Attached files
| file | filename |
|---|---|
| EX-31.2 - EXHIBIT 31.2 - FORWARD AIR CORP | ex31-2.htm |
| EX-32.1 - EXHIBIT 32.1 - FORWARD AIR CORP | ex32-1.htm |
| EX-31.1 - EXHIBIT 31.1 - FORWARD AIR CORP | ex31-1.htm |
| EX-32.2 - EXHIBIT 32.2 - FORWARD AIR CORP | ex32-2.htm |
UNITED
STATES
SECURITIES
AND EXCHANGE COMMISSION
Washington,
D.C. 20549
FORM
10-K
ANNUAL
REPORT PURSUANT TO SECTION 13 OR 15(d)
OF
THE SECURITIES EXCHANGE ACT OF 1934
For
the Fiscal Year Ended December 31, 2009
Commission
File No. 000-22490
FORWARD
AIR CORPORATION
(Exact
name of registrant as specified in its charter)
|
Tennessee
|
62-1120025
|
|
|
(State
or other jurisdiction
of
incorporation or organization)
|
(I.R.S.
Employer Identification No.)
|
|
|
430
Airport Road
|
||
|
Greeneville,
Tennessee
|
37745
|
|
|
(Address
of principal executive offices)
|
(Zip
Code)
|
(423)
636-7000
(Registrant’s
telephone number, including area code)
Securities
registered pursuant to Section 12(b) of the Act:
|
Common
Stock, $0.01 par value
|
The
NASDAQ Stock Market LLC
|
|
|
(Title
of class)
|
(Name
of exchange on which registered)
|
Securities
registered pursuant to Section 12(g) of the Act: None
Indicate
by check mark if the registrant is a well-known seasoned issuer, as defined in
Rule 405 of the Securities Act. Yes o No þ
Indicate
by check mark if the registrant is not required to file reports pursuant to
Section 13 or Section 15(d) of the Act. Yes o No þ
Indicate
by check mark whether the registrant: (1) has filed all reports required to be
filed by Section 13 or 15(d) of the Securities Exchange Act of 1934 during the
preceding 12 months (or for such shorter period that the registrant was required
to file such reports), and (2) has been subject to such filing requirements for
the past 90 days. Yes þ No o
Indicate
by check mark whether the registrant has submitted electronically and posted on
its corporate Web site, if any, every Interactive Data File required to be
submitted and posted pursuant to Rule 405 of Regulation S-T (§ 232.405 of this
chapter) during the preceding 12 months (or for such shorter period that the
registrant was required to submit and post such files). Yes o No
o
Indicate
by check mark if disclosure of delinquent filers pursuant to Item 405 of
Regulation S-K is not contained herein, and will not be contained, to the best
of registrant’s knowledge, in definitive proxy or information statements
incorporated by reference in Part III of this Form 10-K or any amendment to this
Form 10-K. Yes þ No o
Indicate
by check mark whether the registrant is a large accelerated filer, an
accelerated filer, a non-accelerated filer or a smaller reporting
company. See definitions of “large accelerated filer”,
“accelerated filer” and “smaller reporting company” in Rule 12b-2 of the
Exchange Act. (Check one):
(Do not
check if a smaller reporting company)
Indicate
by check mark whether the registrant is a shell company (as defined in Rule
12b-2 of the Exchange Act.) Yes o No þ
The
aggregate market value of the voting stock held by non-affiliates of the
registrant as of June 30, 2009 was approximately $611,603,599 based upon the
$21.32 closing price of the stock as reported on The NASDAQ Stock Market
LLC on that date. For purposes of this computation, all directors and
executive officers of the registrant are assumed to be affiliates. This
assumption is not a conclusive determination for purposes other than this
calculation.
The
number of shares outstanding of the registrant’s common stock, $0.01 par value
per share as of February 17, 2010 was 28,976,977.
DOCUMENTS
INCORPORATED BY REFERENCE
Portions
of the proxy statement for the 2009 Annual Meeting of Shareholders are
incorporated by reference into Part III of this report.
|
Table
of Contents
|
||
|
Forward
Air Corporation
|
||
|
Page
|
||
|
Number
|
||
|
Part
I.
|
||
|
Item
1.
|
Business
|
3
|
|
Item
1A.
|
Risk Factors
|
13
|
|
Item
1B.
|
Unresolved Staff Comments
|
17
|
|
Item
2.
|
Properties
|
17
|
|
Item
3.
|
Legal Proceedings
|
18
|
|
Item
4.
|
Submission of Matters to a Vote of Security
Holders
|
18
|
|
Part
II.
|
||
|
Item
5.
|
Market for Registrant's Common Equity, Related
Shareholder Matters and Issuer Purchases of Equity Securities
|
19
|
|
Item
6.
|
Selected Financial Data
|
21
|
|
Item
7.
|
Management's Discussion and Analysis of Financial
Condition and Results of Operations
|
21
|
|
Item
7A.
|
Quantitative and Qualitative Disclosures About
Market Risk
|
44
|
|
Item
8.
|
Financial Statements and Supplementary
Data
|
44
|
|
Item
9.
|
Changes in and Disagreements with Accountants on
Accounting and Financial Disclosure
|
44
|
|
Item
9A.
|
Controls and Procedures
|
44
|
|
Item
9B.
|
Other Information
|
47
|
|
Part
III.
|
||
|
Item
10.
|
Directors, Executive Officers and Corporate
Governance
|
47
|
|
Item
11.
|
Executive Compensation
|
47
|
|
Item
12.
|
Security Ownership of Certain Beneficial Owners
and Management and Related Shareholder Matters
|
47
|
|
Item
13.
|
Certain Relationships and Related Transactions,
and Director Independence
|
47
|
|
Item
14.
|
Principal Accounting Fees and
Services
|
47
|
|
Part
IV.
|
||
|
Item
15.
|
Exhibits, Financial Statement
Schedules
|
47
|
|
Signatures
|
48
|
|
|
Index to Financial
Statements
|
F2
|
|
|
Financial Statement
Schedule
|
S1
|
|
|
Exhibit Index
|
||
2
Introductory
Note
This
Annual Report on Form 10-K for the fiscal year ended December 31, 2009 (this
“Form 10-K”) contains “forward-looking statements,” as defined in Section 27A of
the Securities Act of 1933, as amended (the “Securities Act”), and Section 21E
of the Securities Exchange Act of 1934, as amended (the “Exchange Act”).
Forward-looking statements are statements other than historical information or
statements of current condition and relate to future events or our future
financial performance. Some forward-looking statements may be identified by use
of such terms as “believes,” “anticipates,” “intends,” “plans,” “estimates,”
“projects” or “expects.” Such forward-looking statements involve known and
unknown risks, uncertainties and other factors that may cause our actual
results, performance or achievements to be materially different from any future
results, performance or achievements expressed or implied by such
forward-looking statements. The following is a list of factors, among others,
that could cause actual results to differ materially from those contemplated by
the forward-looking statements: economic factors such as recessions, inflation,
higher interest rates and downturns in customer business cycles, our inability
to maintain our historical growth rate because of a decreased volume of freight
or decreased average revenue per pound of freight moving through our network,
increasing competition and pricing pressure, surplus inventories, loss of a
major customer, the creditworthiness of our customers and their ability to pay
for services rendered, our ability to secure terminal facilities in desirable
locations at reasonable rates, the inability of our information systems to
handle an increased volume of freight moving through our network, changes in
fuel prices, claims for property damage, personal injuries or workers’
compensation, employment matters including rising health care costs, enforcement
of and changes in governmental regulations, environmental and tax matters, the
handling of hazardous materials, the availability and compensation of qualified
independent owner-operators and freight handlers needed to serve our
transportation needs and our inability to successfully integrate acquisitions.
As a result of the foregoing, no assurance can be given as to future financial
condition, cash flows or results of operations. We undertake no obligation to
update or revise any forward-looking statements, whether as a result of new
information, future events or otherwise.
|
Business
|
We were
formed as a corporation under the laws of the State of Tennessee on October 23,
1981. Our operations can be broadly classified into two principal
segments: Forward Air, Inc. (“Forward Air”) and Forward Air
Solutions, Inc. (“FASI”).
Through
our Forward Air segment, we are a leading provider of time-definite surface
transportation and related logistics services to the North American deferred air
freight market. We offer our customers local pick-up and delivery (Forward Air
Complete™) and scheduled surface transportation of cargo as a cost-effective,
reliable alternative to air transportation. We transport cargo that must be
delivered at a specific time but is less time-sensitive than traditional air
freight. This type of cargo is frequently referred to in the transportation
industry as deferred air freight. We operate our Forward Air segment through a
network of terminals located on or near airports in 84 cities in the United
States and Canada, including a central sorting facility in Columbus, Ohio and 12
regional hubs serving key markets. We also offer our customers an array of
logistics and other services including: expedited truckload brokerage
(“TLX”); dedicated fleets; warehousing; customs brokerage; and shipment
consolidation, deconsolidation and handling.
Through
our Forward Air segment, we market our airport-to-airport services primarily to
air freight forwarders, integrated air cargo carriers, and passenger and cargo
airlines. To serve this market, we offer customers a high level of service with
a focus on on-time, damage-free deliveries. We serve our customers by locating
terminals on or near airports and maintaining regularly scheduled transportation
service between major cities. We either receive shipments at our terminals or
pick up shipments directly from our customers and transport them by
truck (i) directly to the destination terminal; (ii) to our Columbus, Ohio
central sorting facility; or (iii) to one of our 12 regional hubs, where
they are unloaded, sorted and reloaded. After reloading the shipments, we
deliver them to the terminals nearest their destinations and then, if requested
by the customer, on to a final designated site. We ship freight
directly between terminals when justified by the volume of shipments. During
2009, approximately 23.7% of the freight we handled was for overnight delivery,
approximately 59.2% was for delivery within two to three days and the
balance was for delivery in four or more days. We generally do not market our
airport-to-airport services directly to shippers (where such services might
compete with our freight forwarder customers). Also, because we do not place
significant size or weight restrictions on airport-to-airport shipments, we
generally do not compete directly with integrated air cargo carriers such as
United Parcel Service and Federal Express in the overnight delivery of small
parcels. In 2009, Forward Air’s five largest customers accounted for
approximately 21.2% of Forward Air’s operating revenue and no single customer
accounted for more than 10.0% of Forward Air’s operating
revenue.
We
continue to develop and implement complimentary services to the
airport-to-airport network. Our complimentary services including TLX;
dedicated fleets; local pick-up and delivery; warehousing; customs brokerage;
and shipment consolidation, deconsolidation and handling are critical to
helping meet the changing needs of our customers and for efficiently using the
people and resources of our airport-to-airport network.
Through
our FASI segment, which we formed in July 2007 in conjunction with our
acquisition of certain assets and liabilities of USA Carriers, Inc. (“USAC”), we
provide pool distribution services throughout the Mid-Atlantic, Southeast,
Midwest and Southwest continental United States. Pool distribution
involves managing high-frequency handling and distribution of time-sensitive
product to numerous destinations in specific geographic regions. Our
primary customers for pool distribution are regional and nationwide distributors
and specialty retailers, such as mall, strip mall and outlet-based retail
chains. We service these customers through a network of terminals and service
centers located in 19 cities. FASI’s three largest customers
accounted for approximately 50.8% of FASI’s operating revenue, but revenues from
these three customers did not exceed 10.0% of our consolidated
revenue. No other customers accounted for more than 10.0% of FASI’s
operating revenue.
3
Our
Industry
As
businesses minimize inventory levels, close regional and local distribution
centers, perform manufacturing and assembly operations in multiple locations and
distribute their products through multiple channels, they have an increased need
for expedited or time-definite delivery services. Expedited or time-definite
shipments are those shipments for which the customer requires delivery the next
day or within two to three days, usually by a specified time or within a
specified time window.
Shippers
with expedited or time-definite delivery requirements have several principal
alternatives to transport freight: freight forwarders; integrated air cargo
carriers; less-than-truckload carriers; full truckload carriers, and passenger
and cargo airlines.
Although
expedited or time-definite freight is often transported by aircraft, freight
forwarders and shippers often elect to arrange for its transportation by
truck, especially for shipments requiring deferred delivery within two to three
days. Generally, the cost of shipping freight, especially heavy freight, by
truck is substantially less than shipping by aircraft. We believe there are
several trends that are increasing demand for lower-cost truck transportation of
expedited air freight. These trends include:
|
·
|
Freight
forwarders obtain requests for shipments from customers, make arrangements
for transportation of the cargo by a third-party carrier and usually
arrange for both delivery from the shipper to the carrier and from the
carrier to the recipient.
|
|
·
|
Integrated
air cargo carriers provide pick-up and delivery services primarily using
their own fleet of trucks and provide transportation services generally
using their own fleet of aircraft.
|
|
·
|
Less-than-truckload
carriers also provide pick-up and delivery services through their own
fleet of trucks. These carriers operate terminals where a single shipment
is unloaded, sorted and reloaded multiple times. This
additional handling increases transit time, handling costs and the
likelihood of cargo damage.
|
|
·
|
Full
truckload carriers provide transportation services generally using their
own fleet of trucks. A freight forwarder or shipper must have a
shipment of sufficient size to justify the cost of a full
truckload. These cost benefit concerns can inhibit the
flexibility often required by freight forwarders or
shippers.
|
|
·
|
Passenger
or cargo airlines provide airport-to-airport service, but have limited
cargo space and generally accept only shipments weighing less than 150
pounds.
|
Competitive
Advantages
We
believe that the following competitive advantages are critical to our success in
both our Forward Air and FASI segments:
|
·
|
Focus on Specific Freight
Markets. Our Forward Air segment focuses on providing time-definite
surface transportation and related logistics services to the deferred air
cargo industry. Our FASI segment focuses on providing
high-quality pool distribution services to retailers and nationwide
distributors of retail products. This focused approach enables
us to provide a higher level of service in a more cost-effective manner
than our competitors.
|
|
·
|
Expansive Network of Terminals
and Sorting Facilities. We have built a network of Forward Air
terminals and sorting facilities throughout the United States and Canada
located on or near airports. We believe it would be difficult for a
competitor to duplicate our Forward Air network without the expertise and
strategic facility locations we have acquired and without expending
significant capital and management resources. Our expansive Forward Air
network enables us to provide regularly scheduled service between most
markets with low levels of freight damage or loss, all at rates generally
significantly below air freight
rates.
|
Primarily
through acquisitions, we have created a FASI network of terminals and service
centers throughout the Mid-Atlantic, Southeast, Midwest and
Southwest continental United States. The pool distribution
market is very fragmented and our competition primarily consists of regional and
local providers. We believe that through our network of FASI
terminals and service locations we can offer our pool distribution customers
comprehensive, high-quality service across the majority of the continental
United States.
|
·
|
Concentrated Marketing
Strategy. Forward Air provides our deferred air freight
services mainly to air freight forwarders, integrated air cargo carriers,
and passenger and cargo airlines rather than directly serving shippers.
Forward Air does not place significant size or weight restrictions on
shipments and, therefore, it does not compete with delivery services such
as United Parcel Service and Federal Express in the overnight small parcel
market. We believe that Forward Air customers prefer to purchase their
transportation services from us because, among other reasons, we generally
do not market Forward Air’s services to their shipper customers and,
therefore, do not compete directly with them for
customers.
|
FASI
provides pool distribution services primarily to regional and nationwide
distributors and specialty retailers, such as mall, strip mall and outlet-based
retail chains.
4
|
·
|
Superior Service
Offerings. Forward Air’s published deferred air freight
schedule for transit times with specific cut-off and arrival times
generally provides Forward Air customers with the predictability they
need. In addition, our network of Forward Air terminals allows us to offer
our customers later cut-off times, a higher percentage of direct shipments
(which reduces damage and shortens transit times) and earlier delivery
times than most of our competitors.
|
Our
network of FASI terminals allows us the opportunity to provide precision
deliveries to a wider range of locations than most pool distribution providers
with increased on-time performance.
|
·
|
Flexible Business
Model. Rather than owning and operating our own fleet of trucks,
Forward Air purchases most of its transportation requirements from
owner-operators or truckload carriers. This allows Forward Air to respond
quickly to changing demands and opportunities in our industry and to
generate higher returns on assets because of the lower capital
requirements.
|
Primarily
as a result of the structure of our acquisition targets and the nature of pool
distribution services, FASI utilizes a higher percentage of Company-employed
drivers and Company-owned equipment than Forward Air. However, as the
conditions of individual markets and requirements of our customers allow, we are
increasing the usage of owner-operators in our pool distribution
business.
|
·
|
Comprehensive Logistic and
Other Service Offerings. Forward Air offers an array of logistic
and other services including: TLX, pick-up and delivery (Forward Air
Complete™), dedicated fleet, warehousing, customs brokerage and shipment
consolidation and handling. These services are an essential part
of many of our Forward Air customers’ transportation needs and are
not offered by many of our competitors. Forward Air is able to
provide these services utilizing existing infrastructure and thereby able
to earn additional revenue without incurring significant additional fixed
costs.
|
|
·
|
Leading Technology
Platform. We are committed to using information technology to
improve our Forward Air and FASI operations. Through improved
information technology, we believe we can increase the volume of freight
we handle in our networks, improve visibility of shipment information and
reduce our operating costs. Our Forward Air technology allows us to
provide our customers with electronic bookings and real-time tracking and
tracing of shipments while in our network, complete shipment history,
proof of delivery, estimated charges and electronic bill presentment. We
continue to enhance our Forward Air systems to permit us and our customers
to access vital information through both the Internet and electronic data
interchange. We have continued to invest in information
technology to the benefit of our customers and our business processes. The
primary example of this continued development is our Terminal Automation
Program (“TAP”), a wireless application utilized in all our Forward Air
terminals. The system enables individual operators to perform virtually
all data entry from our terminal floor locations. The system provides
immediate shipment updates, resulting in increased shipment accuracy and
improved data timeliness. The TAP system not only reduces operational
manpower, but also improves our on-time performance. Additionally, in
order to support our Forward Air Complete service offering, we developed
and installed a web-based system, which coordinates activities between our
customers, operations personnel and external service
providers.
|
We are
committed to developing the same superior level of information technology for
FASI. One of the challenges FASI faces is the integration of many
different software applications utilized by not only the companies FASI acquired
but our individual customers as well. Our goal is to create a
comprehensive system that will provide our pool distribution customers with the
same level of visibility, interactivity and flexibility as experienced by our
Forward Air customers.
|
·
|
Strong Balance Sheet and
Availability of Funding. Our asset-light business model
and strong market position in the deferred air freight market provides the
foundation for operations that produce excellent cash flow from operations
even in challenging conditions. Our strong balance sheet can
also be a competitive advantage. Our competitors, particularly
in the pool distribution market, are mainly regional and local operations
and may struggle to maintain operations in the current economic
environment. The threat of financial instability may encourage
new and existing customers to use a more financially secure transportation
provider, such as FASI.
|
5
Growth
Strategy
Our
growth strategy is to take advantage of our competitive strengths in order to
increase our profits and shareholder returns. Our goal is to use our established
networks as the base for which to expand and launch new services that will allow
us to grow in any economic environment. Principal components of our
efforts include:
|
·
|
Increase Freight Volume from
Existing Customers. Many of our customers currently use Forward Air
and FASI for only a portion of their overall transportation
needs. We believe we can increase freight volumes from existing
customers by offering more comprehensive services that address all of the
customer’s transportation needs, such as Forward Air Complete, our direct
to door pick-up and delivery service. By offering additional
services that can be integrated with our existing business, we believe we
will attract additional business from existing
customers.
|
|
·
|
Develop New
Customers. We continue to actively market our Forward Air and FASI
services to potential new customers. In our deferred air freight business,
we believe air freight forwarders may move away from integrated air cargo
carriers because those carriers charge higher rates, and away from
less-than-truckload carriers because those carriers provide less reliable
service and compete for the same customers as do the air freight
forwarders. In addition, we believe Forward Air’s comprehensive
North American network and related logistics services are attractive to
domestic and international airlines. Forward Air Complete™ can
also help attract business from new customers who require pick-up and
delivery for their shipments. In our pool distribution
business, we are emphasizing the development of relationships with
retailers who have peak volume seasons outside of the traditional fourth
quarter spike in order to help stabilize FASI’s earnings throughout the
calendar year. Further, by expanding our network of FASI
terminals, we believe we can attract new customers and new business from
existing customers by offering our services across multiple regions of the
continental United States. During the upcoming years, we plan
on expanding FASI’s terminal footprint by opening FASI operations in
select Forward Air terminals. We believe the utilization of
existing Forward Air terminals will allow us to increase our FASI revenues
with minimal addition of fixed
costs.
|
|
·
|
Improve Efficiency of Our
Transportation Network. We constantly seek to improve the
efficiency of our airport-to-airport and FASI networks. Regional hubs and
direct shuttles improve Forward Air’s efficiency by reducing the number of
miles freight must be transported and the number of times freight must be
handled and sorted. As the volume of freight between key markets
increases, we intend to continue to add direct shuttles. Since 2007, we
completed the purchase or construction of three new facilities in Chicago,
Illinois, Atlanta, Georgia and Dallas/Fort Worth, Texas. In
2006, we also completed the expansion of our national hub in Columbus,
Ohio. With these new and expanded facilities, we believe we will
have the necessary space to grow our business in key gateway cities and to
offer additional services. We can improve our FASI operations
by increasing the efficiencies of our daily and weekly routes and the
cartons handled per hour on our docks. We are constantly
looking to improve our route efficiencies by consolidating loads and
utilizing owner-operators when available. We are investing in
conveyor systems for certain FASI terminals to increase the productivity
of our cargo handlers. Finally, we are actively looking to
reduce or eliminate the number of duplicate facilities in cities which
have both Forward Air and FASI terminals. We have combined
Forward Air and FASI facilities in Des Moines, Iowa, Denver, Colorado,
Kansas City, Missouri, Nashville, TN and Richmond, Virginia, and will
continue this process in upcoming years as the expiration of leases and
business volumes allow.
|
|
·
|
Expand Logistics and
Other Services. We continue to expand our logistics and other
services to increase revenue and improve utilization of our Forward Air
terminal facilities and labor force. Because of the timing of the arrival
and departure of cargo, our Forward Air facilities are under-utilized
during certain portions of the day, allowing us to add logistics services
without significantly increasing our costs. Therefore, we have added a
number of Forward Air logistic services in the past few years, such as
TLX, dedicated fleet, warehousing, customs brokerage and shipment
consolidation and handling services. These services directly benefit our
existing customers and increase our ability to attract new customers,
particularly those air freight forwarders that cannot justify providing
the services directly. These services are not offered by many
transportation providers with whom we compete and are attractive to
customers who prefer to use one provider for all of their transportation
needs.
|
|
·
|
Expand Pool Distribution
Services and Integrate with our Forward Air Services. In addition
to increasing our revenue from traditional pool distribution services, we
are working to integrate our Forward Air and FASI service
offerings. Through this process we are able to offer customers
linehaul or truckload services, with handling and sorting at the origin
and destination terminal, and final distribution to one or many locations
utilizing FASI pool distribution and Forward Air
Complete™.
|
|
·
|
Enhance Information
Systems. We are committed to the continued development and
enhancement of our information systems in ways that will continue to
provide us competitive service advantages and increased productivity. We
believe our enhanced systems have and will assist us in capitalizing on
new business opportunities with existing customers and developing
relationships with new customers.
|
6
|
·
|
Pursue Strategic
Acquisitions. We continue to evaluate acquisitions that can
increase our penetration of a geographic area, add new customers, add new
business verticals, increase freight volume and add new service
offerings. In addition, we expect to explore acquisitions that
may enable us to offer additional services. Since our
inception, we have acquired certain assets and liabilities of
12 businesses that met one or more of these
criteria. During 2008 and 2007, we acquired certain assets and
liabilities of four companies that met these
criteria.
|
|
Ø
|
In
July 2007, we acquired certain assets and liabilities of USAC which
provided the base from which we launched our FASI pool distribution
services.
|
|
Ø
|
In
December 2007, we acquired certain assets and liabilities of Black Hawk
Freight Services, Inc. (“Black Hawk”) which increased the penetration
of our Forward Air airport-to-airport network in the
Midwest.
|
|
Ø
|
In
March 2008, we acquired certain assets and liabilities of Pinch Holdings,
Inc. and its related company AFTCO Enterprises, Inc. and certain of their
respective wholly-owned subsidiaries (“Pinch”). Pinch was a
privately-held provider of pool distribution, airport-to-airport,
truckload, custom, and cartage services primarily to the Southwestern
continental United States. This acquisition gave FASI a
presence primarily in Texas and strengthens the position of our Forward
Air network in the Southwest United
States.
|
|
Ø
|
In
September 2008, we acquired certain assets and liabilities of Service
Express, Inc. (“Service Express”). The acquisition of Service
Express, a privately-held provider of pool distribution services, helped
us expand FASI’s geographic footprint in the Mid-Atlantic and Southeastern
continental United
States.
|
Operations
We
operate in two reportable segments, based on differences in the services
provided: Forward Air and FASI. Through Forward Air we
are a leading provider of time-definite transportation and related logistics
services to the North American deferred air freight market. Forward Air’s
activities can be broadly classified into three categories of services:
airport-to-airport, logistics and other.
Through
our FASI segment we provide pool distribution services throughout the
Mid-Atlantic, Southeast, Midwest and Southwest continental United
States. Pool distribution involves managing high-frequency handling
and distribution of time-sensitive product to numerous destinations in specific
geographic regions.
Forward
Air
Airport-to-airport
We
receive freight from air freight forwarders, integrated air cargo carriers and
passenger and cargo airlines at our terminals, which are located on or near
airports in the United States and Canada. We also pick up freight from customers
at designated locations via our Forward Air Complete™ service. We consolidate
and transport these shipments by truck through our network to our terminals
nearest the ultimate destinations of the shipments. We operate regularly
scheduled service to and from each of our terminals through our Columbus, Ohio
central sorting facility or through one of our 12 regional hubs. We also operate
regularly scheduled shuttle service directly between terminals where the volume
of freight warrants bypassing the Columbus, Ohio central sorting facility or a
regional hub. When a shipment arrives at our terminal nearest its destination,
the customer arranges for the shipment to be picked up and delivered to its
final destination, or we, in the alternative, through our Forward Air Complete™
service, deliver the freight for the customer to its final
destination.
7
Terminals
Our
airport-to-airport network consists of terminals located in the following 84
cities:
|
City
|
Airport
Served
|
City
|
Airport
Served
|
|||
|
Albany,
NY
|
ALB
|
Louisville,
KY
|
SDF
|
|||
|
Albuquerque,
NM***
|
ABQ
|
Memphis,
TN
|
MEM
|
|||
|
Allentown,
PA*
|
ABE
|
McAllen,
TX
|
MFE
|
|||
|
Atlanta,
GA
|
ATL
|
Miami,
FL
|
MIA
|
|||
|
Austin,
TX
|
AUS
|
Milwaukee,
WI
|
MKE
|
|||
|
Baltimore,
MD
|
BWI
|
Minneapolis,
MN
|
MSP
|
|||
|
Baton
Rouge, LA*
|
BTR
|
Mobile,
AL*
|
MOB
|
|||
|
Birmingham,
AL*
|
BHM
|
Moline,
IA
|
MLI
|
|||
|
Blountville,
TN*
|
TRI
|
Montgomery,
AL***
|
MGM
|
|||
|
Boston,
MA
|
BOS
|
Nashville,
TN**
|
BNA
|
|||
|
Buffalo,
NY
|
BUF
|
Newark,
NJ
|
EWR
|
|||
|
Burlington,
IA
|
BRL
|
Newburgh,
NY
|
SWF
|
|||
|
Cedar
Rapids, IA
|
CID
|
New
Orleans, LA
|
MSY
|
|||
|
Charleston,
SC
|
CHS
|
New
York, NY
|
JFK
|
|||
|
Charlotte,
NC
|
CLT
|
Norfolk,
VA
|
ORF
|
|||
|
Chicago,
IL
|
ORD
|
Oklahoma
City, OK
|
OKC
|
|||
|
Cincinnati,
OH
|
CVG
|
Omaha,
NE
|
OMA
|
|||
|
Cleveland,
OH
|
CLE
|
Orlando,
FL
|
MCO
|
|||
|
Columbia,
SC*
|
CAE
|
Pensacola,
FL*
|
PNS
|
|||
|
Columbus,
OH
|
CMH
|
Philadelphia,
PA
|
PHL
|
|||
|
Corpus
Christi, TX*
|
CRP
|
Phoenix,
AZ
|
PHX
|
|||
|
Dallas/Ft.
Worth, TX
|
DFW
|
Pittsburgh,
PA
|
PIT
|
|||
|
Dayton,
OH*
|
DAY
|
Portland,
OR
|
PDX
|
|||
|
Denver,
CO**
|
DEN
|
Raleigh,
NC
|
RDU
|
|||
|
Des
Moines, IA**
|
DSM
|
Richmond,
VA**
|
RIC
|
|||
|
Detroit,
MI
|
DTW
|
Rochester,
NY
|
ROC
|
|||
|
El
Paso, TX
|
ELP
|
Sacramento,
CA
|
SMF
|
|||
|
Greensboro,
NC
|
GSO
|
Salt
Lake City, UT
|
SLC
|
|||
|
Greenville,
SC
|
GSP
|
San
Antonio, TX
|
SAT
|
|||
|
Hartford,
CT
|
BDL
|
San
Diego, CA
|
SAN
|
|||
|
Harrisburg,
PA
|
MDT
|
San
Francisco, CA
|
SFO
|
|||
|
Houston,
TX
|
IAH
|
Seattle,
WA
|
SEA
|
|||
|
Huntsville,
AL*
|
HSV
|
Shreveport,
LA*
|
SHV
|
|||
|
Indianapolis,
IN
|
IND
|
St.
Louis, MO
|
STL
|
|||
|
Jacksonville,
FL
|
JAX
|
Syracuse,
NY
|
SYR
|
|||
|
Kansas
City, MO**
|
MCI
|
Tampa,
FL
|
TPA
|
|||
|
Knoxville,
TN*
|
TYS
|
Toledo,
OH*
|
TOL
|
|||
|
Lafayette,
LA*
|
LFT
|
Tucson,
AZ*
|
TUS
|
|||
|
Laredo,
TX
|
LRD
|
Tulsa,
OK
|
TUL
|
|||
|
Las
Vegas, NV
|
LAS
|
Washington,
DC
|
IAD
|
|||
|
Little
Rock, AR*
|
LIT
|
Montreal,
Canada*
|
YUL
|
|||
|
Los
Angeles, CA
|
LAX
|
Toronto,
Canada
|
YYZ
|
* Denotes
an independent agent location.
** Denotes
a location with combined Forward Air and FASI operations.
***
Denotes an agent location operated by FASI.
Independent
agents and FASI operate 17 and 2 of our Forward Air locations, respectively.
These locations typically handle lower volumes of freight relative to our
Company-operated facilities.
8
Direct
Service and Regional Hubs
We
operate direct terminal-to-terminal services and regional overnight service
between terminals where justified by freight volumes. We currently provide
regional overnight service to many of the markets within our network. Direct
service allows us to provide quicker scheduled service at a lower cost because
it allows us to minimize out-of-route miles and eliminate the added time and
cost of handling the freight at our central or regional hub sorting facilities.
Direct shipments also reduce the likelihood of damage because of reduced
handling and sorting of the freight. As we continue to increase volume between
various terminals, we intend to add other direct services. Where warranted by
sufficient volume in a region, we utilize larger terminals as regional sorting
hubs, which allow us to bypass our Columbus, Ohio central sorting facility.
These regional hubs improve our operating efficiency and enhance customer
service. We operate regional hubs in Atlanta, Charlotte, Chicago, Dallas/Ft.
Worth, Denver, Kansas City, Los Angeles, New Orleans, Newark, Newburgh, Orlando,
and Sacramento.
Shipments
The
average weekly volume of freight moving through our network
was approximately 28.5 million pounds per week in 2009. During 2009,
our average shipment weighed approximately 693 pounds and shipment sizes
ranged from small boxes weighing only a few pounds to large shipments of several
thousand pounds. Although we impose no significant size or weight restrictions,
we focus our marketing and price structure on shipments of 200 pounds or more.
As a result, we typically do not directly compete with integrated air cargo
carriers in the overnight delivery of small parcels. The table below summarizes
the average weekly volume of freight moving through our network for each year
since 1990.
|
Average
Weekly
|
||
|
Volume
in Pounds
|
||
|
Year
|
(In
millions)
|
|
|
1990
|
1.2
|
|
|
1991
|
1.4
|
|
|
1992
|
2.3
|
|
|
1993
|
3.8
|
|
|
1994
|
7.4
|
|
|
1995
|
8.5
|
|
|
1996
|
10.5
|
|
|
1997
|
12.4
|
|
|
1998
|
15.4
|
|
|
1999
|
19.4
|
|
|
2000
|
24.0
|
|
|
2001
|
24.3
|
|
|
2002
|
24.5
|
|
|
2003
|
25.3
|
|
|
2004
|
28.7
|
|
|
2005
|
31.2
|
|
|
2006
|
32.2
|
|
|
2007
|
32.8
|
|
|
2008
|
34.2
|
|
|
2009
|
28.5
|
Logistics
and Other Services
Our
customers increasingly demand more than the movement of freight from their
transportation providers. To meet these demands, we continually seek ways to
customize our logistics services and add new services. Logistics and other
services increase our profit margins by increasing our revenue without
corresponding increases in our fixed costs, as airport-to-airport assets and
resources are primarily used to provide the logistics and other
services.
Our logistics and other services allow customers to access the following
services from a single source:
|
·
|
expedited
truckload brokerage, or TLX;
|
|
·
|
dedicated
fleets;
|
|
·
|
customs
brokerage, such as assistance with U.S. Customs and Border Protection
(“U.S. Customs”) procedures for both import and export
shipments;
|
|
·
|
warehousing,
dock and office space;
|
|
·
|
drayage
and intermodal;
|
|
·
|
hotshot
or ad-hoc ultra expedited services;
and
|
|
·
|
shipment
consolidation and handling, such as shipment build-up and break-down and
reconsolidation of air or ocean pallets or
containers.
|
9
These services are critical to many of our air freight forwarder customers that
do not provide logistics services themselves or that prefer to use one provider
for all of their surface transportation needs.
Revenue
and purchased transportation for our TLX and dedicated fleet services are
largely determined by the number of miles driven. The table below
summarizes the average miles driven per week to support our logistics services
since 2003:
|
Average
Weekly Miles
|
||
|
Year
|
(In
thousands)
|
|
|
2003
|
211
|
|
|
2004
|
259
|
|
|
2005
|
248
|
|
|
2006
|
331
|
|
|
2007
|
529
|
|
|
2008
|
676
|
|
|
2009
|
672
|
Forward
Air Solutions (FASI)
Pool
Distribution
Through
our FASI segment we provide pool distribution services through a network of
terminals and service locations in 19 cities throughout the Mid-Atlantic,
Southeast, Midwest and Southwest continental United States. Pool
distribution involves managing high-frequency handling and distribution of
time-sensitive product to numerous destinations in specific geographic
regions. Our primary customers for this product are regional and
nationwide distributors and retailers, such as mall, strip mall and outlet-based
retail chains.
We
continue to expand the geographic footprint of our FASI pool distribution
business, primarily through acquisitions. In July 2007, we acquired
USAC which provided the base from which we launched our FASI pool distribution
services. On March 17, 2008, we acquired certain assets and
liabilities of Pinch. The acquisition of Pinch’s pool distribution
services expanded the geographic footprint in Texas and the Southwestern United
States. On September 8, 2008, we acquired certain assets and
liabilities of Service Express. The acquisition of Service Express
helped us expand our geographic footprint in the Mid-Atlantic and Southeastern
continental United States. Our pool distribution network consists of
terminals and service locations in the following 19 cities:
|
City
|
|
|
Albuquerque,
NM***
|
Kansas
City, MO**
|
|
Atlanta,
GA
|
Lakeland,
FL
|
|
Baltimore,
MD
|
Las
Vegas, NV
|
|
Charlotte,
NC
|
Miami,
FL
|
|
Dallas/Ft.
Worth, TX
|
Montgomery,
AL***
|
|
Denver,
CO**
|
Nashville,
TN**
|
|
Des
Moines, IA**
|
Richmond,
VA**
|
|
Greensboro,
NC
|
San
Antonio, TX
|
|
Houston,
TX
|
Tulsa,
OK
|
|
Jacksonville,
FL
|
|
** Denotes
a location with combined Forward Air and FASI operations.
*** Denotes a location that
provides agent station services to Forward Air.
10
Customers
and Marketing
Our
Forward Air wholesale customer base is primarily comprised of air freight
forwarders, integrated air cargo carriers and passenger and cargo airlines. Our
air freight forwarder customers vary in size from small, independent, single
facility companies to large, international logistics companies such as SEKO
Worldwide, AIT Worldwide Logistics, Associated Global, UPS Supply Chain
Solutions and Pilot Air Freight. Because we deliver dependable service,
integrated air cargo carriers such as UPS Cargo and DHL Worldwide Express use
our network to provide overflow capacity and other services, including shipment
of bigger packages and pallet-loaded cargo. Our passenger and cargo airline
customers include British Airways, United Airlines and Virgin
Atlantic.
Our FASI
pool distribution customers are primarily comprised of national and regional
retailers and distributors, such as The Limited, The Marmaxx Group, The GAP,
Blockbuster and Aeropostale. We also conduct business with other pool
distribution providers.
We market
all our services through a sales and marketing staff located in major markets of
the United States. Senior management also is actively involved in sales and
marketing at the national account level and supports local sales initiatives. We
also participate in air cargo and retail trade shows and advertise our services
through direct mail programs and through the Internet via www.forwardair.com.
The information contained on our website is not part of this filing and is
therefore not incorporated by reference unless such information is otherwise
specifically referenced elsewhere in this report.
Technology
and Information Systems
Our
technology allows us to provide Forward Air customers with real-time tracking
and tracing of shipments throughout the transportation process, complete
shipment history, proof of delivery, estimated charges and electronic bill
presentment. In addition, our Forward Air customers are able to electronically
transmit bookings to us from their own networks and schedule transportation and
obtain tracking and tracing information. We continue to develop and
enhance our systems to permit our customers to obtain this information both
through the Internet and through electronic data interchange.
We
continue to enhance our Forward Air TAP application and website service
offerings in our continuing effort to automate and improve our operations. TAP
enables operations personnel to perform data entry from our terminal floor
locations which greatly reduces the need for data entry personnel and provides
immediate shipment updates. The result is increased shipment accuracy and
improved data timeliness. The TAP system improves our ability to provide
accurate, real-time information, and results in both competitive service
advantages and increased productivity throughout our network. Our Forward Air
Complete™ website coordinates activities between our customers, operations
personnel and external service providers. We believe that the TAP system,
Forward Air Complete™ website and other
technical enhancements will assist us in capitalizing on new
business opportunities and could encourage customers to increase the volume of
freight they send through our network.
During
2009, we made significant investments in technology for FASI. During the year,
we continued our development of a FASI driven enhancement to our existing
Forward Air applications. This system enhancement, called FASTRACS, is
designed specifically to meet the retail distribution business demands, and
makes use of the most modern wireless technologies available. FASTRACS was
implemented in 2009 for a select group of customers and is being designed so as
to be the primary technology platform for all future customers.
Purchased
Transportation
We
contract for most of our Forward Air transportation services on a per mile basis
from owner-operators. FASI also utilizes owner-operators for certain
of its transportation services, but relies more on Company-employed
drivers. The owner-operators own, operate and maintain their own
tractors and employ their own drivers. Our Forward Air freight handlers load and
unload our trailers for hauling by owner-operators between our
terminals.
We seek
to establish long-term relationships with owner-operators to assure dependable
service and availability. Historically, we have experienced significantly higher
than industry average retention of owner-operators. We have established specific
guidelines relating to safety records, driving experience and personal
evaluations that we use to select our owner-operators. To enhance our
relationship with the owner-operators, our per mile rates are generally above
prevailing market rates. In addition, we typically offer our owner-operators and
their drivers a consistent work schedule. Usually, schedules are between the
same two cities, improving quality of work life for the owner-operators and
their drivers and, in turn, increasing driver retention.
As a
result of efforts to expand our logistics and other services, seasonal demands
and volume surges in particular markets, we also purchase transportation from
other surface transportation providers to handle overflow volume. Of the $174.4
million incurred for purchased transportation during 2009, we purchased 70.5%
from owner-operators and 29.5% from other surface transportation
providers.
11
Competition
The air
freight and pool distribution segments of the transportation industry are highly
competitive and very fragmented. Our Forward Air and FASI competitors primarily
include national and regional truckload and less-than-truckload carriers. To a
lesser extent, Forward Air also competes with integrated air cargo carriers and
passenger and cargo airlines.
We
believe competition is based primarily on service, on-time delivery, flexibility
and reliability, as well as rates. We offer our Forward Air services at rates
that generally are significantly below the charge to transport the same shipment
to the same destination by air. We believe Forward Air has an advantage over
less-than-truckload carriers because Forward Air delivers faster, more reliable
service between many cities. We believe FASI has an advantage over
its competitors due to its presence in several regions across the continental
United States allowing us to provide consistent, high-quality service to our
customers regardless of location.
Seasonality
Historically,
our operating results have been subject to seasonal trends when measured on a
quarterly basis. The first quarter has traditionally been the weakest and the
third and fourth quarters have traditionally been the strongest. Typically, this
pattern has been the result of factors such as weather, national holidays,
customer demand and economic conditions. Additionally, a significant portion of
our revenue is derived from customers whose business levels are impacted by the
economy. The impact of seasonal trends is more pronounced on our pool
distribution business. The pool distribution business is seasonal and
operating revenues and results tend to be higher in the third and fourth
quarters than in the first and second quarters.
Employees
As of December 31, 2009, we had 1,798 full-time employees, 488 of whom
were freight handlers. Also, as of that date, we had an additional 957
part-time employees, of whom the majority were freight handlers. None of our
employees are covered by a collective bargaining agreement. We recognize that
our workforce, including our freight handlers, is one of our most valuable
assets. The recruitment, training and retention of qualified employees is
essential to support our continued growth and to meet the service requirements
of our customers.
Risk
Management and Litigation
Under
U.S. Department of Transportation (“DOT”) regulations, we are liable for
property damage and personal injuries caused by owner-operators and
Company-employed drivers while they are operating on our behalf. We currently
maintain liability insurance coverage that we believe is adequate to cover
third-party claims. We have a self-insured retention of $0.5 million per
occurrence for vehicle and general liability claims. We may also be subject to
claims for workers’ compensation. We maintain workers’ compensation insurance
coverage that we believe is adequate to cover such claims. We have a
self-insured retention of approximately $0.3 million for each such claim, except
in Ohio, where we are a qualified self-insured entity with an
approximately $0.4 million self-insured retention. We could incur claims in
excess of our policy limits or incur claims not covered by our
insurance.
From time
to time, we are a party to litigation arising in the normal course of our
business, most of which involve claims for personal injury, property damage
related to the transportation and handling of freight, or workers’ compensation.
We do not believe that any of these pending actions, individually or in the
aggregate, will have a material adverse effect on our business, financial
condition or results of operations.
Regulation
The DOT
and various state agencies have been granted broad powers over our business.
These entities generally regulate such activities as authorization to engage in
property brokerage and motor carrier operations, safety and financial reporting.
We are licensed through our subsidiaries by the DOT as a motor carrier and as a
property broker to arrange for the transportation of freight by truck. Our
domestic customs brokerage operations are licensed by U.S. Customs. We are
subject to similar regulation in Canada.
Service
Marks
Through
one of our subsidiaries, we hold federal trademark registrations or
applications for federal trademark registration, associated with the
following service marks: Forward Air, Inc. ®, North America’s Most Complete
Roadfeeder Network ®, Forward Air ™, Forward Air Solutions ®, Forward
Air TLX™, and Forward Air Complete ™. These marks are of significant value to
our business.
Website
Access
We file
reports with the Securities and Exchange Commission (the “SEC”), including
annual reports on Form 10-K, quarterly reports on Form 10-Q and other reports
from time to time. We are an electronic filer and the SEC maintains an Internet
site at www.sec.gov that contains these reports and other information filed
electronically. We make available free of charge through our website our Code of
Ethics and our reports as soon as reasonably practicable after such material is
electronically filed with or furnished to the SEC. Our website address is
www.forwardair.com. Please note that this website address is provided as an
inactive textual reference only. The information provided on the website is not
part of this report, and is therefore not incorporated by reference unless such
information is otherwise specifically referenced elsewhere in this
report.
12
|
Item
1A.
|
Risk
Factors
|
In
addition to the other information in this Form 10-K and other documents we have
filed with the SEC from time to time, the following factors should be carefully
considered in evaluating our business. Such factors could affect results and
cause results to differ materially from those expressed in any forward-looking
statements made by, or on behalf of, us. Some or all of these factors may apply
to our business.
The
severe economic downturn has resulted in weaker demand for ground transportation
services, which may continue to have a significant negative impact on
us.
We are
experiencing significantly weaker demand for our airport-to-airport and pool
distribution services driven by the severe downturn in the
economy. We began to experience weakening demand late in 2008, and
this weakness continued throughout 2009. We have adjusted the size of
our owner-operator fleet and reduced employee headcount to compensate for the
drop in demand. If the economic downturn persists or worsens, demand
for our services may continue to weaken. No assurance can be given
that our reductions or other steps we have taken or may take will be adequate to
offset the effects of reduced demand.
Our
business is subject to general economic and business factors that are largely
out of our control, any of which could have a material adverse effect on our
results of operations.
Our
business is dependent upon a number of factors that may have a material adverse
effect on the results of our operations, many of which are beyond our control.
These factors include increases or rapid fluctuations in fuel prices, capacity
in the trucking industry, insurance premiums, self-insured retention levels and
difficulty in attracting and retaining qualified owner-operators and freight
handlers. Our profitability would decline if we were unable to anticipate and
react to increases in our operating costs, including purchased transportation
and labor, or decreases in the amount of revenue per pound of freight shipped
through our system. As a result of competitive factors, we may be unable to
raise our prices to meet increases in our operating costs, which could result in
a material adverse effect on our business, results of operations and financial
condition.
Economic
conditions may adversely affect our customers and the amount of freight
available for transport. This may require us to lower our rates, and this may
also result in lower volumes of freight flowing through our network. Customers
encountering adverse economic conditions represent a greater potential for loss,
and we may be required to increase our reserve for bad-debt losses.
Our
results of operations may be affected by seasonal factors. Volumes of freight
tend to be lower in the first quarter after the winter holiday season. In
addition, it is not possible to predict the short or long-term effects of any
geopolitical events on the economy or on customer confidence in the United
States, or their impact, if any, on our future results of
operations.
In order to grow
our business, we will need to increase the volume and revenue per pound of the
freight shipped through our networks.
Our
growth depends in significant part on our ability to increase the amount and
revenue per pound of freight shipped through our networks. The amount of freight
shipped through our networks and our revenue per pound depend on numerous
factors, many of which are beyond our control, such as economic conditions and
our competitors’ pricing. Therefore, we cannot guarantee that the amount of
freight shipped or the revenue per pound we realize on that freight will
increase or even remain at current levels. If we fail to increase the volume of
the freight shipped through our networks or the revenue per pound of the freight
shipped, we may be unable to maintain or increase our
profitability.
Our
rates, overall revenue and expenses are subject to volatility.
Our rates are subject to change based on competitive pricing and market
factors. Our overall transportation rates consist of base
transportation and fuel surcharge rates. Our base transportation
rates exclude fuel surcharges and are set based on numerous factors such as
length of haul, freight class and weight per shipment. The base rates
are subject to change based on competitive pricing pressures and market
factors. Most of our competitors impose fuel surcharges, but there is
no industry standard for the calculation of fuel surcharge rates. Our
fuel surcharge rates are set weekly based on the national average for fuel
prices as published by the U.S. Department of Energy (“DOE”) and our fuel
surcharge table. Historically, we have not adjusted our method for
determining fuel surcharge rates.
Our net fuel surcharge revenue is the result of our fuel surcharge rates and the
tonnage transiting our networks. The fuel surcharge revenue is then
netted with the fuel surcharge we pay to our owner-operators and third party
transportation providers. Fluctuations in tonnage levels, related
load factors, and fuel prices may subject us to volatility in our net fuel
surcharge revenue. This potential volatility in net fuel surcharge
revenue may adversely impact our overall revenue, base transportation revenue
plus net fuel surcharge revenue, and results of operations.
13
Because
a portion of our network costs are fixed, we will be adversely affected by any
decrease in the volume or revenue per pound of freight shipped through our
networks.
Our
operations, particularly our networks of hubs and terminals, represent
substantial fixed costs. As a result, any decline in the volume or revenue per
pound of freight we handle may have an adverse effect on our operating margin
and our results of operations. Typically, Forward Air does not have contracts
with our customers and we cannot guarantee that our current customers will
continue to utilize our services or that they will continue at the same
levels. FASI does have contracts with its customers but these
contracts typically have terms allowing cancellation within 30 to 60
days. The actual shippers of the freight moved through our networks
include various manufacturers, distributors and/or retailers of electronics,
clothing, telecommunications equipment, machine parts, trade show exhibit
materials and medical equipment. Adverse business conditions affecting these
shippers or adverse general economic conditions are likely to cause a decline in
the volume of freight shipped through our networks.
We
operate in highly competitive and fragmented segments of our industry, and our
business will suffer if we are unable to adequately address downward pricing
pressures and other factors that may adversely affect our operations and
profitability.
The
segments of the freight transportation industry we participate in, are highly
competitive, very fragmented and historically have few barriers to entry. Our
principal competitors include national and regional truckload and
less-than-truckload carriers. To a lesser extent, our Forward Air segment also
competes with integrated air cargo carriers and passenger airlines. Our
competition ranges from small operators that compete within a limited geographic
area to companies with substantially greater financial and other resources,
including greater freight capacity. We also face competition from air
freight forwarders who decide to establish their own networks to transport
deferred air freight. We believe competition is based on service, primarily
on-time delivery, flexibility and reliability, as well as rates. Many of our
competitors periodically reduce their rates to gain business, especially during
times of economic decline. In the past several years, several of our competitors
have reduced their rates to unusually low levels that we believe are
unsustainable in the long-term, but that may materially adversely affect our
business in the short-term. These competitors may cause a decrease in our volume
of freight, require us to lower the prices we charge for our services and
adversely affect both our growth prospects and profitability.
Claims
for property damage, personal injuries or workers’ compensation and related
expenses could significantly reduce our earnings.
Under DOT
regulations, we are liable for property damage and personal injuries caused by
owner-operators and Company-employed drivers while they are operating on our
behalf. We currently maintain liability insurance coverage that we believe is
adequate to cover third-party claims. We have a self-insured retention of $0.5
million per occurrence for vehicle and general liability claims. We may also be
subject to claims for workers’ compensation. We maintain workers’ compensation
insurance coverage that we believe is adequate to cover such claims. We have a
self-insured retention of approximately $0.3 million for each such claim, except
in Ohio, where we are a qualified self-insured entity with an approximately $0.4
million self-insured retention. We could incur claims in excess of our policy
limits or incur claims not covered by our insurance. Any claims beyond the
limits or scope of our insurance coverage may have a material adverse effect on
us. Because we do not carry “stop loss” insurance, a significant increase in the
number of claims that we must cover under our self-insurance retainage could
adversely affect our profitability. In addition, we may be unable to maintain
insurance coverage at a reasonable cost or in sufficient amounts or scope to
protect us against losses.
We
have grown and may grow, in part, through acquisitions, which involve various
risks, and we may not be able to identify or acquire companies consistent with
our growth strategy or successfully integrate acquired businesses into our
operations.
We have
grown through acquisitions and we intend to pursue opportunities to expand our
business by acquiring other companies in the future. Acquisitions involve risks,
including those relating to:
|
·
|
identification
of appropriate acquisition
candidates;
|
|
·
|
negotiation
of acquisitions on favorable terms and
valuations;
|
|
·
|
integration
of acquired businesses and
personnel;
|
|
·
|
implementation
of proper business and accounting
controls;
|
|
·
|
ability
to obtain financing, on favorable terms or at
all;
|
|
·
|
diversion
of management attention;
|
|
·
|
retention
of employees and customers;
|
|
·
|
unexpected
liabilities;
|
|
·
|
potential
erosion of operating profits as new acquisitions may be unable to achieve
profitability comparable with our core airport-to-airport business,
and
|
|
·
|
detrimental
issues not discovered during due
diligence.
|
14
Acquisitions
also may affect our short-term cash flow and net income as we expend funds,
potentially increase indebtedness and incur additional expenses. If we are not
able to identify or acquire companies consistent with our growth strategy, or if
we fail to successfully integrate any acquired companies into our operations, we
may not achieve anticipated increases in revenue, cost savings and economies of
scale, our operating results may actually decline and acquired goodwill may
become impaired.
We
could be required to record a material non-cash charge to income if our recorded
intangible assets or goodwill are determined to be impaired.
We
have $35.9 million of recorded net definite-lived intangible assets on our
consolidated balance sheet at December 31, 2009. Our definite-lived
intangible assets primarily represent the value of customer relationships and
non-compete agreements that were recorded in conjunction with our various
acquisitions. We review our long-lived assets, such as our
definite-lived intangible assets, for impairment whenever events or changes in
circumstances indicate that the carrying amount may not be
recoverable. Impairment is recognized on these assets when the sum of
undiscounted estimated cash flows expected to result from the use of the asset
is less than the carrying value. If such measurement indicates a
possible impairment, we would be required to record a non-cash impairment charge
to our statement of income in the amount that the carrying value of these assets
exceed the estimated fair value of the assets.
We also have recorded goodwill of $43.3 million on our consolidated balance
sheet at December 31, 2009. Goodwill is assessed for impairment
annually (or more frequently if circumstances indicate possible impairment) for
each of our reportable segments. This assessment includes comparing
the fair value of each reportable segment to the carrying value of the assets
assigned to each reportable segment. If the carrying value of the
reportable segment was to exceed our estimated fair value of the reportable
segment, we would then be required to estimate the fair value of the individual
assets and liabilities within the reportable segment to ascertain the amount of
fair value of goodwill and any potential impairment. If we determine
that our fair value of goodwill is less than the related book value, we could be
required to record a non-cash impairment charge to our statement of income,
which could have a material adverse effect on our earnings. During
2009, we determined there were indicators of potential impairment of the
goodwill assigned to the FASI segment. This determination was based
on the continuing economic recession, declines in current market valuations and
FASI operating losses in excess of expectations. As a result, we
performed an interim impairment test in accordance with our accounting policy
discussed above as of March 31, 2009. Based on the results of the
interim impairment test, we concluded that an impairment loss was probable and
could be reasonably estimated. Consequently, we recorded a non-cash
goodwill impairment charge of $7.0 million related to the FASI segment during
2009.
Earnings
estimated to be generated by the Forward Air segment are expected to support the
carrying value of its goodwill. The FASI segment is currently facing
the challenges of building and expanding a business during difficult economic
times. If these overall economic conditions worsen or continue for an
extended period of time, we may be required to record an additional impairment
charge against the carrying value of goodwill related to the FASI
segment.
We
may have difficulty effectively managing our growth, which could adversely
affect our results of operations.
Our
growth plans will place significant demands on our management and operating
personnel. Our ability to manage our future growth effectively will require us
to regularly enhance our operating and management information systems and to
continue to attract, retain, train, motivate and manage key employees. If we are
unable to manage our growth effectively, our business, results of operations and
financial condition may be adversely affected.
If
we fail to maintain and enhance our information technology systems, we may lose
orders and customers or incur costs beyond expectations.
We must
maintain and enhance our information technology systems to remain competitive
and effectively handle higher volumes of freight through our network. We expect
customers to continue to demand more sophisticated, fully integrated information
systems from their transportation providers. If we are unable to maintain and
enhance our information systems to handle our freight volumes and meet the
demands of our customers, our business and results of operations will be
adversely affected. If our information systems are unable to handle higher
freight volumes and increased logistics services, our service levels and
operating efficiency may decline. This may lead to a loss of customers and a
decline in the volume of freight we receive from customers.
Our
information technology systems are subject to risks that we cannot
control.
Our
information technology systems are dependent upon global communications
providers, web browsers, telephone systems and other aspects of the Internet
infrastructure that have experienced significant system failures and electrical
outages in the past. While we take measures to ensure our major systems have
redundant capabilities, our systems are susceptible to outages from fire,
floods, power loss, telecommunications failures, break-ins and similar events.
Despite our implementation of network security measures, our servers are
vulnerable to computer viruses, break-ins and similar disruptions from
unauthorized tampering with our computer systems. The occurrence of any of these
events could disrupt or damage our information technology systems and inhibit
our internal operations, our ability to provide services to our customers and
the ability of our customers to access our information technology systems. This
may result in the loss of customers or a reduction in demand for our
services.
15
If
we have difficulty attracting and retaining owner-operators or freight handlers,
our results of operations could be adversely affected.
We depend on owner-operators for most of our transportation needs. In 2009,
owner-operators provided 70.5% of our purchased transportation. Competition for
owner-operators is intense, and sometimes there are shortages of available
owner-operators. In addition, we need a large number of freight handlers to
operate our business efficiently. During periods of low unemployment in the
areas where our terminals are located, we may have difficulty hiring and
retaining a sufficient number of freight handlers. If we have difficulty
attracting and retaining enough qualified owner-operators or freight handlers,
we may be forced to increase wages and benefits, which would increase our
operating costs. This difficulty may also impede our ability to maintain our
delivery schedules, which could make our service less competitive and force us
to curtail our planned growth. If our labor costs increase, we may be unable to
offset the increased labor costs by increasing rates without adversely affecting
our business. As a result, our profitability may be reduced.
A
determination by regulators that our independent owner-operators are employees
rather than independent contractors could expose us to various liabilities and
additional costs.
At times,
the Internal Revenue Service, the Department of Labor and state authorities have
asserted that owner-operators are “employees,” rather than “independent
contractors.” One or more governmental authorities may challenge our position
that the owner-operators we use are not our employees. A determination by
regulators that our independent owner-operators are employees rather than
independent contractors could expose us to various liabilities and additional
costs including, but not limited to, employment-related expenses such as
workers’ compensation insurance coverage and reimbursement of work-related
expenses.
We
operate in a regulated industry, and increased costs of compliance with, or
liability for violation of, existing or future regulations could have a material
adverse effect on our business.
The DOT
and various state agencies have been granted broad regulatory powers over our
business, and we are licensed by the DOT and U.S. Customs. If we fail to comply
with any applicable regulations, our licenses may be revoked or we could be
subject to substantial fines or penalties and to civil and criminal
liability.
The
transportation industry is subject to legislative and regulatory changes that
can affect the economics of our business by requiring changes in operating
practices or influencing the demand for, and the cost of providing,
transportation services. Heightened security concerns may continue to result in
increased regulations, including the implementation of various security
measures, checkpoints or travel restrictions on trucks.
In
addition, there may be changes in applicable federal or state tax or other laws
or interpretations of those laws. If this happens, we may incur additional
taxes, as well as higher workers’ compensation and employee benefit costs, and
possibly penalties and interest for prior periods. This could have an adverse
effect on our results of operations.
We
are subject to various environmental laws and regulations, and costs of
compliance with, or liabilities for violations of, existing or future laws and
regulations could significantly increase our costs of doing
business.
Our operations are subject to environmental laws and regulations dealing with,
among other things, the handling of hazardous materials and discharge and
retention of stormwater. We operate in industrial areas, where truck terminals
and other industrial activities are located, and where groundwater or other
forms of environmental contamination may have occurred. Our operations involve
the risks of fuel spillage, environmental damage, and hazardous waste disposal,
among others. If we are involved in a spill or other accident involving
hazardous substances, or if we are found to be in violation of applicable
environmental laws or regulations, it could significantly increase our cost of
doing business. Under specific environmental laws and regulations, we could be
held responsible for all of the costs relating to any contamination at our past
or present terminals and at third-party waste disposal sites. If we fail to
comply with applicable environmental laws and regulations, we could be subject
to substantial fines or penalties and to civil and criminal
liability.
In addition, as global warming issues become more prevalent, federal and local
governments and our customers are beginning to respond to these
issues. This increased focus on sustainability may result in new
regulations and customer requirements that could negatively affect us. This
could cause us to incur additional direct costs or to make changes to our
operations in order to comply with any new regulations and customer
requirements, as well as increased indirect costs or loss of revenue resulting
from, among other things, our customers incurring additional compliance costs
that affect our costs and revenues. We could also lose revenue if our customers
divert business from us because we haven’t complied with their sustainability
requirements. These costs, changes and loss of revenue could have a
material adverse affect on our business, financial condition and results of
operations.
We
are dependent on our senior management team, and the loss of any such personnel
could materially and adversely affect our business.
Our
future performance depends, in significant part, upon the continued service of
our senior management team. We cannot be certain that we can retain these
employees. The loss of the services of one or more of these or other key
personnel could have a material adverse effect on our business, operating
results and financial condition. We must continue to develop and retain a core
group of management personnel and address issues of succession planning if we
are to realize our goal of growing our business. We cannot be certain that we
will be able to do so.
16
If
our employees were to unionize, our operating costs would likely
increase.
None of
our employees are currently represented by a collective bargaining agreement.
However, we have no assurance that our employees will not unionize in the
future, which could increase our operating costs and force us to alter our
operating methods. This could have a material adverse effect on our operating
results.
Our
charter and bylaws and provisions of Tennessee law could discourage or prevent a
takeover that may be considered favorable.
Our
charter and bylaws and provisions of Tennessee law may discourage, delay or
prevent a merger, acquisition or change in control that may be considered
favorable. These provisions could also discourage proxy contests and make it
more difficult for shareholders to elect directors and take other corporate
actions. Among other things, these provisions:
|
·
|
authorize
us to issue preferred stock, the terms of which may be determined at the
sole discretion of our Board of Directors and may adversely
affect the voting or economic rights of our shareholders;
and
|
|
·
|
establish
advance notice requirements for nominations for election to the Board of
Directors and for proposing matters that can be acted on by shareholders
at a meeting.
|
Our charter and bylaws and provisions of Tennessee law may discourage
transactions that otherwise could provide for the payment of a premium over
prevailing market prices for our Common Stock, $0.01 par value per share, and
also could limit the price that investors are willing to pay in the future for
shares of our Common Stock.
|
Item
1B.
|
Unresolved
Staff Comments
|
None.
|
Item
2.
|
Properties
and Equipment
Management
believes that we have adequate facilities for conducting our business, including
properties owned and leased. Management further believes that in the event
replacement property is needed, it will be available on terms and at costs
substantially similar to the terms and costs experienced by competitors within
the transportation industry.
We lease
our 37,500 square foot headquarters in Greeneville, Tennessee from the
Greeneville-Greene County Airport Authority. The initial lease term ended in
2006 and has two ten-year and one five-year renewal options. During 2007, we
renewed the lease through 2016.
We own
our Columbus, Ohio central sorting facility. The expanded Columbus, Ohio
facility is 125,000 square feet with 168 trailer doors. This premier
facility can unload, sort and load upwards of 3.7 million pounds in five hours.
In addition to the expansion, we process-engineered the freight sorting in the
expanded building to improve handling efficiencies. The benefits include
reductions in the distance each shipment moves in the building to speed up the
transfer process, less handling of freight to further improve service integrity
and flexibility to operate multiple sorts at the same time.
In June
2009, we completed the construction of a facility near Dallas/Fort Worth, Texas
for $31.6 million. The
facility has over 216,000 square feet with 134 trailer doors and
approximately 28,000 square feet of office space. In addition, in
March and June 2007, we completed the purchase of facilities near Chicago,
Illinois and Atlanta, Georgia for $22.3 million and $14.9 million,
respectively. The Atlanta, Georgia facility is over 142,000 square
feet with 118 trailer doors and approximately 12,000 square feet of office
space. The Chicago, Illinois facility is over 125,000 square feet
with 110 trailer doors and over 10,000 square feet of office
space.
We lease
and maintain 77 additional terminals, including our
pool distribution terminals, located in major cities throughout the
United States and Canada. Lease terms for these terminals are typically for
three to five years. The remaining 17 terminals are agent stations operated by
independent agents who handle freight for us on a commission basis.
We own
the majority of trailers we use to move freight through our networks.
Substantially all of our trailers are 53’ long, some of which have specialized
roller bed equipment required to serve air cargo industry customers. At December
31, 2009, we had 2,233 owned trailers in our fleet with an average age of
approximately 4.3 years. In addition, as a result of our acquisitions
in 2007 and 2008, at December 31, 2009, we also had 77 leased trailers in our
fleet.
Through
our acquisitions in 2007 and 2008 we have also increased the size of our tractor
and straight truck fleets. At December 31, 2009, we had 327 owned
tractors and straight trucks in our fleet, with an average age of approximately
3.8 years. In addition, at December 31, 2009, we also had 137 leased
tractors and straight trucks in our fleet.
17
|
Item
3.
|
Legal
Proceedings
|
From time
to time, we are a party to ordinary, routine litigation incidental to and
arising in the normal course of our business, most of which involve claims for
personal injury, property damage related to the transportation and handling of
freight, or workers’ compensation. We do not believe that any of these pending
actions, individually or in the aggregate, will have a material adverse effect
on our business, financial condition, results of operations or cash
flow.
During the fourth quarter of the fiscal year ended December 31, 2009, no matters
were submitted to a vote of security holders through the solicitation of proxies
or otherwise.
Executive
Officers of the Registrant
Pursuant
to Instruction 3 to Item 401(b) of Regulation S-K of the Securities Act and
General Instruction G(3) to Form 10-K, the following information is included in
Part I of this report. The ages listed below are as of December 31,
2009.
The
following are our executive officers:
|
Name
|
Age
|
Position
|
||
|
Bruce
A. Campbell
|
58
|
President
and Chief Executive Officer
|
||
|
Rodney
L. Bell
|
47
|
Chief
Financial Officer, Senior Vice President and Treasurer
|
||
|
Craig
A. Drum
|
54
|
Senior
Vice President, Sales
|
||
|
Matthew
J. Jewell
|
43
|
Executive
Vice President, Chief Legal Officer and Secretary
|
||
|
Chris
C. Ruble
|
47
|
Executive
Vice President, Operations
|
There are
no family relationships between any of our executive officers. All officers hold
office at the pleasure of the Board of Directors.
Bruce A.
Campbell has served as a director since April 1993, as President since August
1998, as Chief Executive Officer since October 2003 and as Chairman of the Board
since May 2007. Mr. Campbell was Chief Operating Officer from April 1990 until
October 2003 and Executive Vice President from April 1990 until August 1998.
Prior to joining us, Mr. Campbell served as Vice President of Ryder-Temperature
Controlled Carriage in Nashville, Tennessee from September 1985 until December
1989. Mr. Campbell also serves as a director of Green Bankshares,
Inc.
Rodney L.
Bell began serving as Chief Financial Officer, Senior Vice President and
Treasurer in June 2006. Mr. Bell, who is a Certified Public Accountant, was
appointed Chief Accounting Officer in February 2006 and continued to serve as
Vice President and Controller, positions held since October 2000 and February
1995, respectively. Mr. Bell joined the Company in March 1992 as Assistant
Controller after serving as a senior manager with the accounting firm of Adams
and Plucker in Greeneville, Tennessee.
Craig A.
Drum has served as Senior Vice President, Sales since July 2001 after joining us
in January 2000 as Vice President, Sales for one of our subsidiaries. In
February 2001, Mr. Drum was promoted to Vice President of National Accounts.
Prior to January 2000, Mr. Drum spent most of his 24-year career in air freight
with Delta Air Lines, Inc., most recently as the Director of Sales and Marketing
- Cargo.
Matthew
J. Jewell has served as Executive Vice President and Chief Legal Officer since
January 2008. From July 2002 until January 2008, he served as Senior Vice
President and General Counsel. In October 2002, he was also appointed
Secretary. From July 2002 until May 2004, Mr. Jewell was also the Senior Vice
President, General Counsel and Secretary of Landair Corporation. From January
2000 until joining us in July 2002, Mr. Jewell was a partner with the law firm
of Austin & Sparks, P.C. Mr. Jewell was an associate at Dennis, Corry &
Porter, L.L.P. from July 1991 to December 1998 and a partner from January 1999
to January 2000.
Chris C.
Ruble has served as Executive Vice President, Operations since August
2007. From October 2001 until August 2007, he served as Senior Vice
President, Operations. He was a Regional Vice President from September 1997 to
October 2001 and a regional manager from February 1997 to September 1997, after
starting with us as a terminal manager in January 1996. From June 1986 to August
1995, Mr. Ruble served in various management capacities at Roadway Package
System, Inc.
18
Part
II
|
Market
for Registrant’s Common Equity, Related Shareholder Matters and Issuer
Purchases of Equity Securities
|
Our
Common Stock trades on The NASDAQ Global Select Stock Market™ under the symbol
“FWRD.” The following table sets forth the high and low sales prices for
Common Stock as reported by The NASDAQ Global Select Stock Market™ for each full
quarterly period within the two most recent fiscal years.
|
2009
|
High
|
Low
|
Dividends
|
||||||
|
First
Quarter
|
$ | 24.66 | $ | 13.80 | $ | 0.07 | |||
|
Second
Quarter
|
24.60 | 13.48 | 0.07 | ||||||
|
Third
Quarter
|
25.39 | 19.73 | 0.07 | ||||||
|
Fourth
Quarter
|
26.29 | 20.32 | 0.07 | ||||||
|
2008
|
High
|
Low
|
Dividends
|
||||||
|
First
Quarter
|
$ | 36.86 | $ | 25.55 | $ | 0.07 | |||
|
Second
Quarter
|
39.09 | 32.54 | 0.07 | ||||||
|
Third
Quarter
|
38.58 | 25.77 | 0.07 | ||||||
|
Fourth
Quarter
|
28.16 | 17.31 | 0.07 | ||||||
There
were approximately 403 shareholders of record of our Common Stock as of
February 4, 2010.
Subsequent
to December 31, 2009, our Board of Directors declared a cash dividend of $0.07
per share that will be paid on March 25, 2010 to shareholders of record at
the close of business on March 10, 2010. We expect to continue to pay regular
quarterly cash dividends, though each subsequent quarterly dividend is subject
to review and approval by the Board of Directors.
There are
no material restrictions on our ability to declare dividends.
None of
our securities were sold during fiscal year 2009 without registration under the
Securities Act.
Securities
Authorized for Issuance Under Equity Compensation Plans
The following table provides information as of December 31, 2009 with respect to
shares of our Common Stock that may be issued under existing equity compensation
plans, including the 1992 Amended and Restated Stock Option and Incentive Plan
(the “1992 Plan”), the 1999 Stock Option and Incentive Plan (the “1999 Plan”),
the Amended and Restated Stock Option and Incentive Plan (“1999 Amended Plan”),
the Non-Employee Director Stock Option Plan (the “NED Plan”), the 2000
Non-Employee Director Award (the “2000 NED Award”), the 2005 Employee Stock
Purchase Plan (the “ESPP”) and the Amended and Restated Non-Employee Director
Stock Plan (the “Amended Plan”). Our shareholders have approved each of
these plans.
|
Equity
Compensation Plan Information
|
|||||||
|
Plan
Category
|
Number
of Securities to be Issued upon Exercise of Outstanding Options, Warrants
and Rights
|
Weighted-Average
Exercise Price of Outstanding Options, Warrants and Rights
|
Number
of Securities Remaining Available for Future Issuance Under Equity
Compensation Plans
|
||||
|
|
(a)
|
(b)
|
|||||
|
Equity
Compensation Plans Approved by Shareholders
|
3,191,254
|
$
|
26
|
3,437,416
|
|||
|
Equity
Compensation Plans Not Approved by Shareholders
|
--
|
--
|
--
|
||||
|
Total
|
3,191,254
|
$
|
26
|
3,437,416
|
|||
|
(a)
|
Excludes
purchase rights accruing under the ESPP, which has an original
shareholder-approved reserve of 500,000 shares. Under the ESPP, each
eligible employee may purchase up to 2,000 shares of Common Stock at
semi-annual intervals each year at a purchase price per share equal to
90.0% of the lower of the fair market value of the Common Stock at close
of (i) the first trading day of an option period or (ii) the last trading
day of an option period.
|
|
(b)
|
Includes
shares available for future issuance under the ESPP. As of December 31,
2009, an aggregate of 447,232 shares of Common Stock were available for
issuance under the ESPP.
|
19
Stock Performance
Graph
The
following graph compares the percentage change in the cumulative shareholder
return on our Common Stock with The NASDAQ Trucking and Transportation Stocks
Index and The NASDAQ Global Select Stock Market™ Index commencing on the last
trading day of December 2004 and ending on the last trading day of December
2009. The graph assumes a base investment of $100 made on December 31, 2004 and
the respective returns assume reinvestment of all dividends. The comparisons in
this graph are required by the SEC and, therefore, are not intended to forecast
or necessarily be indicative of any future return on our Common
Stock.
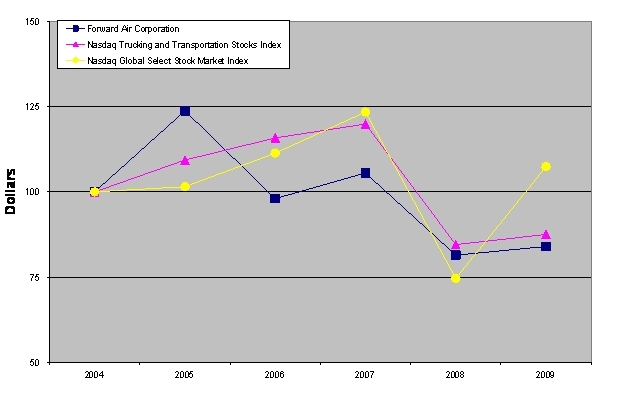
|
2004
|
2005
|
2006
|
2007
|
2008
|
2009
|
||||||
|
Forward
Air Corporation
|
100
|
124
|
98
|
106
|
81
|
84
|
|||||
|
Nasdaq
Trucking and Transportation Stocks Index
|
100
|
109
|
116
|
120
|
85
|
88
|
|||||
|
Nasdaq
Global Select Stock Market Index
|
100
|
102
|
111
|
123
|
75
|
107
|
Issuer
Purchases of Equity Securities
No shares
of our Common Stock were repurchased by the Company during the quarter ended
December 31, 2009.
20
|
Selected
Financial Data
|
The
following table sets forth our selected financial data. The selected financial
data should be read in conjunction with our consolidated financial statements
and notes thereto, included elsewhere in this report.
|
Year
ended
|
|||||||||||||||||||
|
December
31,
|
December
31,
|
December
31,
|
December
31,
|
December
31,
|
|||||||||||||||
|
2009
|
2008
|
2007
|
2006
|
2005
|
|||||||||||||||
|
(In
thousands, except per share data)
|
|||||||||||||||||||
|
Income
Statement Data:
|
|||||||||||||||||||
|
Operating
revenue
|
$ | 417,410 | $ | 474,436 | $ | 392,737 | $ | 352,758 | $ | 320,934 | |||||||||
|
Income
from operations
|
18,550 | 70,285 | 71,048 | 75,396 | 67,437 | ||||||||||||||
|
Operating
margin (1)
|
4.4 | % | 14.8 | % | 18.1 | % | 21.4 | % | 21.0 | % | |||||||||
|
Net
income
|
9,802 | 42,542 | 44,925 | 48,923 | 44,909 | ||||||||||||||
|
Net
income per share:
|
|||||||||||||||||||
|
Basic
|
$ | 0.34 | $ | 1.48 | $ | 1.52 | $ | 1.57 | $ | 1.41 | |||||||||
|
Diluted
|
$ | 0.34 | $ | 1.47 | $ | 1.50 | $ | 1.55 | $ | 1.39 | |||||||||
|
Cash
dividends declared per common share
|
$ | 0.28 | $ | 0.28 | $ | 0.28 | $ | 0.28 | $ | 0.24 | |||||||||
|
Balance
Sheet Data (at end of period):
|
|||||||||||||||||||
|
Total
assets
|
$ | 316,730 | $ | 307,527 | $ | 241,884 | $ | 213,014 | $ | 212,600 | |||||||||
|
Long-term
obligations, net of current portion
|
52,169 | 53,035 | 31,486 | 796 | 837 | ||||||||||||||
|
Shareholders'
equity
|
224,507 | 216,434 | 171,733 | 185,227 | 178,816 | ||||||||||||||
|
(1)
Income from operations as a percentage of operating
revenue
|
|
Item
7.
|
Management’s
Discussion and Analysis of Financial Condition and Results of
Operations
|
Overview
and Executive Summary
Our operations can
be broadly classified into two principal segments: Forward Air and
FASI.
Through our Forward Air
segment, we are a leading provider of time-definite surface transportation and
related logistics services to the North American deferred air freight market. We
offer our customers local pick-up and delivery (Forward Air Complete™) and
scheduled surface transportation of cargo as a cost-effective, reliable
alternative to air transportation. We transport cargo that must be delivered at
a specific time, but is less time-sensitive than traditional air freight. This
type of cargo is frequently referred to in the transportation industry as
deferred air freight. We operate our Forward Air segment through a network
of terminals located on or near airports in 84 cities in the United States
and Canada, including a central sorting facility in Columbus, Ohio and 12
regional hubs serving key markets. We also offer our customers an array of
logistics and other services including: TLX; dedicated fleets; warehousing;
customs brokerage; and shipment consolidation, deconsolidation and
handling.
FASI provides pool
distribution services throughout the Mid-Atlantic, Southeast, Midwest and
Southwest continental United States. Pool distribution involves
managing high-frequency handling and distribution of time-sensitive product to
numerous destinations in specific geographic regions. Our primary
customers for this product are regional and nationwide distributors and
retailers, such as mall, strip mall and outlet-based retail chains. We service
these customers through a network of terminals and service centers located in 19
cities.
Our operations,
particularly our network of hubs and terminals, represent substantial fixed
costs. Consequently, our ability to increase our earnings depends in significant
part on our ability to increase the amount of freight and the revenue per pound
or carton for the freight shipped through our networks and to grow other lines
of businesses, such as TLX, which will allow us to maintain revenue growth in
challenging shipping environments.
21
Trends
and Developments
Acquisitions
On September 8, 2008,
we acquired certain assets and liabilities of Service
Express. Service Express was a privately-held provider of pool
distribution services primarily in the Mid-Atlantic and Southeastern continental
United States. Service Express generated approximately $39.0 million
in revenue during the year ended December 31, 2007. The acquisition
of Service Express’ pool distribution services added to the geographic footprint
of the FASI segment in the Mid-Atlantic and Southeastern United
States.
On March 17, 2008,
we acquired certain assets and liabilities of Pinch. Pinch was a
privately-held provider of pool distribution, airport-to-airport, truckload,
customs, and cartage services primarily to the Southwestern continental United
States. Pinch generated approximately $35.0 million in revenue during
the year ended December 31, 2007. The acquisition of Pinch’s pool
distribution services expanded the geographic footprint of the FASI segment in
the Southwestern United States. In addition, it provided additional
tonnage density to the Forward Air airport-to-airport network, and the
acquisition of Pinch’s cartage and truckload business provided an opportunity
for Forward Air to expand its service options in the Southwestern United
States.
Further, on December
3, 2007 we acquired certain assets and liabilities of Black Hawk for
approximately $35.2 million to increase the penetration of our
airport-to-airport network in the Midwest continental United
States. Also, on July 30, 2007, we acquired certain assets and
liabilities of USAC for approximately $12.9 million. Through this
acquisition we began providing pool distribution services throughout the
Southeast, Midwest and Southwest continental United
States.
Results
from Operations
During the year ended
December 31, 2009, compared to the year ended December 31, 2008, we experienced
significant year-over-year decreases in our consolidated revenues and results
from operations. We largely attribute the decline in Forward Air
revenue and income from operations to the economic recession experienced
throughout 2009 and its effects on our overall business volumes and the rates we
are able to charge for our core services. FASI revenue continued to
increase substantially year over year primarily as a result of our 2008
acquisitions of Pinch and Service Express and new business
wins. However, revenues have not reached expected levels and losses
have been higher than expected largely due to the economic recession reducing
business volumes. Despite significant new business wins, FASI revenue
growth will slow in 2010 as we have now reached the anniversary dates of our
2008 acquisitions.
Declining fuel prices also
adversely affected our revenues and results of operations during 2009 as
compared with 2008. Our net fuel surcharge revenue is the result of
our fuel surcharge rates, which are set weekly using the national average for
diesel price per gallon, and the tonnage transiting our network. The
decline in tonnage levels combined with the continuing decline in diesel fuel
prices have resulted in a significant reduction in our net fuel surcharge
revenue and results from operations during 2009 as compared to
2008. Total net fuel surcharge revenue decreased 59.6% during the
year ended December 31, 2009, as compared to 2008. However, fuel prices and our
related fuel surcharge rates reached comparable year over year levels during the
fourth quarter of 2009.
In
February 2010, we notified one of FASI’s largest customers that we would cease
providing services beginning in the second quarter of 2010. During
2009 revenues from this customer were approximately $9.1 million and accounted
for 12.5% of FASI’s operating revenue and 2.2% of our consolidated operating
revenue. While going forward the loss of this customer will reduce
FASI’s operating revenue we do not anticipate FASI’s results of operations will
be adversely impacted due to the historically low yields obtained from this
business.
Goodwill
During the first
quarter of 2009, we determined there were indicators of potential impairment of
the goodwill assigned to the FASI segment. This determination was
based on the continuing economic recession, declines in current market
valuations and FASI operating losses in excess of expectations. As a
result, we performed an interim impairment test as of March 31, 2009 in
accordance with our accounting policy. We calculated the fair value
of the FASI segment using a combination of discounted cash flows and current
market valuations for comparable companies. Based on the results of
the interim impairment test, we concluded that an impairment loss was probable
and could be reasonably estimated. Consequently, we recorded a
non-cash goodwill impairment charge of $7.0 million related to the FASI segment
during the first quarter of 2009.
In accordance with
our accounting policy, we conducted our annual impairment test of goodwill
for each reportable segment as of June 30, 2009 and no additional
impairment charges were required.
As of December 31, 2009,
the carrying value of goodwill related to our Forward Air and FASI segments was
$37.9 million and $5.4 million, respectively. Earnings estimated to be generated
related to our Forward Air segment are expected to support the carrying value of
its goodwill. Our FASI segment is currently facing the challenges of building
and expanding a business during difficult economic times. If these overall
economic conditions worsen or continue for an extended period of time, we may be
required to record an additional impairment charge against the carrying value of
goodwill related to our FASI segment.
22
Segments
Our operations can be
broadly classified into two principal segments: Forward Air and
FASI.
Our Forward Air segment
includes our airport-to-airport network, Forward Air Complete™, and TLX services
as well as our other accessorial related services such as warehousing; customs
brokerage; and value-added handling services.
Our FASI segment includes
our pool distribution business.
Results
of Operations
The
following table sets forth our historical financial data for the years ended
December 31, 2009 and 2008 (in millions):
|
Year
ended
|
|||||||||||||||
|
December
31,
|
December
31,
|
Percent
|
|||||||||||||
|
2009
|
2008
|
Change
|
Change
|
||||||||||||
|
Operating
revenue
|
$ | 417.4 | $ | 474.4 | $ | (57.0 | ) | (12.0 | ) | % | |||||
|
Operating
expenses:
|
|||||||||||||||
|
Purchased
transportation
|
174.4 | 189.0 | (14.6 | ) | (7.7 | ) | |||||||||
|
Salaries,
wages, and employee benefits
|
118.8 | 116.5 | 2.3 | 2.0 | |||||||||||
|
Operating
leases
|
27.3 | 24.4 | 2.9 | 11.9 | |||||||||||
|
Depreciation
and amortization
|
19.7 | 16.6 | 3.1 | 18.7 | |||||||||||
|
Insurance
and claims
|
9.7 | 8.1 | 1.6 | 19.8 | |||||||||||
|
Fuel
expense
|
7.3 | 11.5 | (4.2 | ) | (36.5 | ) | |||||||||
|
Other
operating expenses
|
34.4 | 38.0 | (3.6 | ) | (9.5 | ) | |||||||||
|
Impairment
of goodwill
|
7.2 | -- | 7.2 | 100.0 | |||||||||||
|
Total
operating expenses
|
398.8 | 404.1 | (5.3 | ) | (1.3 | ) | |||||||||
|
Income
from operations
|
18.6 | 70.3 | (51.7 | ) | (73.5 | ) | |||||||||
|
Other
income (expense):
|
|||||||||||||||
|
Interest
expense
|
(0.7 | ) | (1.2 | ) | 0.5 | (41.7 | ) | ||||||||
|
Other,
net
|
0.1 | 0.3 | (0.2 | ) | (66.7 | ) | |||||||||
|
Total
other (expense) income
|
(0.6 | ) | (0.9 | ) | 0.3 | (33.3 | ) | ||||||||
|
Income
before income taxes
|
18.0 | 69.4 | (51.4 | ) | (74.1 | ) | |||||||||
|
Income
taxes
|
8.2 | 26.9 | (18.7 | ) | (69.5 | ) | |||||||||
|
Net
income
|
$ | 9.8 | $ | 42.5 | $ | (32.7 | ) | (76.9 | ) | % | |||||
23
The
following table sets forth our historical financial data for the years ended
December 31, 2009 and 2008 (in millions):
|
Year
ended
|
|||||||||||||||||||||
|
December
31,
|
Percent
of
|
December
31,
|
Percent
of
|
Percent
|
|||||||||||||||||
|
2009
|
Revenue
|
2008
|
Revenue
|
Change
|
Change
|
||||||||||||||||
|
Operating
revenue
|
|||||||||||||||||||||
|
Forward
Air
|
$
|
346.3
|
83.0
|
%
|
$
|
421.2
|
88.8
|
%
|
$
|
(74.9
|
)
|
(17.8
|
)
|
%
|
|||||||
|
FASI
|
72.5
|
17.4
|
55.3
|
11.6
|
17.2
|
31.1
|
|||||||||||||||
|
Intercompany
Eliminations
|
(1.4
|
)
|
(0.4
|
)
|
(2.1
|
)
|
(0.4
|
)
|
0.7
|
(33.3
|
)
|
||||||||||
|
Total
|
417.4
|
100.0
|
474.4
|
100.0
|
(57.0
|
)
|
(12.0
|
)
|
|||||||||||||
|
Purchased
transportation
|
|||||||||||||||||||||
|
Forward
Air
|
160.3
|
46.3
|
179.9
|
42.7
|
(19.6
|
)
|
(10.9
|
)
|
|||||||||||||
|
FASI
|
15.4
|
21.2
|
11.2
|
20.2
|
4.2
|
37.5
|
|||||||||||||||
|
Intercompany
Eliminations
|
(1.3
|
)
|
92.9
|
(2.1
|
)
|
100.0
|
0.8
|
(38.1
|
)
|
||||||||||||
|
Total
|
174.4
|
41.8
|
189.0
|
39.9
|
(14.6
|
)
|
(7.7
|
)
|
|||||||||||||
|
Salaries,
wages and employee benefits
|
|||||||||||||||||||||
|
Forward
Air
|
85.7
|
24.7
|
92.5
|
22.0
|
(6.8
|
)
|
(7.4
|
)
|
|||||||||||||
|
FASI
|
33.1
|
45.6
|
24.0
|
43.4
|
9.1
|
37.9
|
|||||||||||||||
|
Total
|
118.8
|
28.5
|
116.5
|
24.6
|
2.3
|
2.0
|
|||||||||||||||
|
Operating
leases
|
|||||||||||||||||||||
|
Forward
Air
|
18.7
|
5.4
|
18.5
|
4.4
|
0.2
|
1.1
|
|||||||||||||||
|
FASI
|
8.6
|
11.9
|
5.9
|
10.7
|
2.7
|
45.8
|
|||||||||||||||
|
Total
|
27.3
|
6.5
|
24.4
|
5.1
|
2.9
|
11.9
|
|||||||||||||||
|
Depreciation
and amortization
|
|||||||||||||||||||||
|
Forward
Air
|
16.1
|
4.6
|
14.4
|
3.4
|
1.7
|
11.8
|
|||||||||||||||
|
FASI
|
3.6
|
5.0
|
2.2
|
4.0
|
1.4
|
63.6
|
|||||||||||||||
|
Total
|
19.7
|
4.7
|
16.6
|
3.5
|
3.1
|
18.7
|
|||||||||||||||
|
Insurance
and claims
|
|||||||||||||||||||||
|
Forward
Air
|
7.6
|
2.2
|
7.3
|
1.7
|
0.3
|
4.1
|
|||||||||||||||
|
FASI
|
2.1
|
2.9
|
0.8
|
1.4
|
1.3
|
162.5
|
|||||||||||||||
|
Total
|
9.7
|
2.3
|
8.1
|
1.7
|
1.6
|
19.8
|
|||||||||||||||
|
Fuel
expense
|
|||||||||||||||||||||
|
Forward
Air
|
3.1
|
0.9
|
5.8
|
1.4
|
(2.7
|
)
|
(46.6
|
)
|
|||||||||||||
|
FASI
|
4.2
|
5.8
|
5.7
|
10.3
|
(1.5
|
)
|
(26.3
|
)
|
|||||||||||||
|
Total
|
7.3
|
1.8
|
11.5
|
2.4
|
(4.2
|
)
|
(36.5
|
)
|
|||||||||||||
|
Other
operating expenses
|
|||||||||||||||||||||
|
Forward
Air
|
27.7
|
8.0
|
32.1
|
7.6
|
(4.4
|
)
|
(13.7
|
)
|
|||||||||||||
|
FASI
|
6.8
|
9.4
|
5.9
|
10.7
|
0.9
|
15.3
|
|||||||||||||||
|
Intercompany
Eliminations
|
(0.1
|
)
|
7.1
|
--
|
--
|
(0.1
|
)
|
100.0
|
|||||||||||||
|
Total
|
34.4
|
8.3
|
38.0
|
8.0
|
(3.6
|
)
|
(9.5
|
)
|
|||||||||||||
|
Impairment
of goodwill and
other intangible assets
|
|||||||||||||||||||||
|
Forward
Air
|
0.2
|
0.1
|
--
|
--
|
0.2
|
100.0
|
|||||||||||||||
|
FASI
|
7.0
|
9.6
|
--
|
--
|
7.0
|
100.0
|
|||||||||||||||
|
Total
|
7.2
|
1.7
|
--
|
--
|
7.2
|
100.0
|
|||||||||||||||
|
Income
(loss) from operations
|
|||||||||||||||||||||
|
Forward
Air
|
26.9
|
7.8
|
70.7
|
16.8
|
(43.8
|
)
|
(62.0
|
)
|
|||||||||||||
|
FASI
|
(8.3
|
)
|
(11.4
|
)
|
(0.4
|
)
|
(0.7
|
)
|
(7.9
|
)
|
1,975.0
|
||||||||||
|
Total
|
$
|
18.6
|
4.4
|
%
|
$
|
70.3
|
14.8
|
%
|
$
|
(51.7
|
)
|
(73.5
|
)
|
%
|
|||||||
24
The
following table presents the components of the Forward Air segment’s
operating revenue and purchased transportation for the years ended December 31,
2009 and 2008 (in millions):
|
Percent
of
|
Percent
of
|
Percent
|
|||||||||||||||||
| 2009 |
Revenue
|
2008
|
Revenue
|
Change
|
Change
|
||||||||||||||
|
Forward
Air revenue
|
|||||||||||||||||||
|
Airport-to-airport
|
$
|
268.8
|
77.6
|
%
|
$
|
336.2
|
79.8
|
%
|
$
|
(67.4
|
)
|
(20.0
|
)
|
%
|
|||||
|
Logistics
|
54.4
|
15.7
|
59.9
|
14.2
|
(5.5
|
)
|
(9.2
|
)
|
|||||||||||
|
Other
|
23.1
|
6.7
|
25.1
|
6.0
|
(2.0
|
)
|
(8.0
|
)
|
|||||||||||
|
Total
|
$
|
346.3
|
100.0
|
%
|
$
|
421.2
|
100.0
|
%
|
$
|
(74.9
|
)
|
(17.8
|
)
|
%
|
|||||
|
Forward
Air purchased transportation
|
|||||||||||||||||||
|
Airport-to-airport
|
$
|
112.8
|
42.0
|
%
|
$
|
128.9
|
38.3
|
%
|
$
|
(16.1
|
)
|
(12.5
|
)
|
%
|
|||||
|
Logistics
|
42.2
|
77.6
|
44.5
|
74.3
|
(2.3
|
)
|
(5.2
|
)
|
|||||||||||
|
Other
|
5.3
|
22.9
|
6.5
|
25.9
|
(1.2
|
)
|
(18.5
|
)
|
|||||||||||
|
Total
|
$
|
160.3
|
46.3
|
%
|
$
|
179.9
|
42.7
|
%
|
$
|
(19.6
|
)
|
(10.9
|
)
|
%
|
|||||
Year
ended December 31, 2009 compared to Year ended December 31, 2008
Revenues
Operating revenue decreased by $57.0 million, or 12.0%, to $417.4 million for
the year ended December 31, 2009 from $474.4 million for the year ended December
31, 2008.
Forward
Air
Forward Air operating revenue decreased $74.9 million, or 17.8%, to $346.3
million from $421.2 million, accounting for 83.0% of consolidated operating
revenue for the year ended December 31, 2009. Airport-to-airport revenue, which
is the largest component of our consolidated operating revenue, decreased $67.4
million, or 20.0%, to $268.8 million from $336.2 million, accounting for 77.6%
of the segment’s operating revenue during the year ended December 31, 2009
compared to 79.8% for the year ended December 31, 2008. A significant
decrease in tonnage and a decrease in our base revenue per pound, excluding net
fuel surcharge revenue and Forward Air Complete (“Complete”) revenue, accounted
for $55.2 million of the decline in airport-to-airport revenue. Our
airport-to-airport business is priced on a per pound basis and the average
revenue per pound, excluding the impact of fuel surcharges and Complete,
decreased 3.0% for the year ended December 31, 2009 versus the year ended
December 31, 2008. Tonnage that transited our network decreased by 16.7% during
the year ended December 31, 2009 compared with the year ended December 31,
2008. The decrease in tonnage was primarily driven by the impact of
the economic recession and the resulting reduction in shipping
activity. Average base revenue per pound decreased due to the
continued shift in revenue mix to shorter distance and lower price per pound
routes as well as increased pricing competition brought on by 2009’s difficult
economic environment. The remaining decrease in airport-to-airport
revenue is the result of reduced net fuel surcharge revenue offset by increased
revenue from our Complete pick-up and delivery service. Net fuel
surcharge revenue decreased $17.8 million during the year ended December 31,
2009 as compared to the year ended December 31, 2008 as a result of reduced
average fuel prices as well as decreased overall business
volumes. Partially offsetting these decreases was a $5.6 million
increase in Complete revenue during the year ended December 31, 2009 compared to
2008. The increase in Complete revenue is attributable to an
increased frequency of airport-to-airport shippers opting to utilize our
Complete service.
Logistics revenue, which
is primarily TLX and priced on a per mile basis, decreased $5.5 million, or
9.2%, to $54.4 million for the year ended December 31, 2009 from $59.9 million
for the year ended December 31, 2008. TLX revenue decreased $4.4
million and 8.2% year over year as TLX average revenue per mile decreased
approximately 8.2% in 2009 compared to 2008 while miles driven to support our
TLX revenue remained consistent from 2008 to 2009. The decrease in
average revenue per mile is mainly attributable to decreased fuel surcharges as
a result of decreased fuel prices and reduced yields as a result of increased
truckload price competition. The remaining decrease in logistics
revenue was primarily driven by a $0.8 million, or 79.0%, decrease in dedicated
fleet services, and a $0.3 million decrease in other non-mileage based logistic
revenues. The decline in dedicated fleet services was attributable to
loss of the primary customer. The decrease in non-mileage based
services was in conjunction with the overall decline in TLX business
volumes.
Other revenue, which
includes warehousing services and terminal handling, accounts for the final
component of Forward Air operating revenue. Other revenue decreased $2.0
million, or 8.0%, to $23.1 million during the year ended December 31, 2009 from
$25.1 million during the year ended December 31, 2008. The decline in
other revenue was primarily due to volume decreases in conjunction with the
decline in our airport-to-airport business. These declines were
partially offset by increases in dedicated pick-up and delivery services
initiated during the fourth quarter of 2008.
25
FASI
FASI operating revenue increased $17.2 million, or 31.1%, to $72.5 million for
the year ended December 31, 2009 from $55.3 million for the year ended December
31, 2008. The increase in revenue is the result of additional
activity from the Pinch acquisition on March 17, 2008 and the Service Express
acquisition on September 8, 2008 and new business wins which occurred throughout
2009. These increases were slightly offset by reduced fuel surcharge
revenues as a result of declining fuel prices and reduced shipping volumes at
pre-acquisition terminals resulting from the economic recession experienced
throughout 2009.
Intercompany
Eliminations
Intercompany
eliminations decreased $0.7 million, or 33.3%, to $1.4 million during the year
ended December 31, 2009 from $2.1 million during the year ended December 31,
2008. The intercompany eliminations are the result of truckload
and airport-to-airport services Forward Air provided to FASI. FASI
also provided cartage and station agent services to Forward Air. The
decrease in intercompany eliminations was the result of reduced Forward Air
truckload services provided to FASI.
Purchased
Transportation
Purchased transportation decreased by $14.6 million, or 7.7%, to $174.4 million
for the year ended December 31, 2009 from $189.0 million for the year ended
December 31, 2008. As a percentage of total operating revenue,
purchased transportation was 41.8% during the year ended December 31, 2009
compared to 39.9% for the year ended December 31, 2008.
Forward
Air
Forward Air’s purchased transportation decreased by $19.6 million, or 10.9%, to
$160.3 million for the year ended December 31, 2009 from $179.9 million for the
year ended December 31, 2008. The decrease in purchased transportation is
primarily attributable to a decrease of approximately 14.4% in miles driven
offset by a 3.0% increase in the total cost per mile for the year ended December
31, 2009 versus the year ended December 31, 2008. As a percentage of segment
operating revenue, Forward Air purchased transportation was 46.3% during the
year ended December 31, 2009 compared to 42.7% for the year ended December 31,
2008.
Purchased transportation costs for our airport-to-airport network decreased
$16.1 million, or 12.5%, to $112.8 million for the year ended December 31, 2009
from $128.9 million for the year ended December 31, 2008. For the
year ended December 31, 2009, purchased transportation for our
airport-to-airport network increased to 42.0% of airport-to-airport revenue from
38.3% for the year ended December 31, 2008. The $16.1 million
decrease is attributable to a 17.6% decrease in miles driven by our network of
owner-operators or third party transportation providers offset by a 0.4%
increase in cost per mile paid to our network of owner-operators or third party
transportation providers. The reduction in miles decreased purchased
transportation by $20.2 million while the increase in cost per mile increased
purchased transportation $0.3 million. Miles driven by our network of
owner-operators or third party transportation providers decreased in conjunction
with the tonnage decline discussed above. Offsetting these decreases
in airport-to-airport purchased transportation was a $3.8 million increase in
expenses for third party transportation costs associated with the increased
customer utilization of Complete.
Purchased transportation costs for our logistics revenue decreased $2.3
million, or 5.2%, to $42.2 million for the year ended December 31, 2009 from
$44.5 million for the year ended December 31, 2008. For the year ended December
31, 2009, logistics’ purchased transportation costs represented 77.6% of
logistics revenue versus 74.3% for the year ended December 31, 2008. The
decrease in logistics’ purchased transportation was attributable to the
$2.1 million, or 5.3%, decrease in TLX purchased
transportation. Miles driven to support our TLX revenue remained
consistent, decreasing less than 0.1%, but we reduced the cost per mile by
approximately 5.2% during 2009 compared to 2008. The reduction
in cost per mile was mostly attributable to the increased utilization of our
less costly network of owner-operators and improved purchasing power given the
increased availability of third party transportation providers. The
remaining decrease in logistics’ purchased transportation was driven by a $0.2
million decrease in transportation costs associated with dedicated fleet
services. Logistics’ purchased transportation increased as a
percentage of revenue primarily due to the decline in yield per mile resulting
from lower fuel surcharges and increased truckload pricing
competition. During 2009, these decreases reduced our TLX yield per
mile at a faster rate than we can reduce the related cost per mile.
Purchased transportation costs related to our other revenue decreased $1.2
million, or 18.5%, to $5.3 million for the year ended December 31, 2009 from
$6.5 million for the year ended December 31, 2008. Other purchased
transportation costs as a percentage of other revenue decreased to 22.9% of
other revenue for the year ended December 31, 2009 from 25.9% for the year ended
December 31, 2008. The improvement in other
purchased transportation costs as a percentage of other revenue is attributable
to the use of Company-employed drivers to provide the transportation services
associated with certain dedicated pick-up and delivery services initiated during
the fourth quarter of 2008. Further, due to the economic recession,
we have ceased providing other ancillary services in circumstances in which the
overall yield was insufficient.
26
FASI
FASI purchased transportation increased $4.2 million, or 37.5%, to $15.4 million
for the year ended December 31, 2009 from $11.2 million for the year ended
December 31, 2008. FASI purchased transportation as a percentage of
revenue was 21.2% for the year ended December 31, 2009 compared to 20.2% for the
year ended December 31, 2008. The increase in purchased
transportation is mainly due to our continued expansion of the FASI business
through the acquisitions of Pinch and Service Express in March 2008 and
September 2008, respectively. The increase in purchased
transportation as a percentage of revenue is attributable to increased
utilization of owner-operators and third party transportation providers as
opposed to Company-employed drivers, thereby shifting the cost from salaries,
wages and benefits to purchased transportation. It is generally more
cost effective to run an owner-operator than a Company-employed driver, and we
continue to recruit owner-operators to use in our FASI operations.
Intercompany
Eliminations
Intercompany
eliminations decreased $0.8 million, or 38.1%, to $1.3 million for the year
ended December 31, 2009 from $2.1 million for the year ended December 31,
2008. The intercompany eliminations are the result of truckload and
airport-to-airport services Forward Air provided to FASI during the year end
December 31, 2009. FASI also provided cartage and agent station
services to Forward Air. The decrease in intercompany eliminations
was the result of reduced Forward Air truckload services provided to
FASI.
Salaries,
Wages, and Benefits
Salaries, wages and employee benefits decreased $2.3 million, or 2.0%, to $118.8
million for the year ended December 31, 2009 from $116.5 million for the year
ended December 31, 2008. As a percentage of total operating revenue,
salaries, wages and employee benefits was 28.5% during 2009 compared to 24.6% in
2008.
Forward
Air
Salaries, wages and employee benefits of Forward Air decreased by $6.8 million,
or 7.4%, to $85.7 million for the year ended December 31, 2009 from $92.5
million for the year ended December 31, 2008. Salaries, wages and
employee benefits were 24.7% of Forward Air’s operating revenue for the year
ended December 31, 2009 compared to 22.0% for the year ended December 31,
2008. The $6.8 million decrease in salaries, wages, and benefits was
driven by our efforts to reduce personnel costs in conjunction with the overall
decline in Forward Air revenue. Our efforts to reduce personnel costs
focused largely on controlling airport-to-airport variable wages, such as dock
personnel. Through these reductions we have reduced terminal related
pay by approximately $5.9 million, or 14.3%. In addition, we reduced
personnel costs associated with our sales force and various back-office
functions by approximately $2.2 million, or 5.3%.
However, these decreases were partially offset by increases in workers’
compensation claims, share-based compensation and employee
incentives. Workers’ compensation claims increased $0.9 million, or
50.4%, largely driven by adjustments to our loss development reserves based on
actuary analyses of Forward Air’s worker compensation claims
experience. Share-based compensation increased $0.3 million, or 5.4%,
due to the annual grants of stock options and non-vested shares of Common Stock
(“non-vested shares”) to key members of management and non-employee directors
from 2006 to the present. Employee incentives increased $0.1 million,
or 10.1%, for annual incentives for key employees and senior management.
During the fourth quarter of 2009, salaries, wages and employee benefits
increased by $1.1 million as we increased incentive accruals for senior
management and key employees. Comparatively, during the fourth
quarter of 2008, we decreased salaries, wages and employee benefits by $1.5
million for incentives to key employees and senior management.
During 2009, we were not able to reduce the fixed components of our salaries and
benefits, such as management pay, share-based compensation, and other related
benefit costs at the same rate at which Forward Air revenue declined, and as a
result salaries, wages, and benefits increased as a percentage of
revenue.
FASI
Salaries,
wages and employee benefits of FASI increased by $9.1 million, or 37.9%, to
$33.1 million for the year ended December 31, 2009 from $24.0 million for the
year ended December 31, 2008. As a percentage of FASI operating
revenue, salaries, wages and benefits increased to 45.6% for the year ended
December 31, 2009 compared to 43.4% for the year ended December 31,
2008. FASI salaries, wages and employee benefits are higher as a
percentage of operating revenue than our Forward Air segment, as a larger
percentage of the transportation services are performed by Company-employed
drivers. The increase in salaries, wages and employee benefits as a
percentage of revenue is attributable to increases in health insurance and
workers’ compensation costs, which increased to 5.2% of revenue during 2009 from
3.1% in 2008. The increases in health insurance and workers’
compensation costs is the result of 2009 including a full year of claims
associated with employees brought on with the Pinch and Service Express
acquisitions. In addition, shared-based compensation and employee
incentives increased $0.1 million, or increased 0.1% as a percentage of revenue,
largely driven by increased stock option awards to key FASI employees during
2009.
27
Operating
Leases
Operating leases increased by $2.9 million, or 11.9%, to $27.3 million for the
year ended December 31, 2009 from $24.4 million in the year ended December 31,
2008. Operating leases, the largest component of which is facility
rent, were 6.5% of consolidated operating revenue for the year ended December
31, 2009 compared with 5.1% for the year ended December 31, 2008.
Forward
Air
Operating leases increased $0.2 million, or 1.1%, to $18.7 million for the year
ended December 31, 2009 from $18.5 million for the year ended December 31,
2008. Operating leases were 5.4% of Forward Air’s operating revenue
for the year ended December 31, 2009 compared with 4.4% for the year ended
December 31, 2008. The increase in operating leases in total dollars
was attributable to a $0.4 million, or 2.2%, increase in facility rent expense
associated with the assumption of additional facilities as a result of the Pinch
acquisition and the expansion of certain facilities. The increase in facility
rent was offset by a $0.2 million, or 18.1%, decrease in tractor
leases. The decrease in tractor leases was the result of a reduction
in leased vehicles assumed in conjunction with the Pinch acquisition as such
leases expired.
FASI
Operating leases increased $2.7 million, or 45.8%, to $8.6 million for the year
ended December 31, 2009 from $5.9 million for the year ended December 31,
2008. Operating leases were 11.9% of FASI operating revenue for the
year ended December 31, 2009 compared with 10.7% for the year ended December 31,
2008. Approximately $2.5 million of the increase was attributable to
higher facility rent expense due to the increased number of terminals resulting
from the Pinch and Service Express acquisitions. Operating leases
also increased $0.2 million for trailer, tractor, and straight truck leases
assumed in conjunction with the acquisitions of Pinch and Service
Express.
Depreciation
and Amortization
Depreciation and amortization increased $3.1 million, or 18.7%, to $19.7 million
for the year ended December 31, 2009 from $16.6 million for the year ended
December 31, 2008. Depreciation and amortization was 4.7% of
consolidated operating revenue for the year ended December 31, 2009 compared
with 3.5% for the year ended December 31, 2008.
Forward
Air
Depreciation and amortization increased $1.7 million, or 11.8%, to $16.1 million
for the year ended December 31, 2009 from $14.4 million for the year ended
December 31, 2008. Depreciation and amortization expense as a
percentage of Forward Air operating revenue was 4.6% in the year ended December
31, 2009 compared to 3.4% for the year ended December 31, 2008. The
increase in depreciation and amortization expense is attributable to increased
depreciation on our new regional hub facility, recent trailer purchases,
terminal and facility leasehold improvements, and software and computer
equipment. Trailer depreciation increased $0.4 million due to new
trailers placed in service during the fourth quarter of 2008. Other
depreciation increased $1.3 million as a result of depreciation on our new
regional hub in Dallas/Fort Worth, capital expenditures for improvements to
other new or expanded facilities and for capital expenditures required to
assimilate equipment, terminals and office facilities obtained through our
recent acquisitions into our network.
FASI
Depreciation and amortization increased $1.4 million, or 63.6%, to $3.6 million
for the year ended December 31, 2009 from $2.2 million for the year ended
December 31, 2008. Depreciation and amortization expense as a
percentage of FASI operating revenue was 5.0% for the year ended December 31,
2009 compared to 4.0% for the year ended December 31,
2008. Depreciation on tractors and trailers obtained in conjunction
with our acquisitions of Pinch and Service Express accounted for $0.5 million of
the increase in depreciation and amortization. Amortization of
intangible assets also increased $0.3 million due to intangible assets acquired
with the Pinch and Service Express acquisitions. The remaining $0.6
million increase was attributable to amortization of FASTRACS, our internally
developed software utilized in FASI’s operation, depreciation on terminal
improvements such as conveyors, security systems and office improvements and
depreciation on non-rolling stock assets acquired with the Pinch and Service
Express acquisitions.
Insurance
and Claims
Insurance and claims expense increased $1.6 million, or 19.8%, to $9.7 million
for the year ended December 31, 2009 from $8.1 million for the year ended
December 31, 2008. Insurance and claims was 2.3% of consolidated
operating revenue during 2009 compared with 1.7% in 2008.
28
Forward
Air
Forward Air insurance and claims expense increased $0.3 million, or 4.1%, to
$7.6 million for the year ended December 31, 2009 from $7.3 million for the year
ended December 31, 2008. Insurance and claims as a percentage of
Forward Air’s operating revenue was 2.2% in the year ended December 31, 2009
compared to 1.7% for the year ended December 31, 2008. The increase
is the result of increases in our loss development reserves and the fees
associated with investigation and defense of our vehicle
liability. Adjustments to our loss development reserves for vehicle
accidents increased by approximately $0.5 million during the year ended December
31, 2009 compared to year ended December 31, 2008. These increases
were based on actuarial analyses of Forward Air’s vehicle accident claim
experience performed during 2009. Additionally, professional fees
associated with investigation and defense of our vehicle liability increased
$0.3 million during 2009 compared to 2008. These increases were
offset by a $0.4 million and a $0.1 million decrease in vehicle accident damages
and cargo claims, respectively. These decreases were the result of
the reduced shipping activity discussed above.
FASI
FASI insurance and claims increased $1.3 million to $2.1 million for the year
ended December 31, 2009 from $0.8 million for the year ended December 31, 2008.
As a percentage of operating revenue, insurance and claims was 2.9% for the year
ended December 31, 2009 compared to 1.4% for the year ended December 31, 2008.
The $1.3 million increase in insurance and claims is primarily attributable to a
$1.1 million increase in cargo claims and a $0.2 million increase in insurance
premiums and vehicle claims for the year ended December 31, 2009 compared to the
year ended December 31, 2008. The increase in both is primarily
attributable to the increased shipping activity and claims experience associated
with our recent acquisitions.
Fuel
Expense
Fuel expense decreased $4.2 million, or 36.5%, to $7.3 million in the year ended
December 31, 2009 from $11.5 million in the year ended December 31,
2008. Fuel expense was 1.8% of consolidated operating revenue for the
year ended December 31, 2009 compared with 2.4% for the year ended December 31,
2008.
Forward
Air
Forward Air fuel expense decreased $2.7 million, or 46.6%, to $3.1 million for
the year ended December 31, 2009 from $5.8 million in the year ended December
31, 2008. Fuel expense was 0.9% of Forward Air’s operating revenue
for the year ended December 31, 2009 compared to 1.4% for the year ended
December 31, 2008. The decrease was primarily due to the significant reduction
in average fuel prices and the year over year decline in business volumes
discussed above.
FASI
FASI fuel expense
decreased $1.5 million, or 26.3%, to $4.2 million for the year ended December
31, 2009 from $5.7 million for the year ended December 31, 2008. Fuel
expenses were 5.8% of FASI operating revenue during the year ended December 31,
2009 compared to 10.3% for the year ended December 31, 2008. FASI
fuel expense is significantly higher as a percentage of operating revenue than
Forward Air’s fuel expense, as FASI utilizes a higher ratio of Company-employed
drivers and Company-owned or leased vehicles in its operations than Forward
Air. The decrease in fuel expense was primarily due to the
significant reduction in average fuel prices during 2009 as compared to 2008
offset by increased activity as a result of the Pinch and Service Express
acquisitions.
Other
Operating Expenses
Other operating expenses decreased $3.6 million, or 9.5%, to $34.4 million for
the year ended December 31, 2009 from $38.0 million for the year ended December
31, 2008. Other operating expenses were 8.3% of consolidated
operating revenue for the year ended December 31, 2009 compared with 8.0% for
the year ended December 31, 2008.
Forward
Air
Forward Air other operating expenses decreased $4.4 million, or 13.7%, to $27.7
million for the year ended December 31, 2009 from $32.1 million for the year
ended December 31, 2008. Forward Air other operating expenses were
8.0% of operating revenue for the year ended December 31, 2009 compared to 7.6%
for the year ended December 31, 2008. The increase as a percentage of revenue is
the result of expenses not decreasing at the same rate as
revenue. Volume related expenses such as tires, dock supplies,
maintenance and agent station fees decreased $5.5 million, or 23.1%, in 2009
compared to 2008. However, these decreases were partially offset by a
$1.1 million increase in property and other taxes largely associated with our
Company-owned terminals. The $1.1 million increase in property and
other taxes is partially attributable to other operating expenses for 2008
including a $0.2 million reduction related to the reversal of previous accruals
for fines and penalties associated with the settlement of a dispute with a state
taxing authority. The dispute was settled with the state taxing
authority during the third quarter of 2008 for less than the amount previously
reserved.
29
FASI
FASI other operating expenses increased $0.9 million, or 15.3%, to $6.8 million
for the year ended December 31, 2009 compared to $5.9 million for the year ended
December 31, 2008. FASI other operating expenses were 9.4% of
operating revenue for the year ended December 31, 2009 compared to 10.7% for the
year ended December 31, 2008. The increase is attributable to
increased volume related expenses, such as dock supplies, tires, and vehicle
maintenance. The increase in the volume related expenses was directly
related to the increased revenue activity associated with the acquisitions of
Pinch and Service Express. The decrease as a percentage of revenue is
attributable to the increase in revenue outpacing the increase in other
operating expenses.
Intercompany
Eliminations
Intercompany
eliminations were $0.1 million during the year ended December 31, 2009. The intercompany
eliminations are for agent station services FASI provided to Forward Air during
the year ended December 31, 2009. FASI did not provide agent station
services to Forward Air during 2008.
Impairment
of Goodwill and Other Intangible Assets
Impairment of goodwill and other intangible assets was $7.2 million during the
year ended December 31, 2009. Impairment of goodwill was 1.7% of
consolidated operating revenue for year ended December 31, 2009.
Forward
Air
Impairment
of goodwill and other intangible assets was $0.2 million, or 0.1%, of Forward
Air operating revenue, during the year ended December 31,
2009. During the year ended December 31, 2009, Forward Air
recorded a $0.2 million charge to write off the net book value of certain
truckload and cargo handling customer relationships that had been discontinued
during 2009.
FASI
During the first quarter of 2009, we determined there were indicators of
potential impairment of the goodwill assigned to the FASI
segment. This determination was made based on the continuing economic
recession, declines in current market valuations and FASI operating losses in
excess of expectations. As a result, we performed an interim
impairment test as of March 31, 2009. Based on the results of the
impairment test, we recorded a non-cash goodwill impairment charge of $7.0
million related to the FASI segment during 2009.
Income
from Operations
Income from operations decreased by $51.7 million, or 73.5%, to $18.6 million
for the year ended December 31, 2009 compared with $70.3 million for the year
ended December 31, 2008. Income from operations was 4.4% of
consolidated operating revenue for the year ended December 31, 2009 compared
with 14.8% for the year ended December 31, 2008.
Forward
Air
Income from operations decreased by $43.8 million, or 62.0%, to $26.9 million
for the year ended December 31, 2009 compared with $70.7 million for the year
ended December 31, 2008. Forward Air’s income from operations was
7.8% of operating revenue for the year ended December 31, 2009 compared with
16.8% for the year ended December 31, 2008. The decrease in income
from operations was primarily the result of the decreased transportation and net
fuel surcharge revenues discussed above and our inability during 2009 to reduce
expenses at the same pace as the decline in total revenues.
FASI
FASI loss from operations increased approximately $7.9 million to a $8.3 million
loss from operations for the year ended December 31, 2009 from a loss from
operations of $0.4 million for the year ended December 31, 2008. FASI
loss from operations was 11.4% of operating revenue for the year ended December
31, 2009 compared with 0.7% for the year ended December 31, 2008. The
increase in FASI’s loss from operations was primarily driven by the $7.0 million
non-cash, goodwill impairment charge. Also driving the increase in
the operating loss was the lower than projected business volumes.
Interest
Expense
Interest expense decreased approximately $0.5 million, or 41.7%, to $0.7 million
for the year ended December 31, 2009 compared to $1.2 million for year ended
December 31, 2008. The decrease in interest expense was the result of
the decline in the average interest rate on net borrowings of our senior credit
facility.
30
Other
Income, Net
Other, net was income of $0.1 million for the year ended December 31, 2009
compared with income of $0.3 million for the year ended December 31, 2008. The
decrease in other income was attributable to decreased average cash and
investment balances as well as lower returns received on cash invested driven by
the decline in short term interest rates.
Provision
for Income Taxes
The combined federal and state effective tax rate for the year ended December
31, 2009 was 45.3% compared to a rate of 38.7% for the year ended
December 31, 2008. The increase in our effective tax rate is
primarily attributable to the decline in our income before income taxes combined
with an increase in share-based compensation on incentive stock
options. The share-based compensation for incentive stock options is
mostly not deductible for income tax reporting. Also, increasing the
effective tax rate was the establishment of a $0.2 million valuation allowance
on FASI’s net state deferred tax assets and a $0.2 million reserve for a state
income tax contingency.
The effective rate for the year ended December 31, 2008 was reduced by a $0.3
million decrease in state income tax expense, net of federal benefit, for the
settlement of a dispute with a state taxing authority. The dispute
was settled with the state taxing authority during the third quarter of 2008 for
less than the amount previously reserved.
Net
Income
As a result of the foregoing factors, net income decreased by $32.7 million, or
76.9%, to $9.8 million for the year ended December 31, 2009 compared to $42.5
million for the year ended December 31, 2008.
31
Results
of Operations
The
following table sets forth our historical consolidated financial data for the
years ended December 31, 2008 and 2007 (in millions):
|
Year
ended
|
|||||||||||||||
|
December
31,
|
December
31,
|
Percent
|
|||||||||||||
|
2008
|
2007
|
Change
|
Change
|
||||||||||||
|
Operating
revenue
|
$ | 474.4 | $ | 392.7 | $ | 81.7 | 20.8 | % | |||||||
|
Operating
expenses:
|
|||||||||||||||
|
Purchased
transportation
|
189.0 | 164.4 | 24.6 | 15.0 | |||||||||||
|
Salaries,
wages, and employee benefits
|
116.5 | 88.8 | 27.7 | 31.2 | |||||||||||
|
Operating
leases
|
24.4 | 16.8 | 7.6 | 45.2 | |||||||||||
|
Depreciation
and amortization
|
16.6 | 10.9 | 5.7 | 52.3 | |||||||||||
|
Insurance
and claims
|
8.1 | 7.7 | 0.4 | 5.2 | |||||||||||
|
Fuel
expense
|
11.5 | 2.4 | 9.1 | 379.2 | |||||||||||
|
Other
operating expenses
|
38.0 | 30.7 | 7.3 | 23.8 | |||||||||||
|
Total
operating expenses
|
404.1 | 321.7 | 82.4 | 25.6 | |||||||||||
|
Income
from operations
|
70.3 | 71.0 | (0.7 | ) | (1.0 | ) | |||||||||
|
Other
income (expense):
|
|||||||||||||||
|
Interest
expense
|
(1.2 | ) | (0.5 | ) | (0.7 | ) | 140.0 | ||||||||
|
Other,
net
|
0.3 | 1.8 | (1.5 | ) | (83.3 | ) | |||||||||
|
Total
other (expense) income
|
(0.9 | ) | 1.3 | (2.2 | ) | (169.2 | ) | ||||||||
|
Income
before income taxes
|
69.4 | 72.3 | (2.9 | ) | (4.0 | ) | |||||||||
|
Income
taxes
|
26.9 | 27.4 | (0.5 | ) | (1.8 | ) | |||||||||
|
Net
income
|
$ | 42.5 | $ | 44.9 | $ | (2.4 | ) | (5.3 | ) | % | |||||
32
The
following table sets forth our historical financial data for the years ended
December 31, 2008 and 2007 (in millions):
|
Year
ended
|
|||||||||||||||||||||
|
December
31,
|
Percent
of
|
December
31,
|
Percent
of
|
Percent
|
|||||||||||||||||
|
2008
|
Revenue
|
2007
|
Revenue
|
Change
|
Change
|
||||||||||||||||
|
Operating
revenue
|
|||||||||||||||||||||
|
Forward
Air
|
$
|
421.2
|
88.8
|
%
|
$
|
376.8
|
95.9
|
%
|
$
|
44.4
|
11.8
|
%
|
|||||||||
|
FASI
|
55.3
|
11.6
|
16.0
|
4.1
|
39.3
|
245.6
|
|||||||||||||||
|
Intercompany
Eliminations
|
(2.1
|
)
|
(0.4
|
)
|
(0.1
|
)
|
--
|
(2.0
|
)
|
2,000.0
|
|||||||||||
|
Total
|
474.4
|
100.0
|
392.7
|
100.0
|
81.7
|
20.8
|
|||||||||||||||
|
Purchased
transportation
|
|||||||||||||||||||||
|
Forward
Air
|
179.9
|
42.7
|
162.4
|
43.1
|
17.5
|
10.8
|
|||||||||||||||
|
FASI
|
11.2
|
20.2
|
2.1
|
13.1
|
9.1
|
433.3
|
|||||||||||||||
|
Intercompany
Eliminations
|
(2.1
|
)
|
100.0
|
(0.1
|
)
|
100.0
|
(2.0
|
)
|
2,000.0
|
||||||||||||
|
Total
|
189.0
|
39.9
|
164.4
|
41.9
|
24.6
|
15.0
|
|||||||||||||||
|
Salaries,
wages and employee benefits
|
|||||||||||||||||||||
|
Forward
Air
|
92.5
|
22.0
|
82.0
|
21.8
|
10.5
|
12.8
|
|||||||||||||||
|
FASI
|
24.0
|
43.4
|
6.8
|
42.5
|
17.2
|
252.9
|
|||||||||||||||
|
Total
|
116.5
|
24.6
|
88.8
|
22.6
|
27.7
|
31.2
|
|||||||||||||||
|
Operating
leases
|
|||||||||||||||||||||
|
Forward
Air
|
18.5
|
4.4
|
15.8
|
4.2
|
2.7
|
17.1
|
|||||||||||||||
|
FASI
|
5.9
|
10.7
|
1.0
|
6.3
|
4.9
|
490.0
|
|||||||||||||||
|
Total
|
24.4
|
5.1
|
16.8
|
4.3
|
7.6
|
45.2
|
|||||||||||||||
|
Depreciation
and amortization
|
|||||||||||||||||||||
|
Forward
Air
|
14.4
|
3.4
|
10.4
|
2.8
|
4.0
|
38.5
|
|||||||||||||||
|
FASI
|
2.2
|
4.0
|
0.5
|
3.1
|
1.7
|
340.0
|
|||||||||||||||
|
Total
|
16.6
|
3.5
|
10.9
|
2.8
|
5.7
|
52.3
|
|||||||||||||||
|
Insurance
and claims
|
|||||||||||||||||||||
|
Forward
Air
|
7.3
|
1.7
|
7.2
|
1.9
|
0.1
|
1.4
|
|||||||||||||||
|
FASI
|
0.8
|
1.4
|
0.5
|
3.1
|
0.3
|
60.0
|
|||||||||||||||
|
Total
|
8.1
|
1.7
|
7.7
|
1.9
|
0.4
|
5.2
|
|||||||||||||||
|
Fuel
expense
|
|||||||||||||||||||||
|
Forward
Air
|
5.8
|
1.4
|
1.3
|
0.3
|
4.5
|
346.2
|
|||||||||||||||
|
FASI
|
5.7
|
10.3
|
1.1
|
6.9
|
4.6
|
418.2
|
|||||||||||||||
|
Total
|
11.5
|
2.4
|
2.4
|
0.6
|
9.1
|
379.2
|
|||||||||||||||
|
Other
operating expenses
|
|||||||||||||||||||||
|
Forward
Air
|
32.1
|
7.6
|
29.0
|
7.7
|
3.1
|
10.7
|
|||||||||||||||
|
FASI
|
5.9
|
10.7
|
1.7
|
10.6
|
4.2
|
247.1
|
|||||||||||||||
|
Total
|
38.0
|
8.0
|
30.7
|
7.8
|
7.3
|
23.8
|
|||||||||||||||
|
Income
(loss) from operations
|
|||||||||||||||||||||
|
Forward
Air
|
70.7
|
16.8
|
68.7
|
18.2
|
2.0
|
2.9
|
|||||||||||||||
|
FASI
|
(0.4
|
)
|
(0.7
|
)
|
2.3
|
14.4
|
(2.7
|
)
|
(117.4
|
)
|
|||||||||||
|
Total
|
$
|
70.3
|
14.8
|
%
|
$
|
71.0
|
18.1
|
%
|
$
|
(0.7
|
)
|
(1.0
|
)
|
%
|
|||||||
33
The
following table presents the components of the Forward Air segment’s
revenue and purchased transportation for the years ended December 31, 2008 and
2007 (in millions):
|
Percent
of
|
Percent
of
|
Percent
|
|||||||||||||||
|
2008
|
Revenue
|
2007
|
Revenue
|
Change
|
Change
|
||||||||||||
|
Forward
Air revenue
|
|||||||||||||||||
|
Airport-to-airport
|
$
|
336.2
|
79.8
|
%
|
$
|
313.2
|
83.1
|
%
|
$
|
23.0
|
7.3
|
%
|
|||||
|
Logistics
|
59.9
|
14.2
|
42.7
|
11.3
|
17.2
|
40.3
|
|||||||||||
|
Other
|
25.1
|
6.0
|
20.9
|
5.6
|
4.2
|
20.1
|
|||||||||||
|
Total
|
$
|
421.2
|
100.0
|
%
|
$
|
376.8
|
100.0
|
%
|
$
|
44.4
|
11.8
|
%
|
|||||
|
Forward
Air purchased transportation
|
|||||||||||||||||
|
Airport-to-airport
|
$
|
128.9
|
38.3
|
%
|
$
|
123.7
|
39.5
|
%
|
$
|
5.2
|
4.2
|
%
|
|||||
|
Logistics
|
44.5
|
74.3
|
32.7
|
76.6
|
11.8
|
36.1
|
|||||||||||
|
Other
|
6.5
|
25.9
|
6.0
|
28.7
|
0.5
|
8.3
|
|||||||||||
|
Total
|
$
|
179.9
|
42.7
|
%
|
$
|
162.4
|
43.1
|
%
|
$
|
17.5
|
10.8
|
%
|
|||||
Year
ended December 31, 2008 compared to Year ended December 31, 2007
Revenues
Operating revenue increased by $81.7 million, or 20.8%, to $474.4 million for
the year ended December 31, 2008 from $392.7 million for the year ended December
31, 2007.
Forward
Air
Forward Air operating revenue increased $44.4 million, or 11.8%, to
$421.2 million from $376.8 million, accounting for 88.8% of consolidated
operating revenue for the year ended December 31, 2008. Airport-to-airport
revenue, which is the largest component of our consolidated operating revenue,
increased $23.0 million, or 7.3%, to $336.2 million from $313.2 million,
accounting for 79.8% of the segment’s operating revenue during the year ended
December 31, 2008 compared to 83.1% for the year ended December 31,
2007. The increase in airport-to-airport revenue was driven by our
recent acquisitions, increased utilization of Forward Air Complete and increased
net fuel surcharge revenue. Revenue for Forward Air Complete, our
pick-up and delivery service for the airport-to-airport network increased $11.4
million in 2008 over 2007 due to increased customer utilization of the
service. Also, net fuel surcharge revenue increased $12.4 million in
2008 over 2007 primarily driven by the increase in tonnage and fuel prices
during the second and third quarters of 2008. These increases were
slightly offset by a $0.8 million decrease in our base airport-to-airport
revenue. The 4.4% increase in tonnage that transited our network was
offset by a 4.5% decrease in average revenue per pound before fuel surcharge and
Forward Air Complete revenues. The increase in tonnage was primarily
driven by the increased activity resulting from our acquisitions of Pinch and
Black Hawk in March 2008 and December 2007, respectively, offset by the impact
of the economic recession on our airport-to-airport network during the second
half of 2008, but most acutely in the fourth quarter of 2008. Average
revenue per pound before net fuel surcharge and Forward Air Complete revenues
decreased due to a shift in our business mix to shorter distance lower price per
pound routes. This shift was primarily the result of new business
obtained with the Pinch and Black Hawk acquisitions as well as increased
business from international and domestic airlines.
Logistics revenue, which is primarily truckload brokerage (TLX) and priced on a
per mile basis, increased $17.2 million, or 40.3%, to $59.9 million in the year
ended December 31, 2008 from $42.7 million in the year ended December 31,
2007. The increase in logistics revenue is the result of our
continuing efforts as part of our “Completing the Model” strategic initiative to
grow TLX and $4.0 million in new revenue from service lines obtained through the
Pinch and Black Hawk acquisitions. We continue to place emphasis on
capturing a larger percentage of truckload opportunities and correspondingly
increasing our access to sufficient truckload capacity through the expansion of
our owner-operator fleet and the use of third-party transportation providers.
Through these efforts, we increased the number of miles driven to support our
TLX revenue by 27.9% during the year ended December 31, 2008 compared to the
year ended December 31, 2007. The average revenue per mile of our TLX
product, including the impact of fuel surcharges, increased 2.1% for the year
ended December 31, 2008 versus the year ended December 31, 2007. The increase in
revenue per mile is mainly attributable to increased fuel surcharges to offset
increased fuel costs.
Other revenue, which includes warehousing services and terminal handling,
accounts for the final component of Forward Air operating revenue. Other revenue
increased $4.2 million to $25.1 million for the year ended December 31, 2008, a
20.1% increase from $20.9 million for the year ended December 31,
2007. The increase was primarily due to increased cartage, handling
and storage revenue due to new services offered through our recently expanded
facilities. The increased cartage revenue is also the result of new
business obtained in conjunction with the Pinch and Black Hawk
acquisitions.
34
FASI
FASI operating revenue increased $39.3 million to $55.3 million for the year
ended December 31, 2008 from $16.0 million for the year ended December 31,
2007. The increase in revenue is the result of additional activity
from the Pinch acquisition on March 17, 2008 and the Service Express acquisition
on September 8, 2008. In addition, the year ended December 31, 2008
includes a full twelve months of revenue compared to only five months for the
year ended December 31, 2007, as FASI began operations on July 30, 2007 in
conjunction with the acquisition of USAC.
Intercompany
Eliminations
Intercompany eliminations of $2.1 million were the result of truckload and
airport-to-airport services Forward Air provided to FASI during the year ended
December 31, 2008. FASI also provides cartage services to Forward
Air.
Purchased
Transportation
Purchased transportation increased by $24.6 million, or 15.0%, to $189.0
million for the year ended December 31, 2008 from $164.4 million for the year
ended December 31, 2007. As a percentage of total operating revenue,
purchased transportation was 39.9% during the year ended December 31, 2008
compared to 41.9% for the year ended December 31, 2007.
Forward
Air
Forward Air’s purchased transportation increased by $17.5
million, or 10.8%, to $179.9 million for the year ended December 31,
2008 from $162.4 million for the year ended December 31, 2007. The increase in
purchased transportation is primarily attributable to an increase of
approximately 6.4% in miles driven in addition to a 4.1% increase in the total
cost per mile for the year ended December 31, 2008 versus the year ended
December 31, 2007. As a percentage of segment operating revenue, Forward Air
purchased transportation was 42.7% during the year ended December 31, 2008
compared to 43.1% for the year ended December 31, 2007.
Purchased transportation costs for our airport-to-airport network increased $5.2
million, or 4.2%, to $128.9 million for the year ended December 31,
2008 from $123.7 million for the year ended December 31, 2007. For
the year ended December 31, 2008, purchased transportation for our
airport-to-airport network decreased to 38.3% of airport-to-airport revenue from
39.5% for the year ended December 31, 2007. The $5.2 million increase
was attributable to a 1.2% increase in miles driven by our network of
owner-operators or third party transportation providers plus a 3.0% increase in
cost per mile. The change in miles increased purchased transportation
by $1.5 million while the change in cost per mile increased purchased
transportation $3.7 million. Miles driven by our network of
owner-operators or third party transportation providers increased to support the
increased revenue activity, mainly in the first half of 2008 as discussed
above. The increase in cost per mile was attributable to increased
customer utilization of Forward Air Complete mitigated by increased utilization
of our network of owner-operators as opposed to more costly third party
transportation providers. Additionally, the increase in cost per mile
was also offset by the increased use of Company-employed drivers. The
increase in the number of Company-employed drivers and their use in the
airport-to-airport network is mainly a result of the Pinch and Black Hawk
acquisitions. The cost for the Company-employed drivers is included
in salaries, wages and benefits instead of purchased
transportation.
Purchased transportation costs for our logistics revenue increased $11.8
million, or 36.1%, to $44.5 million for the year ended December 31,
2008 from $32.7 million for the year ended December 31, 2007. For the year ended
December 31, 2008, logistics’ purchased transportation costs represented 74.3%
of logistics revenue versus 76.6% for the year ended December 31, 2007. The
36.1% increase is partially attributable to a $2.3 million increase in costs
associated with new logistics business obtained through the acquisition of Pinch
and Black Hawk. The remaining increase is attributable to a 27.9%
increase in miles driven by our network of owner-operators or third party
transportation providers plus a 0.9% increase in the related cost per
mile. Miles driven by our network of owner-operators or third party
transportation providers increased to support our continuing efforts to grow our
TLX business as discussed above, and accounted for $9.1 million of the increase
in logistics purchased transportation. The change in the cost per
mile increased the logistics’ purchased transportation by $0.4 million. The increase in
cost per mile was mostly the result of increased rates from third party
transportation providers mostly offset by increased use of our network of
owner-operators. The decrease in logistics’ purchased transportation
as a percentage of revenue was the result of the favorable change in business
mix as well as the addition of the new services from the Pinch and Black Hawk
acquisitions.
Purchased transportation costs related to our other revenue increased $0.5
million, or 8.3%, to $6.5 million for the year ended December 31, 2008
from $6.0 million for the year ended December 31, 2007. Other purchased
transportation costs as a percentage of other revenue decreased to 25.9% of
other revenue for the year ended December 31, 2008 from 28.7% for the year ended
December 31, 2007. The improvement in other purchased
transportation costs as a percentage of other revenue was attributable to the
use of Company-employed drivers to provide the transportation services
associated with new business obtained from the Pinch and Black Hawk
acquisitions.
35
FASI
FASI
purchased transportation increased to $11.2 million for the year ended December
31, 2008 from $2.1 million for the year ended December 31, 2007. FASI
purchased transportation as a percentage of revenue was 20.2% for the year ended
December 31, 2008 compared to 13.1% for the year ended December 31,
2007. The increase in purchased transportation was mainly due to our
continued expansion of the FASI business through the acquisitions of Pinch and
Service Express in March 2008 and September 2008, respectively. In
addition, the year ended 2008 includes a full twelve months of FASI activity
compared to only five months for the year ended December 31, 2007, as FASI began
operations on July 30, 2007. Purchased transportation had increased
as a percentage of FASI revenue mainly due to the increased use of
owner-operators particularly in conjunction with the acquisition of
Pinch.
Intercompany
Eliminations
Intercompany eliminations increased to $2.1 million and were the result of
truckload and airport-to-airport services Forward Air provided to FASI during
the year ended December 31, 2008. During the year ended December 31,
2008, FASI also provided cartage services to Forward Air.
Salaries,
Wages, and Benefits
Salaries, wages and employee benefits increased by $27.7 million, or 31.2%, to
$116.5 million in the year ended 2008 from $88.8 million in the same period of
2007. As a percentage of total operating revenue, salaries, wages and
employee benefits was 24.6% during the year ended December 31, 2008 compared to
22.6% for the same period in 2007.
Forward
Air
Salaries, wages and employee benefits of Forward Air increased by $10.5 million,
or 12.8%, to $92.5 million for the year ended December 31, 2008 from $82.0
million for the year ended December 31, 2007. Salaries, wages and
employee benefits were 22.0% of Forward Air’s operating revenue in the year
ended December 31, 2008 compared to 21.8% for the year ended December 31,
2007. The increase in salaries, wages and employee benefits as a
percentage of revenue was the result of increases in health insurance costs and
share-based compensation offset by decreases in workers’ compensation and
employee incentive costs.
Employee incentives decreased $0.4 million, or 0.2%, as a percentage of revenue
for the year ended December 31, 2008 as compared to the year ended December 31,
2007. The decrease was due to a reduction of annual incentives for
key employees due to failures to achieve performance goals.
During the fourth quarter of 2008, salaries, wages and employee benefits
were reduced by $1.5 million as we reduced accruals for incentives to key
employees and senior management. Comparatively, we increased
salaries, wages and employee benefits by $1.1 million during the fourth quarter
of 2007 for annual incentives to key employees and senior
management.
Workers’ compensation costs decreased approximately $1.1 million, or 0.3%, as a
percentage of Forward Air’s operating revenue. The year-over-year
difference was primarily due to a $0.7 million increase in our workers’
compensation loss reserves recorded in 2007 that resulted from an actuarial
analysis. The remaining decrease was due to 2008 reductions in our workers’
compensation loss reserves as a result of lower claims experience than projected
in previous periods.
Share-based compensation increased $2.4 million, or 0.5% as a percentage of
Forward Air’s operating revenue, due to the annual grants of stock options and
non-vested shares to key members of management and non-employee directors from
2006 to the present. Health insurance costs increased $1.8 million
and 0.3% as a percentage of Forward Air’s operating revenue. The
increase was driven by an increase in plan participants primarily as a result of
our Pinch and Black Hawk acquisitions in March 2008 and December 2007,
respectively.
The remaining increase in total dollars was attributable to the increased
headcount of mainly terminal and Company-employed drivers associated with our
acquisitions of Pinch and Black Hawk.
FASI
FASI salaries, wages and employee benefits increased to $24.0 million for the
year ended December 31, 2008 compared to $6.8 million for the year ended
December 31, 2007. The $17.2 million increase was mainly attributable
to the year ended 2008 including twelve months of expense while 2007 included
only five months, as FASI was not operating until July 30, 2007. As a
percentage of FASI operating revenue, salaries, wages and benefits increased to
43.4% for the year ended December 31, 2008 compared to 42.5% for the year ended
December 31, 2007. FASI salaries, wages and employee benefits were
higher as a percentage of operating revenue than our Forward Air segment, as a
larger percentage of the transportation services were performed by
Company-employed drivers as opposed to independent
owner-operators. The increase in salaries, wages and employee
benefits as a percentage of revenue was attributable to the acquisition of
Service Express in September 2008. The terminals we acquired with the
Service Express acquisition utilize a much higher percentage of contract labor
for its dock personnel than used by preexisting FASI
terminals. Contract labor was more expensive in the short term than
Company-employed cargo handlers and dock personnel. We will evaluate
the proper utilization of contract labor in these terminals during the first
quarter of 2009.
36
Operating
Leases
Operating leases increased by $7.6 million, or 45.2%, to $24.4 million for the
year ended December 31, 2008 from $16.8 million in the year ended December 31,
2007. Operating leases, the largest component of which is facility
rent, were 5.1% of consolidated operating revenue for the year ended December
31, 2008 compared with 4.3% for the year ended December 31, 2007.
Forward
Air
Operating leases increased $2.7 million and 17.1% to $18.5 million for the year
ended December 31, 2008 from $15.8 million for the year ended December 31,
2007. Operating leases were 4.4% of Forward Air operating revenue for
the year ended December 31, 2008 compared with 4.2% for the year ended December
31, 2007. The increase in operating leases in total dollars was
attributable to $1.5 million in higher facility rent expense associated with the
assumption of additional facilities as a result of the Pinch and Black Hawk
acquisitions and the expansion of certain facilities. Operating leases also
increased $1.2 million for trailer and tractor leases assumed in conjunction
with the acquisitions of Pinch and Black Hawk.
FASI
FASI operating lease expense increased $4.9 million to $5.9 million for the year
ended December 31, 2008 from $1.0 million for the year ended December 31,
2007. Approximately $2.8 million of the increase was attributable to
higher facility rent expense due to the increased number of terminals
resulting from the Pinch and Service Express acquisitions. Operating
leases also increased $2.1 million for trailer, tractor, and straight truck
leases assumed in conjunction with the acquisitions of Pinch and Service
Express. The increase in operating lease expense, both for facilities
and equipment, is also attributable to the year ended 2008 including twelve
months of lease expense while 2007 included only five months, as FASI was not
operating until July 30, 2007. The increase in lease expense for
tractors, straight trucks and trailers was the primary reason for the increase
in operating leases as a percentage of revenue.
Depreciation
and Amortization
Depreciation and amortization increased $5.7 million, or 52.3%, to $16.6 million
in the year ended December 31, 2008 from $10.9 million for the year ended
December 31, 2007. Depreciation and amortization was 3.5% of
consolidated operating revenue for the year ended December 31, 2008 compared
with 2.8% for the year ended December 31, 2007.
Forward
Air
Depreciation and amortization expense as a percentage of Forward Air operating
revenue was 3.4% in the year ended December 31, 2008 compared to 2.8% for the
year ended December 31, 2007. The increase in depreciation and
amortization expense as a percentage of revenue was primarily due to a $2.1
million, or 0.5% as a percentage of revenue, increase in amortization expense
for intangible assets associated with the acquisitions of Pinch and Black
Hawk. The remaining increase represents depreciation on new forklifts
and other miscellaneous equipment and assets.
FASI
FASI depreciation and amortization increased $1.7 million to $2.2 million for
the year ended December 31, 2008 from $0.5 million for the year ended December
31, 2007. Depreciation and amortization expense as a percentage of FASI
operating revenue was 4.0% in the year ended December 31, 2008 compared to 3.1%
for the year ended December 31, 2007. The increase in depreciation
and amortization expense as a percentage of revenue was partially due to a $0.6
million, or 0.4% as a percentage of revenue, increase in amortization expense
for intangible assets associated with the Service Express, Pinch and USAC
acquisitions. The remainder of the increase was attributable to a full year
of depreciation on assets acquired from USAC and increased depreciation from
tractors, trailers and other equipment assumed in conjunction with our
acquisitions of Pinch and Service Express.
Insurance
and Claims
Insurance
and claims expense increased $0.4 million, or 5.2%, to $8.1 million for the year
ended December 31, 2008 from $7.7 million for the year ended December 31,
2007. Insurance and claims was 1.7% of consolidated operating revenue
during 2008 compared with 1.9% in 2007.
Forward
Air
Insurance
and claims as a percentage of Forward Air’s operating revenue was 1.7% in the
year ended December 31, 2008 compared to 1.9% for the year ended December 31,
2007. The $0.1 million and 1.4% increase in insurance and claims
for the year ended 2008 compared to the year ended December 31, 2007 was the
result of increased insurance premiums resulting from the increased number of
owner-operators, Company-employed drivers, and rolling stock equipment in our
fleet.
37
FASI
FASI insurance and claims increased $0.3 million to $0.8 million for the year
ended December 31, 2008 from $0.5 million for the year ended December 31, 2007.
As a percentage of operating revenue, insurance and claims was 1.4% for the year
ended December 31, 2008 compared to 3.1% for the year ended December 31, 2007.
The decrease as a percentage of revenue was attributable to the increase in
revenue outpacing the increase in claims and insurance premiums.
Fuel
Expense
Fuel expense increased $9.1 million, to $11.5 million in the year ended December
31, 2008 from $2.4 million in the year ended December 31, 2007. Fuel
expense was 2.4% of consolidated operating revenue for the year ended December
31, 2008 compared with 0.6% for the year ended December 31, 2007.
Forward
Air
Fuel expense was 1.4% of Forward Air’s operating revenue for the year ended
December 31, 2008 compared to 0.3% for the year ended December 31, 2007. The
$4.5 million increase was primarily attributable to the increased number of
Company-employed drivers and Company-owned or operated equipment as a result of
the Pinch and Black Hawk acquisitions in March 2008 and December 2007,
respectively. Also increasing fuel expense was the significant year-over-year
increase in average diesel fuel prices during the second and third quarters of
2008.
FASI
FASI fuel expense increased $4.6 million, to $5.7 million for the year ended
December 31, 2008 from $1.1 million for the year ended December 31,
2007. Fuel expenses were 10.3% of FASI operating revenue for the year
ended December 31, 2008 compared to 6.9% for the year ended December 31,
2007. FASI fuel expense was significantly higher as a percentage of
operating revenue than Forward Air’s fuel expense, as FASI utilizes a higher
ratio of Company-employed drivers and Company-owned or leased vehicles in its
operations than Forward Air. The increase in FASI fuel expense was
attributable to the increase in owned and leased tractors assumed with the Pinch
and Service Express acquisitions. The increase was also attributable
to the year ended 2008 including a full year of FASI activity as opposed to only
five months for 2007. Also increasing fuel expense was the
significant year-over-year increase in average diesel fuel prices during the
second and third quarters of 2008.
Other
Operating Expenses
Other operating expenses increased $7.3 million, or 23.8%, to $38.0 million for
the year ended December 31, 2008 from $30.7 million for the year ended December
31, 2007. Other operating expenses were 8.0% of consolidated
operating revenue for the year ended December 31, 2008 compared with 7.8% in the
same period of 2007.
Forward
Air
Other operating expenses were 7.6% of Forward Air’s operating revenue in the
year ended December 31, 2008 compared to 7.7% for the year ended December 31,
2007. The 0.1% decrease in other operating expenses as a percentage of operating
revenue was the result of efforts to control discretionary costs by reducing
expenses such as management training, marketing and travel. In
addition, during the year ended December 31, 2008 other operating expenses were
reduced by $0.2 million related to the reversal of previous accruals for fines
and penalties associated with the settlement of a dispute with a state taxing
authority. The dispute was settled with the state taxing authority
for less than the amount previously reserved.
FASI
FASI other operating expenses increased $4.2 million to $5.9 million for the
year ended December 31, 2008 compared to $1.7 million for the year ended
December 31, 2007. The $4.2 million increase is mainly attributable
to the year ended 2008, including twelve months of expense while 2007 included
only five months, as FASI was not operating until July 30, 2007. FASI
other operating expenses for the year ended December 31, 2008 were 10.7% of the
segment’s operating revenue compared to 10.6% for the December 31,
2007. Other operating expenses are higher as a percentage of revenue
than our Forward Air segment due to the higher
utilization of Company-owned or leased vehicles resulting in higher
maintenance and related expenses.
Income
from Operations
Income from operations decreased by $0.7 million, or 1.0%, to $70.3 million
for the year ended December 31, 2008 compared with $71.0 million for the year
ended December 31, 2007. Income from operations was 14.8% of
consolidated operating revenue for the year ended December 31, 2008 compared
with 18.1% for the year ended December 31, 2007.
38
Forward
Air
Income
from operations increased by $2.0 million, or 2.9%, to $70.7 million for the
year ended December 31, 2008 compared with $68.7 million for the year ended
December 31, 2007. The increase in income from operations was
primarily a result of increased revenues partially offset by increased costs for
salaries, wages and benefits, operating leases and depreciation and
amortization. Income from operations as a percentage of Forward Air’s
operating revenue was 16.8% for the year ended December 31, 2008 compared with
18.2% for the year ended December 31, 2007. The decrease in income
from operations as a percentage of revenue was the result of increasing volumes
from our lower margin services, such as TLX, and declining airport-to-airport
volumes mainly during the fourth quarter of 2008 due to the economic
recession.
FASI
FASI results from operations decreased approximately $2.7 million to a $0.4
million loss from operations for the year ended December 31, 2008 from income of
operations of $2.3 million for the year ended December 31, 2007. The
decrease in FASI results from operations was mainly driven by integration costs
that resulted from the March 17, 2008 acquisition of Pinch. These costs
primarily impacted salaries, wages, and employee benefits, operating leases and
other operating expenses. The loss from operations as a percentage of
FASI operating revenue was (0.7)% for the year ended December 31, 2008 compared
with 14.4% income from operations as a percentage of revenue for the year ended
December 31, 2007. As discussed above, the pool distribution business
is highly seasonal and as a result of the timing of the USAC acquisition, our
2007 results primarily included peak seasonal activity. Consequently,
our 2007 results were better than we would expect for a full year of operations,
such as 2008, which would include less positive results from the non-peak
periods of operations. In addition, FASI’s fourth quarter of 2008
income from operations of $0.5 million was $1.3 million less than the $1.8
million of income from operations for the fourth quarter of
2007. This was primarily the result of lower peak season volumes than
anticipated due to the current economic recession.
Interest
Expense
Interest
expense increased $0.7 million to $1.2 million for the year ended December 31,
2008 compared to $0.5 million for the year ended December 31,
2007. The increase in interest expense was mostly the result of net
borrowings under our line of credit facility used to fund our acquisitions of
Service Express, Pinch and Black Hawk in September 2008, March 2008 and December
2007, respectively. These increases were net of a $0.1 million
reduction of interest expense resulting from the settlement of a dispute with a
state taxing authority during the year ended December 31, 2008. The
dispute was settled with the state taxing authority for less than the amount
previously reserved.
Other
Income, Net
Other income, net was $0.3 million for the year ended December 31, 2008 compared
with $1.8 million for the year ended December 31, 2007. The decrease in other
income was attributable to reduced tax-exempt interest income due to decreased
average cash and investment balances as a result of cash used for the
acquisition of USAC in July 2007 and stock repurchases during the fourth quarter
of 2007.
Provision
for Income Taxes
The combined federal and state effective tax rate for the year ended 2008 was
38.7% compared to a rate of 37.9% for the year ended
December 31, 2007. Our effective federal and state rate increased to
provide for the decrease in tax-exempt interest income as discussed above and
the disallowance of share-based compensation on qualified stock options.
However, during the year ended December 31, 2008 we reduced the provision for
state income taxes by $0.3 million, net of federal benefit, for the settlement
of a dispute with a state taxing authority. The dispute was settled
with the state taxing authority for less than the previously reserved
amount.
Net
Income
As a
result of the foregoing factors, net income decreased by $2.4 million, or 5.3%,
to $42.5 million for the year ended December 31, 2008 compared to $44.9
million for the year ended December 31, 2007.
Discussion
of Critical Accounting Policies
Our
consolidated financial statements have been prepared in accordance with United
States generally accepted accounting principles (“GAAP”). The
preparation of financial statements in accordance with GAAP requires our
management to make estimates and assumptions that affect the amounts reported in
the consolidated financial statements and accompanying notes. Our
estimates and assumptions are based on historical experience and changes in the
business environment. However, actual results may differ from
estimates under different conditions, sometimes materially. Critical
accounting policies and estimates are defined as those that are both most
important to the portrayal of our financial condition and results and require
management’s most subjective judgments.
39
Allowance
for Doubtful Accounts
We
evaluate the collectibility of our accounts receivable based on a combination of
factors. In circumstances in which management is aware of a specific customer’s
inability to meet its financial obligations to us (for example, bankruptcy
filings or accounts turned over for collection or litigation), we record a
specific reserve for these bad debts against amounts due to reduce the net
recognized receivable to the amount we reasonably believe will be collected. For
all other customers, we recognize reserves for these bad debts based on the
length of time the receivables are past due. Specifically, amounts that are 90
days or more past due are reserved at 50.0% for Forward Air and 25.0% for FASI.
If circumstances change (i.e., we experience higher than expected defaults or an
unexpected material adverse change in a customer’s ability to meet its financial
obligations to us), the estimates of the recoverability of amounts due to us
could be changed by a material amount. Accounts are written off after all means
of collection, including legal action, have been exhausted.
Allowance
for Revenue Adjustments
Our
allowance for revenue adjustments consists of amounts reserved for billing rate
changes that are not captured upon load initiation. These adjustments generally
arise: (i) when the sales department contemporaneously grants small rate changes
(“spot quotes”) to customers that differ from the standard rates in the system;
(ii) when freight requires dimensionalization or is reweighed resulting in a
different required rate; (iii) when billing errors occur; and (iv) when data
entry errors occur. When appropriate, permanent rate changes are initiated and
reflected in the system. We monitor the manual revenue adjustments closely
through the employment of various controls that are in place to ensure that
revenue recognition is not compromised and that fraud does not occur. During
2009, average revenue adjustments per month were approximately $0.2 million, on
average revenue per month of approximately $34.8 million (less than 1.0% of
monthly revenue). In order to estimate the allowance for revenue adjustments
related to ending accounts receivable, we prepare an analysis that considers
average monthly revenue adjustments and the average lag for identifying and
quantifying these revenue adjustments. Based on this analysis, we establish an
allowance for approximately 40-80 days (dependent upon experience in the
preceding twelve months) of average revenue adjustments, adjusted for rebates
and billing errors. The lag is periodically adjusted based on actual historical
experience. Additionally, the average amount of revenue adjustments per month
can vary in relation to the level of sales or based on other factors (such as
personnel issues that could result in excessive manual errors or in excessive
spot quotes being granted). Both of these significant assumptions are
continually evaluated for validity.
Self-Insurance
Loss Reserves
Given the
nature of our operating environment, we are subject to vehicle and general
liability, workers’ compensation and health insurance claims. To mitigate a
portion of these risks, we maintain insurance for individual vehicle and general
liability claims exceeding $0.5 million and workers’ compensation claims
and health insurance claims exceeding approximately $0.3 million, except in
Ohio, where we are a qualified self-insured entity with an approximately $0.4
million self-insured retention. The amount of self-insurance loss reserves and
loss adjustment expenses is determined based on an estimation process that uses
information obtained from both company-specific and industry data, as well as
general economic information. The estimation process for self-insurance loss
exposure requires management to continuously monitor and evaluate the life cycle
of claims. Using data obtained from this monitoring and our assumptions about
the emerging trends, management develops information about the size of ultimate
claims based on its historical experience and other available market
information. The most significant assumptions used in the estimation process
include determining the trend in loss costs, the expected consistency in the
frequency and severity of claims incurred but not yet reported to prior year
claims, changes in the timing of the reporting of losses from the loss date to
the notification date, and expected costs to settle unpaid claims. Management
also monitors the reasonableness of the judgments made in the prior year’s
estimation process (referred to as a hindsight analysis) and adjusts current
year assumptions based on the hindsight analysis. Additionally, we utilize
actuarial analysis to evaluate open vehicle liability and workers’ compensation
claims and estimate the ongoing development exposure.
Revenue
Recognition
Operating
revenue and related costs are recognized as of the date shipments are
completed. The transportation rates we charge our customers consist
of base transportation rates and fuel surcharge rates. The revenues
earned and related direct freight expenses incurred from our base transportation
services are recognized on a gross basis in revenue and in purchased
transportation. Transportation revenue is recognized on a gross basis
as we are the primary obligor. The fuel surcharges billed to
customers and paid to owner-operators and third party transportation providers
are recorded on a net basis in revenue as we are not the primary obligor with
regards to the fuel surcharges.
Income
Taxes
We
account for income taxes using the liability method, whereby deferred tax assets
and liabilities are determined based on differences between financial reporting
and tax basis of assets and liabilities and are measured using the enacted tax
rates and laws that will be in effect when the differences are expected to be
recovered or settled. Also, beginning January 1, 2007, we report a
liability for unrecognized tax benefits resulting from uncertain tax positions
taken or expected to be taken in a tax return. We recognize interest
and penalties, if any, related to unrecognized tax benefits in interest expense
and operating expenses, respectively.
40
Valuation
of Goodwill
We
conduct an annual (or more frequently if circumstances indicate possible
impairment) impairment test of goodwill for each reportable segment at the end
of the second quarter of each year. The tests are based on judgments
regarding the market value of our Common Stock, ongoing profitability and cash
flow of the reportable segments and underlying assets. Changes in strategy or
market conditions could significantly impact these judgments and require
adjustments to recorded asset balances. For example, if we had reason to believe
that our recorded goodwill had become impaired due to decreases in the fair
market value of the underlying business, we would have to take a charge to
income for that portion of goodwill that we believe is impaired.
For example, during
the first quarter of 2009, we determined there were indicators of potential
impairment of the goodwill assigned to the FASI segment. This
determination was based on the continuing economic recession, declines in
current market valuations and FASI operating losses in excess of
expectations. As a result, we performed an interim impairment test in
accordance with our accounting policy discussed above as of March 31,
2009. Based on the results of the interim impairment test, we
concluded that an impairment loss was probable and could be reasonably
estimated. Consequently, we recorded a non-cash goodwill impairment
charge of $7.0 million related to the FASI segment during the first quarter of
2009.
Share-Based
Compensation
Our
general practice has been to make a single annual grant to key employees and to
generally make other grants only in connection with new employment or
promotions. In addition, we make annual grants to non-employee
directors in conjunction with their annual election to our Board of Directors or
at the time of their appointment to the Board of Directors. During
the year ended December 31, 2006, we granted non-vested shares to key employees,
but returned to granting stock options during the year ended December 31,
2007. We returned to granting stock options to key employees, as
we believe stock options more closely link long-term compensation with our
long-term goals. For non-employee directors, we have granted
non-vested shares annually beginning in 2006.
Stock
options typically expire seven years from the grant date and vest ratably over a
three-year period. The share-based compensation for stock options are
recognized, net of estimated forfeitures, ratably over the requisite service
period, or vesting period. Based on our historical experience, forfeitures are
estimated. We use the Black-Scholes option-pricing model to estimate the
grant-date fair value of options granted.
The fair
value of non-vested shares issued were estimated using the closing market prices
for the business day of the grant. The share-based compensation for the
non-vested shares is recognized, net of estimated forfeitures, ratably over the
requisite service period or vesting period. Forfeitures are estimated based on
our historical experience, but will be adjusted for future changes in forfeiture
experience.
Under the
ESPP, which has been approved by our shareholders, we are authorized to issue
shares of Common Stock to our employees. These shares may be issued at a price
equal to 90.0% of the lesser of the market value on the first day or the last
day of each six-month purchase period. Common Stock purchases are paid for
through periodic payroll deductions and/or up to two large lump sum
contributions. As the ESPP does not qualify as non-compensatory, we recognize
share-based compensation on the date of purchase based on the difference between
the purchase date fair market value and the employee purchase
price.
Impact
of Recent Accounting Pronouncements
During September 2006, the Financial Accounting Standards Board (“FASB”)
issued guidance regarding fair value measurements, which was effective for
fiscal years beginning after November 15, 2007. This guidance defines fair
value, establishes a framework for measuring fair value in generally accepted
accounting principles, and expands disclosures about fair value measurements. In
February 2008, the FASB delayed the effective date of the fair value guidance
for all non-financial assets and liabilities, except those that are recognized
or disclosed at fair value in the financial statements on a recurring basis,
until January 1, 2009. We adopted the new fair value guidance
on January 1, 2008 for all financial assets and liabilities and on January 1,
2009 for nonfinancial assets. This adoption did not have a
significant impact on our financial position or results of operations other than
considerations used in the fair value calculations of our goodwill impairment
tests.
In December 2007, the FASB issued a revision to rules governing business
combinations. The revised guidance establishes principles and
requirements for how an acquirer recognizes and measures in its financial
statements the identifiable assets acquired, the liabilities assumed, any
noncontrolling interest in the acquiree and the goodwill acquired. The revised
business combination guidance also establishes disclosure requirements to enable
the evaluation of the nature and financial effects of the business combination.
This guidance was effective January 1, 2009. The impact of this
revised guidance will depend on the nature of our business combinations
subsequent to January 1, 2009.
In December 2007, the FASB amended guidance regarding noncontrolling interests
and the treatment of noncontrolling interests in consolidated financial
statements. The amended guidance establishes accounting and reporting
standards for ownership interests in subsidiaries held by parties other than the
parent, the amount of consolidated net income attributable to the parent and to
the noncontrolling interest, changes in a parent’s ownership interest, and the
valuation of retained noncontrolling equity investments when a subsidiary is
deconsolidated. The amended guidance also establishes disclosure requirements
that clearly identify and distinguish between the interests of the parent and
the interests of the noncontrolling owners. The adoption of the
amended guidance on January 1, 2009, did not have a significant impact on the
our financial position, results of operations and cash flows as we do not
currently have any noncontrolling interests in other entities.
41
We adopted the FASB’s new rule regarding subsequent events in the second quarter
of 2009. The FASB’s new rule establishes the accounting for and
disclosure of events that occur after the balance sheet date but before
financial statements are issued or are available to be issued. The new
subsequent event guidance requires the disclosure of the date through which an
entity has evaluated subsequent events and the basis for that date, that is,
whether that date represents the date the financial statements were issued or
were available to be issued. See Note 1 of the Condensed Consolidated Financial
Statements herein for the related disclosures. The adoption of the new
subsequent event rule did not have a material impact on our financial
statements.
In June 2009, the FASB amended rules regarding the transfer and servicing of
financial assets and the extinguishment of financial assets. The
amended guidance eliminates the concept of a qualifying special-purpose entity
(“QSPE”); clarifies and amends the derecognition criteria for a transfer to be
accounted for as a sale; amends and clarifies the unit of account eligible for
sale accounting; and requires that a transferor initially be measured at fair
value and recognize all assets obtained (for example beneficial interests) and
liabilities incurred as a result of a transfer of an entire financial asset or
group of financial assets accounted for as a sale. Additionally, on and after
the effective date of the amended guidance, existing QSPEs (as defined under
previous accounting guidance) must be evaluated for consolidation by reporting
entities in accordance with the applicable consolidation guidance. The amended
guidance requires enhanced disclosures about, among other things, a transferor’s
continuing involvement with transfers of financial assets accounted for as
sales, the risks inherent in the transferred financial assets that have been
retained, and the nature and financial effect of restrictions on the
transferor’s assets that continue to be reported in the statement of financial
position. We will adopt the amended guidance on January 1, 2010, but
at this time we do not anticipate the adoption will have a significant impact on
our financial position, results of operations and cash flows.
In June 2009, the FASB amended its rules regarding the consolidation of variable
interest entities (“VIE”). The FASB also amended the guidance
governing the determination of whether an enterprise is the primary beneficiary
of a VIE, and is, therefore, required to consolidate an entity, by requiring a
qualitative analysis rather than a quantitative analysis. The qualitative
analysis will include, among other things, consideration of who has the power to
direct the activities of the entity that most significantly impact the entity’s
economic performance and who has the obligation to absorb losses or the right to
receive benefits of the VIE that could potentially be significant to the VIE.
This standard also requires continuous reassessments of whether an enterprise is
the primary beneficiary of a VIE. Previously, FASB rules required
reconsideration of whether an enterprise was the primary beneficiary of a VIE
only when specific events had occurred. QSPEs, which were previously exempt from
the application of rules regarding VIEs, will be subject to the provisions of
these new rules when they become effective. The amended guidance also
requires enhanced disclosures about an enterprise’s involvement with a VIE. We
will adopt the amended rules on January 1, 2010, but at this time we do not
anticipate the adoption will have a significant impact on our financial
position, results of operations and cash flows.
In June 2009, the FASB Accounting Standards Codification and the Hierarchy of
Generally Accepted Accounting Principles (the “FASB Codification”) was
implemented. The FASB Codification does not change current U.S. GAAP,
but is intended to simplify user access to all authoritative U.S. GAAP by
providing all the authoritative literature related to a particular topic in one
place for nongovernmental entities. The FASB Codification was
effective for us in the third quarter of 2009, and all subsequent public filings
will reference the FASB Codification as the sole source of authoritative
literature. The adoption of the FASB Codification did not impact our
financial position, results of operations, and cash flows.
Liquidity
and Capital Resources
We have historically financed our working capital needs, including capital
expenditures, with cash flows from operations and borrowings under our bank
lines of credit. Net cash provided by operating activities totaled approximately
$50.2 million for the year ended December 31, 2009 compared to approximately
$59.1 million for the year ended December 31, 2008. The decrease in cash
provided by operating activities is mainly attributable to a $29.3 million
reduction in net earnings after consideration of non-cash items. The
decrease in net earnings after consideration of non-cash items was largely
offset by a $20.4 million change in working capital. Changes in
accounts receivable improved cash flow from operations by $1.6 million as
collections on receivables improved due to the reorganization of our billing and
collections department which has allowed us to increase the speed and accuracy
of our billing as well as address collection issues in a more timely
manner. The $9.7 million decrease in cash used for income taxes is
attributable to decreases in our estimated federal and state income tax payments
due to the overall reduction in our before tax earnings. The $9.1
million decrease in cash used for accounts payable and prepaid expense is
attributable to a reduction in payments to vendors in conjunction with the
decline in our business volumes as well as timing of payroll and owner-operator
settlements.
42
Net cash used in investing activities was approximately $20.2 million for the
year ended December 31, 2009 compared with approximately $56.2 million used in
investing activities during the year ended December 31, 2008. Investing
activities during the year ended December 31, 2009 consisted primarily of $15.2
million in capital expenditures for the construction of our regional hub in
Dallas/Fort Worth, Texas. Cash used for investing activities during
the year ended December 31, 2008 included $29.6 million for the acquisitions of
Pinch and Service Express and $10.8 million for the construction of our regional
hub in Dallas/Fort Worth.
Net cash used in financing activities totaled approximately $10.0 million for
the year ended December 31, 2009 compared with approximately $14.3 million
provided by financing activities during the year ended December 31,
2008. Cash used in financing activities during 2009 mainly included
our quarterly dividend payments and scheduled capital lease
payments. The change in financing activities for 2009 compared to
2008 was attributable to a $20.0 million reduction in net borrowings from our
senior credit facility and a $4.5 million reduction in cash from the exercise
and the tax benefit or expense from employee stock option
exercises. Prior year net borrowings from our line of credit were
used to partially fund the Pinch and Service Express
acquisitions.
On October 10, 2007, we entered into a $100.0 million senior credit
facility. The facility has a term of five years and includes an
accordion feature, which if approved by our lender, allows for an additional
$50.0 million in borrowings on such terms and conditions as set forth in the
credit agreement. Interest rates for advances under the senior credit
facility are at LIBOR plus 0.6% to 0.9% based upon covenants related
to total indebtness to earnings. We entered into this new, larger
credit facility in order to fund potential acquisitions, repurchases of our
Common Stock, and for financing other general business purposes. At
December 31, 2009, we had $39.4 million of available borrowing capacity under
the senior credit facility, not including the accordion feature, and had
utilized $10.6 million of availability for outstanding letters of
credit.
On November 17, 2005, we announced that our Board of Directors approved a stock
repurchase program for up to three million shares of Common Stock (the “2005
Repurchase Plan”). In addition, on July 31, 2007, our Board of Directors
approved an additional stock repurchase program for up to two million shares of
our Common Stock (the “2007 Repurchase Plan”). No shares were
repurchased during the years ended December 31, 2009 and 2008. For
the year ended December 31, 2007, the Company repurchased 1,613,327 shares, for
$49.0 million or $30.42 per share under the 2005 Repurchase Plan and repurchased
an additional 211,173 shares of our Common Stock under the 2007 Repurchase Plan
for $6.1 million, or $28.68 per share. As of December 31,
2009, no shares remained eligible for purchase under the 2005 Repurchase Plan
and 1,788,827 shares remained eligible for repurchase under the 2007 Repurchase
Plan.
In June 2009, we completed the construction of our new regional hub in
Dallas/Fort Worth for a total cost of approximately $31.6
million. During the year ended December 31, 2007, we completed our
purchase of new facilities near Chicago, Illinois and Atlanta, Georgia for $22.3
million and $14.9 million, respectively. Deposits of $3.3 million and $1.5
million paid during 2006 were applied to the purchase price of the Chicago and
Atlanta facilities, respectively. We funded the expenditures for the
construction or purchase of these facilities through cash on hand and cash
provided by operating activities.
During the first, second, third and fourth quarters of 2009, 2008 and 2007, cash
dividends of $0.07 per share were declared on Common Stock outstanding. We
expect to continue to pay regular quarterly cash dividends, though each
subsequent quarterly dividend is subject to review and approval by our Board of
Directors.
We believe that our available cash, investments, expected cash generated from
future operations and borrowings under the available senior credit facility will
be sufficient to satisfy our anticipated cash needs for at least the next twelve
months.
Off-Balance
Sheet Arrangements
At
December 31, 2009, we had letters of credit outstanding from banks totaling
$10.6 million required primarily by our workers’ compensation and vehicle
liability insurance providers.
Contractual
Obligations and Commercial Commitments
Our
contractual obligations and other commercial commitments as of December 31, 2009
(in thousands) are summarized below:
|
Contractual
Obligations
|
Payment
Due Period
|
||||||||||||||
|
2015
and
|
|||||||||||||||
|
Total
|
2010
|
2011-2012
|
2013-2014
|
Thereafter
|
|||||||||||
|
Capital
lease obligations
|
$
|
3,518
|
$
|
1,041
|
$
|
1,468
|
$
|
536
|
$
|
473
|
|||||
|
Other
long-term debt
|
21
|
21
|
--
|
--
|
--
|
||||||||||
|
Operating
leases
|
69,189
|
18,961
|
25,065
|
13,318
|
11,845
|
||||||||||
|
Senior
credit facility
|
50,000
|
--
|
50,000
|
--
|
--
|
||||||||||
|
Total
contractual cash obligations
|
$
|
122,728
|
$
|
20,023
|
$
|
76,533
|
$
|
13,854
|
$
|
12,318
|
|||||
As of December 31, 2009, we had a commitment to acquire 58 new tractors and
straight trucks for approximately $4.9 million during 2010. This
commitment is expected to be funded by cash on hand and cash flows from
operations.
Not included in the above table are reserves for unrecognized tax benefits
and for self insurance claims of $0.8 million and $9.3 million,
respectively.
43
Forward-Looking
Statements
This
report contains “forward-looking statements,” as defined in Section 27A of the
Securities Act and Section 21E of the Exchange Act. Forward-looking statements
are statements other than historical information or statements of current
condition and relate to future events or our future financial performance. Some
forward-looking statements may be identified by use of such terms as “believes,”
“anticipates,” “intends,” “plans,” “estimates,” “projects” or “expects.” Such
forward-looking statements involve known and unknown risks, uncertainties and
other factors that may cause our actual results, performance or achievements to
be materially different from any future results, performance or achievements
expressed or implied by such forward-looking statements. The following is a list
of factors, among others, that could cause actual results to differ materially
from those contemplated by the forward-looking statements: economic factors such
as recessions, inflation, higher interest rates and downturns in customer
business cycles, our inability to maintain our historical growth rate because of
a decreased volume of freight moving through our network or decreased average
revenue per pound of freight moving through our network, increasing competition
and pricing pressure, surplus inventories, loss of a major customer, the
creditworthiness of our customers and their ability to pay for services
rendered, our ability to secure terminal facilities in desirable locations at
reasonable rates, the inability of our information systems to handle an
increased volume of freight moving through our network, changes in fuel prices,
claims for property damage, personal injuries or workers’ compensation,
employment matters including rising health care costs, enforcement of and
changes in governmental regulations, environmental and tax matters, the handling
of hazardous materials, the availability and compensation of qualified
independent owner-operators and freight handlers needed to
serve our transportation needs and our inability to successfully integrate
acquisitions. As a result of the foregoing, no assurance can be given as to
future financial condition, cash flows or results of operations. We undertake no
obligation to update or revise any forward-looking statements, whether as a
result of new information, future events or otherwise.
Our
exposure to market risk relates principally to changes in interest rates and
fuel prices. Our interest rate exposure relates principally to changes in
interest rates for borrowings under our senior credit facility. The senior
credit facility, which represents an aggregate principal amount of
$50.0 million at December 31, 2009, bears interest at variable rates. Based
on our outstanding borrowings at December 31, 2009, a hypothetical increase in
our senior credit facility borrowing rate of 150 basis points, or an increase in
the total effective interest rate from 0.8% to 2.3%, would increase our annual
interest expense by approximately $0.8 million and would have decreased our
annual cash flow from operations by approximately $0.8 million.
Our only
other debt is equipment notes and capital lease obligations totaling $3.1
million. These notes and lease obligations all bear interest at a
fixed rate. Accordingly, there is no exposure to market risk related
to these notes and capital lease obligations.
We are exposed to the effects of changes in the price and availability of diesel
fuel, as more fully discussed in Item 1A, “Risk Factors.”
Our cash
and cash equivalents are also subject to market risk, primarily interest-rate
and credit risk.
The
response to this item is submitted as a separate section of this
report.
None.
|
Item
9A.
|
Disclosure
Controls and Procedures
Our
management, including our principal executive and principal financial officers,
has evaluated the effectiveness of our disclosure controls and procedures as of
December 31, 2009. Our disclosure controls and procedures are
designed to provide reasonable assurance that the information required to be
disclosed in this annual report on Form 10-K has been appropriately recorded,
processed, summarized and reported within the time periods specified in the
Securities and Exchange Commission’s rules and forms, and that such information
is accumulated and communicated to our management, including our principal
executive and principal financial officers, to allow timely decisions regarding
required disclosure. Based on that evaluation, our principal
executive and principal financial officers have concluded that our disclosure
controls and procedures are effective at the reasonable assurance
level.
44
Management’s Report on Internal
Control over Financial Reporting
Management
is responsible for establishing and maintaining effective internal control over
financial reporting as defined in Rules 13a-15(f) under the Exchange Act. Our
internal control over financial reporting is designed to provide reasonable
assurance to management and the Board of Directors regarding the preparation and
fair presentation of financial statements.
Because
of its inherent limitations, internal control over financial reporting may not
prevent or detect misstatements. Therefore, even those systems determined to be
effective can provide only reasonable assurance with respect to financial
statement preparation and presentation.
Under the
supervision and with the participation of our management, including our Chief
Executive Officer and Chief Financial Officer, we assessed the effectiveness of
our internal control over financial reporting as of December 31, 2009. In making
this assessment, management used the framework set forth by the Committee on
Sponsoring Organizations of the Treadway Commission in Internal Control — Integrated
Framework. Based on our assessment, we have concluded, as of December 31,
2009, that our internal control over financial reporting was effective based on
those criteria.
Ernst
& Young LLP, the independent registered public accounting firm that audited
the Company’s consolidated financial statements for the year ended December 31,
2009, has issued an attestation report on the Company’s internal control over
financial reporting.
Changes
in Internal Control over Financial Reporting
There
were no changes in our internal control over financial reporting during the
fourth quarter of 2009 that have materially affected, or are reasonably likely
to materially affect, our internal control over financial
reporting.
45
Report
of Independent Registered Public Accounting Firm
The Board
of Directors and Shareholders
Forward
Air Corporation
We have
audited Forward Air Corporation’s internal control over financial reporting as
of December 31, 2009, based on criteria established in Internal
Control—Integrated Framework issued by the Committee of Sponsoring Organizations
of the Treadway Commission (the COSO criteria). Forward Air Corporation’s
management is responsible for maintaining effective internal control over
financial reporting, and for its assessment of the effectiveness of internal
control over financial reporting included in the accompanying Management’s
Report on Internal Control over Financial Reporting. Our responsibility is to
express an opinion on the company’s internal control over financial reporting
based on our audit.
We
conducted our audit in accordance with the standards of the Public Company
Accounting Oversight Board (United States). Those standards require that we plan
and perform the audit to obtain reasonable assurance about whether effective
internal control over financial reporting was maintained in all material
respects. Our audit included obtaining an understanding of internal control over
financial reporting, assessing the risk that a material weakness exists, testing
and evaluating the design and operating effectiveness of internal control based
on the assessed risk, and performing such other procedures as we considered
necessary in the circumstances. We believe that our audit provides a reasonable
basis for our opinion.
A
company’s internal control over financial reporting is a process designed to
provide reasonable assurance regarding the reliability of financial reporting
and the preparation of financial statements for external purposes in accordance
with generally accepted accounting principles. A company’s internal control over
financial reporting includes those policies and procedures that (1) pertain to
the maintenance of records that, in reasonable detail, accurately and fairly
reflect the transactions and dispositions of the assets of the company; (2)
provide reasonable assurance that transactions are recorded as necessary to
permit preparation of financial statements in accordance with generally accepted
accounting principles, and that receipts and expenditures of the company are
being made only in accordance with authorizations of management and directors of
the company; and (3) provide reasonable assurance regarding prevention or timely
detection of unauthorized acquisition, use or disposition of the company’s
assets that could have a material effect on the financial
statements.
Because
of its inherent limitations, internal control over financial reporting may not
prevent or detect misstatements. Also, projections of any evaluation
of effectiveness to future periods are subject to the risk that controls may
become inadequate because of changes in conditions or that the degree of
compliance with the policies or procedures may deteriorate.
In our
opinion, Forward Air Corporation maintained, in all material respects, effective
internal control over financial reporting as of December 31, 2009, based on the COSO criteria.
We have
also audited, in accordance with the standards of the Public Company Accounting
Oversight Board (United States), the consolidated balance sheets of Forward Air
Corporation as of December 31, 2009 and 2008, and the related consolidated
statements of income, shareholders’ equity, and cash flows for each of the three
years in the period ended December 31, 2009 and our report dated February 24,
2010 expressed an unqualified opinion thereon.
|
/s/
Ernst & Young LLP
|
|
|
Nashville,
Tennessee
|
|
|
February
24, 2010
|
46
|
Item
9B.
|
Other
Information
|
Part
III
The
information required by this item with respect to our directors is incorporated
herein by reference to our proxy statement for the 2010 Annual Meeting of
Shareholders (the “2010 Proxy Statement”). The 2010 Proxy Statement will be
filed with the SEC not later than 120 days subsequent to December 31,
2009.
Pursuant
to Item 401(b) of Regulation S-K, the information required by this item with
respect to our executive officers is set forth in Part I of this
report.
|
Item
11.
|
The
information required by this item is incorporated herein by reference to the
2010 Proxy Statement.
|
Item
12.
|
Security
Ownership of Certain Beneficial Owners and Management and Related
Shareholder Matters
|
The
information required by this item is incorporated herein by reference to the
2010 Proxy Statement.
|
Item
13.
|
Certain
Relationships and Related Transactions, and Director
Independence
|
The
information required by this item is incorporated herein by reference to the
2010 Proxy Statement.
|
Item
14.
|
Principal
Accounting Fees and Services
|
The
information required by this item is incorporated herein by reference to the
2010 Proxy Statement.
Part
IV
|
Exhibits,
Financial Statement Schedules
|
|
(a)(1)
and (2)
|
List
of Financial Statements and Financial Statement
Schedules.
|
The
response to this portion of Item 15 is submitted as a separate section of this
report.
|
(a)(3)
|
List
of Exhibits.
|
The
response to this portion of Item 15 is submitted as a separate section of this
report.
|
(b)
|
Exhibits.
|
The
response to this portion of Item 15 is submitted as a separate section of this
report.
|
(c)
|
Financial
Statement Schedules.
|
The
response to this portion of Item 15 is submitted as a separate section of this
report.
47
Pursuant
to the requirements of Section 13 or 15(d) of the Securities Exchange Act of
1934, the registrant has duly caused this report to be signed on its behalf by
the undersigned, thereunto duly authorized.
|
Forward
Air Corporation
|
|||
|
Date:
February 24, 2010
|
By:
|
/s/
Rodney L. Bell
|
|
|
Rodney
L. Bell
|
|||
|
Chief
Financial Officer, Senior Vice President
|
|||
|
and
Treasurer (Principal Financial Officer)
|
|||
|
By:
|
/s/
Michael P. McLean
|
||
|
Michael
P. McLean
|
|||
|
Chief
Accounting Officer, Vice President
|
|||
|
and
Controller (Principal Accounting
Officer)
|
|||
Pursuant
to the requirements of the Securities Exchange Act of 1934, this report has been
signed below by the following persons on behalf of the registrant and in the
capacities and on the dates indicated.
|
Signature
|
Title
|
Date
|
||
|
/s/
Bruce A. Campbell
|
Chairman,
President and Chief Executive
|
February
24, 2010
|
||
|
Bruce
A. Campbell
|
Officer
(Principal Executive Officer)
|
|||
|
/s/
Rodney L. Bell
|
Chief
Financial Officer, Senior Vice President
|
February
24, 2010
|
||
|
Rodney
L. Bell
|
and
Treasurer ( Principal Financial Officer)
|
|||
|
/s/
Michael P. McLean
|
Chief
Accounting Officer, Vice President and
|
February
24, 2010
|
||
|
Michael
P. McLean
|
Controller
(Principal Accounting Officer)
|
|||
|
/s/
G. Michael Lynch
|
Lead
Director
|
February
24, 2010
|
||
|
G.
Michael Lynch
|
||||
|
/s/
C. Robert Campbell
|
Director
|
February
24, 2010
|
||
|
C.
Robert Campbell
|
||||
|
/s/
Richard W. Hanselman
|
Director
|
February
24, 2010
|
||
|
Richard
W. Hanselman
|
||||
|
/s/
C. John Langley, Jr.
|
Director
|
February
24, 2010
|
||
|
C.
John Langley, Jr.
|
||||
|
/s/
Tracy A. Leinbach
|
Director
|
February
24, 2010
|
||
|
Tracy
A. Leinbach
|
||||
|
/s/
Ray A. Mundy
|
Director
|
February
24, 2010
|
||
|
Ray
A. Mundy
|
||||
|
/s/
Gary L. Paxton
|
Director
|
February
24, 2010
|
||
|
Gary
L. Paxton
|
48
Annual
Report on Form 10-K
Item
8, Item 15(a)(1) and (2), (a)(3), (b) and (c)
List
of Financial Statements and Financial Statement Schedule
Financial
Statements and Supplementary Data
Certain
Exhibits
Financial
Statement Schedule
Year
Ended December 31, 2009
Forward
Air Corporation
Greeneville,
Tennessee
F-1
Forward
Air Corporation
Form
10-K — Item 8 and Item 15(a)(1) and (2)
Index
to Financial Statements and Financial Statement Schedule
The
following consolidated financial statements of Forward Air Corporation are
included as a separate section of this report:
|
Page
No.
|
|
|
Report of Ernst & Young LLP, Independent
Registered Public Accounting Firm
|
F-3
|
|
Consolidated Balance Sheets — December 31, 2009
and 2008
|
F-4
|
|
Consolidated Statements of Income — Years Ended
December 31, 2009, 2008 and 2007
|
F-6
|
|
Consolidated Statements of Shareholders’ Equity —
Years Ended December 31, 2009, 2008
and 2007
|
F-7
|
|
Consolidated Statements of Cash Flows — Years
Ended December 31, 2009, 2008 and 2007
|
F-8
|
|
Notes to Consolidated Financial Statements —
December 31, 2009
|
F-9
|
The
following financial statement schedule of Forward Air Corporation is included as
a separate section of this report.
|
Schedule
II - Valuation and Qualifying Accounts
|
S-1
|
All other
schedules for which provision is made in the applicable accounting regulation of
the Securities and Exchange Commission are not required under the related
instructions or are inapplicable and, therefore, have been omitted.
F-2
Report
of Independent Registered Public Accounting Firm
The Board
of Directors and Shareholders
Forward
Air Corporation
We have audited the accompanying consolidated balance sheets of Forward Air
Corporation as of December 31, 2009 and 2008, and the related consolidated
statements of income, shareholders' equity, and cash flows for each of the three
years in the period ended December 31, 2009. Our audits also included
the financial statement schedule listed in the Index at Item 15(a). These
financial statements and schedule are the responsibility of the Company's
management. Our responsibility is to express an opinion on these
financial statements and schedule based on our audits.
We conducted our audits in accordance with the standards of the Public Company
Accounting Oversight Board (United States). Those standards require that we plan
and perform the audit to obtain reasonable assurance about whether the financial
statements are free of material misstatement. An audit includes examining, on a
test basis, evidence supporting the amounts and disclosures in the financial
statements. An audit also includes assessing the accounting principles used and
significant estimates made by management, as well as evaluating the overall
financial statement presentation. We believe that our audits provide a
reasonable basis for our opinion.
In our opinion, the financial statements referred to above present fairly, in
all material respects, the consolidated financial position of Forward Air
Corporation at December 31, 2009 and 2008, and the consolidated results of its
operations and its cash flows for each of the three years in the period ended
December 31, 2009, in conformity with U.S. generally accepted accounting
principles. Also, in our opinion, the related financial statement
schedule, when considered in relation to the basic financial statements taken as
a whole, presents fairly in all material respects the information set forth
therein.
As discussed in Note 7 to the consolidated financial statements, in 2007 the
Company changed its method of accounting for income tax
contingencies.
We also have audited, in accordance with the standards of the Public Company
Accounting Oversight Board (United States), Forward Air Corporation’s internal
control over financial reporting as of December 31, 2009, based on criteria
established in Internal Control-Integrated Framework issued by the Committee of
Sponsoring Organizations of the Treadway Commission and our report dated
February 24, 2010 expressed an unqualified opinion thereon.
|
/s/
Ernst & Young LLP
|
|
|
Nashville,
Tennessee
|
|
|
February
24, 2010
|
F-3
|
Consolidated
Balance Sheets
|
|||||
|
(Dollars
in thousands)
|
|||||
|
December
31,
|
December
31,
|
||||
|
2009
|
2008
|
||||
|
Assets
|
|||||
|
Current
assets:
|
|||||
|
Cash
|
$ | 42,035 | $ | 22,093 | |
|
Accounts
receivable, less allowance of $1,919 in 2009 and $2,531 in
2008
|
55,720 | 57,206 | |||
|
Income
taxes receivable
|
-- | 3,427 | |||
|
Inventories
|
938 | 669 | |||
|
Prepaid
expenses and other current assets
|
5,272 | 6,089 | |||
|
Deferred
income taxes
|
3,261 | 2,105 | |||
|
Total
current assets
|
107,226 | 91,589 | |||
|
Property
and equipment:
|
|||||
|
Land
|
16,928 | 16,928 | |||
|
Buildings
|
68,444 | 39,895 | |||
|
Equipment
|
111,728 | 107,983 | |||
|
Leasehold
improvements
|
5,243 | 5,049 | |||
|
Construction
in progress
|
2,373 | 16,522 | |||
|
Total
property and equipment
|
204,716 | 186,377 | |||
|
Less
accumulated depreciation and amortization
|
75,990 | 63,401 | |||
|
Net
property and equipment
|
128,726 | 122,976 | |||
|
Goodwill
and other acquired intangibles:
|
|||||
|
Goodwill
|
43,332 | 50,230 | |||
|
Other
acquired intangibles, net of accumulated amortization of $12,281 in 2009
and $8,103 in 2008
|
35,849 | 40,708 | |||
|
Total
net goodwill and other acquired intangibles
|
79,181 | 90,938 | |||
|
Other
assets
|
1,597 | 2,024 | |||
|
Total
assets
|
$ | 316,730 | $ | 307,527 | |
The
accompanying notes are an integral part of the consolidated financial
statements.
F-4
|
Consolidated
Balance Sheets (continued)
|
|||||
|
(Dollars
in thousands)
|
|||||
|
December
31,
|
December
31,
|
||||
|
2009
|
2008
|
||||
|
Liabilities
and Shareholders’ Equity
|
|||||
|
Current
liabilities:
|
|||||
|
Accounts
payable
|
$ | 10,333 | $ | 11,633 | |
|
Accrued
payroll and related items
|
5,394 | 3,652 | |||
|
Insurance
and claims accruals
|
5,622 | 4,620 | |||
|
Payables
to owner-operators
|
3,603 | 2,563 | |||
|
Collections
on behalf of customers
|
697 | 612 | |||
|
Other
accrued expenses
|
1,791 | 1,480 | |||
|
Income
taxes payable
|
1,424 | -- | |||
|
Current
portion of capital lease obligations
|
898 | 1,455 | |||
|
Current
portion of long-term debt
|
21 | 147 | |||
|
Total
current liabilities
|
29,783 | 26,162 | |||
|
Capital
lease obligations, less current portion
|
2,169 | 3,014 | |||
|
Long-term
debt, less current portion
|
50,000 | 50,021 | |||
|
Other
long-term liabilities
|
4,485 | 3,055 | |||
|
Deferred
income taxes
|
5,786 | 8,841 | |||
|
Commitments
and contingencies (Note 9)
|
|||||
|
Shareholders’
equity:
|
|||||
|
Preferred
stock, $0.01 par value
|
|||||
|
Authorized
shares - 5,000,000
|
|||||
|
No
shares issued
|
-- | -- | |||
|
Common
stock, $0.01 par value
|
|||||
|
Authorized
shares – 50,000,000
|
|||||
|
Issued
and outstanding shares – 28,950,391 in 2009 and 28,893,850
in 2008
|
290 | 289 | |||
|
Additional
paid-in capital
|
16,631 | 10,249 | |||
|
Retained
earnings
|
207,586 | 205,896 | |||
|
Total
shareholders’ equity
|
224,507 | 216,434 | |||
|
Total
liabilities and shareholders’ equity
|
$ | 316,730 | $ | 307,527 | |
The
accompanying notes are an integral part of the consolidated financial
statements.
F-5
|
Consolidated
Statements of Income
|
|||||||||||
|
(In
thousands, except per share data)
|
|||||||||||
|
Year
ended
|
|||||||||||
|
December
31,
|
December
31,
|
December
31,
|
|||||||||
|
2009
|
2008
|
2007
|
|||||||||
|
Operating
revenue:
|
|||||||||||
|
Forward
Air
|
|||||||||||
|
Airport-to-airport
|
$ | 268,245 | $ | 334,860 | $ | 313,162 | |||||
|
Logistics
|
54,067 | 59,290 | 42,626 | ||||||||
|
Other
|
23,076 | 25,133 | 20,923 | ||||||||
|
Forward
Air Solutions
|
|||||||||||
|
Pool
distribution
|
72,022 | 55,153 | 16,026 | ||||||||
|
Total
operating revenue
|
417,410 | 474,436 | 392,737 | ||||||||
|
Operating
expenses:
|
|||||||||||
|
Purchased
transportation
|
|||||||||||
|
Forward
Air
|
|||||||||||
|
Airport-to-airport
|
112,516 | 128,785 | 123,658 | ||||||||
|
Logistics
|
42,188 | 44,560 | 32,727 | ||||||||
|
Other
|
5,234 | 6,425 | 6,049 | ||||||||
|
Forward
Air Solutions
|
|||||||||||
|
Pool
distribution
|
14,490 | 9,315 | 2,003 | ||||||||
|
Total
purchased transportation
|
174,428 | 189,085 | 164,437 | ||||||||
|
Salaries,
wages and employee benefits
|
118,804 | 116,504 | 88,803 | ||||||||
|
Operating
leases
|
27,294 | 24,403 | 16,761 | ||||||||
|
Depreciation
and amortization
|
19,722 | 16,615 | 10,824 | ||||||||
|
Insurance
and claims
|
9,719 | 8,099 | 7,685 | ||||||||
|
Fuel
expense
|
7,312 | 11,465 | 2,421 | ||||||||
|
Other
operating expenses
|
34,424 | 37,980 | 30,758 | ||||||||
|
Impairment
of goodwill and other intangible assets
|
7,157 | -- | -- | ||||||||
|
Total
operating expenses
|
398,860 | 404,151 | 321,689 | ||||||||
|
Income
from operations
|
18,550 | 70,285 | 71,048 | ||||||||
|
Other
income (expense):
|
|||||||||||
|
Interest
expense
|
(670 | ) | (1,236 | ) | (491 | ) | |||||
|
Other,
net
|
69 | 362 | 1,756 | ||||||||
|
Total
other (expense) income
|
(601 | ) | (874 | ) | 1,265 | ||||||
|
Income
before income taxes
|
17,949 | 69,411 | 72,313 | ||||||||
|
Income
taxes
|
8,147 | 26,869 | 27,388 | ||||||||
|
Net
income
|
$ | 9,802 | $ | 42,542 | $ | 44,925 | |||||
|
Net
income per share:
|
|||||||||||
|
Basic
|
$ | 0.34 | $ | 1.48 | $ | 1.52 | |||||
|
Diluted
|
$ | 0.34 | $ | 1.47 | $ | 1.50 | |||||
|
Weighted
average shares outstanding:
|
|||||||||||
|
Basic
|
28,928 | 28,808 | 29,609 | ||||||||
|
Diluted
|
28,993 | 29,025 | 29,962 | ||||||||
|
Dividends
per share:
|
$ | 0.28 | $ | 0.28 | $ | 0.28 | |||||
The
accompanying notes are an integral part of the consolidated financial
statements.
F-6
|
Consolidated
Statements of Shareholders' Equity
|
|||||||||||||||||||
|
(In
thousands, except per share data)
|
|||||||||||||||||||
|
Additional
|
Total
|
||||||||||||||||||
|
Common
Stock
|
Paid-in
|
Retained
|
Shareholders'
|
||||||||||||||||
|
Shares
|
Amount
|
Capital
|
Earnings
|
Equity
|
|||||||||||||||
|
Balance
at December 31, 2006
|
30,372 | $ | 304 | $ | -- | $ | 184,923 | $ | 185,227 | ||||||||||
|
Adoption of accounting for uncertainty in income taxes
|
-- | -- | -- | (977 | ) | (977 | ) | ||||||||||||
|
Net and comprehensive income for 2007
|
-- | -- | -- | 44,925 | 44,925 | ||||||||||||||
|
Exercise of stock options
|
57 | -- | 1,017 | -- | 1,017 | ||||||||||||||
|
Common stock issued under employee stock purchase plan
|
9 | -- | 259 | -- | 259 | ||||||||||||||
|
Share-based compensation
|
-- | -- | 3,710 | -- | 3,710 | ||||||||||||||
|
Dividends ($0.28 per share)
|
-- | -- | -- | (8,305 | ) | (8,305 | ) | ||||||||||||
|
Vesting of previously non-vested shares
|
42 | -- | -- | -- | -- | ||||||||||||||
|
Cash settlement of share-based awards for minimum tax
withholdings
|
(8 | ) | -- | (250 | ) | -- | (250 | ) | |||||||||||
|
Common stock repurchased under stock repurchase plan
|
(1,824 | ) | (18 | ) | (5,997 | ) | (49,119 | ) | (55,134 | ) | |||||||||
|
Income tax benefit from stock options exercised
|
-- | -- | 1,261 | -- | 1,261 | ||||||||||||||
|
Balance
at December 31, 2007
|
28,648 | 286 | -- | 171,447 | 171,733 | ||||||||||||||
|
Net and comprehensive income for 2008
|
-- | -- | -- | 42,542 | 42,542 | ||||||||||||||
|
Exercise of stock options
|
191 | 2 | 3,083 | -- | 3,085 | ||||||||||||||
|
Common stock issued under employee stock purchase plan
|
10 | -- | 255 | -- | 255 | ||||||||||||||
|
Share-based compensation
|
-- | -- | 6,269 | (2 | ) | 6,267 | |||||||||||||
|
Dividends ($0.28 per share)
|
-- | -- | 2 | (8,091 | ) | (8,089 | ) | ||||||||||||
|
Vesting of previously non-vested shares
|
56 | 1 | (1 | ) | -- | -- | |||||||||||||
|
Cash settlement of share-based awards for minimum tax
withholdings
|
(11 | ) | -- | (389 | ) | -- | (389 | ) | |||||||||||
|
Income tax benefit from stock options exercised
|
-- | -- | 1,030 | -- | 1,030 | ||||||||||||||
|
Balance
at December 31, 2008
|
28,894 | 289 | 10,249 | 205,896 | 216,434 | ||||||||||||||
|
Net and comprehensive income for 2009
|
-- | -- | -- | 9,802 | 9,802 | ||||||||||||||
|
Exercise of stock options
|
1 | -- | 8 | -- | 8 | ||||||||||||||
|
Common stock issued under employee stock purchase plan
|
12 | -- | 237 | -- | 237 | ||||||||||||||
|
Share-based compensation
|
-- | -- | 6,754 | -- | 6,754 | ||||||||||||||
|
Dividends ($0.28 per share)
|
-- | -- | 3 | (8,112 | ) | (8,109 | ) | ||||||||||||
|
Vesting of previously non-vested shares
|
56 | 1 | (1 | ) | -- | -- | |||||||||||||
|
Cash settlement of share-based awards for minimum tax
withholdings
|
(13 | ) | -- | (249 | ) | -- | (249 | ) | |||||||||||
|
Income tax expense from stock options exercised
|
-- | -- | (370 | ) | -- | (370 | ) | ||||||||||||
|
Balance
at December 31, 2009
|
28,950 | $ | 290 | $ | 16,631 | $ | 207,586 | $ | 224,507 | ||||||||||
The
accompanying notes are an integral part of the consolidated financial
statements.
F-7
|
Consolidated
Statements of Cash Flows
|
|||||||||||
|
(In
thousands)
|
|||||||||||
|
Year
ended
|
|||||||||||
|
December
31,
|
December
31,
|
December
31,
|
|||||||||
|
2009
|
2008
|
2007
|
|||||||||
|
Operating
activities:
|
|||||||||||
|
Net
income
|
$ | 9,802 | $ | 42,542 | $ | 44,925 | |||||
|
Adjustments
to reconcile net income to net cash provided by operating
activities
|
|||||||||||
|
Depreciation
and amortization
|
19,722 | 16,615 | 10,824 | ||||||||
|
Impairment
of goodwill and other intangible assets
|
7,157 | -- | -- | ||||||||
|
Share-based
compensation
|
6,754 | 6,267 | 3,710 | ||||||||
|
(Gain)
loss on disposal of property and equipment
|
(6 | ) | 171 | (172 | ) | ||||||
|
Provision
for (recovery) loss on receivables
|
(60 | ) | 903 | (33 | ) | ||||||
|
Provision
for revenue adjustments
|
2,390 | 4,259 | 2,312 | ||||||||
|
Deferred
income taxes
|
(4,581 | ) | 1,151 | 596 | |||||||
|
Tax
expense (benefit) for stock options exercised
|
370 | (1,030 | ) | (1,261 | ) | ||||||
|
Changes
in operating assets and liabilities, net of acquisitions
|
|||||||||||
|
Accounts
receivable
|
(844 | ) | (2,376 | ) | (11,474 | ) | |||||
|
Prepaid
expenses and other current assets
|
548 | (2,102 | ) | 291 | |||||||
|
Accounts
payable and accrued expenses
|
3,831 | (2,665 | ) | 6,606 | |||||||
|
Income
taxes
|
5,096 | (4,652 | ) | 6,069 | |||||||
|
Net
cash provided by operating activities
|
50,179 | 59,083 | 62,393 | ||||||||
|
Investing
activities:
|
|||||||||||
|
Proceeds
from disposal of property and equipment
|
270 | 87 | 574 | ||||||||
|
Purchases
of property and equipment
|
(20,847 | ) | (26,699 | ) | (47,026 | ) | |||||
|
Proceeds
from sales or maturities of available-for-sale securities
|
-- | -- | 143,410 | ||||||||
|
Purchases
of available-for-sale securities
|
-- | -- | (82,282 | ) | |||||||
|
Acquisition
of businesses
|
-- | (29,566 | ) | (48,627 | ) | ||||||
|
Other
|
372 | (10 | ) | (119 | ) | ||||||
|
Net
cash used in investing activities
|
(20,205 | ) | (56,188 | ) | (34,070 | ) | |||||
|
Financing
activities:
|
|||||||||||
|
Payments
of debt and capital lease obligations
|
(1,549 | ) | (1,603 | ) | (493 | ) | |||||
|
Borrowings
on line of credit
|
-- | 45,000 | 40,000 | ||||||||
|
Payments
on line of credit
|
-- | (25,000 | ) | (10,000 | ) | ||||||
|
Proceeds
from exercise of stock options
|
8 | 3,085 | 1,017 | ||||||||
|
Payments
of cash dividends
|
(8,109 | ) | (8,089 | ) | (8,305 | ) | |||||
|
Common
stock issued under employee stock purchase plan
|
237 | 255 | 259 | ||||||||
|
Cash
settlement of share-based awards for minimum tax
withholdings
|
(249 | ) | (389 | ) | (250 | ) | |||||
|
Repurchase
of common stock
|
-- | -- | (55,134 | ) | |||||||
|
Tax
(expense) benefit for stock options exercised
|
(370 | ) | 1,030 | 1,261 | |||||||
|
Net
cash (used in) provided by financing activities
|
(10,032 | ) | 14,289 | (31,645 | ) | ||||||
|
Net
increase (decrease) in cash
|
19,942 | 17,184 | (3,322 | ) | |||||||
|
Cash
at beginning of year
|
22,093 | 4,909 | 8,231 | ||||||||
|
Cash
at end of year
|
$ | 42,035 | $ | 22,093 | $ | 4,909 | |||||
|
Non-cash
activity:
|
|||||||||||
|
Unpaid
capital expenditures included in accounts payable
|
$ | 234 | $ | 1,640 | $ | -- | |||||
|
|
|||||||||||
The accompanying notes are an
integral part of the consolidated financial statements
F-8
FORWARD
AIR CORPORATION
NOTES
TO CONSOLIDATED FINANCIAL STATEMENTS
DECEMBER
31, 2009
(In
thousands, except share and per share data)
|
1.
|
Accounting
Policies
|
Basis
of Presentation and Principles of Consolidation
Forward
Air Corporation's (“the Company”) services can be broadly classified into two
principal segments: Forward Air, Inc. (“Forward Air”) and Forward Air
Solutions, Inc. (“FASI”).
Through
the Forward Air business the Company is a leading provider of time-definite
transportation and related logistics services to the North American deferred air
freight market and its activities can be broadly classified into three
categories of services. Forward Air’s airport-to-airport service
operates a comprehensive national network for the time-definite surface
transportation of deferred air freight. The airport-to-airport
service offers customers local pick-up and delivery and scheduled surface
transportation of cargo as a cost effective, reliable alternative to air
transportation. Forward Air’s logistics services provide expedited
truckload brokerage and dedicated fleet services. Forward Air’s other
services include shipment consolidation and deconsolidation, warehousing,
customs brokerage, and other handling. The Forward Air segment
primarily provides its transportation services through a network of terminals
located at or near airports in the United States and
Canada.
FASI was
formed in July 2007 in conjunction with the Company’s acquisition of certain
assets and liabilities of USA Carriers, Inc. ("USAC") and subsequently
expanded through other acquisitions. FASI provides pool distribution
services throughout the Mid-Atlantic, Southeast, Midwest and
Southwest continental United States. Pool distribution involves
managing high-frequency handling and distribution of time-sensitive product to
numerous destinations in specific geographic regions. FASI’s primary
customers for this product are regional and nationwide distributors and
retailers, such as mall, strip mall and outlet-based retail
chains.
In
connection with the USAC acquisition, the Company reorganized its management
reporting structure along these lines of business. The Company has
evaluated the segment reporting requirements and determined that it has two
reportable segments, Forward Air and FASI.
The
accompanying consolidated financial statements of the Company include Forward
Air Corporation and its subsidiaries. Significant intercompany accounts and
transactions have been eliminated in consolidation.
The
Company has evaluated all subsequent events through the time this Form 10-K was
filed with the Securities and Exchange Commission on February 24,
2010.
Use
of Estimates
The
preparation of the consolidated financial statements in conformity with
accounting principles generally accepted in the United States requires
management to make estimates and assumptions that affect the amounts reported in
the consolidated financial statements and accompanying notes. Actual results
could differ from those estimates. Significant areas requiring management
estimates include the following key financial areas:
Allowance
for Doubtful Accounts
The Company evaluates the collectability of its accounts receivable based on a
combination of factors. In circumstances in which the Company is aware of a
specific customer’s inability to meet its financial obligations to the Company
(for example, bankruptcy filings, accounts turned over for collection or
litigation), the Company records a specific reserve for these bad debts against
amounts due to reduce the net recognized receivable to the amount the Company
reasonably believes will be collected. For all other customers, the Company
recognizes reserves for these bad debts based on the length of time the
receivables are past due. Specifically, amounts that are 90 days or more past
due are reserved at 50.0% for Forward Air and 25.0% for FASI. If circumstances
change (i.e., the Company experiences higher than expected defaults or an
unexpected material adverse change in a customer’s ability to meet its financial
obligations to the Company), the estimates of the recoverability of amounts due
to the Company could be changed by a material amount. Accounts are written off
after all means of collection, including legal action, have been
exhausted.
F-9
FORWARD
AIR CORPORATION
NOTES
TO CONSOLIDATED FINANCIAL STATEMENTS (Continued)
DECEMBER
31, 2009
(In thousands, except share and per
share data)
|
1.
|
Accounting
Policies (Continued)
|
Allowance
for Revenue Adjustments
The
Company’s allowance for revenue adjustments consists of amounts reserved for
billing rate changes that are not captured upon load initiation. These
adjustments generally arise: (1) when the sales department contemporaneously
grants small rate changes (“spot quotes”) to customers that differ from the
standard rates in the system; (2) when freight requires dimensionalization or is
reweighed resulting in a different required rate; (3) when billing errors occur;
and (4) when data entry errors occur. When appropriate, permanent rate changes
are initiated and reflected in the system. The Company monitors the manual
revenue adjustments closely through
the employment of various controls that are in place to ensure that revenue
recognition is not compromised and that fraud does not occur. During 2009,
average revenue adjustments per month were approximately $199, on average
revenue per month of approximately $34,784 (less than 1.0% of monthly
revenue). In order to estimate the allowance for revenue adjustments related to
ending accounts receivable, the Company prepares an analysis that considers
average monthly revenue adjustments and the average lag for identifying and
quantifying these revenue adjustments. Based on this analysis, the Company
establishes an allowance for approximately 40-80 days (dependent upon experience
in the last twelve months) of average revenue adjustments, adjusted for rebates
and billing errors. The lag is periodically adjusted based on actual historical
experience. Additionally, the average amount of revenue adjustments per month
can vary in relation to the level of sales or based on other factors (such as
personnel issues that could result in excessive manual errors or in excessive
spot quotes being granted). Both of these significant assumptions are
continually evaluated for validity.
Self-Insurance
Loss Reserves
Given the
nature of the Company’s operating environment, the Company is subject to vehicle
and general liability, workers’ compensation and health insurance claims. To
mitigate a portion of these risks, the Company maintains insurance for
individual vehicle and general liability claims exceeding $500 and workers’
compensation claims and health insurance claims exceeding $250, except in Ohio,
where for workers’ compensation we are a qualified self-insured entity with
a $350 self-insured retention. The amount of self-insurance loss reserves and
loss adjustment expenses is determined based on an estimation process that uses
information obtained from both company-specific and industry data, as well as
general economic information. The estimation process for self-insurance loss
exposure requires management to continuously monitor and evaluate the life cycle
of claims. Using data obtained from this monitoring and the Company’s
assumptions about the emerging trends, management develops information about the
size of ultimate claims based on its historical experience and other available
market information. The most significant assumptions used in the estimation
process include determining the trend in loss costs, the expected consistency in
the frequency and severity of claims incurred but not yet reported to prior year
claims, changes in the timing of the reporting of losses from the loss date to
the notification date, and expected costs to settle unpaid claims. Management
also monitors the reasonableness of the judgments made in the prior year’s
estimation process (referred to as a hindsight analysis) and adjusts current
year assumptions based on the hindsight analysis. Additionally, the Company
utilizes actuarial analyses to evaluate open claims and estimate the ongoing
development exposure.
Revenue
Recognition
Operating
revenue and related costs are recognized as of the date shipments are completed.
The transportation rates the Company charges its customers consist of base
transportation rates and fuel surcharge rates. The revenues earned
and related direct freight expenses incurred from the Company’s base
transportation services are recognized on a gross basis in revenue and in
purchased transportation. Transportation revenue is recognized on a
gross basis as the Company is the primary obligor. The fuel
surcharges billed to customers and paid to owner-operators and third party
transportation providers are recorded on a net basis as the Company is not the
primary obligor with regards to the fuel surcharges.
See
discussions of concentrations of credit risk in Note 11.
Cash
and Cash Equivalents
The
Company considers all highly liquid investments with a maturity of three months
or less when purchased to be cash and cash equivalents.
Inventories
Inventories
of tires, replacement parts, supplies, and fuel for equipment are stated at the
lower of cost or market utilizing the FIFO (first-in, first-out) method of
determining cost. Inventories of tires and replacement parts are not material in
the aggregate. Replacement parts are expensed when placed in service, while
tires are capitalized and amortized over their expected life. Replacement parts
and tires are included as a component of other operating expenses in the
consolidated statements of income.
F-10
FORWARD
AIR CORPORATION
NOTES
TO CONSOLIDATED FINANCIAL STATEMENTS (Continued)
DECEMBER
31, 2009
(In
thousands, except share and per share data)
|
1.
|
Accounting
Policies (Continued)
|
Property
and Equipment
Property
and equipment are stated at cost. Expenditures for normal repair and maintenance
are expensed as incurred. Depreciation of property and equipment is calculated
based upon the cost of the asset, reduced by its estimated salvage value, using
the straight-line method over the estimated useful lives as
follows:
|
Buildings
|
30-40
years
|
|
Equipment
|
3-10
years
|
|
Leasehold
improvements
|
Lesser
of Useful Life or Initial Lease
Term
|
Depreciation
expense for each of the three years ended December 31, 2009, 2008 and 2007 was
$15,068, $12,252 and $9,103, respectively.
The
Company reviews its long-lived assets for impairment whenever events or changes
in circumstances indicate that the carrying amount may not be recoverable.
Impairment is recognized on assets classified as held and used when the sum of
undiscounted estimated cash flows expected to result from the use of the asset
is less than the carrying value. If such measurement indicates a possible
impairment, the estimated fair value of the asset is compared to its net book
value to measure the impairment charge, if any. When the criteria have been met
for long-lived assets to be classified as held for sale, the assets are recorded
at the lower of carrying value or fair market value (less selling
costs).
Operating
Leases
Certain
operating leases include rent increases during the initial lease term. For these
leases, the Company recognizes the related rental expenses on a straight-line
basis over the term of the lease, which includes any rent holiday period, and
records the difference between the amounts charged to operations and amount paid
as rent as a rent liability.
Goodwill
and Other Intangible Assets
Goodwill
is recorded at cost based on the excess of purchase price over the fair value of
net assets acquired. Goodwill and intangible assets with indefinite lives are
not amortized but the Company conducts an annual (or more frequently if
circumstances indicate possible impairment) impairment test of goodwill for each
reportable segment at June 30 of each year. Other intangible assets
are amortized over their useful lives. Results of impairment testing are
described in Note 3, Goodwill and Other Long-Lived Assets.
Acquisitions
are accounted for using the purchase method. The definite-lived
intangible assets of the Company resulting from acquisition activity and the
related amortization are described in Note 2, Acquisition of
Businesses.
Software
Development
Costs
related to software developed or acquired for internal use are expensed or
capitalized based on the applicable stage of software development and any
capitalized costs are amortized over their estimated useful life. The
Company typically uses a five-year straight line amortization for the
capitalized amounts of software development costs.
Income
Taxes
The
Company accounts for income taxes using the liability method, whereby deferred
tax assets and liabilities are determined based on differences between financial
reporting and tax basis of assets and liabilities and are measured using the
enacted tax rates and laws that will be in effect when the differences are
expected to be recovered or settled. We report a liability for
unrecognized tax benefits resulting from uncertain tax positions taken or
expected to be taken in a tax return. We recognize interest and
penalties, if any, related to unrecognized tax benefits in interest expense and
operating expenses, respectively.
F-11
FORWARD
AIR CORPORATION
NOTES
TO CONSOLIDATED FINANCIAL STATEMENTS (Continued)
DECEMBER
31, 2009
(In thousands, except share and per
share data)
|
1.
|
Accounting
Policies (Continued)
|
Net
Income Per Share
The
Company calculates net income per share in accordance with the FASB Accounting
Standards Codification and the Hierarchy of Generally Accepted Accounting
Principles, Earnings per Share (the “FASB Codification 260”). Under
the FASB Codification 260, basic net income per basic share excludes any
dilutive effects of options, warrants and convertible securities. Diluted net
income per share includes any dilutive effects of options, warrants and
convertible securities, and uses the treasury stock method in calculating
dilution.
Comprehensive
Income
Comprehensive
income includes any changes in the equity of the Company from transactions and
other events and circumstances from non-operational sources. Unrealized gains
and losses on available-for-sale securities are included in other comprehensive
income for all years presented. Comprehensive income for the years
ended December 31, 2009, 2008 and 2007 approximated net income.
Share-Based
Payments
The
Company’s general practice has been to make a single annual grant of share-based
compensation to key employees and to generally make other grants only in
connection with new employment or promotions. In addition, the
Company makes annual grants to non-employee directors in conjunction with their
annual election to our Board of Directors or at the time of their appointment to
the Board of Directors. During the year ended December 31, 2006, the
Company granted non-vested shares of Common Stock (“non-vested shares”) to key
employees, but returned to granting stock options during the year ended
December 31, 2007. The Company returned to granting stock
options to key employees, as the Company believes stock options more closely
link long-term compensation with the Company’s long-term
goals. For non-employee directors, the Company continued to
issue non-vested shares during the years ended December 31, 2009, 2008 and
2007.
Stock options typically expire seven years from the grant date and vest ratably
over a three-year period. The share-based compensation for these stock options
and non-vested shares is recognized, net of estimated forfeitures, ratably over
the requisite service period, or vesting period. Based on the Company’s
historical experience, forfeitures have been estimated. The Company uses the
Black-Scholes option-pricing model to estimate the grant-date fair value of
options granted. The fair values of non-vested shares issued to
employees in 2006 and non-employee directors in 2009, 2008 and 2007 were
estimated using closing market prices for the business day of the
grant. The following table contains the weighted-average assumptions
used to estimate the fair value of options granted. These assumptions
are highly subjective and changes in these assumptions can materially affect the
fair value estimate.
|
December
31,
|
December
31,
|
December
31,
|
||||||
|
2009
|
2008
|
2007
|
||||||
|
Expected
dividend yield
|
0.9
|
%
|
0.8
|
%
|
0.8
|
%
|
||
|
Expected
stock price volatility
|
42.3
|
%
|
35.2
|
%
|
37.0
|
%
|
||
|
Weighted
average risk-free interest rate
|
2.0
|
%
|
2.8
|
%
|
4.5
|
%
|
||
|
Expected
life of options (years)
|
4.5
|
4.5
|
4.5
|
Under the
2005 Employee Stock Purchase Plan (the “ESPP”), which has been approved by
shareholders, the Company is authorized to issue shares of Common Stock to
eligible employees. These shares may be issued at a price equal to 90% of the
lesser of the market value on the first day or the last day of each six-month
purchase period. Common Stock purchases are paid for through periodic payroll
deductions and/or up to two large lump sum contributions. As the ESPP does not
qualify as non-compensatory, we recognize share-based compensation on the date
of purchase based on the difference between the purchase date fair market value
and the employee purchase price.
F-12
NOTES
TO CONSOLIDATED FINANCIAL STATEMENTS (Continued)
DECEMBER
31, 2009
(In
thousands, except share and per share data)
|
1.
|
Accounting
Policies (Continued)
|
Recently
Issued Accounting Pronouncements
During September 2006, the Financial Accounting Standards Board (“FASB”)
issued guidance regarding fair value measurements, which was effective for
fiscal years beginning after November 15, 2007. This guidance defines fair
value, establishes a framework for measuring fair value in generally accepted
accounting principles, and expands disclosures about fair value measurements. In
February 2008, the FASB delayed the effective date of the fair value guidance
for all non-financial assets and liabilities, except those that are recognized
or disclosed at fair value in the financial statements on a recurring basis,
until January 1, 2009. The Company adopted the new fair value
guidance on January 1, 2008 for all financial assets and liabilities and on
January 1, 2009 for nonfinancial assets. This adoption did not have a
significant impact on the Company's financial position or results of operations
other than considerations used in the fair value calculations of the Company’s
goodwill impairment tests. See further discussion of goodwill
impairment testing in Note 3.
In December 2007, the FASB issued a revision to rules governing business
combinations. The revised guidance establishes principles and
requirements for how an acquirer recognizes and measures in its financial
statements the identifiable assets acquired, the liabilities assumed, any
noncontrolling interest in the acquiree and the goodwill acquired. The revised
business combination guidance also establishes disclosure requirements to enable
the evaluation of the nature and financial effects of the business combination.
This guidance was effective January 1, 2009. The impact of this
revised guidance will depend on the nature of the Company’s business
combinations subsequent to January 1, 2009.
In
December 2007, the FASB amended guidance regarding noncontrolling interests and
the treatment of noncontrolling interests in consolidated financial
statements. The amended guidance establishes accounting and reporting
standards for ownership interests in subsidiaries held by parties other than the
parent, the amount of consolidated net income attributable to the parent and to
the noncontrolling interest, changes in a parent’s ownership interest, and the
valuation of retained noncontrolling equity investments when a subsidiary is
deconsolidated. The amended guidance also establishes disclosure requirements
that clearly identify and distinguish between the interests of the parent and
the interests of the noncontrolling owners. The adoption of the
amended guidance on January 1, 2009, did not have a significant impact on the
Company’s financial position, results of operations and cash flows as the
Company does not currently have any noncontrolling interests in other
entities.
The Company adopted the FASB’s new rule regarding subsequent events in the
second quarter of 2009. The FASB’s new rule establishes the
accounting for and disclosure of events that occur after the balance sheet date
but before financial statements are issued or are available to be issued. The
new subsequent event guidance requires the disclosure of the date through which
an entity has evaluated subsequent events and the basis for that date, that is,
whether that date represents the date the financial statements were issued or
were available to be issued. See Note 1 for the related disclosures. The
adoption of the new subsequent event rule did not have a material impact on the
Company’s financial statements.
In June 2009, the FASB amended rules regarding the transfer and servicing of
financial assets and the extinguishment of financial assets. The
amended guidance eliminates the concept of a qualifying special-purpose entity
(“QSPE”); clarifies and amends the derecognition criteria for a transfer to be
accounted for as a sale; amends and clarifies the unit of account eligible for
sale accounting; and requires that a transferor initially be measured at fair
value and recognize all assets obtained (for example beneficial interests) and
liabilities incurred as a result of a transfer of an entire financial asset or
group of financial assets accounted for as a sale. Additionally, on and after
the effective date of the amended guidance, existing QSPEs (as defined under
previous accounting standards) must be evaluated for consolidation by reporting
entities in accordance with the applicable consolidation guidance. The amended
guidance requires enhanced disclosures about, among other things, a transferor’s
continuing involvement with transfers of financial assets accounted for as
sales, the risks inherent in the transferred financial assets that have been
retained, and the nature and financial effect of restrictions on the
transferor’s assets that continue to be reported in the statement of financial
position. The Company will adopt the amended guidance on January 1,
2010, but at this time the Company does not anticipate the adoption will have a
significant impact on the Company’s financial position, results of operations
and cash flows.
F-13
FORWARD
AIR CORPORATION
NOTES
TO CONSOLIDATED FINANCIAL STATEMENTS (Continued)
DECEMBER
31, 2009
(In
thousands, except share and per share data)
|
1.
|
Accounting
Policies (Continued)
|
In June 2009, the FASB amended its rules regarding the consolidation of variable
interest entities (“VIE”). The FASB also amended the guidance
governing the determination of whether an enterprise is the primary beneficiary
of a VIE, and is, therefore, required to consolidate an entity, by requiring a
qualitative analysis rather than a quantitative analysis. The qualitative
analysis will include, among other things, consideration of who has the power to
direct the activities of the entity that most significantly impact the entity’s
economic performance and who has the obligation to absorb losses or the right to
receive benefits of the VIE that could potentially be significant to the VIE.
This standard also requires continuous reassessments of whether an enterprise is
the primary beneficiary of a VIE. Previously, FASB rules required
reconsideration of whether an enterprise was the primary beneficiary of a VIE
only when specific events had occurred. QSPEs, which were previously exempt from
the application of rules regarding VIEs, will be subject to the provisions of
these new rules when they become effective. The amended guidance also
requires enhanced disclosures about an enterprise’s involvement with a VIE. The
Company will adopt the amended rules on January 1, 2010, but at this time the
Company does not anticipate the adoption will have a significant impact on the
Company’s financial position, results of operations and cash flows.
In June 2009, the FASB Accounting Standards Codification and the Hierarchy of
Generally Accepted Accounting Principles (the “FASB Codification”) was
implemented. The FASB Codification does not change current U.S. GAAP,
but is intended to simplify user access to all authoritative U.S. GAAP by
providing all the authoritative literature related to a particular topic in one
place for nongovernmental entities. The FASB Codification was
effective for the Company in the third quarter of 2009, and all subsequent
public filings will reference the FASB Codification as the sole source of
authoritative literature. The adoption of the FASB Codification did
not impact The Company’s financial position, results of operations, and cash
flows.
|
2.
|
Acquisition
of Businesses
|
On September 8, 2008, the Company acquired certain assets and liabilities of
Service Express, Inc. (“Service Express”). Service Express was a
privately-held provider of pool distribution services primarily in the
Mid-Atlantic and Southeastern continental United States. Service
Express generated approximately $39,000 (unaudited) in revenue during the year
ended December 31, 2007. The acquisition of Service Express’ pool
distribution services expanded the geographic footprint of the FASI segment in
the Mid-Atlantic and Southeastern United States. The purchased
assets and liabilities and the results of operations of Service Express have
been included in the consolidated financial statements since September 8,
2008. The aggregate purchase price of $10,647 as allocated per the
following table was paid with the Company’s available cash and borrowings from
the Company’s senior credit facility (see Note 5).
|
Service
Express
|
||
|
Current
assets
|
$ | 258 |
|
Property
and equipment
|
2,819 | |
|
Customer
relationships
|
6,000 | |
|
Goodwill
|
5,204 | |
|
Total
assets acquired
|
14,281 | |
|
Current
liabilities
|
281 | |
|
Capital
lease obligations
|
3,353 | |
|
Total
liabilities assumed
|
3,634 | |
|
Net
assets acquired
|
$ | 10,647 |
F-14
FORWARD
AIR CORPORATION
NOTES
TO CONSOLIDATED FINANCIAL STATEMENTS (Continued)
DECEMBER
31, 2009
(In thousands, except share and per
share data)
|
2.
|
Acquisition
of Businesses (Continued)
|
On
March 17, 2008, the Company acquired certain assets and liabilities of Pinch
Holdings, Inc. and its related company AFTCO Enterprises, Inc. and certain of
their respective wholly owned subsidiaries (“Pinch”). Pinch was a
privately-held provider of pool distribution, airport-to-airport, truckload,
customs, and cartage services primarily in the Southwestern continental United
States. Pinch generated approximately $35,000 (unaudited) in
revenue during the year ended December 31, 2007. The acquisition of
Pinch’s pool distribution services expanded the geographic footprint of the FASI
segment in the Southwestern United States. In addition to providing
additional tonnage density to the Forward Air airport-to-airport network, the
acquisition of Pinch’s cartage and truckload business provides an opportunity
for Forward Air to expand its service options in the Southwestern United
States. The purchased assets and liabilities and the results of
operations of Pinch have been included in the consolidated financial statements
since March 17, 2008. The aggregate purchase price of $18,682 as
allocated per the following table was paid with the Company’s available cash and
borrowings from the Company’s senior credit facility (see Note
5).
|
Forward
Air
|
FASI
|
Total
|
||||||
|
Current
assets
|
$ | 72 | $ | -- | $ | 72 | ||
|
Property
and equipment
|
960 | 148 | 1,108 | |||||
|
Non-compete
agreements
|
80 | -- | 80 | |||||
|
Customer
relationships
|
4,700 | 4,300 | 9,000 | |||||
|
Goodwill
|
5,573 | 3,437 | 9,010 | |||||
|
Total
assets acquired
|
11,385 | 7,885 | 19,270 | |||||
|
Debt
and capital leases
|
480 | 108 | 588 | |||||
|
Total
liabilities assumed
|
480 | 108 | 588 | |||||
|
Net
assets acquired
|
$ | 10,905 | $ | 7,777 | $ | 18,682 | ||
On July 30, 2007, the Company acquired certain assets and liabilities of USAC.
The purchased assets and liabilities and the results of operations of USAC have
been included in the consolidated financial statements, in the Company’s FASI
segment, since July 30, 2007. USAC was a well-established
transportation service provider with 11 facilities that specialized in pool
distribution services throughout the Southeast, Midwest and
Southwest continental United States. USAC generated approximately
$32,000 (unaudited) in revenue during the year ended December 31, 2006.
In conjunction with the Company’s strategy to expand into new services
complimentary to the airport-to-airport business, the acquisition provides the
opportunity for the Company to introduce new services to new and existing
customers and to drive efficiencies in existing businesses. The
aggregate purchase price was $12,950, paid with the Company’s available
cash. During 2008, $237 was paid to the previous owners of USAC for
final settlement of the purchased working capital.
On December 3, 2007, the Company acquired certain assets and liabilities of
Black Hawk Freight Services, Inc. ("Black Hawk"). The purchased
assets and liabilities and the results of operations of Black Hawk have been
included in the consolidated financial statements, in the Company’s Forward Air
segment, since December 3, 2007. Black Hawk was a privately-held
provider of airport-to-airport, truckload, custom, and cartage services that
generated approximately $30,000 (unaudited) in revenue during the year ended
December 31, 2006. The acquisition of Black Hawk operations is
complimentary to those of the Forward Air segment and increased the geographic
footprint of the segment in the Midwestern United States. The
aggregate purchase price was $35,251, paid with the Company’s available cash and
borrowings from the Company’s senior credit facility.
Also during 2007, the Company acquired certain assets of two other
operations for $681 in cash. The assets purchased were truckload
and cargo handling customer relationships. These acquisitions were
completed to expand existing logistics and other services currently
provided.
F-15
FORWARD
AIR CORPORATION
NOTES
TO CONSOLIDATED FINANCIAL STATEMENTS (Continued)
DECEMBER
31, 2009
(In
thousands, except share and per share data)
|
2.
|
Acquisition
of Businesses (Continued)
|
The purchase price allocations of the respective 2007 acquisitions discussed
above are as follows:
|
USAC
|
Black
Hawk
|
Other
|
Total
|
||||||||
|
Current
assets
|
$ | 2,262 | $ | 17 | $ | -- | $ | 2,279 | |||
|
Property
and equipment
|
3,425 | 3,928 | -- | 7,353 | |||||||
|
Non-compete
agreements
|
200 | 1,500 | -- | 1,700 | |||||||
|
Customer
relationships
|
4,800 | 13,800 | 681 | 19,281 | |||||||
|
Goodwill
|
3,718 | 16,765 | -- | 20,483 | |||||||
|
Other
noncurrent assets
|
215 | -- | -- | 215 | |||||||
|
Total
assets acquired
|
14,620 | 36,010 | 681 | 51,311 | |||||||
|
Current
liabilities
|
456 | -- | -- | 456 | |||||||
|
Debt
and capital leases
|
1,214 | 759 | -- | 1,973 | |||||||
|
Total
liabilities assumed
|
1,670 | 759 | -- | 2,429 | |||||||
|
Net
assets acquired
|
$ | 12,950 | $ | 35,251 | $ | 681 | $ | 48,882 | |||
The
Company’s total acquired customer relationships and non-compete agreements of
$46,350 and $1,780, respectively, have weighted-average useful lives of 11.4 and
5.6 years, respectively. Amortization expense on acquired customer
relationships and non-compete agreements for each of the three years ended
December 31, 2009, 2008 and 2007 was $4,654, $4,363 and $1,721,
respectively.
The
estimated amortization expense for the next five years on definite-lived
intangible assets as of December 31, 2009 is as follows:
|
2010
|
2011
|
2012
|
2013
|
2014
|
||||||||||
|
Customer
relationships
|
$ | 4,255 | $ | 4,255 | $ | 4,255 | $ | 4,255 | $ | 4,067 | ||||
|
Non-compete
agreements
|
336 | 336 | 311 | 24 | 20 | |||||||||
|
Total
|
$ | 4,591 | $ | 4,591 | $ | 4,566 | $ | 4,279 | $ | 4,087 | ||||
|
3.
|
Goodwill
and Other Long-Lived Assets
|
The Company conducts an annual (or more frequently if circumstances indicate
possible impairment) impairment test of goodwill for each reportable segment at
June 30 of each year. The first step of the goodwill impairment test
is the estimation of the reportable segment’s fair value. If step one
indicates that impairment potentially exists, the second step is performed to
measure the amount of the impairment, if any. Goodwill impairment
exists when the calculated implied fair value of goodwill is less than its
carrying value. Changes in strategy or market conditions could
significantly impact these fair value estimates and require adjustments to
recorded asset balances.
During the three months ended March 31, 2009, the Company determined there were
indicators of potential impairment of the goodwill assigned to the FASI
segment. This determination was based on the continuing economic
recession, declines in current market valuations and FASI operating losses in
excess of expectations. As a result, the Company performed an interim
impairment test in accordance with the Company accounting policy discussed above
as of March 31, 2009. Based on the results of the interim impairment
test, the Company concluded that an impairment loss was probable and could be
reasonably estimated. Consequently, the Company recorded a non-cash
goodwill impairment charge of $6,953 related to the FASI segment during the
three months ended March 31, 2009. The Company finalized certain
valuations related to the March 31, 2009 goodwill impairment calculations during
the second quarter of 2009, which did not result in any adjustments to the
impairment recorded at March 31, 2009.
The Company conducted its annual impairment test of goodwill for each
reportable segment as of June 30, 2009 and no additional impairment charges
were required. For both the March 31, 2009 and June 30, 2009 goodwill
impairment calculations, the Company calculated the fair value of the applicable
reportable segments, using a combination of discounted projected cash flows and
market valuations as of the valuation date for comparable
companies. The Company's fair value calculations for goodwill are
classified within level 3 of the fair value hierarchy as defined in the FASB
Codification.
F-16
FORWARD
AIR CORPORATION
NOTES
TO CONSOLIDATED FINANCIAL STATEMENTS (Continued)
DECEMBER
31, 2009
(In
thousands, except share and per share data)
|
3.
|
Goodwill
and Other Long-Lived Assets
(continued)
|
As of December 31, 2009, the carrying value of goodwill related to the Forward
Air and FASI segments was $37,926 and $5,406, respectively. Earnings estimated
to be generated by the Forward Air segment are expected to support the carrying
value of its goodwill. The FASI segment is currently facing the
challenges of building and expanding a business during difficult economic
times. If these overall economic conditions worsen or continue for an
extended period of time, the Company may be required to record an additional
impairment charge against the carrying value of goodwill related to the FASI
segment.
The changes in the carrying value of goodwill by segment for the years ended
December 31, 2009 and 2008 are as follows:
|
Forward
Air
|
FASI
|
Total
|
||||||||||||||
|
Accumulated
|
Accumulated
|
|||||||||||||||
|
Goodwill
|
Impairment
|
Goodwill
|
Impairment
|
Net
|
||||||||||||
|
Ending
balance, December 31, 2007
|
$ | 32,344 | $ | -- | $ | 3,709 | $ | -- | $ | 36,053 | ||||||
|
Pinch
acquisition
|
5,573 | -- | 3,437 | -- | 9,010 | |||||||||||
|
Service
Express acquisition
|
-- | -- | 5,149 | -- | 5,149 | |||||||||||
|
Adjustment
to Black Hawk and USAC acquisitions
|
9 | -- | 9 | -- | 18 | |||||||||||
|
Ending
balance, December 31, 2008
|
37,926 | -- | 12,304 | -- | 50,230 | |||||||||||
|
Adjustment
to Service Express acquisition
|
-- | -- | 55 | -- | 55 | |||||||||||
|
Impairment
loss
|
-- | -- | -- | (6,953 | ) | (6,953 | ) | |||||||||
|
Ending
balance, December 31, 2009
|
$ | 37,926 | $ | -- | $ | 12,359 | $ | (6,953 | ) | $ | 43,332 | |||||
The goodwill for the above acquisitions is deductible for tax
purposes.
Additionally, the Company reviews its long-lived assets for impairment whenever
events or changes in circumstances indicate that the carrying amount may not be
recoverable. Impairment is recognized on assets classified as held and used when
the sum of undiscounted estimated cash flows expected to result from the use of
the asset is less than the carrying value. If such measurement indicates a
possible impairment, the estimated fair value of the asset is compared to its
net book value to measure the impairment charge, if any. During 2009
an impairment charge of $204 was incurred in the Forward Air segment to write
off the net book value of certain truckload and cargo handling customer
relationships purchased during 2007. These impairment charges were
recorded as the related customer relationships and services were discontinued
during the first quarter of 2009.
|
4.
|
Property
|
In June 2007, the Company completed the purchase of a new regional hub near
Atlanta, Georgia for $14,870. The deposit of $1,478 paid in September 2006,
previously included in noncurrent other assets, was applied to this purchase
price.
In March 2007, the Company completed the purchase of a new terminal near
Chicago, Illinois for $22,312. The deposit of $3,316 paid in July 2006,
previously included in noncurrent other assets, was applied to this purchase
price.
In
June 2009, the Company completed the construction of a new regional hub in
Dallas/Fort Worth, Texas for a total cost of approximately $31,642.
F-17
FORWARD
AIR CORPORATION
NOTES
TO CONSOLIDATED FINANCIAL STATEMENTS (Continued)
DECEMBER
31, 2009
(In
thousands, except share and per share data)
|
5.
|
Debt
and Capital Lease Obligations
|
Credit
Facilities
On
October 10, 2007, the Company entered into a $100,000 senior credit facility.
This facility has a term of five years and includes an accordion feature, which
if approved by the Company’s lender, allows for an additional $50,000 in
borrowings on such terms and conditions as set forth in the Credit Agreement.
The senior credit facility matures on October 10, 2012. The facility
replaced the Company's previous $20,000 line of credit. The Company entered into
this larger credit facility in order to fund potential acquisitions, the
repurchase of its Common Stock, and for financing other general business
purposes. Interest rates for advances under the facility are at LIBOR
plus 0.6% to 0.9% based upon covenants related to total indebtedness to earnings
(total borrowing rate of 0.8% at December 31, 2009). The agreement contains
certain covenants and restrictions, none of which are expected to significantly
affect our operations or ability to pay dividends. No assets are
pledged as collateral against the senior credit facility. As of
December 31, 2009, the Company had $50,000 outstanding under the senior credit
facility. At December 31, 2009, the Company had $39,396 of available borrowing
capacity outstanding under the senior credit facility, not including the
accordion feature, and had utilized $10,604 of availability for outstanding
letters of credit. See discussion of the fair value of the Company’s
debt and capital lease obligations in Note 11.
Other
Long-Term Debt
In
conjunction with the July 2007 acquisition of certain assets and
liabilities of USAC, the Company assumed $1,188 in equipment notes. Interest on
the equipment notes is fixed at various rates between 5.9% and
8.5%.
Annual
maturities of long-term debt including the senior credit facility, at
December 31, 2009, are as follows:
|
2010
|
$ | 21 |
|
2011
|
-- | |
|
2012
|
50,000 | |
|
Total
|
$ | 50,021 |
Capital
Leases
In
September 2000, the Company entered into an agreement with the Rickenbacker Port
Authority (“Rickenbacker”) to lease a building located near the Company’s
Columbus, Ohio hub facility. At the inception of the lease, the Company made a
$2,004 loan to Rickenbacker. The lease agreement has a ten-year initial term,
with two five-year renewal options. At December 31, 2009, the present
value of the future minimum lease payments was $756. Because the lease met the
criteria for classification as a capital lease, the leased building was recorded
in property and equipment at $3,015 (which represented the present value of the
total minimum lease payments, including the $2,004 initial
payment). The building is being depreciated over the initial lease
term.
In 2008
and 2007 in conjunction with the acquisitions discussed in Note 2, the Company
assumed several equipment leases that met the criteria for classification as a
capital lease. The leased equipment is being amortized over the
shorter of the lease term or useful life.
Property
and equipment include the following amounts for assets under capital
leases:
|
|
December
31,
|
December
31,
|
|||||
|
2009
|
2008
|
||||||
|
Buildings
|
$
|
3,015
|
$
|
3,015
|
|||
|
Equipment
|
2,391
|
2,975
|
|||||
|
Accumulated
amortization
|
(2,756
|
)
|
(2,061
|
)
|
|||
|
$
|
2,650
|
$
|
3,929
|
||||
Amortization
of assets under capital leases is included in depreciation and amortization
expense.
F-18
FORWARD
AIR CORPORATION
NOTES
TO CONSOLIDATED FINANCIAL STATEMENTS (Continued)
DECEMBER
31, 2009
(In
thousands, except share and per share data)
|
5.
|
Debt
and Capital Lease Obligations
(continued)
|
Future
minimum payments, by year and in the aggregate, under non-cancelable capital
leases with initial or remaining terms of one year or more consist of the
following at December 31, 2009:
|
2010
|
$ | 1,041 |
|
2011
|
794 | |
|
2012
|
674 | |
|
2013
|
376 | |
|
2014
|
160 | |
|
Thereafter
|
473 | |
|
Total
|
3,518 | |
|
Less
amounts representing interest
|
451 | |
|
Present
value of net minimum lease payments (including current portion of
$898)
|
$ | 3,067 |
Interest
Payments
Interest
payments during 2009, 2008 and 2007 were $749, $1,628 and $433,
respectively. During the years ended December 31, 2009 and 2008, $110
and $301 of interest payments were capitalized, respectively.
|
6.
|
Shareholders’
Equity, Stock Options and Net Income per
Share
|
Preferred
Stock
The
Company had a shareholder rights plan that expired May 18, 2009. The
expired plan allowed the Board of Directors to issue, at its discretion, up to
5,000,000 shares of preferred stock, par value $0.01. The 5,000,000 shares of
preferred stock are still authorized, but no shares have been issued to
date.
Cash
Dividends
During
each quarter of 2009, 2008 and 2007, the Company’s Board of Directors declared a
cash dividend of $0.07 per share of Common Stock. On February 8, 2010, the
Company’s Board of Directors declared a $0.07 per share dividend that will be
paid in the first quarter of 2010. The Company expects to continue to pay
regular quarterly cash dividends, though each subsequent quarterly dividend is
subject to review and approval by the Board of Directors.
Repurchase of Common
Stock
On
November 17, 2005, the Company announced that its Board of Directors approved a
stock repurchase program for up to three million shares of Common Stock (the
“2005 Repurchase Plan”). During the year ended December 31, 2007, the Company
repurchased the remaining available shares of Common Stock under the 2005
Repurchase plan, or 1,613,327 shares, for $49,079, or $30.42 per
share. No shares remained eligible for purchase under the 2005
Repurchase Plan.
On July
31, 2007 our Board of Directors approved an additional stock repurchase program
for up to two million shares of the Company’s Common Stock (the “2007 Repurchase
Plan”). During the year ended December 31, 2007, the Company
repurchased 211,173 shares of Common Stock under the 2007 Repurchase Plan for
$6,055, or $28.68 per share. No shares were repurchased during the
years ended December 31, 2009 and 2008. As of December 31, 2009, 1,788,827
shares of Common Stock remain that may be repurchased under the 2007 Repurchase
Plan.
F-19
FORWARD
AIR CORPORATION
NOTES
TO CONSOLIDATED FINANCIAL STATEMENTS (Continued)
DECEMBER
31, 2009
(In
thousands, except share and per share data)
|
6.
|
Shareholders’
Equity, Stock Options and Net Income per Share
(continued)
|
Share-Based
Compensation
The
Company had previously reserved 4,500,000 common shares under the 1999 Stock
Option and Incentive Plan (the “1999 Plan”). Options issued under the 1999 Plan
have seven to ten-year terms and originally vested over a one to five year
period. On December 31, 2005, the Company's Board of Directors accelerated the
vesting of all of the Company's outstanding and unvested stock options awarded
to employees, officers and non-employee directors under the Company's stock
option award plans.
In May
2008, with the approval of shareholders, the Company amended and restated the
1999 Stock Option and Incentive Plan (the “1999 Amended Plan”) to reserve an
additional 3,000,000 common shares, increasing the total number of reserved
common shares under the 1999 Amended Plan to 7,500,000.
Employee
Activity - Options
The
following table summarizes the Company’s employee stock option activity and
related information for the years ended December 31, 2009, 2008 and
2007:
|
2009
|
2008
|
2007
|
||||||||||||||||||
|
Weighted-
|
Weighted-
|
Weighted-
|
||||||||||||||||||
|
Average
|
Average
|
Average
|
||||||||||||||||||
|
Options
|
Exercise
|
Options
|
Exercise
|
Options
|
Exercise
|
|||||||||||||||
|
(000)
|
Price
|
(000)
|
Price
|
(000)
|
Price
|
|||||||||||||||
|
Outstanding
at beginning of year
|
2,446
|
$
|
28
|
2,246
|
$
|
26
|
1,475
|
$
|
23
|
|||||||||||
|
Granted/converted
|
675
|
23
|
387
|
30
|
847
|
31
|
||||||||||||||
|
Exercised
|
(1
|
)
|
18
|
(153
|
)
|
15
|
(64
|
)
|
20
|
|||||||||||
|
Forfeited
|
(34
|
)
|
28
|
(34
|
)
|
32
|
(12
|
)
|
29
|
|||||||||||
|
Outstanding
at end of year
|
3,086
|
$
|
26
|
2,446
|
$
|
28
|
2,246
|
$
|
26
|
|||||||||||
|
Exercisable
at end of year
|
1,906
|
$
|
27
|
1,528
|
$
|
26
|
1,409
|
$
|
23
|
|||||||||||
|
Options/shares
available for grant
|
2,363
|
3,004
|
357
|
|||||||||||||||||
|
Average
aggregate intrinsic value
|
||||||||||||||||||||
|
for
options outstanding
|
$
|
--
|
||||||||||||||||||
|
Average
aggregate intrinsic value
|
||||||||||||||||||||
|
for
exercisable options
|
$
|
--
|
||||||||||||||||||
|
Weighted-average
fair value of
|
||||||||||||||||||||
|
options
granted during the year
|
$
|
7.96
|
$
|
9.17
|
$
|
10.98
|
||||||||||||||
The
following table summarizes information about stock options outstanding as of
December 31, 2009:
|
Weighted
|
Weighted
|
Weighted
|
|||||||||||
|
Range
of
|
Number
|
Average
|
Average
|
Number
|
Average
|
||||||||
|
Exercise
|
Outstanding
|
Remaining
|
Exercise
|
Exercisable
|
Exercise
|
||||||||
|
Price
|
(000)
|
Contractual
Life
|
Price
|
(000)
|
Price
|
||||||||
|
$
|
13.25-18.82
|
333
|
3.3
|
$
|
15.63
|
333
|
$
|
15.63
|
|||||
|
20.05-29.44
|
1,936
|
5.2
|
26.29
|
1,036
|
27.78
|
||||||||
|
30.35-35.53
|
817
|
4.1
|
31.38
|
537
|
31.37
|
||||||||
|
$
|
13.25-35.53
|
3,086
|
4.8
|
$
|
26.49
|
1,906
|
$
|
26.67
|
|||||
F-20
FORWARD
AIR CORPORATION
NOTES
TO CONSOLIDATED FINANCIAL STATEMENTS (Continued)
DECEMBER
31, 2009
(In
thousands, except share and per share data)
|
6.
|
Shareholders’
Equity, Stock Options and Net Income per Share
(continued)
|
Share-based
compensation expense for options granted in 2009, 2008 and 2007 was
recognized in salaries, wages and employee benefits. Share-based
compensation expense for options granted was $5,832, $4,036 and $1,823
during 2009, 2008 and 2007, respectively. The total tax benefit
related to the share-based expense for these options was $1,691, $1,032 and $390
for 2009, 2008 and 2007, respectively. Total compensation cost, net of estimated
forfeitures, related to the options not yet recognized in earnings was $5,603 at
December 31, 2009. Total unrecognized compensation cost will be adjusted for
future changes in estimated forfeitures.
Employee
Activity – Non-vested shares
During
the year ended December 31, 2006, the Company granted 129,350 non-vested shares
to key employees with a weighted-average fair value of $36.09 per
share. Share-based compensation expense of $258, $1,403 and $1,286
for non-vested shares granted to employees during 2006 was recognized in
salaries, wages and employee benefits during the years ended December 31, 2009,
2008 and 2007, respectively. The total tax benefit related to this share-based
expense was $109, $550 and $487 for the years ended December 31, 2009, 2008 and
2007, respectively.
During the year ended December 31, 2009, 37,632 previously non-vested shares
with a total grant date fair value of $1,358 vested to
employees. During the year ended December 31, 2008, 38,078 previously
non-vested shares with a total grant date fair value of $1,374 vested to
employees. During the year ended December 31, 2007, 38,540 previously
non-vested shares with a total grant date fair value of $1,391 vested to
employees. During the year ended December 31, 2008, 1,350 of
non-vested shares were forfeited by employees. No non-vested shares
were forfeited by employees during the years ended December 31, 2009 and
2007. As of December 31, 2009 all shares granted to employees
had vested or been forfeited.
Employee
Activity – ESPP
Under
the ESPP at December 31, 2009, the Company is authorized to issue up to a
remaining 447,232 shares of Common Stock to employees of the Company. For the
years ended December 31, 2009, 2008 and 2007, participants under the plan
purchased 12,092, 10,377 and 9,378 shares, respectively, at an average
price of $19.63, $24.57 and $27.66 per share, respectively. The weighted-average
fair value of each purchase right under the ESPP granted for the years ended
December 31, 2009, 2008 and 2007, which is equal to the discount from the market
value of the Common Stock at the end of each six month purchase period, was
$3.90, $5.00 and $5.09 per share, respectively. Share-based compensation expense
of $47, $51 and $48 was recognized in salaries, wages and employee benefits,
during the years ended December 31, 2009, 2008 and 2007,
respectively.
Non-employee
Directors – Non-vested shares
On May
23, 2006, the Company’s shareholders approved the Company’s 2006 Non-Employee
Director Stock Plan (the “2006 Plan”). The Company’s shareholders
then approved the Company’s Amended and Restated Non-Employee Director Stock
Plan (the “Amended Plan”) on May 22, 2007. The Amended Plan was then
further amended and restated on December 17, 2008. The Amended Plan
is designed to better enable the Company to attract and retain well-qualified
persons for service as directors of the Company. Under the Amended
Plan, on the first business day after each Annual Meeting of Shareholders, each
non-employee director will automatically be granted an award (the “Annual
Grant”), in such form and size as the Board determines from year to
year. Unless otherwise determined by the Board, Annual Grants will
become vested and nonforfeitable one year after the date of grant so long as the
non-employee director’s service with the Company does not earlier
terminate. Each director may elect to defer receipt of the shares
under a non-vested share award until the director terminates service on the
Board of Directors. If a director elects to defer receipt, the
Company will issue deferred stock units to the director, which do not represent
actual ownership in shares and the director will not have voting rights or other
incidents of ownership until the shares are issued. However, the
Company will credit the director with dividend equivalent payments in the form
of additional deferred stock units for each cash dividend payment made by the
Company.
During
2009, 2008 and 2007, under the Amended Plan, 30,870, 18,448 and 14,268,
respectively, of non-vested shares or deferred stock units were issued to the
Company’s non-employee directors. The weighted-average grant date
fair values for the 2009, 2008 and 2007 grants to non-employee directors were
$18.14, $34.69 and $33.64, respectively. The share-based compensation
for these awards are recognized, net of estimated forfeitures, ratably over the
requisite service period, or vesting period, of one
year.
Under the
2006 Plan, during 2006, 13,500 non-vested shares and deferred stock units were
issued to the Company’s non-employee directors with a weighted-average fair
value of $36.27. In April 2007, 375 non-vested shares with fair
values of $30.88 per share were issued to a new non-employee
director. The share-based compensation for these awards are
recognized, net of estimated forfeitures, ratably over the requisite service
period, or vesting period, of three years.
F-21
FORWARD
AIR CORPORATION
NOTES
TO CONSOLIDATED FINANCIAL STATEMENTS (Continued)
DECEMBER
31, 2009
(In
thousands, except share and per share data)
|
6.
|
Shareholders’
Equity, Stock Options and Net Income per Share
(continued)
|
During
the year ended December 31, 2009, 20,017 of previously non-vested shares and
deferred stock units with a total grant date fair value of $700 vested to
non-employee directors. At December 31, 2009, 30,870 non-vested
shares granted to non-employee directors had yet to
vest. During the year ended December 31, 2008, 23,649 of
previously non-vested shares and deferred stock units with a total grant date
fair value of $807 vested to non-employee directors. During 2008, a
non-employee director resigned from our Board of Directors and forfeited
approximately 3,056 non-vested shares.
During
the years ended December 31, 2009, 2008 and 2007, share-based compensation
expense for non-vested shares granted to non-employee directors under the above
plans was $617, $777 and $552, respectively, and was recognized in salaries,
wages and employee benefits. The total tax benefits related to this share-based
expense was $261, $305 and $209 for the years ended December 31, 2009, 2008 and
2007, respectively. Total compensation cost, net of estimated
forfeitures, related to these non-vested shares granted to non-employee
directors not yet recognized in earnings was $205 at December 31, 2009. Total
unrecognized compensation cost will be adjusted for future changes in estimated
forfeitures.
Non-employee
Directors - Options
In addition to the above activity, each May from 1995 to 2005, options were
granted to the non-employee directors of the Company. The options have
terms of ten years and are fully exercisable. The following tables
summarize the Company’s non-employee stock option activity and related
information for the years ended December 31, 2009, 2008 and 2007 :
|
2009
|
2008
|
2007
|
|||||||||||||
|
Weighted-
|
Weighted-
|
Weighted-
|
|||||||||||||
|
Average
|
Average
|
Average
|
|||||||||||||
|
Options
|
Exercise
|
Options
|
Exercise
|
Options
|
Exercise
|
||||||||||
|
(000)
|
Price
|
(000)
|
Price
|
(000)
|
Price
|
||||||||||
|
Outstanding
at beginning of year
|
74
|
$
|
22
|
112
|
$
|
22
|
112
|
$
|
22
|
||||||
|
Granted/converted
|
--
|
--
|
--
|
--
|
--
|
--
|
|||||||||
|
Exercised
|
--
|
--
|
(38
|
)
|
22
|
--
|
--
|
||||||||
|
Forfeited
|
--
|
--
|
--
|
--
|
--
|
--
|
|||||||||
|
Outstanding
and exercisable at end of year
|
74
|
$
|
22
|
74
|
$
|
22
|
112
|
$
|
22
|
||||||
|
Average
aggregate intrinsic value
|
|||||||||||||||
|
for
options outstanding and exercisable
|
$
|
--
|
|||||||||||||
At
December 31, 2009, weighted average remaining contractual term for these options
was 3.1 years.
Net
Income per Share
The
following table sets forth the computation of net income per basic and diluted
share:
|
2009
|
2008
|
2007
|
||||||
|
Numerator:
|
||||||||
|
Numerator
for basic and diluted net income per share
|
$ | 9,802 | $ | 42,542 | $ | 44,925 | ||
|
Denominator:
|
||||||||
|
Denominator
for basic net income per share - weighted-average shares (in
thousands)
|
28,928 | 28,808 | 29,609 | |||||
|
Effect
of dilutive stock options and non-vested shares (in
thousands)
|
65 | 217 | 353 | |||||
|
Denominator
for diluted net income per share - adjusted
|
||||||||
|
weighted-average
shares (in thousands)
|
28,993 | 29,025 | 29,962 | |||||
|
Basic
net income per share
|
$ | 0.34 | $ | 1.48 | $ | 1.52 | ||
|
Diluted
net income per share
|
$ | 0.34 | $ | 1.47 | $ | 1.50 | ||
F-22
FORWARD
AIR CORPORATION
NOTES
TO CONSOLIDATED FINANCIAL STATEMENTS (Continued)
DECEMBER
31, 2008
(In
thousands, except share and per share data)
|
6.
|
Shareholders’
Equity, Stock Options and Net Income per Share
(continued)
|
The
number of options and non-vested shares that could potentially
dilute income per basic share in the future, but that were not
included in the computation of income per diluted share because to do
so would have been anti-dilutive for the periods presented, were approximately
2,610,000, 1,153,000 and 120,000 in 2009, 2008 and 2007,
respectively.
|
7.
|
Income
Taxes
|
The
provision for income taxes consists of the following:
|
2009
|
2008
|
2007
|
|||||||
|
Current:
|
|||||||||
|
Federal
|
$ | 10,711 | $ | 22,242 | $ | 23,179 | |||
|
State
|
2,017 | 3,476 | 3,613 | ||||||
| 12,728 | 25,718 | 26,792 | |||||||
|
Deferred:
|
|||||||||
|
Federal
|
(4,310 | ) | 1,061 | 525 | |||||
|
State
|
(271 | ) | 90 | 71 | |||||
| (4,581 | ) | 1,151 | 596 | ||||||
| $ | 8,147 | $ | 26,869 | $ | 27,388 | ||||
The tax
(expense) benefit associated with the exercise of stock options and the vesting
of non-vested shares during the years ended December 31, 2009, 2008 and
2007 were ($370), $1,030 and $1,261, respectively, and are reflected as a
decrease or increase in additional paid-in capital in the accompanying
consolidated statements of shareholders’ equity.
The
historical income tax expense differs from the amounts computed by applying the
federal statutory rate of 35.0% to income before income taxes as
follows:
|
2009
|
2008
|
2007
|
|||||||||
|
Tax
expense at the statutory rate
|
$
|
6,282
|
$
|
24,294
|
$
|
25,310
|
|||||
|
State
income taxes, net of federal benefit
|
1,135
|
2,318
|
2,574
|
||||||||
|
Qualified
stock options
|
659
|
503
|
294
|
||||||||
|
Meals
and entertainment
|
176
|
194
|
289
|
||||||||
|
Tax-exempt
interest income
|
--
|
(6
|
)
|
(406
|
)
|
||||||
|
Federal
income tax credits
|
(269
|
)
|
(328
|
)
|
(498
|
)
|
|||||
|
Deferred
tax asset valuation allowance
|
183
|
(132
|
)
|
--
|
|||||||
|
Other
|
(19
|
)
|
26
|
(175
|
)
|
||||||
|
$
|
8,147
|
$
|
26,869
|
$
|
27,388
|
||||||
F-23
FORWARD
AIR CORPORATION
NOTES
TO CONSOLIDATED FINANCIAL STATEMENTS (Continued)
DECEMBER
31, 2009
(In
thousands, except share and per share data)
|
7.
|
Income
Taxes (continued)
|
Deferred
income taxes reflect the net tax effects of temporary differences between the
carrying amounts of assets and liabilities for financial reporting purposes and
the amounts used for income tax purposes. Significant components of the
Company’s deferred tax liabilities and assets are as follows:
|
December
31,
|
December
31,
|
||||||
|
2009
|
2008
|
||||||
|
Deferred
tax assets:
|
|||||||
|
Accrued
expenses
|
$
|
4,365
|
$
|
3,049
|
|||
|
Allowance
for doubtful accounts
|
742
|
979
|
|||||
|
Non-compete
agreements
|
1,711
|
1,090
|
|||||
|
Share-based
compensation
|
3,548
|
2,467
|
|||||
|
Accruals
for income tax contingencies
|
114
|
113
|
|||||
|
Impairment
of goodwill and other intangible assets
|
2,104
|
--
|
|||||
|
Net
operating loss carryforwards
|
279
|
276
|
|||||
|
Total
deferred tax assets
|
12,863
|
7,974
|
|||||
|
Valuation
allowance
|
(459
|
)
|
(276
|
)
|
|||
|
Total
deferred tax assets, net of valuation allowance
|
12,404
|
7,698
|
|||||
|
Deferred
tax liabilities:
|
|||||||
|
Tax
over book depreciation
|
8,786
|
8,951
|
|||||
|
Prepaid
expenses deductible when paid
|
1,800
|
1,922
|
|||||
|
Goodwill
|
4,343
|
3,561
|
|||||
|
Total
deferred tax liabilities
|
14,929
|
14,434
|
|||||
|
Net
deferred tax liabilities
|
$
|
(2,525
|
)
|
$
|
(6,736
|
)
|
|
The balance
sheet classification of deferred income taxes is as follows:
|
December
31,
|
December
31,
|
||||||
|
2009
|
2008
|
||||||
|
Current
assets
|
$
|
3,261
|
$
|
2,105
|
|||
|
Noncurrent
liabilities
|
(5,786
|
)
|
(8,841
|
)
|
|||
|
$
|
(2,525
|
)
|
$
|
(6,736
|
)
|
||
Total
income tax payments, net of refunds, during fiscal years 2009, 2008 and
2007 were $7,888, $30,293 and $20,995, respectively.
At
December 31, 2009 and 2008, the Company had state net operating loss
carryforwards of $8,792 and $16,018, respectively that will expire between 2013
and 2025. The use of these state net operating losses is limited to the future
taxable income of separate legal entities. As a result, the valuation allowance
has been provided for certain state loss carryforwards. The valuation allowance
on these certain state loss carryforwards increased $3 during 2009 but decreased
$132 during 2008. Based on expectations of future taxable income,
management believes that it is more likely than not that the results of
operations will not generate sufficient taxable income to realize such net
operating loss benefits.
During
2009, we also established a valuation allowance of $180 on the state portion of
FASI’s net deferred tax assets. This valuation allowance was
established based on expectations of future taxable income as management
believes that it is more likely than not that the results of FASI operations
will not generate sufficient taxable income to realize the state benefit of the
net deferred tax assets.
F-24
FORWARD
AIR CORPORATION
NOTES
TO CONSOLIDATED FINANCIAL STATEMENTS (Continued)
DECEMBER
31, 2009
(In
thousands, except share and per share data)
|
7.
|
Income
Taxes (continued)
|
Income
Tax Contingencies
The
Company or one of its subsidiaries files income tax returns in the U.S. federal
jurisdiction, various states and Canada. With a few exceptions, the Company is
no longer subject to U.S. federal, state and local, or Canadian examinations by
tax authorities for years before 2004.
The
Company adopted its current policies for uncertain tax provisions on January 1,
2007. As a result of the implementation of these new guidelines, the Company
recognized a $1,397 increase in the liability for income tax contingencies,
including related interest and penalties, which net of federal benefit of $420
was accounted for as a reduction to the January 1, 2007 balance of retained
earnings. The total liability for income tax contingencies at January 1, 2007,
net of federal benefit was $977, which represented tax positions where the
realization of the ultimate benefit was uncertain and the disallowance of which
would affect the Company’s annual effective income tax rate.
During
the year ended December 31, 2008, the Company reached a settlement with a state
taxing authority regarding the taxability of two Company subsidiaries in the
related state for tax years 1996 through 2007. As a result of this
settlement, the Company agreed to pay the state $306, including interest and
penalties. Also, the Company further agreed that if the state was
successful in certain litigation efforts the Company would pay an additional
$213, including interest and penalties. Based on the settlement, the
Company maintained a contingent tax liability for $213, and reversed the excess
accrual. The Company had previously reserved $1,393 for this
contingency. As a result of the settlement during 2008 the Company
was able to reduce current state income tax expense by $611, interest expense by
$104 and penalties by $159.
A
reconciliation of the beginning and ending amount of unrecognized tax benefit is
as follows:
|
Liability
for
|
|||
|
Unrecognized
Tax
|
|||
|
Benefits
|
|||
|
Balance
at January 1, 2007
|
$ | 1,020 | |
|
Additions
for tax positions of current year
|
157 | ||
|
Reductions
for tax positions taken in prior year
|
(60 | ) | |
|
Balance
at December 31, 2007
|
$ | 1,117 | |
|
Additions
for tax positions of current year
|
126 | ||
|
Reductions
for settlement with state taxing authorities
|
(815 | ) | |
|
Balance
at December 31, 2008
|
$ | 428 | |
|
Additions
for tax positions of current year
|
71 | ||
|
Additions
for tax positions of prior years
|
143 | ||
|
Balance
at December 31, 2009
|
$ | 642 | |
Included
in the liability for unrecognized tax benefits at December 31, 2009 and December
31, 2008 are tax positions of $642 and $428, respectively, which represents tax
positions where the realization of the ultimate benefit is uncertain and the
disallowance of which would affect the Company’s annual effective income tax
rate.
Included
in the liability for unrecognized tax benefits at December 31, 2009 and December
31, 2008, are accrued penalties of $57. The liability for
unrecognized tax benefits at December 31, 2009 and December 31, 2008 also
included accrued interest of $99 and $68, respectively.
|
8.
|
Operating
Leases
|
The
Company leases certain facilities under noncancellable operating leases that
expire in various years through 2019. Certain leases may be renewed for periods
varying from one to ten years. In 2008 and 2007, in conjunction with
the acquisitions discussed in Note 2, the Company assumed several operating
leases for tractors, straight trucks and trailers with original lease terms
between three and six years. These leases expire in various years
through 2014 and may not be renewed beyond the original term.
Sublease
rental income, was $356, $615 and $452 in 2009, 2008 and 2007,
respectively. The Company expects to receive aggregate future minimum
rental payments under noncancellable subleases of approximately
$153.
F-25
FORWARD
AIR CORPORATION
NOTES
TO CONSOLIDATED FINANCIAL STATEMENTS (Continued)
DECEMBER
31, 2009
(In
thousands, except share and per share data)
|
8.
|
Operating
Leases (continued)
|
Future
minimum rental payments under noncancellable operating leases with initial or
remaining terms in excess of one year consisted of the following at December 31,
2009:
|
2010
|
$ | 18,961 |
|
2011
|
14,918 | |
|
2012
|
10,147 | |
|
2013
|
7,436 | |
|
2014
|
5,882 | |
|
Thereafter
|
11,845 | |
|
Total
|
$ | 69,189 |
|
9.
|
Commitments
and Contingencies
|
From time
to time, the Company is party to ordinary, routine litigation incidental to and
arising in the normal course of business. The Company does not
believe that any of these pending actions, individually or in the aggregate,
will have a material adverse effect on its financial condition, results of
operations or cash flows.
The
primary claims in the Company’s business relate to workers’ compensation,
property damage, vehicle liability and medical benefits. Most of the Company’s
insurance coverage provides for self-insurance levels with primary and excess
coverage which management believes is sufficient to adequately protect the
Company from catastrophic claims. In the opinion of management, adequate
provision has been made for all incurred claims up to the self-insured limits,
including provision for estimated claims incurred but not reported.
The
Company estimates its self-insurance loss exposure by evaluating the merits and
circumstances surrounding individual known claims and by performing hindsight
and actuarial analysis to determine an estimate of probable losses on claims
incurred but not reported. Such losses could be realized immediately
as the events underlying the claims have already occurred as of the balance
sheet dates.
Because
of the uncertainty of the ultimate resolution of outstanding claims, as well as
uncertainty regarding claims incurred but not reported, it is possible that
management’s provision for these losses could change materially in the near
term. However, no estimate can currently be made of the range of additional loss
that is at least reasonably possible.
As of
December 31, 2009, the Company had commitments to acquire 58 new tractors and
straight trucks for approximately $4,852 during 2010. This commitment
is expected to be funded by cash on hand and cash flows from
operations.
|
10.
|
Employee
Benefit Plan
|
The
Company has a retirement savings plan (the “401(k) Plan”). The 401(k) Plan is a
defined contribution plan whereby employees who have completed 90 days of
service, a minimum of 1,000 hours of service and are age 21 or older are
eligible to participate. The 401(k) Plan allows eligible employees to make
contributions of 2.0% to 80.0% of their annual compensation. Employer
contributions were made at 25.0% during 2009, 2008 and 2007 of the employee’s
contribution up to a maximum of 6.0% for all periods presented of total annual
compensation except where government limitations prohibit.
Employer
contributions vest 20.0% after two years of service and continue vesting 20.0%
per year until fully vested. The Company’s matching contributions expensed in
2009, 2008 and 2007 were approximately $519, $615 and $405,
respectively.
F-26
FORWARD
AIR CORPORATION
NOTES
TO CONSOLIDATED FINANCIAL STATEMENTS (Continued)
DECEMBER
31, 2009
(In
thousands, except share and per share data)
|
11.
|
Financial
Instruments
|
Off
Balance Sheet Risk
At
December 31, 2009, the Company had letters of credit outstanding totaling
$10,604 as required by its workers’ compensation and vehicle liability insurance
providers.
Concentrations
of Credit Risk
Financial
instruments that potentially subject the Company to significant concentrations
of credit risk consist principally of cash and trade accounts receivable. The
Company does not generally require collateral from its customers. Concentrations
of credit risk with respect to trade accounts receivable on a consolidated basis
are limited due to the large number of entities comprising the Company’s
customer base and their dispersion across many different
industries. However, while not significant to the Company on a
consolidated basis, three customers account for approximately 50.8% of FASI’s
2009 operating revenue. Receivables from these three customers
totaled approximately $3,572 at December 31, 2009.
In
February 2010, the Company notified one of FASI’s largest customers that it
would cease providing services beginning in the second quarter of
2010. During 2009 revenues from this customer were approximately
$9,050 and accounted for 12.5% of FASI’s operating revenue and 2.2% of the
Company’s consolidated operating revenue. The revenue associated with
this customer was low yielding and the impact on 2009 operating results was
minimal. Receivables from this customer were approximately $812 at
December 31, 2009.
Fair
Value of Financial Instruments
The
following methods and assumptions were used by the Company in estimating its
fair value disclosures for financial instruments:
Accounts
receivable and accounts payable: The carrying amounts reported in the balance
sheet for accounts receivable and accounts payable approximate their fair value
based on their short-term nature.
The
Company’s senior credit facility bears interest at LIBOR plus 0.6% to 0.9% based
upon covenants related to total indebtedness to earnings. However,
due to current economic conditions, the Company believes its borrowing rate to
be favorable to current market rates. Using interest rate quotes
currently available in the market, the Company estimated the fair value of its
senior credit facility, notes payable and capital lease obligations as
follows:
|
December
31, 2009
|
December
31, 2008
|
||||||||||
|
Carrying
|
Fair
|
Carrying
|
Fair
|
||||||||
|
Value
|
Value
|
Value
|
Value
|
||||||||
|
Senior
credit facility
|
$ | 50,000 | $ | 47,461 | $ | 50,000 | $ | 46,995 | |||
|
Notes
payable
|
21 | 22 | 168 | 174 | |||||||
|
Capital
lease obligations
|
3,067 | 3,305 | 4,469 | 4,669 | |||||||
The Company's fair value calculations for the above financial instruments are
classified within level 3 of the fair value hierarchy as defined in the FASB
Codification.
|
12.
|
Segment
Reporting
|
The Company operates in two reportable segments, based on differences in
services provided. Forward Air provides time-definite transportation
and logistics services to the deferred air freight market. FASI
provides pool distribution services primarily to regional and national
distributors and retailers.
The accounting policies of the segments are the same as those described in Note
1. Segment data includes intersegment revenues. Assets and costs of
the corporate headquarters are allocated to the segments based on
usage. The Company evaluates the performance of its segments based on
net income. The Company’s business is conducted principally in the
U.S. and Canada.
F-27
FORWARD
AIR CORPORATION
NOTES
TO CONSOLIDATED FINANCIAL STATEMENTS (Continued)
DECEMBER
31, 2009
(In
thousands, except share and per share data)
|
12.
|
Segment
Reporting (continued)
|
The following tables summarize segment information about net
income and assets used by the chief operating decision maker of the
Company in making decisions regarding allocation of assets and resources as of
and for the years ended December 31, 2009, 2008 and
2007.
|
Year
ended December 31, 2009
|
Forward
Air
|
FASI
|
Eliminations
|
Consolidated
|
||||||||||
|
External
revenues
|
$ | 345,388 | $ | 72,022 | $ | -- | $ | 417,410 | ||||||
|
Intersegment
revenues
|
920 | 446 | (1,366 | ) | -- | |||||||||
|
Depreciation
and amortization
|
16,096 | 3,626 | -- | 19,722 | ||||||||||
|
Share-based
compensation expense
|
6,461 | 293 | -- | 6,754 | ||||||||||
|
Impairment
of goodwill and other intangible assets
|
204 | 6,953 | -- | 7,157 | ||||||||||
|
Interest
expense
|
572 | 98 | -- | 670 | ||||||||||
|
Interest
income
|
66 | 6 | -- | 72 | ||||||||||
|
Income
tax expense (benefit)
|
11,137 | (2,990 | ) | -- | 8,147 | |||||||||
|
Net
income (loss)
|
15,234 | (5,432 | ) | -- | 9,802 | |||||||||
|
Total
assets
|
315,267 | 39,591 | (38,128 | ) | 316,730 | |||||||||
|
Capital
expenditures
|
17,961 | 2,886 | -- | 20,847 | ||||||||||
|
Year
ended December 31, 2008
|
Forward
Air
|
FASI
|
Eliminations
|
Consolidated
|
||||||||||
|
External
revenues
|
$ | 419,283 | $ | 55,153 | $ | -- | $ | 474,436 | ||||||
|
Intersegment
revenues
|
1,929 | 127 | (2,056 | ) | -- | |||||||||
|
Depreciation
and amortization
|
14,414 | 2,201 | -- | 16,615 | ||||||||||
|
Share-based
compensation expense
|
6,130 | 137 | -- | 6,267 | ||||||||||
|
Interest
expense
|
1,157 | 79 | -- | 1,236 | ||||||||||
|
Interest
income
|
344 | 10 | -- | 354 | ||||||||||
|
Income
tax expense (benefit)
|
26,996 | (127 | ) | -- | 26,869 | |||||||||
|
Net
income (loss)
|
42,910 | (368 | ) | -- | 42,542 | |||||||||
|
Total
assets
|
298,585 | 46,901 | (37,959 | ) | 307,527 | |||||||||
|
Capital
expenditures
|
23,337 | 3,362 | -- | 26,699 | ||||||||||
|
Year
ended December 31, 2007
|
Forward
Air
|
FASI
|
Eliminations
|
Consolidated
|
||||||||||
|
External
revenues
|
$ | 376,711 | $ | 16,026 | $ | -- | $ | 392,737 | ||||||
|
Intersegment
revenues
|
108 | -- | (108 | ) | -- | |||||||||
|
Depreciation
and amortization
|
10,372 | 452 | -- | 10,824 | ||||||||||
|
Share-based
compensation expense
|
3,698 | 12 | -- | 3,710 | ||||||||||
|
Interest
expense
|
452 | 39 | -- | 491 | ||||||||||
|
Interest
income
|
1,745 | 5 | -- | 1,750 | ||||||||||
|
Income
tax expense
|
26,498 | 890 | -- | 27,388 | ||||||||||
|
Net
income
|
43,531 | 1,394 | -- | 44,925 | ||||||||||
|
Total
assets
|
236,978 | 17,910 | (13,004 | ) | 241,884 | |||||||||
|
Capital
expenditures
|
42,986 | 4,040 | -- | 47,026 | ||||||||||
F-28
FORWARD
AIR CORPORATION
NOTES
TO CONSOLIDATED FINANCIAL STATEMENTS (Continued)
DECEMBER
31, 2009
(In
thousands, except share and per share data)
|
13.
|
Quarterly
Results of Operations (Unaudited)
|
The following
is a summary of the quarterly results of operations for the years ended December
31, 2009 and 2008:
|
2009
|
||||||||||||
|
March
31
|
June
30
|
September
30
|
December
31
|
|||||||||
|
Operating
revenue
|
$ | 96,616 | $ | 99,697 | $ | 103,079 | $ | 118,018 | ||||
|
Income
(loss) from operations
|
(5,026 | ) | 4,873 | 6,671 | 12,032 | |||||||
|
Net
income (loss)
|
(3,104 | ) | 2,844 | 3,779 | 6,283 | |||||||
|
Net
income (loss) per share:
|
||||||||||||
|
Basic
|
$ | (0.11 | ) | $ | 0.10 | $ | 0.13 | $ | 0.22 | |||
|
Diluted
|
$ | (0.11 | ) | $ | 0.10 | $ | 0.13 | $ | 0.22 | |||
|
2008
|
|||||||||||
|
March
31
|
June
30
|
September
30
|
December
31
|
||||||||
|
Operating
revenue
|
$ | 107,938 | $ | 121,563 | $ | 121,484 | $ | 123,451 | |||
|
Income
from operations
|
16,650 | 20,262 | 19,328 | 14,045 | |||||||
|
Net
income
|
10,008 | 12,102 | 12,097 | 8,335 | |||||||
|
Net
income per share:
|
|||||||||||
|
Basic
|
$ | 0.35 | $ | 0.42 | $ | 0.42 | $ | 0.29 | |||
|
Diluted
|
$ | 0.35 | $ | 0.42 | $ | 0.42 | $ | 0.29 | |||
During the fourth quarter of 2009, salaries, wages, and employee benefits were
increased by $1,050 as the Company increased incentive accruals to senior
management and key employees. Comparatively, during the fourth
quarter of 2008, salaries, wages and employee benefits were reduced by $1,482 as
the Company reduced incentive accruals for senior management and key
employees.
F-29
Schedule
II — Valuation and Qualifying Accounts
|
Col.
A
|
Col.
B
|
Col.
C
|
Col.
D
|
Col.
E
|
||||||||||||
|
Balance
at
|
Charged
to
|
Charged
to
|
Deductions
|
Balance
at
|
||||||||||||
|
Beginning
|
Costs
and
|
Other
Accounts
|
-Describe
|
End
of
|
||||||||||||
|
of
Period
|
Expenses
|
Describe
|
Period
|
|||||||||||||
|
Year
ended December 31, 2009
|
||||||||||||||||
|
Allowance
for doubtful accounts
|
$
|
1,675
|
$
|
(60
|
)
|
$
|
--
|
$
|
158
|
(2)
|
$
|
1,457
|
||||
|
Allowance
for revenue adjustments
|
(1)
|
856
|
2,390
|
--
|
2,784
|
(3)
|
462
|
|||||||||
|
2,531
|
2,330
|
--
|
2,942
|
1,919
|
||||||||||||
|
Year
ended December 31, 2008
|
||||||||||||||||
|
Allowance
for doubtful accounts
|
$
|
805
|
$
|
903
|
$
|
--
|
$
|
33
|
(2)
|
$
|
1,675
|
|||||
|
Allowance
for revenue adjustments
|
(1)
|
337
|
4,259
|
--
|
3,740
|
(3)
|
856
|
|||||||||
|
1,142
|
5,162
|
--
|
3,773
|
2,531
|
||||||||||||
|
Year
ended December 31, 2007
|
||||||||||||||||
|
Allowance
for doubtful accounts
|
$
|
624
|
$
|
(33
|
)
|
--
|
$
|
(214
|
)
|
(2)
|
$
|
805
|
||||
|
Allowance
for revenue adjustments
|
(1)
|
236
|
2,312
|
--
|
2,211
|
(3)
|
337
|
|||||||||
|
860
|
2,279
|
--
|
1,997
|
1,142
|
||||||||||||
|
(1)
Represents an allowance for adjustments to accounts receivable due to
disputed rates, accessorial charges and other aspects of previously billed
shipments.
|
|
(2)
Uncollectible accounts written off, net of
recoveries.
|
|
(3)
Adjustments to billed accounts
receivable.
|
S-1
|
EXHIBIT
INDEX
|
||
|
Exhibit
|
||
|
3.1
|
Restated
Charter of the registrant (incorporated herein by reference to Exhibit 3
to the registrant’s Current Report on Form 8-K filed with the Securities
and Exchange Commission on May 28, 1999 (File No.
0-22490))
|
|
|
3.2
|
Amended
and Restated Bylaws of the registrant (incorporated herein by reference to
Exhibit 3.1 to the registrant's Current Report on Form 8-K filed with the
Securities and Exchange Commission on July 6, 2009 (File No.
0-22490))
|
|
|
4.1
|
Form
of Forward Air Corporation Common Stock Certificate (incorporated herein
by reference to Exhibit 4.1 to the registrant’s Quarterly Report on Form
10-Q for the quarterly period ended September 30, 1998 filed with the
Securities and Exchange Commission on November 16, 1998 (File No.
0-22490))
|
|
|
10.1
|
*
|
Forward
Air Corporation 2005 Employee Stock Purchase Plan (incorporated herein by
reference to the registrant's Proxy Statement filed with the Securities
and Exchange Commission on April 20, 2005 (File No.
0-22490))
|
|
10.2
|
*
|
Amended
and Restated Stock Option and Incentive Plan (incorporated herein by
reference to the registrant’s Proxy Statement filed with the Securities
and Exchange Commission on April 3, 2008 (File No.
0-22490))
|
|
10.3
|
Lease
Agreement, dated as of June 1, 2006, between the Greeneville-Greene County
Airport Authority and the registrant (incorporated herein by reference to
Exhibit 10.3 to the registrant's Annaul Report on Form 10-K for the fiscal
year ended December 31, 2006 filed with the Securities and Exchange
Commission on February 27, 2007 (File No. 0-22490))
|
|
|
10.4
|
Air
Carrier Certificate, effective August 28, 2003 (incorporated herein by
reference to Exhibit 10.5 to the registrant's Annual Report on Form 10-K
for the fiscal year ended December 31, 2003 filed with the Securities and
Exchange Commission on March 11, 2004 (File No.
0-22490))
|
|
|
10.5
|
*
|
Amendment
to the Non-Employee Director Stock Plan (incorporated herein by reference
to Exhibit 10.7 to the registrant's Annual Report on Form 10-K for the
fiscal year ended December 31, 2003 filed with the Securities and Exchange
Commission on March 11, 2004 (File No. 0-22490))
|
|
10.6
|
Credit
Agreement dated October 10, 2007 among the registrant and certain of its
subsidiaries and Wachovia Bank, N.A. (incorporated herein by reference to
Exhibit 2.1 to the registrant's Current Report on Form 8-K filed with the
Securities and Exchange Commission on October 11, 2007 (File No.
0-22490))
|
|
|
10.7
|
*
|
Employment
Agreement dated October 30, 2007, between Forward Air Corporation and
Bruce A. Campbell, including Attachment B, Restrictive Covenants Agreement
entered into contemporaneously with and as part of the Employment
Agreement (incorporated herein by reference to Exhibit 99.1 to the
registrant's Current Report on Form 8-K filed with the Securities and
Exchange Commission on October 31, 2007 (File No.
0-22490))
|
|
10.8
|
*
|
Amendment
dated December 30, 2008 to Employee Agreement dated October 30, 2007,
between Forward Air Corporation and Bruce A. Campbell (incorporated herein
by reference to Exhibit 10.9 to the registrant’s Annual Report on Form
10-K for the fiscal year ended December 31, 2008 filed with the Securities
and Exchange Commission on February 26, 2009 (File No.
0-22490))
|
|
10.9
|
*
|
Second
Amendment dated February 24, 2009 to Employee Agreement dated October 30,
2007, between Forward Air Corporation and Bruce A. Campbell (incorporated
herein by reference to Exhibit 10.10 to the registrant’s Annual Report on
Form 10-K for the fiscal year ended December 31, 2008 filed with the
Securities and Exchange Commission on February 26, 2009 (File No.
0-22490))
|
|
10.10
|
*
|
Form
of Incentive Stock Option Agreement under the registrant's Amended and
Restated Stock Option and Incentive Plan, as amended and 1999 Stock Option
and Incentive Plan, as amended, for grants prior to February 12, 2006
(incorporated herein by reference to Exhibit 10.12 to the registrant's
Annual Report on Form 10-K/A for the fiscal year ended December 31, 2005
filed with the Securities and Exchange Commission on March 22, 2006 (File
No. 0-22490))
|
|
10.11
|
*
|
Form
of Non-Qualified Stock Option Agreement under the registrant's
Non-Employee Director Stock Option Plan, as amended, for grants prior to
February 12, 2006 (incorporated herein by reference to Exhibit 10.13 to
the registrant's Annual Report on Form 10-K/A for the fiscal year ended
December 31, 2005 filed with the Securities and Exchange Commission on
March 22, 2006 (File No. 0-22490))
|
|
10.12
|
*
|
Non-Qualified
Stock Option Agreement dated August 21, 2000 between the registrant and
Ray A. Mundy (incorporated herein by reference to Exhibit 10.1 to the
registrant's Quarterly Report on Form 10-Q for the quarterly period ended
September 30, 2000 filed with the Securities and Exchange Commission on
November 6, 2000 (File No. 0-22490))
|
|
10.13
|
Forward
Air Corporation Section 125 Plan (incorporated herein by reference to
Exhibit 10.18 to the registrant's Annual Report on Form 10-K for the
fiscal year ended December 31, 2001 filed with the Securities and Exchange
Commission on March 15, 2002 (File No. 0-22490))
|
|
|
10.14
|
*
|
Forward
Air Corporation Amended and Restated Stock Option and Incentive Plan
(incorporated herein by reference to Appendix A of the registrant's Proxy
Statement on Schedule 14A filed with the Securities and Exchange
Commission on April 3, 2008 (File No. 0-22490))
|
|
10.15
|
*
|
Form
of Incentive Stock Option Agreement under the registrant's Amended and
Restated Stock Option and Incentive Plan
|
|
10.16
|
*
|
Form
of Option Restriction Agreement between the registrant and each executive
officer regarding certain restrictions on transferability of accelerated
stock options granted under the registrant's 1999 Stock Option and
Incentive Plan, as amended (incorporated herein by reference to Exhibit
10.18 to the registrant's Annual Report on Form 10-K/A for the fiscal year
ended December 31, 2005 filed with the Securities and Exchange Commission
on March 22, 2006 (File No. 0-22490))
|
|
10.17
|
*
|
Form
of Restricted Stock Agreement under the registrant's 1999 Stock Option and
Incentive Plan, as amended, granted on or after February 12, 2006
(incorporated herein by reference to Exhibit 10.19 to the registrant's
Annual Report on Form 10-K/A for the fiscal year ended December 31, 2005
filed with the Securities and Exchange Commission on March 22, 2006 (File
No. 0-22490))
|
|
10.18
|
*
|
2006
Non-Employee Director Stock Plan (incorporated herein by reference to
Appendix A of the registrant's Proxy Statement filed with the Securities
and Exchange Commission on April 24, 2006 (File No.
0-22490))
|
|
10.19
|
*
|
Form
of Non-Employee Director Restricted Stock Agreement for an award of
restricted stock under the registrant's 2006 Non-Employee Director Stock
Plan (incorporated herein by reference to Exhibit 99.2 to the registrant's
Registration Statement on Form S-8 filed with the Securities and Exchange
Commission on May 19, 2006 (File No. 0-22490))
|
|
10.20
|
*
|
Amended
and Restated Non-Employee Director Stock Plan (incorporated herein by
reference to Appendix B of the registrant's Proxy Statement filed with the
Securities and Exchange Commission on April 19, 2007 (File No.
0-22490))
|
|
10.21
|
*
|
Amended
and Restated Non-Employee Director Stock Plan, as further amended and
restated on December 17, 2008 (incorporated herein by reference
to Exhibit 10.25 to the registrant’s Annual Report on Form 10-K for the
fiscal year ended December 31, 2008 filed with the Securities and Exchange
Commission on February 26, 2009 (File No. 0-22490))
|
|
10.22
|
*
|
Schedule
of Non-Employee Director Compensation effective May 24, 2006 (incorporated
herein by reference to the registrant's Current Report on Form 8-K filed
with the Securities and Exchange Commission on May 23, 2006 (File No.
0-22490))
|
|
10.23
|
Agreement
of Purchase and Sale, dated as of July 10, 2006, among AMB Property II,
L.P., Headlands Realty Corporation and Forward Air, Inc. (incorporated
herein by reference to Exhibit 10.2 to the registrant's Quarterly Report
on Form 10-Q for the quarterly period ended June 30, 2006 filed with the
Securities and Exchange Commission on August 4, 2006 (File No.
0-22490))
|
|
|
10.24
|
Agreement
of Purchase and Sale, dated as of September 14, 2006, by and between
Headlands Realty Corporation and Forward Air, Inc. (incorporated herein by
reference to Exhibit 10.2 to the registrant's Quarterly Report on Form
10-Q for the quarterly period ended September 30, 2006 filed with the
Securities and Exchange Commission on November 3, 2006 (File No.
0-22490))
|
|
|
10.25
|
Asset
Purchase Agreement dated November 26, 2007 by and among Forward Air
Corporation, Black Hawk Freight Services, Inc. and the stockholders of
Black Hawk Freight Services, Inc. (incorporated herein by reference to
Exhibit 2.1 to the registrant's Current Report on Form 8-K filed with the
Securities and Exchange Commission on November 30, 2007 (File No.
0-22490))
|
|
|
14.1
|
Code
of Ethics (incorporated herein by reference to Exhibit 14.1 to the
registrant's Annual Report of Form 10-K for the fiscal year ended December
31, 2003 filed with the Securities and Exchange Commission on March 11,
2004 (File No. 0-22490))
|
|
|
21.1
|
Subsidiaries
of the registrant
|
|
|
23.1
|
Consent
of Ernst & Young LLP, Independent Registered Public Accounting
Firm
|
|
|
31.1
|
Certification
of Chief Executive Officer Pursuant to Exchange Act Rule 13a-14(a) (17 CFR
240.13a-14(a))
|
|
|
31.2
|
Certification
of Chief Financial Officer Pursuant to Exchange Act Rule 13a-14(a) (17 CFR
240.13a-14(a))
|
|
|
32.1
|
Certification
of Chief Executive Officer Pursuant to 18 U.S.C. Section 1350, as Adopted
Pursuant to Section 906 of the Sarbanes-Oxley Act of
2002
|
|
|
32.2
|
Certification
of Chief Financial Officer Pursuant to 18 U.S.C. Section 1350, as Adopted
Pursuant to Section 906 of the Sarbanes-Oxley Act of
2002
|
|
*Denotes
a management contract or compensatory plan or arrangement.