Attached files
| file | filename |
|---|---|
| EX-31.01 - EXHIBIT 31.01 - FORMFACTOR INC | a2196665zex-31_01.htm |
| EX-21.01 - EXHIBIT 21.01 - FORMFACTOR INC | a2196665zex-21_01.htm |
| EX-10.06 - EXHIBIT 10.06 - FORMFACTOR INC | a2196665zex-10_06.htm |
| EX-31.02 - EXHIBIT 31.02 - FORMFACTOR INC | a2196665zex-31_02.htm |
| EX-32.01 - EXHIBIT 32.01 - FORMFACTOR INC | a2196665zex-32_01.htm |
| EX-23.01 - EXHIBIT 23.01 - FORMFACTOR INC | a2196665zex-23_01.htm |
UNITED STATES
SECURITIES AND EXCHANGE COMMISSION
Washington, D.C. 20549
FORM 10-K
| (Mark One) | ||
ý |
ANNUAL REPORT PURSUANT TO SECTION 13 OR 15(d) OF THE SECURITIES EXCHANGE ACT OF 1934 |
|
For the fiscal year ended December 26, 2009 |
||
Or |
||
o |
TRANSITION REPORT PURSUANT TO SECTION 13 OR 15(d) OF THE SECURITIES EXCHANGE ACT OF 1934 |
|
For the transition period from to |
||
Commission file number: 000-50307
FormFactor, Inc.
(Exact name of registrant as specified in its charter)
| Delaware (State or other jurisdiction of incorporation or organization) |
13-3711155 (I.R.S. Employer Identification No.) |
7005 Southfront Road, Livermore, California 94551
(Address of principal executive offices, including zip code)
(925) 290-4000
(Registrant's telephone number, including area code)
Securities registered pursuant to Section 12(b) of the Act: Common Stock
Name of each exchange on which registered: NASDAQ Global Market
Securities registered pursuant to Section 12(g) of the Act: None
Indicate by check mark if the registrant is a well-known seasoned issuer, as defined in Rule 405 of the Securities Act. Yes o No ý
Indicate by check mark if the registrant is not required to file reports pursuant to Section 13 or Section 15(d) of the Exchange Act. Yes o No ý
Indicate by check mark whether the registrant: (1) has filed all reports required to be filed by Section 13 or 15(d) of the Exchange Act during the preceding 12 months (or for such shorter period that the registrant was required to file such reports), and (2) has been subject to such filing requirements for the past 90 days. Yes ý No o
Indicate by check mark whether the registrant submitted electronically and posted on its corporate Web site, if any, every Interactive Data File required to be submitted and posted pursuant to Rule 405 of the Regulation S-T during the preceding 12 months (or for such shorter period that the registrant was required to submit and post such files). Yes o No o
Indicate by check mark if disclosure of delinquent filers pursuant to Item 405 of Regulation S-K is not contained herein, and will not be contained, to the best of registrant's knowledge, in definitive proxy or information statements incorporated by reference in Part III of this Form 10-K or any amendment to this Form 10-K ý
Indicate by check mark whether the registrant is a large accelerated filer, an accelerated filer, a non-accelerated filer or a smaller reporting company. See the definitions of "large accelerated filer," "accelerated filer" and "smaller reporting company" in Rule 12b-2 of the Exchange Act:
| Large accelerated filer o | Accelerated filer ý | Non-accelerated filer o (Do not check if a smaller reporting company) |
Smaller reporting company o |
Indicate by check mark whether the registrant is a shell company (as defined in Rule 12b-2 of the Exchange Act). Yes o No ý
Aggregate market value of registrant's common stock held by non-affiliates of the registrant, based upon the closing price of a share of the registrant's common stock on June 26, 2009 as reported by NASDAQ Global Market on that date: $492,206,167. Shares of the registrant's common stock held by each officer, director and person who owns 5% or more of the outstanding common stock of the registrant have been excluded in that such persons may be deemed to be affiliates. This determination of affiliate status is not necessarily a conclusive determination for other purposes.
The number of shares of the registrant's common stock, par value $0.001 per share, outstanding as of February 16, 2010 was 49,934,074 shares.
DOCUMENTS INCORPORATED BY REFERENCE
Portions of the registrant's definitive Proxy Statement for the 2010 Annual Meeting of Stockholders, which will be filed within 120 days of the end of the registrant's fiscal year ended December 26, 2009, are incorporated by reference in Part III hereof. Except with respect to information specifically incorporated by reference in this Form 10-K, the Proxy Statement is not deemed to be filed as a part of this Form 10-K.
FORMFACTOR, INC.
Form 10-K for the Fiscal Year Ended December 26, 2009
Index
FormFactor, the FormFactor logo and its product and technology names, including ATRE, DC-Boost, Harmony, MicroSpring, MicroForce, MicroLign, RapidSoak, SmartMatrix, TouchMatrix, OneTouch, TRE and TrueScale, are trademarks or registered trademarks of FormFactor in the United States and other countries. All other trademarks, trade names or service marks appearing in this Annual Report on Form 10-K is the property of their respective owners.
Throughout this Annual Report on Form 10-K, we refer to FormFactor, Inc. and its consolidated subsidiaries as "FormFactor," "we," "us," and "our". Our fiscal years end on the last Saturday in December. Our last three fiscal years ended on December 29, 2007, December 27, 2008 and December 26, 2009.
2
NOTE REGARDING FORWARD-LOOKING STATEMENTS
This Annual Report on Form 10-K contains forward-looking statements within the meaning of the Securities Exchange Act of 1934 and the Securities Act of 1933, which are subject to risks and uncertainties. The forward-looking statements include statements concerning, among other things, our business strategy (including anticipated trends and developments in, and management plans for, our business and the markets in which we operate), financial results, operating results, revenues, gross margin, operating expenses, products, projected costs and capital expenditures, research and development programs, sales and marketing initiatives and competition. In some cases, you can identify these statements by forward-looking words, such as "may," "might," "will," "could," "should," "expect," "plan," "anticipate," "believe," "estimate," "predict," "intend" and "continue," the negative or plural of these words and other comparable terminology. The forward-looking statements are based on information available to us as of the filing date of this Annual Report on Form 10-K and our current expectations about future events, which are inherently subject to change and involve risks and uncertainties. You should not place undue reliance on these forward-looking statements. We undertake no obligation to update any of these statements for any reason. Actual events or results may differ materially from those expressed or implied by these statements due to various factors, including but not limited to the matters discussed in the section entitled "Item 1A: Risk Factors" and elsewhere in this Form 10-K. You should carefully consider the numerous risks and uncertainties described in such sections.
FormFactor, Inc. was incorporated in Delaware in 1993. We design, develop, manufacture, sell and support precision, high performance advanced semiconductor wafer probe card products and solutions. Semiconductor manufacturers use our wafer probe cards to perform wafer sort and test on the semiconductor die, or chips, on the whole semiconductor wafer, which is prior to singulation of the wafer into individual separate chips. We work closely with our customers on product design, as each wafer probe card is a custom product that is specific to the chip and wafer designs of the customer. During wafer sort and test, a wafer probe card is mounted in a prober, which in turn is connected to a semiconductor tester. The wafer probe card is used as an interface to connect electronically with and test individual chips on a wafer. Our wafer probe cards are used by our customers in the front end of the semiconductor manufacturing process, as are our parametric or in-line probe cards. We introduced our first wafer probe card based on our MicroSpring® interconnect technology in 1995. We offer products and solutions that are custom designed for semiconductor manufacturers' unique wafer designs and enable them to reduce their overall cost of test.
The oversupply of memory devices and a semiconductor industry downturn coupled with the overall global economic and financial crisis has had a significant impact on global semiconductor device manufacturing, and consequently, our company. In fiscal 2009, we saw our markets adversely affected by the continuing global economic and semiconductor industry downturns, which resulted in a significant decrease in demand and continuing market challenges for our advanced wafer probe cards. Overall, our revenue declined year-over-year in each of the major semiconductor device segments we address—Dynamic Random Access Memory, or DRAM, NAND and NOR Flash and System on Chip, or SoC. We experienced significant reductions in our revenues due to a number of factors including the reduced demand for various semiconductor devices and end products incorporating those devices, and device manufacturers' conservation of cash by cutting production, postponing the implementation of tooling cycles and delaying the ramp of new technology nodes. In 2009, we continued our efforts to improve our company's operating efficiency and to better position our company for expanding our addressable market opportunities. We resized the organization to better align operations with the business environment, and improved our manufacturing and product development capabilities, which
3
resulted in a more flexible cost structure. We continued to implement our global regionalization strategy as we moved more resources closer to our customers to improve our ability to meet local market requirements. We strengthened our design, service and support capabilities and operations in Japan and South Korea. We also moved to a new campus facility in Singapore and initiated build-out of manufacturing operations, where we plan to house a significant portion of our front-end manufacturing.
Products
Our products are based on our proprietary technologies, including our MicroSpring interconnect technology and design tools. Our MicroSpring interconnect technology, which includes resilient spring-like contact elements, enables us to produce wafer probe cards for applications that require reliability, speed, precision and signal integrity. We manufacture our MicroSpring contact elements through precision micro-machining and scalable semiconductor-like wafer fabrication processes. Our MicroSpring contacts are springs that optimize the relative amounts of force on, and across, a bond pad during the test process and maintain their shape and position over a range of compression. These characteristics allow us to achieve reliable, electrical contact on either clean or oxidized surfaces, including bond pads on a wafer. MicroSpring contacts enable our wafer probe cards to make hundreds of thousands of touchdowns with minimal maintenance for many device applications. The MicroSpring contact can be attached to many surfaces, or substrates, including printed circuit boards, silicon wafers, ceramics and various metalized surfaces.
Since its original conception, the MicroSpring contact has evolved into a library of spring shapes and technologies. Our designers use this library to design an optimized custom wafer probe card for each customer-unique application. Since developing this fundamental technology, we have broadened and refined it to respond to the increasing requirements of testing smaller, faster and more complex semiconductor devices. We continue to invest in research and development activities around our interconnect technologies, including our micro-electro-mechanical systems, or MEMS, technology, as our MicroSpring contacts have scaled in size with the evolution of semiconductors.
Our MicroSpring contacts include geometrically precise tip structures. These tip structures are the part of our wafer probe cards that come into physical contact with the devices being tested, and are manufactured using proprietary micro-machining semiconductor-like processes. These tip structures enable precise contact with small bond pad sizes and pitches. Our technology allows for the design of specific geometries of the contact tip that deliver precise and predictable electrical contact for a customer's particular application.
Our wafer probe cards are custom products that are designed to order for our customers' unique wafer designs. For high parallelism memory test applications, our products require large area contact array sizes because they must accommodate tens of thousands of simultaneous contacts. Our current technology enables probe cards for certain applications to be populated with over 50,000 contacts. This requirement poses fundamental challenges that our technology addresses, including the planarity of the array, the force needed to make contact and the need to touch all bond pads with equal accuracy. We have developed wafer probe cards that use array sizes ranging from 50 mm × 50 mm up to array sizes suitable for contacting all die on a 300 mm wafer simultaneously, in combination with complex multi-layer printed circuit boards that we have designed.
We have invested and intend to continue to invest considerable resources in our wafer probe card design tools and processes. These tools and processes enable automated routing and trace length adjustment within our printed circuit boards and greatly enhance our ability to rapidly design and lay out complex printed circuit board structures. Our proprietary design tools also enable us to design wafer probe cards particularly suited for testing today's low voltage, high power chips, which require
4
superior power supply performance. Our MicroSpring interconnect technology is used to provide a very low inductance, low resistance electrical path between the power source and the chip under test.
Because our customers typically use our wafer probe cards in a wide range of operating temperatures, as opposed to conducting wafer probe tests at one predetermined temperature, we have designed complex thermal compensation characteristics into our products. We select our wafer probe card materials after careful consideration of the potential range of test operating temperatures and design our wafer probe cards to provide for a precise match with the thermal expansion characteristics of the wafer under test. As a result, many of our wafer probe cards are able to accurately probe over a large range of operating temperatures. This feature enables our customers to use the same wafer probe card for both low and high temperature testing without a loss of performance. In addition, for those testing situations that require positional accuracy at a specific temperature, we have designed wafer probe cards optimized for testing at such temperatures.
We have many spring shapes, different geometrically-precise tip structures, various array sizes and diverse printed circuit board layouts that enable a wide variety of solutions for our customers. Our designers select the most appropriate of these elements, or modify or improve upon such existing elements, and integrate them with our other technologies to deliver a custom solution optimized for the customer's requirements.
Our technology investment yielded several advances in fiscal 2009. In February, we announced a new technology, the Harmony OneTouch™ ATC probe solution. The Harmony OneTouch is an advanced full-wafer contact probe card for NAND and NOR Flash memory 300-mm wafer testing. Leveraging many of the architectural enhancements recently introduced with our Harmony eXP™ platform for DRAM wafer testing, the Harmony OneTouch ATC card enables Flash device manufacturers to lower their test costs on their leading-edge Flash products through increased wafer test productivity and improved test yields. The Harmony OneTouch ATC card supports the company's RapidSoak™ technology, which was introduced in 2008 and leverages advanced temperature control to reduce the time required for the probe card to achieve thermal equilibrium by as much as 50 percent—resulting in increased test cell productivity and uptime.
In October 2009 we introduced our next-generation full-wafer contact probe card for NAND Flash devices called the TouchMatrix™ wafer probe card. The TouchMatrix solution is built on a new, proprietary architecture that leverages FormFactor's MicroSpring® MEMS contact technology and offers chip manufacturers superior product performance with a substantially reduced production lead time. The TouchMatrix probe card is specifically designed for today's cost sensitive test flows and enables testing of Flash devices down to sub 32-nm process nodes, including those integrating three-bit and four-bit memory cell architectures. The TouchMatrix solution provides superior electrical and probe contact performance, and features a new architecture that improves manufacturing efficiency. Like its Harmony™ platform predecessor, the TouchMatrix probe card is designed for improved thermal performance that enables it to quickly reach and maintain test temperatures—improving throughput and extending uptime. The card can also be enhanced with FormFactor's patented RapidSoak™ technology to achieve near-zero soak time and superior scrub performance.
In December 2009, FormFactor introduced new products for DRAM and SoC device testing. The SmartMatrix™100 probe solution is a 300-mm full-wafer contact platform that lowers test cost per die for leading-edge mobile and commodity DRAM test applications and extends the life of the tester cell. Like FormFactor's recently introduced TouchMatrix™ probe card for advanced NAND Flash testing, the new SmartMatrix 100 probe card features an innovative architecture that significantly improves manufacturing efficiency and reduces probe card delivery lead time. These capabilities are particularly important for DRAM manufacturers, who face rapid fab cycle times, as well as steep and dynamic ramp plans.
5
SmartMatrix 100 probe cards are also designed for improved thermal performance, which allow the cards to quickly reach test temperatures. This improved thermal performance enables dual-temperature operation and ensures thermal stability during wafer and lot changes, making the new platform extremely robust in demanding performance environments. SmartMatrix 100 is also compatible with FormFactor's advanced TRE™ technology, which enables more efficient use of tester channels on test equipment to increase the total number of devices that can be tested simultaneously. With this capability, DRAM manufacturers and test service providers can significantly increase test cell throughput on new test equipment, extend the life of their existing test equipment, and reduce their overall cost of test.
Also in December 2009, FormFactor introduced a new MEMS probing contact technology for its advanced probe cards for wire bond logic and SoC wafer testing. The new TrueScale Multi-Tier™ contact technology will support fully populated, staggered pad layouts down to 25/50 microns in size, which are utilized in leading-edge wire bond logic and SoC chip designs at 45-nm and below nodes. The new contact technology provides the ability to probe higher pad densities with reliable x/y positioning, which enables semiconductor manufacturers to increase the pad count per die and support continued die shrinks. In addition, the scalable contacts enable the production of higher pin-count probe cards that can support x2 through x16 full logic sort testing and even higher levels of test parallelism (x64, x128, x256) for embedded memory test applications, allowing semiconductor manufacturers to increase their test throughput with their existing capital equipment.
Customers
Our customers include manufacturers in the DRAM, Flash and SoC markets. Our customers use our wafer probe cards to test DRAM chips including DDR, DDR2, DDR3, SDRAM, PSRAM, mobile DRAM, and Graphic DRAM, NOR and NAND flash memory chips, serial data devices, chipsets, microprocessors and microcontrollers.
One customer accounted for 49.1% of our revenues in fiscal 2009, three customers accounted for 51.3% of our revenues in fiscal 2008, and four customers accounted for 63.0% of our revenues in fiscal 2007, as follows:
| |
Fiscal 2009 |
Fiscal 2008 |
Fiscal 2007 |
|||||||
|---|---|---|---|---|---|---|---|---|---|---|
Elpida(1) |
49.1 | % | 27.7 | % | 26.2 | % | ||||
Intel Corporation |
* | 12.9 | 10.0 | |||||||
Spansion |
* | 10.7 | 14.4 | |||||||
Powerchip |
* | * | 12.4 | |||||||
- (1)
- Includes
Elpida Memory and its consolidated subsidiaries, Rexchip and Tera Probe for fiscal 2009
- *
- Less than 10% of revenues.
Information concerning revenue by geographic region and by country based upon ship to location appears under "Item 7: Management's Discussion and Analysis of Financial Condition and Results of Operations—Revenues—Revenue by Geographic Region" and Note 13—Operating Segment and Geographic Information of the Notes to our Consolidated Financial Statements, which are included elsewhere in this 10-K.
Backlog
Our backlog was $43.6 million at December 26, 2009 compared to $40.9 million at December 27, 2008. We manufacture our wafer probe cards based on order backlog and customer commitments. In
6
addition, due to our customers' short delivery time requirements, we at times produce our products in anticipation of receiving orders for our products. Backlog includes only orders for which written authorizations have been accepted and shipment dates within 12 months have been assigned. In addition, backlog includes service revenue for existing product service agreements to be earned within the next 12 months. Customers may delay delivery of products or cancel orders prior to shipment, subject to possible cancellation penalties. Due to possible changes in delivery schedules and cancellations of orders, our backlog on any particular date is not necessarily indicative of actual sales for any succeeding period. Delays in delivery schedules and/or a reduction in backlog during any particular period could have a material adverse effect on our business and results of operations.
Manufacturing
Our wafer probe cards are custom products that we design to order for our customers' unique chip and wafer designs. We manufacture our products at our facility located in Livermore, California, United States, and we are ramping parts of our manufacturing processes in regions within Asia as part of our global regionalization strategy.
In Singapore, we are building-out manufacturing operations to provide the capability for completing a significant portion of our front-end manufacturing operations. This build-out is part of our global regionalization strategy to move operations closer to our customers, and in combination with our assembly and test, service and support capabilities in South Korea and Japan, is designed to enhance our customer relationships and improve our responsiveness to our customers' requirements. In 2009, we also completed the move of certain of our product design capacity to Asia and now have design expertise in Singapore, Japan and South Korea.
Our proprietary manufacturing processes include wirebonding, photolithography, plating and metallurgical processes, dry and electro-deposition, and complex interconnection system design. Certain steps in our manufacturing process are performed in a Class 100 clean room environment. We also expend considerable resources on the assembly and test of our wafer probe cards and on quality control.
We depend upon suppliers for some critical components of our manufacturing processes, including ceramic substrates and complex printed circuit boards, and for materials used in our manufacturing processes. Some of these components and materials are supplied by a single vendor. Generally, we rely on purchase orders rather than long-term contracts with our suppliers which subjects us to risks including price increases and component shortages. We continue to evaluate alternative sources of supply for these components and for materials.
We maintain repair and service capability in Livermore, California, United States. We also provide repair and service capabilities in our service centers in Gyeonggi-do, South Korea; Dresden, Germany; Yokohama City, Japan; Vimercate, Italy; Jubei City, Taiwan, and Singapore.
Research, Development and Engineering
The semiconductor industry is subject to rapid technological change and new product introductions and enhancements. We believe that our continued commitment to research and development and our timely introduction of new and enhanced wafer probe test solutions and other technologies related to our MicroSpring interconnect technology are integral to maintaining our competitive position. We continue to invest considerable time and resources in creating structured processes for undertaking, tracking and completing our development projects, and plan to implement those developments into new product or technology offerings. We continue to allocate significant resources to these efforts and to use automation and information technology to provide additional efficiencies in our research and development activities.
7
Research and development expenses were $57.5 million for fiscal 2009, $65.5 million for fiscal 2008, and $61.0 million for fiscal 2007.
Our research and development activities, including our product engineering activities, are directed by individuals with significant expertise and industry experience.
Sales and Marketing
We sell our products utilizing a proprietary sales model that emphasizes the customer's total cost of ownership as it relates to the costs of test. With this sales model, we strive to demonstrate how test costs can be reduced by simulating the customer's test floor environment, including testers and probers, utilizing our products and comparing the overall cost of test to that of conventional wafer probe cards.
We sell our products worldwide primarily through a global direct sales force, a distributor and four independent sales representatives. In Europe, and in the Asia Pacific, we sell our products through our direct sales force. In Europe, our local sales team works with two independent sales representatives. In Japan, our direct sales force is supplemented by an independent sales representative for our SoC products. In the People's Republic of China, we sell through Spirox Corporation, our regional distributor. We also have the ability to sell our products directly to customers in the People's Republic of China.
Our sales and marketing representatives located in Livermore, California, Dallas, Texas, United States, Munich, Germany, Milan, Italy, Jubei City, Taiwan and Tokyo, Japan, Gyeonggi-do, South Korea and Singapore work closely with customers to understand their businesses, anticipate trends and define products that will provide significant technical and economic advantages to our customers.
We utilize a highly skilled team of field application engineers that support our customers as they integrate our products into their manufacturing processes. Through these customer relationships, we develop a close understanding of customer and product requirements, thereby accelerating our customers' production ramps.
Environmental Matters
We are subject to U.S. federal, state and local, and foreign governmental laws and regulations relating to the protection of the environment, including those governing the discharge of pollutants into the air and water, the management and disposal of hazardous substances and wastes, the clean-up of contaminated sites and the maintenance of a safe workplace. We believe that we comply in all material respects with the environmental laws and regulations that apply to us, including those of the California Department of Toxic Substances Control, the Bay Area Air Quality Management District, the City of Livermore Water Resources Division and the California Division of Occupational Safety and Health. We received two notices of violation in fiscal 2007, one notice of violation in the first quarter of fiscal 2008 and one notice of violation in the first quarter of fiscal 2009 from the City of Livermore regarding violation of certain applicable waste water discharge limits. For each notice received, we promptly investigated the violation, took what we believed to be appropriate steps to address the cause of the violation, and implemented corrective measures to prevent a recurrence. No provision has been made for loss from environmental remediation liabilities associated with our facilities because we believe that it is not probable that a liability has been incurred as of December 26, 2009.
While we believe that we are in compliance in all material respects with the environmental laws and regulations that apply to us, in the future, we may receive additional environmental violation notices, and if received, final resolution of the violations identified by these notices could harm our operations, which may adversely impact our operating results and cash flows. New laws and regulations, stricter enforcement of existing laws and regulations, the discovery of previously unknown contamination at our or others' sites or the imposition of new cleanup requirements could also harm our operations, thereby adversely impacting our operating results and cash flows.
8
Competition
The highly competitive wafer probe card market is comprised of many domestic and foreign companies, and has historically been fragmented with many local suppliers servicing individual customers. Our current and potential competitors in the wafer probe card market include Advantest Corporation, Aehr Test Systems, AMST Co., Ltd., Cascade Microtech, Inc., Feinmetall GmbH, Korea Instrument Co., Ltd., Japan Electronic Materials Corporation, SV Probe, Inc., Micronics Japan Co., Ltd., Microfriend Inc., Technoprobe Asia Pte. Ltd., MicroProbe, Inc., TCS Memsys Corp., formerly Phicom Corporation, Tokyo Cathode Laboratory Co., Ltd., Tokyo Electron Ltd., TSE Co., Ltd., Verigy, Ltd. and Wentworth Laboratories, Inc., among others. In addition to the ability to address wafer probe card performance issues, the primary competitive factors in the industry in which we compete include product quality and reliability, price, total cost of ownership, lead times, the ability to provide prompt and effective customer service, field applications support and timeliness of delivery.
Some of our competitors are also suppliers of other types of test equipment or other semiconductor equipment, or offer both advanced wafer probe cards and needle probe cards, and may have greater financial and other resources than we do. We expect that our competitors will enhance their current wafer probe products and that they may introduce new products that will be competitive with our wafer probe cards. In addition, it is possible that new competitors, including test equipment manufacturers, may offer new technologies that reduce the value of our wafer probe cards.
Additionally, semiconductor manufacturers may implement chip designs that include built-in self-test capabilities or similar functions or methodologies that increase test throughput and eliminate some or all of our current competitive advantages. Our ability to compete favorably may also be adversely affected by (1) low volume orders that do not meet our present minimum volume requirements, (2) very short cycle time requirements which may be difficult for us to meet, (3) long-standing relationships between our competitors and certain semiconductor manufacturers, and (4) semiconductor manufacturer test strategies that include low performance semiconductor testers.
Intellectual Property
Our success depends in part upon our ability to continue to innovate and invest in research and development to meet the semiconductor testing requirements of our customers, to maintain and protect our proprietary technology and to conduct our business without infringing the proprietary rights of others. We rely on a combination of patents, trade secrets, trademarks and contractual restrictions on disclosure to protect our intellectual property rights.
As of December 26, 2009, we had 684 issued patents, of which 354 are United States patents and 330 are foreign patents. The expiration dates of these patents range from 2010 to 2028. Our issued patents cover many of the features of our interconnect technology, as well as some of our inventions related to wafer probe cards and testing, wafer-level packaging and test, sockets and assemblies and chips. In addition, as of December 26, 2009, we had 622 patent applications pending worldwide, including 163 United States applications, 444 foreign national or regional stage applications and 15 Patent Cooperation Treaty applications. We cannot provide any assurance that our current patent applications, or any future patent applications that we may file, will result in a patent being issued with the scope of the claims we seek, or at all, or whether any patents that we may obtain will not be challenged or invalidated. Even if additional patents are issued, our patents might not provide sufficiently broad coverage to protect our proprietary rights or to avoid a third party claim against one or more of our products or technologies.
We have both registered and unregistered trademarks, including FormFactor, ATRE, DC-Boost, Harmony, MicroSpring, MicroForce, MicroLign, RapidSoak, SmartMatrix, TouchMatrix, OneTouch, TRE, TrueScale and the FormFactor logo.
9
We routinely require our employees, customers, suppliers and potential business partners to enter into confidentiality and non-disclosure agreements before we disclose to them any sensitive or proprietary information regarding our products, technology or business plans. We require our employees to assign to us proprietary information, inventions and other intellectual property they create, modify or improve.
Legal protections afford only limited protection for our proprietary rights. We also may not be successful in our efforts to enforce our proprietary rights. To date, for example, we have been unsuccessful in our efforts to enforce certain of our patent rights in South Korea, and through the U.S. International Trade Commission, or ITC. The ITC initiated an investigation into certain activities of two companies based on a complaint we filed in late 2007, but did not find a violation of Section 337 of the U.S. Tariff Act of 1930 and terminated its investigation in November 2009 without issuing an exclusionary order against any products. Notwithstanding our efforts to protect our proprietary rights, unauthorized parties may attempt to copy aspects of our products or to obtain and use information that we regard as proprietary. From time to time, we have become aware of situations where others are or may be infringing on our proprietary rights. We evaluate these situations as they arise and elect to take actions against these companies as we deem appropriate. Others might independently develop similar or competing technologies or methods, design around our patents, or attempt to manufacture and sell infringing products in countries that do not strongly enforce intellectual property rights or hold invalid our intellectual property rights. In addition, leading companies in the semiconductor industry have extensive patent portfolios and other intellectual property with respect to semiconductor technology. Actions have been filed in the U.S. Patent and Trademark Office and patent offices in other countries, challenging the validity of certain of our patents. In the future, we might receive claims that we are infringing intellectual property rights of others or that our patents or other intellectual property rights are invalid. We have received in the past, and may receive in the future, communications from third parties inquiring about our interest in licensing certain of their intellectual property or more generally identifying intellectual property that may be of interest to us.
We have invested significant time and resources in our technology, and as a part of our ongoing efforts to protect the intellectual property embodied in our proprietary technologies, including our MicroSpring interconnect technology and design processes, we may pursue actions to enforce our intellectual property rights against infringing third parties.
For a description of the material patent-related proceedings in which we are involved, see "Item 3: Legal Proceedings".
Employees
As of December 26, 2009, we had 808 regular full-time employees, including 181 in research and development, 114 in sales and marketing, 93 in general and administrative functions, and 420 in operations. By region, 602 of our employees were in North America, 65 in Japan, 37 in South Korea, 68 in Singapore, 23 in Taiwan, and 13 in Europe. No employees are currently covered by a collective bargaining agreement. We believe that our relations with our employees are good.
Available Information
We maintain a website at http://www.formfactor.com. We make available free of charge on our website our Annual Report on Form 10-K, quarterly reports on Form 10-Q, current reports on Form 8-K and amendments to those reports filed or furnished pursuant to Section 13(a) or 15(d) of the Exchange Act, as soon as reasonably practicable after we electronically file such material with, or furnish it to, the SEC. The reference to our website does not constitute incorporation by reference of the information contained at the site.
10
The public may also read and copy any materials that we file with the SEC at the SEC's Public Reference Room at 100 F Street N.E., Washington, D.C. 20549. The public may obtain information on the operation of the Public Reference Room by calling the SEC at 1-800-SEC-0330. The SEC also maintains an Internet website that contains reports and other information regarding issuers, such as FormFactor, that file electronically with the SEC. The SEC's Internet website is located at http://www.sec.gov.
Directors and Executive Officers
Directors. The names of the members of our board of directors, their ages as of December 26, 2009 and their current occupations are set forth below.
Name of Director
|
Age | Current Occupation | |||
|---|---|---|---|---|---|
Dr. Homa Bahrami |
54 | Senior Lecturer at the Haas School of Business, University of California Berkeley |
|||
G. Carl Everett, Jr. |
59 | Venture Partner at Accel LLP |
|||
Dr. Chenming Hu |
62 | TSMC Distinguished Chair Professor of Microelectronics in Electrical Engineering and Computer Science at the University of California, Berkeley |
|||
Lothar Maier |
54 | Chief Executive Officer and Director of Linear Technology Corporation |
|||
James A. Prestridge |
77 | Director of FormFactor, Inc. |
|||
Dr. Mario Ruscev |
53 | Chief Executive Officer and Director of FormFactor, Inc. |
|||
Harvey A. Wagner |
68 | Chief Executive Officer, President and Director of Caregiver Services, Inc. |
|||
Dr. Homa Bahrami has served as a Director since December 2004. Dr. Bahrami is a Senior Lecturer at the Haas School of Business, University of California, Berkeley. Dr. Bahrami is also a Faculty Director of the Center for Executive Education and a Board Member of the Center for Trading Excellence, both at the Haas School of Business, University of California, Berkeley. Dr. Bahrami has been on the Haas School faculty since 1986 and is widely published on organizational design and organizational development challenges and trends in the high technology sector. Dr. Bahrami currently serves on the board of directors of one privately held company. Dr. Bahrami holds a Ph.D. in organizational behavior from Aston University, United Kingdom.
G. Carl Everett, Jr. has served as a Director since June 2001. Mr. Everett founded GCE Ventures, a venture advisement firm, in April 2001. Mr. Everett has served as a venture partner at Accel LLP, a venture capital firm, since 2002. From February 1998 to April 2001, Mr. Everett served as Senior Vice President, Personal Systems Group of Dell Inc. During 1997, Mr. Everett was on a personal sabbatical. From 1978 to December 1996, Mr. Everett held several management positions with Intel Corporation, including Senior Vice President and General Manager of the Microprocessor Products Group, and Senior Vice President and General Manager of the Desktop Products Group. Mr. Everett currently serves on the board of directors of three privately held companies. Mr. Everett holds a B.A. in business administration and an honorary Doctorate of Laws from New Mexico State University.
Dr. Chenming Hu has served as a Director since December 2009. Dr. Hu is the TSMC Distinguished Chair Professor of Microelectronics in Electrical Engineering and Computer Sciences at the University of California, Berkeley, and has been a Professor of Electrical Engineering and Computer Sciences at the University of California, Berkeley since 1976. From 2001 through 2004, Dr. Hu was the Chief Technology Officer at Taiwan Semiconductor Manufacturing Company Limited, a dedicated semiconductor foundry. From 1995 through 2003, Dr. Hu served as the Chairman of the
11
board of directors of Celestry Design Technologies, Inc., a complete, full-chip SoC silicon accurate sign-off solution provider, which Cadence Design Systems, Inc. acquired in 2003. Dr. Hu was also the co-founder of Celestry Design Technologies. From 1973 through 1976 Dr. Hu was an assistant professor at the Massachusetts Institute of Technology. Dr. Hu has served as a member of the Board of Directors of MoSys, Inc., a publicly traded company, since January 2005, and of SanDisk Corporation, a publicly traded company, since September 2009, where he is a member of the Compensation Committee. Dr. Hu currently serves on the board of directors of one privately held company, where he is a member of the Audit Committee. Dr. Hu holds a B.S. in Electrical Engineering from National Taiwan University, Taiwan and an M.S. and a Ph.D. in Electrical Engineering from the University of California, Berkeley.
Lothar Maier has served as a Director since November 2006. Mr. Maier has served as the Chief Executive Officer and a member of the board of directors of Linear Technology Corporation, a supplier of high performance analog integrated circuits, which is a publicly traded company, since January 2005. Prior to that, Mr. Maier served as Linear Technology's Chief Operating Officer from April 1999 to December 2004. Before joining Linear Technology, Mr. Maier held various management positions at Cypress Semiconductor Corporation, a provider of high-performance, mixed-signal, programmable solutions, from 1983 to 1999, most recently as Senior Vice President and Executive Vice President of Worldwide Operations. Mr. Maier holds a B.S. in chemical engineering from the University of California at Berkeley.
James A. Prestridge has served as a Director since April 2002, and has served as Chairman of our Board of Directors from August 2005 to June 2008, and since May 2009. Mr. Prestridge served as our Lead Independent Director from June 2008 to May 2009. Mr. Prestridge served as a consultant for Empirix Inc., a provider of test and monitoring solutions for communications applications, from October 2001 until October 2003. From June 1997 to January 2001, Mr. Prestridge served as a Director of five private companies that were amalgamated into Empirix. Mr. Prestridge served as a member of the board of directors of Teradyne, Inc., a manufacturer of automated test equipment, which is a publicly traded company, from 1992 until 2000. Mr. Prestridge was Vice-Chairman of Teradyne from January 1996 until May 2000 and served as Executive Vice President of Teradyne from 1992 until May 1997. Mr. Prestridge holds a B.S. in general engineering from the U.S. Naval Academy and an M.B.A. from Harvard University. Mr. Prestridge served as a Captain in the U.S. Marine Corps.
Dr. Mario Ruscev has served as our Chief Executive Officer since June 2008 and a member of our board of directors since January 2008, when he joined our company. Dr. Ruscev previously served as our President from January 2008 to June 2008. Prior to FormFactor, Dr. Ruscev served as President of Testing Schlumberger Oilfield Services of Schlumberger Limited, a services company supplying technology, project management and information solutions for optimizing performance in the oil and gas industry, from April 2006 to December 2007. He also held several executive positions at Schlumberger during his 23 year career with that company, including President of Schlumberger Water and Carbon Services from April 2002 to March 2006, President of Wireline Schlumberger Oilfield Services from January 2001 to March 2002 and President of Geco-Prakla Schlumberger Oilfield Services from April 1999 to December 2000. Dr. Ruscev received a Doctorate in Nuclear Physics from Université, Pierre et Marie Curie in Paris, France and a Ph.D. in Nuclear Physics from Yale University.
Harvey A. Wagner has served as a Director since February 2005. Mr. Wagner joined Caregiver Services, Inc., a provider of in-home care services, as the President and Chief Executive Officer and a member of the board of directors on April 7, 2008. Mr. Wagner founded the H.A. Wagner Group, LLC, a consulting firm, where he has served as managing principal since July 2007. Mr. Wagner previously served as President and Chief Executive Officer of Quovadx, Inc. (now Healthvision, Inc.), a software and services company, from October 2004 to July 2007, and as a member of the board of directors of Quovadx from April 2004 to July 2007. From May 2004 through October 2004, Mr. Wagner served as acting President and Chief Executive Officer of Quovadx. Prior to joining Quovadx, he served
12
as Executive Vice President and Chief Financial Officer of Mirant Corporation, an independent energy company, from January 2003 through April 2004. Prior to joining Mirant, Mr. Wagner was Executive Vice President of Finance, Secretary, Treasurer, and Chief Financial Officer at Optio Software, Inc., a provider of business process improvement solutions, from February 2002 to December 2002. From May 2001 to January 2002, he performed independent consulting services for various corporations. He was Chief Financial Officer and Chief Operating Officer for PaySys International, Inc. from December 1999 to April 2001. Mr. Wagner also serves on the board of directors of Cree, Inc., a publicly traded company, since February 2004 where he is Chairman of the Audit Committee and a member of the Nominating and Governance Committee. Mr. Wagner also serves on the Board of Startek, Inc., a publicly traded company, since May 2008 where he is Chairman of the Audit Committee, a member of the Governance Committee and a member of the Compensation Committee. Mr. Wagner holds a B.B.A. in accounting from the University of Miami.
Executive Officers. Our executive officers in fiscal 2009, their ages as of December 26, 2009 and their positions with our company in fiscal 2009 are set forth below.
Name
|
Age | Position | |||
|---|---|---|---|---|---|
Dr. Mario Ruscev |
53 | Chief Executive Officer |
|||
Jean B. Vernet |
48 | Senior Vice President and Chief Financial Officer |
|||
Stuart L. Merkadeau |
48 | Senior Vice President, General Counsel and Secretary |
|||
Jean B. Vernet joined our company in March 2008, as Chief Financial Officer and Senior Vice President. Mr. Vernet previously served as the Director of Risk and Assistant Treasurer at Rio Tinto Alcan, one of five product groups of Rio Tinto plc, a leading international mining group from July 2007 to March 2008. Prior to joining Rio Tinto, Mr. Vernet worked for more than 10 years at Schlumberger Limited, a services company supplying technology, project management and information solutions for optimizing performance in the oil and gas industry, from October 1996 to June 2007, where he held several key leadership positions, including Finance Director and Controller of the REW Wireline Business Unit and Corporate R&D, from July 2004 to June 2007 and Treasurer of Atlantic Asia from January 2003 to June 2004, as well as various risk management and treasury roles. Mr. Vernet holds a M.S. degree in mechanical engineering from the École Centrale de Lyon in France, an M.B.A in analytic finance and accounting from the University of Chicago and a B.S. equivalent in mathematics and physics from Lycée Janson de Sailly in France.
Stuart L. Merkadeau has served as one of our Senior Vice Presidents since October 2003 and as our General Counsel and Secretary since October 2002. Mr. Merkadeau previously served as one of our Vice Presidents from October 2002 to September 2003, and as our Vice President of Intellectual Property from July 2000 to October 2002. From 1990 to July 2000, Mr. Merkadeau practiced law as an associate and then a partner with Graham & James LLP, where he specialized in licensing and strategic counseling in intellectual property matters. Mr. Merkadeau is admitted to practice in California and registered to practice before the U.S. Patent and Trademark Office. Mr. Merkadeau holds a B.S. in industrial engineering from Northwestern University and a J.D. from the University of California at Los Angeles.
You should carefully consider the following risk factors, as well as the other information in this Annual Report on Form 10-K, in evaluating FormFactor and our business. If any of the following risks actually occur, our business, financial condition and results of operations would suffer, the trading price of our common stock could decline and you may lose all or part of your investment in our common stock.
13
The global economic and semiconductor industry downturns, slower than anticipated recoveries, or a further downturn could continue to negatively affect our business, results of operations, and financial condition.
The global economic and semiconductor industry downturns have negatively affected and could continue to negatively affect our business, results of operations and financial condition. This negative effect could worsen if the economic and semiconductor industry recoveries are slower than anticipated or further downturns occur. We may experience continued declines in demand for our probe cards resulting from our customers continuing to conserve cash by cutting production, postponing the implementation of tooling cycles and delaying the ramp of new technology nodes in response to slow demand for consumer and other products incorporating devices tested with our wafer probe cards. We may experience continued pricing pressure on certain of our products, which may reduce our gross margins. A slower than anticipated recovery or a further downturn could cause additional customers to file for bankruptcy protection as occurred in 2009 with our customers Spansion and Qimonda, resulting in our loss of revenue. In the current environment, customers are seeking extended payment terms or are delaying payment for our products past their original due dates, which could impact their payment histories resulting in our deferral of revenue and which could increase our potential bad debt exposure. In fiscal 2009, we recorded a $5.0 million pre-tax expense to increase our allowance for doubtful accounts as a result of the heightened non-payment risk of accounts receivable primarily related to three customers.
We may also experience the insolvency of key suppliers, leading to delays in the development and shipment of our products, increased expense and loss of revenue. In addition, we may experience increased impairment charges due to declines in the fair values of marketable debt securities.
We derive a substantial portion of our revenues from a small number of customers, and we could continue to experience significant declines in our revenues if any major customer does not place, cancels, reduces or delays a purchase of our products, or does not pay us, or delays or extends payment for our products past their original due dates.
A relatively small number of customers have accounted for a significant portion of our revenues in any particular period. One customer accounted for 49.1% of our revenues in fiscal 2009, and three customers accounted for 51.3% of our revenues in fiscal 2008. In fiscal 2009 and in fiscal 2008, our ten largest customers accounted for 83.3% of our revenues and 81.0% of our revenues, respectively. We anticipate that sales of our products to a relatively small number of customers will continue to account for a significant portion of our revenues. Consolidation in the semiconductor industry may increase this concentration. As a result of the global economic and semiconductor industry downturns, we have experienced significant declines in our revenues. In the future, the cancellation, reduction or deferral of even a small number of purchases of our products could significantly reduce our revenues in any particular quarter. Cancellations, reductions or deferrals could result from a prolonged or another downturn in the semiconductor industry, manufacturing delays, quality or reliability issues with our products, or interruptions to our customers' operations due to fire, natural disasters or other events. Furthermore, because our probe cards are custom products designed for our customers' unique wafer designs, any cancellations, reductions or delays can result in significant, non-recoverable costs. In some situations, our customers might be able to cancel or reduce orders without a significant penalty. Our customers could also fail to pay all or part of an invoice for our products. If a customer fails to pay us or delays payment for our products, we may be unable to recognize revenue, our financial condition and liquidity could be impacted and we may incur additional charges for bad debt reserve to the extent certain of our customers continue to face financial difficulties during this downturn. It is also possible that if we make the decision to file one or more additional actions against customers to seek payment of outstanding receivables that it will negatively impact a customer relationship and result in lost revenues in the future. Customers with financial difficulties may be forced to materially reduce or
14
discontinue operations, file for bankruptcy or other relief, or may be acquired by one of our other customers, any of which would further reduce our customer base.
The markets in which we participate are competitive, and if we do not compete effectively, our operating results could be harmed.
We are experiencing increased competition in the wafer probe card market and we expect competition to intensify in the future. Increased competition has resulted in, and in the future is likely to result in price reductions, reduced gross margins or loss of market share. Competitors might introduce new competitive products for the same markets that our products currently serve. These products may have better performance, lower prices and/or broader acceptance than our products. In addition, for products such as wafer probe cards, semiconductor manufacturers typically qualify more than one source, to avoid dependence on a single source of supply. As a result, our customers would likely purchase products from our competitors. Current and potential competitors include AMST Co., Ltd., Feinmetall GmbH, Japan Electronic Materials Corporation, Korea Instrument Co., Ltd., SV Probe Inc., Micronics Japan Co., Ltd., Microfriend Inc., MicroProbe Inc., Phicom Corporation, Technoprobe Asia Pte. Ltd., Tokyo Cathode Laboratory Co., Ltd., TSE Co., Ltd., Verigy Ltd., and Wentworth Laboratories, Inc., among others. Many of our current and potential competitors have greater name recognition, larger customer bases, more established customer relationships or greater financial, technical, manufacturing, marketing and other resources than we do. As a result, they might be able to respond more quickly to new or emerging technologies and changes in customer requirements, devote greater resources to the development, promotion, sale and support of their products, and reduce prices to increase market share. Some of our competitors also supply other types of test equipment, or offer both advanced wafer probe cards and needle probe cards. Those competitors that offer both advanced wafer probe cards and needle probe cards might have strong, existing relationships with our existing customers or with potential customers. Because we do not offer a needle probe card or other conventional technology wafer probe card for less advanced applications, it may be difficult for us to introduce our advanced wafer probe cards to these customers and potential customers for certain wafer test applications. It is also possible that one or more of our competitors may be able to increase their relative revenue with mutual customers, resulting in a loss of revenue share to us. It is further possible that existing or new competitors, including test equipment manufacturers, may offer new technologies that reduce the value of our wafer probe cards.
We are implementing our global regionalization strategy, and if we do not effectively devise and implement an effective global strategic plan or if we decide to change our strategy, our operating results could be negatively impacted.
We are implementing our global regionalization strategy in which we are, in part, moving operational resources and capabilities to different country regions in Asia to be closer to our customers. We believe this implementation will enhance our customer relationships, improve our responsiveness and increase our product serviceability. The first phase of this strategy was focused on Singapore, where we have established design, sales, procurement and administrative functions. We are now bringing up a manufacturing facility in Singapore, with the initial effort directed to bringing-up portions of our front-end manufacturing processes, as well as certain back-end assembly and test capabilities. We are also executing a phased bring up of certain operational capabilities in different country regions in Asia in which we do business. For example, we have established assembly and test capabilities in South Korea, which we plan to expand, and also have established an assembly and test facility in Japan. Our global regionalization strategy is subject to a variety of complexities and risks, many of which our executive team has had little experience in managing at FormFactor, and which may
15
divert a substantial amount of our management's time. Risks stem from the following, among other things:
- •
- challenges in designing new facilities that can be scaled for future expansion, replicating current processes and bringing
new facilities up to full operation;
- •
- delays in the development of improvements to products, processes and technologies and of new products, processes and
technologies that may delay the transfer and implementation of those developments in a facility;
- •
- unpredictable costs, redundancy costs and cost overruns for developing new facilities and acquiring equipment
(e.g., design and construction costs increased at a pace that we could not have reasonably anticipated for the Singapore manufacturing plan);
- •
- building local management teams, technical personnel and other staff for functions that we have not previously conducted
outside of Livermore California, United States;
- •
- technical obstacles such as poor production or process yield and loss of quality control during the ramp of a new
facility;
- •
- requalifications and other procedures that may be required by our customers;
- •
- our ability to bring up local suppliers to meet our quality and cycle-time needs;
- •
- rapidly changing business conditions that may require plans to be changed or abandoned before they are fully implemented;
and
- •
- challenges posed by distance and by differences in language and culture.
These and other factors could delay us in developing and implementing our strategy, as well as impair our gross margins, delay shipments and deliveries, cause us to lose sales, require us to write off investments already made, damage our reputation and harm our business, financial condition and operating results. If we decide to change our current global regionalization strategy, we may incur charges for certain costs incurred.
If we fail to protect our proprietary rights, our competitors might gain access to our technology, which could adversely affect our ability to compete successfully in our markets and harm our operating results.
If we choose not to protect our proprietary rights adequately or fail in our efforts to protect our proprietary rights, our competitors might gain access to our technology. Unauthorized parties might attempt to copy aspects of our products or to obtain and use information that we regard as proprietary. Others might independently develop similar or competing technologies or methods or design around our patents. In addition, the laws of many foreign countries in which we or our customers do business do not protect our intellectual property rights to the same extent as the laws of the United States. To date, we have not been successful in our efforts to enforce our proprietary rights in South Korea. As a result, our proprietary rights could be compromised, our competitors might offer products similar to ours and we might not be able to compete successfully. We also cannot assure that:
- •
- our means of protecting our proprietary rights will be adequate;
- •
- patents will be issued from our pending or future applications;
- •
- our existing or future patents will be sufficient in scope or strength to provide any meaningful protection or commercial
advantage to us;
- •
- our patents or other intellectual property will not be invalidated, circumvented or successfully challenged in the United States or foreign countries; or
16
- •
- others will not misappropriate our proprietary technologies or independently develop similar technologies, duplicate our products or design around any of our patents or other intellectual property, or attempt to manufacture and sell infringing products in countries that do not strongly enforce intellectual property rights.
We have spent in the past and may be required to spend in the future significant resources to monitor and protect our intellectual property rights. We presently believe that it is likely that two or more of our competitors are using methodologies or have implemented structures into certain of their products that are covered by one or more of our intellectual property rights. We have in the past brought claims to protect our rights, and we are currently involved in patent infringement litigation, including two ongoing United States federal district court actions. These district court actions were stayed after our filing of a complaint against two competitors, Phicom Corporation and Micronics Japan Co., Ltd., and their respective U.S. subsidiaries, before the United States International Trade Commission, or ITC. In November 2009, the ITC issued a final determination, finding certain of FormFactor's asserted patent claims valid, but not infringed, and other asserted patent claims invalid. The ITC did not find a violation of Section 337 of the Tariff Act of 1930 and terminated its investigation without issuing an exclusionary order against any products. The pending U.S. federal district court infringement actions include patent infringement allegations against Phicom and against Micronics Japan that include FormFactor patents and patent claims that were not at issue before the ITC. We expect the stays will be lifted and we may not obtain a favorable ruling in either of these U.S. federal district court actions. In certain cases, our competitors have initiated re-examination proceedings in the U.S. Patent and Trademark Office and invalidity proceedings in foreign patent offices against certain of our patents. Any litigation, whether or not resolved in our favor, and whether initiated by us or by a third party, could result in significant and possibly material expense to us and divert the efforts of our management and technical personnel. In addition, while patents are territorial and a ruling on a certain given patent does not necessarily impact the validity or enforceability of a corresponding or related patent in a different country, an adverse ruling in one country might negatively impact our ability to enforce the corresponding or related patent in other countries. Finally, certain of our customer contracts contain provisions that require us to defend and/or indemnify our customers for third party intellectual property infringement claims, which would increase the cost to us of an adverse ruling in such a claim. An adverse determination could also negatively impact our ability to license certain of our technologies and methods to others, and result in our competitors being allowed to sell products with, or add to their products, features and benefits contained in our products, thereby reducing our competitive advantages over these competing products.
If we do not innovate and keep pace with technological developments in the semiconductor industry, our products might not be competitive and our revenues and operating results could suffer.
We must continue to innovate and to invest in research and development to improve our competitive position and to meet the testing requirements of our customers. Our future growth depends, in significant part, upon our ability to work effectively with and anticipate the testing needs of our customers and to develop and support new products and product enhancements to meet these needs on a timely and cost-effective basis. Our customers' testing needs are becoming more challenging as the semiconductor industry continues to experience rapid technological change driven by the demand for complex circuits that are shrinking in size and at the same time are increasing in speed and functionality and becoming less expensive to produce. Examples of trends driving demand for technological research and development include semiconductor manufacturers' transitions to 70 and below nanometer technology nodes, to two gigabit density devices, and to Double Data Rate III, or DDR III, architecture devices. Our customers expect that they will be able to integrate our wafer probe cards into any manufacturing process as soon as it is deployed. Therefore, to meet these expectations and remain competitive, we must continually design, develop and introduce on a timely basis new products and product enhancements with improved features. For example, in October 2009, we
17
acquired certain intellectual property rights and other technology assets related to precision motion control automation from Electroglas Inc. ("Electroglas"), a company under Chapter 11 bankruptcy protection, which had been an important technology partner in the development of certain manufacturing equipment for future products. However, it is unclear whether we will be able to proceed with the development and implementation efforts on the same timeline and any delay in the timeline could negatively impact our financial results. It is possible that our internal development efforts and engagements with third parties regarding the development of manufacturing equipment having similar functionality may have a lengthy bring-up time and negatively impact our ability to complete new products and realize revenue from those products.
Successful product design, development and introduction on a timely basis require that we:
- •
- design innovative and performance-enhancing product architectures, technologies and features that differentiate our
products from those of our competitors;
- •
- in some cases engage with third parties who have particular expertise in order to complete one or more aspects of the
design and manufacturing process;
- •
- transition our products to new manufacturing technologies;
- •
- identify emerging technological trends in our target markets;
- •
- maintain effective marketing strategies;
- •
- respond effectively to technological changes or product announcements by others; and
- •
- adjust to changing market conditions quickly and cost-effectively.
Not only do we need the technical expertise to implement the changes necessary to keep our technologies current, but we must also rely heavily on the judgment of our management to anticipate future market trends. If we are unable to timely predict industry changes or industry trends, or if we are unable to modify our products or design, manufacture and deliver new products on a timely basis, or if a third party with which we engage does not timely deliver a component or service for one of our product modifications or new products, we might lose customers or market share. In addition, we might not be able to recover our research and development expenditures, which could harm our operating results.
If semiconductor manufacturers do not migrate elements of final test to wafer probe test, market acceptance of other applications of our technology could be delayed.
We are working with some existing and new customers as they evolve the focus of their semiconductor test efforts from the individual device level to the wafer level. This evolution is typically a long-term process in which the outcome and the effect on our business is not clear. Semiconductor manufacturers might not adopt wafer-level final test in a way that uses our technology. Our technology's ability to perform elements of final test on the wafer may not scale with the needs of semiconductor manufacturers. Further, the pace and manner in which wafer-level testing is adopted will also vary by manufacturer and will be affected by factors like capital tooling cycles and end market growth in different application segments. We believe, for example, that testing in stacked packaging or 3-D packaging applications is more likely to migrate to wafer level test than other applications. If the migration of elements of final test to wafer probe test does not grow as we anticipate, or if semiconductor manufacturers do not adopt our technology for their wafer probe test requirements, market acceptance of other applications for our technology could be delayed. In addition, to the extent manufacturers do not invest in wafer test technology enabling the identification of known good die, or KGD, or if the projected or anticipated investment in such technology is delayed or reduced, it could delay the introduction of certain of our technologies and negatively affect our business.
18
Changes in test strategies, equipment and processes could cause us to lose revenues.
The demand for wafer probe cards depends in large part upon the number of semiconductor designs, the pace of technology and architecture transitions in chip designs and overall semiconductor unit volume. The time it takes to test a wafer depends upon the number of devices being tested, the complexity of these devices, the test software program and the test equipment itself. As test programs become increasingly effective and test throughput increases, the number of wafer probe cards required to test a given volume of devices declines. Therefore, advances in the test process could cause us to lose sales. Further, most semiconductor manufacturers are implementing chip designs featuring built-in self-test, or BIST, capabilities or similar "design for testability", or DFT, functions or methodologies that increase test throughput and reduce the cost of test. These efforts include strategies to reduce the technical requirements on test equipment, or to improve data about device performance early in the manufacturing process, or to test the device later in the life of the product for quality assurance purposes. In some cases, BIST or DFT can create opportunities for our technologies. In other cases BIST or DFT can reduce requirements for wafer level test and reduce our opportunities. Although we seek to work with our customers to show ways that our technologies can be applied together with BIST and DFT approaches to create opportunities to further reduce the cost of test, the overall impact of BIST and DFT technologies, as they exist today and as they may be developed in the future, could slow the migration to wafer level testing and adversely affect our revenues. Similar results could occur if new chip designs are implemented which we are unable to test efficiently, or if semiconductor manufacturers reduce generally the amount or degree of wafer test they perform. We incur significant research and development expenses in conjunction with the introduction of new product architectures and platforms. Often, we time our product introductions to the introduction of new test equipment platforms or the declination of manufacturers to adopt a new test platform. Because our customers require both test equipment and wafer probe cards, any delay or disruption in the introduction of new test equipment platforms would negatively affect our growth.
We have recorded significant restructuring, inventory write-off and asset impairment charges in the past and may do so again in the future, which could have a material negative impact on our business.
We recorded material restructuring charges related to our global workforce reductions and impairment charges related to our long-lived assets in fiscal 2008 and fiscal 2009. If the current challenging economic and semiconductor industry conditions persist, we may implement additional cost reduction actions, which would require us to take additional, potentially material, restructuring charges related to employee terminations or asset disposal or exit costs. We may also be required to write off additional inventory if our product build plans or usage of inventory experience further declines, and such additional write-offs could constitute material charges. In addition, a further decline in our stock price or significant adverse change in market conditions could require us to take additional material impairment charges related to our long-lived assets. Our long-lived assets, including intangible assets, are amortized over their respective estimated useful lives using the straight-line method and are reviewed for impairment annually, or whenever events or changes in circumstances indicate that their carrying amount may not be recoverable. The valuation of our long-lived assets requires assumptions and estimates of many critical factors, including revenue and market growth, operating cash flows, market multiples, and discount rates. Other adverse changes in market conditions, particularly if such changes have the effect of changing one of the critical assumptions or estimates we used to calculate the amount of impairment charge, if any, could result in a change to the estimation of fair value that could result in future impairment charges. Any such additional material charges, whether related to restructuring or asset impairment, may have a material negative impact on our operating results and related financial statements.
19
Changes in our tax rates, inability to realize our deferred tax assets or exposure to additional tax liabilities could adversely affect our operating results.
We are subject to income taxes in both the United States and various foreign jurisdictions, and our domestic and international tax liabilities are subject to the allocation of expenses in different jurisdictions. The amount of income taxes we pay are subject to audits in various jurisdictions and a material assessment by a governing tax authority could adversely affect our operating results. Our effective tax rate could be adversely affected by changes in the mix of earnings in countries with different statutory tax rates, changes in tax laws, such as changes in the taxation of our non-U.S. operations by the United States tax authorities or changes in our operational activities in connection with implementation of our global regionalization strategy. Realization of our deferred tax assets, which are predominantly in the United States, is dependent on our ability to generate sufficient future taxable income. If we determine that we may not be able to realize some portion of our deferred tax assets in the future, we would record a valuation allowance against the deferred tax assets that could result in additional income tax expense. This valuation allowance will not limit our ability to utilize our federal and state deferred tax assets to offset future U.S. profits.
Our equity plans have evergreen provisions that automatically increase the number of shares available for issuance each year without stockholder approval, and as a result of this annual increase in shares, you may experience dilution and we may not seek your approval for further additions to our existing plans or for new plans.
Our 2002 Equity Incentive Plan and 2002 Employee Stock Purchase Plan have evergreen provisions that automatically increase the number of shares available for issuance under these plans each year without stockholder approval. Specifically, our 2002 Equity Incentive Plan's evergreen provision increases the number of shares available for issuance on each January 1st by an amount equal to 5% of the total amount of our outstanding common stock as of December 31st of the prior year, and our 2002 Employee Stock Purchase Plan's evergreen provision increases the number of shares available for issuance on each January 1st by an amount equal to 1% of the total amount of our outstanding common stock as of December 31st of the prior year. These evergreen provisions, which have a compounding effect, have been in place since the adoption of the plans in 2003. In 2010, these evergreen provisions added 2,488,180 shares to the 2002 Equity Incentive Plan and 497,636 shares to the 2002 Employee Stock Purchase Plan, which shares were available for issuance on January 1, 2010. In 2009, these evergreen provisions added 2,453,115 shares to the 2002 Equity Incentive Plan and 490,623 shares to the 2002 Employee Stock Purchase Plan, which shares were available for issuance on January 1, 2009. In 2008, these evergreen provisions added 2,432,112 shares to the 2002 Equity Incentive Plan and 486,422 shares to the 2002 Employee Stock Purchase Plan, which shares were available for issuance on January 1, 2008, and we had 49,062,308 shares of common stock outstanding on December 27, 2008. In 2007, these evergreen provisions added 2,343,067 shares to the 2002 Equity Incentive Plan and 468,613 shares to the 2002 Employee Stock Purchase Plan, which shares were available for issuance on January 1, 2007, and we had 48,642,258 shares of common stock outstanding on December 29, 2007. In 2006, these evergreen provisions added 2,011,834 shares to the 2002 Equity Incentive Plan and 402,366 shares to the 2002 Employee Stock Purchase Plan, which shares were available for issuance on January 1, 2006, and we had 46,861,334 shares of common stock outstanding on December 30, 2006. In 2005, these evergreen provisions added 1,944,281 shares to the 2002 Equity Incentive Plan and 388,856 shares to the 2002 Employee Stock Purchase Plan, which shares were available for issuance on January 1, 2005, and we had 40,236,686 shares of common stock outstanding on December 31, 2005. In 2004, these evergreen provisions added 1,840,502 shares to the 2002 Equity Incentive Plan and 368,100 shares to the 2002 Employee Stock Purchase Plan, which shares were available for issuance on January 1, 2004, and we had 38,885,637 shares of common stock outstanding on December 25, 2004. Since the adoption of the plans, we have added 15,513,091 shares to the 2002 Equity Incentive Plan and 3,102,616 shares under the 2002 Employee Stock Purchase Plan. Due to the
20
annual increase in the amount of shares available for issuance under these equity plans and to the extent that we issue these shares and they become outstanding, you will continue to experience dilution. While the equity plans are in effect, it is more likely that due to the plans' evergreen provision, we will not ask our stockholders to approve or disapprove further additions to the plans. In addition, while the equity plans are in effect, it is more likely that due to the plans' evergreen provisions, we will not ask our stockholders to approve or disapprove the adoption of any new equity plans.
Our operating results are likely to fluctuate, which could cause us to miss market analyst or investor expectations and cause the trading price of our common stock to decline.
Our operating results have fluctuated in the past and are likely to continue to fluctuate. As a result, we believe you should not rely on period-to-period comparisons of our financial results as indicators of our future performance. Some of the important factors that could cause our revenues, operating results and outlook to fluctuate from period-to-period include:
- •
- customer demand for and adoption of our products;
- •
- market and competitive conditions in our industry, the semiconductor industry and the economy as a whole;
- •
- our ability to improve operating efficiency to achieve operating cash flow break even in the current business environment
and to better position our company for long-term, profitable growth;
- •
- the timing and success of new technologies and product introductions by our competitors and by us;
- •
- our ability to deliver reliable, cost-effective products that meet our customers' testing requirements in a
timely manner;
- •
- our ability to transition to new product architectures and to bring new products into volume production on time and at
acceptable yields and cost;
- •
- our ability to implement measures for enabling efficiencies and supporting growth in our design, applications,
manufacturing and other operational activities;
- •
- the reduction, rescheduling or cancellation of orders by our customers;
- •
- our ability to collect accounts receivables owed by our customers;
- •
- our product and customer sales mix and geographical sales mix;
- •
- a reduction in the price or the profitability of our products;
- •
- the availability or the cost of components and materials utilized in our products;
- •
- our ability to efficiently optimize manufacturing capacity and to stabilize production yields, and as necessary to meet
customer demand and ramp production volume at our manufacturing facilities;
- •
- our ability to successfully implement our global regionalization strategy, which includes locating certain operational
capabilities and resources in the specific countries where our customers are located;
- •
- our ability to protect our intellectual property against third parties and continue our investment in research and
development and design activities;
- •
- our ability to obtain tax and other cost advantages from our expansion of operations into Singapore;
21
- •
- any disruption in the operation of our manufacturing facility;
- •
- the timing of and return on our investments in research and development; and
- •
- seasonality, principally due to our customers' purchasing cycles.
The impact of one or more of these factors might cause our operating results to vary widely. If our revenues, operating results or outlook fall below the expectations of market analysts or investors, the market price of our common stock could decline substantially.
Cyclicality in the semiconductor industry is currently adversely impacting our sales and may do so in the future, and as a result we would experience reduced revenues and operating results.
The semiconductor industry has historically been cyclical and is characterized by wide fluctuations in product supply and demand. From time to time, this industry has experienced significant downturns, often in connection with, or in anticipation of, maturing product and technology cycles, excess inventories and declines in general economic conditions. The current global economic and semiconductor downturns have caused and may continue to cause our operating results to decline dramatically from one period to the next. For example, our revenues in fiscal 2009 declined by 35.6% compared to our revenues for fiscal 2008, due in significant part to continuing challenges in semiconductor market conditions, particularly in the DRAM and Flash markets, and we cannot provide any assurance when semiconductor market conditions will improve. Our business depends heavily upon the development and manufacture of new semiconductors, the rate at which semiconductor manufacturers make transitions to smaller nanometer technology nodes and implement tooling cycles, the volume of production by semiconductor manufacturers and the overall financial strength of our customers, which, in turn, depend upon the current and anticipated market demand for semiconductors and products, such as personal computers and cell phones, that use semiconductors. Semiconductor manufacturers generally sharply curtail their spending, including their equipment spending, and defer their adoption of emerging technologies during industry downturns and historically have lowered their spending disproportionately more than the decline in their revenues. This is particularly true when there is a point during an industry cycle in which the semiconductor manufacturers' costs related to semiconductor devices approach or exceed the sales price of the devices. As a result, we would experience reduced revenues due to the decreased demand for our wafer probe cards by our semiconductor manufacturer customers, which is what we are experiencing in this current downturn. Accordingly, if we are unable to adjust our levels of manufacturing and human resources or manage our costs and deliveries from suppliers in response to lower spending by semiconductor manufacturers, our gross margin may continue to decline and cause us to experience further operating losses.
If we do not effectively restructure our operations in light of the global economic and semiconductor downturns and to better position our company for long-term, profitable growth, we might not succeed.
During an extended period of rapid growth and expansion prior to 2008 and 2009, we primarily focused on growing capacity and meeting customer mission-critical needs. With the current global economic and semiconductor downturns, we are focusing on improving our operating efficiency to achieve operating cash flow break even in the current business environment and to better position our company for long-term, profitable growth. The timing, length and severity of the cycles in the semiconductor industry are difficult to predict. This cyclicality affects our ability to accurately predict our future operating results and plan our business, and could also impair the value of our tangible and intangible assets. We implemented global cost reduction plans in fiscal 2008 and 2009, and are continuing to pursue measures to improve our operating efficiency. Such measures have included workforce reductions, the movement of certain manufacturing activities to geographic areas that are closer to our customers, the implementation of a shared service center, the consolidation of manufacturing capacity and the centralization of support functions to regional and global shared service
22
centers. If we do not successfully implement our global cost reduction plan and other measures for optimizing our financial model for prevailing market conditions, our competitiveness could be seriously harmed, our ability to invest in our business for future growth may be negatively impacted and our company might not succeed. If we do not successfully restructure our operations by, for example, placing more decision-making in regions close to our customers to enhance customer relationships, strengthening our local design, application and service capabilities to improve customer responsiveness, changing our manufacturing structure for shorter cycle time and improved product delivery capabilities, and realigning our research and development efforts, and continue to motivate and retain our key employees, we may experience continued deterioration in our business and our company might not succeed. In addition, as the business environment improves, if we are unable to proactively and effectively manage our operations and/or realign our controls, systems and infrastructure to changing business conditions, we may not be in a position to boost our personnel, manufacturing capacity, service capabilities and productivity, and support growth in response to increasing customer demand for our products, which would, in turn, have a negative impact on our operating results. Adverse general economic conditions may also impair the recovery of our business.
If we are unable to efficiently manufacture and ramp production of our new probe card products, our business may be materially adversely affected.
We must continuously improve our manufacturing processes in an effort to increase yields and product performance, lower our costs and reduce the time it takes for us to design, manufacture and deliver our products in volume. If we cannot, our new products may not be commercially successful, our revenues may be adversely affected, our customer relationships and our reputation may be harmed and our business may be materially adversely affected. To improve our manufacturing processes, we have incurred, and may incur in the future, substantial costs as we optimize capacity and yields, implement new manufacturing technologies, methods and processes, purchase new equipment, upgrade existing equipment and train technical personnel. We have experienced, and may experience in the future, manufacturing delays and other inefficiencies in connection with the development and implementation of these improvements, with customer qualifications of new processes, and with the expansion of manufacturing capacity and ramp of production volume to meet customer demand, any and all of which could cause our operating results to decline. We have also experienced, and may experience in the future, difficulties in manufacturing our complex products in volume on time and at acceptable yields and cost, and installation issues in the field due to complexity of customer design requirements, including integration of wafer probe cards with varying customer test cell environments and testing of semiconductor devices over a wide temperature range. For example, we experienced challenges transitioning our Harmony architecture-based products from a lower-volume, engineering-assisted process to a high-volume manufacturing process. These problems have resulted, and could result in the future, in missed opportunities with customers. Any continued difficulties could cause additional product delivery delays and lost sales. This increases our vulnerability to our competitors and the likelihood that our customers will seek solutions from other suppliers or to develop solutions themselves. If demand for our products decreases, we could have excess manufacturing capacity. The fixed costs associated with excess manufacturing capacity could cause our operating results to decline. If we are unable to achieve further manufacturing efficiencies and cost reductions, particularly if we are experiencing pricing pressures in the marketplace, our operating results could suffer.
Industry consolidation could adversely affect the market for our products, which could cause a decline in our revenues.
Consolidation in the semiconductor industry, particularly among manufacturers of DRAM, would reduce our customer base and could adversely affect the market for our products, which could cause a decline in our revenues. The global economic downturn caused significant disruption within the semiconductor industry. Two of our customers, Spansion and Qimonda, filed for protection under
23
applicable bankruptcy laws. The semiconductor industry now has a smaller customer landscape than in past years. The loss of additional customers will further concentrate, and could adversely affect, the market for our products. Consolidation may lead to lost or delayed sales, reduced demand for our wafer probe cards, loss of market share and increased pricing pressures. Additionally, certain customers may not want to rely entirely or substantially on a single wafer probe card supplier and, as a result, such customers could reduce their purchases of our wafer probe cards.
We depend upon the sale of our wafer probe cards for substantially all of our revenues, and the majority of our wafer probe cards are utilized by semiconductor manufacturers for testing DRAM devices; if we continue to experience a downturn in demand for our DRAM products, our revenues could decline further.
We have historically derived substantially all of our revenues from the sale of our wafer probe cards to manufacturers of DRAM, flash memory devices, and microprocessor, chipset and other SoC devices. For fiscal 2009 and for fiscal 2008, sales to manufacturers of DRAM devices accounted for 80.4% and 66.4%, respectively, of our revenues; sales to manufacturers of flash memory devices accounted for 5.4% and 18.3%, respectively, of our revenues and sales to manufacturers of SoC devices accounted for 14.2% and 15.3%, respectively, of our revenues. We anticipate that sales of our wafer probe cards will represent a substantial majority of our revenues for the foreseeable future. Our success depends in large part upon the continued acceptance of our products within these markets and our ability to continue to develop and introduce new products that meet our customers' requirements on a timely basis for these markets. In particular, to continue to grow our business, we need to further penetrate the full wafer contactor flash memory and SoC markets and to gain additional market share with manufacturers of flash memory and SoC devices. To the extent that we are unable to realize cost reductions and manufacturing efficiencies in the production of our wafer probe cards, or if we are not able to timely deliver our products, our revenues and business operations could be adversely impacted and our ability to grow could suffer. As our next generation wafer probe cards are used in greater volume in commercial production, it is possible that we will identify certain areas of technical performance that require improvement, and if we are unable to continually, efficiently and in a timely manner improve our products, it could result in reduced demand for our products and our operating results could be harmed. If chip manufacturers fail to make architecture, node or technology transitions as we anticipate, or if anticipated or announced transitions are delayed, it could adversely impact our revenues and operating results. In addition, we might not be able to sustain or increase our revenues from sales of our wafer probe cards, particularly if conditions in the semiconductor market continue to deteriorate or do not improve or if the market enters another downturn. Any decrease in revenues from sales of our wafer probe cards could harm our business more than it would if we offered a more diversified line of products.
If our relationships with our customers and companies that manufacture semiconductor test equipment deteriorate, our product development activities could be harmed.
The success of our product development efforts depends upon our ability to anticipate market trends and to collaborate closely with our customers and with companies that manufacture semiconductor test equipment. Our relationships with these customers and companies provide us with access to valuable information regarding manufacturing and process technology trends in the semiconductor industry, which enables us to better plan our product development activities. These relationships also provide us with opportunities to understand the performance and functionality requirements of our customers, which improve our ability to customize our products to fulfill their needs. Our relationships with test equipment companies are important to us because test equipment companies can design our wafer probe cards into their equipment and provide us with the insight into their product plans that allows us to offer wafer probe cards for use with their products when they are
24
introduced to the market. Our relationships with our customers and test equipment companies could deteriorate if they:
- •
- become concerned about our ability to protect their intellectual property;
- •
- become concerned with our ability to deliver quality products on a timely basis;
- •
- develop their own solutions to address the need for testing improvement;
- •
- implement chip designs that include enhanced built-in self-test capabilities;
- •
- regard us as a competitor;
- •
- introduce their own wafer probe card product or solution;
- •
- establish relationships with others in our industry;
- •
- acquire or invest in a competitive wafer probe card manufacturer or enter into a business venture with a competitive wafer
probe card manufacturer; or
- •
- attempt to restrict our ability to enter into relationships with their competitors.
Many of our customers and the test equipment companies we work with are large companies. The consequences of deterioration in our relationship with any of these companies could be exacerbated due to the significant influence these companies can exert in our markets. If our current relationships with our customers and test equipment companies deteriorate, or if we are unable to develop similar collaborative relationships with important customers and test equipment companies in the future, our long-term ability to produce commercially successful products could be impaired.
Because we generally do not have a sufficient backlog of unfilled orders to meet our quarterly revenue targets, revenues in any quarter are substantially dependent upon customer orders received and fulfilled in that quarter.
Our revenues are difficult to forecast because we generally do not have sufficient backlog of unfilled orders to meet our quarterly revenue targets at the beginning of a quarter. Rather, a substantial percentage of our revenues in any quarter depends upon customer orders for our wafer probe cards that we receive and fulfill in that quarter. Because our expense levels are based in part on our expectations as to future revenues and to a large extent are fixed in the short term, we might be unable to adjust spending in time to compensate for any unexpected shortfall in revenues. Accordingly, any significant shortfall of revenues in relation to our expectations could hurt our operating results.
We manufacture substantially all our products at our facility in Livermore, California, and any disruption in the operations of this facility could adversely impact our business and operating results.
Our manufacturing processes require sophisticated and costly equipment and a specially designed facility, including a semiconductor clean room. While we are implementing steps to increase our manufacturing capabilities in certain of our foreign subsidiaries, we today still manufacture substantially all of our wafer probe cards at our facility located in Livermore, California. Any disruption in our manufacturing, whether due to contamination in our manufacturing process, technical or labor difficulties, destruction or damage from fire or earthquake, infrastructure failures such as power or water shortage or any other reason, could interrupt our operations, impair critical systems, disrupt communications with our customers and suppliers, and cause us to write off inventory, thereby potentially resulting in the loss of revenues. In addition, if the previous energy crises in California that resulted in disruptions in power supply and increases in utility costs were to recur, we might experience power interruptions and shortages, which could disrupt our manufacturing operations. This could subject us to loss of revenues as well as significantly higher costs of energy. Further, current and
25
potential customers might not purchase our products if they perceive our lack of a fully operational alternate manufacturing facility to be a risk to their continuing source of supply.
If we are unable to continue to reduce the time it takes for us to design and produce a wafer probe card, our growth could be impeded.
Our customers continuously seek to reduce the time it takes them to introduce new products to market. The cyclicality of the semiconductor industry, coupled with changing demands for semiconductor devices, requires our customers to be flexible and highly adaptable to changes in the volume and mix of products they must produce. Each of those changes requires a new design and each new design requires a new wafer probe card. For some existing semiconductor devices, the manufacturers' volume and mix of product requirements are such that we are unable to design, manufacture and ship products to meet such manufacturers' relatively short cycle time requirements. We, for example, have lost sales in the past where we were unable to meet a customer's schedule for wafer probe cards for a particular design. If we are unable to reduce the time it takes for us to design, manufacture and ship our products in response to the needs of our customers, our competitive position could be harmed and we could lose sales. If we are unable to grow design capacity in the event demand increases, our ability to respond to customer requirements could be challenged and our revenues could be negatively impacted.
We obtain some of the components and materials we use in our products from a sole source or a limited group of suppliers, and the partial or complete loss of one of these suppliers could cause production delays and a substantial loss of revenues.
We obtain some of the components and materials used in our products, such as printed circuit board assemblies, plating materials and ceramic substrates, from a sole source or a limited group of suppliers. Alternative sources are not currently available for sole source components and materials. Because we rely on purchase orders rather than long-term contracts with the majority of our suppliers, we cannot predict with certainty our ability to obtain components and materials in the longer term. A sole or limited source supplier could increase prices, which could lead to a decline in our gross margin. Our dependence upon sole or limited source suppliers exposes us to several other risks, including inability to obtain an adequate supply of materials, late deliveries and poor component quality. In addition, the ability of any of these suppliers to timely provide us with sufficient quality materials would be adversely affected if they are forced to reduce or discontinue operations due to financial difficulties, which is a heightened risk during economic downturns. Disruption or termination of the supply of components or materials could delay shipments of our products, damage our customer relationships and reduce our revenues. For example, if we were unable to obtain an adequate supply of a component or material, we might have to use a substitute component or material, which could require us to make changes in our manufacturing process. From time to time, we have experienced difficulties in receiving shipments from one or more of our suppliers, especially during periods of high demand for our products. If we cannot obtain an adequate supply of the components and materials we require, or do not receive them in a timely manner, we might be required to identify new suppliers. We might not be able to identify new suppliers on a timely basis or at all. We, as well as our customers would also need to qualify any new suppliers. The lead-time required to identify and qualify new suppliers could affect our ability to timely ship our products and cause our operating results to suffer. Further, a sole or limited source supplier could require us to enter into non-cancelable purchase commitments or pay in advance to ensure our source of supply. In an industry downturn or in an environment in which growth is not at a level we projected or anticipated, commitments of this type could result in charges for excess inventory of parts. If we are unable to predict our component and materials needs accurately, or if our supply is disrupted, we might miss market opportunities by not being able to meet the demand for our products.
26
Wafer probe cards that do not meet specifications or that contain defects could damage our reputation, decrease market acceptance of our technology, cause us to lose customers and revenues, and result in liability to us.
The complexity and ongoing development of our wafer probe card manufacturing process, combined with increases in wafer probe card production volumes, have in the past and could in the future lead to design or manufacturing problems. For example, we have experienced the presence of contaminants in our plating baths, which have caused a decrease in our manufacturing yields or have resulted in unanticipated stress-related failures when our wafer probe cards are being used in the manufacturing test environment. This contamination problem caused a yield decline that, in turn, resulted in our inability to timely ship products to our customers. Manufacturing design errors such as the miswiring of a wafer probe card or the incorrect placement of probe contact elements have caused us to repeat manufacturing design steps. In addition to these examples, problems might result from a number of factors, including design defects, materials failures, failures of components manufactured by our suppliers to meet our specifications, contamination in the manufacturing environment, impurities in the materials used, unknown sensitivities to process conditions, such as temperature and humidity, and equipment failures. As a result, our products have in the past contained and might in the future contain undetected errors or defects. Any errors or defects could:
- •
- cause lower than anticipated yields and lengthen delivery schedules;
- •
- cause delays in product shipments;
- •
- cause delays in new product introductions;
- •
- cause us to incur warranty expenses;
- •
- result in increased costs and diversion of development resources;
- •
- cause us to incur increased charges due to unusable inventory;
- •
- require design modifications; or
- •
- decrease market acceptance or customer satisfaction with these products.
The occurrence of any one or more of these events could hurt our operating results.
In addition, if any of our products fails to meet specifications or has reliability, quality or compatibility problems, our reputation could be damaged significantly and customers might be reluctant to buy our products, which could result in a decline in revenues, an increase in product returns or warranty costs and the loss of existing customers or the failure to attract new customers. Our customers use our products with test equipment and software in their manufacturing facilities. Our products must be compatible with the customers' equipment and software to form an integrated system. While we have designed our test capabilities and standards to replicate the actual test environment of our customers and continually work to improve our capabilities, it is possible that our wafer probe card will perform differently in the customers' actual test environments. If our wafer probe card does not function properly within a customer's specific test environment, we could be required to provide field application engineers to locate the problem, which can take time and resources. If the problem relates to our wafer probe cards, we might have to invest significant capital, manufacturing capacity and other resources to correct it. Our current or potential customers also might seek to recover from us any losses resulting from defects or failures in our products. Liability claims could require us to spend significant time and money in litigation or to pay significant damages.
27
If our ability to forecast demand for our products deteriorates or the predictability of our manufacturing yields does not improve, we could incur higher inventory losses than we currently experience.
Each semiconductor chip design requires a custom wafer probe card. Because our products are design-specific, demand for our products is difficult to forecast. Due to our customers' short delivery time requirements, we often design, procure materials and, at times, produce our products in anticipation of demand for our products rather than in response to an order. Our manufacturing yields, particularly for new products, have historically been unpredictable and consequently, we generally produce more components for probe cards, or actual probe cards, than forecasted demand. If we do not obtain orders as we anticipate, or if we continue to produce excess inventory to compensate for unpredictable manufacturing yields, we could have excess or obsolete inventory for a specific customer design that we would not be able to sell to any other customer, which would likely result in inventory write-offs or material charges for scrap.
If we fail to maintain an effective system of internal and disclosure controls, we may not be able to accurately report our financial results or prevent fraud, which may adversely affect our business and reputation. In addition, current and potential stockholders could lose confidence in our financial reporting, which may adversely impact the trading price of our securities.
Effective internal and disclosure controls are necessary for us to provide reliable financial reports, to prevent fraud and to operate successfully as a public company. If we cannot provide reliable financial reports or prevent fraud, our business and reputation may be harmed. We regularly review and assess our internal control over financial reporting and our disclosure controls and procedures. As part of that process, we may discover material weaknesses or significant deficiencies in our internal control as defined under standards adopted by the Public Company Accounting Oversight Board, or PCAOB, that require remediation. A material weakness is a deficiency, or combination of deficiencies, in internal control over financial reporting, such that there is a reasonable possibility that a material misstatement of the company's annual or interim financial statements will not be prevented or detected in a timely basis. A significant deficiency is a deficiency or combination of deficiencies, in internal control over financial reporting that is less severe than a material weakness, yet important enough to merit attention by those responsible for the oversight of the company's financial reporting. For example, in November 2007, we completed a review of our historical practices with respect to inventory valuation. That review indicated that during fiscal 2006 and the first half of fiscal 2007 we did not consistently follow our accounting policies for determining inventory valuation. Specifically, we did not maintain effective controls to ensure that the estimation process to value inventory complied with our accounting policies. As a result, we restated our annual and interim financial statements for fiscal 2006 and interim financial statements for the first and second quarters of fiscal 2007 and made audit adjustments to our annual financial statements for fiscal 2007. As a result of weaknesses that may be identified in our internal controls, we may also identify certain deficiencies in some of our disclosure controls and procedures that we believe require remediation. If we discover weaknesses, we will make efforts to improve our internal and disclosure controls. However, there is no assurance that we will be successful. If we fail to maintain effective controls or timely affect any necessary improvement of our internal and disclosure controls, we may not have accurate information to make management decisions, our operating results could be harmed or we may fail to meet our reporting obligations, which could affect our ability to remain listed with the NASDAQ Global Market. Ineffective internal and disclosure controls could also cause stockholders to lose confidence in our reported financial information and our ability to manage our business, which would likely have a negative effect on the trading price of our securities.
28
We might be subject to claims of infringement of other parties' proprietary rights which could harm our business.
In the future, as we have in the past, we might receive claims that we are infringing intellectual property rights of others or inquiries about our interest in a license, or assertions that we need a license, to the intellectual property. The semiconductor industry is characterized by uncertain and conflicting intellectual property claims and vigorous protection and pursuit of these rights. The resolution of any claims of this nature, with or without merit, could be time consuming, result in costly litigation or cause product shipment delays. In the event of an adverse ruling or settlement, we might be required to pay substantial damages, cease the use or sale of infringing products, spend significant resources to develop non-infringing technology, discontinue the use of certain technology and/or enter into license agreements. License agreements, if required, might not be available on terms acceptable to us or at all. The loss of access to any of our intellectual property or the ability to use any of our technology could harm our business. Finally, certain of our customer contracts contain provisions that require us to defend and/or indemnify our customers for third party intellectual property infringement claims, which would increase the cost to us of an adverse ruling or settlement.
We may not be able to recruit or retain qualified personnel, which could harm our business.
We believe our ability to successfully manage and grow our business and to develop new products depends, in large part, on our ability to recruit and retain qualified employees, particularly highly skilled technical, sales, management, and key staff personnel. Competition for qualified resources is intense and other companies may have greater resources available to provide substantial inducements to lure key personnel away from us or to offer more competitive compensation packages to individuals we are trying to hire. Additionally, we have implemented global cost reduction plans in which we have reduced our workforce and our current stock price is significantly below the exercise prices associated with stock options granted to employees over the past several years, which makes it challenging to retain key people and recruit new talent, as needed. While we are implementing programs that will include goals for attracting employees and programs, which include goals of employee retention, and we may grant additional equity compensation to certain employees outside of our annual equity grant program for retention purposes, there can be no assurance that we will be able to successfully recruit and retain the qualified personnel we require.
We may make acquisitions and investments, which could put a strain on our resources, cause ownership dilution to our stockholders and adversely affect our financial results.
We may make acquisitions of complementary businesses, products or technologies in the future. In October 2009, we completed the acquisition of certain precision motion control automation assets from Electroglas, a company under Chapter 11 bankruptcy protection in Delaware. Prior to the acquisition, Electroglas was engaged in the supply of semiconductor manufacturing equipment and software to the semiconductor industry. The assets acquired consisted of manufacturing and testing equipment, spare parts and components related to the purchased equipment and other technology assets related to precision motion control automation and all of the intellectual property rights of Electroglas, with the exception of certain trademark rights.
We may also make certain investments in complementary or supplementary businesses, products or technologies in the future. Integrating newly acquired businesses, products or technologies into our company could put a strain on our resources, could be expensive and time consuming, and might not be successful. Future acquisitions and investments could divert our management's attention from other business concerns and expose our business to unforeseen liabilities or risks associated with entering new markets. In addition, we might lose key employees while integrating new organizations. We might not be successful in integrating any acquired businesses, products or technologies, and might not achieve anticipated revenues and cost benefits. Investments that we make may not result in a return consistent
29
with our projections upon which such investments are made, or may require additional investment that we did not originally anticipate. In addition, future acquisitions could result in customer dissatisfaction, performance problems with an acquired company, potentially dilutive issuances of equity securities or the incurrence of debt, contingent liabilities, possible impairment charges related to goodwill or other intangible assets or other unanticipated events or circumstances, any of which could harm our business.
As part of our sales process, we could incur substantial sales and engineering expenses that do not result in revenues, which would harm our operating results.
Our customers generally expend significant efforts evaluating and qualifying our products prior to placing an order. The time that our customers require to evaluate and qualify our wafer probe cards is typically between three and 12 months and sometimes longer. While our customers are evaluating our products, we might incur substantial sales, marketing, and research and development expenses. For example, we typically expend significant resources educating our prospective customers regarding the uses and benefits of our wafer probe cards and developing wafer probe cards customized to the potential customer's needs, for which we might not be reimbursed. Although we commit substantial resources to our sales efforts, we might never receive any revenues from a customer. For example, many semiconductor designs never reach production, including designs for which we have expended design effort and expense. In addition, prospective customers might decide not to use our wafer probe cards. The length of time that it takes for the evaluation process and for us to make a sale depends upon many factors including:
- •
- the efforts of our sales force and our distributor and independent sales representatives;
- •
- the complexity of the customer's fabrication processes;
- •
- the internal technical capabilities of the customer; and
- •
- the customer's budgetary constraints and, in particular, the customer's ability to devote resources to the evaluation process.
In addition, product purchases are frequently subject to delays, particularly with respect to large customers for which our products may represent a small percentage of their overall purchases. As a result, our sales cycles are unpredictable. If we incur substantial sales and engineering expenses without generating revenues, our operating results could be harmed.
Our failure to comply with environmental laws and regulations could subject us to significant fines and liabilities, and new laws and regulations or changes in regulatory interpretation or enforcement could make compliance more difficult and costly.
We are subject to various U.S. federal, state and local, and foreign governmental laws and regulations relating to the protection of the environment, including those governing the discharge of pollutants into the air and water, the management and disposal of hazardous substances and wastes, the cleanup of contaminated sites and the maintenance of a safe workplace. We could incur substantial costs, including cleanup costs, civil or criminal fines or sanctions and third-party claims for property damage or personal injury, as a result of violations of or liabilities under environmental laws and regulations or non-compliance with the environmental permits required at our facilities.
These laws, regulations and permits also could require the installation of costly pollution control equipment or operational changes to limit pollution emissions or decrease the likelihood of accidental releases of hazardous substances. In addition, changing laws and regulations, new laws and regulations, stricter enforcement of existing laws and regulations, the discovery of previously unknown contamination at our or others' sites or the imposition of new cleanup requirements could require us to curtail our operations, restrict our future expansion, subject us to liability and cause us to incur future costs that could harm our operations, thereby adversely impacting our operating results and cash flow.
30
Because we conduct most of our business internationally, we are subject to operational, economic, financial and political risks abroad.
Sales of our products to customers outside the United States have accounted for a significant part of our revenues. Our international sales as a percentage of our revenues were 81.9% and 80.2% for fiscal 2009 and fiscal 2008, respectively. Additionally, certain of our South Korean customers purchase through their North American subsidiaries. In the future, we expect international sales, particularly in Europe, Japan, South Korea and Taiwan, to continue to account for a significant percentage of our revenues. Accordingly, we will be subject to risks and challenges that we would not otherwise face if we conducted our business solely in the United States. These risks and challenges include:
- •
- compliance with a wide variety of foreign laws and regulations;
- •
- legal uncertainties regarding taxes, tariffs, quotas, export controls, export licenses and other trade barriers;
- •
- political and economic instability in, or foreign conflicts that involve or affect, the countries of our customers;
- •
- difficulties in collecting accounts receivable and longer accounts receivable payment cycles;
- •
- difficulties in staffing and managing personnel, distributors and representatives;
- •
- reduced protection for intellectual property rights in some countries;
- •
- currency exchange rate fluctuations, which could affect the value of our assets denominated in local currency, as well as
the price of our products relative to locally produced products;
- •
- seasonal fluctuations in purchasing patterns in other countries; and
- •
- fluctuations in freight rates and transportation disruptions.
Any of these factors could harm our existing international operations and business or impair our ability to continue expanding into international markets.
We may not obtain the tax and other benefits that we anticipate through the expansion of our operations into Singapore, which could negatively impact our operating results.
We have initiated the first phase of our company's global regionalization strategy in Singapore. Our plan, portions of which we have delayed, to build a front-end wafer manufacturing facility in Singapore, is driven in substantial part by the benefits that we believe are obtainable by operating in that country. These benefits include favorable tax exempt status granted by the Singapore government, subject to meeting certain conditions, as well as lower labor costs for qualified technical personnel. However, if we do not fulfill the conditions for our granted tax status for any reason, we may not obtain the full tax benefits, the tax benefits could lapse, any future tax benefits that we may seek may not be granted, and any benefits from royalty payments, or cost sharing payments, which have increased, could increase our effective tax rate. Additionally, our tax rate could be adversely impacted by any change in our planned operations in Singapore. Consequently, our effective corporate income tax rate may not decrease as we expect but, instead, may remain approximately the same or increase. In addition, the other benefits of operating in Singapore may not materialize. The inability to obtain the anticipated tax and other benefits through the expansion of certain operations into Singapore could negatively impact our operating results.
31
The trading price of our common stock has been and is likely to continue to be volatile, and you might not be able to sell your shares at or above the price that you paid for them.
The trading prices of the securities of technology companies have been highly volatile, and from January 1, 2009 through February 18, 2010, our stock price has ranged from $13.35 a share to $25.88 a share. The trading price of our common stock is likely to continue to be subject to wide fluctuations. Factors affecting the trading price of our common stock include:
- •
- variations in our operating results;
- •
- our forecasts and financial guidance for future periods;
- •
- announcements of technological innovations, new products or product enhancements, new product adoptions at semiconductor
customers or significant agreements by us or by our competitors;
- •
- reports regarding our ability to bring new products into volume production efficiently;
- •
- the gain or loss of significant orders or customers;
- •
- changes in the estimates of our operating results or changes in recommendations by any securities analysts that elect to
follow our common stock;
- •
- rulings on various of our pending litigations and proceedings relating to intellectual property matters;
- •
- seasonality, principally due to our customers' purchasing cycles;
- •
- market and competitive conditions in our industry, semiconductor industry and the economy as a whole; and
- •
- recruitment or departure of key personnel.
In addition, if the market for technology stocks or the stock market in general experiences loss of investor confidence, the trading price of our common stock could decline for reasons unrelated to our business, operating results or financial condition. The trading price of our common stock also might decline in reaction to events that affect other companies in our industry even if these events do not directly affect us.
Provisions of our certificate of incorporation and bylaws or Delaware law might discourage, delay or prevent a change of control of our company or changes in our management and, therefore, depress the trading price of our common stock.
Delaware corporate law and our certificate of incorporation and bylaws contain provisions that could discourage, delay or prevent a change in control of our company or changes in our management that the stockholders of our company may deem advantageous. These provisions:
- •
- establish a classified board of directors so that not all members of our board are elected at one time;
- •
- provide that directors may only be removed "for cause" and only with the approval of 662/3% of our
stockholders;
- •
- require super-majority voting to amend some provisions in our certificate of incorporation and bylaws;
- •
- authorize the issuance of "blank check" preferred stock that our board could issue to increase the number of outstanding
shares and to discourage a takeover attempt;
- •
- limit the ability of our stockholders to call special meetings of stockholders;
32
- •
- prohibit stockholder action by written consent, which requires all stockholder actions to be taken at a meeting of our
stockholders;
- •
- provide that the board of directors is expressly authorized to make, alter or repeal our bylaws; and
- •
- establish advance notice requirements for nominations for election to our board or for proposing matters that can be acted upon by stockholders at stockholder meetings.
In addition, Section 203 of the Delaware General Corporation Law may discourage, delay or prevent a change in control of our company. In addition, each of our named executive officers and certain other officers of the company have entered into change of control severance agreements, which were approved by our Compensation Committee, which could increase the costs associated with a change of control and thus, potentially deter such a transaction.
Item 1B: Unresolved Staff Comments
None.
Our corporate headquarters, which includes sales, marketing, administration, manufacturing, engineering, and research and development facilities, is located in Livermore, California, United States. Our corporate headquarters is comprised of a campus of six buildings totaling approximately 210,000 square feet. We presently lease those six buildings. We also own one building which was a part of our older manufacturing facility and which we are no longer using. That building is presently for sale. In addition, we also lease office, repair and service, manufacturing and/or research and development space outside of the United States. The leases expire at various times through 2021. We believe that our existing and planned facilities are suitable for our current needs.
33
Information concerning our properties as of December 26, 2009 is set forth below:
Location
|
Principal Use | Square Footage |
Ownership | ||||
|---|---|---|---|---|---|---|---|
| Livermore, California, United States | Corporate headquarters, sales, marketing, product design, manufacturing, service and repair engineering, distribution, research and development | 208,114 | Leased | ||||
Singapore |
Sales, finance, design, service, field service, supply chain , factory, stockroom, warehousing and manufacturing |
46,870 |
Leased |
||||
Jubei City, Hsinchu, Taiwan |
Sales office, product design, field service and service and repair center |
18,188 |
Leased |
||||
Tokyo, Japan |
Sales office, marketing, product design, research and development |
10,581 |
Leased |
||||
Yokohama City, Japan |
Field service, service and repair center and manufacturing |
8,777 |
Leased |
||||
Gyeonggi-do, South Korea |
Sales office, product design, field service, service, repair center and manufacturing |
7,979 |
Leased |
||||
Munich, Germany |
Sales office |
918 |
Leased |
||||
Milan, Italy |
Sales office and field service |
915 |
Leased |
||||
Hiroshima, Japan |
Research and development |
642 |
Leased |
||||
People's Republic of China |
Sales office |
194 |
Leased |
||||
From time to time, we may be subject to legal proceedings and claims in the ordinary course of business. As of the filing of this Form 10-K, we were not involved in any material legal proceedings, other than the proceedings summarized below. In the future we may become a party to additional legal proceedings, including proceedings designed to protect our intellectual property rights and to collect past due accounts receivable from our customers, that may require us to spend significant resources.
We believe that the factual allegations and circumstances underlying the legal proceedings described below that have been filed against us are without merit. We also believe that our company does not have a material monetary damages exposure in these legal proceedings that would individually or in the aggregate have a material adverse effect on our financial condition, liquidity or results of operations; however, these legal proceedings have been costly and it is possible we will incur significant, and possibly material, attorneys' fees, which may not be covered by our insurance policies. These legal proceedings may also divert our management's time and attention away from business operations, which could prove to be disruptive to our business operations. In addition, an unfavorable outcome or settlement of these proceedings, particularly if it is not covered by or exceeds our insurance coverage, could individually or in the aggregate adversely impact our financial condition, liquidity or results of operations.
34
Patent Litigation
We initiated patent infringement litigation in the United States against Phicom Corporation, a Korea corporation, with a current operating name of TSC Memsys Corp., here referred to as Phicom, and against Micronics Japan Co., Ltd., a Japan corporation, and its U.S. subsidiary, both collectively "Micronics Japan." In 2005, we filed a patent infringement lawsuit in the United States District Court for the District of Oregon against Phicom charging that it is willfully infringing four U.S. patents that cover key aspects of our wafer probe cards—U.S. Patent Nos. 5,974,662, 6,246,247, 6,624,648, and 5,994,152. In 2006, we also filed an amended complaint in the same Oregon district court adding two additional patents to the litigation—U.S. Patent Nos. 7,073,254 and 6,615,485. Also in 2006, we filed a patent infringement lawsuit in the United States District Court for the Northern District of California against Micronics Japan charging that it is willfully infringing four U.S. patents that cover key aspects of our wafer probe cards—U.S. Patent Nos. 6,246,247, 6,509,751, 6,624,648, and 7,073,254.
These two district court actions were stayed pending resolution of the complaint that we filed with the United States International Trade Commission, or ITC, on or about November 13, 2007, seeking institution of a formal investigation into the activities of Micronics Japan and Phicom. The requested investigation as filed encompassed U.S. Patent Nos. 5,994,152, 6,509,751, 6,615,485, 6,624,648 and 7,225,538 and alleged that infringement by each of Micronics Japan and Phicom of certain of the identified patents constitute unfair acts in violation of 19 U.S.C. Section 1337 and alleged violations of Section 337 of the Tariff Act of 1930 in the importation into the United States of certain probe card assemblies, components thereof, and certain tested DRAM and NAND flash memory devices and products containing such devices that infringe patents owned by us.
In November 2009 in response to a request for review of prior decisions by an ITC Administrative Law Judge, the Commission issued a decision, which is termed a "final determination," finding certain of FormFactor's asserted patent claims valid, but not infringed, and other asserted patent claims invalid. The Commission did not find a violation of Section 337 of the Tariff Act of 1930 and terminated the investigation without issuing an exclusionary order against any products. We did not appeal the final determination to the Court of Appeals for the Federal Circuit. As a consequence, we anticipate that the stays in the two district court actions will be lifted and the actions will proceed forward.
In addition to the United States litigations, we also initiated actions in Seoul, South Korea against Phicom. In 2004 we filed two actions in Seoul Southern District Court, located in Seoul, South Korea, against Phicom alleging infringement of our Korean Patent Nos. 252,457, 324,064, 278,342 and 399,210. In the action alleging infringement of our Korean Patent Nos. 278,342 and 399,210, the Seoul Southern District Court closed the case after rejecting our petition. The Seoul Southern District Court also rendered decisions unfavorable to us related to our Korean Patent Nos. 252,457 and 324,064 and the Seoul High Court recently dismissed our appeals of those decisions. The Seoul High Court decisions are subject to a final appeal, if we so elect, to the Korea Supreme Court. We also in 2006 filed in the Seoul Central District Court two actions, including a preliminary injunction action, against Phicom alleging infringement of certain claims of our Korea Patent No. 252,457. The Seoul Central District Court did not accept the preliminary injunction action and both actions have been closed.
In response to our initiation of the infringement actions in Korea, Phicom filed in the Korean Intellectual Property Office, or KIPO, invalidity actions challenging the validity of some or all of the claims of each of our four patents at issue in the Seoul Southern District Court infringement actions. KIPO dismissed Phicom's challenges against all four of the patents-at-issue. Phicom appealed the dismissals of the challenges to the Korea Patent Court. In 2006, the Korea Patent Court issued a ruling upholding the validity of our Korean Patent No. 252,457, the only one of the four patents still subject to litigation. Phicom appealed the Patent Court ruling on Korean Patent No. 252,457 to the Korea Supreme Court. In June 2008, the Korea Supreme Court reversed the Patent Court ruling and finding invalid certain claims of our Korean Patent No. 252,457 and remanding the case for further trial to the
35
Patent Court, and the case is now pending in KIPO. We filed a correction trial with KIPO on certain claims of Korean Patent No. 252,457 and that case is also pending.
Additionally, one or more third parties have initiated challenges in the U.S. and in foreign patent offices against certain of the above and other of our patents. These actions include re-examination proceedings filed in the U.S. Patent and Trademark Office, USPTO, against three of our U.S. patents that were at issue in the ITC investigation. In two of the USPTO reexamination proceedings, all of the challenged claims have been finally rejected as non-patentable, and we have requested a review of those rejections; in the third USPTO reexamination proceeding, the challenged claims have not been finally rejected. The foreign actions include proceedings in Korea against two of our Korean patents, and proceedings in Taiwan against four of our Taiwan patents.
No provision has been made for patent-related litigation because we believe that it is not probable that a liability had been incurred as of December 26, 2009. We will incur material attorneys' fees in prosecuting and defending the various identified actions.
Securities Litigation
On October 31, 2007, a plaintiff filed a purported stockholder class action in the United States District Court for the Northern District of California in which we and certain of our then officers, including one former officer who was a director at the time of filing, are named as defendants under the caption "Danny McCasland, Individually and on Behalf of All Others Similarly Situated v. FormFactor, Inc., Igor Y. Khandros, Ronald C. Foster and Richard M. Freeman." Subsequently, plaintiffs filed two other purported stockholder class actions in the United States District Court for the Northern District of California under the captions "Yuk Ling Lui, on Behalf of Herself and All Others Similarly Situated v. FormFactor, Inc., Igor Y. Khandros, Ronald C. Foster and Richard M. Freeman," and "Victor Albertazzi, Individually and on Behalf of All Others Similarly Situated v. FormFactor, Inc., Igor Y. Khandros, Ronald C. Foster and Richard M. Freeman." The three actions were consolidated. The plaintiffs filed these actions following our restatement of our financial statements for the fiscal year ended December 30, 2006, for each of the fiscal quarters for that year, and for the fiscal quarters ended March 31 and June 30, 2007. On July 25, 2008, the court granted the defendants' motion to dismiss the Consolidated Amended Complaint with leave to amend. On August 22, 2008 the designated lead plaintiffs filed a Second Amended Complaint. The Second Amended Complaint again alleged violations of Sections 10(b) and 20(a), and Rule 10b-5 of the Securities Exchange Act of 1934. Plaintiffs sought to recover unspecified monetary damages, equitable relief and attorneys' fees and costs. On July 14, 2009, the court issued a ruling granting motions to dismiss the Second Amended Complaint without leave to amend. On July 28, 2009, plaintiffs filed a Motion to Alter or Amend the Judgment and to Uphold a Revised, Narrowed Second Amended Complaint. On September 14, 2009, the court issued a ruling denying plaintiffs' Motion to Alter or Amend the Judgment and to Uphold a Revised, Narrowed Second Amended Complaint. Plaintiffs appealed to the Court of Appeals for the Ninth Circuit the Judgment dismissing the case and the Court's ruling denying their Motion to Alter or Amend the Judgment, but thereafter determined to withdraw the appeal. Upon motion by the plaintiffs/appellants, the Ninth Circuit dismissed the appeal, with each side bearing its own costs. Upon motion by the plaintiffs/appellants, the Ninth Circuit dismissed the appeal, with each side bearing its own costs.
No provision was made for the securities litigation because we believe that it is not probable that a liability had been incurred as of December 26, 2009.
Stockholder Derivative Litigation
On November 19, 2007, a plaintiff filed a purported stockholder derivative action in the Superior Court of the State of California for the County of Alameda in which we were named as a nominal
36
defendant and certain of our then directors and then officers were named as defendants under the caption "John King, Derivatively on Behalf of Nominal Defendant FormFactor, Inc. v. Dr. Igor Y. Khandros, Dr. Homa Bahrami, Dr. Thomas J. Campbell, G. Carl Everett, Jr., Lothar Maier, James A. Prestridge, Harvey A. Wagner, Ronald C. Foster and Richard M. Freeman, and FormFactor, Inc." Subsequently, another plaintiff filed a second purported stockholder derivative action in the Superior Court of the State of California for the County of Alameda under the caption "Joseph Priestley, Derivatively on Behalf of FormFactor, Inc. v. Igor Y. Khandros, Mario Ruscev, James A. Prestridge, Thomas J. Campbell, Harvey A. Wagner, G. Carl Everett, Jr., Homa Bahrami, Lothar Maier, William H. Davidow and Joseph R. Bronson, and FormFactor, Inc." The plaintiffs filed these derivative actions following our company's restatement of its financial statements for the fiscal year ended December 30, 2006, for each of the fiscal quarters for that year, and for the fiscal quarters ended March 31 and June 30, 2007. The plaintiffs alleged that the individual defendants breached their fiduciary duties and violated applicable law by issuing, and permitting our company to issue, materially false and misleading statements regarding our company's business and financial results prior to the restatements. The plaintiffs sought to recover monetary damages, and attorneys' fees and costs. Plaintiffs thereafter voluntarily dismissed without prejudice the two derivative actions, which had been consolidated. Although the cases have been dismissed, plaintiffs have the right to re-file the actions in the future. The two derivative actions, which had been consolidated, have been dismissed without prejudice, though two plaintiffs have the right to re-file the actions at some point in the future.
No provision was made for the stockholder derivative litigation because we believe that it is not probable that a liability had been incurred as of December 26, 2009.
Commercial Litigation
On February 20, 2009, we filed a complaint for breach of contract, common counts, account stated and injunctive relief against Spansion, LLC, a Delaware limited liability company ("Spansion"), in the state superior court located in Santa Clara County, California. The complaint alleges that Spansion, in breach of Spansion's obligations under a purchase agreement entered into by us and Spansion, has failed to pay us for probe cards that we designed, developed and manufactured pursuant to several purchase orders placed by Spansion with us pursuant to the agreement. The complaint states that as of February 13, 2009, Spansion owed us $8,094,533 for probe cards delivered by us and not paid for by Spansion. In the complaint, we are seeking (i) payment of at least $8,094,533, (ii) a temporary protective order and an injunction enjoining Spansion from assigning or in any way divesting itself of any monies that we believe Spansion received from a certain third party entity, (iii) a prejudgment writ of attachment in favor of us over Spansion's corporate assets and property, (iv) costs and (v) attorney's fees. Prior to making any appearance or filing any answer in the action, Spansion filed for protection under Chapter 11 of the Bankruptcy Laws of the United States, which served to stay our complaint against Spansion. In November 2009, we sold all rights, title and interest in the bankruptcy claim to a third party in exchange for net proceeds of less than full value of the asserted claim.
Item 4: Submission of Matters to a Vote of Security Holders
None.
37
Item 5: Market for Registrant's Common Equity, Related Stockholder Matters and Issuer Purchases of Equity Securities
Price Range of Common Stock
Our common stock is listed on the Nasdaq Global Market under the symbol "FORM". The following table sets forth the range of high and low sales prices per share as reported on the Nasdaq Global Market for the periods indicated.
Fiscal 2009
|
High | Low | |||||
|---|---|---|---|---|---|---|---|
First Quarter |
$ | 19.06 | $ | 13.10 | |||
Second Quarter |
21.76 | 15.47 | |||||
Third Quarter |
26.08 | 17.05 | |||||
Fourth Quarter |
24.63 | 15.20 | |||||
Fiscal 2008
|
High | Low | |||||
|---|---|---|---|---|---|---|---|
First Quarter |
$ | 33.86 | $ | 16.17 | |||
Second Quarter |
22.84 | 17.16 | |||||
Third Quarter |
22.48 | 15.56 | |||||
Fourth Quarter |
18.92 | 11.36 | |||||
The closing sales price of our common stock on the Nasdaq Global Market was $17.05 per share on February 18, 2010. As of February 18, 2010, there were 68 registered holders of record of our common stock.
Dividend Policy
We have never declared or paid cash dividends on our common stock. We currently expect to retain all available funds and any future earnings for use in the operation and development of our business. Accordingly, we do not anticipate declaring or paying cash dividends on our common stock in the foreseeable future.
38
Stock Price Performance Graph
The following graph shows the total stockholder return of an investment of $100 in cash on December 31, 2004 through December 31, 2009, for (1) our common stock, (2) the S&P 500 Index and (3) the RDG Semiconductor Composite Index. All values assume reinvestment of the full amount of all dividends. No cash dividends have been declared on shares of our common stock. Stockholder returns over the indicated period are based on historical data and are not necessarily indicative of future stockholder returns.
COMPARISON OF 5 YEAR CUMULATIVE TOTAL RETURN*
Among FormFactor, Inc., The S&P 500 Index
And The RDG Semiconductor Composite Index
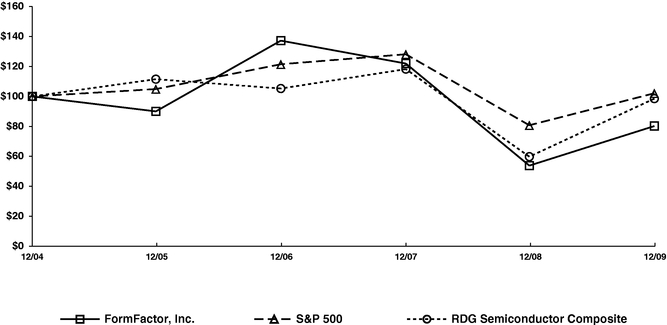
| |
Cumulative Total Return | ||||||||||||||||||
|---|---|---|---|---|---|---|---|---|---|---|---|---|---|---|---|---|---|---|---|
| |
December 31, 2004 |
December 31, 2005 |
December 31, 2006 |
December 31, 2007 |
December 31, 2008 |
December 31, 2009 |
|||||||||||||
FormFactor, Inc. |
100.00 | 90.01 | 137.25 | 121.96 | 53.80 | 80.21 | |||||||||||||
S & P 500 |
100.00 | 104.91 | 121.48 | 128.16 | 80.74 | 102.11 | |||||||||||||
RDG Semiconductor Composite |
100.00 | 111.51 | 105.27 | 118.23 | 59.77 | 98.51 | |||||||||||||
- *
- $100
invested on December 31, 2004 in stock or index, including reinvestment of dividends.
Fiscal year ending December 31.
39
Item 6: Selected Financial Data
The following selected consolidated financial data are derived from our consolidated financial statements. This data should be read in conjunction with our consolidated financial statements and the related notes, and "Item 7: Management's Discussion and Analysis of Financial Condition and Results of Operations".
| |
Fiscal 2009(3) |
Fiscal 2008(3) |
Fiscal 2007(3) |
Fiscal 2006(3) |
Fiscal 2005 |
|||||||||||||
|---|---|---|---|---|---|---|---|---|---|---|---|---|---|---|---|---|---|---|
| |
(In thousands, except per share data) |
|||||||||||||||||
Consolidated Statements of Operations Data: |
||||||||||||||||||
Revenues |
$ | 135,335 | $ | 210,189 | $ | 462,191 | $ | 369,213 | $ | 237,495 | ||||||||
Cost of revenues |
135,804 | 173,926 | 215,484 | 184,087 | 130,102 | |||||||||||||
Gross profit (loss) |
(469 | ) | 36,263 | 246,707 | 185,126 | 107,393 | ||||||||||||
Operating expenses |
||||||||||||||||||
Research and development |
57,509 | 65,509 | 60,951 | 46,608 | 28,348 | |||||||||||||
Selling, general and administrative(5) |
78,428 | 95,208 | 92,552 | 71,540 | 43,744 | |||||||||||||
Restructuring(1) |
8,780 | 9,157 | — | — | — | |||||||||||||
Impairment of long lived assets(2) |
— | 4,400 | — | — | — | |||||||||||||
Total operating expenses |
144,717 | 174,274 | 153,503 | 118,148 | 72,092 | |||||||||||||
Operating (loss) income |
(145,186 | ) | (138,011 | ) | 93,204 | 66,978 | 35,301 | |||||||||||
Interest income |
3,282 | 12,446 | 22,508 | 15,183 | 4,282 | |||||||||||||
Other income (expense), net |
(535 | ) | 653 | 528 | 204 | (1,091 | ) | |||||||||||
Income (loss) before income taxes |
(142,439 | ) | (124,912 | ) | 116,240 | 82,365 | 38,492 | |||||||||||
Provision for (benefit from) income taxes(4) |
13,214 | (44,291 | ) | 43,350 | 25,148 | 8,310 | ||||||||||||
Net (loss) income |
$ | (155,653 | ) | $ | (80,621 | ) | $ | 72,890 | $ | 57,217 | $ | 30,182 | ||||||
Net (loss) income per share available to common stockholders: |
||||||||||||||||||
Basic |
$ | (3.15 | ) | $ | (1.65 | ) | $ | 1.52 | $ | 1.27 | $ | 0.76 | ||||||
Diluted |
$ | (3.15 | ) | $ | (1.65 | ) | $ | 1.47 | $ | 1.21 | $ | 0.73 | ||||||
Weighted-average number of shares used in per share calculations: |
||||||||||||||||||
Basic |
49,483 | 48,905 | 48,044 | 45,172 | 39,547 | |||||||||||||
Diluted |
49,483 | 48,905 | 49,557 | 47,193 | 41,590 | |||||||||||||
Consolidated Balance Sheet Data: |
||||||||||||||||||
Cash, cash equivalents and marketable securities |
$ | 449,235 | $ | 522,894 | $ | 570,046 | $ | 492,394 | $ | 211,608 | ||||||||
Working capital |
482,607 | 576,754 | 622,093 | 517,218 | 232,110 | |||||||||||||
Total assets |
655,968 | 785,710 | 855,322 | 694,473 | 381,361 | |||||||||||||
Deferred stock based compensation, net |
— | — | — | — | (2,495 | ) | ||||||||||||
Total stockholders' equity |
577,781 | 706,064 | 756,950 | 614,041 | 317,789 | |||||||||||||
- (1)
- Fiscal
2009 and fiscal 2008 operating results include restructuring charges of $8.8 million and $9.2 million, respectively, relating to our
global reorganization efforts. (See Note 6 of Notes to the Consolidated Financial Statements).
- (2)
- Fiscal
2008 operating results include an impairment charge of $4.4 million related to Singapore construction-in-progress
assets (See Note 3 of Notes to the Consolidated Financial Statements).
- (3)
- Effective December 31, 2005, the first day of fiscal 2006, we adopted the appropriate accounting guidance on share based payments. As a result, we have included stock-based compensation costs
40
in our results of operations beginning in fiscal 2006. (See Note 10 of Notes to the Consolidated Financial Statements).
- (4)
- We
recorded a valuation allowance of $57.7 million in fiscal 2009 against the U.S. excess tax benefits, including prior years, based on our
assessment of realizability of our U.S. deferred tax assets. This charge resulted in an income tax provision, rather than an income tax benefit, for fiscal 2009.
- (5)
- Fiscal 2009 and fiscal 2008 selling, general and administrative expenses include a provision for doubtful accounts receivable of $5.0 million and $4.1 million, respectively (See Note 2 of Notes to the Consolidated Financial Statements).
41
Item 7: Management's Discussion and Analysis of Financial Condition and Results of Operations
The following discussion and analysis of our financial condition and results of operations should be read in conjunction with our consolidated financial statements and the related notes included elsewhere in this Annual Report on Form 10-K. In addition to historical consolidated financial information, the following discussion and analysis contains forward-looking statements that involve risks, uncertainties and assumptions as described under the "Note Regarding Forward-Looking Statements" that appears earlier in this Annual Report on Form 10-K. Our actual results could differ materially from those anticipated by these forward-looking statements as a result of many factors, including those discussed under "Item 1A: Risk Factors" and elsewhere in this Annual Report on Form 10-K.
Overview
We design, develop, manufacture, sell and support precision, high performance advanced semiconductor wafer probe card products and solutions. Semiconductor manufacturers use our wafer probe cards to perform wafer sort and test on the semiconductor die, or chips, on the whole semiconductor wafer, which is prior to singulation of the wafer into individual separate chips. We work closely with our customers on product design, as each wafer probe card is a custom product that is specific to the chip and wafer designs of the customer. We have derived substantially all of our revenues from the sale of wafer probe cards incorporating our proprietary technology, including our MicroSpring interconnect technology.
The overall global economic downturn and uncertainty in fiscal 2009 had a significant impact on global semiconductor device manufacturing, which, coupled with an oversupply of memory devices, resulted in a significant decrease in demand and a challenging environment for our advanced wafer probe cards. Our revenues declined by 35.6%, or $74.9 million, in fiscal 2009 as compared to fiscal 2008. This revenue decline was in each of the product markets we address—Dynamic Random Access Memory, or DRAM, NAND and NOR Flash memory and System on a Chip, or SoC. These results were due to a number of factors including the relative supply and demand of various semiconductor devices and end products incorporating those devices, semiconductor manufacturers' efforts to curtail spending and conserve cash by taking capacity offline, reducing production, delaying the transition to new technology nodes and postponing the implementation of tooling cycles.
We incurred net losses of $155.7 million and $80.6 million in fiscal 2009 and fiscal 2008, respectively. Net loss increased in fiscal 2009 as compared to fiscal 2008 primarily due to lower revenues across all market segments as well as reduced gross margins on product sales. Results for fiscal 2009 also included the recognition of a valuation allowance of $57.7 million for our deferred tax assets, restructuring charges of $8.8 million, $2.5 million in a stock-based compensation charge related to an option modification in connection with the retirement of our founder and former executive chairman of our board of directors in May 2009, as well as $5.0 million in provision for bad debts due to the heightened risk of non-payment of certain accounts receivable. Net loss for fiscal 2008 included $13.6 million in restructuring and impairment charges and $4.1 million in provision for doubtful debts.
Our cash, cash equivalents and marketable securities totaled approximately $449.2 million as of December 26, 2009 as compared to $522.9 million at December 27, 2008. The decrease in our cash, cash equivalents and marketable securities balances was primarily due to the use of cash for operating activities in fiscal 2009. We also paid $12.0 million in the fourth quarter of fiscal 2009 for the acquisition of manufacturing and testing equipment and technology assets, including intellectual property assets, from Electroglas, Inc. We believe that we will be able to satisfy our working capital requirements for the next twelve months with the liquidity provided by our existing cash, cash equivalents and marketable securities. If we are unsuccessful in improving our operating efficiency, reducing our cash outlays or increasing our available cash through financing, our cash, cash equivalents and marketable securities will further decline in fiscal 2010.
42
In response to the continued deterioration in semiconductor market conditions, we are focusing on aligning our operations and improving our operating efficiency to achieve operating cash flow break-even in the current business environment and to better position our company for long-term, profitable growth. In January 2009, we initiated a global reorganization and cost reduction plan designed to lower the company's cash breakeven level in order to enable us to sustain ourselves financially in the current market environment. As part of the plan, we reduced our workforce by 22%. We also implemented certain non-severance measures that we expect to result in future cost savings. We also incurred restructuring charges in the fourth quarter of fiscal 2009 as we continued our efforts to lower our quarterly operating expense run rate.
In addition, we are restructuring our operations through our global regionalization strategy by, for example, placing more decision-making in regions close to our semiconductor customers, and strengthening our local design, application and service capabilities to improve customer responsiveness and enhance our relationships with our customers. We are also changing our manufacturing structure to realize a shorter cycle time and improved product delivery capabilities. We have accelerated our regionalization efforts by bringing up back-end manufacturing operations in Asia. We qualified our back-end manufacturing in Korea during our first quarter of fiscal 2009, and in Japan in the fourth quarter of fiscal 2009. We currently plan to qualify a significant portion of our front-end manufacturing operations in Singapore in fiscal 2010. The combination of these initiatives is intended to result in a lower manufacturing cost, a simplified manufacturing process and decreased cycle times for our customers.
We believe the following information is important to understanding our business, our financial statements and the remainder of this discussion and analysis of our financial condition and results of operations:
Fiscal Year. Fiscal years ended December 26, 2009, December 27, 2008 and December 29, 2007 had 52 weeks each. Our fiscal year ends on the last Saturday in December.
Revenues. We derive substantially all of our revenues from product sales of wafer probe cards. Revenues from our customers are subject to fluctuations due to factors including, but not limited to, design cycles, technology adoption rates, competitive pressure to reduce prices, cyclicality of the different end markets into which our customers' products are sold and market conditions in the semiconductor industry. Historically, increases in revenues have resulted from increased demand for our existing products, the introduction of new, more complex products and the penetration of new markets. We expect that revenues from the sale of wafer probe cards will continue to account for substantially all of our revenues for the foreseeable future.
Cost of Revenues. Cost of revenues consists primarily of manufacturing materials, payroll, shipping and handling costs and, manufacturing-related overhead. Our manufacturing operations rely upon a limited number of suppliers to provide key components and materials for our products, some of which are a sole source. We order materials and supplies based on backlog and forecasted customer orders. Tooling and setup costs related to changing manufacturing lots at our suppliers are also included in the cost of revenues. We expense all warranty costs and inventory provisions as cost of revenues.
We design, manufacture and sell a custom product into the semiconductor test market, which is subject to significant variability and demand fluctuations. Our wafer probe cards are complex products that are custom to a specific chip design of a customer and must be delivered on relatively short lead-times as compared to our overall manufacturing process. As our advanced wafer probe cards are manufactured in low volumes and must be delivered on relatively short lead-times, it is not uncommon for us to acquire production materials and start certain production activities based on estimated production yields and forecasted demand prior to or in excess of actual demand for our wafer probe cards. We record an adjustment to our inventory valuation for estimated obsolete and non-saleable
43
inventories based on assumptions about future demand, changes to manufacturing processes, and overall market conditions.
Research and Development. Research and development expenses include expenses related to product development, engineering and material costs. Almost all research and development costs are expensed as incurred. We plan to continue to invest in research and development activities to improve and enhance existing technologies and to develop new technologies for current and new markets and for new applications.
Selling, General and Administrative. Selling, general and administrative expenses include expenses related to sales, marketing, and administrative personnel, provision for doubtful accounts, internal and outside sales representatives' commissions, market research and consulting, and other sales, marketing, and administrative activities. These expenses also include costs for protecting and enforcing our patent rights and regulatory compliance costs.
Restructuring Charges. Restructuring charges include expenses related to employee termination severance pay and benefits, and property and equipment impairment charges incurred as part of our cost reduction plans.
Use of Estimates. The preparation of consolidated financial statements in conformity with generally accepted accounting principles in the United States of America ("GAAP") requires management to make estimates and assumptions that affect the reported amounts of assets and liabilities, the disclosure of contingent assets and liabilities at the date of the financial statements, and the reported amounts of revenues and expenses during the reporting period. Actual results could differ from those estimates. Estimates may change as new information is obtained. Significant items that are subject to such estimates include the fair value of revenue elements, fair value of marketable securities, allowance for doubtful accounts, reserves for product warranty, valuation of obsolete and slow moving inventory, valuation of intangible assets, the assessment of recoverability of long-lived assets, valuation and recognition of stock-based compensation, provision for income taxes and valuation allowance for deferred tax assets and, tax liabilities and accruals for other liabilities.
Critical Accounting Policies and Estimates
Our discussion and analysis of our financial condition and results of operations are based upon our consolidated financial statements, which have been prepared in accordance with U.S. generally accepted accounting principles. The preparation of these financial statements require us to make estimates and assumptions that affect the reported amounts of assets and liabilities at the date of the financial statements and the reported amounts of net revenue and expenses in the reporting period. Our accounting policies are fundamental to understanding our financial condition and results of operations reported in our financial statements and related disclosures. We have identified the following accounting policies as being critical because they require our management to make particularly difficult, subjective and/or complex judgments about the effect of matters that are inherently uncertain. We evaluate our estimates and assumptions on an ongoing basis and we base these estimates and assumptions on current facts, historical experiences and various other factors and assumptions that are believed to be reasonable under the circumstances. Actual results may differ materially and adversely from our estimates. Our management has discussed the development, selection, application and disclosure of these critical accounting policies with the Audit Committee of our Board of Directors.
Revenue Recognition: We recognize revenue when persuasive evidence of a sales arrangement exists, delivery has occurred or services are rendered, the sales price or fee is fixed or determinable and collectability is reasonably assured. In instances where final acceptance of our product is specified by our customer, revenue is deferred until all acceptance criteria have been met.
44
In multiple element arrangements, we determine whether there is more than one unit of accounting. To the extent that the deliverables are separable into multiple units of accounting, we then allocate the total fee on such arrangements to the individual units of accounting based on relative fair value of individual elements.
We offer product maintenance and repair arrangements to our customers. Amounts due from our customers under these arrangements are initially recorded as deferred revenues. The fees are recognized as revenue on a straight-line basis over the service period and related costs are recorded as incurred.
Revenues from the licensing of our design and manufacturing technology, which have been insignificant to date, are recognized over the term of the license agreement or when the significant contractual obligations have been fulfilled.
Warranty Accrual: We provide for the estimated cost of product warranties at the time revenue is recognized. While we engage in extensive product quality programs and processes, including actively monitoring and evaluating the quality of our component suppliers, our warranty obligation is affected by product failure rates, material usage and service delivery costs incurred in correcting a product failure. We continuously monitor product returns for warranty and maintain a reserve for the related expenses based upon our historical experience and any specifically identified field failures. As we sell new products to our customers, we must exercise considerable judgment in estimating the expected failure rates. This estimating process is based on historical experience of similar products, as well as various other assumptions that we believe to be reasonable under the circumstances.
Inventory Valuation: We state our inventories at the lower of cost (principally standard cost which approximates actual cost on a first in, first out basis) or market. We review the adequacy of our inventory reserves on a quarterly basis and record adjustments to our inventory valuation for estimated obsolescence or non-saleable inventories equal to the difference between the cost of inventories and the estimated market value based upon assumptions about future demand and market conditions.
Allowance for Doubtful Accounts: A majority of our trade receivables are derived from sales to large multinational semiconductor manufacturers throughout the world. In order to monitor potential credit losses, we perform ongoing credit evaluations of our customers' financial condition. An allowance for doubtful accounts is maintained for probable credit losses based upon our assessment of the expected collectability of all accounts receivable. The allowance for doubtful accounts is reviewed on a quarterly basis to assess the adequacy of the allowance. We take into consideration (1) any circumstances of which we are aware of a customer's inability to meet its financial obligations; and (2) our judgments as to prevailing economic conditions in the industry and their impact on our customers.
Impairment of Long-Lived Assets and Long-Lived Assets to be Disposed of: We evaluate the carrying value of our long-lived assets whenever certain events or changes in circumstances indicate that the carrying amount of these assets may not be recoverable. Such events or circumstances include, but are not limited to, a prolonged industry downturn, a significant decline in our market value or significant reductions in projected future cash flows.
Significant judgments and assumptions are required in the forecast of future operating results used in the preparation of the estimated future cash flows, including profit margins, long-term forecasts of the amounts and timing of overall market growth and our percentage of that market, groupings of assets, discount rates and terminal growth rates. In addition, significant estimates and assumptions are required in the determination of the fair value of our tangible long-lived assets, including replacement cost, economic obsolescence, and the value that could be realized in orderly liquidation. Changes in these estimates could have a material adverse effect on the assessment of our long-lived assets, thereby requiring us to write down the assets.
45
Accounting for Income Taxes: We utilize the asset and liability method of accounting for income taxes, under which deferred taxes are determined based on the temporary differences between the financial statement and tax basis of assets and liabilities using tax rates expected to be in effect during the years in which the basis differences reverse. We estimate our provision for income taxes and amounts ultimately payable or recoverable in numerous tax jurisdictions around the world. Estimates involve interpretations of regulations and are inherently complex. Resolution of income tax treatments in individual jurisdictions may not be known for many years after completion of any fiscal year. We are required to evaluate the realizability of our deferred tax assets on an ongoing basis in accordance with U.S. GAAP to determine whether there is a need for a valuation allowance with respect to such deferred tax assets. A valuation allowance is recorded when it is more likely than not that some of the deferred tax assets will not be realized. Significant management judgment is required in determining any valuation allowance recorded against deferred tax assets. In evaluating the ability to recover deferred tax assets, we consider available positive and negative evidence giving greater weight to our recent cumulative losses and our ability to carryback losses against prior taxable income and, commensurate with objective verifiability, the forecast of future taxable income including the reversal of temporary differences and the implementation of feasible and prudent tax planning strategies.
In July 2006, the FASB issued guidance regarding the accounting for uncertainty in income taxes, which clarifies the accounting for uncertainty in income taxes recognized in the financial statements, which we adopted the first quarter of fiscal 2007. Income tax positions must meet a more-likely-than-not recognition threshold to be recognized. This interpretation provides guidance on measurement, derecognition, classification, interest and penalties, accounting in interim periods and disclosure. We recognize interest and penalties related to unrecognized tax benefits within the income tax provision. Accrued interest and penalties are included within the related tax liability line in the consolidated balance sheet.
The amount of income taxes we pay is subject to ongoing audits by U.S. federal and state, and foreign tax authorities which might result in proposed assessments. Our estimate for the potential outcome for any uncertain tax issue is judgmental in nature. However, we believe we have adequately provided for any reasonable foreseeable outcome related to those matters. Our future results may include favorable or unfavorable adjustments to our estimated tax liabilities in the period the assessments are made or resolved or when statutes of limitation on potential assessments expire.
Stock-Based Compensation: Under provisions of accounting standards, stock-based compensation cost is estimated at the grant date based on the fair-value of the award and is recognized as expense ratably over the requisite service period of the award. Determining the appropriate fair-value model and calculating the fair value of stock-based awards at the grant date requires considerable judgment, including estimating stock price volatility, expected option life and forfeiture rates. We develop our estimates based on historical data and market information which can change significantly over time. A small change in the estimates used can result in a relatively large change in the estimated valuation. We use the Black-Scholes option valuation model to value employee stock awards.
The most significant assumptions impacted by management's judgment are the expected volatility and the expected life of the options. The expected dividend yield, and expected risk-free interest rate are not as significant to the calculation of fair value. In addition, adjustments to our estimates of the number of share-based payment awards that we expect to vest did have a significant impact on the recorded share-based compensation expense.
Expected volatility: The value of a stock option is derived from its potential for appreciation. The more volatile the stock, the more valuable the option becomes because of the greater possibility of significant changes in stock price. Our computation of expected volatility is based on a blend of historical volatility of our common stock and implied volatility of traded options to purchase shares of our common stock. Our decision to incorporate implied volatility was based on our assessment that
46
implied volatility of publicly traded options in our common stock is expected to be more reflective of market conditions and, therefore, can reasonably be expected to be a better indicator of expected volatility than historical volatility of our common stock.
Expected life and forfeiture rate: The expected life also has a significant effect on the value of the option. The longer the term, the more time the option holder has to allow the stock price to increase without a cash investment and thus, the more valuable the option. Further, longer option terms provide more opportunity to exploit market highs. However, employees are not required to wait until the end of the contractual term of a nontransferable option to exercise. Accordingly, we are required to estimate the expected term of the option. We determine the expected life by considering several factors, including historical option exercise behavior, post vesting turnover rates and terms and vesting periods of the options granted. Similarly, we base our estimate of forfeiture on historical option cancellation behavior including pre-vesting turnover rates.
Results of Operations
The following table sets forth our operating results as a percentage of revenues:
| |
Fiscal 2009 |
Fiscal 2008 |
Fiscal 2007 |
|||||||||
|---|---|---|---|---|---|---|---|---|---|---|---|---|
Revenues |
100.0 | % | 100.0 | % | 100.0 | % | ||||||
Cost of revenues |
100.3 | 82.7 | 46.6 | |||||||||
Gross margin |
(0.3 | ) | 17.3 | 53.4 | ||||||||
Operating expenses: |
||||||||||||
Research and development |
42.5 | 31.2 | 13.2 | |||||||||
Selling, general and administrative |
58.0 | 45.3 | 20.0 | |||||||||
Restructuring |
6.5 | 4.3 | — | |||||||||
Impairment of long lived assets |
— | 2.1 | — | |||||||||
Total operating expenses |
107.0 | 82.9 | 33.2 | |||||||||
Operating (loss) income |
(107.3 | ) | (65.6 | ) | 20.2 | |||||||
Interest income, net |
2.4 | 5.9 | 4.9 | |||||||||
Other income (expense), net |
(0.4 | ) | 0.3 | 0.1 | ||||||||
Income (loss) before income taxes |
(105.3 | ) | (59.4 | ) | 25.2 | |||||||
Provision for (benefit from) income taxes |
9.8 | (21.0 | ) | 9.4 | ||||||||
Net income (loss) |
(115.1 | )% | (38.4 | )% | 15.8 | % | ||||||
Fiscal Years Ended December 26, 2009 and December 27, 2008
Revenues
| |
Fiscal 2009 |
% of Revenues |
Fiscal 2008 |
% of Revenues |
(Decrease) | Change % |
||||||||||||||
|---|---|---|---|---|---|---|---|---|---|---|---|---|---|---|---|---|---|---|---|---|
| |
(In thousands) |
|||||||||||||||||||
Revenues by Market: |
||||||||||||||||||||
DRAM |
$ | 108,820 | 80.4 | % | $ | 139,537 | 66.4 | % | $ | (30,717 | ) | (22.0 | )% | |||||||
Flash |
7,282 | 5.4 | 38,430 | 18.3 | (31,148 | ) | (81.1 | ) | ||||||||||||
SoC |
19,233 | 14.2 | 32,222 | 15.3 | (12,989 | ) | (40.3 | ) | ||||||||||||
Total revenues |
$ | 135,335 | 100.0 | % | $ | 210,189 | 100.0 | % | $ | (74,854 | ) | (35.6 | )% | |||||||
The decrease in revenue for the year ended December 26, 2009 was primarily due to weak demand for our advanced wafer probe cards caused by the slow recovery in the semiconductor market. For
47
certain of our products we also experienced pricing pressure due to the availability of competitive products, which also contributed to the decrease in revenues.
Our revenues for the year ended December 26, 2009 were primarily generated by sales of wafer probe cards to manufacturers of DRAM devices. Revenues for our products that address the DRAM segment declined in the year ended December 26, 2009 as compared to the prior year, primarily due to a number of factors including the relative supply and demand of various semiconductor devices and end products incorporating those devices, semiconductor manufacturers' efforts to curtail spending and conserve cash by taking capacity offline, reducing production, delaying the transition to new technology nodes and postponing the implementation of tooling cycles. We also experienced pricing pressure on certain DRAM test products due to the competitive environment.
Revenues from sales to Flash memory device manufacturers also decreased significantly in the year ended December 26, 2009 compared to the prior year, with the decrease driven by sales declines in both NOR and NAND Flash wafer probe cards . The weakness in NOR Flash can be attributed to a decline in purchases by certain key customers, specifically from our largest NOR customer filing for bankruptcy protection in the first quarter of fiscal 2009. Additionally, revenues from NAND Flash wafer probe cards declined as NAND Flash memory device manufacturers significantly reduced their output in the first quarter of fiscal 2009, in an attempt to promote industry absorption of excess inventories.
Revenues from manufacturers of SoC devices decreased in the year ended December 26, 2009 compared to the prior year, primarily due to the overall downturn in the semiconductor industry which negatively impacted the revenues from sales of our wafer probe cards.
Revenue by Geographic Region
The following table sets forth our revenues by geographic region for the periods indicated:
| |
Fiscal 2009 |
% of Revenues |
Fiscal 2008 |
% of Revenues |
||||||||||
|---|---|---|---|---|---|---|---|---|---|---|---|---|---|---|
| |
(In thousands) |
|||||||||||||
Japan |
$ | 64,575 | 47.7 | % | $ | 77,154 | 36.7 | % | ||||||
North America |
24,533 | 18.1 | 41,651 | 19.8 | ||||||||||
Asia Pacific |
38,026 | 28.1 | 73,531 | 35.0 | ||||||||||
Europe |
8,201 | 6.1 | 17,853 | 8.5 | ||||||||||
Total revenues |
$ | 135,335 | 100.0 | % | $ | 210,189 | 100 | % | ||||||
Geographic revenue information is based on the location to which we ship the customer product. For example, certain South Korean customers purchase through their North American subsidiaries and accordingly, if the product is shipped to an address in South Korea it is reflected in the revenue for Asia Pacific.
The decrease in revenues across all geographic regions for the year ended December 26, 2009 as compared to the prior year was primarily due to the decrease in sales in those regions in each of the product markets we address—DRAM, Flash memory and SoC. Additionally, revenues decreased due generally to the semiconductor industry downturn, characterized by weak demand for semiconductor devices, delayed production ramps and weak device pricing environments.
48
Gross Profit (Loss)
| |
Fiscal 2009 |
Fiscal 2008 |
|||||
|---|---|---|---|---|---|---|---|
| |
(In thousands) |
||||||
Gross profit (loss) |
$ | (469 | ) | $ | 36,263 | ||
Gross margin |
(0.3 | )% | 17.3 | %% | |||
Gross margin fluctuates with revenue levels, product mix, selling prices, factory loading, and material costs. For the year ended December 26, 2009, gross margin declined compared to the prior year, primarily due to the significant decline in revenue driving lower factory utilization, thereby increasing unit manufacturing costs, combined with declines in average selling prices as well as an unfavorable change in product mix from higher margin to lower margin products. This decline was partially mitigated by lower personnel costs as a result of our fiscal 2008 and 2009 global cost reduction plans as well as a decline in inventory write-downs. Inventory charge-offs decreased from $16.3 million or 7.7% of revenues in fiscal 2008 to $7.0 million, or 5.2% of revenues, in fiscal 2009. The higher inventory write-downs in fiscal 2008 were associated with deterioration in the DRAM memory segment in that period. Inventory write-downs declined in fiscal 2009 despite the continued deterioration in the DRAM memory segment primarily due to stronger inventory management in fiscal 2009. Excess custom inventories are not uncommon for us as our advanced wafer probe cards are custom designs manufactured in low volumes and must be delivered on relatively short lead times, which requires us to acquire production materials and start certain production activities based on estimated production yields and forecasted demand prior to or in excess of actual demand for our wafer probe cards. Stock-based compensation included in gross margin was $3.6 million or 2.6% of revenues, in the year ended December 26, 2009 and $4.8 million, or 2.2% of revenues for the year ended December 27, 2008. The decline of stock-based compensation, in absolute dollars, was primarily as a result of reductions in headcount as a result of our 2008 and 2009 global cost reduction plans.
In the near future, our gross margins will likely continue to be adversely affected by lower levels of product revenues in comparison to the same periods in the prior fiscal year, even though we have taken significant steps to reduce our production levels and operating cost structure. Additionally, we may be required to record additional inventory write-downs if estimated average selling prices of products held in finished goods and work in process inventories at a quarter-end date are below the manufacturing cost of those products. Also, as part of our global regionalization strategy, we continued our efforts to transition back-end manufacturing to Asia in fiscal 2009. We qualified our back-end manufacturing in Korea and Japan during fiscal 2009, and plan to qualify front-end manufacturing operations in Singapore in fiscal 2010. This initiative is intended, in part, to reduce manufacturing costs. However, as we go through our ramp up of new technologies over the coming quarters, we will see associated costs related to the transition and to the ramp of new technologies before we more fully experience the benefits of lower manufacturing costs by the second half of fiscal 2010.
Research and Development
| |
Fiscal 2009 |
Fiscal 2008 |
|||||
|---|---|---|---|---|---|---|---|
| |
(In thousands) |
||||||
Research and Development |
$ | 57,509 | $ | 65,509 | |||
% of revenues |
42.5% | 31.2% | |||||
Research and development expenses decreased in absolute dollars for the year ended December 26, 2009 compared to the same period in the prior year primarily due to a decrease in certain new technology product development related costs, personnel costs, and depreciation, facilities and information technology costs. For the year ended December 26, 2009, personnel costs decreased
49
$6.5 million primarily due to reductions in headcount as a result of our global reorganization plans. Expenses related to new technology and product development remained flat, and depreciation and facilities and information technology costs decreased $0.9 million, primarily due to the implementation of corporate cost reduction initiatives. Stock-based compensation included within research and development was $4.4 million for the year ended December 26, 2009 compared to $5.0 million for the year ended December 27, 2008. The decline in stock-based compensation in absolute dollars was primarily due to reductions in headcount resulting from the 2008 and 2009 global cost reduction plans.
As a percent of revenues, research and development expenses increased in fiscal 2009 as compared to fiscal 2008 primarily due to the declining revenue base.
We are continuing our strategic investments in research and development, including the development of our next generation parallelism architecture and products, fine pitch memory and Logic products, advanced MicroSpring interconnect technology and new process technologies. We remain committed to product development in new and emerging technologies.
Selling, General and Administrative
| |
Fiscal 2009 |
Fiscal 2008 |
|||||
|---|---|---|---|---|---|---|---|
| |
(In thousands) |
||||||
Selling, general and administrative |
$ | 78,428 | $ | 95,208 | |||
% of revenues |
58.0% | 45.3% | |||||
Selling, general and administrative expenses decreased in absolute dollars for the year ended December 26, 2009 compared to the prior year primarily due to a decrease in personnel-related costs and other discretionary spending. For the year ended December 26, 2009, personnel related costs decreased by approximately $11.4 million, primarily due to the work force reductions as well as lower discretionary spending. Outside legal and other professional fees decreased by $6.1 million in the year ended December 26, 2009 as compared to the prior year primarily to a decrease in legal fees. The decrease in legal fees for the year ended December 26, 2009 was primarily due to the scheduling of the International Trade Commission hearing on the investigation (337-TA-621) of two of our competitors which arose out of our complaint filed in late 2007. The majority of the fees and costs related to the hearing and post hearing activities were completed by the end of the first quarter of fiscal 2009.
Additionally, we recorded a provision for doubtful accounts of $5.0 million and $4.1 million in the year ended December 26, 2009 and December 27, 2008, respectively. We recorded a provision for doubtful accounts primarily due to the heightened risk of non-payment of accounts receivable by certain customers facing financial difficulty. In addition, stock-based compensation included within selling, general and administrative expense was $12.6 million for the year ended December 26, 2009, compared to $12.4 million for the year ended December 27, 2008. The increase in stock-based compensation for the year ended December 26, 2009 was due to an option modification expense of $2.5 million in connection with the retirement of Dr. Igor Y. Khandros, our founder and former executive chairman of our board of directors in May 2009, offset in part by a decrease due to reductions in headcount as a result of our 2008 and 2009 global cost reduction plans.
50
As a percent of revenue, selling, general and administrative expenses increased in year ended December 26, 2009 as compared to the prior year, primarily due to the declining revenue base.
Restructuring Charges
| |
Fiscal 2009 |
Fiscal 2008 |
|||||
|---|---|---|---|---|---|---|---|
| |
(In thousands) |
||||||
Restructuring Charges |
$ | 8,780 | $ | 9,157 | |||
% of revenues |
6.5% | 4.3% | |||||
In the first quarter of fiscal 2009, we implemented the Q1 2009 Restructuring Plan that included reducing our global workforce by 22%. The Q1 2009 Restructuring Plan extended the cost reduction plans implemented during fiscal 2008 and impacted employees across all functions of the organization. The Q1 2009 Restructuring Plan consisted primarily of involuntary employee terminations and benefit costs and write-down of certain assets taken out of service. We recorded $7.7 million in relation to the Q1 2009 Restructuring Plan in the first quarter of fiscal 2009 and an additional $0.3 million in the second quarter of fiscal 2009.
In the fourth quarter of fiscal 2009, we incurred further restructuring charges of $0.8 million, related to further reductions in our global workforce in an effort to lower our quarterly operating expense run rate.
We anticipate that the balance of the employee-related charges resulting from the cost reduction plans implemented in fiscal 2009 will be paid within the next six months. We expect to realize quarterly savings, excluding stock-based compensation expense, of approximately $3.8 million as a result of the restructuring actions taken in the first and fourth quarters of fiscal 2009.
In both the first and second quarters of fiscal 2008, we implemented global cost reduction plans that included reducing our global workforce. The first quarter action also included facility consolidation charges related to vacating buildings in Livermore, California. Both plans were implemented to restructure our company to better align with the market environment. All expenses, including adjustments associated with our restructuring plans are included in "Restructuring" in the Consolidated Statements of Operations. During fiscal 2008, we paid $6.9 million, representing substantially all of the employee related expenses for the cost reduction plans and $0.3 million primarily related to a non-cancellable contract. Substantially all of the employee related charges related to the first quarter of fiscal 2008 and second quarter of fiscal 2008 cost reduction plans were paid by the end of fiscal 2008.
Interest Income and Other Income (Expense), Net
| |
Fiscal 2009 |
Fiscal 2008 |
|||||
|---|---|---|---|---|---|---|---|
| |
(In thousands) |
||||||
Interest income (expense) |
$ | 3,282 | $ | 12,446 | |||
% of revenues |
2.4% | 5.9% | |||||
Other income (expense), net |
$ | (535 | ) | $ | 653 | ||
% of revenues |
(0.4 | )% | 0.3% | ||||
The decrease in interest income on cash, cash equivalents and marketable securities for the year ended December 26, 2009 was primarily a result of lower interest yields as compared to the prior year as well as lower average balances. Weighted-average yields for the year ended December 26, 2009 were 0.73% compared to 2.29% for the year ended December 27, 2008. Cash, cash equivalents, restricted cash and marketable securities were $449.9 million at December 26, 2009 compared to $523.6 million at December 27, 2008. The change in other income (expense) for fiscal 2009 compared to fiscal 2008 was
51
mainly comprised of bank fees of $0.1 million and foreign currency losses of $1.1 million primarily related to the Japanese Yen.
Provision for (Benefit from) Income Taxes
| |
Fiscal 2009 |
Fiscal 2008 |
|||||
|---|---|---|---|---|---|---|---|
| |
(In thousands) |
||||||
Provision for (benefit from) income taxes |
$ | 13,214 | $ | (44,291 | ) | ||
Effective tax rate |
9.3% | (35.5 | )% | ||||
In fiscal 2008 we recorded a tax benefit for U.S. losses, tax credits and deferred tax assets. During fiscal 2009, in accordance with accounting requirements, a valuation allowance against our U.S. deferred tax assets was recorded. Our tax rate was thus negatively impacted by a valuation allowance of $57.7 million and non-U.S. net operating losses, primarily in Singapore, of $4.6 million.
In November, 2009, President Obama signed into law the Worker, Homeownership and Business Assistance Act of 2009. This law extended net operating loss carrybacks from two years to five years. We benefited from this provision by increasing our refund claim to prior years for the carryback of our 2009 Federal tax loss by approximately $5.0 million prior to the law change.
We utilize the asset and liability method of accounting for income taxes, under which deferred taxes are determined based on the temporary differences between the financial statement and tax basis of assets and liabilities using tax rates expected to be in effect during the years in which the basis differences reverse. A valuation allowance is recorded when it is more likely than not that some of the deferred tax assets will not be realized. Significant management judgment is required in determining any valuation allowance recorded against deferred tax assets. In evaluating the ability to recover deferred tax assets, we considered available positive and negative evidence giving greater weight to our recent cumulative losses and our ability to carryback losses against prior taxable income and commensurate with our objective verifiability, the forecast of future taxable income including the reversal of temporary differences and the implementation of feasible and prudent tax planning strategies. Under current tax laws, this valuation allowance will not limit our ability to utilize Federal and state deferred tax assets provided we can generate sufficient future taxable income.
We anticipate we will continue to record a valuation allowance against the deferred tax assets of certain jurisdictions, primarily Federal and state, until such time as we are able to determine it is more likely than not the deferred tax asset will be realized. Such position is dependent on whether there will be sufficient future taxable income to realize such deferred tax assets. We expect our future tax provisions, during the time such valuation allowances are recorded, will consist primarily of the tax provision of our profitable non-U.S. jurisdictions.
We classify interest and penalties related to uncertain tax positions as part of the income tax provision. We recognized interest expense of $0.3 million and $0.2 million for the years ended December 26, 2009 and December 27, 2008, respectively. As of December 26, 2009, we had approximately $0.9 million of interest and $0 penalties related to uncertain tax positions.
The amount of income taxes we pay is subject to ongoing audits by Federal, state and non-U.S. tax authorities which might result in proposed assessments. Our estimate for the potential outcome for any uncertain tax issue is judgmental in nature. However, we believe that we have adequately provided for any reasonably foreseeable outcome related to those matters. Our future results may include favorable or unfavorable adjustments to our estimated tax liabilities in the period the assessments are made or resolved or when statutes of limitation on potential assessments expire. As of December 26, 2009, changes to our uncertain tax positions in the next 12 months, that are reasonably possible, are not expected to have a significant impact on our financial position or results of operations.
52
We and our subsidiaries file income tax returns in the U.S. Federal jurisdiction, various U.S. states and non-U.S. jurisdictions. We are currently under examination by the State of California Franchise Tax Board for fiscal years 2004 and 2005. For Federal tax purposes, we have been audited and effectively settled through fiscal year 2006. Generally, for our major non-U.S. jurisdictions we are subject to examination by tax authorities for fiscal years after 2002.
Fiscal Years Ended December 27, 2008 and December 29, 2007
Revenues
| |
Fiscal 2008 |
% of Revenues |
Fiscal 2007 |
% of Revenues |
(Decrease) | Change % |
||||||||||||||
|---|---|---|---|---|---|---|---|---|---|---|---|---|---|---|---|---|---|---|---|---|
| |
(In thousands) |
|||||||||||||||||||
Revenues by Market: |
||||||||||||||||||||
DRAM |
$ | 139,537 | 66.4 | % | $ | 328,019 | 71.0 | % | $ | (188,482 | ) | (57.5 | )% | |||||||
Flash |
38,430 | 18.3 | 88,958 | 19.2 | (50,528 | ) | (56.8 | ) | ||||||||||||
SoC |
32,222 | 15.3 | 45,214 | 9.8 | (12,992 | ) | (28.7 | ) | ||||||||||||
Total revenues |
$ | 210,189 | 100.0 | % | $ | 462,191 | 100.0 | % | $ | (252,002 | ) | (54.5 | )% | |||||||
Total revenues declined by 54.5%, or $252.0 million, in fiscal 2008 as compared to fiscal 2007 primarily due to weak demand for our advanced wafer probe cards caused by the downturn in the semiconductor market. For certain of our products we also experienced pricing pressure in light of the availability of competitive products, which also contributed to the decrease in revenues.
Our revenues for fiscal 2008 were primarily generated by sales of wafer probe cards to manufacturers of DRAM devices. Revenues for our products that address the DRAM segment decreased significantly in fiscal 2008 compared to fiscal 2007 primarily due to weak market conditions in which DRAM device pricing fell precipitously, to pricing pressure from our customers on certain of our DRAM products due to the competitive environment, and from increased competition. Given the price trend of DRAM devices in fiscal 2008, our customers that manufacture DRAM devices took certain actions to curtail spending and conserve cash, including decisions to delay test capacity expansions and ramping of key devices.
Revenues from sales to Flash memory device manufacturers also decreased significantly in fiscal 2008 compared to fiscal 2007 primarily due to sales decline of our NOR Flash wafer probe cards in light of the reduced product ordering pattern of one of our primary NOR Flash device customers, to pricing pressure from our customers on certain of our Flash products due to the competitive environment, and from increased competition for full wafer contactor products in the NAND flash market. Market conditions for Flash memory devices weakened during fiscal 2008 and, as a consequence, our customers that manufacture Flash memory devices took certain actions similar to our DRAM customers which. in turn, impacted the demand for our products. The weakness in NOR Flash can be attributed to certain key customers pushing their production ramp of 65-nanometer into 2009. We also experienced market share reduction as a result of pricing pressure on certain Flash memory products due to the competitive environment.
Revenues from manufacturers of SoC devices decreased in fiscal 2008 as compared to fiscal 2007 primarily due to delayed production ramp of a key customer's ongoing transition to advanced technology nodes in both chipset application and high performance flip-chip microprocessors, which are used in personal computer, gaming and graphics applications. This revenue decline was partly offset by growth in the Wire-bond SoC market segment.
53
Revenue by Geographic Region
The following table sets forth our revenues by geographic region for the periods indicated:
| |
Fiscal 2008 |
% of Revenues |
Fiscal 2007 |
% of Revenues |
||||||||||
|---|---|---|---|---|---|---|---|---|---|---|---|---|---|---|
| |
(In thousands) |
|||||||||||||
Japan |
$ | 77,154 | 36.7 | % | $ | 194,309 | 42.0 | % | ||||||
North America |
41,651 | 19.8 | 82,086 | 17.8 | ||||||||||
Asia Pacific |
73,531 | 35.0 | 154,691 | 33.5 | ||||||||||
Europe |
17,853 | 8.5 | 31,105 | 6.7 | ||||||||||
Total revenues |
$ | 210,189 | 100.0 | % | $ | 462,191 | 100 | % | ||||||
Geographic revenue information is based on the location to which we ship the customer product. For example, certain South Korean customers purchase through their North American subsidiaries and accordingly, if the product is shipped to an address in South Korea it is reflected in the revenue for Asia Pacific. The decrease in revenues across all geographic regions was due to generally to the semiconductor industry downturn, characterized by weak demand for semiconductor devices, delayed production ramps and weak device pricing environments.
Gross Profit
| |
Fiscal 2008 |
Fiscal 2007 |
|||||
|---|---|---|---|---|---|---|---|
| |
(In thousands) |
||||||
Gross profit |
$ | 36,263 | $ | 246,707 | |||
Gross margin |
17.3 | % | 53.4 | % | |||
Gross margin fluctuates with revenue levels, product mix, selling prices, factory loading, and material costs. For fiscal 2008, gross margin declined compared to fiscal 2007 primarily due to the significant decline in revenue driving lower factory utilization, thereby increasing unit manufacturing costs, as well as inventory write-downs and declines in average selling prices. This decline was partially mitigated by lower personnel costs as a result of our fiscal 2008 global cost reduction plans. Excess custom inventories are not uncommon as our advanced wafer probe cards are custom designs that must be delivered on relatively short lead-times, and often requires us to acquire and start certain production activities prior to a firm customer commitment. Charge-offs to inventories increased from $12.7 million or 2.7% of revenues in fiscal 2007 to $16.3 million or 7.7% of revenues in fiscal 2008 due primarily to customer cancellations. Gross margin for fiscal 2008 includes stock-based compensation expense of $4.8 million, or 2.2% of revenue compared to $5.4 million, or 1.2% of revenue for fiscal 2007. The decline, in absolute dollars, was primarily as a result of reductions in headcount as a result of our 2008 global cost reduction plans.
Research and Development
| |
Fiscal 2008 |
Fiscal 2007 |
|||||
|---|---|---|---|---|---|---|---|
| |
(In thousands) |
||||||
Research and development |
$ | 65,509 | $ | 60,951 | |||
% of revenues |
31.2 | % | 13.2 | % | |||
Research and development expenses increased in absolute dollars in fiscal 2008 as compared to fiscal 2007 primarily due to an increase in product development related costs offset by a decrease in personnel costs. During fiscal 2008, expenses related to new technology and product development increased $5.2 million, and depreciation and facilities and information technology costs increased
54
$0.7 million due to investment in research and development facilities and development equipment. In fiscal 2008 personnel costs decreased $1.3 million due to the work force reductions as well as the temporary suspension of our company's key employee bonus and profit sharing plans. Stock-based compensation included within research and development was $5.0 million for fiscal 2008 compared to $5.2 million for fiscal 2007, with the decrease in absolute dollars being primarily due to reductions in headcount as a result of our 2008 global reorganization plans.
As a percent of revenues, research and development expenses increased in fiscal 2008 as compared to fiscal 2007 primarily due to the declining revenue base.
Selling, General and Administrative
| |
Fiscal 2008 |
Fiscal 2007 |
|||||
|---|---|---|---|---|---|---|---|
| |
(In thousands) |
||||||
Selling, general and administrative |
$ | 95,208 | $ | 92,552 | |||
% of revenues |
45.3 | % | 20.0 | % | |||
Selling, general and administrative expenses increased in absolute dollars in fiscal 2008 compared to fiscal 2007 primarily due to an increase in legal costs and allowance for doubtful accounts offset in part by a decrease in personnel costs. During fiscal 2008, outside legal services incurred for protecting our intellectual property portfolio, tax services and other expenses increased by approximately $5.1 million, provision for doubtful accounts increased by $4.1 million primarily due to the heightened risk of collection from a customer, and personnel related costs decreased by approximately $2.7 million primarily due to the work force reductions as well as the temporary suspension of our key employee bonus plan and profit sharing plan. In addition, stock-based compensation included within selling, general and administrative expense was $12.4 million for fiscal 2008 compared to $15.3 million for fiscal 2007, the decrease being primarily due to reductions in headcount as a result of our 2008 global reorganization plans.
As a percent of revenue, selling, general and administrative expenses increased in fiscal 2008 as compared to fiscal 2007 primarily due to the declining revenue base.
Restructuring
| |
Fiscal 2008 |
Fiscal 2007 |
|||||
|---|---|---|---|---|---|---|---|
| |
(In thousands) |
||||||
Restructuring charges |
$ | 9,157 | $ | — | |||
% of revenues |
4.3 | % | 0.0 | % | |||
In both the first and second quarters of fiscal 2008, we implemented global cost reduction plans that included reducing our global workforce. As part of the first quarter action, our workforce was reduced by 14% and as part of the second quarter action, we reduced our workforce by 12%. The first quarter action also included facility consolidation charges related to vacating buildings in Livermore, California. Both plans were implemented to restructure our company to better align with the market environment. All expenses, including adjustments associated with our restructuring plans are included in "Restructuring" in the Consolidated Statements of Operations. During fiscal 2008, we paid $6.9 million, representing substantially all of the employee related expenses for the cost reduction plans and $0.3 million primarily related to a non-cancellable contract. The remaining employee-related charges will be paid in the first half of fiscal 2009. See Note 6 of Notes to the Consolidated Financial Statements.
55
Impairment of long-lived assets
| |
Fiscal 2008 |
Fiscal 2007 |
|||||
|---|---|---|---|---|---|---|---|
| |
(In thousands) |
||||||
Impairment of long-lived assets |
$ | 4,400 | $ | — | |||
% of revenues |
2.1 | % | 0.0 | % | |||
In the fourth quarter of fiscal 2008, we recorded an impairment charge of $4.4 million related to construction in-progress assets in Singapore based on our decision not to proceed with the construction of a new manufacturing facility at the proposed site in Singapore. The impaired construction-in-progress assets consisted primarily of building design costs as well as costs of temporary construction structures.
Interest and Other Income (Expense), Net
| |
Fiscal 2008 |
Fiscal 2007 |
|||||
|---|---|---|---|---|---|---|---|
| |
(In thousands) |
||||||
Interest income (expense) |
$ | 12,446 | $ | 22,508 | |||
% of revenues |
5.9 | % | 4.9 | % | |||
Other income (expense), net |
$ | 653 | $ | 528 | |||
% of revenues |
0.3 | % | 0.1 | % | |||
The decrease in interest income on cash, cash equivalents and marketable securities was primarily a result of lower interest rates and lower average cash balances during fiscal 2008 as compared to fiscal 2007. Seeking greater investment safety, we re-allocated our investment securities from longer maturity, higher yield municipal securities to U. S. government and agency shorter maturity securities during fiscal 2008. Weighted average yields for fiscal 2008 and fiscal 2007 were 2.29% and 4.39%, respectively. Cash, cash equivalents, restricted cash and marketable securities totaled $523.6 million at December 27, 2008 compared to $572.2 million at December 29, 2007 with the decrease caused by our company's use of cash for operating activities in fiscal 2008, partially offset by cash provided by investing and financing activities. Other income (expense) for fiscal 2008 consisted primarily of realized gains related to the sale of investments and net foreign currency gains related to Japanese Yen, offset in part by bank fees. Other income (expense) for fiscal 2007 consisted primarily of net foreign currency gains related to Japanese Yen, miscellaneous income, offset by bank fees.
Provision for (benefit from Income Taxes
| |
Fiscal 2008 |
Fiscal 2007 |
|||||
|---|---|---|---|---|---|---|---|
| |
(In thousands) |
||||||
Provision for (benefit from) income taxes |
$ | (44,291 | ) | $ | 43,350 | ||
Effective tax rate |
(35.5 | )% | 37.3 | % | |||
Our effective income tax rate was a benefit 35.5% in fiscal year 2008 versus a provision of 37.3% in fiscal 2007. The fiscal 2008 benefit was negatively impacted by tax charges for tax losses in Singapore but was positively impacted by the reinstatement of the U.S. federal research and development credit and the favorable resolution of issues related to our company's 2004-2006 IRS examination during 2008. The Singapore losses are due to the initial phase of a worldwide structure implemented to align our worldwide affiliates with the geographic mix of our customers. In 2007, we initiated the first phase of our current plan to establish operations in Singapore to provide operational and financial services to the region. A significant element of the new structure involves the sharing of certain expenses related to the ongoing development of intangible property. Tax charges to implement the new structure negatively impacted the effective tax rate by approximately 4 and 7 percentage points in fiscal 2008 and 2007, respectively. These charges consisted primarily of payments associated with our intellectual property shared between Singapore and the U. S.
56
On October 3, 2008, the Emergency Economic Stabilization Act of 2008 was signed into law. Under this law, the research tax credit was retroactively extended through January 1, 2010 from December 31, 2007. This extension of the credit benefited our fourth quarter and full year effective tax rate by less than one percentage point. The California 2008-2009 Budget Bill (Assembly Bill 1452), enacted on September 30, 2008, resulted in two temporary changes to the California income tax. First, the bill suspends the use of net operating loss carryovers for the fiscal 2008 and 2009. Second, the bill limits the use of research tax credit carryovers to no more than 50% of the tax liability before credits. While these changes did not affect our 2008 effective tax rate, they may impact our 2009 tax provision depending on our profitability in 2009.
Liquidity and Capital Resources
| |
Fiscal 2009 |
Fiscal 2008 |
Fiscal 2007 |
|||||||
|---|---|---|---|---|---|---|---|---|---|---|
| |
(In thousands) |
|||||||||
Working capital |
$ | 482,607 | $ | 576,754 | $ | 622,093 | ||||
Cash and cash equivalent and marketable securities |
449,235 | 522,894 | 570,046 | |||||||
Working capital: The decrease in working capital in the year ended December 26, 2009 was primarily due to a decrease in our cash, cash equivalents and marketable securities balances due to use of cash for operating and investing activities, a decrease in deferred tax assets due to the establishment of a valuation allowance in the second quarter of fiscal 2009, offset in part by decreases in accounts payable and accrued liabilities.
Cash, cash equivalents and marketable securities: Cash and cash equivalents consist of deposits held at major banks, money market funds, U.S. government securities and commercial paper that at the time of purchase had maturities of 90 days or less. Marketable securities consist of U.S. government and agency securities, municipal bonds and commercial paper. Cash, cash equivalents and marketable securities include $15.8 million held by our foreign subsidiaries as of December 26, 2009.
Day Sales Outstanding: Days sales outstanding from receivables, or DSO, were 103 days at December 26, 2009 compared with 87 days at December 27, 2008. Our DSO calculation is calculated using the countback method and is based on gross accounts receivable (including accounts receivable for amounts in deferred revenue). The increase in DSO is primarily due to the significant shift to longer payment terms for several customers.
| |
Fiscal 2009 |
Fiscal 2008 |
Fiscal 2007 |
|||||||
|---|---|---|---|---|---|---|---|---|---|---|
| |
(In thousands) |
|||||||||
Net cash provided by (used in) operating activities |
$ | (52,667 | ) | $ | (24,370 | ) | $ | 84,802 | ||
Net cash provided by (used in) investing activities |
(174,408 | ) | 40,743 | (95,085 | ) | |||||
Net cash provided by financing activities |
11,450 | 5,950 | 41,480 | |||||||
Cash flows from operating activities: Net cash used in operating activities for the year ended December 26, 2009 was primarily driven by our operating loss of $155.7 million offset in part by non-cash charges including depreciation and amortization of $32.9 million, stock-based compensation expense of $20.8 million, deferred income tax benefit of $39.1 million, provision for doubtful accounts receivable of $5.0 million and provision for excess and obsolete inventories of $7.0 million.
The net change in operating assets and liabilities for the year ended December 26, 2009 was $2.5 million consisting primarily of, an increase in deferred revenues due to lengthening of payment terms for certain customers, a decrease in refundable income taxes primarily due to the receipt of federal income tax refunds in fiscal 2009, as well as a decrease in prepaids and other current assets.
57
This was offset in part by an increase in inventories due to lower shipments and a decrease in accounts payable and accruals.
Cash flows from investing activities: The cash flows used in investing activities for the year ended December 26, 2009 primarily relate to the purchase of marketable securities, net of receipts from the sales and maturities thereof as well as cash used for capital expenditures in support of information technology system upgrades and new product technology. Cash flows used in investing activities for the year ended December 26, 2009 also included $12.0 million of consideration paid for the purchase of manufacturing and testing equipment and technology assets from Electroglas (See Note 4 of Notes to Consolidated Financial Statements).
We carefully monitor our investments to minimize risks and have not experienced other-than-temporary investment losses. Except for experiencing declining yields, our investment portfolio has not been negatively impacted by the ongoing economic turmoil in the credit markets.
Cash flows from financing activities: The cash flows provided by financing activities for the year ended December 26, 2009 are primarily due to $3.6 million received in fiscal 2009 for purchases under our 2002 Employee Stock Purchase Plan, or ESPP and net proceeds of $3.5 million from the exercise of stock options. Cash flows from financing activities also included proceeds of $3.5 million from the sale of certain receivables, which was accounted for as a secured borrowing (See Note 3 of Notes to Consolidated Financial Statements).
Our cash, cash equivalents and marketable securities declined in fiscal 2009. Given the uncertainty in the global economy and the downturn in the semiconductor industry coupled with the decrease in demand for our products, we are focusing on improving our operating efficiency to achieve break even operating cash flow. Our actions have included operational expense reduction initiatives, re-timing or eliminating certain capital spending and research and development projects and re-negotiating longer payment terms with our vendors. We believe that we will be able to satisfy our cash requirements for the next twelve months with the liquidity provided by our existing cash, cash equivalents and marketable securities. We are also considering establishing manufacturing and technology partnerships, or to seek short and long-term debt obligations, or to obtain new financing facilities which may not be available on terms favorable to us or at all. Our future capital requirements may vary materially from those now planned. However, if we are unsuccessful in improving our operating efficiency, reducing our cash outlays or increasing our available cash through financing, our cash, cash equivalents and marketable securities will further decline in fiscal 2010.
The following table describes our commitments to settle contractual obligations in cash as of December 26, 2009:
| |
Payments Due In Fiscal Years | ||||||||||||||||
|---|---|---|---|---|---|---|---|---|---|---|---|---|---|---|---|---|---|
| |
2010 | 2011-2012 | 2013-2014 | After 2014 | Total | ||||||||||||
| |
(In thousands) |
||||||||||||||||
Operating leases |
$ | 5,587 | $ | 7,942 | $ | 1,198 | $ | 4,474 | $ | 19,201 | |||||||
Other purchase obligations |
2,297 | — | — | — | 2,297 | ||||||||||||
Total |
$ | 7,884 | $ | 7,942 | $ | 1,198 | $ | 4,474 | $ | 21,498 | |||||||
Other purchase obligations are primarily for purchases of inventory. For the purposes of this table, other purchase obligations are defined as agreements that are enforceable and legally binding and that specify all significant terms, including: fixed or minimum quantities to be purchased; fixed, minimum or variable price provisions; and the approximate timing of the transaction. The expected timing of payment of the obligations discussed above is estimated based on information available to us as of December 26, 2009. Timing of payments and actual amounts paid may be different depending on the time of receipt of goods or services or changes to agreed-upon amounts for some obligations.
58
The table above excludes our liability for unrecognized tax benefits, which totaled $17.4 million as of December 26, 2009 and are classified as deferred and other long-term tax liabilities on our consolidated balance sheets. As of December 26, 2009, the settlement period for our income tax liabilities cannot be determined; however, it is not expected to be due within the next twelve months.
Off-Balance Sheet Arrangements
Historically, we have not participated in transactions that have generated relationships with unconsolidated entities or financial partnerships, such as entities often referred to as structured finance or special purpose entities, which would have been established for the purpose of facilitating off-balance sheet arrangements or other contractually narrow or limited purposes. As of December 26, 2009, we were not involved in any such off-balance sheet arrangements.
Indemnification Agreements
We may, from time to time in the ordinary course of our business enter into contractual arrangements with third parties that include indemnification obligations. Under these contractual arrangements, we have agreed to defend, indemnify and/or hold the third party harmless from and against certain liabilities. These arrangements include indemnities in favor of customers in the event that our wafer probe cards infringe a third party's intellectual property and our lessors in connection with facility leasehold liabilities that we may cause. In addition, we have entered into indemnification agreements with our directors, and with persons who were at one time our directors, and certain of our officers, and our bylaws contain indemnification obligations in favor of our directors, officers and agents. These indemnity arrangements may limit the type of the claim, the total amount that we can be required to pay in connection with the indemnification obligation and the time within which an indemnification claim can be made. The duration of the indemnification obligation may vary, and for most arrangements, survives the agreement term and is indefinite. We believe that substantially all of our indemnity arrangements provide for limitations on the maximum potential future payments we could be obligated to make. However, it is not possible to determine or reasonably estimate the maximum potential amount of future payments under these indemnification obligations due to the varying terms of such obligations, the history of prior indemnification claims, the unique facts and circumstances involved in each particular contractual arrangement and in each potential future claim for indemnification, and the contingency of any potential liabilities upon the occurrence of events that are not reasonably determinable. We have not had any requests for indemnification under these arrangements. Our management believes that any liability for these indemnity arrangements would not be material to our accompanying consolidated financial statements. We have not recorded any liabilities for these indemnification arrangements on our consolidated balance sheet as of December 26, 2009.
Recent Accounting Pronouncements
Please refer to the discussion of our recent accounting pronouncements in Note 2 -Summary of Significant Accounting Policies of the Notes to the Consolidated Financial Statements under Part II, Item 8 in this Form 10-K.
Item 7A: Quantitative and Qualitative Disclosures about Market Risk
Foreign Currency Exchange Risk. We conduct certain operations in foreign currencies. We enter into currency forward exchange contracts to hedge a portion, but not all, of existing foreign currency denominated amounts. Gains and losses on these contracts are generally recognized in income. Because the effect of movements in currency exchange rates on the currency forward exchange contracts generally offsets the related effect on the underlying items being hedged, these financial instruments are not expected to subject us to risks that would otherwise result from changes in currency exchange rates. We do not use derivative financial instruments for trading or speculative purposes. We recognized
59
a net gain of $1.0 million for the fiscal year ended December 26, 2009, from the fluctuation in foreign exchange rates and the valuation of these hedge contracts in our financial statements under other expense.
Interest Rate Sensitivity. Our exposure to market risk for changes in interest rates relates primarily to our investment portfolio. We invest in a number of securities including U.S. agency discount notes, municipal bonds and notes and money market funds and commercial paper. We attempt to ensure the safety and preservation of our invested principal funds by limiting default risk, market risk and reinvestment risk. We mitigate default risk by investing in high grade investment securities. By policy, we limit the amount of credit exposure to an issuer, except U.S. Treasuries and U.S. agencies. We do not use interest rate derivative instruments to manage interest rate exposures nor do we invest for trading or speculative purposes. The fair market value of our fixed rate securities may be adversely impacted by increases in interest rates while income earned on floating rate securities may decline as a result of decreases in interest rates. A hypothetical 100 basis-point (one percentage point) increase or decrease in interest rates compared to rates at December 26, 2009 would have affected the fair value of our investment portfolio by less than $4.0 million.
Item 8: Financial Statements and Supplementary Data
Consolidated Financial Statements
The consolidated financial statements and supplementary data of FormFactor required by this item are included in the section entitled "Consolidated Financial Statements" of this Annual Report on Form 10-K. See Item 15(a)(1) for a list of our consolidated financial statements.
Item 9: Changes in and Disagreements with Accountants on Accounting and Financial Disclosure
None.
Item 9A: Controls and Procedures
Evaluation of Disclosure Controls and Procedures
Based on our management's evaluation (with the participation of our principal executive officer and principal financial officer), as of the end of the period covered by this report, our principal executive officer and principal financial officer have concluded that our disclosure controls and procedures (as defined in Rules 13a-15(e) and 15d-15(e) under the Securities Exchange Act of 1934, as amended, (the "Exchange Act")) were effective to ensure that information required to be disclosed by us in reports that we file or submit under the Exchange Act is recorded, processed, summarized and reported within the time periods specified in Securities and Exchange Commission rules and forms and is accumulated and communicated to our management, including our principal executive officer and principal financial officer, as appropriate to allow timely decisions regarding required disclosure.
Changes in Internal Control over Financial Reporting
There was no change in our internal control over financial reporting (as defined in Rules 13a-15(f) and 15d-15(f) under the Exchange Act) during fiscal 2009 that has materially affected, or is reasonably likely to materially affect, our internal control over financial reporting.
Management's Report on Internal Control over Financial Reporting
Our management is responsible for establishing and maintaining adequate internal control over financial reporting (as defined in Rules 13a-15(f) and 15d-15(f) under the Exchange Act) for FormFactor. Our management with the participation of our principal executive officer and principal financial officer conducted an evaluation of the effectiveness of our internal control over financial
60
reporting as of December 26, 2009. This evaluation was based on the framework established in Internal Control—Integrated Framework issued by the Committee of Sponsoring Organizations of the Treadway Commission. Based on our assessment under the framework in Internal Control—Integrated Framework, our management concluded that our internal control over financial reporting was effective as of December 26, 2009.
The effectiveness of our internal control over financial reporting as of December 26, 2009 has been audited by PricewaterhouseCoopers LLP, an independent registered public accounting firm, as stated in their report which appears in this Form 10-K.
Limitations on the Effectiveness of Controls
Control systems, no matter how well designed and operated, can provide only reasonable, not absolute, assurance that the control systems' objectives are being met. Further, the design of any control systems must reflect the fact that there are resource constraints, and the benefits of all controls must be considered relative to their costs. Because of the inherent limitations in all control systems, no evaluation of controls can provide absolute assurance that all control issues and instances of fraud, if any, within our company have been detected. These inherent limitations include the realities that judgments in decision making can be faulty and that breakdowns can occur because of simple error or mistake. Control systems can also be circumvented by the individual acts of some persons, by collusion of two or more people, or by management override of the controls. The design of any system of controls is based, in part, on certain assumptions about the likelihood of future events, and there can be no assurance that any design will succeed in achieving its stated goals under all potential future conditions. Over time, controls may become inadequate because of changes in conditions or deterioration in the degree of compliance with policies or procedures.
CEO and CFO Certifications
We have attached as exhibits to this Form 10-K the certifications of our Chief Executive Officer and Chief Financial Officer, which are required in accordance with the Exchange Act. We recommend that this Item 9A be read in conjunction with the certifications for a more complete understanding of the subject matter presented.
None.
61
Item 10: Directors, Executive Officers and Corporate Governance
Information concerning our board of directors, committees and directors, including our audit committee and audit committee financial expert, will be included in our Proxy Statement for our 2010 annual meeting of stockholders, under the section entitled "Proposal No. 1—Election of Directors". Information regarding the nomination and election of our company's Class I directors, who are Lothar Maier and Dr. Chenming Hu, will appear under the section entitled "Proposal No. 1—Election of Directors" in our Proxy Statement. The information in such portions of the Proxy Statement is incorporated in this Annual Report on Form 10-K by reference.
For biographical information with respect to our directors and executive officers, see Part I, Item 1 of this Annual Report on Form 10-K under the section entitled "Directors and Executive Officers".
Information concerning Section 16(a) beneficial ownership reporting compliance will appear in our Proxy Statement under the section entitled "Section 16(a) Beneficial Ownership Reporting Compliance". The information in such portion of the Proxy Statement is incorporated in this Annual Report on Form 10-K by reference.
We have adopted a Statement of Corporate Code of Business Conduct that applies to all directors, officers and employees of FormFactor and a Statement of Financial Code of Ethics that applies to our chief executive officer, chief financial officer, and other employees in our finance department. Information concerning these codes will appear in our Proxy Statement under the section entitled "Proposal No. 1—Election of Directors—Corporate Codes". The information in such portion of the Proxy Statement is incorporated in this Annual Report on Form 10-K by reference.
Item 11: Executive Compensation
Information concerning executive officer compensation and related information will appear in our Proxy Statement under the section entitled "Compensation Discussion and Analysis", "Executive Compensation and Related Information", "Report of the Compensation Committee" and "Proposal No. 1—Election of Directors—Compensation Committee Interlocks and Insider Participation". Information concerning director compensation and related information will appear in our Proxy Statement under the section entitled "Proposal No. 1—Election of Directors". The information in such portions of the Proxy Statement is incorporated in this Annual Report on Form 10-K by reference.
Item 12: Security Ownership of Certain Beneficial Owners and Management and Related Stockholder Matters
Information concerning the security ownership of certain beneficial owners and management and related stockholder matters will appear in our Proxy Statement under the section entitled "Security Ownership of Certain Beneficial Owners and Management and Related Stockholder Matters". The information in such portion of the Proxy Statement is incorporated in this Annual Report on Form 10-K by reference.
Information concerning our equity compensation plans will appear in our Proxy Statement under the section entitled "Security Ownership of Certain Beneficial Owners and Management and Related Stockholder Matters—Equity Compensation Plans". The information in such portion of the Proxy Statement is incorporated in this Annual Report on Form 10-K by reference.
Item 13: Certain Relationships and Related Transactions, and Director Independence
Information concerning certain relationships and related transactions, including our related person transactions policy will appear in our Proxy Statement under the section entitled "Certain Relationships
62
and Related Transactions". The information in such portion of the Proxy Statement is incorporated in this Annual Report on Form 10-K by reference.
Information concerning director independence will appear in our Proxy Statement under the section entitled "Proposal No. 1—Election of Directors". The information in such portion of the Proxy Statement is incorporated in this Annual Report on Form 10-K by reference.
Item 14: Principal Accounting Fees and Services
Information concerning principal accounting fees and services and the audit committee's pre-approval policies and procedures will appear in our Proxy Statement under the section entitled "Proposal No. 2—Ratification of Selection of Independent Registered Public Accounting Firm". The information in such portion of the Proxy Statement is incorporated in this Annual Report on Form 10-K by reference.
63
Item 15: Exhibits, Financial Statement Schedules
- (a)
- The following documents are filed as part of this Annual Report on Form 10-K:
| (1) | Consolidated Financial Statements: | |||||
| Report of Independent Registered Public Accounting Firm | ||||||
| Consolidated Balance Sheets | ||||||
| Consolidated Statements of Operations | ||||||
| Consolidated Statements of Stockholders' Equity | ||||||
| Consolidated Statements of Cash Flows | ||||||
| Notes to Consolidated Financial Statements | ||||||
(2) |
Exhibits: |
|||||
| The exhibits listed in the accompanying Index to Exhibits are filed or incorporated by reference as part of this Annual Report on Form 10-K. |
- (b)
- Financial Statement Schedule: Schedule II: Valuation and Qualifying Accounts
All other schedules have been omitted because they are not required, not applicable, or the required information is otherwise included.
Schedule II: Valuation and Qualifying Accounts
| |
Balance at Beginning of Year |
Additional Charged (Credited) to Expenses |
Net Deductions (Recoveries) |
Balance at End of Year |
|||||||||
|---|---|---|---|---|---|---|---|---|---|---|---|---|---|
| |
(In thousands) |
||||||||||||
Allowance for doubtful accounts receivable |
|||||||||||||
Fiscal year ended December 26, 2009 |
$ | 4,220 | $ | 5,040 | $ | — | $ | 9,260 | |||||
Fiscal year ended December 27, 2008 |
$ | 74 | $ | 4,635 | $ | (489 | ) | $ | 4,220 | ||||
Fiscal year ended December 29, 2007 |
$ | 74 | $ | — | $ | — | $ | 74 | |||||
Valuation allowance for deferred tax assets |
|||||||||||||
Fiscal year ended December 26, 2009 |
$ | 1,395 | $ | 57,702 | $ | — | $ | 59,097 | |||||
Fiscal year ended December 27, 2008 |
$ | 1,387 | $ | 8 | $ | — | $ | 1,395 | |||||
Fiscal year ended December 29, 2007 |
$ | 1,440 | $ | 68 | $ | 121 | $ | 1,387 | |||||
64
- (c)
- Exhibits: The following exhibits are filed as part of this Annual Report on Form 10-K:
| Exhibit Number |
Exhibit Description | ||
|---|---|---|---|
| 10.06+ | 2002 Equity Incentive Plan, as amended, and forms of plan agreements. | ||
| 21.01 | List of Registrant's subsidiaries. | ||
| 23.01 | Consent of Independent Registered Public Accounting Firm. | ||
| 24.01 | Power of Attorney (included in the signature page of this Form 10-K). | ||
| 31.01 | Certification of Chief Executive Officer pursuant to 15 U.S.C. Section 7241, as adopted pursuant to Section 302 of the Sarbanes-Oxley Act of 2002. | ||
| 31.02 | Certification of Chief Financial Officer pursuant to 15 U.S.C. Section 7241, as adopted pursuant to Section 302 of the Sarbanes-Oxley Act of 2002. | ||
| 32.01* | Certification of Chief Executive Officer and Chief Financial Officer pursuant to 18 U.S.C. Section 1350, as adopted pursuant to Section 906 of the Sarbanes- Oxley Act of 2002. | ||
- *
- This
exhibit shall not be deemed "filed" for purposes of Section 18 of the Securities Exchange Act of 1934 or otherwise subject to the liabilities of
that section, nor shall it be deemed incorporated by reference in any filing under the Securities Act of 1933 or the Securities Exchange Act of 1934, whether made before or after the date hereof and
irrespective of any general incorporation language in any filings.
- +
- Indicates a management contract or compensatory plan or arrangement.
65
Pursuant to the requirements of Section 13 or 15(d) of the Securities Exchange Act of 1934, the Registrant has duly caused this report to be signed on its behalf by the undersigned, thereunto duly authorized, in the City of Livermore, State of California, on the 24th day of February 2010.
| FORMFACTOR, INC. | ||||
By: |
/s/ JEAN B. VERNET Jean B. Vernet Chief Financial Officer (Principal Financial Officer and Principal Accounting Officer) |
|||
KNOW BY ALL PERSONS BY THESE PRESENTS, that each of the undersigned whose signature appears below constitutes and appoints Jean B. Vernet and Stuart L. Merkadeau, and each of them, the undersigned's true and lawful attorneys-in-fact and agents with full power of substitution, for the undersigned and in the undersigned's name, place and stead, in any and all capacities, to sign any and all amendments to this Annual Report on Form 10-K and any other documents in connection therewith, and to file the same, with all exhibits thereto, with the Securities and Exchange Commission, granting unto said attorneys-in-fact and agents, and each of them, full power and authority to do and perform each and every act requisite and necessary to be done with respect to this Annual Report on Form 10-K, including amendments, as fully to all intents and purposes as the undersigned might or could do in person, hereby ratifying and confirming all that said attorneys-in-fact and agents, or his or their substitute or substitutes, may lawfully do or cause to be done by virtue hereof.
IN WITNESS WHEREOF, each of the undersigned has executed this Power of Attorney as of the date indicated below.
Pursuant to the requirements of the Securities Exchange Act of 1934, this report has been signed below by the following persons on behalf of the Registrant and in the capacities and on the dates indicated.
Signature
|
Title
|
Date
|
||
|---|---|---|---|---|
| Principal Executive Officer: | ||||
/s/ MARIO RUSCEV Dr. Mario Ruscev |
Chief Executive Officer and Director |
February 24, 2010 |
||
Principal Financial Officer and Principal Accounting Officer: |
||||
/s/ JEAN B. VERNET Jean B. Vernet |
Chief Financial Officer and Senior Vice President |
February 24, 2010 |
66
Signature
|
Title
|
Date
|
||
|---|---|---|---|---|
| Additional Directors: | ||||
/s/ JAMES A. PRESTRIDGE James A. Prestridge |
Chairman of the Board |
February 24, 2010 |
||
/s/ LOTHAR MAIER Lothar Maier |
Director |
February 24, 2010 |
||
/s/ HOMA BAHRAMI Dr. Homa Bahrami |
Director |
February 24, 2010 |
||
/s/ CHENMING HU Dr. Chenming Hu |
Director |
February 24, 2010 |
||
/s/ HARVEY A. WAGNER Harvey A. Wagner |
Director |
February 24, 2010 |
||
/s/ G. CARL EVERETT, JR. G. Carl Everett, Jr. |
Director |
February 24, 2010 |
67
Report of Independent Registered Public Accounting Firm
To the Board of Directors and Stockholders of FormFactor, Inc:
In our opinion, the accompanying consolidated balance sheets and the related consolidated statements of income, stockholders' equity, and cash flows present fairly, in all material respects, the financial position of FormFactor, Inc. and its subsidiaries at December 26, 2009 and December 27, 2008 and the results of their operations and their cash flows for each of the three years in the period ended December 26, 2009 in conformity with accounting principles generally accepted in the United States of America. In addition, in our opinion, the financial statement schedule listed in the index appearing under Item 15(b) presents fairly, in all material respects, the information set forth therein when read in conjunction with the related consolidated financial statements. Also in our opinion, the Company maintained, in all material respects, effective internal control over financial reporting as of December 26, 2009, based on criteria established in Internal Control—Integrated Framework issued by the Committee of Sponsoring Organizations of the Treadway Commission (COSO). The Company's management is responsible for these financial statements and financial statement schedule, for maintaining effective internal control over financial reporting and for its assessment of the effectiveness of internal control over financial reporting, included in Management's Report on Internal Control over Financial Reporting appearing under Item 9A of this Form 10-K. Our responsibility is to express opinions on these financial statements, on the financial statement schedule and on the Company's internal control over financial reporting based on our integrated audits. We conducted our audits in accordance with the standards of the Public Company Accounting Oversight Board (United States). Those standards require that we plan and perform the audits to obtain reasonable assurance about whether the financial statements are free of material misstatement and whether effective internal control over financial reporting was maintained in all material respects. Our audits of the financial statements included examining, on a test basis, evidence supporting the amounts and disclosures in the financial statements, assessing the accounting principles used and significant estimates made by management, and evaluating the overall financial statement presentation. Our audit of internal control over financial reporting included obtaining an understanding of internal control over financial reporting, assessing the risk that a material weakness exists, and testing and evaluating the design and operating effectiveness of internal control based on the assessed risk. Our audits also included performing such other procedures as we considered necessary in the circumstances. We believe that our audits provide a reasonable basis for our opinions.
A company's internal control over financial reporting is a process designed to provide reasonable assurance regarding the reliability of financial reporting and the preparation of financial statements for external purposes in accordance with generally accepted accounting principles. A company's internal control over financial reporting includes those policies and procedures that (i) pertain to the maintenance of records that, in reasonable detail, accurately and fairly reflect the transactions and dispositions of the assets of the company; (ii) provide reasonable assurance that transactions are recorded as necessary to permit preparation of financial statements in accordance with generally accepted accounting principles, and that receipts and expenditures of the company are being made only in accordance with authorizations of management and directors of the company; and (iii) provide reasonable assurance regarding prevention or timely detection of unauthorized acquisition, use, or disposition of the company's assets that could have a material effect on the financial statements.
Because of its inherent limitations, internal control over financial reporting may not prevent or detect misstatements. Also, projections of any evaluation of effectiveness to future periods are subject to the risk that controls may become inadequate because of changes in conditions, or that the degree of compliance with the policies or procedures may deteriorate.
/s/
PRICEWATERHOUSECOOPERS LLP
San Jose, California
February 24, 2010
68
FORMFACTOR, INC.
CONSOLIDATED BALANCE SHEETS
| |
December 26, 2009 |
December 27, 2008 |
|||||||
|---|---|---|---|---|---|---|---|---|---|
| |
(In thousands, except share and per share data) |
||||||||
ASSETS |
|||||||||
Current assets: |
|||||||||
Cash and cash equivalents |
$ | 122,043 | $ | 337,926 | |||||
Marketable securities |
327,192 | 184,968 | |||||||
Accounts receivable, net of allowance for doubtful accounts of $9,260 at December 26, 2009 and $4,220 at December 27, 2008, respectively |
29,412 | 34,127 | |||||||
Inventories |
25,548 | 18,788 | |||||||
Deferred tax assets |
3,296 | 23,039 | |||||||
Refundable income taxes |
26,774 | 29,413 | |||||||
Prepaid expenses and other current assets |
12,346 | 14,702 | |||||||
Total current assets |
546,611 | 642,963 | |||||||
Restricted cash |
680 | 680 | |||||||
Property and equipment, net |
97,758 | 113,813 | |||||||
Deferred tax assets |
2,202 | 20,580 | |||||||
Other assets |
8,717 | 7,674 | |||||||
Total assets |
$ | 655,968 | $ | 785,710 | |||||
LIABILITIES AND STOCKHOLDERS' EQUITY |
|||||||||
Current liabilities: |
|||||||||
Accounts payable |
$ | 29,250 | $ | 33,214 | |||||
Accrued liabilities |
23,417 | 26,145 | |||||||
Income taxes payable |
481 | 1,904 | |||||||
Deferred revenue |
10,856 | 4,946 | |||||||
Total current liabilities |
64,004 | 66,209 | |||||||
Long-term income taxes payable |
6,423 | 7,732 | |||||||
Deferred rent and other liabilities |
5,626 | 5,705 | |||||||
Deferred tax liability |
2,134 | — | |||||||
Total liabilities |
78,187 | 79,646 | |||||||
Commitments and contingencies (Note 8) |
|||||||||
Stockholders' equity |
|||||||||
Preferred stock, $0.001 par value: |
|||||||||
10,000,000 shares authorized; no shares issued and outstanding at December 26, 2009 and December 27, 2008, respectively |
— | — | |||||||
Common stock, $0.001 par value: |
|||||||||
250,000,000 shares authorized; 49,762,008 and 49,062,308 shares issued and outstanding at December 26, 2009 and December 27, 2008, respectively |
50 | 49 | |||||||
Additional paid-in capital |
630,333 | 602,295 | |||||||
Accumulated other comprehensive income |
1,253 | 1,922 | |||||||
Retained earnings (accumulated deficit) |
(53,855 | ) | 101,798 | ||||||
Total stockholders' equity |
577,781 | 706,064 | |||||||
Total liabilities and stockholders' equity |
$ | 655,968 | $ | 785,710 | |||||
The accompanying notes are an integral part of these consolidated financial statements.
69
FORMFACTOR, INC.
CONSOLIDATED STATEMENTS OF OPERATIONS
| |
Fiscal Years Ended | |||||||||||
|---|---|---|---|---|---|---|---|---|---|---|---|---|
| |
December 26, 2009 |
December 27, 2008 |
December 29, 2007 |
|||||||||
| |
(In thousands, except per share data) |
|||||||||||
Revenues |
$ | 135,335 | $ | 210,189 | $ | 462,191 | ||||||
Cost of revenues |
135,804 | 173,926 | 215,484 | |||||||||
Gross profit (loss) |
(469 | ) | 36,263 | 246,707 | ||||||||
Operating expenses: |
||||||||||||
Research and development |
57,509 | 65,509 | 60,951 | |||||||||
Selling, general and administrative |
78,428 | 95,208 | 92,552 | |||||||||
Restructuring |
8,780 | 9,157 | — | |||||||||
Impairment of long-lived assets |
— | 4,400 | — | |||||||||
Total operating expenses |
144,717 | 174,274 | 153,503 | |||||||||
Operating income (loss) |
(145,186 | ) | (138,011 | ) | 93,204 | |||||||
Interest income |
3,282 | 12,446 | 22,508 | |||||||||
Other income (expense), net |
(535 | ) | 653 | 528 | ||||||||
Income (loss) before income taxes |
(142,439 | ) | (124,912 | ) | 116,240 | |||||||
Provision for (benefit from) income taxes |
13,214 | (44,291 | ) | 43,350 | ||||||||
Net income (loss) |
$ | (155,653 | ) | $ | (80,621 | ) | $ | 72,890 | ||||
Net income (loss) per share: |
||||||||||||
Basic |
$ | (3.15 | ) | $ | (1.65 | ) | $ | 1.52 | ||||
Diluted |
$ | (3.15 | ) | $ | (1.65 | ) | $ | 1.47 | ||||
Weighted-average number of shares used in per share calculations: |
||||||||||||
Basic |
49,483 | 48,905 | 48,044 | |||||||||
Diluted |
49,483 | 48,905 | 49,557 | |||||||||
The accompanying notes are an integral part of these consolidated financial statements.
70
FORMFACTOR, INC.
CONSOLIDATED STATEMENTS OF STOCKHOLDERS' EQUITY
| |
Common Stock | |
|
Retained Earnings (Accumulated Deficit) |
|
||||||||||||||||
|---|---|---|---|---|---|---|---|---|---|---|---|---|---|---|---|---|---|---|---|---|---|
| |
Additonal Paid-in Capital |
Accumulated Other Comprehensive Income (Loss) |
|
||||||||||||||||||
| |
Shares | Amount | Total | ||||||||||||||||||
| |
(In thousands, except per share data) |
||||||||||||||||||||
Balances, December 30, 2006 |
46,861,334 | $ | 47 | $ | 504,709 | $ | (244 | ) | $ | 109,529 | $ | 614,041 | |||||||||
Issuance of common stock pursuant to exercise of options for cash |
1,498,847 | 2 | 26,998 | — | — | 27,000 | |||||||||||||||
Issuance of common stock pursuant to vesting of restricted stock units |
28,824 | — | — | — | — | — | |||||||||||||||
Issuance of common stock under the Employee Stock Purchase Plan |
253,253 | — | 6,564 | — | — | 6,564 | |||||||||||||||
Tax benefit from exercise of common stock options |
— | — | 9,191 | — | — | 9,191 | |||||||||||||||
Stock-based compensation |
— | — | 26,091 | — | — | 26,091 | |||||||||||||||
Components of other comprehensive income (loss): |
|||||||||||||||||||||
Unrealized gain (loss) on marketable securities, net of tax |
— | — | — | 1,114 | — | 1,114 | |||||||||||||||
Translation adjustments |
— | — | — | 59 | — | 59 | |||||||||||||||
Net income (loss) |
— | — | — | — | 72,890 | 72,890 | |||||||||||||||
Comprehensive income (loss) |
74,063 | ||||||||||||||||||||
Balances, December 29, 2007 |
48,642,258 | 49 | 573,553 | 929 | 182,419 | 756,950 | |||||||||||||||
Issuance of common stock pursuant to exercise of options for cash |
113,200 | — | 571 | — | — | 571 | |||||||||||||||
Issuance of common stock pursuant to vesting of restricted stock units |
20,501 | — | — | — | — | — | |||||||||||||||
Issuance of common stock under the Employee Stock Purchase Plan |
286,349 | — | 5,108 | — | — | 5,108 | |||||||||||||||
Tax benefit from exercise of common stock options |
— | — | 526 | — | — | 526 | |||||||||||||||
Stock-based compensation |
— | — | 22,537 | — | — | 22,537 | |||||||||||||||
Components of other comprehensive income (loss): |
— | ||||||||||||||||||||
Unrealized gain (loss) on marketable securities, net of tax |
— | — | — | 248 | — | 248 | |||||||||||||||
Translation adjustments |
— | — | — | 745 | — | 745 | |||||||||||||||
Net income (loss) |
— | — | — | — | (80,621 | ) | (80,621 | ) | |||||||||||||
Comprehensive income (loss) |
(79,628 | ) | |||||||||||||||||||
Balances, December 27, 2008 |
49,062,308 | 49 | 602,295 | 1,922 | 101,798 | 706,064 | |||||||||||||||
Issuance of common stock pursuant to exercise of options for cash |
319,386 | 1 | 3,528 | — | — | 3,529 | |||||||||||||||
Issuance of common stock pursuant to vesting of restricted stock units |
111,158 | — | — | — | — | — | |||||||||||||||
Issuance of common stock under the Employee Stock Purchase Plan |
269,156 | — | 3,601 | — | — | 3,601 | |||||||||||||||
Tax benefit from exercise of common stock options |
— | — | 10 | — | — | 10 | |||||||||||||||
Stock-based compensation |
— | — | 20,899 | — | — | 20,899 | |||||||||||||||
Components of other comprehensive income (loss): |
— | ||||||||||||||||||||
Unrealized gain (loss) on marketable securities, net of tax |
— | — | — | (981 | ) | — | (981 | ) | |||||||||||||
Translation adjustments |
— | — | — | 312 | — | 312 | |||||||||||||||
Net income (loss) |
— | — | — | — | (155,653 | ) | (155,653 | ) | |||||||||||||
Comprehensive income (loss) |
(156,322 | ) | |||||||||||||||||||
Balances, December 26, 2009 |
49,762,008 | $ | 50 | $ | 630,333 | $ | 1,253 | $ | (53,855 | ) | $ | 577,781 | |||||||||
The accompanying notes are an integral part of these consolidated financial statements.
71
FORMFACTOR, INC.
CONSOLIDATED STATEMENTS OF CASH FLOWS
| |
Fiscal Years Ended | ||||||||||||
|---|---|---|---|---|---|---|---|---|---|---|---|---|---|
| |
December 26, 2009 |
December 27, 2008 |
December 29, 2007 |
||||||||||
| |
(In thousands) |
||||||||||||
Cash flows from operating activities: |
|||||||||||||
Net income (loss) |
(155,653 | ) | (80,621 | ) | 72,890 | ||||||||
Adjustments to reconcile net income to net cash provided by operating activities: |
|||||||||||||
Depreciation and amortization |
32,910 | 32,181 | 26,804 | ||||||||||
Stock-based compensation expense |
20,776 | 22,868 | 25,920 | ||||||||||
Deferred income tax (benefit) expense |
39,131 | (15,281 | ) | (9,172 | ) | ||||||||
Excess tax benefits from equity based compensation plans |
(841 | ) | (273 | ) | (7,917 | ) | |||||||
Provision for doubtful accounts receivable |
5,040 | 4,147 | — | ||||||||||
Provision for excess and obsolete inventories |
7,032 | 16,268 | 12,695 | ||||||||||
Write offs and loss on disposal of property and equipment |
1,718 | 593 | 312 | ||||||||||
Non-cash restructuring |
366 | 980 | — | ||||||||||
Impairment of long-lived assets |
— | 4,400 | — | ||||||||||
Foreign currency transaction (gains) / losses |
(613 | ) | — | — | |||||||||
Changes in assets and liabilities: |
|||||||||||||
Accounts receivable |
610 | 31,206 | (14,911 | ) | |||||||||
Inventories |
(13,716 | ) | (6,052 | ) | (22,901 | ) | |||||||
Prepaids and other current assets |
4,722 | (174 | ) | (2,637 | ) | ||||||||
Refundable income taxes |
2,701 | (27,373 | ) | — | |||||||||
Other assets |
6,402 | 2,303 | (8,835 | ) | |||||||||
Accounts payable |
(322 | ) | (1,596 | ) | 5,008 | ||||||||
Accrued liabilities |
(5,573 | ) | (3,534 | ) | (5,259 | ) | |||||||
Income tax payable |
(3,030 | ) | (3,396 | ) | 14,612 | ||||||||
Deferred rent |
(231 | ) | (425 | ) | (45 | ) | |||||||
Deferred revenues |
5,904 | (591 | ) | (1,762 | ) | ||||||||
Net cash provided by (used in) operating activities |
(52,667 | ) | (24,370 | ) | 84,802 | ||||||||
Cash flows from investing activities: |
|||||||||||||
Acquisition of property and equipment |
(18,972 | ) | (30,245 | ) | (48,656 | ) | |||||||
Purchases of marketable securities |
(587,797 | ) | (273,928 | ) | (225,964 | ) | |||||||
Proceeds from maturities of marketable securities |
399,023 | 56,015 | 41,325 | ||||||||||
Proceeds from sales of marketable securities |
45,364 | 287,331 | 138,210 | ||||||||||
Payments made in connection with acquisition of assets (Refer to Note 4) |
(12,026 | ) | — | — | |||||||||
Release of restricted cash |
— | 1,570 | — | ||||||||||
Net cash provided by (used in) investing activities |
(174,408 | ) | 40,743 | (95,085 | ) | ||||||||
Cash flows from financing activities: |
|||||||||||||
Proceeds from issuances of common stock, net of issuance costs |
7,129 | 5,679 | 33,563 | ||||||||||
Excess tax benefits from equity based compensation plans |
841 | 271 | 7,917 | ||||||||||
Proceeds from secured borrowing (see Note 3) |
3,480 | — | — | ||||||||||
Net cash provided by financing activities |
11,450 | 5,950 | 41,480 | ||||||||||
Effect of exchange rate changes on cash and cash equivalents |
(258 | ) | 371 | (96 | ) | ||||||||
Net increase (decrease) in cash and cash equivalents |
(215,883 | ) | 22,694 | 31,101 | |||||||||
Cash and cash equivalents, beginning of year |
337,926 | 315,232 | 284,131 | ||||||||||
Cash and cash equivalents, end of year |
122,043 | 337,926 | 315,232 | ||||||||||
Non-cash financing activities: |
|||||||||||||
Purchases of property and equipment through accounts payable and accruals |
4,430 | 9,720 | 17,392 | ||||||||||
Supplemental disclosure of cash flow information: |
|||||||||||||
Income taxes paid (refunded) |
(25,787 | ) | (1,230 | ) | 41,237 | ||||||||
The accompanying notes are an integral part of these consolidated financial statements.
72
FORMFACTOR, INC.
NOTES TO CONSOLIDATED FINANCIAL STATEMENT
Note 1—Formation and Business of the Company:
FormFactor, Inc., which was incorporated in Delaware on April 15, 1993 (the "Company"), designs, develops, manufactures, sells and supports precision, high performance advanced semiconductor wafer probe cards. We are based in Livermore, California, home to our corporate offices, research and development, and manufacturing locations. We have facilities in the United States, Singapore, Japan, Germany, Taiwan, Italy, South Korea and the People's Republic of China.
Fiscal Year
Our fiscal year ends on the last Saturday in December. The fiscal years ended on December 26, 2009, December 27, 2008, and December 29, 2007, respectively, consisted of 52 weeks.
Reclassifications
Certain prior period balances have been reclassified to conform to the current period presentation.
Codification
In June 2009 the Financial Accounting Standards Board, or FASB, established the Accounting Standards Codification, or Codification, as the source of authoritative generally accepted accounting principles in the United States of America ("GAAP") recognized by the FASB. The Codification is effective in the first interim and annual periods ending after September 15, 2009 and had no effect on our audited consolidated financial statements.
Subsequent Events
We have performed an evaluation of subsequent events through February 24, 2010, which is the date the financial statements were issued.
Note 2—Summary of Significant Accounting Policies:
Basis of Consolidation and Foreign Currency Translation
The consolidated financial statements include our accounts and those of our wholly owned subsidiaries. All material intercompany balances and transactions have been eliminated.
Translation gains and losses resulting from the process of remeasuring into the United States of America dollar, the foreign currency financial statements of our wholly owned subsidiaries, for which the United States of America dollar is the functional currency, are included in operations. We translate assets and liabilities of foreign subsidiaries, whose functional currency is their local currency, at exchange rates in effect at the balance sheet date. We translate revenue and expenses at the monthly average exchange rates. We include accumulated net translation adjustments in stockholders' equity as a component of accumulated other comprehensive income.
Use of Estimates
The preparation of consolidated financial statements in conformity with GAAP requires management to make estimates and assumptions that affect the reported amounts of assets and liabilities, the disclosure of contingent assets and liabilities at the date of the financial statements, and the reported amounts of revenues and expenses during the reporting period. Actual results could differ
73
FORMFACTOR, INC.
NOTES TO CONSOLIDATED FINANCIAL STATEMENT (Continued)
Note 2—Summary of Significant Accounting Policies: (Continued)
from those estimates. Estimates may change as new information is obtained. Significant items that are subject to such estimates include the fair value of revenue elements, fair value of marketable securities, allowance for doubtful accounts, reserves for product warranty, valuation of obsolete and slow moving inventory, valuation of intangible assets, the assessment of recoverability of long-lived assets, valuation and recognition of stock-based compensation, provision for income taxes and related deferred tax assets, valuation and tax liabilities and accruals for other liabilities. Actual results could differ from those estimates.
Foreign Exchange Management
We transact business in various foreign currencies, primarily the Japanese Yen. We enter into forward foreign exchange contracts in an effort to mitigate the risks associated with currency fluctuations on certain foreign currency balance sheet exposures. Gains and losses resulting from the impact of currency exchange rate movements on forward foreign exchange contracts designated to offset certain foreign currency balance sheet exposures and backlog are recognized as other income (expense), net in the accompanying consolidated statements of operations in the period in which the exchange rates change. These gains and losses are intended to partially offset the foreign currency exchange gains and losses on the underlying exposures being hedged. We do not use derivative financial instruments for trading or speculative purposes.
Net foreign currency realized gains were $1.0 million, $1.3 million and $58,000 for fiscal 2009, fiscal 2008, and fiscal 2007, respectively, and are recorded to other income and expense.
Cash and Cash Equivalents
We consider all highly liquid investments with original or remaining maturities of three months or less, at the date of purchase, to be cash equivalents. Cash and cash equivalents include deposits held at major banks, money market funds, U.S. government securities and commercial paper that at the time of purchase had maturities of 90 days or less.
Marketable Securities
We classify our marketable debt securities as "available-for-sale". All marketable securities represent the investment of funds available for current operations, notwithstanding their contractual maturities. Such marketable securities are recorded at fair value and unrealized gains and losses are recorded to accumulated other comprehensive income (loss) until realized. At December 26, 2009, our net unrealized gains on marketable securities were $0.4 million. Realized gains and losses on sale of all such securities are reported in earnings, computed using the specific identification cost method.
The fair value determination for our marketable securities is based either on quoted prices for such security or an assessment of an investment's value based on the creditworthiness and interest yield to maturity of the individual security using information provided from commercial financial pricing services.
Other-Than-Temporary Impairment
We consider a number of factors in determining other-than-temporary impairment. An indicator of impairment for our marketable debt securities is a non-recoverable decline in market price below the
74
FORMFACTOR, INC.
NOTES TO CONSOLIDATED FINANCIAL STATEMENT (Continued)
Note 2—Summary of Significant Accounting Policies: (Continued)
amount recorded for that investment. We typically invest in highly-rated securities with low probabilities of default. Our investment policy requires investments to be rated single-A or better, limits the types of acceptable investments, concentration as to security holder and duration of the investment. When evaluating the investments for other-than-temporary impairment, we review factors such as the length of time and extent to which fair value has been below the amortized cost basis, review of current market liquidity, interest rate risk, the financial condition of the issuer, as well as credit rating downgrades. We believe that the unrealized losses at December 26, 2009 are temporary. We do not have a foreseeable need to liquidate the portfolio and anticipate recovering the full cost of the securities either as market conditions improve.
Fair Value of Financial Instruments
The carrying amounts of certain of our financial instruments, including cash and cash equivalents, accounts receivable, accounts payable, accrued compensation and other accrued liabilities, approximate fair value because of their short maturities. Estimates of fair value of fixed-income securities are based on quoted market prices from active markets or third party, market-based pricing sources which we believe to be reliable. These estimates represent the third parties' good faith opinion as to what a buyer in the marketplace would pay for a security in a current sale.
Restricted Cash
Under the terms of one of our facility leases, we provide security to the landlord in the form of letters of credit. As of December 26, 2009 and December 27, 2008, restricted cash includes $680,000 of letters of credit secured by a certificate of deposit.
Inventories
Inventories are stated at the lower of cost (principally standard cost which approximates actual cost on a first-in, first-out basis) or market value. The provision for potentially excess and obsolete inventory is made based on management's analysis of inventory levels and forecasted future sales. Once the value is adjusted, the original cost of our inventory less the related inventory write-down represents the new cost basis of such products. Reversal of these write downs is recognized only when the related inventory has been scrapped or sold. Shipping and handling costs are classified as a component of cost of goods sold in the consolidated statements of income.
We design, manufacture and sell a fully custom product into a market that has been subject to cyclicality and significant demand fluctuations. Probe cards are complex products, custom to a specific chip design and have to be delivered on short lead-times. Probe cards are manufactured in low volumes, but for certain materials, the material purchases are often subject to minimum purchase order quantities in excess of the actual underlying probe card demand. It is not uncommon for us to acquire production materials and start certain production activities based on estimated production yields and forecasted demand prior to or in excess of actual demand for our wafer probe cards. These factors make inventory valuation adjustments part of our normal recurring cost of revenue. Aggregate inventory write downs were $7.0 million, $16.3 million and $12.7 million for the fiscal years ended December 26, 2009, December 27, 2008, and December 29, 2007, respectively. We retain a portion of the excess inventory until the customer's design is discontinued. The inventory may be used to satisfy customer warranty demand.
75
FORMFACTOR, INC.
NOTES TO CONSOLIDATED FINANCIAL STATEMENT (Continued)
Note 2—Summary of Significant Accounting Policies: (Continued)
When our products have been delivered, but the revenue associated with that product is deferred because the related revenue recognition criteria have not been met, we defer the related inventory costs. The deferred inventory costs do not exceed the deferred revenue amounts.
Property and Equipment
Property and equipment are stated at cost less accumulated depreciation and amortization. Depreciation is provided on a straight-line method over the following estimated useful lives of the assets, 1 to 15 years for leasehold improvements, 5 to 7 years for machinery and equipment, 3 to 5 years for computer equipment and software and 5 years for furniture and fixtures. Leasehold improvements are amortized over their estimated useful lives or the term of the related lease, whichever is less. Upon sale or retirement of assets, the cost and related accumulated depreciation or amortization, are removed from the balance sheet and the resulting gain or loss is reflected in operations.
Intangible Assets
Intellectual property assets represent asset acquisition-related developed technology rights and are amortized on a straight-line basis over the periods of benefit, ranging from 3 to 5 years. We classify all identified intangible assets within Other Assets on the consolidated balance-sheet. For further discussion of identified intangible assets, see "Note 4: Asset Acquisition". We perform a quarterly review of intangible assets to determine if facts and circumstances indicate that the useful life is shorter than we had originally estimated or that the carrying amount of assets may not be recoverable. If such facts and circumstances exist, we assess the recoverability of identified intangible assets by comparing the projected undiscounted net cash flows associated with the related asset or group of assets over their remaining lives against their respective carrying amounts. Impairments, if any, are based on the excess of the carrying amount over the fair value of those assets.
Impairment of Long-Lived Assets and Long-Lived Assets to be Disposed of
We review long-lived assets, which include property plant and equipment and finite long-lived intangible assets, for impairment whenever events or changes in circumstances indicate that the carrying amount of an asset may not be recoverable. Recoverability of assets to be held and used is measured by comparing the carrying amount of an asset to estimated undiscounted future net cash flows expected to be generated by the asset. If the carrying amount of the asset exceeds its estimated future cash flows, an impairment charge is recognized in the amount by which the carrying amount of the asset exceeds the fair value of the asset.
Concentration of Credit Risk and Other Risks and Uncertainties
Financial instruments that potentially subject us to concentrations of credit risk consist primarily of cash equivalents, investments and trade receivables. Our cash equivalents and marketable securities are held in safekeeping by large, creditworthy financial institutions. We invest our excess cash primarily in U.S. banks, government and agency bonds, money market funds and corporate obligations. We have established guidelines relative to credit ratings, diversification and maturities that seek to maintain safety and liquidity. Deposits in these banks may exceed the amounts of insurance provided on such deposits. To date, we have not experienced any losses on our deposits of cash and cash equivalents.
76
FORMFACTOR, INC.
NOTES TO CONSOLIDATED FINANCIAL STATEMENT (Continued)
Note 2—Summary of Significant Accounting Policies: (Continued)
Carrying amounts of certain of our financial instruments including cash and cash equivalents, accounts receivable and accounts payable approximate fair value due to their short maturities.
We market and sell our products to a narrow base of customers and generally do not require collateral. In fiscal 2009, one customer accounted for 49.1% of revenues. In fiscal 2008, three customers accounted for 28%, 13%, and 11% of revenues. In fiscal 2007, four customers accounted for 26%, 14%, 12% and 10% of revenues.
At December 26, 2009, three customers accounted for approximately 21%, 16% and 12% of accounts receivable. As a result of our credit risk review process, we recorded an increase to the allowance for doubtful accounts of $5.0 million and $4.1 million, respectively, for the periods ended December 26, 2009 and December 27, 2008. These charges were recorded to selling, general and administrative expense.
We operate in the intensely competitive semiconductor industry, primarily the DRAM and Flash markets, which have been characterized by price erosion, rapid technological change, short product life, cyclical market patterns and heightened foreign and domestic competition. Significant technological changes in the industry could affect operating results adversely.
Certain components that meet our requirements are available only from a limited number of suppliers. The rapid rate of technological change and the necessity of developing and manufacturing products with short lifecycles may intensify these risks. The inability to obtain components as required, or to develop alternative sources, if and as required in the future, could result in delays or reductions in product shipments, which in turn could have a material adverse effect on our business, financial condition, results of operations or cash flows.
Revenue Recognition
We recognize revenue when persuasive evidence of a sales arrangement exists, delivery has occurred or services are rendered, the sales price or fee is fixed or determinable and collectability is reasonably assured. In instances where final acceptance of the product, system, or solution is specified by the customer, revenue is deferred until all acceptance criteria have been met.
In multiple element arrangements, we determine whether there is more than one unit of accounting. To the extent that the deliverables are separable into multiple units of accounting, we then allocate the total fee on such arrangements to the individual units of accounting based on relative fair value of individual elements.
We offer product maintenance and repair arrangements to our customers. Amounts due from customers under these arrangements are initially recorded as deferred revenues. The fees are recognized as revenue on a straight-line basis over the service period and related costs are recorded as incurred.
Revenues from the licensing of our design and manufacturing technology, which have been insignificant to date, are recognized over the term of the license agreement or when the significant contractual obligations have been fulfilled.
77
FORMFACTOR, INC.
NOTES TO CONSOLIDATED FINANCIAL STATEMENT (Continued)
Note 2—Summary of Significant Accounting Policies: (Continued)
Warranty Accrual
We offer warranties on certain products and record a liability for the estimated future costs associated with warranty claims, which is based upon historical experience and our estimate of the level of future costs. Warranty costs are reflected in the statement of operations as a cost of revenues. A reconciliation of the changes in our warranty liability is as follows (in thousands):
| |
Fiscal Years Ended | ||||||
|---|---|---|---|---|---|---|---|
| |
December 26, 2009 | December 27, 2008 | |||||
Warranty accrual beginning balance |
$ | 1,098 | $ | 1,383 | |||
Reserve for warranties issued during the year |
469 | 3,989 | |||||
Settlements made during the period |
(835 | ) | (4,274 | ) | |||
Warranty accrual ending balance |
$ | 732 | $ | 1,098 | |||
Research and Development
Research and development costs are expensed as incurred and consist primarily of personnel costs, development materials and other related costs.
Allowance for Doubtful Accounts
A majority of our trade receivables are derived from sales to large multinational semiconductor manufacturers throughout the world. In order to monitor potential credit losses, we perform ongoing credit evaluations of our customers' financial condition. An allowance for doubtful accounts is maintained for probable credit losses based upon our assessment of the expected collectibility of all accounts receivable. The allowance for doubtful accounts is reviewed on a quarterly basis to assess the adequacy of the allowance. We take into consideration (1) any circumstances of which we are aware of a customer's inability to meet its financial obligations; and (2) our judgments as to prevailing economic conditions in the industry and their impact on our customers. If circumstances change, and the financial condition of our customers are adversely affected and they are unable to meet their financial obligations to us, we may need to take additional allowances, which would result in a reduction of our net income.
We recorded a provision for doubtful accounts of $5.0 million in fiscal 2009 primarily due to the heightened risk of non-payment of accounts receivable by certain customers that filed bankruptcy or those that are facing financial difficulty. The increase in our allowance for doubtful accounts during fiscal 2009 related primarily to three customers. The allowance for doubtful accounts consisted of the
78
FORMFACTOR, INC.
NOTES TO CONSOLIDATED FINANCIAL STATEMENT (Continued)
Note 2—Summary of Significant Accounting Policies: (Continued)
following activity for fiscal years ended December 26, 2009, December 27, 2008, and December 29, 2007, (in thousands):
| |
Balance at Beginning of Year |
Additions | Deductions | Balance at End of Year |
|||||||||
|---|---|---|---|---|---|---|---|---|---|---|---|---|---|
Allowance for doubtful accounts receivable |
|||||||||||||
Fiscal year ended December 29, 2007 |
$ | 74 | $ | — | $ | — | $ | 74 | |||||
Fiscal year ended December 27, 2008 |
74 | 4,635 | (489 | ) | 4,220 | ||||||||
Fiscal year ended December 26, 2009 |
4,220 | 5,040 | $ | — | 9,260 | ||||||||
Shipping and Handling Expenses
Costs incurred for shipping and handling are included in cost of revenue at the time the related revenue is recognized.
Income Taxes
We utilize the asset and liability method of accounting for income taxes, under which deferred taxes are determined based on the temporary differences between the financial statement and tax basis of assets and liabilities using tax rates expected to be in effect during the years in which the basis differences reverse. We estimate our provision for income taxes and amounts ultimately payable or recoverable in numerous tax jurisdictions around the world. Estimates involve interpretations of regulations and are inherently complex. Resolution of income tax treatments in individual jurisdictions may not be known for many years after completion of any fiscal year. We are required to evaluate the realizability of our deferred tax assets on an ongoing basis in accordance with U.S. GAAP to determine whether there is a need for a valuation allowance with respect to such deferred tax assets. A valuation allowance is recorded when it is more likely than not that some of the deferred tax assets will not be realized. Significant management judgment is required in determining any valuation allowance recorded against deferred tax assets. In evaluating the ability to recover deferred tax assets, we consider available positive and negative evidence giving greater weight to our recent cumulative losses and our ability to carryback losses against prior taxable income and, commensurate with objective verifiability, the forecast of future taxable income including the reversal of temporary differences and the implementation of feasible and prudent tax planning strategies.
In July 2006, the FASB issued guidance regarding the accounting for uncertainty in income taxes, which clarifies the accounting for uncertainty in income taxes recognized in the financial statements, which we adopted the first quarter of fiscal 2007. Income tax positions must meet a more-likely-than-not recognition threshold to be recognized. This interpretation provides guidance on measurement, derecognition, classification, interest and penalties, accounting in interim periods and disclosure. We recognize interest and penalties related to unrecognized tax benefits within the income tax provision. Accrued interest and penalties are included within the related tax liability line in the consolidated balance sheet.
The amount of income taxes we pay is subject to ongoing audits by U.S. federal and state, and foreign tax authorities which might result in proposed assessments. Our estimate for the potential outcome for any uncertain tax issue is judgmental in nature. However, we believe we have adequately
79
FORMFACTOR, INC.
NOTES TO CONSOLIDATED FINANCIAL STATEMENT (Continued)
Note 2—Summary of Significant Accounting Policies: (Continued)
provided for any reasonable foreseeable outcome related to those matters. Our future results may include favorable or unfavorable adjustments to our estimated tax liabilities in the period the assessments are made or resolved or when statutes of limitation on potential assessments expire.
Segments
We operate in one segment for the design, development, manufacture, sale and support of precision, high performance advanced semiconductor wafer probe cards, using one measurement of profitability to manage our business.
Stock-based Compensation
Stock-based compensation is measured at the grant date, based on the fair value of the award, and is recognized on a straight-line basis over the requisite service period. The fair value of stock options is measured using the Black-Scholes option-pricing model while the fair value for restricted stock awards and restricted stock units is based on the quoted price of our common stock on the date of grant.
Net Income (Loss) Per Share
Basic net income (loss) per share available to common stockholders is computed by dividing net income (loss) available to common stockholders by the weighted-average number of common shares outstanding for the period. Diluted net income per share is computed giving effect to all potential dilutive common stock, including options, warrants and common stock subject to repurchase.
80
FORMFACTOR, INC.
NOTES TO CONSOLIDATED FINANCIAL STATEMENT (Continued)
Note 2—Summary of Significant Accounting Policies: (Continued)
A reconciliation of the numerator and denominator used in the calculation of basic and diluted net income (loss) per share follows (in thousands):
| |
Fiscal Years Ended | ||||||||||
|---|---|---|---|---|---|---|---|---|---|---|---|
| |
December 26, 2009 |
December 27, 2008 |
December 29, 2007 |
||||||||
Basic net (loss) income per share |
|||||||||||
Numerator: |
|||||||||||
Net income (loss) |
$ | (155,653 | ) | $ | (80,621 | ) | $ | 72,890 | |||
Denominator: |
|||||||||||
Weighted average common stock outstanding |
49,483 | 48,905 | 48,044 | ||||||||
Weighted average shares used in computing basic net income (loss) per share |
49,483 | 48,905 | 48,044 | ||||||||
Diluted net (loss) income per share |
|||||||||||
Numerator: |
|||||||||||
Net income (loss) |
$ | (155,653 | ) | $ | (80,621 | ) | $ | 72,890 | |||
Denominator: |
|||||||||||
Weighted average shares used in computing basic net income (loss) per share |
49,483 | 48,905 | 48,044 | ||||||||
Add stock options, restricted stock, ESPP, warrants and common stock subject to repurchase |
— | — | 1,513 | ||||||||
Weighted average shares used in computing diluted net income (loss) per share |
49,483 | 48,905 | 49,557 | ||||||||
The following table sets forth the weighted-average potentially dilutive securities excluded from the computation in the table above because their effect would have been antidilutive (in thousands):
| |
Fiscal Years Ended | |||||||||
|---|---|---|---|---|---|---|---|---|---|---|
| |
December 26, 2009 |
December 27, 2008 |
December 29, 2007 |
|||||||
Stock options |
5,258 | 6,775 | 2,741 | |||||||
ESPP |
123 | 161 | 99 | |||||||
Restricted stock units |
27 | 40 | — | |||||||
Total potentially dilutive securities |
5,408 | 6,976 | 2,840 | |||||||
Comprehensive Income
Comprehensive income includes foreign currency translation adjustments and unrealized gains (losses) on available-for-sale securities, the impact of which has been excluded from net loss and reflected as components of stockholders' equity.
81
FORMFACTOR, INC.
NOTES TO CONSOLIDATED FINANCIAL STATEMENT (Continued)
Note 2—Summary of Significant Accounting Policies: (Continued)
Components of accumulated other comprehensive income was as follows (in thousands):
| |
December 26, 2009 |
December 27, 2008 |
|||||
|---|---|---|---|---|---|---|---|
Unrealized gain on marketable securities, net of tax of $299 in fiscal 2009 and $266 in fiscal 2008 |
$ | 99 | $ | 1,080 | |||
Cumulative translation adjustments |
1,154 | 842 | |||||
Accumulated other comprehensive income |
$ | 1,253 | $ | 1,922 | |||
Recent Accounting Pronouncements
In January 2010, the Financial Accounting Standards Board ("FASB") issued guidance to amend the disclosure requirements related to recurring and nonrecurring fair value measurements. The guidance requires new disclosures on the transfers of assets and liabilities between Level 1 (quoted prices in active market for identical assets or liabilities) and Level 2 (significant other observable inputs) of the fair value measurement hierarchy, including the reasons and the timing of the transfers. Additionally, the guidance requires a roll forward of activities on purchases, sales, issuance, and settlements of the assets and liabilities measured using significant unobservable inputs (Level 3 fair value measurements). The guidance is effective for us with the reporting period beginning December 27, 2009. Other than requiring additional disclosures, adoption of this new guidance will not have a material impact on our financial statements.
In September 2009, the FASB's Emerging Issues Task Force issued authoritative guidance that modifies accounting for revenue arrangements with multiple deliverables. The modification would allow the use of an estimated selling price for undelivered elements for purposes of separating elements included in multiple-element arrangements and allocating arrangement consideration when neither vendor-specific objective evidence nor acceptable third-party evidence of the selling price of the undelivered element are available. We must adopt the new standard no later than January 1, 2011, and may elect to adopt it earlier, effective at the beginning of the fiscal year of adoption. This standard could alter the timing of how we record revenue for future arrangements. We are currently assessing the impact the adoption of these changes would have on our consolidated financial statements.
82
FORMFACTOR, INC.
NOTES TO CONSOLIDATED FINANCIAL STATEMENT (Continued)
Note 3—Balance Sheet Components:
Marketable Securities
Marketable securities at December 26, 2009 consisted of the following (in thousands):
| |
Amortized Cost |
Gross Unrealized Gains |
Gross Unrealized Losses |
Market Value |
|||||||||
|---|---|---|---|---|---|---|---|---|---|---|---|---|---|
U. S. Treasury |
$ | 135,061 | $ | 300 | $ | (67 | ) | $ | 135,294 | ||||
Agency Securities |
172,670 | 339 | (192 | ) | 172,817 | ||||||||
Commercial Paper |
16,992 | — | — | 16,992 | |||||||||
Obligations of states and political subdivisions |
2,071 | 18 | — | 2,089 | |||||||||
|
$ | 326,794 | $ | 657 | $ | (259 | ) | $ | 327,192 | ||||
We typically invest in highly-rated securities with low probabilities of default. Our investment policy requires investments to be rated single-A or better, limits the types of acceptable investments, concentration as to security holder and duration of the investment. The net unrealized losses on our investments during the twelve months ended December 26, 2009 were caused primarily by changes in interest rates. When evaluating the investments for other-than-temporary impairment, we review factors such as the length of time and extent to which fair value has been below the amortized cost basis, review of current market liquidity, interest rate risk, the financial condition of the issuer, as well as credit rating downgrades.
We believe that the unrealized losses are not other-than-temporary. We do not have a foreseeable need to liquidate the portfolio and anticipate recovering the full cost of the securities either as market conditions improve, or as the securities mature.
The following table shows the gross unrealized losses and fair value for those investments with unrealized losses that are not deemed to be other-than-temporarily impaired, aggregated by investment category and the length of time that individual securities has been in a continuous loss position as of December 26, 2009 (in thousands):
| |
In Loss Position for Less than 12 Months |
In Loss Position for 12 Months or Greater |
Total | ||||||||||||||||
|---|---|---|---|---|---|---|---|---|---|---|---|---|---|---|---|---|---|---|---|
| |
Fair Value | Gross Unrealized Loss |
Fair Value | Gross Unrealized Loss |
Fair Value | Gross Unrealized Loss |
|||||||||||||
U. S. Treasury |
$ | 54,863 | $ | (67 | ) | $ | — | $ | — | $ | 54,863 | $ | (67 | ) | |||||
Agency Securities |
72,471 | (192 | ) | — | — | 72,471 | (192 | ) | |||||||||||
|
$ | 127,334 | $ | (259 | ) | $ | — | $ | — | $ | 127,334 | $ | (259 | ) | |||||
83
FORMFACTOR, INC.
NOTES TO CONSOLIDATED FINANCIAL STATEMENT (Continued)
Note 3—Balance Sheet Components: (Continued)
Marketable securities at December 27, 2008 consisted of the following (in thousands):
| |
Amortized Cost |
Gross Unrealized Gains |
Gross Unrealized Losses |
Market Value |
|||||||||
|---|---|---|---|---|---|---|---|---|---|---|---|---|---|
U. S. Treasury |
$ | 104,817 | $ | 468 | $ | — | $ | 105,285 | |||||
Agency Securities |
60,943 | 836 | (24 | ) | 61,755 | ||||||||
Obligations of states and political subdivisions |
17,862 | 126 | (60 | ) | 17,928 | ||||||||
|
$ | 183,622 | $ | 1,430 | $ | (84 | ) | $ | 184,968 | ||||
The following table shows the gross unrealized losses and fair value for those investments with unrealized losses that are not deemed to be other-than-temporarily impaired, aggregated by investment category and the length of time that individual securities has been in a continuous loss position as of December 27, 2008 (in thousands):
| |
In Loss Position for Less than 12 Months |
In Loss Position for 12 Months or Greater |
Total | ||||||||||||||||
|---|---|---|---|---|---|---|---|---|---|---|---|---|---|---|---|---|---|---|---|
| |
Fair Value | Gross Unrealized Loss |
Fair Value | Gross Unrealized Loss |
Fair Value | Gross Unrealized Loss |
|||||||||||||
U. S. Treasury |
$ | 6,459 | $ | — | $ | — | $ | — | $ | 6,459 | $ | — | |||||||
Agency Securities |
24,948 | (24 | ) | — | — | 24,948 | (24 | ) | |||||||||||
Obligations of states and political subdivisions |
3,776 | (60 | ) | — | — | 3,776 | (60 | ) | |||||||||||
|
$ | 35,183 | $ | (84 | ) | $ | — | $ | — | $ | 35,183 | $ | (84 | ) | |||||
Contractual maturities of marketable securities as of December 26, 2009 were as follows (in thousands):
| |
Amortized Cost |
Market Value |
|||||
|---|---|---|---|---|---|---|---|
Due in one year or less |
$ | 186,805 | $ | 187,074 | |||
Due in one year to five years |
139,989 | 140,118 | |||||
|
$ | 326,794 | $ | 327,192 | |||
Realized gains on sales or maturities of marketable securities were $18,000, $0.5 million and $50,000 for fiscal 2009, fiscal 2008, and fiscal 2007, respectively.
Asset Retirement Obligation
We account for the fair value of a liability for an asset retirement obligation to be recognized in the period in which it is incurred if a reasonable estimate of fair value can be made. The fair value of the liability is added to the carrying amount of the associated asset and this additional carrying amount is amortized over the life of the asset. Our retirement obligation is associated with our commitment to return property subject to operating leases in Taiwan, South Korea, Japan and Singapore to their
84
FORMFACTOR, INC.
NOTES TO CONSOLIDATED FINANCIAL STATEMENT (Continued)
Note 3—Balance Sheet Components: (Continued)
original condition upon lease termination. We have estimated that as of December 26, 2009, gross expected future cash flows of approximately $2.5 million would be required to fulfill these obligations.
The leasehold improvements are being amortized over the term of the lease. During the fiscal years ended December 26, 2009, December 27, 2008, and December 29, 2007, approximately $0.4 million, $0.2 million and $0.3 million of the leasehold improvements were amortized to expense, respectively.
Following is a reconciliation of the aggregate retirement liability associated with our commitment to return property to original condition upon lease termination included in non-current deferred rent and other liabilities (in thousands):
| |
Fiscal Years Ended | ||||||
|---|---|---|---|---|---|---|---|
| |
December 26, 2009 |
December 27, 2008 |
|||||
Asset retirement obligation beginning balance |
$ | 1,893 | $ | 1,642 | |||
Initial amount recorded for new asset retirement obligation |
315 | — | |||||
Liabilities settled |
— | — | |||||
Increase (Decrease) based on revised estimates of asset retirement obligation |
— | 191 | |||||
Accretion expense |
142 | 60 | |||||
Asset retirement obligation ending balance |
$ | 2,350 | $ | 1,893 | |||
Inventories
Inventories consisted of the following (in thousands):
| |
Fiscal Years Ended | |||||||
|---|---|---|---|---|---|---|---|---|
| |
December 26, 2009 |
December 27, 2008 |
||||||
Raw materials |
$ | 2,405 | $ | 2,147 | ||||
Work-in-progress |
11,457 | 7,120 | ||||||
Finished goods: |
||||||||
Deferred cost of revenue |
6,097 | 1,765 | ||||||
Manufactured finished goods |
5,589 | 7,756 | ||||||
|
$ | 25,548 | $ | 18,788 | ||||
85
FORMFACTOR, INC.
NOTES TO CONSOLIDATED FINANCIAL STATEMENT (Continued)
Note 3—Balance Sheet Components: (Continued)
Property and Equipment
Property and equipment consisted of the following (in thousands):
| |
|
Fiscal Years Ended | |||||||
|---|---|---|---|---|---|---|---|---|---|
| |
Useful Life (in years) |
December 26, 2009 |
December 27, 2008 |
||||||
Machinery and equipment |
5 to 7 | $ | 115,938 | $ | 109,808 | ||||
Computer equipment and software |
3 to 5 | 34,810 | 28,378 | ||||||
Furniture and fixtures |
5 | 7,172 | 6,860 | ||||||
Leasehold improvements |
1 to 15 | 71,816 | 70,699 | ||||||
|
229,736 | 215,745 | |||||||
Less: Accumulated depreciation and amortization |
(146,365 | ) | (116,900 | ) | |||||
|
83,371 | 98,845 | |||||||
Construction-in-progress |
14,387 | 14,968 | |||||||
|
$ | 97,758 | $ | 113,813 | |||||
During fiscal 2008, we recognized an impairment charge of $4.4 million related to construction in-progress assets in Singapore in conjunction with our decision not to proceed with the construction of a new manufacturing facility at the proposed site in Singapore. The construction-in-progress assets impaired included building design costs as well as costs of temporary structures. The charge was included in "Impairment of long-lived assets" in the Consolidated Statement of Operations.
Depreciation and amortization of property and equipment for the fiscal years ended December 26, 2009, December 27, 2008, and December 29, 2007 was approximately $32.6 million, $32.3 million, and $25.2 million, respectively.
Accrued Liabilities
Accrued liabilities consisted of the following (in thousands):
| |
Fiscal Years Ended | ||||||
|---|---|---|---|---|---|---|---|
| |
December 26, 2009 |
December 27, 2008 |
|||||
Accrued compensation and benefits |
$ | 11,323 | $ | 17,408 | |||
Accrued commissions |
695 | 967 | |||||
Accrued warranty |
732 | 1,098 | |||||
Secured borrowing |
3,480 | — | |||||
Deferred rent |
469 | 452 | |||||
Other accrued expenses |
6,718 | 6,220 | |||||
|
$ | 23,417 | $ | 26,145 | |||
The proceeds from the sale of certain receivables have been accounted for as a secured borrowing and included within "Accrued liabilities" in the Consolidated Balance Sheet since we provided limited recourse to the purchaser to the extent of impairment of the purchased claims. The outstanding
86
FORMFACTOR, INC.
NOTES TO CONSOLIDATED FINANCIAL STATEMENT (Continued)
Note 3—Balance Sheet Components: (Continued)
receivables as well as the related reserves are included within Accounts Receivable, net of allowance for doubtful accounts on our consolidated Balance-Sheet as of December 26, 2009.
Note 4—Asset Acquisition
In October 2009, we completed the acquisition of certain assets from Electroglas, Inc. ("Electroglas"), a company under Chapter 11 bankruptcy protection in Delaware. Prior to the acquisition, Electroglas was engaged in the supply of semiconductor manufacturing equipment and software to the semiconductor industry. The assets acquired consisted of manufacturing and testing equipment, spare parts and components related to the purchased equipment and intellectual property assets representing developed technology rights related to precision motion control automation and all of the intellectual property rights of Electroglas, with the exception of certain trademark rights. We believe that the acquisition of these assets will enable us to continue to improve our manufacturing efficiency and provide our customers with high quality end products. The purchase price for the assets, including transaction costs, of approximately $11.8 million was capitalized in the fourth quarter of fiscal 2009.
Of the total purchase price, $3.6 million was allocated to property and equipment, $7.8 million was allocated to intellectual property assets, and $0.4 million was allocated to other current assets.
The amortization of the purchased intellectual property assets was $0.4 million for fiscal 2009, of which $0.3 million was charged to cost of revenues and $0.1 million was charged to selling, general and administrative expense. The purchased intellectual property assets had a weighted average amortization period of 4.5 years at December 26, 2009 and the net book value was $7.4 million at December 26, 2009.
The estimated future amortization expense of the purchased intangible assets as of December 26, 2009 is as follows (in thousands):
Fiscal Year
|
Amount | ||||
|---|---|---|---|---|---|
2010 |
$ | 1,830 | |||
2011 |
1,830 | ||||
2012 |
1,669 | ||||
2013 |
1,185 | ||||
2014 |
889 | ||||
Total |
$ | 7,403 | |||
Note 5—Derivative Financial Instruments
We operate and sell our products in various global markets. As a result, we are exposed to changes in foreign currency exchange rates. We utilize foreign currency forward contracts to hedge against future movements in foreign exchange rates that affect certain existing foreign currency denominated assets and liabilities. Under this program, our strategy is to have increases or decreases in our foreign currency denominated assets and liabilities caused by movements in foreign exchange rates offset by gains or losses on the foreign currency forward contracts to mitigate the risks and volatility associated with foreign currency transaction gains or losses. We do not use derivative financial instruments for speculative or trading purposes. Our derivative instruments, which are generally settled in the same
87
FORMFACTOR, INC.
NOTES TO CONSOLIDATED FINANCIAL STATEMENT (Continued)
Note 5—Derivative Financial Instruments (Continued)
quarter, are not designated as hedging instruments. We record the fair value of these contracts as of the end of our reporting period to our consolidated balance sheet with changes in fair value recorded in our consolidated statement of operations. The statement of operations classification for the fair values of these forward contracts is to non-operating income, net, for both realized and unrealized gains and losses.
As of December 26, 2009, there were three outstanding foreign exchange forward contracts to sell Japanese Yen, South Korean Won and Taiwan Dollars. The following table provides information about our foreign currency forward contracts outstanding as of December 26, 2009:
| |
Contract Amount (Local Currency) |
Contract Amount (U.S. Dollars) |
|||||
|---|---|---|---|---|---|---|---|
| |
(In thousands) |
||||||
Japanese Yen |
1,293,803 | $ | 14,092 | ||||
Taiwan Dollar |
19,777 | 614 | |||||
South Korean Won |
2,470,875 | 2,096 | |||||
Total USD notional amount of outstanding foreign exchange contracts |
$ | 16,802 | |||||
The contracts were entered into on December 24, 2009 and matured on December 29, 2009. There was no change in value of these contracts as of December 26, 2009.
The location and amount of gains and losses related to non-designated derivative instruments that matured in the fiscal year ended December 26, 2009 in the Consolidated Statement of Operations are as follows (in thousands):
Derivatives Not Designated as Hedging Instruments
|
Location of Gain (Loss) Recognized in Loss on Derivative |
Amount of Gain or (Loss) Recognized in Loss on Derivative |
||||
|---|---|---|---|---|---|---|
Foreign exchange forward contracts |
Other income (expense), net | $ | (760 | ) | ||
88
FORMFACTOR, INC.
NOTES TO CONSOLIDATED FINANCIAL STATEMENT (Continued)
Note 6—Restructuring Charges
Restructuring charges include costs related to one-time employee termination benefits, cost of long-lived assets abandoned, as well as contract termination costs. We recognize a liability for employee termination benefits when a plan of termination, approved by management and establishing the terms of the benefit arrangement, has been communicated to employees. The timing of the recognition of one-time employee termination benefits is dependent upon the period of time the employees are required to render service after communication. If employees are not required to render service in order to receive the termination benefits or if employees will not be retained to render service beyond the minimum legal notification period, a liability for the termination benefits is recognized at the communication date. In instances where employees will be retained to render service beyond the minimum legal notification period, the liability for employee termination benefits is measured initially at the communication date based on the fair value of the liability as of the termination date and is recognized ratably over the future service period. We record charges related to long-lived assets to be abandoned when the assets cease to be used. We record a liability for contract termination costs that will continue to be incurred under a contract for its remaining term without economic benefit to us at the cease-use date.
We implemented two restructuring plans in fiscal 2009 which included reductions of our workforce and consolidation of our facilities. The restructuring plans were designed to improve our operating efficiency. All expenses associated with our restructuring plans are included in "Restructuring" in the Consolidated Statements of Operations.
In the first quarter of fiscal 2009, we implemented a global reorganization and cost reduction plan (the "Q1 2009 Restructuring Plan") designed to lower our cash breakeven level in the current market environment. The Q1 2009 Restructuring Plan extended the global cost reduction plans implemented during fiscal 2008 and included workforce reductions of 178 employees spread across all functions of the organization. The Q1 2009 Restructuring Plan also included other actions such as the elimination of 24 contractor positions as well as non-replacement of certain voluntary employee terminations. We recorded $7.7 million in charges for this restructuring plan in the first quarter of fiscal 2009, of which $7.3 million related to severance and related benefits and $0.4 million related to write-down of certain assets taken out of service. We incurred approximately $0.3 million in connection with this restructuring plan in the second quarter of fiscal 2009 related to severance and related benefits.
In the fourth quarter of fiscal 2009, we incurred restructuring charges of $0.8 million, related to a further reduction of 10 employees in our global workforce in an effort to lower our quarterly operating expense run rate.
89
FORMFACTOR, INC.
NOTES TO CONSOLIDATED FINANCIAL STATEMENT (Continued)
Note 6—Restructuring Charges (Continued)
The following table summarizes the activities related to the cost reduction plan as of December 26, 2009 (in thousands):
| |
Fiscal 2009 Restructuring | ||||||||||||
|---|---|---|---|---|---|---|---|---|---|---|---|---|---|
| |
Employee Severance and Benefits |
Property and Equipment Impairment |
Contract Termination and Other |
Total | |||||||||
Accrual at December 27, 2008 |
$ | 77 | $ | — | $ | 71 | $ | 148 | |||||
Restructuring charges |
8,419 | 366 | (5 | ) | 8,780 | ||||||||
Cash payments |
(7,306 | ) | — | 10 | (7,296 | ) | |||||||
Non-cash settlements |
(217 | ) | (366 | ) | — | (583 | ) | ||||||
Accrual at December 26, 2009 |
$ | 973 | $ | — | $ | 76 | $ | 1,049 | |||||
The remaining accrual as of December 26, 2009 relates primarily to certain severance costs which are expected to be paid within the next six months. As such, the restructuring accrual is recorded as a current liability within "Accrued Liabilities" in the Consolidated Balance Sheets.
Note 7—Fair Value
We use fair value measurements to record fair value adjustments to certain financial and non-financial assets and to determine fair value disclosures. Our marketable securities are financial assets recorded at fair value on a recurring basis. We also have a building held for sale in Livermore, CA as well as certain manufacturing equipment held for sale, which are measured at fair value on a non-recurring basis and included within 'Prepaid expenses and other current assets' in the accompanying Consolidated Balance Sheet.
The accounting standard for fair value defines fair value, establishes a framework for measuring fair value in generally accepted accounting principles, and requires disclosures about fair value measurements. Fair value is defined as the price that would be received from selling an asset or paid to transfer a liability in an orderly transaction between market participants at the measurement date. When determining the fair value measurements for assets and liabilities required to be recorded at fair value, we consider the principal or most advantageous market in which we would transact and consider assumptions that market participants would use when pricing the asset or liability, such as inherent risk, transfer restrictions, and risk of nonperformance. The accounting standard for fair value establishes a fair value hierarchy that requires an entity to maximize the use of observable inputs and minimize the use of unobservable inputs when measuring fair value. A financial instrument's categorization within the fair value hierarchy is based upon the lowest level of input that is significant to the fair value measurement. The standard describes a fair value hierarchy based on three levels of inputs, the first two of which are considered observable and the last unobservable, that may be used to measure fair value:
- •
- Level 1—Quoted prices in active markets for identical assets or liabilities.
- •
- Level 2—Inputs, other than the quoted prices in active markets, that are observable either directly or
indirectly.
- •
- Level 3—Unobservable inputs that are supported by little or no market activity and that are significant to the fair value of the assets or liabilities.
90
FORMFACTOR, INC.
NOTES TO CONSOLIDATED FINANCIAL STATEMENT (Continued)
Note 7—Fair Value (Continued)
We adopted the accounting standard for fair value as of the beginning of our fiscal 2008 year for our financial assets and financial liabilities, and as of the beginning of our 2009 fiscal year as it relates to nonrecurring fair value measurement requirements for non-financial assets and liabilities.
Assets Measured at Fair Value on a Recurring Basis
We measure and report certain assets and liabilities at fair value on a recurring basis, including money market funds, U. S. government securities, municipal bonds, agency securities and foreign currency derivatives. The following tables represent the fair value hierarchy for our financial assets (cash equivalents and marketable securities):
Fair value measured on a recurring basis as of December 26, 2009 (in thousands):
| |
Level 1 | Level 2 | Total | ||||||||
|---|---|---|---|---|---|---|---|---|---|---|---|
| |
(In thousands) |
||||||||||
Cash equivalents |
|||||||||||
Money market funds |
$ | 100,145 | $ | — | $ | 100,145 | |||||
U. S. Treasury |
— | — | — | ||||||||
Agency securities |
— | — | — | ||||||||
Commercial paper |
— | 5,000 | 5,000 | ||||||||
Marketable securities |
|||||||||||
U. S. Treasury |
— | 135,294 | 135,294 | ||||||||
Municipal bonds |
— | 2,089 | 2,089 | ||||||||
Agency securities |
— | 172,817 | 172,817 | ||||||||
Commercial paper |
— | 16,992 | 16,992 | ||||||||
Total |
$ | 100,145 | $ | 332,192 | $ | 432,337 | |||||
Fair value measured on a recurring basis as of December 27, 2008 (in thousands):
| |
Level 1 | Level 2 | Total | ||||||||
|---|---|---|---|---|---|---|---|---|---|---|---|
| |
(In thousands) |
||||||||||
Cash equivalents |
|||||||||||
Money market funds |
$ | 183,765 | $ | — | $ | 183,765 | |||||
U. S. Treasury |
— | 20,000 | 20,000 | ||||||||
Agency securities |
— | 79,977 | 79,977 | ||||||||
Marketable securities |
|||||||||||
U. S. Treasury |
— | 105,285 | 105,285 | ||||||||
Municipal bonds |
— | 17,928 | 17,928 | ||||||||
Agency securities |
— | 61,755 | 61,755 | ||||||||
Total |
$ | 183,765 | $ | 284,945 | $ | 468,710 | |||||
The Level 1 assets consist of our money market fund deposits. The Level 2 assets consist of our available-for-sale investment portfolio. Our investments are priced by pricing vendors who provided observable inputs for their pricing without applying significant judgments. Broker's pricing is used mainly when a quoted price is not available, the investment is not priced by our pricing vendors, or when a broker price is more reflective of fair values in the market in which the investment trades. Our
91
FORMFACTOR, INC.
NOTES TO CONSOLIDATED FINANCIAL STATEMENT (Continued)
Note 7—Fair Value (Continued)
investments are labeled as Level 2 investments because fair values for these investments are based on similar assets without applying significant judgments. In addition, all of our investments have a sufficient level of trading volume to demonstrate that the fair values used are appropriate for these investments.
Assets Measured at Fair Value on a Nonrecurring Basis
The building held for sale is classified as Level 3 as we used unobservable inputs in its valuation reflecting our assumptions that market participants would use in pricing this asset due to the absence of recent comparable market transactions and inherent lack of liquidity. The building held for sale was valued at $0.9 million as of December 26, 2009. We also classified certain manufacturing equipment as held for sale as of December 26, 2009. The equipment was classified as Level 3 as we used unobservable inputs in its valuation reflecting our assumptions that market participants would use in pricing this asset due to the absence of observable market data on pricing and inherent lack of liquidity. The manufacturing equipment held for sale was valued at $0.6 million at December 26, 2009.
Our fair value processes include controls that are designed to ensure appropriate fair values are recorded. Such controls include model validation, review of key model inputs, and analysis of period-over-period fluctuations and independent recalculation of prices.
Note 8—Commitments and Contingencies:
Environmental Matters
We are subject to U.S. federal, state and local, and foreign governmental laws and regulations relating to the protection of the environment, including those governing the discharge of pollutants into the air and water, the management and disposal of hazardous substances and wastes, the clean-up of contaminated sites and the maintenance of a safe workplace. We believe that we comply in all material respects with the environmental laws and regulations that apply to us, including those of the California Department of Toxic Substances Control, the Bay Area Air Quality Management District, the City of Livermore Water Resources Division and the California Division of Occupational Safety and Health. No provision has been made for loss from environmental remediation liabilities associated with our facilities because we believe that it is not probable that a liability has been incurred as of December 26, 2009.
While we believe that we are in compliance in all material respects with the environmental laws and regulations that apply to it, in the future, we may receive environmental violation notices, and if received, final resolution of the violations identified by these notices could harm our operations, which may adversely impact our operating results and cash flows. New laws and regulations, stricter enforcement of existing laws and regulations, the discovery of previously unknown contamination at our or others' sites or the imposition of new cleanup requirements could also harm our operations, thereby adversely impacting its operating results and cash flows.
92
FORMFACTOR, INC.
NOTES TO CONSOLIDATED FINANCIAL STATEMENT (Continued)
Note 8—Commitments and Contingencies: (Continued)
Contractual Obligations
The following table describes our commitments to settle contractual obligations in cash as of December 26, 2009:
| |
Payments Due In Fiscal Years | ||||||||||||||||
|---|---|---|---|---|---|---|---|---|---|---|---|---|---|---|---|---|---|
| |
2010 | 2011-2012 | 2013-2014 | After 2014 | Total | ||||||||||||
| |
(In thousands) |
||||||||||||||||
Operating leases |
$ | 5,587 | $ | 7,942 | $ | 1,198 | $ | 4,474 | $ | 19,201 | |||||||
Other purchase obligations |
2,297 | — | — | — | 2,297 | ||||||||||||
Total |
$ | 7,884 | $ | 7,942 | $ | 1,198 | $ | 4,474 | $ | 21,498 | |||||||
We lease facilities under non-cancelable operating leases with various expiration dates through 2021. The facilities generally require us to pay property taxes, insurance and maintenance costs. Further, several lease agreements contain rent escalation clauses or rent holidays. For purposes of recognizing minimum rental expenses on a straight-line basis over the terms of the leases, we use the date of initial possession to begin amortization. We have the option to extend or renew most of our leases which may increase the future minimum lease commitments.
Rent expense for the fiscal years ended December 26, 2009, December 27, 2008, and December 29, 2007, was approximately $5.7 million, $6.0 million, and $5.3 million, respectively.
The table above excludes liabilities for our unrecognized tax benefits, which totaled $17.4 million as of December 26, 2009 and are classified as long-term income taxes payable on our consolidated balance sheet. As of December 26, 2009, the settlement period for our income tax liabilities cannot be determined; however, it is not expected to be due within the next twelve months.
Indemnification Arrangements
We may, from time to time in the ordinary course of our business enter into contractual arrangements with third parties that include indemnification obligations. Under these contractual arrangements, we have agreed to defend, indemnify and/or hold the third party harmless from and against certain liabilities. These arrangements include indemnities in favor of customers in the event that our wafer probe cards infringe a third party's intellectual property and our lessors in connection with facility leasehold liabilities that we may cause. In addition, we have entered into indemnification agreements with our directors and certain of our officers, and our bylaws contain indemnification obligations in favor of our directors, officers and agents. These indemnity arrangements may limit the type of the claim, the total amount that we can be required to pay in connection with the indemnification obligation and the time within which an indemnification claim can be made. The duration of the indemnification obligation may vary, and for most arrangements, survives the agreement term and is indefinite. We believe that substantially all of our indemnity arrangements provide for limitations on the maximum potential future payments we could be obligated to make. However, it is not possible to determine or reasonably estimate the maximum potential amount of future payments under these indemnification obligations due to the varying terms of such obligations, the history of prior indemnification claims, the unique facts and circumstances involved in each particular contractual arrangement and in each potential future claim for indemnification, and the contingency of any potential liabilities upon the occurrence of events that are not reasonably determinable. We have not
93
FORMFACTOR, INC.
NOTES TO CONSOLIDATED FINANCIAL STATEMENT (Continued)
Note 8—Commitments and Contingencies: (Continued)
had any requests for indemnification under these arrangements. Our management believes that any liability for these indemnity arrangements would not be material to our accompanying consolidated financial statements. We have not recorded any liabilities for these indemnification arrangements on our consolidated balance sheet as of December 26, 2009.
Legal Matters
From time to time, we may be subject to legal proceedings and claims in the ordinary course of business. As of the filing date of this Form 10-K, we were not involved in any material legal proceedings, other than the proceedings summarized below. In the future we may become a party to additional legal proceedings, including proceedings designed to protect its intellectual property rights and to collect past due accounts receivable that may require us to spend significant resources. We believe that the factual allegations and circumstances underlying the legal proceedings described below that have been filed against us are without merit. We also believe that our company does not have a material monetary damages exposure in these legal proceedings that would individually or in the aggregate have a material adverse effect on our financial condition, liquidity or results of operations; however, these legal proceedings have been costly and it is possible we will incur significant, and possibly material, attorneys' fees, which may not be covered by our insurance policies. These legal proceedings may also divert our management's time and attention away from business operations, which could prove to be disruptive to our business operations. In addition, an unfavorable outcome or settlement of these proceedings, particularly if it is not covered by or exceeds our insurance coverage, could individually or in the aggregate adversely impact our financial condition, liquidity or results of operations.
Patent Litigation
We initiated patent infringement litigation in the United States against Phicom Corporation, with a current operating name of TSC Memsys Corp., here referred to as Phicom and against Micronics Japan Co., Ltd., a Japan corporation, and its U.S. subsidiary, both collectively "Micronics Japan." In 2005, we filed a patent infringement lawsuit in the United States District Court for the District of Oregon against Phicom charging that it is willfully infringing four U.S. patents that cover key aspects of our wafer probe cards—U.S. Patent Nos. 5,974,662, 6,246,247, 6,624,648, and 5,994,152. In 2006, we also filed an amended complaint in the same Oregon district court adding two additional patents to the litigation—U.S. Patent Nos. 7,073,254 and 6,615,485. Also in 2006, we filed a patent infringement lawsuit in the United States District Court for the Northern District of California against Micronics Japan charging that it is willfully infringing four U.S. patents that cover key aspects of our wafer probe cards—U.S. Patent Nos. 6,246,247, 6,509,751, 6,624,648, and 7,073,254.
These two district court actions were stayed pending resolution of the complaint that we filed with the United States International Trade Commission, or ITC, on or about November 13, 2007, seeking institution of a formal investigation into the activities of Micronics Japan and Phicom. The requested investigation as filed encompassed U.S. Patent Nos. 5,994,152, 6,509,751, 6,615,485, 6,624,648 and 7,225,538 and alleged that infringement by each of Micronics Japan and Phicom of certain of the identified patents constitute unfair acts in violation of 19 U.S.C. Section 1337 and alleged violations of Section 337 of the Tariff Act of 1930 in the importation into the United States of certain probe card assemblies, components thereof, and certain tested DRAM and NAND flash memory devices and products containing such devices that infringe patents owned by us.
94
FORMFACTOR, INC.
NOTES TO CONSOLIDATED FINANCIAL STATEMENT (Continued)
Note 8—Commitments and Contingencies: (Continued)
In November 2009 in response to a request for review of prior decisions by an ITC Administrative Law Judge, the Commission issued a decision, which is termed a "final determination," finding certain of FormFactor's asserted patent claims valid, but not infringed, and other asserted patent claims invalid. The Commission did not find a violation of Section 337 of the Tariff Act of 1930 and terminated the investigation without issuing an exclusionary order against any products. We did not appeal the final determination to the Court of Appeals for the Federal Circuit. As a consequence, we anticipate that the stays in the two district court actions will be lifted and the actions will proceed forward.
In addition to the United States litigations, we also initiated actions in Seoul, South Korea against Phicom. In 2004 we filed two actions in Seoul Southern District Court, located in Seoul, South Korea, against Phicom alleging infringement of our Korean Patent Nos. 252,457, 324,064, 278,342 and 399,210. In the action alleging infringement of our Korean Patent Nos. 278,342 and 399,210, the Seoul Southern District Court closed the case after rejecting our petition and the decision became conclusive with the withdrawal of our appeal. The Seoul Southern District Court also rendered decisions unfavorable to us related to our Korean Patent Nos. 252,457 and 324,064 and the Seoul High Court recently dismissed our appeals of those decisions. We also in 2006 filed in the Seoul Central District Court two actions, including a preliminary injunction action and a permanent injunction and damages action, against Phicom alleging infringement of certain claims of our Korea Patent No. 252,457. The Seoul Central District Court did not accept our petitions and we only appealed the decision of the permanent injunction and damages action. The Seoul High Court recently dismissed our appeal of the decision. The Seoul High Court decisions are subject to a final appeal, if we so elect, to the Korea Supreme Court.
In response to our initiation of the infringement actions in Korea, Phicom filed in the Korean Intellectual Property Office, or KIPO, invalidity actions challenging the validity of some or all of the claims of each of our four patents at issue in the Seoul Southern District Court infringement actions. KIPO dismissed Phicom's challenges against all four of the patents-at-issue. Phicom appealed the dismissals of the challenges to the Korea Patent Court. In 2006, the Korea Patent Court issued a ruling upholding the validity of our Korean Patent No. 252,457, the only one of the four patents still subject to litigation. Phicom appealed the Patent Court ruling on Korean Patent No. 252,457 to the Korea Supreme Court. In June 2008, the Korea Supreme Court reversed the Patent Court ruling and finding invalid certain claims of our Korean Patent No. 252,457 and remanding the case for further trial to the Patent Court, and the case is now pending in KIPO. We filed a correction trial with KIPO on certain claims of Korean Patent No. 252,457 and that case is also pending.
Additionally, one or more third parties have initiated challenges in the U.S. and in foreign patent offices against certain of the above and other of our patents. These actions include re-examination proceedings filed in the U.S. Patent and Trademark Office, USPTO, against three of our U.S. patents that were at issue in the ITC investigation. In two of the USPTO reexamination proceedings, all of the challenged claims have been finally rejected as non-patentable, and we have requested a review of those rejections; in the third USPTO reexamination proceeding, the challenged claims have not been finally rejected. The foreign actions include proceedings in Korea against two of our Korean patents, and proceedings in Taiwan against four of our Taiwan patents.
No provision has been made for patent-related litigation because we believe that it is not probable that a liability had been incurred as of December 26, 2009. We will incur material attorneys' fees in prosecuting and defending the various identified actions.
95
FORMFACTOR, INC.
NOTES TO CONSOLIDATED FINANCIAL STATEMENT (Continued)
Note 8—Commitments and Contingencies: (Continued)
Securities Litigation
On October 31, 2007, a plaintiff filed a purported stockholder class action in the United States District Court for the Northern District of California in which we and certain of our then officers, including one former officer who was a director at the time of filing, are named as defendants under the caption "Danny McCasland, Individually and on Behalf of All Others Similarly Situated v. FormFactor, Inc., Igor Y. Khandros, Ronald C. Foster and Richard M. Freeman." Subsequently, plaintiffs filed two other purported stockholder class actions in the United States District Court for the Northern District of California under the captions "Yuk Ling Lui, on Behalf of Herself and All Others Similarly Situated v. FormFactor, Inc., Igor Y. Khandros, Ronald C. Foster and Richard M. Freeman," and "Victor Albertazzi, Individually and on Behalf of All Others Similarly Situated v. FormFactor, Inc., Igor Y. Khandros, Ronald C. Foster and Richard M. Freeman." The three actions were consolidated. The plaintiffs filed these actions following our restatement of our financial statements for the fiscal year ended December 30, 2006, for each of the fiscal quarters for that year, and for the fiscal quarters ended March 31 and June 30, 2007. On July 25, 2008, the court granted the defendants' motion to dismiss the Consolidated Amended Complaint with leave to amend. On August 22, 2008 the designated lead plaintiffs filed a Second Amended Complaint. The Second Amended Complaint again alleged violations of Sections 10(b) and 20(a), and Rule 10b-5 of the Securities Exchange Act of 1934. Plaintiffs sought to recover unspecified monetary damages, equitable relief and attorneys' fees and costs. On July 14, 2009, the court issued a ruling granting motions to dismiss the Second Amended Complaint without leave to amend. On July 28, 2009, plaintiffs filed a Motion to Alter or Amend the Judgment and to Uphold a Revised, Narrowed Second Amended Complaint. On September 14, 2009, the court issued a ruling denying plaintiffs' Motion to Alter or Amend the Judgment and to Uphold a Revised, Narrowed Second Amended Complaint. Plaintiffs appealed to the Court of Appeals for the Ninth Circuit the Judgment dismissing the case and the Court's ruling denying their Motion to Alter or Amend the Judgment, but thereafter determined to withdraw the appeal. Upon motion by the plaintiffs/appellants, the Ninth Circuit dismissed the appeal, with each side bearing its own costs. Upon motion by the plaintiffs/appellants, the Ninth Circuit dismissed the appeal, with each side bearing its own costs.
No provision was made for the securities litigation because we believe that it is not probable that a liability had been incurred as of December 26, 2009.
Stockholder Derivative Litigation
On November 19, 2007, a plaintiff filed a purported stockholder derivative action in the Superior Court of the State of California for the County of Alameda in which we were named as a nominal defendant and certain of our then directors and officers were named as defendants under the caption "John King, Derivatively on Behalf of Nominal Defendant FormFactor, Inc. v. Dr. Igor Y. Khandros, Dr. Homa Bahrami, Dr. Thomas J. Campbell, G. Carl Everett, Jr., Lothar Maier, James A. Prestridge, Harvey A. Wagner, Ronald C. Foster and Richard M. Freeman, and FormFactor, Inc." Subsequently, another plaintiff filed a second purported stockholder derivative action in the Superior Court of the State of California for the County of Alameda under the caption "Joseph Priestley, Derivatively on Behalf of FormFactor, Inc. v. Igor Y. Khandros, Mario Ruscev, James A. Prestridge, Thomas J. Campbell, Harvey A. Wagner, G. Carl Everett, Jr., Homa Bahrami, Lothar Maier, William H. Davidow and Joseph R. Bronson, and FormFactor, Inc." The plaintiffs filed these derivative actions following our restatement of our financial statements for the fiscal year ended December 30, 2006, for each of
96
FORMFACTOR, INC.
NOTES TO CONSOLIDATED FINANCIAL STATEMENT (Continued)
Note 8—Commitments and Contingencies: (Continued)
the fiscal quarters for that year, and for the fiscal quarters ended March 31 and June 30, 2007. The plaintiffs alleged that the individual defendants breached their fiduciary duties and violated applicable law by issuing, and permitting us to issue, materially false and misleading statements regarding our business and financial results prior to the restatements. The plaintiffs sought to recover monetary damages, and attorneys' fees and costs. Plaintiffs thereafter voluntarily dismissed without prejudice the two derivative actions, which had been consolidated. Although the cases have been dismissed, plaintiffs have the right to re-file the actions in the future. The two derivative actions, which had been consolidated, have been dismissed without prejudice, though the plaintiffs will have the right to refile the actions at some point in the future.
No provision was made for the stockholder derivative litigation because we believe that it is not probable that a liability had been incurred as of December 26, 2009.
We believe that the factual allegations and circumstances underlying the legal proceedings described above that have been filed against us are without merit. We also believe that there would not be material monetary damage exposure in these legal proceedings that would individually or in the aggregate have a material adverse effect on our financial condition, liquidity or results of operations; however, these legal proceedings have been costly and it is possible we will incur significant, and possibly material, attorneys' fees, which may not be covered by our insurance policies. These legal proceedings may also divert our management's time and attention away from business operations, which could prove to be disruptive to our business operations. In addition, an unfavorable outcome or settlement of these proceedings, particularly if it is not covered by or exceeds our insurance coverage, could individually or in the aggregate adversely impact our financial condition, liquidity or results of operations.
Commercial Litigation
On February 20, 2009, we filed a complaint for breach of contract, common counts, account stated and injunctive relief against Spansion, LLC, a Delaware limited liability company ("Spansion"), in the state superior court located in Santa Clara County, California. The complaint alleges that Spansion, in breach of Spansion's obligations under a purchase agreement entered into by us and Spansion, has failed to pay us for probe cards that we designed, developed and manufactured pursuant to several purchase orders placed by Spansion with us pursuant to the agreement. The complaint states that as of February 13, 2009, Spansion owed us $8,094,533 for probe cards delivered by us and not paid for by Spansion. In the complaint, we are seeking (i) payment of at least $8,094,533, (ii) a temporary protective order and an injunction enjoining Spansion from assigning or in any way divesting itself of any monies that we believe Spansion received from a certain third party entity, (iii) a prejudgment writ of attachment in favor of us over Spansion's corporate assets and property, (iv) costs and (v) attorney's fees. Prior to making any appearance or filing any answer in the action, Spansion filed for protection under Chapter 11 of the Bankruptcy Laws of the United States, which served to stay our complaint against Spansion. In November 2009, we sold all rights, title and interest in the bankruptcy claim to a third party in exchange for net proceeds of less than full value of the asserted claim.
97
FORMFACTOR, INC.
NOTES TO CONSOLIDATED FINANCIAL STATEMENT (Continued)
Note 9—Stockholders' Equity:
Preferred Stock
We have authorized 10,000,000 shares of undesignated preferred stock, $0.001 par value, none of which is issued and outstanding. Our Board of Directors shall determine the rights, preferences, privileges and restrictions of the preferred stock, including dividends rights, conversion rights, voting rights, terms of redemption, liquidation preferences, sinking fund terms and the number of shares constituting any series or the designation of any series.
Common Stock
Each share of common stock has the right to one vote. The holders of common stock are also entitled to receive dividends whenever funds are legally available and when declared by the Board of Directors, subject to the prior rights of holders of all classes of stock outstanding having priority rights as to dividends. No dividends have been declared or paid as of December 26, 2009.
Equity Incentive Plans
Stock Option Plans
We have options to purchase shares of common stock outstanding under the 1996 Stock Option Plan, the Incentive Option Plan and the Management Incentive Option Plan (the "Plans") for which we have reserved shares for issuance upon exercise of these options. Since the effectiveness of our 2002 Equity Incentive Plan in connection with our initial public offering, we do not grant any options under the Plans. Under the Plans, the Board of Directors had the authority to issue incentive stock options to employees and nonqualified stock options and stock purchase rights to consultants and employees of ours. The Board of Directors had the authority to determine to whom options would be granted, the number of shares, the term and exercise price (which could not be less than fair market value at date of grant for incentive stock options or 85% of fair market value for nonqualified stock options). If an employee owned stock representing more than 10% of the outstanding shares, the price of each share would be at least 110% of the fair market value, as determined by the Board of Directors. Generally, all options are immediately exercisable and vest 25% on the first anniversary of the vesting commencement date and on a monthly basis thereafter for a period of an additional three years. The options have a maximum term of ten years. Unvested option exercises are subject to repurchase upon termination of the holder's status as an employee or consultant. At December 26, 2009 and December 27, 2008, no shares of common stock were subject to our right of repurchase.
On April 18, 2002, the Board of Directors adopted the 2002 Equity Incentive Plan ("2002 Plan"), which became effective upon the effective date of the initial public offering of our common stock. The 2002 Plan provides for the grant of both, incentive stock options and nonqualified stock options, restricted stock and restricted stock units. The incentive stock options may be granted to our employees and the nonqualified stock options, and all awards other than incentive stock options, may be granted to employees, directors and consultants. The exercise price of incentive stock options must be at least equal to the fair market value of common stock on the date of grant. The exercise price of incentive stock options granted to 10% stockholders must be at least equal to 110% of the fair market value of common stock on the date of grant and vest over five years. Options granted under the 2002 Plan are exercisable as determined by the Compensation Committee of the Board of Directors, and for options granted on or before February 9, 2006, the options generally expire ten years from date of grant, and for options granted after February 9, 2006, the options generally expire seven years from the date of grant. We initially reserved 500,000 shares of common stock for issuance under the 2002 Plan plus any
98
FORMFACTOR, INC.
NOTES TO CONSOLIDATED FINANCIAL STATEMENT (Continued)
Note 9—Stockholders' Equity: (Continued)
shares that have been reserved but not issued under our prior equity plans, plus any shares repurchased at the original purchase price and any options which expire, thereafter. In addition, on each January 1, the number of shares available for issuance under the 2002 Plan will be increased by an amount equal to 5.0% of the outstanding shares of common stock on the preceding day.
At December 26, 2009, 8,471,525 shares were reserved for issuance under the Plans and the 2002 Plan.
Activity under the Plans and the 2002 Plan is set forth below (in thousands, except share and per share data):
| |
Outstanding Options | |
|||||||||||
|---|---|---|---|---|---|---|---|---|---|---|---|---|---|
| |
Number of Shares |
Weighted Average Exercise Price |
Weigthed Average Remaining Contractual Life in Years |
Aggregate Intrinsic Value |
|||||||||
Outstanding at December 30, 2006 |
7,118,896 | $ | 24.39 | ||||||||||
Options granted |
1,729,168 | 41.23 | |||||||||||
Options exercised |
(1,498,847 | ) | 18.01 | ||||||||||
Options canceled |
(737,721 | ) | 26.89 | ||||||||||
Outstanding at December 29, 2007 |
6,611,496 | 29.18 | |||||||||||
Options granted |
1,141,010 | 20.78 | |||||||||||
Options exercised |
(119,674 | ) | 5.97 | ||||||||||
Options canceled |
(946,012 | ) | 34.87 | ||||||||||
Outstanding at December 27, 2008 |
6,686,820 | 27.36 | |||||||||||
Options granted |
449,980 | 17.71 | |||||||||||
Options exercised |
(319,386 | ) | 13.37 | ||||||||||
Options canceled |
(957,594 | ) | 34.80 | ||||||||||
Outstanding at December 26, 2009 |
5,859,820 | 26.17 | 4.31 | $ | 16,817,286 | ||||||||
Vested and expected to vest at December 26, 2009 |
5,573,800 | 26.30 | 4.24 | $ | 15,889,141 | ||||||||
Exercisable at December 26, 2009 |
4,237,762 | $ | 25.81 | 3.97 | $ | 12,781,171 | |||||||
99
FORMFACTOR, INC.
NOTES TO CONSOLIDATED FINANCIAL STATEMENT (Continued)
Note 9—Stockholders' Equity: (Continued)
The options outstanding and vested by exercise price at December 26, 2009 are as follows:
| |
|
Options Outstanding | Options Exercisable | |||||||||||||
|---|---|---|---|---|---|---|---|---|---|---|---|---|---|---|---|---|
Range of Exercise Prices
|
Number of Options Outstanding |
Weighted Average Remaining Contractual Term (in years) |
Weighted Average Exercise Price |
Number Vested and Exercisable |
Weighted Average Exercise Price |
|||||||||||
$5.50 - $14.00 |
651,052 | 2.33 | $ | 8.26 | 637,927 | $ | 8.15 | |||||||||
$15.25 - $18.09 |
773,392 | 5.72 | 17.47 | 255,904 | 17.60 | |||||||||||
$18.19 - $19.40 |
602,178 | 5.18 | 19.30 | 244,493 | 19.26 | |||||||||||
$19.50 - $25.08 |
940,685 | 4.19 | 21.29 | 894,417 | 21.32 | |||||||||||
$25.39 - $25.39 |
592,573 | 5.09 | 25.39 | 592,573 | 25.39 | |||||||||||
$25.59 - $38.25 |
589,554 | 4.70 | 30.79 | 455,383 | 30.55 | |||||||||||
$38.38 - $39.84 |
721,188 | 3.23 | 38.96 | 553,753 | 38.97 | |||||||||||
$40.05 - $47.63 |
989,198 | 4.19 | 41.97 | 603,312 | 42.06 | |||||||||||
|
5,859,820 | 4.31 | $ | 26.17 | 4,237,762 | $ | 25.81 | |||||||||
The aggregate intrinsic value in the tables above represents the total pre-tax intrinsic value based on our closing stock price of $22.57 on December 24, 2009.
The weighted average grant-date fair value of options granted during fiscal 2009 was $7.96. The intrinsic value of option exercises during fiscal 2009 was $2.5 million. Cash received from stock option exercises in fiscal 2009 was $3.5 million. In connection with these exercises, the gross tax benefit realized by us was $10,000.
The weighted average grant-date fair value of options granted during fiscal 2008 was $9.94. The intrinsic value of option exercises during fiscal 2008 was $1.7 million. Cash received from stock option exercises in fiscal 2008 was $0.7 million. In connection with these exercises, the gross tax benefit realized by us was $0.5 million.
The weighted average grant-date fair value of options granted during fiscal 2007 was $18.01. The intrinsic value of option exercises during fiscal 2007 was $37.7 million. Cash received from stock option exercises in fiscal 2007 was $27.0 million. In connection with these exercises, the gross tax benefit realized by us was $9.2 million.
We expect to settle employee stock option exercises by issuing new shares under the 2002 Plan.
Restricted Stock Units
Restricted stock units are converted into shares of our common stock upon vesting on a one-for-one basis. The vesting of restricted stock units is subject to the employee's continuing service to
100
FORMFACTOR, INC.
NOTES TO CONSOLIDATED FINANCIAL STATEMENT (Continued)
Note 9—Stockholders' Equity: (Continued)
us. Activity of the restricted stock units under our 2002 Plan for the fiscal year ended December 26, 2009 is set forth below:
| |
Shares | Weighted Average Grant Date Fair Value |
|||||
|---|---|---|---|---|---|---|---|
Restricted stock units at December 30, 2006 |
37,324 | $ | 25.46 | ||||
Granted |
13,650 | 38.46 | |||||
Vested(1) |
(28,824 | ) | 26.02 | ||||
Restricted stock units at December 29, 2007 |
22,150 | 32.74 | |||||
Granted |
653,840 | 19.86 | |||||
Vested |
(27,180 | ) | 21.51 | ||||
Canceled |
(64,945 | ) | 19.36 | ||||
Restricted stock units at December 27, 2008 |
583,865 | 19.92 | |||||
Granted |
1,151,462 | 18.00 | |||||
Vested |
(160,137 | ) | 15.55 | ||||
Canceled |
(83,512 | ) | 18.44 | ||||
Restricted stock units at December 26, 2009 |
1,491,678 | $ | 18.51 | ||||
- (1)
- In January 2007, 9,608 shares of the former President's restricted stock units vested. The remaining 19,216 shares of restricted stock units vested on an accelerated basis under the separation agreement and general release with the former President.
2002 Employee Stock Purchase Plan
On April 18, 2002, the Board of Directors approved the 2002 Employee Stock Purchase Plan ("2002 ESPP"). The 2002 ESPP is designed to enable eligible employees to purchase shares of common stock at a discount on a periodic basis through payroll deductions. Each offering period has generally been two years in length, consisting of four six month purchase periods. Effective from February 1, 2007, the new offering periods under the 2002 ESPP are a 12 month fixed offering period commencing on February 1 of each calendar year and ending on January 31 of the subsequent calendar year, and a six month fixed offering period commencing on August 1 of each calendar year and ending on January 31 of the subsequent calendar year. The 12 month offering period consists of two six month purchase periods and the six month offering period consists of one six month purchase period. The price of the common stock purchased is 85% of the lesser of the fair market value of the common stock on the first day of the applicable offering period or the last day of each purchase period, 1,500,000 shares of common stock were initially reserved for issuance under the 2002 ESPP. In addition, the number of shares available for issuance under the 2002 ESPP will be increased on each January 1 by an amount equal to 1.0% of the outstanding shares of common stock on the preceding day. Employees purchased 269,156 shares, 286,349 shares, and 253,253 shares under this program at a weighted average exercise price of $13.37, $17.84, and $25.92, during fiscal 2009, fiscal 2008, and fiscal 2007 respectively.
101
FORMFACTOR, INC.
NOTES TO CONSOLIDATED FINANCIAL STATEMENT (Continued)
Note 10—Stock-Based Compensation
We account for all stock-based compensation to employees and directors, including grants of stock options, as stock-based compensation costs in the Consolidated Financial Statements based on the fair value measured as of the date of grant. These costs are recognized as an expense in the Consolidated Statements of Operations over the requisite service period and increase additional paid-in capital.
The table below shows the stock-based compensation expense included in the statement of operations:
| |
Fiscal Years Ended | ||||||||||
|---|---|---|---|---|---|---|---|---|---|---|---|
| |
December 26, 2009 |
December 27, 2008 |
December 29, 2007 |
||||||||
| |
(In thousands) |
||||||||||
Stock-based compensation expense included in: |
|||||||||||
Cost of revenues |
$ | 3,516 | $ | 4,849 | $ | 5,443 | |||||
Research and development |
4,407 | 4,999 | 5,220 | ||||||||
Selling, general and administrative(1)(2)(3)(4) |
12,637 | 12,397 | 15,257 | ||||||||
Restructuring |
216 | 623 | — | ||||||||
Total stock-based compensation |
20,776 | 22,868 | 25,920 | ||||||||
Tax effect on stock-based compensation |
— | (7,218 | ) | (8,702 | ) | ||||||
Effect on net income (loss) |
$ | 20,776 | $ | 15,650 | $ | 17,218 | |||||
- (1)
- Fiscal
2009 includes $2.5 million of stock-based compensation expense resulting from the modification and acceleration of the vesting of a portion of
the options awarded to our founder and former Executive Chairman of the Board of Directors in conjunction with his separation agreement and mutual release (See Note 14 of Notes to the
Consolidated Financial Statements).
- (2)
- Fiscal
2008 includes $118,000 of stock-based compensation expense and an offsetting benefit of approximately $375,000 related to the reversal of previously
recognized expense for unvested stock options resulting from the acceleration of the vesting of a portion of our former Chief Financial Officer's stock options in conjunction with his separation
agreement and general release.
- (3)
- Fiscal
2007 includes approximately $575,000 in stock-based compensation expense resulting from the acceleration of the vesting of a portion of our former
President's stock options in conjunction with his separation agreement and general release.
- (4)
- Fiscal 2007 includes approximately $798,000 in stock-based compensation expense resulting from the acceleration of our former President's remaining unvested restricted stock units in conjunction with his separation agreement and general release.
Stock Options
The exercise price of each stock option equals the market price of our stock on the date of grant. Most options are scheduled to vest over four years and expire in either seven or ten years from the grant date. The fair value of each option grant is estimated on the date of grant using the Black-
102
FORMFACTOR, INC.
NOTES TO CONSOLIDATED FINANCIAL STATEMENT (Continued)
Note 10—Stock-Based Compensation (Continued)
Scholes option pricing model. In addition, we estimate forfeitures when recognizing compensation expense, and adjust our estimates of forfeitures over the requisite service period based on the extent to which actual forfeitures differ, or are expected to differ, from such estimates. Changes in estimated forfeitures are recognized as a change in estimate in the period of change and will also impact the amount of compensation expense to be recognized in future periods.
The following weighted-average assumptions were used in the estimated grant-date fair value calculations for stock options:
| |
Fiscal Years Ended | |||||||||
|---|---|---|---|---|---|---|---|---|---|---|
| |
December 26, 2009 |
December 27, 2008 |
December 29, 2007 |
|||||||
Stock Options: |
||||||||||
Dividend yield |
0 | % | 0 | % | 0 | % | ||||
Expected volatility |
52.19 | % | 53.25 | % | 45.20 | % | ||||
Risk-free interest rate |
1.68 | % | 3.04 | % | 4.47 | % | ||||
Expected life (in years) |
4.69 | 4.75 | 4.70 | |||||||
Our computation of expected volatility for fiscal 2009, fiscal 2008, and fiscal 2007 was based on a combination of historical and market-based implied volatility from traded options on our common stock. We believe that including market-based implied volatility in the calculation of expected volatility results in a more accurate measure of the volatility expected in future periods. Risk-free interest rates are yields for zero-coupon U.S. Treasury notes maturing approximately at the end of the expected option life. The expected term is based on historical exercise behavior. Prior to fiscal 2009, we applied the simplified method approach for deriving expected term. The simplified method is based on the vesting period and the contractual term for each grant, or for each vesting-tranche for awards with graded vesting. The mid-point between the vesting date and the expiration date is used as the expected term under this method.
During fiscal 2009, we granted approximately 450,000 stock options with an estimated total grant-date fair value of $3.6 million. For fiscal 2008, we granted approximately 1,100,000 stock options with an estimated total grant-date fair value of $11.3 million. As of December 26, 2009, the unamortized stock-based compensation balance related to stock options was $14.0 million after estimated forfeitures, which will be recognized over an estimated period of 1.8 years based on the weighted-average days to vest. Approximately $0.1 million of stock-based compensation was capitalized in inventory for fiscal 2009.
Employee Stock Purchase Plan
The ESPP provides that eligible employees may contribute up to 15% of their eligible earnings toward the semi-annual purchase of our common stock. Under the ESPP, employees may purchase our common stock through payroll deductions at a price equal to 85% of the lower of the fair market value at the beginning of the applicable offering period or at the end of each applicable purchase period. Each offering period has generally been two years in length, consisting of four six month purchase periods. During the fiscal year ended December 26, 2009, 269,156 shares were issued under the ESPP. As of December 26, 2009, we had $0.1 million of total unrecognized stock-based compensation expense, which will be recognized over the weighted average period of one month. Compensation expense is calculated using the fair value of the employees' purchase rights under the Black-Scholes model. The
103
FORMFACTOR, INC.
NOTES TO CONSOLIDATED FINANCIAL STATEMENT (Continued)
Note 10—Stock-Based Compensation (Continued)
following assumptions were used in the estimated fair value calculations for the employees' purchase rights:
| |
Fiscal Years Ended | |||||
|---|---|---|---|---|---|---|
| |
December 26, 2009 |
December 27, 2008 |
December 29, 2007 |
|||
ESPP: |
||||||
Dividend yield |
0% | 0% | 0% | |||
Expected volatility |
52.0% - 62.2% | 52.0% - 56.2% | 37.9% - 50.2% | |||
Risk-free interest rate |
0.26% - 2.13% | 1.88% - 5.11% | 4.96% - 5.16% | |||
Expected life (in years) |
0.50 - 1.00 | 0.50 - 1.00 | 0.50 - 1.00 | |||
Restricted Stock Units
The cost of these awards is determined using the fair value of our common stock on the date of the grant, and compensation cost is recognized over the vesting period. Restricted stock units generally vest over four years.
The total fair value of restricted stock units that vested during fiscal 2009, fiscal 2008, and fiscal 2007 was $2.5 million, $0.6 million, and $1.2 million, respectively. As of December 26, 2009, we had $17.1 million of unrecognized stock-based compensation costs related to restricted stock unit grants, net of forfeitures, which will be recognized over the weighted average remaining contractual term of 2.6 years. As of December 26, 2009, we expected 1,159,323 restricted stock units to vest.
Note 11—Income Taxes
The components of income (loss) before income taxes were as follows (in thousands):
| |
Fiscal Years Ended | |||||||||
|---|---|---|---|---|---|---|---|---|---|---|
| |
December 26, 2009 |
December 27, 2008 |
December 29, 2007 |
|||||||
United States |
$ | (130,815 | ) | $ | (111,680 | ) | $ | 134,727 | ||
Foreign |
(11,624 | ) | (13,232 | ) | (18,487 | ) | ||||
|
$ | (142,439 | ) | $ | (124,912 | ) | $ | 116,240 | ||
104
FORMFACTOR, INC.
NOTES TO CONSOLIDATED FINANCIAL STATEMENT (Continued)
Note 11—Income Taxes (Continued)
The components of the provision for income taxes are as follows (in thousands):
| |
Fiscal Years Ended | ||||||||||
|---|---|---|---|---|---|---|---|---|---|---|---|
| |
December 26, 2009 |
December 27, 2008 |
December 29, 2007 |
||||||||
Current provision (benefit): |
|||||||||||
Federal |
$ | (25,267 | ) | $ | (32,244 | ) | $ | 48,718 | |||
State |
61 | 985 | 802 | ||||||||
Foreign |
806 | 2,249 | 3,002 | ||||||||
|
(24,400 | ) | (29,010 | ) | 52,522 | ||||||
Deferred provision (benefit): |
|||||||||||
Federal |
30,889 | (9,240 | ) | (9,137 | ) | ||||||
State |
8,518 | (6,041 | ) | 585 | |||||||
Foreign |
(1,793 | ) | — | (620 | ) | ||||||
|
37,614 | (15,281 | ) | (9,172 | ) | ||||||
Total provision (benefit) for income taxes |
$ | 13,214 | $ | (44,291 | ) | $ | 43,350 | ||||
The components of the deferred tax assets and liabilities are as follows (in thousands):
| |
Fiscal Years Ended | |||||||
|---|---|---|---|---|---|---|---|---|
| |
December 26, 2009 |
December 27, 2008 |
||||||
Tax credits |
$ | 19,098 | $ | 1,630 | ||||
Inventory reserve |
15,261 | 20,145 | ||||||
Other reserves and accruals |
6,477 | 6,414 | ||||||
Non-statutory stock options |
21,941 | 17,744 | ||||||
Net operating loss carryforwards |
6,302 | 4,709 | ||||||
Gross deferred tax assets |
69,079 | 50,642 | ||||||
Valuation allowance |
(59,097 | ) | (1,395 | ) | ||||
Total deferred tax assets |
9,982 | 49,247 | ||||||
Unrealized investment gains |
(152 | ) | (300 | ) | ||||
Depreciation and amortization |
(6,466 | ) | (5,328 | ) | ||||
Total deferred tax liabilities |
(6,618 | ) | (5,628 | ) | ||||
Net Deferred Tax Assets |
$ | 3,364 | $ | 43,619 | ||||
We utilize the asset and liability method of accounting for income taxes, under which deferred taxes are determined based on the temporary differences between the financial statement and tax basis of assets and liabilities using tax rates expected to be in effect during the years in which the basis differences reverse and for operating losses and tax credit carryforwards. We are required to evaluate the realizability of our deferred tax assets on an ongoing basis in accordance with U.S. GAAP to determine whether there is a need for a valuation allowance with respect to such deferred tax assets. A valuation allowance is recorded when it is more likely than not that some of the deferred tax assets will not be realized. Significant management judgment is required in determining any valuation allowance recorded against deferred tax assets. In evaluating the ability to recover deferred tax assets, we
105
FORMFACTOR, INC.
NOTES TO CONSOLIDATED FINANCIAL STATEMENT (Continued)
Note 11—Income Taxes (Continued)
considered available positive and negative evidence giving greater weight to our recent cumulative losses and our ability to carryback losses against prior taxable income and lesser weight to our projected financial results. We also considered, commensurate with our objective verifiability, the forecast of future taxable income including the reversal of temporary differences and the implementation of feasible and prudent tax planning strategies. During 2009, we recorded a valuation allowance against our US deferred tax assets based on the assessment of both our positive and negative evidence. We have also evaluated our foreign deferred tax assets related to certain net operating losses and have concluded that it is more likely than not that these assets will not be utilized and therefore, we have recorded a full valuation allowance for those deferred tax assets. We intend to maintain a valuation allowance until sufficient positive evidence exists to support a reversal of a valuation allowance.
At December 26, 2009, we had Federal research and development tax credit carryforwards of approximately $15.3 million and foreign tax credit carryforwards of $1.71 million which will expire at various dates from 2015 through 2029, and alternative minimum tax credits of $1.6 million, which do not expire. We had California research credit and net operating loss carryforwards of approximately $9.3 million and $116.5 million, respectively, and foreign net operating loss carryforwards of approximately $56.0 million. The California research credit and foreign net operating losses can be carried forward indefinitely. The California net operating loss carryforwards will expire at various dates from 2028 through 2029. We believe that it is more likely than not the benefit from the above carryfowards, along with our United States deferred tax assets, will not be realized and thus a valuation allowance has been recorded.
The valuation allowance against deferred tax assets consisted of the following activity for the fiscal years ended December 26, 2009, December 27, 2008, and December 29, 2007:
Description
|
Balance at Beginning of Year |
Additions | Deductions | Balance at End of Year |
||||||||||
|---|---|---|---|---|---|---|---|---|---|---|---|---|---|---|
Allowance against deferred tax assets |
||||||||||||||
Year ended December 29, 2007 |
$ | 1,440 | $ | 68 | $ | 121 | $ | 1,387 | ||||||
Year ended December 27, 2008 |
$ | 1,387 | $ | 8 | $ | — | $ | 1,395 | ||||||
Year ended December 26, 2009 |
$ | 1,395 | $ | 57,702 | $ | — | $ | 59,097 | ||||||
U.S. income taxes and foreign withholding taxes associated with the repatriation of earnings of foreign subsidiaries were not provided for approximately $5.2 million of undistributed earnings of our foreign subsidiaries. We intend to reinvest these earnings indefinitely in our foreign subsidiaries. If these earnings were distributed to the United States in the form of dividends or otherwise, or if the shares of the relevant foreign subsidiaries were sold or otherwise transferred, we would be subject to additional U.S. income taxes (subject to an adjustment for foreign tax credits) and foreign withholding taxes. Determination of the amount of unrecognized deferred income tax liability related to these earnings is not practicable.
Tax benefits of $10,000, $0.5 million, and $9.2 million, in fiscal 2009, fiscal 2008, and fiscal 2007, respectively, associated with the exercise of employee stock options and other employee stock programs were credited to stockholders' equity.
106
FORMFACTOR, INC.
NOTES TO CONSOLIDATED FINANCIAL STATEMENT (Continued)
Note 11—Income Taxes (Continued)
The items accounting for the difference between income taxes computed and the (benefit) provision for income taxes consisted of:
| |
Fiscal Years Ended | |||||||||
|---|---|---|---|---|---|---|---|---|---|---|
| |
December 26, 2009 |
December 27, 2008 |
December 29, 2007 |
|||||||
U.S. statutory federal tax rate |
$ | (49,854 | ) | $ | (43,719 | ) | $ | 40,684 | ||
State taxes and credits, net of federal benefit |
(424 | ) | (3,637 | ) | 4,129 | |||||
Amortization of stock-based compensation, net of tax benefit |
484 | 1,377 | 953 | |||||||
Research and development credits |
(2,435 | ) | (2,322 | ) | (4,401 | ) | ||||
Foreign net operating losses |
4,628 | 6,266 | 10,470 | |||||||
Tax exempt interest income |
(90 | ) | (836 | ) | (2,485 | ) | ||||
Foreign taxes at rates different than the U.S. |
(244 | ) | 50 | (1,095 | ) | |||||
Other permanent differences |
2,439 | (1,463 | ) | (4,961 | ) | |||||
Change in valuation allowance |
57,702 | (7 | ) | 56 | ||||||
Other |
1,008 | — | — | |||||||
Total |
$ | 13,214 | $ | (44,291 | ) | $ | 43,350 | |||
Subject to meeting certain conditions of investment and business operations, we have been granted a favorable tax incentive in Singapore into 2018. To date, we have not realized any financial statement benefit from such incentive.
At December 26, 2009, we had gross tax-effected unrecognized tax benefits of $17.4 million of which $4.4 million if recognized, would impact the effective tax rate.
The reconciliation of the total amounts of unrecognized tax benefits as follows (in thousands):
| |
Fiscal Years Ended | |||||||||
|---|---|---|---|---|---|---|---|---|---|---|
| |
December 26, 2009 |
December 27, 2008 |
December 29, 2007 |
|||||||
Unrecognized tax benefit beginning balance |
$ | 15,816 | $ | 19,795 | $ | 16,696 | ||||
Additions based on tax positions related to the current year |
1,620 | 2,452 | 5,772 | |||||||
Additions for tax positions of prior years |
— | — | — | |||||||
Reductions for tax positions of prior years |
— | (4,437 | ) | (347 | ) | |||||
Reductions to unrecognized tax benefits due to lapse of the applicable statute of limitations |
(29 | ) | (464 | ) | (2,326 | ) | ||||
Settlements |
— | (1,530 | ) | — | ||||||
Unrecognized tax benefit ending balance |
$ | 17,407 | $ | 15,816 | $ | 19,795 | ||||
We classify interest and penalties as part of income tax expense. We recognized interest expense of $0.3 million, $0.2 million, and $0.7 million for fiscal 2009, fiscal 2008, and fiscal 2007, respectively, and $0 penalties for all years. As of December 26, 2009, we had approximately $0.9 million of accrued interest and $0 of penalties related to uncertain tax positions.
107
FORMFACTOR, INC.
NOTES TO CONSOLIDATED FINANCIAL STATEMENT (Continued)
Note 11—Income Taxes (Continued)
The amount of income taxes we pay is subject to ongoing audits by federal, state and foreign tax authorities which might result in proposed assessments. Our estimate for the potential outcome for any uncertain tax issue is judgmental in nature. However, we believe we have adequately provided for any reasonably foreseeable outcome related to those matters. Our future results may include favorable or unfavorable adjustments to our estimated tax liabilities in the period the assessments are made or resolved or when statutes of limitation on potential assessments expire. As of December 26, 2009, changes to our uncertain tax positions in the next 12 months, that are reasonably possible, are not expected to have a significant impact on our financial position or results of operation.
We and our subsidiaries file income tax returns in the U.S. federal jurisdiction, various states and non-U.S. jurisdictions. We are currently under examination by the State of California Franchise Tax Board for fiscal years 2004 and 2005. Generally, for our major non-U.S. jurisdictions we are subject to examination by tax authorities for fiscal years after 2002.
Note 12—Employee Benefit Plan
In 1996, we adopted a retirement plan which is qualified under Section 401(k) of the Internal Revenue Code of 1986. Eligible employees may make voluntary contributions to the retirement plan of up to 25% of their annual compensation, not to exceed the statutory amount, and we may make matching contributions. We provide a tax-qualified profit sharing retirement plan for the benefit of eligible employees in the U.S. The plan is designed to provide employees with an accumulation of funds for retirement on a tax-deferred basis and provide for annual discretionary employer contributions. We recorded expenses for matching contributions under the 401(k) plan as well as contributions to the profit sharing retirement plan of $0.9 million, $1.9 million and $7.4 million in fiscal 2009, fiscal 2008 and fiscal 2007, respectively. We suspended our match under the 401(k) plan in the second quarter of fiscal 2009.
Note 13—Operating Segment and Geographic Information
We operate in one segment consisting of the design, development, manufacture, sale and support of precision, high performance advanced semiconductor wafer probe cards. Our chief operating decision-maker is the Chief Executive Officer, who reviews operating results to make decisions about allocating resources and assessing performance for the entire company. Since we operate in one segment and in one group of similar products and services, all financial segment and product line information required can be found in the consolidated financial statements.
The following table summarizes revenue by country based upon ship-to location:
| |
Fiscal Years Ended | |||||||||
|---|---|---|---|---|---|---|---|---|---|---|
| |
December 26, 2009 |
December 27, 2008 |
December 29, 2007 |
|||||||
United States |
18.1 | % | 19.8 | % | 17.8 | % | ||||
Taiwan |
21.4 | 22.9 | 28.1 | |||||||
Japan |
47.7 | 36.7 | 42.0 | |||||||
Germany |
6.1 | 8.5 | 6.7 | |||||||
Other |
6.7 | 12.1 | 5.4 | |||||||
Total |
100.0 | % | 100.0 | % | 100.0 | % | ||||
108
FORMFACTOR, INC.
NOTES TO CONSOLIDATED FINANCIAL STATEMENT (Continued)
Note 13—Operating Segment and Geographic Information (Continued)
The following table summarizes revenue by product group (in thousands):
| |
Fiscal Years Ended | ||||||||||
|---|---|---|---|---|---|---|---|---|---|---|---|
| |
December 26, 2009 |
December 27, 2008 |
December 29, 2007 |
||||||||
DRAM |
$ | 108,820 | $ | 139,537 | $ | 328,019 | |||||
Flash |
7,282 | 38,430 | 88,958 | ||||||||
SoC |
19,233 | 32,222 | 45,214 | ||||||||
Total revenues |
$ | 135,335 | $ | 210,189 | $ | 462,191 | |||||
The following table summarizes net property and equipment and intangible assets by country (in thousands):
| |
Fiscal Years Ended | ||||||
|---|---|---|---|---|---|---|---|
| |
December 26, 2009 |
December 27, 2008 |
|||||
United States(1) |
$ | 92,136 | $ | 103,141 | |||
Japan |
4,594 | 4,282 | |||||
South Korea |
3,244 | 3,657 | |||||
Taiwan |
1,632 | 2,023 | |||||
Germany |
477 | 605 | |||||
Singapore |
3,077 | 105 | |||||
Total |
$ | 105,160 | $ | 113,813 | |||
- (1)
- Fiscal 2009 include net intangible assets of $7.4 million
The following customers represented greater than 10% of our revenues in fiscal 2009, fiscal 2008, and fiscal 2007:
| |
Fiscal 2009 |
Fiscal 2008 |
Fiscal 2007 |
|||||||
|---|---|---|---|---|---|---|---|---|---|---|
Elpida(1) |
49.1 | % | 27.7 | % | 26.2 | % | ||||
Intel Corporation |
* | 12.9 | 10.0 | |||||||
Spansion |
* | 10.7 | 14.4 | |||||||
Powerchip |
* | * | 12.4 | |||||||
- (1)
- Includes
Elpida Memory and its consolidated subsidiaries, Rexchip and Tera Probe for fiscal 2009
- *
- Less than 10% of revenues.
Note 14—Departure of Executive Officers
We entered into a Separation Agreement and Mutual Release as of May 1, 2009 (the "Separation Agreement") with our founder and former Executive Chairman Dr. Igor Khandros, who retired from the Company and the board of directors. Under the terms of the Separation Agreement, we accelerated the vesting of options to acquire 75,000 shares and permitted certain vested stock options
109
FORMFACTOR, INC.
NOTES TO CONSOLIDATED FINANCIAL STATEMENT (Continued)
Note 14—Departure of Executive Officers (Continued)
to be exercisable until the earlier of (i) May 1, 2014 or (ii) the original expiration date of the applicable stock option (Refer to Note 10). We also entered into a consulting agreement with Dr. Khandros effective as of May 1, 2009 under which Dr. Khandros would continue to serve as a key advisor to us for a term of one-year for a quarterly consulting fee of $75,000. The consulting agreement was terminated by Dr. Khandros effective July 1, 2009.
Note 15—Related Party Transactions
We engaged the law firm of Orrick, Herrington & Sutcliffe LLP in our fiscal 2007 to provide us with certain legal services, including matters related to compensation and benefits, and to represent us and certain of our then directors and officers in the securities class action litigation and the stockholder derivative litigation. A partner at Orrick, Herrington & Sutcliffe LLP, who is not involved in the above matters, is the brother-in-law of Stuart L. Merkadeau, our Senior Vice President, General Counsel and Secretary. Mr. Merkadeau does not have a financial or other interest in Orrick's engagement and Mr. Merkadeau's brother-in-law does not provide any legal services to us. Prior to engaging Orrick, Herrington & Sutcliffe LLP, our management discussed the potential engagement with our Governance Committee of the Board of Directors under the Statement of Policy regarding Related Person Transactions. The Governance Committee reviewed and approved the Orrick engagement, and continues to monitor the engagement as necessary. We paid Orrick $616,078 and $1,596,613 in fiscal 2009 and 2008, respectively, for legal services rendered. As of the date of this Form 10-K, Orrick continues to provide legal services in the above matters and is now providing certain other corporate and commercial legal services as well.
Note 16—Selected Quarterly Financial Data (Unaudited)
The following selected quarterly financial data should be read in conjunction with our consolidated financial statements and the related notes and "Item 7: Management's Discussion and Analysis of Financial Condition and Results of Operations". This information has been derived from our unaudited consolidated financial statements that, in our opinion, reflect all recurring adjustments necessary to fairly present this information when read in conjunction with our consolidated financial statements and the related notes appearing in the section entitled "Consolidated Financial Statements". The results of
110
FORMFACTOR, INC.
NOTES TO CONSOLIDATED FINANCIAL STATEMENT (Continued)
Note 16—Selected Quarterly Financial Data (Unaudited) (Continued)
operations for any quarter are not necessarily indicative of the results to be expected for any future period.
| |
Dec. 26, 2009(2)(3)(5) |
Sep. 26, 2009(2)(5) |
June 27, 2009(2)(3)(4) |
Mar. 28, 2009(3)(4) |
Dec. 27, 2008(1) |
Sep. 27, 2008 |
June 28, 2008 |
Mar. 29, 2008 |
|||||||||||||||||||
|---|---|---|---|---|---|---|---|---|---|---|---|---|---|---|---|---|---|---|---|---|---|---|---|---|---|---|---|
| |
(In thousands, except per share data) |
||||||||||||||||||||||||||
Revenues |
$ | 32,995 | $ | 43,773 | $ | 31,198 | $ | 27,369 | $ | 39,889 | $ | 52,584 | $ | 52,013 | $ | 65,703 | |||||||||||
Cost of revenues |
35,797 | 36,435 | 32,524 | 31,048 | 39,300 | 40,583 | 40,912 | 53,131 | |||||||||||||||||||
Gross Margin |
(2,802 | ) | 7,338 | (1,326 | ) | (3,679 | ) | 589 | 12,001 | 11,101 | 12,572 | ||||||||||||||||
Operating Expenses: |
|||||||||||||||||||||||||||
Research and development |
15,686 | 13,775 | 13,938 | 14,110 | 16,221 | 17,079 | 15,821 | 16,388 | |||||||||||||||||||
Selling, general and administrative |
16,489 | 17,366 | 18,263 | 26,310 | 26,170 | 23,675 | 22,705 | 22,658 | |||||||||||||||||||
Restructuring |
837 | — | 264 | 7,679 | 473 | 141 | 3,223 | 5,320 | |||||||||||||||||||
Impairment of long lived assets |
— | — | — | — | 4,400 | — | — | — | |||||||||||||||||||
Total operating expenses |
33,012 | 31,141 | 32,465 | 48,099 | 47,264 | 40,895 | 41,749 | 44,366 | |||||||||||||||||||
Operating income (loss) |
(35,814 | ) | (23,803 | ) | (33,791 | ) | (51,778 | ) | (46,675 | ) | (28,894 | ) | (30,648 | ) | (31,794 | ) | |||||||||||
Interest income, net |
711 | 694 | 762 | 1,115 | 1,638 | 2,805 | 3,128 | 4,875 | |||||||||||||||||||
Other income (expense), net |
385 | (415 | ) | (89 | ) | (416 | ) | 249 | 263 | (652 | ) | 793 | |||||||||||||||
Income (loss) before income taxes |
(34,718 | ) | (23,524 | ) | (33,118 | ) | (51,079 | ) | (44,788 | ) | (25,826 | ) | (28,172 | ) | (26,126 | ) | |||||||||||
Provision for (benefit) from income taxes |
(6,755 | ) | 377 | 32,728 | (13,136 | ) | (14,828 | ) | (11,785 | ) | (9,513 | ) | (8,165 | ) | |||||||||||||
Net income (loss) |
$ | (27,963 | ) | $ | (23,901 | ) | $ | (65,846 | ) | $ | (37,943 | ) | $ | (29,960 | ) | $ | (14,041 | ) | $ | (18,659 | ) | $ | (17,961 | ) | |||
Net income (loss) per share: |
|||||||||||||||||||||||||||
Basic |
$ | (0.56 | ) | $ | (0.48 | ) | $ | (1.33 | ) | $ | (0.77 | ) | $ | (0.61 | ) | $ | (0.29 | ) | $ | (0.38 | ) | $ | (0.37 | ) | |||
Diluted |
$ | (0.56 | ) | $ | (0.48 | ) | $ | (1.33 | ) | $ | (0.77 | ) | $ | (0.61 | ) | $ | (0.29 | ) | $ | (0.38 | ) | $ | (0.37 | ) | |||
Weighted average number of shares used in per share calculations: |
|||||||||||||||||||||||||||
Basic |
49,755 | 49,582 | 49,394 | 49,201 | 49,061 | 48,988 | 48,835 | 48,743 | |||||||||||||||||||
Diluted |
49,755 | 49,582 | 49,394 | 49,201 | 49,061 | 48,988 | 48,835 | 48,743 | |||||||||||||||||||
- (1)
- Fiscal
2008 operating results include a fourth quarter impairment charge of $4.4 million related to Singapore
construction-in-progress assets (See Note 3 of Notes to the Consolidated Financial Statements).
- (2)
- We
recorded a valuation allowance of $44.7 million in the second quarter of fiscal 2009. This valuation allowance was recorded against the U.S.
deferred tax assets, including prior years, based on our assessment of the realizability of such assets. This charge resulted in an income tax provision, rather than an income tax benefit for the
second quarter of fiscal 2009. In the fourth quarter of fiscal 2009, we realized a benefit from the enactment in November, 2009 of a Federal tax law change, the Worker, Homeownership and Business
Assistance Act of 2009, that extended net operating loss carrybacks from two years to five years. We benefited from this provision by approximately $5.0 million prior to the law change.
- (3)
- As
part of our Q1 2009 Restructuring Plan, fiscal 2009 operating results include restructuring charges of $7.7 million and $0.3 million in the
first and second quarters, respectively. We recorded an additional $0.8 million of restructuring charges in the fourth quarter of fiscal 2009 related to further reductions in our global
workforce.
- (4)
- The
decrease in selling, general and administrative expenses from the first quarter to the second quarter of fiscal 2009 is primarily due to a decrease in
outside legal and other professional fees of $1.5 million. The decrease in legal fees was primarily due to the scheduling of the International Trade Commission hearing arising out of our
complaint filed in late 2007. The hearing was conducted during the first quarter of fiscal 2009, during which we also incurred fees and costs related to hearing preparation activities. The majority of
the fees and costs related to the hearing and post hearing activities were completed by the end of the first quarter of fiscal 2009.
- (5)
- The increase in research and development expenses from the third quarter to the fourth quarter of fiscal 2009 is primarily due to an increase in headcount, outside consulting costs as well as other material costs related to research and development projects.
111
Set forth below is a list of exhibits that are being filed or incorporated by reference into this Annual Report on Form 10-K:
| |
|
Incorporated by Reference | |
|
|||||||||||||||
|---|---|---|---|---|---|---|---|---|---|---|---|---|---|---|---|---|---|---|---|
| Exhibit Number | Exhibit Description | Form | File No | Date of First Filing |
Exhibit Number |
Filed Herewith |
|||||||||||||
| 3.01 | Amended and Restated Certificate of Incorporation of the Registrant as filed with the Delaware Secretary of State on June 17, 2003 | S-1 | 333-109815 | 10/20/03 | 3.01 | ||||||||||||||
3.02 |
Amended and Restated Bylaws of the Registrant |
8-K |
000-50307 |
5/25/05 |
3.02 |
||||||||||||||
4.01 |
Specimen Common Stock Certificate |
S-1/A |
333-86738 |
5/28/02 |
4.01 |
||||||||||||||
4.02 |
Stockholders Agreement by and among the Registrant, Dr. Igor Y. Khandros, Susan Bloch and Richard Hoffman dated February 9, 1994 |
S-1 |
333-86738 |
4/22/02 |
4.03 |
||||||||||||||
4.03 |
Stockholders Agreement by and among the Registrant, Dr. Igor Y. Khandros, Susan Bloch and Milton Ohring dated April 11, 1994 |
S-1 |
333-86738 |
4/22/02 |
4.04 |
||||||||||||||
4.04 |
Stockholders Agreement by and among the Registrant, Dr. Igor Y. Khandros, Susan Bloch and Benjamin Eldridge dated August 12, 1994 |
S-1 |
333-86738 |
4/22/02 |
4.05 |
||||||||||||||
4.05 |
Stockholders Agreement by and among the Registrant, Dr. Igor Y. Khandros, Susan Bloch and Charles Baxley, P.C. dated September 8, 1994 |
S-1 |
333-86738 |
4/22/02 |
4.06 |
||||||||||||||
10.01+ |
Form of Indemnity Agreement |
S-1/A |
333-86738 |
5/28/02 |
10.01 |
||||||||||||||
10.02+ |
Form of Change of Control Severance Agreement |
10-K |
000-50307 |
3/14/05 |
10.48 |
||||||||||||||
10.03+ |
1996 Stock Option Plan, and form of option grant |
S-1 |
333-86738 |
4/22/02 |
10.03 |
||||||||||||||
10.04+ |
Incentive Option Plan, and form of option grant |
S-1 |
333-86738 |
4/22/02 |
10.04 |
||||||||||||||
10.05+ |
Management Incentive Option Plan, and form of option grant |
S-1 |
333-86738 |
4/22/02 |
10.05 |
||||||||||||||
10.06+ |
2002 Equity Incentive Plan, as amended, and forms of plan agreements |
— |
— |
— |
— |
X |
|||||||||||||
10.07+ |
2002 Employee Stock Purchase Plan, as amended |
10-Q |
000-50307 |
8/7/07 |
10.01 |
||||||||||||||
10.08+ |
Key Employee Bonus Plan, as amended |
10-Q |
000-50307 |
5/7/07 |
10.01 |
||||||||||||||
10.9+ |
Separation Agreement and General Release dated January 30, 2007 with Joseph R. Bronson |
8-K |
000-50307 |
1/31/07 |
10.01 |
||||||||||||||
112
| |
|
Incorporated by Reference | |
|
|||||||||||||||
|---|---|---|---|---|---|---|---|---|---|---|---|---|---|---|---|---|---|---|---|
| Exhibit Number | Exhibit Description | Form | File No | Date of First Filing |
Exhibit Number |
Filed Herewith |
|||||||||||||
| 10.10+ | Separation Agreement and General Release dated March 20, 2008 with Ronald C. Foster | 8-K | 000-50307 | 3/26/08 | 10.01 | ||||||||||||||
10.11+ |
Employment Offer Letter dated November 23, 2007 to Dr. Mario Ruscev |
8-K |
000-50307 |
1/7/08 |
99.01 |
||||||||||||||
10.12+ |
Employment Offer Letter dated September 25, 2007 to Jorge L. Titinger |
10-K |
000-50307 |
2/27/08 |
10.12 |
||||||||||||||
10.13+ |
Separation Agreement and General Release dated April 15, 2008 with Jorge L. Titinger |
8-K |
000-50307 |
4/21/08 |
10.01 |
||||||||||||||
10.14+ |
Employment Offer Letter dated March 1, 2008 to Jean B. Vernet |
8-K |
000-50307 |
3/31/08 |
10.01 |
||||||||||||||
10.15+ |
Separation Agreement and Mutual Release dated May 1, 2009 with Dr. Igor Y. Khandros |
8-K |
000-50307 |
5/1/09 |
10.01 |
||||||||||||||
10.16+ |
Consulting Agreement dated May 1, 2009 with Dr. Igor Y. Khandros |
8-K |
000-50307 |
5/1/09 |
10.02 |
||||||||||||||
10.17+ |
Written description of definitive agreement to accelerate vesting of restricted stock units of Dr. Thomas J. Campbell in connection with his resignation as director |
8-K |
000-50307 |
12/16/09 |
— |
||||||||||||||
10.18+ |
Written description of definitive agreements to increase base salaries and bonus targets for certain executive officers approved on April 16, 2007 |
8-K |
000-50307 |
4/20/07 |
— |
||||||||||||||
10.19+ |
Written description of definitive agreement regarding director compensation approved on May 21 and 22, 2008 |
8-K |
000-50307 |
5/28/08 |
— |
||||||||||||||
10.20+ |
Pacific Corporate Center Lease by and between Greenville Holding Company LLC (successor to Greenville Investors, L.P.) ("Greenville") and the Registrant dated May 3, 2001 |
S-1/A |
333-86738 |
6/10/03 |
10.18 |
||||||||||||||
10.21 |
First Amendment to Pacific Corporate Center Lease by and between Greenville and the Registrant dated January 31, 2003 |
S-1/A |
333-86738 |
5/7/03 |
10.18.1 |
||||||||||||||
10.22 |
Pacific Corporate Center Lease by and between Greenville and the Registrant dated May 3, 2001 |
S-1/A |
333-86738 |
6/10/03 |
10.19 |
||||||||||||||
10.23 |
First Amendment to Pacific Corporate Center Lease by and between Greenville and the Registrant dated January 31, 2003 |
S-1/A |
333-86738 |
5/7/03 |
10.19.1 |
||||||||||||||
113
| |
|
Incorporated by Reference | |
|
|||||||||||||||
|---|---|---|---|---|---|---|---|---|---|---|---|---|---|---|---|---|---|---|---|
| Exhibit Number | Exhibit Description | Form | File No | Date of First Filing |
Exhibit Number |
Filed Herewith |
|||||||||||||
| 10.24 | Pacific Corporate Center Lease by and between Greenville and the Registrant dated May 3, 2001 | S-1/A | 333-86738 | 6/10/03 | 10.20 | ||||||||||||||
10.25 |
First Amendment to Pacific Corporate Center Lease by and between Greenville and the Registrant dated January 31, 2003 |
S-1/A |
333-86738 |
5/7/03 |
10.20.1 |
||||||||||||||
10.26 |
Pacific Corporate Center Lease by and between Greenville and the Registrant dated September 7, 2004, as amended by First Amendment to Building 6 Lease dated August 16, 2006 |
10-Q |
000-50307 |
11/7/06 |
10.01 |
||||||||||||||
21.01 |
List of Registrant's subsidiaries |
— |
— |
— |
— |
X |
|||||||||||||
23.01 |
Consent of Independent Registered Public Accounting Firm |
— |
— |
— |
— |
X |
|||||||||||||
24.01 |
Power of Attorney (included on the signature page of this Form 10-K) |
— |
— |
— |
— |
X |
|||||||||||||
31.01 |
Certification of Chief Executive Officer pursuant to 15 U.S.C. Section 7241, as adopted pursuant to Section 302 of the Sarbanes-Oxley Act of 2002 |
— |
— |
— |
— |
X |
|||||||||||||
31.02 |
Certification of Chief Financial Officer pursuant to 15 U.S.C. Section 7241, as adopted pursuant to Section 302 of the Sarbanes-Oxley Act of 2002 |
— |
— |
— |
— |
X |
|||||||||||||
32.01* |
Certification of Chief Executive Officer and Chief Financial Officer pursuant to 18 U.S.C. Section 1350, as adopted pursuant to Section 906 of the Sarbanes-Oxley Act of 2002 |
— |
— |
— |
— |
X |
|||||||||||||
- *
- This
exhibit shall not be deemed "filed" for purposes of Section 18 of the Securities Exchange Act of 1934 or otherwise subject to the liabilities of
that section, nor shall it be deemed incorporated by reference in any filing under the Securities Act of 1933 or the Securities Exchange Act of 1934, whether made before or after the date hereof and
irrespective of any general incorporation language in any filings.
- +
- Indicates a management contract or compensatory plan or arrangement.
114