Attached files
Table of Contents
UNITED STATES SECURITIES AND EXCHANGE COMMISSION
WASHINGTON, D.C. 20549
Form 10-K
ANNUAL REPORT PURSUANT TO SECTION 13 OR 15(d) OF THE
SECURITIES EXCHANGE ACT OF 1934
For the fiscal year ended December 31, 2009
Commission file number 1-12372
CYTEC INDUSTRIES INC.
(Exact name of registrant as specified in its charter)
| Delaware | 22-3268660 | |
| (State or other jurisdiction of incorporation or organization) |
(I.R.S. Employer Identification No). |
| Five Garret Mountain Plaza Woodland Park, New Jersey |
07424 | |
| (Address of principal executive offices) | (Zip Code) |
Registrant’s telephone number, including area code (973) 357-3100
Securities registered pursuant to Section 12(b) of the Act:
| Title of each class | Name of exchange on which registered | |
| Common Stock, par value $.01 per share | New York Stock Exchange |
Securities registered pursuant to Section 12(g) of the Act:
None
(Title of Class)
Indicate by check mark if the registrant is a well-known seasoned issuer, as defined in Rule 405 of the Securities Act. Yes x No ¨
Indicate by check mark if the registrant is not required to file reports pursuant to Section 13 or Section 15(d) of the Act. Yes ¨ No x
Indicate by check mark whether the registrant (1) has filed all reports required to be filed by Section 13 or 15(d) of the Securities Exchange Act of 1934 during the preceding 12 months (or for such shorter period that the registrant was required to file such reports), and (2) has been subject to the filing requirements for at least the past 90 days. Yes x No ¨
Indicate by check mark whether the registrant has submitted electronically and posted on its corporate Web site, if any, every Interactive Data File required to be submitted and posted pursuant to Rule 405 of Regulation S-T (§232.405 of this chapter) during the preceding 12 months (or for such shorter period that the registrant was required to submit and post such files). Yes ¨ No ¨.
Indicate by check mark if disclosure of delinquent filers pursuant to Item 405 of Regulation S-K (§229.405 of this chapter) is not contained herein, and will not be contained, to the best of registrant’s knowledge, in definitive proxy or information statements incorporated by reference in Part III of this Form 10-K or any amendment to this Form 10-K. ¨
Indicate by check mark whether the registrant is a large accelerated filer, an accelerated filer, or a non-accelerated filer. See definition of “accelerated filer and large accelerated filer” in Rule 12b-2 of the Exchange Act. Large accelerated filer x Accelerated filer ¨ Non-accelerated filer ¨.
Indicate by check mark whether the Registrant is a shell company (as defined in Rule 12b-2 of the Exchange Act). Yes ¨ No x
At June 30, 2009 the aggregate market value of common stock held by non-affiliates was $895,424,330 based on the closing price ($18.60 per share) of such stock on such date.
There were 48,775,331 shares of common stock outstanding on February 18, 2010.
DOCUMENTS INCORPORATED BY REFERENCE
| Documents | Part of Form 10-K | |
| Portions of Cytec’s Proxy Statement for 2010 Annual Meeting of Common Stockholders to be held on April 22, 2010. | Parts III, IV |
Table of Contents
SUBSIDIARIES
Form 10-K
Table of Contents
Table of Contents
COMMENTS ON
FORWARD-LOOKING STATEMENTS
A number of the statements made by us in our Annual Report on Form 10-K, in other documents, including but not limited to the Chairman, President and Chief Executive Officer’s and Vice President and Chief Financial Officer’s letters to stockholders and stakeholders, respectively, in our press releases and in other reports to the Securities and Exchange Commission, may be regarded as “forward-looking statements” within the meaning of the Private Securities Litigation Reform Act of 1995. All statements in this report, including those made by the management of Cytec, other than historical statements, are forward-looking statements.
Forward-looking statements include, among others, statements concerning: our or any of our segments outlook for the future, anticipated results of acquisitions and divestitures, selling price and raw material cost trends, anticipated changes in currency rates and their effects, economic forces within the industry we operate, anticipated costs, target completion dates and expenditures for capital projects, expected sales growth, operational excellence strategies and their results, expected annual tax rates, our long-term goals, future legal settlements and other statements of expectations, beliefs, future plans and strategies, anticipated events or trends and similar expressions concerning matters that are not historical facts. Such statements are based upon our current beliefs and expectations and are subject to significant risks and uncertainties including those discussed in Item 1A, “Risk Factors” below and elsewhere in this report. Actual results may vary materially from those set forth in the forward-looking statements.
The following factors, among others, could affect our anticipated results: our ability to successfully complete planned or ongoing restructuring and capital expansion projects, including realization of the anticipated results from such projects; our ability to maintain or improve current ratings on our debt; our ability to obtain financing or borrow fully against committed lines, changes in financial conditions or the financial status of our existing lenders markets; changes in global and regional economies; the financial well-being of our customers and the end consumers of our products; changes in demand for our products or in the quality, costs and availability of our raw materials and energy; customer inventory reductions; the actions of competitors; currency and interest rate fluctuations; technological change; our ability to renegotiate expiring long-term contracts; our ability to raise our selling prices when our product costs increase; changes in employee relations, possible strikes or work stoppages at our facilities or at the facilities of our customers or suppliers; new laws and regulations or changes in their interpretation, including those related to taxation, global warming and those particular to the purchase, sale, storage and manufacture of chemicals or operation of chemical plants; governmental funding for those military programs that utilize our products; litigation, including its inherent uncertainty and changes in the number or severity of various types of claims brought against us and changes in the laws applicable to these claims; quality problems; difficulties in plant operations and materials transportation, including those caused by hurricanes or other natural forces; short or long term climate changes; environmental matters; returns on employee benefit plan assets and changes in the discount rates used to estimate employee benefit liabilities; changes in the medical cost trend rate; changes in accounting principles or new accounting standards; political instability or adverse treatment of foreign operations in any of the significant countries in which we or our customers operate; war, terrorism or sabotage; epidemics; and other unforeseen circumstances. Unless indicated otherwise, the terms “Cytec,” “Company,” “we,” “us,” and “our” each refer collectively to Cytec Industries Inc. and its subsidiaries.
AVAILABLE INFORMATION
We maintain a website that contains various information on our Company and products. It is accessible at www.Cytec.com. Through our website, stockholders and the general public may access free of charge (other than any connection charges from internet service providers) filings we make with the Securities and Exchange Commission as soon as practicable after filing. Filing accessibility in this manner includes our Annual Report on Form 10-K, Quarterly Reports on Form 10-Q, Current Reports on Form 8-K and amendments to those reports filed or furnished pursuant to Section 13(a) of the Securities Exchange Act of 1934.
- 1 -
Table of Contents
PART I
(Currencies in millions, except per share amounts)
We are a global specialty chemicals and materials company focused on developing, manufacturing and selling value-added products. Our products serve a diverse range of end markets including aerospace, adhesives, automotive and industrial coatings, construction, chemical intermediates, inks, mining and plastics. We use our technology and application development expertise to create chemical and material solutions that are formulated to perform specific and important functions for our customers. We operate on a global basis with 38% of our 2009 revenues in North America, 39 % in Europe, Middle East, and Africa, 17 % in Asia-Pacific and 6 % in Latin America. We have manufacturing and research facilities located in 16 countries. We had net sales of $2,789.5 and earnings from operations of $31.1 in 2009. Cytec was incorporated as an independent public company in December 1993.
We have five reportable business segments: Coating Resins, Additive Technologies, In Process Separation, Engineered Materials, and Building Block Chemicals. Coating Resins, Additive Technologies, and In Process Separation are managed under one executive leader, and are referred to collectively as Cytec Specialty Chemicals. The Coating Resins segment is substantially comprised of the Surface Specialties business acquired from UCB in 2005, and includes the following product lines: radiation-cured resins (Radcure resins), powder coating resins, and liquid coating resins. Included in the liquid coating resins product line are waterborne resins, amino cross-linkers, solventborne resins, and urethane resins. Additive Technologies includes polymer additives, specialty additives, and polyurethanes. As of May 19th, 2009, all polyurethanes assets have been divested. In Process Separation includes mining chemicals and phosphines. Engineered Materials principally includes advanced composites, carbon fiber, structural film and pressure sensitive adhesives, and formulated resins. Building Block Chemicals principally includes acrylonitrile, hydrocyanic acid, sulfuric acid and melamine.
We regularly review our segment reporting and classifications and may periodically change our reportable segments to align with operational changes.
Our corporate vision is to deliver technology beyond our customers’ imagination. To achieve our corporate vision, our strategy includes the following initiatives:
| • | Achieve sustainable and profitable growth by providing innovative solutions to meet customer needs. We seek to collaborate closely with our customers to understand their needs and provide them with a superior value proposition, whether through improvement in product quality, performance, cost or a new enabling technology. We seek to market our specialty products in terms of the value they provide and focus on delivering a high level of technical service to our customers as we work with them on solving problems and providing them with better products for their applications. |
| • | Provide a culture that challenges, engages and rewards our employees. We know that progress and growth depend on every employee taking responsibility, being creative, and contributing to our overall successful performance. We strive to have employees be challenged and to enjoy success as we continue to build a stronger Cytec. As part of this process, employees have opportunities to embark on career paths geared towards advancement in various areas of our organization. Our goal is to attract, retain and develop employees to their highest potential and be recognized as a global employer of choice. |
| • | Be universally recognized as the technology leader in our markets. We are dedicated to creating a sustainable competitive advantage through superior technology. We believe our technology is the ultimate engine of our growth and success. To that end we focus on our new product pipeline and delivering value-added products to our customers every year. Even in a difficult period such as 2009, we continued to invest in our three growth platforms i.e. Engineered Materials, Eco-Friendly Coatings (radiation cured and waterborne resins) and In-Process Separation. We also launched our High Performance Industrial Materials (“HPIM”) product line. The HPIM product line is comprised of technologies from our specialty chemical adhesives product lines, certain coating resins and our non aerospace engineered materials products. HPIM is designed to leverage our competencies across these technology platforms and grow our share in the adjacent rapidly expanding structural adhesive and fiber reinforced composite industrial markets. |
| • | Positively impact society by our commitment to safety, health, and environmental stewardship. We focus our innovation on the development of environmentally sustainable products, and demonstrate our respect for the communities in which we operate. We operate on a global basis with manufacturing plants and research facilities located in 16 countries including high growth emerging markets where we will continue to expand sales as markets |
- 2 -
Table of Contents
| develop. Our global operations add to the vitality and the economy of the regions in which we operate. |
We are focused on operational excellence. To develop and implement best practices, we benchmark our performance against our competitive peer group. This has had a significant positive impact in terms of our safety and environmental performance.
Manufacturing has the largest impact on our costs and we use various techniques such as six-sigma and lean manufacturing to reduce our product costs by improving process yields, reducing batch times, increasing capacity and improving and/or streamlining our manufacturing processes. We continuously review our operational footprint versus current and projected market demand and from time to time we may also shutdown parts of or close certain manufacturing or laboratory facilities.
Over the years, in the course of our ongoing operations, we have made a number of other strategic business and product line acquisitions and dispositions.
Our management team regularly reviews our product line portfolio in terms of strategic fit and capital allocation based on financial performance which includes factors such as growth, profitability and return on invested capital. From time to time, we may also dispose of or withdraw certain product lines. We may also acquire additional product lines or technologies. We conduct regular reviews of our plant sites’ cost effectiveness, including individual facilities within such sites to insure our long-term competitiveness.
SEGMENT INFORMATION
Revenues from external customers, earnings from operations and total assets for each of our five reportable segments can be found in Note 16 of the Notes to Consolidated Financial Statements.
COATING RESINS
Set forth below are our primary product lines and major products in this segment and their principal applications.
| Product Line | Major Products | Principal Applications | ||
| Radcure resins | Oligomers, monomers, photo-initiators | Coatings and inks used in industrial metal, wood and plastic coatings including parquet, furniture, safety glass interlayer, printing varnishes and inks | ||
| Powder coating resins | Conventional and ultraviolet powder coating resins | Powder coatings for industrial and heavy duty metal applications, appliance, white goods, architecture and wood | ||
| Liquid coating resins | Waterborne resins, solventborne resins, amino cross-linkers, and urethane resins | Industrial coatings for automobiles, cans, coil, metal fixtures, metal and wood furniture, and heavy-duty industrial machinery, architectural applications, products used in abrasives, tires, electronics, marine, sanitary and swimming pools |
We market our coating resins chemicals through specialized sales and technical service staffs for each of our product lines. Sales are typically made directly to large customers and through distributors to smaller customers. Certain of our products, primarily amino cross-linkers, in this segment are manufactured using melamine that is manufactured by our Building Block Chemicals segment. For further discussion of raw materials, refer to “Customers and Suppliers.”
RADCURE RESINS
We are a leading producer of environmentally friendly, radiation-cured resins for high-performance coatings and graphics applications. These resins are cured (dried and hardened) by exposing them to ultraviolet or electron-beam radiation, rather than heat which typically reduces processing costs and increases productivity. Products such as inks, compact discs, DVDs, flat panel displays, credit cards, packaging, parquet and furniture utilize advanced resins like the ones we have developed.
POWDER COATING RESINS
Our polyester powder resin technologies which are environmentally friendly account for a significant portion of the industrial finishing market. We offer innovations such as powder resins for super durable clear coats, weather-resistant finishes and ultraviolet-curing powder coating resins systems for heat-sensitive substrates such as plastic and wood. These powder coatings provide original equipment
- 3 -
Table of Contents
manufacturers with a number of cost and environmental benefits compared to traditional coating systems.
LIQUID COATING RESINS
We manufacture a broad range of waterborne and solventborne resins. We are a market leader in resins for high-solids and waterborne coating systems. Our extensive portfolio includes products based on seven chemistries: acrylics, amino cross-linkers, epoxy systems, alkyds and polyesters, urethanes, phenolics and unsaturated polyesters.
We also market a broad range of additives to assist customers in formulating high-performance coatings for protective and decorative applications.
ADDITIVE TECHNOLOGIES
Set forth below are our primary product lines and major products in this segment and their principal applications.
| Product Line | Major Products | Principal Applications | ||
| Polymer additives | Ultraviolet light stabilizers and absorbers, high performance antioxidants and antistatic agents | Plastics, coatings, and fibers for: agricultural films, automotive parts, architectural lighting, housewares, packaging, outdoor furniture, sporting goods, toys and apparel | ||
| Specialty additives | Surfactants, specialty monomers, resin amines, and PTZ® Phenothiazine (acrylic acid stabilizers) | Textiles, non-wovens and adhesives, super absorbent polymers, pharmaceuticals and acrylic acid |
We market our additives technologies chemicals through specialized sales and technical service staffs for each of our product lines. Sales are usually made directly to large customers and through distributors to smaller customers. For a discussion of raw materials, refer to “Customers and Suppliers.”
POLYMER ADDITIVES
We are a global supplier to the plastics industry of specialty additives which protect plastics from the ultraviolet radiation of sunlight and from oxidation. We seek to enhance our position with new products based on proprietary chemistries combined with our technical support. In certain cases, we use a combination of additives to achieve a level of efficiency not previously achieved in polymer applications.
SPECIALTY ADDITIVES
We are a leading global supplier of sulfosuccinate surfactants, Docusate sodium, acrylamide-based specialty monomers, and PTZ® phenothiazine. Sulfosuccinate surfactants and acrylamide-based specialty monomers products are used in emulsion polymers, paints, paper coatings, printing inks, and other diverse customer applications. Docusate is a pharmaceutical grade product used as both an active ingredient and excipient/ formulating aid. PTZ® phenothiazine is primarily used as an acrylic acid, acrylic ester and methacrylate monomer stabilizer.
IN PROCESS SEPARATION
Set forth below are our primary product lines and major products in this segment and their principal applications.
| Product Line | Major Products | Principal Applications | ||
| Mining chemicals | Promoters, collectors, solvent extractants, flocculants, frothers, filter and dewatering aids, antiscalants, dispersants, depressants, defoamers, and phosphine specialty reagents | Mineral separation and processing for copper, alumina, cobalt, nickel, and other minerals | ||
| Phosphines | Flame retardants, catalyst ligands, high purity phosphine gas and biocides | Pharmaceutical, chemical and electronic manufacturing, and fumigants |
We market our In Process Separation chemicals through specialized sales and technical service staffs for each of our product lines. Sales are usually made directly to large customers and through distributors to smaller customers. For a discussion of raw materials, refer to “Customers and Suppliers.”
- 4 -
Table of Contents
MINING CHEMICALS
Our mining chemicals product line is primarily used in applications to separate desired minerals from host ores. We have a leading position in the copper processing industry, particularly in the flotation and solvent extraction of copper. We also have a leading position in the alumina processing industry, where our patented HxPAMs are particularly effective at the flocculation of “red mud” and our patented MaxHT™ antiscalant is sold for suppressing sodalite scale formation. We also sell phosphine specialty reagents which have leading positions in cobalt, nickel solvent extraction separation and complex sulfide flotation applications. Demand for mining chemicals is cyclical and varies with industry conditions such as global demand, inventory levels and prices for the particular minerals with respect to which our products have processing applications. We strive to develop new technologies as well as new formulations tailored for specific applications.
PHOSPHINES
Our phosphine specialties are utilized for a variety of applications. We are a leading supplier of ultra-high purity phosphine gas, used in semiconductor manufacturing and light emitting diode applications, and have significant positions in various phosphine derivative products including phosphonium salts used in pharmaceutical catalysts and biocides. Included in the phosphine line are organo phosphorus compounds. The compounds are used primarily as intermediates and catalyst ligands for organic and chemical synthesis in the pharmaceutical and chemical industries.
ENGINEERED MATERIALS
Set forth below are our primary product lines and major products in this segment and their principal applications.
| Product Line | Major Products | Principal Applications | ||
| Carbon Fibers | High performance fiber | Raw material input for industrial and aerospace advanced composite materials | ||
| Advanced composites and Aerospace adhesives |
Advanced composite materials and structural film adhesives | Large commercial airliners, regional and business jets, military aircraft (including rotorcraft, satellites and launch vehicles), high performance automotive and specialty applications | ||
| High Performance Industrial Materials | Prepregs, resin infusion, adhesives and gelcoats/top coats; pressure sensitive adhesives; formulated resins | Industrial markets including alternative energy, construction, marine and high performance automotive; pressure sensitive adhesives for signage, labels, tapes, graphics and medical applications; formulated resins for bonding and/or sealing of electrical and electronic components, tooling applications and specialty adhesives and sealants | ||
We market engineered materials through a dedicated sales and technical service staff typically direct to customers. Sales are dependent to a large degree on the commercial and military aircraft build-rates and the number of applications and aircraft programs for which we are a qualified supplier. The majority of commercial aircraft programs in the western world have qualified and use our products. We are a major supplier to such U.S. military programs as the F-35 Joint Strike Fighter, the F/A-22 and F/A-18 combat aircraft and the C-17 transport aircraft. We have a number of long-term agreements, expiring over various periods, to supply aerospace customers with their requirements of various engineered materials at prices that are generally fixed by year.
CARBON FIBERS, ADVANCED COMPOSITES, AND STRUCTURAL ADHESIVES
Our Engineered Materials segment manufactures and sells advanced structural film adhesives and advanced composite materials primarily to the aerospace industry and other high performance specialty applications. The primary applications for both aerospace adhesives and advanced composites are large commercial airliners, regional and business jets, military aircraft (including rotorcraft, satellites and launch vehicles), high-performance automotive, marine and specialty applications. Advanced composites are exceptionally strong and lightweight materials manufactured by impregnating fabrics and tapes made from high performance fibers (such as carbon fiber) with epoxy, bismaleimide, phenolic, polyimide and other resins formulated or purchased by us.
- 5 -
Table of Contents
Advanced composites generally account for a higher percentage of the structural weight on a military aircraft than on a commercial aircraft. They also account for a higher percentage of the structural weight on newer design commercial aircraft than older design commercial aircraft as technology progresses and manufacturers design planes to achieve greater fuel efficiency. Advanced composites made from carbon fibers and epoxy or bismaleimide resins are primarily used for structural aircraft applications such as wing, tail and rudder components, engine housings, and fuselage components while advanced composites made from fiberglass or aramid materials and phenolic resins are primarily used for secondary structure applications such as fairings and interior aircraft applications such as sidewall, ceiling and floor panels and storage and cargo bins. In addition, our ablatives are used in manufacturing rocket nozzles and our carbon/carbon products are used in manufacturing aircraft and other high performance brakes. We expect the demand for advanced composites to continue to increase as new applications are developed.
Our structural adhesives and advanced composites also have various applications in industrial, high performance automotive, marine and selected recreational products.
We purchase from third parties all of the aramid and glass fibers and much of the carbon fibers and base resins used in the manufacture of composites. They are mainly used as a reinforcement material for advanced composites used in the aerospace and certain other industries and have many advantageous characteristics such as light weight, high strength, long fatigue life and strong heat and corrosion resistance.
We manufacture and sell various high-performance grades of both polyacrylonitrile (“PAN”) type and pitch type carbon fibers. Approximately 65% of our carbon fiber production is utilized internally (which represents approximately 35% of our demand for carbon fiber) with the balance being sold to third parties. We have started a project to build a new carbon fiber line at our existing site in South Carolina which is forecasted to cost in a range of $200 to $250, of which $172 has been spent through December 31, 2009. Taking into account our expectations of the future business environment and the impact on the overall demand profile for carbon fiber, we decided in the first quarter of 2009 to delay the completion of the carbon fiber expansion project for at least eighteen months. The new line will increase our capacity of PAN carbon fiber for aerospace applications by approximately 50%. The project will include certain infrastructure to support additional carbon fiber production expansion. For additional information refer to “Customers and Suppliers”.
HIGH PERFORMANCE INDUSTRIAL MATERIALS (“HPIM”)
Our HPIM product line leverages our composites and adhesives technologies across multiple industrial markets.
We supply composites and adhesives to a broad range of markets such as alternative energy, construction, marine and high performance automotive to meet increasing requirements for weight, strength and cost optimized products and materials.
We manufacture and sell specialty pressure sensitive adhesives for waterborne, solventborne and radiation cured systems, featuring innovative products such as high-performance emulsions, adhesives for medical (transdermal patch) applications and removable adhesives. The adhesives are applied to a variety of substrates by our customers who utilize them in applications for signage, labels, tapes (high performance automotive, aerospace and other specialty markets), graphics and medical systems. Formulations are designed for broad market use and for customer-specific applications.
Our formulated resins products include formulated high technology, specialty polyurethane and epoxy resin systems tailored to suit the individual needs of our customers. These resins are commonly used in the tooling industry, and to encapsulate and protect electronics, coat printed circuit boards and adhere/seal filters. Urethane and epoxy systems are also formulated and sold to adhesive applications that bond metal to composite materials, laminate composite layers and adhere/seal filtration membranes.
BUILDING BLOCK CHEMICALS
Building Block Chemicals are manufactured at our world-scale, highly integrated Fortier facility. The Fortier facility is located on the bank of the Mississippi River near New Orleans, Louisiana and has access to all major forms of transportation and supplies of raw materials. This segment’s product lines include acrylonitrile, hydrocyanic acid (a co-product of acrylonitrile), sulfuric acid, acetonitrile and melamine which is produced both for use internally within our other segments and for third party sale. The integration of the facility comes from its steam usage whereas the acrylonitrile and sulfuric acid production produces excess steam which is used in the production of melamine. Additionally, a tenant at the site purchases substantially all of the hydrocyanic acid we produce as well as substantial amounts of the sulfuric acid
- 6 -
Table of Contents
we produce for their manufacture of methyl methacrylate at the site. We strive to operate our plants at capacity subject to market conditions and raw material availability.
ACRYLONITRILE AND HYDROCYANIC ACID
We expect to sell up to approximately 15% of our current acrylonitrile production to an international trading company under a long-term distribution agreement at a market based price. Another 30% is expected to be sold to Kemira Group (“Kemira”) under long-term agreements to make acrylamide and the remainder is sold within the United States or exported to international markets principally in Europe and Asia depending upon selling prices in the regions. We sell all of our hydrocyanic acid under a long-term supply agreement to a tenant at our Fortier site.
OTHER BUILDING BLOCK CHEMICALS
We are the only manufacturer of melamine in North America and about 30% of our approximately 150 million pound capacity is used internally to make amino cross-linkers. Depending on market conditions, the remainder is marketed and sold to third parties. Our ability to manufacture melamine at a competitive cost depends primarily on the cost of ammonia (which is dependent on the cost of natural gas) and freight rates.
We manufacture and sell sulfuric acid and regenerated sulfuric acid under a long-term supply agreement to a tenant at our Fortier site and sell sulfuric acid in the merchant marketplace.
Prices of Building Block Chemicals are sensitive to the stages of economic cycles, raw material cost and availability, energy prices and currency rates, as well as to periods of insufficient or excess capacity. Building Block Chemicals and its competitors tend to operate their plants at capacity even in poor market environments, which may result in strong downward pressure on product pricing.
We sell Building Block Chemicals to third parties through a direct sales force and distributors.
ASSOCIATED COMPANY AND MINORITY INTERESTS
We own a 50% interest in SK Cytec Co., Ltd. and a majority share of two consolidated entities. All make products for principal applications similar to those listed in our Coating Resins segment. Each of the entities is immaterial to the results of our operations.
COMPETITION
We actively compete with companies producing the same or similar products and, in some instances, with companies producing different products designed for the same uses. We encounter competition in price, delivery, service, performance, product innovation, product recognition and quality, depending on the product involved. For some of our products, our competitors are larger and have greater financial resources than we do. As a result, these competitors may be better able to withstand a change in conditions within the industries in which we operate, a change in the prices of raw materials without increasing their prices or a change in the economy as a whole.
Our competitors can be expected to continue to develop and introduce new and enhanced products, which could cause a decline in market acceptance of our products. Current and future consolidation among our competitors and customers may also cause a loss of market share as well as put downward pressure on pricing. Our competitors could cause a reduction in the prices for some of our products as a result of intensified price competition. Competitive pressures can also result in the loss of major customers.
In general, we compete by maintaining a broad range of products, focusing our resources on products in which we have a competitive advantage and fostering our reputation for quality products, competitive prices and excellent technical service and customer support. To help increase sales and margins, we are seeking to leverage our research and development efforts to develop value-added products and products based on proprietary technologies. If we cannot compete successfully, our businesses, financial condition, results of operations, and cash flows could be adversely affected.
CUSTOMERS AND SUPPLIERS
Sales derived from any single customer did not exceed 10% of our consolidated revenues for fiscal years 2009, 2008, and 2007. Sales to one of our customers, including sales to that customer’s subcontractors, are significant to our Engineered Materials segment. The loss of this customer and related subcontractors would have a material adverse effect on the operating results of our Engineered Materials segment. Sales of hydrocyanic acid and acrylonitrile, as well as tolling manufacturing of regenerated sulfuric acid to two of our customers are significant to our Building Block Chemicals segment. The loss of these customers would have a material adverse effect on the operating results of our Building Block Chemicals segment. Sales to one customer of our Coating Resins segment are significant to this segment and, if such sales were lost, would have a material adverse effect on the operating results of our Coating Resins segment. A summary of various
- 7 -
Table of Contents
long-term customer supply agreements is disclosed in Note 11, of the Notes to Consolidated Financial Statements which is incorporated by reference herein.
A number of our customers operate in cyclical industries such as the aerospace, automotive, construction and mining. This in turn, causes demand for our products to also be cyclical. Industry cycles also impact profitability of our Building Block Chemicals’ sales.
Key raw materials for the Cytec Specialty Chemicals segments are propylene derivatives such as acrylic acid, methanol derivatives and natural gas for energy. Key raw materials for the Engineered Materials segment are carbon fiber and various resins. We require natural gas, propylene, ammonia and sulfur to manufacture our Building Block Chemicals. These are typically available although we have experienced tight markets for certain raw materials from time to time.
Oil and natural gas are important indirect raw materials for many of our products. The prices of both of these commodities have been volatile over time. Sudden price swings can adversely affect our ability to recover increased costs from our customers or demand for our products. Because natural gas is not easily transported, the price may vary widely between geographic regions. As a result of this, many of our products could compete with similar products made with less expensive natural gas available elsewhere and we may not be able to recover any or all of the increased cost of gas in manufacturing our products.
Our Fortier facility is served principally by a single propylene pipeline owned by a supplier. Propylene deliveries from two suppliers will utilize this pipeline with contracts expiring at the end of 2010. A significant quantity of propylene was received via rail in 2009 and this trend is anticipated to continue in 2010.
To minimize reliance on any one supplier, we generally attempt to retain multiple sources for high volume raw materials, other than our own Building Block Chemicals. We are dependent on a limited number of suppliers for carbon fibers that are used in many of our advanced composite products. As we manufacture some of our own carbon fibers, the risk of future carbon fiber supply limitations is somewhat reduced. There can be no assurance that the risk of encountering supply limitations can be entirely eliminated.
Changes to raw material costs year on year are an important factor in profitability. Raw material prices can increase or decrease based on supply and demand and other market forces. We have from time to time experienced difficulty procuring several key raw materials, such as but not limited to, methanol derivatives, propylene, natural gas and carbon fiber, due to general market conditions or conditions unique to a significant supplier. We may experience supply disruptions of these and other materials in the future. Such conditions, if protracted, could result in our inability to manufacture our products, resulting in lower than anticipated revenues. If we are unable to raise our selling prices to recover the increased costs of raw materials driven by higher energy costs or other factors, our profit margins will be adversely affected. In other cases, we may have to reduce the selling prices of our products due to competitive pressures and may not be able to retain the additional profitability from the reduced raw material costs.
INTERNATIONAL
We operate on a global basis, with manufacturing and research facilities located in 16 countries. Through our sales forces, third party distributors and agents, we market our products internationally. Geographical information is contained in Note 16 of the Notes to Consolidated Financial Statements.
International operations are subject to various risks which may or may not be present in U.S. operations. These risks include political instability, the possibility of expropriation, restrictions on royalties, dividends and remittances, exchange rate fluctuations, requirements for governmental approvals for new ventures and local participation in operations such as local equity ownership and workers’ councils. Since we conduct business through subsidiaries in many different countries, fluctuations in currency exchange rates could have a significant impact on our reported revenues, which are reported in U.S. dollars. In 2009, approximately 64 % of our consolidated net sales occurred outside of the U.S., a significant portion of which are denominated in foreign currencies. However, we have material operations outside the U.S. which tend to offset some of the impact on earnings. Accordingly, changes in currency exchange rates could cause favorable or unfavorable fluctuations in our reported results of operations. Cross border transactions, both with external parties and intercompany relationships result in increased exposure to foreign exchange effects. Such fluctuations between the various currencies in which we do business have caused and will continue to cause currency transaction gains and losses, which may be material. While we may periodically enter into currency forward contracts to hedge currency fluctuations of transactions denominated in currencies other than the functional currency of the respective entity, it is
- 8 -
Table of Contents
not always cost effective to hedge all foreign currency exposures in a manner that would completely eliminate the effects of changes in foreign currency exchange rates on our results of operations or cash flows. Further, our international sales are translated into U.S. dollars for reporting purposes. The strengthening or weakening of the U.S. dollar could result in favorable or unfavorable translation effects as the results of our foreign operations are translated into U.S. dollars. Foreign currency translation unfavorably impacted our sales and favorably impacted our income from operations for the year ended December 31, 2009 by approximately $45.0 and $16.0, respectively as compared to fiscal 2008. While we do not currently believe that we are likely to suffer a material adverse effect on our results of operations in connection with our existing international operations, any of these events could have an adverse effect on our international operations in the future by reducing the demand for our products, affecting the prices at which we can sell our products or otherwise having an adverse effect on our operating performance.
RESEARCH AND PROCESS DEVELOPMENT
During 2009, 2008 and 2007, we incurred $75.2, $81.6 and $75.7, respectively, of research and process development expense.
TRADEMARKS AND PATENTS
We have approximately 1,900 patents issued in various countries around the world. We also have trademark applications and registrations for approximately 250 product names. We do not believe that the loss of patent or trademark protection on any one product or process would have a material adverse effect on our company. While the existence of a patent is presumptive evidence of its validity, we cannot assure that any of our patents will not be challenged, nor can we predict the outcome of any challenge.
EMPLOYEES
We employ approximately 5,800 employees of whom about 42 % are represented by unions. We believe that our relations with employees and unions are generally good.
OPERATING RISKS
Our revenues are largely dependent on the continued operation of our various manufacturing facilities. There are many risks involved in operating chemical manufacturing plants, including the breakdown, failure or substandard performance of equipment, operating errors, natural disasters, the need to comply with directives of, and maintain all necessary permits from, government agencies, and potential terrorist attack. Our operations can be adversely affected by labor force shortages or work stoppages and events impeding or increasing the cost of transporting our raw materials and finished products. The occurrence of material operational problems, including but not limited to the above events, may have a material adverse effect on the productivity and profitability of a particular manufacturing facility. With respect to certain facilities, such events could have a material effect on our company as a whole.
Our operations are also subject to various hazards incident to the production of industrial chemicals. These include the use, handling, processing, storage and transportation of certain hazardous materials. Under certain circumstances, these hazards could cause personal injury and loss of life, severe damage to and destruction of property and equipment, environmental damage and suspension of operations. Claims arising from any future catastrophic occurrence at one of our locations may result in Cytec being named as a defendant in lawsuits asserting potentially large claims.
We typically seek to utilize third party insurance. This insurance covers portions of certain of these risks to the extent that coverage is available and can be obtained on terms we believe are economically justified.
ENVIRONMENTAL MATTERS AND REACH
We are subject to various laws and regulations which impose stringent requirements for the control and abatement of pollutants and contaminants and the manufacture, transportation, storage, handling and disposal of hazardous substances, hazardous wastes, pollutants and contaminants.
In particular, under various laws in the U.S. and certain other countries in which we operate, a current or previous owner or operator of a facility may be liable for the removal or remediation of hazardous materials at the facility and nearby areas. Such laws typically impose liability without regard to whether the owner or operator knew of, or was responsible for, the presence of such hazardous materials. In addition, under various laws governing the generation, transportation, treatment, storage or disposal of solid and hazardous wastes, owners and operators of facilities may be liable for removal or remediation, or other corrective action at areas where hazardous materials have been released. The costs of removal, remediation or corrective action may be substantial. The presence of hazardous materials in the environment at any of our facilities, or the failure to abate such materials
- 9 -
Table of Contents
promptly or properly, may adversely affect our ability to operate such facilities. Certain of these laws also impose liability for investigative, removal and remedial costs on persons who dispose of or arrange for the disposal of hazardous substances at facilities owned or operated by third parties. Liability for such costs is retroactive, strict, and joint and several.
We are required to comply with laws that govern the emission of pollutants into the ground, waters and the atmosphere and with laws that govern the generation, transportation, treatment, storage, and disposal of solid and hazardous wastes. We are also subject to laws that regulate the manufacture, processing, and distribution of chemical substances and mixtures, as well as the disposition of certain hazardous substances. In addition, certain laws govern the abatement, removal, and disposal of asbestos-containing materials and the maintenance of underground storage tanks and equipment which contains or is contaminated by polychlorinated biphenyls. The costs of compliance with such laws and related regulations may be substantial, and regulatory standards tend to evolve towards more stringent requirements. These requirements might, from time to time, make it uneconomic or impossible to continue operating a facility. Non-compliance with such requirements at any of our facilities could result in substantial civil penalties or our inability to operate all or part of the facility, or our ability to sell certain products.
In regards to concerns about global warming, global warming could have an adverse impact on our operations, particularly in hurricane prone or low lying areas near the ocean. At this time, we are not able to speculate as to the potential timing or impact from potential global warming, however we believe we currently have adequate insurance coverage related to natural disasters at our sites. There are several initiatives in the United States and other countries to regulate certain industries and actions to reduce the impact of global warming. Some of these initiatives, if made effective, could have a direct adverse impact on our operations or an indirect adverse impact by affecting our suppliers or customers. In September 2009, the U.S. Environmental Protection Agency (“EPA”) promulgated a new regulation regarding the registry of greenhouse gas emissions for certain facilities. Currently we have two sites that are required to report such emissions under the new EPA climate registry rule. We do not expect the regulation to have a significant impact from a cost or operations perspective, as we already have systems in place to measure and report our emissions. We continue to monitor proposed legislation and regulation and its impact.
Further discussion of environmental matters is discussed in Note 11 of the Notes to Consolidated Financial Statements.
The Registration, Evaluation and Authorization of Chemicals (“REACH”) legislation became effective in the European Union on June 1, 2007. This legislation requires manufacturers and importers of certain chemicals to register certain chemicals and evaluate their potential impact on human health and the environment. Under REACH, where warranted by a risk assessment, specified uses of some hazardous substances may be restricted. Covered substances were registered as of December 31, 2009. Subsequently, registration is required based on volume for covered substances manufactured or imported into the European Union in quantities greater than one metric ton per year. REACH is expected to take effect in three primary stages over eleven years following the effective date. The registration, evaluation and authorization phases would require expenditures and resource commitments, for example, in order to compile and file comprehensive reports, including testing data, on each chemical substance and perform chemical safety assessments. We did not incur significant costs for REACH compliance in 2008 and 2009 and do not expect to incur significant costs in 2010. However, the overall cost of compliance over the next 10-15 years could be substantial although at this time, we do not expect costs to be substantial. In addition, it is possible that REACH may affect raw material supply, customer demand for certain products, and our decision to continue to manufacture and sell certain products in the European Union.
RISK FACTORS
Our indebtedness could adversely affect our financial condition, limit our ability to grow and compete and prevent us from fulfilling our obligations under our notes and our other indebtedness.
As of December 31, 2009, we had $685.5 of total debt outstanding. Our indebtedness could adversely affect our financial condition, limit our ability to grow and compete and prevent us from fulfilling our obligations under our notes and our other indebtedness. A discussion of our debt is contained in Note 10 of the Notes to Consolidated Financial Statements.
There is $400.0 of availability under our $400.0 five-year revolving credit facility, which expires June 2012, and $77.3 of availability under various non-U.S. credit facilities. The requirements to meet
- 10 -
Table of Contents
financial ratios could limit our ability to plan for or react to market conditions or meet extraordinary capital needs and could otherwise restrict our financing activities. Our ability to comply with the covenants will depend on our future operating performance. If we fail to comply with those covenants and terms, we will be in default. In this case, we would be required to obtain waivers from our lenders in order to maintain compliance. If we were unable to obtain any necessary waivers, the amounts outstanding under this agreement could be accelerated, and become immediately due and payable, and we would not be able to borrow any additional funds under the agreement while such default continued. Our ability to fully utilize our facility is limited by our actual calculated Debt Covenant Ratios as compared to the maximum Debt Covenant Ratio permitted under the agreement. We would be required to obtain waivers from our lenders in order to maintain the full use of the revolver if our actual calculated Debt Covenant Ratios were expected to exceed the maximum Debt Covenant Ratios permitted under the agreement, and as a result, we believe our financing costs would be significantly higher.
Disposition or restructuring charges, goodwill impairment, acquisition intangible impairment, or other asset impairment charges may affect our results of operations in the future.
Management regularly reviews our business portfolio in terms of strategic fit and financial performance and may from time to time dispose of or withdraw certain product lines. Additionally, management regularly reviews the cost effectiveness of its plant sites and/or assets at such sites. Long-lived assets with determinable useful lives are reviewed for impairment whenever events or changes in circumstances indicate that the carrying amount of an asset may not be recoverable. We may find it necessary to record disposition, restructuring or asset impairment charges in connection with such reviews. For example, we recorded restructuring charges of approximately $90.2 in 2009 principally related to plant closures and employee severance. See Note 3 of the Notes to the Consolidated Financial Statements for further details. Such charges could have a material adverse effect on our results of operations in the period in which they are recorded.
We test goodwill for impairment on an annual basis each October 1st and more often if events occur or circumstances change that would likely reduce the fair value of a reporting unit to an amount below its carrying value. We also test for other possible acquisition intangible impairments if events occur or circumstances change that would indicate that the carrying amount of such intangible asset may not be recoverable. Any resulting impairment loss would be a non-cash charge and may have a material adverse impact on our results of operations in any future period in which we record a charge. For example, in connection with our annual goodwill impairment test in 2008, we recorded in the fourth quarter of 2008 a $385.0 ($358.3 after-tax) non-cash goodwill impairment charge related to our Coating Resins reporting unit, comprised primarily of our former Surface Specialties reporting unit. In total, we had goodwill of $701.9 and acquisition intangibles with a net carrying value of $399.5 at December 31, 2009. See Critical Accounting Policies for further discussion on our goodwill impairment testing.
We may be adversely impacted by increased costs related to our defined benefit pension plans.
We sponsor defined benefit pension plans for employees in the United States and various foreign locations. The major defined benefit pension plans are funded with trust assets invested in a globally diversified portfolio of securities and other investments. Changes in regulatory requirements or the market value of plan assets, investment returns, interest rates and mortality rates may affect the funded status of our defined benefit pension plans and cause volatility in the net periodic benefit cost and future funding requirements of the plans. A significant increase in our obligations or future funding requirements could have an adverse effect on our financial results and financial position.
Prices and availability of raw materials could adversely affect our operations.
Loss of certain significant customers may have an adverse effect on results of the affected segment and loss of several significant customers may have an adverse effect on our consolidated results.
See “Item 1. BUSINESS – Customers and Suppliers”
We face active competition from other companies, which could adversely affect our revenue and financial condition.
See “Item 1. BUSINESS – Competition”
We face numerous risks relating to our international operations that may adversely affect our results of operations.
See “Item 1. BUSINESS – International”
Our production facilities are subject to operating risks that may adversely affect our operations.
See “Item 1. BUSINESS – Operating Risks”
- 11 -
Table of Contents
We are subject to significant environmental and product regulatory expenses and risks.
See “Item 1. BUSINESS – Environmental Matters”
We are subject to significant litigation expense and risk.
See “Item 3. LEGAL PROCEEDINGS”
A further worsening of global economic conditions coupled with a lack of credit availability from the credit markets could adversely impact our customer’s demand for our products, their ability to pay their accounts receivable with us and/or their viability.
During 2009, certain customers in our Specialty Chemicals segments and Building Block Chemical segment experienced financial difficulties. Certain customers filed for bankruptcy protection as a result of the prevailing economic conditions of 2009, especially in the first half of the year. We attempt to mitigate the risks associated with extending credit to our customers by maintaining detailed credit procedures and routinely updating customer credit limits. It is possible that these procedures will not fully mitigate customer collectability risk. Our results of operations in 2009 were not significantly impacted by the inability of our customers to pay. However, the risks associated with extending credit to our customers could increase if global economic conditions or the financial viability of our customers worsen.
A further worsening of global economic conditions could also adversely impact our supplier’s ability to supply our raw materials requirements.
The economic conditions that prevailed for most of 2009 impacted our suppliers in many of the same ways that such conditions impacted us. If economic conditions further deteriorate or the financial viability of our suppliers worsens, our suppliers may not be able to meet their raw material commitments to us, could request shortened payment terms, or could reduce or in extreme cases eliminate the amount of credit they extend to us. Our operations in 2009 were not significantly impacted by these factors due to the diversity of our supplier base and our materials sourcing strategies. However, it is possible that such procedures and strategy may not completely eliminate these risks.
If the current global economic weakness worsens or continues for an extended period, it could significantly impact our results of operations and cash flows. This could impact our ability to fund certain investments for growth, could cause a significant reduction in global operations, our ability to borrow and impact our current credit rating.
The economic conditions of 2009 and the resulting downturn in the global economy especially impacted the automotive, construction and general industrial markets that we serve and led to a significant reduction in our sales and operating profitability. If economic conditions further deteriorate we may be forced to take additional cost reduction initiatives that could lead to further reductions in profitability and could jeopardize our ability to fund growth programs designed to position us for success when economic conditions improve. Further, the reduced profitability and cash generation that would be triggered by a further weakening of economic conditions, could limit the amounts we can borrow under our primary credit facility due to the covenants contained in the agreement and could unfavorably impact our credit rating. In both instances, our ability to borrow could be limited and thus our liquidity adversely impacted.
UNRESOLVED STAFF COMMENTS
None.
- 12 -
Table of Contents
PROPERTIES
We operate manufacturing and research facilities in 16 countries. Capital spending for the years ended December 31, 2009, 2008 and 2007 was $193.9, $195.8 and $114.8, respectively.
Our capital expenditures are intended to provide increased capacity, to improve the efficiency of production units, to improve the quality of our products, to modernize or replace older facilities, or to install equipment for protection of employees, neighboring communities and the environment.
Our manufacturing and research facilities and the segments served by each such facility are as follows:
| FACILITY | SEGMENTS SERVED | |
| Anaheim, California |
Engineered Materials | |
| Antofagasta, Chile |
In Process Separation | |
| Atequiza, Mexico |
In Process Separation; Additive Technologies | |
| Avondale (Fortier), Louisiana |
Building Block Chemicals | |
| Bassano, Italy |
Coating Resins | |
| Belmont (Willow Island), West Virginia |
Coating Resins; Additive Technologies | |
| D’Aircraft (Anaheim), California |
Engineered Materials | |
| Drogenbos, Belgium |
Coating Resins; Additive Technologies; Engineered Materials | |
| Graz, Austria |
Coating Resins | |
| Greenville, South Carolina |
Engineered Materials | |
| Greenville, Texas |
Engineered Materials | |
| Hamburg, Germany |
Coating Resins | |
| Havre de Grace, Maryland |
Engineered Materials | |
| Indian Orchard, Massachusetts |
Engineered Materials | |
| Kalamazoo, Michigan |
Coating Resins; Additive Technologies; In Process Separation; Engineered Materials | |
| Langley, South Carolina |
Coating Resins; Engineered Materials | |
| Lillestrom, Norway |
Coating Resins | |
| Mount Pleasant, Tennessee |
Additive Technologies; In Process Separation | |
| North Augusta, South Carolina |
Coating Resins | |
| Oestringen, Germany |
Engineered Materials | |
| Olean, New York |
Engineered Materials | |
| Orange, California |
Engineered Materials | |
| Rayong, Thailand |
Coating Resins; In Process Separation; Engineered Materials | |
| Rock Hill, South Carolina |
Engineered Materials | |
| San Fernando, Spain |
Coating Resins | |
| Schoonaarde, Belgium |
Coating Resins | |
| Seremban, Malaysia |
Coating Resins | |
| Shanghai, China |
Coating Resins, Engineered Materials | |
| Shimonoseki, Japan |
Coating Resins | |
| Smyrna, Georgia |
Coating Resins | |
| Stamford, Connecticut |
Coating Resins; In Process Separation; Additive Technologies | |
| Suzano, Brazil |
Coating Resins | |
| Wallingford, Connecticut |
Coating Resins; Additive Technologies | |
| Welland, Canada |
In Process Separation | |
| Werndorf, Austria |
Coating Resins | |
| Wiesbaden, Germany |
Coating Resins | |
| Winona, Minnesota |
Engineered Materials | |
| Wrexham, U. K. |
Engineered Materials |
We own all of the foregoing facilities and their sites except for the land at the Indian Orchard, Lillestrom, Shanghai and Shimonoseki facilities and the land and the facilities at the Smyrna, and Wiesbaden sites. We have long-term leases and/or operating agreements for the Indian Orchard, Lillestrom, Smyrna, Shanghai, Shimonoseki and Wiesbaden sites. We lease our corporate headquarters in Woodland Park, New Jersey, our Cytec Specialty Chemicals headquarters in Brussels, Belgium and our Engineered Materials headquarters located in Tempe, Arizona. We are in negotiations with the municipal authorities in San Fernando, Spain regarding the consideration to be received by Cytec from the government on the expropriation of our San Fernando site and we are currently reviewing our options.
LEGAL PROCEEDINGS
Information regarding legal proceedings is included in Note 11 of the Notes to Consolidated Financial Statements.
SUBMISSION OF MATTERS TO A VOTE OF SECURITY HOLDERS
Not applicable.
- 13 -
Table of Contents
PART II
(Currencies in millions, except per share amounts)
MARKET FOR REGISTRANT’S COMMON EQUITY AND RELATED STOCKHOLDER MATTERS
Our stock is listed on the New York Stock Exchange. On February 18, 2010, there were approximately 6,123 registered holders of our Common Stock.
The high and low closing stock prices and declared dividends per share for each quarter were:
| 1Q | 2Q | 3Q | 4Q | |||||||||
| 2009 |
||||||||||||
| High |
$ | 23.87 | $ | 24.67 | $ | 34.84 | $ | 39.20 | ||||
| Low |
$ | 10.58 | $ | 13.95 | $ | 17.59 | $ | 30.52 | ||||
| Dividends |
$ | 0.125 | $ | 0.0125 | $ | 0.0125 | $ | 0.0125 | ||||
| 2008 |
||||||||||||
| High |
$ | 60.35 | $ | 63.77 | $ | 58.19 | $ | 38.67 | ||||
| Low |
$ | 47.66 | $ | 54.56 | $ | 38.91 | $ | 16.28 | ||||
| Dividends |
$ | 0.125 | $ | 0.125 | $ | 0.125 | $ | 0.125 | ||||
On April 16, 2009, our Board of Directors reduced our quarterly dividend by 90% in light of economic conditions to $0.0125 from $0.125. On January 28, 2010, our Board of Directors declared a quarterly cash dividend of $0.0125 per common share, payable on February 25, 2010 to stockholders of record as of February 10, 2010.
See Part III, Item 12. “Security Ownership of Certain Beneficial Owners and Management and Related Stockholder Matters” for information relating to our equity compensation plans.
PERFORMANCE GRAPH
The graph set forth below is based on the assumption that $100 had been invested in our common stock and in each index on December 31, 2004, with reinvestment of dividends at market prices. The total cumulative dollar returns represent the value such investments would have had on December 31, 2009.
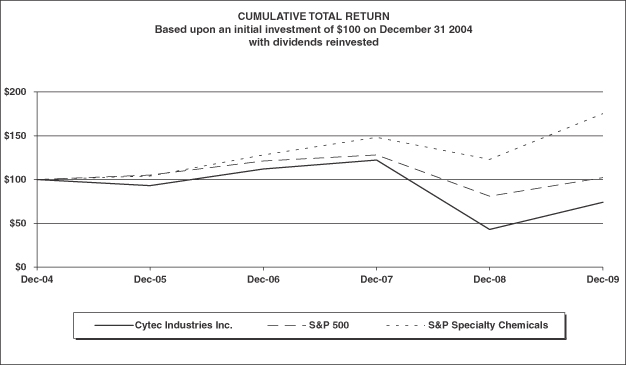
| Dec-04 | Dec-05 | Dec-06 | Dec-07 | Dec-08 | Dec-09 | |||||||||||||
| Cytec Industries Inc. |
$ | 100 | $ | 93 | $ | 112 | $ | 122 | $ | 43 | $ | 74 | ||||||
| S&P 500 |
$ | 100 | $ | 105 | $ | 121 | $ | 128 | $ | 81 | $ | 102 | ||||||
| S&P Specialty Chemicals |
$ | 100 | $ | 104 | $ | 128 | $ | 148 | $ | 123 | $ | 175 | ||||||
Copyright © 2010 Standard & Poor’s, a division of The McGraw-Hill Companies Inc. All rights reserved.
- 14 -
Table of Contents
SELECTED FINANCIAL DATA
FIVE-YEAR SUMMARY
| 2009 | 2008 | 2007 | 2006 | 2005 | ||||||||||||||||
| Statements of income data: |
||||||||||||||||||||
| Net sales |
$ | 2,789.5 | $ | 3,639.9 | $ | 3,503.8 | $ | 3,329.5 | $ | 2,925.7 | ||||||||||
| Earnings/(loss) from operations |
$ | 31.1 | (1),(9) | $ | (121.1 | )(3),(9) | $ | 324.1 | (5),(9) | $ | 305.4 | (7),(9) | $ | 162.1 | (10) | |||||
| (Loss)/Earnings from continuing operations before accounting change |
$ | (2.5 | )(2) | $ | (198.8 | )(4) | $ | 206.5 | (6) | $ | 196.4 | (8) | $ | 58.9 | (11) | |||||
| Earnings from discontinued operations, net of taxes |
– | – | – | – | 1.2 | |||||||||||||||
| Cumulative effect of accounting change, net of taxes |
– | – | – | (1.2 | )(9) | – | ||||||||||||||
| Net (loss)/earnings attributable to Cytec |
$ | (2.5 | ) | $ | (198.8 | ) | $ | 206.5 | $ | 195.2 | $ | 60.1 | ||||||||
| Basic net (loss)/earnings attributable to Cytec Industries Inc.: |
||||||||||||||||||||
| (Loss)/earnings attributable to Cytec Industries Inc. before discontinued operations and accounting change |
$ | (0.05 | ) | $ | (4.16 | ) | $ | 4.29 | $ | 4.13 | $ | 1.30 | ||||||||
| Earnings from discontinued operations, net of taxes |
– | – | – | – | 0.03 | |||||||||||||||
| Cumulative effect of accounting change, net of taxes |
– | – | – | (0.02 | ) | – | ||||||||||||||
| Net (loss)/earnings attributable to Cytec |
$ | (0.05 | ) | $ | (4.16 | ) | $ | 4.29 | $ | 4.11 | $ | 1.33 | ||||||||
| Diluted net (loss)/earnings attributable to Cytec Industries Inc.: |
||||||||||||||||||||
| (Loss)/earnings attributable to Cytec Industries Inc. before discontinued operations and accounting change |
$ | (0.05 | ) | $ | (4.16 | ) | $ | 4.20 | $ | 4.03 | $ | 1.28 | ||||||||
| Earnings from discontinued operations, net of taxes |
– | – | – | – | 0.02 | |||||||||||||||
| Cumulative effect of accounting change, net of taxes |
– | – | – | (0.02 | ) | – | ||||||||||||||
| Net (loss)/earnings attributable to Cytec |
$ | (0.05 | ) | $ | (4.16 | ) | $ | 4.20 | $ | 4.01 | $ | 1.30 | ||||||||
| Cash dividends declared and paid per common share |
$ | 0.16 | $ | 0.50 | $ | 0.40 | $ | 0.40 | $ | 0.40 | ||||||||||
| Balance sheet data: |
||||||||||||||||||||
| Total assets |
$ | 3,559.4 | $ | 3,640.0 | (12) | $ | 4,085.6 | (12) | $ | 3,830.5 | (12) | $ | 3,864.1 | (12) | ||||||
| Long-term debt |
$ | 658.4 | $ | 806.4 | $ | 705.3 | $ | 900.4 | $ | 1,225.5 | ||||||||||
| (1) | Includes pre-tax charge of $90.2 ($63.7 after-tax) for various manufacturing and organizational restructuring initiatives across the Specialty Chemical segments and Engineered Materials segment and within corporate operations as well as restructuring charges related to the shared services initiative. Also includes a net pre-tax loss of $1.4 ($1.9 after-tax) related to the exit of the polyurethane product line in Europe and Asia. |
| (2) | In addition to items in Note (1) above, includes a net pre-tax loss of $8.6 ($5.2 after-tax) associated with the premium for the debt tender, a pre-tax, non-cash gain of $8.9 ($5.5 after-tax) as a result of a land sale for which the proceeds were received in 2004, a pre-tax gain of $6.2 ($3.8 after-tax) related to a legal settlement, a pre-tax, non-cash charge of $12.2 ($9.1 after-tax) relating to a pension settlement in an international jurisdiction, and a benefit of $4.0 related to a favorable tax adjustment for an audit settlement in an international jurisdiction. |
| (3) | Includes a pre-tax charge of $5.6 ($3.6 after-tax) for incremental accelerated depreciation related to our exit of Radcure manufacturing at our leased facility in Pampa, Texas, a pre-tax goodwill impairment charge of $385.0 ($358.3 after-tax), and a pre-tax charge of $14.9 ($10.4 after-tax) for additional restructuring costs primarily associated with various organizational restructuring initiatives across the Specialty Chemicals segments. |
| (4) | In addition to items in Note (3) above, includes a pre-tax gain of $6.1 ($4.0 after-tax) for a legal settlement and an income tax benefit of $2.6 related to a favorable tax development related to the sale of the water treatment business in 2007. |
| (5) | Includes a pre-tax restructuring charge of $6.2 ($5.0 after-tax) for restructuring initiatives and a pre-tax gain of $13.6 ($13.3 after-tax) for the sale of certain product lines. |
- 15 -
Table of Contents
| (6) | In addition to the items in Note (5) above, includes $6.3 related to various income tax rate changes in various jurisdictions. |
| (7) | Includes pre-tax restructuring charges of $19.3 ($16.1 after-tax) primarily related to plant closures, pre-tax impairment charges of $29.3 ($24.6 after-tax) related to two unprofitable manufacturing sites in Europe, a pre-tax charge of $2.6 ($1.9 after-tax) related to a change in employee benefit plans in the U.K., a pre-tax charge of $2.2 ($1.6 after-tax) related to a contingent liability study update, pre-tax integration costs of $1.7 ($1.3 after-tax) related to the Surface Specialties acquisition and a pre-tax gain of $75.5 ($59.6 after-tax) for the sale of certain product lines. |
| (8) | In addition to the items in Note (7) above, includes a pre-tax $15.7 ($12.4 after-tax) gain related to resolution of a legal dispute and an income tax benefit of $3.5 related to the completion of prior years tax audits, partially offset by a $1.7 tax charge related to a taxable capital reduction at our Thailand subsidiary. |
| (9) | 2006 cumulative effect of accounting change represents the cumulative effect of adopting accounting pronouncement on share-based payments. The pronouncement requires that all share-based payments be recorded at a fair value to compensation costs. Pre-tax expenses resulting from the application of this pronouncement included in Earnings from Operations were $6.6, $9.1, $11.6, and $10.4 in 2009, 2008, 2007, and 2006, respectively. |
| (10) | Includes a non-deductible charge of $37.0 for the write-off of acquired in-process research and development, a pre-tax charge of $20.8 ($15.4 after-tax) resulting from the amortization of the write-up to fair value of acquired inventory, pre-tax restructuring charges of $16.8 ($12.4 after-tax) and pre-tax integration costs of $0.2 ($0.1 after-tax). |
| (11) | In addition to the items in Note (10) above, includes pre-tax charges of $44.2 ($28.1 after-tax) related to derivative contracts entered into to hedge currency and interest rate exposure associated with the purchase of Surface Specialties, pre-tax $22.0 ($14.0 after-tax) of interest charges and unamortized put premiums and rate lock agreements related to the redemption of the Mandatory Par Put Remarketed Securities (“MOPPRS”) and $28.3 benefit representing the favorable resolution of several prior year tax matters. |
| (12) | We revised and appropriately reclassified the prior year amounts related to an immaterial misclassification of certain current and long-term deferred income tax liabilities. |
- 16 -
Table of Contents
MANAGEMENT’S DISCUSSION AND ANALYSIS OF FINANCIAL CONDITION AND RESULTS OF OPERATIONS
The following discussion and analysis should be read in conjunction with the Consolidated Financial Statements and Notes to the Consolidated Financial Statements. It is assumed that the reader is familiar with the description of our business and risk factors contained in Part I of this report. Currency amounts are in millions, except per share amounts. Percentages are approximate.
GENERAL
We are a global specialty chemicals and materials company and sell our products to diverse major markets for aerospace, adhesives, automotive and industrial coatings, chemical intermediates, inks, mining and plastics. Sales price and volume by region and the impact of exchange rates on our reporting segments are important measures that are analyzed by management and are provided in our segment analysis.
We report net sales in four geographic regions: North America, Latin America, Asia/Pacific and Europe/Middle East/Africa. The destination of the sale determines the region under which it is reported consistent with management’s view of the business. North America consists of the United States and Canada. Latin America includes Mexico, Central America, South America and the Caribbean Islands. Asia/Pacific is comprised of Asia, Australia and the islands of the South Pacific Rim.
Selling price changes and raw material cost changes year on year are an important factor in profitability especially in years of high volatility. Global oil and natural gas costs in certain countries are highly volatile and many of our raw materials are derived from these two commodities. Discussion of the year to year impact of raw materials and energy is provided in our segment discussion. In addition, higher global demand levels and, occasionally, operating difficulties at suppliers, have limited the availability of certain of our raw materials.
The downturn in the global economy during the fourth quarter of 2008 led to a dramatic reduction in demand for our products across many of our industrial markets, which resulted in a significant decrease in earnings starting in the fourth quarter of 2008. Beginning in January 2009, we initiated various restructuring initiatives within our Specialty Chemical segments and corporate service functions. We have substantially completed these actions to reduce our structural costs and the elimination of these positions as of December 31, 2009. In addition, in the second and third quarters of 2009, we also initiated restructuring actions within our Engineered Materials segment to respond to lower demand due to inventory destocking and sharper than expected decline in business and regional jet build rates. We estimate that the aforementioned structural cost reduction actions as well as actions initiated in prior years improved our 2009 results by approximately $50.0 and the expected full year annualized rate of savings is approximately $120.0. In addition to these restructuring initiatives, we implemented additional short-term cost reduction and liquidity measures across our operations. These short-term measures include the implementation of furloughs in certain production facilities in order to better align our cost structure with the reduced demand in 2009, a global salary freeze and bonus limitations, except as required by local law and contracts, and suspension of the company matching contributions to the 401(k) savings program for all U.S. salaried and non-bargaining employees effective May 1, 2009. We estimate that these short-term actions improved our 2009 operating earnings by approximately $76.0.
- 17 -
Table of Contents
RESULTS OF OPERATIONS
The following table sets forth the percentage relationship that certain items in our Consolidated Statements of Income bear to net sales:
| Years Ended December 31, | 2009 | 2008 | 2007 | ||||||
| Net sales |
100.0 | % | 100.0 | % | 100.0 | % | |||
| Manufacturing cost of sales |
83.1 | 80.0 | 78.6 | ||||||
| Gross profit |
16.9 | 20.0 | 21.4 | ||||||
| Selling and technical services |
7.1 | 6.3 | 6.1 | ||||||
| Research and process development |
2.7 | 2.2 | 2.2 | ||||||
| Administrative and general |
4.5 | 3.1 | 3.2 | ||||||
| Amortization of acquisition intangibles |
1.4 | 1.1 | 1.1 | ||||||
| Net gain on sale of assets |
– | – | – | ||||||
| Asset impairment charge |
0.2 | – | – | ||||||
| Goodwill impairment charge |
– | 10.6 | – | ||||||
| Gain on sale of assets held for sale |
– | – | 0.4 | ||||||
| Earnings/(loss) from operations |
1.1 | (3.3 | ) | 9.2 | |||||
| Net (loss)/earnings attributable to Cytec Industries Inc. |
(0.1 | ) | (5.5 | ) | 5.9 |
NET SALES BY SEGMENT AND GEOGRAPHIC AREA
| Net Sales | North America | Latin America | Asia/ Pacific |
Europe/ Middle East/ Africa |
Total | ||||||||||
| 2009 |
|||||||||||||||
| Coating Resins |
$ | 260.0 | $ | 50.5 | $ | 274.3 | $ | 622.1 | $ | 1,206.9 | |||||
| Additive Technologies |
90.8 | 19.7 | 55.4 | 73.2 | 239.1 | ||||||||||
| In Process Separation |
69.0 | 79.7 | 69.5 | 47.6 | 265.8 | ||||||||||
| Engineered Materials |
432.9 | 4.3 | 50.4 | 229.9 | 717.5 | ||||||||||
| Building Block Chemicals |
208.7 | 5.0 | 39.8 | 106.7 | 360.2 | ||||||||||
| Total |
$ | 1,061.4 | $ | 159.2 | $ | 489.4 | $ | 1,079.5 | $ | 2,789.5 | |||||
| 2008 |
|||||||||||||||
| Coating Resins |
$ | 340.9 | $ | 73.7 | $ | 306.6 | $ | 930.8 | $ | 1,652.0 | |||||
| Additive Technologies |
125.8 | 21.1 | 62.2 | 101.4 | 310.5 | ||||||||||
| In Process Separation |
71.5 | 107.2 | 63.8 | 55.9 | 298.4 | ||||||||||
| Engineered Materials |
511.9 | 5.2 | 63.4 | 286.8 | 867.3 | ||||||||||
| Building Block Chemicals |
364.5 | 5.8 | 12.9 | 128.5 | 511.7 | ||||||||||
| Total |
$ | 1,414.6 | $ | 213.0 | $ | 508.9 | $ | 1,503.4 | $ | 3,639.9 | |||||
| 2007 |
|||||||||||||||
| Coating Resins |
$ | 354.0 | $ | 72.9 | $ | 288.4 | $ | 942.8 | $ | 1,658.1 | |||||
| Additive Technologies |
134.7 | 29.3 | 64.8 | 101.4 | 330.2 | ||||||||||
| In Process Separation |
61.7 | 100.8 | 57.0 | 49.8 | 269.3 | ||||||||||
| Engineered Materials |
478.2 | 3.4 | 56.5 | 250.9 | 789.0 | ||||||||||
| Building Block Chemicals |
246.1 | 3.7 | 31.8 | 175.6 | 457.2 | ||||||||||
| Total |
$ | 1,274.7 | $ | 210.1 | $ | 498.5 | $ | 1,520.5 | $ | 3,503.8 | |||||
Net sales in the United States were $995.1, $1,322.1, and $1,188.6, or 36%, 36% and 34% of total net sales for 2009, 2008 and 2007, respectively. International net sales were $1,794.4, $2,317.8, and $2,315.2, or 64%, 64% and 66% of total net sales, for 2009, 2008 and 2007, respectively.
We regularly review our segment reporting and classifications and may periodically change our reportable segments to align with operational changes. Our latest strategic review of our operations resulted in business segment changes which became effective April 1, 2009. We believe
- 18 -
Table of Contents
the new strategy that resulted in these new reportable segments will enable us to develop a more sustainable portfolio in the future that will drive earnings growth and a better return on our assets. We now have five reportable business segments: Coating Resins, Additive Technologies, In Process Separation, Engineered Materials, and Building Block Chemicals. Coating Resins, Additive Technologies, and In Process Separation are managed under one executive leader, and are referred to collectively as Cytec Specialty Chemicals. The Coating Resins segment is substantially comprised of the Surface Specialties business, and includes the following product lines: radiation-cured resins (Radcure resins), powder coating resins, and liquid coating resins. Included in the liquid coating resins product line are waterborne resins, amino cross-linkers, solventborne resins and urethane resins. Additive Technologies includes polymer additives, specialty additives, and polyurethanes. As of May 19th, 2009, all polyurethane assets have been divested. In Process Separation includes mining chemicals and phosphines. Engineered Materials principally includes advanced composites, carbon fiber, structural film and pressure sensitive adhesives, and formulated resins. Building Block Chemicals principally includes acrylonitrile, hydrocyanic acid, sulfuric acid and melamine. We revised the accompanying related segment disclosures for all periods presented to reflect our new business segment structure.
For more information on our segments, refer to Note 16 of the Notes to Consolidated Financial Statements and further discussions in “Segment Results” below.
YEAR ENDED DECEMBER 31, 2009, COMPARED WITH YEAR ENDED DECEMBER 31, 2008
CONSOLIDATED RESULTS
Net sales for 2009 were $2,789.5 compared with $3,639.9 for 2008. Overall, sales decreased 23% driven by volume decreases of 14%, price decreases of 8%, and unfavorable changes in exchange rates of 1%. Coating Resins sales decreased 27% primarily due to volume decreases and to a lesser extent price decreases and unfavorable changes in exchange rates. Additive Technologies sales decreased 23%, In Process Separation sales decreased 11%, and Engineered Materials sales decreased 17%; the decline in sales for each of these segments is primarily due to lower volumes. Building Block Chemicals sales decreased 30% primarily due to lower selling prices partially offset by higher sales volumes.
For a detailed discussion on revenues refer to the Segment Results section below.
Manufacturing cost of sales was $2,317.1 or 83.1% of sales in 2009, compared with $2,912.7, or 80% of sales in 2008. Manufacturing costs decreased $595.6, which includes $283.8 associated with lower volumes and lower costs associated with product line exits, $362.9 related to lower material costs, $50.5 related to reduced spending and cost savings initiatives, and $48.0 due to changes in exchange rates partially offset by $87.2 of unfavorable fixed cost absorption. Manufacturing cost of sales for 2009 also includes $3.7 of higher expenses related to environmental contingent liabilities compared with 2008 and $1.2 of accelerated depreciation related to our polyurethane product line assets in Asia that were sold in the second quarter of 2009. Manufacturing cost of sales for 2009 includes restructuring charges of $68.9 which includes manufacturing cost savings initiatives launched within our Specialty Chemical and Engineered Materials segments and corporate functions throughout 2009. Included in 2008 was $5.6 of pre-tax restructuring charges primarily related to various organization restructuring initiatives across our Specialty Chemical segments and our manufacturing sites in West Virginia and Connecticut and $5.6 of incremental accelerated depreciation on assets at our Pampa, Texas site that we exited. See Note 3 to the Consolidated Financial Statements for additional detail.
Selling and technical services expenses were $199.4 in 2009 versus $230.1 in 2008. The decrease includes $22.1 related to reduced spending and cost savings initiatives, $6.5 related to changes in exchange rates, $3.4 related to the exit of several commodity products and product line divestiture, and $2.2 related to lower costs associated with restructuring initiatives. These decreases were partially offset by $2.1 of increased employee benefits costs as compared to 2008.
Research and process development expenses were $75.2 in 2009 versus $81.6 in 2008. The decrease includes $5.4 related to reduced spending and cost savings initiatives and $1.7 related to changes in exchange rates, which were partially offset by $1.6 of higher costs associated with restructuring initiatives.
Administrative and general expenses were $124.4 in 2009 versus $112.0 in 2008. The increase includes $10.0 of consulting costs incurred related to working capital reduction and other cost savings initiatives, $8.3 of higher costs associated with restructuring initiatives, $3.7 of increased employee incentive costs, and $1.2 of higher credit facility
- 19 -
Table of Contents
fees. These increases were partially offset by lower spending of $8.6 related to reduced spending and cost savings initiatives and $3.0 related to changes in exchange rates.
Amortization of acquisition intangibles was $38.2 in 2009 versus $39.6 in 2008 mostly due to decreases in Coating Resins amortization as a result of changes in exchange rates.
Net gain on sale of assets of $0.2 in 2009 includes a gain of $1.5 associated with the sale in the first quarter of 2009 of certain of our polyurethane product line assets in Europe and a loss of $1.3 associated with the sale of our polyurethane product line assets in Asia in the second quarter of 2009. See Note 2 of the Consolidated Financial Statements for further information.
Asset impairment charge of $4.3 in 2009 relates to the write down of the land at our closed facility in La Llagosta, Spain to its estimated fair value.
Goodwill impairment charge of $385.0 in 2008 is related to our former Surface Specialties segment (which now substantially forms the Coating Resins segment) which resulted from the adverse impact that 2008 macroeconomic conditions had on forecasted volume growth and thus reduced profitability of certain product lines. For further details see Note 9 to the Consolidated Financial Statements.
Other income/(expense), net was expense of $2.5 in 2009 compared with an income of $3.3 in 2008. Included in other income/(expense), net for 2009 is a loss of $12.2 associated with a partial settlement of an existing pension plan in an international jurisdiction and $3.0 of additional unrealized losses on currency swaps, partially offset by a gain of $8.9 resulting from the sale of land for which the proceeds were received in 2004, and $2.0 of lower costs associated with environmental contingent liabilities. Included in 2008 is a gain of $3.9 from the sale of real estate and a favorable insurance settlement of $2.2. Other income/(expense) in 2009 and 2008 includes gains of $6.2 and $6.1, respectively, related to legal settlements associated with our Engineered Materials segment.
Net loss on early extinguishment of debt of $9.1 in 2009 consists of the loss incurred on the repurchase of $234.6 principal amount of our 5.5% notes with an original maturity of October 1, 2010 for a purchase price of $242.8 plus accrued interest of $3.7 and $15.4 principal amount of our 4.6% notes with an original maturity of July 1, 2013 for a purchase price of $14.6. Both of the debt repurchases were completed under an offer to repurchase the notes that expired during the third quarter of 2009. Also during 2009, we repurchased portions of our 4.6% notes due July 1, 2013 with a total carrying value of $16.5 for a total purchase price of $16.9 plus accrued interest of $0.3, resulting in a loss of $0.5. Included in 2008 is a gain on the early extinguishment of debt of $1.9 as we repurchased a portion of our 4.6% notes due July 1, 2013 with a carrying value of $11.2 (including accrued interest) at a purchase price of $9.3.
Equity in earnings of associated companies was $0.9 in 2009 versus $1.5 in 2008 with the decrease primarily due to reduced demand.
Interest expense, net was $24.2 in 2009 compared with $35.2 in 2008. The decrease is partially attributable to a $7.4 benefit related to the 2009 purchase of our 5.5% notes under the tender offer referenced above and a portion of our 4.6% notes, as well as the repayment of our revolving credit facility balance during 2009. This benefit was more than offset by $10.9 of increased interest expense associated with our 8.95% notes due 2017, the proceeds of which were received and used during the third quarter to repurchase a portion of our 5.5% and 4.6% notes as discussed above. In addition, interest expense in 2009 is $1.5 lower than 2008 as we repaid the principal balance of our 6.75% notes in March of 2008. Interest expense in 2009 also includes the benefits of $5.7 of additional interest capitalized as compared to 2008 due to a higher level of capital expenditures in 2009 eligible for interest capitalization. Interest expense, net in 2009 includes $6.0 of benefits associated with our cross currency swap of which $1.9 represents the impact of favorable changes in exchange rates on Euro-denominated interest payments and $4.1 represents the amortization of unrealized gains related to certain cross currency swaps previously designated as hedging instruments. This amortization will cease in October 2010. See Note 6 of the consolidated financial statements for further information of amortization related to cross currency swaps.
The effective income tax rate for 2009 was a tax benefit of -76.3% ($2.9) compared to a tax provision of 31.7% ($47.4) for 2008. Included in the 2009 tax benefit rate is a $4.0 ($3.8 net after related unrecognized tax benefit adjustment) tax benefit due to a favorable resolution of a tax matter in an international subsidiary offset by a reduced tax benefit on the Company’s restructuring charges. The underlying annual tax rate for the year ended December 31, 2009 was 29.8% (excluding accrued interest on unrecognized tax benefits) with an underlying tax rate of 30.8% including such interest. The decrease in the underlying annual tax rate compared to the 2008 underlying annual tax rate of
- 20 -
Table of Contents
31.8% (including accrued interest on unrecognized tax benefits) is primarily due to a shift in earnings to lower tax jurisdictions.
The 2008 effective tax rate was unfavorably impacted primarily by the portion of the goodwill impairment charge for which no tax benefit was given, partially offset by a $2.6 tax benefit recorded due to a favorable audit resolution regarding an international subsidiary. The underlying annual tax rate for the year ended December 31, 2008 was 31.5% (excluding accrued interest on unrecognized tax benefits), with an underlying tax rate of 31.8% including such interest.
Net loss for 2009 was $2.5 ($0.05 per basic share) compared with net loss of $198.8 ($4.16 per basic share) in 2008. Included in 2009 was an after-tax charge of $63.7 related to restructuring costs, of which $19.8 and $3.4 relate to accelerated depreciation and asset impairment charge, respectively. Our 2009 results also include an after-tax charge of $9.1 related to a pension settlement in an international jurisdiction, an after-tax loss of $5.2 associated with the repurchase of debt under a tender offer during the third quarter of 2009, and an after-tax loss of $1.9 associated with the sale of our polyurethane product line assets in Asia and Europe. In addition, our 2009 results include a non-cash after-tax gain of $5.5 associated with the transfer of ownership of land to a third party, an after-tax benefit of $3.8 related to a legal settlement related to our Engineered Materials segment, and a tax benefit of $4.0 related to a favorable tax adjustment for an audit settlement in an international jurisdiction.
Included in 2008 results were an after-tax goodwill impairment charge of $358.3 in our Coating Resins segment and an after-tax restructuring charge of $10.4 for various organizational restructuring initiatives across Specialty Chemicals segments and restructuring costs at our Additive Technologies manufacturing facility in West Virginia and Coating Resins manufacturing facilities in Connecticut and France. Included in our 2008 results was an after-tax $3.6 charge related to incremental accelerated depreciation on our Pampa, Texas Coating Resins manufacturing site that we exited and relocated the manufacturing to one of our other existing facilities. Our 2008 results also include an after-tax $4.0 gain related to a legal settlement related to our Engineered Materials segment and an income tax benefit of $2.6 related to a favorable tax development related to the sale of the water treatment business in 2007.
SEGMENT RESULTS (SALES TO EXTERNAL CUSTOMERS)
Year-to-year comparisons and analyses of changes in net sales by segment and region are set forth below:
Coating Resins
| % Change Due to | ||||||||||||||||||
| 2009 | 2008 | Total % Change |
Price | Volume/ Mix |
Currency | |||||||||||||
| North America |
$ | 260.0 | $ | 340.9 | -24 | % | -4 | % | -20 | % | 0 | % | ||||||
| Latin America |
50.5 | 73.7 | -32 | % | -3 | % | -29 | % | 0 | % | ||||||||
| Asia/Pacific |
274.3 | 306.6 | -11 | % | -5 | % | -7 | % | 1 | % | ||||||||
| Europe/Middle East/Africa |
622.1 | 930.8 | -33 | % | -5 | % | -25 | % | -3 | % | ||||||||
| Total |
$ | 1,206.9 | $ | 1,652.0 | -27 | % | -4 | % | -21 | % | -2 | % | ||||||
Overall sales were down 27% primarily due to decreased selling volumes of 21%, reflecting lower volumes across all regions and all product lines due to reduced demand resulting from weak global economic conditions as well as destocking by our customers, the impact of which was primarily reflected during the first six months of 2009. Overall selling prices were down 4% with decreases essentially across all product lines. Selling prices for powders were down reflecting lower raw material prices and price competition particularly in Europe and Asia. Radcure selling prices were slightly down primarily due to lower raw material costs and price competition Unfavorable changes in exchange rates decreased sales 2%.
Loss from operations was $3.2 or -0.3% of sales in 2009, compared with loss from operations of $340.2 or -21% of sales in 2008. 2008 operating loss includes a goodwill impairment charge of $385.0. Excluding the impairment charge, 2008 earnings from operations were $44.8. See Note 9 of the Consolidated Financial Statements for additional details on goodwill impairment. Earnings from operations in 2009, excluding the aforementioned goodwill impairment charge in 2008, decreased by $48.0. The negative impacts on earnings from operations were as follows: $127.9 due to lower selling volumes, $74.1 due to lower selling prices, and $37.3 from lower fixed cost absorption due to lower production volumes as a result of reduced
- 21 -
Table of Contents
demand and our initiative to reduce inventory levels. These negative impacts were partially offset by favorable impacts of $111.5 from lower raw material costs, $46.6 from lower manufacturing and operating expenses due to reduced spending and cost savings initiatives, $20.6 from lower freight costs related to lower selling volumes, and $8.1 from changes in exchange rates. Manufacturing cost of sales in 2008 also included $5.6 of incremental accelerated depreciation of assets at our Pampa, Texas site given our decision to exit the site and consolidate production.
Additive Technologies
| % Change Due to | ||||||||||||||||||
| 2009 | 2008 | Total % Change |
Price | Volume/ Mix |
Currency | |||||||||||||
| North America |
$ | 90.8 | $ | 125.8 | -28 | % | 2 | % | -30 | % | 0 | % | ||||||
| Latin America |
19.7 | 21.1 | -7 | % | 1 | % | -6 | % | -2 | % | ||||||||
| Asia/Pacific |
55.4 | 62.2 | -11 | % | 2 | % | -12 | % | -1 | % | ||||||||
| Europe/Middle East/Africa |
73.2 | 101.4 | -28 | % | -3 | % | -21 | % | -4 | % | ||||||||
| Total |
$ | 239.1 | $ | 310.5 | -23 | % | 0 | % | -21 | % | -2 | % | ||||||
Overall sales were down 23%, primarily due to decreased selling volumes of 21%, reflecting lower volumes across all regions and most product lines due to reduced demand resulting from weak global economic conditions and price competition. In addition, the exit of our polyurethane product line in 2009, the exit of certain polymer additives commodity product lines and the divestiture of the water treatment product line, which were both completed in 2008 also adversely impacted sales volumes. Selling volumes were up 2% in Asia/Pacific and Latin America in the polymer additives product line mainly due to improved demand and new business from the automotive and other industrial sectors. Overall selling prices were flat as increases in the specialty and polymer additive product lines in North America and Asia/Pacific were offset by decreases in Europe. Unfavorable changes in exchange rates decreased sales 2%.
Earnings from operations were $11.0 or 5% of sales in 2009, compared with $17.9, or 6% of sales in 2008. The $6.9 decrease in earnings is principally due to the negative impacts of $30.0 related to lower selling volumes and $8.7 of lower fixed cost absorption due to lower production volumes as a result of reduced demand and our initiative to reduce inventory levels. These negative impacts were partially offset by favorable impacts of $10.3 from lower manufacturing and operating expenses due to reduced spending and cost savings initiatives, $9.7 from lower manufacturing and operating expenses as a result of the aforementioned exit of certain product lines and divestitures, $7.3 from lower raw material costs, $3.9 from lower freight costs due to lower volumes, and $1.1 from higher selling prices.
In Process Separation
| % Change Due to | ||||||||||||||||||
| 2009 | 2008 | Total % Change |
Price | Volume/ Mix |
Currency | |||||||||||||
| North America |
$ | 69.0 | $ | 71.5 | -3 | % | 3 | % | -6 | % | 0 | % | ||||||
| Latin America |
79.7 | 107.2 | -26 | % | 2 | % | -28 | % | 0 | % | ||||||||
| Asia/Pacific |
69.5 | 63.8 | 9 | % | 4 | % | 7 | % | -2 | % | ||||||||
| Europe/Middle East/Africa |
47.6 | 55.9 | -15 | % | -2 | % | -11 | % | -2 | % | ||||||||
| Total |
$ | 265.8 | $ | 298.4 | -11 | % | 2 | % | -12 | % | -1 | % | ||||||
Overall sales were down 11%, primarily due to decreased selling volumes of 12%, driven by lower mining chemicals selling volumes across all regions except Asia/Pacific due to customer destocking, the impact of which was primarily in the first half of 2009 and weak global economic conditions. Selling volumes were up 5% within the phosphine product lines primarily due to improved demand in North America related to new business captured during the year. Overall selling prices were up 2% across all product lines and most regions. Unfavorable changes in exchange rates decreased sales 1%.
Earnings from operations were $34.6 or 13% of sales in 2009, compared with $51.5, or 17% in 2008. The $16.9 decrease in earnings is principally due to the negative impacts of $14.7 related to lower selling volumes, $11.6 of higher raw material
- 22 -
Table of Contents
prices, $7.6 of lower fixed cost absorption due to lower production volumes as a result of reduced demand and our initiative to reduce inventory levels. These negative impacts were partially offset
by favorable impacts of $5.6 from increases in selling prices, $4.6 from changes in exchange rates, $4.5 from lower freight costs due to lower volumes, and $3.9 from lower operating expenses due to reduced spending and cost savings initiatives.
Engineered Materials
| % Change Due to | ||||||||||||||||||
| 2009 | 2008 | Total % Change |
Price | Volume/ Mix |
Currency | |||||||||||||
| North America |
$ | 432.9 | $ | 511.9 | -15 | % | 1 | % | -16 | % | 0 | % | ||||||
| Latin America(1) |
4.3 | 5.2 | – | – | – | – | ||||||||||||
| Asia/Pacific |
50.4 | 63.4 | -21 | % | 0 | % | -21 | % | 0 | % | ||||||||
| Europe/Middle East/Africa |
229.9 | 286.8 | -20 | % | 2 | % | -19 | % | -3 | % | ||||||||
| Total |
$ | 717.5 | $ | 867.3 | -17 | % | 2 | % | -18 | % | -1 | % | ||||||
| (1) | Due to the level of sales in this geographic region, percentage comparisons are not meaningful. |
Overall sales were down 17% due to decreased selling volumes, driven primarily by destocking actions by customers mostly in the large commercial transport, business jet and high performance industrial sectors. In addition, the business jet and high performance industrial markets have significantly lower build rates than the prior year. Pressure sensitive adhesive product line selling volumes were adversely impacted by weak global economic conditions. These negative impacts were partially offset by higher selling volumes from increased build rates in the military aircraft sector. Overall selling prices were up 2% with increases across most regions and market sectors. Unfavorable changes in exchange rates decreased sales 1%.
Earnings from operations were $96.3 or 13% of sales in 2009, compared with $163.2, or 19% of sales in 2008. The $66.9 decrease in earnings is principally due to the negative impacts of $98.2 due to lower selling volumes and $23.0 of lower fixed cost absorption due to lower production volumes as a result of reduced demand and our initiative to reduce inventory levels. These negative impacts were partially offset by favorable impacts of $32.5 from lower manufacturing and operating expenses primarily due to reduced spending and cost savings initiatives, $14.4 from increased selling prices, $3.1 from lower raw material costs, $2.5 from lower freight costs due to lower volumes, and $1.8 from changes in exchange rates.
Building Block Chemicals
| % Change Due to | ||||||||||||||||||
| 2009 | 2008 | Total % Change |
Price | Volume/ Mix |
Currency | |||||||||||||
| North America |
$ | 208.7 | $ | 364.5 | -43 | % | -32 | % | -11 | % | 0 | % | ||||||
| Latin America(1) |
5.0 | 5.8 | – | – | – | – | ||||||||||||
| Asia/Pacific(2) |
39.8 | 12.9 | – | – | – | – | ||||||||||||
| Europe/Middle East/Africa |
106.7 | 128.5 | -17 | % | -59 | % | 42 | % | 0 | % | ||||||||
| Total |
$ | 360.2 | $ | 511.7 | -30 | % | -46 | % | 16 | % | 0 | % | ||||||
| (1) | Due to the level of sales in this geographic region, percentage comparisons are not meaningful. |
| (2) | Due to unusually large volume/price fluctuation percentage, comparisons are not meaningful. |
Overall sales decreased 30%. Lower selling prices of 46%, driven by lower costs of propylene and ammonia used in the manufacturing of acrylonitrile where selling prices closely follow raw material costs, was partially offset by increased selling volumes of 16%. The higher selling volumes were mostly due to improved demand for acrylonitrile into the acrylic fibers market in Europe and Asia/Pacific coupled with a major acrylonitrile maintenance outage taken in the second quarter of 2008.
Earnings from operations were $10.2 or 3% of sales in 2009, compared with $4.7, or 1% of sales in 2008. The $5.5 increase in earnings is primarily due to the favorable impacts of $252.6 from lower raw material costs, $2.0 of lower freight costs, $1.1 of lower operating expenses related to corporate cost savings initiatives, $1.0 of lower manufacturing costs related to higher acid regeneration operations in 2009 coupled with $1.5 of higher plant spending in 2008 due to hurricane Gustav. These favorable impacts were partially offset by negative impacts of $233.4 from lower selling prices, $10.6 from lower fixed cost absorption primarily due to reductions in inventory, $4.3 from higher selling volumes of lower margin acrylonitrile to Asia/Pacific, and $4.3 from increased manufacturing and operating costs.
- 23 -
Table of Contents
YEAR ENDED DECEMBER 31, 2008, COMPARED WITH YEAR ENDED DECEMBER 31, 2007
CONSOLIDATED RESULTS
Net sales for 2008 were $3,639.9 compared with $3,503.8 for 2007. Overall, sales were up 4% with price increases of 7% and favorable exchange impact of 3%, which were partially offset by lower volumes of 6%. In the Coating Resins segment, sales were flat as changes in exchange rates and higher selling prices increased sales 9% but were offset by lower selling volumes. The Additive Technologies segment sales decreased 6% due to lower selling volumes partially due to the completion of a resale agreement related to the sale of the water treating chemicals product line in the prior year period. These negative impacts were partially offset by higher selling prices and favorable changes in exchange rates. In Process Separation segment sales increased 11% due to higher selling prices compared to 2007. In the Engineered Materials segment, sales increased 10% primarily due to higher selling volumes and prices. Building Block Chemicals segment sales were up 12% primarily due to higher selling prices which were partially offset by lower volumes.
For a detailed discussion on revenues refer to the Segment Results section below.
Manufacturing cost of sales was $2,912.7 (80.0% of net sales) compared with $2,752.9 (78.6% of net sales) for 2007. The $159.8 increase in manufacturing costs, or 1.4% increase in manufacturing cost as a percent of sales, is primarily due to $213.2 of higher raw material prices, $90.9 due to changes in exchange rates, and $26.3 related to higher fixed costs due to inflationary increases. These increases were partially offset by $161.8 of lower costs related to lower selling volumes. Manufacturing cost of sales for 2008 includes $5.6 of incremental accelerated depreciation on assets at our Pampa, Texas site that we have exited. Included in 2008 was $5.6 of pre-tax restructuring charges primarily related to various organization restructuring initiatives across our Specialty Chemical segments and our manufacturing sites in West Virginia and Connecticut. Included in 2007 were pre-tax charges of $5.7 primarily related to restructuring of manufacturing sites in France, West Virginia, and Connecticut. See Note 3 to the Consolidated Financial Statements for additional detail.
Pension and other post employment benefits expense was $21.0 for 2008 versus $30.7 in 2007. The $9.7 decrease from 2007 is primarily related to the change from a defined benefit plan to a defined contribution plan for our U.S. salaried employees effective December 31, 2007. This decline was largely offset by an $8.3 increase in costs of our defined contribution plans. Pension and other post employment benefit expense is reported in the expense category that it relates to, which is primarily in manufacturing cost of sales.
Selling and technical services was $230.1 in 2008 versus $212.8 in the prior year. The increase of $17.3 was primarily due to exchange rate changes of $6.3, increased spending in our Cytec Engineered Materials segment of $6.7 primarily related to higher personnel costs and a restructuring charge of $6.6.
Research and process development was $81.6 in 2008 versus $75.7 in the prior year. The increase was primarily related to changes in exchange rates of $2.1, higher spending in the Coating Resins segment of $2.4, and a restructuring charge of $1.6.
Administrative and general expenses were $112.0 in 2008 versus $113.2 in the prior year. The decrease in 2008 was primarily attributable to lower incentive compensation of $4.7, offset by exchange rate changes of $3.1 and restructuring charges of $1.1.
Amortization of acquisition intangibles was $39.6 in 2008 versus $38.7 in the prior year. This increase was primarily attributable to changes in exchange rates of $1.8.
Gain on the sale of assets of $13.6 in 2007 was attributable to the phase two and three closings of the water treatment and acrylamide product lines. See Note 2 of the Consolidated Financial Statements for further information.
Goodwill impairment charge of $385.0 in 2008 is related to our former Surface Specialties segment (which now substantially forms the Coating Resins segment) which resulted from the adverse impact that current macroeconomic conditions had on forecasted volume growth and thus reduced profitability of certain product lines. For further details see Note 9 to the Consolidated Financial Statements.
Other income (expense), net was income of $1.5 in 2008 compared with expense of ($0.4) in the prior year. Included in 2008 is a pre-tax gain of $6.1 related to a legal settlement for our Engineered Materials segment and a gain on sale of real estate of $3.9, partially offset by environmental reserve adjustments of $2.2, increased legal spending of $1.0, supplemental savings plan adjustments of $3.1, and unrealized losses on cross currency swaps of $1.5.
- 24 -
Table of Contents
Included in 2008 is a gain on the early extinguishment of debt of $1.9 as we repurchased a portion of our 4.6% notes due July 1, 2013 with a carrying value of $11.2 (including accrued interest) at a purchase price of $9.3.
Equity in earnings of associated companies was $1.5 in 2008 versus $1.4 in the prior year.
Interest expense, net was $35.2 in 2008 compared with $41.9 in the prior year. The decrease resulted primarily from lower average outstanding debt balances and lower cost of borrowing versus 2007.
The effective income tax rate for 2008 was a tax provision of 31.7% ($47.4) compared to a tax provision of 27.0% ($76.7) for 2007. The 2008 effective tax rate was unfavorably impacted primarily by the portion of the goodwill impairment charge for which no tax benefit was given, partially offset by a $2.6 tax benefit recorded due to a favorable audit resolution regarding an international subsidiary. The underlying annual tax rate for the year ended December 31, 2008 was 31.5% (excluding accrued interest on unrecognized tax benefits), with an underlying tax rate of 31.8% including such interest. The increase in the underlying annual tax rate compared to the 2007 underlying annual tax rate of 30.2% (including accrued interest on unrecognized tax benefits) is primarily due to a shift in earnings to higher tax jurisdictions and limited tax benefit attributable to U.S. manufacturing incentives.
Included in the 2007 rate is a $6.3 tax benefit to primarily adjust our deferred taxes for tax legislation that lowered the corporate income tax rate in a number of jurisdictions, partially offset by a zero tax benefit with respect to a French restructuring charge. The rate was also favorably impacted by the relatively low tax expense of $0.3 regarding the $13.6 gain recorded on the water divestiture. The underlying annual tax rate for the year ended December 31, 2007 was 29.2% (excluding accrued interest on unrecognized tax benefits), with an underlying rate of 30.2% including such interest.
Net loss for 2008 was $198.8 ($4.16 loss per basic share) compared with net earnings of $206.5 ($4.20 earnings per diluted share) in 2007. Included in 2008 results were an after-tax goodwill impairment charge of $358.3 in our Coating Resins segment and an after-tax $10.4 restructuring charge for various organizational restructuring initiatives across Specialty Chemicals segments and restructuring costs at our Additive Technologies manufacturing facility in West Virginia and Coating Resins manufacturing facilities in Connecticut and France. Included in our 2008 results was an after-tax $3.6 charge related to incremental accelerated depreciation on our Pampa, Texas Coating Resins manufacturing site that we exited. Our 2008 results also include an after-tax $4.0 gain related to a legal settlement related to our Engineered Materials segment and an income tax benefit of $2.6 related to a favorable tax development related to the sale of the water treatment business in 2007.
Included in 2007 results were an after-tax gain of $13.3 on the sale of the water treatment chemicals product line to Kemira, a $6.3 benefit for tax adjustments primarily related to tax rate changes in various jurisdictions and net after-tax restructuring charges of $5.0.
SEGMENT RESULTS (SALES TO EXTERNAL CUSTOMERS)
Year-to-year comparisons and analyses of changes in net sales by segment and region are set forth below:
Coating Resins
| % Change Due to | ||||||||||||||||||
| 2008 | 2007 | Total % Change |
Price | Volume/ Mix |
Currency | |||||||||||||
| North America |
$ | 340.9 | $ | 354.0 | -4 | % | 6 | % | -10 | % | 0 | % | ||||||
| Latin America |
73.7 | 72.9 | 1 | % | 3 | % | -6 | % | 4 | % | ||||||||
| Asia/Pacific |
306.6 | 288.4 | 6 | % | 4 | % | -5 | % | 7 | % | ||||||||
| Europe/Middle East/Africa |
930.8 | 942.8 | -1 | % | 0 | % | -10 | % | 9 | % | ||||||||
| Total |
$ | 1,652.0 | $ | 1,658.1 | 0 | % | 2 | % | -9 | % | 7 | % | ||||||
Overall sales were flat as favorable changes in exchange rates and higher selling prices were offset by lower selling volumes across all regions due to the global recession and depressed demand in industrial coatings markets, particularly automotive and construction, which affected all product lines. Overall selling prices were up 2% with increases in all product lines except powders which were flat primarily due to price competition and lower demand. Changes in exchange rates increased sales by 7%.
- 25 -
Table of Contents
Loss from operations was $340.2 or -21% of sales, compared with earnings from operations of $102.2, or 6% of sales in 2007. The operating loss includes a goodwill impairment charge of $385.0. See Note 9 of the Consolidated Financial Statements for additional details on goodwill impairment. Excluding the goodwill impairment charge, earnings from operations were $44.8 and positively impacted primarily by increases in selling prices of $34.3, $14.0 from changes in exchange rates, and $3.0 due to higher fixed cost absorption into inventory. These positive impacts were more than offset principally by the negative impacts of $62.7 due to lower selling volumes, $39.2 for higher raw material costs and $1.3 related to higher freight costs. Earnings were also negatively impacted in 2008 by $5.6 in incremental accelerated depreciation on assets at our Pampa, Texas site that we exited.
Additive Technologies
| % Change Due to | ||||||||||||||||||
| 2008 | 2007 | Total % Change |
Price | Volume/ Mix |
Currency | |||||||||||||
| North America |
$ | 125.8 | $ | 134.7 | -7 | % | 4 | % | -11 | % | 0 | % | ||||||
| Latin America |
21.1 | 29.3 | -28 | % | 1 | % | -31 | % | 2 | % | ||||||||
| Asia/Pacific |
62.2 | 64.8 | -4 | % | 7 | % | -12 | % | 1 | % | ||||||||
| Europe/Middle East/Africa |
101.4 | 101.4 | 0 | % | 0 | % | -8 | % | 8 | % | ||||||||
| Total |
$ | 310.5 | $ | 330.2 | -6 | % | 3 | % | -12 | % | 3 | % | ||||||
Overall selling volumes decreased 12% reflecting lower volumes across all regions mostly due to global economic weakness experienced in the fourth quarter and partially due to the completion of a resale agreement related to the sale of the water treating chemicals product line in the prior year and a commodity product line exit in polymer additives. Selling volumes were down across all product lines. Overall selling prices increased 3% with increases across all product lines and most regions. Changes in exchange rates increased sales by 3%.
Earnings from operations were $17.9, or 6% of sales in 2008, up from $16.2 or 5% of sales in 2007. Earnings were positively impacted primarily by $10.1 of higher selling prices, $5.0 of lower manufacturing costs, $5.1 from changes in exchange rates and $2.4 due to higher fixed cost absorption into inventory due to the lower demand. Earnings were negatively impacted by $10.7 due to higher raw material costs and $9.9 due to lower volumes across all product lines.
In Process Separation
| % Change Due to | ||||||||||||||||||
| 2008 | 2007 | Total % Change |
Price | Volume/ Mix |
Currency | |||||||||||||
| North America |
$ | 71.5 | $ | 61.7 | 16 | % | 10 | % | 6 | % | 0 | % | ||||||
| Latin America |
107.2 | 100.8 | 6 | % | 11 | % | -5 | % | 0 | % | ||||||||
| Asia/Pacific |
63.8 | 57.0 | 12 | % | 9 | % | 0 | % | 3 | % | ||||||||
| Europe/Middle East/Africa |
55.9 | 49.8 | 12 | % | 14 | % | -3 | % | 1 | % | ||||||||
| Total |
$ | 298.4 | $ | 269.3 | 11 | % | 11 | % | -1 | % | 1 | % | ||||||
Overall sales increased 11% due to increased selling prices of 11% across all regions and product lines. Overall selling volumes were down 1% with strong demand in North America and new product sales largely offsetting selling volume declines in all other regions. Changes in exchange rates increased sales 1%.
Earnings from operations were $51.5, or 17% of sales in 2008, up from $39.2 or 15% of sales in 2007. Earnings were positively impacted primarily by $29.4 of higher selling prices across all regions and product lines and $6.0 of favorable volume and product mix which were partially offset by higher raw material costs of $16.5, higher freight costs of $3.4, and higher manufacturing and operating expenses of $2.5.
- 26 -
Table of Contents
Engineered Materials
| % Change Due to | ||||||||||||||||||
| 2008 | 2007 | Total % Change |
Price | Volume/ Mix |
Currency | |||||||||||||
| North America |
$ | 511.9 | $ | 478.2 | 7 | % | 3 | % | 4 | % | 0 | % | ||||||
| Latin America(1) |
5.2 | 3.4 | – | – | – | – | ||||||||||||
| Asia/Pacific |
63.4 | 56.5 | 12 | % | 1 | % | 11 | % | 0 | % | ||||||||
| Europe/Middle East/Africa |
286.8 | 250.9 | 14 | % | 4 | % | 9 | % | 1 | % | ||||||||
| Total |
$ | 867.3 | $ | 789.0 | 10 | % | 3 | % | 7 | % | 0 | % | ||||||
| (1) | Due to the level of sales in this geographic region, percentage comparisons are not meaningful. |
Overall sales increased 10%. Overall selling volumes increased 7% primarily from higher volumes to the business/regional jet and rotorcraft and commercial transport market sectors due to build-rate increases partially offset by a decline in pressure sensitive adhesives due to global economic weakness. Net selling prices increased 3% due to price increases across most market sectors and regions.
Earnings from operations were $163.2, or 19% of sales in 2008, up from $145.5, or 18% of sales in 2007. The $17.7 increase in earnings included $28.6 due to higher selling volumes, $21.9 due to higher selling prices, and $5.8 due to increased fixed cost absorption into inventory. Earnings were adversely impacted by $20.2 of higher manufacturing costs primarily related to the higher production volumes, $6.7 due to higher operating expenses which primarily related to increased investments in selling and technical services, $9.4 due to higher raw material costs, and $3.0 due to higher freight costs.
Building Block Chemicals
| % Change Due to | ||||||||||||||||||
| 2008 | 2007 | Total % Change |
Price | Volume/ Mix |
Currency | |||||||||||||
| North America |
$ | 364.5 | $ | 246.1 | 48 | % | 48 | % | 0 | % | 0 | % | ||||||
| Latin America(1) |
5.8 | 3.7 | – | – | – | – | ||||||||||||
| Asia/Pacific |
12.9 | 31.8 | -59 | % | 5 | % | -64 | % | 0 | % | ||||||||
| Europe/Middle East/Africa |
128.5 | 175.6 | -27 | % | 10 | % | -37 | % | 0 | % | ||||||||
| Total |
$ | 511.7 | $ | 457.2 | 12 | % | 31 | % | -19 | % | 0 | % | ||||||
| (1) | Due to the level of sales in this geographic region, percentage comparisons are not meaningful. |
Overall sales were up 12%. Selling volumes were down 19% primarily due to lower volumes of acrylonitrile. Demand reduction occurred for acrylic fibers primarily in Asia and Europe due to high costs for acrylonitrile in 2008. Overall selling prices increased 31% to offset higher raw material price increases across all product lines.
Earnings from operations were $4.7, or 1% of sales in 2008, down from $23.8, or 5% of sales in 2007. Earnings were positively impacted by a $140.4 increase in selling prices and $9.8 of higher fixed cost absorption into inventory due to higher production than demand primarily in the acrylonitrile product line. Earnings in 2008 were negatively impacted $137.2 due to higher raw material costs, $24.1 related to lower selling volumes, and $8.7 of higher manufacturing costs of which $6.0 was related to lower acid regeneration operations.
RESTRUCTURING ACTIVITIES
In accordance with our accounting policy, restructuring costs are included in our corporate unallocated operating results for segment reporting purposes consistent with management’s view of its businesses.
Details of 2009 restructuring initiatives are as follows:
In 2009, we initiated restructuring actions across all segments and corporate functions. These actions were taken in response to the downturn in the global economy, which especially impacted the automotive, construction and general industrial markets that we serve, and led to a significant reduction in our sales and operating profitability. The following summarizes the details of the restructuring initiatives launched in 2009, which resulted in $91.9 of restructuring charges for the twelve months ended December 31, 2009.
- 27 -
Table of Contents
We launched restructuring initiatives at several of our Specialty Chemical manufacturing locations, which resulted in restructuring charges totaling $70.4 of which $40.4 is associated with severance and other employee benefits and $30.0 is associated with asset write-downs and accelerated depreciation. The manufacturing locations impacted by these initiatives are as follows:
| • | Closure of our manufacturing facility in La Llagosta, Spain and the transfer of manufacturing of most of the liquid coating resins products produced at the site to our facility in Werndorf, Austria. |
| • | Transfer of the manufacturing of our powder coating resins product line from Drogenbos, Belgium to our manufacturing facility in Bassano, Italy and consolidate or eliminate supply chain, sales, marketing and administrative functions at the site. |
| • | Transfer of the manufacturing of certain liquid coating resins products from our Hamburg, Germany site to our facility in Werndorf, Austria and consolidate or eliminate certain manufacturing, supply chain, and administrative functions at the site. |
| • | Conversion of our manufacturing facility in Antofagasta, Chile into a blending and distribution facility to support the Mining business and eliminate manufacturing functions at the site. |
| • | Closure of our manufacturing facility in Bogota, Colombia. |
The above manufacturing restructuring initiatives include the elimination 366 positions. We realized an estimated $9.3 of cost savings in 2009 related to these initiatives and expect to realize an estimated $33.2 of annualized pre-tax savings in 2010.
We launched restructuring initiatives across our Engineered Materials segment in response to inventory destocking by parts manufacturers that supply large commercial aircraft manufacturers as well as a sharper than expected decline in business and regional jet production rates. These initiatives resulted in $4.4 of restructuring charges for severance and employee benefits related to the elimination of 284 positions. We realized an estimated $6.0 of cost savings in 2009 related to these initiatives and expect to realize an estimated $23.0 of annualized pre-tax savings starting in 2010.
We launched several initiatives throughout 2009 in our Specialty Chemical segments and corporate functions across sales, marketing, manufacturing, supply chain, research and development, and administrative functions, including our initiative to establish a shared services center. These initiatives resulted in $17.1 of charges related to severance and employee benefits associated with the elimination of 393 positions. We realized $16.4 of estimated cost savings in 2009 related to these initiatives and expect to realize $29.5 of annualized pre-tax savings starting in 2010. Incremental annualized savings of $4.1 and $2.4 are projected to be realized in 2011 and 2012, respectively.
The majority of the aforementioned initiatives are substantially complete as of December 31, 2009, with some components expected to be completed in waves throughout 2010 and 2011.
The remaining reserve at December 31, 2009 of $30.8 relating to 2009 restructuring initiatives is expected to be paid through 2011.
Details of 2008 restructuring initiatives are as follows:
In 2008, as a cost reduction initiative and to align our cost structure to the declining demand environment at that time, we decided to restructure certain activities of our Coating Resins segment. These initiatives resulted in restructuring charges of $11.1 for the twelve months ended December 31, 2008, which primarily relates to severance for the 93 eliminated positions. Savings of $2.1 from these restructuring initiatives were realized in 2008 and $10.8 of annualized pre-tax savings were realized in 2009. These initiatives were completed in 2008. In 2009, the remaining balance of $0.9 was reversed. All costs have been paid in full as of December 31, 2009.
Details of 2007 restructuring initiatives are as follows:
In 2007, we initiated restructuring actions across our Specialty Chemicals segments to exit several mature product lines manufactured at our Willow Island, West Virginia and Wallingford, Connecticut facilities. As a result, we recorded total restructuring charges of $7.0 in 2007 and 2008. These initiatives were completed in 2008. In 2009, the remaining balance of $0.6 was reversed. All costs have been paid in full as of December 31, 2009. Minimal savings from this restructuring initiative were realized in 2007 and $5.9 annualized pre-tax savings were realized in 2008. A cash benefit of $18.9 from working capital reductions was realized through the first quarter of 2009. These benefits are net of lost earnings due to an annual sales reduction of $38.3.
During 2009, 2008, and 2007, we also recorded a net adjustment of $(0.2), $0.8, and $2.2, respectively, related to our 2006 and prior restructuring initiatives. The remaining reserve balance as of December 31, 2009 of $0.8 related to these initiatives is expected to be paid in 2010.
- 28 -
Table of Contents
See Note 3 of the Consolidated Financial Statements for a further summary of the restructuring charges.
LIQUIDITY AND FINANCIAL CONDITION
At December 31, 2009, our cash balance was $261.7 compared with $55.3 at year end 2008.
Cash flows provided by operating activities were $565.3 compared with $230.9 for 2008 primarily due to the favorable progress from our working capital initiative. Trade accounts receivable decreased $94.0 principally reflecting the reduction in days outstanding from 63 days at December 31, 2008 to 45 days at December 31, 2009. Inventory decreased $227.6 reflecting the reduction in days outstanding from 96 days at December 31, 2008 to 62 days at December 31, 2009. Accounts payable increased $32.7 primarily due to increased purchases in the fourth quarter of 2009 versus the prior year quarter. Days outstanding were flat at December 31, 2009 compared to 2008. Accrued expenses increased $24.6 primarily due to increased accrued restructuring costs of $16.7.
On May 13, 2009, we contributed 1,184,273 of newly issued shares of our common stock to the four benefit plans included in our U.S. pension master trust. These shares were valued at approximately $22.5. This contribution increased the funded status of each of the plans while significantly reducing our cash contributions.
Cash flows used in investing activities were $186.9 in 2009 compared to $193.4 in 2008. During the first nine months of 2009, we sold our polyurethane product line assets in Europe and Asia for cash proceeds totaling $7.0. Capital spending for 2009 was $193.9, which was mostly related to equipment purchases and work on our new carbon fiber line in Greenville, South Carolina, and our prepreg plant in China. Construction of the prepreg plant in China is now completed. Taking into account our expectations of the future business environment and the impact on the overall demand profile for carbon fiber, we decided in the first quarter of 2009 to delay the completion of the carbon fiber expansion project for at least eighteen months. We will continue to evaluate the timing of the carbon fiber project as market conditions change. Our capital spending for 2010 is expected to be in the range of $140.0 to $160.0.
Net cash flows used by financing activities were $174.3 in 2009 compared with $54.2 in 2008. In 2009, we had net debt repayments of $172.5. During third quarter of 2009, we completed an offering of $250.0 aggregate principal amount of 8.95% senior unsecured notes due 2017. We used those proceeds to purchase $234.6 principal amount of our 5.5% notes maturing October 2010 and $15.4 principal amount of our 4.6% notes maturing July 2013 to improve our debt maturity profile. We have been focused on using the cash generated from our working capital reduction initiatives to lower our debt levels and successfully reduced outstanding borrowings under our primary credit agreement to zero at December 31, 2009. Proceeds from the exercise of stock options were $7.4 in 2009.
On April 16, 2009 the Board of Directors reduced our quarterly dividend by 90% in light of economic conditions. As a result, we paid one quarterly cash dividend of $0.125 per common share and three quarterly dividends of $0.0125 per common share in 2009 which aggregated to $7.7. On January 28, 2010, our Board of Directors declared a quarterly cash dividend of $0.0125 per common share, payable on February 25, 2010 to stockholders of record as of February 10, 2010. Also during 2009, our majority owned subsidiary paid cash dividends to their minority shareholders which aggregated to $1.5.
CREDIT FACILITY
In the second quarter of 2009, we amended our existing $400.0 unsecured revolving credit facility. The amendment increases the maximum permitted ratio of Total Consolidated Debt (as defined) to Consolidated Earnings Before Interest, Tax, Depreciation and Amortization (“EBITDA”) (as defined) through March 31, 2010, and also excludes up to $100.0 of cash restructuring charges from the calculation of Consolidated EBITDA as it pertains to this covenant. The maturity date remains June 2012. The amendment also significantly increased the interest rate margin applicable to borrowings under the facility and replaces the existing facility fee with a commitment fee. At December 31, 2009, there were no borrowings outstanding under our $400.0 revolving credit facility.
DEBT OFFERING
On July 6, 2009 we closed on an offering of $250.0 aggregate principal amount of 8.95% senior unsecured notes due July 1, 2017, which resulted in $247.7 in net proceeds after original issue discount and underwriting fees. In addition, on June 30, 2009, we commenced offers to purchase our 5.5% notes due October 1, 2010 and our 4.6% notes due July 1, 2013. In July 2009, we applied the net proceeds from the issuance of the 8.95% notes and corporate cash to repurchase $234.6 principal amount of our 5.5% notes due October 1, 2010 for a purchase price of $242.8 plus accrued interest of $3.7 and $15.4 principal amount of our 4.6% notes due July 1, 2013 for a purchase price of $14.6. We
- 29 -
Table of Contents
raised the additional debt and launched the tender offer to improve our debt maturity profile and further mitigate any liquidity concerns associated with debt maturities. The repurchase of the notes through the tender offer resulted in a net loss of $8.6, including transaction costs, recognized in the third quarter of 2009.
Approximately $45.0 remained authorized under our stock buyback program as of December 31, 2009. We did not repurchase any shares during 2009. We do not expect to repurchase any shares in 2010 given current economic conditions.
We believe that we have the ability to fund our operating cash requirements and planned capital expenditures as well as the ability to meet our debt service requirements for the foreseeable future from existing cash and from internal cash generation. However, from time to time, based on such factors as local tax regulations, prevailing interest rates and our plans for capital investment or other investments, it may make economic sense to utilize our existing credit lines in order to meet those cash requirements, which may include debt-service related disbursements. We are required to meet financial ratios under our $400.0 five-year revolving credit agreement, including a maximum permitted ratio of Total Consolidated Debt (as defined) to Consolidated EBITDA (as defined) and a minimum consolidated EBITDA (as defined) to interest expense ratio. Complying with these ratios could limit our ability to plan for or react to market conditions or meet extraordinary capital needs and could otherwise restrict our financing activities. Our ability to comply with the covenants will depend on our future operating performance, which may continue to be adversely affected by general economic conditions. If we fail to comply with those covenants and terms, we will be in default. In this case, we would be required to obtain waivers from our lenders in order to maintain compliance. If we were unable to obtain any necessary waivers, the amounts outstanding under this agreement could be accelerated, and become immediately due and payable, and we would not be able to borrow any additional funds under the agreement while such default continued. We are in compliance with these covenants and expect to be in compliance for the remainder of the current facility which matures in June 2012. We have no borrowings outstanding under the agreement as of December 31, 2009. Our ability to fully utilize our revolving credit agreement can be limited by our actual calculated Debt Covenant Ratio as compared to the maximum Debt Covenant Ratio permitted under the agreement. At December 31, 2009 the full amount of the facility is available to us, and we expect that the full amount will continue to be available based on our current forecasts.
With the significant amount of cash generated in 2009, our priority will be to invest in the typical maintenance of business capital expenditures, pension contributions, and environmental remediation projects. We will also consider expansion/cost reduction capital in our growth product lines and fast payback/margin improvement capital in our cash product lines. In addition, if available at a reasonable price, we will pursue small technology based acquisitions for our growth product lines. We also will continue to pursue debt reductions when available at a reasonable price. We will also revisit the amount of our cash dividend when the global economy shows a consistent recovery.
We have not guaranteed any indebtedness of our unconsolidated associated company.
Inflation at this time is not considered significant although higher costs for energy and commodities could impact our future operating expenses and capital spending. The impact of increasing raw material costs are discussed under “Customers and Suppliers” in “Business” in Item 1, herein.
We estimate that pension and postretirement plan funding will be approximately $75.6 in 2010 as compared to $64.9 in 2009.
- 30 -
Table of Contents
Contractual Obligations and Commercial Commitments
The following table sets forth our contractual obligations under long-term agreements as of December 31, 2009:
| Contractual Obligations | Payments Due by Period | ||||||||||||||
| (In Millions) | |||||||||||||||
| Total | Less Than 1 Year |
1-3 Years | 3-5 Years | More than 5 Years | |||||||||||
| Long-term debt |
$ | 675.5 | $ | 16.7 | $ | – | $ | 157.2 | $ | 501.6 | |||||
| Interest payments(1) |
282.5 | 36.3 | 86.2 | 79.0 | 81.0 | ||||||||||
| Operating leases |
53.1 | 13.6 | 17.6 | 8.4 | 13.5 | ||||||||||
| Pension and postretirement plans obligations(2) |
75.6 | 75.6 | |||||||||||||
| Purchase obligations |
46.3 | 27.7 | 14.4 | 3.6 | 0.6 | ||||||||||
| Other noncurrent liabilities(3): |
|||||||||||||||
| Environmental liabilities(2) |
5.5 | 5.5 | |||||||||||||
| Cross currency swap(4) |
61.7 | 14.0 | 0.0 | 0.0 | 47.7 | ||||||||||
| Total |
$ | 1,200.2 | $ | 189.4 | $ | 118.2 | $ | 248.2 | $ | 644.4 | |||||
| (1) | Based on Euro exchange rate at December 31, 2009. |
| (2) | Expected cash flows for our pension and postretirement plans obligations and environmental liabilities for years beyond 2010 were excluded as specific payment dates could not be reasonably estimated. Amounts reflected to be paid in less than one year are based on our budget and actual amounts paid in 2010 may vary significantly for pension. See Notes 11 (environmental) and 13 (pension) of the Notes to the Consolidated Financial Statements for more information on these liabilities. |
| (3) | Included in other noncurrent liabilities on our consolidated balance sheet at December 31, 2009, were $60.8 of contingent liabilities (principally asbestos related liabilities) and $46.0 of asset retirement obligations. As specific payment dates for these items are unknown, the related balances have not been reflected in the “Payments Due by Period” section of the table above. |
| (4) | Related balances are based on principal components using Euro exchange rate at December 31, 2009. Current portions are recorded in cross currency swap receivable and payable in the accompanying balance sheets at fair values. |
As of December 31, 2009, the amount of unrecognized tax benefits was $37.9. As specific payment dates cannot be reasonably estimated, the related balances have not been reflected in the “Payments Due by Period” section of the table above.
At December 31, 2009, we had net contractual commitments under currency forward contracts in U.S. dollar equivalent amounts of $164.5, that all settle in less than one year. (Refer to Item 7A as well as Note 6 of the Notes to Consolidated Financial Statements included herein).
We had $33.9 of outstanding letters of credit, surety bonds and bank guarantees at December 31, 2009 that are issued on our behalf in the ordinary course of business to support certain of our performance obligations and commitments. The instruments are typically renewed on an annual basis.
We do not have any unconsolidated limited purpose entities or any undisclosed material transactions or commitments involving related persons or entities.
- 31 -
Table of Contents
QUANTITATIVE AND QUALITATIVE DISCLOSURES ABOUT MARKET RISK
The following discussion provides forward-looking quantitative and qualitative information about our potential exposures to market risk arising from changes in currency rates, commodity prices and interest rates. Actual results could differ materially from those projected in this forward-looking analysis. Currencies are in millions.
Market risk represents the potential loss arising from adverse changes in the value of financial instruments. The risk of loss is assessed based on the likelihood of adverse changes in fair values, cash flows or future earnings.
In the ordinary course of business, we are exposed to various market risks, including fluctuations in currency rates, commodity prices and interest rates. To manage the exposure related to these risks, we may engage in various derivative transactions in accordance with our established policies. We do not hold or issue financial instruments for trading or speculative purposes. Moreover, we enter into financial instrument transactions with either major financial institutions or highly-rated counterparties and make reasonable attempts to diversify transactions among counterparties, thereby limiting exposure to credit-related and performance-related risks.
Currency Risk: We periodically enter into currency forward and cross currency swap contracts primarily to hedge currency fluctuations of transactions denominated in currencies other than the functional currency of the respective entity. At December 31, 2009, the principal transactions hedged involved accounts receivable, accounts payable and intercompany loans. When hedging currency exposures, our practice is to hedge such exposures with forward contracts and cross currency swaps denominated in the same currency and with similar critical terms as the underlying exposure, and therefore, the instruments are effective at generating offsetting changes in the fair value, cash flows or future earnings of the hedged item or transaction.
At December 31, 2009, the currency and net notional amounts of forward contracts outstanding translated into U.S. dollar equivalent amounts were as follows:
| December 31, 2009 |
Buy | ||||||||||||||||||||
| Sell | U.S. Dollar | Euro | Pound Sterling |
Australian Dollar |
Canadian Dollar |
Chilean Peso |
Others | ||||||||||||||
| U.S. Dollar |
– | $ | 44.0 | $ | 9.9 | $ | 21.8 | $ | 43.4 | $ | 6.9 | $ | 2.3 | ||||||||
| Pound Sterling |
– | $ | 5.7 | – | – | – | – | – | |||||||||||||
| Canadian Dollar |
– | $ | 5.0 | – | – | – | – | – | |||||||||||||
| Brazilian Real |
$ | 4.5 | – | – | – | – | – | – | |||||||||||||
| Norwegian Krone |
– | $ | 5.1 | – | – | – | – | – | |||||||||||||
| Taiwan Dollar |
$ | 6.8 | – | – | – | – | – | – | |||||||||||||
| Korean Won |
$ | 5.9 | – | – | – | – | – | – | |||||||||||||
| Others |
$ | 2.0 | $ | 1.2 | – | – | – | – | – | ||||||||||||
The favorable fair value of currency contracts, based on exchange rates at December 31, 2009, was $0.5. Assuming that year-end exchange rates between the underlying currencies of all outstanding contracts and the various hedged currencies were to adversely change by a hypothetical 10%, the fair value of all outstanding contracts at year-end would decrease by approximately $21.9. However, since these contracts hedge specific transactions, any change in the fair value of the contracts would be offset by changes in the underlying value of the transaction being hedged.
In September 2005, we entered into €207.9 of five year cross currency swaps and €207.9 of ten year cross currency swaps to effectively convert the five-year notes and ten-year notes into Euro-denominated liabilities. The swaps included an initial exchange of $500.0 on October 4, 2005 and will require final principal exchanges of $250.0 on each settlement date of the five-year and ten-year notes (October 1, 2010 and October 1, 2015, respectively). At the initial principal exchange, we paid U.S. dollars to counterparties and received Euros. Upon final exchange, we will provide Euros to counterparties and receive U.S. dollars. The swaps also call for a semi-annual exchange of fixed Euro interest payments for fixed U.S. dollar interest receipts. With respect to the five year swaps, we will receive 5.5% per annum and will pay 3.78% per annum on each April 1 and October 1, through the maturity date of the five year swaps. With respect to the ten year swaps, we will receive 6.0% per annum and will pay 4.52% per annum on each April 1 and October 1, through the maturity date of the ten year swaps. Both currency swaps were designated as cash flow hedges of the changes in value of the
- 32 -
Table of Contents
future Euro interest and principal receipts that results from changes in the U.S. dollar to Euro exchange rates on certain Euro denominated intercompany loans receivable we have with one of our subsidiaries. In November 2008, the €207.9 five year cross currency swaps were de-designated as cash flow hedges due to our decision to execute new off-setting cross currency swaps (“two year cross currency swaps”) to lock-in the Euro forward exchange rate for the principal exchange on the five year cross currency swaps due on October 1, 2010. The net credit of $5.5 recorded in accumulated other comprehensive income on the de-designation date related to the five year swaps will be amortized into earnings over the remaining term of the related Euro-denominated intercompany loans. Prospective changes in the fair value of the five year swaps since the date of de-designation are reported in earnings. The two year cross currency swaps cover an identical notional amount of €207.9 and also call for a semi-annual exchange of fixed Euro interest receipts for fixed U.S. dollar interest payments. With respect to the two year swaps, we will receive 3.78% per annum on the Euro notional amount and will pay 3.69% per annum on the USD notional amount on each April 1 and October 1, through the maturity date of the two year swaps, which is also on October 1, 2010. The two year cross currency swaps are not designated as cash flow hedges. The fair value of the two year swaps is calculated each quarter with changes in fair value reported in earnings. We expect the earnings impact related to future changes in the fair value of the two year cross currency swaps to substantially offset the earnings impact related to future changes in the fair value of the five year swaps. At December 31, 2009, the fair value of the two, five, and ten year swaps were $34.8, $(44.7), and $(41.6), respectively. Assuming other factors are held constant, a hypothetical increase/decrease of 10% in the Euro exchange rate would cause an increase/decrease of approximately $31.4 in the total value of the hedging instruments referred to above.
A portion of the intercompany Euro denominated loans payable of one of our U.S. subsidiaries is designated as a hedge of our net investment in our Belgium-based subsidiary, Cytec Surface Specialties SA/NV. From time to time we also enter into designated forward Euro contracts to adjust the amount of the net investment hedge. At December 31, 2009, we had no designated forward contracts.
Commodity Price Risk: We use natural gas forwards to hedge a portion of our utility requirements at certain of our North American manufacturing facilities. The maturities of these swaps correlate highly to the actual purchases of the commodity and have the effect of securing predetermined prices that we pay for the underlying commodity. While these contracts are structured to limit our exposure to increases in commodity prices, they can also limit the potential benefit we might have otherwise received from decreases in commodity prices. These swaps are recognized on the balance sheet at fair value, which will be reclassified into manufacturing cost of sales through December 2010 as the hedged natural gas purchases affect earnings. For a detailed discussion on natural gas swaps, see Critical Accounting Policies – Derivative Financial Instruments and Certain Hedging Activities, Commodity Price Risk section below.
At December 31, 2009, we had outstanding natural gas forwards with a favorable fair value of $0.3. Assuming that year-end natural gas prices were to decrease by a hypothetical 10%, the value of these contracts would decrease by approximately $0.8.
Interest Rate Risk: At December 31, 2009, our outstanding borrowings consisted of $10.4 of short-term variable rate borrowings and long-term debt, including the current portion, which had a carrying value of $675.1, a face value of $675.5 and a fair value, of $746.1. The fair value is based on a discounted cash flow analysis which incorporates the contractual terms of the notes and observable market-based inputs that include time value, interest rate curves, and credit spreads.
Assuming other factors are held constant, a hypothetical increase/decrease of 1% in the weighted-average prevailing interest rate on our variable rate debt outstanding as of December 31, 2009, interest expense would increase/decrease by approximately $0.1 for the next fiscal year and the fair value of the fixed rate long-term debt would increase/decrease by approximately $34.1.
SIGNIFICANT ACCOUNTING ESTIMATES / CRITICAL ACCOUNTING POLICIES
Accounting principles generally accepted in the United States require management to make certain estimates and assumptions. These estimates and assumptions affect the reported amounts in the consolidated financial statements and the notes thereto. The areas discussed below involve the use of significant judgment in the preparation of our consolidated financial statements and changes in the estimates and assumptions used may impact future results of operations and financial condition.
SHARE-BASED COMPENSATION
U.S. Generally Accepted Accounting Principles (“GAAP”) requires recognition of compensation cost in an amount equal to the fair value of share-based payments. Compensation cost for performance
- 33 -
Table of Contents
stock is recorded based on the market value on the original date of grant (which is the fair value). Compensation cost for stock appreciation rights payable in cash (“cash-settled SARS”) is recognized based on the fair value of the award at the end of each period through the date of settlement. Compensation cost for stock appreciation rights payable in shares (“stock-settled SARS”) and stock options is recognized over the vesting period based on the estimated fair value on the date of the grant.
GAAP also requires that we estimate a forfeiture rate for all share-based awards. We monitor share option exercise and employee termination patterns to estimate forfeiture rates within the valuation model. The estimated fair values are based on assumptions, including estimated lives of the instruments, historical and implied volatility, dividend yield on our common stock, and risk-free interest rates. We also consider the probability that the options and stock-settled SARS will be exercised prior to the end of their contractual lives and the probability of termination or retirement of the holder. These assumptions are based on reasonable facts but are subject to change based on a variety of external factors. Changes in assumptions from period to period may materially affect the amount of share-based compensation cost we recognize in income.
ENVIRONMENTAL AND OTHER CONTINGENT LIABILITIES
Accruals for environmental remediation and operating and maintenance costs directly related to remediation, and other contingent liabilities are recorded when it is probable that a liability has been incurred and the amount of the liability can be reasonably estimated. Accruals are recorded at management’s best estimate of the ultimate expected liabilities, without any discount to reflect the time value of money. These accruals are reviewed periodically and adjusted, if necessary, as additional information becomes available.
The amount accrued for environmental remediation reflects our assumptions about remediation requirements at the contaminated site, the nature and cost of the remedy, the outcome of discussions with regulatory agencies and other potentially responsible parties at multi-party sites, and the number and financial viability of other potentially responsible parties.
Included in other contingent liabilities are workers’ compensation, product liability and toxic tort claims. The amount accrued for other contingent liabilities reflects our assumptions about the incidence, severity, indemnity costs and dismissal rates for existing and future claims.
Our asbestos related contingent liabilities and related insurance receivables are based on a study. The study estimated our gross asbestos liabilities using a frequency/severity approach. With this approach, the cost of future claim filings due to asbestos-related diseases are estimated as the product of the future number of claims filed and the average value of those claims on a nominal as opposed to discounted basis. Future claim frequency has been estimated using our claims history and the Stallard/Manton Epidemiological Decay Model, a widely used industry study. The Decay model assumes that future levels of claims activity will gradually decrease from current levels by applying model-specific decay factors that project this claim activity to wind down over the next 35 to 40 years. Our current levels are estimated based on our risk profile and our historical claim experience. The estimated cost per claim is based on our historical paid claims adjusted for inflation. Although these estimates and assumptions are based on reasonable facts, they are subject to change based on the actual outcome and a variety of external factors. A sustained 1% change in the annual number of future asbestos claims filed against us will increase or decrease the liability and related receivable by $0.4 and $0.3, respectively. A sustained 1% change in the average value of asbestos claims paid will increase or decrease the liability and related receivable by $0.4 and $0.3, respectively.
Accruals for environmental remediation and other contingent liabilities can change substantially if our assumptions are not realized or due to actions by governmental agencies or private parties. We cannot estimate any additional amount of loss or range of loss in excess of the recorded amounts. Moreover, environmental and other contingent liabilities are paid over an extended period, and the timing of such payments cannot be predicted with any certainty. Accruals for environmental and other contingent liabilities are recorded as other noncurrent liabilities with any amounts expected to be paid out in the next twelve months classified as accrued expenses.
Probable insurance recoveries for past and probable future indemnity costs are recorded at management’s best estimate of the ultimate expected receipts without discounting to reflect the time value of money and are recorded as other assets. A number of factors impact the estimates of insurance reimbursements. These factors include the financial viability of the insurance companies, the method in which losses will be allocated to the various insurance policies, how legal and defense costs will be covered by the insurance policies, the interpretation of the effect on coverage of various policy terms and limits and their interrelationships, and historical recovery rates over the past ten years.
- 34 -
Table of Contents
Defense and processing costs are expensed as incurred. Insurance recoveries for defense and processing costs are recognized when the recovery is probable and related costs are incurred and are recorded as other assets.
RETIREMENT PLANS
We sponsor defined benefit pension and other postretirement benefit plans. The postretirement plans provide medical and life insurance benefits to retirees who meet minimum age and service requirements. Our most significant pension plans are in the U.S., and constituted over 75% of our consolidated pension assets and 73% of projected benefit obligations as of December 31, 2009. The calculation of our pension expense and pension liability associated with our defined benefit pension plans requires the use of a number of assumptions. Changes in these assumptions can result in different pension expense and liability amounts, and actual experience can differ from the assumptions. We believe that the most critical assumptions are the discount rate and the expected rate of return on plan assets. Our U.S. salaried pension plan was frozen on December 31, 2007.
At the end of each year, we determine the discount rate to be used for pension liabilities. In estimating this rate, we look to rates of return on high quality, long-term corporate bonds that receive one of the two highest ratings given by a recognized ratings agency. Future expected actuarially determined cash flows of our major U.S. plans are matched against a yield curve encompassing such bonds to arrive at a single discount rate by plan. We discounted our U.S. future pension and postretirement medical liabilities using a rate of 5.8% and 5.4%, respectively, at December 31, 2009. The discount rate used to determine the value of liabilities has a significant effect on expense. A 1% increase to the discount rate for our U.S. pension plans would decrease our 2010 expected annual expense by $4.9 and decrease our liability by $68.5. A 1% decrease to the discount rate for our U.S. pension plans would increase our 2010 expected annual expense by $4.7 and increase our liability by $76.9. A 1% increase to the discount rate for our U.S. postretirement medical plan would increase our 2010 expected annual expense by $0.7 and decrease our liability by $15.5. A 1% decrease to the discount rate for our U.S. postretirement medical plan would increase our 2010 expected annual expense by $0.5 and increase our liability by $16.7.
The expected rate of return on our U.S. plan assets, which was 7.5% for 2009, reflects the long-term average rate of return expected on funds invested or to be invested in the pension plans to provide for the benefits included in the pension liability. We establish the expected rate of return at the beginning of each fiscal year based upon information available to us at that time, including the historical returns of major asset classes, the expected investment mix of the plans’ assets, and estimates of future long-term investment returns. A 1% change to the expected rate of return on plan assets of our U.S. pension plans would increase or decrease our 2010 expected annual expense by $5.3. The U.S. pension plans’ investment mix at December 31, 2009 approximated 63% equities and 37% fixed income securities. Any differences between actual experience and assumed experience are deferred as an unrecognized actuarial gain or loss. The unrecognized net actuarial gain or loss is amortized into pension expense in accordance with GAAP.
IMPAIRMENT OF GOODWILL
We have defined our segments as our reporting units. Our five business segments are Coating Resins, Additive Technologies, In Process Separation, Engineered Materials, and Building Block Chemicals. Additive Technologies and In Process Separation serve large, global industrial markets. Coating Resins serves the large, global coatings market. Engineered Materials serves principally aerospace markets. Building Block Chemicals sells commodity chemical intermediates to industrial users. The segments above reflect how we run our Company, manage the assets and view our customers.
We test goodwill for impairment on an annual basis. Goodwill of a reporting unit will be tested for impairment between annual tests if events occur or circumstances change that would likely reduce the fair value of the reporting unit below its carrying value. We use a two-step process to test goodwill for impairment. We initially use a market multiple approach (1A) to estimate a range of fair values by reporting unit, and then use a discounted cash flow approach (1B) if the market multiple approach indicates that a potential impairment might exist to refine and reaffirm the results of the first test. The market multiple approach provides a straightforward, cost effective and relatively simple method to readily determine if an impairment might exist by utilizing EBITDA (Earnings Before Interest, Taxes, Depreciation, and Amortization) information by reporting unit multiplied by average current industry valuation factors or multiples to easily determine an estimated range of fair value. Due to the cyclical nature of our reporting units, we utilize a three year EBITDA average of historical and forecasted EBITDA for the reportable segment times the range of EBITDA multiple factors. The
- 35 -
Table of Contents
three year period is comprised of the prior year, current year and one year projected amounts. The market multiple range utilizes an average lower and upper multiple limit based on recent industry acquisition average EBITDA multiples paid by financial and strategic purchasers. We obtain this information from a third party investment bank. If the reporting unit’s estimated fair value using the low end of the range is close to, in our judgment, or below the reporting unit’s carrying value, we refine the calculation using cash flows to calculate a point estimate of the reporting unit’s fair value, as opposed to a range. If the discounted cash flow approach yields a fair value estimate less than the reporting unit’s carrying value, we would proceed to step two of the impairment test. In the second step, the implied fair value of the reporting unit’s goodwill is determined by allocating the reporting unit’s fair value to all of its assets and liabilities other than goodwill in a manner similar to a purchase price allocation. The resulting implied fair value of the goodwill that results from the application of this second step is then compared to the carrying amount of the goodwill and an impairment charge is recorded for the difference.
In the fourth quarter of 2009, we completed our annual goodwill impairment test. For the market multiple approach, we used an EBITDA range of between 6.0X and 8.0X. All of our reporting units passed step 1A with the exception of the Coating Resins reporting unit. The Coating Resins EBITDA of $117.0 was a three year average of the 2008 actual, 2009 actual, and the 2010 budgeted EBITDA amounts. The market multiple approach (Step 1A) for the Coating Resins reporting unit resulted in a fair value range of $702.0 to $936.0. Since the range of the estimated fair values using the multiples was below the carrying value, we refined the estimate of the fair value using a discounted cash flow approach in accordance with our aforementioned policy which resulted in a fair value of $1,294.0. The discounted cash flow approach fair value exceeded the carrying value by $46.9, or 4.0%, indicating that there was no impairment of Coating Resins’ goodwill. The discounted cash flow approach considered a weighted average cost of capital (“WACC”) rate of 12% as the discount rate and an estimated net cash flow for a ten-year period from 2010 to 2019. The WACC calculation considered a risk-free rate of return, cost of debt and expected equity premium. The risk-free rate of return equaled the yield on long-term United States Treasury bonds. The cost of debt represented the yield of a BBB rated U.S. bond. The cost of equity included an estimate of the return on typical long-term investments required to induce investment in a diversified portfolio of U.S. publicly traded stocks adjusted for specific risk and size premiums of the reporting unit. The risk premium reflects the specific risks associated with the current business and future performance estimates. The cost of equity and debt were weighted based on the observed capital structures of companies with characteristics similar to the reporting unit. The discounted cash flow model also reflects a terminal value that assumes 2019 net cash flows will continue to grow at a rate of 2.75% in perpetuity, which we believe is reasonable for this business. These evaluations involve amounts that are based on management’s best estimates and judgments.
The discounted cash flows were based on a ten year projection, covering 2010 through 2019. The 2010 to 2013 projections take into account current macroeconomic conditions and reflect management’s best estimate of the amount of time required before the business recovers from the current recessionary environment. The 2014 to 2019 amounts were based on forecasted average revenue growth factor of approximately 3%. The projections included average annual capital expenditures of $33.0 and net working capital increases corresponding to the revenue growth assumed. We assumed an average tax rate of 31% for the discounted cash flow approach which we believe is a realistic approximation of our future annual effective tax rate.
The following table summarizes the approximate impact that a change in certain critical assumptions would have on the goodwill impairment. The approximate impact of the change in each critical assumption assumes all other assumptions and factors remain constant.
| Critical Factors | Change | Approximate Increase/(Decrease) |
|||||
| Weighted Average Cost of Capital |
+0.50 | % | $ | (63.0 | ) | ||
| Weighted Average Cost of Capital |
-0.50 | % | 70.0 | ||||
| Terminal Value Growth Rate |
+0.25 | % | 15.0 | ||||
| Terminal Value Growth Rate |
-0.25 | % | (15.0 | ) | |||
| Annual Capital Expenditures |
+$10.0 | (48.0 | ) | ||||
| Annual Capital Expenditures |
-$10.0 | 48.0 | |||||
| Annual Sales Volume Growth Rate |
+0.25 | % | 48.0 | ||||
| Annual Sales Volume Growth Rate |
-0.25 | % | (48.0 | ) | |||
| Operating Profit Margin |
+1 | % | 121.0 | ||||
| Operating Profit Margin |
-1 | % | (121.0 | ) | |||
- 36 -
Table of Contents
Because of the uncertainty inherent in such estimates, actual results may differ from these estimates. We are not aware of reasonably likely events or circumstances that would result in different amounts being estimated that would have a material impact on these assessments for impairment.
IMPAIRMENT OF LONG-LIVED ASSETS, INTANGIBLE ASSETS AND ASSETS TO BE DISPOSED
Long-lived assets and intangible assets with determinable useful lives are reviewed for impairment whenever events or changes in circumstances indicate that the carrying amount of an asset or asset group may not be recoverable. Recoverability of assets to be held and used is measured by a comparison of the carrying amount of the assets or asset group to the future undiscounted net cash flows expected to be generated by the asset or asset group. If such assets are considered to be impaired, the impairment to be recognized is measured by the amount by which the carrying amount of the assets exceeds the fair value of the assets and would be charged to earnings. Intangible assets with determinable useful lives are amortized over their respective estimated useful lives. Assets to be disposed of are reported at the lower of the carrying amount or fair value less the costs to sell.
INCOME TAXES
Income taxes are accounted for under the asset and liability method. Deferred tax assets and liabilities are recognized for the future tax consequences attributable to differences between the financial statement carrying amounts of existing assets and liabilities and their respective tax basis and operating loss and tax credit carryforwards. A valuation allowance is provided when it is more likely than not that some portion or all of the deferred tax assets will not be realized. Deferred tax assets and liabilities are measured using enacted tax rates expected to apply to taxable income in the years in which those temporary differences are expected to be recovered or settled. The effect on deferred tax assets and liabilities of a change in tax rates is recognized in earnings in the period that includes the enactment date.
We intend to reinvest the unremitted earnings of international subsidiaries. Accordingly, no provision has been made for U.S. or additional non-U.S. taxes with respect to these earnings. In the event of repatriation to the U.S., such earnings would be subject to U.S. income taxes in most cases. Foreign tax credits would be available to substantially reduce the amount of U.S. tax otherwise payable in future years.
Our annual effective tax rate is based on expected income, statutory tax rates and tax planning opportunities available in various jurisdictions in which we operate. Significant judgment is required in determining the annual effective tax rate and in evaluating our tax positions.
We establish accruals for tax contingencies when, notwithstanding the reasonable belief that our tax return positions are fully supported, we believe that certain filing positions are likely to be challenged and moreover, that such filing positions may not be fully sustained. We recognize a tax benefit from an uncertain tax position only if it is more likely than not that the tax position will be sustained on examination by the taxing authorities based on the technical merits of the position. We continually evaluate our uncertain tax positions and will adjust such amounts in light of changing facts and circumstances including but not limited to emerging case law, tax legislation, rulings by relevant tax authorities, and the progress of ongoing tax audits. Settlement of a given tax contingency could impact the income tax provision in the period of resolution. Our accruals for gross uncertain tax positions are presented in the balance sheet within income taxes payable and other noncurrent liabilities.
DERIVATIVE FINANCIAL INSTRUMENTS AND CERTAIN HEDGING ACTIVITIES
We use derivative instruments in accordance with our established policies to manage exposure to fluctuations in currency rates, interest rates and natural gas prices in North America. We do not hold or issue derivative financial instruments for trading or speculative purposes. We enter into financial instrument transactions with either major financial institutions or highly-rated counterparties and make reasonable attempts to diversify transactions among counterparties, thereby limiting exposure to credit-related and performance-related risks.
Foreign Currency Risk: We use currency forward contracts and cross currency swaps to manage our exposure to fluctuations in currency rates on third party and intercompany transactions denominated in currencies other than the functional currency of the legal entity. We hedge such exposures with currency forward contracts and cross currency swaps denominated in the same currency and with similar terms as the underlying exposure, and therefore, the instruments are effective at generating offsetting changes in the fair value or cash flows of the hedged item or transaction. All derivative contracts used to manage foreign currency risk are measured at fair value and reported as assets or liabilities on the balance sheet. Changes in fair value are reported in earnings or deferred, depending on the nature and
- 37 -
Table of Contents
effectiveness of the hedging relationship. Ineffectiveness, if any, in a hedging relationship is recognized immediately into earnings. If the hedging relationship is not highly effective in generating offsetting cash flows or changes in fair value, we would recognize the change in the fair value of the currency forward contract in other income (expense), net. In November 2008, we ceased designating our five year cross currency swaps as a cash flow hedge of the changes in the value of the future Euro interest and principal receipts that results from changes in the U.S. dollar to Euro exchange rates on certain intercompany loans as noted below. We did not terminate any other designated hedging relationships in 2009. There was no ineffectiveness in 2009, 2008 or 2007.
The earnings impact of cross currency swaps that are not designated as cash flow hedges and currency forward contracts that are used to economically hedge foreign currency assets or liabilities, if any, are recognized in other income/(expense), net during the term of the contracts.
We use cross currency swaps to hedge certain future cash flows from Euro receipts on certain Euro denominated intercompany loans receivable we have with certain subsidiaries against changes in the U.S. dollar to Euro exchange rates. The swaps fix the U.S. dollar equivalent cash flows of these Euro denominated intercompany loans and eliminate foreign exchange variability since the notional amounts of the swaps equal that of the loans, and all cash flow dates and interest rates coincide between the swaps and the loans, therefore no ineffectiveness is expected. These swaps have been designated as cash flow hedges. In November 2008, the €207.9 five year cross currency swaps were de-designated as cash flow hedges, due to our decision to execute new off-setting cross currency swaps (“two year cross currency swaps”) to lock-in the Euro forward exchange rate for the principal exchange on the five year cross currency swaps due on October 1, 2010. The two year cross currency swaps are not designated as cash flow hedges. All cross currency swaps are recorded at fair value as either assets or liabilities. Each period we record the change in the fair value of the ten year swaps in accumulated other comprehensive income. For the ten year swaps, we reclassify an amount out of accumulated other comprehensive income to the income statement to offset the foreign currency gain or loss on the remeasurement to U.S. dollar of the Euro intercompany loans. We accounted for the five year swaps in this manner until de-designation as cash flow hedges in November 2008. Prospectively, upon de-designation, the fair value of the two year and the five year cross currency swaps is calculated each quarter with changes in fair value reported in earnings. We expect the earnings impact related to future changes in the fair value of the two year cross currency swaps to substantially offset the earnings impact related to future changes in the fair value of the five year cross currency swaps. We accrue for all swaps the periodic net swap interest payments each period in the consolidated income statement. We monitor the counterparty credit risk and the continued probability of the hedged cash flows as to amount and timing.
A portion of the intercompany Euro denominated loans payable of one of our U.S. subsidiaries is designated as a hedge of our net investment in our Belgium-based subsidiary, Cytec Surface Specialties SA/NV. The portion of the remeasurement of the intercompany loan to the U.S. dollar that relates to the amount designated as a hedge of our net investment is recorded as a translation adjustment.
Commodity Price Risk: We use natural gas forwards to hedge a portion of our utility requirements at certain of our North American manufacturing facilities. These forward contracts, which are highly effective at achieving offsetting cash flows of the underlying natural gas purchases, have been designated as cash flow hedges and are reported on the consolidated balance sheets at fair value, with the effective portion of the hedged item included in accumulated other comprehensive income/(loss) on an after-tax basis. Gains and losses are reclassified into earnings, as a component of manufacturing cost of sales, in the period the hedged natural gas purchases affect earnings. If the derivative is no longer highly effective in achieving offsetting cash flows, subsequent changes in fair value are recorded in other income (expense), net. Any ineffectiveness is recognized in other income (expense), net in the current period. If the hedging relationship is terminated we continue to defer the related gain or loss in accumulated other comprehensive income and include it as a component of the cost of the underlying hedged item. If the forecasted transaction is no longer likely to occur we recognize the related gain or loss in other income (expense), net in that period. We did not terminate any hedges during 2009, 2008 and 2007. All hedged transactions that were forecasted to occur in 2009, 2008 and 2007 occurred as forecasted. Ineffectiveness during these years was insignificant. Our gas forwards and currency forwards are valued based on readily available published indices for commodity prices and currency exchange rates.
- 38 -
Table of Contents
FAIR VALUE MEASUREMENTS
On January 1, 2008 we adopted a new accounting standard regarding fair value measurements for financial assets and liabilities, as well as for any other assets and liabilities that are carried at fair value on a recurring basis in financial statements. The Financial Accounting Standards Board (“FASB”) issued a one-year deferral of the new fair value measurement requirements for non-financial assets and liabilities that are not required or permitted to be measured at fair value on a recurring basis at the time of issuance and accordingly, we adopted the remainder of the new standard on January 1, 2009. Included among our non-financial assets and liabilities that are not required to be measured at fair value on a recurring basis are plant, equipment and facilities, goodwill, acquisition intangibles, and asset retirement obligations. As a result of the adoption, a company must determine the appropriate level in the fair value hierarchy for each fair value measurement. The fair value hierarchy prioritizes the inputs, which refer broadly to assumptions market participants would use in pricing an asset or liability, into three levels. It gives the highest priority to quoted prices in active markets for identical assets or liabilities and the lowest priority to unobservable inputs. The level in the fair value hierarchy within which a fair value measurement in its entirety falls is determined based on the lowest level input that is significant to the fair value measurement in its entirety. Level 1 inputs are quoted prices (unadjusted) in active markets for identical assets or liabilities that the Company has the ability to access at the measurement date. Level 2 inputs are inputs other than quoted prices within Level 1 that are observable for the asset or liability, either directly or indirectly, such as quoted prices for similar assets or liabilities in active markets, interest rates, exchange rates, and yield curves observable at commonly quoted intervals. Level 3 inputs are unobservable inputs for the asset or liability.
All of our derivatives are valued based on level 2 inputs. Our gas forwards and currency forwards are valued based on readily available published indices for commodity prices and currency exchange rates. Our cross currency swaps are valued using an income approach based on industry-standard techniques. This model includes a discounted cash flow analysis that nets the discounted future cash receipts and the discounted expected cash payments resulting from the swap. The analysis is based on the contractual terms of the swaps including the period to maturity and observable market-based inputs that include time value, interest rate curves, foreign exchange rates, implied volatilities, as well as other relevant economic measures. We incorporate credit valuation adjustments to appropriately reflect both our own nonperformance risk and the counterparty’s nonperformance risk in the fair value measurements.
Although we have determined that the majority of the inputs used to value our derivatives fall within Level 2 of the fair value hierarchy, the credit valuation adjustments associated with our derivatives utilize Level 3 inputs, such as estimates of current credit spreads, to evaluate the likelihood of default by us and our counterparties. However, as of December 31, 2009, we have determined that the credit valuation adjustments are not significant to the overall valuation of our derivatives. As a result, we have determined that our derivative valuations in their entirety are classified in Level 2 of the fair value hierarchy.
At December 31, 2009, the favorable/(unfavorable) fair value of the two, five, and ten year swaps were $34.8, $(44.7), and $(41.6), respectively. The following table summarizes the approximate impact that a change in certain critical inputs would have on the fair values of our cross currency swaps in total. The approximate impact of the change in each critical input assumes all other inputs and factors remain constant. See Note 6 of the Consolidated Financial Statements for additional details on fair value disclosures.
| Critical Factors | Change | Approximate Impact On Two, Five, and Ten Year Swaps Favorable/(Unfavorable) Fair Value Combined |
|||||
| Euro interest rate curve |
+10 | % | $ | 4.8 | |||
| Euro interest rate curve |
-10 | % | (4.9 | ) | |||
| USD interest rate curve |
+10 | % | (4.6 | ) | |||
| USD interest rate curve |
-10 | % | 4.7 | ||||
| Euro/USD exchange rate |
+10 | % | (31.4 | ) | |||
| Euro/USD exchange rate |
-10 | % | 31.4 | ||||
- 39 -
Table of Contents
FINANCIAL STATEMENTS AND SUPPLEMENTARY DATA
CYTEC INDUSTRIES INC. AND SUBSIDIARIES
CONSOLIDATED BALANCE SHEETS
| December 31, | ||||||||
| (Dollars in millions, except per share amounts) | 2009 | 2008 | ||||||
| Assets |
||||||||
| Current assets |
||||||||
| Cash and cash equivalents |
$ | 261.7 | $ | 55.3 | ||||
| Trade accounts receivable, less allowance for doubtful accounts of $6.6 and $6.2 in 2009 and 2008, respectively |
374.2 | 448.8 | ||||||
| Other accounts receivable |
58.4 | 81.2 | ||||||
| Inventories |
351.9 | 569.4 | ||||||
| Deferred income taxes |
41.3 | 42.6 | ||||||
| Currency swap receivable |
34.4 | – | ||||||
| Other current assets |
19.0 | 19.4 | ||||||
| Total current assets |
1,140.9 | 1,216.7 | ||||||
| Investment in associated companies |
21.5 | 22.1 | ||||||
| Plants, equipment and facilities, at cost |
2,310.0 | 2,136.1 | ||||||
| Less: accumulated depreciation |
(1,133.8 | ) | (1,019.8 | ) | ||||
| Net plant investment |
1,176.2 | 1,116.3 | ||||||
| Acquisition intangibles, net of accumulated amortization of $214.8 and $171.3 in 2009 and 2008, respectively |
399.5 | 430.8 | ||||||
| Goodwill |
701.9 | 693.7 | ||||||
| Deferred income taxes |
11.9 | 28.9 | ||||||
| Other assets |
107.5 | 131.5 | ||||||
| Total assets |
$ | 3,559.4 | $ | 3,640.0 | ||||
| Liabilities |
||||||||
| Current liabilities |
||||||||
| Accounts payable |
$ | 276.4 | $ | 249.4 | ||||
| Short-term borrowings |
10.4 | 41.0 | ||||||
| Current maturities of long-term debt |
16.7 | 1.4 | ||||||
| Accrued expenses |
202.2 | 190.2 | ||||||
| Income taxes payable |
19.2 | 12.5 | ||||||
| Currency swap payable |
45.3 | – | ||||||
| Deferred income taxes |
5.2 | 2.4 | ||||||
| Total current liabilities |
575.4 | 496.9 | ||||||
| Long-term debt |
658.4 | 806.4 | ||||||
| Pension and other postretirement benefit liabilities |
388.8 | 436.3 | ||||||
| Other noncurrent liabilities |
309.7 | 300.1 | ||||||
| Deferred income taxes |
64.0 | 121.5 | ||||||
| Stockholders’ equity |
||||||||
| Preferred stock, 20,000,000 shares authorized; none issued and outstanding |
– | – | ||||||
| Common stock, $.01 par value per share, 150,000,000 shares authorized; issued 49,316,913 in 2009 and 48,132,640 shares in 2008 |
0.5 | 0.5 | ||||||
| Additional paid-in capital |
451.0 | 437.1 | ||||||
| Retained earnings |
1,123.2 | 1,133.5 | ||||||
| Accumulated other comprehensive gain/(loss) |
16.0 | (39.2 | ) | |||||
| Treasury stock, at cost, 594,134 shares in 2009 and 1,069,423 shares in 2008 |
(31.8 | ) | (57.2 | ) | ||||
| Total Cytec Industries Inc. stockholders’ equity |
1,558.9 | 1,474.7 | ||||||
| Noncontrolling interests |
4.2 | 4.1 | ||||||
| Total equity |
1,563.1 | 1,478.8 | ||||||
| Total liabilities and stockholders’ equity |
$ | 3,559.4 | $ | 3,640.0 | ||||
See accompanying Notes to Consolidated Financial Statements
- 40 -
Table of Contents
CYTEC INDUSTRIES INC. AND SUBSIDIARIES
CONSOLIDATED STATEMENTS OF INCOME
| Years ended December 31, | ||||||||||||
| (Dollars in millions, except per share amounts) | 2009 | 2008 | 2007 | |||||||||
| Net sales |
$ | 2,789.5 | $ | 3,639.9 | $ | 3,503.8 | ||||||
| Manufacturing cost of sales |
2,317.1 | 2,912.7 | 2,752.9 | |||||||||
| Selling and technical services |
199.4 | 230.1 | 212.8 | |||||||||
| Research and process development |
75.2 | 81.6 | 75.7 | |||||||||
| Administrative and general |
124.4 | 112.0 | 113.2 | |||||||||
| Amortization of acquisition intangibles |
38.2 | 39.6 | 38.7 | |||||||||
| Net gain on sale of assets |
0.2 | – | 13.6 | |||||||||
| Asset impairment charge |
4.3 | – | – | |||||||||
| Goodwill impairment charge |
– | 385.0 | – | |||||||||
| Earnings/(loss) from operations |
31.1 | (121.1 | ) | 324.1 | ||||||||
| Other (expense)/income, net |
(2.5 | ) | 3.3 | 0.4 | ||||||||
| Net (loss)/gain on early extinguishment of debt |
(9.1 | ) | 1.9 | – | ||||||||
| Equity in earnings of associated companies |
0.9 | 1.5 | 1.4 | |||||||||
| Interest expense, net |
24.2 | 35.2 | 41.9 | |||||||||
| (Loss)/earnings before income tax provision |
(3.8 | ) | (149.6 | ) | 284.0 | |||||||
| Income tax (benefit)/provision |
(2.9 | ) | 47.4 | 76.7 | ||||||||
| Net (loss)/earnings |
$ | (0.9 | ) | $ | (197.0 | ) | $ | 207.3 | ||||
| Less: Net earnings attributable to noncontrolling interests |
(1.6 | ) | (1.8 | ) | (0.8 | ) | ||||||
| Net (loss)/earnings attributable to Cytec Industries Inc. |
$ | (2.5 | ) | $ | (198.8 | ) | $ | 206.5 | ||||
| (Loss)/earnings per common share attributable to Cytec Industries Inc. |
||||||||||||
| Basic (loss)/earnings per common share |
$ | (0.05 | ) | $ | (4.16 | ) | $ | 4.29 | ||||
| Diluted (loss)/earnings per common share |
$ | (0.05 | ) | $ | (4.16 | ) | $ | 4.20 | ||||
| Dividends per common share |
$ | 0.16 | $ | 0.50 | $ | 0.40 | ||||||
See accompanying Notes to Consolidated Financial Statements
- 41 -
Table of Contents
CYTEC INDUSTRIES INC. AND SUBSIDIARIES
CONSOLIDATED STATEMENTS OF CASH FLOWS
| Years ended December 31, (Dollars in millions, except per share amounts) |
2009 | 2008 | 2007 | |||||||||
| Cash flows provided by (used in) operating activities |
||||||||||||
| Net (loss)/earnings |
$ | (0.9 | ) | $ | (197.0 | ) | $ | 207.3 | ||||
| Non cash items included in net (loss)/earnings: |
||||||||||||
| Depreciation |
135.9 | 113.7 | 100.9 | |||||||||
| Amortization |
44.7 | 45.6 | 44.7 | |||||||||
| Share-based compensation |
7.8 | 10.2 | 12.9 | |||||||||
| Deferred income taxes |
(42.1 | ) | (19.1 | ) | 27.2 | |||||||
| Net gain on sales of assets |
(0.2 | ) | (3.9 | ) | (13.6 | ) | ||||||
| Non-cash gain on transfer of land |
(8.9 | ) | – | – | ||||||||
| Non-cash pension settlement charge |
12.2 | – | – | |||||||||
| Asset impairment charges |
4.3 | 385.0 | 1.4 | |||||||||
| Net loss/(gain) on early extinguishment of debt |
9.1 | (1.9 | ) | – | ||||||||
| Unrealized (gain)/loss on derivative instruments |
(5.7 | ) | 8.4 | (1.7 | ) | |||||||
| Other |
1.0 | 0.7 | 1.9 | |||||||||
| Changes in operating assets and liabilities: |
||||||||||||
| Trade accounts receivable |
94.0 | 104.0 | (38.8 | ) | ||||||||
| Other receivables |
22.2 | 6.0 | 10.1 | |||||||||
| Inventories |
227.6 | (70.0 | ) | (21.7 | ) | |||||||
| Other assets |
3.2 | (13.8 | ) | 5.2 | ||||||||
| Accounts payable |
32.7 | (75.4 | ) | 2.8 | ||||||||
| Accrued expenses |
24.6 | (18.6 | ) | (1.8 | ) | |||||||
| Income taxes payable |
13.2 | (1.4 | ) | (14.7 | ) | |||||||
| Other liabilities |
(9.4 | ) | (41.6 | ) | (51.4 | ) | ||||||
| Net cash provided by operating activities |
565.3 | 230.9 | 270.7 | |||||||||
| Cash flows (used in) provided by investing activities: |
||||||||||||
| Additions to plants, equipment and facilities |
(193.9 | ) | (195.8 | ) | (114.8 | ) | ||||||
| Net proceeds received on sale of assets |
7.0 | 2.4 | 38.7 | |||||||||
| Net cash used in investing activities |
(186.9 | ) | (193.4 | ) | (76.1 | ) | ||||||
| Cash flows (used in) provided by financing activities |
||||||||||||
| Proceeds from long-term debt |
390.2 | 282.0 | 222.0 | |||||||||
| Payments on long-term debt |
(532.8 | ) | (278.7 | ) | (319.8 | ) | ||||||
| Change in short-term borrowings |
(29.9 | ) | (3.0 | ) | (1.2 | ) | ||||||
| Cash dividends |
(9.2 | ) | (24.6 | ) | (19.6 | ) | ||||||
| Proceeds from the exercise of stock options |
7.4 | 11.2 | 39.3 | |||||||||
| Purchase of treasury stock |
– | (46.4 | ) | (77.3 | ) | |||||||
| Excess tax benefits from share-based payment arrangements |
– | 5.3 | 11.7 | |||||||||
| Net cash used in financing activities |
(174.3 | ) | (54.2 | ) | (144.9 | ) | ||||||
| Effect of currency rate changes on cash and cash equivalents |
2.3 | (4.8 | ) | 3.5 | ||||||||
| Increase/(decrease) in cash and cash equivalents |
206.4 | (21.5 | ) | 53.2 | ||||||||
| Cash and cash equivalents, beginning of year |
55.3 | 76.8 | 23.6 | |||||||||
| Cash and cash equivalents, end of year |
$ | 261.7 | $ | 55.3 | $ | 76.8 | ||||||
See accompanying Notes to Consolidated Financial Statements
- 42 -
Table of Contents
CYTEC INDUSTRIES INC.
CONSOLIDATED STATEMENTS OF STOCKHOLDERS’ EQUITY
| Cytec Industries Inc. Stockholder’s Equity | Noncont- rolling interests |
Total | |||||||||||||||||||||||||||||||||
| Years ended December 31, 2009, 2008 and 2007 (Dollars in millions) |
Common Stock |
Additional Paid-in Capital |
Retained Earnings |
Pension Liabilities |
Unrealized net (losses) gains on cash flow hedges |
Cumulative Translation Adjustments |
Treasury Stock |
||||||||||||||||||||||||||||
| Balance at December 31, 2006 |
$ | 0.5 | $ | 429.0 | $ | 1,169.1 | $ | (102.3 | ) | $ | 3.1 | $ | 88.8 | $ | (16.2 | ) | $ | 2.2 | $ | 1,574.2 | |||||||||||||||
| Cumulative effect of adjustment resulting from the adoption of new accounting pronouncement(1) |
– | – | 0.3 | – | – | – | – | – | 0.3 | ||||||||||||||||||||||||||
| Adjusted Balance at January 1, 2007 |
0.5 | 429.0 | 1,169.4 | (102.3 | ) | 3.1 | 88.8 | (16.2 | ) | 2.2 | 1,574.5 | ||||||||||||||||||||||||
| Net earnings |
– | – | 206.5 | – | – | – | – | 0.8 | 207.3 | ||||||||||||||||||||||||||
| Other comprehensive income: |
|||||||||||||||||||||||||||||||||||
| Pension liability adjustment, net of taxes of $32.0 |
– | – | – | 52.5 | – | – | – | – | 52.5 | ||||||||||||||||||||||||||
| Unrealized net gains on derivative instruments, net of taxes of $13.2 |
– | – | – | – | 20.7 | – | – | – | 20.7 | ||||||||||||||||||||||||||
| Translation adjustments |
– | – | – | – | – | 94.7 | – | 0.2 | 94.9 | ||||||||||||||||||||||||||
| Comprehensive income |
$ | 1.0 | $ | 375.4 | |||||||||||||||||||||||||||||||
| Dividends – noncontrolling interests |
– | – | – | – | – | – | – | (0.5 | ) | (0.5 | ) | ||||||||||||||||||||||||
| Dividends: |
|||||||||||||||||||||||||||||||||||
| Common stock outstanding |
– | – | (19.1 | ) | – | – | – | – | – | (19.1 | ) | ||||||||||||||||||||||||
| Deferred and unvested common stock |
– | 0.2 | (0.2 | ) | – | – | – | – | – | – | |||||||||||||||||||||||||
| Purchase of treasury stock |
– | – | – | – | – | – | (77.3 | ) | – | (77.3 | ) | ||||||||||||||||||||||||
| Share-based compensation |
– | 12.0 | – | – | – | – | 0.7 | – | 12.7 | ||||||||||||||||||||||||||
| Exercise of stock options |
– | (14.9 | ) | – | – | – | – | 54.2 | – | 39.3 | |||||||||||||||||||||||||
| Excess tax benefit on stock options |
– | 11.7 | – | – | – | – | – | – | 11.7 | ||||||||||||||||||||||||||
| Balance at December 31, 2007 |
$ | 0.5 | $ | 438.0 | $ | 1,356.6 | $ | (49.8 | ) | $ | 23.8 | $ | 183.5 | $ | (38.6 | ) | $ | 2.7 | $ | 1,916.7 | |||||||||||||||
| Net loss |
– | – | (198.8 | ) | – | – | – | – | 1.8 | (197.0 | ) | ||||||||||||||||||||||||
| Benefit plan measurement date adjustment(2) |
– | – | (0.3 | ) | – | – | – | – | – | (0.3 | ) | ||||||||||||||||||||||||
| Other comprehensive income: |
|||||||||||||||||||||||||||||||||||
| Pension liability adjustment, net of taxes of $76.5 |
– | – | – | (127.8 | ) | – | – | – | – | (127.8 | ) | ||||||||||||||||||||||||
| Unrealized net loss on derivative instruments, net of taxes of $1.9 |
– | – | – | – | (2.6 | ) | – | – | – | (2.6 | ) | ||||||||||||||||||||||||
| Translation adjustments |
– | – | – | – | – | (66.3 | ) | – | 0.4 | (65.9 | ) | ||||||||||||||||||||||||
| Comprehensive income |
$ | 2.2 | $ | (393.6 | ) | ||||||||||||||||||||||||||||||
| Dividends – noncontrolling interests |
– | – | – | – | – | – | – | (0.8 | ) | (0.8 | ) | ||||||||||||||||||||||||
| Dividends: |
|||||||||||||||||||||||||||||||||||
| Common stock outstanding |
– | – | (23.8 | ) | – | – | – | – | – | (23.8 | ) | ||||||||||||||||||||||||
| Deferred and unvested common stock |
– | 0.2 | (0.2 | ) | – | – | – | – | – | – | |||||||||||||||||||||||||
| Purchase of treasury stock |
– | – | – | – | – | – | (46.4 | ) | – | (46.4 | ) | ||||||||||||||||||||||||
| Share-based compensation |
– | 6.8 | – | – | – | – | 3.4 | – | 10.2 | ||||||||||||||||||||||||||
| Exercise of stock options |
– | (13.2 | ) | – | – | – | – | 24.4 | – | 11.2 | |||||||||||||||||||||||||
| Excess tax benefit on stock options |
– | 5.3 | – | – | – | – | – | – | 5.3 | ||||||||||||||||||||||||||
| Balance at December 31, 2008 |
$ | 0.5 | $ | 437.1 | $ | 1,133.5 | $ | (177.6 | ) | $ | 21.2 | $ | 117.2 | $ | (57.2 | ) | $ | 4.1 | $ | 1,478.8 | |||||||||||||||
- 43 -
Table of Contents
CYTEC INDUSTRIES INC.
CONSOLIDATED STATEMENTS OF STOCKHOLDERS’ EQUITY (CONTINUED)
| Years ended December 31, 2009, 2008 and 2007 (Dollars in millions) |
Cytec Industries Inc. Stockholder’s Equity | Noncont- rolling interests |
Total | |||||||||||||||||||||||||||||||
| Common Stock |
Additional Paid-in Capital |
Retained Earnings |
Pension Liabilities |
Unrealized net (losses) gains on cash flow hedges |
Cumulative Translation Adjustments |
Treasury Stock |
||||||||||||||||||||||||||||
| Balance at December 31, 2008 | $ 0.5 | $ 437.1 | $1,133.5 | $ (177.6) | $ 21.2 | $ 117.2 | $ (57.2) | $ 4.1 | $1,478.8 | |||||||||||||||||||||||||
| Net earnings |
– | – | (2.5 | ) | – | – | – | – | 1.6 | (0.9 | ) | |||||||||||||||||||||||
| Other comprehensive income: |
||||||||||||||||||||||||||||||||||
| Pension liability adjustment, net of taxes of $8.3 |
– | – | – | 14.4 | – | – | – | – | 14.4 | |||||||||||||||||||||||||
| Unrealized net loss on derivative instruments, net of taxes of $9.7 |
– | – | – | – | (15.2 | ) | – | – | – | (15.2 | ) | |||||||||||||||||||||||
| Translation adjustments |
– | – | – | – | – | 56.0 | – | – | 56.0 | |||||||||||||||||||||||||
| Comprehensive income |
$ | 1.6 | $ | 54.3 | ||||||||||||||||||||||||||||||
| Dividends – noncontrolling interests |
– | – | – | – | – | – | – | (1.5 | ) | (1.5 | ) | |||||||||||||||||||||||
| Dividends: |
||||||||||||||||||||||||||||||||||
| Common stock outstanding |
– | – | (7.7 | ) | – | – | – | – | – | (7.7 | ) | |||||||||||||||||||||||
| Deferred and unvested common stock |
– | 0.1 | (0.1 | ) | – | – | – | – | – | – | ||||||||||||||||||||||||
| Share-based compensation |
– | (1.0 | ) | – | – | – | – | 8.7 | – | 7.7 | ||||||||||||||||||||||||
| Shares contribution to pension plans |
– | 22.5 | – | – | – | – | – | – | 22.5 | |||||||||||||||||||||||||
| Exercise of stock options |
– | (9.3 | ) | – | – | – | – | 16.7 | – | 7.4 | ||||||||||||||||||||||||
| Excess tax benefit on stock options |
– | 1.6 | – | – | – | – | – | – | 1.6 | |||||||||||||||||||||||||
| Balance at December 31, 2009 |
$ | 0.5 | $ | 451.0 | $ | 1,123.2 | $ | (163.2 | ) | $ | 6.0 | $ | 173.2 | $ | (31.8 | ) | $ | 4.2 | $ | 1,563.1 | ||||||||||||||
| (1) | In June 2006, the Financial Accounting Standards Board, (“FASB”) issued a new pronouncement which addresses the determination of whether tax benefits claimed or expected to be claimed on a tax return should be recorded in the financial statements. Under this pronouncement, we recognize the tax benefit from an uncertain tax position only if it is more likely than not that the tax position will be sustained on examination by the taxing authorities, based on the technical merits of the position. The tax benefits recognized in the financial statements from such a position are measured based on the largest benefit that has a greater than fifty percent likelihood of being realized upon settlement with the tax authorities. The pronouncement also provides guidance on derecognition, classification, interest and penalties on income taxes, accounting in interim periods and requires increased disclosures. On January 1, 2007, we adopted the provisions of this new pronouncement and as a result, we recognized a $0.3 decrease in the liability for unrecognized tax benefits. This decrease in liability resulted in an increase to the January 1, 2007 retained earnings balance in the amount of $0.3. |
| (2) | In September 2006, the FASB issued a new accounting pronouncement which requires an employer to measure plan assets and benefit obligations as of the date of the employer’s statement of financial position, as opposed to at an earlier measurement date as allowed previously. Prior to 2008, we used a measurement date of November 30 when valuing our pension obligations for the majority of our non-U.S. defined benefit pension plans. The provisions of this pronouncement requiring that the measurement date be the same as the date of the statement of financial position became effective for the year ended December 31, 2008 and as a result, we changed our measurement date for certain non-U.S. defined benefit pension plans to December 31 from November 30. We adopted the measurement date requirement in 2008 using the 13-month approach. In accordance with this approach, we recorded an additional one month of net periodic benefit cost covering the period between the previous measurement date of November 30, 2007 and December 31, 2008 as an adjustment to retained earnings. |
See accompanying Notes to Consolidated Financial Statements
- 44 -
Table of Contents
CYTEC INDUSTRIES INC.
NOTES TO THE CONSOLIDATED FINANCIAL STATEMENTS
(Currencies in millions, except per share amounts, unless otherwise indicated)
1. SUMMARY OF SIGNIFICANT ACCOUNTING POLICIES
A. Nature of Business and Consolidation Policy: We are a global specialty chemicals and materials company focused on developing, manufacturing and selling value-added products. Our products serve a diverse range of end markets including aerospace, adhesives, automotive and industrial coatings, construction, chemical intermediates, inks, mining and plastics. We use our technology and application development expertise to create chemical and material solutions that are formulated to perform specific and important functions in the finished products of our customers. We operate on a global basis with 38% of our 2009 revenues in North America, 39% in Europe, Middle East, and Africa, 17% in Asia-Pacific and 6% in Latin America. We have manufacturing and research facilities located in 16 countries. The consolidated financial statements include the accounts of Cytec Industries Inc. and our subsidiaries on a consolidated basis. Intercompany transactions and balances have been eliminated. The equity method of accounting is used for investments in associated companies that we do not control, but for which we have the ability to exercise significant influence on operating and financial policy.
B. Inventories: Inventories are stated at the lower of cost or market. We determine cost using the first-in, first-out method.
C. Currency Translation: Operations in our international subsidiaries are recorded in local currencies which are also the functional currencies for financial reporting purposes. The results of operations for our international subsidiaries are translated from local currencies into U.S. dollars using the average currency rate during each period which approximates the results that would be obtained using actual currency rates on the dates of individual transactions. Assets and liabilities are translated using currency rates at the end of the period with translation adjustments recorded in accumulated translation adjustments and recognized as a component of accumulated other comprehensive income. Gains and losses on foreign currency transactions, which represent the translation of transactions denominated in currencies other than the functional currency of the impacted legal entity, are recorded as incurred in other income (expense), net.
D. Depreciation: Depreciation is provided on either the straight-line or the straight-line composite method. Assets in the United States acquired in conjunction with the Surface Specialties business (forming substantially all of our Coating Resins segment) of UCB SA (“UCB”) and assets outside the United States and Canada are depreciated on a straight-line basis over the estimated useful lives of the assets. When these assets are retired or disposed of, the net book value of assets are removed from the consolidated balance sheet and the net gain or loss is included in the determination of earnings from operations. Depreciation for the remainder of our assets in the United States and Canada is recorded primarily on a straight-line composite method over the estimated useful lives of various classes of assets, with rates periodically reviewed and adjusted if necessary. When such depreciable assets are sold or otherwise retired from service, unless a major change in the composition of an asset class has occurred, their costs plus demolition costs less amounts realized on sale or salvage are charged or credited to the accumulated depreciation account. Expenditures for maintenance and repairs are charged to current operating expenses. Acquisitions, additions and betterments, either to provide necessary capacity, improve the efficiency of production units, modernize or replace older facilities or to install equipment for protection of the environment, are capitalized. We capitalize interest costs incurred during the period of construction of plants and equipment.
E. Impairment of Long-Lived Assets, Intangible Assets, and Long-Lived Assets to Be Disposed: Long-lived assets and intangible assets with determinable useful lives are reviewed for impairment whenever events or changes in circumstances indicate that the carrying amount of an asset or asset group may not be recoverable. Recoverability of assets to be held and used is measured by a comparison of the carrying amount of the assets to the future undiscounted net cash flows expected to be generated by the assets. If such assets are considered to be impaired, the impairment to be recognized is measured by the amount by which the carrying amount of the assets exceeds the fair value of the assets and would be charged to income. Assets to be disposed of are reported at the lower of the carrying amount or fair value less the costs to sell. Intangible assets are amortized on a straight-line basis over their respective estimated useful lives.
F. Goodwill: We have defined our reportable segments as our reporting units for our goodwill
- 45 -
Table of Contents
accounting. We test goodwill for impairment on an annual basis as of October 1st and more often if events occur or circumstances change that would likely reduce the fair value of a reporting unit to an amount below its carrying value. When necessary, we record charges for goodwill impairments for the amount by which the implied fair value of goodwill is less than its carrying value.
We use a two-step process to test goodwill for impairment. First, the reporting unit’s fair value is compared to its carrying value. We initially use a market multiple approach (1A) to estimate a range of fair values by reporting unit, and then use a discounted cash flow approach (1B) if the market multiple approach indicates that a potential impairment might exist to refine and reaffirm the results of the first test. Due to the cyclical nature of our reporting units, market multiple values are determined utilizing a three-year average. The three-year period is comprised of the prior year, current year and one year of projected amounts. If the reporting unit’s estimated fair value at the low end of the range is close to, in our judgment, or below the reporting unit’s carrying value, we refine the calculation using discounted cash flows to calculate a point estimate of the reporting unit’s fair value, as opposed to a range. If the discounted cash flow approach yields a fair value estimate less than the reporting unit’s carrying value, we would proceed to step two of the impairment test which is used to measure the amount of the impairment loss. In the second step, the implied fair value of the reporting unit’s goodwill is determined by allocating the reporting unit’s fair value to all of its assets and liabilities other than goodwill in a manner similar to a purchase price allocation. The resulting implied fair value of the goodwill that results from the application of this second step would then be compared to the carrying amount of the goodwill and an impairment charge would be recorded for the difference.
G. Cash and Cash Equivalents: Securities with maturities of three months or less when purchased are considered to be cash equivalents.
H. Financial Instruments: On January 1, 2008 we adopted a new accounting standard regarding fair value measurements for financial assets and liabilities, as well as for any other assets and liabilities that are carried at fair value on a recurring basis in financial statements. Certain financial instruments are recorded at cost which approximates fair value such as cash and cash equivalents, receivables, certain other assets, accounts payable, and certain other liabilities. Fair values are determined through a combination of management estimates and information obtained from third parties using the latest available market data. Long-term debt is carried at amortized cost.
I. Derivative Instruments and Hedging Activities: We use derivative instruments in accordance with our established policies to manage exposure to fluctuations in currency rates, interest rates and natural gas prices in North America. We do not hold or issue derivative financial instruments for trading or speculative purposes. We enter into financial instrument transactions with either major financial institutions or highly-rated counterparties and make reasonable attempts to diversify transactions among counterparties, thereby limiting exposure to credit-related and performance-related risks.
Foreign Currency Risk: We use currency forward contracts and cross currency swaps to manage our exposure to fluctuations in currency rates on third party and intercompany transactions denominated in currencies other than the functional currency of the legal entity. We hedge such exposures with currency forward contracts and cross currency swaps denominated in the same currency and with similar terms as the underlying exposure, and therefore, the instruments are effective at generating offsetting changes in the fair value or cash flows of the hedged item or transaction. All derivative contracts used to manage foreign currency risk are measured at fair value and reported as assets or liabilities on the balance sheet. Changes in fair value are reported in earnings or deferred, depending on the nature and effectiveness of the hedging relationship. Ineffectiveness, if any, in a hedging relationship is recognized immediately into earnings. If the hedging relationship is not highly effective in generating offsetting cash flows or changes in fair value, we recognize the change in the fair value of the currency forward contract in other income (expense), net.
We use cross currency swaps to hedge certain future cash flows from Euro receipts on certain Euro denominated intercompany loans receivable we have with certain subsidiaries against changes in the U.S. dollar to Euro exchange rates. The swaps fix the U.S. dollar equivalent cash flows of these Euro denominated intercompany loans and eliminate foreign exchange variability since the notional amounts of the swaps equal that of the loans, and all cash flow dates and interest rates coincide between the swaps and the loans, therefore no ineffectiveness is expected. All cross currency swaps are recorded at fair value as either assets or liabilities. Certain of these swaps have been designated as cash flow hedges. Accordingly, for swaps designated as cash flow hedges, each period we record the change in fair value of the swaps in accumulated other comprehensive
- 46 -
Table of Contents
income, net of taxes, and reclassify an amount out of accumulated other comprehensive income to the income statement to offset the foreign currency gain or loss on the remeasurement to U.S. dollar of the Euro denominated loans that are being hedged.
If all or a portion of these swaps are de-designated as cash flow hedges, the net gain or loss in accumulated other comprehensive income at the de-designation date is deferred and recognized in earnings over the remaining term of the originally hedged transaction if it is still probable that the original hedged forecasted transaction will occur. The earnings impact of cross currency swaps that are not designated as cash flow hedges and currency forward contracts that are used to hedge foreign currency assets or liabilities, if any, are recognized in other income (expense), net during the term of the contracts. We accrue for all swaps the periodic net swap interest payments each period in the consolidated income statement. We monitor the counterparty credit risk and the continued probability of the hedged cash flows as to amount and timing.
A portion of the intercompany Euro denominated loans payable of one of our U.S. subsidiaries is designated as a hedge of our net investment in our Belgium-based subsidiary, Cytec Surface Specialties SA/NV. The portion of the remeasurement of the intercompany loan to the U.S. dollar that relates to the amount designated as a hedge of our net investment is recorded as a translation adjustment.
Commodity Price Risk: We use natural gas forwards to hedge a portion of our utility requirements at certain of our North American manufacturing facilities. These swaps, which are highly effective at achieving offsetting cash flows of the underlying natural gas purchases, have been designated as cash flow hedges and are reported on the consolidated balance sheets at fair value, with the effective portion of the hedged item included in accumulated other comprehensive income/(loss) on an after-tax basis. Gains and losses are reclassified into earnings, as a component of manufacturing cost of sales, in the period the hedged natural gas purchases affect earnings. If the derivative is no longer highly effective in achieving offsetting cash flows, subsequent changes in fair value are recorded in other income (expense), net. Any ineffectiveness is recognized in other income (expense), net in the current period. If the hedging relationship is terminated, we continue to defer the related gains or loss in accumulated other comprehensive income and include it as a component of the cost of the underlying hedged item. If the forecasted transaction is no longer likely to occur, we recognize the related gain or loss in other income (expense), net in that period. We did not terminate any hedges during 2009, 2008 and 2007. All hedged transactions that were forecasted to occur in 2009, 2008 and 2007 occurred as forecasted. Ineffectiveness during these years was insignificant. The fair values of all of these instruments are based on a readily available published index for commodity prices.
J. Environmental and Other Contingent Liabilities: Accruals for environmental remediation, maintenance and operating costs directly related to remediation, and other contingent liabilities are recorded when it is probable that a liability has been incurred and the amount of the liability can be reasonably estimated.
It is our practice to conduct an analysis of our self-insured and insured contingent liabilities annually and whenever circumstances change significantly. Included in these liabilities are workers’ compensation, product liability and toxic tort claims.
Accruals for environmental liabilities and other contingent liabilities are recorded as other liabilities with amounts expected to be paid out in the next twelve months classified as accrued expenses at undiscounted amounts.
Probable insurance recoveries for past and future indemnity costs are recorded in other receivables, to the extent collection is reasonably assured within the next twelve months, and longer term receivables are included in other assets at our best estimate of the ultimate expected receipts at undiscounted amounts. Defense and processing costs are expensed as incurred. Probable insurance recoveries for defense and processing costs are recognized only as actual costs are incurred.
In addition, we recognize the fair value of the liability for an asset retirement obligation in the period in which it is incurred if a reasonable estimate of fair value can be made. The fair value of the liability is added to the carrying amount of the associated asset and this additional carrying amount is depreciated over the life of the asset. The liability is accreted at the end of each period through charges to operating expense. If the obligation is settled for other than the carrying amount of the liability we recognize a gain or loss on settlement.
K. Income Taxes: Income taxes are accounted for under the asset and liability method. Deferred tax assets and liabilities are recognized for the future tax consequences attributable to differences between the financial statement carrying amounts of existing assets and liabilities and their respective tax basis and operating loss and tax credit carryforwards. A valuation allowance is provided
- 47 -
Table of Contents
when it is more likely than not that some portion or all of the deferred tax assets will not be realized. We measure deferred tax assets and liabilities using enacted tax rates expected to apply to taxable income in the years in which those temporary differences are expected to be recovered or settled. The effect on deferred tax assets and liabilities of a change in tax rates is recognized in earnings in the period that includes the enactment date. If repatriation of the undistributed income of our international subsidiaries and associated companies is anticipated then income taxes are provided for such earnings.
On January 1, 2007, we adopted a new accounting pronouncement which addresses the determination of whether tax benefits claimed or expected to be claimed on a tax return should be recorded in the financial statements. Under such pronouncement, we recognize the tax benefit from an uncertain tax position only if it is more likely than not that the tax position will be sustained on examination by the taxing authorities, based on the technical merits of the position. The tax benefits recognized in the financial statements from such a position are measured based on the largest benefit that has a greater than fifty percent likelihood of being realized upon settlement with the tax authorities. The pronouncement also provides guidance on derecognition, classification, interest and penalties on income taxes, accounting in interim periods and requires increased disclosures.
L. Postretirement Benefits: Costs of postretirement benefits are recognized as employees render the services necessary to earn the related benefits. In September 2006, the FASB issued a new accounting pronouncement which requires an employer that sponsors postretirement plans to recognize an asset or liability for the overfunded or underfunded status of plans. Additionally, employers are required to record all unrecognized prior service costs and credits, unrecognized actuarial gains and losses and any unrecognized transition obligations or assets in accumulated other comprehensive income. Such amounts are reclassified into earnings as components of net periodic benefit cost/income pursuant to the recognition and amortization provisions of the current applicable accounting literature. Finally, the pronouncement requires an employer to measure plan assets and benefit obligations as of the date of the employer’s statement of financial position, as opposed to at an earlier measurement date as allowed previously. Prior to 2008, we used a measurement date of November 30 when valuing our pension obligations for the majority of our non-U.S. defined benefit pension plans. The provisions of the pronouncement requiring that the measurement date be the same as the date of the statement of financial position became effective for the year ended December 31, 2008 and as a result, we changed our measurement date for certain non-U.S. defined benefit pension plans to December 31 from November 30. The pronouncement allows employers to choose one of two transition methods to adopt the measurement date requirement. We adopted the measurement date requirement in 2008 using the 13-month approach. In accordance with this approach, we recorded an additional one month of net periodic benefit cost of $0.3 net of tax in December 2008 covering the period between the previous measurement date of November 30, 2007 and December 31, 2008 as an adjustment to retained earnings. This pronouncement does not alter the basic approach to measuring plan assets, benefit obligations, or net periodic benefit cost. Except for the measurement date requirement, we adopted this pronouncement in the fourth quarter of 2006. The adoption of this pronouncement in 2008 and 2006 had no effect on our consolidated statements of income and cash flows.
M. Revenue Recognition: We recognize revenue when persuasive evidence of an arrangement exists, the selling price is fixed or determinable, collection is reasonably assured and title and risk of loss has passed to our customers. Customer rebates are estimated and recognized as a reduction of sales as such rebates are being earned.
N. Stock-Based Compensation: We recognize our share-based compensation cost in an amount equal to the fair value of share-based payments and estimate a forfeiture rate for all share-based awards. We monitor share option exercise and employee termination patterns to estimate forfeiture rates within the valuation model.
O. Use of Estimates: The preparation of financial statements in conformity with U.S. generally accepted accounting principles requires management to make estimates and assumptions. These estimates or assumptions affect the reported amounts and disclosures. For example, estimates are used when accounting for allowance for doubtful accounts, inventory valuations, useful lives of tangible and intangible assets, recoverability of goodwill, accrued expenses, environmental and other contingent liabilities, pension and other postretirement benefits, income tax valuation allowances and assumptions utilized in determining share-based compensation. Actual results could differ from these estimates. Accounting estimates require the use of judgment regarding uncertain future events and their related effects and, accordingly, may change as additional information is obtained.
- 48 -
Table of Contents
P. Reclassifications: We revised and appropriately reclassified the prior year amounts related to an immaterial misclassification of certain current and long-term deferred income tax liabilities.
2. DIVESTITURES
In the first quarter of 2009, we sold certain of our European polyurethane product line assets for cash proceeds totaling $5.7 and recognized a pre-tax gain on sale of $1.5 ($1.0 after-tax). The gain is recorded in net gain on sales of assets in the accompanying statement of income.
Also in the first quarter of 2009, we decided to sell and began negotiations to sell our polyurethane product line assets in Asia. Accordingly, we revised the estimated remaining useful life of the assets to reflect the period we expected to continue to use the assets and recognized incremental depreciation expense in the first quarter of 2009 of $1.2 which is recorded in manufacturing cost of sales. We also recorded a charge of $0.4 during the first quarter of 2009 for additional costs that were incurred as a result of this decision, which are recorded in selling and technical services. In the second quarter of 2009, we sold our polyurethane product line assets in Asia for $1.8 of which $1.2 was received in cash and $0.6 represents a promissory note from the purchaser. The net loss of $1.4 ($1.4 after-tax) resulting from this sale is recorded in net gain on sale of assets in the accompanying statements of income.
In 2006 and 2007, we completed the sale of our water treatment chemicals and acrylamide product lines to Kemira Group (“Kemira”) in three phases. The timing of the flow of funds was as follows: $208.0 ($206.6 net of associated transaction costs) was received in October 2006 for the first closing, and $21.2 was received for the second closing in January 2007. We also received $5.9 in February 2007 for a working capital adjustment from the first phase closing per the terms of the contract. During the third quarter of 2007, we received $3.1 from completed transfers of the assets at various subsidiaries in Asia/Pacific and Latin America, and $8.5 was received in the fourth quarter of 2007 in settlement of the final working capital transfers in Asia/Pacific and Latin America and for the sale of our subsidiary in Venezuela. After adjusting for environmental settlements, final net proceeds related to this transaction were $242.0 ($240.6 net of associated transaction costs).
We recorded a pre-tax gain of $75.5 related to the first phase closing in the fourth quarter of 2006, and a pre-tax gain of $13.6 in 2007 from other closings and other activities. The 2007 gain consists of a pre-tax gain of $15.7 recorded in the first quarter related to the phase two sale of the Botlek site, which includes a pre-tax gain of $13.8 resulting from the recognition of accumulated translation adjustments, and a pre-tax loss of $2.1 recorded in the fourth quarter. The fourth quarter 2007 loss included a loss on the transfer of the Venezuela subsidiary, an accrual to increase recorded environmental liabilities related to sites previously transferred to Kemira based on additional information generated by updated site evaluations, and a favorable adjustment, based on final actuarial reports, to a pension settlement loss accrued in the first quarter of 2007 related to the sale of the Botlek site.
3. RESTRUCTURING OF OPERATIONS
In accordance with our accounting policy, restructuring costs are included in our corporate unallocated operating results for segment reporting purposes consistent with management’s view of its businesses.
Aggregate restructuring charges included in the statements of income were recorded by line item as follows:
| 2009 | 2008 | 2007 | |||||||
| Manufacturing cost of sales |
$ | 68.9 | $ | 5.6 | $ | 5.7 | |||
| Selling and technical services |
4.4 | 6.6 | – | ||||||
| Research and process development |
3.2 | 1.6 | – | ||||||
| Administrative and General |
9.4 | 1.1 | 0.5 | ||||||
| Asset impairment charge |
4.3 | – | – | ||||||
| Total |
$ | 90.2 | $ | 14.9 | $ | 6.2 | |||
- 49 -
Table of Contents
Details of 2009 restructuring initiatives are as follows:
In 2009, we initiated restructuring actions across all segments and corporate functions. These actions were taken in response to the downturn in the global economy, which especially impacted the automotive, construction and general industrial markets that we serve, and led to a significant reduction in our sales and operating profitability. The following summarizes the details of the restructuring initiatives launched in 2009, which resulted in $91.9 of restructuring charges for the twelve months ended December 31, 2009.
We launched restructuring initiatives at several of our Specialty Chemical manufacturing locations, which resulted in restructuring charges totaling $70.4 of which $40.4 is associated with severance and other employee benefits and $30.0 is associated with asset write-downs and accelerated depreciation. The manufacturing locations impacted by these initiatives are as follows:
| • | Closure of our manufacturing facility in La Llagosta, Spain and transfer of the manufacturing of most of the liquid coating resins products produced at the site to our facility in Werndorf, Austria. |
| • | Transfer the manufacturing of our powder coating resins product line from Drogenbos, Belgium to our manufacturing facility in Bassano, Italy and consolidate or eliminate supply chain, sales, marketing and administrative functions at the site. |
| • | Transfer the manufacturing of certain liquid coating resins products from our Hamburg, Germany site to our facility in Werndorf, Austria and consolidate or eliminate certain manufacturing, supply chain, and administrative functions at the site. |
| • | Conversion of our manufacturing facility in Antofagasta, Chile into a blending and distribution facility to support the Mining business and eliminate manufacturing functions at the site. |
| • | Closure of our manufacturing facility in Bogota, Colombia. |
The above manufacturing restructuring initiatives include the elimination 366 positions.
We launched restructuring initiatives across our Engineered Materials segment in response to inventory destocking by parts manufacturers that supply large commercial aircraft manufacturers as well as a sharper than expected decline in business and regional jet production rates. These initiatives resulted in $4.4 of restructuring expenses for severance and employee benefits related to the elimination of 284 positions.
We launched several initiatives throughout 2009 in our Specialty Chemical segments and corporate functions across sales, marketing, manufacturing, supply chain, research and development, and administrative functions, including our initiative to establish a shared services center. These initiatives resulted in $17.1 of charges related to severance and employee benefits associated with the elimination of 393 positions.
All of the aforementioned initiatives are substantially complete as of December 31, 2009, with the exception of the shared services initiative, which is expected to be completed in waves throughout 2010 and 2011.
The remaining reserve at December 31, 2009 of $30.8 relating to 2009 restructuring initiatives is expected to be paid through 2011.
Details of 2008 restructuring initiatives are as follows:
In 2008, as a cost reduction initiative and to align our cost structure to the declining demand environment at that time, we decided to restructure certain activities of our Coating Resins segment. These initiatives resulted in restructuring charges of $11.1 for the twelve months ended December 31, 2008, which primarily relates to severance for the 93 eliminated positions. These initiatives were completed in 2008. In 2009, the remaining balance of $0.9 was reversed. All costs have been paid in full as of December 31, 2009.
Details of 2007 restructuring initiatives are as follows:
In 2007, we initiated restructuring actions across our Specialty Chemicals segments to exit several mature product lines manufactured at our Willow Island, West Virginia and Wallingford, Connecticut facilities. As a result, we recorded total restructuring charges of $7.0 in 2007 and 2008. These initiatives were completed in 2008. In 2009, the remaining balance of $0.6 was reversed. All costs have been paid in full as of December 31, 2009.
During 2009, 2008, and 2007, we also recorded a net adjustment of $(0.2), $0.8, and $2.2, respectively, related to our 2006 and prior restructuring initiatives. The remaining reserve balance as of December 31, 2009 of $0.8 related to these initiatives is expected to be paid in 2010.
- 50 -
Table of Contents
| 2007 Restructuring Initiatives |
2008 Restructuring Initiatives |
2009 Restructuring Initiatives |
Total | |||||||||||||
| 2007 charges |
$ | 4.0 | $ | – | $ | – | $ | 4.0 | ||||||||
| Cash payments |
(0.6 | ) | – | – | (0.6 | ) | ||||||||||
| Balance December 31, 2007 |
$ | 3.4 | $ | – | $ | – | $ | 3.4 | ||||||||
| 2008 charges |
3.0 | 11.1 | – | 14.1 | ||||||||||||
| Non-cash items |
(0.3 | )(1) | – | – | (0.3 | ) | ||||||||||
| Cash payments |
(4.1 | ) | (6.9 | ) | – | (11.0 | ) | |||||||||
| Currency translation adjustments |
– | 0.1 | – | 0.1 | ||||||||||||
| Balance December 31, 2008 |
$ | 2.0 | $ | 4.3 | $ | – | $ | 6.3 | ||||||||
| 2009 charges |
(0.6 | ) | (0.9 | ) | 91.9 | 90.4 | ||||||||||
| Non-cash items |
– | – | (30.6 | )(2) | (30.6 | ) | ||||||||||
| Cash payments |
(1.4 | ) | (3.3 | ) | (31.0 | ) | (35.7 | ) | ||||||||
| Currency translation adjustments |
– | (0.1 | ) | 1.3 | 1.2 | |||||||||||
| Other adjustments |
– | – | (0.8 | )(3) | (0.8 | ) | ||||||||||
| Balance December 31, 2009 |
$ | – | $ | – | $ | 30.8 | $ | 30.8 | ||||||||
| (1) | Represents a write-off of excess raw materials at the Willow Island facility. |
| (2) | Represents accelerated depreciation of plant assets and impairment of the land at our facility in La Llagosta, Spain. |
| (3) | Represents a reclass of an environmental related restructuring accrual to environmental liabilities. |
4. SHARE-BASED COMPENSATION
The fair value of each option or stock-settled share appreciation right, (“stock-settled SARS”) award is estimated on the date of grant using a binomial-lattice option valuation model. Stock-settled SARS are economically valued the same as stock options. The binomial-lattice model takes into account variables such as volatility, dividend yield, and risk-free interest rate. In addition, the binomial-lattice model considers the contractual term of the option, the probability that the option will be exercised prior to the end of its contractual life, and the probability of termination or retirement of the option holder in computing the value of the option. The weighted average assumptions for the years ended December 31, 2009, 2008 and 2007 are noted in the following table:
| 2009 | 2008 | 2007 | ||||||||||
| Expected life (years) |
6.7 | 6.6 | 6.2 | |||||||||
| Expected volatility |
48.2 | % | 31.0 | % | 27.2 | % | ||||||
| Expected dividend yield |
2.23 | % | 0.76 | % | 0.69 | % | ||||||
| Range of risk-free interest rate |
0.1% - 2.7 | % | 2.1% - 3.7 | % | 4.8% - 5.2 | % | ||||||
| Weighted-average fair value per option |
$ | 8.63 | $ | 17.65 | $ | 19.50 | ||||||
The expected life of options granted is derived from the output of the option valuation model and represents the period of time that options granted are expected to be outstanding. Expected volatilities are based on the combination of implied market volatility and our historical volatility. The risk-free rate for periods within the contractual life of the option is based on the U.S. Treasury yield curve in effect at the time of grant. As share-based compensation recognized in the consolidated statement of income is based on awards ultimately expected to vest, we incorporate the probability of pre-vesting forfeiture in determining the number of expected vested options. The forfeiture rate is based on the historical forfeiture experience and prospective actuarial analysis.
STOCK AWARD AND INCENTIVE PLAN:
The 1993 Stock Award and Incentive Plan (the “1993 Plan”) provides for grants of a variety of awards, such as stock options (including incentive stock options and nonqualified stock options), non-vested stock (including performance stock), SARS (including those settled with common shares) and deferred stock awards and dividend equivalents. At December 31, 2009, there are approximately 6,700,000 shares reserved for issuance under the 1993 Plan.
We have utilized the stock option component of the 1993 Plan to provide for the granting of nonqualified stock options and stock-settled SARS with an exercise price at 100% of the market price on the
- 51 -
Table of Contents
date of the grant. Options and stock-settled SARS are generally exercisable in installments of one-third per year commencing one year after the date of grant and annually thereafter, with contract lives of generally 10 years from the date of grant.
A summary of stock options and stock-settled SARS activity for the year ended December 31, 2009 is presented below.
| Options and Stock-Settled SARS Activity: | Number of Units |
Weighted Average Exercise Price Per Unit |
Weighted Average Remaining Contractual Life (Years) |
Aggregate Intrinsic Value | |||||||
| Outstanding at January 1, 2009 |
3,644,108 | $ | 41.22 | ||||||||
| Granted |
670,047 | 22.53 | |||||||||
| Exercised |
(312,609 | ) | 23.65 | ||||||||
| Forfeited |
(167,496 | ) | 34.66 | ||||||||
| Outstanding at December 31, 2009 |
3,834,050 | $ | 39.67 | 5.6 | $ | 17.2 | |||||
| Exercisable at December 31, 2009 |
2,728,796 | $ | 40.97 | 4.4 | $ | 8.6 | |||||
| Nonvested Options and Stock-Settled SARS: | Number of Units |
Weighted Average Grant Date Fair Value Per Unit | ||||
| Nonvested at January 1, 2009 |
1,048,669 | $ | 18.47 | |||
| Granted |
670,047 | 8.63 | ||||
| Vested |
(520,800 | ) | 18.70 | |||
| Forfeited |
(92,662 | ) | 13.26 | |||
| Nonvested at December 31, 2009 |
1,105,254 | $ | 12.84 | |||
During the year ended December 31, 2009, we granted 670,047 stock options. The weighted-average grant-date fair value of stock options and the stock-settled SARS granted during the years ended December 31, 2009, 2008, and 2007 was $8.63, $17.65, and $19.50 per share, respectively. Total pre-tax compensation cost related to stock option and stock-settled SARS was $6.6, $9.1, and $11.6 during the years ended December 31, 2009, 2008, and 2007, respectively. The total intrinsic value of stock options and stock-settled SARS exercised during the years ended December 31, 2009, 2008, and 2007 was $3.0, $10.8, and $33.9, respectively. Treasury shares have been utilized and reissued upon stock option and stock-settled SARS exercises. The total fair value of stock options and stock-settled SARS vested during the years ended December 31, 2009, 2008, and 2007 was approximately $9.7, $9.5, and $9.1, respectively.
As of December 31, 2009, there was approximately $5.7 of total unrecognized compensation cost related to stock options and stock-settled SARS. That cost is expected to be recognized over a weighted-average period of 1.3 years as the majority of our awards vest over three years. Compensation cost related to stock options and stock-settled SARS capitalized in inventory as of December 31, 2009 and 2008 was approximately $0.2 and $0.5, respectively.
Total tax benefits realized from share-based awards was $2.0, $3.9 and $12.3, for the years ended December 31, 2009, 2008 and 2007, respectively. Cash received from stock options exercised was $7.4, $11.2, and $39.3 for the years ended December 31, 2009, 2008, and 2007, respectively. As mentioned previously, our 1993 Plan also provides for the granting of cash-settled SARS, which were granted during 2004 and 2005. Cash-settled SARS are liability-classified awards. Intrinsic value and cash used to settle cash-settled SARS was $0.0, $0.1 and $0.9 for the years ended December 31, 2009, 2008, and 2007, respectively. Cash-settled SARS are exercisable in installments of one-third per year commencing one year after the date of grant and annually thereafter, with contractual lives of ten years from the date of grant. The total amount of before-tax expense/(income) recognized for cash-settled SARS was $1.1, $(3.7), and $1.0 for the years ended December 31, 2009, 2008 and 2007, respectively. The liability related to our cash-settled SARS was $1.7 and $0.6 at December 31, 2009 and 2008, respectively.
As provided under the 1993 Plan, we have also issued non-vested stock and performance stock. Non-vested stock is subject to certain restrictions on ownership and transferability that lapse upon vesting. Performance stock payouts are based on the attainment of certain financial performance objectives and may vary depending on the degree
- 52 -
Table of Contents
to which the performance objectives are met. We did not grant any performance stock in 2007 and 2009. During 2008, we granted performance stock awards for 47,927 shares (assuming par payout) to nine employees, which relate to the 2010 performance period. During 2009, we granted 38,380 shares of non-vested stock to ten directors, which generally vest on the third anniversary of the date of grant. The weighted average fair value of the non-vested stock on the date of grant was $18.24 per share which was equal to the closing market price of our stock on the date of the grant. The total amount of share-based compensation expense recognized for non-vested and performance stock was $0.7, $0.6, and $1.0 for the years ended December 31, 2009, 2008 and 2007, respectively.
In the event of a “change of control” (as defined in the 1993 Plan and interpreted in accordance with the American Jobs Creation Act of 2004), (i) any award under the 1993 Plan carrying a right to exercise that was not previously exercisable and vested will become fully exercisable and vested, (ii) the restrictions, deferral limitations, payment conditions and forfeitures applicable to any other award granted under the 1993 Plan will lapse and such awards will be deemed fully vested and (iii) any performance conditions imposed with respect to awards shall be deemed to be fully achieved.
As of December 31, 2009 and December 31, 2008, our additional paid-in capital pool (“APIC Pool”) which represents excess tax benefits available to absorb potential future tax deficiencies was $69.9 and $69.9, respectively.
5. EARNINGS PER SHARE (EPS)
Basic (loss)/earnings per common share excludes dilution and is computed by dividing net (loss)/earnings available to common stockholders by the weighted-average number of common shares outstanding (which includes shares outstanding, less performance and non-vested shares for which vesting criteria have not been met) plus deferred stock awards, weighted for the period outstanding. Diluted earnings per common share is computed by dividing net earnings available to common stockholders by the sum of the weighted-average number of common shares outstanding for the period adjusted (i.e., increased) for all additional common shares that would have been outstanding if potentially dilutive common shares had been issued and any proceeds of the issuance had been used to repurchase common stock at the average market price during the period. The proceeds are assumed to be the sum of the amount to be paid to the Company upon exercise of options, the amount of compensation cost attributed to future services and not yet recognized, and the amount of income taxes that would be credited to or deducted from capital upon exercise.
The following shows the reconciliation of weighted-average shares:
| December 31, | 2009 | 2008 | 2007 | |||
| Weighted average shares outstanding |
48,306,893 | 47,800,244 | 48,149,792 | |||
| Effect of dilutive shares: |
||||||
| Options and stock-settled SARS |
– | – | 1,048,636 | |||
| Non-vested shares |
– | – | 26,503 | |||
| Adjusted average shares outstanding |
48,306,893 | 47,800,244 | 49,224,931 |
Since the results for the years ended December 31, 2009 and 2008 were losses, all per share calculations are performed using the same denominator, as the loss available to common stockholders renders all potential common shares anti-dilutive. Outstanding stock options to purchase 751,211 shares, 2,165,890 shares and 35,068 shares of common stock at December 31, 2009, 2008 and 2007, respectively, were excluded from the above calculation because their inclusion would have had an anti-dilutive effect on earnings per share. In addition, 1,432,148 units, 1,477,637 units, and 504,022 units of outstanding stock-settled SARS at December 31, 2009, 2008 and 2007 respectively, were excluded from the above calculation due to their anti-dilutive effect on earnings per share.
6. DERIVATIVE FINANCIAL INSTRUMENTS AND CERTAIN HEDGING ACTIVITIES
The following information regarding derivative instruments and hedging activities incorporates additional disclosure as required by an amendment issued by the FASB to existing standards as adopted on January 1, 2009. As a result of the amendment, additional disclosures are included below specifying (a) how and why the company uses derivative instruments, (b) the accounting for derivative instruments and related hedged items, and (c) how derivative instruments and related hedged items affect the company’s financial position, financial performance and cash flow.
- 53 -
Table of Contents
FOREIGN CURRENCY DERIVATIVE AND HEDGING ACTIVITIES
We periodically enter into currency forward contracts primarily to hedge currency fluctuations of transactions denominated in currencies other than the functional currency of the respective entity. At December 31, 2009, the principal transactions hedged involved accounts receivable and accounts payable. When hedging currency exposures, our practice is to economically hedge such exposures with forward contracts denominated in the same currency and with similar critical terms as the underlying exposure, and therefore, the instruments are effective at generating offsetting changes in the fair value, cash flows or future earnings of the hedged item or transaction. The fair values of forward contracts are calculated each period. These forward contracts are not defined as hedging instruments and therefore, all changes in fair values are reported in other (expense)/income, net.
At December 31, 2009, net contractual amounts of forward contracts outstanding translated into U. S. dollar (“USD”) amounts of $164.5. Of this total, $147.5 was attributed to the exposure in forward selling/purchase of USD. The remaining $17.0 was attributable to the exposure in forward selling/purchase of Euros, translated into USD equivalent amounts. The net favorable/(unfavorable) fair values of currency contracts, based on forward exchange rates at December 31, 2009 and 2008 were $0.5 and $(5.4), respectively.
At December 31, 2009 and 2008, the currency and net notional amounts of forward contracts outstanding translated into U.S. dollar equivalent amounts were as follows:
| December 31, 2009 |
Buy | ||||||||||||||||||||
| Sell | U.S. Dollar | Euro | Pound Sterling |
Australian Dollar |
Canadian Dollar |
Chilean Peso |
Others | ||||||||||||||
| U.S. Dollar |
– | $ | 44.0 | $ | 9.9 | $ | 21.8 | $ | 43.4 | $ | 6.9 | $ | 2.3 | ||||||||
| Pound Sterling |
– | $ | 5.7 | – | – | – | – | – | |||||||||||||
| Canadian Dollar |
– | $ | 5.0 | – | – | – | – | – | |||||||||||||
| Brazilian Real |
$ | 4.5 | – | – | – | – | – | – | |||||||||||||
| Norwegian Krone |
– | $ | 5.1 | – | – | – | – | – | |||||||||||||
| Taiwan Dollar |
$ | 6.8 | – | – | – | – | – | – | |||||||||||||
| Korean Won |
$ | 5.9 | – | – | – | – | – | – | |||||||||||||
| Others |
$ | 2.0 | $ | 1.2 | – | – | – | – | – | ||||||||||||
| December 31, 2008 |
Buy | |||||||||||||||||
| Sell | U.S. Dollar | Euro | Pound Sterling |
Australian Dollar |
Canadian Dollar |
Others | ||||||||||||
| U.S. Dollar |
– | $ | 26.5 | $ | 8.0 | $ | 16.2 | $ | 41.0 | $ | 5.6 | |||||||
| Pound Sterling |
– | $ | 1.7 | – | – | – | – | |||||||||||
| Chinese Yuan |
$ | 5.0 | – | – | – | – | – | |||||||||||
| Brazilian Real |
$ | 16.9 | – | – | – | – | – | |||||||||||
| Norwegian Krone |
– | $ | 5.2 | – | – | – | – | |||||||||||
| Taiwan Dollar |
$ | 6.7 | – | – | – | – | – | |||||||||||
| Korean Won |
$ | 6.8 | – | – | – | – | – | |||||||||||
| Others |
$ | 4.4 | $ | 1.3 | – | – | – | $ | 1.1 | |||||||||
We use cross currency swaps to hedge the changes in the cash flows of certain Euro denominated intercompany loans receivable (“Euro loans”) held by U.S. entities. The loan amounts are €207.9 and €207.9 due October 1, 2010 and October 1, 2015, respectively. Since the loans are denominated in Euros, we have foreign exchange exposure upon remeasurement to USD. We originally hedged this foreign exchange exposure by entering into two cross currency swaps each with notional amounts of €207.9 ($250.0) that settle on October 1, 2010 (“five year swaps”) and October 1, 2015 (“ten year swaps”), respectively. At the initial principal exchange, we paid $500.0 and received € 415.8 from counterparties. At the final exchanges we will pay €207.9 and receive $250.0 on October 1, 2010 and October 1, 2015. The swaps have fixed interest rates on both legs. On the five year swaps, we pay 3.78% interest per annum on the Euro notional amount and we receive 5.5% interest per annum on the USD notional amount. On the ten year swaps, we pay 4.52% interest per annum on the Euro notional amount and we receive 6.0% interest per annum on the USD notional amount. The interest payment dates (April 1 and October 1) and Euro rates coincide with the Euro loans.
- 54 -
Table of Contents
The five and ten year swaps fix the U.S. dollar equivalent cash flows of the Euro loans and eliminate foreign exchange variability since the notional amounts of the swaps equal that of the loans, and all cash flow dates and interest rates coincide between the swaps and the loans, therefore no ineffectiveness is expected. At inception, the five and ten year swaps were designated as cash flow hedges of the Euro loans. In November 2008, the five year swaps were de-designated as cash flow hedges, due to our decision to execute new off-setting cross currency swaps (“two year swaps”) to lock-in the Euro forward exchange rate for the principal exchange on the five year swaps due on October 1, 2010. A net after-tax credit of $5.5 remained in other comprehensive income on the de-designation date representing the unrealized gain associated with the five year swaps. As it is probable that the original hedged forecasted transaction will occur, this $5.5 of unrealized gains is being reclassified into earnings on a straight line basis over the remaining life of the previously hedged transaction, which was 23 months as of the de-designation date. The remaining amount of other comprehensive income at December 31, 2009 which will be amortized to income in the future is $2.2, all of which will be amortized over the next 9 months.
The two year swaps cover an identical notional amount of €207.9 and also call for a semi-annual exchange of fixed Euro interest receipts for fixed USD interest payments. With respect to the two year swaps, we will receive 3.78% per annum on the Euro notional amount and will pay 3.69% per annum on the USD notional amount on each April 1 and October 1, through the maturity date of the two year swaps, which is also on October 1, 2010. The two year swaps are not designated as cash flow hedges, therefore all changes in fair value are reported in interest expense, net, and other income/(expense), net.
All cross currency swaps are recorded at fair value as either assets or liabilities. We accrue the periodic net swap interest payments due each period in the consolidated income statement. Each period we record the change in the fair value of the ten year swaps in accumulated other comprehensive income. For the ten year swaps, we reclassify an amount out of accumulated other comprehensive income to the income statement to offset the foreign currency gain or loss on the remeasurement to USD of the Euro intercompany loans. The amount of such reclassification will depend on changes in the USD/Euro exchange rate occurring during the period. We accounted for the five year swaps in this manner until de-designation as cash flow hedges in November 2008. The fair value of the two year swaps and prospectively, upon de-designation, the five year swaps, is calculated each period with changes in fair value reported in interest expense, net, and other (expense)/income, net. We expect the earnings impact related to future changes in the fair value of the two year swaps to substantially offset the earnings impact related to future changes in the fair value of the five year swaps. We monitor the counterparty credit risk and the continued probability of the hedged cash flows as to amount and timing.
At December 31, 2009, the favorable/(unfavorable) fair values of the two, five, and ten year swaps were $34.8, $(44.7), and $(41.6), respectively, and at December 31, 2008, the favorable/(unfavorable) fair values of the two, five, and ten year swaps were $24.9, $(30.5), and $(4.6), respectively.
COMMODITY DERIVATIVE AND HEDGING ACTIVITIES
We purchase natural gas for utility consumption at our manufacturing facilities and therefore, our overall profitability and operating cash flows are exposed to the variability in the market price. To partially eliminate this variability, we use natural gas forward purchase contracts to hedge a portion of our utility requirements at certain of our North American manufacturing facilities. These forward contracts, which are highly effective at achieving offsetting cash flows of the underlying natural gas purchases, have been designated as cash flow hedges of our forecasted natural gas purchases and are reported on the consolidated balance sheets at fair value in other assets/liabilities, with the effective portion of the fair value of the forward contract included in accumulated other comprehensive income/(loss) on an after-tax basis. Any ineffectiveness, which represents the amount by which the cumulative change in the cash flows of the forward contract is not completely offset by the cumulative change in the cash flows of the hedged transaction is recognized in other (expense)/income, net in the current period. During the years ended December 31, 2009 and 2008 there were no significant gains or losses reported in earnings for ineffectiveness. Gains and losses are reclassified into earnings, as a component of manufacturing cost of sales, in the period the hedged natural gas purchases affect earnings. If the derivative is no longer highly effective in achieving offsetting cash flows, subsequent changes in fair value are recorded in other (expense)/income, net. If the hedging relationship is terminated and the originally hedged transaction remains probable of occurring, the unrealized gain or loss associated with forward contract remains in accumulated other comprehensive income and is recognized in
- 55 -
Table of Contents
earnings as a component of cost of sales in the period the originally hedged natural gas purchase affects earnings. If the forecasted transaction is no longer probable of occurring we recognize the related gain or loss in other (expense)/income, net in that period.
Generally, short-term (one to three months) natural gas usage requirements are hedged up to 90% with a gradual decrease to 10% for the natural gas requirements extending out to twelve months. At December 31, 2009, we held natural gas forwards to purchase 3,020,000 MMBtu of gas with a favorable fair value of $0.3 included in other current assets, which will be reclassified into Manufacturing Cost of Sales through December 2010 as the hedged natural gas purchases affect earnings.
At December 31, 2009, we did not have derivative instruments that contained credit-related-risk contingent features or provisions that would trigger immediate settlement or require us to post collateral to our counterparties. Also as of December 31, 2009, we did not have any significant concentration of credit risk arising from our derivative instruments.
NET INVESTMENT HEDGE ACTIVITIES
The value of one of our U.S. subsidiaries’ net investment in our Belgium-based subsidiary, Cytec Surface Specialties SA/NV (our largest Euro functional currency subsidiary), is affected by foreign exchange movements in the U.S. dollar value of the Euro. To hedge this foreign currency exposure inherent in a net investment in such foreign operation, a portion of the intercompany Euro denominated loans payable of one of our U.S. subsidiaries is designated as a hedge of our net investment in Cytec Surface Specialties SA/NV. The portion of the remeasurement of the intercompany loan to the U.S. dollar that relates to the amount designated as a hedge of our net investment is recorded as a translation adjustment within accumulated other comprehensive income (loss)/gain. From time to time we also enter into designated forward Euro contracts to adjust the amount of the net investment hedge. At December 31, 2009, we had no designated forward contracts. For the years ended December 31, 2009 and 2008, ($2.3) and $26.8, net of tax, respectively, related to remeasurement of intercompany loans designated as a net investment hedge was recorded as a translation adjustment within accumulated other comprehensive income (loss)/gain, respectively.
- 56 -
Table of Contents
Following is a summary of the impact of derivative instruments on our consolidated balance sheets and statements of income:
| Asset Derivatives |
Liability Derivatives | |||||||||||||||||||
| December 31, 2009 |
December 31, 2008 |
December 31, 2009 |
December 31, 2008 | |||||||||||||||||
| Balance Sheet Location |
Fair Value |
Balance Sheet Location |
Fair Value |
Balance Sheet Location |
Fair Value |
Balance Sheet Location |
Fair Value | |||||||||||||
| Derivatives designated as hedging instruments: |
||||||||||||||||||||
| Natural Gas Forwards |
Other current assets | $ | 0.3 | Accrued expenses | $ | 11.3 | ||||||||||||||
| Cross currency swaps(1) |
Other current assets | 0.4 | Accrued expenses | $ | 0.4 | Other noncurrent liabilities | $ | 42.0 | Other noncurrent liabilities | 5.0 | ||||||||||
| Total derivatives designated as hedging instruments: |
$ | 0.7 | $ | 0.4 | $ | 42.0 | $ | 16.3 | ||||||||||||
| Derivatives not designated as hedging instruments: |
||||||||||||||||||||
| Cross currency swaps(2) |
Currency swap receivable | $ | 34.4 | Accrued expenses | $ | 0.6 | Currency swap payable | $ | 45.3 | |||||||||||
| Other current assets |
1.0 | Other assets | 24.9 | Other noncurrent liabilities | $ | 31.1 | ||||||||||||||
| Foreign currency forwards |
Other current assets | 2.4 | Other current assets | 1.8 | Accrued expenses | 1.9 | Accrued expenses | 7.2 | ||||||||||||
| Total derivatives not designated as hedging instruments: |
$ | 37.8 | $ | 27.3 | $ | 47.2 | $ | 38.3 | ||||||||||||
| Total derivatives |
$ | 38.5 | $ | 27.7 | $ | 89.2 | $ | 54.6 | ||||||||||||
- 57 -
Table of Contents
| Amount of Gain or (Loss) Recognized in OCI on Derivative (Effective Portion), Net of Tax |
Location of Gain or (Loss) Recognized from Accumulated OCI into Income (Effective Portion) |
Amount of Gain or (Loss) Reclassified from Accumulated OCI into Income (Effective Portion) |
Location of Gain or (Loss) Recognized in Income on Derivative (Ineffective Portion and Amount Excluded from Effectiveness Testing) |
Amount of Gain or (Loss) Recognized in Income on Derivative (Ineffective Portion and Amount Excluded from Effectiveness Testing) | ||||||||||||||||||
| Year Ended December 31 |
Year Ended December 31 |
Year Ended December 31 | ||||||||||||||||||||
| 2009 | 2008 | 2009 | 2008 | 2009 | 2008 | |||||||||||||||||
| Derivatives in Cash Flow Hedging Relationships: | ||||||||||||||||||||||
| Natural Gas Forwards |
$ | (4.7) | $ | (9.7) | Manufacturing cost of sales |
$ | (23.1) | $ | (2.0) | Other (expense) income, net |
$ | – | $ | 0.1 | ||||||||
| Cross currency swaps(3) |
(22.7) | 38.2 | Other (expense) income, net |
(5.6) | 56.1 | |||||||||||||||||
| Total |
$ | (27.4) | $ | 28.5 | $ | (28.7) | $ | 54.1 | $ | – | $ | 0.1 | ||||||||||
| Location of Gain or (Loss) |
Amount of Gain or (Loss) Recognized in Income on Derivative |
|||||||||
| Year Ended December 31 | ||||||||||
| 2009 | 2008 | |||||||||
| Derivatives not Designated as Hedging Instruments: | ||||||||||
| Foreign currency forwards |
Other (expense) income, net | $ | 18.8 | $ | (18.2 | ) | ||||
| Cross currency swaps(2) |
Other (expense) income, net | (4.4 | ) | (1.5 | ) | |||||
| Cross currency swaps(2) |
Interest expense, net | 4.0 | 0.7 | |||||||
| Cross currency swaps(4) |
Interest expense, net | 4.8 | 0.7 | |||||||
| Total |
$ | 23.2 | $ | (18.3 | ) | |||||
| (1) | Ten year swap. |
| (2) | Two and five year swaps. |
| (3) | Ten year swap for 2009. Five and ten year swaps for the first ten months of 2008 and ten year swap only for the last two months of 2008. |
| (4) | Represents OCI amortization of five year cross currency swaps, which was de-designated as a cash flow hedge in November 2008. |
FAIR VALUE MEASUREMENTS
On January 1, 2008 we adopted a new accounting standard regarding fair value measurements for financial assets and liabilities, as well as for any other assets and liabilities that are carried at fair value on a recurring basis in the financial statements. The FASB issued a one-year deferral of the new fair value measurement requirements for non-financial assets and liabilities that are not required or permitted to be measured at fair value on a recurring basis at the time of issuance and accordingly, we adopted the remainder of the new standard on January 1, 2009. Included among our non-financial assets and liabilities that are not required to be measured at fair value on a recurring basis are plant, equipment and facilities, goodwill, acquisition intangibles, and asset retirement obligations. As a result of the adoption, we are required to determine the appropriate level in the fair value hierarchy for each fair value measurement. The fair value hierarchy prioritizes the inputs, which refer broadly to assumptions market participants would use in pricing an asset or liability, into three levels. It gives the highest priority to quoted prices in active markets for identical assets or liabilities and the lowest priority to unobservable inputs. The level in the fair value hierarchy within which a fair value measurement in its entirety falls is determined based on the lowest level input that is significant to the fair value measurement in its entirety. Level 1 inputs are quoted prices (unadjusted) in active markets for identical assets or liabilities that we have the ability to access at the measurement date. Level 2 inputs are inputs other than quoted prices within Level 1
- 58 -
Table of Contents
that are observable for the asset or liability, either directly or indirectly, such as quoted prices for similar assets or liabilities in active markets, interest rates, exchange rates, and yield curves observable at commonly quoted intervals. Level 3 inputs are unobservable inputs for the asset or liability.
All of our derivatives are valued based on Level 2 inputs. Our gas forwards and currency forwards are valued based on readily available published indices for commodity prices and currency exchange rates. Our cross currency swaps are valued using an income approach based on industry-standard techniques. This model includes a discounted cash flow analysis that nets the discounted future cash receipts and the discounted expected cash payments resulting from the swap. The analysis is based on the contractual terms of the swaps including the period to maturity and observable market-based inputs that include time value, interest rate curves, foreign exchange rates, implied volatilities, as well as other relevant economic measures. We incorporate credit valuation adjustments to appropriately reflect both our own nonperformance risk and the counterparty’s nonperformance risk in the fair value measurements.
Although we have determined that the majority of the inputs used to value our derivatives fall within Level 2 of the fair value hierarchy, the credit valuation adjustments associated with our derivatives utilize Level 3 inputs, such as estimates of current credit spreads, to evaluate the likelihood of default by us and our counterparties. However, as of December 31, 2009, we have determined that the credit valuation adjustments are not significant to the overall valuation of our derivatives. As a result, we have determined that our derivative valuations in their entirety are classified in Level 2 of the fair value hierarchy.
A summary of the fair value measurements for each major category of derivatives at December 31, 2009 is outlined in the table below:
| Description | Significant Other Observable Inputs (Level 2) |
|||
| Currency forwards |
$ | 0.5 | ||
| Cross currency swaps |
(51.5 | ) | ||
| Natural gas forwards |
0.3 | |||
| Total |
$ | (50.7 | ) | |
As of December 31, 2009, we did not have any non-financial assets and liabilities that are carried at fair value on a recurring basis in the financial statements or for which a fair value measurement was required for the year ended December 31, 2009.
7. INVENTORIES
Inventories consisted of the following:
| December 31, | 2009 | 2008 | ||||
| Finished goods |
$ | 234.8 | $ | 404.7 | ||
| Work in progress |
33.6 | 40.8 | ||||
| Raw materials and supplies |
83.5 | 123.9 | ||||
| Total inventories |
$ | 351.9 | $ | 569.4 | ||
8. PLANTS, EQUIPMENT AND FACILITIES
| December 31, | 2009 | 2008 | ||||
| Land and land improvements |
$ | 91.6 | $ | 88.4 | ||
| Buildings |
329.5 | 324.5 | ||||
| Machinery and equipment |
1,653.8 | 1,570.7 | ||||
| Construction in progress |
235.1 | 152.5 | ||||
| Plants, equipment and facilities, at cost |
$ | 2,310.0 | $ | 2,136.1 | ||
The average composite depreciation rates utilized in the U.S. and Canada, expressed as a percentage of the average depreciable property in service, were 4.6% in 2009, 4.5% in 2008, and 4.6% in 2007. Gross cost of the assets depreciated under the composite method in the U.S. and Canada totaled $1,260.7 and $1,232.3 as of December 31, 2009 and 2008, respectively. Depreciation is calculated using the straight line depreciation method for assets at the remainder of our locations.
Following are the depreciable lives for our assets under the composite and straight-line methods:
| Category | Composite Depreciation |
Straight-line Depreciation | ||
| Buildings |
31 years | 20 - 33 years | ||
| Machinery and equipment |
5 - 18 years | 3 - 15 years |
- 59 -
Table of Contents
9. GOODWILL AND OTHER ACQUISITION INTANGIBLES
Following are the changes in goodwill by segment.
| Coating Resins |
Additive Technologies |
In Process Separation |
Engineered Materials |
Total | ||||||||||||||||
| Balance, December 31, 2007: |
||||||||||||||||||||
| Goodwill |
$ | 773.5 | $ | 20.9 | $ | 52.9 | $ | 257.5 | $ | 1,104.8 | ||||||||||
| Purchase adjustment(1) |
3.3 | – | – | – | 3.3 | |||||||||||||||
| Currency exchange |
(24.0 | ) | (1.3 | ) | (3.2 | ) | (0.9 | ) | (29.4 | ) | ||||||||||
| Impairment charge |
(385.0 | ) | – | – | – | (385.0 | ) | |||||||||||||
| Balance, December 31, 2008: |
||||||||||||||||||||
| Goodwill |
752.8 | 19.6 | 49.7 | 256.6 | 1,078.7 | |||||||||||||||
| Accumulated impairment charges |
(385.0 | ) | – | – | – | (385.0 | ) | |||||||||||||
| $ | 367.8 | $ | 19.6 | $ | 49.7 | $ | 256.6 | $ | 693.7 | |||||||||||
| Purchase adjustment(1) |
(1.2 | ) | – | – | – | (1.2 | ) | |||||||||||||
| Currency exchange |
5.7 | – | 3.5 | 0.2 | 9.4 | |||||||||||||||
| Balance, December 31, 2009: |
||||||||||||||||||||
| Goodwill |
757.3 | 19.6 | 53.2 | 256.8 | 1,086.9 | |||||||||||||||
| Accumulated impairment charges |
(385.0 | ) | – | – | – | (385.0 | ) | |||||||||||||
| $ | 372.3 | $ | 19.6 | $ | 53.2 | $ | 256.8 | $ | 701.9 | |||||||||||
| (1) | Reflects adjustments to acquired deferred taxes. |
In conjunction with our segment realignment discussed in Note 16, we completed a goodwill impairment test in the second quarter of 2009 and concluded that no impairment existed at that time. In the fourth quarter of 2009, we completed our required annual impairment test and again concluded that there was no impairment.
When performing our annual goodwill impairment test in the fourth quarter of 2008, due to the adverse impact that the then current macroeconomic conditions had on forecasted volume growth in our former Surface Specialties reporting unit (which now substantially comprises our Coating Resins reporting unit) and the resulting reduced profitability of certain product lines, we concluded that the goodwill of our former Surface Specialties reporting unit was impaired. We calculated the fair value of our former Surface Specialties reporting unit using a discounted cash flow analysis which resulted in a fair value of $1,159. The discounted cash flow fair value of the reporting unit was less than its carrying value, indicating an impairment existed. The discounted cash flow approach considered a weighted average cost of capital (“WACC”) rate of 11.5% as the discount rate and estimated net cash flow projections for a ten-year period from 2009 to 2018. The WACC calculation considered a risk-free rate of return, cost of debt and expected equity premiums. The costs of equity and debt were weighted based on the observed capital structures of companies with characteristics similar to our former Surface Specialties reporting unit. A terminal value that assumes 2018 net cash flows will continue to grow at a rate of 2.75% in perpetuity was assumed. We believe the terminal value long-term growth rate of 2.75% is reasonable for this business. These evaluations involve amounts that are based on management’s best estimates and judgments.
The discounted cash flows were based on a ten year projection, covering 2009 through 2018. The 2009 to 2012 projections took into account macroeconomic conditions and reflected management’s best estimate of the amount of time required before the business would recover from the recessionary environment.
Since the fair value of our former Surface Specialties reporting unit was less than the carrying value of the business, we allocated the fair value of our former Surface Specialties reporting unit to all of the identifiable tangible and intangible assets and liabilities of the reporting unit. The results of the allocation of total fair value to all assets and liabilities resulted in an implied fair value of goodwill of $322.0. The difference of $385.0 between the carrying value of goodwill of $707.0 and the implied fair value of goodwill of $322.0 represents the impairment charge recorded in the fourth quarter of 2008.
The goodwill impairment charge is included in 2008 operating expenses in the accompanying consolidated statements of income and is included in the 2008 results of our Coating Resins segment.
- 60 -
Table of Contents
Other acquisition intangibles consisted of the following major classes:
| Weighted Average Useful Life (years) |
Gross Carrying Value |
Accumulated Amortization |
Net Carrying Value | |||||||||||||||||||
| December 31, | 2009 | 2009 | 2008 | 2009 | 2008 | 2009 | 2008 | |||||||||||||||
| Technology-based |
15.1 | $ | 55.9 | $ | 52.7 | $ | (32.3 | ) | $ | (26.6 | ) | $ | 23.6 | $ | 26.1 | |||||||
| Marketing-related |
< 2.0 | 2.1 | 2.0 | (2.1 | ) | (2.0 | ) | – | – | |||||||||||||
| Marketing-related |
15.4 | 65.0 | 63.9 | (25.6 | ) | (21.0 | ) | 39.4 | 42.9 | |||||||||||||
| Marketing-related |
40 | 47.5 | 46.7 | (4.2 | ) | (2.9 | ) | 43.3 | 43.8 | |||||||||||||
| Customer-related |
15 | 443.8 | 436.8 | (150.6 | ) | (118.8 | ) | 293.2 | 318.0 | |||||||||||||
| Total |
$ | 614.3 | $ | 602.1 | $ | (214.8 | ) | $ | (171.3 | ) | $ | 399.5 | $ | 430.8 | ||||||||
Amortization of acquisition intangibles for the years ended December 31, 2009, 2008, and 2007 was $38.2, $39.6, and $38.7, respectively. Assuming no change in the gross carrying amount of acquisition intangibles and the 2009 average currency exchange rates remain constant, the estimated future amortization expense for the next five years are as follows:
| 2010 | 2011 | 2012 | 2013 | 2014 | |||||||||||
| Intangibles Amortization Expense |
$ | 38.1 | $ | 38.1 | $ | 37.9 | $ | 37.3 | $ | 36.9 | |||||
10. DEBT
Long-term debt, including the current portion, consisted of the following:
| December 31, | ||||||||||||||||
| 2009 | 2008 | |||||||||||||||
| Face | Carrying Value |
Face | Carrying Value |
|||||||||||||
| Five-Year Revolving Credit Line Due June 2012 |
$ | – | $ | – | $ | 114.0 | $ | 114.0 | ||||||||
| 5.5% Notes Due October 1, 2010 |
15.4 | 15.4 | 250.0 | 249.9 | ||||||||||||
| 4.6% Notes Due July 1, 2013 |
157.2 | 157.8 | 189.1 | 190.0 | ||||||||||||
| 6.0% Notes Due October 1, 2015 |
250.0 | 249.6 | 250.0 | 249.5 | ||||||||||||
| 8.95% Notes Due July 1, 2017 |
250.0 | 249.4 | – | – | ||||||||||||
| Other |
2.9 | 2.9 | 4.4 | 4.4 | ||||||||||||
| $ | 675.5 | $ | 675.1 | $ | 807.5 | $ | 807.8 | |||||||||
| Less: Current maturities |
(16.7 | ) | (16.7 | ) | (1.4 | ) | (1.4 | ) | ||||||||
| Long-term Debt |
$ | 658.8 | $ | 658.4 | $ | 806.1 | $ | 806.4 | ||||||||
DEBT OFFERING
On July 6, 2009 we sold $250.0 aggregate principal amount of 8.95% senior unsecured notes due July 1, 2017, which resulted in $247.7 in net proceeds after original issue discount and underwriting fees. In addition, on June 30, 2009, we commenced offers to purchase our 5.5% notes due October 1, 2010 and our 4.6% notes due July 1, 2013. In July 2009, we applied the net proceeds from the issuance of the 8.95% notes and corporate cash to repurchase $234.6 principal amount of our 5.5% notes due October 1, 2010 for a purchase price of $242.8 plus accrued interest of $3.7 and $15.4 principal amount of our 4.6 % notes due July 1, 2013 for a purchase price of $14.6 plus accrued interest of $0.1. The repurchase of the 5.5% and 4.6% notes resulted in a net loss of $8.6 including transaction costs.
Also during 2009, we repurchased portions of our 4.6% notes due July 1, 2013 with a total carrying value of $16.5 for a total purchase price of $16.9 plus accrued interest of $0.3, resulting in a loss of $0.5.
Net loss from our 2009 debt repurchases is included in net (loss)/gain on early extinguishment of debt in the accompanying statement of income.
In November 2008, we repurchased a portion of our 4.6% notes due July 1, 2013 with a carrying value of $11.2 (including accrued interest) for a purchase price of $9.3 and recorded a gain on extinguishment of debt for $1.9.
All of the outstanding notes are unsecured and may be repaid in whole or in part, at our option at any time subject to a prepayment adjustment.
- 61 -
Table of Contents
In the second quarter of 2009, we amended our existing $400.0 unsecured revolving credit facility. The amendment increases the maximum permitted ratio of Total Consolidated Debt (as defined) to Consolidated Earnings Before Interest, Tax, Depreciation and Amortization (“EBITDA”) (as defined) through March 31, 2010, and also excludes up to $100.0 of cash restructuring charges from the calculation of Consolidated EBITDA as it pertains to this covenant. The maturity date remains June 2012. The amendment also increases the interest rate margin applicable to borrowings under the facility and replaces the existing facility fee with a commitment fee. There were no borrowings outstanding under the $400.0 unsecured five-year revolving credit facility at December 31, 2009. Based on the unused commitments and our current credit rating, the annual commitment fees for this facility would be $2.5 as of December 31, 2009.
At December 31, 2009 and December 31, 2008, the fair value of our long-term debt, including the current portion, was $746.1 and $734.6, respectively. The fair value is based on a discounted cash flow analysis which incorporates the contractual terms of the notes and observable market-based inputs that include time value, interest rate curves, and credit spreads.
The weighted-average interest rate on all of our debt was 6.6% for 2009 and 4.1% for 2008. The weighted-average interest rate on short-term borrowings outstanding, which consisted of the current portion of non-U.S. credit facilities, as of December 31, 2009 and 2008 was 1.1% and 3.5%, respectively.
At December 31, 2009 and 2008, we had approximately $89.0 and $117.9, respectively, of non-U.S. credit facilities which are renewable annually. There were outstanding borrowings of $11.7 and $43.8 under these facilities at December 31, 2009 and 2008, respectively.
Cash payments during the years ended December 31, 2009, 2008 and 2007, included interest of $34.7, $42.7 and $44.5, respectively. Included in interest expense, net, for the years ended December 31, 2009, 2008 and 2007, is interest income of $7.4, $3.5 and $2.1, respectively. Capitalized interest for the years ended 2009 and 2008 was $8.3 and $3.0, respectively.
Maturities of long-term debt for the next five years are as follows:
| Payments Due by year | |||||||||||||||||||||
| 2010 | 2011 | 2012 | 2013 | 2014 | Thereafter | Total | |||||||||||||||
| Long-term debt |
$ | 16.7 | $ | – | $ | – | $ | 157.2 | $ | – | $ | 501.6 | $ | 675.5 | |||||||
11. ENVIRONMENTAL, CONTINGENCIES AND COMMITMENTS
ENVIRONMENTAL AND RELATED MATTERS
We are subject to substantial costs arising out of environmental laws and regulations, which include obligations to remove or limit the effects on the environment of the disposal or release of certain wastes or substances at various sites or to pay compensation to others for doing so.
Our most significant environmental liabilities relate to remediation and regulatory closure obligations at manufacturing sites now or formerly owned by us. We are also involved in legal proceedings directed at the cleanup of various other sites, including a number of federal or state Superfund sites. Since the laws pertaining to Superfund sites generally impose retroactive, strict, joint and several liability, a governmental plaintiff could seek to recover all remediation costs at any such site from any of the potentially responsible parties (“PRPs”) for such site, including us, despite the involvement of other PRPs. In some cases, we are one of several hundred identified PRPs, while in others we are the only one or one of only a few. Generally, where there are a number of financially solvent PRPs, liability has been apportioned, or we believe, based on our experience with such matters, that liability will be apportioned based on the type and amount of waste disposed by each PRP at such disposal site and the number of financially solvent PRPs. In many cases, the nature of future environmental expenditures cannot be quantified with accuracy. In addition, from time to time in the ordinary course of our business, we are informed of, and receive inquiries with respect to, additional sites that may be environmentally impaired and for which we may be responsible.
As of December 31, 2009 and 2008, the aggregate environmental related accruals were $105.4 and $101.1, respectively, of which $5.5 and $7.4, respectively, are included in accrued expenses with the remainder included in other noncurrent liabilities. Environmental remediation spending, for the years ended December 31, 2009, 2008, and 2007, was $4.8, $10.2 and $5.0, respectively.
- 62 -
Table of Contents
Our process is to review our environmental remediation accruals quarterly and based on new information, we may from time to time adjust our environmental related accruals. Overall, our adjustments resulted in a net increase of $5.7 in our environmental accruals for the year ended December 31, 2009, which primarily relate to operating sites in the U.S. Our environmental liabilities were also increased by $1.8 of environmental related accruals previously tracked as part of our restructuring accruals.
We divested our water treatment and acrylamide product lines to Kemira in 2006 and 2007, including certain manufacturing facilities. At the time of the sale of these facilities Kemira agreed to assume certain related environmental liabilities, and we agreed to compensate Kemira for the estimated costs of required remediation identified in subsequent site evaluations or to undertake such actions on behalf of Kemira. In 2007, we increased our reserves for certain of these sites based on additional information generated by such site evaluations. Negotiations with Kemira over the required remedial actions and their estimated costs were completed in first quarter 2008 and we adjusted our reserves accordingly. We also adjusted our reserves for certain other sites based on new information or changes in remedial plans during 2008. As a result of the negotiations with Kemira in the first quarter of 2008, we paid Kemira approximately $1.9 in exchange for their agreement to assume the environmental liabilities related to one of the transferred sites and additional $2.8 was paid to Kemira in the second quarter of 2008 in exchange for their agreement to assume the environmental liabilities related to the remaining transferred sites.
Our environmental related accruals can change substantially due to such factors as additional information on the nature or extent of contamination, methods of remediation required, changes in the apportionment of costs among responsible parties and other actions by governmental agencies or private parties or if we are named in a new matter and determine that an accrual needs to be provided or if we determine that we are not liable and no longer require an accrual.
ASSET RETIREMENT OBLIGATIONS
The fair value of a liability for an asset retirement obligation is recognized in the period in which the liability is incurred and becomes determinable with an offsetting increase in the carrying amount of the related long-lived asset. The recognition of an asset retirement obligation at fair value requires that management make numerous estimates, assumptions and judgments regarding such factors as the estimated probabilities, amounts and timing of settlements, the credit-adjusted risk-free rate to be used, inflation rates, market risk-premium, and changes in environmental, regulatory, and legal environments. In periods subsequent to initial measurement of the liability, we must recognize period-to-period changes in the liability resulting from the passage of time and revisions such as the timing or the amount of the original estimate of undiscounted cash flows. Over time, the liability is accreted to its future value, and the capitalized cost is depreciated over the useful life of the related asset. Upon settlement of the liability, we either settle the obligation for its recorded amount or incur a gain or loss.
A summary of the changes in the asset retirement obligation for the years ended December 31, 2009 and 2008 is presented below:
| Asset retirement obligation as of December 31, 2007 |
$ | 45.7 | ||
| Liabilities incurred |
– | |||
| Liabilities settled |
(0.8 | ) | ||
| Accretion expense |
2.9 | |||
| Revision in estimated cash flows |
(1.1 | ) | ||
| Currency exchange |
(1.2 | ) | ||
| Asset retirement obligation as of December 31, 2008 |
$ | 45.5 | ||
| Liabilities incurred |
– | |||
| Liabilities settled |
(1.9 | ) | ||
| Accretion expense |
2.9 | |||
| Revision in estimated cash flows |
(0.9 | ) | ||
| Currency exchange |
0.4 | |||
| Asset retirement obligation as of December 31, 2009 |
$ | 46.0 |
Our long-lived assets subject to asset retirement obligations are primarily related to asbestos abatement and Resource Conservation and Recovery Act (“RCRA”) closures at certain manufacturing and research facilities. As of December 31, 2009, 40 of our sites have been identified with regulatory closure obligations. Assets subject to asset retirement obligations are primarily manufacturing and research facilities, related equipment, and storage tanks. We are also obligated to return certain land to its original condition upon vacating.
There are no sites with a regulatory closure obligation for which a liability has not been estimated and recorded.
- 63 -
Table of Contents
At December 31, 2009, there were no assets legally restricted for purpose of settling asset retirement obligations. The asset retirement obligation liability has been recorded as other noncurrent liabilities in the accompanying consolidated balance sheets.
OTHER CONTINGENCIES
We are the subject of numerous lawsuits and claims incidental to the conduct of our or certain of our predecessors’ businesses, including lawsuits and claims relating to product liability, personal injury including asbestos, environmental, contractual, employment and intellectual property matters.
As of December 31, 2009 and 2008, the aggregate self-insured and insured contingent liability was $60.8 and $66.2, respectively, and the related insurance recovery receivable was $28.0 and $33.1, respectively. The asbestos liability included in the above amounts at December 31, 2009 and 2008 was $45.0 and $51.1, respectively, and the related insurance receivable was $26.5 and $32.0, respectively. A net deferred tax benefit has been recognized for those claims for which full insurance recovery is not expected.
ASBESTOS
We, like many other industrial companies, have been named as one of hundreds of defendants in a number of lawsuits filed in the U.S. by persons alleging bodily injury from asbestos. The claimants allege exposure to asbestos at facilities that we own or formerly owned or from products that we formerly manufactured for specialized applications. Most of these cases involve numerous defendants, sometimes as many as several hundred. Historically, most of the closed asbestos claims against us have been dismissed without any indemnity payment by us; however, we can make no assurances that this pattern will continue.
The following table presents information about asbestos claims activity:
| Year Ended December 31, 2009 |
Year Ended December 31, 2008 |
|||||
| Number of claimants at beginning of period |
8,100 | 8,200 | ||||
| Number of claimants associated with claims closed during period |
(200 | ) | (200 | ) | ||
| Number of claimants associated with claims opened during period |
100 | 100 | ||||
| Number of claimants at end of period |
8,000 | 8,100 |
Numbers in the foregoing table are rounded to the nearest hundred and are based on information as received by us which may lag actual court filing dates by several months or more. Claims are recorded as closed when a claimant is dismissed or severed from a case. Claims are opened whenever a new claim is brought, including from a claimant previously dismissed or severed from another case.
During the third quarter of 2009, we completed an actuarial study of our asbestos related contingent liabilities and related insurance receivables. This study which updates our last study prepared in the third quarter of 2006, is based on, among other things, the incidence and nature of historical claims data through June 30, 2009, the incidence of malignancy claims, the severity of indemnity payments for malignancy and non-malignancy claims, dismissal rates by claim type, estimated future claim frequency, settlement values and reserves, and expected average insurance recovery rates by claim type.
As a result of our findings, we recorded a decrease of $5.0 to our self insured and insured contingent liabilities for indemnity costs for pending and anticipated probable future claims and recorded a decrease of $4.9 related to receivables for probable insurance recoveries for these pending and future claims. The reserve decrease is attributable to significantly lower projected claim filings offset by more severe malignancy rates and settlement value projections. The decrease in the receivable is a result of the lower gross liability and a shift in the types of future claims expected. Overall, we expect to recover approximately 48% of our future indemnity costs. We have completed coverage in place agreements with most of our larger insurance carriers.
Most of our insurance is with carriers with investment grade ratings and only those with such ratings or other solvent carriers were included in the estimation of the recovery of indemnity and incurred defense costs.
It should be noted that the ultimate liability and related insurance recovery for all pending and anticipated future claims cannot be determined with certainty due to the difficulty of forecasting the numerous variables that can affect the amount of the liability and insurance recovery. These variables include but are not limited to: (i) significant changes in the number of future claims; (ii) significant changes in the average cost of resolving claims; (iii) changes in the nature of claims received; (iv) changes in the laws applicable to these claims; and (v) financial viability of co-defendants and insurers.
- 64 -
Table of Contents
LEAD PIGMENT
Over the past 15 years we have been named as defendants in more than fifty cases in the U.S. in which plaintiffs assert claims for personal injury, property damage, and other claims for relief relating to one or more kinds of lead pigment that were used as an ingredient decades ago in paint for use in buildings. Seven cases remain outstanding. The different suits were brought by government entities and/or individual plaintiffs, on behalf of themselves and others. The suits variously sought compensatory and punitive damages and/or injunctive relief, including funds for the cost of monitoring, detecting and removing lead based paint from buildings and for medical monitoring; for personal injuries allegedly caused by ingestion of lead based paint; and plaintiffs’ attorneys’ fees. We settled one of these cases in 2005 for an immaterial amount in order to avoid litigation costs. In all of the others, we prevailed in court or were dismissed as a defendant. We believe that the seven remaining suits against us are without merit, and we are vigorously defending them.
Six of the remaining lead suits are for personal injury claims and have been filed against us in Wisconsin. In July, 2005, the Supreme Court of Wisconsin held in a case in which we were one of several defendants that Wisconsin’s risk contribution doctrine applies to bodily injury cases against manufacturers of white lead pigment. Under this doctrine, manufacturers of white lead pigment may be liable for injuries caused by white lead pigment based on their past market shares unless they can prove they are not responsible for the white lead pigment which caused the injury in question. Seven other courts have previously rejected the applicability of this and similar doctrines to white lead pigment. The trial court’s dismissal of the plaintiff’s strict liability and negligent design defect causes of action for white lead carbonate in the case styled Ruben Godoy et al v. E.I DuPont de Nemours et al., one of the Wisconsin lead cases, was affirmed by the Wisconsin Court of Appeals in October 2007 and by the Wisconsin Supreme Court in July 2009. The decision in this case together with our non-existent or diminutive market share reinforces our belief that we have no liability in any of the Wisconsin cases, and accordingly, we have not recorded a loss contingency.
We have access to a substantial amount of primary and excess general liability insurance for property damage and believe these policies are available to cover a significant portion of both our defense costs and indemnity costs, if any, for lead pigment related property damage claims. We have agreements with two of our insurers to date which provide that they will pay for approximately fifty percent (50%) of our defense costs associated with lead pigment related property damage claims, and we are in the process of negotiating additional agreements with other insurance carriers.
OTHER
We commenced binding arbitration proceedings against SNF SA (“SNF”) in 2000 to resolve a commercial dispute relating to SNF’s failure to purchase agreed amounts of acrylamide under a long-term agreement. In July 2004, the arbitrators awarded us damages and interest aggregating approximately €11.0 plus interest on the award at a rate of 7% per annum from July 28, 2004 until paid. After further proceedings in France, we collected €12.2 ($15.7) related to the arbitration award including interest in the second quarter of 2006 and recognized the gain in other income in the 2006 consolidated statement of income. In December 2009, SNF voluntarily dismissed its last remaining appeal to the Belgium Court de Cassation, ending the litigation.
Periodically, we enter into settlement discussions for lawsuits or claims for which we have meritorious defenses and for which an unfavorable outcome against us is not probable. In such instances, no loss contingency is recorded since a loss is not probable and it is our policy to expense defense costs as incurred. Typically, we consider these types of settlements in fairly limited circumstances usually related to the avoidance of future defense costs and/or the elimination of any risk of an unfavorable outcome. Such settlements, if any, are recorded when it is probable a liability has been incurred, typically upon entering into a settlement agreement.
While it is not feasible to predict the outcome of all pending environmental matters, lawsuits and claims, it is reasonably possible that there will be a necessity for future provisions for costs for environmental matters and for other contingent liabilities that we believe, will not have a material adverse effect on our consolidated financial position, but could be material to our consolidated results of operations or cash flows in any one accounting period. We cannot estimate any additional amount of loss or range of loss in excess of the recorded amounts. Moreover, many of these liabilities are paid over an extended period, and the timing of such payments cannot be predicted with any certainty.
From time to time, we are also included in legal proceedings as a plaintiff involving tax, contract, patent protection, environmental and other legal matters. Gain contingencies related to these matters, if any, are recorded when they are realized.
- 65 -
Table of Contents
ACCOUNTING FOR UNCERTAINTY IN INCOME TAXES
We recognize the tax benefit from an uncertain tax position only if it is more likely than not that the tax position will be sustained on examination by the taxing authorities, based on the technical merits of the position. The tax benefits recognized in the financial statements from such a position are measured based on the largest benefit that has a greater than fifty percent likelihood of being realized upon effective settlement. See Note 12 of the Consolidated Financial Statements for additional information.
COMMITMENTS
Rental expense under property and equipment leases was $16.4 in 2009, $15.8 in 2008 and $17.5 in 2007. Estimated future minimum rental expenses under property and equipment leases that have initial or remaining noncancelable lease terms in excess of one year as of December 31, 2009 are:
| Year | Operating Leases | ||
| 2010 |
$ | 13.6 | |
| 2011 |
10.4 | ||
| 2012 |
7.2 | ||
| 2013 |
4.6 | ||
| 2014 |
3.8 | ||
| Thereafter |
13.5 | ||
| Total minimum lease payments |
$ | 53.1 | |
We frequently enter into long-term contracts with customers with terms that vary depending on specific industry practices. The business of Cytec Industries and its consolidated subsidiaries as a whole, is not substantially dependent on any single contract or any series of related contracts. Set forth below are more specific terms about our significant sales contracts.
We have the option to sell, and an affiliate of an international trading company is obligated to buy, up to approximately 15% of our production capacity of acrylonitrile per year under a long-term distributorship agreement that is scheduled to expire on January 1, 2013. The price under this distributorship agreement is market-based less certain costs and commissions.
We are obligated to sell, and a tenant at our Fortier facility is obligated to buy, substantially all of our nominal production capacity of hydrocyanic acid under an agreement with an initial term expiring May 30, 2013. Price is determined by a formula based on the raw materials used to manufacture hydrocyanic acid and to a lesser extent on the quoted market price of such tenant’s product based on hydrocyanic acid and is adjusted periodically.
We are obligated to sell sulfuric acid, and also to regenerate used sulfuric acid, and a tenant at our Fortier facility is obligated to buy such product and services, under an agreement with an initial term expiring May 30, 2013. The price for regenerated sulfuric acid is cost based and the price for sulfuric acid is set between the price for regenerated acid and a market price for sulfuric acid and both prices are adjusted periodically. Regenerated sulfuric acid and sulfuric acid are produced in the same plant at the same time.
We are obligated to manufacture a customer’s requirements for certain resins utilized in the automotive industry under long-term manufacturing agreements which may be terminated any year upon one year prior written notice but not before November 27, 2012. Pricing is based on a fixed toll agreement.
We are obligated to sell and, subject to certain exceptions, an aerospace customer is obligated to buy its requirements of various specialty materials for products related to certain aircraft programs, under an agreement which is scheduled to expire at the end of 2015.
We are obligated to supply acrylonitrile to the Kemira acrylamide plants at Fortier and Botlek under a long-term supply agreement. In addition, we are committed to purchase certain mining chemicals manufactured at Kemira’s Mobile, Alabama and Longview, Washington sites and various other products at the Botlek site which Kemira will manufacture and sell to us. The acrylonitrile price to Kemira is determined by a formula based on the primary raw material components.
The Engineered Materials segment is party to a number of long-term supply and pricing agreements that cover various time periods. Such agreements are common practice in the aerospace and aircraft manufacturing industries.
We frequently enter into long-term agreements in order to lock-in price and availability of raw materials and services required to operate our businesses. At December 31, 2009, obligations under such agreements totaled $46.3, of which $27.7 are expected to be paid in 2010.
We had $33.9 of outstanding letters of credit, surety bonds and bank guarantees at December 31, 2009 that are issued on our behalf in the ordinary course of business to support certain of our performance obligations and commitments. The instruments are typically renewed on an annual basis.
- 66 -
Table of Contents
12. INCOME TAXES
The income tax provision (benefit) is based on earnings (losses) from continuing operations before income taxes:
| 2009 | 2008 | 2007 | |||||||||
| U.S. |
$ | 35.4 | $ | (4.0 | ) | $ | 119.1 | ||||
| Non-U.S. |
(39.2 | ) | (145.6 | ) | 164.9 | ||||||
| Total |
$ | (3.8 | ) | $ | (149.6 | ) | $ | 284.0 | |||
The components of the income tax provision (benefit) are as follows:
| 2009 | 2008 | 2007 | |||||||||
| Current: |
|||||||||||
| U.S. Federal |
$ | 4.0 | $ | 20.9 | $ | 19.8 | |||||
| Non-U.S. |
34.5 | 43.9 | 29.0 | ||||||||
| Other, principally state |
0.7 | 1.7 | 0.7 | ||||||||
| Total |
$ | 39.2 | $ | 66.5 | $ | 49.5 | |||||
| Deferred: |
|||||||||||
| U.S. Federal |
$ | 6.9 | $ | 1.9 | $ | 18.0 | |||||
| Non-U.S. |
(51.6 | ) | (19.0 | ) | 6.9 | ||||||
| Other, principally state |
2.6 | (2.0 | ) | 2.3 | |||||||
| Total |
$ | (42.1 | ) | $ | (19.1 | ) | $ | 27.2 | |||
| Total income tax (benefit) provision |
$ | (2.9 | ) | $ | 47.4 | $ | 76.7 | ||||
A reconciliation of our effective tax rate to the U.S. federal income tax rate is as follows:
| 2009 | 2008 | 2007 | |||||||
| Federal income tax rate |
-35.0 | % | -35.0 | % | 35.0 | % | |||
| Research and development credit |
-47.5 | % | -1.2 | % | -0.7 | % | |||
| Income subject to other than the federal income tax rate |
-4.6 | % | -8.1 | % | -7.0 | % | |||
| Change in tax rates |
29.7 | % | 0.1 | % | -2.1 | % | |||
| State taxes, net of federal benefits |
-60.3 | % | 0.0 | % | 0.7 | % | |||
| Valuation allowance |
90.5 | % | 1.9 | % | 1.2 | % | |||
| Favorable resolution of prior year audits |
-100.7 | % | -1.8 | % | 0.0 | % | |||
| Impairment attributable to non-deductable goodwill |
0.0 | % | 72.2 | % | 0.0 | % | |||
| Other charges (credits), net |
51.6 | % | 3.6 | % | -0.1 | % | |||
| Effective tax rate |
-76.3 | % | 31.7 | % | 27.0 | % |
U.S. and non-U.S. earnings of consolidated companies, before income taxes, include all earnings derived from operations in the respective U.S. and non-U.S. geographic areas; whereas provisions (benefits) for income taxes include all income taxes payable to (receivable from) U.S. Federal, non-U.S. and other governments as applicable, regardless of the sites in which the taxable income (loss) is generated.
Income taxes paid in 2009, 2008 and 2007 were $30.0, $72.7 and $59.7, respectively, and include non-U.S. taxes of $28.9, $45.2 and $45.8 in 2009, 2008 and 2007, respectively. Income taxes paid related to the pre-acquisition tax period of the Surface Specialties entities in 2009, 2008 and 2007 were $2.1, $0.0 and $0.0, respectively, in which $2.1, $0.8 and $0.1 in 2009, 2008, and 2007, respectively, has been reimbursed to us thus far from UCB pursuant to the Stock and Asset Purchase Agreement.
- 67 -
Table of Contents
The temporary differences that give rise to a significant portion of deferred tax assets and liabilities were as follows:
| December 31, | 2009 | 2008 | ||||||
| Deferred tax assets: |
||||||||
| Allowance for bad debts |
$ | 3.4 | $ | 3.1 | ||||
| Self insurance accruals |
22.1 | 24.0 | ||||||
| Operating accruals |
3.2 | 4.5 | ||||||
| Environmental accruals |
31.2 | 22.7 | ||||||
| Pension and postretirement benefit liabilities |
144.2 | 159.0 | ||||||
| Employee benefit accruals |
26.7 | 24.2 | ||||||
| Tax credit carry forwards |
20.1 | 9.0 | ||||||
| Net operating losses |
78.2 | 54.4 | ||||||
| Other |
14.7 | 7.8 | ||||||
| Gross deferred tax assets |
$ | 343.8 | $ | 308.7 | ||||
| Valuation allowance |
(39.7 | ) | (35.4 | ) | ||||
| Total net deferred tax assets |
$ | 304.1 | $ | 273.3 | ||||
| Deferred tax liabilities: |
||||||||
| Inventory |
$ | (2.7 | ) | $ | (2.4 | ) | ||
| Plants, equipment and facilities |
(171.8 | ) | (179.7 | ) | ||||
| Insurance receivables |
(9.3 | ) | (11.5 | ) | ||||
| Intangibles |
(135.5 | ) | (131.3 | ) | ||||
| Other |
(0.8 | ) | (0.8 | ) | ||||
| Gross deferred tax liabilities |
$ | (320.1 | ) | $ | (325.7 | ) | ||
| Net deferred tax assets/(liabilities) |
$ | (16.0 | ) | $ | (52.4 | ) | ||
No provision has been made for U.S. or additional non-U.S. taxes on the undistributed earnings of international subsidiaries totaling $418.0 since we intend to reinvest these earnings. It is not practicable to calculate the unrecognized deferred tax liability on such earnings. U.S. foreign tax credits would be available to substantially reduce any amount of additional U.S. tax that might be payable on these earnings in the event of a distribution.
We have U.S. research and development tax credit carryforwards of $1.8 available as of December 31, 2009 to offset future U.S. tax liabilities. These carryforwards expire in 2029. We have U.S. foreign tax credit carryforwards of $7.4 available as of December 31, 2009 to offset future U.S. tax liabilities. Such U.S. foreign tax credits will expire 2019. We have $12.8 of state tax credits of which $9.7 will be carried forward indefinitely with the balance to expire at various dates starting in 2009. Additionally, we have $2.6 of foreign jurisdiction tax credits related to our operations in Belgium, which do not expire.
At December 31, 2009, we have U.S. federal income tax net operating loss carryforwards of $4.3 relating to our 1998 acquisition of The American Materials & Technologies Corporation available to offset future taxable income. Utilization of those loss carryforwards is limited under certain provisions of the Internal Revenue Code. The carryforwards began to expire at various dates starting in 2009 through 2018. We have state net operating losses totaling $295.5 which are available to offset future taxable income in the respective states. The total carryforwards expire at various dates starting in 2010 through 2028. In addition, we have foreign net operating losses totaling $62.8, primarily related to our operations in Europe, Canada, Thailand and Brazil. These net operating losses are available to offset future taxable income in the respective foreign countries. Of the total carryforwards, approximately $6.7 expire at various dates starting in 2010 through 2016, while $56.1 can be utilized over an indefinite period.
Our long-term earnings trend makes it more likely than not that we will generate sufficient taxable income on a consolidated basis to realize our net deferred tax assets with the exception of certain state net operating losses and state tax credits, and various foreign deferred tax assets. Accordingly, we have recorded a valuation allowance of $39.7 and $35.4 as of December 31, 2009 and 2008. For 2009, the $4.3 valuation allowance activity primarily consisted of an increase to the valuation allowance for foreign net operating losses and other foreign deferred tax assets ($0.6), and state tax credits and other state deferred tax assets ($3.7). As of December 31, 2009, $21.9 of the valuation allowance is attributable to U.S. state tax attributes and $17.8 primarily relates to foreign net operating losses. For 2008, the $1.9 valuation allowance activity primarily consisted of a net increase to the valuation allowance for state tax credits and other state deferred tax assets. As of December 31, 2008, $18.1 of the valuation allowance is attributable to U.S. state tax attributes and $17.3 primarily relates to foreign net operating losses.
In January 2008, the Norwegian Supreme Court upheld a tax assessment with respect to a 1999 restructuring of certain European operations. The tax liability attributable to this assessment was approximately 84.0 Norwegian krone ($14.5). After giving effect for payments previously remitted we have a remaining tax liability as of December 31, 2009 of Norwegian krone 16.1 ($2.8) of which approximately 7.0 Norwegian krone ($1.2) relates to pre-2005 taxable periods with the balance to be paid in subsequently filed tax returns without interest.
- 68 -
Table of Contents
During 2009, we settled German and Italian tax audits for certain international subsidiaries acquired as part of the Surface Specialties acquisition. The German audit covered the pre-acquisition periods 1999 – 2003 and the Italian audit pertained to the 2004 – 2007 tax years. Amounts paid to the tax authorities in settlement of these audits were reimbursed by UCB SA, in whole or in part, in accordance with the Surface Specialties Stock and Asset Purchase Agreement. We also recorded a net tax benefit of $3.8 based on the favorable resolution of the Italian audit.
We recognize the tax benefit from an uncertain tax position only if it is more likely than not that the tax position will be sustained on examination by the taxing authorities, based on the technical merits of the position. The tax benefits recognized in the financial statements from such a position should be measured based on the largest benefit that has a greater than fifty percent likelihood of being realized upon settlement with the tax authorities.
The amount of unrecognized tax benefits at January 1, 2009 was $39.2 (gross) of which $22.2 would impact our effective tax rate, if recognized. As of December 31, 2009, the amount of unrecognized tax benefits is $37.9 (gross) of which $19.8 would impact our effective tax rate, if recognized.
We recognize interest and penalties related to unrecognized tax benefits in income tax expense in the consolidated statements of income. We had recorded a liability for the payment of interest and penalties (gross), of approximately $6.0 as of January 1, 2009, increasing by current year activity of $0.9, thus resulting in a liability for the payment of interest and penalties of $6.9 as of December 31, 2009.
Set forth below is the tabular roll-forward of our 2009 and 2008 unrecognized tax benefits from uncertain tax positions:
| 2009 | 2008 | |||||||
| Balance as of beginning of the year |
$ | 39.2 | $ | 42.4 | ||||
| Increase due to tax positions related to current periods |
3.0 | 6.5 | ||||||
| Increase due to tax positions related to prior periods |
3.0 | 3.2 | ||||||
| Decrease due to tax positions related to prior periods |
(3.6 | ) | (5.8 | ) | ||||
| Settlements |
(4.6 | ) | (4.9 | ) | ||||
| Foreign exchange |
0.9 | (2.2 | ) | |||||
| Balance as of the end of the year |
$ | 37.9 | $ | 39.2 | ||||
We believe it is reasonably possible that the unrecognized tax benefits primarily related to global transfer pricing at December 31, 2009 may decrease by approximately $3.0 (before offset for any correlated competent authority adjustments), due to the completion of examinations and the expiration of statutes in several jurisdictions within twelve months of December 31, 2009.
The IRS has completed and closed its audits of our tax returns through 2003. During the second quarter of 2007, the IRS commenced the audit of our tax returns for the years 2004 and 2005, and is still ongoing as of December 31, 2009. We believe that adequate provisions for all outstanding issues have been made for all open years.
State income tax returns are generally subject to examination for a period of 3-5 years after filing of the respective return. The state impact of any federal changes remains subject to examination by various states for a period of up to one year after formal notification to the states. Years still open to examination by tax authorities in major jurisdictions include Arizona (2005 onward), California (2005 onward), Connecticut (2006 onward), Georgia (2006 onward), Louisiana (2006 onward), Maryland (2006 onward), Michigan (2005 onward), New Jersey (2001 onward), North Carolina (2006 onward), Ohio (2006 onward), South Carolina (2006 onward), Texas (2005 onward), and West Virginia (2006 onward). We have various state income tax returns in the process of examination.
International jurisdictions have statutes of limitations generally ranging from 3-5 years after filing of the respective return. Years still open to examination by tax authorities in major jurisdictions include Austria (2005 onward), Belgium (2005 onward), Germany (2005 onward), Netherlands (2005 onward), Canada (2003 onward), UK (2005 onward), Italy (2005 onward), China (2003 onward), and Norway (2003 onward). We are currently under examination in several of these jurisdictions.
13. EMPLOYEE BENEFIT PLANS
We have defined benefit and defined contribution pension plans that cover employees in a number of countries. Almost all of the plans provide defined benefits based on years of service and career average salary. We also sponsor postretirement and post employment benefit plans in certain countries. The postretirement plans provide medical and life insurance benefits to retirees who meet minimum age and service requirements, and in the case of non-bargaining employees, who commenced employment prior to April 1, 2007. The medical plans are contributory and non-contributory with certain participants’ contributions adjusted annually; the life insurance plans are non-contributory. The accounting for the postretirement plans anticipates future cost-sharing
- 69 -
Table of Contents
and changes to the plans. The postretirement plans include a cap on our share of costs for recent and future retirees. The post employment plans provide salary continuation, disability-related benefits, severance pay and continuation of health costs during the period after employment but before retirement.
We used a measurement date of December 31 in 2009 and 2008 for all of our pension and postretirement benefit plans. The majority of our non-U.S. defined benefit pension plans used a measurement date of November 30 for fiscal year 2007.
| Pension Plans | Postretirement Plans | |||||||||||||||||||||||
| 2009 | 2008 | 2007 | 2009 | 2008 | 2007 | |||||||||||||||||||
| Net periodic costs: |
||||||||||||||||||||||||
| Service cost |
$ | 9.6 | $ | 10.0 | $ | 19.5 | $ | 1.3 | $ | 1.2 | $ | 1.2 | ||||||||||||
| Interest cost |
50.6 | 50.3 | 47.2 | 11.8 | 12.2 | 11.8 | ||||||||||||||||||
| Expected return on plan assets |
(48.5 | ) | (50.6 | ) | (48.8 | ) | (3.7 | ) | (4.2 | ) | (4.1 | ) | ||||||||||||
| Net amortization |
15.1 | 12.5 | 14.0 | (10.6 | ) | (10.5 | ) | (10.4 | ) | |||||||||||||||
| Curtailment/Settlement |
11.2 | 0.1 | 0.3 | – | – | – | ||||||||||||||||||
| Net periodic expense (credit) |
$ | 38.0 | $ | 22.3 | $ | 32.2 | $ | (1.2 | ) | $ | (1.3 | ) | $ | (1.5 | ) | |||||||||
| Weighted-average assumptions used to determine net periodic costs, during the year |
||||||||||||||||||||||||
| Discount rate |
5.8 | % | 5.7 | % | 5.5 | % | 6.0 | % | 6.0 | % | 5.7 | % | ||||||||||||
| Expected return on plan assets |
6.9 | % | 7.1 | % | 7.6 | % | 7.0 | % | 7.0 | % | 6.5 | % | ||||||||||||
| Rate of compensation increase |
2.5%-10 | % | 3%-10 | % | 3%-10 | % | – | – | – | |||||||||||||||
| Weighted-average assumptions used to determine benefit obligations, end of the year |
||||||||||||||||||||||||
| Discount rate |
5.7 | % | 5.9 | % | 5.9 | % | 5.4 | % | 6.1 | % | 6.2 | % | ||||||||||||
| Rate of compensation increase |
2.5%-10 | % | 3%-10 | % | 3%-10 | % | – | – | – | |||||||||||||||
The expected rate of return on U.S. plan assets was determined by examining the annualized rates of return over various five and ten year periods for the major U.S. stock and bond indexes and the estimated long-term asset mix of the plan assets of 50%-70% stocks and 30%-50% bonds, including cash equivalents (“fixed income securities”). Since the long-term average annualized return is approximately 8%-10% for stocks and 5%-7% for fixed income securities, the expected long-term weighted average return was estimated to be 7.50% and 7.75% for the U.S. pension plans in 2009 and 2008, respectively. This return is based on an assumed allocation of U.S. pension assets of 60% stocks and 40% in fixed income securities for 2009 and 58% stocks and 42% fixed income securities for 2008. Expected long-term investment returns for U.S. investments were 8.5% for stocks and 6.0% for fixed income securities in 2009 and 9.0% for stocks and 6.0% for fixed income securities in 2008. For U.S. and non-U.S. postretirement plans, assets are only held in the U.S. The expected rate of return on postretirement assets was 7.0% in 2009 and 7.0% in 2008, based on an assumed asset allocation of 60% stocks and 40% fixed income securities in 2009 and 58% stocks and 42% fixed income securities in 2008.
The investment strategy for our worldwide benefit plan assets is to maintain broadly-diversified portfolios of stocks, bonds and money market instruments that, along with periodic plan contributions, provide the necessary liquidity for ongoing benefit obligations.
The expected return on non-U.S. plan assets is also based on the historical rates of return of the various asset classes in each country and the corresponding asset mix. For our two largest non-U.S. pension plans, the assumed weighted average rate of return was 5.3% in 2009. The 2009 return is based on assumed weighted average rates of return of 7.1% for stocks and 4.5% for fixed income securities and an assumed weighted average asset allocation of 32% stocks and 68% fixed income securities.
- 70 -
Table of Contents
| Pension Plans | Postretirement Plans | |||||||||||||||||||||||
| 2009 | 2008 | 2007 | 2009 | 2008 | 2007 | |||||||||||||||||||
| Change in benefit obligation: |
||||||||||||||||||||||||
| Benefit obligation at January 1 |
$ | 859.2 | $ | 858.0 | $ | 876.0 | $ | 200.3 | $ | 205.3 | $ | 242.7 | ||||||||||||
| Addition of plans |
– | – | 0.8 | – | – | – | ||||||||||||||||||
| Service cost |
9.6 | 10.0 | 19.5 | 1.3 | 1.2 | 1.2 | ||||||||||||||||||
| Interest cost |
50.6 | 50.3 | 47.2 | 11.8 | 12.2 | 11.8 | ||||||||||||||||||
| Amendments |
6.5 | – | – | – | – | – | ||||||||||||||||||
| Translation difference |
13.6 | (30.5 | ) | 28.7 | 0.7 | (1.0 | ) | 0.7 | ||||||||||||||||
| Actuarial (gain)/losses |
36.4 | 12.6 | (37.3 | ) | 18.9 | 4.9 | (29.5 | ) | ||||||||||||||||
| Employee contributions |
0.7 | 0.7 | 0.6 | 4.2 | 3.9 | 3.6 | ||||||||||||||||||
| Company contributions(1) |
– | – | 0.6 | – | – | – | ||||||||||||||||||
| Benefits paid |
(43.6 | ) | (42.3 | ) | (38.2 | ) | (24.5 | ) | (26.2 | ) | (25.2 | ) | ||||||||||||
| Curtailments/Settlements(2) |
(63.1 | ) | – | (39.9 | ) | – | – | – | ||||||||||||||||
| Elimination of early measurement date |
– | 0.4 | – | – | – | – | ||||||||||||||||||
| Benefit obligation at December 31 |
$ | 869.9 | $ | 859.2 | $ | 858.0 | $ | 212.7 | $ | 200.3 | $ | 205.3 | ||||||||||||
| Accumulated benefit obligation at December 31 |
$ | 827.0 | $ | 817.1 | $ | 809.2 | $ | – | $ | – | $ | – | ||||||||||||
| Change in plan assets: |
||||||||||||||||||||||||
| Fair value of plan assets at January 1 |
$ | 563.9 | $ | 725.3 | $ | 663.5 | $ | 46.5 | $ | 64.6 | $ | 69.3 | ||||||||||||
| Actual return on plan assets |
111.4 | (123.1 | ) | 43.5 | 8.7 | (10.2 | ) | 3.7 | ||||||||||||||||
| Company contributions(3) |
53.0 | 34.4 | 59.7 | 11.9 | 16.5 | 15.7 | ||||||||||||||||||
| Employee contributions |
0.7 | 0.7 | 0.6 | 4.2 | 3.9 | 3.6 | ||||||||||||||||||
| Translation difference |
12.3 | (31.1 | ) | 20.9 | – | – | – | |||||||||||||||||
| Curtailments/Settlements(2) |
(62.1 | ) | (0.1 | ) | (24.7 | ) | – | – | – | |||||||||||||||
| Benefits paid |
(43.6 | ) | (42.3 | ) | (38.2 | ) | (26.7 | ) | (28.3 | ) | (27.7 | ) | ||||||||||||
| Elimination of early measurement date |
– | 0.1 | – | – | – | – | ||||||||||||||||||
| Fair value of plan assets at December 31 |
$ | 635.6 | $ | 563.9 | $ | 725.3 | $ | 44.6 | $ | 46.5 | $ | 64.6 | ||||||||||||
| (1) | Represents net post-measurement date contribution. |
| (2) | Represents various curtailments and settlements. 2007 includes the impact of the transfer of accrued pension rights and plan assets in the Netherlands related to the divestiture of the water treatment and acrylamide product lines and a change in certain U.S. plans from defined benefit plans to defined contribution plans. In December 2009, we irrevocably transferred the liability and plan assets associated with the accrued benefits of all inactive participants of our defined benefit pension plan in the Netherlands to an insurance company, resulting in a settlement loss of $12.2 due to recognition of actuarial losses previously recorded in other comprehensive loss. |
| (3) | The 2009 contributions to our pension plans include a contribution of 1,184,273 shares of common stock to our U.S. plans on May 13, 2009, which had a fair value of $22.5. |
- 71 -
Table of Contents
The postretirement plan benefit obligation includes Medicare Part D subsidies received that reduce company contributions. The amounts received for 2009, 2008 and 2007 were $2.2, $2.1 and $2.5, respectively.
| Pension Plans | Postretirement Plans | |||||||||||||||||||||||
| 2009 | 2008 | 2007 | 2009 | 2008 | 2007 | |||||||||||||||||||
| Funded status, end of year: |
||||||||||||||||||||||||
| Fair value of plan assets |
$ | 635.6 | $ | 563.9 | $ | 725.3 | $ | 44.6 | $ | 46.5 | $ | 64.6 | ||||||||||||
| Benefit obligations |
(869.9 | ) | (859.2 | ) | (858.0 | ) | (212.7 | ) | (200.3 | ) | (205.3 | ) | ||||||||||||
| Funded status |
$ | (234.3 | ) | $ | (295.3 | ) | $ | (132.7 | ) | $ | (168.1 | ) | $ | (153.8 | ) | $ | (140.7 | ) | ||||||
| Amounts recognized in the consolidated balance sheet consist of: |
||||||||||||||||||||||||
| Noncurrent asset |
$ | 3.1 | $ | 3.7 | $ | 19.2 | $ | – | $ | – | $ | – | ||||||||||||
| Current liability |
(4.5 | ) | (4.4 | ) | (4.6 | ) | (12.2 | ) | (12.1 | ) | (16.6 | ) | ||||||||||||
| Noncurrent liability |
(232.9 | ) | (294.6 | ) | (147.3 | ) | (155.9 | ) | (141.7 | ) | (124.1 | ) | ||||||||||||
| Total amount recognized |
$ | (234.3 | ) | $ | (295.3 | ) | $ | (132.7 | ) | $ | (168.1 | ) | $ | (153.8 | ) | $ | (140.7 | ) | ||||||
| Amounts recognized in accumulated other comprehensive income consist of: |
||||||||||||||||||||||||
| Net actuarial (gain)/loss |
$ | 255.7 | $ | 302.5 | $ | 128.7 | $ | 29.1 | $ | 15.1 | $ | (4.4 | ) | |||||||||||
| Prior service (credit)/cost |
1.8 | 2.1 | 2.3 | (21.6 | ) | (32.2 | ) | (42.8 | ) | |||||||||||||||
| Transition obligation |
0.1 | 0.1 | 0.1 | – | – | – | ||||||||||||||||||
| Total |
$ | 257.6 | $ | 304.7 | $ | 131.1 | $ | 7.5 | $ | (17.1 | ) | $ | (47.2 | ) | ||||||||||
| Change in accumulated other comprehensive income (AOCI): |
||||||||||||||||||||||||
| AOCI, beginning of year |
$ | 304.7 | $ | 131.1 | $ | 193.2 | $ | (17.1 | ) | $ | (47.2 | ) | $ | (28.5 | ) | |||||||||
| Current year actuarial (gain)/loss |
(20.1 | ) | 186.1 | (47.7 | ) | 14.0 | 19.6 | (29.2 | ) | |||||||||||||||
| Current year prior service cost/(credit) |
(0.7 | ) | – | (0.2 | ) | – | – | – | ||||||||||||||||
| Curtailments/ Settlements |
(11.2 | ) | – | – | – | – | – | |||||||||||||||||
| Amortization: |
||||||||||||||||||||||||
| Amortization of actuarial gain/(loss) |
(14.7 | ) | (12.2 | ) | (13.7 | ) | – | (0.1 | ) | (0.1 | ) | |||||||||||||
| Amortization of prior service (cost)/credit |
(0.4 | ) | (0.3 | ) | (0.3 | ) | 10.6 | 10.6 | 10.6 | |||||||||||||||
| Translation difference |
– | – | (0.2 | ) | – | – | – | |||||||||||||||||
| AOCI, end of year |
$ | 257.6 | $ | 304.7 | $ | 131.1 | $ | 7.5 | $ | (17.1 | ) | $ | (47.2 | ) | ||||||||||
| Estimated amortization to be recognized in accumulated other comprehensive income in 2010 consist of: |
||||||||||||||||||||||||
| Net actuarial loss |
$ | 16.6 | $ | 0.5 | ||||||||||||||||||||
| Prior service cost/(credit) |
0.1 | (10.6 | ) | |||||||||||||||||||||
| Transition obligation/ (asset) |
2.3 | – | ||||||||||||||||||||||
| Total |
$ | 19.0 | $ | (10.1 | ) | |||||||||||||||||||
Prior to 2008, we used a measurement date of November 30 when valuing our pension obligations for the majority of our non-U.S. defined benefit pension plans. The requirement that the measurement date be the same as the date of the statement of financial position became effective for the year ended December 31, 2008 and as a result, we changed our measurement date for certain non-U.S. defined benefit pension plans to December 31 from November 30. We adopted the measurement date requirement in 2008 using the 13-month approach. In accordance with this approach, we recorded an additional one month of net periodic benefit cost of $0.3, net of tax, covering the period between the previous measurement date of November 30, 2007 and December 31, 2008 as an adjustment to retained earnings.
- 72 -
Table of Contents
The assumed rate of future increases in the per capita cost of healthcare benefits (healthcare cost trend rate) is 8.0% in 2009, decreasing to ultimate trend of 5.0% in 2015. The healthcare cost trend rate has a significant effect on the reported amounts of accumulated postretirement benefit obligation (“APBO”) and related expense. A 1.0% change in assumed health care cost trend rates would have the following effect:
| 2009 | 2008 | |||||||||||||
| 1% Increase |
1% Decrease |
1% Increase |
1% Decrease |
|||||||||||
| Approximate effect on the total of service and interest cost components of other postretirement benefit cost |
$ | 0.7 | ($ | 0.7 | ) | $ | 0.7 | ($ | 0.7 | ) | ||||
| Approximate effect on accumulated postretirement benefit obligation |
$ | 12.7 | ($ | 11.6 | ) | $ | 11.8 | ($ | 10.9 | ) | ||||
The following information is presented for those plans with an accumulated benefit obligation in excess of plan assets:
| U.S. Plans | Non-U.S. Plans | Total | ||||||||||||||||||||||
| December 31, | 2009 | 2008 | 2009 | 2008 | 2009 | 2008 | ||||||||||||||||||
| Projected benefit obligation |
($ | 637.9 | ) | ($ | 599.3 | ) | ($ | 180.1 | ) | ($ | 190.7 | ) | ($ | 818.0 | ) | ($ | 790.0 | ) | ||||||
| Accumulated benefit obligation |
(627.4 | ) | (589.9 | ) | (169.5 | ) | (168.8 | ) | (796.9 | ) | (758.7 | ) | ||||||||||||
| Fair value of plan assets |
481.8 | 385.9 | 117.9 | 113.3 | 599.7 | 499.2 | ||||||||||||||||||
The asset allocation for our U.S. and non-U.S. pension plans and postretirement plans at the end of 2009 and 2008, and the target allocation for 2010, by asset category, are as follows:
| U.S. Pension Plans |
|||||||||
| Target Allocation |
Percentage of Plan Assets at Year End |
||||||||
| Asset Category | 2010 | 2009 | 2008 | ||||||
| Equity Securities |
60 | % | 63 | % | 45 | % | |||
| Fixed Income |
40 | % | 37 | % | 55 | % | |||
| Total |
100 | % | 100 | % | 100 | % | |||
| Non-U.S. Pension Plans |
|||||||||
| Target Allocation |
Percentage of Plan Assets at Year End |
||||||||
| Asset Category | 2010 | 2009 | 2008 | ||||||
| Equity Securities |
44 | % | 44 | % | 30 | % | |||
| Fixed Income |
40 | % | 38 | % | 54 | % | |||
| Cash and other |
16 | % | 18 | % | 16 | % | |||
| Total |
100 | % | 100 | % | 100 | % | |||
| Postretirement Plans |
|||||||||
| Asset Category |
Target Allocation |
Percentage of Plan Assets at Year End |
|||||||
| 2010 | 2009 | 2008 | |||||||
| Equity Securities | 60 | % | 79 | % | 46 | % | |||
| Fixed Income | 40 | % | 21 | % | 54 | % | |||
| Total | 100 | % | 100 | % | 100 | % | |||
The total fair value of U.S. pension and postretirement plan assets was $526.4 and $432.5 at December 31, 2009 and 2008, respectively. We have invested certain U.S. pension assets directly in our common stock as described previously and use a combination of active and passive stock and bond managers to invest all other assets of the pension and postretirement plans. The managers are selected based on an analysis of, among other things, their historical investment results, frequency of management turnover, cost structure, and assets under management. Assets are periodically reallocated among the investment managers to maintain the appropriate asset mix and occasionally transferred to new or existing managers in the event that a manager is terminated.
The company’s overall investment strategy is to achieve a mix of approximately 90% of investments for long-term growth and 10% percent for near-term benefit payments with a wide diversification of asset types, fund strategies, and fund managers. The target allocations for U.S. pension plan and postretirement plan assets are 60% equity securities and 40% corporate bonds and U.S. Treasury securities. Equity securities primarily include investments in large-cap, mid-cap and small-cap companies primarily located in the United States. Fixed income securities include corporate bonds of companies from diversified industries, mortgage-backed securities, and U.S. Treasuries.
The target allocations for Non-U.S. plan assets are 50-70% equity securities, 30-40% corporate bonds and U.S. Treasury securities, and 10-20% percent
- 73 -
Table of Contents
to all other types of investments. Equity securities primarily include a broadly diversified portfolio of common stocks of publicly traded companies that are primarily non-U.S. Fixed income securities include corporate bonds, mortgage-backed securities and government bonds. Other types of investments include insurance assets and investment in hedge funds that follow several different strategies.
The fair values of our Level 1 pension assets are determined based on quoted market prices in active markets for identical assets. The fair values of our Level 2 pension assets are based on the net asset values of the funds, which are based on quoted market prices of the underlying investments. Our Level 3 assets include insurance contracts and a real estate fund. The fair values of insurance contracts of the plans of two of our Non-U.S. entities are based on the contractual terms of the arrangement with the insurance company, which in certain cases includes a nominal, but guaranteed, return. The fair value of the real estate fund is based on the net asset value of shares held at year end.
The fair values of the pension assets at December 31, 2009, by asset category are as follows:
| Fair Value Measurements at December 31, 2009 | ||||||||||||
| Asset Category | Total | Quoted Prices in Active Markets for Identical Assets (Level 1) |
Significant Observable Inputs (Level 2) |
Significant (Level 3) | ||||||||
| Cash and cash equivalents |
$ | 25.1 | $ | 25.1 | $ | – | $ | – | ||||
| Equity securities: |
||||||||||||
| - Company stock |
43.1 | 43.1 | – | – | ||||||||
| - US equity funds(1) |
204.1 | 199.8 | 4.3 | – | ||||||||
| - International equity funds(2) |
104.5 | – | 104.5 | – | ||||||||
| Fixed income funds(3) |
183.6 | 156.5 | 27.1 | – | ||||||||
| Balanced fund(4) |
21.8 | 21.8 | – | – | ||||||||
| Real estate fund |
2.4 | – | – | 2.4 | ||||||||
| Insurance assets |
13.2 | – | – | 13.2 | ||||||||
| Other investments(5) |
37.8 | – | 37.8 | – | ||||||||
| Total |
$ | 635.6 | $ | 446.3 | $ | 173.7 | $ | 15.6 | ||||
| (1) | Funds which invest in a diversified portfolio of publicly traded U.S. common stocks of large-cap, medium-cap, and small-cap companies. There are no restrictions on these investments. |
| (2) | Funds which invest in a diversified portfolio of publicly traded common stock of non-U.S. companies, primarily in Europe. There are no restrictions on these investments. |
| (3) | Funds which invest in a diversified portfolio of publicly traded government bonds, corporate bonds and mortgage-backed securities, approximately 53%, 41% and 6%, respectively. There are no restrictions on these investments. |
| (4) | Represents non-U.S. entity plan assets invested in a pooled publicly traded fund with underlying investments in a diversified portfolio of securities comprised of approximately 13% U.S. equities, 38% international equities and 49% corporate bonds. There are no restrictions on these investments. |
| (5) | Represents non-U.S. entity plan assets invested in a fund that invests in funds with underlying investments comprised of equity and debt securities, all of which have publicly available quoted market prices. |
Fair Value Measurement of plan assets using significant unobservable inputs (Level 3):
| Insurance assets | Real estate fund | Total | ||||||||||
| Balance, beginning of year |
$ | 63.9 | $ | 2.7 | $ | 66.6 | ||||||
| Actual return on assets: |
||||||||||||
| Assets held at end of year |
0.6 | (0.2 | ) | 0.4 | ||||||||
| Assets sold during the year |
5.4 | – | 5.4 | |||||||||
| Purchases, sales and settlements |
(56.7 | ) | (0.1 | ) | (56.8 | ) | ||||||
| Transfers in/(out) |
– | – | – | |||||||||
| Balance, end of year |
$ | 13.2 | $ | 2.4 | $ | 15.6 | ||||||
- 74 -
Table of Contents
The fair values of the postretirement plan assets at December 31, 2009, by asset category are as follows:
| Fair Value Measurements at December 31, 2009 | ||||||||||||
| Asset Category |
Total | Quoted Prices in Active Markets for Identical Assets (Level 1) |
Significant Observable Inputs (Level 2) |
Significant Unobservable Inputs (Level 3) | ||||||||
| Cash and cash equivalents |
$ | 4.0 | $ | 4.0 | $ | – | $ | – | ||||
| Equity funds(1) |
35.3 | 35.3 | – | – | ||||||||
| Fixed income funds(2) |
5.3 | 5.3 | – | – | ||||||||
| Total |
$ | 44.6 | $ | 44.6 | $ | – | $ | – | ||||
| (1) | Investments in publicly traded funds. 55% invested in an S&P 500 index fund and 45% invested in international index fund for Europe and Asia. |
| (2) | A publicly traded mutual fund that invests in a diversified portfolio of investment grade fixed income securities, with government, corporate and mortgage securities. The fund has a dollar weighted maturity between 3 and 10 years. |
The following table reflects expected 2010 cash flows for the pension and postretirement benefit plans:
| Expected Employer Contributions |
Pension Plans | Postretirement Plans | ||||
| U.S. Plans |
$ | 51.8 | $ | 12.0 | ||
| Non-U.S. Plans |
$ | 11.7 | $ | 0.1 | ||
The following table reflects total benefits expected to be paid from the U.S. plans and/or our assets:
| Expected Benefit Payments |
Pension Plans | Postretirement Plans | |||||||
| Prior to Medicare Part D Subsidy |
Anticipated Medicare Part D Subsidy | ||||||||
| 2010 |
$ | 33.9 | $ | 20.9 | $ | 2.5 | |||
| 2011 |
35.2 | 21.1 | 2.5 | ||||||
| 2012 |
36.7 | 20.9 | 2.6 | ||||||
| 2013 |
38.2 | 20.8 | 2.6 | ||||||
| 2014 |
39.6 | 20.4 | 2.6 | ||||||
| 2015-2019 |
219.7 | 93.9 | 11.6 | ||||||
The following table reflects the total benefits expected to be paid from the non-U.S. plans and/or our assets:
| Expected Benefit Payments |
Pension Plans | Postretirement Plans | ||||
| 2010 |
$ | 11.3 | $ | 0.1 | ||
| 2011 |
10.0 | 0.2 | ||||
| 2012 |
14.7 | 0.2 | ||||
| 2013 |
15.6 | 0.2 | ||||
| 2014 |
12.7 | 0.3 | ||||
| 2015-2019 |
99.1 | 1.4 | ||||
We also sponsor various defined contribution retirement plans in a number of countries, consisting primarily of savings, profit growth and profit sharing plans. Contributions to the savings plans are based on matching a percentage of employees’ contributions. Contributions to the profit growth and profit sharing plans are generally based on our financial performance. Amounts expensed related to these plans are as follows:
| 2009 | 2008 | 2007 | |||||||
| U.S. |
|||||||||
| Profit Growth Sharing(1) |
$ | – | $ | – | $ | 8.2 | |||
| Savings Plan |
15.5 | 24.4 | 7.8 | ||||||
| Total |
$ | 15.5 | $ | 24.4 | $ | 16.0 | |||
| Non-U.S. |
|||||||||
| Others |
$ | 4.1 | $ | 4.3 | $ | 4.4 | |||
| (1) | In conjunction with the freezing of certain of our U.S. pension plans, we discontinued the U.S. profit growth sharing plan for all U.S. salaried and non-bargaining employees effective December 31, 2007. All U.S. salaried and non-bargaining unit employees participated in an enhanced savings plan effective on January 1, 2008. |
- 75 -
Table of Contents
In addition to defined benefit pension and defined contribution retirement plans, we sponsor immaterial post employment plans in a number of countries. Those plans, in certain circumstances, provide salary continuation, disability related benefits, severance pay and continuation of health care coverage during the period after employment but before retirement.
Certain of our benefit plans provide for enhanced benefits in the event of a “change of control” as defined in the plans.
14. ACCRUED EXPENSES AND OTHER
Accrued Expenses include the following:
| December 31, |
2009 | 2008 | ||||
| Employee benefits |
$ | 33.0 | $ | 22.3 | ||
| Pension and other postretirement employee benefits |
16.6 | 16.6 | ||||
| Salaries and wages |
30.5 | 32.6 | ||||
| Taxes other than income taxes |
9.8 | 9.2 | ||||
| Environmental |
5.5 | 7.4 | ||||
| Interest, excluding interest on uncertain tax positions |
15.0 | 10.8 | ||||
| Restructuring costs |
24.4 | 7.7 | ||||
| Customer rebates |
12.0 | 17.2 | ||||
| All other |
55.4 | 66.4 | ||||
| Total |
$ | 202.2 | $ | 190.2 | ||
OTHER
On September 28, 2009, we transferred title to land previously leased to a third party to such third party. The transfer of title was triggered by the third party exercising their right to purchase the property pursuant to the terms of the original lease. The transfer of title resulted in the recognition of a gain of $8.9, which represents the unamortized balance of the consideration we received at the inception of the lease as of the date of the exercise of the option to purchase. The gain is recorded in other income/(expense), net in the consolidated statement of income.
15. COMMON STOCK AND PREFERRED STOCK
We are authorized to issue 150 million shares of common stock with a par value of $.01 per share, of which 48,722,779 shares were outstanding at December 31, 2009. A summary of changes in common stock issued and treasury stock is presented below.
| Common Stock | Treasury Stock | ||||
| Balance at December 31, 2006 |
48,132,640 | 510,006 | |||
| Purchase of treasury stock |
– | 1,252,800 | |||
| Issuance pursuant to stock option and stock-SARS plan |
– | (1,157,745 | ) | ||
| Awards of restricted stock |
– | (11,180 | ) | ||
| Forfeitures and deferrals of stock awards |
– | 3,030 | |||
| Balance at December 31, 2007 |
48,132,640 | 596,911 | |||
| Purchase of treasury stock |
– | 908,400 | |||
| Issuance pursuant to stock option and stock-SARS plan |
– | (396,784 | ) | ||
| Awards of restricted stock |
– | (12,680 | ) | ||
| Issuance of deferred shares |
– | (26,424 | ) | ||
| Balance at December 31, 2008 |
48,132,640 | 1,069,423 | |||
| Issuance – pension plan contribution |
1,184,273 | – | |||
| Issuance pursuant to stock option and stock-SARS plan |
– | (312,609 | ) | ||
| Awards of restricted stock |
– | (38,380 | ) | ||
| Issuance of deferred shares |
– | (124,300 | ) | ||
| Balance at December 31, 2009 |
49,316,913 | 594,134 |
Treasury stock, when reissued, is relieved at the moving average cost of the shares in treasury.
On April 16, 2009 our Board of Directors reduced our quarterly dividend by 90% in light of economic conditions. As a result, we paid one quarterly cash dividend of $0.125 per common share and three quarterly dividends of $0.0125 per common share in 2009 which aggregated to $7.7. During 2008, four quarterly cash dividends of $0.125 per share were declared and paid totaling $23.8. During 2007, four quarterly cash dividends of $0.10 per share were declared and paid totaling $19.1.
On January 28, 2010, our Board of Directors declared a quarterly cash dividend of $0.0125 per common share, payable on February 25, 2010 to stockholders of record as of February 10, 2010.
- 76 -
Table of Contents
Approximately $45.0 remained authorized under our stock buyback program as of December 31, 2009. We did not purchase any shares during 2009. We do not expect to repurchase any shares in 2010 given current economic conditions.
16. OPERATIONS BY SEGMENT AND GEOGRAPHIC AREAS AND IDENTIFIABLE ASSETS
In April of 2009, we reorganized our business structure to align with our revised strategic direction. As a result of this change, we now have five business segments: Coating Resins, Additive Technologies, In Process Separation, Engineered Materials, and Building Block Chemicals. Coating Resins, Additive Technologies, and In Process Separation are managed under one executive leader, and are referred to collectively as Cytec Specialty Chemicals. The Coating Resins segment is substantially comprised of the Surface Specialties business acquired from UCB in 2005. Coating Resins includes the following product lines: radiation-cured resins (Radcure resins), powder coating resins, and liquid coating resins. Included in the liquid coating resins product line are waterborne resins, amino cross-linkers, solventborne resins, and urethane resins. Additive Technologies includes polymer additives, specialty additives, and polyurethanes. As of May 19, 2009, all polyurethanes assets have been divested. In Process Separation includes mining chemicals and phosphines. Engineered Materials principally includes advanced composites, carbon fiber, structural film and pressure sensitive adhesives, and formulated resins. Building Block Chemicals principally includes acrylonitrile, hydrocyanic acid, sulfuric acid and melamine.
The accounting policies of the reportable segments are the same as those described in Note 1. All intersegment sales prices are cost based. We evaluate the performance of our operating segments primarily based on earnings from operations of the respective segment. As described in Note 3, restructuring costs and impairment charges related to unprofitable sites are not charged to our operating segments consistent with management’s view of its businesses.
Following is selected information in relation to our continuing operations for the periods indicated as revised for all periods presented in accordance with our new business segment structure:
| Coating Resins |
Additive Technologies |
In Process Separation |
Engineered Materials |
Building Block Chemicals |
Total Segments |
|||||||||||||||||||
| 2009 |
||||||||||||||||||||||||
| Net sales to external customers |
$ | 1,206.9 | $ | 239.1 | $ | 265.8 | $ | 717.5 | $ | 360.2 | $ | 2,789.5 | ||||||||||||
| Intersegment net sales |
– | 0.8 | – | – | 26.5 | 27.3 | ||||||||||||||||||
| Total net sales |
1,206.9 | 239.9 | 265.8 | 717.5 | 386.7 | 2,816.8 | ||||||||||||||||||
| (Loss)/earnings from operations |
(3.2 | ) | 11.0 | 34.6 | 96.3 | 10.2 | 148.9 | |||||||||||||||||
| Percentage of sales |
-0.3 | % | 4.6 | % | 13.0 | % | 13.4 | % | 2.6 | % | 5.3 | % | ||||||||||||
| Total assets |
1,647.2 | 205.7 | 307.3 | 833.1 | 161.9 | 3,155.2 | ||||||||||||||||||
| Capital expenditures |
27.5 | 3.0 | 8.8 | 128.7 | 20.6 | 188.6 | ||||||||||||||||||
| Depreciation and amortization |
110.8 | 10.7 | 12.9 | 20.8 | 21.3 | 176.5 | ||||||||||||||||||
| 2008 |
||||||||||||||||||||||||
| Net sales to external customers |
$ | 1,652.0 | $ | 310.5 | $ | 298.4 | $ | 867.3 | $ | 511.7 | $ | 3,639.9 | ||||||||||||
| Intersegment net sales |
– | 1.6 | – | – | 19.9 | 21.5 | ||||||||||||||||||
| Total net sales |
1,652.0 | 312.1 | 298.4 | 867.3 | 531.6 | 3,661.4 | ||||||||||||||||||
| (Loss)/earnings from operations |
(340.2 | ) | 17.9 | 51.5 | 163.2 | 4.7 | (102.9 | ) | ||||||||||||||||
| Percentage of sales |
-20.6 | % | 5.7 | % | 17.3 | % | 18.8 | % | 0.9 | % | -2.8 | % | ||||||||||||
| Total assets |
1,844.7 | 245.3 | 327.4 | 815.7 | 169.4 | 3,402.5 | ||||||||||||||||||
| Capital expenditures |
64.3 | 8.4 | 8.8 | 94.0 | 16.9 | 192.4 | ||||||||||||||||||
| Depreciation and amortization |
92.8 | 10.1 | 15.5 | 19.6 | 20.8 | 158.8 | ||||||||||||||||||
| 2007 |
||||||||||||||||||||||||
| Net sales to external customers |
$ | 1,658.1 | $ | 330.2 | $ | 269.3 | $ | 789.0 | $ | 457.2 | $ | 3,503.8 | ||||||||||||
| Intersegment net sales |
– | 5.7 | – | – | 34.9 | 40.6 | ||||||||||||||||||
| Total net sales |
1,658.1 | 335.9 | 269.3 | 789.0 | 492.1 | 3,544.4 | ||||||||||||||||||
| Earnings from operations |
102.2 | 16.2 | 39.2 | 145.5 | 23.8 | 326.9 | ||||||||||||||||||
| Percentage of sales |
6.2 | % | 4.8 | % | 14.6 | % | 18.4 | % | 4.8 | % | 9.2 | % | ||||||||||||
| Total assets |
2,359.9 | 251.7 | 311.0 | 732.5 | 203.5 | 3,858.6 | ||||||||||||||||||
| Capital expenditures |
49.4 | 11.1 | 6.1 | 27.2 | 19.0 | 112.8 | ||||||||||||||||||
| Depreciation and amortization |
78.7 | 7.3 | 11.8 | 19.0 | 24.9 | 141.7 | ||||||||||||||||||
- 77 -
Table of Contents
The following table provides a reconciliation of selected segment information to corresponding amounts contained in our consolidated financial statements:
| 2009 | 2008 | 2007 | ||||||||||
| Net sales: |
||||||||||||
| Net sales from segments |
$ | 2,816.8 | $ | 3,661.4 | $ | 3,544.4 | ||||||
| Elimination of intersegment revenue |
(27.3 | ) | (21.5 | ) | (40.6 | ) | ||||||
| Total consolidated net sales |
$ | 2,789.5 | $ | 3,639.9 | $ | 3,503.8 | ||||||
| Earnings from operations: |
||||||||||||
| Earnings/(loss) from segments(1) |
$ | 148.9 | $ | (102.9 | ) | $ | 326.9 | |||||
| Corporate unallocated(2) |
(117.8 | ) | (18.2 | ) | (2.8 | ) | ||||||
| Total consolidated earnings/(loss) from operations |
$ | 31.1 | $ | (121.1 | ) | $ | 324.1 | |||||
| Total assets: |
||||||||||||
| Assets from segments |
$ | 3,155.2 | $ | 3,402.5 | $ | 3,858.6 | ||||||
| Other assets(3) |
404.2 | 237.5 | 227.0 | |||||||||
| Total consolidated assets |
$ | 3,559.4 | $ | 3,640.0 | $ | 4,085.6 | ||||||
| (1) | 2008 includes a pre-tax charge of $5.6 for incremental accelerated depreciation in relation to the decision to exit Radcure manufacturing at a leased facility in Pampa, Texas. 2008 also includes a pre-tax goodwill impairment charge of $385.0. |
| (2) | 2009 includes a pre-tax charge of $90.2 for various manufacturing and organizational restructuring initiatives across the Specialty Chemical segments and Engineered Materials segment and within corporate operations as well as restructuring charges related to the shared services initiative. 2009 also includes a net loss of $1.4 related to the exit of the polyurethane product line in Europe and Asia. 2008 includes a net restructuring charge of $14.9 for additional restructuring costs primarily associated with various organizational restructuring initiatives across the Specialty Chemicals segments. 2007 includes a restructuring charge of $2.6 for the polymer additives Willow Island restructuring, charges of $2.2 primarily related to the restructuring of an unprofitable manufacturing site in Europe, a charge of $1.4 for the Wallingford restructuring, and a gain of $13.6 for the second and third phases of the sale of the water treatment and acrylamide product lines. |
| (3) | Includes cash and cash equivalents at December 31, 2009, 2008 and 2007 of $261.7, $55.3 and $76.8, respectively. |
Operations by Geographic Areas: Net sales to unaffiliated customers presented below are based upon the sales destination, which is consistent with how we manage our businesses. U.S. exports included in net sales are based upon the sales destination and represent direct sales of U.S.-based entities to unaffiliated customers outside of the United States. Identifiable assets are those assets used in our operations in each geographic area. Unallocated assets are primarily cash and cash equivalents, miscellaneous receivables, construction in progress, deferred taxes and the fair values of derivatives.
| 2009 | 2008 | 2007 | |||||||
| Net Sales |
|||||||||
| United States |
$ | 995.1 | $ | 1,322.1 | $ | 1,188.6 | |||
| Other Americas |
225.5 | 305.5 | 296.2 | ||||||
| Asia / Pacific |
489.4 | 508.9 | 498.5 | ||||||
| Europe, Middle East and Africa |
1,079.5 | 1,503.4 | 1,520.5 | ||||||
| Total |
$ | 2,789.5 | $ | 3,639.9 | $ | 3,503.8 | |||
| U.S. exports included in net sales above |
|||||||||
| Other Americas |
$ | 80.5 | $ | 114.8 | $ | 106.4 | |||
| Asia / Pacific |
98.3 | 86.1 | 102.4 | ||||||
| Europe, Middle East and Africa |
160.8 | 206.2 | 239.9 | ||||||
| Total |
$ | 339.6 | $ | 407.1 | $ | 448.7 | |||
| Identifiable assets |
|||||||||
| United States |
$ | 1,302.4 | $ | 1,493.6 | $ | 1,557.0 | |||
| Other Americas |
160.8 | 168.2 | 187.4 | ||||||
| Asia / Pacific |
241.5 | 286.8 | 271.9 | ||||||
| Europe, Middle East and Africa |
1,082.2 | 1,230.3 | 1,675.8 | ||||||
| Total Identifiable Assets |
2,786.9 | 3,178.9 | 3,692.1 | ||||||
| Equity in net assets of and advances to associated companies |
21.5 | 22.1 | 23.8 | ||||||
| Unallocated assets(1) |
751.0 | 439.0 | 369.7 | ||||||
| Total assets |
$ | 3,559.4 | $ | 3,640.0 | $ | 4,085.6 | |||
| (1) | Includes cash and cash equivalents at December 31, 2009, 2008 and 2007 of $261.7, $55.3 and $76.8, respectively. |
- 78 -
Table of Contents
17. RISKS AND UNCERTAINTIES
Our revenues are largely dependent on the continued operation of our various manufacturing facilities. There are many risks involved in operating chemical manufacturing plants, including the breakdown, failure or substandard performance of equipment, operating errors, natural disasters, the need to comply with directives of, and maintain all necessary permits from, government agencies and potential terrorist attacks. Our operations can be adversely affected by raw material shortages, labor force shortages or work stoppages and events impeding or increasing the cost of transporting our raw materials and finished products. The occurrence of material operational problems, including but not limited to the above events, may have a material adverse effect on the productivity and profitability of a particular manufacturing facility. With respect to certain facilities, such events could have a material effect on our company as a whole.
Our operations are also subject to various hazards incident to the production of industrial chemicals. These include the use, handling, processing, storage and transportation of certain hazardous materials. Under certain circumstances, these hazards could cause personal injury and loss of life, severe damage to and destruction of property and equipment, environmental damage and suspension of operations. Claims arising from any future catastrophic occurrence at one of our locations may result in Cytec being named as a defendant in lawsuits asserting potentially large claims.
We perform ongoing credit evaluations of our customers’ financial condition including an assessment of the impact, if any, of
prevailing economic conditions. We generally do not require collateral from our customers. We are exposed to credit losses in the event of nonperformance by counterparties on derivative instruments. The counterparties to these transactions are major financial institutions, which may be adversely affected by the current global credit crisis. However, we consider the risk of default to be minimal. We typically do not require collateral or other security to support potential credit risk.
International operations are subject to various risks which may or may not be present in U.S. operations. These risks include political instability, the possibility of expropriation, restrictions on royalties, dividends and remittances, instabilities of currencies, requirements for governmental approvals for new ventures and local participation in operations such as local equity ownership and workers’ councils. Currency fluctuations between the U.S. dollar and the currencies in which we do business have caused and will continue to cause foreign currency transaction gains and losses, which may be material. While we do not currently believe that we are likely to suffer a material adverse effect on our results of operations in connection with our existing international operations, any of these events could have an adverse effect on our international operations in the future by reducing the demand for our products, affecting the prices at which we can sell our products or otherwise having an adverse effect on our operating performance.
18. SUBSEQUENT EVENTS
Subsequent events have been evaluated through February 24, 2010, which is the filing date of our report with the SEC for the year ended December 31, 2009. No subsequent events requiring disclosures have occurred through this date.
- 79 -
Table of Contents
REPORTS OF INDEPENDENT REGISTERED PUBLIC ACCOUNTING FIRM
The Board of Directors and Stockholders
Cytec Industries Inc.:
We have audited the accompanying consolidated balance sheets of Cytec Industries Inc. and subsidiaries (the “Company”) as of December 31, 2009 and 2008, and the related consolidated statements of income, stockholders’ equity and cash flows for each of the years in the three-year period ended December 31, 2009. In connection with our audits of the consolidated financial statements, we also have audited the consolidated financial statement schedule, “Schedule II—Valuation and Qualifying Accounts.” These consolidated financial statements and financial statement schedule are the responsibility of the Company’s management. Our responsibility is to express an opinion on these consolidated financial statements and financial statement schedule based on our audits.
We conducted our audits in accordance with the standards of the Public Company Accounting Oversight Board (United States). Those standards require that we plan and perform the audit to obtain reasonable assurance about whether the financial statements are free of material misstatement. An audit includes examining, on a test basis, evidence supporting the amounts and disclosures in the financial statements. An audit also includes assessing the accounting principles used and significant estimates made by management, as well as evaluating the overall financial statement presentation. We believe that our audits provide a reasonable basis for our opinion.
In our opinion, the consolidated financial statements referred to above present fairly, in all material respects, the financial position of the Company as of December 31, 2009 and 2008, and the results of their operations and their cash flows for each of the years in the three-year period ended December 31, 2009, in conformity with U.S. generally accepted accounting principles. Also in our opinion, the related financial statement schedule, when considered in relation to the basic consolidated financial statements taken as a whole, presents fairly, in all material respects, the information set forth therein.
As discussed in the Notes to the consolidated financial statements, the Company, in 2009, changed its method of accounting for fair value measurements for non-financial assets and non-financial liabilities, in 2008, changed its methods of accounting for the measurement date of pension and other postretirement plan benefits and for fair value measurements for financial assets and financial liabilities and, in 2007, changed its method of accounting for uncertainty in income taxes.
We also have audited, in accordance with the standards of the Public Company Accounting Oversight Board (United States), the Company’s internal control over financial reporting as of December 31, 2009, based on criteria established in Internal Control—Integrated Framework issued by the Committee of Sponsoring Organizations of the Treadway Commission (COSO), and our report dated February 24, 2010 expressed an unqualified opinion on the effectiveness of the Company’s internal control over financial reporting.
/s/ KPMG LLP
Short Hills, New Jersey
February 24, 2010
- 80 -
Table of Contents
The Board of Directors and Stockholders
Cytec Industries Inc.:
We have audited Cytec Industries Inc. and subsidiaries’ (the “Company”) internal control over financial reporting as of December 31, 2009, based on criteria established in Internal Control—Integrated Framework issued by the Committee of Sponsoring Organizations of the Treadway Commission (COSO). The Company’s management is responsible for maintaining effective internal control over financial reporting and for its assessment of the effectiveness of internal control over financial reporting, included in Management’s Report on Internal Control Over Financial Reporting, appearing in Item 9A, Controls and Procedures. Our responsibility is to express an opinion on the Company’s internal control over financial reporting based on our audit.
We conducted our audit in accordance with the standards of the Public Company Accounting Oversight Board (United States). Those standards require that we plan and perform the audit to obtain reasonable assurance about whether effective internal control over financial reporting was maintained in all material respects. Our audit included obtaining an understanding of internal control over financial reporting, assessing the risk that a material weakness exists, and testing and evaluating the design and operating effectiveness of internal control based on the assessed risk. Our audit also included performing such other procedures as we considered necessary in the circumstances. We believe that our audit provides a reasonable basis for our opinion.
A company’s internal control over financial reporting is a process designed to provide reasonable assurance regarding the reliability of financial reporting and the preparation of financial statements for external purposes in accordance with generally accepted accounting principles. A company’s internal control over financial reporting includes those policies and procedures that (1) pertain to the maintenance of records that, in reasonable detail, accurately and fairly reflect the transactions and dispositions of the assets of the company; (2) provide reasonable assurance that transactions are recorded as necessary to permit preparation of financial statements in accordance with generally accepted accounting principles, and that receipts and expenditures of the company are being made only in accordance with authorizations of management and directors of the company; and (3) provide reasonable assurance regarding prevention or timely detection of unauthorized acquisition, use, or disposition of the company’s assets that could have a material effect on the financial statements.
Because of its inherent limitations, internal control over financial reporting may not prevent or detect misstatements. Also, projections of any evaluation of effectiveness to future periods are subject to the risk that controls may become inadequate because of changes in conditions, or that the degree of compliance with the policies or procedures may deteriorate.
In our opinion, the Company maintained, in all material respects, effective internal control over financial reporting as of December 31, 2009, based on criteria established in Internal Control—Integrated Framework issued by the Committee of Sponsoring Organizations of the Treadway Commission (COSO).
We also have audited, in accordance with the standards of the Public Company Accounting Oversight Board (United States), the consolidated balance sheets of Cytec Industries Inc. and subsidiaries as of December 31, 2009 and 2008, and the related consolidated statements of income, stockholders’ equity and cash flows for each of the years in the three-year period ended December 31, 2009, and our report dated February 24, 2010 expressed an unqualified opinion on those consolidated financial statements.
/s/ KPMG LLP
Short Hills, New Jersey
February 24, 2010
- 81 -
Table of Contents
QUARTERLY DATA (UNAUDITED)
| (Dollars in millions, except per share amounts) | 1Q | 2Q | 3Q | 4Q | Year | ||||||||||||||
| 2009 |
|||||||||||||||||||
| Net sales |
$ | 612.0 | $ | 685.3 | $ | 740.2 | $ | 752.0 | $ | 2,789.5 | |||||||||
| Gross profit(1) |
114.2 | 82.3 | 134.8 | 141.1 | 472.4 | ||||||||||||||
| Net (loss)/earnings attributable to Cytec Industries Inc. |
(0.1 | ) | (24.7 | ) | 12.5 | 9.8 | (2.5 | ) | |||||||||||
| (Loss)/earnings per common share attributable to Cytec Industries Inc.: |
|||||||||||||||||||
| Basic net (loss)/earnings per share(2) |
$ | 0.00 | $ | (0.52 | ) | $ | 0.26 | $ | 0.20 | $ | (0.05 | ) | |||||||
| Diluted net (loss)/earnings per share(2) |
$ | 0.00 | $ | (0.52 | ) | $ | 0.26 | $ | 0.20 | $ | (0.05 | ) | |||||||
| 2008 |
|||||||||||||||||||
| Net sales |
$ | 973.0 | $ | 1,005.8 | $ | 963.0 | $ | 698.1 | $ | 3,639.9 | |||||||||
| Gross profit(1) |
200.3 | 209.6 | 197.2 | 120.1 | 727.2 | ||||||||||||||
| Net (loss)/earnings attributable to Cytec Industries Inc. |
49.1 | 56.5 | 46.3 | (350.7 | ) | (198.8 | ) | ||||||||||||
| (Loss)/earnings per common share attributable to Cytec Industries Inc.: |
|||||||||||||||||||
| Basic net (loss)/earnings per share(2) |
$ | 1.02 | $ | 1.18 | $ | 0.97 | $ | (7.39 | ) | $ | (4.16 | ) | |||||||
| Diluted net (loss)/earnings per share(2) |
$ | 1.01 | $ | 1.16 | $ | 0.96 | $ | (7.39 | ) | $ | (4.16 | ) | |||||||
| (1) | Gross profit is derived by subtracting manufacturing cost of sales from net sales. |
| (2) | The sum of the quarters may not equal the full year basic and diluted earnings per share since each period is calculated separately. |
- 82 -
Table of Contents
CHANGES IN AND DISAGREEMENTS WITH ACCOUNTANTS ON ACCOUNTING AND FINANCIAL DISCLOSURE
Not applicable.
CONTROLS AND PROCEDURES
CONCLUSION REGARDING THE EFFECTIVENESS OF DISCLOSURE CONTROLS AND PROCEDURES
An evaluation was carried out by our management, under the supervision and with the participation of our Chief Executive Officer and Chief Financial Officer, of the effectiveness of our disclosure controls and procedures (as defined in Rule 13a-15(e) of the Exchange Act), as of December 31, 2009. Based upon that evaluation, the Chief Executive Officer and Chief Financial Officer have concluded that our current disclosure controls and procedures are effective.
MANAGEMENT’S REPORT ON INTERNAL CONTROL OVER FINANCIAL REPORTING
Our management is responsible for establishing and maintaining adequate internal control over financial reporting, as defined in Rule 13a-15(f) of the Exchange Act. Under the supervision and with the participation of our management, including our Chief Executive Officer and Chief Financial Officer, an evaluation of the effectiveness of our internal control over financial reporting was carried out. Management’s evaluation was based on the criteria established in Internal Control – Integrated Framework issued by the Committee of Sponsoring Organizations of the Treadway Commission (COSO). Based on this evaluation, management has concluded that our internal control over financial reporting was effective as of December 31, 2009.
Our internal control over financial reporting as of December 31, 2009, has been audited by KPMG LLP, an independent registered public accounting firm, as stated in their report which is included in Item 8 of this report.
CHANGES IN INTERNAL CONTROL
There were no changes in internal controls during the fourth quarter of 2009 that have materially affected, or are reasonably likely to materially affect, the Company’s internal control over financial reporting.
OTHER INFORMATION
Not applicable.
- 83 -
Table of Contents
PART III
DIRECTORS AND EXECUTIVE OFFICERS OF THE REGISTRANT
Set forth below is certain information concerning our executive officers as of February 15, 2010. Each such person serves at the pleasure of our Board of Directors.
| Name | Age | Positions | ||
| S. D. Fleming |
51 | Mr. Fleming was elected Chairman of the Board, President and Chief Executive Officer effective January 1, 2009. He previously served as President and Chief Operating Officer since June 27, 2008. Prior thereto, he was President of Cytec Specialty Chemicals since October 2005 and was elected as an officer in September 2004. Mr. Fleming previously served as President of Cytec Performance Specialties, Vice President, Phosphine and Mining Chemicals and other executive positions in our specialty chemicals businesses for more than three years. | ||
| D. M. Drillock |
52 | Mr. Drillock was elected Vice President and Chief Financial Officer in May, 2007. He previously served as Vice President, Controller and Investor Relations for more than five years. | ||
| W. N. Avrin |
54 | Mr. Avrin is President, Building Block Chemicals, and Vice President, Corporate and Business Development and has held this position for more than five years. | ||
| R. Smith |
51 | Mr. Smith is Vice President, General Counsel and Secretary, and has held this position for more than five years. | ||
| T. P. Wozniak |
56 | Mr. Wozniak is Treasurer of Cytec and has held this position for more than five years. | ||
| F. Aranzana |
51 | Mr. Aranzana is President of Cytec Specialty Chemicals and an officer since June 2008. Before joining Cytec as part of the UCB acquisition in 2005, he served as Vice President with UCB. | ||
| R. Charles |
52 | Ms. Charles was elected Vice President of Human Resources in March, 2008. Previously, she served as Chief Human Resources Officer of E.I. DuPont Electronic and Communications Technologies Platform, Director of Global People Managers Processes and Director of Global Human Resources, DuPont Nylon since 1998. |
We have a specific Code of Ethics which is applicable to our chief executive officer, our chief financial officer, our chief accounting officer and our controller. This code sets forth certain of our expectations, including that the officers will act with honesty and integrity, will avoid actual and apparent conflicts of interest, will comply with all applicable laws, will disclose information that is complete and understandable and will act in good faith and responsibly. The Code also requires the prompt reporting of violations to the Chair of the Audit Committee. A current copy of the Code is available on our website accessible at www.Cytec.com. We will disclose information regarding any amendment to the Code or any waiver from any of its provisions on the same website. There have never been any waivers granted regarding our Code.
The remainder of the information required by this Item is incorporated by reference from the “Election of Directors” section of our definitive Proxy Statement for our 2010 Annual Meeting of Common Stockholders,to be held on April 22, 2010.
EXECUTIVE COMPENSATION
The information required by this Item is incorporated by reference from the “Summary Compensation Table,” the “Grants of Plan-Based Awards,” the “Outstanding Equity Awards at Fiscal Year-End,” the “Option Exercises and Stock Vested,” the “Pension Benefits,” the “Nonqualified Deferred Compensation,” the “Director Compensation Tables,” the “Compensation Discussion and Analysis,” and the “Potential Payments Upon Termination or Change-In-Control” sections of our definitive Proxy Statement for our 2010 Annual Meeting of Common Stockholders to be held on April 22, 2010.
SECURITY OWNERSHIP OF CERTAIN BENEFICIAL OWNERS AND MANAGEMENT AND RELATED STOCKHOLDER MATTERS
The information required by Item 403 of Regulation S-K will be included under the caption “Cytec Stock Ownership by Directors and Officers” in the 2010 Proxy Statement, and that information is incorporated by reference.
EQUITY COMPENSATION PLAN INFORMATION
The table below sets forth, as of December 31, 2009, the number of shares of the Company’s Common Stock issuable upon the exercise of outstanding options, warrants and rights and their weighted average exercise price.
- 84 -
Table of Contents
Actual at December 31, 2009
| Number of Securities to be Issued Upon Exercise of Outstanding Options, Warrants and Rights |
Weighted Average Exercise Price of Outstanding Options, Warrants and Rights |
Number of Securities Remaining Available for Future Issuance Under Equity Compensation Plans (excluding securities reflected in the first column) |
|||||||
| Equity compensation plans approved by stockholders |
1,673,313 | (1) | $ | 39.67 | 5,014,478 | (1) | |||
| Equity compensation plans not approved by stockholders |
0 | 0 | 0 | ||||||
| (1) | The number of securities to be issued upon exercise of outstanding stock-settled SARs cannot be determined precisely because it depends on the relative price of a share of Cytec’s stock to the grant price of the stock-settled SAR on the date such SAR is exercised. At December 31, 2009, there were 1,417,970 stock-settled SARs outstanding and we estimate that no stock-settled SARS will be exercised based on the closing price on December 31, 2009. This estimate also affects the number of shares remaining available for future issuance. |
CERTAIN RELATIONSHIPS AND RELATED TRANSACTIONS
The information required by this Item is incorporated by reference from the “Certain Relationships and Related Transactions” section of our definitive Proxy Statement for our 2010 Annual Meeting of Common Stockholders to be held on April 22, 2010.
PRINCIPAL ACCOUNTANT FEES AND SERVICES
The information required by this Item is incorporated by reference from the “Fees Paid to the Auditors” section of our definitive Proxy Statement for our 2010 Annual Meeting of Common Stockholders to be held on April 22, 2010.
- 85 -
Table of Contents
PART IV
EXHIBITS AND FINANCIAL STATEMENT SCHEDULES
| (a)(1) | List of Financial Statements: |
Cytec Industries Inc. and Subsidiaries Consolidated Financial Statements (Refer to Item 8):
Consolidated Balance Sheets as of December 31, 2009, and 2008
Consolidated Statements of Income for the Years ended December 31, 2009, 2008, and 2007
Consolidated Statements of Cash Flows for the Years ended December 31, 2009, 2008, and 2007
Consolidated Statements of Stockholders’ Equity for the Years ended December 31, 2009, 2008, and 2007
Notes to Consolidated Financial Statements
Reports of Independent Registered Public Accounting Firm
| (a)(2) | Cytec Industries Inc. and Subsidiaries Financial Statement Schedules |
Schedule II – Valuation and Qualifying Accounts
Schedules, other than “Schedule II –Valuation and Qualifying Accounts,” are omitted because of the absence of the conditions under which they are required or because the information called for are included in the consolidated financial statements or notes thereto.
| (a)(3) | Exhibits |
| Exhibit No. | Description | |
| 3.1(a) | Certificate of Incorporation (incorporated by reference to exhibit 3.1(a) to Cytec’s quarterly report on Form 10-Q for the quarter ended September 30, 1996). | |
| 3.1(b) | Certificate of Amendment to Certificate of Incorporation dated May 13, 1997 (incorporated by reference to exhibit 3.1(a) to Cytec’s quarterly report on Form 10-Q for the quarter ended June 30, 1997). | |
| 3.1(c) | Conformed copy of Cytec’s certificate of incorporation, as amended (incorporated by reference to exhibit 3(c) to Cytec’s registration statement on Form S-8, registration number 333-45577). | 3.2 | By-laws, as amended through December 10, 2009 (incorporated by reference to Exhibit 3.1 to Cytec’s current report on Form 8-K, dated December 11, 2009). |
| 4.1 | Form of Common Stock Certificate (incorporated by reference to exhibit 4.1 to Cytec’s registration statement on Form 10). | |
| 4.2(a) | Indenture, dated as of March 15, 1998 between Cytec and PNC Bank, National Association as Trustee (incorporated by reference to Exhibit 4.1 of Cytec’s current report on Form 8-K, dated March 18, 1998). | |
| 4.2(b) | Supplemental Indenture, dated as of May 11, 1998 between Cytec and PNC Bank National Association, as Trustee (incorporated by reference to Exhibit 4.2 to Cytec’s quarterly report on Form 10-Q for the quarter ended March 31, 1998). | |
| 4.2(c) | Second Supplemental Indenture, dates as of July 6, 2009, between Cytec and The Bank of New York Mellon, as Trustee (incorporated by reference to Exhibit 4.2 to Cytec’s current report on Form 8-K dated July 6, 2009). | |
| 4.3 | 4.60% Senior Note due 2013 (incorporated by reference to Exhibit 4.2 to Cytec’s quarterly report on Form 10-Q for the quarter ended June 30, 2003). | |
| 4.4 | 5.500% Senior Note due 2010 (incorporated by reference to Exhibit 4.1 to Cytec’s current report on Form 8-K, dated October 4, 2005). | |
| 4.5 | 6.00% Senior Note due 2015 (incorporated by reference to Exhibit 4.2 to Cytec’s current report on Form 8-K, dated October 4, 2005). | |
| 4.6 | 8.95% Senior Note due 2017 (incorporated by reference to Exhibit 4.1 to Cytec’s current report on Form 8-K dated July 6, 2009). | |
| 10.1 | Amended and Restated Five Year Credit Agreement dated as of June 7, 2007, among Cytec, the banks named therein and Citigroup Global Markets, Inc., as lead arranger and book manager (“Credit Agreement”) (incorporated by reference to exhibit 10.1 to Cytec’s current report on Form 8-K dated June 7, 2007). |
- 86 -
Table of Contents
| Exhibit No. | Description | |
| 10.1(a) | Amendment Number 1 to Credit Agreement (incorporated by reference to Exhibit 10.1 to Cytec’s current report on Form 8-K dated May 15, 2009). | |
| 10.2 | Executive Compensation Plans and Arrangements (incorporated by reference to exhibit 10.12 to Cytec’s annual report on Form 10-K for the year ended December 31, 2003). | |
| 10.2(a) | 1993 Stock Award and Incentive Plan, as amended through April 17, 2008 (incorporated by reference to Exhibit A to Cytec’s proxy statement dated March 11, 2008 as filed on Schedule 14A). | |
| 10.2(b) | Form of Performance Stock Award/Performance Cash Award Grant Letter (incorporated by reference to exhibit 10.12(b) to Cytec’s annual report on Form 10-K for the year ended December 31, 1999). | |
| 10.2(c) | Rule No. 1 under 1993 Stock Award and Incentive Plan as amended through January 20, 2003 (incorporated by reference to exhibit 10.12(c) to Cytec’s Annual Report on Form 10-K for the year ended December 31, 2002). | |
| 10.2(d)(i) | Form of Stock Option Grant Letter (incorporated by reference to exhibit 10.13(d) of Cytec’s annual report on Form 10-K for the year ended December 31, 1998). | |
| 10.2(d)(ii) | Form of Stock Option Grant Letter used for grants to officers from January 21, 2002 through January 19, 2004 (incorporated by reference to Exhibit 10.12(d)(ii) to Cytec’s annual report on Form 10-K for the year ended December 31, 2001). | |
| 10.2(d)(iii) | Form of Stock Option Grant Letter used for grants to officers from January 21, 2004 through February 8, 2006 (incorporated by reference to exhibit 10.12 to Cytec’s annual report on Form 10-K for the year ended December 31, 2003). | |
| 10.2(d)(iv) | Form of Performance Stock Award Grant Letter used for grants to officers during 2004 and 2005 (incorporated by reference to exhibit 10.12 to Cytec’s annual report on Form 10-K for the year ended December 31, 2003). | |
| 10.2(d)(v) | Form of common stock settled Stock Appreciation Rights (“SARs”) Award letter used for grants to officers from February 9, 2006 (incorporated by reference to Exhibit 10.2(d)(v) to Cytec’s annual report on Form 10-K for the year ended December 31, 2005). | |
| 10.2(d)(vi) | Form of Performance Cash Award letter used for grants to officers from February 9, 2006 (incorporated by reference to exhibit 10.2(d)(vi) to Cytec’s annual report on Form 10-K for the year ended December 31, 2006). | |
| 10.2(d)(vii) | Form of Performance Stock Award Letter used for grants to officers from January 29, 2008 (incorporated by reference to exhibit 10.2(d)(vii) to Cytec’s annual report on Form 10-K for the year ended December 31, 2007). | |
| 10.2(d)(viii) | Form of Restricted Stock Award letter used for grants to directors from May 2007 (incorporated by reference to exhibit 10.2(d)(viii) to Cytec’s quarterly report on Form 10-Q for the quarter ended March 31, 2008). | |
| 10.2(d)(ix) | Form of Performance Cash Award letter, as amended, used for grants to officers from January 27, 2010 (filed herewith). | |
| 10.2(d)(x) | Form of Restricted Stock Unit Award letter used for grants to executive officers from January 27, 2010 (incorporated by reference to Exhibit 10.1 to Cytec’s current report on Form 8-K dated February 2, 2010). | |
| 10.2(d)(xi) | Form of Restricted Stock Award letter (no deferral) used for grants to directors from April 2009 (incorporated by reference to Exhibit 10.2(d)(xi) to Cytec’s quarterly report on Form 10-Q for the quarter ended March 31, 2009). | |
| 10.2(d)(xii) | Form of Restricted Stock Award letter (with deferral) used for grants to directors from April 2009 (incorporated by reference to Exhibit 10.2(d)(xii) to Cytec’s quarterly report on Form 10-Q for the quarter ended March 31, 2009). | |
| 10.2(d)(xiii) | Form of Stock Option Grant letter used for grants to executive officers from January 27, 2010 (incorporated by reference to Exhibit 10.2 to Cytec’s current report on Form 8-K dated February 2, 2010). | |
| 10.2(d)(xiv) | Form of Stock Option Grant letter used for grants from January 27, 2010 to executive officers residing in Belgium (filed herewith). | |
| 10.2(d)(xv) | Form of 2010 Executive Claw Back Acknowledgement (filed herewith). |
- 87 -
Table of Contents
| Exhibit No. | Description | |
| 10.2(e) | Rule No. 2, as amended through January 27, 1997, under 1993 Stock Award and Incentive Plan (incorporated by reference to exhibit 10.13(e) to Cytec’s annual report on Form 10-K for the year ended December 31, 1996). | |
| 10.2(f) | Executive Income Continuity Plan, as amended and restated October 15, 2009 (incorporated by reference to Exhibit 10.2(f) to Cytec’s quarterly report on Form 10-Q for the quarter ended September 30, 2009). | |
| 10.2(g) | Key Manager Income Continuity Plan, as amended and restated October 15, 2009 (incorporated by reference to Exhibit 10.2(g) to Cytec’s quarterly report on Form 10-Q for the quarter ended September 30, 2009). | |
| 10.2(h) | Employee Income Continuity Plan, as amended and restated December 15, 2008 (incorporated by reference to exhibit 10.2(h) to Cytec’s annual report on Form 10-K for the year ended December 31, 2008). | |
| 10.2(i) | Cytec Excess Retirement Benefit Plan, as amended and restated effective January 1, 2009 (incorporated by reference to exhibit 10.2(i) to Cytec’s annual report on Form 10-K for the year ended December 31, 2008). | |
| 10.2(j) | Cytec Supplemental Employees’ Retirement Plan, as amended and restated effective January 1, 2009 (incorporated by reference to exhibit 10.2(j) to Cytec’s annual report on Form 10-K for the year ended December 31, 2008). | |
| 10.2(k) | Cytec Executive Supplemental Employees’ Retirement Plan, as amended and restated effective January 1, 2009 (incorporated by reference to exhibit 10.2(k) to Cytec’s annual report on Form 10-K for the year ended December 31, 2008). | |
| 10.2(l) | Cytec Compensation Taxation Equalization Plan, as restated effective January 1, 2009 (incorporated by reference to exhibit 10.2(l) to Cytec’s annual report on Form 10-K for the year ended December 31, 2008). | |
| 10.2(m) | Cytec Supplemental Savings Plan, as amended and restated effective January 1, 2009 (incorporated by reference to exhibit 10.2(m) to Cytec’s annual report on Form 10-K for the year ended December 31, 2008). | |
| 10.2(n) | Amended and Restated Trust Agreement effective as of December 15, 1994 between the Cytec and Vanguard Fiduciary Trust Company, as successor trustee (incorporated by reference to exhibit 10.12(p) to Cytec’s annual report on Form 10-K for the year ended December 31, 1999). | |
| 10.2(o) | Deferred Compensation Plan, as amended and restated December 15, 2008 (incorporated by reference to exhibit 10.2(o) to Cytec’s annual report on Form 10-K for the year ended December 31, 2008). | |
| 10.2(p) | Rule No. 4 under 1993 Stock Award and Incentive Plan as amended (incorporated by reference to Exhibit 10.2(p) to Cytec’s annual report on Form 10-K for the year ended December 31, 2005). | |
| 10.2(q) | Relocation Agreement for Shane Fleming dated December 11, 2005 (incorporated by reference to Exhibit 10.3 to Cytec’s annual report on Form 10-K for the year ended December 31, 2005). | |
| 10.2(r) | Amended Restricted Stock Award Agreement between the Registrant and M. R. Charles dated April 1, 2009 (incorporated by reference to Exhibit 10.2(r) to Cytec’s quarterly report on Form 10-Q for the quarter ended March 31, 2009). | |
| 10.2(s) | Restricted Stock Award Agreement for William N. Avrin dated March 1, 2005 (incorporated by reference to Exhibit 10.5 to Cytec’s annual report on Form 10-K for the year ended December 31, 2005). | |
| 10.2(t) | Employment Agreement between the Registrant and M.R. Charles dated March 14, 2008 (incorporated by reference to exhibit 10.2(t) to Cytec’s quarterly report on Form 10-Q for the quarter ended March 31, 2008). | |
| 10.2(u) | Retirement Letter Agreement for Joseph E. Marosits dated April 2, 2008 (incorporated by reference to Exhibit 10.2(u) to Cytec’s quarterly report on Form 10-Q for the quarter ended June 30, 2008). | |
| 10.2(v) | Stock Option Grant Letter to David Lilley dated January 28, 2009 (incorporated by reference to exhibit 10.2(v) to Cytec’s annual report on Form 10-K for the year ended December 31, 2008). |
- 88 -
Table of Contents
| Exhibit No. | Description | |
| 10.2(w) | Employment Agreement between a subsidiary of the Registrant and Frank Aranzana dated as of July 1, 2008 (filed herewith). | |
| 10.2(x) | AXA Supplemental Plan dated as of March 1, 2008 (filed herewith). | |
| 10.2(y) | Retirement Agreement dated as of October 27, 2009, between the Registrant and Steven C. Speak (incorporated by reference to Exhibit 10.1 to Cytec’s current report on Form 8-K dated October 28, 2009). | |
| 12 | Computation of Ratio of Earnings to Fixed Charges. | |
| 21 | Subsidiaries of the Company. | |
| 23 | Consent of KPMG LLP. | |
| 24(a-j) | Powers of Attorney of C.A. Davis, A.G. Fernandes, L. L. Hoynes, Jr., B. C. Johnson, C.P. Lowe, W. P. Powell, T.W. Rabaut, J.R. Satrum, R. P. Sharpe and J. R. Stanley. | |
| 31.1 | Certification of Shane Fleming, Chief Executive Officer pursuant to Rule 13a-14(a), as adopted pursuant to Section 302 of the Sarbanes-Oxley Act of 2002. | |
| 31.2 | Certification of David M. Drillock, Chief Financial Officer pursuant to Rule 13a-14(a), as adopted pursuant to Section 302 of the Sarbanes-Oxley Act of 2002. | |
| 32.1 | Certification of Shane Fleming, Chief Executive Officer pursuant to 18 U.S.C. Section 1350, as adopted pursuant to Section 906 of the Sarbanes-Oxley Act of 2002. | |
| 32.2 | Certification of David M. Drillock, Chief Financial Officer pursuant to 18 U.S.C. Section 1350, as adopted pursuant to Section 906 of the Sarbanes-Oxley Act of 2002. |
- 89 -
Table of Contents
Pursuant to the requirements of Section 13 or 15(d) of the Securities Exchange Act of 1934, we have duly caused this report to be signed on our behalf by the undersigned, thereunto duly authorized.
| CYTEC INDUSTRIES INC. (Registrant) | ||||||
| Date: February 24, 2010 | By: | /s/ Shane Fleming | ||||
| Shane Fleming | ||||||
| Chairman, President and Chief Executive Officer | ||||||
Pursuant to the requirements of the Securities Exchange Act of 1934, this report has been signed below by the following persons on our behalf and in the capacities and on the dates indicated.
| Date: February 24, 2010 | /s/ Shane Fleming | |||
| Shane Fleming | ||||
| Chairman, President and Chief Executive Officer | ||||
| Date: February 24, 2010 | /s/ David M. Drillock | |||
| D. M. Drillock, Vice President, | ||||
| Chief Financial and Accounting Officer | ||||
| * C.A. Davis, Director |
||||||
| * A.G. Fernandes, Director |
||||||
| * L. L. Hoynes, Jr., Director |
*By: | /s/ R. Smith Attorney-in-Fact | ||||
| * C. P. Lowe, Director |
||||||
| * B. C. Johnson, Director |
||||||
| * W. P. Powell, Director |
||||||
| * T.W. Rabaut, Director |
||||||
| * J. R. Satrum, Director |
||||||
| * R. P. Sharpe, Director |
||||||
| * J. R. Stanley, Director |
||||||
DATE: February 24, 2010
- 90 -
Table of Contents
SCHEDULE II – VALUATION AND QUALIFYING ACCOUNTS
Years Ended December 31, 2009, 2008 and 2007 (in millions)
| Description | Balance 12/31/2008 |
Additions or (deductions) charged or (credited) to expenses |
Other additions or (deductions) |
Balance 12/31/2009 | |||||||||
| Reserves deducted from related assets: |
|||||||||||||
| Doubtful accounts receivable |
$ | 6.2 | $ | 0.5 | $ | (0.1 | )(1) | $ | 6.6 | ||||
| Deferred tax asset valuation allowance |
$ | 35.4 | $ | 4.3 | $ | – | $ | 39.7 | |||||
| Environmental accruals |
$ | 101.1 | $ | 5.7 | $ | (1.4 | )(2) | $ | 105.4 | ||||
| (1) | Principally bad debts written off partially offset by currency exchange. |
| (2) | Comprised of environmental remediation spending of $4.8, currency exchange of $1.6, and a reclassification of environmental related restructuring accrual of $1.8 to environmental accruals. |
| Description | Balance 12/31/2007 |
Additions or (deductions) charged or (credited) to expenses |
Other additions or (deductions) |
Balance 12/31/2008 | |||||||||
| Reserves deducted from related assets: |
|||||||||||||
| Doubtful accounts receivable |
$ | 4.5 | $ | 2.4 | $ | (0.7 | )(1) | $ | 6.2 | ||||
| Deferred tax asset valuation allowance |
$ | 33.5 | $ | 2.1 | $ | (0.2 | ) | $ | 35.4 | ||||
| Environmental accruals |
$ | 109.7 | $ | 4.4 | $ | (13.0 | )(2) | $ | 101.1 | ||||
| (1) | Principally bad debts written off and currency exchange. |
| (2) | Environmental remediation spending of $10.2 and favorable currency exchange of $2.8. |
| Description | Balance 12/31/2006 |
Additions or (deductions) charged or (credited) to expenses |
Other additions or (deductions) |
Balance 12/31/2007 | |||||||||
| Reserves deducted from related assets: |
|||||||||||||
| Doubtful accounts receivable |
$ | 5.1 | $ | 0.3 | $ | (0.9 | )(1) | $ | 4.5 | ||||
| Deferred tax asset valuation allowance |
$ | 27.8 | $ | 5.9 | $ | (0.2 | ) | $ | 33.5 | ||||
| Environmental accruals |
$ | 102.7 | $ | 6.2 | $ | 0.8 | (2) | $ | 109.7 | ||||
| (1) | Principally bad debts written off. |
| (2) | Environmental remediation spending of $5.0 offset by unfavorable currency exchange of $5.8. |
- 91 -