Attached files
| file | filename |
|---|---|
| EX-31.1 - EXHIBIT 31.1 - UNITED ONLINE INC | a2196581zex-31_1.htm |
| EX-31.2 - EXHIBIT 31.2 - UNITED ONLINE INC | a2196581zex-31_2.htm |
| EX-23.1 - EXHIBIT 23.1 - UNITED ONLINE INC | a2196581zex-23_1.htm |
| EX-21.1 - EXHIBIT 21.1 - UNITED ONLINE INC | a2196581zex-21_1.htm |
| EX-32.1 - EXHIBIT 32.1 - UNITED ONLINE INC | a2196581zex-32_1.htm |
| EX-32.2 - EXHIBIT 32.2 - UNITED ONLINE INC | a2196581zex-32_2.htm |
| EX-10.15 - EXHIBIT 10.15 - UNITED ONLINE INC | a2196581zex-10_15.htm |
UNITED STATES
SECURITIES AND EXCHANGE COMMISSION
Washington, D.C. 20549
FORM 10-K
| (Mark One) | ||
ý |
ANNUAL REPORT PURSUANT TO SECTION 13 OR 15(d) OF THE SECURITIES EXCHANGE ACT OF 1934 |
|
For the Fiscal Year Ended December 31, 2009 |
||
Or |
||
o |
TRANSITION REPORT PURSUANT TO SECTION 13 OR 15(d) OF THE SECURITIES EXCHANGE ACT OF 1934 |
|
For the transition period from to |
||
Commission file number 000-33367
UNITED ONLINE, INC.
(Exact name of Registrant as specified in its charter)
| Delaware (State or other jurisdiction of incorporation or organization) |
77-0575839 (I.R.S. Employer Identification No.) |
|
21301 Burbank Boulevard Woodland Hills, California (Address of principal executive office) |
91367 (Zip Code) |
(818) 287-3000
(Registrant's telephone number, including area code)
Securities
registered pursuant to Section 12(b) of the Act:
None
Securities registered pursuant to Section 12(g) of the Act:
| Title of Each Class | Name of Exchange on Which Registered | |
|---|---|---|
| Common Stock, par value $0.0001 per share | The Nasdaq Stock Market LLC | |
| Preferred Stock Purchase Rights | (Nasdaq Global Select Market) |
Indicate by check mark if the Registrant is a well-known seasoned issuer, as defined in Rule 405 of the Securities Act. Yes o No ý
Indicate by check mark if the Registrant is not required to file reports pursuant to Section 13 or Section 15(d) of the Act. Yes o No ý
Indicate by check mark whether the registrant (1) has filed all reports required to be filed by Section 13 or 15(d) of the Securities Exchange Act of 1934 during the preceding 12 months (or for such shorter period that the registrant was required to file such reports), and (2) has been subject to such filing requirements for the past 90 days. Yes ý No o
Indicate by check mark whether the registrant has submitted electronically and posted on its corporate Web site, if any, every Interactive Data File required to be submitted and posted pursuant to Rule 405 of Regulation S-T (§232.405 of this chapter) during the preceding 12 months (or for such shorter period that the registrant was required to submit and post such files). Yes o No o
Indicate by check mark if disclosure of delinquent filers pursuant to Item 405 of Regulation S-K is not contained herein, and will not be contained, to the best of Registrant's knowledge, in definitive proxy or information statements incorporated by reference in Part III of this Form 10-K or any amendment to this Form 10-K. o
Indicate by check mark whether the Registrant is a large accelerated filer, an accelerated filer, a non-accelerated filer, or a smaller reporting company. See definitions of "large accelerated filer," "accelerated filer" and "smaller reporting company" in Rule 12b-2 of the Exchange Act. (Check one):
| Large accelerated filer ý | Accelerated filer o | Non-accelerated filer o | Smaller reporting company o |
Indicate by check mark whether the Registrant is a shell company (as defined in Rule 12b-2) of the Act). Yes o No ý
At June 30, 2009, the aggregate market value of voting stock held by non-affiliates of the Registrant, based on the last reported sales price of the Registrant's common stock on such date reported by The Nasdaq Global Select Market, was $531,095,194 (calculated by excluding shares directly or indirectly held by directors and officers).
At February 12, 2010, there were 84,965,617 shares of the Registrant's common stock outstanding.
DOCUMENTS INCORPORATED BY REFERENCE
The information required by Part III of this Form 10-K, to the extent not set forth herein, is incorporated herein by reference to the Registrant's definitive proxy statement relating to the 2010 annual meeting of stockholders to be filed with the Securities and Exchange Commission not later than 120 days after the end of the Registrant's fiscal year.
UNITED ONLINE, INC.
INDEX TO FORM 10-K
For the Year Ended December 31, 2009
In this document, "United Online," "UOL," the "Company," "we," "us" and "our" refer to United Online, Inc. and its subsidiaries.
This Annual Report on Form 10-K and the documents incorporated herein by reference contain forward-looking statements within the meaning of the "safe harbor" provisions of the Private Securities Litigation Reform Act of 1995, as amended, based on our current expectations, estimates and projections about our operations, industry, financial condition, performance, results of operations, and liquidity. Statements containing words such as "may," "believe," "anticipate," "expect," "intend," "plan," "project," "projections," "business outlook," "estimate," or similar expressions constitute forward-looking statements. These forward-looking statements include, but are not limited to, statements about future financial performance; advertising revenues; segment metrics; operating expenses; market trends, including those in the markets in which we compete; operating and marketing efficiencies; revenues; liquidity; cash flows and uses of cash; dividends; capital expenditures; depreciation and amortization; tax payments; foreign currency exchange rates; hedging arrangements; our ability to repay indebtedness, pay dividends and invest in initiatives; our products and
2
Overview
United Online is a leading provider of consumer products and services over the Internet. Our offerings feature highly recognized brands including FTD, Interflora, Classmates, NetZero and MyPoints.
We are a Delaware corporation, headquartered in Woodland Hills, California, that commenced operations in 2001 following the merger of dial-up Internet access providers NetZero, Inc. ("NetZero") and Juno Online Services, Inc. ("Juno"). In 2004, our Internet access revenues began to decline and we began diversifying our business to include other consumer Internet offerings in an effort to provide new growth opportunities for the Company. In November 2004, we acquired Classmates Online, Inc. (together with its subsidiaries, "Classmates Online"), a provider of online social networking services, and in April 2006, we acquired MyPoints.com, Inc. ("MyPoints"), a provider of online loyalty marketing services. In August 2008, we acquired FTD Group, Inc. (together with its subsidiaries, "FTD"), a provider of floral and related products and services to consumers and retail florists, as well as to other retail locations offering floral and related products and services under the FTD and Interflora brands.
We report our businesses in three reportable operating segments:
Segment
|
Products and Services | |
|---|---|---|
| FTD | Floral and related products and services for consumers, retail florists and other retail locations | |
| Classmates Media | Online social networking and online loyalty marketing services | |
| Communications | Internet access, email, Internet security, and Web hosting services |
Our acquisition of FTD in August 2008, combined with revenues within our Classmates Media segment, has significantly reduced our exposure to the mature Communications segment that is experiencing declining revenues. In 2009, the Communications segment represented the smallest revenue contributor among our operating segments. In 2009, the FTD segment, the Classmates Media segment, and the Communications segment accounted for 55%, 24% and 21% of consolidated revenues, respectively. In 2008, the FTD segment, the Classmates Media segment, and the Communications segment accounted for 27%, 34% and 38% of consolidated revenues, respectively.
We generate revenues from three primary sources:
- •
- Services revenues. Services revenues in our FTD segment
are derived from membership fees, order-related fees and services, and subscription and other fees generated from independent members of the FTD and Interflora networks, which we also refer to as our
floral network members. Our floral network members include independent traditional retail florists and other retailers. Services revenues in our Classmates Media and Communications segments are
derived from selling subscriptions to consumers who are typically billed in advance for the entire subscription term. This enhances our cash flows and the predictability of future revenues.
- •
- Products revenues. Products revenues in our FTD segment are derived primarily from selling floral and related products to consumers via our Internet Web sites and toll-free telephone numbers and, to a lesser extent, to our floral network members. We generally do not maintain physical inventory or bear the cost of warehousing our consumer product offerings, and we generally receive payment from consumers before paying florists or other third parties to fulfill
4
- •
- Advertising revenues. Advertising revenues are derived from a wide variety of advertising, marketing and media-related initiatives in each of our operating segments.
product orders. Our Classmates Media and Communications segments do not generate products revenues.
Industry Background
FTD Segment—Floral and Related Products and Services
Consumers
Floral industry retail purchases, including flowers, potted plants and seeds, in the U.S. were approximately $21 billion in 2008, according to the U.S. Department of Commerce. Floral industry retail purchases in the United Kingdom, including fresh cut flowers and indoor plants, were approximately £2.2 billion in 2008, according to Mintel, a market research company. Both the U.S. and U.K. markets are highly fragmented with thousands of floral industry participants. The retail marketplace has evolved considerably in recent years. The following sets forth some of the key market trends:
- •
- The increasing role of nationwide floral marketers, particularly those marketing floral products over the Internet, has
resulted in a growing percentage of floral orders being placed through nationwide floral marketers versus traditional retail florists;
- •
- Consumer purchases of "cash and carry" flowers for every-day occasions have continued to shift away from
traditional retail florists and increasingly occur at supermarket and mass merchant retail locations;
- •
- Traditional retail florists have become increasingly dependent on floral network services to provide incoming order volume
to offset business lost to the Internet, supermarket and mass merchant channels; and
- •
- Traditional retail florists and nationwide floral marketers have expanded their product offerings to include a larger selection of specialty gift items.
Nationwide floral marketers, such as FTD and Interflora, attract floral orders from consumers via the Internet and telephone. Nationwide floral marketers typically partner with third parties to fulfill and deliver the marketers' floral product orders, including retail florists and direct ship merchants. The nationwide floral marketers' share of retail floral purchases has expanded due to shifting consumer preferences towards purchasing floral products online and the emergence of prominent brands with national exposure. Growing consumer interest in floral arrangements shipped directly to the consumer via common carrier has also benefited the nationwide floral marketers in recent years.
Traditional Retail Florists and Other Retailers
There were approximately 19,600 retail florists in the U.S. in 2007, according to the U.S. Census Bureau. The total number of retail florists has declined in recent years, primarily because floral products have become increasingly available for purchase on the Internet and in other retail channels. Supermarkets, mass merchants and other retailers are becoming increasingly important distribution channels in the floral products retail market. During the past several years, these retail locations have increased their presence in the floral products retail market by adding a variety of floral and related products to their merchandise assortments. The emergence of supermarkets and mass merchants within the floral products retail market has led many traditional retail florists to expand their merchandise offerings to include giftware, indoor plants, outdoor nursery stock, and seasonal decorations, among other items.
5
Floral wire services, which we also refer to as floral network services, utilize proprietary network communications systems to facilitate the transmission and fulfillment of orders among their floral network members. Services provided by floral wire services typically include order transmission, clearing-house, marketing and other services in support of the floral network. Order clearing-house services play an important role by ensuring the flow of payment between a floral network member sending an order received from a consumer and the member receiving and fulfilling the order, thereby eliminating counterparty credit risk. The growth of nationwide floral marketers and the Internet channel has led traditional retail florists to increasingly rely on floral networks to augment their order volumes. Access to incremental consumer orders represents one of the principal benefits a member receives from membership in a floral network.
Providers of floral network services typically offer a broad range of services that are designed to promote revenue growth and facilitate the efficient operation of a retail florist's business, including the ability to send, receive and deliver floral orders. Additional products and services offered by providers of floral network services include: point-of-sale technology systems and services, credit card processing services, e-commerce Web site services, and telephone answering, order-taking, transmission and clearing-house services. Certain providers of floral network services have recently broadened their focus and developed new product and service offerings, to appeal to supermarkets and mass merchants which have increased their presence within the retail floral market in recent years.
Providers of floral network services that have a separate nationwide floral marketing business (such as FTD's consumer operations under the FTD and Interflora brands) which generates a significant flow of consumer floral orders can potentially increase the value of their services by providing a strong flow of consumer orders for fulfillment by network members.
Classmates Media Segment—Online Social Networking
Online social networking is rapidly growing and evolving to include a broad spectrum of Web sites and online services that have attracted significant usage by nearly all demographics of Internet users. During December 2009, social networking Web sites attracted 830.9 million unique visitors worldwide, according to comScore MediaMetrix, an Internet industry research company. Widespread adoption of broadband Internet access, digital photography and online video has facilitated the sharing of content over the Internet, serving as a catalyst for industry growth.
We believe people have a fundamental drive to connect with others, be part of a community, express themselves, and maintain personal relationships. Core, life-long relationships are often based on enduring affiliations related to shared experiences such as family, school, workplace, or military service. Affiliations based on schools attended encompass a particularly large population of individuals. According to the U.S. Census Bureau, as of 2008, there were approximately 193 million high school graduates living in the U.S. and approximately 123 million people living in the U.S. who had attended college. We believe that the occurrence of class reunions among this large population frequently strengthens an individual's curiosity and nostalgic feelings about school memories, friends and acquaintances.
Over time, people frequently lose touch with each other for a variety of reasons, including geographic moves and job changes. According to the U.S. Census Bureau, in 2008 approximately 35 million people relocated and nearly one-third of America's workforce changed jobs that year. In addition, it is estimated by the U.S. Department of Labor that the average American worker will hold more than 10 jobs by age 40. There is a growing trend towards using new mediums of communication that facilitate social interaction in enabling individuals to find and reconnect with friends and former colleagues.
Social networking Web sites fulfill a number of different needs, including allowing users to find, connect or reconnect with individuals and important memories from their past. These Web sites and
6
services are used by individuals to, among other things, post content about themselves and to review or comment on the content posted by others. Many social networking services also provide users with tools that enable individuals to identify, build and maintain personal networks from their relevant affiliations. Numerous sources have reported that social networking users frequently choose to participate in, and develop affiliations through, several online social networking services—often to fulfill different purposes such as professional networking or various types of social interaction.
Many advertisers view social networking Web sites as an attractive marketing medium for their products and services. Most social networking Web sites are free to the user and primarily generate revenues from a wide variety of sources that include online advertising and transactions related to Web site content such as online games, applications or virtual goods. Some social networking Web sites, including LinkedIn as well as our Classmates Web site and our international social networking Web sites, also generate revenues from paid subscriptions from members interested in premium services.
Classmates Media Segment—Online Loyalty Marketing
The Internet has been a growing channel for advertising and for consumers to find and purchase goods and services. As a result of both existing activity and expected growth, advertisers continue to seek effective ways to target and reach online consumers.
Online loyalty marketing programs are generally designed to reward consumers with points that accumulate based on their activities and which may be redeemed for products and services from participating vendors. Some online loyalty marketing programs use points as an incentive for members to update their personal interest profiles, which provide useful information that helps advertisers to target consumer segments interested in purchasing the advertisers' products and services. While these programs have long been popular with airlines, credit card vendors, hotels, and retailers, in recent years online loyalty marketing programs have expanded into a comprehensive direct marketing and targeted advertising strategy. Nonetheless, we believe consumer adoption of online loyalty marketing programs has remained largely associated with a single type of activity, such as airline, hotel or credit card selection.
Online loyalty marketing programs enable advertisers to target consumers in ways that are generally impractical with traditional offline direct marketing channels. Online loyalty marketing programs can also easily measure click-through rates on display advertising and response rates to email campaigns, providing rapid feedback for advertisers that can be used to identify potential customers and create new targeted offers. In addition, an online loyalty marketing program that has attracted a large, responsive and loyal member base helps to maximize returns on the advertisers' marketing investments. Furthermore, advertisers may prefer to work with online loyalty marketing programs that offer performance-based pricing, which helps the advertisers achieve their specific performance objectives within budget.
Communications Segment
The U.S. consumer Internet access service market has evolved from one where the Internet was accessed primarily through dial-up access to one in which consumers can access the Internet through dial-up or a variety of high-speed, or broadband, connection methods.
Broadband Internet access services, once characterized by high prices and a limited coverage area, are now available to most of the U.S. population at competitive prices, although market pricing varies based on the geographic region and speed of the broadband service, among other factors. However, broadband continues to have a lower penetration in rural areas when compared to urban and suburban areas, and numerous sources suggest that broadband access may not be as available or affordable in rural areas. Many broadband providers, including cable companies such as Comcast and local exchange carriers such as AT&T, bundle their offerings with phone, entertainment or other services, which may
7
result in lower prices than stand-alone services. As a result of these factors, it is anticipated that the number of dial-up pay accounts will continue to decrease.
There are numerous dial-up Internet access providers in the U.S. although a small number of national providers account for a significant majority of the U.S. dial-up market. AOL, EarthLink and our Internet access subsidiaries, NetZero and Juno, on a combined basis reported approximately 7.2 million dial-up pay accounts at December 31, 2009. Some dial-up pay accounts also have a separate broadband connection, but choose to maintain their dial-up pay account as a secondary, or back up, means of connecting to the Internet for use when traveling or if their broadband connection should fail for any reason. The maturity of the dial-up Internet access market has led the largest service providers in the U.S., including AOL, EarthLink, NetZero, and Juno, to reduce marketing and investment spending and operate their dial-up Internet access businesses primarily for profitability and cash flow contributions. As the industry has matured, the average tenure of dial-up Internet access pay accounts has increased significantly which has generally resulted in a reduction in subscriber churn since longer tenured pay accounts, on average, exhibit greater retention characteristics than new pay accounts.
Segment Services
FTD
FTD is a leading provider of floral and related products and services to consumers and retail florists, as well as to other retail locations offering floral and related products and services, in the U.S., Canada, the U.K., and the Republic of Ireland. The business uses the highly recognized FTD and Interflora brands, both supported by the Mercury Man logo. FTD is a nationwide floral marketer, which we refer to as FTD's consumer business, and a provider of floral network services, which we refer to as FTD's floral network business. These businesses are complementary, as the majority of floral orders generated by the consumer business are fulfilled and hand-delivered by the members of the FTD network. FTD does not own or operate any retail locations. For additional information regarding our FTD segment, see Note 2—"Segment Information" of the Notes to the Consolidated Financial Statements, which appears in Part II, Item 8 of this Annual Report on Form 10-K.
Consumer Business. FTD is a leading marketer of flowers and specialty gift items to consumers. FTD operates in the U.S. and Canada, primarily through the www.ftd.com Web site and 1-800-SEND-FTD toll-free telephone number, and in the U.K. and the Republic of Ireland through the www.interflora.co.uk and www.interflora.ie Web sites and various toll-free telephone numbers. FTD also operates mobile Web sites that are optimized for mobile phones with Internet connections. While floral arrangements and plants are FTD's primary offerings, FTD also markets and sells other specialty gift items including: gourmet food, special occasion gifts, bath and beauty products, jewelry, wine and gift baskets, chocolates, and stuffed animals.
Consumers place orders at FTD's Web sites or, to a much lesser extent, over the telephone. Internet orders represented 85.9% of consumer order volume during the year ended December 31, 2009. Orders are transmitted to floral network members or third-party suppliers for processing and delivery. The majority of consumer orders are hand-delivered by FTD's floral network members, offering same-day delivery (subject to certain limitations) of bouquets. A smaller percentage of consumer orders are fulfilled and shipped by third parties direct to the consumer in an elegant gift box, principally offering next-day delivery. Consumer orders are backed by a seven day satisfaction guarantee.
Consumers typically pay for floral and specialty gift orders before FTD pays its floral network members or third-party suppliers to fulfill and deliver them. In general, FTD does not maintain physical inventory or bear the cost of warehousing and distribution facilities because its floral network members and third-party suppliers maintain substantially all floral and specialty gift physical inventory and facilities, and therefore bear the cost of warehousing and distribution. FTD's distribution networks
8
also allow its consumer businesses to process peak order flow substantially above that of its average daily order flow.
Floral Network Business. FTD provides a comprehensive suite of products and services that promote revenue growth and enhance the operating efficiencies of its floral network members, including services that enable such members to receive, send and deliver floral orders. Floral network members include traditional retail florists, as well as other retailers offering floral and related products and services, that are located primarily in the U.S., Canada, the U.K., and the Republic of Ireland. The large network of affiliated floral network members provides an order fulfillment vehicle for our consumer business and allows FTD to offer same-day delivery capability (subject to certain limitations) to nearly 100% of U.S., Canadian, U.K., and Irish populations. Additionally, FTD is part of a large international network of floral retailers that enables FTD to market consumer products for delivery in more than 150 countries.
FTD products and services available to floral network members include: access to the FTD and Interflora brands and the Mercury Man logo, supported by various marketing and advertising campaigns; access to the floral network; credit card processing services; e-commerce Web site services; online advertising tools; and telephone answering, order-taking, transmission and clearing-house services. FTD also provides point-of-sale and related technology services and systems that enable its floral network members to transmit and receive orders and manage several back office functions of a floral retailer's business, including accounting, customer relationship management, direct marketing campaigns, and delivery route management. FTD also acts as a national wholesaler to its floral network members, providing branded and non-branded hard goods and cut flowers as well as packaging, promotional products and a wide variety of other floral-related supplies.
Our strategy for the FTD segment includes the following key elements: attract and retain consumer customers and generate additional order volume through innovative marketing initiatives; further expand FTD's consumer product offerings; increase the number of florists in the floral network and expand the penetration of our floral network products and services with existing floral network members; increase FTD's presence in alternative retail channels such as supermarkets and mass merchants; and expand FTD's range of marketing and distribution partnerships.
Classmates Media
Our Classmates Media services include online social networking under the Classmates brand and online loyalty marketing under the MyPoints brand. Our Classmates Media services also include international online social networking under the StayFriends and Trombi brands. For additional information regarding our Classmates Media segment, see Note 2—"Segment Information" of the Notes to the Consolidated Financial Statements, which appears in Part II, Item 8 of this Annual Report on Form 10-K.
Online Social Networking
Our social networking Web sites enable users to locate and interact with acquaintances from their past, with school affiliations as the primary focus. Led by our flagship Classmates Web site (www.classmates.com) that serves the U.S. and Canada, our social networking properties comprise a large and diverse population of users, with over 60 million registered accounts at December 31, 2009.
Using our interactive tools and features, our members have contributed to our social networking Web sites a substantial amount of distinct, relevant pieces of content, such as names, high school affiliations, profiles, biographies, interests, and photos. Our large membership base and the extensive user-generated content posted on our Web sites assist us in acquiring new members, and we receive tens of thousands of new free account registrations each day. We believe this valuable content also
9
brings existing members back to our Web sites, with a significant number of our members visiting our Web sites on a recurring basis over many years.
Our social networking members can choose between free membership and a paid subscription offering additional features. Free accounts constitute the vast majority of our social networking accounts. Revenues from our social networking services are derived from subscription fees and advertising fees. We had approximately 4.9 million social networking pay accounts at December 31, 2009. During the quarter ended December 31, 2009, our average monthly revenue per social networking pay account was $2.53 per month.
Basic Membership. Basic membership on our Classmates Web site is free and provides members with access to a number of interactive features. Visitors to our Classmates Web site can become free members by completing the registration process and providing their name, year of birth, graduation year (or, in the case of workplace or military affiliations, years at such affiliation), and an email address. Free members are required to affiliate with at least one high school, college, work, or military community. In addition, free members can elect to provide information about their personal interests and post photos.
Free members have free access to the following primary features:
- •
- Search. Free members can use our search feature to locate
individuals within communities of interest and to browse our member database which is currently differentiated by high school, college, workplace, or military unit.
- •
- Post and view member content. Free members can post
information about themselves and view information about other members, including personal profiles, biography information, photos, affiliations, timelines, bulletin board messages, and answers to our
multiple choice questions about life, love, family, and hobbies.
- •
- Reunion Radio and Games Features. Free members can listen
to popular tracks from their high school years on the Classmates Reunion Radio feature, or play a variety of classic online games at the Classmates Games section of the Web site.
- •
- Reunions. Reunions and events can be organized and
invitations can be sent through the Classmates Web site. Free members can create events and track RSVPs to reunions, build surveys, exchange party ideas on private message boards, and share pictures
in photo albums devoted to the reunion event.
- •
- Email. Free members have the ability to send double-blind
emails (where email addresses are not visible to the email sender or recipient) through our Classmates Web site to other Classmates members and respond to email messages received from our paying
members. However, free members are not able to read and respond to emails from other free members.
- •
- Read and post to message boards. Free members have access
to messages posted on our interest group message boards encompassing a wide range of topics. Free members are also able to directly post content on the message boards and post pictures in the photo
albums devoted to their affiliated communities.
- •
- Newsletter. Free members can subscribe to our weekly "Connections" newsletter that contains information on the various features available on our Classmates Web site, a listing of new members who joined their communities and links to new content posted by members within their communities.
10
Gold Membership. Gold membership on our Classmates Web site is a paid subscription service that provides members with access to all of the features of a free membership as well as the following additional features:
- •
- Digital guestbook. Our digital guestbook feature alerts a
Classmates member when another member visits his or her profile, unless the visiting member chooses not to leave his or her name. However, only a paying member is able to see the name of the member
who visited his or her profile.
- •
- Email. Paying members have the ability to send
double-blind emails through our Classmates Web site to other Classmates members and respond to email messages from any other Classmates member, regardless of whether the sender is a free member or a
paying member.
- •
- Classmates maps. Paying members have access to our
Classmates maps feature which can generate a map, satellite or hybrid view, showing the geographic locations, based on zip codes, of the members in a paying member's affiliated communities.
- •
- Newsletter. In addition to receiving our Connections newsletter, paying members also receive our monthly "Gold Standard" newsletter, which highlights ways for our paying members to get the most out of the subscription features accessible on our Classmates Web site.
We continue to develop a number of new features on our Classmates Web site that we believe will enhance the member experience while providing an additional incentive for our free members to upgrade to a pay account. We expect the features available to free members and paying members to continue to change from time to time.
Standard pricing for a Classmates social networking pay account varies significantly by term of membership. Standard pricing for pay accounts currently consists of a three-month subscription for $15.00, or $5.00 per month, a 12-month subscription for $39.00, or $3.25 per month, or a 24-month subscription for $59.00, or $2.46 per month. In addition, discounted pricing plans are offered to certain free members at various times on a promotional basis. Discounted promotions often feature an introductory 12-month subscription for $9.95 that, if not cancelled by the customer, will renew at the then-current full price after the introductory 12-month period. We expect that the pricing and terms of membership we offer will change periodically due to discounting and other factors.
International. In addition to our flagship Classmates Web site, we operate five international social networking services. We operate StayFriends in Sweden, Germany, Austria, and Switzerland (www.stayfriends.se, www.stayfriends.de, www.stayfriends.at and www.stayfriends.ch, respectively) and Trombi in France (www.trombi.com). Each service is similar to our Classmates service, although their affiliations are focused primarily on schools. We offer free and pay memberships on all of our international Web sites, although certain features of our international social networking pay services differ from those of our Classmates pay services and pricing for our international social networking services is generally lower than the standard pricing for Classmates.
Our strategy for our online social networking services includes the following key elements: continue to enhance member experience and engagement by promoting user-generated and third-party content focused on connecting members with the people, places, events, and experiences associated with their high school years; expand the free and pay member bases by marketing on, or in conjunction with, complementary Web sites and services; increase monetization by incorporating loyalty programs into our services, by offering additional pay services to our members and by developing new sources of revenue consistent with our value proposition of connecting members with their high school years; and evaluate further opportunities to expand internationally or through the development and acquisition of complementary services.
11
Online Loyalty Marketing
Our online loyalty marketing service, MyPoints, connects advertisers with its members by allowing members to earn rewards points for engaging in online activities. MyPoints is a free service for consumers who need only provide their name, zip code, gender, date of birth, and an email address to register. Members register to receive direct email marketing and other online loyalty promotions, and earn points for responding to email offers, taking market research companies' surveys, shopping online at the MyPoints Web site which serves as a shopping portal, searching the Internet through a MyPoints branded toolbar, playing MyPoints branded online games, and engaging in other online activities. Rewards points are redeemable primarily in the form of third-party gift cards from over 75 merchants, including, among others, retailers, theaters, restaurants, airlines, and hotels. Participating merchants include, among others, Amazon.com, iTunes, Marriott, Macy's, and Target.
MyPoints provides advertisers with an effective means to reach a large online audience. MyPoints uses a variety of criteria, including personal interests, purchasing behavior and demographic profiles, to create targeted promotions for advertisers. These marketing campaigns are tailored to meet the needs of the specific advertiser, which may include generating sales leads, soliciting information, registrations or the purchase of an advertiser's products or services, or increasing customer traffic on an advertiser's Web site. In many cases, MyPoints sends personalized email marketing messages, called Bonusmail, that are directed specifically to individual MyPoints members to showcase a single advertiser or offer. Generally, MyPoints members receive points for clicking through the media links in Bonusmail as well as for purchases or other actions taken within a limited time period.
All of our online loyalty marketing service revenues are classified as advertising revenues. Advertisers pay us primarily based on performance measures that include when our MyPoints emails are transmitted to members, when members respond to emails and when members complete online transactions.
Our strategy for our online loyalty marketing service includes the following key elements: enhance member experience and engagement by broadening the range of available advertiser offers, including expanding offers for offline activities and for recurring purchases such as gasoline and consumer packaged goods; reward our most active members by providing them additional opportunities to earn improved rewards; increase our member base through increased acquisition spend and exploration of new marketing channels; increase the types of awards available to our members; and increase automation of our service and offers to decrease costs and increase our ability to personalize offers to our members.
Communications
Our principal Communications pay service is dial-up Internet access, offered under the NetZero and Juno brands. We also offer broadband services, email, Internet security services, and Web hosting services. In total, we had 1.4 million Communications pay accounts at December 31, 2009, of which 1.0 million were dial-up Internet access accounts. Most of our Communications revenues are derived from dial-up Internet access pay accounts. For additional information regarding our Communications segment, see Note 2—"Segment Information" of the Notes to the Consolidated Financial Statements, which appears in Part II, Item 8 of this Annual Report on Form 10-K.
Internet Access Services
Our dial-up Internet access services are provided on both a free and pay basis, with the free services subject to hourly and other limitations. Basic pay dial-up Internet access services include Internet access and an email account, although we also offer an enhanced email service as a stand-alone pay service. In addition, we offer accelerated dial-up Internet access services which can significantly reduce the time for certain Web pages to download when compared to our basic dial-up
12
Internet access services. Our accelerated dial-up Internet access services are also bundled with additional benefits including pop-up blocking, antivirus software and enhanced email storage. Our dial-up Internet access services are available in more than 11,000 cities across the U.S. and Canada. The current standard monthly pricing for our dial-up Internet access services generally ranges from $9.95 for basic services to $14.95 for our bundled services. We also offer promotional, discounted pricing plans at various times.
Our broadband Internet access services consist of digital subscriber lines (also known as "DSL") services that we purchase from third parties and resell under our own brands. These services are primarily used as a means to retain users who are leaving our dial-up services and we have conducted very limited marketing of our broadband services to the general public. As a result, we have experienced limited adoption of our broadband services. The current monthly pricing for our broadband Internet access services ranges from $9.95 to $43.95, which includes certain new customer promotions that feature discounted fees for a limited number of months and revert to a standard rate at the end of the discount period. Pricing also varies due to connection speed and geographic region.
Our primary strategy for the Communications segment is to manage our dial-up Internet access business for profitability and cash flows. In certain instances, we seek to extend the business life cycle and cash flows generated by our dial-up Internet access subscribers by offering them a broadband alternative to their dial-up service.
Sources of Revenue
We generate revenue from the sale of services, products and online advertising.
Services Revenues
FTD
FTD services revenues consist of fees charged to floral network members for access to the FTD and Interflora brands and the Mercury Man logo, access to the floral network, credit card processing services, e-commerce Web site services, online advertising tools, telephone answering, order-taking, transmission and clearing-house services.
Classmates Media and Communications
Classmates Media services revenues consist of amounts charged to pay accounts for social networking services. Communications services revenues consist of amounts charged to pay accounts for Internet access, email, Web hosting, Internet security, and other services, with substantially all of such revenues associated with Internet access. Our Classmates Media and Communications services revenues are primarily dependent on two factors: the average number of pay accounts for a period and the average monthly revenue per pay account ("ARPU"). The average number of pay accounts is a simple average calculated based on the number of pay accounts at the beginning and end of a period.
In general, we charge our pay accounts in advance of providing a service, which results in the deferral of services revenue to the period in which the services are provided. We have offered, and may offer in the future, a variety of price points, subscription periods, discounts, and promotions, both in connection with offers extended to some of our existing accounts and through external marketing channels. Changes in our offers, the extent to which we make such offers and the percentage of such offers that are accepted, can have a significant impact on ARPU, profitability, pay account acquisition metrics, conversion rates of free accounts to pay accounts, and retention rates.
13
Products Revenues
Products revenues consist of the FTD segment's merchandise revenue and related shipping and service fees for consumer orders, as well as revenues generated from the sale of containers, point-of-sale systems, cut flowers, packaging and promotional products, and a wide variety of other floral-related supplies to floral network members. We do not generate products revenues from our Classmates Media segment or our Communications segment.
Advertising Revenues
We provide advertising solutions to marketers with both brand and direct response objectives through a full suite of display, search, email, and text-link opportunities across our various properties. We also use targeting technologies, Web site sponsorships and Web site integrations in order to provide effective solutions.
FTD
FTD advertising revenues consist primarily of revenues that are generated when FTD and Interflora consumers are provided third-party offers after completing a purchase on the www.ftd.com, www.interflora.co.uk and www.interflora.ie Web sites.
Classmates Media
Our social networking services have historically generated advertising revenues primarily from providing third-party offers to Classmates paying members after they have completed the pay account registration process and, to a lesser extent, from display advertisements. Advertising inventory on our social networking Web sites includes text and graphic placements on the user home page, profile page, class list page, and most other pages on our Web sites. We are able to target the advertising delivered to most of our members based on a wide variety of factors, including age, gender, demographic data, affiliations, profile data, and zip code. We also sell a portion of our advertising inventory through third-party advertising resellers.
Our online loyalty marketing services revenues are derived from advertising fees, consisting primarily of fees based on performance measures, that are generated when emails are transmitted to members, when members respond to emails, when members complete online transactions, and when members engage in a variety of other activities including games, Internet searches and market research surveys. We sell marketing solutions to advertisers with both brand and direct response objectives through a full suite of display, email and other advertising opportunities. We also use targeting technologies and Web site integrations in order to provide effective solutions for advertisers.
Communications
Our Communications services generate advertising revenues from search placements, display advertisements and online market research. Substantially all of our Communications advertising revenues are generated from our Internet access services. We host and customize the initial Web site displayed to users of our Internet access services. This Web site, or "start page," displays sponsored links to a variety of content, products and services, including Internet search. We also display a toolbar on Internet access users' screens throughout their online access sessions that is generally visible regardless of the particular Web site they visit. The toolbar contains Internet search functionality and a variety of buttons, icons and drop-down menus. A variety of advertising opportunities also exist through our email platforms, including display advertising on the main pages and within emails.
14
Sales and Marketing
FTD
Our marketing efforts within the FTD segment are primarily focused on attracting orders from new and existing consumer customers; marketing our services to our floral network members; attracting new members to our floral network; and marketing our services to alternative channels such as supermarkets and mass merchants. We also engage in a variety of activities to build and enhance the FTD and Interflora brands.
Our marketing efforts for our consumer business include: online advertising, primarily related to search engine marketing and optimization; co-marketing and affiliate partnerships with retailers and loyalty programs such as airlines, credit card companies and hotel chains; database marketing to existing consumer customers featuring timely email promotions; direct mail and other forms of print advertising; an email-based reminder service that provides consumers with personalized reminders of occasions such as birthdays, anniversaries and key gift-giving holidays; television and radio advertising; and cross-marketing to the large base of consumers registered to United Online services, including Classmates, MyPoints, NetZero, and Juno.
Our marketing efforts for our floral network business include: member appreciation and training events for our floral network members; sponsoring and participating in floral and retail industry trade shows; and offline media campaigns. In addition, many of our marketing efforts for our consumer business are also designed to enhance the businesses of our floral network members. By enhancing the FTD and Interflora brands, we increase the possibility that a consumer will place an order directly with one of our floral network members since floral retailers frequently highlight their association with our floral network in their marketing efforts. FTD also employs a dedicated sales force to market our products and services to our floral network members and to encourage other floral retailers to become members of our floral network.
Classmates Media
Our marketing efforts for social networking have been comprised almost entirely of Internet advertising designed to increase our free member base, with most payments to third parties determined based on fees per free member acquired through the campaign. After we acquire a free member, we seek to upsell our pay services to the free member. We have also increased the number of social networking members who have signed up for our free services organically (without incurring online advertising expenditures to attract them) in recent years, primarily through enhancements to our Web sites to improve search engine optimization and, to a lesser extent, through an increasing base of referrals from existing social networking members. Our marketing efforts to obtain members for our online loyalty marketing service are primarily based on co-registration with third-party services.
Communications
Our Communications segment's marketing efforts are focused primarily on attracting pay accounts, primarily dial-up Internet access accounts; building our NetZero brand; and cross-selling our other services to existing accounts. These marketing efforts include distribution arrangements with retailers and personal computer manufacturers; advertising on the Internet and television; and direct marketing campaigns. These activities are designed to drive prospective accounts to call our toll-free telephone numbers to purchase our services, or to visit our Web sites and download our software. In most distribution arrangements, we pay a fee for each new pay account referred to us by the retailer or personal computer manufacturer.
15
Sales of Advertising Inventory
We have internal sales organizations dedicated to selling our Internet advertising products and services. One organization is dedicated to our online loyalty marketing service, and the other organization is dedicated to our Communications and Classmates Online properties. These groups work with internal media operations personnel dedicated to serving and monitoring the performance of our advertising initiatives. While we derive a significant portion of our advertising revenues from transactions entered into directly with advertisers and their agencies, particularly within our online loyalty marketing service, we also sell a portion of our advertising inventory through third-party advertising resellers.
Competition
The industries in which we offer products and services are highly competitive. A summary of competitive factors is set forth below and in "Risk Factors," which appears in Item 1A of this Annual Report on Form 10-K.
Floral and Related Products and Services
We compete in the market for flowers and, to a lesser degree, specialty gifts. In the consumer market, consumers are our customers for direct sales of floral and specialty gifts through our Web sites and toll-free telephone numbers. In the floral network services market, retail florists and supermarkets are our principal customers for memberships and subscriptions to our various floral network services, including access to the FTD and Interflora brands and the Mercury Man logo, access to the floral network, credit card processing services, e-commerce Web site services, online advertising tools, and telephone answering, order-taking, transmission and clearing-house services.
The consumer market for flowers and specialty gifts is highly competitive as consumers can purchase the products we offer from numerous sources, including traditional local retail florists, supermarkets, mass merchants, specialty gift retailers, and nationwide floral marketers, such as those that use Web sites, toll-free telephone numbers and catalogs. We believe the primary competitive factors in the consumer market are price, quality of products, selection, customer service, ordering convenience, and strength of brand. The floral network services market is highly competitive as well, and retail florists and supermarkets may choose from a few floral service providers that offer similar products and services. We believe the primary competitive factors in this market are price, order volume, customer service, services offered, strength of brand, number of members in the network, and fulfillment capabilities. In the U.S., our key competitors in the consumer market include 1-800-FLOWERS.COM, Inc., Proflowers.com and Teleflora, and our key competitors in the floral network services market include Teleflora and BloomNet Wire Service, a subsidiary of 1-800-FLOWERS.COM. International key competitors include Marks & Spencer, NEXT, John Lewis, Teleflorist (also known as eFlorist), and Flowers Direct. Although we believe that we compare favorably with respect to many competitive factors, some of our competitors have an advantage over us with respect to certain factors.
We believe competition in the consumer market will likely intensify. Supermarkets, mass merchants and nationwide floral marketers have been gaining market share over retail florists as consumers continue to shift more of their floral purchases to these channels. We expect the sales volumes at supermarkets and other mass merchants to continue to increase, and other nationwide floral marketers will continue to increase their competition with us. In particular, the nature of the Internet as a marketplace facilitates competitive entry and comparative shopping, and we have experienced increased competition based on price. Some of our competitors may have significant competitive advantages over us, may devote significantly greater resources to marketing campaigns or other aspects of their business or may respond more quickly and effectively than we can to new or changing opportunities or customer requirements.
16
We expect competition in the floral network services market to continue to increase as well. We believe we will continue to experience increasing competition from the other floral network services providers. In addition, we expect retail florists likely will continue to lose sales to supermarkets and nationwide floral marketers, which likely will result in a continuing decrease in their revenues and in the number of retail florists. As the number of retail florists and their revenues decrease, competition for the business of the remaining retail florists will intensify.
Online Social Networking
The social networking market is highly competitive and is characterized by numerous companies offering varying online services. This market has been rapidly evolving to respond to growing consumer demand for compelling social networking services and functionality. As this market continues to evolve, we believe that demand will be met by a number of social networking companies. In addition, we believe a large number of social networking users generally will continue to register with and frequent more than one social networking service. We believe the factors that drive long-term success are the ability to build a large and active user base and the ability to monetize that user base through subscriptions and advertising. We believe the principal competitive factors in this market are the size of the user base, volume and quality of user-generated content, price of the service, and the scope and quality of features. We believe that we compete favorably in certain of these areas, although certain of our competitors have an advantage over us in some or all of these areas.
Our social networking services compete with a wide variety of social networking Web sites, including broad social networking Web sites such as Facebook; a number of specialty niche Web sites, including LinkedIn and MyLife.com, that offer online social networking services focused on particular affiliations such as school or work communities; and schools, employers and associations that maintain their own Internet-based alumni information services. We also compete with a wide variety of Web sites that provide users with alternative networks and ways of locating and interacting with acquaintances from various affiliations, including online services designed to locate individuals such as White Pages and US Search, Internet search engines that have the ability to locate individuals, including by finding individuals through their profiles on social networking Web sites, and Web portals such as Yahoo!, MSN and AOL. We believe that there are currently only a small number of competitive online social networking services that are focused specifically on our niche of the market, which is to help people find and reconnect with enduring relationships and important memories from school. However, as the membership bases of social networking Web sites continue to grow, users may be able to locate individuals from their past, free of charge in certain cases, without having to use a niche Web site or other online search service. As a result of the growth of the social networking market and minimal barriers to entry, a number of companies have entered or are attempting to enter our market, either directly or indirectly, some of which may become significant competitors in the future. In addition, many existing social networking services are broadening their service offerings to compete with our services.
Internet Access Services
We compete with numerous other dial-up Internet access providers as well as providers of broadband services. Our key dial-up Internet access competitors include established online service and content providers, such as AOL and MSN, and independent national Internet service providers, such as EarthLink and its PeoplePC subsidiary. We believe the primary competitive factors in the dial-up Internet access industry are price, features, coverage area, scope of services, speed, and quality of service. While we believe our dial-up Internet access services compete favorably based on these factors when compared to many other dial-up Internet access services, we are at a competitive disadvantage relative to some or all of these factors with respect to the services of certain of our competitors. Our
17
dial-up Internet access services do not compete favorably with broadband services with respect to certain of these factors, including, but not limited to, speed and, in certain cases, price.
Online Loyalty Marketing
The market for online loyalty marketing services is highly competitive, and we expect competition to significantly increase in the future as online loyalty marketing programs grow in popularity. Our MyPoints online loyalty marketing business faces competition for members from several other online loyalty marketing programs as well as offline loyalty marketing programs that have a significant online presence, such as those operated by credit card, airline and hotel companies. We believe the primary competitive factors in the online loyalty marketing industry are the number, type and popularity of the participating merchants, the attractiveness of the rewards offered, the number of points awarded for various actions, the ease and speed of earning rewards, and the ability to offer members a robust, user-friendly shopping experience. We believe that we compete favorably in certain of these areas, although some of our competitors have an advantage over us in some or all of these areas. We also believe that the time, effort and expenses required to successfully develop certain of these areas serve as effective barriers to entry.
Seasonality and Cyclicality
Revenues and operating results from our FTD segment typically exhibit seasonality. Revenue and operating results tend to be lower for the quarter ending September 30 because none of the most popular floral and gift-giving holidays, which include Mother's Day in the U.S. and U.K., Valentine's Day, Christmas, Easter, and Thanksgiving, fall within that quarter. In addition, depending on the year, Easter and the U.K. Mother's Day sometimes fall within the quarter ending March 31 and sometimes fall within the quarter ending June 30. As a result of these seasonal variations, we believe that comparisons of the FTD segment's revenues and operating results for any period with those of the immediately preceding period, or in some instances, the same period of the preceding fiscal year, may be of limited relevance in evaluating its historical performance and predicting its future financial performance. Our working capital, cash and any short-term borrowings may also fluctuate during the year as a result of the factors described above.
Online loyalty marketing advertising revenues tend to be higher in the quarter ending December 31 when compared to other quarters. Our Internet access services have typically experienced a lower rate of new registrations during the quarter ending June 30 when compared to other quarters. Seasonality has not had a material impact on our online social networking services revenues. There can be no assurance that these seasonal trends will continue in the future.
Billing
Orders placed through FTD's consumer Web sites or toll-free telephone numbers typically are paid for using a credit card or a debit card; therefore, consumers generally pay for floral and specialty gift orders before FTD pays the floral network members and third-party providers to fulfill and deliver them. FTD's floral network members are generally billed for products and services and are billed or credited for net order activity on a monthly basis.
The vast majority of the pay accounts for our Classmates Media and Communications segments pay us in advance with a credit card. Other payment options for some of our pay services include automated clearing-house ("ACH"), personal check or money order, or via a customer's local telephone bill. Internet access pay accounts that elect to pay with a personal check or money order are not provisioned until their payment is received and they are required to subscribe for one of our prepaid multi-month billing plans.
18
We utilize a combination of third-party and internally-developed software applications for customer billing. Customer billing is a complex process and our billing systems must efficiently interface with third parties' systems, such as our credit card, ACH and telephone bill processors' systems. Our ability to accurately and efficiently bill and collect payment from our members and customers is dependent on the successful operation of our billing systems and various third-party processors. In addition, our ability to offer new pay services or alternative payment plans is dependent on our ability to customize our billing systems.
Customer Support and Retention
We believe reliable customer service and technical support are important to retaining our customers. Our businesses generally offer a variety of online and offline tools designed to provide solutions and answers to frequently asked questions. These tools are also designed to assist our members and customers in verifying and updating their account information. In addition, we offer traditional email support and certain of our services provide live telephone support as well.
Our customer relationship management and support infrastructure includes employees at our facilities in Woodland Hills, California; Hyderabad, India; Fort Lee, New Jersey; Seattle, Washington; San Francisco, California; Downers Grove, Illinois; Centerbrook, Connecticut; Medford, Oregon; Sherwood, Arkansas; Sleaford, England; and Nottingham, England. We also outsource to a third party substantially all of our telephone customer support and some of our email customer support for our Classmates Media and Communications services, and some of our telephone customer support for FTD. We monitor the effectiveness of our customer support functions and measure performance metrics such as average hold time and first call resolution and abandonment rates. Communications with our customers are logged and categorized to enable us to recognize and act on trends. An internal quality assurance team monitors the performance of our customer support vendor and provides feedback to improve their skills and establish consistency throughout our customer support functions.
Technology
Each of our services, including our floral network services, our online social networking services, our Internet access services and our online loyalty marketing services, operates on a separate and distinct technology platform. Each of our services is generally provided through a combination of internally-developed and third-party software, industry standard hardware and outsourced network services. We have internally-developed order processing, order fulfillment and customer service systems which provide communication to our floral network members and third-party suppliers. We also have developed software to enhance the functionality of certain components of our services, including connectivity, Web services, billing, email, customer support, customer loyalty applications, and targeted advertising. We maintain data centers in multiple locations in the U.S. and Europe. In some cases, we have redundant systems to provide high levels of service availability and connectivity. We host or outsource the majority of our data center services in third-party co-location facilities and we outsource all of our bandwidth and managed modem services.
We license from third parties a number of our software applications and components, including applications for our billing, customer support, advertising, and database systems, our client and server applications, and portions of our dial-up Internet access accelerator services. These licenses generally have terms ranging from several years to perpetual.
Government Regulations
We are subject to a number of international, federal, state, and local laws and regulations, including, without limitation, those relating to taxation, bulk email or "spam," advertising, user privacy, data protection, and consumer protection. In addition, proposed laws and regulations relating to the
19
foregoing are being debated and considered for adoption in the U.S. and other countries, and such legislation could be passed in the future. For additional information, see "Risk Factors," which appears in Item 1A of this Annual Report on Form 10-K.
Proprietary Rights
Our trade names, trademarks, service marks, patents, copyrights, domain names, and trade secrets are important to the success of our business. In particular, we view our primary trademarks as critical to our success. We principally rely upon patent, trademark, copyright, trade secret, and contract laws to protect our proprietary rights. We also license some of our intellectual property rights, including the Mercury Man logo, to third parties. We continuously assess whether to seek patent and other intellectual property protections for those aspects of our business and technology that we believe constitute innovations providing competitive advantages. We generally enter into confidentiality or license agreements with our employees, consultants and corporate partners, and generally control access to, and distribution of, our technologies, documentation and other proprietary information. We consider our United Online, FTD, Interflora, Classmates, NetZero, Juno, StayFriends and MyPoints trademarks to be very valuable assets, and these trademarks have been registered in the U.S. or, in certain cases, in other countries.
International Operations
We have international operations in the U.K., India and Germany. Our operations in the U.K. provide floral and related products and services to consumers and floral network members in the U.K. and the Republic of Ireland. Our operations in India primarily handle email customer support, product development and quality assurance. Our operations in Germany provide online social networking services in Sweden, Germany, France, Austria, and Switzerland. We do not generate revenues directly from our operations in India. Our U.S. revenues totaled $818.9 million, $602.8 million and $506.2 million for the years ended December 31, 2009, 2008 and 2007, respectively. International revenues totaled $171.2 million, $66.6 million and $7.3 million for the years ended December 31, 2009, 2008 and 2007, respectively. Revenues from our operations in the U.K. and the Republic of Ireland totaled $141.2 million and $48.0 million for the years ended December 31, 2009 and 2008, respectively. For information regarding risks associated with our international operations, see "Risk Factors," which appears in Item 1A of this Annual Report on Form 10-K. For information regarding long-lived assets, see Note 2—"Segment Information" of the Notes to the Consolidated Financial Statements, which appears in Part II, Item 8 of this Annual Report on Form 10-K.
Employees
At December 31, 2009, we had 1,699 employees, 1,172 of which were located in the U.S., 263 of which were located in Europe, and 264 of which were located in Hyderabad, India. None of these employees are subject to a collective bargaining agreement, and we consider our relationships with our employees to be good.
Executive Officers
See Part III, Item 10 "Directors, Executive Officers and Corporate Governance" of this Annual Report on Form 10-K for information about executive officers of the Registrant.
Available Information
Our corporate Web site is www.unitedonline.com. On this Web site, we make available, free of charge, our annual, quarterly and current reports (including all amendments to such reports), changes in the stock ownership of our directors and executive officers, our code of ethics, and other documents
20
filed with, or furnished to, the Securities and Exchange Commission ("SEC"), as soon as reasonably practicable after such documents are filed with, or furnished to, the SEC.
The public may read and copy any materials we file with the SEC at the SEC's Public Reference Room at 100 F Street, NE, Washington, DC 20549. The public may obtain information on the operation of the Public Reference Room by calling the SEC at 1-800-SEC-0330. The SEC also maintains an Internet site that contains reports, proxy and information statements and other information regarding our Company that we file electronically with the SEC at www.sec.gov.
By referring to our Web sites, including www.unitedonline.com, www.ftd.com, www.interflora.co.uk, www.interflora.ie, www.classmates.com, www.stayfriends.se, www.stayfriends.de, www.stayfriends.at, www.stayfriends.ch, www.trombi.com, and www.mypoints.com, we do not incorporate these Web sites or their contents into this Annual Report on Form 10-K.
RISKS RELATING TO OUR BUSINESS GENERALLY
Current or future economic conditions may have a material and adverse impact on our business, financial condition, results of operations, and cash flows.
Economic conditions in the United States and the European Union have been depressed and may remain depressed for the foreseeable future. Our products and services are discretionary and dependent upon levels of consumer spending. Consumer spending patterns are difficult to predict and are sensitive to, among other factors, the general economic climate, the consumers' level of disposable income, consumer debt, and overall consumer confidence. The current economic conditions have adversely impacted certain aspects of our businesses in a number of ways including reduced demand, more aggressive pricing for similar products and services by our competitors, decreased spending by advertisers, increased credit risks, increased credit card failures, a loss of customers, and increased use of discounted pricing plans for certain of our products and services. It is likely that these and other factors will continue to adversely impact our businesses, at least in the near term. The current economic conditions may adversely impact our key vendors. The depressed economic conditions and decreased consumer spending have, in certain cases, resulted in, and may in the future result in, a variety of negative effects such as a reduction in revenues, increased costs, lower gross margin and operating margin percentages, increased allowances for doubtful accounts and write-offs of accounts receivable, and recognition of impairments of assets, including goodwill and other intangible and long-lived assets. Any of the above factors could have a material adverse effect on our business, financial condition, results of operations, and cash flows.
Our business is subject to fluctuations.
Our results of operations and changes in our key business metrics from period to period have varied in the past and may fluctuate significantly in the future due to a variety of factors, many of which are outside of our control and difficult to predict. Each of the risk factors discussed in this Item 1A and the other factors described elsewhere in this Annual Report on Form 10-K and in our other filings with the SEC may affect us from period to period and may affect our long-term performance. As a result, you should not rely on period-to-period comparisons as an indication of our future performance. In addition, these factors and the depressed economic conditions create difficulties with respect to our ability to forecast our financial performance and business metrics accurately. We believe that these difficulties in forecasting present even greater challenges for financial analysts who publish their own estimates of our future financial results and business metrics. We cannot assure you that we will achieve the expectations of, or projections made by, our management or the financial analysts. In the event we do not achieve such expectations or projections, our financial results and the price of our common stock could be adversely affected.
21
We may be unable to maintain or grow our advertising revenues. Reduced advertising revenues may reduce our profits.
Advertising revenues are a key component of our revenues and profitability. Factors that have caused, or may cause in the future, our advertising revenues to fluctuate include, without limitation, the effect of, changes to, or terminations of key advertising relationships, changes in applicable laws, regulations or business practices, changes in the online advertising market, changes in the economy, advertisers' budgeting and buying patterns, competition, changes in the number of consumers purchasing our products and services, changes in our business models, changes in our advertising inventory, and changes in usage of our services. Decreases in our advertising revenues are likely to adversely impact our profitability.
Our advertising revenues have in the past declined, and may in the future decline, when compared to prior periods. For 2010, we expect that our advertising revenues will decrease as compared to 2009. We anticipate advertising revenues generated by our Communications segment to continue to decline primarily as a result of the decrease in our dial-up Internet access pay accounts. In addition, our Communications segment has derived significant advertising revenues from search, and we are in the process of changing Internet search providers. Changes to the terms of our search agreement or difficulties or delays with the transition of our new search provider's service onto our Web sites, or the inability of the new search provider's service to monetize as well as the prior service, could have a material adverse effect on our Communications segment's advertising revenues. Also, all of our revenues from our online loyalty marketing service are derived from advertising, and we have experienced from time to time, and may continue to experience, significant declines in revenues from this service. In addition, prior to 2010, our Classmates Media and FTD segments have collectively derived significant advertising revenues from domestic post-transaction sales agreements. Post-transaction sales involve the online presentation of a third-party offer following the point where a consumer has purchased our subscription services or floral products, as applicable. In January 2010, we terminated our domestic post-transaction sales agreements. As discussed in greater detail in the risk factor related to changes in laws and regulations, certain governmental agencies have been investigating post-transaction sales practices and the companies that have engaged in such practices, including us. Although we expect to continue to offer our members and customers complementary services or products at the end of our registration or sale processes, including third-party offers as well as our own offers, there are no assurances that we will enter into any such third-party arrangements or that such offers will be well received by our members or customers. Even if we do enter into third-party arrangements, we anticipate that the revenues generated from such arrangements will be significantly less than the post-transaction sales revenues generated in 2009. Any or all of the above factors could cause our advertising revenues and profits to significantly decline in the future.
Changes in exchange rates could adversely affect comparisons of our operating results.
We transact business in different foreign currencies and may be exposed to financial market risk resulting from fluctuations in foreign currency exchange rates, including the British Pound, the Euro, the Indian Rupee, and the Canadian Dollar. Revenues and expenses in foreign currencies translate into higher or lower revenues and expenses in U.S. Dollars as the U.S. Dollar weakens or strengthens against such other currencies. Substantially all of the revenues of our foreign subsidiaries are received, and substantially all expenses are incurred, in currencies other than the U.S. Dollar, which increases or decreases the related U.S. Dollar-reported revenues and expenses depending on the trend in currency exchange rates. Certain of our key business metrics, such as the FTD segment's average order value, are similarly affected by such currency fluctuations. Changes in global economic conditions, market factors, and governmental actions, among other factors, can affect the value of these currencies in relation to the U.S. Dollar. A strengthening of the U.S. Dollar compared to these currencies and, in particular, to the British Pound, has had, and in future periods could have, an adverse effect on the
22
comparisons of our revenues and operating income against prior periods. We cannot accurately predict the impact of future foreign currency exchange rate fluctuations on our operating results, and such fluctuations could negatively impact the comparisons of such results against prior periods.
Our marketing efforts may not be successful, which could increase our costs and adversely impact our key metrics and financial results.
We spend significant resources marketing our brands, products and services. We rely on relationships with a wide variety of third parties, including Internet search providers, Internet advertising networks, co-registration partners, retailers, distributers and direct marketers, to promote or distribute our products and services. In addition, one of our strategies is to cross market our various products and services to our existing customer base. If our marketing, including cross marketing, activities are inefficient or unsuccessful, or if important third-party relationships become more expensive or unavailable, our key metrics and financial results could be materially and adversely impacted.
Significant problems with our key systems or those of our third-party vendors could have a material adverse effect on our business, financial condition, results of operations, and cash flows.
The systems underlying the operations of each of our business segments are complex and diverse, and must efficiently integrate with third-party systems, such as credit card processors. Key systems include, without limitation, billing; Web site and database management; order transmission, fulfillment and processing including the system for transmitting orders through the floral network; customer support; telecommunications network management; advertisement serving and management systems; and internal financial systems. Some of these systems, such as customer support, are outsourced to third parties, and other systems, such as FTD's order transmission and fulfillment system and the platform for our international social networking Web sites, are not redundant. We have experienced systems problems in the past, and we or these third parties may experience problems in the future. In addition, if these third parties face financial or other difficulties, our business could be adversely impacted. Any significant errors, failures, interruptions, delays, or other problems with our systems or our third-party vendors or their systems could have a material adverse effect on our business, financial condition, results of operations, and cash flows.
In addition, our Classmates Media and Communications businesses outsource a majority of their live technical and billing support functions. These businesses rely on one customer support vendor, and we maintain only a small number of internal customer support personnel for these businesses. Our internal customer support personnel are not equipped to provide the necessary range of customer support functions in the event that this vendor unexpectedly becomes unable or unwilling to provide these services to us.
Our failure to enforce and protect our proprietary rights could harm our business.
Our trade names, trademarks, service marks, patents, copyrights, domain names, and trade secrets are important to the success of our businesses. In particular, we view our primary trademarks as critical to our success. We rely upon patent, trademark, copyright, trade secret, and domain name laws in the U.S. and similar laws in other countries, as well as licenses and other agreements with our employees, members, consumers, suppliers and other parties, to establish and maintain our proprietary rights in the technology, products, services and content used in our operations. These laws and agreements may not guarantee that our proprietary rights will be protected and our proprietary rights could be challenged or invalidated. We also license some of our intellectual property rights, including the Mercury Man logo, to third parties. The steps we and such third parties have taken to protect our proprietary rights may not be adequate, and other third parties may infringe or misappropriate our proprietary rights. The protection of our proprietary rights may require the expenditure of significant financial and
23
internal resources. We cannot assure you that we have taken adequate steps to prevent misappropriation of our proprietary rights. Our failure to adequately protect our proprietary rights could adversely affect our brands and could harm our business.
We may be unsuccessful at acquiring additional businesses, services or technologies. Even if we complete an acquisition, it may not improve our results of operations and may also adversely impact our business, financial condition and cash flows.
One of our strategic objectives is to acquire businesses, services or technologies that will provide us with an opportunity to diversify the products and services we offer, leverage our assets and core competencies, or expand our geographic reach, or that otherwise may be complementary to our existing businesses. However, acquiring companies is a difficult process with many factors outside of our control. In addition, our credit agreements impose certain restrictions on our ability to complete acquisitions and there is no assurance that we will be successful in completing additional acquisitions.
We have evaluated and expect to continue to evaluate, a wide variety of potential strategic transactions that we believe may complement our current or future business activities. However, we cannot assure you that the anticipated benefits and synergies of an acquisition will materialize or that any integration attempts will be successful. Acquiring a business, service or technology involves many operational and financial risks, including risks relating to:
- •
- disruption of our ongoing business and significant diversion of resources and management time from
day-to-day responsibilities;
- •
- acquisition financings that involve the issuance of potentially dilutive equity or the incurrence of debt;
- •
- reduction of cash and other resources available for operations and other uses;
- •
- exposure to risks specific to the acquired business, service or technology to which we are not currently exposed;
- •
- risks of entering markets in which we have little or no direct prior experience;
- •
- unforeseen obligations or liabilities;
- •
- difficulty assimilating the acquired customer bases, technologies and operations;
- •
- difficulty assimilating and retaining management and employees of the acquired business;
- •
- potential impairment of relationships with users, customers or vendors as a result of changes in management of the
acquired business or other factors;
- •
- large write-offs either at the time of the acquisition or in the future, the incurrence of restructuring
charges, the amortization of identifiable intangible assets, and the impairment of amounts capitalized as goodwill, intangible assets and other long-lived assets; and
- •
- lack of, or inadequate, controls, policies and procedures appropriate for a public company, and the time, cost and difficulties related to the implementation of such controls, policies and procedures or the remediation of any deficiencies.
Any of these risks could harm our business, financial condition, results of operations, and cash flows.
In addition, an acquisition of a foreign business involves risks in addition to those set forth above, including risks associated with foreign currency exchange rates, potentially unfamiliar economic, political and regulatory environments and integration difficulties due to language, cultural and geographic differences.
24
A security breach or inappropriate access to, or use of, our networks, computer systems or services or those of third-party vendors could expose us to liability, claims and a loss of revenue.
The success of our business depends on the security of our networks and, in part, on the security of the network infrastructures of our third-party vendors. Unauthorized or inappropriate access to, or use of, our networks, computer systems or services, whether intentional, unintentional or as a result of criminal activity, could potentially jeopardize the security of confidential information, including credit card information, of our customers and of third parties. We cannot assure you that the security measures we take will be effective in preventing these types of activities. We also cannot assure you that the security measures of our third-party network providers, providers of customer and billing support services or other vendors will be adequate. In addition to potential legal liability, these activities may adversely impact our reputation or our revenues and may interfere with our ability to provide our products and services, all of which could adversely impact our business.
Legal actions or investigations could subject us to substantial liability, require us to change our business practices, and adversely affect our business, financial condition, results of operations, and cash flows.
We are currently, and have been in the past, party to various legal actions and investigations. These actions may include, without limitation, claims by private parties in connection with consumer protection and other laws, claims that we infringe third-party patents, claims involving unfair competition, claims in connection with employment practices, securities laws claims, breach of contract claims, and other business-related claims. The nature of our business could subject us to additional claims for similar matters, as well as a wide variety of other claims including, without limitation, claims for defamation, right of publicity, negligence, trademark and copyright infringement, and privacy and security matters. Various governmental agencies have in the past, and may in the future, assert claims, institute legal actions, inquiries or investigations, or impose obligations relating to our business practices, such as our marketing, billing, customer retention, renewal, cancelation, refund, or disclosure practices. As discussed in the risk factor related to changes in laws and regulations, certain governmental agencies have been investigating post-transaction sales practices and the companies that engage in such practices, including us. Defending against lawsuits, inquiries and investigations involves significant expense and diversion of management's attention and resources from other matters. We may not prevail in existing or future claims. The failure to successfully defend against certain types of claims, including claims relating to our business practices or alleging infringement of proprietary rights, could result in our incurring significant liabilities related to judgments or settlements or require us to change our business practices. Infringement claims may also result in our being required to obtain licenses from third parties, which licenses may not be available on acceptable terms, if at all. Both the cost of defending claims, as well as the effect of settlements and judgments, could cause our results of operations to fluctuate significantly from period to period and could materially and adversely affect our business, financial condition, results of operations, and cash flows.
Our online social networking and online loyalty marketing services, as well as our FTD segment's consumer business, rely heavily on email campaigns, and any disruptions or restrictions on the sending of emails or increase in the associated costs could adversely affect our business and results of operations.
Our emails generate the majority of the traffic on our social networking Web sites and are the most important driver of member activity for our online loyalty marketing service. A significant number of members of our online social networking and online loyalty marketing services elect to opt-out of receiving certain types of emails. Without the ability to email these members, we have very limited means of inducing members to return to our Web sites and utilize our services. In addition, each month, a significant number of email addresses for members of our online social networking and online
25
loyalty marketing services become invalid. This disrupts our ability to email these members and prevents social networking members from being able to contact these members, which is a key reason why members use our online social networking services.
Our FTD segment generates a significant portion of its consumer orders from the emails we send to customers who have previously ordered products from us. We also engage in a number of third-party email marketing campaigns in which such third parties include our marketing offers in the emails they send.
An increase in the number of members or customers who elect to not receive, or are unable to receive, our emails could adversely affect our business and results of operations. From time to time, Internet service providers block bulk email transmissions or otherwise experience technical difficulties that result in our inability to successfully deliver emails to our members. Third parties may also block, impose restrictions on, or start to charge for, the delivery of emails through their email systems. Due to the importance of email to our businesses, any disruption or restriction on the distribution of emails or increase in the associated costs could materially and adversely affect our revenues and profitability.
Our substantial amount of indebtedness could adversely affect our ability to raise additional capital to fund operations, our flexibility in operating our business and our ability to react to changes in the economy or our industry, and prevent us from satisfying our debt obligations.
We have a substantial amount of indebtedness which could have important consequences for our business and financial condition. For example:
- •
- if we fail to meet payment obligations or otherwise default under the agreements governing our indebtedness, the lenders
under those agreements will have the right to accelerate the indebtedness and exercise other rights and remedies against us;
- •
- we will be required to dedicate a substantial portion of our cash flow from operations to payments on our debt, thereby
reducing funds available for working capital, capital expenditures, dividends, acquisitions, and other purposes;
- •
- our ability to obtain additional financing to fund future working capital, capital expenditures, additional acquisitions,
and other general corporate requirements could be limited;
- •
- the credit agreements impose operating and financial covenants and restrictions on us, including limitations on our
ability to use FTD cash flow for the benefit of our subsidiaries other than FTD, and on our ability to use the cash flow of our subsidiaries other than FTD for the benefit of FTD, and compliance with
such covenants and restrictions may adversely affect our ability to adequately finance our operations or capital needs in the future, to pursue attractive business opportunities that may arise in the
future, to redeem or repurchase capital stock, to pay dividends, to sell assets, and to make capital expenditures;
- •
- our failure to comply with the covenants in the credit agreements, including failure as a result of events beyond our
control, could result in an event of default under the applicable credit agreement (and any other credit agreement which contains a cross-default provision), which could cause all amounts outstanding
with respect to that debt to become immediately due and payable and could materially and adversely affect our operating results, financial condition and liquidity;
- •
- we will experience increased vulnerability to, and limited flexibility in planning for, changes to our businesses and
adverse economic and industry conditions;
- •
- we could be placed at a competitive disadvantage relative to other companies with less indebtedness;
26
- •
- our ability to apply excess cash flow or proceeds from certain types of securities offerings, asset sales and other
transactions to purposes other than the repayment of debt, as well as servicing of the debt, could be limited;
- •
- the interest rates under the credit agreements will fluctuate and, accordingly, interest expense may increase; and
- •
- if we make voluntary prepayments on our debt, we will have to accelerate the related discount accretion and debt issuance cost amortization, which would impact interest expense, and certain prepayments may be subject to penalties.
Under the terms of the credit agreements, we will be permitted to incur additional indebtedness subject to certain conditions, and the risks described above may be increased if we incur additional indebtedness.
Our credit agreements include guarantees on a joint and several basis by our existing and future, direct and indirect domestic subsidiaries and are secured by first priority security interests in, and mortgages on, substantially all of our direct and indirect subsidiaries' tangible and intangible assets and first priority pledges of all the equity interests owned by us in our existing and future direct and indirect subsidiaries (except with respect to foreign subsidiaries in which case such pledges are limited to 66% of the outstanding capital stock). The occurrence of an event of default under the credit agreements could permit the lenders to terminate the commitments of such lenders to make further extensions of credit under the credit agreements, to call and enforce the guarantees, and to foreclose on the collateral securing such debt.
We may not realize the benefits associated with our assets and may be required to record a significant charge to earnings if we are required to expense certain costs or impair our assets.
We have capitalized goodwill and identifiable intangible assets in connection with our acquisitions. We perform an impairment test of our goodwill and indefinite-lived intangible assets annually during the fourth quarter of our fiscal year or when events occur or circumstances change that would more likely than not indicate that goodwill or any such assets might be permanently impaired. If our acquisitions are not commercially successful or, if due to economic or other conditions, our assumptions regarding the performance of the acquired businesses are not achieved, we would likely be required to record impairment charges which would negatively impact our financial condition and results of operations. We have experienced impairment charges in the past, and in the fourth quarter of 2008, we recorded material impairment charges related to our FTD segment's goodwill and indefinite-lived intangible assets. Given the current economic environment and the uncertainties regarding the impact on our businesses, there can be no assurance that our estimates and assumptions regarding the duration of the depressed economic conditions, or the period or strength of recovery, made for purposes of our goodwill and identifiable intangible assets impairment testing will prove to be accurate predictions of the future. If our assumptions regarding forecasted revenue or growth rates of certain reporting units or other factors are not achieved or are revised downward, we may be required to record additional impairment charges in future periods. In addition, from time to time, we record tangible or intangible assets on our balance sheet that, due to changes in value or in our strategy, may have to be expensed in future periods. Write-downs or impairments of assets, whether tangible or intangible, could adversely and materially impact our financial condition and results of operations.
Our ability to operate our business could be seriously harmed if we lose members of our senior management team or other key employees.
Our business is largely dependent on the efforts and abilities of our senior management, particularly Mark R. Goldston, our chairman, president and chief executive officer, and other key personnel. Any of our officers or employees can terminate his or her employment relationship at any
27
time. The loss of any of these key employees or our inability to attract or retain other qualified employees could seriously harm our business and prospects. We do not carry key-person life insurance on any of our employees.
Foreign, state and local governments may attempt to impose additional income taxes, sales and use taxes, value-added taxes or other taxes on our business activities and Internet-based transactions, including our past sales, which could decrease our ability to compete, reduce our sales, or have a material adverse effect on our business, financial condition, results of operations, and cash flows.
We are subject to income and various other taxes in the United States and numerous foreign jurisdictions. Significant judgment is required in evaluating our worldwide provision for income taxes. During the ordinary course of business, there are many transactions for which the ultimate tax determination is uncertain. In addition, our effective income tax rates could be adversely affected by earnings being lower than anticipated in countries where we have lower statutory rates and higher (or determined to be higher by a particular taxing jurisdiction) than anticipated in countries where we have higher statutory rates, by changes in the valuation of our deferred tax assets and liabilities or by, among other factors, changes in the relevant tax, accounting and other laws, regulations, principles and interpretations. We are subject to audit in various jurisdictions, and such jurisdictions may assess additional income and other taxes against us. Although we believe our tax estimates are reasonable, the final determination of tax audits and any related litigation could be materially different from our historical income tax provisions, and our historical recognition of other tax matters. The results of an audit or litigation could have a material effect on our business, financial condition, results of operations, and cash flows.
In connection with our Internet-based transactions, a number of states have been considering or adopting legislation or instituting policy initiatives, including those that would facilitate a finding of nexus to exist between Internet companies with the states, aimed at expanding the reach of sales and use taxes or imposing state income or other taxes on various innovative theories, including agency attribution from independent third-party service providers. Such legislation or initiatives could result in the imposition of additional sales and use taxes, or the payment of state income or other taxes, on certain transactions conducted over the Internet. If such legislation is enacted, or such initiatives are instituted, and upheld by the courts, the legislation or initiatives could subject us to substantially increased tax liabilities for past and future sales or state income or other taxes, require us to collect additional sales and use taxes, cause our future sales to decrease, otherwise negatively impact our businesses, and thus have a material adverse affect on us.
Changes in laws and regulations and new laws and regulations may adversely affect our business, financial condition, results of operations, and cash flows.
We are subject to a variety of international, federal, state, and local laws and regulations, including, without limitation, those relating to taxation, bulk email or "spam," advertising, user privacy and data protection, consumer protection, antitrust, and unclaimed property. Compliance with the various laws and regulations, which in many instances are unclear or unsettled, is complex. Any changes in such laws and regulations, the enactment of any additional laws or regulations, failure to comply with, or increased enforcement activity of, such laws and regulations, could significantly impact our products and services, our costs, or the manner in which we conduct business, all of which could adversely impact our results of operations and cause our business to suffer.
The Federal Trade Commission and certain state agencies have investigated Internet companies, including us, in connection with consumer protection and privacy matters. Federal, state and foreign governments have also enacted consumer protection laws, including laws protecting the privacy of consumers' nonpublic personal information. In 2009, a committee of the U.S. Senate commenced an investigation of post-transaction sales practices and the companies that have engaged in such practices.
28
As part of such investigation, we received a request for information from the committee, and we have cooperated with such request. In addition, we have received a civil investigative demand from the Attorney General of the State of Washington and subpoenas from the Attorney General of the State of New York regarding their respective investigations into such practices and the companies that have engaged in them, including us. We have been cooperating with the investigations, but we cannot predict their outcome or their potential implications for our business. There are no assurances that additional governmental investigations or other legal actions will not be instituted in connection with our former post-transaction sales practices or other current or former business practices. Enforcement actions or changes in enforcement policies and procedures, the adoption of new laws or regulations, or our failure to comply with existing laws, including those of foreign countries in which we operate, could decrease our revenues and increase the costs of operating our business. To the extent that our services and business practices change as a result of claims or actions by governmental agencies, changes in laws and regulations, or claims or actions by private parties, our business, financial condition, results of operations, and cash flows could be materially and adversely affected.
We face risks relating to operating and doing business internationally that could adversely affect our businesses and results of operations.
Our businesses operate in a number of countries outside the U.S. Conducting international operations involves risks and uncertainties, including:
- •
- adverse fluctuations in currency exchange rates;
- •
- potentially adverse tax consequences, including the complexities of foreign value-added taxes and restrictions on the
repatriation of earnings;
- •
- increased financial accounting, tax and reporting burdens and complexities;
- •
- disruption of our ongoing business and significant diversion of management attention from
day-to-day responsibilities;
- •
- localization of our services, including translation into foreign languages and adaptation for local practices and
regulatory requirements;
- •
- lack of familiarity with, and unexpected changes in, foreign regulatory requirements;
- •
- longer accounts receivable collection cycles;
- •
- difficulties in managing and staffing international operations;
- •
- the burdens of complying with a wide variety of foreign laws, regulations and legal and regulatory standards;
- •
- political, social and economic instability abroad, terrorist attacks and security concerns in general; and
- •
- reduced or varied protection for intellectual property rights.
The occurrence of any one of these risks could negatively affect our international operations, our key business metrics, and our financial results.
Our businesses could be shut down or severely impacted by a catastrophic event.
Our businesses could be materially and adversely affected by a catastrophic event. A disaster such as a fire, earthquake, flood, power loss, terrorism, or other similar event, affecting any of our facilities, data centers or computer systems, or those of our third-party vendors, could result in a significant and extended disruption of our operations and services. Any prolonged disruption of our services due to these or other events would severely impact our businesses. We do not carry flood insurance for one of
29
our facilities, and the property, business interruption and other insurance we do carry may not be sufficient to cover, if at all, losses that may occur as a result of any events which cause interruptions in our services.
We cannot predict our future capital needs and we may not be able to secure additional financing which could adversely impact us.
We may need to raise additional funds in the future to fund our operations, for acquisitions of businesses, services or technologies or for other purposes. Additional financing may not be available in a timely manner, on terms favorable to us, or at all. We incurred substantial indebtedness in connection with the acquisition of FTD. The terms of such indebtedness in addition to the degree to which we are leveraged, will adversely affect our ability to obtain additional financing. In addition, the current extreme volatility of, and disruption in, the securities and credit markets may restrict our ability to raise any such additional funds. If adequate funds are not available or not available when required and in sufficient amounts or on acceptable terms, our businesses and future prospects may suffer.
We may stop paying, or reduce, quarterly cash dividends on our common stock.
The payment of future dividends is discretionary and is subject to determination by our Board of Directors each quarter following its review of our financial condition, results of operations and cash flows and such other factors as are deemed relevant by our Board of Directors. The terms of our indebtedness impose limitations on our ability to pay dividends. Commencing with the third quarter of 2008, we have decreased our quarterly cash dividend from $0.20 per share of common stock to $0.10 per share of common stock. Changes in our business needs, including working capital and funding for acquisitions, or a change in tax laws relating to dividends, among other factors, could cause our Board of Directors to decide to cease the payment of, or further reduce, dividends in the future. We cannot assure you that we will not decrease or discontinue quarterly cash dividends, and if we do, our stock price could be negatively impacted.
We have anti-takeover provisions that may make it difficult for a third party to acquire us.
Provisions of our certificate of incorporation, our bylaws and Delaware law could make it difficult for a third party to acquire us, even if doing so might be beneficial to our stockholders because of a premium price offered by a potential acquirer. Our Board of Directors adopted a stockholder rights plan, which is an anti-takeover measure that will cause substantial dilution to a third party who attempts to acquire our Company on terms not approved by our Board of Directors.
Our stock price has been highly volatile and may continue to be volatile.
The market price of our common stock has fluctuated significantly and it may continue to be volatile with extreme trading volume fluctuations. In addition, The Nasdaq Global Select Market has experienced substantial price and trading volume fluctuations. The broad market and industry factors that influence or affect such fluctuations may harm the market price of our common stock, regardless of our actual operating performance. As a result of these or other reasons, we have experienced and may continue to experience significant volatility in the market price of our common stock.
30
ADDITIONAL RISKS RELATING TO OUR FTD SEGMENT
Competition could have a material adverse effect on our business, financial condition, results of operations, and cash flows.
We compete in the market for flowers and, to a lesser degree, specialty gifts. In the consumer market, consumers are our customers for direct sales of floral and specialty gifts through our Web sites and toll-free telephone numbers. In the floral network services market, retail florists and supermarkets are our principal customers for memberships and subscriptions to our various floral network services including, among other things, access to the FTD and Interflora brands and the Mercury Man logo, access to the floral network, credit card processing services, e-commerce Web sites, online advertising tools, and telephone answering, order-taking, transmission and clearing-house services.
The consumer market for flowers and specialty gifts is highly competitive, and consumers can purchase the products we offer from numerous sources, including traditional local retail florists, supermarkets, mass merchants, specialty gift retailers, and nationwide floral marketers, such as those that use Web sites, toll-free telephone numbers and catalogs. The floral network services market is highly competitive as well, and retail florists and supermarkets may choose from a few floral network service providers that offer similar products and services. In the U.S., our key competitors in the consumer market include 1-800-FLOWERS.COM, Inc., Proflowers.com and Teleflora, and our key competitors in the floral network services market include Teleflora and BloomNet Wire Service, a subsidiary of 1-800-FLOWERS.COM. International key competitors include Marks & Spencer, NEXT, John Lewis, Teleflorist (also known as eFlorist), and Flowers Direct.
We believe competition in the consumer market will likely intensify. Supermarkets and nationwide floral marketers have been gaining market share over retail florists as consumers continue to shift more of their floral purchases to these channels. We expect the sales volumes at supermarkets and other mass merchants to continue to increase, and that nationwide floral marketers will continue to increase their competition with us. In particular, the nature of the Internet as a marketplace facilitates competitive entry and comparative shopping, and we have experienced increased competition based on price. Some of our competitors may have significant competitive advantages over us, may devote significantly greater resources to marketing campaigns or other aspects of their business or may respond more quickly and effectively than we can to new or changing opportunities or customer requirements.
We expect competition in the floral network services market to continue to increase as well. We believe we will continue to experience increasing competition from the other floral network services providers. In addition, we expect retail florists likely will continue to lose sales to supermarkets and nationwide floral marketers, which likely will result in a continuing decrease in their revenues and in the number of retail florists. As the number of retail florists and their revenues decrease, competition for the business of the remaining retail florists will intensify.
Increased competition in the consumer market or the floral network services market may result in lower revenues, reduced gross margins, loss of market share, and increased marketing expenditures. We cannot provide assurance that we will be able to compete successfully or that competitive pressures will not have a material adverse effect on our business, financial condition, results of operations, and cash flows.
31
We are dependent on third parties who fulfill orders and deliver goods and services to our customers and their failure to provide our customers with high-quality products and customer service may harm our brands and could have a material adverse effect on our business, financial condition, results of operations, and cash flows.
We believe that our success in promoting and enhancing our brands depends on our ability to provide our customers high-quality products and a high level of customer service. Our business depends, in part, on the ability of our independent floral network members and third-party suppliers who fulfill our orders to do so at high-quality levels. We work with our floral network members and third-party suppliers to develop best practices for quality assurance; however, we generally do not directly control or continuously monitor any floral network member or third-party supplier. The failure of our floral network members or third-party suppliers to fulfill orders to our customers' satisfaction, at an acceptable level of quality and within the required timeframe, could adversely impact our brands and cause us to lose customers, which could have a material adverse effect on our business, financial condition, results of operations, and cash flows.
Additionally, because we depend upon third parties for the delivery of our products to customers, strikes or other service interruptions affecting these shippers could have an adverse effect on our ability to deliver our products on a timely basis. If any of our shippers are unable or unwilling to deliver our products, we would have to engage alternative shippers which could increase our costs. A disruption in any of our shippers' delivery of our products could cause us to lose customers or could increase our costs, which could have a material adverse effect on our business, financial condition, results of operations, and cash flows.
The success of our business is dependent on our floral network members and on the financial performance of the retail floral industry.
A significant portion of our profitability is dependent on our floral network members. We have lost, and may continue to lose, floral network members as a result of both our members choosing not to do business with us as well as declines in the number of local retail florists as a result of economic factors and competition. If we lose a significant number of floral network members, or if we are not able to maintain or increase revenues from our floral network members, our business, financial condition, results of operations, and cash flows may be materially and adversely affected.
If the supply of flowers becomes limited, the price of these products could rise or these products may become unavailable, which could result in our not being able to meet consumer demand and could cause an adverse effect on our business, financial condition, results of operations, and cash flows.
Many factors, such as weather conditions, agricultural limitations and restrictions relating to the management of pests and disease, affect the supply of flowers and the price of our floral products. If the supply of flowers available for sale is limited, the wholesale prices of flowers could rise, which would cause us to increase our prices or reduce our profits. An increase in our prices could result in a decline in customer demand for our floral products, which would decrease our revenues.
Alternatively, we may not be able to obtain high-quality flowers in an amount sufficient to meet customer demand. Even if available, flowers from alternative sources may be of lesser quality or more expensive than those currently offered by us. A large portion of our supply of flowers is sourced from Colombia, Ecuador and Holland.
The availability and price of our products could be affected by a number of other factors affecting suppliers, including:
- •
- severe weather;
- •
- import duties and quotas;
32
- •
- time-consuming import regulations or controls at airports;
- •
- changes in trading status;
- •
- economic uncertainties and currency fluctuations, including as a result of the recent volatility and disruptions in the
credit markets and general economy;
- •
- foreign government regulations, laws and political unrest;
- •
- governmental bans or quarantines; and
- •
- trade restrictions, including U.S. retaliation against foreign trade practices.
Foreign, state and local governments may attempt to impose additional sales and use taxes, value-added taxes or other taxes on our business activities, including our past sales, which could decrease our ability to compete, reduce our sales, and have a material adverse effect on our business, financial condition, results of operations, and cash flows.
In accordance with current industry practice by domestic floral and specialty gift order gatherers and our interpretation of applicable law, our FTD consumer business collects and remits sales and use taxes on orders that are delivered in states where it has a physical presence or other form of jurisdictional nexus, which is a limited number of states. If states successfully challenge this practice and impose sales and use taxes on orders delivered in states where we do not have physical presence or another form of jurisdictional nexus, we could incur substantial tax liabilities for past sales and lose future sales as a result of the increased tax cost that would be borne by the customer. Also, states may seek to reclassify the status of Internet order gatherers, such as our FTD consumer business, as persons that are deemed to fulfill the underlying order, in which case, a state may seek to impose taxes on the receipts generated by our FTD consumer business for orders fulfilled and delivered by florists outside such state. In addition, future changes in the operation of our online and telephonic sales channels could result in the imposition of additional sales and use tax or other tax obligations.
Additionally, in accordance with current industry practice by international floral and specialty gift direct marketers and our interpretation of applicable law, we collect and remit value-added taxes on certain consumer orders placed through Interflora. Future changes in the operation of our Interflora business could result in the imposition of additional tax obligations. Moreover, if a foreign taxing authority challenges our current practice or implements new legislative initiatives, additional taxes on consumer sales could be due by us. The imposition of additional tax liabilities for past or future sales could decrease our ability to compete with traditional retailers and reduce our sales, which could have a material adverse effect on our business, financial condition, results of operations, and cash flow.
We utilize outsourced staff and temporary employees, who may not be as well trained or committed to our customers as our permanent employees, and their failure to provide our customers with high-quality customer service may cause our customers not to return, which could have a material adverse effect on our business, financial condition, results of operations, and cash flows.
We utilize and rely on a significant number of outsourced staff and temporary employees in addition to our permanent employees, to take orders and respond to customer inquiries. These outsourced staff and temporary employees may not have the same level of commitment to our customers or be as well trained as our permanent employees. In addition, we may not hire enough outsourced staff or temporary employees to adequately handle the increased volume of telephone calls we receive during peak periods. If our customers are dissatisfied with the quality of the customer service they receive, they may not place orders with us again, which could have a material adverse effect on our business, financial condition, results of operations and cash flows.
33
ADDITIONAL RISKS RELATING TO OUR CLASSMATES MEDIA SEGMENT
We expect to face increasing competition that could result in a loss of members, reduced revenues and decreased profitability.
Our online social networking services compete with a wide variety of social networking Web sites, including broad social networking Web sites such as Facebook; a number of specialty niche Web sites, including LinkedIn and MyLife.com, that offer online social networking services focused on particular affiliations such as school or work communities; and schools, employers and associations that maintain their own Internet-based alumni information services. We also compete with a wide variety of Web sites that provide users with alternative networks and ways of locating and interacting with acquaintances from various affiliations, including online services designed to locate individuals such as White Pages and US Search, Internet search engines that have the ability to locate individuals, including by finding individuals through their profiles on social networking Web sites, and Web portals such as Yahoo!, MSN and AOL. We believe that there are currently only a small number of competitive online social networking services that are focused specifically on our niche of the market, which is to help people find and reconnect with enduring relationships and important memories from school. However, as the membership bases of broad social networking Web sites continue to grow, users may be able to locate individuals from their past, free of charge in certain cases, without having to use a niche Web site or other online search service. As a result of the growth of the social networking market and minimal barriers to entry, a number of companies have entered or are attempting to enter our market, either directly or indirectly, some of which may become significant competitors in the future. In addition, many existing online social networking services are broadening their service offerings to compete with our services.
The market for online loyalty marketing services is highly competitive, and we expect competition to significantly increase in the future as loyalty marketing programs grow in popularity. Our MyPoints online loyalty marketing service faces competition for members from several other online loyalty marketing programs as well as offline loyalty marketing programs that have a significant online presence, such as those operated by credit card, airline and hotel companies.
Some of our competitors have longer operating histories, greater name and brand recognition, larger user bases, significantly greater financial, technical, sales, and marketing resources, and engage in more extensive research and development than we do. Some of our competitors also have lower customer acquisition costs than we do, offer a wider variety of services, have more compelling Web sites with more extensive user-generated content or offer their services free to their users. If our competitors are more successful than we are in attracting and retaining members, our ability to maintain a large and growing member base will be adversely affected. If our social networking competitors provide similar services for free, we may not be able to continue to charge for any of our online social networking services. Competition could have a material adverse effect on our subscription revenues from online social networking services, as well as on advertising revenues from our online social networking and online loyalty marketing services. More intense competition could also require us to increase our marketing or other expenditures. As a result of competition, our number of members, revenues, cash flows, and profitability could be adversely affected.
Failure to increase or maintain the number of pay accounts for our online social networking services could cause our business and financial results to suffer.
Pay accounts are critical to our business model. Only a small percentage of users initially registering for our online social networking services sign up for a paid subscription at the time of registration. As a result, our ability to generate subscription revenue is highly dependent on our ability to attract users to our Web sites and register them as free members, to encourage them to return to our Web sites, and to convince them to become pay accounts in order to access the pay features of our
34
Web sites. If we are not able to attract users to our Web sites and convert a significant portion to pay accounts, we may not be able to increase or maintain the number of pay accounts for our online social networking services and our business and financial results would be adversely affected.
A number of our social networking pay account subscriptions each month are not renewed or are canceled, which, for the Classmates Media segment, we refer to as "churn." The level of churn we experience fluctuates from quarter to quarter due to a variety of factors, including our mix of subscription terms, which affects the timing of subscription expirations, as well as the degree of credit card failures. We must continually add new social networking pay accounts both to replace pay accounts who churn and to grow our business beyond our current pay account base. We expect that our churn rate will continue to fluctuate from period to period. A significant majority of our pay accounts are on plans that automatically renew at the end of their subscription period and we have received complaints with respect to our renewal policies and practices. We also experienced an increase in the percentage of credit card failures in 2009. Any change in our renewal policies or practices, or in the degree of credit card failures, could have a material impact on our churn rate. If we experience a higher than expected level of churn, it will make it more difficult for us to increase or maintain the number of pay accounts, which could reduce our revenues and adversely affect our financial results.
Failure to increase or maintain the number of members for our online social networking and online loyalty marketing services or the activity level of these members could cause our business and financial results to suffer.
The success of our online social networking and online loyalty marketing services depends upon our ability to increase or maintain our base of free members and the level of activity of those members. A decline in the number of registered or active free social networking members, or a decline in the activity of those members, could result in decreased pay accounts, decreased content on our Web sites and decreased advertising revenues. A decline in the number of registered or active online loyalty marketing service members could result in decreased advertising revenues. The failure to increase or maintain our base of free members, or the failure to convince our free members to actively participate in our Web sites or services, could have a material adverse effect on our business and our financial results.
In addition, our online social networking services have expended, and may in the future expend, significant resources in developing and implementing new products and services. The development of new products and services involves a number of uncertainties, including unanticipated delays and expenses and technological problems. They also may not be accepted by our members. We cannot assure you that we will be successful in developing or implementing new or enhanced products or services, or that any new products or services will be commercially successful.
Failure to maintain our standard pricing could have adverse effects on our financial results.
Due to the economic conditions in the U.S. and for competitive and other reasons, we recently have been offering a greater percentage of discounted plans on a promotional basis than we typically have offered in the past. In general, these discounted plans offer a one-year subscription term for $9.95, which is a significant discount compared to the current standard pricing for a one-year subscription term of $39.00. We anticipate that the increase in the percentage of pay accounts under a discounted plan will likely result in a decrease in subscription revenues and ARPU, at least in the near term. Although these discounted plans will renew at the then-current standard pricing for such subscription term upon the expiration of the initial term, there are no assurances as to the number of pay accounts that will renew at the standard pricing. We intend to continue offering discounted plans in the future, and there are no assurances that the percentage of discounted plans offered during a period will not be higher than anticipated. Our continued use of discounted plans may result in our becoming dependent on offering such plans in order to obtain new pay accounts and retain existing pay accounts
35
and may result in our having to reduce our standard pricing, which would adversely impact our financial results.
ADDITIONAL RISKS RELATING TO OUR COMMUNICATIONS SEGMENT
Our business will suffer if we are unable to compete successfully.
We compete with numerous other dial-up Internet access providers as well as providers of broadband services. Our key dial-up Internet access competitors include established online service and content providers, such as AOL and MSN, and independent national Internet service providers, such as EarthLink and its PeoplePC subsidiary. Dial-up Internet access services do not compete favorably with broadband services with respect to connection speed and do not have a significant, if any, price advantage over certain broadband services. Many broadband providers, including cable companies and local exchange carriers, bundle their offerings with telephone, entertainment or other services, which may result in lower prices than standalone services. In addition to competition from broadband providers, competition among dial-up Internet access service providers is intense and neither our pricing nor our features provides us with a significant competitive advantage, if any, over certain of our dial-up Internet access competitors. We expect that competition, particularly with respect to price, both for broadband as well as dial-up Internet access services, will continue. We also expect that our dial-up Internet access subscriber base will continue to decrease, potentially at an increasing rate, and that our broadband services will not experience significant growth.
In order to compete effectively, we may have to make significant revisions to our services, pricing and marketing strategies, and business model. For example, we may have to lower our introductory rates, offer additional free periods of service, offer additional features at little or no additional cost to the consumer, or reduce the standard pricing of our services. Measures such as these could decrease our revenues and our average revenue per dial-up Internet access pay account. We may also have to allocate more marketing resources toward our dial-up Internet access services than we anticipate. All of the foregoing could adversely affect the profitability of our dial-up Internet access services which could materially and adversely impact our business, financial condition, results of operations, and cash flows.
Revenues and profitability of our Communications segment are expected to decrease.
Most of our Communications revenues and profits come from our dial-up Internet access services. Our dial-up Internet access pay accounts and revenues have been declining and are expected to continue to decline due to the continued maturation of the market for dial-up Internet access. Consumers continue to migrate to broadband access, primarily due to the faster connection and download speeds provided by broadband access. Advanced applications such as online gaming, music downloads and videos require greater bandwidth for optimal performance, which adds to the demand for broadband access. The pricing for basic broadband services has been declining as well, making it a more viable option for consumers. We expect our dial-up Internet access pay accounts to continue to decline. As a result of expected continued decreases in our dial-up Internet access pay accounts and, potentially, the average monthly revenue per pay account, we expect that our Communications services revenues, advertising revenues, and the profitability of this segment will continue to decline over time. The number of dial-up Internet access pay accounts has been adversely impacted by both a decrease in the number of new pay accounts signing up for our services as well as the impact of subscribers canceling their accounts, which we refer to as "churn." Churn has increased from time to time and may increase in the future. The rate of decline in Communications services revenues has accelerated in some periods and may continue to accelerate. Continued declines, particularly if such declines accelerate, in Communications revenues will materially and adversely impact the profitability of this segment.
36
Our Internet access business is dependent on the availability of telecommunications services and compatibility with third-party systems and products.
Our Internet access business substantially depends on the availability, capacity, affordability, reliability, and security of our telecommunications networks. Only a limited number of telecommunications providers offer the network and data services we currently require, and we purchase most of our telecommunications services from a few providers. Some of our telecommunications services are provided pursuant to short-term agreements that the providers can terminate or elect not to renew. In addition, some telecommunications providers may cease to offer network services for certain less populated areas, which would reduce the number of providers from which we may purchase services and may entirely eliminate our ability to purchase services for certain areas. If we are unable to maintain, renew or obtain new agreements with telecommunications providers, our business, financial condition, results of operations, and cash flows could be materially and adversely affected.
Our dial-up Internet access services also rely on their compatibility with other third-party systems, products and features, including operating systems. Incompatibility with third-party systems and products could adversely affect our ability to deliver our services or a user's ability to access our services and could also adversely impact the distribution channels for our services. Our services are dependent on dial-up modems and an increasing number of computer manufacturers, including certain manufacturers with whom we have distribution relationships, do not pre-load their new computers with dial-up modems, requiring the user to separately acquire a modem to access our services. There can be no assurance that, as the dial-up Internet access market declines and new technologies emerge, we will be able to continue to effectively distribute and deliver our services.
ITEM 1B. UNRESOLVED STAFF COMMENTS
None.
Our corporate headquarters are located in Woodland Hills, California and consist of leased space of approximately 0.1 million square feet. We also lease office space in Fort Lee, New Jersey and Hyderabad, India, which is generally used by our Communications segment. Additionally, we lease office space in Seattle, Washington; San Francisco, California; Schaumburg, Illinois; Erlangen, Germany; and Berlin, Germany, which is generally used by our Classmates Media segment. Our FTD segment also leases space for call center facilities in Centerbrook, Connecticut; Medford, Oregon; Sherwood, Arkansas; and Nottingham, England. We also lease warehouse space in a distribution center in Naperville, Illinois, which is used by our FTD segment.
We own office space in Downers Grove, Illinois and Sleaford, England which is occupied by our FTD segment. We entered into a credit agreement in conjunction with the acquisition of FTD, which includes a security interest in substantially all of its assets, including a mortgage on the owned real property at the Downers Grove, Illinois location.
We believe that our existing facilities are adequate to meet our current requirements and that suitable additional or substitute space will be available as needed to accommodate any physical expansion of our corporate and operations facilities, customer support and technology centers or for any additional sales offices. For additional information regarding our obligations under leases, see Note 15—"Commitments and Contingencies" to our Consolidated Financial Statements included in this Annual Report on Form 10-K.
37
In April 2001 and in May 2001, lawsuits were filed in the United States District Court for the Southern District of New York against NetZero, Inc. ("NetZero"), certain officers and directors of NetZero and the underwriters of NetZero's initial public offering, Goldman Sachs Group, Inc., BancBoston Robertson Stephens, Inc. and Salomon Smith Barney, Inc. A consolidated amended complaint was filed in April 2002. The complaint alleges that the prospectus through which NetZero conducted its initial public offering in September 1999 was materially false and misleading because it failed to disclose, among other things, that (i) the underwriters had solicited and received excessive and undisclosed commissions from certain investors in exchange for which the underwriters allocated to those investors material portions of the restricted number of NetZero shares issued in connection with the offering; and (ii) the underwriters had entered into agreements with customers whereby the underwriters agreed to allocate NetZero shares to those customers in the offering in exchange for which the customers agreed to purchase additional NetZero shares in the aftermarket at pre-determined prices. Plaintiffs are seeking injunctive relief and damages. The case against NetZero was coordinated with approximately 300 other suits filed against more than 300 issuers that conducted their initial public offerings between 1998 and 2000, their underwriters and an unspecified number of their individual corporate officers and directors. The parties in the approximately 300 coordinated class actions, including NetZero, the underwriter defendants in the NetZero class action, and the plaintiff class in the NetZero action, have reached an agreement in principle under which the insurers for the issuer defendants in the coordinated cases will make a settlement payment on behalf of the issuers, including NetZero. On October 5, 2009, the district court issued an order granting final approval of the settlement and certifying the settlement class. Certain individuals have appealed the October 5, 2009 order.
In 2009, a committee of the U.S. Senate commenced an investigation of post-transaction sales practices and the companies that have engaged in such practices. As part of such investigation, we received a request for information from the committee, and we have cooperated with such request. In addition, we have received a civil investigative demand from the Attorney General of the State of Washington and subpoenas from the Attorney General of the State of New York regarding their respective investigations into such practices and the companies that have engaged in them, including us. We have been cooperating with the investigations, but we cannot predict their outcome or their potential implications for our business. There are no assurances that additional governmental investigations or other legal actions will not be instituted in connection with our former post-transaction sales practices or other current or former business practices.
Lawsuits and investigations involve complex questions of fact and law and may require the expenditure of significant funds and the diversion of other resources to defend. Although we do not believe the outcome of our outstanding legal proceedings, investigations, claims, and litigation will have a material adverse effect on our business, financial condition, results of operations, or cash flows, the results of legal proceedings, investigations, claims, and litigation are inherently uncertain and we cannot provide assurance that we will not be materially and adversely impacted by the results of such proceedings or investigations. At December 31, 2009, we had not established any reserves for legal proceedings and investigations except for a $2.2 million reserve for a pending lawsuit.
We are subject to various legal proceedings, claims and litigation that arise in the ordinary course of business. Based on information at this time, we believe the amount, and ultimate liability, if any, with respect to these actions will not materially affect our business, financial condition, results of operations, or cash flows. There can be no assurance, however, that such actions will not materially and adversely affect our business, financial condition, results of operations, or cash flows.
ITEM 4. SUBMISSION OF MATTERS TO A VOTE OF SECURITY HOLDERS
We did not submit any matters to a vote of security holders during the quarter ended December 31, 2009.
38
ITEM 5. MARKET FOR REGISTRANT'S COMMON EQUITY, RELATED STOCKHOLDER MATTERS AND ISSUER PURCHASES OF EQUITY SECURITIES
Our common stock has been quoted on The Nasdaq Global Select Market ("NASDAQ") under the symbol "UNTD" since September 26, 2001. Prior to that, NetZero common stock had been quoted on NASDAQ under the symbol "NZRO" since September 23, 1999. The following table sets forth, for the quarters indicated, the high and low sales prices per share of our common stock as reported on the NASDAQ.
| |
2008 | 2009 | |||||||||||
|---|---|---|---|---|---|---|---|---|---|---|---|---|---|
| |
High | Low | High | Low | |||||||||
First Quarter |
$ | 11.91 | $ | 9.55 | $ | 6.39 | $ | 3.76 | |||||
Second Quarter |
$ | 12.50 | $ | 9.83 | $ | 7.74 | $ | 4.26 | |||||
Third Quarter |
$ | 12.25 | $ | 9.25 | $ | 9.46 | $ | 5.99 | |||||
Fourth Quarter |
$ | 9.43 | $ | 5.11 | $ | 9.28 | $ | 6.69 | |||||
On February 12, 2010, there were 552 holders of record of our common stock.
Dividends
United Online, Inc.'s Board of Directors declared quarterly cash dividends of $0.20 per share of common stock in February, April, July and October 2007. The dividends were paid on February 28, May 31, August 31, and November 30, 2007 and totaled $13.7 million, $14.4 million, $14.4 million, and $14.6 million, respectively.
United Online, Inc.'s Board of Directors declared quarterly cash dividends of $0.20 per share of common stock in January, April and July 2008. The dividends were paid on February 29, May 30, and August 29, 2008 and totaled $14.6 million, $14.9 million, and $14.9 million, respectively. Following the closing of the FTD acquisition, our Board of Directors decreased our quarterly cash dividend from $0.20 per share of common stock to $0.10 per share of common stock. In October 2008, our Board of Directors declared a quarterly cash dividend of $0.10 per share of common stock. The dividend was paid on November 28, 2008 and totaled $8.7 million.
United Online, Inc.'s Board of Directors declared quarterly cash dividends of $0.10 per share of common stock in January, April, July, and October 2009. The dividends were paid on February 27, May 29, August 31, and November 30, 2009 and totaled $8.8 million, $9.1 million, $9.2 million, and $9.1 million, respectively.
In February 2010, United Online Inc.'s Board of Directors declared a quarterly cash dividend of $0.10 per share of common stock. The record date was February 14, 2010 and the dividend will be paid on February 26, 2010.
The payment of future dividends is discretionary and is subject to determination by United Online, Inc.'s Board of Directors each quarter following its review of our financial performance and other factors. In addition, our credit agreement with Silicon Valley Bank imposes certain limitations on our ability to pay dividends. Dividends are declared and paid out of our surplus, as defined and computed in accordance with the General Corporation Law of the State of Delaware.
Common Stock Repurchases
United Online, Inc.'s Board of Directors authorized a common stock repurchase program (the "program") that allows us to repurchase shares of our common stock through open market or privately negotiated transactions based on prevailing market conditions and other factors through December 31,
39
2009. From time to time, the Board of Directors has increased the amount authorized for repurchase under this program and has extended the program. In April 2004, the Board of Directors authorized us to purchase up to an additional $100 million of our common stock under the program, bringing the total amount authorized under the program to $200 million. In December 2009, the Board of Directors again further extended the program through December 31, 2010. From August 2001 through December 31, 2009, we had repurchased $139.2 million of our common stock under the program, leaving $60.8 million of authorization remaining under the program. We have not repurchased any shares of our common stock under the program since February 2005.
Shares withheld upon the vesting of restricted stock units and restricted stock awards and upon the issuance of stock awards to pay applicable employee withholding taxes are considered common stock repurchases, but are not counted as purchases against the program. Upon vesting of restricted stock units or issuance of stock awards, we currently do not collect the applicable employee withholding taxes from employees. Instead, we automatically withhold, from the restricted stock units that vest and from the stock awards that are issued, the portion of those shares with a fair market value equal to the amount of the employee withholding taxes due, which is accounted for as a repurchase of common stock. We then pay the applicable withholding taxes in cash.
Common stock repurchases during the quarter ended December 31, 2009 were as follows (in thousands, except per share amounts):
Period
|
Total Number of Shares Purchased |
Average Price Paid per Share |
Total Number of Shares Purchased as Part of a Publicly Announced Program |
Maximum Approximate Dollar Value that May Yet be Purchased Under the Program |
|||||||||
|---|---|---|---|---|---|---|---|---|---|---|---|---|---|
November 2009 |
199 | $ | 8.15 | — | $ | 60,782 | |||||||
40
Performance Graph
This performance graph shall not be deemed "filed" for purposes of Section 18 of the Securities Exchange Act of 1934, as amended (the "Exchange Act"), or otherwise subject to the liabilities under that Section and shall not be deemed to be incorporated by reference into any filing of United Online, Inc. under the Securities Act of 1933, as amended, or the Exchange Act.
The following graph compares, for the five-year period ended December 31, 2009, the cumulative total stockholder return for the Company's common stock, The Nasdaq Global Select Market (U.S. companies) Index (the "Nasdaq Composite") and the Morgan Stanley Internet Index ("MS Internet Index"). Measurement points are the last trading day of each of the Company's fiscal years ended December 31, 2004, 2005, 2006, 2007, 2008, and 2009. The graph assumes that $100 was invested on December 31, 2004 in the common stock of the Company, the Nasdaq Composite and the MS Internet Index and assumes reinvestment of any dividends. The stock price performance on the following graph is not necessarily indicative of future stock price performance.
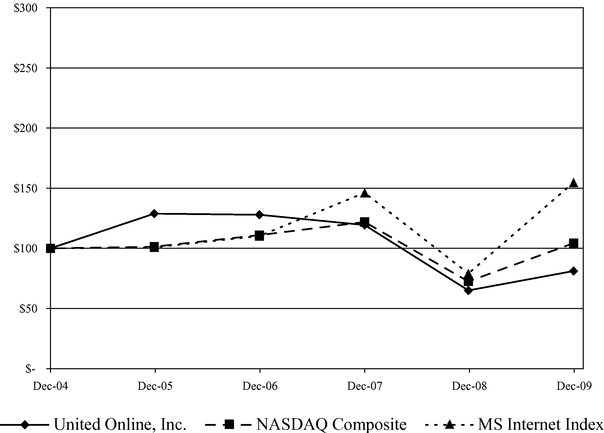
| |
Dec-04 | Dec-05 | Dec-06 | Dec-07 | Dec-08 | Dec-09 | |||||||||||||
|---|---|---|---|---|---|---|---|---|---|---|---|---|---|---|---|---|---|---|---|
United Online, Inc. |
$ | 100.00 | $ | 128.88 | $ | 127.94 | $ | 119.42 | $ | 65.04 | $ | 81.16 | |||||||
Nasdaq Composite |
$ | 100.00 | $ | 101.37 | $ | 111.03 | $ | 121.92 | $ | 72.49 | $ | 104.31 | |||||||
MS Internet Index |
$ | 100.00 | $ | 100.81 | $ | 110.31 | $ | 146.23 | $ | 79.11 | $ | 154.78 | |||||||
41
ITEM 6. SELECTED FINANCIAL DATA
The following selected consolidated financial data should be read in conjunction with our consolidated financial statements and related notes and Management's Discussion and Analysis of Financial Condition and Results of Operations included elsewhere in this Annual Report on Form 10-K.
The following table presents the consolidated statements of operations data for the years ended December 31, 2009, 2008 and 2007, and the consolidated balance sheet data at December 31, 2009 and 2008. Such financial data are derived from our audited consolidated financial statements included elsewhere in this Annual Report on Form 10-K. The table also presents the consolidated statements of operations data for the years ended December 31, 2006 and 2005 and the consolidated balance sheet data at December 31, 2007, 2006 and 2005 which are derived from our audited consolidated financial statements that are not included in this Annual Report on Form 10-K except for net income (loss) applicable to common stockholders and net income (loss) per common share information, which has been updated in connection with the adoption of Accounting Standards Codification ("ASC") 260-10-45, Earnings Per Share-Other Presentation Matters.
The following amounts are in thousands, except per share data:
| |
Year Ended December 31, | |||||||||||||||
|---|---|---|---|---|---|---|---|---|---|---|---|---|---|---|---|---|
| |
2009 | 2008(2) | 2007 | 2006(1) | 2005 | |||||||||||
Consolidated Statements of Operations Data: |
||||||||||||||||
Revenues |
$ | 990,132 | $ | 669,403 | $ | 513,503 | $ | 522,654 | $ | 525,061 | ||||||
Cost of revenues |
$ | 417,411 | $ | 214,885 | $ | 117,203 | $ | 119,990 | $ | 110,672 | ||||||
Operating income (loss) |
$ | 145,993 | $ | (62,679 | ) | $ | 92,301 | $ | 74,019 | $ | 86,560 | |||||
Net income (loss) |
$ | 70,085 | $ | (94,657 | ) | $ | 57,777 | $ | 42,272 | $ | 47,127 | |||||
Net income (loss) applicable to common stockholders |
$ | 65,438 | $ | (97,722 | ) | $ | 54,698 | $ | 40,110 | $ | 45,799 | |||||
Net income (loss) per common share—basic |
$ | 0.78 | $ | (1.33 | ) | $ | 0.82 | $ | 0.63 | $ | 0.75 | |||||
Net income (loss) per common share—diluted |
$ | 0.78 | $ | (1.33 | ) | $ | 0.81 | $ | 0.61 | $ | 0.72 | |||||
| |
December 31, | |||||||||||||||
|---|---|---|---|---|---|---|---|---|---|---|---|---|---|---|---|---|
| |
2009 | 2008 | 2007 | 2006 | 2005 | |||||||||||
Consolidated Balance Sheet Data: |
||||||||||||||||
Total assets |
$ | 1,049,934 | $ | 1,073,527 | $ | 552,393 | $ | 503,019 | $ | 521,188 | ||||||
Non-current liabilities |
$ | 375,844 | $ | 481,428 | $ | 20,486 | $ | 10,983 | $ | 45,863 | ||||||
Cash dividends declared and paid per common share |
$ | 0.40 | $ | 0.70 | $ | 0.80 | $ | 0.80 | $ | 0.60 | ||||||
- (1)
- In
April 2006, we acquired MyPoints. The results of MyPoints are included in our consolidated statements of operations from the date of acquisition.
Additionally, in the December 2006 quarter, we recorded a $13.3 million ($8.0 million, net of tax) impairment of goodwill, intangible assets and long-lived assets related to
our Communications segment.
- (2)
- In August 2008, we acquired FTD. The results of FTD are included in our consolidated statements of operations from the date of acquisition. For additional information regarding our acquisitions, see Note 13—"Acquisitions" of the Notes to the Consolidated Financial Statements, which appears in Part II, Item 8 of this Annual Report on Form 10-K. During the quarter ended December 31, 2008, we recorded an impairment of goodwill, intangible assets and long-lived assets of $176.2 million ($153.9 million, net of tax) primarily related to our FTD segment.
42
ITEM 7. MANAGEMENT'S DISCUSSION AND ANALYSIS OF FINANCIAL CONDITION AND RESULTS OF OPERATIONS
Forward-Looking Statements
This Annual Report on Form 10-K and the documents incorporated herein by reference contain forward-looking statements within the meaning of the "safe harbor" provisions of the Private Securities Litigation Reform Act of 1995, as amended, based on our current expectations, estimates and projections about our operations, industry, financial condition, performance, results of operations, and liquidity. Statements containing words such as "may," "believe," "anticipate," "expect," "intend," "plan," "project," "projections," "business outlook," "estimate," or similar expressions constitute forward-looking statements. These forward-looking statements include, but are not limited to, statements about future financial performance; advertising revenues; segment metrics; operating expenses; market trends, including those in the markets in which we compete; operating and marketing efficiencies; revenues; liquidity; cash flows and uses of cash; dividends; capital expenditures; depreciation and amortization; tax payments; foreign currency exchange rates; hedging arrangements; our ability to repay indebtedness, pay dividends and invest in initiatives; our products and services; pricing; competition; and strategies and initiatives. Potential factors that could affect the matters about which the forward-looking statements are made include, among others, the factors disclosed in the section entitled "Risk Factors" in this Annual Report on Form 10-K and additional factors that accompany the related forward-looking statements in this Annual Report on Form 10-K and our other filings with the Securities and Exchange Commission. Readers are cautioned not to place undue reliance on these forward-looking statements, which reflect management's analysis only as the date hereof. Any such forward-looking statements are not guarantees of future performance or results and involve risks and uncertainties that may cause actual performance and results to differ materially from those predicted. Reported results should not be considered an indication of future performance. Except as required by law, we undertake no obligation to publicly release the results of any revision to these forward-looking statements that may be made to reflect events or circumstances after the date hereof or to reflect the occurrence of unanticipated events.
Overview
We are a leading provider of consumer products and services over the Internet through a number of brands including FTD, Interflora, Classmates, NetZero, and MyPoints. Our FTD segment provides floral and related products and services to consumers and retail florists, as well as to other retail locations offering floral and related products and services. Our Classmates Media segment services are online social networking and online loyalty marketing. Our primary Communications segment services are Internet access and email. On a combined basis, our Web properties attract a significant number of Internet users, and we offer a broad range of Internet marketing services for advertisers.
Segment Definitions
We report our businesses in three reportable segments:
Segment
|
Products and Services | |
|---|---|---|
FTD |
Floral and related products and services for consumers, retail florists and other retail locations |
|
Classmates Media |
Online social networking and online loyalty marketing services |
|
Communications |
Internet access, email, Internet security, and Web hosting services |
43
Key Business Metrics
We review a number of key business metrics to help us monitor our performance and trends affecting our businesses, and to develop forecasts and budgets. These key measures are:
FTD Segment Metrics
Consumer Orders. We monitor the number of consumer orders for floral and gift products during a given period. Consumer orders are orders delivered during the period that originated in the U.S. and Canada, primarily from the www.ftd.com Web site and the 1-800-SEND-FTD telephone number, and in the U.K. and the Republic of Ireland, primarily from the www.interflora.co.uk and www.interflora.ie Web sites and a toll-free telephone number. Orders originating with a florist or other retail location for delivery to consumers are not included. The number of consumer orders received may fluctuate significantly from period to period due to seasonality resulting from the timing of key holidays; general economic conditions; fluctuations in marketing expenditures on initiatives designed to attract new and retain existing customers; changes in pricing for our floral, plant and specialty gift products or competitive offerings; and changing consumer preferences, among other factors.
Average Order Value. We monitor the average value for consumer orders delivered in a given period, which we refer to as the average order value. Average order value represents the average U.S. Dollar amount received for consumer orders delivered during a period. This average U.S. Dollar amount is determined after translating the British Pound amounts received for orders delivered in the U.K. and the Republic of Ireland into U.S. Dollars. Average order value includes merchandise revenue and shipping and service fees paid by the consumer, less certain discounts and certain refunds. Average order values may fluctuate from period to period based on the average foreign currency exchange rate between the U.S. Dollar and the British Pound; product mix; changes in merchandise pricing, shipping and service fees; levels of certain refunds issued; and discounts, among other factors.
Classmates Media and Communications Segment Metrics
Pay Accounts. We generate a significant portion of our revenues from our pay accounts and they represent one of the most important drivers of our business model. A pay account is defined as a member who has subscribed to, and paid for, our Classmates Media or Communications services, and whose subscription has not expired. A pay account does not equate to a unique subscriber since one subscriber could have several pay accounts. At any point in time, our pay account base includes a number of accounts receiving a free period of service as either a promotion or retention tool and a number of accounts that have notified us that they are terminating their service but whose service remains in effect. In general, the key metrics that affect our revenues from our pay accounts base include the number of pay accounts and the average monthly revenue per pay account ("ARPU"). A pay account generally becomes a free account following the expiration or termination of the related subscription.
ARPU. We monitor ARPU, which is calculated by dividing Classmates Media or Communications services revenues, as applicable, for a period (after translation into U.S. Dollars) by the average number of segment pay accounts for that period, divided by the number of months in that period. The average number of pay accounts is the simple average of the number of pay accounts at the beginning and end of a period. ARPU may fluctuate from period to period as a result of a variety of factors, including, but not limited to, changes in the mix of pay services and the related pricing plans; the use of promotional or retention pricing to attract new, or retain existing, paying subscribers; increases or decreases in the price of our services; the timing of pay accounts being added or removed during a period; and the average foreign currency exchange rate between the U.S. Dollar and the Euro.
44
Churn. To evaluate the retention characteristics of our membership base, we also monitor the percentage of pay accounts that terminate or expire, which we refer to as our average monthly churn rate. Our average monthly churn rate is calculated as the total number of pay accounts that terminated or expired in a period divided by the average number of pay accounts for the same period, divided by the number of months in that period. Our average monthly churn percentage may fluctuate from period to period due to our mix of subscription terms, which affects the timing of subscription expirations, and other factors. We make certain normalizing adjustments to the calculation of our churn percentage for periods in which we add a significant number of pay accounts due to acquisitions. For our Communications segment pay accounts, we do not include in our churn calculation those accounts canceled during the first 30 days of service unless the accounts have upgraded from free accounts, although a number of such accounts will be included in our account totals at any given measurement date. Subscribers who cancel one pay service but subscribe to another pay service are not necessarily considered to have canceled a pay account depending on the services and, as such, our segment churn rates are not necessarily indicative of the percentage of subscribers canceling any particular service.
Active Accounts. We monitor the number of active accounts among our membership base. Classmates Media segment active accounts are defined as the sum of all social networking pay accounts as of the date presented; the monthly average for the period of all free social networking accounts who have visited our domestic or international social networking Web sites (excluding The Names Database) at least once during the period; and the monthly average for the period of all online loyalty marketing members who have earned or redeemed points during such period. Communications segment active accounts include all Communications segment pay accounts as of the date presented combined with the number of free Internet access and email accounts that logged on to our services at least once during the preceding 31 days.
In general, we count and track pay accounts and free accounts by unique member identifiers. Users have the ability to register for separate services under separate brands and member identifiers independently. We do not track whether a pay account has purchased more than one of our services unless the account uses the same member identifier. As a result, total active accounts may not represent total unique users.
The table below sets forth, for the quarterly periods presented, as applicable, our consolidated revenues, pay accounts (at the end of the period), segment revenues, consumer orders, average order value, average currency exchange rate, churn (monthly average for the period), ARPU (monthly average for the period), and active accounts (monthly average for the period).
Revenues and operating results from our FTD segment are impacted by seasonal holiday timing variations and fluctuations in foreign currency exchange rates. As such, we believe that comparisons of our FTD segment's revenues and operating results for any period with those of the immediately preceding period or, in some instances, the same period of the preceding fiscal year, may be of limited relevance in evaluating its historical financial performance and predicting its future financial performance.
The pay accounts and ARPU metrics for our Classmates Media segment may fluctuate significantly from period to period due to various factors including, but not limited to, the extent to which discounted pricing is offered in prior and current periods, the percentage of pay accounts being
45
represented by international social networking pay accounts which, on average, have lower-priced subscription plans compared to U.S. social networking pay accounts, and the churn rate.
| |
Quarter Ended | ||||||||||||||||||
|---|---|---|---|---|---|---|---|---|---|---|---|---|---|---|---|---|---|---|---|
| |
December 31, 2009 |
September 30, 2009 |
June 30, 2009 |
March 31, 2009 |
December 31, 2008 |
||||||||||||||
Consolidated: |
|||||||||||||||||||
Revenues (in thousands) |
$ | 249,490 | $ | 216,206 | $ | 260,789 | $ | 263,647 | $ | 256,162 | |||||||||
FTD: |
|||||||||||||||||||
Segment revenues (in thousands) |
$ | 141,116 | $ | 107,526 | $ | 149,216 | $ | 147,987 | $ | 133,685 | |||||||||
% of consolidated revenues |
57 | % | 50 | % | 57 | % | 56 | % | 52 | % | |||||||||
Consumer orders (in thousands) |
1,594 | 1,075 | 1,711 | 1,691 | 1,467 | ||||||||||||||
Average order value |
$ | 60.14 | $ | 61.29 | $ | 59.78 | $ | 57.70 | $ | 58.80 | |||||||||
Average currency exchange rate: GBP to USD |
1.63 | 1.64 | 1.55 | 1.43 | 1.56 | ||||||||||||||
Classmates Media: |
|||||||||||||||||||
Segment revenues (in thousands) |
$ | 60,712 | $ | 58,682 | $ | 58,155 | $ | 58,473 | $ | 62,592 | |||||||||
% of consolidated revenues |
24 | % | 27 | % | 22 | % | 22 | % | 24 | % | |||||||||
Pay accounts (in thousands) |
4,886 | 4,785 | 4,621 | 4,563 | 4,319 | ||||||||||||||
Segment churn |
3.8 | % | 3.8 | % | 4.3 | % | 4.1 | % | 4.4 | % | |||||||||
ARPU |
$ | 2.53 | $ | 2.71 | $ | 2.81 | $ | 2.87 | $ | 2.98 | |||||||||
Segment active accounts (in millions) |
19.4 | 16.9 | 16.4 | 16.8 | 16.0 | ||||||||||||||
Communications: |
|||||||||||||||||||
Segment revenues (in thousands) |
$ | 48,429 | $ | 50,679 | $ | 54,147 | $ | 57,978 | $ | 60,120 | |||||||||
% of consolidated revenues |
19 | % | 23 | % | 21 | % | 22 | % | 23 | % | |||||||||
Pay accounts (in thousands): |
|||||||||||||||||||
Access |
1,036 | 1,118 | 1,203 | 1,316 | 1,388 | ||||||||||||||
Other |
314 | 322 | 329 | 337 | 347 | ||||||||||||||
Total pay accounts |
1,350 | 1,440 | 1,532 | 1,653 | 1,735 | ||||||||||||||
Segment churn |
4.4 | % | 4.6 | % | 4.9 | % | 4.8 | % | 4.3 | % | |||||||||
ARPU |
$ | 9.43 | $ | 9.43 | $ | 9.55 | $ | 9.45 | $ | 9.31 | |||||||||
Segment active accounts (in millions) |
2.2 | 2.3 | 2.4 | 2.6 | 2.7 | ||||||||||||||
Critical Accounting Policies, Estimates and Assumptions
General
Our discussion and analysis of our financial condition and results of operations is based upon our audited consolidated financial statements, which have been prepared in accordance with accounting principles generally accepted in the United States of America ("GAAP") and with the instructions for Form 10-K and Article 10 of Regulation S-X issued by the SEC. The preparation of financial statements in accordance with GAAP requires management to make estimates and assumptions that affect the reported amounts of assets and liabilities, disclosure of contingent liabilities and the reported amounts of revenues and expenses. Actual results could differ from those estimates and assumptions. The results of operations for interim or transition periods are not necessarily indicative of the operating results for a full year. We apply the following critical accounting policies in the preparation of our consolidated financial statements:
Revenue Recognition
FTD Segment Revenue Recognition—Products revenues and related cost of revenues are generally recognized when products are delivered to the customers. Shipping and service fees charged to
46
customers are recognized at the time the products revenue is recognized and are included in products revenue. Shipping and delivery costs are included in cost of revenues. FTD's consumer businesses generally recognize revenue on a gross basis as FTD bears the risks and rewards associated with the revenue generating activities by: (1) acting as a principal in the transaction; (2) establishing prices; (3) being responsible for fulfillment of the order by our floral network members and third-party suppliers; (4) taking the risk of loss for collection, delivery and returns; and (5) marketing the products and services.
FTD also sells computer systems to its floral network members and recognizes revenue in accordance with ASC 985, Software. FTD recognizes revenue on hardware which is sold without software at the time of delivery. For hardware sales that include software, revenue is recognized when delivery, installation and customer acceptance have all occurred.
Services revenues based on enabling the delivery of orders by floral network members are generally recognized in the period in which the orders are delivered. Monthly, recurring fees and other floral network service-based fees are recognized in the period in which the service has been provided.
Classmates Media Segment and Communications Segment Revenue Recognition—Revenues are comprised of services revenues, which are derived primarily from fees charged to pay accounts, and advertising revenues. We apply the provisions of ASC 605, Revenue Recognition, which provides guidance on the recognition, presentation and disclosure of revenue in financial statements filed with the SEC. ASC 605 outlines the basic criteria that must be met to recognize revenue and provides guidance for disclosure related to revenue recognition policies. We recognize revenue when persuasive evidence of an arrangement exists, delivery has occurred or services have been rendered, the fee is fixed or determinable, no significant Company obligations remain, and collectibility is reasonably assured.
Services revenues for our online social networking services and Communications services are recognized in the period in which fees are fixed or determinable and the related services are provided to the customer. Our pay accounts generally pay in advance for their service by credit card, and revenue is then recognized ratably over the service period. Advance payments from pay accounts are recorded on the consolidated balance sheets as deferred revenue. We offer alternative payment methods to credit cards for certain pay service plans. These alternative payment methods currently include use of ACH, payment by personal check or money order, or payment through a local telephone company. In circumstances where payment is not received in advance, revenue is only recognized if collectibility is reasonably assured.
Advertising revenues from our online social networking services and Communications services consist primarily of amounts from Internet search partners that are generated as a result of users utilizing partner Internet search services, amounts generated from the display of third-party offers at the end of Classmates' pay account registration process, amounts generated from other display advertisements, and amounts generated from referring members to third-party Web sites or services. We recognize such advertising revenues in the period in which the advertisement is displayed or, for performance-based arrangements, when the related performance criteria are met. In determining whether an arrangement exists, we ensure that a written contract is in place, such as a standard insertion order or a customer-specific agreement. We assess whether performance criteria have been met and whether the fees are fixed or determinable based on a reconciliation of the performance criteria and the payment terms associated with the transaction. The reconciliation of the performance criteria generally includes a comparison of internally-tracked performance data to the contractual performance obligation and, when available, to third-party or customer-provided performance data.
Advertising revenues for our online loyalty marketing service consist primarily of fees generated when emails are transmitted to members, when members respond to emails and when members complete online transactions. Each of these activities is a discrete, independent activity, which generally
47
is specified in the sales agreement for each advertising customer. As the earning activities take place, activity measurement data (examples include the number of emails delivered and the number of responses received) is accumulated and the related revenue is recorded.
Probability of collection is assessed based on a number of factors, including past transaction history with the customer and the creditworthiness of the customer. If it is determined that collection is not reasonably assured, revenue is not recognized until collection becomes reasonably assured, which is generally upon receipt of cash. Deferred revenue also represents invoiced services that have not yet been performed.
Business Combinations
All of our acquisitions occurred prior to the effective date of ASC 805, Business Combinations, and accordingly, have been accounted for as purchase business combinations in accordance with the provisions of Statement of Financial Accounting Standards ("SFAS") No. 141, Business Combinations. Under the purchase method of accounting, the costs, including transaction costs, are allocated to the underlying net assets acquired, based on their respective estimated fair values. The excess of the purchase price over the estimated fair values of the net assets acquired is recorded as goodwill.
The judgments made in determining the estimated fair value and expected useful lives assigned to each class of assets and liabilities acquired can significantly impact net income. Consequently, to the extent an indefinite-lived, definite-lived or a longer-lived asset is ascribed greater value under the purchase method than a shorter-lived asset, there may be less amortization recorded in a given period. Definite-lived identifiable intangible assets are amortized on either a straight-line basis or an accelerated basis. We determine the appropriate amortization method by performing an analysis of expected cash flows over the estimated useful lives of the assets and match the amortization expense to the expected cash flows from those assets.
Determining the fair value of certain assets and liabilities acquired is subjective in nature and often involves the use of significant estimates and assumptions. Two areas, in particular, that require significant judgment are estimating the fair value and related useful lives of identifiable intangible assets. To assist in this process, we may obtain appraisals from valuation specialists for certain intangible assets. While there are a number of different methods used in estimating the fair value of acquired intangible assets, there are two approaches primarily used: the discounted cash flow and market comparison approaches. Some of the more significant estimates and assumptions inherent in the two approaches include: projected future cash flows (including timing); discount rate reflecting the risk inherent in the future cash flows; terminal growth rate; subscriber churn; terminal value; determination of appropriate market comparables; and the determination of whether a premium or a discount should be applied to market comparables. Most of the above assumptions are made based on available historical and market information.
Goodwill and Indefinite-Lived Intangible Assets
Goodwill represents the excess of the purchase price of an acquired entity over the fair value of the net tangible and intangible assets acquired. Indefinite-lived intangible assets acquired in a business combination are initially recorded at management's estimate of their fair values. We account for goodwill and indefinite-lived intangible assets in accordance with ASC 350, Intangibles-Goodwill and Other, which among other things, addresses financial accounting and reporting requirements for acquired goodwill and indefinite-lived intangible assets. ASC 350 prohibits the amortization of goodwill and indefinite-lived intangible assets and requires us to test goodwill and indefinite-lived intangible assets for impairment at least annually at the reporting unit level.
We test the goodwill of our reporting units and indefinite-lived intangible assets for impairment annually during the fourth quarter of our fiscal year and whenever events occur or circumstances
48
change that would more likely than not indicate that the goodwill and/or indefinite-lived intangible assets might be permanently impaired. Events or circumstances which could trigger an impairment review include, but are not limited to, a significant adverse change in legal factors or in the business climate, an adverse action or assessment by a regulator, unanticipated competition, a loss of key management or other personnel, significant changes in the manner of our use of the acquired assets or the strategy for the acquired business or our overall business, significant negative industry or economic trends, or significant underperformance relative to expected historical or projected future results of operations.
The determination of whether or not goodwill is impaired involves a significant level of judgment in the assumptions underlying the approaches used to determine the estimated fair values of our reporting units. The determination of the fair values of our reporting units generally includes a study of market comparables, including the selection of appropriate valuation multiples and discounted cash flow models based on our internal forecasts and projections. The estimated fair value of each of our reporting units is determined using a combination of the income approach and the market approach.
Indefinite-Lived Intangible Assets
Testing indefinite-lived intangible assets, other than goodwill, for impairment requires a one-step approach under ASC 350. We test indefinite-lived intangible assets for impairment on an annual basis, or more frequently, if events occur or circumstances change that indicate they may be impaired. The fair values of indefinite-lived intangible assets are compared to their carrying values and if the carrying amount of indefinite-lived intangible assets exceeds the fair value, an impairment loss is recognized equal to the excess.
The process of estimating the fair value of indefinite-lived intangible assets is subjective and requires us to make estimates that may significantly impact the outcome of the analyses. Such estimates include, but are not limited to, future operating performance and cash flows, cost of capital, terminal values, and remaining economic lives of assets.
Goodwill
We operate in three reportable segments, in accordance with ASC 280, Segment Reporting, and we have identified five reporting units—FTD, Interflora, Classmates Online, MyPoints, and Communications—for purposes of evaluating goodwill. These reporting units each constitute a business or group of businesses for which discrete financial information is available and is regularly reviewed by segment management. The goodwill related to our acquired businesses is specific to each reporting unit and the goodwill amounts are assigned as such.
Testing goodwill for impairment involves a two-step process. The first step of the impairment test involves comparing the estimated fair values of each of our reporting units with their respective net book values, including goodwill. If the estimated fair value of a reporting unit exceeds its net book value, including goodwill, goodwill is considered not to be impaired and no additional steps are necessary. If, however, the estimated fair value of the reporting unit is less than its net book value, including goodwill, then the carrying amount of the goodwill is compared with its implied fair value. If the carrying amount of goodwill exceeds the implied fair value of that goodwill, an impairment loss is recognized in an amount equal to the excess.
We performed step one of our annual goodwill impairment test in the fourth quarter of 2009 and determined that the fair value of our FTD, Interflora, Classmates Online, MyPoints, and Communications reporting units exceeded their net book values, including goodwill. Accordingly, step two was not required.
49
The determination of whether or not goodwill is impaired involves a significant level of judgment in the assumptions underlying the approaches used to determine the estimated fair value of our reporting units. Our analysis included sufficient tolerance for sensitivity in key assumptions. The determination of the fair value of our reporting units included a study of market comparables, including the selection of appropriate valuation multiples and discounted cash flow models based on our internal forecasts and projections.
The estimated fair values for all of our reporting units were determined using a combination of the income approach and the market approach. Under the income approach, a reporting unit's fair value is estimated based on the discounted cash flow method. The discounted cash flow method is dependent upon a number of factors, including projections of the amounts and timing of future revenues and cash flows, assumed discount rates and other assumptions. Under the market approach, using the guideline company method, a reporting unit's fair value is estimated based on multiples of the cash-free market value of invested capital to revenue and adjusted EBITDA of the guideline companies. Adjusted EBITDA amounts excluded stock-based compensation expense for the reporting units and guideline companies. The revenue and adjusted EBITDA multiples of our reporting units were selected based on a comparison of each reporting unit's operating performance and margins, among other factors, to those of the guideline companies.
Based on our impairment testing in the fourth quarter of 2009, an increase or decrease of 100 basis points in the discount rate or the terminal growth rate for each of our reporting units would not have resulted in any goodwill impairment. A 100 basis point decrease in the terminal growth rate for FTD would result in an indicated fair value that was higher than the carrying value of equity by $12.6 million. We believe the assumptions and rates used in our impairment assessment are reasonable, but they are judgmental, and variations in any assumptions could result in a materially different calculation of the impairment amount, if any.
Intangible Assets and Other Long-Lived Assets
We account for identifiable intangible assets and other long-lived assets in accordance with ASC 360, Property, Plant and Equipment, which addresses financial accounting and reporting for the impairment and disposition of identifiable intangible assets and other long-lived assets. Intangible assets acquired in a business combination are initially recorded at management's estimate of their fair values. We evaluate the recoverability of identifiable intangible assets and other long-lived assets for impairment when events occur or circumstances change that would indicate that the carrying amount of an asset may not be recoverable. Events or circumstances that may indicate that an asset is impaired include, but are not limited to, significant decreases in the market value of an asset, significant underperformance relative to expected historical or projected future operating results, a change in the extent or manner in which an asset is used, shifts in technology, loss of key management or other personnel, significant negative industry or economic trends, changes in our operating model or strategy, and competitive forces. In determining if an impairment exists, we estimate the undiscounted cash flows to be generated from the use and ultimate disposition of these assets. If an impairment is indicated based on a comparison of the assets' carrying values and the undiscounted cash flows, the impairment loss is measured as the amount by which the carrying amount of the assets exceeds the fair market value of the assets. Definite-lived intangible assets are amortized on either a straight-line basis or an accelerated basis over their estimated useful lives, ranging from two to ten years. Our identifiable intangible assets were acquired primarily in connection with business combinations. We did not record any impairment charges related to our intangible assets in the year ended December 31, 2009.
The process of evaluating the potential impairment of long-lived intangible assets is subjective and requires significant judgment on matters such as, but not limited to, the asset group to be tested for recoverability. We are also required to make estimates that may significantly impact the outcome of the
50
analyses. Such estimates include, but are not limited to, future operating performance and cash flows, cost of capital, terminal values, and remaining economic lives of assets.
Member Redemption Liability
Member redemption liability for online loyalty marketing points represents the estimated costs associated with the obligation of MyPoints to redeem outstanding points accumulated by its online loyalty marketing members as well as those points purchased by its advertisers for use in such advertisers' promotion campaigns as they have been earned by MyPoints' members, less an allowance for points expected to expire prior to redemption. The estimated cost of points is primarily presented in cost of revenues, except for the portion related to member acquisition activities, internal marketing surveys and other non-revenue generating activities, which are presented in sales and marketing expenses. The member redemption liability is recognized when members earn points, less an allowance for points expected to expire, and is reduced when members redeem accumulated points upon reaching required redemption thresholds or when points expire prior to redemption.
MyPoints members may redeem points for third-party gift cards and other rewards. Members earn points when they respond to direct marketing offers delivered by MyPoints, purchase goods or services from advertisers, engage in certain promotional campaigns of advertisers, or engage in other specified activities.
The member redemption liability is estimated based upon the weighted-average cost and number of points that may be redeemed in the future. On a monthly basis, the weighted-average cost of points is calculated by taking the total cost of items fulfilled divided by total points redeemed. MyPoints purchases gift cards and other awards from merchants at a discount and sets redemption levels for its members. The discounts and points needed to redeem awards vary by merchant and award denomination. MyPoints has the ability to adjust the number of points required to redeem awards to reflect changes in the cost of awards.
On a monthly basis, MyPoints accounts for and reduces the gross points issued by an estimate of points that will never be redeemed by its members. This reduction is calculated based on an analysis of historical point-earning trends, redemption activities and individual member account activity. MyPoints' historical analysis takes into consideration the total points in members' accounts that have been inactive for six months or longer, less an estimated reactivation rate, plus an estimate of future inactive points. Changes in, among other factors, the net number of points issued, redemption activities and members' activity levels could materially impact the member redemption liability. A 100 basis point increase or decrease in the estimate of points that will never be redeemed would increase or decrease our member redemption liability at December 31, 2009 by approximately $55,000.
Points in active accounts do not expire; however, unredeemed points expire after twelve consecutive months of inactivity. For purposes of the member redemption liability, "inactive" means a lack of all of the following: Web site visit; email response; survey completion; profile update; or any point-earning or point-redeeming transaction. The canceling or disabling of inactive accounts would have no impact on our consolidated financial statements, as we fully consider inactive accounts when establishing the member redemption liability, as discussed above.
51
The following table sets forth, for the periods presented, a reconciliation of the changes in the member redemption liability (in thousands):
| |
Year Ended December 31, |
|||||||
|---|---|---|---|---|---|---|---|---|
| |
2009 | 2008 | ||||||
Beginning balance |
$ | 25,976 | $ | 24,560 | ||||
Accruals for points earned |
18,684 | 23,356 | ||||||
Reduction for redeemed points |
(17,465 | ) | (22,604 | ) | ||||
Converted points |
— | 1,846 | ||||||
Changes in allowance for points expected to expire and weighted-average cost of points |
(1,440 | ) | (1,182 | ) | ||||
Ending balance |
$ | 25,755 | $ | 25,976 | ||||
Income Taxes
We account for income taxes under ASC 740, Income Taxes. Under ASC 740, deferred income tax assets and liabilities are determined based on differences between the financial reporting and tax basis of assets and liabilities and are measured using the enacted tax rates and laws that will be in effect when the differences are expected to reverse. We record a valuation allowance to reduce our deferred tax assets to the amount that is more likely than not to be realized. In evaluating our ability to recover our deferred tax assets, we consider all available positive and negative evidence, including our operating results, ongoing tax planning and forecasts of future taxable income on a jurisdiction-by-jurisdiction basis. Under ASC 740, we recognize, in our consolidated financial statements, the impact of tax positions that are more likely than not to be sustained upon examination based on the technical merits of the positions.
Legal Contingencies
We are currently involved in certain legal proceedings and investigations. We record liabilities related to pending litigation when an unfavorable outcome is deemed probable and management can reasonably estimate the amount of loss. We do not record liabilities for pending litigation when there are uncertainties related to assessing either the amount or the probable outcome of the claims asserted in the litigation. As additional information becomes available, we continually assess the potential liability related to such pending litigation.
Financial Statement Presentation
Revenues
Services Revenues
FTD
FTD services revenues consist of fees charged to its floral network members for access to the FTD and Interflora brands and the Mercury Man logo, access to the floral networks, credit card processing services, e-commerce Web sites services, online advertising tools, and telephone answering, order-taking, transmission, and clearing-house services.
Classmates Media and Communications
Classmates Media services revenues consist of amounts charged to pay accounts for social networking services. Communications services revenues consist of amounts charged to pay accounts for Internet access, email, Web hosting, Internet security, and other services, with substantially all of such
52
revenues associated with Internet access. Our Classmates Media and Communications services revenues are primarily dependent on two factors: the average number of pay accounts for a period and the ARPU. The average number of pay accounts is a simple average calculated based on the number of pay accounts at the beginning and end of a period. In general, we charge our pay accounts in advance of providing a service, which results in the deferral of services revenue to the period in which the services are provided.
Products Revenues
Products revenues consist of merchandise revenue and related shipping and service fees, less discounts and refunds, for FTD consumer orders as well as revenues generated from sales of containers, software and hardware systems, cut flowers, packaging and promotional products, and a wide variety of other floral-related supplies to floral network members. We do not generate products revenues from our Classmates Media segment or our Communications segment.
Advertising Revenues
We provide advertising solutions to marketers with both brand and direct response objectives through a full suite of display, search, email, and text-link opportunities across our various properties. We also use targeting technologies, Web site sponsorships and Web site integrations in order to provide effective solutions.
FTD
FTD advertising revenues consist primarily of post-transaction sales that are generated when FTD and Interflora consumers are provided third-party offers after completing a purchase on the www.ftd.com, www.interflora.co.uk and www.interflora.ie Web sites.
Classmates Media
Our online social networking services have historically generated advertising revenues primarily from providing third-party offers to Classmates members after they have completed the pay account registration process and, to a lesser extent, from display advertisements. Advertising inventory on our social networking Web sites includes text and graphic placements on the user home page, profile page, class list page, and most other pages on our Web sites. We also sell a portion of our advertising inventory through third-party advertising resellers.
Our online loyalty marketing service revenues are derived from advertising fees, consisting primarily of fees based on performance measures, that are generated when emails are transmitted to members, when members respond to emails, when members complete online transactions, and when members engage in a variety of other activities including, but not limited to, games, Internet searches and market research surveys.
Communications
Our Communications services generate advertising revenues from search placements, display advertisements and online market research. Substantially all of our Communications advertising revenues are generated from our Internet access services.
Cost of Revenues
FTD
FTD cost of revenues includes product costs; shipping and delivery costs; costs associated with taking orders; printing and postage costs; costs related to FTD's product quality guarantee; systems
53
installation, training and support costs; data center costs; personnel- and overhead-related costs associated with operating our networks and data centers; depreciation of network computers and equipment; license fees; costs related to providing customer support; costs related to customer billing for floral network members; fees associated with the storage and processing of customer credit cards and associated bank fees; and domain name registration fees.
Classmates Media
Classmates Media cost of revenues includes costs of points earned by members of our online loyalty marketing service; data center costs; personnel- and overhead-related costs associated with operating our networks and data centers; depreciation of network computers and equipment; license fees; costs related to providing customer support; costs related to customer billing and billing support for our pay accounts; fees associated with the storage and processing of customer credit cards and associated bank fees; and domain name registration fees.
Communications
Communications cost of revenues includes telecommunications and data center costs; personnel- and overhead-related costs associated with operating our networks and data centers; depreciation of network computers and equipment; license fees; costs related to providing customer support; costs related to customer billing and billing support for our pay accounts; fees associated with the storage and processing of customer credit cards and associated bank fees; and domain name registration fees.
Sales and Marketing
Sales and marketing expenses include expenses associated with promoting our brands, products and services and with generating advertising revenues. Expenses associated with promoting our brands, products and services include advertising and promotion expenses; fees paid to distribution partners, third-party advertising networks and co-registration partners to acquire new pay and free accounts; personnel and overhead-related expenses for marketing, merchandising, customer service, and sales personnel; and telemarketing costs incurred to acquire and retain pay accounts and up-sell pay accounts to additional services. Expenses associated with generating advertising revenues include sales commissions and personnel-related expenses. We have expended significant amounts on sales and marketing, including branding and customer acquisition campaigns consisting of television, Internet, sponsorships, radio, print, and outdoor advertising, and on retail and other performance-based distribution relationships. Marketing and advertising costs to promote our products and services are expensed in the period incurred. Advertising and promotion expenses include media, agency and promotion expenses. Media production costs are expensed the first time the advertisement is run. Media and agency costs are expensed over the period the advertising runs.
Technology and Development
Technology and development expenses include expenses for product development, maintenance of existing software and technology and development of new or improved software and technology, including personnel-related expenses for our technology group in various office locations, and the costs associated with operating our facility in India. Costs incurred by us to manage and monitor our technology and development activities are expensed as incurred. Costs relating to the acquisition and development of internal-use software are capitalized when appropriate and depreciated over their estimated useful lives, generally three years.
54
General and Administrative
General and administrative expenses include personnel-related expenses for executive, finance, legal, human resources, facilities, and internal customer support personnel. In addition, general and administrative expenses include, among other costs, professional fees for legal, accounting and financial services; insurance; occupancy and other overhead-related costs; office relocation costs; non-income taxes; and expenses incurred and credits received as a result of certain legal settlements or reserves.
Amortization of Intangible Assets
Amortization of intangible assets principally includes amortization of: acquired pay accounts and free accounts; certain acquired trademarks and trade names; purchased software and technology; acquired customer and advertising contracts and related relationships; acquired patents and domain names; and other acquired identifiable intangible assets. In accordance with the provisions set forth in ASC 350, goodwill and indefinite-lived intangible assets are not being amortized but are tested for impairment at a reporting unit level on an annual basis and between annual tests if an event occurs or circumstances change that would indicate the fair value of a reporting unit is below its carrying value.
Restructuring Charges
Restructuring charges consist of costs associated with the realignment and reorganization of our operations and generally include reductions in force and closures of facilities.
Interest Income
Interest income consists of earnings on our cash, cash equivalents and short-term investments held from time to time, and interest on long-term receivables from FTD's technology system sales.
Interest Expense
Interest expense consists of interest expense on our credit facilities, including accretion of discounts and amortization of debt issue costs, and interest expense relating to capital leases and our interest rate cap.
Other Income (Expense), Net
Other income (expense), net, generally consists of realized gains and losses recognized in connection with the sale of short-term investments, gains and losses on the sale of assets, equity earnings on investments in subsidiaries, and gains and losses on foreign currency exchange rate transactions. Additionally, other income (expense), net, consists of realized and unrealized gains and losses on foreign currency forward contracts and one-time, non-operating income and expenses.
Results of Operations
The following tables set forth for the periods presented selected historical statements of operations data. The information contained in the tables below should be read in conjunction with Liquidity and Capital Resources, Contractual Obligations, and Critical Accounting Policies, Estimates and Assumptions included in this Item 7 as well as the consolidated financial statements and notes thereto included elsewhere in this Annual Report on Form 10-K. As a result of the FTD acquisition, the results of operations of FTD have been included in the consolidated statements of operations and cash flows from August 26, 2008, the date of acquisition. Combined information for FTD for the full-year ended December 31, 2008 is set forth below under "FTD Segment Results (Actual Results vs. Combined Results Discussion)".
55
Consolidated information was as follows (in thousands):
| |
Year Ended December 31, | |||||||||||
|---|---|---|---|---|---|---|---|---|---|---|---|---|
| |
2009 | 2008 | 2007 | |||||||||
Revenues |
$ | 990,132 | $ | 669,403 | $ | 513,503 | ||||||
Operating expenses: |
||||||||||||
Cost of revenues |
417,411 | 214,885 | 117,203 | |||||||||
Sales and marketing |
202,871 | 173,042 | 163,424 | |||||||||
Technology and development |
65,215 | 56,715 | 51,044 | |||||||||
General and administrative |
121,677 | 92,219 | 73,312 | |||||||||
Amortization of intangible assets |
34,844 | 18,415 | 12,800 | |||||||||
Restructuring charges |
2,121 | 656 | 3,419 | |||||||||
Impairment of goodwill, intangible assets and long-lived assets |
— | 176,150 | — | |||||||||
Total operating expenses |
844,139 | 732,082 | 421,202 | |||||||||
Operating income (loss) |
145,993 | (62,679 | ) | 92,301 | ||||||||
Interest income |
1,545 | 4,527 | 7,141 | |||||||||
Interest expense |
(33,524 | ) | (13,170 | ) | (3 | ) | ||||||
Other income (expense), net |
4,215 | (48 | ) | (747 | ) | |||||||
Income (loss) before income taxes |
118,229 | (71,370 | ) | 98,692 | ||||||||
Provision for income taxes |
48,144 | 23,287 | 40,915 | |||||||||
Net income (loss) |
$ | 70,085 | $ | (94,657 | ) | $ | 57,777 | |||||
Information for our three reportable segments was as follows (in thousands):
| |
FTD | Classmates Media | Communications | ||||||||||||||||||||||||
|---|---|---|---|---|---|---|---|---|---|---|---|---|---|---|---|---|---|---|---|---|---|---|---|---|---|---|---|
| |
|
Period from August 26, 2008 (date of acquisition) to December 31, 2008 |
Year Ended December 31, | Year Ended December 31, | |||||||||||||||||||||||
| |
Year Ended December 31, 2009 |
||||||||||||||||||||||||||
| |
2009 | 2008 | 2007 | 2009 | 2008 | 2007 | |||||||||||||||||||||
Revenues: |
|||||||||||||||||||||||||||
Services |
$ | 125,430 | $ | 47,277 | $ | 151,902 | $ | 139,386 | $ | 106,514 | $ | 175,207 | $ | 218,414 | $ | 273,012 | |||||||||||
Products |
414,127 | 132,983 | — | — | — | — | — | — | |||||||||||||||||||
Advertising |
6,288 | 1,705 | 84,120 | 90,849 | 86,905 | 36,026 | 39,024 | 47,072 | |||||||||||||||||||
Total revenues |
545,845 | 181,965 | 236,022 | 230,235 | 193,419 | 211,233 | 257,438 | 320,084 | |||||||||||||||||||
Operating expenses: |
|||||||||||||||||||||||||||
Cost of revenues |
323,581 | 107,131 | 35,014 | 41,113 | 39,497 | 48,723 | 57,903 | 69,254 | |||||||||||||||||||
Sales and marketing |
89,720 | 30,640 | 74,819 | 81,858 | 78,918 | 39,863 | 60,240 | 84,094 | |||||||||||||||||||
Technology and development |
11,868 | 3,677 | 25,535 | 21,969 | 16,016 | 19,525 | 24,239 | 29,613 | |||||||||||||||||||
General and administrative |
43,748 | 14,055 | 39,740 | 37,986 | 30,769 | 33,177 | 34,927 | 36,672 | |||||||||||||||||||
Restructuring charges |
— | — | 2,121 | — | 42 | — | 656 | 3,377 | |||||||||||||||||||
Impairment of goodwill, intangible assets and long-lived assets |
— | 175,867 | — | — | — | — | 283 | — | |||||||||||||||||||
Total operating expenses |
468,917 | 331,370 | 177,229 | 182,926 | 165,242 | 141,288 | 178,248 | 223,010 | |||||||||||||||||||
Segment income (loss) from operations |
$ | 76,928 | $ | (149,405 | ) | $ | 58,793 | $ | 47,309 | $ | 28,177 | 69,945 | $ | 79,190 | $ | 97,074 | |||||||||||
56
A reconciliation of segment revenues to consolidated revenues was as follows for each period presented (in thousands):
| |
Year Ended December 31, | ||||||||||
|---|---|---|---|---|---|---|---|---|---|---|---|
| |
2009 | 2008 | 2007 | ||||||||
Segment revenues: |
|||||||||||
FTD |
$ | 545,845 | $ | 181,965 | $ | — | |||||
Classmates Media |
236,022 | 230,235 | 193,419 | ||||||||
Communications |
211,233 | 257,438 | 320,084 | ||||||||
Intersegment eliminations |
(2,968 | ) | (235 | ) | — | ||||||
Consolidated revenues |
$ | 990,132 | $ | 669,403 | $ | 513,503 | |||||
A reconciliation of segment operating expenses (which excludes depreciation and amortization of intangible assets) to consolidated operating expenses was as follows for each period presented (in thousands):
| |
Year Ended December 31, | ||||||||||
|---|---|---|---|---|---|---|---|---|---|---|---|
| |
2009 | 2008 | 2007 | ||||||||
Segment operating expenses: |
|||||||||||
FTD |
$ | 468,917 | $ | 331,370 | $ | — | |||||
Classmates Media |
177,229 | 182,926 | 165,242 | ||||||||
Communications |
141,288 | 178,248 | 223,010 | ||||||||
Total segment operating expenses |
787,434 | 692,544 | 388,252 | ||||||||
Depreciation |
24,829 | 21,358 | 20,150 | ||||||||
Amortization of intangible assets |
34,844 | 18,415 | 12,800 | ||||||||
Intersegment eliminations |
(2,968 | ) | (235 | ) | — | ||||||
Consolidated operating expenses |
$ | 844,139 | $ | 732,082 | $ | 421,202 | |||||
A reconciliation of segment income (loss) from operations (which excludes depreciation and amortization of intangible assets) to consolidated operating income (loss) was as follows for each period presented (in thousands):
| |
Year Ended December 31, | ||||||||||
|---|---|---|---|---|---|---|---|---|---|---|---|
| |
2009 | 2008 | 2007 | ||||||||
Segment income (loss) from operations: |
|||||||||||
FTD |
$ | 76,928 | $ | (149,405 | ) | $ | — | ||||
Classmates Media |
58,793 | 47,309 | 28,177 | ||||||||
Communications |
69,945 | 79,190 | 97,074 | ||||||||
Total segment income (loss) from operations |
205,666 | (22,906 | ) | 125,251 | |||||||
Depreciation |
(24,829 | ) | (21,358 | ) | (20,150 | ) | |||||
Amortization of intangible assets |
(34,844 | ) | (18,415 | ) | (12,800 | ) | |||||
Consolidated operating income (loss) |
$ | 145,993 | $ | (62,679 | ) | $ | 92,301 | ||||
57
Year Ended December 31, 2009 compared to Year Ended December 31, 2008
The following table presents our consolidated results of operations as a percentage of consolidated revenues for the years ended December 31, 2009 and 2008.
| |
Year Ended December 31, |
||||||||
|---|---|---|---|---|---|---|---|---|---|
| |
2009 | 2008 | |||||||
Revenues |
100.0 | % | 100.0 | % | |||||
Operating expenses: |
|||||||||
Cost of revenues |
42.2 | 32.1 | |||||||
Sales and marketing |
20.5 | 25.9 | |||||||
Technology and development |
6.6 | 8.5 | |||||||
General and administrative |
12.3 | 13.8 | |||||||
Amortization of intangible assets |
3.5 | 2.8 | |||||||
Restructuring charges |
0.2 | 0.1 | |||||||
Impairment of goodwill, intangible assets and long-lived assets |
— | 26.3 | |||||||
Total operating expenses |
85.3 | 109.4 | |||||||
Operating income |
14.7 | (9.4 | ) | ||||||
Interest income |
0.2 | 0.7 | |||||||
Interest expense |
(3.4 | ) | (2.0 | ) | |||||
Other income, net |
0.4 | — | |||||||
Income before income taxes |
11.9 | (10.7 | ) | ||||||
Provision for income taxes |
4.9 | 3.5 | |||||||
Net income (loss) |
7.1 | % | (14.1 | )% | |||||
Consolidated Results
Revenues. Consolidated revenues increased by $320.7 million, or 48%, to $990.1 million for the year ended December 31, 2009, compared to $669.4 million for the year ended December 31, 2008. The increase of $320.7 million was primarily due to a $363.9 million increase in revenues associated with our FTD segment as a result of including FTD revenues for the entire period for the year ended December 31, 2009 whereas such revenues were included only from August 26, 2008 (date of acquisition) in the prior-year period. The increase was also due to an increase in revenues from our Classmates Media segment, partially offset by a decrease in revenues from our Communications segment. Revenues related to our FTD, Classmates Media and Communications segments constituted 55.0%, 23.8% and 21.3%, respectively, of our consolidated revenues for the year ended December 31, 2009, compared to 27.2%, 34.4% and 38.4%, respectively, for the year ended December 31, 2008. In January 2010, we terminated our domestic post-transaction sales agreements. In 2009, these agreements, which have minimal costs of revenues, contributed $5.7 million, or 1%, of our FTD segment revenues and $20.8 million, or 9%, of our Classmates Media segment revenues. During 2010, we expect to be able to replace only a limited portion of the advertising revenues previously generated through these agreements. As a result of a number of factors, including those discussed throughout the results of operations discussion, we anticipate revenues and operating income will decrease in 2010 as compared to 2009.
Cost of Revenues. Consolidated cost of revenues increased by $202.5 million, or 94%, to $417.4 million for the year ended December 31, 2009, compared to $214.9 million for the year ended December 31, 2008. The increase of $202.5 million was primarily due to a $216.5 million increase in cost of revenues associated with our FTD segment as a result of including FTD cost of revenues for the entire period for the year ended December 31, 2009 whereas such costs were included only from
58
August 26, 2008 (date of acquisition) in the prior-year period. The increase was also due to a $1.6 million increase in depreciation expense for the year ended December 31, 2009, compared to the prior-year period. The increase was partially offset by decreases in cost of revenues associated with our Communications and Classmates Media segments. Consolidated cost of revenues increased to 42.2% of consolidated revenues for the year ended December 31, 2009, compared to 32.1% for the prior-year period primarily as a result of including FTD for the entire period for the year ended December 31, 2009 since our FTD segment has a higher cost of revenues as a percentage of its revenues compared to the other segments. Cost of revenues related to our FTD, Classmates Media and Communications segments constituted 79.4%, 8.6% and 12.0%, respectively, of our total segment cost of revenues for the year ended December 31, 2009, compared to 52.0%, 19.9% and 28.1%, respectively, for the year ended December 31, 2008.
Sales and Marketing Expenses. Consolidated sales and marketing expenses increased by $29.8 million, or 17%, to $202.9 million, for the year ended December 31, 2009, compared to $173.0 million for the year ended December 31, 2008. The increase of $29.8 million was primarily due to a $59.1 million increase in sales and marketing expenses associated with our FTD segment as a result of including FTD sales and marketing expenses for the entire period for the year ended December 31, 2009 whereas such expenses were included only from August 26, 2008 (date of acquisition) in the prior-year period. The increase was also due to a $0.6 million increase in depreciation expense for the year ended December 31, 2009, compared to the prior-year period. The increase was partially offset by decreases in sales and marketing expenses associated with our Communications and Classmates Media segments. Consolidated sales and marketing expenses as a percentage of consolidated revenues decreased to 20.5% for the year ended December 31, 2009, compared to 25.9% for the prior-year period primarily as a result of including FTD for the entire period for the year ended December 31, 2009 since our FTD segment has lower sales and marketing expenses as a percentage its revenues compared to the other segments. Sales and marketing expenses related to our FTD, Classmates Media and Communications segments constituted 43.9%, 36.6% and 19.5%, respectively, of total segment sales and marketing expenses for the year ended December 31, 2009, compared to 17.7%, 47.4% and 34.9%, respectively, for the year ended December 31, 2008.
Technology and Development Expenses. Consolidated technology and development expenses increased by $8.5 million, or 15%, to $65.2 million for the year ended December 31, 2009, compared to $56.7 million for the year ended December 31, 2008. The increase of $8.5 million was primarily due to an $8.2 million increase in technology and development expenses associated with our FTD segment as a result of including FTD technology and development expenses for the entire period for the year ended December 31, 2009 whereas such expenses were included only from August 26, 2008 (date of acquisition) in the prior-year period. The increase was also due to an increase in technology and development expenses related to our Classmates Media segment and an increase of $1.5 million in depreciation expense, partially offset by a decrease in technology and development expenses in our Communications segment. Consolidated technology and development expenses as a percentage of consolidated revenues decreased to 6.6% for the year ended December 31, 2009, compared to 8.5% for the prior-year period primarily as a result of including FTD for the entire period for the year ended December 31, 2009 since our FTD segment has lower technology and development expenses as a percentage of its revenues compared to the other segments. Technology and development expenses related to our FTD, Classmates Media and Communications segments constituted 20.8%, 44.9% and 34.3%, respectively, of total segment technology and development expenses for the year ended December 31, 2009, compared to 7.4%, 44.0% and 48.6%, respectively, for the year ended December 31, 2008.
General and Administrative Expenses. Consolidated general and administrative expenses increased by $29.5 million, or 32%, to $121.7 million, for the year ended December 31, 2009, compared to $92.2 million for the year ended December 31, 2008. The increase of $29.5 million was primarily due to
59
a $29.7 million increase in general and administrative expenses associated with our FTD segment as a result of including FTD general and administrative expenses for the entire period in the year ended December 31, 2009 whereas such expenses were included only from August 26, 2008 (date of acquisition) in the prior-year period. The increase was partially offset by decreases in general and administrative expenses associated with our Communications and Classmates Media segments. Consolidated general and administrative expenses as a percentage of consolidated revenues decreased to 12.3% for the year ended December 31, 2009, compared to 13.8% for the prior-year period primarily as a result of including FTD for the entire period for the year ended December 31, 2009 since our FTD segment has lower general and administrative expenses as a percentage of its revenues compared to the other segments. General and administrative expenses related to our FTD, Classmates Media and Communications segments constituted 37.5%, 34.1% and 28.4%, respectively, of total segment general and administrative expenses for the year ended December 31, 2009, compared to 16.2%, 43.7% and 40.2%, respectively, for the year ended December 31, 2008.
Amortization of Intangible Assets. Consolidated amortization of intangible assets increased by $16.4 million, or 89%, to $34.8 million for the year ended December 31, 2009, compared to $18.4 million for the year ended December 31, 2008. The increase was primarily due to an increase in amortization of intangible assets associated with our FTD segment as a result of including FTD amortization of intangible assets for the entire period for the year ended December 31, 2009 whereas such expenses were included only from August 26, 2008 (date of acquisition) in the prior-year period.
Restructuring Charges. Consolidated restructuring charges increased by $1.5 million, or 223%, to $2.1 million for the year ended December 31, 2009, compared to $0.7 million for the year ended December 31, 2008. Restructuring charges for the year ended December 31, 2009 were primarily associated with a reduction in headcount in the fourth quarter in our Classmates Media segment. We eliminated 71 positions within our Classmates Media segment. Restructuring charges for the year ended December 31, 2008 were primarily associated with the closure of our Orem, Utah facility.
Impairment of Goodwill, Intangible Assets and Long-Lived Assets. There were no impairment charges for the year ended December 31, 2009, compared to $176.2 million for the year ended December 31, 2008. Impairment charges for the year ended December 31, 2008 were primarily due to a reduction in the fair value of the FTD reporting unit compared to its carrying value and lower fair values in the FTD and Interflora trademarks and trade names compared to their carrying values.
Interest Income. Interest income decreased by $3.0 million, or 66%, to $1.5 million for the year ended December 31, 2009, compared to $4.5 million for the year ended December 31, 2008. The decrease in interest income was primarily due to the liquidation of our short-term investments portfolio to partially fund the FTD acquisition in August 2008, as well as to a decline in interest rates as a result of the interest rate environment in recent quarterly periods and to our decision in the fourth quarter of 2008 to presently invest in only cash and cash equivalents. The decrease in interest income was partially offset by higher average cash and cash equivalents balances for the year ended December 31, 2009, compared to the prior-year period.
Interest Expense. Interest expense increased by $20.4 million, or 155%, to $33.5 million for the year ended December 31, 2009, compared to $13.2 million for the year ended December 31, 2008. The increase in interest expense was primarily a result of the indebtedness incurred in connection with the FTD acquisition, which closed on August 26, 2008. Interest expense was primarily related to interest on our credit facilities, including accretion of discounts and amortization of debt issue costs.
Other Income (Expense), net. Other income, net increased by $4.3 million to $4.2 million for the year ended December 31, 2009, compared to other expense, net of $48,000 for the year ended December 31, 2008. Other income for the year ended December 31, 2009 included non-operating income related to a non-income tax refund recovery and a favorable legal settlement.
60
Provision for Income Taxes. For the year ended December 31, 2009, we recorded a tax provision of $48.1 million on pre-tax income of $118.2 million, resulting in an effective income tax rate of 40.7%. For the year ended December 31, 2008, we recorded a tax provision of $23.3 million on a pre-tax loss of $71.4 million. The tax provision for the year ended December 31, 2008 reflects the impact of non-deductible goodwill and impairment charges of $176.2 million. Excluding these charges, the effective income tax rate for the year ended December 31, 2008 would have been 43.5%. The current rate has declined primarily due to the effects of net benefits resulting from statute expirations of uncertain tax positions offset partially by the limitation of foreign tax credits.
FTD Segment Results (Actual Results vs. Combined Results Discussion)
The results of operations for FTD for the year ended December 31, 2009 and unaudited combined results of operations for FTD for the year ended December 31, 2008 (the "Combined Year Ended December 31, 2008 Results") are set forth below. The unaudited Combined Year Ended December 31, 2008 Results were derived by adding (i) the unaudited pre-acquisition results of operations of FTD for the period from January 1, 2008 through August 25, 2008 and (ii) the post-acquisition results of operations of FTD for the period from August 26, 2008 through December 31, 2008. Consistent with our definition of segment income (loss) from operations, the discussion of FTD segment results excludes depreciation and amortization within segment operating expenses.
The Combined Year Ended December 31, 2008 Results set forth below have been included for informational purposes only and do not purport to be indicative of the results of future operations of our FTD segment or the results that would have actually been attained had the FTD acquisition taken place at the beginning of 2008. The Combined Year Ended December 31, 2008 Results should be read in conjunction with the historical consolidated financial statements of FTD Group, Inc. and the related notes to those financial statements. The historical information presented below has been revised to exclude depreciation and amortization from segment operating expenses and reflects certain reclassifications to conform with the Company's financial statement presentation. Historical public filings of FTD Group, Inc. are available at the SEC's Web site at www.sec.gov.
| |
Year Ended December 31, | |||||||||||
|---|---|---|---|---|---|---|---|---|---|---|---|---|
| |
2009 | 2008 (Combined) |
% Change | |||||||||
| |
(in thousands, except average order value and average currency exchange rates) |
|
||||||||||
Revenues |
$ | 545,845 | $ | 622,003 | (12.2 | )% | ||||||
Operating expenses: |
||||||||||||
Cost of revenues |
323,581 | 374,231 | (13.5 | )% | ||||||||
Sales and marketing |
89,720 | 103,046 | (12.9 | )% | ||||||||
Technology and development |
11,868 | 12,770 | (7.1 | )% | ||||||||
General and administrative |
43,748 | 56,189 | (22.1 | )% | ||||||||
Impairment of goodwill, intangible assets and long-lived assets |
— | 175,867 | N/A | |||||||||
Total operating expenses |
468,917 | 722,103 | (35.1 | )% | ||||||||
Segment income (loss) from operations |
$ | 76,928 | $ | (100,100 | ) | N/A | ||||||
Consumer orders |
6,071 | 6,548 | (7.3 | )% | ||||||||
Average order value |
$ | 59.56 | $ | 62.99 | (5.4 | )% | ||||||
Average currency exchange rate: GBP to USD |
1.55 | 1.86 | (16.7 | )% | ||||||||
61
The following table presents the FTD segment's expenses and results as a percentage of FTD revenues for the years ended December 31, 2009 and 2008.
| |
Year Ended December 31, |
||||||||
|---|---|---|---|---|---|---|---|---|---|
| |
2009 | 2008 (Combined) |
|||||||
Revenues |
100.0 | % | 100.0 | % | |||||
Operating expenses: |
|||||||||
Cost of revenues |
59.3 | 60.2 | |||||||
Sales and marketing |
16.4 | 16.6 | |||||||
Technology and development |
2.2 | 2.1 | |||||||
General and administrative |
8.0 | 9.0 | |||||||
Impairment of goodwill, intangible assets and long-lived assets |
— | 28.3 | |||||||
Total operating expenses |
85.9 | 116.1 | |||||||
Segment income (loss) from operations |
14.1 | % | (16.1 | )% | |||||
FTD Revenues. FTD revenues decreased by $76.2 million, or 12%, to $545.8 million for the year ended December 31, 2009, compared to $622.0 million for the year ended December 31, 2008. Excluding the foreign currency exchange rate impact of $27.3 million due to a weaker British Pound versus the U.S. Dollar, revenues decreased by $48.9 million, or 8%, compared to the prior-year period, primarily due to reduced consumer order volume and a decrease in sales of products and services to our floral network members. In the fourth quarter of 2009, the FTD segment achieved a year-over-year increase in revenues for the first time since the acquisition and, despite the expected decrease in advertising revenues due to the termination of the post-transaction sales agreements, we anticipate continued increases in quarterly year-over-year revenues in 2010 when compared to 2009; however, the anticipated increases are contingent upon a number of factors, including economic conditions, and there is no assurance that we can increase revenues as anticipated.
FTD Cost of Revenues. FTD cost of revenues decreased by $50.7 million, or 14%, to $323.6 million for the year ended December 31, 2009, compared to $374.2 million for the year ended December 31, 2008. Excluding the impact of foreign currency exchange rates of $18.8 million, cost of revenues decreased by $31.8 million, or 9%, compared to the prior-year period, primarily as a result of the decline in products and services revenues noted above. FTD cost of revenues as a percentage of revenues decreased to 59.3% for the year ended December 31, 2009, compared to 60.2% for the prior-year period. Cost of revenues as a percentage of revenues was positively impacted by a shift in the mix of products and services sold as well as by cost reductions, primarily related to shipping costs.
FTD Sales and Marketing Expenses. FTD sales and marketing expenses decreased by $13.3 million, or 13%, to $89.7 million for the year ended December 31, 2009, compared to $103.0 million for the year ended December 31, 2008. FTD sales and marketing expenses as a percentage of revenues decreased to 16.4% for the year ended December 31, 2009, compared to 16.6% for the prior-year period. Excluding the impact of foreign currency exchange rates of $2.8 million, sales and marketing expenses decreased by $10.5 million, or 10%, compared to the prior-year period. The decrease was due to reduced marketing expenditures for online marketing and print advertising, a decrease in floral network member incentives, and a decrease in personnel-related costs, partially offset by an increase in expenses related to second quarter 2009 television advertising for the Mother's Day holiday. We anticipate marketing expenditures may increase in 2010, particularly associated with branding initiatives; however, there are no assurances that such expenditures will have a commensurate, positive impact on either our FTD segment revenues or profitability.
62
FTD Technology and Development Expenses. FTD technology and development expenses decreased by $0.9 million, or 7%, to $11.9 million for the year ended December 31, 2009, compared to $12.8 million for the year ended December 31, 2008. FTD technology and development expenses as a percentage of revenues increased slightly to 2.2% for the year ended December 31, 2009, compared to 2.1% for the prior-year period. Excluding the impact of foreign currency exchange rates of $1.0 million, technology and development expenses increased by $0.1 million, or 1%, compared to the prior-year period.
FTD General and Administrative Expenses. FTD general and administrative expenses decreased by $12.4 million, or 22%, to $43.7 million for the year ended December 31, 2009, compared to $56.2 million for the year ended December 31, 2008. FTD general and administrative expenses as a percentage of revenues decreased to 8.0% for the year ended December 31, 2009, compared to 9.0% for the prior-year period. Excluding the impact of foreign currency exchange rates of $0.6 million, general and administrative expenses decreased by $11.9 million, or 21%, compared to the prior-year period. The decrease was primarily due to $16.2 million of expenses in the prior-year period related to the acquisition of FTD by the Company and $2.0 million of charges related to acquisition opportunities that were abandoned in light of the then-pending acquisition of FTD by the Company. The decrease was largely offset by an increase in allocated stock-based compensation and allocated corporate costs as well as increased bad debt expense for the year ended December 31, 2009.
FTD Impairment of Goodwill, Intangible Assets and Long-Lived Assets. FTD recorded impairment charges of $175.9 million for the year ended December 31, 2008 due to a reduction in the fair value of the FTD reporting unit compared to its carrying value and lower fair values in the FTD and Interflora trademarks and trade names compared to their carrying values. There were no such impairments in the year ended December 31, 2009.
Classmates Media Segment Results
The following table presents the Classmates Media segment's results of operations as a percentage of Classmates Media revenues for the years ended December 31, 2009 and 2008.
| |
Year Ended December 31, |
||||||||
|---|---|---|---|---|---|---|---|---|---|
| |
2009 | 2008 | |||||||
Revenues |
100.0 | % | 100.0 | % | |||||
Operating expenses: |
|||||||||
Cost of revenues |
14.8 | 17.9 | |||||||
Sales and marketing |
31.7 | 35.6 | |||||||
Technology and development |
10.8 | 9.5 | |||||||
General and administrative |
16.8 | 16.5 | |||||||
Restructuring charges |
0.9 | — | |||||||
Total operating expenses |
75.1 | 79.5 | |||||||
Segment income from operations |
28.6 | % | 20.5 | % | |||||
Classmates Media Revenues. Classmates Media revenues increased by $5.8 million, or 3%, to $236.0 million for the year ended December 31, 2009, compared to $230.2 million for the year ended December 31, 2008. The increase in Classmates Media revenues was primarily due to a $12.5 million increase in services revenues as a result of a 22% increase in our average number of pay accounts from 3.8 million for the year ended December 31, 2008 to 4.6 million for the year ended December 31, 2009, partially offset by an 11% decrease in ARPU from $3.09 for the year ended December 31, 2008 to $2.75 for the year ended December 31, 2009. The decrease in ARPU was primarily attributable to the
63
increased use of discounted pricing plans offered to certain U.S. online social networking pay accounts on a promotional basis and, to a lesser extent, a greater percentage of total pay accounts being represented by international online social networking pay accounts which have, on average, lower-priced subscription plans compared to U.S. online social networking pay accounts. Although we experienced a net increase in Classmates Media pay accounts in the year ended December 31, 2009, this increase was largely due to an increase in our offerings of discounted pricing plans, with a significant number of the new pay accounts generated during the period under this promotional pricing, resulting in a decrease in the churn rate. The increase in Classmates Media services revenues was partially offset by a $6.7 million decrease in advertising revenues due to a decrease in revenues generated by our online loyalty marketing service, partially offset by an increase in advertising revenues generated by our online social networking services, primarily from post-transaction sales. Due to economic and other factors, we engaged in significant discounting of our pricing plans during the latter half of 2009 which adversely impacted ARPU and resulted in declining services revenues at the end of 2009. While we anticipate continued use of discounted pricing plans, we do not expect selling the volume of discounted pricing plans that we did in the latter half of 2009. However, we expect our use of discounted pricing plans to cause our services revenues to continue to decline, at least in the near term. In addition, as a result of the termination of the post-transaction sales agreements, we expect decreased advertising revenues in 2010 as compared to 2009.
Classmates Media Cost of Revenues. Classmates Media cost of revenues decreased by $6.1 million, or 15%, to $35.0 million, for the year ended December 31, 2009, compared to $41.1 million for the year ended December 31, 2008. Classmates Media cost of revenues as a percentage of Classmates Media revenues decreased to 14.8% for the year ended December 31, 2009, compared to 17.9% for the prior-year period. The decrease of $6.1 million was largely related to a $3.8 million decrease in the cost of points earned by members of our online loyalty marketing service as a result of a decrease in revenues generated by our online loyalty marketing service. The decrease was also due to a $1.4 million decrease in personnel-related expenses associated with our online social networking services and a $0.7 million decrease in overhead-related costs. The decrease in cost of revenues as a percentage of Classmates Media revenues was mainly due to a greater percentage of revenues having been generated from higher-margin online social networking services.
Classmates Media Sales and Marketing Expenses. Classmates Media sales and marketing expenses decreased by $7.0 million, or 9%, to $74.9 million, for the year ended December 31, 2009, compared to $81.9 million for the year ended December 31, 2008. Classmates Media sales and marketing expenses as a percentage of Classmates Media revenues decreased to 31.7% for the year ended December 31, 2009, compared to 35.6% for the prior-year period. The decrease of $7.0 million was largely the result of a $5.8 million decrease in marketing costs related to acquiring new online social networking and online loyalty marketing members. The decrease was also due to a $1.2 million decrease in personnel- and overhead-related expenses. The decrease in sales and marketing expenses as a percentage of Classmates Media revenues was mainly due to a reduction in sales commissions as a result of a decline in revenues from our online loyalty marketing service and an increase in revenues from our international online social networking operations without a corresponding increase in related sales and marketing costs.
Classmates Media Technology and Development Expenses. Classmates Media technology and development expenses increased by $3.6 million, or 16%, to $25.5 million, for the year ended December 31, 2009, compared to $22.0 million for the year ended December 31, 2008. Classmates Media technology and development expenses as a percentage of Classmates Media revenues increased to 10.8% for the year ended December 31, 2009, compared to 9.5% for the prior-year period. The increase in expenses was primarily due to a $1.8 million increase in overhead-related expenses and a $1.6 million increase in personnel-related expenses.
64
Classmates Media General and Administrative Expenses. Classmates Media general and administrative expenses increased by $1.8 million, or 5%, to $39.7 million, for the year ended December 31, 2009, compared to $38.0 million for the year ended December 31, 2008. Classmates Media general and administrative expenses as a percentage of Classmates Media revenues increased to 16.8% for the year ended December 31, 2009, compared to 16.5% for the prior-year period. The increase of $1.8 million was primarily due to a $3.3 million non-income tax favorable settlement in 2008, a $2.2 million charge in the quarter ended December 31, 2009 related to a reserve for a pending lawsuit, a $1.0 million increase in professional services and consulting fees and a $0.9 million increase in personnel-related expenses. The increase was partially offset by the expensing of $3.9 million in deferred transaction costs related to the potential initial public offering ("IPO") of Classmates Media Corporation ("CMC") in the year ended December 31, 2008, a $1.5 million decrease in 2009 in recruiting and relocation-related expenses and a $0.4 million decrease in overhead-related expenses.
Classmates Media Restructuring Charges. Classmates Media restructuring charges totaled $2.1 million for the year ended December 31, 2009. There were no restructuring charges in our Classmates Media segment for the year ended December 31, 2008. Restructuring charges for the year ended December 31, 2009 were associated with a reduction in headcount in the fourth quarter of 2009. In connection with this reduction in headcount, we eliminated 71 positions within our Classmates Media segment.
Communications Segment Results
The following table presents the Communications segment's results of operations as a percentage of Communications revenues for the years ended December 31, 2009 and 2008.
| |
Year Ended December 31, |
||||||||
|---|---|---|---|---|---|---|---|---|---|
| |
2009 | 2008 | |||||||
Revenues |
100.0 | % | 100.0 | % | |||||
Operating expenses: |
|||||||||
Cost of revenues |
23.1 | 22.5 | |||||||
Sales and marketing |
18.9 | 23.4 | |||||||
Technology and development |
9.2 | 9.4 | |||||||
General and administrative |
15.7 | 13.6 | |||||||
Restructuring charges |
— | 0.3 | |||||||
Impairment of goodwill, intangible assets and long lived assets |
— | 0.1 | |||||||
Total operating expenses |
66.9 | 69.2 | |||||||
Segment income from operations |
33.1 | % | 30.8 | % | |||||
Communications Revenues. Communications revenues decreased by $46.2 million, or 18%, to $211.2 million for the year ended December 31, 2009, compared to $257.4 million for the year ended December 31, 2008. The decrease in Communications revenues was primarily due to a $43.2 million decrease in services revenues as a result of a 24% decrease in our average number of dial-up Internet access pay accounts from 1.6 million for the year ended December 31, 2008 to 1.2 million for the year ended December 31, 2009, partially offset by an increase in ARPU. The decrease in Communications revenues was also due to a $3.0 million decrease in advertising revenues resulting from a decrease in pay accounts. In 2010, we expect that Communications pay accounts and segment revenues, including advertising revenues, will continue to decline.
Communications Cost of Revenues. Communications cost of revenues decreased by $9.2 million, or 16%, to $48.7 million, for the year ended December 31, 2009, compared to $57.9 million for the year
65
ended December 31, 2008. Communications cost of revenues as a percentage of Communications revenues increased to 23.1% for the year ended December 31, 2009, compared to 22.5% for the prior-year period. The decrease of $9.2 million was largely due to a $6.0 million decrease in telecommunications costs associated with our dial-up Internet access services primarily due to a decrease in the number of pay accounts, a decrease in hourly usage per pay account and lower average hourly telecommunications costs. In addition, Communications cost of revenues decreased as a result of a $2.8 million decrease in customer support- and billing-related costs due to a decrease in the number of dial-up Internet access pay accounts, a $0.7 million decrease in costs associated with our Web hosting business primarily as a result of the closure of our Orem, Utah facility in 2008, a $0.6 million decrease in personnel-related costs as a result of reduced headcount and a $0.4 million decrease in costs associated with our VoIP service as a result of our previous decision to exit this business. These decreases were partially offset by a $1.4 million increase in costs associated with our broadband services due to the increase in the number of subscribers to our services.
Communications Sales and Marketing Expenses. Communications sales and marketing expenses decreased by $20.4 million, or 34%, to $39.9 million, for the year ended December 31, 2009, compared to $60.2 million for the year ended December 31, 2008. Communications sales and marketing expenses as a percentage of Communications revenues decreased to 18.9% for the year ended December 31, 2009, compared to 23.4% for the prior-year period. The decrease in expenses reflected the continued decline in dial-up Internet access pay accounts and revenues. The decrease of $20.4 million was attributable to a $15.1 million decline in advertising, promotion and distribution costs related to our dial-up Internet access services and, to a lesser extent, a $6.9 million decrease in personnel- and overhead-related expenses as a result of reduced headcount. The decrease was partially offset by a one-time, out-of-period adjustment of $1.4 million related to marketing expenses.
Communications Technology and Development Expenses. Communications technology and development expenses decreased by $4.7 million, or 20%, to $19.5 million, for the year ended December 31, 2009, compared to $24.2 million, for the year ended December 31, 2008. Communications technology and development expenses as a percentage of Communications revenues decreased to 9.2% for the year ended December 31, 2009, compared to 9.4% for the prior-year period. The decrease in expenses was primarily the result of a $6.0 million decrease in personnel-related expenses as a result of reduced headcount, partially offset by a $1.2 million increase in overhead-related expenses.
Communications General and Administrative Expenses. Communications general and administrative expenses decreased by $1.7 million, or 5%, to $33.2 million, for the year ended December 31, 2009, compared to $34.9 million for the year ended December 31, 2008. Communications general and administrative expenses as a percentage of Communications revenues increased to 15.7% for the year ended December 31, 2009, compared to 13.6% for the prior-year period. The decrease of $1.7 million was primarily due to a $2.0 million decrease in personnel-related costs as a result of reduced headcount and a $1.3 million decrease in professional services and consulting fees, partially offset by a $0.9 million increase in bad debt expense. The increase as a percentage of revenues was largely attributable to continued declines in revenues as a result of continuing declines in the number of dial-up Internet access pay accounts.
Communications Restructuring Charges. There were no Communications restructuring charges for the year ended December 31, 2009, compared to $0.7 million for the year ended December 31, 2008. Restructuring charges for the year ended December 31, 2008 were primarily associated with the closure of our Orem, Utah facility.
66
Year Ended December 31, 2008 compared to Year Ended December 31, 2007
The following table presents our results of operations as a percentage of consolidated revenues for the years ended December 31, 2008 and 2007.
| |
Year Ended December 31, |
||||||||
|---|---|---|---|---|---|---|---|---|---|
| |
2008 | 2007 | |||||||
Revenues |
100.0 | % | 100.0 | % | |||||
Operating expenses: |
|||||||||
Cost of revenues |
32.1 | 22.8 | |||||||
Sales and marketing |
25.9 | 31.8 | |||||||
Technology and development |
8.5 | 9.9 | |||||||
General and administrative |
13.8 | 14.3 | |||||||
Amortization of intangible assets |
2.8 | 2.5 | |||||||
Restructuring charges |
0.1 | 0.7 | |||||||
Impairment of goodwill, intangible assets and long-lived assets |
26.3 | — | |||||||
Total operating expenses |
109.4 | 82.0 | |||||||
Operating income (loss) |
(9.4 | ) | 18.0 | ||||||
Interest income |
0.7 | 1.4 | |||||||
Interest expense |
(2.0 | ) | — | ||||||
Other income, net |
— | (0.1 | ) | ||||||
Income (loss) before income taxes |
(10.7 | ) | 19.2 | ||||||
Provision for income taxes |
3.5 | 8.0 | |||||||
Net income (loss) |
(14.1 | )% | 11.3 | % | |||||
Consolidated Results
Revenues. Consolidated revenues increased by $155.9 million, or 30.4%, to $669.4 million for the year ended December 31, 2008, compared to $513.5 million for the year ended December 31, 2007. The increase of $155.9 million was primarily related to $182.0 million of revenues associated with our FTD segment, which are included in consolidated revenues from August 26, 2008 (date of acquisition) and, to a lesser extent, an increase in revenues from our Classmates Media segment, partially offset by a decrease in revenues from our Communications segment. Consolidated revenues related to our FTD, Classmates Media and Communications segments constituted 27.2%, 34.4% and 38.4%, respectively, of our consolidated revenues for the year ended December 31, 2008, compared to 0%, 37.7% and 62.3%, respectively, for the year ended December 31, 2007.
Cost of Revenues. Consolidated cost of revenues increased by $97.7 million, or 83.3%, to $214.9 million for the year ended December 31, 2008, compared to $117.2 million for the year ended December 31, 2007. Consolidated cost of revenues increased to 32.1% of consolidated revenues for the year ended December 31, 2008, compared to 22.8% for the prior-year period. The increase of $97.7 million was primarily related to $107.1 million of cost of revenues associated with our FTD segment, which is included in consolidated cost of revenues from August 26, 2008 (date of acquisition) and, to a lesser extent, a slight increase in cost of revenues associated with our Classmates Media segment, partially offset by a decrease in cost of revenues associated with our Communications segment. The increase in cost of revenues as a percentage of revenues was primarily due to the addition of FTD which has higher cost of revenues as a percentage of its revenues, compared to the other segments. Cost of revenues related to our FTD, Classmates Media and Communications segments constituted 52.0%, 19.9% and 28.1%, respectively, of our total segment cost of revenues for
67
the year ended December 31, 2008, compared to 0%, 36.3% and 63.7%, respectively, for the year ended December 31, 2007.
Sales and Marketing Expenses. Consolidated sales and marketing expenses increased by $9.6 million, or 5.9%, to $173.0 million, for the year ended December 31, 2008, compared to $163.4 million for the year ended December 31, 2007. Consolidated sales and marketing expenses as a percentage of consolidated revenues decreased to 25.9% for the year ended December 31, 2008, compared to 31.8% for the prior-year period. The increase of $9.6 million was primarily related to $30.6 million of sales and marketing expenses associated with our FTD segment, which are included in consolidated sales and marketing expenses from August 26, 2008 (date of acquisition) and, to a lesser extent, an increase in sales and marketing expenses associated with our Classmates Media segment, partially offset by a decrease in expenses in the Communications segment. The decrease as a percentage of consolidated revenues was primarily due to the addition of FTD, which has lower sales and marketing expenses as a percentage its revenues, compared to the other segments. Sales and marketing expenses related to our FTD, Classmates Media and Communications segments constituted 17.7%, 47.4% and 34.9%, respectively, of total segment sales and marketing expenses for the year ended December 31, 2008, compared to 0%, 48.4% and 51.6%, respectively, for the year ended December 31, 2007.
Technology and Development Expenses. Consolidated technology and development expenses increased by $5.7 million, or 11.1%, to $56.7 million, for the year ended December 31, 2008, compared to $51.0 million for the year ended December 31, 2007. Consolidated technology and development expenses as a percentage of consolidated revenues decreased to 8.5% for the year ended December 31, 2008, compared to 9.9% for the prior-year period. The increase of $5.7 million was largely attributable to an increase in expenses in the Classmates Media segment of $6.0 million, $3.7 million in expenses associated with our FTD segment, which are included in consolidated technology and development expenses from August 26, 2008 (date of acquisition), and a $1.4 million increase in depreciation, partially offset by a decrease in expenses in the Communications segment of $5.4 million. The decrease as a percentage of revenues was due to the addition of FTD, which has lower technology and development expenses as a percentage of its revenues, compared to the other segments. Technology and development expenses related to our FTD, Classmates Media and Communications segments constituted 7.4%, 44.0% and 48.6%, respectively, of total segment technology and development expenses for the year ended December 31, 2008, compared to 0%, 35.1% and 64.9%, respectively, for the year ended December 31, 2007.
General and Administrative Expenses. Consolidated general and administrative expenses, in the aggregate, increased in the year ended December 31, 2008 compared to the year ended December 31, 2007. A significant amount of the increase, in the aggregate, was due to the addition of FTD and an increase in stock-based compensation as a result of several factors, including bonuses for certain members of senior management for the year ended December 31, 2008 (the "2008 Bonuses") that were paid in shares of our common stock whereas such bonuses were historically paid primarily in cash; the effect of shares of common stock and restricted stock units awarded in the first quarter of fiscal 2008; and the effect of restricted stock units awarded in 2007 to members of senior management in connection with the execution or renewal of employment agreements. Also, the resignation of an executive officer in 2007 resulted in the reversal in 2007 of certain stock-based compensation recorded in prior periods, which reduced stock-based compensation associated with general and administrative expenses in 2007. The payment of the 2008 Bonuses in shares of common stock as opposed to cash, while increasing stock-based compensation, did not have a significant impact on general and administrative expenses in 2008.
Consolidated general and administrative expenses increased by $18.9 million, or 25.8%, to $92.2 million, for the year ended December 31, 2008, compared to $73.3 million for the year ended
68
December 31, 2007. Consolidated general and administrative expenses as a percentage of consolidated revenues decreased slightly to 13.8% for the year ended December 31, 2008, compared to 14.3% for the prior-year period. The increase of $18.9 million was due to $14.1 million of general and administrative expenses associated with our FTD segment, which are included in consolidated general and administrative expenses from August 26, 2008 (date of acquisition), and a $7.2 million increase in expenses associated with our Classmates Media segment, partially offset by a $1.7 million decrease in expenses associated with our Communications segment and a $0.6 million decrease in depreciation. General and administrative expenses related to our FTD, Classmates Media and Communications segments constituted 16.2%, 43.7% and 40.2%, respectively, of total segment general and administrative expenses for the year ended December 31, 2008, compared to 0%, 45.6% and 54.4%, respectively, for the year ended December 31, 2007.
Amortization of Intangible Assets. Consolidated amortization of intangible assets increased by $5.6 million, or 43.9%, to $18.4 million for the year ended December 31, 2008, compared to $12.8 million for the year ended December 31, 2007. The increase was associated with increased amortization related to definite-lived intangible assets acquired in connection with our FTD acquisition, partially offset by a decrease in amortization of intangible assets attributable to the accelerated amortization of intangible assets in earlier years associated with our Classmates acquisition in November 2004 and, to a lesser extent, a decrease in amortization in the year ended December 31, 2008 compared to the year ended December 31, 2007 as a result of certain assets from the acquisition of Web hosting assets in April 2004 becoming fully amortized in March 2007.
Restructuring Charges. Consolidated restructuring charges totaled $0.7 million for the year ended December 31, 2008, compared to $3.4 million for the year ended December 31, 2007. The restructuring charges for the year ended December 31, 2008 were primarily associated with the closure of our Orem, Utah facility. In 2007, we eliminated 69 positions and recorded restructuring charges totaling $3.0 million to better align the Communications segment's cost structure within a mature business for dial-up Internet access services. In addition, we recognized $0.4 million in restructuring charges in the year ended December 31, 2007 for termination benefits paid to certain employees associated with our Web hosting and photo sharing businesses.
Impairment of Goodwill, Intangible Assets and Long-Lived Assets. Consolidated impairment charges totaled $176.2 million for the year ended December 31, 2008, compared to $0 for the year ended December 31, 2007. Impairment charges for the year ended December 31, 2008 were primarily due to a reduction in the fair value of the FTD reporting unit compared to its carrying value and lower fair values in the FTD and Interflora trademarks and trade names compared to their carrying values.
Interest Income. Interest income decreased by $2.6 million, or 36.6%, to $4.5 million for the year ended December 31, 2008, compared to $7.1 million for the year ended December 31, 2007. The decrease in interest income is consistent with the decrease in the investment portfolio during the year ended December 31, 2008 as a result of the liquidation of investments to partially fund the FTD acquisition and the reduction in interest rates as a result of the macroeconomic environment.
Interest Expense. Interest expense was $13.2 million for the year ended December 31, 2008, compared to $3,000 for the year ended December 31, 2007. The increase in interest expense was a result of the indebtedness incurred in connection with the FTD acquisition, which closed on August 26, 2008.
Other Income (Expense), net. Other expense, net was $48,000 for the year ended December 31, 2008, compared to $0.7 million for the year ended December 31, 2007. The decrease in other expense, net, was primarily due to interest earned on a non-income tax dispute settlement, a $0.3 million net realized gain on sales of our short-term investments recognized in the year ended December 31, 2008 in connection with the liquidation of our short-term investments portfolio during the year ended
69
December 31, 2008 and $0.3 million of imputed interest on the acquired member redemption liability of our online loyalty marketing service recorded in the year ended December 31, 2007. These decreases were offset by an increase in foreign currency exchange rate losses and an increase in losses on disposal of assets.
Provision for Income Taxes. For the year ended December 31, 2008, we recorded a tax provision of $23.3 million on a pre-tax loss of $71.4 million. The tax provision reflects the impact of non-deductible goodwill and impairment charges of $176.2 million. Excluding these charges, the effective income tax rate for the year ended December 31, 2008 would have been 43.5%. For the year ended December 31, 2007, we recorded a tax provision of $40.9 million on pre-tax income of $98.7 million, resulting in an effective income tax rate of 41.5%. The increase in our effective income tax rate, excluding the impact of the impairment charges, was primarily due to (1) an increase in nondeductible executive compensation expense; (2) a lower amount of tax-free interest income; and (3) a net increase in the reserve for uncertain tax positions primarily due to state law changes. These increases were partially offset by (1) a lower state income tax rate, net of federal income tax benefit and (2) the release of the deferred tax valuation allowance attributable to the utilization of certain foreign net operating losses.
Classmates Media Segment Results
The following table presents the Classmates Media segment's results of operations as a percentage of Classmates Media revenues for the years ended December 31, 2008 and 2007.
| |
Year Ended December 31, |
||||||||
|---|---|---|---|---|---|---|---|---|---|
| |
2008 | 2007 | |||||||
Revenues |
100.0 | % | 100.0 | % | |||||
Operating expenses: |
|||||||||
Cost of revenues |
17.9 | 20.4 | |||||||
Sales and marketing |
35.6 | 40.8 | |||||||
Technology and development |
9.5 | 8.3 | |||||||
General and administrative |
16.5 | 15.9 | |||||||
Restructuring charges |
— | — | |||||||
Total operating expenses |
79.5 | 85.4 | |||||||
Segment income from operations |
20.5 | % | 14.6 | % | |||||
Classmates Media Revenues. Classmates Media revenues increased by $36.8 million, or 19.0%, to $230.2 million for the year ended December 31, 2008, compared to $193.4 million for the year ended December 31, 2007. The increase in Classmates Media revenues was primarily due to a $32.9 million increase in services revenues as a result of a 40% increase in our average number of pay accounts from 2.7 million for the year ended December 31, 2007 to 3.8 million for the year ended December 31, 2008, partially offset by a 7% decrease in ARPU from $3.31 for the year ended December 31, 2007 to $3.09 for the year ended December 31, 2008. The decrease in ARPU was primarily attributable to limited-time promotional subscription offerings in the fourth quarter of 2007, which negatively impacted ARPU in the year ended December 31, 2008 compared to the prior-year and, to a lesser extent, a greater percentage of pay accounts represented by international online social networking pay accounts which have lower-priced subscription plans compared to U.S. online social networking pay accounts. The increase in Classmates Media revenues was also due to a $3.9 million increase in advertising revenues as a result of increased advertising revenues associated with our online loyalty marketing and international online social networking services, partially offset by decreased advertising revenues associated with post-transaction sales.
70
Classmates Media Cost of Revenues. Classmates Media cost of revenues increased by $1.6 million, or 4.1%, to $41.1 million, for the year ended December 31, 2008, compared to $39.5 million for the year ended December 31, 2007. Classmates Media cost of revenues as a percentage of Classmates Media revenues decreased to 17.9% for the year ended December 31, 2008, compared to 20.4% for the prior-year period. The increase of $1.6 million was primarily related to a $2.6 million increase in customer support, overhead and personnel-related costs associated with our online social networking services as a result of growth in the business and an increase in headcount, partially offset by decreased costs associated with our online loyalty marketing service. The decrease in cost of revenues as a percentage of revenues was mainly due to a reduction in the weighted-average cost of points for our online loyalty marketing service and a greater percentage of revenues generated from higher margin services.
Classmates Media Sales and Marketing Expenses. Classmates Media sales and marketing expenses increased by $2.9 million, or 3.7%, to $81.9 million, for the year ended December 31, 2008, compared to $78.9 million for the year ended December 31, 2007. Classmates Media sales and marketing expenses as a percentage of Classmates Media revenues decreased to 35.6% for the year ended December 31, 2008, compared to 40.8% for the prior-year period. The increase of $2.9 million was the result of a $3.3 million increase in marketing costs related to acquiring new online social networking and online loyalty marketing members, partially offset by a $0.3 million decrease in personnel- and overhead-related expenses. The decrease as a percentage of Classmates Media revenues was mainly due to lower customer acquisition cost.
Classmates Media Technology and Development Expenses. Classmates Media technology and development expenses increased by $6.0 million, or 37.2%, to $22.0 million, for the year ended December 31, 2008, compared to $16.0 million for the year ended December 31, 2007. Classmates Media technology and development expenses as a percentage of Classmates Media revenues increased slightly to 9.5% for the year ended December 31, 2008, compared to 8.3% for the prior-year period. The increase in expenses was primarily due to a $5.0 million increase in personnel-related expenses resulting from increased headcount to develop new features related to our online social networking services and a $0.9 million increase in overhead expenses.
Classmates Media General and Administrative Expenses. Classmates Media general and administrative expenses increased by $7.2 million, or 23.5%, to $38.0 million, for the year ended December 31, 2008, compared to $30.8 million for the year ended December 31, 2007. Classmates Media general and administrative expenses as a percentage of Classmates Media revenues remained relatively stable, with a slight increase to 16.5% for the year ended December 31, 2008, compared to 15.9% for the prior-year period. The increase was primarily related to a $6.2 million increase in personnel-related expenses, the expensing of $3.9 million in deferred transaction-related costs relating to the proposed IPO of CMC in the second quarter of 2008 and an increase in overhead-related costs of $2.2 million. These increases were partially offset by a $3.3 million non-income tax dispute settlement and a $1.9 million decrease in consulting expenses related to audit and executive search fees incurred in the year ended December 31, 2007 related to our then-proposed IPO of CMC.
71
Communications Segment Results
The following table presents the Communications segment's results of operations as a percentage of Communications revenues for the years ended December 31, 2008 and 2007.
| |
Year Ended December 31, |
||||||||
|---|---|---|---|---|---|---|---|---|---|
| |
2008 | 2007 | |||||||
Revenues |
100.0 | % | 100.0 | % | |||||
Operating expenses: |
|||||||||
Cost of revenues |
22.5 | 21.6 | |||||||
Sales and marketing |
23.4 | 26.3 | |||||||
Technology and development |
9.4 | 9.3 | |||||||
General and administrative |
13.6 | 11.5 | |||||||
Restructuring charges |
0.3 | 1.1 | |||||||
Impairment of goodwill, intangible assets and long lived assets |
0.1 | — | |||||||
Total operating expenses |
69.2 | 69.7 | |||||||
Segment income from operations |
30.8 | % | 30.3 | % | |||||
Communications Revenues. Communications revenues decreased by $62.6 million, or 19.6%, to $257.4 million for the year ended December 31, 2008, compared to $320.1 million for the year ended December 31, 2007. The decrease in Communications revenues was primarily due to a $54.6 million decrease in services revenues as a result of a 22% decrease in our average number of dial-up Internet access pay accounts from 2.0 million for the year ended December 31, 2007 to 1.6 million for the year ended December 31, 2008 and, to a lesser extent, a $1.5 million decrease in services revenues associated with our VoIP business, which we exited in the third quarter of 2007, partially offset by an increase in services revenues from our broadband services in the year ended December 31, 2008 compared to the year ended December 31, 2007. The decrease in Communications revenues was also due to an $8.0 million decrease in advertising revenues resulting from a decrease in pay accounts and termination of a key advertising contract during 2007.
Communications Cost of Revenues. Communications cost of revenues decreased by $11.4 million, or 16.4%, to $57.9 million, for the year ended December 31, 2008, compared to $69.3 million for the year ended December 31, 2007. Communications cost of revenues as a percentage of Communications increased slightly to 22.5% for the year ended December 31, 2008, compared to 21.6% for the prior-year period. The decrease of $11.4 million was primarily due to a $9.8 million decrease in telecommunications costs associated with our dial-up Internet access services due to a decrease in the number of pay accounts, a decrease in hourly usage per pay account, and lower average hourly telecommunications costs. In addition, Communications costs of revenues decreased as a result of a $3.5 million decrease in customer support- and billing-related costs in the year ended December 31, 2008, compared to the year ended December 31, 2007, as a result of a decrease in the number of dial-up Internet access pay accounts and a decrease in the hourly rate charged by our third-party vendor and a $2.5 million decrease in costs associated with our VoIP service as a result of our decision to exit this business in the third quarter of 2007. These decreases were partially offset by a $6.0 million increase in costs associated with our broadband services due to an increase in the number of broadband pay accounts.
Communications Sales and Marketing Expenses. Communications sales and marketing expenses decreased by $23.9 million, or 28.4%, to $60.2 million, for the year ended December 31, 2008, compared to $84.1 million for the year ended December 31, 2007. Communications sales and marketing expenses as a percentage of Communications revenues decreased to 23.4% for the year ended
72
December 31, 2008, compared to 26.3% for the prior-year period. The decrease in expenses was a result of continued declines in dial-up Internet access revenues. The decrease of $23.9 million was attributable to a $21.6 million decline in advertising, promotion and distribution costs related to our dial-up Internet access services, a $1.3 million decrease in promotion costs related to our broadband services, and a $0.7 million decrease in personnel- and overhead-related expenses as a result of reduced headcount.
Communications Technology and Development Expenses. Communications technology and development expenses decreased by $5.4 million, or 18.1%, to $24.2 million, for the year ended December 31, 2008, compared to $29.6 million, for the year ended December 31, 2007. Communications technology and development expenses as a percentage of Communications revenues remained stable at 9.4% for the year ended December 31, 2008, compared to 9.3% for the prior-year period. The decrease in expense was primarily the result of a $5.5 million decrease in personnel-related expenses as a result of reduced headcount.
Communications General and Administrative Expenses. Communications general and administrative expenses decreased by $1.7 million, or 4.6%, to $34.9 million, for the year ended December 31, 2008, compared to $36.7 million for the year ended December 31, 2007. Communications general and administrative expenses as a percentage of Communications revenues increased to 13.6% for the year ended December 31, 2008, compared to 11.5% for the prior-year period. The decrease of $1.7 million was due to a combined $2.4 million decrease in bad debt expense related to a technology partner and a litigation-related allowance recorded in the quarter ended September 30, 2007, a $2.0 million decrease in facilities and other overhead-related expenses, and a $0.6 million decrease in recruiting and relocation expenses. These decreases were partially offset by a $2.2 million increase in personnel-related expenses and, a $1.2 million increase in consulting fees. The increase as a percentage of revenues was largely attributable to continued declines in revenues as a result of continuing declines in the number of dial-up Internet access pay accounts.
Communications Restructuring Charges. Communications restructuring charges totaled $0.7 million for the year ended December 31, 2008, compared to $3.4 million for the year ended December 31, 2007. The restructuring charges for the year ended December 31, 2008 were primarily associated with the closure of our Orem, Utah facility. In 2007, we eliminated 69 positions and recorded restructuring charges totaling $3.0 million to better align the segment's cost structure within a mature business for dial-up Internet access services. In addition, we recognized $0.4 million in restructuring charges in the year ended December 31, 2007 for termination benefits paid to certain employees associated with our Web hosting and photo sharing businesses.
FTD Segment Results (Combined Results vs. Pre-Acquisition Results Discussion)
The unaudited combined results of operations for FTD for the year ended December 31, 2008 and unaudited pre-acquisition results of operations for FTD for the year ended December 31, 2007 are set forth below. The unaudited combined results of operations of FTD for the year ended December 31, 2008 were derived by adding (i) the unaudited pre-acquisition results of operations of FTD for the period from January 1, 2008 through August 25, 2008 and (ii) the audited post-acquisition results of operations of FTD for the period from August 26, 2008 through December 31, 2008. Consistent with our definition of segment income from operations, the discussion of FTD segment results excludes depreciation and amortization within segment operating expenses.
The unaudited results of operations of FTD set forth below have been included for informational purposes only and do not purport to be indicative of the results of future operations of the FTD segment or the results that would have actually been attained had the acquisition taken place at the beginning of 2008. The pre-acquisition results of FTD should be read in conjunction with the historical consolidated financial statements of FTD Group, Inc. and the related notes to those financial
73
statements. The historical information presented below has been revised to exclude depreciation and amortization and reflects certain reclassifications to conform with the Company's financial statement presentation. Historical public filings of FTD Group, Inc. are available at the SEC's Web site at www.sec.gov.
| |
Year Ended December 31, | |||||||||||
|---|---|---|---|---|---|---|---|---|---|---|---|---|
| |
2008 | 2007 | % Change | |||||||||
| |
(in thousands, except average order value and average currency exchange rates) |
|
||||||||||
Revenues |
$ | 622,003 | $ | 631,935 | (1.6 | )% | ||||||
Operating expenses: |
||||||||||||
Cost of revenues |
374,231 | 376,370 | (0.6 | )% | ||||||||
Sales and marketing |
103,046 | 104,823 | (1.7 | )% | ||||||||
Technology and development |
12,770 | 21,486 | (40.6 | )% | ||||||||
General and administrative |
56,189 | 32,957 | 70.5 | % | ||||||||
Impairment of goodwill, intangible assets and long-lived assets |
175,867 | — | N/A | |||||||||
Total operating expenses |
722,103 | 535,636 | 34.8 | % | ||||||||
Segment income (loss) from operations |
$ | (100,100 | ) | $ | 96,299 | N/A | ||||||
Consumer orders |
6,548 | 6,423 | 1.9 | % | ||||||||
Average order value |
$ | 62.99 | $ | 64.32 | (2.1 | )% | ||||||
Average currency exchange rate: GBP to USD |
1.86 | 2.00 | (7.0 | )% | ||||||||
The following table presents the FTD segment's expenses and results as a percentage of FTD revenues for each period presented:
| |
Year Ended December 31, |
||||||||
|---|---|---|---|---|---|---|---|---|---|
| |
2008 | 2007 | |||||||
Revenues |
100.0 | % | 100.0 | % | |||||
Operating expenses: |
|||||||||
Cost of revenues |
60.2 | 59.6 | |||||||
Sales and marketing |
16.6 | 16.6 | |||||||
Technology and development |
2.1 | 3.4 | |||||||
General and administrative |
9.0 | 5.2 | |||||||
Impairment of goodwill, intangible assets and long-lived assets |
28.3 | — | |||||||
Total operating expenses |
116.1 | 84.8 | |||||||
Segment income (loss) from operations |
(16.1 | )% | 15.2 | % | |||||
FTD Revenues. FTD revenues decreased by $9.9 million, or 1.6%, to $622.0 million for the year ended December 31, 2008, compared to $631.9 million for the year ended December 31, 2007. Excluding the foreign currency exchange rate impact of $12.3 million due to a weaker British Pound versus the U.S. Dollar, revenues increased $2.3 million primarily due to an increase in consumer order volume, partially offset by a decrease in sales of products and services to our floral network members. However, the increase in revenues, excluding the foreign currency exchange rate impact, was attributable to increased revenues in the first six months of 2008 when compared to the first six months of 2007. Due primarily to adverse economic conditions in the U.S. and the U.K., revenues during the latter part of 2008 declined when compared to the latter part of 2007.
74
FTD Cost of Revenues. FTD cost of revenues decreased by $2.1 million, or 0.6%, to $374.2 million, for the year ended December 31, 2008, compared to $376.4 million for the year ended December 31, 2007. Excluding the impact of the strengthening of the U.S. Dollar versus the British Pound of $8.4 million, cost of revenues increased by $6.3 million compared to the prior-year period. FTD cost of revenues as a percentage of FTD revenues increased to 60.2% for the year ended December 31, 2008, compared to 59.6% for the prior-year period. Cost of revenues as a percentage of revenues was impacted by a shift in the mix of products and services sold.
FTD Sales and Marketing Expenses. FTD sales and marketing expenses decreased by $1.8 million, or 1.7%, to $103.0 million, for the year ended December 31, 2008, compared to $104.8 million for the year ended December 31, 2007. FTD sales and marketing expenses as a percentage of FTD revenues remained consistent at 16.6% for the year ended December 31, 2008 and the prior-year period. Excluding the impact of foreign currency exchange rates of $1.7 million, sales and marketing costs decreased by $0.1 million.
FTD Technology and Development Expenses. FTD technology and development expenses decreased by $8.7 million, or 40.6%, to $12.8 million, for the year ended December 31, 2008, compared to $21.5 million, for the year ended December 31, 2007. FTD technology and development expenses as a percentage of FTD revenues decreased to 2.1% for the year ended December 31, 2008, compared to 3.4% for the prior-year period. Excluding the impact of foreign currency exchange rates of $0.6 million, technology and development costs decreased by $8.1 million. The decrease was primarily driven by reduced costs for third-party services and personnel and related costs for technology development.
FTD General and Administrative Expenses. FTD general and administrative expenses increased by $23.2 million, or 70.5%, to $56.2 million, for the year ended December 31, 2008, compared to $33.0 million for the year ended December 31, 2007. FTD general and administrative expenses as a percentage of FTD revenues increased to 9.0% for the year ended December 31, 2008, compared to 5.2% for the prior-year period. Excluding the impact of foreign currency exchange rates, general and administrative costs increased by $23.5 million. The increase was primarily due to the inclusion of $16.2 million of costs related to the acquisition of FTD in August 2008. In addition, FTD incurred charges of $2.0 million related to acquisition opportunities that were abandoned in light of the pending acquisition. The increase related to these costs was partially offset by reduced personnel and related costs and the reversal of a deferred compensation accrual upon the departure of a member of FTD's management.
FTD Impairment of Goodwill, Intangible Assets and Long-Lived Assets. FTD impairment charges totaled $175.9 million for the year ended December 31, 2008. There were no impairment charges for the year ended December 31, 2007. Impairment charges for the year ended December 31, 2008 were due to a reduction in the fair value of the FTD reporting unit compared to its carrying value and lower fair values in the FTD and Interflora trademarks and trade names compared to their carrying values.
Liquidity and Capital Resources
On August 26, 2008, we completed the acquisition of 100% of the capital stock of FTD Group, Inc. We paid a combination of (i) $10.15 in cash and (ii) 0.4087 of a share of United Online common stock for each outstanding share of FTD common stock. The total merger consideration was approximately $307 million in cash and approximately 12.3 million shares of United Online common stock, subject to the payment of cash in lieu of fractional shares of United Online, Inc. common stock.
The FTD acquisition was funded, in part, with the net proceeds from (i) a $60 million term loan under a senior secured credit agreement with Silicon Valley Bank (the "UOL Credit Agreement") and (ii) $375 million of term loan borrowings under senior secured credit facilities with Wells Fargo Bank, National Association (the "FTD Credit Agreement"). In connection with the FTD Credit Agreement,
75
FTD received a $50 million revolving line of credit. The remaining cash consideration in the transaction was paid from United Online's and FTD's existing cash on hand.
The term loans under the UOL Credit Agreement bear interest at either LIBOR plus 3.50% per annum (with a LIBOR floor of 3.00%) or the prime rate plus 2.00% per annum. The UOL Credit Agreement contains customary representations and warranties, events of default, affirmative covenants and negative covenants (which impose restrictions and limitations on, among other things, dividends, investments, asset sales, and the ability to incur additional debt and liens) that, among other things, impose the maintenance of a maximum consolidated leverage ratio and the maintenance of a minimum consolidated fixed charge coverage ratio and minimum twelve-month consolidated adjusted EBITDA.
The obligations under the UOL Credit Agreement are guaranteed by our domestic wholly-owned subsidiaries, other than UNOL Intermediate, Inc. (a wholly-owned subsidiary of United Online and the direct parent of FTD Group, Inc.) and its subsidiaries. In addition, the obligations under the UOL Credit Agreement are secured by a lien on substantially all of the assets of the guarantors, including a pledge of all of the outstanding capital stock of the guarantors' direct subsidiaries (except with respect to foreign subsidiaries, in which case such pledge is limited to 66% of the outstanding capital stock), excluding the capital stock of UNOL Intermediate, Inc.
The FTD Credit Agreement consists of (i) a term loan A facility of up to $75 million, (ii) a term loan B facility of up to $300 million, and (iii) a revolving credit facility of up to $50 million. The interest rate set forth in the FTD Credit Agreement for loans made under the revolving credit facility and term loan A facility is either the prime rate plus 2.50% per annum, or LIBOR plus 3.50% per annum (with a LIBOR floor of 3.00%), in each case, with step-downs in the interest rate depending on FTD's leverage ratio. The interest rate set forth in the FTD Credit Agreement for loans made under the term loan B facility is either the prime rate plus 3.50% per annum, or LIBOR plus 4.50% per annum (with a LIBOR floor of 3.00%), in each case, with step-downs in the interest rate depending on FTD's leverage ratio. In addition, there is a commitment fee equal to 0.50% per annum (with step-downs in the commitment fee depending on FTD's leverage ratio) on the unused portion of the revolving credit facility. The FTD Credit Agreement is guaranteed by UNOL Intermediate, Inc. and substantially all of the domestic subsidiaries of FTD and is secured by substantially all of the assets of FTD and such subsidiaries, including a pledge of all of the outstanding capital stock owned by FTD and such guarantors (provided that no more than 66% of the capital stock of any foreign subsidiary is pledged or otherwise secures the FTD Credit Agreement). The FTD Credit Agreement contains customary representations and warranties, events of default, affirmative covenants and negative covenants that, among other things, require FTD not to exceed a maximum leverage ratio and to maintain a minimum fixed charge coverage ratio and imposes restrictions and limitations on, among other things, capital expenditures, investments, dividends, asset sales, and the incurrence of additional debt and liens. On the date of the FTD acquisition, term loan A and term loan B under the FTD Credit Agreement were fully funded.
In connection with the closing of the FTD acquisition, all of the approximately $122.1 million of outstanding borrowings under FTD's existing credit facilities were repaid. In addition, FTD, Inc. ("FTDI"), a Delaware corporation and wholly-owned subsidiary of FTD Group, Inc., repurchased approximately $170.0 million aggregate principal amount of its 7.75% Senior Subordinated Notes due 2014 (the "FTDI Notes") tendered pursuant to its offer to repurchase all of the approximately $170.1 million outstanding principal amount of FTDI Notes, which purchased FTDI Notes were canceled. Substantially concurrently with the closing of the FTD acquisition, we effected a covenant defeasance with respect to the balance of the FTDI Notes pursuant to the terms of the indenture governing the FTDI Notes.
76
Our total cash and cash equivalents balance increased by $11.0 million, or 10.5%, to $115.5 million at December 31, 2009, compared to $104.5 million at December 31, 2008. Our summary cash flows for the years ended December 31, 2009, 2008 and 2007 were as follows (in thousands):
| |
Year Ended December 31, | |||||||||
|---|---|---|---|---|---|---|---|---|---|---|
| |
2009 | 2008 | 2007 | |||||||
Net cash provided by operating activities |
$ | 163,526 | $ | 164,049 | $ | 127,225 | ||||
Net cash provided by (used for) investing activities |
$ | (26,160 | ) | $ | (258,586 | ) | $ | 48,526 | ||
Net cash provided by (used for) financing activities |
$ | (128,019 | ) | $ | 51,824 | $ | (45,561 | ) | ||
Year Ended December 31, 2009 compared to Year Ended December 31, 2008
Net cash provided by operating activities decreased by $0.5 million, or 0.3%, for the year ended December 31, 2009 compared to the year ended December 31, 2008. Net cash provided by operating activities is driven by our net income adjusted for non-cash items, including, but not limited to, depreciation and amortization, stock-based compensation, impairment of goodwill, intangible assets and long-lived assets, deferred taxes, tax benefits from equity awards and changes in operating assets and liabilities. The year ended December 31, 2009 includes the results of FTD, which we acquired in August 2008. Net income, adjusted for non-cash items, increased by $26.2 million, or 19%, to $170.5 million. This increase was offset by a $26.7 million decrease in working capital, primarily related to a decrease in deferred revenue in 2009, compared to the prior-year period, resulting from an increase in the number of pay accounts with discounted promotional pricing plans in our Classmates Media segment as well as a reduction in the number of pay accounts with longer-term plans in our Communications segment.
Net cash used for investing activities decreased by $232.4 million, or 89.9%, for the year ended December 31, 2009, compared to the year ended December 31, 2008. The decrease was primarily due to $307.5 million in cash paid for our FTD acquisition in August 2008. The decrease was partially offset by a $68.8 million decrease in net proceeds from sales and maturities of short-term investments for the year ended December 31, 2009, compared to the prior-year period, as a result of our decision to liquidate our short-term investments portfolio in 2008 and a $6.3 million increase in capital expenditures for the year ended December 31, 2009 compared to the year ended December 31, 2008.
Capital expenditures for the year ended December 31, 2009 were $26.2 million. We currently anticipate that our total capital expenditures for 2010 will be in the range of $26 million to $31 million. The actual amount of future capital expenditures may fluctuate due to a number of factors including, without limitation, potential future acquisitions and new business initiatives, which are difficult to predict and which could change significantly over time. Additionally, technological advances may require us to make capital expenditures to develop or acquire new equipment or technology in order to replace aging or technologically obsolete equipment.
Net cash used for financing activities increased by $179.8 million, or 347.0%, for the year ended December 31, 2009, compared to the year ended December 31, 2008. The increase in net cash used for financing activities was primarily due to $422.0 million in net proceeds from the UOL Credit Agreement and the FTD Credit Agreement received for the year ended December 31, 2008, partially offset by a decrease in payments on term loans of $223.6 million for the year ended December 31, 2009, compared to the year ended December 31, 2008. The increase in net cash used for financing activities was also partially offset by a $16.8 million decrease in the payment of dividends resulting from the decrease in our quarterly cash dividend from $0.20 per share of common stock to $0.10 per share of common stock subsequent to the FTD acquisition and a decrease in repurchases of common stock of $2.0 million related to cash paid for employee tax withholding upon vesting of restricted stock units and restricted stock awards and upon the issuance of stock awards.
77
The payment of dividends reduces our cash flows from financing activities. In January, April, July, and October 2009, United Online, Inc.'s Board of Directors declared quarterly cash dividends of $0.10 per share of common stock. The dividends were paid on February 27, May 29, August 31, and November 30, 2009 and totaled $8.8 million, $9.1 million, $9.2 million, and $9.1 million, respectively. In February 2010, United Online, Inc.'s Board of Directors declared a quarterly cash dividend of $0.10 per share of common stock. The record date was February 14, 2010 and the dividend will be paid on February 26, 2010. In January, April and July 2008, United Online, Inc.'s Board of Directors declared quarterly cash dividends of $0.20 per share of common stock. The dividends were paid on February 29, May 30 and August 29, 2008 and totaled $14.6 million, $14.9 million and $14.9 million, respectively. Following the closing of the FTD acquisition, United Online, Inc.'s Board of Directors decreased the cash dividend from $0.20 per share of common stock to $0.10 per share of common stock. In October 2008, United Online, Inc.'s Board of Directors declared a quarterly cash dividend of $0.10 per share of common stock. The dividend was paid on November 28, 2008 and totaled $8.7 million. The payment of future dividends is discretionary and is subject to determination by United Online, Inc.'s Board of Directors each quarter following its review of our financial performance and other factors. In accordance with the terms of the FTD Credit Agreement, cash flows at FTD will, in general, not be available to United Online, Inc. or segments other than the FTD segment. In addition, the UOL Credit Agreement imposes certain limitations on our ability to pay dividends or use cash flows from operations generated by our Communications and Classmates Media segments for the benefit of our FTD segment.
Future cash flows from financing activities may also be affected by our repurchases of our common stock. United Online, Inc.'s Board of Directors authorized a common stock repurchase program (the "program") that allows us to repurchase shares of our common stock through open market or privately negotiated transactions based on prevailing market conditions and other factors through December 31, 2010. From August 2001 through December 31, 2009, we had repurchased a total of $139.2 million of our common stock under the program. We have not repurchased any shares of our common stock under the program since February 2005, and at December 31, 2009, the remaining amount available under the program was $60.8 million. The UOL Credit Agreement imposes certain restrictions on our ability to repurchase shares of our common stock.
Cash flows from financing activities may also be negatively impacted by the withholding of a portion of shares underlying the restricted stock units, restricted stock awards and stock awards we award to employees. We currently do not collect the applicable employee withholding taxes from employees upon vesting of restricted stock units and restricted stock awards and upon the issuance of stock awards. Instead, we automatically withhold, from the restricted stock units that vest and the stock awards that are issued, the portion of those shares with a fair market value equal to the amount of the employee withholding taxes due. We then pay the applicable withholding taxes in cash. The withholding of these shares, although accounted for as a common stock repurchase, does not reduce the amount available under the program. Similar to repurchases of common stock under the program, the net effect of such withholding will adversely impact our cash flows from financing activities. The amounts remitted in the years ended December 31, 2009 and 2008 were $6.8 million and $8.8 million, respectively, for which we withheld 1,066,000 shares and 806,000 shares of common stock, respectively, that were underlying the restricted stock units and restricted stock awards which vested and stock awards that were issued. The amount we pay in future quarters will vary based on our stock price and the number of restricted stock units vesting and stock awards being issued during the quarter.
Based on our current projections, we expect to continue to generate positive cash flows from operations, at least in the next twelve months. We may use our existing cash balances and future cash generated from operations to fund, among other things, both contractual payments and optional prepayments on the outstanding balances under the UOL Credit Agreement and FTD Credit Agreement; dividend payments, if declared by United Online, Inc.'s Board of Directors; the
78
development and/or acquisition of other services, businesses or technologies; the repurchase of our common stock underlying restricted stock units and stock awards to pay the employee withholding taxes due on vested restricted stock units and stock awards issued; the repurchase of our common stock under the program; and future capital expenditures.
Under the terms of the UOL Credit Agreement and the FTD Credit Agreement, there are significant limitations on our ability to use cash flows generated by our Communications and Classmates Media segments for the benefit of the FTD segment and, conversely, there are significant limitations on our ability to use cash flows generated by the FTD segment for the benefit of United Online, Inc. or the Communications and Classmates Media segments. Our credit facilities include provisions which may require us to make debt prepayments in the event that we generate excess cash flow, as defined in the UOL Credit Agreement and the FTD Credit Agreement, on a quarterly or annual basis, respectively. The assessments of future excess cash flow for UOL, excluding FTD, and for FTD on a standalone basis require us to forecast our respective cash flows from operations less certain cash outflows, including, but not limited to, those related to capital expenditures and income taxes. Based on our current projections, under the provisions of our credit facilities, we reasonably expect to make excess cash flow debt prepayments of approximately $11.0 million in the next twelve months. Accordingly, this amount has been classified as a current liability on our consolidated balance sheet at December 31, 2009. The determination of excess cash flow obligations requires us to make significant estimates regarding our cash flows from operations, capital expenditures, income taxes, and other items. Actual results could differ from our current projections and we could be required to pay materially different amounts under the excess cash flow provisions of our credit facilities. The degree to which our assets are leveraged and the terms of our debt could materially and adversely affect our ability to obtain additional capital as well as the terms at which such capital might be offered to us. We currently expect to have sufficient liquidity to fulfill our debt service obligations, at least in the next twelve months. In addition, in 2009, we made voluntary prepayments on the FTD Credit Agreement totaling $57.0 million, eliminating all required payments in 2010. We have not yet determined whether we will make additional voluntary prepayments in 2010.
If we need to raise additional capital through public or private debt or equity financings, strategic relationships or other arrangements, this capital might not be available to us in a timely manner, on acceptable terms, or at all. Our failure to raise sufficient capital when needed could severely constrain or prevent us from, among other factors, developing new or enhancing existing services or products, repurchasing our common stock, acquiring other services, businesses or technologies or funding significant capital expenditures, and have a material adverse effect on our business, financial position, results of operations, and cash flows as well as impair our ability to pay future dividends. If additional funds were raised through the issuance of equity or convertible debt securities, the percentage of stock owned by the then-current stockholders could be reduced. Furthermore, such equity or debt securities that we issue might have rights, preferences or privileges senior to holders of our common stock. In addition, the extreme volatility and disruption in the securities and credit markets may restrict our ability to raise any such additional funds, at least in the near term.
Year Ended December 31, 2008 compared to Year Ended December 31, 2007
Net cash provided by operating activities increased by $36.8 million, or 28.9%, for the year ended December 31, 2008 compared to the year ended December 31, 2007. Net cash provided by operating activities is driven by our net income adjusted for non-cash items, including, but not limited to, depreciation and amortization, stock-based compensation, impairment of goodwill, intangible assets and long-lived assets, deferred taxes, tax benefits from equity awards and changes in operating assets and liabilities. The increase was primarily due to a $176.4 million increase in non-cash items and a $13.7 million favorable change in operating assets and liabilities, partially offset by a $152.4 million increase in net loss.
79
Net cash used for investing activities was $258.6 million for the year ended December 31, 2008, compared to net cash provided by investing activities of $48.5 million for the year ended December 31, 2007. The net increase in cash used for investing activities of $307.1 million was primarily due to the cash paid for the FTD acquisition and a $5.2 million decrease in net proceeds from maturities and sales of short-term investments as a result of the liquidation of our short-term investments portfolio to fund the FTD acquisition. Capital expenditures for the year ended December 31, 2008 were $19.9 million.
Net cash provided by financing activities was $51.8 million for the year ended December 31, 2008, compared to net cash used for financing activities of $45.6 million for the year ended December 31, 2007. The increase in net cash provided by financing activities was primarily related to net proceeds from the UOL Credit Agreement and the FTD Credit Agreement of $422.0 million, partially offset by the repayment of FTD indebtedness of $302.3 million in connection with the closing of the FTD acquisition and payments on the UOL Credit Agreement and FTD Credit Agreement of $11.4 million. In addition, there was a $4.1 million decrease in the payment of dividends resulting from the decrease in our quarterly dividend from $0.20 per share of common stock to $0.10 per share of common stock as discussed below. The increase in net cash provided by financing activities was partially offset by a combined $8.6 million decrease in proceeds from exercises of stock options and proceeds from our employee stock purchase plan; a $3.2 million increase in repurchases of common stock in connection with shares withheld upon vesting of restricted stock awards and restricted stock units to pay applicable employee withholding taxes; and a $2.9 million decrease in excess tax benefits from equity awards. In 2008, prior to the closing of the FTD acquisition, we paid quarterly cash dividends of $0.20 per share of common stock for a total of $44.4 million. Following the closing of the FTD acquisition, United Online, Inc.'s Board of Directors decreased our quarterly cash dividend from $0.20 per share of common stock to $0.10 per share of common stock. For the remaining period in 2008, we paid a quarterly cash dividend of $0.10 per share of common stock for a total of $8.7 million. In 2007, we paid quarterly cash dividends of $0.20 per share of common stock for a total of $57.1 million.
Cash flows from financing activities were also negatively impacted by the withholding of a portion of shares underlying the restricted stock units, restricted stock awards and stock awards we award to employees. We did not collect the applicable employee withholding taxes upon vesting of restricted stock units and restricted stock awards and upon the issuance of stock awards from employees. Instead, we automatically withheld, from the restricted stock units that vested and the stock awards that were issued, the portion of those shares with a fair market value equal to the amount of the employee withholding taxes due. We then paid the applicable withholding taxes in cash. The net effect of such withholding adversely impacted our cash flows from financing activities. The amounts remitted in the years ended December 31, 2008 and 2007 were $8.8 million and $5.6 million, respectively, for which we withheld 806,000 shares and 390,000 shares of common stock, respectively, that were underlying the restricted stock units and restricted stock awards which vested and stock awards that were issued.
80
Contractual Obligations
Contractual obligations at December 31, 2009 were as follows (in thousands):
| |
Total | Less than 1 Year |
1 Year to Less than 3 Years |
3 Years to Less than 5 Years |
More than 5 Years |
||||||||||||
|---|---|---|---|---|---|---|---|---|---|---|---|---|---|---|---|---|---|
Debt, including interest |
$ | 449,339 | $ | 43,611 | $ | 70,234 | $ | 335,494 | $ | — | |||||||
Member redemption liability, long-term |
25,755 | 20,666 | 5,089 | — | — | ||||||||||||
Operating leases(1) |
48,757 | 12,772 | 16,448 | 12,310 | 7,227 | ||||||||||||
Services and promotional contracts |
6,964 | 5,364 | 1,600 | — | — | ||||||||||||
Telecommunications purchases |
989 | 989 | — | — | — | ||||||||||||
Media purchases |
1,838 | 1,838 | — | — | — | ||||||||||||
Floral-related purchases |
3,060 | 2,048 | 875 | 137 | — | ||||||||||||
Other long-term liabilities |
2,943 | 301 | 1,882 | 256 | 504 | ||||||||||||
Total |
$ | 539,645 | $ | 87,589 | $ | 96,128 | $ | 348,197 | $ | 7,731 | |||||||
- (1)
- The operating lease obligations shown in the table have not been reduced by minimum non-cancelable sublease rentals aggregating $0.4 million. We remain secondarily liable under these leases in the event that any sublessee defaults under the sublease terms. We do not believe that material payments will be required as a result of our secondary responsibilities.
At December 31, 2009, we had gross unrealized tax benefits of approximately $9.2 million, all of which, if recognized, would have an impact on our effective income tax rate.
Commitments under standby letters of credit at December 31, 2009 are scheduled to expire as follows (in thousands):
| |
Total | Less than 1 Year |
1 Year to Less than 3 Years |
3 Years to Less than 5 Years |
More than 5 Years |
|||||||||||
|---|---|---|---|---|---|---|---|---|---|---|---|---|---|---|---|---|
Standby letters of credit |
$ | 2,124 | $ | 1,583 | $ | 299 | $ | 242 | $ | — | ||||||
Standby letters of credit are maintained pursuant to certain of our lease arrangements. The standby letters of credit remain in effect at declining levels through the terms of the related leases. In addition, standby letters of credit are maintained by FTD to secure credit card processing activity.
Other Commitments
In the ordinary course of business, we may provide indemnifications of varying scope and terms to customers, vendors, lessors, business partners, and other parties with respect to certain matters, including, but not limited to, losses arising out of our breach of such agreements, services to be provided by us, or from intellectual property infringement claims made by third parties. In addition, we have entered into indemnification agreements with our directors and certain of our officers and employees that will require us, among other things, to indemnify them against certain liabilities that may arise by reason of their status or service as directors, officers or employees. We have also agreed to indemnify certain former officers, directors and employees of acquired companies in connection with the acquisition of such companies. We maintain director and officer insurance, which may cover certain liabilities arising from our obligation to indemnify our directors and certain of our officers and employees, and former officers, directors and employees of acquired companies, in certain circumstances.
It is not possible to determine the maximum potential amount of exposure under these indemnification agreements due to the limited history of prior indemnification claims and the unique
81
facts and circumstances involved in each particular agreement. Such indemnification agreements may not be subject to maximum loss clauses.
Off-Balance Sheet Arrangements
At December 31, 2009, we had no off-balance sheet arrangements that have, or are reasonably likely to have, a current or future material effect on our consolidated financial condition, results of operations, liquidity, capital expenditures, or capital resources.
Recent Accounting Pronouncements
Revenue Recognition—In October 2009, the FASB issued Accounting Standards Update ("ASU") No. 2009-13, Revenue Recognition—Multiple Deliverable Revenue Arrangements, as codified in Accounting Standards Codification ("ASC") 605. This update addresses the accounting for multiple-deliverable arrangements to enable vendors to account for products or services (deliverables) separately rather than as a combined unit. The amendments in this update will be effective prospectively for revenue arrangements entered into or materially modified beginning January 1, 2011. Early adoption is permitted. We are currently evaluating the impact, if any, of this update on our consolidated financial statements.
Software—In October 2009, the FASB issued ASU No. 2009-14, Software—Certain Revenue Arrangements That Include Software Elements, as codified in ASC 985. The amendments in this update change the accounting model for revenue arrangements that include both tangible products and software elements. Tangible products containing software components and non-software components that function together to deliver the tangible product's essential functionality will no longer be within the scope of the software revenue guidance in ASC 985-605, Software—Revenue Recognition. The amendments in this update will be effective prospectively for revenue arrangements entered into or materially modified beginning January 1, 2011. Early adoption is permitted. We are currently evaluating the impact, if any, of this update on our consolidated financial statements.
Fair Value Measurements and Disclosures—In January 2010, the FASB issued ASU No. 2010-06, Fair Value Measurements and Disclosures—Improving Disclosures about Fair Value Measurements, as codified in ASC 820. This update provides amendments to ASC 820, effective January 1, 2010, that will provide more robust disclosures about (i) the different classes of assets and liabilities measured at fair value, (ii) the valuation techniques and inputs used, (iii) the activity in Level 3 fair value measurements, and (4) the transfers between Levels 1, 2, and 3. We do not expect the amendments to ASC 820 to have a material impact on our consolidated financials statements.
Inflation
Inflation did not have a material impact on our consolidated revenues and results of operations during the years ended December 31, 2009, 2008 and 2007, and we do not currently anticipate that inflation will have a material impact on our consolidated revenues and results of operations for year ending December 31, 2010.
82
ITEM 7A. QUANTITATIVE AND QUALITATIVE DISCLOSURES ABOUT MARKET RISK
We are exposed to certain market risks arising from transactions in the normal course of business, principally risk associated with interest rate and foreign currency fluctuations.
Interest Rate Risk
We are exposed to interest rate risk on our cash, cash equivalents, and outstanding balances of the UOL Credit Agreement and the FTD Credit Agreement. The UOL Credit Agreement bears interest at either LIBOR plus 3.50% per annum (with a LIBOR floor of 3.00%) or the prime rate plus 2.00% per annum. The interest rate set forth in the FTD Credit Agreement for loans made under the revolving credit facility and term loan A facility is either LIBOR plus 3.50% per annum (with a LIBOR floor of 3.00%) or the prime rate plus 2.50% per annum, in each case, with step-downs in the interest rate depending on FTD's leverage ratio. The interest rate set forth in the FTD Credit Agreement for loans made under the term loan B facility is either LIBOR plus 4.50% per annum (with a LIBOR floor of 3.00%) or the prime rate plus 3.50% per annum, in each case, with step-downs in the interest rate depending on FTD's leverage ratio. The FTD Credit Agreement also requires that FTD maintain one or more interest rate swap agreements, interest rate cap agreements, interest rate collar agreements, or other similar arrangements to manage risks associated with interest rate fluctuations and exposures on its credit facilities with Wells Fargo Bank, National Association. Accordingly, in November 2008, FTD Group, Inc. entered into a three-year interest rate cap instrument based on LIBOR and a $150 million notional amount of our FTD Credit Agreement. At inception and at December 31, 2008, the interest rate cap instrument was designated as a cash flow hedge against expected future cash flows attributable to future LIBOR interest payments on the outstanding borrowings under the FTD Credit Agreement. However, in January 2009, as economic and capital market conditions continued to deteriorate, we determined that prime rate-based borrowings were more attractive than LIBOR-based borrowings. Therefore, in January 2009, the cash flow hedge was de-designated and cash flow hedge accounting was discontinued prospectively. As a result, subsequent fluctuations in the market value of the interest rate cap are recorded in earnings. For the year ended December 31, 2009, we recorded a $10,000 gain as a result of such fluctuations. A 100 basis point increase in interest rates would result in an annual increase in our interest expense related to our debt of approximately $3.3 million.
Prior to 2009, we had interest rate risk related to our short-term investments portfolio. As a result, we were exposed to the impact of interest rate changes and changes in the market values of our investments. While we do not currently maintain any short-term investments, we still maintain deposits which are classified as cash equivalents. Therefore, our interest income is sensitive to changes in the general level of U.S. and certain foreign interest rates.
In the past, we typically have maintained a short-term investments portfolio consisting, at times, of U.S. commercial paper, U.S. corporate notes, U.S. Government or U.S. Government agencies obligations, and municipal securities, including, prior to 2008, auction rate securities. We have not used derivative financial instruments in our short-term investments portfolio. Our principal objective in managing our short-term investments is the preservation of principal and liquidity, while optimizing yield without significantly increasing risk. The minimum long-term credit rating is A, and if a long-term credit rating is not available, we require a minimum short-term credit rating of A1 and P1. Furthermore, by policy, we limit the amount of credit exposure to any one issuer. Our short-term investments, at times in both fixed-rate and variable-rate interest-earning instruments, carry a degree of interest rate risk. Fixed-rate securities may have their fair market value adversely impacted due to a rise in interest rates, while variable-rate securities may produce less income than expected if interest rates fall. Due in part to these factors, any future investment income may fall short of expectations due to changes in interest rates, or we may suffer losses in principal by selling securities which have declined in market value due to changes in interest rates.
83
Foreign Currency Risk
We transact business in foreign currencies and are exposed to risk resulting from fluctuations in foreign currency exchange rates, particularly the British Pound ("GBP"), the Euro ("EUR"), the Indian Rupee ("INR"), and the Canadian Dollar ("CAD"), which may result in gains or losses reported in our earnings. The volatilities in GBP, EUR, INR, and CAD (and all other applicable foreign currencies) are monitored by us throughout the year. We face two risks related to foreign currency exchange rates—translation risk and transaction risk. Amounts invested in our foreign operations are translated into U.S. Dollars using period-end exchange rates. The resulting translation adjustments are recorded as a component of accumulated other comprehensive income (loss) in stockholders' equity. Revenues and expenses in foreign currencies translate into higher or lower revenues and expenses in U.S. Dollars as the U.S. Dollar weakens or strengthens against other currencies. Substantially all of the revenues of our foreign subsidiaries are received, and substantially all expenses are incurred, in currencies other than the U.S. Dollar, which increases or decreases the related U.S. Dollar reported revenues and expenses depending on the trend in currencies. Therefore, changes in foreign currency exchange rates may negatively affect our consolidated revenues and expenses. A 10% adverse change in overall foreign currency exchange rates over an entire year would result in a reduction of reported annual revenues of approximately $17.1 million and a reduction of reported annual income before income taxes of approximately $2.4 million. These estimates assume an adverse shift in all foreign currency exchange rates against the U.S. Dollar, which do not always move in the same direction or in the same degrees, and actual results may differ materially. Net foreign currency transaction gains or losses arising from transactions denominated in currencies other than the local functional currency are included in other income, net in the consolidated statements of operations.
In the second quarter of 2009, we entered into foreign currency forward contracts to partially offset the economic effect of fluctuations in the U.S. Dollar against the British Pound. These derivatives were intended to minimize the foreign currency exchange rate impact of intercompany dividend payments in British Pounds. Changes in the fair value of these derivatives were recognized in earnings in the period of change. We may in the future also use other hedging programs, including derivative financial instruments commonly utilized, if it is determined that such hedging activities are appropriate to reduce risk. At December 31, 2009, there were no foreign currency forward contracts outstanding.
ITEM 8. FINANCIAL STATEMENTS AND SUPPLEMENTARY DATA
For our Consolidated Financial Statements, Schedule I and Schedule II, see the Index to Consolidated Financial Statements on page F-1.
ITEM 9. CHANGES IN AND DISAGREEMENTS WITH ACCOUNTANTS ON ACCOUNTING AND FINANCIAL DISCLOSURE
None.
ITEM 9A. CONTROLS AND PROCEDURES
Disclosure Controls and Procedures
Our management, with the participation of our Chief Executive Officer and Chief Financial Officer, has evaluated the effectiveness of the Company's disclosure controls and procedures (as such term is defined in Rules 13a-15(e) and 15d-15(e) under the Exchange Act) as of the end of the period covered by this report. Based on such evaluation, our Chief Executive Officer and Chief Financial Officer have concluded that, as of the end of such period, the Company's disclosure controls and procedures are effective in recording, processing, summarizing, and reporting, on a timely basis, information required to be disclosed by the Company in the reports that it files or submits under the
84
Exchange Act and are effective in ensuring that information required to be disclosed by the Company in the reports that it files or submits under the Exchange Act is accumulated and communicated to the Company's management, including the Company's Chief Executive Officer and Chief Financial Officer, as appropriate to allow timely decisions regarding required disclosure.
Management's Report on Internal Control Over Financial Reporting
The Company's management is responsible for establishing and maintaining adequate internal control over financial reporting. The Company's internal control over financial reporting has been designed to provide reasonable assurance regarding the reliability of financial reporting and the preparation of financial statements for external reporting purposes in accordance with accounting principles generally accepted in the United States of America.
The Company's internal control over financial reporting includes policies and procedures that pertain to the maintenance of records that, in reasonable detail, accurately and fairly reflect transactions and dispositions of assets of the Company; provide reasonable assurance that transactions are recorded as necessary to permit preparation of financial statements in accordance with accounting principles generally accepted in the United States of America, and that receipts and expenditures are being made only in accordance with authorization of management and directors of the Company; and provide reasonable assurance regarding prevention or timely detection of unauthorized acquisition, use or disposition of the Company's assets that could have a material effect on the Company's consolidated financial statements.
Because of its inherent limitations, internal control over financial reporting may not prevent or detect misstatements. Also, projections of any evaluation of effectiveness to future periods are subject to the risk that controls may become inadequate because of changes in conditions, or that the degree of compliance with the policies or procedures may deteriorate.
Management assessed the effectiveness of the Company's internal control over financial reporting at December 31, 2009. In making this assessment, management used the criteria set forth by the Committee of Sponsoring Organizations of the Treadway Commission ("COSO") in Internal Control—Integrated Framework. Based on that assessment under those criteria, management has determined that, at December 31, 2009, the Company's internal control over financial reporting was effective.
The Company's internal control over financial reporting at December 31, 2009 has been audited by PricewaterhouseCoopers LLP, an independent registered public accounting firm, as stated in their report which appears herein.
Changes in Internal Control Over Financial Reporting
There have not been any changes in the Company's internal control over financial reporting (as such term is defined in Rules 13a-15(f) and 15d-15(f) under the Exchange Act) during the most recent fiscal quarter that have materially affected, or are reasonably likely to materially affect, the Company's internal control over financial reporting.
None.
85
ITEM 10. DIRECTORS, EXECUTIVE OFFICERS AND CORPORATE GOVERNANCE
The information required by Item 10 is included under the following captions in our definitive proxy statement relating to our 2010 annual meeting of stockholders to be filed with the SEC within 120 days after the end of our fiscal year and is incorporated herein by reference: "Matters to Be Considered at Annual Meeting—Proposal One: Election of Directors"; "Executive Compensation and Other Information"; and "Section 16(a) Beneficial Ownership Reporting Compliance".
ITEM 11. EXECUTIVE COMPENSATION
The information required by Item 11 is included under the following captions in our definitive proxy statement relating to our 2010 annual meeting of stockholders to be filed with the SEC within 120 days after the end of our fiscal year and is incorporated herein by reference: "Compensation Discussion and Analysis"; "Summary Compensation Table"; "Grants of Plan-Based Awards"; "Outstanding Equity Awards at Fiscal Year-End"; "Option Exercises and Stock Vested"; "Director Summary Compensation Table"; "Compensation Committee Interlocks and Insider Participation"; and "Compensation Committee Report".
ITEM 12. SECURITY OWNERSHIP OF CERTAIN BENEFICIAL OWNERS AND MANAGEMENT AND RELATED STOCKHOLDER MATTERS
The information required by Item 12 is included under the following captions in our definitive proxy statement relating to our 2010 annual meeting of stockholders to be filed with the SEC within 120 days after the end of our fiscal year and is incorporated herein by reference: "Equity Compensation Plan Information" and "Ownership of Securities".
ITEM 13. CERTAIN RELATIONSHIPS AND RELATED TRANSACTIONS, AND DIRECTOR INDEPENDENCE
The information required by Item 13 is included under the following captions in our definitive proxy statement relating to our 2010 annual meeting of stockholders to be filed with the SEC within 120 days after the end of our fiscal year and is incorporated herein by reference: "Board Committees and Meetings" and "Related-Party Transactions".
ITEM 14. PRINCIPAL ACCOUNTING FEES AND SERVICES
The information required by Item 14 is included under the caption "Proposal Two: Ratification of Independent Registered Public Accounting Firm" in our definitive proxy statement relating to our 2010 annual meeting of stockholders to be filed with the SEC within 120 days after the end of our fiscal year and is incorporated herein by reference.
86
ITEM 15. EXHIBITS, FINANCIAL STATEMENT SCHEDULES
- (a)
- The following documents are filed as part of this report:
| |
|
|
||
|---|---|---|---|---|
1. |
Consolidated Financial Statements: |
|||
|
Page |
|||
|
Report of Independent Registered Public Accounting Firm |
F-2 | ||
|
Consolidated Balance Sheets |
F-4 | ||
|
Consolidated Statements of Operations |
F-5 | ||
|
Consolidated Statements of Comprehensive Income (Loss) |
F-6 | ||
|
Consolidated Statements of Stockholders' Equity |
F-7 | ||
|
Consolidated Statements of Cash Flows |
F-8 | ||
|
Notes to Consolidated Financial Statements |
F-9 | ||
2. |
Financial Statement Schedules: |
|||
|
Page |
|||
|
Schedule I—Condensed Financial Information of the Registrant |
F-48 | ||
|
Schedule II—Valuation and Qualifying Accounts |
F-52 |
All other schedules have been omitted because the information required to be set forth therein is not applicable, not required or is shown in the consolidated financial statements or notes related thereto.
- 3.
- Exhibits:
The agreements included as exhibits to this Annual Report on Form 10-K contain representations and warranties by each of the parties to the applicable agreement. These representations and warranties have been made solely for the benefit of the other parties to the applicable agreement and:
- •
- should not be treated as categorical statements of fact, but rather as a way of allocating the
risk to one of the parties if those statements prove to be inaccurate;
- •
- may have been qualified in such agreement by disclosures that were made to the other party in
connection with the negotiation of the applicable agreement;
- •
- may apply contract standards of "materiality" that are different from "materiality" under the
applicable securities laws; and
- •
- were made only as of the date of the applicable agreement or such other date or dates as may be specified in the agreement.
The Company acknowledges that, notwithstanding the inclusion of the foregoing cautionary statements, it is responsible for considering whether additional specific disclosures of material information regarding material contractual provisions are required to make the statements in this Form 10-K not misleading.
Additional information about the Company may be found elsewhere in this Annual Report on Form 10-K and in the Company's other public filings, which are available without charge through the SEC's Web site at www.sec.gov.
87
| |
|
|
Incorporated by Reference to | |||||||
|---|---|---|---|---|---|---|---|---|---|---|
| |
|
Filed with this Form 10-K |
||||||||
| No. | Exhibit Description | Form | File No. | Date Filed | ||||||
| 2.1 | Stock Purchase Agreement, dated as of April 9, 2006, by and between United Online, Inc. and UAL Corporation | 8-K | 000-33367 | 4/13/2006 | ||||||
| 2.2 | Agreement and Plan of Merger, dated April 30, 2008, among United Online, Inc., UNOLA Corp. and FTD Group, Inc. | S-4/A | 333-151998 | 7/22/2008 | ||||||
| 2.3 | Amendment No. 1 to Agreement and Plan of Merger, dated July 16, 2008, among United Online, Inc., UNOLA Corp. and FTD Group, Inc. | S-4/A | 333-151998 | 7/22/2008 | ||||||
| 3.1 | Amended and Restated Certificate of Incorporation | 10-K | 000-33367 | 3/1/2007 | ||||||
| 3.2 | Amended and Restated Bylaws | 10-K | 000-33367 | 3/1/2007 | ||||||
| 3.3 | Certificate of Designation for Series A Junior Participating Preferred Stock (included in Exhibit 4.1 below) | 10-K | 000-33367 | 3/1/2007 | ||||||
| 4.1 | Rights Agreement, dated as of November 15, 2001, between the Company and U.S. Stock Transfer Corporation, which includes the form of Certificate of Designation for the Series A junior participating preferred stock as Exhibit A, and the form of Rights Certificate as Exhibit B | 10-K | 000-33367 | 3/1/2007 | ||||||
| 4.2 | Amendment No. 1 to Rights Agreement, dated as of April 29, 2003, between the Registrant and U.S. Stock Transfer Corporation | 10-Q | 000-33367 | 5/1/2003 | ||||||
| 10.1 | Form of Indemnification Agreement | 10-Q | 000-33367 | 11/10/2008 | ||||||
| 10.2 | 2001 Amended and Restated Employee Stock Purchase Plan | 10-Q | 000-33367 | 5/3/2004 | ||||||
| 10.3 | 2001 Stock Incentive Plan | 10-Q | 000-33367 | 8/9/2007 | ||||||
| 10.4 | 2001 Supplemental Stock Incentive Plan | 10-Q | 000-33367 | 8/9/2007 | ||||||
| 10.5 | Classmates Online, Inc. Amended and Restated 1999 Stock Plan | S-8 | 333-121217 | 2/11/2005 | ||||||
| 10.6 | Classmates Online, Inc. 2004 Stock Plan | 10-Q | 000-33367 | 5/10/2005 | ||||||
| 10.7 | FTD Group, Inc. 2005 Equity Incentive Award Plan, Amended and Restated as of October 29, 2008 | 10-Q | 000-33367 | 11/10/2008 | ||||||
| 10.8 | Form of Restricted Stock Unit Issuance Agreement for 2001 Stock Incentive Plan and 2001 Supplemental Stock Incentive Plan | 10-Q | 000-33367 | 8/8/2005 | ||||||
88
| |
|
|
Incorporated by Reference to | |||||||
|---|---|---|---|---|---|---|---|---|---|---|
| |
|
Filed with this Form 10-K |
||||||||
| No. | Exhibit Description | Form | File No. | Date Filed | ||||||
| 10.9 | Form of Restricted Stock Unit Issuance Agreement for 2001 Stock Incentive Plan, 2001 Supplemental Stock Incentive Plan and FTD Group, Inc. 2005 Equity Incentive Award Plan, Amended and Restated as of October 29, 2008 | 10-K | 000-33367 | 2/27/2009 | ||||||
| 10.10 | Form of Restricted Stock Unit Issuance Agreement for 2001 Stock Incentive Plan, 2001 Supplemental Stock Incentive Plan and FTD Group, Inc. 2005 Equity Incentive Award Plan, Amended and Restated as of October 29, 2008 | 10-K | 000-33367 | 2/27/2009 | ||||||
| 10.11 | Form of Restricted Stock Unit Issuance Agreement for 2001 Stock Incentive Plan | 10-Q | 000-33367 | 5/12/2008 | ||||||
| 10.12 | Form of Option Agreement for 2001 Stock Incentive Plan | 10-Q | 000-33367 | 10/27/2004 | ||||||
| 10.13 | Form of Option Agreement for 2001 Supplemental Stock Incentive Plan | 10-Q | 000-33367 | 10/27/2004 | ||||||
| 10.14 | Form of Option Agreement for Classmates Online, Inc. 2004 Stock Plan | 10-Q | 000-33367 | 5/10/2005 | ||||||
| 10.15 | Amended and Restated United Online, Inc. Severance Benefit Plan | X | 000-33367 | 2/23/2010 | ||||||
| 10.16 | Employment Agreement between the Registrant and Mark R. Goldston | 10-Q | 000-33367 | 5/3/2007 | ||||||
| 10.17 | First Amendment to Employment Agreement between the Registrant and Mark R. Goldston | 10-Q | 000-33367 | 10/30/2007 | ||||||
| 10.18 | Amended and Restated Employment Agreement between the Registrant and Mark R. Goldston | 8-K | 000-33367 | 12/30/2008 | ||||||
| 10.19 | Employment Agreement between Classmates Media Corporation and Mark R. Goldston | 10-Q | 000-33367 | 10/30/2007 | ||||||
| 10.20 | Amended and Restated Employment Agreement between Classmates Media Corporation and Mark R. Goldston | 8-K | 000-33367 | 12/30/2008 | ||||||
| 10.21 | Employment Agreement between the Registrant and Jeremy E. Helfand | 10-Q | 000-33367 | 10/30/2007 | ||||||
| 10.22 | First Amendment to Employment Agreement between Registrant and Jeremy E. Helfand | 10-K | 000-33367 | 2/27/2009 | ||||||
| 10.23 | Employment Agreement between the Registrant and Paul E. Jordan | 10-Q | 000-33367 | 10/30/2007 | ||||||
| 10.24 | First Amendment to Employment Agreement between Registrant and Paul E. Jordan | 10-K | 000-33367 | 2/27/2009 | ||||||
| 10.25 | Amended and Restated Employment Agreement between Classmates Online, Inc. and Steven B. McArthur | 10-Q | 000-33367 | 11/10/2008 | ||||||
89
| |
|
|
Incorporated by Reference to | |||||||
|---|---|---|---|---|---|---|---|---|---|---|
| |
|
Filed with this Form 10-K |
||||||||
| No. | Exhibit Description | Form | File No. | Date Filed | ||||||
| 10.26 | First Amendment to Amended and Restated Employment Agreement between Classmates Online, Inc. and Steven B. McArthur | 10-K | 000-33367 | 2/27/2009 | ||||||
| 10.27 | Employment Agreement between the Registrant and Frederic A. Randall, Jr. | 10-Q | 000-33367 | 10/30/2007 | ||||||
| 10.28 | Second Amended and Restated Employment Agreement between the Registrant and Frederic A. Randall, Jr. | 8-K | 000-33367 | 12/30/2008 | ||||||
| 10.29 | First Amendment to Second Amended and Restated Employment Agreement between the Registrant and Frederic A. Randall, Jr. | 8-K | 000-33367 | 08/17/2009 | ||||||
| 10.30 | Employment Agreement between the Registrant and Scott H. Ray | 10-Q | 000-33367 | 10/30/2007 | ||||||
| 10.31 | First Amendment to Employment Agreement between the Registrant and Scott H. Ray | 8-K | 000-33367 | 12/30/2008 | ||||||
| 10.32 | Employment Agreement between the Registrant and Robert J. Taragan | 10-Q | 000-33367 | 10/30/2007 | ||||||
| 10.33 | First Amendment to Employment Agreement between Registrant and Robert J. Taragan | 10-K | 000-33367 | 2/27/2009 | ||||||
| 10.34 | Employment Agreement between the Registrant and Matthew J. Wisk | 10-Q | 000-33367 | 10/30/2007 | ||||||
| 10.35 | First Amendment to Employment Agreement between the Registrant and Matthew J. Wisk | 8-K | 000-33367 | 12/30/2008 | ||||||
| 10.36 | Employment Agreement between FTD Group, Inc. and Robert S. Apatoff | 10-Q | 000-33367 | 11/10/2008 | ||||||
| 10.37 | First Amendment to Employment Agreement between FTD Group, Inc. and Robert S. Apatoff | 10-K | 000-33367 | 2/27/2009 | ||||||
| 10.38 | Employment Agreement between the Registrant and Charles B. Ammann | 10-Q | 000-33367 | 11/6/2009 | ||||||
| 10.39 | Restricted Stock Unit Issuance Agreement(s) Amendment Agreement between United Online, Inc. and Mark R. Goldston | 8-K | 000-33367 | 12/30/2008 | ||||||
| 10.40 | Restricted Stock Unit Issuance Agreement Amendment Agreement between United Online, Inc. and Mark R. Goldston | 8-K | 000-33367 | 12/30/2008 | ||||||
| 10.41 | Restricted Stock Unit Issuance Agreement Amendment Agreement between United Online, Inc. and Scott H. Ray | 8-K | 000-33367 | 12/30/2008 | ||||||
| 10.42 | Restricted Stock Unit Issuance Agreement(s) Amendment Agreement between United Online, Inc. and Frederic A. Randall, Jr. | 8-K | 000-33367 | 12/30/2008 | ||||||
90
| |
|
|
Incorporated by Reference to | |||||||
|---|---|---|---|---|---|---|---|---|---|---|
| |
|
Filed with this Form 10-K |
||||||||
| No. | Exhibit Description | Form | File No. | Date Filed | ||||||
| 10.43 | Restricted Stock Unit Issuance Agreement(s) Amendment Agreement between United Online, Inc. and Matthew J. Wisk | 8-K | 000-33367 | 12/30/2008 | ||||||
| 10.44 | Restricted Stock Unit Issuance Agreement(s) Amendment Agreement between United Online, Inc. and Jeremy E. Helfand | 10-K | 000-33367 | 2/27/2009 | ||||||
| 10.45 | Restricted Stock Unit Issuance Agreement(s) Amendment Agreement between United Online, Inc. and Paul E. Jordan | 10-K | 000-33367 | 2/27/2009 | ||||||
| 10.46 | Restricted Stock Unit Issuance Agreement(s) Amendment Agreement between United Online, Inc. and Robert J. Taragan | 10-K | 000-33367 | 2/27/2009 | ||||||
| 10.47 | United Online, Inc. 2009 Management Bonus Plan | 10-Q | 000-33367 | 5/8/2009 | ||||||
| 10.48 | Office Lease between LNR Warner Center, LLC and NetZero, Inc. | 10-Q | 000-33367 | 5/3/2004 | ||||||
| 10.49 | Commitment Letter, dated April 30, 2008, from Wells Fargo Bank, National Association, to United Online, Inc. | 8-K | 000-33367 | 5/6/2008 | ||||||
| 10.50 | Commitment Letter, dated July 2, 2008, from Silicon Valley Bank to United Online, Inc. | 8-K | 000-33367 | 7/17/2008 | ||||||
| 10.51 | Voting and Support Agreement, dated as of April 30, 2008, by and among Green Equity Investors IV L.P., FTD Co-Investment, LLC and United Online, Inc. | S-4/A | 333-151998 | 7/22/2008 | ||||||
| 10.52 | Credit Agreement, dated as of August 4, 2008, among UNOLA Corp., the financial institutions party thereto from time to time and Wells Fargo Bank, National Association, as sole lead arranger, sole book manager and administrative agent | 8-K/A | 000-33367 | 8/6/2009 | ||||||
| 10.53 | Credit Agreement, dated as of August 11, 2008, among United Online, Inc., the lenders party thereto from time to time and Silicon Valley Bank, as administrative agent | 8-K/A | 000-33367 | 8/6/2009 | ||||||
| 21.1 | List of Subsidiaries | X | 000-33367 | 2/23/2010 | ||||||
| 23.1 | Consent of Independent Registered Public Accounting Firm | X | 000-33367 | 2/23/2010 | ||||||
| 24.1 | Power of Attorney (see signature page of this Annual Report on Form 10-K) | X | 000-33367 | 2/23/2010 | ||||||
| 31.1 | Certification of the Chief Executive Officer pursuant to Section 302 of the Sarbanes-Oxley Act of 2002 | X | 000-33367 | 2/23/2010 | ||||||
91
| |
|
|
Incorporated by Reference to | |||||||
|---|---|---|---|---|---|---|---|---|---|---|
| |
|
Filed with this Form 10-K |
||||||||
| No. | Exhibit Description | Form | File No. | Date Filed | ||||||
| 31.2 | Certification of the Chief Financial Officer pursuant to Section 302 of the Sarbanes-Oxley Act of 2002 | X | 000-33367 | 2/23/2010 | ||||||
| 32.1 | Certification of the Chief Executive Officer pursuant to Section 906 of the Sarbanes-Oxley Act of 2002 | X | 000-33367 | 2/23/2010 | ||||||
| 32.2 | Certification of the Chief Financial Officer pursuant to Section 906 of the Sarbanes-Oxley Act of 2002 | X | 000-33367 | 2/23/2010 | ||||||
- (b)
- Exhibits
The exhibits filed as part of this report are listed in Item 15(a)(3) of this Annual Report on Form 10-K.
- (c)
- Financial Statement Schedules
The financial statement schedules required by Regulation S-X and Item 8 of this Annual Report on Form 10-K are listed in Item 15(a)(2) of this Annual Report on Form 10-K.
92
Pursuant to the requirements of Section 13 of the Securities Exchange Act of 1934, the Registrant has duly caused this report to be signed on its behalf by the undersigned, thereunto duly authorized on February 23, 2010.
| UNITED ONLINE, INC. | |||
By: |
/s/ MARK R. GOLDSTON Mark R. Goldston Chairman, President and Chief Executive Officer |
||
KNOW ALL PERSONS BY THESE PRESENT, that each person whose signature appears below constitutes and appoints Mark R. Goldston and Scott H. Ray, as his or her attorneys-in-fact, each with the power of substitution, for him or her in any and all capacities, to sign any amendment to this Annual Report on Form 10-K, and to file the same, with exhibits thereto and other documents in connection therewith with the Securities and Exchange Commission, hereby ratifying and confirming all that each of said attorneys-in-fact, or his or her substitute or substitutes may do or cause to be done by virtue hereof.
Pursuant to the requirements of the Securities Exchange Act of 1934, this report has been signed below by the following persons on behalf of the Company and in the capacities and on the dates indicated below.
Signature
|
Title
|
Date
|
||
|---|---|---|---|---|
| /s/ MARK R. GOLDSTON Mark R. Goldston |
Chairman, President, Chief Executive Officer and Director (Principal Executive Officer and Director) | February 23, 2010 | ||
/s/ SCOTT H. RAY Scott H. Ray |
Executive Vice President and Chief Financial Officer (Principal Financial Officer) |
February 23, 2010 |
||
/s/ NEIL P. EDWARDS Neil P. Edwards |
Senior Vice President, Finance, Treasurer and Chief Accounting Officer (Principal Accounting Officer) |
February 23, 2010 |
||
/s/ JAMES T. ARMSTRONG James T. Armstrong |
Director |
February 23, 2010 |
||
/s/ ROBERT BERGLASS Robert Berglass |
Director |
February 23, 2010 |
93
Signature
|
Title
|
Date
|
||
|---|---|---|---|---|
| /s/ KENNETH L. COLEMAN Kenneth L. Coleman |
Director | February 23, 2010 | ||
/s/ DENNIS HOLT Dennis Holt |
Director |
February 23, 2010 |
||
/s/ HOWARD G. PHANSTIEL Howard G. Phanstiel |
Director |
February 23, 2010 |
||
/s/ CAROL A. SCOTT Carol A. Scott |
Director |
February 23, 2010 |
94
The agreements included as exhibits to this Annual Report on Form 10-K contain representations and warranties by each of the parties to the applicable agreement. These representations and warranties have been made solely for the benefit of the other parties to the applicable agreement and:
- •
- should not be treated as categorical statements of fact, but rather as a way of allocating the
risk to one of the parties if those statements prove to be inaccurate;
- •
- may have been qualified in such agreement by disclosures that were made to the other party in
connection with the negotiation of the applicable agreement;
- •
- may apply contract standards of "materiality" that are different from "materiality" under the
applicable securities laws; and
- •
- were made only as of the date of the applicable agreement or such other date or dates as may be specified in the agreement.
The Company acknowledges that, notwithstanding the inclusion of the foregoing cautionary statements, it is responsible for considering whether additional specific disclosures of material information regarding material contractual provisions are required to make the statements in this Form 10-K not misleading.
Additional information about the Company may be found elsewhere in this Annual Report on Form 10-K and in the Company's other public filings, which are available without charge through the SEC's Web site at www.sec.gov.
| |
|
|
Incorporated by Reference to | ||||||||
|---|---|---|---|---|---|---|---|---|---|---|---|
| |
|
Filed with this Form 10-K |
|||||||||
| No. | Exhibit Description | Form | File No. | Date Filed | |||||||
| 2.1 | Stock Purchase Agreement, dated as of April 9, 2006, by and between United Online, Inc. and UAL Corporation | 8-K | 000-33367 | 4/13/2006 | |||||||
| 2.2 | Agreement and Plan of Merger, dated April 30, 2008, among United Online, Inc., UNOLA Corp. and FTD Group, Inc. | S-4/A | 333-151998 | 7/22/2008 | |||||||
| 2.3 | Amendment No. 1 to Agreement and Plan of Merger, dated July 16, 2008, among United Online, Inc., UNOLA Corp. and FTD Group, Inc. | S-4/A | 333-151998 | 7/22/2008 | |||||||
| 3.1 | Amended and Restated Certificate of Incorporation | 10-K | 000-33367 | 3/1/2007 | |||||||
| 3.2 | Amended and Restated Bylaws | 10-K | 000-33367 | 3/1/2007 | |||||||
| 3.3 | Certificate of Designation for Series A Junior Participating Preferred Stock (included in Exhibit 4.1 below) | 10-K | 000-33367 | 3/1/2007 | |||||||
| 4.1 | Rights Agreement, dated as of November 15, 2001, between the Company and U.S. Stock Transfer Corporation, which includes the form of Certificate of Designation for the Series A junior participating preferred stock as Exhibit A, and the form of Rights Certificate as Exhibit B | 10-K | 000-33367 | 3/1/2007 | |||||||
| 4.2 | Amendment No. 1 to Rights Agreement, dated as of April 29, 2003, between the Registrant and U.S. Stock Transfer Corporation | 10-Q | 000-33367 | 5/1/2003 | |||||||
95
| |
|
|
Incorporated by Reference to | ||||||||
|---|---|---|---|---|---|---|---|---|---|---|---|
| |
|
Filed with this Form 10-K |
|||||||||
| No. | Exhibit Description | Form | File No. | Date Filed | |||||||
| 10.1 | Form of Indemnification Agreement | 10-Q | 000-33367 | 11/10/2008 | |||||||
| 10.2 | 2001 Amended and Restated Employee Stock Purchase Plan | 10-Q | 000-33367 | 5/3/2004 | |||||||
| 10.3 | 2001 Stock Incentive Plan | 10-Q | 000-33367 | 8/9/2007 | |||||||
| 10.4 | 2001 Supplemental Stock Incentive Plan | 10-Q | 000-33367 | 8/9/2007 | |||||||
| 10.5 | Classmates Online, Inc. Amended and Restated 1999 Stock Plan | S-8 | 333-121217 | 2/11/2005 | |||||||
| 10.6 | Classmates Online, Inc. 2004 Stock Plan | 10-Q | 000-33367 | 5/10/2005 | |||||||
| 10.7 | FTD Group, Inc. 2005 Equity Incentive Award Plan, Amended and Restated as of October 29, 2008 | 10-Q | 000-33367 | 11/10/2008 | |||||||
| 10.8 | Form of Restricted Stock Unit Issuance Agreement for 2001 Stock Incentive Plan and 2001 Supplemental Stock Incentive Plan | 10-Q | 000-33367 | 8/8/2005 | |||||||
| 10.9 | Form of Restricted Stock Unit Issuance Agreement for 2001 Stock Incentive Plan, 2001 Supplemental Stock Incentive Plan and FTD Group, Inc. 2005 Equity Incentive Award Plan, Amended and Restated as of October 29, 2008 | 10-K | 000-33367 | 2/27/2009 | |||||||
| 10.10 | Form of Restricted Stock Unit Issuance Agreement for 2001 Stock Incentive Plan, 2001 Supplemental Stock Incentive Plan and FTD Group, Inc. 2005 Equity Incentive Award Plan, Amended and Restated as of October 29, 2008 | 10-K | 000-33367 | 2/27/2009 | |||||||
| 10.11 | Form of Restricted Stock Unit Issuance Agreement for 2001 Stock Incentive Plan | 10-Q | 000-33367 | 5/12/2008 | |||||||
| 10.12 | Form of Option Agreement for 2001 Stock Incentive Plan | 10-Q | 000-33367 | 10/27/2004 | |||||||
| 10.13 | Form of Option Agreement for 2001 Supplemental Stock Incentive Plan | 10-Q | 000-33367 | 10/27/2004 | |||||||
| 10.14 | Form of Option Agreement for Classmates Online, Inc. 2004 Stock Plan | 10-Q | 000-33367 | 5/10/2005 | |||||||
| 10.15 | Amended and Restated United Online, Inc. Severance Benefit Plan | X | 000-33367 | 2/23/2010 | |||||||
| 10.16 | Employment Agreement between the Registrant and Mark R. Goldston | 10-Q | 000-33367 | 5/3/2007 | |||||||
| 10.17 | First Amendment to Employment Agreement between the Registrant and Mark R. Goldston | 10-Q | 000-33367 | 10/30/2007 | |||||||
| 10.18 | Amended and Restated Employment Agreement between the Registrant and Mark R. Goldston | 8-K | 000-33367 | 12/30/2008 | |||||||
| 10.19 | Employment Agreement between Classmates Media Corporation and Mark R. Goldston | 10-Q | 000-33367 | 10/30/2007 | |||||||
96
| |
|
|
Incorporated by Reference to | ||||||||
|---|---|---|---|---|---|---|---|---|---|---|---|
| |
|
Filed with this Form 10-K |
|||||||||
| No. | Exhibit Description | Form | File No. | Date Filed | |||||||
| 10.20 | Amended and Restated Employment Agreement between Classmates Media Corporation and Mark R. Goldston | 8-K | 000-33367 | 12/30/2008 | |||||||
| 10.21 | Employment Agreement between the Registrant and Jeremy E. Helfand | 10-Q | 000-33367 | 10/30/2007 | |||||||
| 10.22 | First Amendment to Employment Agreement between Registrant and Jeremy E. Helfand | 10-K | 000-33367 | 2/27/2009 | |||||||
| 10.23 | Employment Agreement between the Registrant and Paul E. Jordan | 10-Q | 000-33367 | 10/30/2007 | |||||||
| 10.24 | First Amendment to Employment Agreement between Registrant and Paul E. Jordan | 10-K | 000-33367 | 2/27/2009 | |||||||
| 10.25 | Amended and Restated Employment Agreement between Classmates Online, Inc. and Steven B. McArthur | 10-Q | 000-33367 | 11/10/2008 | |||||||
| 10.26 | First Amendment to Amended and Restated Employment Agreement between Classmates Online, Inc. and Steven B. McArthur | 10-K | 000-33367 | 2/27/2009 | |||||||
| 10.27 | Employment Agreement between the Registrant and Frederic A. Randall, Jr. | 10-Q | 000-33367 | 10/30/2007 | |||||||
| 10.28 | Second Amended and Restated Employment Agreement between the Registrant and Frederic A. Randall, Jr. | 8-K | 000-33367 | 12/30/2008 | |||||||
| 10.29 | First Amendment to Second Amended and Restated Employment Agreement between the Registrant and Frederic A. Randall, Jr. | 8-K | 000-33367 | 08/17/2009 | |||||||
| 10.30 | Employment Agreement between the Registrant and Scott H. Ray | 10-Q | 000-33367 | 10/30/2007 | |||||||
| 10.31 | First Amendment to Employment Agreement between the Registrant and Scott H. Ray | 8-K | 000-33367 | 12/30/2008 | |||||||
| 10.32 | Employment Agreement between the Registrant and Robert J. Taragan | 10-Q | 000-33367 | 10/30/2007 | |||||||
| 10.33 | First Amendment to Employment Agreement between Registrant and Robert J. Taragan | 10-K | 000-33367 | 2/27/2009 | |||||||
| 10.34 | Employment Agreement between the Registrant and Matthew J. Wisk | 10-Q | 000-33367 | 10/30/2007 | |||||||
| 10.35 | First Amendment to Employment Agreement between the Registrant and Matthew J. Wisk | 8-K | 000-33367 | 12/30/2008 | |||||||
| 10.36 | Employment Agreement between FTD Group, Inc. and Robert S. Apatoff | 10-Q | 000-33367 | 11/10/2008 | |||||||
| 10.37 | First Amendment to Employment Agreement between FTD Group, Inc. and Robert S. Apatoff | 10-K | 000-33367 | 2/27/2009 | |||||||
97
| |
|
|
Incorporated by Reference to | ||||||||
|---|---|---|---|---|---|---|---|---|---|---|---|
| |
|
Filed with this Form 10-K |
|||||||||
| No. | Exhibit Description | Form | File No. | Date Filed | |||||||
| 10.38 | Employment Agreement between the Registrant and Charles B. Ammann | 10-Q | 000-33367 | 11/6/2009 | |||||||
| 10.39 | Restricted Stock Unit Issuance Agreement(s) Amendment Agreement between United Online, Inc. and Mark R. Goldston | 8-K | 000-33367 | 12/30/2008 | |||||||
| 10.40 | Restricted Stock Unit Issuance Agreement Amendment Agreement between United Online, Inc. and Mark R. Goldston | 8-K | 000-33367 | 12/30/2008 | |||||||
| 10.41 | Restricted Stock Unit Issuance Agreement Amendment Agreement between United Online, Inc. and Scott H. Ray | 8-K | 000-33367 | 12/30/2008 | |||||||
| 10.42 | Restricted Stock Unit Issuance Agreement(s) Amendment Agreement between United Online, Inc. and Frederic A. Randall, Jr. | 8-K | 000-33367 | 12/30/2008 | |||||||
| 10.43 | Restricted Stock Unit Issuance Agreement(s) Amendment Agreement between United Online, Inc. and Matthew J. Wisk | 8-K | 000-33367 | 12/30/2008 | |||||||
| 10.44 | Restricted Stock Unit Issuance Agreement(s) Amendment Agreement between United Online, Inc. and Jeremy E. Helfand | 10-K | 000-33367 | 2/27/2009 | |||||||
| 10.45 | Restricted Stock Unit Issuance Agreement(s) Amendment Agreement between United Online, Inc. and Paul E. Jordan | 10-K | 000-33367 | 2/27/2009 | |||||||
| 10.46 | Restricted Stock Unit Issuance Agreement(s) Amendment Agreement between United Online, Inc. and Robert J. Taragan | 10-K | 000-33367 | 2/27/2009 | |||||||
| 10.47 | United Online, Inc. 2009 Management Bonus Plan | 10-Q | 000-33367 | 5/8/2009 | |||||||
| 10.48 | Office Lease between LNR Warner Center, LLC and NetZero, Inc. | 10-Q | 000-33367 | 5/3/2004 | |||||||
| 10.49 | Commitment Letter, dated April 30, 2008, from Wells Fargo Bank, National Association, to United Online, Inc. | 8-K | 000-33367 | 5/6/2008 | |||||||
| 10.50 | Commitment Letter, dated July 2, 2008, from Silicon Valley Bank to United Online, Inc. | 8-K | 000-33367 | 7/17/2008 | |||||||
| 10.51 | Voting and Support Agreement, dated as of April 30, 2008, by and among Green Equity Investors IV L.P., FTD Co-Investment, LLC and United Online, Inc. | S-4/A | 333-151998 | 7/22/2008 | |||||||
| 10.52 | Credit Agreement, dated as of August 4, 2008, among UNOLA Corp., the financial institutions party thereto from time to time and Wells Fargo Bank, National Association, as sole lead arranger, sole book manager and administrative agent | 8-K/A | 000-33367 | 8/6/2009 | |||||||
98
| |
|
|
Incorporated by Reference to | ||||||||
|---|---|---|---|---|---|---|---|---|---|---|---|
| |
|
Filed with this Form 10-K |
|||||||||
| No. | Exhibit Description | Form | File No. | Date Filed | |||||||
| 10.53 | Credit Agreement, dated as of August 11, 2008, among United Online, Inc., the lenders party thereto from time to time and Silicon Valley Bank, as administrative agent | 8-K/A | 000-33367 | 8/6/2009 | |||||||
| 21.1 | List of Subsidiaries | X | 000-33367 | 2/23/2010 | |||||||
| 23.1 | Consent of Independent Registered Public Accounting Firm | X | 000-33367 | 2/23/2010 | |||||||
| 24.1 | Power of Attorney (see signature page of this Annual Report on Form 10-K) | X | 000-33367 | 2/23/2010 | |||||||
| 31.1 | Certification of the Chief Executive Officer pursuant to Section 302 of the Sarbanes-Oxley Act of 2002 | X | 000-33367 | 2/23/2010 | |||||||
| 31.2 | Certification of the Chief Financial Officer pursuant to Section 302 of the Sarbanes-Oxley Act of 2002 | X | 000-33367 | 2/23/2010 | |||||||
| 32.1 | Certification of the Chief Executive Officer pursuant to Section 906 of the Sarbanes-Oxley Act of 2002 | X | 000-33367 | 2/23/2010 | |||||||
| 32.2 | Certification of the Chief Financial Officer pursuant to Section 906 of the Sarbanes-Oxley Act of 2002 | X | 000-33367 | 2/23/2010 | |||||||
99
UNITED ONLINE, INC.
INDEX TO CONSOLIDATED FINANCIAL STATEMENTS
F-1
Report of Independent Registered Public Accounting Firm
To Board of Directors and Stockholders of United Online, Inc.:
In our opinion, the consolidated financial statements listed in the index appearing under Item 15(a)(1) present fairly, in all material respects, the financial position of United Online, Inc. and its subsidiaries at December 31, 2009 and 2008, and the results of their operations and their cash flows for each of the three years in the period ended December 31, 2009 in conformity with accounting principles generally accepted in the United States of America. In addition, in our opinion, the financial statement schedules listed in the index appearing under Item 15(a)(2) present fairly, in all material respects, the information set forth therein when read in conjunction with the related consolidated financial statements. Also in our opinion, the Company maintained, in all material respects, effective internal control over financial reporting as of December 31, 2009, based on criteria established in Internal Control—Integrated Framework issued by the Committee of Sponsoring Organizations of the Treadway Commission (COSO). The Company's management is responsible for these financial statements and financial statement schedules, for maintaining effective internal control over financial reporting and for its assessment of the effectiveness of internal control over financial reporting, included in Management's Report on Internal Control over Financial Reporting appearing under Item 9A. Our responsibility is to express opinions on these financial statements, on the financial statement schedules, and on the Company's internal control over financial reporting based on our integrated audits. We conducted our audits in accordance with the standards of the Public Company Accounting Oversight Board (United States). Those standards require that we plan and perform the audits to obtain reasonable assurance about whether the financial statements are free of material misstatement and whether effective internal control over financial reporting was maintained in all material respects. Our audits of the financial statements included examining, on a test basis, evidence supporting the amounts and disclosures in the financial statements, assessing the accounting principles used and significant estimates made by management, and evaluating the overall financial statement presentation. Our audit of internal control over financial reporting included obtaining an understanding of internal control over financial reporting, assessing the risk that a material weakness exists, and testing and evaluating the design and operating effectiveness of internal control based on the assessed risk. Our audits also included performing such other procedures as we considered necessary in the circumstances. We believe that our audits provide a reasonable basis for our opinions.
As discussed in Notes 1 and 11 to the consolidated financial statements, the Company changed the manner in which it allocates net income to certain participating securities. This change impacted earnings per common share for all periods presented.
A company's internal control over financial reporting is a process designed to provide reasonable assurance regarding the reliability of financial reporting and the preparation of financial statements for external purposes in accordance with generally accepted accounting principles. A company's internal control over financial reporting includes those policies and procedures that (i) pertain to the maintenance of records that, in reasonable detail, accurately and fairly reflect the transactions and dispositions of the assets of the company; (ii) provide reasonable assurance that transactions are recorded as necessary to permit preparation of financial statements in accordance with generally accepted accounting principles, and that receipts and expenditures of the company are being made only in accordance with authorizations of management and directors of the company; and (iii) provide reasonable assurance regarding prevention or timely detection of unauthorized acquisition, use, or disposition of the company's assets that could have a material effect on the financial statements.
F-2
Because of its inherent limitations, internal control over financial reporting may not prevent or detect misstatements. Also, projections of any evaluation of effectiveness to future periods are subject to the risk that controls may become inadequate because of changes in conditions, or that the degree of compliance with the policies or procedures may deteriorate.
/s/
PRICEWATERHOUSECOOPERS LLP
Los Angeles, California
February 23, 2010
F-3
UNITED ONLINE, INC.
CONSOLIDATED BALANCE SHEETS
(in thousands, except per share amounts)
| |
December 31, | ||||||||
|---|---|---|---|---|---|---|---|---|---|
| |
2009 | 2008 | |||||||
Assets |
|||||||||
Current assets: |
|||||||||
Cash and cash equivalents |
$ | 115,509 | $ | 104,514 | |||||
Accounts receivable, net of allowance for doubtful accounts of $8,777 and $4,327 at December 31, 2009 and 2008, respectively |
55,874 | 58,901 | |||||||
Deferred tax assets, net |
15,797 | 16,170 | |||||||
Other current assets |
25,599 | 30,970 | |||||||
Total current assets |
212,779 | 210,555 | |||||||
Property and equipment, net |
63,547 | 61,822 | |||||||
Goodwill |
464,151 | 459,348 | |||||||
Intangible assets, net |
292,520 | 320,236 | |||||||
Other assets |
16,937 | 21,566 | |||||||
Total assets |
$ | 1,049,934 | $ | 1,073,527 | |||||
Liabilities and Stockholders' Equity |
|||||||||
Current liabilities: |
|||||||||
Accounts payable |
$ | 71,668 | $ | 83,372 | |||||
Accrued liabilities |
50,428 | 43,148 | |||||||
Member redemption liability |
20,666 | 20,745 | |||||||
Deferred revenue |
74,294 | 78,498 | |||||||
Long-term debt |
24,383 | 22,219 | |||||||
Total current liabilities |
241,439 | 247,982 | |||||||
Member redemption liability |
5,089 | 5,231 | |||||||
Deferred revenue |
3,340 | 4,763 | |||||||
Long-term debt, net of discounts |
304,563 | 391,258 | |||||||
Deferred tax liabilities, net |
44,788 | 60,834 | |||||||
Other liabilities |
18,064 | 19,342 | |||||||
Total liabilities |
617,283 | 729,410 | |||||||
Commitments and contingencies (see Note 15) |
|||||||||
Stockholders' equity: |
|||||||||
Preferred stock, $0.0001 par value; 5,000 shares authorized; no shares issued or outstanding at December 31, 2009 and 2008 |
— | — | |||||||
Common stock, $0.0001 par value; 300,000 shares authorized; 84,958 and 82,107 shares issued and outstanding at December 31, 2009 and 2008, respectively |
8 | 8 | |||||||
Additional paid-in capital |
518,580 | 520,187 | |||||||
Accumulated other comprehensive loss |
(26,963 | ) | (47,019 | ) | |||||
Accumulated deficit |
(58,974 | ) | (129,059 | ) | |||||
Total stockholders' equity |
432,651 | 344,117 | |||||||
Total liabilities and stockholders' equity |
$ | 1,049,934 | $ | 1,073,527 | |||||
The accompanying notes are an integral part of these consolidated financial statements.
F-4
UNITED ONLINE, INC.
CONSOLIDATED STATEMENTS OF OPERATIONS
(in thousands, except per share amounts)
| |
Year Ended December 31, | |||||||||||
|---|---|---|---|---|---|---|---|---|---|---|---|---|
| |
2009 | 2008 | 2007 | |||||||||
Revenues: |
||||||||||||
Services |
$ | 576,005 | $ | 536,420 | $ | 513,503 | ||||||
Products |
414,127 | 132,983 | — | |||||||||
Total revenues |
990,132 | 669,403 | 513,503 | |||||||||
Operating expenses: |
||||||||||||
Cost of revenues-services |
112,543 | 114,816 | 117,203 | |||||||||
Cost of revenues-products |
304,868 | 100,069 | — | |||||||||
Sales and marketing |
202,871 | 173,042 | 163,424 | |||||||||
Technology and development |
65,215 | 56,715 | 51,044 | |||||||||
General and administrative |
121,677 | 92,219 | 73,312 | |||||||||
Amortization of intangible assets |
34,844 | 18,415 | 12,800 | |||||||||
Restructuring charges |
2,121 | 656 | 3,419 | |||||||||
Impairment of goodwill, intangible assets and long-lived assets |
— | 176,150 | — | |||||||||
Total operating expenses |
844,139 | 732,082 | 421,202 | |||||||||
Operating income (loss) |
145,993 | (62,679 | ) | 92,301 | ||||||||
Interest income |
1,545 | 4,527 | 7,141 | |||||||||
Interest expense |
(33,524 | ) | (13,170 | ) | (3 | ) | ||||||
Other income (expense), net |
4,215 | (48 | ) | (747 | ) | |||||||
Income (loss) before income taxes |
118,229 | (71,370 | ) | 98,692 | ||||||||
Provision for income taxes |
48,144 | 23,287 | 40,915 | |||||||||
Net income (loss) |
$ | 70,085 | $ | (94,657 | ) | $ | 57,777 | |||||
Income allocated to participating securities |
(4,647 | ) | (3,065 | ) | (3,079 | ) | ||||||
Net income (loss) applicable to common stockholders |
$ | 65,438 | $ | (97,722 | ) | $ | 54,698 | |||||
Basic net income (loss) per common share |
$ | 0.78 | $ | (1.33 | ) | $ | 0.82 | |||||
Shares used to calculate basic net income (loss) per common share |
83,698 | 73,236 | 66,768 | |||||||||
Diluted net income (loss) per common share |
$ | 0.78 | $ | (1.33 | ) | $ | 0.81 | |||||
Shares used to calculate diluted net income (loss) per common share |
84,386 | 73,236 | 67,834 | |||||||||
The accompanying notes are an integral part of these consolidated financial statements.
F-5
UNITED ONLINE, INC.
CONSOLIDATED STATEMENTS OF COMPREHENSIVE INCOME (LOSS)
(in thousands)
| |
Year Ended December 31, | ||||||||||
|---|---|---|---|---|---|---|---|---|---|---|---|
| |
2009 | 2008 | 2007 | ||||||||
Net income (loss) |
$ | 70,085 | $ | (94,657 | ) | $ | 57,777 | ||||
Change in unrealized gain (loss) on short-term investments, net of tax of $0, $(102) and $184 for the years ended December 31, 2009, 2008 and 2007, respectively |
— | (157 | ) | 285 | |||||||
Change in unrealized gain (loss) on derivative, net of tax of $0, $(155) and $0 for the years ended December 31, 2009, 2008 and 2007, respectively |
— | (242 | ) | — | |||||||
Foreign currency translation |
20,056 | (46,802 | ) | 142 | |||||||
Comprehensive income (loss) |
$ | 90,141 | $ | (141,858 | ) | $ | 58,204 | ||||
The accompanying notes are an integral part of these consolidated financial statements.
F-6
UNITED ONLINE, INC.
CONSOLIDATED STATEMENTS OF STOCKHOLDERS' EQUITY
(in thousands)
| |
Common Stock | |
Accumulated Other Comprehensive Income (Loss) |
|
|
|||||||||||||||
|---|---|---|---|---|---|---|---|---|---|---|---|---|---|---|---|---|---|---|---|---|
| |
Additional Paid-In Capital |
Accumulated Deficit |
Total Stockholders' Equity |
|||||||||||||||||
| |
Shares | Amount | ||||||||||||||||||
Balance at January 1, 2007 |
65,805 | $ | 7 | $ | 439,383 | $ | (245 | ) | $ | (92,179 | ) | $ | 346,966 | |||||||
Exercises of stock options |
1,068 | — | 8,605 | — | — | 8,605 | ||||||||||||||
Issuance of common stock through employee stock purchase plan |
583 | — | 5,413 | — | — | 5,413 | ||||||||||||||
Vesting of restricted stock units |
688 | — | — | — | — | — | ||||||||||||||
Repurchases of common stock |
— | — | (5,601 | ) | — | — | (5,601 | ) | ||||||||||||
Repurchase of forfeited restricted stock |
(125 | ) | — | — | — | — | — | |||||||||||||
Dividends paid on shares outstanding and restricted stock units |
— | — | (57,130 | ) | — | — | (57,130 | ) | ||||||||||||
Stock-based compensation |
— | — | 19,549 | — | — | 19,549 | ||||||||||||||
Change in unrealized gain on short-term investments, net of tax |
— | — | — | 285 | — | 285 | ||||||||||||||
Foreign currency translation |
— | — | — | 142 | — | 142 | ||||||||||||||
Tax benefits from equity awards |
— | — | 4,622 | — | — | 4,622 | ||||||||||||||
Net income |
— | — | — | — | 57,777 | 57,777 | ||||||||||||||
Balance at December 31, 2007 |
68,019 | 7 | 414,841 | 182 | (34,402 | ) | 380,628 | |||||||||||||
Exercises of stock options |
220 | — | 1,668 | — | — | 1,668 | ||||||||||||||
Issuance of common stock through employee stock purchase plan |
471 | — | 3,754 | — | — | 3,754 | ||||||||||||||
Vesting of restricted stock units |
1,137 | — | — | — | — | — | ||||||||||||||
Repurchases of common stock |
— | — | (8,841 | ) | — | — | (8,841 | ) | ||||||||||||
Issuance of common stock in connection with acquisition |
12,260 | 1 | 126,150 | — | — | 126,151 | ||||||||||||||
Dividends paid on shares outstanding and restricted stock units |
— | — | (53,060 | ) | — | — | (53,060 | ) | ||||||||||||
Dividends payable on restricted stock units |
— | — | (385 | ) | — | — | (385 | ) | ||||||||||||
Stock-based compensation |
— | — | 36,527 | — | — | 36,527 | ||||||||||||||
Change in unrealized loss on short-term investments, net of tax |
— | — | — | (157 | ) | — | (157 | ) | ||||||||||||
Change in unrealized loss on interest rate cap, net of tax |
— | — | — | (242 | ) | — | (242 | ) | ||||||||||||
Foreign currency translation |
— | — | — | (46,802 | ) | — | (46,802 | ) | ||||||||||||
Tax shortfalls from equity awards |
— | — | (467 | ) | — | — | (467 | ) | ||||||||||||
Net loss |
— | — | — | — | (94,657 | ) | (94,657 | ) | ||||||||||||
Balance at December 31, 2008 |
82,107 | 8 | 520,187 | (47,019 | ) | (129,059 | ) | 344,117 | ||||||||||||
Exercises of stock options |
120 | — | 546 | — | — | 546 | ||||||||||||||
Issuance of common stock through employee stock purchase plan |
907 | — | 4,069 | — | — | 4,069 | ||||||||||||||
Vesting of restricted stock units |
1,824 | — | — | — | — | — | ||||||||||||||
Repurchases of common stock |
— | — | (6,842 | ) | — | — | (6,842 | ) | ||||||||||||
Dividends paid on shares outstanding and restricted stock units |
— | — | (36,257 | ) | — | — | (36,257 | ) | ||||||||||||
Dividends payable on restricted stock units |
— | — | (207 | ) | — | — | (207 | ) | ||||||||||||
Stock-based compensation |
— | — | 40,080 | — | — | 40,080 | ||||||||||||||
Foreign currency translation |
— | — | — | 20,056 | — | 20,056 | ||||||||||||||
Tax shortfalls from equity awards |
— | — | (2,996 | ) | — | — | (2,996 | ) | ||||||||||||
Net income |
— | — | — | — | 70,085 | 70,085 | ||||||||||||||
Balance at December 31, 2009 |
84,958 | $ | 8 | $ | 518,580 | $ | (26,963 | ) | $ | (58,974 | ) | $ | 432,651 | |||||||
The accompanying notes are an integral part of these consolidated financial statements.
F-7
UNITED ONLINE, INC.
CONSOLIDATED STATEMENTS OF CASH FLOWS
(in thousands)
| |
Year Ended December 31, | ||||||||||||
|---|---|---|---|---|---|---|---|---|---|---|---|---|---|
| |
2009 | 2008 | 2007 | ||||||||||
Cash flows from operating activities: |
|||||||||||||
Net income (loss) |
$ | 70,085 | $ | (94,657 | ) | $ | 57,777 | ||||||
Adjustments to reconcile net income to net cash provided by operating activities: |
|||||||||||||
Depreciation and amortization |
59,673 | 39,773 | 32,950 | ||||||||||
Stock-based compensation |
40,080 | 36,527 | 19,549 | ||||||||||
Provision for doubtful accounts receivable |
6,481 | 2,322 | 1,323 | ||||||||||
Impairment of goodwill, intangible assets and long-lived assets |
— | 176,150 | — | ||||||||||
Accretion of discounts and amortization of debt issue costs |
6,179 | 1,470 | — | ||||||||||
Deferred taxes, net |
(8,902 | ) | (16,557 | ) | 7,248 | ||||||||
Tax benefits (shortfalls) from equity awards |
(2,996 | ) | (467 | ) | 4,622 | ||||||||
Excess tax benefits from equity awards |
(584 | ) | (295 | ) | (3,168 | ) | |||||||
Other |
474 | 15 | 929 | ||||||||||
Changes in operating assets and liabilities (net of effects of acquisitions): |
|||||||||||||
Accounts receivable |
(3,073 | ) | 1,242 | 2,138 | |||||||||
Other assets |
9,258 | 4,194 | (9,018 | ) | |||||||||
Accounts payable and accrued liabilities |
(6,496 | ) | (2,688 | ) | (9,025 | ) | |||||||
Member redemption liability |
(220 | ) | 1,415 | 4,572 | |||||||||
Deferred revenue |
(4,475 | ) | 12,201 | 11,430 | |||||||||
Other liabilities |
(1,958 | ) | 3,404 | 5,898 | |||||||||
Net cash provided by operating activities |
163,526 | 164,049 | 127,225 | ||||||||||
Cash flows from investing activities: |
|||||||||||||
Purchases of property and equipment |
(26,196 | ) | (19,886 | ) | (25,509 | ) | |||||||
Purchases of short-term investments |
— | (120,378 | ) | (228,920 | ) | ||||||||
Proceeds from maturities of short-term investments |
— | 82,765 | 72,890 | ||||||||||
Proceeds from sales of short-term investments |
— | 106,364 | 229,994 | ||||||||||
Cash paid for acquisitions, net of cash acquired |
— | (307,496 | ) | — | |||||||||
Proceeds from sales of assets, net |
36 | 45 | 71 | ||||||||||
Net cash provided by (used for) investing activities |
(26,160 | ) | (258,586 | ) | 48,526 | ||||||||
Cash flows from financing activities: |
|||||||||||||
Proceeds from term loans and revolver |
— | 421,988 | — | ||||||||||
Payments on term loans and revolver |
(90,119 | ) | (313,718 | ) | — | ||||||||
Payments on capital leases |
— | (13 | ) | (16 | ) | ||||||||
Payments for debt issue costs |
— | (249 | ) | — | |||||||||
Proceeds from exercises of stock options |
546 | 1,668 | 8,605 | ||||||||||
Proceeds from employee stock purchase plan |
4,069 | 3,754 | 5,413 | ||||||||||
Repurchases of common stock |
(6,842 | ) | (8,841 | ) | (5,601 | ) | |||||||
Payments for dividends |
(36,257 | ) | (53,060 | ) | (57,130 | ) | |||||||
Excess tax benefits from equity awards |
584 | 295 | 3,168 | ||||||||||
Net cash provided by (used for) financing activities |
(128,019 | ) | 51,824 | (45,561 | ) | ||||||||
Effect of foreign currency exchange rate changes on cash and cash equivalents |
1,648 | (2,280 | ) | 65 | |||||||||
Change in cash and cash equivalents |
10,995 | (44,993 | ) | 130,255 | |||||||||
Cash and cash equivalents, beginning of period |
104,514 | 149,507 | 19,252 | ||||||||||
Cash and cash equivalents, end of period |
$ | 115,509 | $ | 104,514 | $ | 149,507 | |||||||
Supplemental disclosure of cash flows: |
|||||||||||||
Cash paid for interest |
$ | 29,204 | $ | 9,587 | $ | 2 | |||||||
Cash paid for income taxes |
$ | 53,228 | $ | 36,350 | $ | 34,855 | |||||||
Supplemental disclosure of non-cash investing and financing activities: |
|||||||||||||
Reduction in goodwill in connection with a release of a portion of the valuation allowance for deferred tax assets |
$ | — | $ | 128 | $ | 375 | |||||||
Dividends payable on restricted stock units |
$ | 207 | $ | 385 | $ | — | |||||||
Issuance of common stock in connection with the acquisition of FTD (see Note 13) |
$ | — | $ | 126,151 | $ | — | |||||||
The accompanying notes are an integral part of these consolidated financial statements.
F-8
UNITED ONLINE, INC.
NOTES TO CONSOLIDATED FINANCIAL STATEMENTS
1. DESCRIPTION OF BUSINESS, BASIS OF PRESENTATION, ACCOUNTING POLICIES, AND RECENT ACCOUNTING PRONOUNCEMENTS
Description of Business
United Online, Inc. (together with its subsidiaries, "United Online", "UOL" or the "Company") is a leading provider of consumer products and services over the Internet through a number of brands, including FTD, Interflora, Classmates, NetZero, and MyPoints. On August 26, 2008, the Company completed its acquisition of 100% of the capital stock of FTD Group, Inc. (together with its subsidiaries, "FTD"). The Company reports its business in three reportable segments: FTD, Classmates Media and Communications. The Company's FTD segment provides floral and related products and services to consumers and retail florists, as well as to other retail locations offering floral and related products and services. The Company's Classmates Media services are online social networking and online loyalty marketing. The Company's primary Communications services are Internet access and email. On a combined basis, the Company's Web properties attract a significant number of Internet users and the Company offers a broad array of Internet marketing services for advertisers.
United Online, Inc. is a Delaware corporation that commenced operations in 2001 following the merger of Internet access providers NetZero, Inc. and Juno Online Services, Inc. In April 2004, the Company acquired the Web hosting and domain name registration business of About Web Services, Inc. (now known as United Online Web Services, Inc.), and in November 2004, the Company acquired Classmates Online, Inc. ("Classmates"), a leading provider of online social networking services. In March 2006, the Company acquired The Names Database, a global online social networking service. In April 2006, the Company acquired MyPoints.com, Inc. ("MyPoints"), a leading provider of online loyalty marketing services. In August 2008, the Company acquired FTD, a leading provider of floral and related products and services under the FTD and Interflora brands. The Company's corporate headquarters are located in Woodland Hills, California, and the Company also maintains offices in Fort Lee, New Jersey; Seattle, Washington; San Francisco, California; Schaumburg, Illinois; Downers Grove, Illinois; Sleaford, England; Erlangen, Germany; Berlin, Germany; and Hyderabad, India.
The Company believes that its existing cash and cash equivalents, and cash generated from operations will be sufficient to service its debt obligations and fund its working capital requirements, capital expenditures, dividend payments, and other obligations through at least the next twelve months.
Basis of Presentation
The accompanying consolidated financial statements for the years ended December 31, 2009, 2008 and 2007 include United Online, Inc. and its subsidiaries. All significant intercompany accounts and transactions have been eliminated in consolidation. The consolidated financial statements, in the opinion of management, reflect all adjustments (consisting only of normal recurring adjustments) that are necessary for a fair presentation of the results for the periods shown. The results of operations for such periods are not necessarily indicative of the results expected for any future periods.
The preparation of financial statements in accordance with accounting principles generally accepted in the United States of America ("GAAP") requires management to make estimates and assumptions that affect the reported amounts of assets and liabilities, disclosure of contingent liabilities and the reported amounts of revenues and expenses. Actual results could differ from these estimates and assumptions.
F-9
UNITED ONLINE, INC.
NOTES TO CONSOLIDATED FINANCIAL STATEMENTS (Continued)
1. DESCRIPTION OF BUSINESS, BASIS OF PRESENTATION, ACCOUNTING POLICIES, AND RECENT ACCOUNTING PRONOUNCEMENTS (Continued)
The most significant areas of the consolidated financial statements that require management judgment and which are susceptible to possible change in the near term include the Company's revenue recognition, business combinations, goodwill and indefinite-lived intangible assets, intangible assets and other long-lived assets, member redemption liability, income taxes, and legal contingencies. The accounting policies for these areas are discussed elsewhere in these consolidated financial statements.
Reclassifications—Certain prior-year amounts have been reclassified to conform to the current year presentation. These changes had no impact on the previously reported consolidated results of operations or stockholders' equity.
Subsequent events—The Company has evaluated subsequent events through February 23, 2010, the date this Annual Report on Form 10-K was filed with the Securities and Exchange Commission ("SEC").
Accounting Policies
Segments—The Company complies with the reporting requirements of Financial Accounting Standards Board ("FASB") Accounting Standards Codification ("ASC") 280, Segment Reporting. In August 2008, the Company completed the acquisition of FTD. FTD's operating results are now reported as the FTD segment, which is aligned with how management measures and reviews segment performance for internal reporting purposes in accordance with the "management approach" defined in ASC 280. Management has determined that segment income from operations, which excludes depreciation and amortization of intangible assets, is the appropriate measure for assessing performance of its segments and for allocating resources among its segments.
Cash, Cash Equivalents and Short-Term Investments—The Company considers cash equivalents to be only those investments which are highly liquid, readily convertible to cash and which have a maturity date within ninety days from the date of purchase. The Company's short-term investments held during 2008 consisted of available-for-sale securities with maturities exceeding ninety days from the date of purchase. Consistent with ASC 320, Investments-Debt and Equity Securities, the Company classified these securities, all of which had readily determinable fair values and which were highly liquid, as short-term. In connection with the FTD acquisition, the Company liquidated its short-term investments portfolio and, at December 31, 2009 and 2008, had no short-term investments.
Concentrations of Credit and Business Risk—Financial instruments that potentially subject the Company to a concentration of credit risk primarily consist of cash and cash equivalents, short-term investments and accounts receivable. The Company's accounts receivable are derived primarily from revenue earned from advertising customers and floral network members located in the United States and the United Kingdom, and pay accounts. The Company extends credit based upon an evaluation of the customer's financial condition and, generally, collateral is not required. The Company maintains an allowance for doubtful accounts receivable based upon the expected collectibility of accounts receivable and, to date, such losses have been within management's expectations.
The Company evaluates specific accounts receivable where information exists that the customer may have an inability to meet its financial obligations. In these cases, based on the best available facts and circumstances, a specific allowance is recorded for that customer against amounts due to reduce
F-10
UNITED ONLINE, INC.
NOTES TO CONSOLIDATED FINANCIAL STATEMENTS (Continued)
1. DESCRIPTION OF BUSINESS, BASIS OF PRESENTATION, ACCOUNTING POLICIES, AND RECENT ACCOUNTING PRONOUNCEMENTS (Continued)
the receivable to the amount that is expected to be collected. These specific allowances are re-evaluated and adjusted as additional information is received that impacts the amount of the allowance. Also, an allowance is established for all customers based on the aging of the receivables. If circumstances change (i.e., higher than expected defaults or an unexpected material adverse change in a customer's ability to meet its financial obligations), the estimates of the recoverability of amounts due to the Company are adjusted.
At December 31, 2009 and 2008, the Company's cash and cash equivalents were maintained primarily with major financial institutions and brokerage firms in the United States and the United Kingdom. Deposits with these institutions and firms generally exceed the amount of insurance provided on such deposits.
Property and Equipment—Property and equipment are stated at historical cost less accumulated depreciation and amortization. Depreciation is computed using the straight-line method over the estimated useful lives of the assets, which is generally two to three years for computer software and equipment, three to seven years for furniture and fixtures, twenty-five to forty years for buildings, and five to forty years for building improvements. Leasehold improvements, which are included in furniture and fixtures, are amortized using the straight-line method over the shorter of the lease term or up to ten years. Upon the sale or retirement of property or equipment, the cost and related accumulated depreciation or amortization is removed from the Company's consolidated financial statements with the resulting gain or loss reflected in the Company's results of operations. Repairs and maintenance costs are expensed as incurred.
Derivative Instruments—The Company accounts for derivative instruments in accordance with ASC 815, Derivatives and Hedging. The Company maintains an interest rate cap associated with interest rate fluctuations on certain of its credit facilities, however, the interest rate cap does not currently qualify for hedge accounting treatment. In addition, the Company periodically uses foreign exchange contracts to partially offset the economic effect of fluctuations in currency exchange rates.
Derivatives are recognized on the balance sheet at fair value. Changes in the fair value of derivatives that qualify as cash flow hedges are recorded in accumulated other comprehensive income (loss) and are subsequently reclassified into earnings when the underlying transactions occur. Cash flows from hedging activities are classified in the consolidated statements of cash flows under the same category as the cash flows from the hedged item.
The Company formally assesses, at inception and on an ongoing basis, whether the derivatives that are used in hedging transactions are highly effective in offsetting changes in the cash flows of hedged items. If it is determined that a derivative is not highly effective as a hedge, or that it ceased to be a highly effective hedge or if a forecasted hedge is no longer probable to occur, gains or losses on the derivative are reported in earnings.
Fair Value of Financial Instruments—In accordance with ASC 820, Fair Value Measurements and Disclosures, the Company maximizes the use of observable inputs and minimizes the use of unobservable inputs when developing fair value measurements. When available, the Company uses quoted market prices to measure fair value. If market prices are not available, fair value measurement is based upon models that use primarily market-based or independently-sourced market parameters. If market observable inputs for model-based valuation techniques are not available, the Company will be
F-11
UNITED ONLINE, INC.
NOTES TO CONSOLIDATED FINANCIAL STATEMENTS (Continued)
1. DESCRIPTION OF BUSINESS, BASIS OF PRESENTATION, ACCOUNTING POLICIES, AND RECENT ACCOUNTING PRONOUNCEMENTS (Continued)
required to make judgments about assumptions market participants would use in estimating the fair value of the financial instrument. Fair values of cash and cash equivalents, short-term accounts receivable, accounts payable, accrued liabilities, and short-term borrowings approximate their carrying amounts because of their short-term nature. Derivative instruments are recognized in the balance sheets at their fair values based on third-party quotes. Long-term debt is carried at amortized cost. However, the Company is required to estimate the fair value of long-term debt under ASC 825, Disclosures about Fair Value of Financial Instruments. Fair value of long-term debt is estimated based on the discounted cash flow method.
Business Combinations—All of the Company's acquisitions occurred prior to the effective date of ASC 805, Business Combinations and, accordingly, have been accounted for as purchase business combinations in accordance with the provisions of Statement of Financial Accounting Standards ("SFAS") No. 141, Business Combinations. Under the purchase method of accounting, the costs, including transaction costs, were allocated to the underlying net assets acquired, based on their respective estimated fair values. The excess of the purchase price over the estimated fair values of the net assets acquired was recorded as goodwill.
The judgments made in determining the estimated fair value and expected useful lives assigned to each class of assets and liabilities acquired can significantly impact net income (loss). Consequently, to the extent an indefinite-lived, definite-lived or a long-lived asset is ascribed greater value under the purchase method than a shorter-lived asset, there may be less amortization recorded in a given period. Definite-lived identifiable intangible assets are amortized on either a straight-line basis or an accelerated basis. The Company determines the appropriate amortization method by performing an analysis of expected cash flows over the estimated useful lives of the assets and matches the amortization expense to the expected cash flows from those assets.
Determining the fair value of certain assets and liabilities acquired is subjective in nature and often involves the use of significant estimates and assumptions. Two areas, in particular, that require significant judgment are estimating the fair value and related useful lives of identifiable intangible assets. To assist in this process, the Company may obtain appraisals from valuation specialists for certain intangible assets. While there are a number of different methods used in estimating the fair value of acquired intangible assets, there are two approaches primarily used: the discounted cash flow and market comparison approaches. Some of the more significant estimates and assumptions inherent in the two approaches include: projected future cash flows (including timing); discount rate reflecting the risk inherent in the future cash flows; terminal growth rate; subscriber churn; terminal value; determination of appropriate market comparables; and the determination of whether a premium or a discount should be applied to market comparables. Most of the above assumptions are made based on available historical and market information.
Goodwill and Indefinite-Lived Intangible Assets—Goodwill represents the excess of the purchase price of an acquired entity over the fair value of the net tangible and intangible assets acquired. Indefinite-lived intangible assets acquired in a business combination are initially recorded at management's estimate of their fair values. The Company accounts for goodwill and indefinite-lived intangible assets in accordance with ASC 350, Intangibles-Goodwill and Other, which among other things, addresses financial accounting and reporting requirements for acquired goodwill and indefinite-lived intangible assets. ASC 350 prohibits the amortization of goodwill and requires the Company to
F-12
UNITED ONLINE, INC.
NOTES TO CONSOLIDATED FINANCIAL STATEMENTS (Continued)
1. DESCRIPTION OF BUSINESS, BASIS OF PRESENTATION, ACCOUNTING POLICIES, AND RECENT ACCOUNTING PRONOUNCEMENTS (Continued)
test goodwill and indefinite-lived intangible assets for impairment at least annually at the reporting unit level.
The Company tests the goodwill of its reporting units and indefinite-lived intangible assets for impairment annually during the fourth quarter of its fiscal year and whenever events occur or circumstances change that would more likely than not indicate that the goodwill and/or indefinite-lived intangible assets might be impaired. Events or circumstances which could trigger an impairment review include, but are not limited to, a significant adverse change in legal factors or in the business climate, an adverse action or assessment by a regulator, unanticipated competition, a loss of key management or other personnel, significant changes in the manner of the Company's use of the acquired assets or the strategy for the acquired business or the Company's overall business, significant negative industry or economic trends, or significant underperformance relative to expected historical or projected future results of operations.
Indefinite-Lived Intangible Assets—Testing indefinite-lived intangible assets, other than goodwill, for impairment requires a one-step approach under ASC 350. The Company tests indefinite-lived intangible assets for impairment on an annual basis, or more frequently, if events occur or circumstances change that indicate they may be impaired. The fair values of indefinite-lived intangible assets are compared to their carrying values and if the carrying amount of indefinite-lived intangible assets exceeds the fair value, an impairment loss is recognized equal to the excess.
The process of estimating the fair value of indefinite-lived intangible assets is subjective and requires the Company to make estimates that may significantly impact the outcome of the analyses. Such estimates include, but are not limited to, future operating performance and cash flows, cost of capital, terminal values, and remaining economic lives of assets.
Goodwill—Testing goodwill for impairment involves a two-step process. The first step of the impairment test involves comparing the estimated fair values of each of the Company's reporting units with their respective net book values, including goodwill. If the estimated fair value of a reporting unit exceeds its net book value, goodwill is considered not to be impaired and no additional steps are necessary. If, however, the estimated fair value of the reporting unit is less than its net book value, including goodwill, then the carrying amount of the goodwill is compared with its implied fair value. If the carrying amount of goodwill exceeds the implied fair value of that goodwill, an impairment loss is recognized in an amount equal to the excess.
Intangible Assets and Other Long-Lived Assets—The Company accounts for identifiable intangible assets and other long-lived assets in accordance with ASC 360, Property, Plant and Equipment, which addresses financial accounting and reporting for the impairment and disposition of identifiable intangible assets and other long-lived assets. Intangible assets acquired in a business combination are initially recorded at management's estimate of their fair values. The Company evaluates the recoverability of identifiable intangible assets and other long-lived assets, other than indefinite-lived intangible assets, for impairment when events occur or circumstances change that would indicate that the carrying amount of an asset may not be recoverable. Events or circumstances that may indicate that an asset is impaired include, but are not limited to, significant decreases in the market value of an asset, significant underperformance relative to expected historical or projected future operating results, a change in the extent or manner in which an asset is used, shifts in technology, loss of key
F-13
UNITED ONLINE, INC.
NOTES TO CONSOLIDATED FINANCIAL STATEMENTS (Continued)
1. DESCRIPTION OF BUSINESS, BASIS OF PRESENTATION, ACCOUNTING POLICIES, AND RECENT ACCOUNTING PRONOUNCEMENTS (Continued)
management or other personnel, significant negative industry or economic trends, changes in the Company's operating model or strategy, and competitive forces. In determining if an impairment exists, the Company estimates the undiscounted cash flows to be generated from the use and ultimate disposition of these assets. If an impairment is indicated based on a comparison of the assets' carrying values and the undiscounted cash flows, the impairment loss is measured as the amount by which the carrying amount of the assets exceeds the fair market value of the assets. Definite-lived intangible assets are amortized on either a straight-line basis or an accelerated basis over their estimated useful lives, ranging from two to ten years.
The process of evaluating the potential impairment of long-lived intangible assets is subjective and requires significant judgment on matters such as, but not limited to, the asset group to be tested for recoverability. The Company is also required to make estimates that may significantly impact the outcome of the analyses. Such estimates include, but are not limited to, future operating performance and cash flows, cost of capital, terminal values, and remaining economic lives of assets.
Member Redemption Liability—Member redemption liability for online loyalty marketing points represents the estimated costs associated with the obligation of MyPoints to redeem outstanding points accumulated by its online loyalty marketing members as well as those points purchased by its advertisers for use in such advertisers' promotion campaigns as they have been earned by MyPoints' members, less an allowance for points expected to expire prior to redemption. The estimated cost of points is primarily presented in cost of revenues, except for the portion related to member acquisition activities, internal marketing surveys and other non-revenue generating activities which are presented in sales and marketing expenses. The member redemption liability is recognized when members earn points, less an allowance for points expected to expire, and is reduced when members redeem accumulated points upon reaching required redemption thresholds or when points expire prior to redemption.
MyPoints members may redeem points for third-party gift cards and other rewards. Members earn points when they respond to direct marketing offers delivered by MyPoints, purchase goods or services from advertisers, engage in certain promotional campaigns of advertisers, or engage in other specified activities.
The member redemption liability is estimated based upon the weighted-average cost and number of points that may be redeemed in the future. On a monthly basis, the weighted-average cost of points is calculated by taking the total cost of items fulfilled divided by total points redeemed. MyPoints purchases gift cards and other awards from merchants at a discount and sets redemption levels for its members. The discounts and points needed to redeem awards vary by merchant and award denomination. MyPoints has the ability to adjust the number of points required to redeem awards to reflect changes in the cost of awards.
On a monthly basis, MyPoints accounts for and reduces the gross points issued by an estimate of points that will never be redeemed by its members. This reduction is calculated based on an analysis of historical point-earning trends, redemption activities and individual member account activity. MyPoints' historical analysis takes into consideration the total points in members' accounts that have been inactive for six months or longer, less an estimated reactivation rate, plus an estimate of future inactive points.
F-14
UNITED ONLINE, INC.
NOTES TO CONSOLIDATED FINANCIAL STATEMENTS (Continued)
1. DESCRIPTION OF BUSINESS, BASIS OF PRESENTATION, ACCOUNTING POLICIES, AND RECENT ACCOUNTING PRONOUNCEMENTS (Continued)
Changes in, among other factors, the net number of points issued, redemption activities and members' activity levels could materially impact the member redemption liability.
Points in active accounts do not expire; however, unredeemed points expire after twelve consecutive months of inactivity. For purposes of the member redemption liability, "inactive" means a lack of all of the following: Web site visit; email response; survey completion; profile update; or any point-earning or point-redeeming transaction. The canceling or disabling of inactive accounts would have no impact on the Company's consolidated financial statements, as the Company fully considers inactive accounts when establishing the member redemption liability, as discussed above.
FTD Segment Revenue Recognition—Products revenues and the related cost of revenues are generally recognized when products are delivered to the customers. Shipping and service fees charged to customers are recognized at the time the product revenue is recognized and are included in products revenue. Shipping costs are included in cost of revenues. FTD's consumer businesses generally recognize revenue on a gross basis as FTD bears the risks and rewards associated with the revenue generating activities by: (1) acting as a principal in the transaction; (2) establishing prices; (3) being responsible for fulfillment of the order by the floral network members and third-party suppliers; (4) taking the risk of loss for collection, delivery and returns; and (5) marketing the products and services.
FTD also sells computer systems to its floral network members and recognizes revenue in accordance with ASC 985, Software. FTD recognizes revenue on hardware which is sold without software at the time of delivery. For hardware sales that include software, revenue is recognized when delivery, installation and customer acceptance have all occurred.
Services revenues based on enabling the delivery of orders by floral network members are recognized in the period in which the orders are delivered. Monthly, recurring fees and other floral network service-based fees are recognized in the period in which the service has been provided.
Classmates Media Segment and Communications Segment Revenue Recognition—The Company's online social networking revenues and Communications revenues are comprised of services revenues, which are derived primarily from fees charged to pay accounts, and advertising revenues. The Company applies the provisions of ASC 605, Revenue Recognition, which provides guidance on the recognition, presentation and disclosure of revenue in financial statements filed with the Securities and Exchange Commission ("SEC"). ASC 605 outlines the basic criteria that must be met to recognize revenue and provides guidance for disclosure related to revenue recognition policies. The Company recognizes revenue when persuasive evidence of an arrangement exists, delivery has occurred or services have been rendered, the fee is fixed or determinable, no significant Company obligations remain, and collectibility is reasonably assured.
Services revenues for the Company's online social networking services and for Communications services are recognized in the period in which fees are fixed or determinable and the related services are provided to the customer. The Company's pay accounts generally pay in advance for their services by credit card, and revenue is then recognized ratably over the service period. Advance payments from pay accounts are recorded on the consolidated balance sheets as deferred revenue. The Company offers alternative payment methods to credit cards for certain pay service plans. These alternative payment methods currently include use of automated clearing-house ("ACH"), payment by personal check or money order, or payment through a local telephone company. In circumstances where payment is not received in advance, revenue is only recognized if collectibility is also reasonably assured.
F-15
UNITED ONLINE, INC.
NOTES TO CONSOLIDATED FINANCIAL STATEMENTS (Continued)
1. DESCRIPTION OF BUSINESS, BASIS OF PRESENTATION, ACCOUNTING POLICIES, AND RECENT ACCOUNTING PRONOUNCEMENTS (Continued)
Advertising revenues from the Company's online social networking services and from Communications services consist primarily of amounts from Internet search partners that are generated as a result of users utilizing partner Internet search services, amounts generated from the display of third-party offers at the end of Classmates' pay account registration process, amounts generated from other display advertisements, and amounts generated from referring members to third-party Web sites or services. The Company recognizes such advertising revenues in the period in which the advertisement is displayed or, for performance-based arrangements, when the related performance criteria are met. In determining whether an arrangement exists, the Company ensures that a written contract is in place, such as a standard insertion order or a customer-specific agreement. The Company assesses whether performance criteria have been met and whether the fees are fixed or determinable based on a reconciliation of the performance criteria and the payment terms associated with the transaction. The reconciliation of the performance criteria generally includes a comparison of the Company's internally-tracked performance data to the contractual performance obligation and, when available, to third-party or customer-provided performance data.
Advertising revenues for the Company's online loyalty marketing service consist primarily of fees generated when emails are transmitted to members, when members respond to emails and when members complete online transactions. Each of these activities is a discrete, independent activity, which generally is specified in the sales agreement for each advertising customer. As the earning activities take place, activity measurement data (examples include the number of emails delivered and the number of responses received) is accumulated and the related revenue is recorded.
Probability of collection is assessed based on a number of factors, including past transaction history with the customer and the creditworthiness of the customer. If it is determined that collection is not reasonably assured, revenue is not recognized until collection becomes reasonably assured, which is generally upon receipt of cash. Deferred revenue also represents invoiced services that have not yet been performed.
Cost of Revenues—Cost of revenues primarily includes product costs; shipping and delivery costs; costs associated with taking orders; printing and postage costs; costs related to FTD's product quality guarantee; systems installation, training and support costs; costs of points earned by members of the Company's online loyalty marketing service; telecommunications and data center costs; personnel-and overhead-related costs associated with operating the Company's networks and data centers; depreciation of network computers and equipment; email support and license fees; costs related to providing telephone support; customer billing and billing support for the Company's pay accounts and floral network members; fees associated with the storage and processing of customer credit cards and associated bank fees; and domain name registration fees.
Sales and Marketing—Sales and marketing expenses include expenses associated with promoting the Company's brands, products and services and with generating advertising revenues. Expenses associated with promoting the Company's brands, products and services include advertising and promotion expenses; fees paid to distribution partners, third-party advertising networks and co-registration partners to acquire new pay and free accounts; personnel and overhead-related expenses for marketing, merchandising, customer service and sales personnel; and telemarketing costs incurred to acquire and retain pay accounts and up-sell pay accounts to additional services. Expenses associated with generating advertising revenues include sales commissions and personnel-related expenses. The Company has expended significant amounts on sales and marketing, including branding and customer acquisition
F-16
UNITED ONLINE, INC.
NOTES TO CONSOLIDATED FINANCIAL STATEMENTS (Continued)
1. DESCRIPTION OF BUSINESS, BASIS OF PRESENTATION, ACCOUNTING POLICIES, AND RECENT ACCOUNTING PRONOUNCEMENTS (Continued)
campaigns consisting of television, Internet, sponsorships, radio, print, and outdoor advertising, and on retail and other performance-based distribution relationships. Marketing and advertising costs to promote the Company's products and services are expensed in the period incurred. Advertising and promotion expenses include media, agency and promotion expenses. Production costs are expensed the first time the advertisement is run. Media and agency costs are expensed over the period the advertising runs. Advertising and promotion expense for the years ended December 31, 2009, 2008 and 2007 was $118.5 million, $102.7 million and $99.5 million, respectively. At December 31, 2009 and 2008, $3.0 million and $3.5 million, respectively, of prepaid advertising and promotion expense was included in other current assets in the consolidated balance sheets.
Technology and Development—Technology and development expenses include expenses for product development, maintenance of existing software and technology and the development of new or improved software and technology, including personnel-related expenses for the Company's technology group in various office locations, and the costs associated with operating the Company's facility in India. Costs incurred by the Company to manage and monitor the Company's technology and development activities are expensed as incurred. Costs relating to the acquisition and development of internal-use software are capitalized when appropriate and depreciated over their estimated useful lives, generally three years.
Software Development Costs—The Company accounts for costs incurred to develop software for internal use in accordance with ASC 350, which requires such costs be capitalized and amortized over the estimated useful life of the software. The Company capitalizes costs associated with customized internal-use software systems that have reached the application development stage. Such capitalized costs include external direct costs utilized in developing or obtaining the applications and payroll and payroll-related expenses for employees who are directly associated with the applications. Capitalization of such costs begins when the preliminary project stage is complete and ceases at the point in which the project is substantially complete and ready for its intended purpose. The Company capitalized costs associated with internal-use software of $10.6 million and $7.0 million in the years ended December 31, 2009 and 2008, respectively, which are being depreciated on a straight-line basis over each project's estimated useful life which is generally three years. Capitalized internal-use software is included within the computer software and equipment category within property and equipment, net, in the consolidated balance sheets.
Software to be Sold, Leased or Marketed—The Company follows the provisions of ASC 985, which requires that all costs relating to the purchase or internal development and production of computer software products to be sold, leased or otherwise marketed be expensed in the period incurred unless the requirements for technological feasibility have been established. The Company capitalizes all eligible computer software costs incurred once technological feasibility is established. The Company amortizes these costs using the greater of the straight-line method over a period of three to five years or the revenue method prescribed by ASC 985. At December 31, 2009 and 2008, the net book value of capitalized computer software costs related to the internal development and production of computer software to be sold, leased or otherwise marketed was $12.0 million and $14.0 million, respectively. During the years ended December 31, 2009 and 2008, $3.7 million and $0.9 million, respectively, was charged to expense related to the amortization of these capitalized computer software costs.
General and Administrative—General and administrative expenses include personnel-related expenses for executive, finance, legal, human resources, facilities, and internal customer support
F-17
UNITED ONLINE, INC.
NOTES TO CONSOLIDATED FINANCIAL STATEMENTS (Continued)
1. DESCRIPTION OF BUSINESS, BASIS OF PRESENTATION, ACCOUNTING POLICIES, AND RECENT ACCOUNTING PRONOUNCEMENTS (Continued)
personnel. In addition, general and administrative expenses include, among other costs, professional fees for legal, accounting and financial services; insurance; occupancy and other overhead-related costs; office relocation costs; non-income taxes; and expenses incurred and credits received as a result of certain legal settlements or reserves.
Stock-Based Compensation—The Company follows the provisions of ASC 718, Compensation-Stock Compensation, which requires the measurement and recognition of compensation expense for all share-based payment awards made to employees and directors including restricted stock units, stock awards, stock options, and employee stock purchases.
ASC 718 requires companies to estimate the fair value of share-based payment awards on the grant date using an option-pricing model. The Company values its restricted stock units based on the grant-date closing price of the Company's common stock. The Company uses the Black-Scholes option-pricing model for valuing stock options. The value of the portion of the award that is ultimately expected to vest is recognized as an expense over the requisite service periods in the Company's consolidated statements of operations. ASC 718 also requires forfeitures to be estimated at the time of grant in order to calculate the amount of share-based payment awards ultimately expected to vest.
Comprehensive Income (Loss)—The Company follows the provisions of ASC 220, Comprehensive Income, which establishes standards for reporting comprehensive income (loss) and its components in financial statements. Comprehensive income (loss), as defined, includes all changes in equity (net assets) during a period from non-owner sources. For the Company, comprehensive income (loss) primarily consists of its reported net income (loss), changes in unrealized gains or losses on short-term investments and derivatives, both net of tax, and foreign currency translation.
Foreign Currency Translation—The Company accounts for foreign currency translation in accordance with ASC 830, Foreign Currency Matters. The functional currency of the Company's international subsidiaries is the local currency. The financial statements of these subsidiaries are translated to U.S. Dollars using period-end rates of exchange for assets and liabilities, and average rates of exchange for the period for revenues and expenses. Translation gains and losses are recorded in accumulated other comprehensive income (loss) as a component of stockholders' equity in the consolidated balance sheets. The Company periodically hedges foreign currency translation risk.
Income Taxes—The Company accounts for income taxes under ASC 740, Income Taxes. Under ASC 740, deferred tax assets and liabilities are determined based on differences between the financial reporting and tax basis of assets and liabilities and are measured using the enacted tax rates and laws that will be in effect when the differences are expected to reverse. The Company records a valuation allowance to reduce its deferred tax assets to the amount that is more likely than not to be realized. In evaluating the Company's ability to recover its deferred tax assets, the Company considers all available positive and negative evidence, including its operating results, ongoing tax planning and forecasts of future taxable income on a jurisdiction-by-jurisdiction basis. In accordance with ASC 740, the Company recognizes, in its consolidated financial statements, the impact of tax positions that are more likely than not to be sustained upon examination based on the technical merits of the positions.
Earnings Per Share—The Company computes earnings per share in accordance with ASC 260, Earnings Per Share. ASC 260 provides that unvested share-based payment awards that contain non-forfeitable rights to dividends are participating securities and shall be included in the computation of earnings per share pursuant to the two-class method. The two-class method of computing earnings
F-18
UNITED ONLINE, INC.
NOTES TO CONSOLIDATED FINANCIAL STATEMENTS (Continued)
1. DESCRIPTION OF BUSINESS, BASIS OF PRESENTATION, ACCOUNTING POLICIES, AND RECENT ACCOUNTING PRONOUNCEMENTS (Continued)
per share is an earnings allocation formula that determines earnings per share for common stock and any participating securities according to dividends declared (whether paid or unpaid) and participation rights in undistributed earnings. Certain of the Company's restricted stock units are considered participating securities because they contain a non-forfeitable right to dividends irrespective of whether the awards ultimately vest. The Company is required to retrospectively adjust earnings per share data to conform to the provisions in this standard. Accordingly, effective January 1, 2009, the Company computed earnings per common share using the two-class method for all periods presented. See Note 11 for additional disclosures.
Legal Contingencies—The Company is currently involved in certain legal proceedings and investigations. The Company records liabilities related to pending litigation when an unfavorable outcome is deemed probable and management can reasonably estimate the amount of loss. The Company does not record liabilities for pending litigation when there are uncertainties related to assessing either the amount or the probable outcome of the claims asserted in the litigation. As additional information becomes available, the Company continually assesses the potential liability related to such pending litigation.
Operating Leases—The Company leases office space, data centers and certain office equipment under operating lease agreements with original lease periods of up to ten years. Certain of the lease agreements contain rent holidays and rent escalation provisions. Rent holidays and rent escalation provisions are considered in determining straight-line rent expense to be recorded over the lease term. The lease term begins on the date of initial possession of the leased property for purposes of recognizing lease expense on a straight-line basis over the term of the lease. Lease renewal periods are considered on a lease-by-lease basis and are generally not included in the initial lease term.
Recent Accounting Pronouncements
Revenue Recognition—In October 2009, the FASB issued Accounting Standards Update ("ASU") No. 2009-13, Revenue Recognition—Multiple Deliverable Revenue Arrangements, as codified in ASC 605. This update addresses the accounting for multiple-deliverable arrangements to enable vendors to account for products or services (deliverables) separately rather than as a combined unit. The amendments in this update will be effective prospectively for revenue arrangements entered into or materially modified beginning January 1, 2011. Early adoption is permitted. The Company is currently evaluating the impact, if any, of this update on its consolidated financial statements.
Software—In October 2009, the FASB issued ASU No. 2009-14, Software—Certain Revenue Arrangements That Include Software Elements, as codified in ASC 985. The amendments in this update change the accounting model for revenue arrangements that include both tangible products and software elements. Tangible products containing software components and non-software components that function together to deliver the tangible product's essential functionality will no longer be within the scope of the software revenue guidance in ASC 985-605, Software—Revenue Recognition. The amendments in this update will be effective prospectively for revenue arrangements entered into or materially modified beginning January 1, 2011. Early adoption is permitted. The Company is currently evaluating the impact, if any, of this update on its consolidated financial statements.
F-19
UNITED ONLINE, INC.
NOTES TO CONSOLIDATED FINANCIAL STATEMENTS (Continued)
1. DESCRIPTION OF BUSINESS, BASIS OF PRESENTATION, ACCOUNTING POLICIES, AND RECENT ACCOUNTING PRONOUNCEMENTS (Continued)
Fair Value Measurements and Disclosures—In January 2010, the FASB issued ASU No. 2010-06, Fair Value Measurements and Disclosures—Improving Disclosures about Fair Value Measurements, as codified in ASC 820. This update provides amendments to ASC 820, effective January 1, 2010, that will provide more robust disclosures about (i) the different classes of assets and liabilities measured at fair value, (ii) the valuation techniques and inputs used, (iii) the activity in Level 3 fair value measurements, and (iv) the transfers between Levels 1, 2 and 3. The Company does not expect the amendments to ASC 820 to have a material impact on its consolidated financials statements.
2. SEGMENT INFORMATION
Segment revenues and segment income (loss) from operations were as follows (in thousands):
| |
Year Ended December 31, 2009 | |||||||||||||
|---|---|---|---|---|---|---|---|---|---|---|---|---|---|---|
| |
FTD | Classmates Media | Communications | Total | ||||||||||
Services |
$ | 125,430 | $ | 151,902 | $ | 175,207 | $ | 452,539 | ||||||
Products |
414,127 | — | — | 414,127 | ||||||||||
Advertising |
6,288 | 84,120 | 36,026 | 126,434 | ||||||||||
Total segment revenues |
$ | 545,845 | $ | 236,022 | $ | 211,233 | $ | 993,100 | ||||||
Segment income from operations |
$ | 76,928 | $ | 58,793 | $ | 69,945 | $ | 205,666 | ||||||
| |
Year Ended December 31, 2008 | |||||||||||||
|---|---|---|---|---|---|---|---|---|---|---|---|---|---|---|
| |
FTD | Classmates Media | Communications | Total | ||||||||||
Services |
$ | 47,277 | $ | 139,386 | $ | 218,414 | $ | 405,077 | ||||||
Products |
132,983 | — | — | 132,983 | ||||||||||
Advertising |
1,705 | 90,849 | 39,024 | 131,578 | ||||||||||
Total segment revenues |
$ | 181,965 | $ | 230,235 | $ | 257,438 | $ | 669,638 | ||||||
Segment income (loss) from operations |
$ | (149,405 | ) | $ | 47,309 | $ | 79,190 | $ | (22,906 | ) | ||||
| |
Year Ended December 31, 2007 | |||||||||||||
|---|---|---|---|---|---|---|---|---|---|---|---|---|---|---|
| |
FTD | Classmates Media | Communications | Total | ||||||||||
Services |
$ | — | $ | 106,514 | $ | 273,012 | $ | 379,526 | ||||||
Advertising |
— | 86,905 | 47,072 | 133,977 | ||||||||||
Total segment revenues |
$ | — | $ | 193,419 | $ | 320,084 | $ | 513,503 | ||||||
Segment income from operations |
$ | — | $ | 28,177 | $ | 97,074 | $ | 125,251 | ||||||
F-20
UNITED ONLINE, INC.
NOTES TO CONSOLIDATED FINANCIAL STATEMENTS (Continued)
2. SEGMENT INFORMATION (Continued)
A reconciliation of segment revenues to consolidated revenues was as follows for each period presented (in thousands):
| |
Year Ended December 31, | ||||||||||
|---|---|---|---|---|---|---|---|---|---|---|---|
| |
2009 | 2008 | 2007 | ||||||||
Segment revenues: |
|||||||||||
FTD |
$ | 545,845 | $ | 181,965 | $ | — | |||||
Classmates Media |
236,022 | 230,235 | 193,419 | ||||||||
Communications |
211,233 | 257,438 | 320,084 | ||||||||
Intersegment eliminations |
(2,968 | ) | (235 | ) | — | ||||||
Consolidated revenues |
$ | 990,132 | $ | 669,403 | $ | 513,503 | |||||
A reconciliation of segment operating expenses (which excludes depreciation and amortization of intangible assets) to consolidated operating expenses was as follows for each period presented (in thousands):
| |
Year Ended December 31, | ||||||||||
|---|---|---|---|---|---|---|---|---|---|---|---|
| |
2009 | 2008 | 2007 | ||||||||
Segment operating expenses: |
|||||||||||
FTD |
$ | 468,917 | $ | 331,370 | $ | — | |||||
Classmates Media |
177,229 | 182,926 | 165,242 | ||||||||
Communications |
141,288 | 178,248 | 223,010 | ||||||||
Total segment operating expenses |
787,434 | 692,544 | 388,252 | ||||||||
Depreciation |
24,829 | 21,358 | 20,150 | ||||||||
Amortization of intangible assets |
34,844 | 18,415 | 12,800 | ||||||||
Intersegment eliminations |
(2,968 | ) | (235 | ) | — | ||||||
Consolidated operating expenses |
$ | 844,139 | $ | 732,082 | $ | 421,202 | |||||
A reconciliation of segment income (loss) from operations (which excludes depreciation and amortization of intangible assets) to consolidated operating income (loss), was as follows for each period presented (in thousands):
| |
Year Ended December 31, | ||||||||||
|---|---|---|---|---|---|---|---|---|---|---|---|
| |
2009 | 2008 | 2007 | ||||||||
Segment income (loss) from operations: |
|||||||||||
FTD |
$ | 76,928 | $ | (149,405 | ) | $ | — | ||||
Classmates Media |
58,793 | 47,309 | 28,177 | ||||||||
Communications |
69,945 | 79,190 | 97,074 | ||||||||
Total segment income (loss) from operations |
205,666 | (22,906 | ) | 125,251 | |||||||
Depreciation |
(24,829 | ) | (21,358 | ) | (20,150 | ) | |||||
Amortization of intangible assets |
(34,844 | ) | (18,415 | ) | (12,800 | ) | |||||
Consolidated operating income (loss) |
$ | 145,993 | $ | (62,679 | ) | $ | 92,301 | ||||
F-21
UNITED ONLINE, INC.
NOTES TO CONSOLIDATED FINANCIAL STATEMENTS (Continued)
2. SEGMENT INFORMATION (Continued)
International revenues are generated by the Company's operations in Europe. International revenues totaled $171.2 million, $66.6 million and $7.3 million for the years ended December 31, 2009, 2008 and 2007, respectively.
Geographic information for long-lived assets, which consist of property and equipment and other assets, was as follows (in thousands):
| |
December 31, | ||||||||||
|---|---|---|---|---|---|---|---|---|---|---|---|
| |
2009 | 2008 | 2007 | ||||||||
United States |
$ | 71,280 | $ | 76,436 | $ | 47,054 | |||||
Europe |
9,204 | 6,952 | 399 | ||||||||
Total long-lived assets |
$ | 80,484 | $ | 83,388 | $ | 47,453 | |||||
The Company manages its working capital on a consolidated basis. In addition, segment assets are not reported to, or used by, the Company's chief operating decision maker to allocate resources to or assess performance of the segments and therefore, pursuant to ASC 280, Segment Reporting, total segment assets have not been disclosed.
3. BALANCE SHEET COMPONENTS
Other Current Assets
Other current assets consisted of the following (in thousands):
| |
December 31, | |||||||
|---|---|---|---|---|---|---|---|---|
| |
2009 | 2008 | ||||||
Prepaid expenses |
$ | 14,112 | $ | 15,751 | ||||
Income taxes receivable |
— | 1,810 | ||||||
Gift cards related to member redemption liability |
4,017 | 4,332 | ||||||
Floral-related inventories, net |
4,035 | 5,603 | ||||||
Other |
3,435 | 3,474 | ||||||
Total |
$ | 25,599 | $ | 30,970 | ||||
Property and Equipment
Property and equipment consisted of the following (in thousands):
| |
December 31, | |||||||
|---|---|---|---|---|---|---|---|---|
| |
2009 | 2008 | ||||||
Computer software and equipment |
$ | 159,359 | $ | 140,619 | ||||
Land and buildings |
17,671 | 17,070 | ||||||
Furniture and fixtures |
16,485 | 15,511 | ||||||
|
193,515 | 173,200 | ||||||
Less: accumulated depreciation and amortization |
(129,968 | ) | (111,378 | ) | ||||
Total |
$ | 63,547 | $ | 61,822 | ||||
F-22
UNITED ONLINE, INC.
NOTES TO CONSOLIDATED FINANCIAL STATEMENTS (Continued)
3. BALANCE SHEET COMPONENTS (Continued)
Depreciation expense, including the amortization of leasehold improvements, for the years ended December 31, 2009, 2008 and 2007 was $24.8 million, $21.4 million and $20.2 million, respectively.
Accrued Liabilities
Accrued liabilities consisted of the following (in thousands):
| |
December 31, | |||||||
|---|---|---|---|---|---|---|---|---|
| |
2009 | 2008 | ||||||
Employee compensation and related expenses |
$ | 22,475 | $ | 23,683 | ||||
Income taxes payable |
8,565 | 1,690 | ||||||
Non-income taxes payable |
5,325 | 4,930 | ||||||
Customer deposits |
3,636 | 4,269 | ||||||
Other |
10,427 | 8,576 | ||||||
Total |
$ | 50,428 | $ | 43,148 | ||||
4. GOODWILL, INTANGIBLE ASSETS AND OTHER LONG-LIVED ASSETS
Goodwill
The changes in goodwill by reportable segment for the years ended December 31, 2008 and 2009 were as follows (in thousands):
| |
Communications | Classmates Media |
FTD | Total | |||||||||||
|---|---|---|---|---|---|---|---|---|---|---|---|---|---|---|---|
Balance at January 1, 2008: |
|||||||||||||||
Goodwill (excluding impairment charges) |
$ | 13,227 | $ | 124,863 | $ | — | $ | 138,090 | |||||||
Accumulated impairment charges |
(5,738 | ) | — | — | (5,738 | ) | |||||||||
Goodwill |
7,489 | 124,863 | — | 132,352 | |||||||||||
FTD acquisition |
— | — | 477,520 | 477,520 | |||||||||||
Acquisition adjustments(a) |
— | — | (4,721 | ) | (4,721 | ) | |||||||||
Impairment charges |
— | — | (114,000 | ) | (114,000 | ) | |||||||||
Foreign currency translation |
— | (137 | ) | (31,666 | ) | (31,803 | ) | ||||||||
Balance at December 31, 2008: |
|||||||||||||||
Goodwill (excluding impairment charges) |
13,227 | 124,726 | 441,133 | 579,086 | |||||||||||
Accumulated impairment charges |
(5,738 | ) | — | (114,000 | ) | (119,738 | ) | ||||||||
Goodwill |
7,489 | 124,726 | 327,133 | 459,348 | |||||||||||
Acquisition adjustments(a) |
— | — | (9,535 | ) | (9,535 | ) | |||||||||
Foreign currency translation |
— | 5 | 14,333 | 14,338 | |||||||||||
Balance at December 31, 2009: |
|||||||||||||||
Goodwill (excluding impairment charges) |
13,227 | 124,731 | 445,931 | 583,889 | |||||||||||
Accumulated impairment charges |
(5,738 | ) | — | (114,000 | ) | (119,738 | ) | ||||||||
Goodwill |
$ | 7,489 | $ | 124,731 | $ | 331,931 | $ | 464,151 | |||||||
- (a)
- Represents adjustments to purchase accounting and/or adjustments to acquired deferred tax assets within one year of acquisition.
F-23
UNITED ONLINE, INC.
NOTES TO CONSOLIDATED FINANCIAL STATEMENTS (Continued)
4. GOODWILL, INTANGIBLE ASSETS AND OTHER LONG-LIVED ASSETS (Continued)
Intangible Assets
Intangible assets consisted of the following (in thousands):
| |
December 31, 2009 | ||||||||||
|---|---|---|---|---|---|---|---|---|---|---|---|
| |
Gross Value |
Accumulated Amortization |
Net | ||||||||
Pay accounts and free accounts |
$ | 100,825 | $ | (88,935 | ) | $ | 11,890 | ||||
Customer contracts and relationships |
112,575 | (31,856 | ) | 80,719 | |||||||
Trademarks and trade names |
184,020 | (14,912 | ) | 169,108 | |||||||
Software and technology |
46,726 | (16,279 | ) | 30,447 | |||||||
Patents, domain names and other |
4,602 | (4,246 | ) | 356 | |||||||
Total |
$ | 448,748 | $ | (156,228 | ) | $ | 292,520 | ||||
| |
December 31, 2008 | ||||||||||
|---|---|---|---|---|---|---|---|---|---|---|---|
| |
Gross Value | Accumulated Amortization | Net | ||||||||
Pay accounts and free accounts |
$ | 100,785 | $ | (85,658 | ) | $ | 15,127 | ||||
Customer contracts and relationships |
110,570 | (11,805 | ) | 98,765 | |||||||
Trademarks and trade names |
179,300 | (12,221 | ) | 167,079 | |||||||
Software and technology |
46,047 | (7,884 | ) | 38,163 | |||||||
Patents, domain names and other |
4,596 | (3,494 | ) | 1,102 | |||||||
Total |
$ | 441,298 | $ | (121,062 | ) | $ | 320,236 | ||||
The Company's acquired trademarks and trade names related to the FTD acquisition of $229.8 million, prior to impairment charges, are indefinite-lived, and accordingly there is no associated accumulated amortization. At December 31, 2009, the FTD trademarks and trade names after impairment and foreign currency translation adjustments totaled $158.2 million.
Amortization expense related to intangible assets for the years ended December 31, 2009, 2008 and 2007 was $34.8 million, $18.4 million and $12.8 million, respectively.
Estimated future intangible asset amortization expense at December 31, 2009 was as follows (in thousands):
| |
|
Year Ending December 31, | |
|||||||||||||||||||
|---|---|---|---|---|---|---|---|---|---|---|---|---|---|---|---|---|---|---|---|---|---|---|
| |
Total | 2010 | 2011 | 2012 | 2013 | 2014 | Thereafter | |||||||||||||||
Estimated amortization of intangible assets |
$ | 134,286 | $ | 32,297 | $ | 30,461 | $ | 29,315 | $ | 26,554 | $ | 14,733 | $ | 926 | ||||||||
5. CREDIT AGREEMENTS
UOL Credit Agreement
In connection with the FTD acquisition, in August 2008, United Online entered into a $60 million senior secured credit agreement with Silicon Valley Bank (the "UOL Credit Agreement") and
F-24
UNITED ONLINE, INC.
NOTES TO CONSOLIDATED FINANCIAL STATEMENTS (Continued)
5. CREDIT AGREEMENTS (Continued)
borrowed $60 million thereunder. The net proceeds of the term loan under the UOL Credit Agreement were used to finance, in part, the acquisition of FTD.
The term loan under the UOL Credit Agreement bears interest at either LIBOR plus 3.50% per annum (with a LIBOR floor of 3.00%) or the prime rate plus 2.00% per annum. The UOL Credit Agreement contains customary representations and warranties, events of default, affirmative covenants and negative covenants (which impose restrictions and limitations on, among other things, dividends, investments, asset sales, and the ability to incur additional debt and liens) that, among other things, impose the maintenance of a maximum consolidated leverage ratio and the maintenance of a minimum consolidated fixed charge coverage ratio and minimum consolidated adjusted EBITDA. Impairment charges recorded by the Company do not impact covenants contained in the UOL Credit Agreement.
The obligations under the UOL Credit Agreement are guaranteed by the Company's domestic wholly-owned subsidiaries, other than UNOL Intermediate, Inc. (the direct parent of FTD Group, Inc.) and its subsidiaries. In addition, the obligations under the UOL Credit Agreement are secured by a lien on substantially all of the assets of the guarantors, including a pledge of all of the outstanding capital stock of the guarantors' direct subsidiaries (except with respect to foreign subsidiaries, in which case such pledge is limited to 66% of the outstanding capital stock), excluding the capital stock of UNOL Intermediate, Inc.
FTD Credit Agreement
In connection with the FTD acquisition, in August 2008, UNOLA Corp., then an indirect wholly-owned subsidiary of United Online, Inc., which subsequently merged into FTD Group, Inc., entered into a $425 million senior secured credit agreement with Wells Fargo Bank National Association, as Administrative Agent (the "FTD Credit Agreement"), consisting of (i) a term loan A facility of up to $75 million, (ii) a term loan B facility of up to $300 million, and (iii) a revolving credit facility of up to $50 million. The interest rate set forth in the FTD Credit Agreement for loans made under the revolving credit facility and term loan A facility is either the prime rate plus 2.50% per annum, or LIBOR plus 3.50% per annum (with a LIBOR floor of 3.00%), in each case, with step-downs in the interest rate depending on FTD's leverage ratio. The interest rate set forth in the FTD Credit Agreement for loans made under the term loan B facility is either the prime rate plus 3.50% per annum, or LIBOR plus 4.50% per annum (with a LIBOR floor of 3.00%), in each case, with a step-down in the interest rate depending on FTD's leverage ratio. In addition, there is a commitment fee equal to 0.50% per annum (with step-downs in the commitment fee depending on FTD's leverage ratio) on the unused portion of the revolving credit facility. The FTD Credit Agreement is guaranteed by UNOL Intermediate, Inc. and substantially all of the domestic subsidiaries of FTD and is secured by substantially all of the assets of FTD and such subsidiaries, including a pledge of all of the outstanding capital stock owned by FTD and such guarantors (provided that no more than 66% of the capital stock of any foreign subsidiary is pledged or otherwise secures the FTD Credit Agreement). On the date of the FTD acquisition, term loan A and term loan B under the FTD Credit Agreement were funded and FTD and its subsidiaries undertook UNOLA Corp.'s obligations under the FTD Credit Agreement. The FTD Credit Agreement contains customary representations and warranties, events of default, affirmative covenants and negative covenants that, among other things, require FTD and its subsidiaries not to exceed a maximum leverage ratio and to maintain a minimum fixed charge coverage ratio and imposes restrictions and limitations on, among other things, capital expenditures, investments,
F-25
UNITED ONLINE, INC.
NOTES TO CONSOLIDATED FINANCIAL STATEMENTS (Continued)
5. CREDIT AGREEMENTS (Continued)
dividends, asset sales, and the incurrence of additional debt and liens. Impairment charges recorded by the Company do not impact covenants contained in the FTD Credit Agreement.
The changes in the Company's debt balances, net of discounts, for the years ended December 31, 2009 and 2008 were as follows (in thousands):
| |
Balance at January 1, 2009 |
Repayments of Debt |
Accretion of Discounts |
Balance at December 31, 2009 |
||||||||||
|---|---|---|---|---|---|---|---|---|---|---|---|---|---|---|
UOL Credit Agreement |
$ | 54,859 | $ | (31,431 | ) | $ | 955 | $ | 24,383 | |||||
FTD Credit Agreement, term loan A |
71,812 | (12,872 | ) | 839 | 59,779 | |||||||||
FTD Credit Agreement, term loan B |
286,806 | (45,816 | ) | 3,794 | 244,784 | |||||||||
FTD Credit Agreement, revolving credit facility |
— | — | — | — | ||||||||||
Total |
$ | 413,477 | $ | (90,119 | ) | $ | 5,588 | $ | 328,946 | |||||
| |
Drawn Downs of Debt |
Debt Discounts |
Repayments of Debt |
Accretion of Discounts |
Balance at December 31, 2008 |
||||||||||||
|---|---|---|---|---|---|---|---|---|---|---|---|---|---|---|---|---|---|
UOL Credit Agreement |
$ | 60,000 | $ | (1,681 | ) | $ | (3,750 | ) | $ | 290 | $ | 54,859 | |||||
FTD Credit Agreement, term loan A |
75,000 | (2,458 | ) | (938 | ) | 208 | 71,812 | ||||||||||
FTD Credit Agreement, term loan B |
300,000 | (13,233 | ) | (750 | ) | 789 | 286,806 | ||||||||||
FTD Credit Agreement, revolving credit facility |
6,000 | — | (6,000 | ) | — | — | |||||||||||
Total |
$ | 441,000 | $ | (17,372 | ) | $ | (11,438 | ) | $ | 1,287 | $ | 413,477 | |||||
Future minimum principal payments based upon the outstanding and scheduled mandatory debt payments under the UOL Credit Agreement and FTD Credit Agreement, excluding required prepayments based on excess cash flows, were as follows at December 31, 2009 (in thousands):
| |
|
Year Ending December 31, | ||||||||||||||||||
|---|---|---|---|---|---|---|---|---|---|---|---|---|---|---|---|---|---|---|---|---|
| |
Total Gross Debt | |||||||||||||||||||
| |
2010 | 2011 | 2012 | 2013 | 2014 | |||||||||||||||
UOL Credit Agreement |
$ | 24,819 | $ | 15,000 | $ | 9,819 | $ | — | $ | — | $ | — | ||||||||
FTD Credit Agreement, term loan A |
61,190 | — | 7,199 | 7,649 | 46,342 | — | ||||||||||||||
FTD Credit Agreement, term loan B |
253,435 | — | 2,593 | 2,593 | 2,593 | 245,656 | ||||||||||||||
Total |
$ | 339,444 | $ | 15,000 | $ | 19,611 | $ | 10,242 | $ | 48,935 | $ | 245,656 | ||||||||
At December 31, 2009, the borrowing capacity under the FTD revolving credit facility, which was reduced by $1.0 million in outstanding standby letters of credit, was $49.0 million.
At December 31, 2009, the interest rate on the UOL Credit Agreement was 6.00%. The interest rate on the FTD Credit Agreement term loan A was 5.75% and the interest rate on the FTD Credit Agreement term loan B was 6.75%.
Subject to certain exceptions, United Online, Inc. is required to make quarterly prepayments of a portion of the term loan under the UOL Credit Agreement based on excess cash flow as defined in the
F-26
UNITED ONLINE, INC.
NOTES TO CONSOLIDATED FINANCIAL STATEMENTS (Continued)
5. CREDIT AGREEMENTS (Continued)
UOL Credit Agreement (commencing in the second quarter of 2009). Subject to certain exceptions, FTD Group, Inc. is required to make annual prepayments of a portion of the term loans under the FTD Credit Agreement based on excess cash flow as defined in the FTD Credit Agreement (commencing in the second quarter of 2010). Based on the Company's current projections, under the provisions of the credit facilities, the Company reasonably expects to make excess cash flow debt prepayments of approximately $11.0 million in the next twelve months. Accordingly, this amount has been classified as a current liability on the consolidated balance sheet at December 31, 2009. In addition, in 2009, the Company made voluntary prepayments on the FTD Credit Agreement totaling $57.0 million, eliminating all required payments in 2010.
Under the terms of the FTD Credit Agreement, FTD is significantly restricted from making dividend payments, loans or advances to United Online, Inc. and its subsidiaries other than to UNOL Intermediate, Inc. and its subsidiaries. These restrictions have resulted in the restricted net assets (as defined in Rule 4-08(e)(3) of Regulation S-X) of FTD exceeding 25% of the consolidated net assets of the Company. FTD's restricted net assets at December 31, 2009 and 2008 were $250.5 million and $191.5 million, respectively.
6. DERIVATIVE INSTRUMENTS
Interest Rate Cap
FTD Group, Inc. is required by the FTD Credit Agreement to maintain one or more interest rate swap agreements, interest rate cap agreements, interest rate collar agreements, or other similar instruments to manage risks associated with interest rate fluctuations and exposures on its credit facilities with Wells Fargo Bank, National Association. Accordingly, in November 2008, FTD Group, Inc. entered into a three-year interest rate cap agreement to manage risks associated with interest rate fluctuations on a $150 million notional amount of the FTD Credit Agreement. This instrument was initially accounted for as a cash flow hedge. In January 2009, FTD Group, Inc. changed the interest rate basis of the hedged item from LIBOR-based to prime rate-based and, as a result, the cash flow hedge was de-designated and accordingly does not currently qualify for hedge accounting treatment. The amount of deferred loss on the interest rate cap reclassified from accumulated other comprehensive loss in the statement of stockholders' equity to interest expense since de-designation of the hedge in the first quarter of 2009 was immaterial. The interest rate cap does not contain any credit risk-related contingent features as defined by ASC 815, Derivatives and Hedging.
Foreign Exchange Contracts
In 2009, the Company entered into foreign currency forward contracts between the U.S. Dollar and the British Pound. While these contracts were not designated as hedging instruments for accounting purposes, the Company entered into these derivative contracts to partially offset the economic effect of fluctuations in the currency exchange rate between the U.S. Dollar and the British Pound. These derivatives were intended to minimize the impact of foreign currency exchange rates on intercompany dividend payments in British Pounds. At December 31, 2009, there were no foreign currency forward contracts outstanding. The Company presently anticipates that it may continue to enter into foreign currency forward or other similar contracts to manage foreign currency exchange rate risks. The foreign currency forward contracts did not contain any credit risk-related contingent features as defined by ASC 815.
F-27
UNITED ONLINE, INC.
NOTES TO CONSOLIDATED FINANCIAL STATEMENTS (Continued)
7. FAIR VALUE MEASUREMENTS
The provisions of ASC 820 related to nonfinancial assets and liabilities became effective for the Company on January 1, 2009, and did not have a material impact on the Company's consolidated financial statements.
ASC 820 establishes a three-tiered hierarchy that draws a distinction between market participant assumptions based on (i) quoted prices (unadjusted) in active markets for identical assets and liabilities (Level 1), (ii) inputs other than quoted prices in active markets that are observable either directly or indirectly (Level 2) and (iii) unobservable inputs that require the Company to use present value and other valuation techniques in the determination of fair value (Level 3). The following table presents information about assets and liabilities at December 31, 2009 that are required to be measured at fair value on a recurring basis (in thousands):
Description
|
Total Fair Value |
Level 1 Fair Value |
Level 2 Fair Value |
||||||||
|---|---|---|---|---|---|---|---|---|---|---|---|
Money market funds |
$ | 79,915 | $ | 79,915 | $ | — | |||||
Time deposits |
7,700 | — | 7,700 | ||||||||
Derivative asset |
60 | — | 60 | ||||||||
Total |
$ | 87,675 | $ | 79,915 | $ | 7,760 | |||||
The Company estimated the fair value of its long-term debt using a discounted cash flow technique that incorporates a market interest yield curve with adjustments for duration and risk profile. In determining the market interest yield curve, the Company considered, among other factors, its estimated credit ratings. The Company estimated its credit ratings as A/A- for the long-term debt associated with the UOL Credit Agreement, resulting in a discount rate of 4% and a credit rating of BBB/BB+ for the long-term debt associated with the FTD Credit Agreement, resulting in a discount rate of 6%. The table below summarizes the fair value estimates for long-term debt at December 31, 2009, as defined by ASC 825, Disclosures about Fair Value of Financial Instruments, (in thousands):
| |
December 31, 2009 | ||||||
|---|---|---|---|---|---|---|---|
| |
Carrying Amount |
Estimated Fair Value |
|||||
Long-term debt, net of discounts, including current portion |
$ | 328,946 | $ | 365,260 | |||
8. STOCKHOLDERS' EQUITY
Stockholders' Rights Plan
On November 15, 2001, the Board of Directors declared a dividend of one preferred share purchase right for each outstanding share of the Company's common stock. The dividend was paid on November 26, 2001 to the stockholders of record at the close of business on that date. Each right entitles the registered holder to purchase from the Company one unit consisting of one one-thousandth of a share of its Series A junior participating preferred stock at a price of $25 per unit. On April 29, 2003, the Board of Directors voted to amend the purchase price per unit from $25 to $140. The rights generally will be exercisable only if a person or group acquires beneficial ownership of 15% or more of the Company's common stock or announces a tender or exchange offer which would result in a person or group owning 15% or more of the Company's common stock. The Company generally will be entitled to redeem the rights at $0.0007 per right at any time until 10 days after a public announcement
F-28
UNITED ONLINE, INC.
NOTES TO CONSOLIDATED FINANCIAL STATEMENTS (Continued)
8. STOCKHOLDERS' EQUITY (Continued)
that a 15% position in the Company's common stock has been acquired or that a tender or exchange offer which would result in a person or group owning 15% or more of the Company's common stock has commenced. The rights expire on November 26, 2011.
Preferred Stock
The Company has 5.0 million shares of preferred stock authorized with a par value of $0.0001, of which 300,000 shares are designated as Series A junior participating preferred stock. At December 31, 2009 and 2008, the Company had no preferred shares issued or outstanding.
Common Stock Repurchases
United Online, Inc.'s Board of Directors authorized a common stock repurchase program (the "program") that allows the Company to repurchase shares of its common stock through open market or privately negotiated transactions based on prevailing market conditions and other factors through December 31, 2010. From August 2001 through December 31, 2009, the Company had repurchased $139.2 million of its common stock under the program, leaving $60.8 million of authorization remaining under the program. The Company has not repurchased any shares of its common stock under the program since February 2005.
Shares withheld upon the vesting of restricted stock units and restricted stock awards and upon the issuance of stock awards to pay applicable employee withholding taxes are considered common stock repurchases, but are not counted as purchases against the program. Upon vesting of restricted stock units and restricted stock awards or issuance of stock awards, the Company currently does not collect the applicable employee withholding taxes from employees. Instead, the Company automatically withholds, from the restricted stock units that vest, and from the stock awards that are issued, the portion of those shares with a fair market value equal to the amount of the employee withholding taxes due, which is accounted for as a repurchase of common stock. The Company then pays the applicable withholding taxes in cash. The amounts remitted in the years ended December 31, 2009, 2008 and 2007 were $6.8 million, $8.8 million and $5.6 million, respectively, for which the Company withheld 1,066,000, 806,000 and 390,000 shares of common stock, respectively, that were underlying the restricted stock units and restricted stock awards which vested and stock awards that were issued.
Dividends
Dividends are paid on shares of common stock and, in general, unvested restricted stock units outstanding as of the record date.
In February, April, July, and October 2007, United Online, Inc.'s Board of Directors declared quarterly cash dividends of $0.20 per share of common stock. The dividends were paid on February 28, May 31, August 31, and November 30, 2007 and totaled $13.7 million, $14.4 million, $14.4 million, and $14.6 million, respectively.
F-29
UNITED ONLINE, INC.
NOTES TO CONSOLIDATED FINANCIAL STATEMENTS (Continued)
8. STOCKHOLDERS' EQUITY (Continued)
In January, April and July 2008, United Online, Inc.'s Board of Directors declared quarterly cash dividends of $0.20 per share of common stock. The dividends were paid on February 29, May 30, and August 29, 2008 and totaled $14.6 million, $14.9 million, and $14.9 million, respectively. Following the closing of the FTD acquisition, United Online, Inc.'s Board of Directors decreased the cash dividend from $0.20 per share of common stock to $0.10 per share of common stock. In October 2008, United Online, Inc.'s Board of Directors declared a quarterly cash dividend of $0.10 per share of common stock. The dividend was paid on November 28, 2008 and totaled $8.7 million.
In January, April, July, and October 2009, United Online, Inc.'s Board of Directors declared quarterly cash dividends of $0.10 per share of common stock. The dividends were paid on February 27, May 29, August 31, and November 30, 2009 and totaled $8.8 million, $9.1 million, $9.2 million, and $9.1 million, respectively.
In February 2010, United Online, Inc.'s Board of Directors declared a quarterly cash dividend of $0.10 per share of common stock. The record date was February 14, 2010 and the dividend will be paid on February 26, 2010.
The payment of future dividends is discretionary and is subject to determination by United Online, Inc.'s Board of Directors each quarter following its review of the Company's financial performance and other factors. Dividends are declared and paid out of the Company's surplus, as defined and computed in accordance with the General Corporation Law of the State of Delaware.
Accumulated Other Comprehensive Income (Loss)
Accumulated other comprehensive income (loss) was as follows (in thousands):
| |
Change in unrealized gain (loss) on short-term investments, net of tax |
Change in unrealized gain (loss) on derivatives, net of tax |
Foreign currency translation |
Accumulated Other Comprehensive Income (Loss) |
||||||||||
|---|---|---|---|---|---|---|---|---|---|---|---|---|---|---|
Balance at January 1, 2007 |
$ | (128 | ) | $ | — | $ | (117 | ) | $ | (245 | ) | |||
Current period change |
285 | — | 142 | 427 | ||||||||||
Balance at December 31, 2007 |
157 | — | 25 | 182 | ||||||||||
Current period change |
(157 | ) | (242 | ) | (46,802 | ) | (47,201 | ) | ||||||
Balance at December 31, 2008 |
— | (242 | ) | (46,777 | ) | (47,019 | ) | |||||||
Current period change |
— | — | 20,056 | 20,056 | ||||||||||
Balance at December 31, 2009 |
$ | — | $ | (242 | ) | $ | (26,721 | ) | $ | (26,963 | ) | |||
9. STOCK-BASED COMPENSATION PLANS
The Company has four active equity plans, under three of which, in general, it is authorized to grant stock options, stock awards and restricted stock units.
Restricted stock units granted to employees generally vest over a one- to four-year period under a variety of vesting schedules and are canceled upon termination of employment. Restricted stock units granted to non-employee directors generally vest annually over a one-year period.
F-30
UNITED ONLINE, INC.
NOTES TO CONSOLIDATED FINANCIAL STATEMENTS (Continued)
9. STOCK-BASED COMPENSATION PLANS (Continued)
Stock options granted to employees generally vest over a three- or four-year period under a variety of vesting schedules and are canceled upon termination of employment. Stock options granted to non-employee directors generally vest over a nine-month to three-year period, either monthly or annually. Stock option grants expire after ten years unless canceled earlier due to termination of employment or Board of Directors service. Certain stock option grants are immediately exercisable for unvested shares of common stock, with the unvested portion of the shares remaining subject to repurchase by the Company at the exercise price until the vesting period is complete.
Upon the exercise of a stock option award, the vesting of a restricted stock unit or the award of common stock or restricted stock, shares of common stock are issued from authorized but unissued shares.
The following table summarizes the aggregate shares reserved for issuance and the shares available for grant under the Company's equity plans at December 31, 2009 (in thousands):
| |
Aggregate Shares Reserved for Issuance |
Shares Available for Grant |
||||||
|---|---|---|---|---|---|---|---|---|
2001 Stock Incentive Plan |
27,676 | 3,693 | ||||||
2001 Supplemental Stock Incentive Plan |
5,253 | 390 | ||||||
Classmates Online, Inc. 2004 Stock Plan |
1,128 | 553 | ||||||
FTD Group, Inc. 2005 Equity Incentive Plan |
1,462 | 516 | ||||||
Total |
35,519 | 5,152 | ||||||
The Company cannot grant restricted stock units from the Classmates Online, Inc. 2004 Stock Plan.
Stock-Based Compensation
The following table summarizes the stock-based compensation that has been included in the following captions within the consolidated statements of operations for each of the periods presented (in thousands):
| |
Year Ended December 31, | ||||||||||
|---|---|---|---|---|---|---|---|---|---|---|---|
| |
2009 | 2008 | 2007 | ||||||||
Operating expenses: |
|||||||||||
Cost of revenues—services |
$ | 943 | $ | 1,049 | $ | 884 | |||||
Cost of revenues—products |
43 | — | — | ||||||||
Sales and marketing |
5,472 | 7,250 | 4,031 | ||||||||
Technology and development |
4,856 | 6,410 | 4,941 | ||||||||
General and administrative |
28,766 | 21,818 | 9,693 | ||||||||
Total stock-based compensation |
$ | 40,080 | $ | 36,527 | $ | 19,549 | |||||
Tax benefit recognized |
$ | 7,890 | $ | 8,952 | $ | 4,529 | |||||
F-31
UNITED ONLINE, INC.
NOTES TO CONSOLIDATED FINANCIAL STATEMENTS (Continued)
9. STOCK-BASED COMPENSATION PLANS (Continued)