Attached files
| file | filename |
|---|---|
| EX-21 - EX-21 - Talecris Biotherapeutics Holdings Corp. | a10-1548_1ex21.htm |
| EX-32.2 - EX-32.2 - Talecris Biotherapeutics Holdings Corp. | a10-1548_1ex32d2.htm |
| EX-32.1 - EX-32.1 - Talecris Biotherapeutics Holdings Corp. | a10-1548_1ex32d1.htm |
| EX-23.1 - EX-23.1 - Talecris Biotherapeutics Holdings Corp. | a10-1548_1ex23d1.htm |
| EX-31.2 - EX-31.2 - Talecris Biotherapeutics Holdings Corp. | a10-1548_1ex31d2.htm |
| EX-31.1 - EX-31.1 - Talecris Biotherapeutics Holdings Corp. | a10-1548_1ex31d1.htm |
UNITED STATES
SECURITIES AND EXCHANGE COMMISSION
WASHINGTON, D.C. 20549
Form 10-K
(Mark One)
|
x |
ANNUAL REPORT PURSUANT TO SECTION 13 OR 15(d) OF THE SECURITIES EXCHANGE ACT OF 1934 |
For the fiscal year ended December 31, 2009
or
|
o |
TRANSITION REPORT PURSUANT TO SECTION 13 OR 15(d) OF THE SECURITIES EXCHANGE ACT OF 1934 |
For the transition period from to
Commission file number: 001-34473
TALECRIS BIOTHERAPEUTICS HOLDINGS CORP.
(Exact name of registrant as specified in its charter)
|
Delaware |
|
20-2533768 |
|
(State or other jurisdiction of |
|
(IRS Employer Identification No.) |
P.O. Box 110526
4101 Research Commons
79 T.W. Alexander Drive
Research Triangle Park, North Carolina 27709
(Address of principal
executive offices, including
Zip Code)
(919) 316-6300
(Registrant’s telephone number, including area code)
Securities registered pursuant to Section 12(b) of the Act:
|
Title of each class |
|
Name of
each exchange on which |
|
Common Stock, $0.01 par value |
|
The NASDAQ Global Select Market |
Securities registered pursuant to section 12(g) of the Act: None
Indicate by check mark if the registrant is a well-known seasoned issuer, as defined in Rule 405 of the Securities Act. Yes o No x
Indicate by check mark if the registrant is not required to file reports pursuant to Section 13 or Section 15(d) of the Act. Yes o No x
Indicate by check mark whether the registrant (1) has filed all reports required to be filed by Section 13 or 15(d) of the Securities Exchange Act of 1934 during the preceding 12 months (or for such shorter period that the registrant was required to file such reports), and (2) has been subject to such filing requirements for the past 90 days. Yes x No o
Indicate by check mark whether the registrant has submitted electronically and posted on its corporate Website, if any, every Interactive Data File required to be submitted and posted pursuant to Rule 405 of Regulation S-T (§232.405 of this chapter) during the preceding 12 months (or for such shorter period that the registrant was required to submit and post such files) Yes o No o
Indicate by check mark if disclosure of delinquent filers pursuant to Item 405 of Regulation S-K (§229.405 of this chapter) is not contained herein, and will not be contained, to the best of registrant’s knowledge, in definitive proxy or information statements incorporated by reference in Part III of this Form 10-K or any amendment to this Form 10-K. x
Indicate by check mark whether the registrant is a large accelerated filer, an accelerated filer, a non-accelerated filer, or a smaller reporting company. See definitions of “large accelerated filer,” “accelerated filer” and “smaller reporting company” in Rule 12b-2 of the Exchange Act.
|
Large accelerated filer o |
|
Accelerated filer o |
|
|
|
|
|
Non- accelerated filer x |
|
Smaller reporting company o |
Indicate by check mark whether the registrant is a shell company (as defined in Rule 12b-2 of the Act). Yes o No x
The registrant commenced the initial public offering of its common stock on September 30, 2009. Accordingly, there was no public market for the registrant’s common stock as of June 30, 2009, the last business day of the registrant’s most recently completed second fiscal quarter.
Indicate the number of shares outstanding of each of the registrant’s classes of common stock, as of the latest practicable date. 122,552,847 shares of Common Stock, $0.01 par value, as of February 10, 2010.
DOCUMENTS INCORPORATED BY REFERENCE
Portions of the Talecris Biotherapeutics Holdings Corp. Definitive Proxy Statement to the 2010 Annual Meeting of Stockholders to be filed with the Securities and Exchange Commission within 120 days after the close of the registrant’s fiscal year are incorporated by reference in Part III to the extent described therein.
Talecris Biotherapeutics Holdings Corp.
2009 Annual Report on Form 10-K
|
|
|
|
|
Page |
|
|
1 |
|||
|
|
|
|
|
|
|
|
|
2 |
||
|
|
|
32 |
||
|
|
|
58 |
||
|
|
|
58 |
||
|
|
|
59 |
||
|
|
|
59 |
||
|
|
|
|
|
|
|
|
|
|
|
|
|
|
|
61 |
||
|
|
|
65 |
||
|
|
Management’s Discussion and Analysis of Financial Condition and Results of Operations |
|
67 |
|
|
|
|
107 |
||
|
|
|
109 |
||
|
|
Changes in and Disagreements With Accountants on Accounting and Financial Disclosure |
|
154 |
|
|
|
|
154 |
||
|
|
|
154 |
||
|
|
|
|
|
|
|
|
|
|
|
|
|
|
|
155 |
||
|
|
|
157 |
||
|
|
Security Ownership of Certain Beneficial Owners and Management and Related Stockholder Matters |
|
157 |
|
|
|
Certain Relationships and Related Transactions, and Director Independence |
|
157 |
|
|
|
|
157 |
||
|
|
|
|
|
|
|
|
|
|
|
|
|
|
|
158 |
||
|
|
|
|
162 |
|
Special Note Regarding Forward-Looking Statements
This Annual Report on Form 10-K (Annual Report) contains forward-looking statements that involve substantial risks and uncertainties. All statements, other than statements of historical facts, included in this Annual Report, regarding our strategy, future operations, future financial position, future revenue, projected costs, prospects, plans and objectives of management are forward-looking statements. Forward-looking statements may be identified by the use of forward-looking terms such as “may,” “will,” “would,” “expects,” “intends,” “believes,” “anticipates,” “plans,” “predicts,” “estimates,” “projects,” “targets,” “forecasts,” “seeks,” or the negative of such terms or other variations on such terms or comparable terminology. The forward-looking statements that we make are based upon assumptions about many important risk factors, many of which are beyond our control. Among the factors that could cause actual results to differ materially are the following:
· possible U.S. legislation, regulatory action or legal proceedings affecting, among other things, the U.S. healthcare system, pharmaceutical pricing and reimbursement, including Medicaid, Medicare and the Public Health Service Program;
· our ability to procure adequate quantities of plasma and other materials which are acceptable for use in our manufacturing processes from our own plasma collection centers or from third-party vendors;
· our ability to maintain compliance with government regulations and licenses, including those related to plasma collection, production, and marketing;
· our ability to identify growth opportunities for existing products and our ability to identify and develop new product candidates through our research and development activities;
· the timing of, and our ability to, obtain and/or maintain regulatory approvals for new product candidates, the rate and degree of market acceptance, and the clinical utility of our products;
· unexpected shut-downs of our manufacturing and storage facilities or delays in opening new planned facilities;
· our and our suppliers’ ability to adhere to cGMP;
· our ability to manufacture at appropriate scale to meet the market’s demand for our products;
· legislation or regulations in markets outside of the U.S. affecting product pricing, reimbursement, access, or distribution channels;
· our ability to resume or replace sales to countries affected by our Foreign Corrupt Practices Act investigation;
· availability and cost of financing opportunities;
· the impact of geographic and product mix on our sales and gross profit;
· the impact of competitive products and pricing;
· fluctuations in the balance between supply and demand with respect to the market for plasma-derived products;
· interest rate fluctuations impacting our Revolving Credit Facility and foreign currency exchange rate fluctuations in the international markets in which we operate;
· the impact of our substantial capital plan over the next five years; and
· other factors identified elsewhere in this Annual Report.
No assurances can be provided as to any future financial results. Our forward-looking statements do not reflect the potential impact of any future acquisitions, mergers, dispositions, joint ventures, or investments we may make. Unless legally required, we do not undertake to update or revise any forward-looking statements, even if events make it clear that any projected results, expressed or implied, will not be realized.
Unless otherwise stated or the context otherwise requires, references in this Annual Report to “Talecris,” “we,” “us,” “our” and similar references refer to Talecris Biotherapeutics Holdings Corp. and its wholly-owned subsidiaries.
Overview
We are a biopharmaceutical company that is one of the largest producers and marketers of plasma-derived protein therapies in the world. We develop, produce, market, and distribute therapies that extend and enhance the lives of people suffering from chronic and acute, often life-threatening, conditions, such as chronic inflammatory demyelinating polyneuropathy (CIDP), primary immune deficiencies (PI), alpha-1 antitrypsin deficiency, bleeding disorders, infectious diseases and severe trauma. Our products are derived from human plasma, the liquid component of blood, which is sourced from our plasma collection centers or purchased from third parties, located in the United States. Plasma contains many therapeutic proteins which we extract through a process known as fractionation at our Clayton, North Carolina and/or Melville, New York facilities. The fractionated intermediates are then purified, formulated into a final bulk, and aseptically filled into final containers for distribution. We also sell fractionated intermediate materials. Our manufacturing facilities currently have the capacity to fractionate approximately 4.2 million liters of human plasma per year. Purification, filling and finishing capacities are dependent on fraction mix.
Our largest product, Gamunex, Immune Globulin Intravenous (Human), 10% Caprylate/Chromatography Purified, is one of the leading products in the intravenous immune globulin (IGIV) segment, with a reputation as a premium product. Gamunex is the only IGIV approved for the treatment of CIDP, a neurological indication, in the U.S., Canada and 17 European countries. The Gamunex IGIV share of sales was 25% in the U.S. in 2009 and 16% globally in 2007 based on MRB data. Our second largest product, Prolastin Alpha-1 Proteinase Inhibitor (Human) had a 67% share of sales in the United States in 2008 and a 76% share of sales worldwide in 2007 and has a high degree of brand recognition within the alpha-1 proteinase inhibitor, or A1PI, category. In addition to Gamunex and Prolastin, which together represented 74.7% of our net revenue in 2009, we also produce and sell albumin, Koate DVI Factor VIII, hyperimmunes, Thrombate III, PPF powder and other products. Our products are primarily prescribed by specialty physicians, including neurologists, immunologists, pulmonologists, and hematologists. Our six key products categories and their indications are given in the table below:
|
Category and Talecris |
|
Talecris Indications |
|
Talecris |
|
Talecris Net |
|
IGIV |
|
U.S., Canada and EU—PI,ITP, CIDP. |
|
25%—U.S.(1) |
|
$599.8—U.S. |
|
|
Canada and EU—Post Bone Marrow Transplant, Pediatric HIV Infection. |
|
16%—Worldwide(2) |
|
$826.4(3)—Worldwide |
|
|
|
|
EU only—Kawasaki Disease, Guillain Barre Syndrome, Chronic Lymphocytic Leukemia, Multiple Myeloma |
|
|
|
|
|
A1PI |
|
A1PI Deficiency related emphysema |
|
67%—U.S.(4) |
|
$206.1—U.S. |
|
|
|
|
76%—Worldwide(2) |
|
$319.1—Worldwide |
|
|
Fraction V (Albumin and PPF) |
|
Plasma expanders, severe trauma, acute liver and kidney failures |
|
9%—U.S.(4) 7%—Worldwide(2) |
|
$44.8—U.S. $84.8(3)—Worldwide |
|
Factor VIII |
|
Hemophilia A |
|
4%—U.S.(4) 3%—Worldwide(2) |
|
$13.6—U.S. $46.5—Worldwide |
|
Antithrombin III |
|
Heriditary antithrombin III deficiency |
|
100%—U.S.(4) 5%—Worldwide(2) |
|
$24.2—U.S. $24.2—Worldwide |
|
Hyperimmunes |
|
Hepatitis A, Hepatitis B, Rabies, RH Sensitization, Tetanus |
|
22%—U.S.(4) 10%—Worldwide(2) |
|
$59.5—U.S. $74.2—Worldwide |
(1) For the 2009 calendar year, according to MRB 2009 estimate (MRB IVIG 2015: A Forecast of the Polyvalent Intravenous Immune Globulin (IVIG) Market in the United Sates in 2015, October 2009).
(2) For the 2007 calendar year, according to MRB. Includes IGIV contract fractionation revenues.
(3) Excludes contract fractionation revenues from the Canadian blood system operators.
(4) For the 2008 calendar year, according to MRB.
We established our leading industry positions through a history of innovation including developing the first ready-to-use 10% liquid IGIV product in North America, the only IGIV product approved for use in neurology in North America, and the first A1PI product globally. Our primary products have orphan drug designation to serve populations with rare, chronic diseases. We continue to develop products to address unmet medical needs and, as of December 31, 2009, employ approximately 300 scientists and support staff to develop new products, expand the uses of our existing products, and enhance our process technologies. We focus our research and development efforts in three key areas: continued enhancement of our process technologies, including pathogen safety, life cycle management for our existing products, including new indications, and discovery of new products. Our research and development expenditures amounted to $71.2 million for the year ended December 31, 2009.
Our business is supported by an integrated infrastructure including, as of December 31, 2009, 69 plasma collection centers (64 FDA licensed, 5 unlicensed), two owned and operated manufacturing facilities (including our primary manufacturing facility in Clayton, North Carolina, which is one of the world’s largest integrated fractionation and purification facilities), a distribution network and sales and marketing organizations in the U.S., Canada, Germany, and other international regions. Our heritage of patient care innovations in therapeutic proteins dates back to Cutter Laboratories, which began to produce plasma-derived products in the early 1940s, and its successor companies, including Miles Inc., Bayer Corporation and Bayer Healthcare LLC. Our long experience as a producer and marketer of plasma-derived protein therapies has enabled us to forge strong ties with members of the medical community, patient advocacy groups and our distributors.
Competitive Strengths
We believe that the following strengths position us to compete effectively in the plasma products industry:
· Premium Global Liquid 10% IGIV Product. Our product, Gamunex IGIV, which was launched in North America in 2003 as a premium ready-to-use liquid IGIV product, is one of the leading products in the IGIV segment with a 25% share of U.S. sales in 2009 according to the MRB 2009 estimate. We believe Gamunex IGIV is considered to be the industry benchmark due to a comprehensive set of differentiated product characteristics that have positioned it as the premium product in its category since its launch. As a measure of our focus on continued enhancement of product safety, the manufacturing process for our IGIV therapy incorporates prion removal, which is described in the FDA approved labeling for Gamunex. We also use a patented caprylate process that preserves more of the fragile IgG proteins compared to prior generation IGIV products made with a harsher solvent/detergent purification process. Gamunex IGIV is the only IGIV approved for CIDP in the U.S., Canada and 17 European countries. Our CIDP indication approval makes Gamunex the only IGIV approved for use in a neurological indication in North America. According to an independent survey by Harris Interactive, CIDP is the largest IGIV segment in the U.S., representing 29% of total unit volume. As the only FDA approved IGIV for CIDP, we believe we doubled our licensed market access to 61% of total U.S. IGIV unit volume. Further, the FDA granted Gamunex IGIV orphan drug status, which provides marketing exclusivity for the CIDP indication in the U.S. through September 2015.
· Leading Producer of A1PI with Strong Brand Recognition. We are the world’s largest producer of A1PI, which is used for the treatment of A1PI deficiency-related emphysema. In 2008, Prolastin A1PI had a 67% share of sales in the United States and an over 90% share of sales in the European Union (EU) where it is licensed in 15 countries and competes with another licensed A1PI product only in Spain. We are also the only licensed A1PI product in Canada. While other manufacturers began selling A1PI products in the United States and Spain beginning in 2003, we continue to benefit
from having been the first provider in this product class and from our strong relationships with the primary patient advocacy groups. We believe Prolastin is differentiated in the United States by its unique direct-to-patient distribution and service model, Prolastin Direct, which provides easy enrollment, home infusion, access to insurance experts and patient-centered health management. Prolastin Direct health management provides better patient outcomes by reducing the frequency of respiratory exacerbations. Furthermore, Prolastin Direct results in high medication compliance, with over 94% of prescribed doses being administered annually and high patient loyalty, with an annual retention rate of over 96%. Based upon our internal estimates, we believe that approximately 30% of the global patient population for A1PI products resides in European countries where Prolastin is now licensed. We are developing additional product enhancements, including inhaled and recombinant versions of our A1PI product. We received FDA approval for our next generation A1PI product, Prolastin-C A1PI in October 2009. A post-approval clinical trial was required as a condition for approval. We submitted a supplemental New Drug Submission (sNDS) to Health Canada for the approval of Prolastin-C A1PI in March 2009 and Prolastin-C A1PI was approved for use in Canada in February 2010. Presently, additional clinical trials are being required by European authorities as a precursor to Prolastin-C A1PI approval in Europe. We are currently in the process of launching Prolastin-C A1PI in the U.S. and Canada. Prolastin-C A1PI has improved yields and higher concentration. As a result, infusion time for patients will be significantly reduced.
· Vertically Integrated Global Platform. We have an integrated platform that allows us to appropriately control our plasma supply and production process.
· TPR Plasma Platform: Until 2006, we purchased all of our plasma, which is our primary raw material, from third parties. Since then, we have successfully designed and executed our vertical plasma supply integration strategy and, as of December 31, 2009, we operated 69 plasma collection centers (64 FDA licensed, 5 unlicensed) with approximately 2,400 employees. Over the past two years, we have aggressively expanded our plasma supply through these collection centers under our wholly-owned subsidiary, Talecris Plasma Resources, Inc. (TPR). This gives us access to future supply of plasma that we believe will meet product demand and enable us to increase gross margin as we lower our collection cost per liter. These centers collectively represent substantially all of our currently planned collection center network for the next three years. We expect that this network, once it matures, will provide in excess of 90% of our current plasma requirements. Additionally, in August 2008 we entered into a five-year plasma supply agreement with CSL Plasma Inc., which has declining annual minimum volume commitments with the ability to request higher volumes annually, and provides flexibility as we increase internal production.
· Integrated Facilities: Our Clayton, North Carolina site is one of the world’s largest integrated protein manufacturing sites, including fractionation, purification and aseptic filling and finishing of plasma-derived proteins. Together with our facility in Melville, New York, we have a combined fractionation capacity of approximately 4.2 million liters of plasma per year. We processed approximately 3.6 million liters of plasma during 2009, which represented a utilization rate of approximately 85% of our fractionation capacity. Our facilities at Clayton have benefited from roughly $630 million of capital investment since 1995, including compliance enhancements, general site infrastructure upgrades, capacity expansions, and new facilities, such as our chromatographic purification facilities and our high-capacity sterile filling facility. We have embarked on a capital expenditure plan which we currently estimate will be in the range of $750 million to $800 million through 2014, which includes the expansion of our fractionation capacity 43% to 6.0 million liters in order to allow us to keep pace with the expected demand growth for plasma-derived products and to provide a balance with our Gamunex purification capacities.
· Leader and Innovator in the Global Plasma Products Industry. We are one of the largest producers and marketers of plasma-derived protein therapies in the world. We have a successful history of product innovation and commercialization, and we possess specific expertise and core competencies in the development, purification, large-scale manufacture and sale of protein therapeutics. Our longstanding infrastructure, processes and expertise have enabled us to develop a stable of growing marketed products and create a robust pipeline of potential new products and lifecycle management opportunities for our existing products.
· Process and Product Innovation: We are the developer of the first ready-to-use 10% liquid IGIV product in North America and the first A1PI product in the world. We have applied new developments in protein purification, including caprylate and chromatography technologies, and are now producing and selling a third generation IGIV product.
· R&D Pipeline: Our current research and development consists of a range of programs that aim to develop new products, obtain new therapeutic indications for existing products, enhance product delivery, improve concentrations and safety, and increase product yields. Our Phase I candidate, Plasmin, represents an
opportunity to expand into a new segment addressing the dissolution of blood clots including acute peripheral arterial occlusion (aPAO) and ischemic stroke. We have also successfully completed pivotal clinical trials and submitted regulatory filings for licensure of Gamunex for subcutaneous administration for the treatment of PI. Prolastin-C A1PI was recently approved by the FDA and Health Canada.
· Favorable Distribution Arrangements. We enjoy favorable distribution arrangements, particularly in North America for our IGIV products. Our size, history and reputation in the industry have enabled us to establish direct and indirect channels for the distribution of our products, and have provided us with experience in appropriately addressing our key regulators, doctors, patient advocacy groups and plasma protein policy makers.
· In the U.S., we have three specialty sales teams (Immunology/Neurology, Pulmonary and Hematology/Specialty) that have a combination of extensive commercial and healthcare-related experience calling on a variety of touch points including physicians, pharmacists, and homecare companies. Our specialty sales teams educate physicians and other healthcare providers on the benefits of our plasma-derived therapies. Our Immunology/Neurology team focuses on promoting Gamunex as the only IGIV product approved for a neurological indication in the U.S. Our Pulmonary team focuses on the identification of A1PI patients and driving brand choice for Prolastin. Our Hematology/Specialty team promotes Koate, Thrombate III, and our portfolio of hyperimmune products.
· We are the primary supplier of plasma-derived products to the Canadian blood system under our contracts with the two national Canadian blood system operators, Canadian Blood Services and Hema Quebec. We were awarded five year contracts which became effective April 1, 2008. Under these contracts, we currently fractionate 70% of Canadian plasma and we expect to supply the majority of the Canadian requirements for IGIV during the terms of the contracts. The contracts may be extended for two one-year terms upon agreement of the parties. The total purchase commitment by Canadian Blood Services and Hema Quebec under these contracts was approximately $139 million and $71 million, respectively, in 2009 and will be $122 million and $62 million, respectively, in 2010, subject to annual volume and price adjustments. Canadian Blood Services has elected to pursue a dual-source strategy and although we will continue to be the primary supplier, we incorporate likely annual volume declines because of their strategy. Hema Quebec has a sole source strategy for fractionation of their plasma and we expect our IGIV share to remain relatively constant through the duration of the contract. We expect to offset the overall volume decline in Canada with increased sales in Europe as well as in other international markets. We transport plasma from Canadian Blood Services and Hema Quebec collection centers to our manufacturing facility in Clayton, North Carolina for fractionation, and return the finished product, along with commercial product, for sale to Canadian Blood Services and Hema Quebec. Pricing for our products and services was set at the beginning of the contract period, subject to adjustment for inflation. The contracts are terminable upon the occurrence of certain events, including a third party obtaining Canadian regulatory approval to introduce a significantly superior product or fractionation service. These five-year contracts are currently the largest government contracts for IGIV units globally.
· We have rationalized our distribution network and simultaneously entered into long-term distribution agreements with major hospital group purchasing organizations, or GPOs, home care and specialty pharmacy providers and distributors which we believe grant us favorable committed volume and payment terms, including liquidated damages if they fail to purchase the agreed volume of products. We have contractual commitments from our customers for a majority of our North American IGIV volume over the next three years. We have made appropriate commitments to the Public Health Service and Federal Supply Schedule programs as part of our distribution system.
· Experienced, Proven Management Team. Our business is led by an experienced management team, with our executive officers possessing an average of nearly 11 years of experience in the plasma/protein therapeutics business and an average of over 15 years of experience in healthcare-related businesses. We have the complex technical knowledge required in the protein therapeutic products industry, proven competency in commercializing protein therapeutic products and the expertise to manage an operationally complex business efficiently.
Business Strategy
Our goal is to be the recognized global leader in developing and delivering premium protein therapies to extend and enhance the lives of individuals suffering from chronic, acute and life-threatening conditions. The key elements of our strategy for achieving this goal are as follows:
· Achieve Cost Efficiencies in Our Plasma Collection Platform. In 2006, we made the strategic decision to vertically integrate our plasma supply chain in order to enhance the predictability, sustainability and profitability of our plasma supply. Our rapid vertical integration of our plasma supply was accomplished through the development of an extensive infrastructure to manage the multiple work streams necessary to accomplish the development of our current plasma collection platform. The infrastructure necessary to integrate the centers we acquired from IBR in November 2006 and to open new centers which formed our sixty-nine center system included third party consultants as well as additional management. Given that it generally takes three to four years to mature a plasma center, many of our centers are immature. We have eliminated the third party consultants used to develop the platform and reduced the management necessary to drive the platform development resulting in a significant reduction in cost. Additionally, as we increase the utilization of the platform, we achieve economies of scale that result in lower cost per liter. These factors will lead to improving cost per liter of plasma collected and the elimination of unabsorbed TPR infrastructure and start-up costs charged directly to cost of goods sold. Consequently, we expect that the improvement in our plasma collection costs will provide a near-term gross margin improvement opportunity.
· Improve Operating Leverage through Increased Recovery of Plasma Proteins. We seek to improve our profitability by capitalizing on the operating leverage in our business model. A significant portion of our cost structure, other than raw materials, is relatively fixed and therefore incremental volume contributes significant additional profit. Our capital expenditure plan is designed, in part, to facilitate the production of an increasing volume of existing and new products from each liter of plasma. We currently have purification capacity constraints related to the production of albumin and Koate, our plasma-derived Factor VIII product. We also expect to be less efficient in the utilization of each incremental liter of plasma fractionated as we increase Gamunex production, which will result in gross margin erosion. Additionally, we anticipate that we will reach our fractionation capacity in the near future. Consequently, we have embarked on a capital expenditure plan which we currently estimate will be in the range of $750 million to $800 million through 2014. Key elements of this plan include a new fractionation facility currently estimated to range from $280 million to $300 million, based on conceptual engineering, to expand our fractionation capacity from 4.2 million liters to 6.0 million liters. This 43% capacity expansion will allow us to keep pace with expected demand growth for plasma-derived products and will provide a balance with our Gamunex purification capacity. We also plan to expand albumin and Koate purification capacities. We are targeting 2015 for commercial production from our new fractionation facility, with additional albumin and Koate purification capacities available in the next five to six years. This capacity expansion will allow us to improve the utilization of the proteins in each liter of plasma which should result in additional gross margin improvement opportunities once completed.
· Enhance Growth through New Plasma-Derived and Recombinant Proteins. We continue to pursue growth through our internal development capabilities and in-licensing of new technologies and products. Increases in our research and development spending will be driven by our emphasis on new plasma-derived molecules as well as the development of our recombinant capabilities in addition to our life cycle management activities, particularly as they relate to A1PI. We believe that our plasma-derived and recombinant Plasmin therapies hold particular promise. Plasmin is a natural protein that dissolves blood clots for which we are pursuing two versions. We are developing a plasma-derived molecule, which is in a Phase I clinical trial for aPAO and a commercial process to produce a recombinant form to treat ischemic stroke. Additionally, we are developing recombinant versions of Factor VIII and A1PI through the use of human cell lines. If successful, the development of these therapies could significantly improve our revenue and profitability. In addition, our external business development will focus on proteins where we have synergies or core competencies in research, manufacturing and/or marketing.
· Broaden Geographic Reach. During 2009, approximately 80% of our net revenue was generated in North America, whereas North America represented only approximately 40% of global plasma product sales in 2007, according to MRB. Although our business is concentrated in North America, we see significant opportunities to broaden our geographic reach in Europe as well as the rest of the world. In terms of A1PI, there are a number of European countries with registries of identified A1PI patients whose healthcare systems currently do not provide for reimbursement for the use of A1PI therapy. We hope to obtain reimbursement for these patients as we engage with the respective governmental healthcare organizations, patient advocacy groups and supporting physicians and scientists. We also believe that the approval for the CIDP indication in 17 European countries will facilitate Gamunex market expansion. Additionally, we believe that the demand for plasma-derived therapies, particularly IGIV, Factor VIII and albumin are increasing internationally with improving socio-economic conditions and medical education regarding the benefits of plasma-derived therapies. Until our facilities are expanded as described above, significant growth in our international distribution will be limited and our focus will be on developing channels and relationships.
Executing the above elements of our strategy should enable the profitable growth of our business. We plan to achieve further cost efficiencies in our plasma collection platform through increased utilization and economies of scale which will lead to a lower cost per liter of plasma. We expect to increase our operating leverage through capacity expansion and recovering more proteins per liter.
Our geographic expansion will continue. We will continue to invest in new plasma-derived and recombinant proteins. Lastly, we believe we are well positioned to benefit from the favorable industry dynamics.
Products
The majority of our sales are concentrated in the therapeutic areas of: Immunology/Neurology, primarily through our intravenous immune globulin (IGIV) product for the treatment of primary immune deficiency, CIDP, and Pulmonology, through our alpha-1 proteinase inhibitor (A1PI) product for the treatment of alpha-1 antitrypsin deficiency-related emphysema. These therapeutic areas are served by our branded products, Gamunex brand IGIV (Gamunex or Gamunex IGIV), Prolastin brand A1PI (Prolastin or Prolastin A1PI) and our recently approved next generation A1PI product, Prolastin-C. We also have a line of hyperimmune therapies that provide treatment for tetanus, rabies, hepatitis B, hepatitis A and Rh factor control during pregnancy and at birth. In addition, we provide plasma-derived therapies for critical care, including the treatment of hemophilia, an anti-coagulation factor, as well as albumin to expand blood volume. Although we sell our products worldwide, the majority of our sales were concentrated in the United States and Canada for the periods presented. Our products are primarily prescribed by specialty physicians, including neurologists, immunologists, pulmonologists, and hematologists. Our six largest product categories, their indications, and net revenues are included in the following table:
|
|
|
|
|
Net Revenue (in millions) |
|
|||||||
|
Category and Key Products |
|
Our Indications |
|
2007 |
|
2008 |
|
2009 |
|
|||
|
IGIV(1) |
|
|
|
|
|
|
|
|
|
|
|
|
|
Gamunex IGIV |
|
U.S., Canada, and EU-PI, ITP, CIDP. Canada and EU-Post Bone Marrow Transplant, Pediatric HIV Infection. EU only - Kawasaki Disease, Guillain Barre Syndrome, Chronic Lymphocytic Leukemia, Multiple Myeloma |
|
$ |
646.8 |
|
$ |
677.7 |
|
$ |
826.4 |
|
|
|
|
|
|
|
|
|
|
|
|
|||
|
A1PI |
|
|
|
|
|
|
|
|
|
|
|
|
|
Prolastin A1PI |
|
A1PI Deficiency related emphysema |
|
$ |
276.5 |
|
$ |
316.5 |
|
$ |
319.1 |
|
|
|
|
|
|
|
|
|
|
|
|
|||
|
Fraction V (Albumin and PPF) (1) |
|
|
|
$ |
68.8 |
|
$ |
61.1 |
|
$ |
84.8 |
|
|
Plasbumin-5 |
|
Plasma expanders, severe trauma, acute liver and kidney failures |
|
|
|
|
|
|
|
|
|
|
|
|
|
|
|
|
|
|
|
|
||||
|
(Human) 5% USP |
|
|
|
|
|
|
|
|
|
|||
|
Plasbumin-20 |
|
|
|
|
|
|
|
|
|
|||
|
(Human) 25% USP |
|
|
|
|
|
|
|
|
|
|||
|
Plasmanate |
|
|
|
|
|
|
|
|
|
|||
|
Plasma Protein Fraction 5% USP |
|
|
|
|
|
|
|
|
|
|||
|
|
|
|
|
|
|
|
|
|
|
|||
|
Factor VIII |
|
Hemophilia A |
|
$ |
33.7 |
|
$ |
40.2 |
|
$ |
46.5 |
|
|
|
|
|
|
|
|
|
|
|
|
|||
|
Antithrombin III |
|
Hereditary antithrombin III deficiency |
|
$ |
15.8 |
|
$ |
21.3 |
|
$ |
24.2 |
|
|
|
|
|
|
|
|
|
|
|
|
|||
|
Hyperimmunes |
|
Hepatitis A, Hepatitis B, Rabies, RH Sensitization, Tetanus |
|
$ |
68.8 |
|
$ |
78.2 |
|
$ |
74.2 |
|
|
GamaStan |
|
|
|
|
|
|
|
|
|
|
|
|
|
HyperHepB |
|
|
|
|
|
|
|
|
|
|||
|
HyperRho |
|
|
|
|
|
|
|
|
|
|||
|
HyperRab |
|
|
|
|
|
|
|
|
|
|||
|
HyperTet |
|
|
|
|
|
|
|
|
|
|||
(1) Excludes contract fractionation revenues from the Canadian blood system operators.
We have a strong product portfolio with over ten licensed products focused on what we believe to be under diagnosed, underdeveloped markets. Our sales are driven primarily by Gamunex and Prolastin products, which collectively accounted for approximately 74.7% of our net revenue for the year ended December 31, 2009. The following is a discussion of our key products or product classes:
IGIV—Gamunex
IGIV products are antibody-rich plasma therapies that have long been used in the treatment of immune related disorders such as primary immune deficiencies and certain autoimmune disorders, such as CIDP. For many indications, IGIV is thought to act as an immune modulator; however, in most cases formal regulatory approvals have not been obtained. We believe that the overall unit demand for IGIV is still significantly underdeveloped, due to under-diagnosis of conditions amenable to IGIV therapy, physician under-dosing for current indications and underutilization for many indications where it has demonstrated efficacy. We believe demand for IGIV products will generally increase as a result of new European Agency for the Evaluation of Medicinal Products (EMEA) and FDA approved indications, physician education on diagnosis and treatment options and development of consensus guidelines (to ensure appropriate therapeutic use and optimal dosing).
In 2003, we became the first producer to commercialize a high concentration 10% caprylate/chromatography purified liquid version of IGIV. The majority of competing IGIV products at the time and until recently were either lyophilized (freeze dried) powders that require time-consuming reconstitution or lower concentrated liquids, some of which contain high levels of sugars and salt that pose increased risk of adverse events particularly in patients with cardiovascular risk factors and/or renal insufficiency. Gamunex IGIV provides a combination of characteristics that are important to physicians, nurses and patients. It is a ready-to-use 10% liquid, which simplifies infusions by eliminating the need for time-consuming reconstitution processes necessary with lyophilized products. As an example of our continued enhancement of product safety, the manufacturing process for our IGIV therapy incorporates prion removal, which is described in the FDA-approved labeling for Gamunex. We use a patented caprylate purification process in the production of Gamunex IGIV, which results in higher yields of the fragile IgG proteins, compared to harsher purification processes. The caprylate process maintains the integrity of the IgG protein by allowing it to remain in solution during processing, maximizing biologic integrity and purity. We believe it is this comprehensive set of features, together with our history as the first producer of a ready-to-use liquid IGIV product in North America and our reputation for quality and innovation, that has resulted in a high level of brand recognition among prescribing physicians and the patient community and has contributed to our holding a leading position in sales of IGIV since the mid-1990s, currently with Gamunex IGIV and previously with its predecessor, Gamimune IGIV. Gamunex has the most approved indications of any liquid IGIV currently marketed in the U.S. Further, the FDA granted Gamunex IGIV orphan drug status, which provides marketing exclusivity for the CIDP indication in the U.S. until September 2015. According to an independent study by Harris Interactive, CIDP is the largest therapeutic use of IGIV volume, representing 29% of the total U.S. IGIV unit volume. We believe Gamunex’s indication for CIDP doubles our market access for licensed indications to 61% of total U.S. IGIV unit volume in the U.S. In 2009, we submitted a sBLA with the FDA and a sNDS with Health Canada for subcutaneous route of administration for Gamunex IGIV for the treatment of PI.
The approved indications for Gamunex IGIV in the U.S., Canada and 17 countries in the European Union are Primary Immunodeficiency (PI), Idiopathic Thrombocytopenic Purpura (ITP), and Chronic Inflammatory Demyelinating Polyneuropathy (CIDP). Gamunex IGIV is also approved in the European Union and Canada for post bone marrow transplant and pediatric HIV infection. Gamunex IGIV is also approved in the European Union for Kawasaki Disease, Guillain Barre Syndrome, Chronic Lymphocytic Leukemia and Multiple Myeloma.
On November 14, 2008 Talecris Biotherapeutics GmbH, our German subsidiary, filed a type II variation to support the inclusion of the neurological indication Chronic Inflammatory Demyelinating Polyneuropathy (CIDP) for Gamunex 10% (tradename in Greece : Gaminex 10%). The type II variation procedure for the inclusion of CIDP was performed within a European Mutual Recognition Procedure, with the European Member State Germany as Reference Member State and the Paul-Ehrlich Institute as Reference Competent Authority. The procedure included the following European Member States as Concerned Member States: Austria, Belgium, Cyprus, Czech Republic, Denmark, Finland, Greece, Hungary, Ireland, Luxembourg, Poland, Portugal, Sweden, Netherlands and the United Kingdom.
On June 12, 2009, the Paul-Ehrlich Institute approved the inclusion of CIDP as a new indication for Gamunex/Gaminex 10% for Germany. According to European Union regulations this approval has been mutually agreed upon by all of the Concerned Member States in this variation-procedure. As a result, we now have the approval to promote the CIDP indication in 17 European countries (including a National License in Switzerland). The approval of CIDP is a key step in our plan to launch Gamunex in selected countries over the next several years and grow our overall European business significantly.
In 2009, we experienced a significant increase in demand for Gamunex, driven primarily by supply availability, growth in our GPO and Specialty Pharmacy/Homecare segments in the U.S., and geographic expansion. As a result of the success of our plasma collection platform, as well as our plasma supply contract with CSL, we began to alleviate our plasma supply constraints in the second
half of 2008, bringing significant additional IGIV volumes to the market, to meet the pent up demand for Gamunex. We believe that this pent up demand has largely been satisfied, and consequently, we would not expect to experience the same high level of accelerated IGIV volume growth that we experienced in second half of 2008 and full year 2009, which will affect our comparative growth in sales and margins in future periods. We expect that our volume growth rate will moderate substantially and effectively grow with market at a long-term compound annual rate of approximately 6% to 8%, matching our Gamunex and fractionation capacities. The supply of IGIV inventory increased throughout the distribution channel as supply became available from the previous low levels.
For the years ended December 31, 2009 and 2008, Gamunex IGIV net revenues were $826.4 million and $677.7 million, respectively, excluding contract fractionation revenue associated with our contracts with the Canadian blood system operators.
A1PI—Prolastin/Prolastin-C
A1PI is a naturally occurring, self-defensive protein produced in the liver. A1PI is used to treat congenital A1PI deficiency-related emphysema. This deficiency may predispose an individual to several illnesses but most commonly appears as emphysema in adults. U.S. sales of A1PI have experienced a compound annual growth rate of 15% since 1996. Our Prolastin A1PI product represented 76% of worldwide A1PI sales in 2007 and 67% of U.S. A1PI sales in 2008 according to the MRB Worldwide Book and the MRB U.S. Book, respectively.
Prolastin A1PI has the leading share of sales in the U.S., and approximately 90% share of sales in the European Union. From 1987 when our A1PI product, Prolastin A1PI, was granted orphan drug status, until 2003, when competitors began selling in the U.S., Prolastin had 100% share of A1PI sales in the U.S. Prolastin had a 67% share of U.S. sales in 2008. As a result of our first-mover advantage, pricing, brand strength and direct-to-patient distribution model, we have lost very few of our patients to competitors, which rely on identification of new patients to establish their market share. We consistently experience patient losses due to the nature of the disease. Globally, we continue to focus on access to new markets and patient identification efforts, including distribution of diagnostic kits as a way to increase sales of A1PI, and are seeking reimbursement in several European countries.
There are approximately 11,000 individuals with A1PI deficiency globally with 5,500 currently undergoing A1PI treatment, based on internal estimates. There are an estimated 200,000 individuals with A1PI deficiency-related emphysema in North America and Europe. Many individuals with symptoms are misdiagnosed before receiving a diagnosis of A1PI deficiency-related emphysema. Based on patient registries in many European countries, we believe that severe A1PI deficiency is also prevalent in Europe, and that European patients may represent approximately 30% of potential global sales.
Epidemiological surveys have demonstrated that there is significant latent demand as only approximately ten percent of all patients in need of treatment have been identified (source: Alpha-1-antitrypsin deficiency. High prevalence in the St. Louis area determined by direct population screening. Silverman EK, et al. Am Rev Respir Dis. 1989; 140:961-966). Even fewer patients are being treated using an A1PI product due to the limited number of countries with licensed product. This represents two distinct opportunities for market expansion—improved disease awareness leading to increased patient identification, and gaining licenses in new markets where there has not been access to A1PI.
We believe Prolastin is differentiated in the United States by its unique direct-to-patient distribution and service model, Prolastin Direct, which provides easy enrollment, home infusion, access to insurance experts and patient-centered health management. Prolastin Direct health management provides better patient outcomes by reducing the frequency of respiratory exacerbations. Furthermore, Prolastin Direct results in high medication compliance, with over 94% of prescribed doses being administered annually and high patient loyalty, with an annual retention rate of over 96%. Unlike our competitors, our Prolastin A1PI product is primarily shipped in the U.S. directly to the patient through Centric Health Resources (Centric), a specialized pharmacy. We own 30% of Centric’s common stock as of December 31, 2009.
We believe we are well suited to maintain a leading sales position in, and further increase growth of, A1PI due to a number of factors, including the following:
· We have a well-established and respected brand—Prolastin A1PI—supported by direct-to-patient service systems in the U.S.
· In 2006, we completed a Mutual Recognition Procedure to sell product in European countries with significant identified patient populations. Prolastin is approved in 15 European countries and we are currently established in six of these markets. We have been in reimbursement discussions with a number of these countries since late 2007 and these discussions must be concluded before we can expect to significantly increase sales in these countries. Competitors are currently only licensed in the U.S., Spain and France.
· We have strong physician and patient community relationships developed over 20 years.
· We continue to devote resources to increase disease awareness and support diagnostic testing to increase the identified patient population.
· Launching Prolastin-C in the U.S. and Canada, a new and improved Prolastin with improved yields, higher concentration, and significantly reduced infusion time.
For the years ended December 31, 2009 and 2008, Prolastin A1PI net revenues were $319.1 million and $316.5 million, respectively.
Hyperimmunes
Hyperimmunes are antibody rich preparations, the majority of which are used to provide antibodies to counter specific antigens. Other products, collectively referred to as hyperimmune globulins, are made from human plasma collected from donors with immunity to specific diseases. We have one of the broadest lines of FDA approved hyperimmunes for hepatitis A, hepatitis B, rabies, tetanus and treatment of Rh negative women pregnant with Rh positive children.
In 2007, sales of hyperimmunes worldwide were $584 million and comprised 6% of global plasma products. In the U.S., hyperimmune sales totaled $270 million in 2008. Our hyperimmune net revenue was $74.2 million and $78.2 million for the years ended December 31, 2009 and 2008, respectively. We had a 22% share of U.S. sales in 2008 and we had the largest share of sales in the U.S. for HyperRab and HyperTet in 2008 and 2009.
Albumin and PPF
Albumin is the most abundant protein in human plasma. It is a protein synthesized by the liver and performs multiple functions, including the transport of many small molecules in the blood and the binding of toxins and heavy metals, which prevents damage they might otherwise cause. Recent studies have indicated the therapeutic benefit of albumin in some surgical settings compared to alternatives such as starch solutions, which has helped increase demand for albumin recently after a period of declining demand and depressed prices.
Plasma Protein Factor (Human) (PPF) has similar therapeutic uses as albumin and both are derived from plasma Fraction V. We are licensed to produce and market albumin and PPF under the brand names: Plasbumin and Plasmanate. We believe that the advent of substitute products has acted to commoditize prices for sales of albumin.
Since 2005, pricing for albumin has strengthened considerably, although it still remains below historical peaks. In 2007, sales of albumin and PPF were $1.3 billion worldwide. Sales in the U.S. were $314.0 million in 2008, with a 16% year over year increase in average price per unit and a 0.9% decrease in volume. Albumin units in the U.S. increased from 118,136 grams in 2008 to 119,039 grams in 2009, which is a 0.8% increase. We had an approximately 12% share of U.S. units in 2009 and a 9% share of U.S. units in 2008.
Some of our indications for albumin are:
· Emergency treatment of Hypovolemic Shock
· Burn therapy
· Hypoproteinemia with or without edema
· Adult Respiratory Distress Syndrome (ARDS)
· Cardiopulmonary bypass
· Acute Liver Failure
· Neonatal Hemolytic Disease
· Acute Nephrosis
· Eythrocyte Resuspension
· Renal Dialysis
We had $84.8 million and $61.1 million in net revenue from the sale of albumin and PPF products for the years ended December 31, 2009 and 2008, respectively, excluding contract fractionation revenue associated with our contracts with the Canadian blood system operators. During 2008, our albumin sales were negatively impacted by a change in production mix to contracted PPF powder from albumin as a result of the 2007 settlement of a customer dispute, which resulted in lower quantities of albumin and finished PPF product available for sale during 2008. Demand for our albumin products exceeds our supply. We are expanding production capacity
to closer meet demand. This is consistent with our overall strategy to sell more products from each liter of plasma leading to margin expansion opportunities.
Plasma-Derived Hematology Products
Plasma-derived hematology products are used to treat patients who either lack one of the necessary factors for blood clotting or suffer from conditions in which clotting occurs abnormally. There are 13 blood coagulation factors found in human blood.
· We produce plasma-derived Factor VIII. Factor VIII is the primary treatment for Hemophilia A, a congenital bleeding disorder caused by a deficiency of coagulation agents in the blood. We had $46.5 million and $40.2 million in plasma-derived Factor VIII net revenue for the years ended December 31, 2009 and 2008, respectively, under our Koate DVI Antihemophilic Factor (human) brand. Koate DVI had a 4% share of sales in the U.S. in 2008 and 3% worldwide in 2007 according to MRB. Sales of plasma-derived hemostasis products in 2008 were $452.9 million in the U.S. In 2007 sales were $2.0 billion worldwide (includes plasma-derived Factor VIII, FIX, ATIII, and von Willebrands and FVII). Plasma-derived Factor VIII faces significant competition from higher priced recombinant products that are not derived from plasma in the U.S. and EU. Growth in the demand for plasma-derived Factor VIII is being driven by increased patient identification and treatment in developing countries. The current per capita Factor VIII utilization is significantly higher in the U.S. and European Union than in developing countries. Plasma-derived Factor VIII has lost sales to recombinant products, which have generally been perceived to have lower risk of disease transmission than plasma-derived Factor VIII products. These recombinant products, however, currently lack proteins essential for the treatment of certain conditions. Demand for Koate also exceeds our ability to supply. We are expanding production capabilities in a two phased approach to help meet demand. Increased supply enables us to sell more product per liter of plasma helping to drive our margin expansion strategy.
· ATIII is an important anticoagulant and ATIII therapies are designed to treat and prevent thromboemboli, or spontaneous clotting within vital organs, in patients with congenital ATIII deficiency during high risk surgery, trauma, pregnancy, or childbirth. For the years ended December 31, 2009 and 2008, we had $24.2 million and $21.3 million, respectively, in ATIII net revenue under the Thrombate III brand. A transgenic ATIII product produced in the milk of transgenic goats by GTC Biotherapeutics, Inc. and marketed in the U.S. by Lundbeck Inc. was launched in May of 2009. Our Thrombate III product is currently produced for us by Bayer pursuant to a manufacturing agreement. We are currently validating a new production facility at our Clayton, North Carolina site with regulatory approval expected in early 2012. The new facility will increase our capacity and will allow us to increase supply.
PPF-powder Intermediate Sales
Separately from our sales of PPF packaged for final use, we provide PPF powder to Bayer as an intermediate for the fermentation of Kogenate, Bayer’s recombinant Factor VIII product that Bayer retained at the time of our formation transaction. Recombinant Factor VIII is a Factor VIII product produced by fermentation of cells transfected with human genes. We will continue to provide PPF powder to the Bayer Kogenate business through 2012 pursuant to a supply agreement with potential extensions at Bayer’s option to 2015. We had $40.3 million and $54.6 million in PPF-powder net revenue for the years ended December 31, 2009 and 2008, respectively. PPF-powder sales during 2008 were positively impacted by a change in production mix to PPF powder from albumin and finished PPF product as a result of the settlement of a customer dispute.
Manufacturing and Raw Materials
Our Clayton, North Carolina manufacturing site is one of the world’s largest fully integrated facilities for plasma-derived therapies. The site includes plasma receiving, fractionation, purification, filling/freeze-drying and packaging capabilities as well as freezer storage, testing laboratories and a cGMP pilot plant for clinical supply manufacture. In addition, we have a manufacturing facility in Melville, NewYork that provides additional fractionation capacity as well as capabilities for other contract manufacturing services. A small part of our operations (Thrombate III production) is currently performed by Bayer under a Supply Agreement, but is in the process of transfer to the Clayton facility. In addition to the on-site freezer storage, we also utilize a leased facility which allows for expanded inventory storage capacity.
Our manufacturing facilities currently have the capacity to fractionate approximately 4.2 million liters of human plasma per year. We processed approximately 3.6 million liters of plasma in 2009, which represents a utilization rate of approximately 85% of our fractionation capacity. The majority of the capacity is used for internal production requirements with a small amount utilized for contract fractionation, mainly for the Canadian blood system operators. We anticipate that we will reach our fractionation capacity in the near term depending upon the demand for our products, the availability of source plasma and the impact of variability in yield among other factors. We plan to utilize available fractionation capacity in the near term which will result in increased inventory levels in order to maintain pace with projected growth in product demand. To allow full fractionation capacity utilization of 4.2 million
liters, harvest of albumin paste will be capped at 2.3 million liters. For future capacity expansion, a new fractionation facility is planned for 6.0 million liters of Crypoprecipitate (Factor VIII) and II+III paste (IGIV) and 4.0 million liters for IV-I paste (Alpha-1). Fraction V paste (albumin) will continue to be fractionated in our existing facility in the mid-term at a capacity of 4.0 million liters. Purification, filling, and finishing capacities are dependent on fraction mix.
Talecris Plasma Resources
Plasma is the key raw material used in the production of plasma-derived biological products, representing greater than 50% of our cost of goods sold. Human plasma can be secured through internal or external collection networks or sources. As of December 31, 2009, we operated 69 plasma collection centers, of which 64 were FDA licensed. We fractionated approximately 3.6 million liters of plasma in 2009, of which approximately 62% came from plasma collection centers we own and approximately 38% came from third-party plasma supply contracts.
In 2006, we made the strategic decision to vertically integrate our plasma supply chain in order to enhance the predictability, sustainability, and profitability of our plasma supply. In response to this decision, we formed our wholly-owned plasma procurement subsidiary, Talecris Plasma Resources, Inc. (TPR). In November 2006, we acquired 21 licensed plasma centers, 12 unlicensed operating centers, and 25 development sites from IBR through an asset purchase agreement as the first step of our vertical integration strategy. Subsequently, in June 2007 we entered into a Purchase and Sale of Assets Agreement with IBR, pursuant to which we acquired three licensed plasma collection centers in both 2007 and 2008 and twelve licensed plasma collection centers in 2009. Concurrently with the execution of this agreement, we entered into a Plasma Supply Agreement, which provides us with the option to fund the development and purchase additional plasma collection centers.
The rapid vertical integration of our plasma supply was accomplished through the development of an extensive infrastructure necessary to manage the multiple work streams to open and obtain FDA licenses at our centers, as well as the ramp up of their production. We devoted significant resources on the initial build out of our plasma collection center platform, which included consulting arrangements with third parties and the hiring of additional corporate management. We experienced some operational issues with the rapid expansion of our platform, which required additional resources to address issues with maintaining quality operations in accordance with our standard operating procedures. We have addressed the operational issues that resulted from the maturation of our plasma collection center platform, which has resulted in the termination of the third party consultants and rationalization of our TPR corporate infrastructure.
Prior to the execution of our vertical integration strategy, we relied exclusively on third parties for all of our plasma, a significant portion of which was provided to us through plasma collection centers owned or controlled by our competitors. Through the successful execution of our strategy, we have been able to reduce our reliance on third party suppliers, enhance our flexibility in procuring plasma, increase our operating efficiencies and, we expect, will ultimately improve our gross margin and profitability as our collection center platform matures and we are able to reduce levels of under-absorbed TPR infrastructure and start-up costs.
We intend to continue to purchase some plasma from third parties through plasma supply contracts. On August 12, 2008, we signed a five-year plasma supply agreement with CSL Plasma Inc., a subsidiary of CSL Limited, a major competitor. This agreement provides us with minimum annual purchase commitments that decline from 550,000 liters in 2010 to 200,000 liters in 2013, the final year of the agreement. We have the ability to obtain additional volumes above the minimum purchase commitments under the terms of the agreement. This contract survives the termination of the merger agreement. In addition to the contract with CSL Plasma Inc., we have several other contracts to purchase minimum quantities of plasma with various third parties.
We plan to source our plasma supply through the continued growth of our plasma collection center platform and through our plasma supply contracts with third parties. In addition to the procurement of plasma on occasion, we have also purchased intermediate materials needed for the production of specific fractions. These materials are purchased from fractionators that have either excess capacity or do not have the processes to manufacture the final product.
Until our plasma collection centers reach normal operating capacity, we charge unabsorbed overhead costs directly to cost of goods sold. We have reduced and plan to continue to reduce both the collection cost per liter and the amount of excess period costs charged directly to cost of goods sold as TPR matures.
Pathogen safety
Assuring the pathogen safety of our products is a priority for us. There are a number of steps used to help ensure the pathogen safety of the source plasma we use and the products we produce. The initial step is the application of donor qualification procedures by our plasma suppliers. We also test donated plasma for serum antibodies. The purpose of serological testing is to detect serum antibodies and other biological markers that appear specifically in association with certain diseases. Serological testing is provided under contract by qualified laboratories according to our specifications.
Prior to delivery of the source plasma from our suppliers to our manufacturing plant, we internally perform nucleic acid amplification testing, or NAT, for various viruses, including HBV, HCV, HIV, HAV, and B-19. Our ability to perform NAT testing internally provides us with a strategic advantage over competitors who do not have such facilities and must contract with a third party, the National Genetics Institute. We perform these tests in a 76,000 square foot testing facility, located in Raleigh, North Carolina. The facility is leased through September 2017, with an option to purchase until September 1, 2011. The laboratory tested over 4.7 million samples in 2009 and is operated by approximately 100 operations and quality employees.
Once a unit of plasma passes strict donor qualification procedures, the initial round of serological testing and NAT, the unit is held for a period of time to monitor for pathogen development in subsequent donations. Following the inventory hold period, acceptable units are combined into fractionation pools and a second round of selected serological testing and NAT is performed on the fractionation pool. As purification of the target proteins occurs, viral particles and prions can be removed as a result of the fractionation and downstream processes. In addition, all products undergo specific virus inactivation steps in the manufacturing process that are distinct to the particular product being produced. Extensive laboratory studies are conducted to validate the capacity of the manufacturing processes to remove or inactivate pathogens. The results of these studies undergo rigorous evaluation by our pathogen safety experts and government regulatory agencies. Our safety efforts include use of a zoning concept at our Clayton fractionation site to tightly control air, material, and personnel flow throughout production. Furthermore, we have received certification from the industry’s trade association, the Plasma Protein Therapeutics Association, as a result of our voluntary adoption of safety standards beyond those required by government regulators.
Research and Development
As a result of our past and ongoing investment in research and development, we believe that we are positioned to continue as a leader in the plasma-derived therapies industry. Innovation by our research and development operations is critical to our future growth and ability to remain competitive in our industry. We have a strong commitment to science and technology with a track record of accomplishments and pipeline opportunities. On December 31, 2009, we had approximately 300 scientists and support staff engaged in research and development activities. We focus our research and development efforts in three key areas: continued enhancement of our process technologies (including pathogen safety), life cycle management for our existing products (including new indications), and development of new products. To the extent we wish to add new products to our research and development pipeline, we anticipate making opportunistic business acquisitions or partnering with other companies with projects that fit our expertise. Our research and development spending was $71.2 million, $66.0 million, and $61.3 million for the years ended December 31, 2009, 2008, and 2007, respectively.
The following table includes information regarding the clinical development stage of various product candidates currently in our development pipeline:
|
Product Candidate |
|
Therapeutic Area |
|
Product Type |
|
Use |
|
Development Phase |
|
|
|
|
|
|
|
|
|
|
|
Gamunex IGIV—10% |
|
Immunology |
|
Subcutaneous |
|
Primary immune deficiency |
|
Licensing clinical trial completed. Pending regulatory review in U.S. and Canada. |
|
|
|
|
|
|
|
|
|
|
|
Plasmin |
|
Thrombolytic |
|
Plasma-derived Plasmin |
|
aPAO |
|
Phase I |
|
|
|
|
|
|
|
|
|
|
|
recPlasmin |
|
Thrombolytic |
|
Recombinant Plasmin |
|
Acute Ischemic Stroke |
|
Preclinical |
|
|
|
|
|
|
|
|
|
|
|
Prolastin-C A1PI |
|
Respiratory |
|
IVA1PI |
|
A1PI deficiency |
|
Approved in U.S. and Canada |
|
|
|
|
|
|
|
|
|
|
|
Prolastin A1PI Aerosol (Alpha-1 Aerosol) (TAL-6005) |
|
Respiratory |
|
aerosolized |
|
A1PI deficiency |
|
Submission planned 2010 for first clinical trial in U.S. |
|
|
|
|
|
|
|
|
|
|
|
Recombinant FVIII |
|
Coagulation |
|
intravenous |
|
hemophilia A |
|
Preclinical |
|
|
|
|
|
|
|
|
|
|
|
Recombinant A1PI |
|
Respiratory |
|
intravenous and/or aerosolized |
|
A1PI deficiency, COPD, Cystic Fibrosis |
|
Preclinical |
The content of our development portfolio will change over time as new plasma products progress from pre-clinical to development to market, and as we discontinue testing of product candidates that do not prove to be promising or feasible to develop. Due to the uncertainties and difficulties of the development process, it is not unusual for protein therapeutics, especially those in the early stages of investigation, to be terminated or delayed as they progress through development.
We cannot assure you that any of the products listed above will eventually be approved and marketed. The fact that a product candidate is at a late stage of development does not necessarily mean that clinical testing will ultimately succeed or the product will eventually pass that phase and be approved for marketing. We may at any time discontinue the development of any of these products due to the occurrence of an unexpected side effect or for any other reason.
While our current protein products are derived from human plasma, we expect that recombinant technologies will be a major source of new protein therapies commercialized in the future. We have initiated recombinant protein development programs for Plasmin, Factor VIII, and A1PI. Recombinant or recPlasmin is a patentable form of Plasmin that retains key properties of Plasmin that make it a candidate for development as a therapy for ischemic stroke. We have filed composition of matter patents covering recPlasmin. We are conducting pre-clinical development of recombinant Factor VIII and A1PI utilizing advanced protein production technology licensed from Crucell N.V.
Gamunex IGIV (TAL-05-0002)
We are developing a subcutaneous route of administration option for Gamunex 10% IGIV to meet a growing demand for subcutaneous self-administration of immunoglobulin for PI patients. Our licensure clinical trial for a subcutaneous administration of our 10% Gamunex product has been completed; a sBLA has been submitted to the FDA and a sNDS has been submitted to Health Canada.
Plasmin (TAL-05-00013)
Plasmin, a thrombolytic agent, is our most innovative pipeline product. Plasmin is purified from human plasma in its inactive, zymogen form, plasminogen. Historically, attempts to use plasminogen in clinical settings have been impeded by the inability to provide sufficient quantities of Plasmin at the site of clotting before it autodegraded or because such attempts required potentially toxic additives. We have avoided these difficulties by converting plasminogen to Plasmin, the active form of the enzyme, and stabilizing it by placing it in an acidified solution that allows us to administer it directly into patients at appropriate doses and low toxicity to dissolve blood clots as determined by pre-clinical investigation. Plasmin is being produced for clinical trials at our R&D clinical manufacturing facilities in Clayton, North Carolina. Our use of Plasmin as a thrombolytic is protected by patents and patent applications including: method of use patent as a direct thrombolytic granted in the U.S., European Union and Australia; formulation patent granted in Australia and allowed in European Union and pending in U.S. and Japan; process patent granted in European Union and Australia and pending in the U.S.
Plasmin has an expected advantage over tissue plasminogen activator as it has a reduced likelihood of causing bleeding. As a natural human plasma enzyme, Plasmin plays a key role in maintaining hemostasis in human and animal physiology. Its main physiologic function is dissolution of blood clots. Plasmin is inactivated in less than a second when it is present in the blood stream unless it is bound to a blood clot. To ensure that Plasmin remains active, it is delivered locally to a clot using a catheter. Once Plasmin is delivered to a clot, it binds and dissolves the clot. When the clot is dissolved and Plasmin is released into the blood stream it is immediately inactivated thereby preventing active Plasmin from circulating and causing bleeding at distal sites within the body. The balance between clot binding and systemic inhibition provides the basis for differentiation of our Plasmin development product from any other thrombolytic agents, both licensed and those in development.
Plasmin’s formulation is designed for direct delivery into clots via state-of-the-art procedures (catheter-directed thrombolytic therapy) performed in catheterization laboratories of hospitals, rather than by the current method involving intravenous injection into the bloodstream. Studies have found that current treatment of blood clots involving intravenous injection of tissue plasminogen activator, or tPA, may cause bleeding, including a 1% to 2% chance of causing a stroke due to intracranial hemorrhage which often results in death or severe disability. Plasminogen activators continue to carry significant risk of bleeding complication even when delivered through intravascular catheters. This concern regarding hemorrhage may limit the number of patients who receive tPA. In addition, this concern has caused physicians to use lower doses which significantly prolong the length of treatment under conditions requiring urgent clot removal.
Potential applications of catheter delivered thrombolytics include aPAO, DVT (deep vein thrombosis), and ischemic stroke. Basically, wherever a vessel or device is occluded by a blood clot and is accessible by catheter, the potential exists for directed thrombolytic therapy. We have filed Investigational New Drug Applications (IND) for aPAO, DVT and HGO (hemodialysis graft
occlusion). We believe Plasmin may have other significant indications as well. We are also evaluating the use of Plasmin for the treatment of clotting for stroke.
We filed an IND with the FDA in early 2003 and conducted a Phase I safety trial in hemodialysis patients who have clogged synthetic arterial-venous shunts. This study started in September 2003 and was completed in 2005. Plasmin was well-tolerated with no major bleeding events at all doses tested and there was a dose-dependent response in clot lysis with greater than 75% clot lysis in five of five patients at the highest dose of 24 mg.
Based on the encouraging outcome of this initial trial, we filed an IND in the U.S. and Clinical Trial Applications (CTA) in various European Union and other non-U.S. countries to evaluate Plasmin in the treatment of aPAO. We are now proceeding with a clinical trial for aPAO, or clots in leg arteries. In patients with aPAO, arterial blood flow to extremities, usually the legs, becomes blocked by a blood clot. Affecting approximately 100,000 people in the U.S. each year, this condition is most common in people with underlying narrowing of arteries and gradual restriction of blood flow over time resulting from peripheral arterial disease (PAD). Without prompt intervention, aPAO can result in significant complications such as permanent nerve and muscle damage, and in the most severe cases, even amputation or death.
There is an unmet medical need for a proven safe thrombolytic agent to treat aPAO. Current methods focus on pharmacologic, mechanical, or surgical removal of the blood clot, or bypass grafting to direct flow around the area of the clot. However, no clot-busting drugs currently are approved for this indication by regulatory authorities, and those currently used (plasminogen activators) may require a prolonged infusion averaging 24 to 36 hours and produce increased risk of bleeding complications. Talecris has received an orphan drug designation in the US for the development of Plasmin for aPAO, which provides incentives for qualified clinical testing expenses and, if approved, market exclusivity for seven years. We are currently in our seventh and last dosing cohort in Phase I and have begun to design a Phase II trial. Our goal is to commence this trial during 2010. In Phase I and preclinical trials, Plasmin appears able to rapidly dissolve blood clots without an elevated risk of bleeding. Pd-Plasmin delivered by catheter has dissolved blood clots over 30 cm long in two hours.
We also have an open IND for Plasmin in deep vein thrombosis but currently have no plans to pursue an indication.
Stroke constitutes a major worldwide health threat, and it is the third leading cause of death in the U.S. Approximately 87% of strokes are ischemic, and it is estimated that 1 million to 1.5 million patients suffering from ischemic stroke are admitted into hospitals in the U.S. and Europe each year. Activase (tPA) is currently the only product approved for use in the treatment of ischemic stroke, and intravenous administration of tPA to treat stroke caused by blood clot is the standard of care. Although tPA has shown efficacy in this indication, there are three weaknesses of this product which reduce the populations of stroke patients eligible for this treatment. First, tPA is only indicated for use within 3 hours of onset of stroke, and the average time of arrival in the Emergency Department is 3 to 6 hours from symptom onset. Second, treatment with tPA is associated with major bleeding. The most serious bleeding in stroke patients is symptomatic intracranial hemorrhage, which can be fatal or result in permanent disability, and is a known complication of tPA therapy of stroke. Third, there are a number of restrictions on the use of tPA based on the condition of the patient and the presence of other diseases. As a result of these limitations, 10-15% of stroke patients are eligible for treatment with current thrombolytic therapy and less than 5% actually receive thrombolytic. Therefore, there is an urgent, unmet medical need for safe thrombolytic therapy for patients with acute stroke. The vast majority of stroke victims are essentially untreated. A proof-of-concept trial to treat ischemic stroke has also been approved in six countries, with the first patient enrolled. Our strategy is to develop recombinant Plasmin for ischemic stroke.
Prolastin-C A1PI
We completed pivotal clinical studies and submitted a sBLA with the FDA and a sNDS with Health Canada for the approval of Prolastin-C A1PI. Prolastin-C A1PI is a key product life cycle enhancement to Prolastin A1PI. Like Prolastin, Prolastin-C is intended to treat A1PI deficiency, an inherited disorder that causes a significant reduction in the naturally occurring protein A1PI. The modified production process of Prolastin-C A1PI will allow for increased yield and higher concentration versus our current Prolastin A1PI product, effectively increasing our capacity by 40%. The European Union regulatory authorities have indicated that a successful efficacy trial will be a prerequisite to applying for marketing authorization for Prolastin-C A1PI in the European Union. The sBLA has been approved by the FDA; and a post-approval clinical trial is required as a condition for approval. The sNDS has been approved by Health Canada. Commercial production of Prolastin-C A1PI at our manufacturing facility, located at the Clayton site, began in 2009 in support of the planned launch in 2010.
A1PI Aerosol (Alpha-1 Aerosol) (TAL-6005)
Alpha-1 Aerosol is an inhaled version of our A1PI product, which, if successful, is expected to provide an important advancement in the convenience and speed of delivery of therapy to A1PI-deficient patients, as well as a potential platform for other respiratory indications. An inhaled version may also allow for effective treatment with dosages lower than those currently used and
may facilitate administration to a larger patient population. Progress includes the development of a commercial scale manufacturing process, an exclusive partnership for a highly efficient nebulizing device, and the initiation of toxicology studies. High levels of enzymes known as neutrophil elastase are present in the respiratory secretion of patients suffering from A1PI deficiency. These enzymes can lead to degradation of the lung tissue. Future clinical studies will assess the safety of A1PI delivered to the lung by aerosol administration.
Recombinant A1PI and Factor VIII
We are exploring the potential for human cell line based protein production technology to produce A1PI and Factor VIII with human modifications. Current recombinant forms of A1PI and Factor VIII are produced in animal cell lines and therefore lack key protein modifications characteristic of the human plasma version of the two proteins. Human protein modifications have the potential to make the human recombinant forms physiologically similar to their plasma-derived counterparts. The availability of recombinant A1PI may facilitate the application of A1PI therapy to other respiratory diseases such as, COPD or cystic fibrosis (CF).
Technical Support of Manufacturing Operations
As part of the R&D function, staff members are allocated to support production of commercial products currently on the market. This support includes, but is not limited to, the following:
· troubleshooting production issues, especially relating to plasma pooling and fractionation, downstream protein purification processes, and filling and freeze drying operations;
· providing technical expertise for evaluation and implementation of improvements to existing licensed processes, including driving process changes for improved quality and throughput, and leading process evaluations to mitigate potential failure modes;
· tracking and trending of production operational parameters to identify opportunities that can improve gross margins;
· supporting transfer of production processes into the manufacturing setting, evaluating commercial opportunities for existing production intermediates, and implementing lifecycle management programs. Examples include implementation of latex free stoppers; Koate reliability, capacity and yield improvements and the new fractionation facility; and
· supporting throughput capability increases by evaluation of new vendor pastes and plasma sources, such as the Canadian blood system plasma collection method conversion, and evaluation of recovered plasma sources.
Our R&D activities also support improvements in manufacturing and testing processes that enhance yield and product quality. In addition to the above initiatives, we are working to transfer production of our Thrombate III product from Bayer, with whom we currently have a supply agreement. We are currently validating a new production facility at our Clayton site with regulatory approval expected in early 2012. The new facility will increase our capacity and will allow us to increase supply.
Company History
Our heritage of patient care innovations in therapeutic proteins dates back to Cutter Laboratories, which began to produce plasma-derived products in the early 1940s, and its successor companies, including Miles Inc., Bayer Corporation and Bayer Healthcare LLC.
We began operations as Talecris Biotherapeutics Holdings Corp. on April 1, 2005, upon the completion of our acquisition of substantially all of the assets and specified liabilities of Bayer’s worldwide plasma business (Bayer Plasma), an operating unit of the Biological Products division of Bayer Healthcare LLC, which is a wholly-owned (indirect) subsidiary of Bayer AG (collectively or individually, Bayer), in a transaction which was effected by Talecris Holdings, LLC. As part of our overall formation activities, we also acquired 100% of the outstanding common stock of Precision Pharma Services, Inc. (Precision) on April 12, 2005 from Ampersand.
In order to improve the predictability, reliability, and sustainability of our plasma supply, we pursued a strategy to substantially vertically integrate our plasma supply chain through the creation of TPR, enabling us to significantly reduce our reliance on third party suppliers, enhancing our flexibility in procuring plasma, increasing our operating efficiencies, and as our plasma collection centers mature, improving our gross margin and profitability. Pursuant to this strategy, we have acquired plasma collection centers from third parties, particularly IBR, and developed our own plasma collection centers. At December 31, 2009, our plasma collection center network consisted of 69 centers, of which 64 were FDA licensed.
On October 6, 2009, we completed our initial public offering (IPO) of 56,000,000 shares of our common stock at an offering price of $19.00 per share for an aggregate offering of $1.064 billion. We received net proceeds of $519.7 million from the issuance of 28,947,368 new shares of common stock. These proceeds were used to repay principal under our then existing First and Second Lien Term Loans. We did not receive any proceeds from the selling stockholders’ sale of 27,052,632 shares of common stock in the offering.
On October 21, 2009, we completed the issuance of $600.0 million, 7.75% Senior Unsecured Notes, due November 15, 2016 at a price of 99.321% of par in a private placement to certain qualified institutional buyers. We used the net proceeds to us of $583.9 million to repay principal and interest amounts of $499.6 million under our First and Second Lien Term Loans, which were subsequently terminated, $55.6 million to repay principal under our Revolving Credit Facility, and $28.7 million to settle and terminate certain interest rate swap contracts with a notional amount of $390.0 million. Subsequently, we terminated the remaining interest rate swap contract with a notional amount of $50.0 million for $6.1 million.
As of December 31, 2009, Talecris Holdings, LLC held approximately 50.1% of our outstanding common stock. Talecris Holdings, LLC is owned by (i) Cerberus-Plasma Holdings LLC, the managing member of which is Cerberus Partners, L.P., and (ii) limited partnerships affiliated with Ampersand Ventures. Substantially all rights of management and control of Talecris Holdings, LLC are held by Cerberus-Plasma Holdings LLC. Subsequent to December 31, 2009, the ownership of our outstanding common stock by Talecris Holdings, LLC was diluted below 50%.
Customers
Three customers accounted for approximately 36% and 35% of our net revenues for the years ended December 31, 2009 and 2008, respectively. Similarly, our accounts receivable balances have also been concentrated with a small number of customers. Two customers accounted for approximately 23% and 29% of our accounts receivable, net, as of December 31, 2009 and December 31, 2008, respectively. Additionally, we are the largest supplier of plasma-derived products to the Canadian blood system operators, Canadian Blood Services and Hema Quebec, and derive significant revenue and profits from these contracts. It is estimated that 64% (41% in-patient; 23% out-patient) of IGIV sold in the U.S. in 2008 was purchased by hospitals; physician offices represented about 19% of IGIV volume; and home healthcare companies and specialty pharmacies represented 17% of the IGIV volume. We expect that sales of our products to a limited number of customers will continue to represent a substantial amount of our revenues for the foreseeable future. For a discussion of certain risks related to our customer concentration, please see “Risk Factors—A substantial portion of our revenue is derived from a small number of customers, and the loss of one or more of these customers could have a material adverse effect on us.”
Approximately 34% of our net revenue for 2009 and 2008 and approximately 33% of our net revenue for 2007 was generated from outside of the United States. The following table includes a geographic breakdown of our net revenues:
|
|
|
Years Ended December 31, |
|
|||||||
|
|
|
2009 |
|
2008 |
|
2007 |
|
|||
|
United States |
|
$ |
1,011,468 |
|
$ |
906,376 |
|
$ |
817,276 |
|
|
Canada |
|
214,883 |
|
215,964 |
|
189,923 |
|
|||
|
Europe |
|
185,297 |
|
168,081 |
|
136,972 |
|
|||
|
Other |
|
121,561 |
|
83,871 |
|
74,338 |
|
|||
|
Total net revenue |
|
$ |
1,533,209 |
|
$ |
1,374,292 |
|
$ |
1,218,509 |
|
Our international business is subject, in various degrees, to a number of risks inherent in conducting business in other countries. These include, but are not limited to, currency exchange rate fluctuations, capital and exchange control regulations, expropriation and other restrictive government actions. Our international business is also subject to government-imposed constraints, including laws on pricing, reimbursement, and access to our products.
Our worldwide net revenue does not reflect a significant degree of seasonality. We generally experience a favorable revenue and gross margin benefit during the second and third quarters due to higher sales of our hyperimmune therapies for the treatment of exposure to rabies.
Contract Services
Apart from the contracts with the Canadian blood system operators discussed elsewhere, including under “Business—Competitive Strengths—Favorable Distribution Arrangements,” we also provide a variety of contract manufacturing or process services, including plasma fractionation, manufacturing, and analytical testing. These contracts are for a limited number of batches of
product and development services during the clinical development phase of a project and then change to a guaranteed annual minimum purchase commitment for a term of typically three to five years during the commercial phase of each agreement.
Sales, Marketing and Distribution
Our sales and marketing department consists of approximately 240 full time professionals as of December 31, 2009, including a U.S. sales force of approximately 120 field sale representatives. Within the U.S., our core market, we have developed a “push-pull” distribution network comprised of both direct and indirect channels. Our direct channel is comprised of three specialty sales teams: Immunology/Neurology, Pulmonary, and Hematology/Specialty. Our specialty sales representatives are experienced professionals with a combination of extensive commercial and healthcare related experience calling on a variety of touch points including physicians, pharmacists, and homecare companies.
· The Immunology/Neurology team is primarily focused on promoting Gamunex for the use in PI, CIDP, and ITP. It is also responsible for promoting our portfolio of hyperimmune products and Plasbumin. This team calls on office-based and hospital-based specialty physicians including neurologists and immunologists. They also call on a variety of healthcare providers within the hospital and home-care settings (physicians, nurses, pharmacists).
· The Pulmonary team promotes Prolastin, focusing on identification of A1PI patients and driving brand choice for Prolastin, which is the most prescribed A1PI therapy in the U.S.
· The Hematology/Specialty team promotes Koate, Thrombate III, and our portfolio of hyperimmune products calling on hematologists and other healthcare providers within the hospital and specialty treatment centers.
· In addition to our direct sales force, we have a managed markets sales team that manages relationships and contracting efforts with GPOs, distributors, home healthcare and specialty pharmacy providers and private commercial payors.
We sell, market and distribute our various products through both our direct sales personnel and our network of distributors. Our sales, marketing and distribution efforts focus on strengthening our relationships with physicians, pharmacists, nurses, patients, GPOs, distributors, home healthcare and specialty pharmacy providers. In the U.S., our Prolastin Direct Program has engaged a prescription fulfillment provider to ensure that Prolastin A1PI can be shipped directly to patients. This direct-to-patient distribution service is designed to enhance user convenience and ensure the patient of an uninterrupted supply of Prolastin A1PI, while providing us with valuable information about their usage patterns. We are the only A1PI provider to have completed a Mutual Recognition Procedure in the European Union. Prolastin A1PI is approved in 15 European countries and we are currently established in six of these markets. We have been in reimbursement discussions with a number of these countries since late 2007 and these discussions must be concluded before we can expect to significantly increase sales in these countries.
Packaging and Distribution Contracts
Since 2005, we significantly reduced the number of our distributors and simultaneously entered into long-term distribution agreements with major hospital group purchasing organizations, or GPOs, distributors, home care and specialty pharmacy providers and distributors which we believe grant us favorable volume, pricing, and payment terms, including in certain cases financial penalties if they fail to purchase the agreed volume of products.
In addition, we have an agreement with Catalent Pharma Solutions pursuant to which they provide packaging, labeling and testing services for us in connection with the distribution of our products in Europe. The agreement expires in 2013, though we have the option to extend it twice, each time for a period of two years. We may terminate the agreement upon 12 months notice, and Catalent may terminate the agreement upon 24 months notice, beginning in 2011. Either party may terminate the agreement upon the bankruptcy of the other party or if there is a material breach which is not cured within 30 business days.
Patents and Other Intellectual Property Rights
Our success depends in part on our ability to obtain and maintain proprietary protection for our product candidates, technology and know-how, to operate without infringing the proprietary rights of others and to prevent others from infringing our proprietary rights. Our policy is to seek to protect our proprietary position by, among other methods, filing U.S. and foreign patent applications related to our proprietary technology, inventions and improvements that are important to the development of our business. We also rely on trade secrets, legal opinions, know-how, continuing technological innovation and in-licensing opportunities to develop and maintain our proprietary position.
Patents. As of December 31, 2009, we owned or licensed for uses within our field of business over 130 U.S. patents and
U.S. patent applications as well as numerous foreign counterparts to many of these patents and patent applications. At present, we do not consider any individual patent, patent application or patent family to be material to the operation of our business as a whole. Our patent portfolio includes patents and patent applications with claims directed to the composition of matter, manufacturing processes, pharmaceutical formulation and methods of use of many of our compounds and products, including a composition of matter patent application for a recombinant Plasmin molecule and a manufacturing process patent for Gamunex IGIV. We vigorously defend our intellectual property to preserve our rights and gain the benefit of our investment.
The patent positions of companies like ours are generally uncertain and involve complex legal and factual questions. Our ability to maintain and solidify our proprietary position for our technology will depend on our success in obtaining effective claims and enforcing those claims once granted. We do not know whether any of our patent applications or those patent applications that we license will result in the issuance of any patents. Our issued patents and those that may issue in the future, or those licensed by us, may be challenged, narrowed, circumvented or found to be invalid or unenforceable, which could limit our ability to prevent competitors from marketing related products or the length of term of patent protection that we may have for our products. Neither we nor our licensors can be certain that we were the first to invent the inventions claimed in our owned or licensed patents or patent applications. In addition, our competitors may independently develop similar technologies or duplicate any technology developed by us, and the rights granted under any issued patents may not provide us with any meaningful competitive advantages against these competitors. Furthermore, because of the extensive time required for development, testing and regulatory review of a potential product, it is possible that, before any of our products can be commercialized, any related patent may expire or remain in force for only a short period following commercialization, thereby reducing any advantage of the patent.
We continuously monitor the proprietary positions of third parties, and particularly the proprietary positions of our business competitors, in order to guide the development of our product candidates and avoid the possibility of infringement. Periodically we commission formal legal opinions in order to confirm our freedom to operate.
Trademarks. Given the importance of our name brands, particularly with respect to IGIV and Alpha-1-Antitrypsin (A1PI) products, we rely heavily on the protection of trade names and trademarks. We have registered trademarks for a number of our products, including Gamunex®, Gaminex 10%®, Prolastin®, Prolastin-C®, Plasbumin®, Plasmanate®, Koate®, Thrombate III®, GamaStan®, HyperHepB®, HyperRho®, HyperRab®, HyperTet®, Gamimune®, Talecris Direct®, and Prolastin Direct®.
Trade Secrets. We may rely, in some circumstances, on trade secrets to protect our technology. However, trade secrets can be difficult to protect. We seek to protect our proprietary technology and processes, in part, by maintaining a trade secret registry and by implementing confidentiality agreements with our employees, consultants, scientific advisors and contractors. We also seek to preserve the integrity and confidentiality of our data and trade secrets by maintaining physical security of our premises and physical and electronic security of our information technology systems. While we have confidence in these individuals, organizations and systems, agreements or security measures may be breached, and we may not have adequate remedies for any breach. In addition, our trade secrets may otherwise become known or be independently discovered by competitors.
In-License Agreements. We license from Bayer HealthCare LLC certain intellectual property rights not acquired by us in connection with our formation transaction. On August 1, 2006 we entered into a collaboration and development agreement with Activaero GmbH which grants Talecris exclusive rights to use the Akita™ inhalation device for the aerosol delivery of A1PI for any indication. Under that agreement, we are committed to a minimal level of spending each year during development and should the product reach commercialization we must pay a royalty on sales, with no milestone payments due to Activaero GmbH. The agreement is valid until the last to expire applicable patent right—currently not expected until 2025. Talecris has the right to terminate with up to 120 days notice, but must pay a progressively higher termination fee determined by considering both the reason for Talecris’ termination and the number of years since the effective date of the agreement. On September 4, 2008 and December 17, 2008, we entered into exclusive commercial licenses with Crucell N.V. for two recombinant proteins, A1PI and Factor VIII (alone or combined with recombinant Von Willebrand Factor), respectively, utilizing advanced protein technology. We paid Crucell license fees and committed to pay them milestone payments when certain research and clinical targets have been met and royalty payments upon commercialization, while reserving the right for us to terminate the agreements without penalty upon 90 days notice.
Competition
The plasma products industry is highly competitive with changing competitive dynamics. We face, and will continue to face, competition from both U.S.-based and foreign producers of plasma-derived therapies, some of which have lower cost structure, greater capital, manufacturing facilities, resources for research and development, and marketing capabilities. In addition to competition from other large worldwide plasma products providers, we face competition in local areas from smaller entities. For example, in Europe, where the industry is highly regulated and health care systems vary from country to country, local entities may have greater knowledge of local health care systems, more established infrastructure and have existing regulatory approvals or a better understanding of the local regulatory process, allowing them to market their products more quickly. Moreover, plasma-derived therapies generally face competition from non-plasma products and other courses of treatment.
In 2007, we were ranked third in global plasma product sales, with a 12% share of worldwide sales. According to MRB, our principal plasma derivatives competitors are Baxter International, Inc., CSL Behring, Octapharma AG and Grifols, representing 22%, 18%, 9% and 8%, respectively, of worldwide plasma derivative sales in 2007. We also face competition in specific countries from local non-profit organizations.
With regard to other large plasma product providers and certain key products of the plasma product business, the competition we face, and the principal bases on which we compete, vary from product class to product class.
IGIV
The majority of competing IGIV products were, prior to 2007, either lyophilized powders that required time consuming reconstitution or lower concentrated liquid, most of which contain high levels of sugars and salt that pose increased risk of adverse events particularly in patients with cardiovascular risk factors and/or renal insufficiency. We believe our use of a caprylate purification process gives our product an advantage over competitors’ products that are purified by harsher solvent processes. Since 2002, the majority of sales for IGIV products have shifted from lyophilized to liquid with liquids capturing 29% of the market in 2002 and 80% in 2008. Liquid IGIV products are viewed as preferable because they are ready-to-use (i.e., they require no reconstitution), with generally excellent efficacy and tolerability profiles. Product margin improvement opportunities are being driven by the transition from lower priced lyophilized products to higher priced liquids using manufacturing processes that deliver improved IgG (immune gamma globulin) yields.
There has been considerable consolidation among IGIV producers in the U.S. In 2003, CSL acquired the assets from Aventis Behring, and Grifols acquired a range of assets from Mitsubishi’s Alpha Therapeutics that led to the exit of two IGIV brands. A year later, Octapharma and Grifols launched lower concentration liquids. Grifols has recently received FDA approval for its new manufacturing process: Flebogamma 5% DIF with double virus inactivation and filtering. CSL received U.S. regulatory approval for its liquid 10% IGIV and launched its product in 2008. CSL has a second generation subcutaneous product in development for a PI indication and launched Rhophylac for ITP in 2007. In 2006, Baxter Bioscience launched Gammagard Liquid 10% soon after its purchase of the American Red Cross IGIV product line (Panglobulin and Polygam). Other Baxter efforts in subcutaneous formulation and delivery in flexible containers have also been announced. We expect additional producers of IGIV outside the U.S. to introduce products into the U.S. in the next few years. For example, Bio Products Laboratory, a not-for-profit organization wholly-owned by the U.K. government, received approval from the FDA for its 5 percent concentration IGIV for PI and Octapharma and Grifols have filed for approval of a 10% liquid IGIV. Among producers of liquid IGIV products, we intend to compete primarily on the basis of our first-line positioning as the premium liquid IGIV brand with extensive clinical experience and well developed brand loyalty supplemented in the medium term with new indications and formulations.
A1PI
Until 2003, our A1PI product, Prolastin A1PI, was the only plasma product licensed and sold for therapy of congenital A1PI deficiency-related emphysema in the U.S. As new competitors introduced products into the U.S., our share of units sold of Prolastin A1PI in the U.S. was approximately 67% of all A1PI product sales in 2008 according to MRB. In August 2009 Kamada’s A1PI intravenous therapy was approved by the FDA and we expect them to begin sales in the U.S. in 2010. We expect to compete with increased competition on the basis of our long clinical history as well as brand name recognition and customer acceptance. In that regard, we believe we have a significant advantage because of our existing direct-to-patient delivery program, Prolastin Direct, which is our primary distribution mode in the U.S. We believe Prolastin is differentiated in the United States by its unique direct-to-patient distribution and service model, Prolastin Direct, which provides easy enrollment, home infusion, access to insurance experts and patient-centered health management. Prolastin Direct health management provides better patient outcomes by reducing the frequency of respiratory exacerbations. Furthermore, Prolastin Direct results in high medication compliance, with over 94% of prescribed doses being administered annually and high patient loyalty with, an annual retention rate of over 96%. New entrants will likely continue to gain some share of product sales for new patients (competitors have also invested in new patient identification efforts), but we have not incurred significant erosion of our existing customer base due to patients’ switching to alternative A1PI products and we have been successful in identifying new patients. We experience continual patient losses due to the nature of the disease.
Other manufacturers began selling A1PI products in the United States and Spain beginning in 2003 and France in 2005. In 2006, we completed a Mutual Recognition Procedure in the European Union covering countries where over 1,300 symptomatic patients have been identified but have had no access to a licensed A1PI product. Prolastin A1PI is approved in 15 European countries and we are currently established in six of these markets. We have been in reimbursement discussions with a number of these countries since late 2007 and these discussions must be concluded before we can expect to significantly increase sales in these countries. In October 2009, we received FDA approval, and in February 2010, we received Health Canada approval for Prolastin-C A1PI, a new concentrated version of our Prolastin A1PI product, which delivers the same amount of active protein, but with significantly reduced
infusion time. This product was developed using advances in manufacturing technology. We expect to launch sales of Prolastin-C A1PI in the first half of 2010.
Albumin
Recently, industry-wide albumin sales have increased significantly driven by both favorable volume demand and price. Among albumin products, competition is generally based on price, given that the products tend to be homogenous. In 2007, we had an approximate 7% share of global albumin and PPF sales. Most of our albumin sales are in the U.S.
Thrombate
We have the only plasma-derived brand ATIII licensed in the U.S. Recently, GTC Biotherapeutics received FDA approval for a competing product—Atryn, transgenic ATIII (produced in transgenic goats) for the treatment of hereditary antithrombin deficiency. The product was launched by Lundbeck, Inc. in the U.S. in May 2009.
Government Regulation
Government authorities in the U.S., at the federal, state and local level, and in other countries extensively regulate, among other things, the research, development, testing, approval, manufacturing, labeling, post-approval monitoring and reporting, packaging, promotion, storage, advertising, distribution, marketing and export and import of pharmaceutical products such as those we are developing. The process of obtaining regulatory approvals and the subsequent substantial compliance with appropriate federal, state, local and foreign statutes and regulations require the expenditure of substantial time and financial resources. The following is a summary of overall regulatory landscape for our business.
United States Government Regulation. In the U.S., the FDA regulates drugs under the Federal Food, Drug, and Cosmetic Act and implementing regulations. Failure to comply with the applicable FDA requirements at any time during the product development process, approval process or after approval may result in administrative or judicial sanctions. These sanctions could include the FDA’s imposition of a clinical hold on trials, refusal to approve pending applications, withdrawal of an approval, warning letters, product recalls, product seizures, total or partial suspension of production or distribution, injunctions, fines, civil penalties or criminal prosecution, or any combination of these sanctions. Any agency or judicial enforcement action could have a material adverse effect on us.
The BLA Approval Process. Drugs that are also biological products must also satisfy the requirements of the Public Health Services Act and its implementing regulations. In order for a biological drug product to be legally marketed in the U.S., the product must have a Biologic License Application (BLA), approved by the FDA.
The steps for obtaining FDA approval of a BLA to market a biological product in the U.S. include:
· completion of preclinical laboratory tests, animal studies and formulation studies under the FDA’s good laboratory practices regulations;
· submission to the FDA of an Investigational New Drug Application (IND), for human clinical testing, which must become effective before human clinical trials may begin and which must include independent Institutional Review Board, or IRB, approval at each clinical site before the trials may be initiated;
· performance of adequate and well-controlled clinical trials in accordance with Good Clinical Practices to establish the safety and efficacy of the product for each indication;
· submission to the FDA of a BLA, which contains detailed information about the chemistry, manufacturing and controls for the product, reports of the outcomes and full data sets of the clinical trials, and proposed labeling and packaging for the product;
· satisfactory review of the contents of the BLA by the FDA, including the satisfactory resolution of any questions raised during the review;
· satisfactory completion of an FDA Advisory Committee review, if applicable;
· satisfactory completion of an FDA inspection of the manufacturing facility or facilities at which the product is produced to assess compliance with cGMP regulations, to assure that the facilities, methods and controls are adequate to ensure the product’s identity, strength, quality and purity; and
· FDA approval of the BLA including agreement on post-marketing commitments, if applicable.
Preclinical tests include laboratory evaluations of product chemistry, toxicity and formulation, as well as animal studies. An IND sponsor must submit the results of the preclinical tests, together with manufacturing information and analytical data, to the FDA as part of the IND. Some preclinical testing may continue after the IND is submitted. The IND must become effective before human clinical trials may begin. An IND will automatically become effective 30 days after receipt by the FDA, unless before that time the FDA raises concerns or questions about issues such as the conduct of the trials and or supporting preclinical data as outlined in the IND. In that case, the IND sponsor and the FDA must resolve any outstanding FDA concerns or questions before clinical trials can proceed. In other words, submission of an IND may not result in the FDA allowing clinical trials to commence.
Clinical trials involve the administration of the investigational product to human subjects under the supervision of qualified investigators. Clinical trials are conducted under strict requirements to ensure the protection of human subjects participating in the trial and protocols detailing, among other things, the objectives of the study, the parameters to be used in monitoring safety and the effectiveness criteria to be evaluated. A protocol for each clinical trial and any subsequent protocol amendments must be submitted to the FDA as part of the IND. In addition, an institutional review board, or IRB, at each site at which the study is conducted must approve the protocol, subject consent form and any amendments. All research subjects must be informed, among other things, about the risks and benefits of the investigational product and provide their informed consent in writing.
Clinical trials typically are conducted in three sequential phases, but the phases may overlap or be combined. Phase I trials usually involve the initial introduction of the investigational drug into a small group of healthy volunteers (e.g., 10 to 20) to evaluate the product’s safety, dosage tolerance and pharmacokinetics and, if possible, to gain an early indication of its effectiveness.
Phase II trials usually involve controlled trials in a larger but limited patient population (e.g., a few hundred) to:
· evaluate dosage tolerance and appropriate dosage;
· identify possible adverse effects and safety risks; and
· provide a preliminary evaluation of the efficacy of the drug for specific indications.
Phase III trials usually further evaluate clinical efficacy and test further for safety in an expanded patient population (e.g., several hundred to several thousand). Phase III trials usually involve comparison with placebo, standard treatments or other active comparators. Usually two well-controlled large Phase III or pivotal trials demonstrating safety and efficacy are required. These trials are intended to establish the overall risk-benefit profile of the product and provide an adequate basis for physician labeling. Phase III trials are usually larger, more time consuming, more complex and more costly than Phase I and Phase II trials. Since most of our products are aimed at very small populations where it is not always possible to conduct two large studies, regulators may accept one study on a smaller number of patients than would typically be required for pharmaceutical products in general provided the data are sufficiently robust.
Phase I, Phase II and Phase III testing may not be completed successfully within any specified period, if at all. Furthermore, the FDA or we may suspend or terminate clinical trials at any time on various grounds, including a finding that the subjects or patients are being exposed to an unacceptable health risk, have experienced a serious and unexpected adverse event, or that continued use in an investigational setting may be unethical. Similarly, an IRB can suspend or terminate approval of research if the research is not being conducted in accordance with the IRB’s requirements or if the research has been associated with unexpected serious harm to patients.
Assuming successful completion of the required clinical testing, the results of the preclinical studies and of the clinical trials, together with other detailed information, including information on the chemistry, manufacture and composition of the product, are submitted to the FDA in the form of a BLA requesting approval to market the product for one or more indications. In most cases, the BLA must be accompanied by a substantial user fee. The FDA will initially review the BLA for completeness before it accepts the BLA for filing. After the BLA submission is accepted for filing, the FDA reviews the BLA to determine, among other things, whether a product is safe and effective for its intended use and whether the product is being manufactured in accordance with cGMP to assure and preserve the product’s identity, strength, quality, purity and potency.
Under the Pediatric Research Equity Act of 2003, or PREA, BLAs or supplements to BLAs must contain data to assess the safety and effectiveness of the drug for the claimed indications in all relevant pediatric subpopulations and to support dosing and administration for each pediatric subpopulation for which the drug is safe and effective. The FDA may grant deferrals for submission
of data or full or partial waivers. Unless otherwise required by regulation, PREA does not apply to any drug for an indication for which orphan designation has been granted.
Before approving a BLA, the FDA generally will inspect the facility or the facilities at which the product is manufactured. The FDA will not approve the product if it finds that the facility does not appear to be in cGMP compliance. If the FDA determines the application, manufacturing process or manufacturing facilities are not acceptable, it will either disapprove the application or issue an approvable letter in which it will outline the deficiencies in the BLA and provide the applicant an opportunity to meet with FDA representatives and subsequently to submit additional information or data to address the deficiencies. Notwithstanding the submission of any requested additional information, the FDA ultimately may decide that the application does not satisfy the regulatory criteria for approval.
The testing and approval process requires substantial time, effort and financial resources, and each may take several years to complete. Data obtained from clinical activities are not always conclusive and may be susceptible to varying interpretations, which could delay, limit or prevent regulatory approval. The FDA may not grant approval on a timely basis, or at all. We may encounter difficulties or unanticipated costs in our efforts to secure necessary governmental approvals, which could delay or preclude us from marketing our products. The FDA may limit the indications for use or place other conditions on any approvals that could restrict the commercial application of the products. After approval, some types of changes to the approved product, such as adding new indications, manufacturing changes and additional labeling claims, are subject to further testing requirements and FDA review and approval.
Post-Approval Requirements. After regulatory approval of a product is obtained, we are required to comply with a number of post-approval requirements. For example, as a condition of approval of a BLA, the FDA may require post marketing testing and surveillance to monitor the product’s safety or efficacy. In addition, holders of an approved BLA are required to keep extensive records, to report certain adverse reactions and production problems to the FDA, to provide updated safety and efficacy information and to comply with requirements concerning advertising and promotional labeling for their products. Also, quality control and manufacturing procedures must continue to conform to cGMP regulations as well as the manufacturing conditions of approval set forth in the BLA. The FDA periodically inspects manufacturing facilities to assess compliance with cGMP regulations, which imposes certain procedural, substantive and recordkeeping requirements. Accordingly, manufacturers must continue to expend time, money and effort in the area of production and quality control to maintain compliance with cGMP and other aspects of regulatory compliance.
Future FDA inspections may identify compliance issues at our facilities or at the facilities of our contract manufacturers that may disrupt production or distribution, or require substantial resources to correct and prevent recurrence of any deficiencies. In addition, discovery of problems with a product or the failure to comply with applicable requirements may result in restrictions on a product, manufacturer or holder of an approved BLA, including withdrawal or recall of the product from the market or other voluntary, FDA-initiated or judicial action that could delay or prohibit further marketing. Newly discovered or developed safety or effectiveness data may require changes to a product’s approved labeling, including the addition of new warnings and contraindications. Also, new government requirements, including those resulting from new legislation, may be established that could delay or prevent regulatory approval of our products under development.
Orphan Drug Designation. The FDA may grant orphan drug designation to drugs intended to treat a “rare disease or condition” that affects fewer than 200,000 individuals in the U.S., or more than 200,000 individuals in the U.S. and for which there is no reasonable expectation that the cost of developing and making available in the U.S. a drug for this type of disease or condition will be recovered from sales in the U.S. for that drug. Orphan drug designation must be requested before submitting an application for marketing approval. Orphan drug designation does not convey any advantage in, or shorten the duration of, the regulatory review and approval process. Orphan drug designation can provide opportunities for grant funding towards clinical trial costs, tax advantages and FDA user-fee benefits. In addition, if a product which has an orphan drug designation subsequently receives the first FDA approval for the indication for which it has such designation, the product is entitled to orphan drug exclusivity, which means the FDA may not approve any other application to market the same drug for the same indication for a period of seven years, except in limited circumstances, such as a showing of clinical superiority to the product with orphan exclusivity or a meaningfully different mode of administration. Competitors may receive approval of different drugs or biologics for the indications for which the orphan product has exclusivity. However, if a company with orphan drug exclusivity is not able to supply the market, the FDA could allow another company with the same drug a license to market for said indication.
Fast Track Designation. The FDA’s fast track programs, one of which is fast track designation, are designed to facilitate the development and review of new drugs that are intended to treat serious or life threatening conditions and that demonstrate the potential to address unmet medical needs for the conditions. Fast track designation applies to a combination of the product and the specific indication for which it is being studied. Thus, it is the development program for a specific drug for a specific indication that receives fast track designation. The sponsor of a product designated as being in a fast track drug development program may engage in close early communication with the FDA including through timely meetings and feedback on clinical trials. Products in fast track drug
development programs also may receive Priority Review or accelerated approval (i.e., where the review cycle is set with a six-month review clock instead of 10- or 12-month review clock). Sponsors may also be able to submit completed portions of an application before the entire application is completed; however, the review clock will not officially begin until the entire completed BLA is submitted to and filed by the FDA. The FDA may notify a sponsor that its program is no longer classified as a fast track development program if the fast track designation is no longer supported by emerging data, the designated drug development program is no longer being pursued, or another product that meets the unmet medical need for the same indication is approved first.
Regulation Outside the United States. In addition to regulations in the U.S., we are subject to a variety of regulations in other jurisdictions governing clinical trials and commercial sales and distribution of our products. Whether or not we obtain FDA approval for a product, we must obtain approval of a product by the comparable regulatory authorities of countries outside the U.S. before we can commence clinical trials or marketing of the product in those countries. The approval process varies from country to country, and the time may be longer or shorter than that required for FDA approval. The requirements governing the conduct of clinical trials, product licensing, pricing and reimbursement vary greatly from country to country.
To obtain regulatory approval of a drug under European Union regulatory systems, we may submit marketing authorizations either under a centralized or decentralized procedure. The centralized procedure, which is compulsory for medicines produced by certain biotechnological processes and optional for those which are highly innovative, provides for the grant of a single marketing authorization that is valid for all European Union member states. All marketing authorizations for products designated as orphan drugs must be granted in accordance with the centralized procedure. The decentralized procedure provides for approval by one or more other, or concerned, member states of an assessment of an application performed by one member state, known as the reference member state. Under this procedure, an applicant submits an application, or dossier, and related materials including a draft summary of product characteristics, and draft labeling and package leaflet, to the reference member state and concerned member states. The reference member state prepares a draft assessment and drafts of the related materials within 120 days after receipt of a valid application. Within 90 days of receiving the reference member state’s assessment report, each concerned member state must decide whether to approve the assessment report and related materials. If a member state cannot approve the assessment report and related materials on the grounds of potential serious risk to the public health, the disputed points may eventually be referred to the European Commission, whose decision is binding on all member states.
The European Agency for the Evaluation of Medicinal Products grants orphan drug designation to promote the development of products that may offer therapeutic benefits for life-threatening or chronically debilitating conditions affecting not more than five in 10,000 people in the European Union. In addition, orphan drug designation can be granted if the drug is intended for a life threatening, seriously debilitating or serious and chronic condition in the European Union and that without incentives it is unlikely that sales of the drug in the European Union would be sufficient to justify developing the drug. Orphan drug designation is only available if there is no other satisfactory method approved in the European Union of diagnosing, preventing or treating the condition, or if such a method exists, the proposed orphan drug will be of significant benefit to patients. Orphan drug designation provides opportunities for free protocol assistance, fee reductions for access to the centralized regulatory procedures before and during the first year after marketing authorization and 10 years of market exclusivity following drug approval. Fee reductions are not limited to the first year after authorization for small and medium enterprises. The exclusivity period may be reduced to six years if the designation criteria are no longer met, including where it is shown that the product is sufficiently profitable not to justify maintenance of market exclusivity.
FDA-approved Talecris products are required to be registered and approved by local regulatory agencies in the majority of countries outside North America and Europe. There are a limited number of countries (Bahamas, Bermuda, Guam, Oman and Quatar) which do not require further local product registration and product may be distributed based on the existing FDA approval. In addition, any changes in the distributors supporting our export business could result in a loss of sales.
Pharmaceutical Pricing and Reimbursement
In the United States and markets in other countries, sales of any products for which we receive regulatory approval for commercial sale will depend in part on the availability of reimbursement from third-party payors. Third-party payors include government health programs, managed care providers, private health insurers and other organizations. These third-party payors are increasingly challenging the price and examining the cost-effectiveness of medical products and services. In addition, significant uncertainty exists as to the reimbursement status of newly approved healthcare products. Our products may not be considered cost-effective. Adequate third-party reimbursement may not be available to enable us to maintain price levels sufficient to realize an appropriate return on our investment in product development.
In the U.S., Talecris’ products are reimbursed or purchased under several government programs, including, Medicaid, Medicare Parts B and D, the 340B/Public Health Service (“PHS”) program, and pursuant to our contract with the Department of Veterans Affairs. Medicaid is a joint state and federal government health plan that provides covered outpatient prescription drugs for low-income individuals. Under Medicaid, drug manufacturers pay rebates to the states based on utilization data provided by the states. The rebate amount for branded drugs is equal to 15.1% of the Average Manufacturer Price (“AMP”) or AMP less Best Price
(“BP”), whichever greater. The government has proposed increasing the size of the Medicaid rebates paid by drug manufacturers to 23.1% of the AMP.
Medicare Part B reimburses providers for drugs provided in the outpatient setting based upon Average Sales Price (“ASP”). Recent federal government reforms to Medicare Part B have reduced the reimbursement rates for IGIV. Beginning January 1, 2008, CMS reduced the reimbursement for separately covered outpatient drugs and biologicals, including IGIV in the hospital outpatient setting, from ASP +6% to ASP +5% using 2006 Medicare claims data as a reference for this reduction. CMS reduced this reimbursement further in 2009 to ASP +4% using aggregate hospital cost report data as a reference for the reduction. Additional reductions in Medicare Part B reimbursement rates could restrict access to our products.
Medicare Part D is a partial, voluntary prescription drug benefit created by the federal government primarily for persons 65 years old and over. The Part D drug program is administered through private insurers that contract with CMS. Government payment for some of the costs of prescription drugs may increase demand for any products for which we receive marketing approval. However, to obtain payments under this program, we are required to negotiate prices with private insurers operating pursuant to federal program guidance. These prices may be lower than we might otherwise obtain.
Some payors, including Medicare Part D plans and some state Medicaid programs, reimburse providers for drugs based upon a discount off of the Average Wholesale Price (“AWP”). AWP is a list price determined by third party publishers, which does not reflect actual transactions in the distribution chain. We do not publish an AWP for any of our products. We may be at a competitive disadvantage where providers are reimbursed on an AWP basis and competitors’ products are reimbursed at higher rates than our corresponding product.
The availability of federal funds to pay for our products under the Medicaid and Medicare Part B programs requires that we extend discounts under the 340B/PHS drug pricing program. The 340B drug pricing program extends discounts to a variety of community health clinics and other entities that receive health services grants from the PHS, as well as hospitals that serve a disproportionate share of certain low income individuals. The PHS price or “ceiling price” cannot exceed the AMP (as reported to CMS under the Medicaid drug rebate program) less the Medicaid unit rebate amount. Talecris has entered into a Pharmaceutical Pricing Agreement (“PPA”) with the government in which the company has agreed to participate in the 340B/PHS program by charging eligible entities no more than the PHS ceiling price for drugs intended for outpatient use. The government has recently proposed amendments to the 340B program that would extend the availability of PHS pricing to drugs administrated by eligible entities in the inpatient setting, impose a “must sell” obligation on manufacturers, and/or eliminate a program restriction that prohibits entities from participating in the 340B program while also participating in a GPO or group purchasing arrangement for outpatient drugs. If enacted, these proposals could require us to allocate even more of our products for sale under the 340B program in order to maintain the availability of federal funds to pay for our products under Medicaid and Medicare Part B coverage.
We also make our products available for purchase by authorized government users of the Federal Supply Schedule (“FSS”) pursuant to our FSS contract with the Department of Veterans Affairs. Under the Veterans Health Care Act of 1992, or the VHC Act, we are required to offer discounted FSS contract pricing to four Federal agencies — the Department of Veterans Affairs, the Department of Defense, the Coast Guard and the Public Health Service (including the Indian Health Service) — for federal funding to be made available for reimbursement of any of our products under the Medicaid program and for our products to be eligible to be purchased by those four Federal agencies. FSS pricing to those four Federal agencies must be equal to or less than the “Federal Ceiling Price,” which is, at a minimum, 24% off the Non-Federal Average Manufacturer Price, or “Non-FAMP”, for the prior fiscal year.
The marketability of any products for which we receive regulatory approval for commercial sale may suffer if the government and third-party payors fail to provide adequate coverage and reimbursement. Federal, state and local governments in the U.S. continue to consider legislation to limit the growth of healthcare costs, including the cost of prescription drugs. Future legislation could limit payments for pharmaceuticals such as the drug candidates that we are developing, including possibly permitting the federal government to negotiate prices directly with manufacturers. In addition, an increasing emphasis on managed care in the U.S. has increased and will continue to increase the pressure on pharmaceutical pricing. For a discussion of certain risks related to reimbursement and pricing, please see “Risk Factors—Risks Related to Healthcare Reform and Reimbursement—We could be adversely affected if government or private third-party payors decrease or otherwise limit the amount, price, scope or other eligibility requirements for reimbursement for the purchasers of our products.”
Other
Our operations and many of the products we manufacture or sell are subject to extensive regulation by numerous other governmental agencies, both within and outside the United States. In the United States, apart from the agencies discussed above, our facilities, operations, employees, products (their manufacture, sale, import and export) and services are regulated by the Drug Enforcement Agency, the Environmental Protection Agency, the Occupational Health & Safety Administration, the Department of
Agriculture, the Department of Labor, Customs and Border Protection, the Department of Commerce, the Department of Treasury, the Department of Justice and others. Furthermore, because we supply products and services to healthcare providers that are reimbursed by federally funded programs such as Medicare, our activities are also subject to regulation by the Centers for Medicare and Medicaid Services and enforcement by the Office of the Inspector General within the Department of Health and Human Services. State agencies also regulate our facilities, operations, employees, products and services within their respective states. Government agencies outside the United States also regulate public health, product registration, manufacturing, environmental conditions, labor, exports, imports and other aspects of the company’s global operations. For further discussion of the impact of regulation on our business, see “Risk Factors—Risks Related to Our Business—Certain of our other business practices are subject to scrutiny by regulatory authorities.”
Employees
As of December 31, 2009, we had approximately 5,000 full-time employees, none of which are represented by labor unions or covered by collective bargaining agreements. We consider our relationships with our employees to be good.
Of our workforce, 303 employees are engaged in research and development at December 31, 2009 as described below:
|
Functional |
|
Headcount |
|
Core responsibilities |
|
|
Preclinical |
|
28 |
|
|
Candidate identification, pre-clinical research, candidate advancement to development decision, candidate screening based on proof of principle or clear mechanism of action. |
|
Administration |
|
12 |
|
|
Office of the Executive Vice President, R&D, R&D Pre-Clinical and Clinical Compliance, and R&D facilities personnel. |
|
Program Management Office |
|
7 |
|
|
Oversight of the systems for and management of the execution of, strategic development projects for new products, new indications, and new processes. |
|
Technology |
|
87 |
|
|
Process development and improvement for plasma-based products (including technical support for operations), technology exploration, process/product development, and clinical manufacturing operations. |
|
Pathogen safety |
|
36 |
|
|
Exploration, introduction, validation of viral and prion detection and reduction technologies. |
|
BioAnalytics |
|
63 |
|
|
Exploration, implementation of new technologies for analytics, support of R&D functions, development of new and improved test methods for operations. |
|
Medical Affairs |
|
52 |
|
|
Continuing medical education, medical writing and publication, communicating medical information to health care providers. Trial design, execution, monitoring, data collection, analysis, report creation, regulatory agency interaction (supplemented by external contract research organizations). |
|
NAT Development |
|
18 |
|
|
To develop, validate, and support the operational setting of the Nucleic Acid Technology operational group located at our Raleigh Test Lab, primarily serving manufacturing operations in the testing of all incoming plasma units for blood born pathogens. |
|
Total |
|
303 |
|
|
|
Industry
Overview of the Plasma Products Industry
Industry Dynamics. The human plasma-derived products industry has demonstrated revenue growth at a compound annual rate of approximately 8% globally over the past 21 years with worldwide sales of approximately $9.7 billion in 2008 based on MRB data. U.S. sales have grown at a compound annual rate of approximately 10% over the past 18 years with sales of $4.0 billion in 2008, representing a 13.5% increase over 2007, according to the MRB U.S. Book. Consistent worldwide growth in demand and favorable supply/demand dynamics have generally provided a basis for price increases over the past five years.
Significant industry consolidation has reduced the number of major producers of plasma-derived products in the U.S. to five companies, including us. Three companies, including us, currently collectively account for almost 81% of U.S. sales according to the MRB U.S. Book. The industry today has fewer participants, which tend to be larger, vertically integrated and profit driven, with the scale necessary to permit investment in the development of new therapies and indications, and more efficient and compliant facilities to serve the patient community.
We believe that many plasma-derived products are underutilized and have positive growth outlook. We believe worldwide unit volume demand for plasma-derived products will grow over the long term at a compound annual rate of approximately 6% to 8%, driven principally by the following factors:
· population growth;
· discovery and approval of new applications and indications for plasma-based products;
· growth of diagnosed cases;
· increased treatment of untreated but diagnosed patients;
· increased patient compliance and appropriate dosing levels for diagnosed, treated patients; and
· geographic expansion.
There are significant barriers to entry into the plasma derivatives manufacturing business, including the operationally complex nature of the business, which requires a highly skilled workforce with specialized know-how; significant intellectual property, including trade secrets relating to purification of products and pathogen safety; the need to develop recognized and trusted brands as well as sales, marketing and distribution infrastructures and relationships; and the ability to comply with extensive regulation by the FDA and comparable authorities worldwide. Additionally, the construction and maintenance, including regular improvements necessitated by evolving standards of current Good Manufacturing Practices (cGMP), of production facilities requires extensive capital expenditures and may involve long lead times to obtain necessary governmental approval. For example, we have invested approximately $630 million in our primary manufacturing facility since 1995. Further, unlike small molecule pharmaceutical products, which are often subject to patent expirations on a defined date, plasma-derived protein therapies are usually protected through intellectual property relating to process, including trade secrets, which may not have a scheduled expiration. New entrants may, however, develop and market competing products by subcontracting portions of the manufacturing process, such as fractionation or purification, from existing plasma derivative manufacturers. Also, existing fractionators with operations in one region may have lower barriers to entering other regional areas. In addition, while the industry’s plasma supply constraint has eased, any new competitors in the U.S. would need to secure an adequate supply of U.S. plasma since, as a practical matter, although plasma collected in the U.S. may be certified for use in products sold in Europe and Canada, only plasma collected in the U.S. is certified for use in products sold in the U.S. Since there are currently a very limited number of independent plasma suppliers, much of whose plasma collection and center development capacity is already contracted to existing fractionators, any new competitor would likely have to eventually develop their own U.S. based plasma collection centers and related infrastructure.
Plasma-Derived Products
The three largest selling plasma proteins, which together constituted approximately 71% and 73% of plasma-derived product sales in the world in 2007 and the U.S. in 2008, respectively, and their therapeutic properties are:
· IGIV products, which are antibody-rich plasma therapies that have long been used in the treatment of immune related disorders such as primary immune deficiencies (PI) and certain autoimmune disorders, such as CIDP, where IGIV is thought to act as an immune modulator. Physicians frequently prescribe IGIV for a wide variety of diseases even though these uses are not described in the product’s labeling and differ from those tested in clinical studies and approved by the FDA or similar regulatory authorities in other countries. These unapproved, or “off-label,” uses are common across
medical specialties, and physicians may believe such off-label uses constitute the preferred standard of care or treatment of last resort for many patients in varied circumstances. We believe that a significant portion of IGIV volume may be used to fill physician prescriptions for indications not approved by the FDA or similar regulatory authorities. We estimate neurologists are the largest prescribers in the U.S., representing 48% of the total IGIV volume. We further estimate CIDP, PI and idiopathic thrombocytopenic purpura (ITP) collectively represent approximately 61% of U.S. IGIV volume. Demand for IGIV has increased rapidly in recent years, and it now represents the largest plasma-derived product by sales value. It is one of the key growth drivers of the industry largely due to the increasing number of medical conditions for which IGIV is used. We expect worldwide unit volume demand to grow over the long term at a compound annual rate of approximately 6% to 8% with similar growth in the U.S. Because IGIV is a complex mixture of antibody molecules, no recombinant (or synthetic) means of production currently exists. Thus, IGIV can only be derived from human plasma. Our most significant revenue generating product, Gamunex, Immune Globulin Intravenous (Human), 10% Caprylate/Chromatography Purified, is one of the leading revenue products in the IGIV market, with a reputation as a premium product.
· Factor VIII, which is a blood coagulation factor for the treatment of Hemophilia A. Hemophilia A is a hereditary condition that affects an estimated 380,000 patients worldwide; however, we estimate that only one-third of those have been identified and are being treated. A recombinant substitute has been developed for Factor VIII. Recombinant Factor VIII is currently priced higher than plasma-derived Factor VIII because recombinants have generally been perceived to be safer. In 2007, worldwide sales of plasma-derived Factor VIII were $1.2 billion and comprised 12% of the global plasma product sales. In 2008, Recombinant Factor VIII sales in 2007 were $3.5 billion worldwide. Recombinant Factor VIII was more prevalent in the U.S. in 2008 with 86% of total Factor VIII sales and 81% of units according to MRB data. In Europe, recombinant Factor VIII had 73% of sales and 63% of the units. The plasma-derived Factor VIII market had a compound annual growth rate of 6% over the past ten years. The global market for plasma-derived Factor VIII is supply constrained resulting in unmet demand. Growth in plasma-derived Factor VIII is being driven by increased patient identification and treatment in developing countries. The current per capita Factor VIII utilization is significantly higher in the U.S. and European Union (EU) than in developing countries. We produce and market plasma-derived Factor VIII under our Koate DVI Antihemophilic Factor (human) brand.
· Albumin, which is used as an expander of plasma volume after significant blood losses during surgery or trauma, for severe burns or for patients with acute liver or kidney failures. Prices of, and demand for, albumin have stabilized recently as prescribers have recognized that albumin has therapeutic significance. The demand for albumin has increased since 2000 and is projected to grow moderately over the next few years. Prices for albumin have increased significantly since 2005, although they have not reached historical highs, as the average selling price for albumin reached $50.15 in 1998. The U.S. average selling price in 2008 was $33.09, having grown at a compound annual rate of 28.5% since 2005, when the average selling price was $15.58. We produce and market albumin and Plasma Protein Factor (human) (PPF) under two brand names: Plasbumin and Plasmanate, both of which are derived from plasma Fraction V.
A1PI is a fourth protein that is financially important to us and is growing in sales. From December 1987 to December 2002 we had the only FDA approved A1PI product, Prolastin A1PI, which had net revenue of $319.1 million in 2009 and $316.5 million in 2008. In December 2003, two competing A1PI products were introduced into the market. We expect that increased spending on patient identification and physician education, as well as product introduction in additional countries, will increase the demand for A1PI products. We received FDA approval for our next generation A1PI product, Prolastin-C, in October 2009 and received Health Canada approval in February 2010 and are currently in the process of launching it in the U.S. and Canada.
The following chart presents a breakdown of worldwide sales of plasma derivatives by product category in 2007.
2007 Plasma Derivative Worldwide Sales by Category
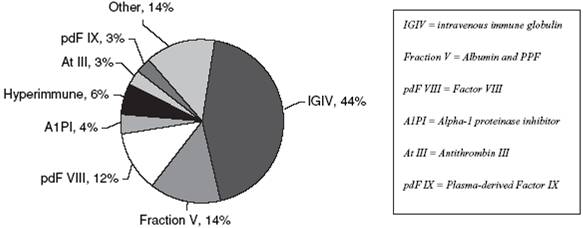
Plasma-Derived Products Sales by Geographic Region
Due to the high demand and cost of plasma-derived therapies, the majority of plasma sales are derived from the more economically developed regions in the world. Compared to the U.S. and Canada, where the industry is open, though highly regulated, Europe is characterized by local fractionators, considerable government control, and divergent health care systems. Japan is mainly supplied by local producers. The following chart presents a breakdown of the global sales of plasma derivatives by region in terms of sales in 2007.
Estimated 2007 Plasma Derivative Worldwide Sales by Region

Plasma Collection and Testing
Plasma may be obtained in two different ways. The traditional method is through the separation of plasma from blood obtained from a blood donation. This is referred to as “recovered plasma.” This plasma is the by-product of donations made at blood banks or transfusion centers because the main objective of these banks and centers is to obtain the blood cells and platelets.
The second method for obtaining plasma is through a process called “plasmapheresis” whereby plasma is mechanically separated from the cellular elements of blood (such as red and white cells and platelets) through centrifugation or membrane filtration at the time the donation is made. These cellular elements are then returned to the donor as part of the same procedure. Because blood cells are returned, it is possible for individuals to donate plasma more frequently than whole blood. Plasma obtained through
plasmapheresis is referred to as “source plasma.” We believe that source plasma constitutes roughly two-thirds of plasma processed by fractionators.
In order to prevent the deterioration of coagulation factors, plasma is typically frozen as soon as possible after collection. Source plasma is generally frozen within six hours following donation, whereas recovered plasma must first be separated from the blood cells. Freezing must be carried out within 24 to 72 hours if intended for the fractionation and purification of proteins.
U.S. and European regulatory authorities impose stringent requirements to avoid the transmission of blood borne diseases. Each donation is typically tested for the following infections: Hepatitis A, Hepatitis B, Hepatitis C, Parvo B-19 and HIV. Then it is sent to a fractionator, where it undergoes additional viral marker testing as well as nucleic acid testing in the production environment. Thereafter, it is broken down into its constituent parts, or “fractions.” “Bulk” fractions are further refined into final products through various purification processes, formulation and aseptic filling.
As a practical matter, although plasma collected in the U.S. may be certified for use in products sold in Europe, only plasma collected in the U.S. is certified for use in products sold in the U.S.
Production of Plasma-Derived Products (Fractionation)
Three principle techniques are used to separate proteins into bulk fractions: the Cohn, Kistler-Nitschmann and Chromatography techniques.
· Cohn. Cohn, the most widely employed technique and the one we use, subjects plasma to varying conditions of alcohol concentration, pH level and temperature to separate specific protein fractions from the plasma. The fractions are then collected using centrifugation or filtration. Following fractionation, the protein pastes are purified using steps such as solvent detergent treatment, caprylate incubation, column chromatography, and various methods of filtration. In 2003, we began use of the more advanced chromatography technique for purification of fraction II and III paste to produce our Gamunex IGIV product.
· Kistler-Nitschmann. Kistler-Nitschmann is derived from the Cohn process and is often used in smaller fractionation facilities. This technique produces a limited product range, consisting of primarily immunoglobulins and albumin.
· Chromatography. Chromatography separates plasma proteins by specifically targeting the unique characteristics of each protein, which include: molecular size, using gel filtration; charge, using ion exchange chromatography; and known reactions with specific molecules, using affinity chromatography. Chromatography has higher product purity and superior product yields compared to the Cohn technique. However, regulatory hurdles, including the approval process for the procedure and the type of production facility required, have made the cost of switching to chromatography very expensive. As a result, few plasma fractionators have adopted this technique for fractionation, although many use it for purification.
Once the plasma has been broken down into bulk fractions using one of these separation techniques, each fraction undergoes a series of production steps including purification, filling, freeze-drying (for those products requiring lyophilisation), packaging and distribution. Purification involves the further isolation of the fraction, as well as viral removal/inactivation steps, using a variety of technologies. The specific procedures used differentiate the end product and are generally proprietary to each fractionator.
Plasma Supply Consolidation and Rationalization
Plasma-derived product manufacturers secure human plasma in the United States from either third-party supply contracts (e.g., with a blood bank or with an independent plasma collection company) or from vertically integrated plasma collection centers. Historically, several of the largest global fractionators relied on smaller, independently owned U.S. source plasma collection companies to supply a portion of their plasma supply. Over time, fractionators chose to vertically integrate and acquire many of these suppliers. As of 2009, all five of the largest global fractionators are either fully integrated or, like us, have a significant percent of their total plasma collection internalized as a result of vertical integration.
The vertical integration of the plasma supply has resulted in fewer, but more efficient, plasma collection centers in the United States producing more U.S. source plasma. From 1996 to 2008, we believe that the number of U.S. plasma collection centers decreased from 454 to 389, while the volume of source plasma has increased from 11.8 million liters to 15.4 million liters.
The growth in U.S. source plasma collections over the past several years has been higher than in other geographic areas, primarily due to the desire of fractionators to have the flexibility to export U.S. source plasma for the manufacture of products outside
the U.S., the favorable collection environment for source plasma centers in the U.S., and by the decreasing availability of recovered plasma worldwide.
Market estimates continue to point to new growth in U.S. source plasma, as new centers are developed in the U.S. and individual plasma center productivity improves. Despite the growth in U.S. source plasma supply, a continued increase in demand for plasma products in recent years has led to industry supply constraints, which supported pricing increases for many plasma products and stimulated the addition of new plasma collection centers to meet the increased need for source plasma. As a result of demand and as a result of increased collection and testing costs, prices for key plasma-derived products have generally increased over the past three years.
In response to IGIV demand, we and some of our competitors and independent suppliers opened a significant number of new plasma collection centers. We believe that worldwide plasma collection is increasing and will continue to increase in future years, primarily driven by increased plasma collection in the U.S. The supply of plasma has sufficiently increased providing a more balanced level of IGIV supply and demand. As a result, the supply of IGIV inventory has been increasing throughout the distribution channel from the previous low levels.
Fractionation and Purification Capacity Rationalization
As overall plasma supply was reduced from 2000 to 2005, industry utilization of facilities and in some cases capacity for fractionation was also reduced. Currently, product production capacity may be limited by fractionation capacity or purification capacity. Our competitors and we have announced plans to invest in the development of additional fractionation and purification capacity, which should allow production of plasma-derived therapies to meet the pace of demand.
Industry Consolidation
We believe that, in addition to the capacity reductions described above, the plasma products industry has been transformed in the past decade by the exit of traditional pharmaceutical companies, such as Aventis S.A., Bayer AG and Mitsubishi Pharma Corporation, and of major non-profits, such as the American Red Cross, from the plasma proteins business. Over the same period, the industry had undergone sudden restrictions in product supply, with the imposition of consent decrees resulting from regulatory action by the FDA against certain manufacturers, which limited their ability to release product for sale. These restrictions on product release were lifted in relatively close proximity in 2000 and 2001, creating an excess supply environment in subsequent years. In response, the remaining producers subsequently rationalized production and plasma collection capacity and began to vertically integrate. The number of major producers of plasma products globally decreased from 13 in 1990 to 8 in 2002 and to 5 in 2005. Three major producers, including us, collectively accounted for almost 81% of 2008 U.S. sales of plasma-derived products. The resulting industry has fewer participants, that tend to be larger and vertically integrated.
Recombinant Manufacturing
During the late 1970s and early 1980s, some plasma-derived Factor VIII patients were exposed to HIV and Hepatitis C through contaminated Factor VIII products. In an effort to eliminate the risk of pathogen transmission, scientists developed recombinant or synthetic alternatives to plasma-derived Factor VIII products for the treatment of Hemophilia A and Hemophilia B.
Recombinant products have taken a significant share of Factor VIII sales due to their near independence from human plasma. Of the 6.2 billion units of Factor VIII sold in 2007, approximately 60% were recombinant. On a per unit basis, recombinants are priced approximately 94% higher than plasma-derived products and have been adopted more rapidly in the U.S. and industrialized nations. The high cost of recombinant products prevents their use in developing markets where plasma derivatives are the standard. We are conducting pre-clinical development of recombinant Factor VIII proteins utilizing advanced protein production technology.
Although recombinant technology could be used to produce any of the coagulation proteins found in blood, its use is limited to larger, more developed markets, which have the demand to sustain the high cost of development. Most other plasma products, such as IGIV and A1PI, are not currently produced using recombinant technologies for human therapeutic use.
In the case of IGIV, this is due to its nature as a collection of different types of antibodies, which makes the development of a recombinant version very difficult. In the case of A1PI, we believe that no recombinant competitor for the therapy of Alpha-1 deficiency has developed a molecule that could have a half-life equivalent to the plasma-derived protein; however, emerging protein production technologies could make a recombinant competitor feasible. We are conducting pre-clinical development of recombinant A1PI using advanced protein production technology.
We have begun work to develop a recombinant version of Plasmin. We have secured intellectual property rights around this product and hope to eventually commercialize recombinant Plasmin for the treatment of ischemic stroke. The ability for us to produce therapeutic proteins by recombinant means would significantly expand our opportunities to produce additional products in the future.
U.S. Plasma Products Distribution
Historically, manufacturers of plasma-derived products sought to distribute their finished product through the same distribution channels as pharmaceuticals, typically through wholesalers, which purchased products at fixed prices, re-sold them at contract prices and charged the difference to the manufacturer. The plasma therapeutics market, however, has evolved from wholesalers to highly specialized plasma distributors, including:
· “Group Purchasing Organizations,” or GPOs, which are umbrella buying groups representing inpatient and outpatient hospitals and non-acute members who benefit through consolidated supply contracts. GPOs do not purchase products directly, rather, they select authorized distributors which purchase inventory and handle all product logistics for their members.
· Wholesalers/Distributors either provide product directly to, or enter into distribution agreements with, hospitals, GPOs, and physician offices. The distributor is generally paid service fees for “encumbered” products on a GPO contract, or they purchase “unencumbered” products directly from manufacturers which are not part of a GPO contract.
· Homecare and specialty pharmacy providers are a growing segment which provides patient treatment in the home, either through self-medication or with the assistance of a nurse. These providers either purchase products direct from manufacturers or through GPOs.
· Manufacturing Direct programs distribute products directly to a physician’s office or patient’s home.
The distribution by product line and type are summarized as follows:
· We estimate that 64% (41% in-patient; 23% out-patient) of the IGIV sold in the U.S. in 2008 was purchased by hospitals for both in-patient and out-patient use; physician offices represented about 18% of IGIV volume; and homecare companies and specialty pharmacies represented 17% of the IGIV volume.
· A1PI is generally distributed by homecare companies and specialty pharmacies and administered by a nurse at home or at a hospital infusion suite. In the U.S., Prolastin A1PI is sold directly to patients through our Prolastin Direct program, which includes nursing, reimbursement, and health management services. These services are administered by Centric Health Resources, in which we hold a 30% equity interest as of December 31, 2009. Competing products in the U.S. generally sell to homecare providers.
· Albumin is generally used in surgical and trauma settings and is generally sold to hospital groups.
Clotting factors, such as Factor VIII, generally are self administered by patients and are mainly channeled from manufacturers to patients through home care companies and similar agencies.
Available Information
Our Internet website address is www.talecris.com. Our Annual Reports on Form 10-K, Quarterly Reports on Form 10-Q, Current Reports on Form 8-K, and amendments to those reports filed or furnished pursuant to section 13(a) or 15(d) of the Exchange Act are available free of charge through our website as soon as reasonably practicable after we electronically file with or furnish them to the Securities and Exchange Commission (SEC) and are available in print to any stockholder who requests a copy. The public may also read and copy any materials that we file with the SEC at the SEC’s Public Reference Room at 100 F Street, NE, Washington, DC 20549. You may obtain information on the operation of the Public Reference Room by calling the SEC at 1-800-SEC-0330. Additionally, the SEC maintains a website that contains reports, proxy statements, information statements and other information regarding issuers, including us, that file electronically with the SEC at www.sec.gov.
Risks Related to Healthcare Reform and Reimbursement
We could be adversely affected if healthcare reform measures substantially change the market for medical care or healthcare coverage in the United States.
Substantial changes could be made to the current system for paying for healthcare in the U.S., including changes made in order to extend medical benefits to those who currently lack insurance coverage. Approximately 47 million Americans currently lack health insurance of any kind. Extending coverage to such a large population could substantially change the structure of the health insurance system and the methodology for reimbursing medical services, drugs and devices. These structural changes could entail modifications to the existing system of private payors and government programs (Medicare, Medicaid and State Children’s Health Insurance Program), creation of a government-sponsored healthcare insurance source, or some combination of both, as well as other changes. Restructuring the coverage of medical care in the U.S. could impact the reimbursement for prescribed drugs and biopharmaceuticals, such as those produced and marketed by us. If reimbursement for these products is substantially reduced in the future, or rebate obligations associated with them are substantially increased (discussed in more detail below), our business could be materially impacted.
Extending medical benefits to those who currently lack coverage will likely result in substantial cost to the federal government, which may force significant changes to the U.S. healthcare system. Much of the funding for expanded healthcare coverage may be sought through cost savings. While some of these savings may come from realizing greater efficiencies in delivering care, improving the effectiveness of preventive care and enhancing the overall quality of care, much of the cost savings may come from reducing the cost of care. Cost of care could be reduced by reducing the level of reimbursement for medical services or products (including those biopharmaceuticals produced and marketed by us), or by restricting coverage (and, thereby, utilization) of medical services or products. In either case, a reduction in the utilization of, or reimbursement for, our products could have a materially adverse impact on our financial performance.
More specific changes to the current system of coverage and reimbursement could also be significant. For instance, Talecris and other pharmaceutical and biopharmaceutical companies currently pay rebates to states for outpatient drugs provided under Medicaid programs. These rebates comprise a fixed percentage of sales plus an adjustment for inflation tied to the date a particular drug was introduced to the market (inflationary penalty). Should the Medicaid rebate percentage or the inflationary penalty be increased, our business could be materially impacted. Moreover, if the Medicaid rebate is extended to drugs paid for under Medicaid Managed Care plans, there could be an additional adverse impact on our business. Similarly, if the Medicaid rebate requirements are extended to the Medicare Part D program, there could be a materially adverse impact on our business. Currently the “340B program” in the U.S. extends Public Health Service pricing to hospitals serving some disadvantaged populations. If eligibility for the 340B program is expanded to additional types of hospitals, or if the program is expanded to apply to the inpatient purchases of participating hospitals, our business could be materially adversely impacted.
There is substantial uncertainty regarding the exact provisions of healthcare reform that may be enacted, if at all. All of the changes discussed above, and others, are under consideration by Congress. This uncertainty limits our ability to forecast changes that may occur in the future and to manage our business accordingly.
We could be adversely affected if government or private third-party payors decrease or otherwise limit the amount, price, scope or other eligibility requirements for reimbursement for the purchasers of our products.
Independent of healthcare reform initiatives, we have experienced and expect to experience pricing pressures on our current products and pipeline products from initiatives aimed at reducing healthcare costs by governmental and private third-party payors, the increasing influence of health maintenance organizations, and regulatory proposals, both in the United States and in foreign markets. Healthcare reform in the United States is likely to increase the pressure, which may include the effect of such proposed changes as the possible introduction of a biosimilar pathway and the possible redefinition of the term “single source” products which plays a key role in determining reimbursements under the Medicare Part B program. In addition, prices in many European countries are subject to local regulation. If payors reduce the amount of reimbursement for a product, it may cause groups or individuals dispensing the product to discontinue administration of the product, to administer lower doses, to substitute lower cost products or to seek additional price related concessions. These actions could have a negative effect on our financial results, particularly in cases where we have a product that commands a premium price in the marketplace, or where changes in reimbursement induce a shift in the site of treatment. For example, beginning in 2005, the Medicare drug reimbursement methodology for physician and hospital outpatient payment schedules changed to Average Sales Price (ASP) +6%. This payment was based on a volume-weighted average of all brands under a common billing code. Medicare payments to physicians between the fourth quarter of 2004 and the first quarter of 2005 dropped 14% for both the powder and liquid forms of IGIV. Medicare payments to hospitals fell 45% for powder IGIV and 30% for liquid IGIV between the fourth quarter of 2005 and the first quarter of 2006. The Medicare reimbursement changes resulted in the shift of a significant number of Medicare IGIV patients to hospitals from physicians’ offices beginning in 2005 as many physicians could no longer recover their costs of obtaining and administering IGIV in their offices and clinics. After 2006, some hospitals reportedly began to refuse providing IGIV to Medicare patients due to reimbursement rates that were below their acquisition costs. While subsequent changes have improved some of these Medicare reimbursement issues, on January 1, 2008, the Centers for Medicare & Medicaid Services (CMS) reduced the reimbursement for separately covered drugs and biologicals, including IGIV, in the hospital outpatient setting from ASP +6% to ASP +5% using 2006 Medicare claims data as a reference for this reduction. In addition, CMS reduced a hospital add-on
payment from $75 to $38 per infusion. Beginning January 1, 2009, CMS further reduced the hospital outpatient reimbursement for separately covered outpatient drugs, including IGIV, to ASP +4%, and eliminated the add-on payment.
Additionally, physicians frequently prescribe legally available therapies for uses that are not described in the product’s labeling and that differ from those tested in clinical studies and approved by the FDA or similar regulatory authorities in other countries. These unapproved, or “off-label,” uses are common across medical specialties, and physicians may believe such off-label uses constitute the preferred treatment or treatment of last resort for many patients in varied circumstances. We believe that a significant portion of our IGIV volume may be used to fill physician prescriptions for indications not approved by the FDA or similar regulatory authorities. If reimbursement for off-label uses of our products, including IGIV, is reduced or eliminated by Medicare or other third-party payors, including those in the United States or the European Union, we could be adversely affected.
For example, CMS could initiate an administrative procedure known as a National Coverage Determination (NCD) by which the agency determines which uses of a therapeutic product would be reimbursable under Medicare and which uses would not. This determination process can be lengthy, thereby creating a long period during which the future reimbursement for a particular product may be uncertain. High levels of spending on IGIV products, along with increases in IGIV prices, increased IGIV utilization and the high proportion of off-label uses, may increase the risk of regulation of IGIV reimbursement by CMS. On the state level, similar limits could be proposed for therapeutic products covered under Medicaid. Moreover, the Deficit Reduction Act of 2005 incentivizes states to take innovative steps to control healthcare costs, which could include attempts to negotiate limits to, or reductions of, drug prices.
The U.S. economic stimulus legislation enacted in February 2009 provided significant funding for the federal government to conduct Comparative Effectiveness Research (CER). While the stated intent of CER is to develop information to guide providers to the most efficacious therapies, outcomes of CER could influence the reimbursement or coverage for therapies that are determined to be less cost-effective than others. Should any of our products be determined to be less cost-effective than alternative therapies, the levels of reimbursement for these products, or the willingness to reimburse at all, could be impacted, which could materially impact our financial results.
Additionally, the settlement of class action litigation against First DataBank and others will result in the downward revision and possible eventual elimination of the published Average Wholesale Prices (AWPs) which are an important basis for reimbursement used by many third-party payors for our products. Under the settlement, the revision became effective in September 2009. First DataBank and other pricing compendia have stated that they will or may discontinue publishing AWP within two years. Consequently, given the nature of our Prolastin Direct Model in the U.S., we anticipate a decrease in Prolastin AWPs resulting in a decrease in our net price subsequent to the settlement. We currently estimate the annual impact of the First DataBank settlement to be a reduction in the net revenue between $3 million and $6 million.
Some payors, including Medicare Part D plans and some state Medicaid programs, reimburse providers for drugs based upon a discount off of the AWP. AWP is a list price determined by third party publishers, which does not reflect actual transactions in the distribution chain. We do not publish an AWP for any of our products. We may be at a competitive disadvantage where providers are reimbursed on an AWP basis and competitors’ products are reimbursed at higher rates than our corresponding product.
Risks Related to Our Business
Our business is highly concentrated on our two largest products, Gamunex IGIV and Prolastin A1PI, and our largest geographic region, the U.S. Any adverse market event with respect to either product or the U.S. region would have a material adverse effect on us.
We rely heavily upon the sales of two of our products: Gamunex IGIV and Prolastin A1PI. Sales of Gamunex IGIV and Prolastin A1PI together comprised approximately 74.7% and 72.3% of our total net revenue for the years ended December 31, 2009 and 2008, respectively. Sales of Gamunex IGIV comprised approximately half of our total net revenue in each of these periods. If either Gamunex IGIV or Prolastin A1PI lost significant sales, or were substantially or completely displaced in the market, we would lose a significant and material source of our net revenue. Similarly, if either Gamunex IGIV or Prolastin A1PI were to become the subject of litigation and/or an adverse governmental ruling requiring us to cease sales of either product, our business would be adversely affected.
We rely heavily upon sales from the U.S. region, which comprised approximately 66.0% of our net revenue for both 2009 and 2008. If our U.S. sales were significantly impacted by either material changes to government or private payor reimbursement, by other regulatory developments, or by competition, then our business would be adversely affected.
Our manufacturing processes are complex and involve biological intermediates that are susceptible to contamination and variations in yield.
Plasma is a raw material that is susceptible to damage and contamination and may contain human pathogens, any of which would render the plasma unsuitable as raw material for further manufacturing. For instance, improper storage of plasma, by us or third-party suppliers, may require us to destroy some of our raw material. If unsuitable plasma is not identified and discarded prior to the release of the plasma to our manufacturing process, it may be necessary to discard intermediate or finished product made from that plasma or to recall any finished product released to the market, resulting in a charge to cost of goods sold.
The manufacture of our plasma products is an extremely complex process of fractionation, purification, filling and finishing. Although we attempt to maintain high standards for product testing, manufacturing, process controls and quality assurance, our products can become non-releasable or otherwise fail to meet our stringent specifications through a failure of one or more of these processes. Extensive testing is performed throughout the process to ensure the safety and effectiveness of our products. We may, however, detect instances in which an unreleased product was produced without adherence to our manufacturing procedures or plasma used in our production process was not collected or stored in a compliant manner consistent with our current Good Manufacturing Practices (cGMP) or other regulations. Such an event of non-compliance would likely result in our determination that the impacted products should not be released and therefore should be destroyed. For example, a malfunction of the Gamunex IGIV chromatography system just prior to our formation transaction in 2005 resulted in the processing of IGIV products containing elevated levels of antibodies for over one month. Our total cost related to this incident, including the costs of product loss, investigation, testing, disposal, and other remedial actions, was approximately $41.6 million. We subsequently recovered from Bayer $10.7 million through our 2005 working capital adjustment and $9.0 million in the first quarter of 2007 through a settlement.
Once we have manufactured our plasma derivative products, they must be handled carefully and kept at appropriate temperatures. Our failure, or the failure of third parties that supply, ship or distribute our products, to properly care for our products may require that those products be destroyed.
While we expect to write off small amounts of work-in-progress in the ordinary course of business due to the complex nature of plasma, our processes and our products, unanticipated events may lead to write-offs and other costs materially in excess of our expectations and the reserves we have established for these purposes. We have in the past had issues with product quality and purity that have caused us to write off the value of the product. Such write-offs and other costs could cause material fluctuations in our profitability. Furthermore, contamination of our products could cause investors, consumers, or other third parties with whom we conduct business to lose confidence in the reliability of our manufacturing procedures, which could adversely affect our sales and profits. In addition, faulty or contaminated products that are unknowingly distributed could result in patient harm, threaten the reputation of our products and expose us to product liability damages and claims from companies for whom we do contract manufacturing.
Additionally, due to the nature of plasma there will be variations in the biologic properties of the plasma we collect or purchase for fractionation that may result in fluctuations in the obtainable yield of desired fractions, even if cGMP is followed. Lower yields may limit production of our plasma-derived products due to capacity constraints. If these batches of plasma with lower yields impact production for extended periods, it may reduce the total capacity of product that we could market and increase our cost of goods sold, thus reducing our profitability.
Our business requires substantial capital to operate and grow and to achieve our strategy of realizing increased operating leverage, including the completion of several large capital projects.
We intend to undertake several large capital projects to maintain compliance with cGMP and expand capacity. These projects are required for us to expand our production capabilities and achieve our strategy of realizing operating leverage. Capital projects of this magnitude involve technology and project management risks. Technologies that have worked well in a laboratory or in a pilot plant may cost more or not perform as well, or at all, in full scale operations. Projects may run over budget or be delayed. We cannot be certain that these projects will be completed in a timely manner or that we will maintain our compliance with cGMP, and we may need to spend additional amounts to achieve compliance. Additionally, by the time these multi-year projects are completed, market conditions may differ significantly from our assumptions regarding the number of competitors, customer demand, alternative therapies, reimbursement and public policy, and as a result capital returns might not be realized.
We plan on spending substantial sums in capital and operating expense over the next five years to obtain FDA approval for new indications for existing products, to enhance the facilities in which and processes by which we manufacture existing products, to develop new product delivery mechanisms for existing products, to strengthen our plasma collection system and to develop innovative product additions. We face a number of obstacles to successfully converting these efforts into profitable products including but not limited to the successful development of a experimental product for use in clinical trials, the design of clinical study protocols acceptable to FDA, the successful outcome of clinical trials, our ability to scale our manufacturing processes to produce commercial quantities or successfully transition technology, FDA approval of our product or process and our ability to successfully market an approved product with our new process or new indication.
Our planned capital expenditures are significant over the next five years, which we currently estimate to be in the range of $750 million to $800 million on a cumulative basis through 2014. The amount and timing of future capital spending is dependent upon a number of factors, including market conditions, regulatory requirements, and the extent and timing of particular projects, among other things. Given our expectations that we will need fractionation capacity in the near term, our ability to grow our business is dependent upon the timely completion of these facilities and obtaining the requisite regulatory approvals.
To finance these various activities, we may need to incur future debt or issue additional equity if our cash flows and capital resources are insufficient, and we may not be able to structure our debt obligations on favorable economic terms. A failure to fund these activities may harm our competitive position, quality compliance and financial condition.
Our ability to continue manufacturing and distributing our products depends on our and our suppliers’ continued adherence to cGMP regulations.
The manufacturing processes for our products are governed by detailed written procedures and federal regulations that set forth cGMP requirements for blood and blood products. Our Quality Operations unit monitors compliance with these procedures and regulations, and the conformance of materials, manufacturing intermediates, and final products to their specifications. Failure to adhere to established procedures or regulations, or to meet a specification, could require that a product or material be rejected and destroyed. There are relatively few opportunities for us to rework, reprocess or salvage nonconforming materials or products.
Our adherence to cGMP regulations and the effectiveness of our quality systems are periodically assessed through inspections of our facilities by the FDA in the U.S. and analogous regulatory authorities in other countries. While we believe that our manufacturing facilities are currently in substantial compliance with cGMP regulations, we cannot assure you that we will not be cited for deficiencies in the future. If deficiencies are noted during an inspection, we must take action to correct those deficiencies and to demonstrate to the regulatory authorities that our corrections have been effective. If serious deficiencies are noted or if we are unable to prevent recurrences, we may have to recall product or suspend operations until appropriate measures can be implemented. We are required to report some deviations from procedures to the FDA. Even if we determine that the deviations were not material, the FDA could require us to take similar measures. Since cGMP reflects ever evolving standards, we regularly need to update our manufacturing processes and procedures to comply with cGMP. These changes may cause us to incur costs without improving our profitability or the safety of our products. For example, more sensitive testing assays may be required (if and when they become available) or existing procedures or processes may require revalidation, all of which may be costly and time-consuming and could delay or prevent the manufacturing of a product or launch of a new product.
Changes in manufacturing processes, including a change in the location where the product is manufactured or a change of a third-party manufacturer, may require prior FDA review and approval or revalidation of the manufacturing process and procedures in accordance with cGMP. There may be comparable foreign requirements. For example, we are currently in the process of transferring the manufacture of our Thrombate III product from Bayer’s Berkeley, California, biologics manufacturing facility to our Clayton manufacturing facility. To validate our manufacturing processes and procedures following completion of upgraded facilities, we must demonstrate that the processes and procedures at the upgraded facilities are comparable to those currently in place at our facilities. In order to provide such a comparative analysis, both the existing processes and the processes that we expect to be implemented at our upgraded facilities must comply with the regulatory standards prevailing at the time that our expected upgrade is completed. In addition, regulatory requirements, including cGMP regulations, continually evolve. Failure to adjust our operations to conform to new standards as established and interpreted by applicable regulatory authorities would create a compliance risk that could impair our ability to sustain normal operations.
Our Thrombate III product is currently being produced for us at Bayer’s Berkeley, California biologics manufacturing facility. The failure of Bayer or of our other suppliers to comply with cGMP standards or disagreements between us and Bayer as to requirements could result in our product being rejected, production being slowed down or halted, or product releases being delayed. We are in the process of transferring this manufacturing to our Clayton Facility. If the FDA does not approve the transfer, our ability to market our Thrombate III product will be seriously impaired or eliminated.
A number of inspections by the FDA and foreign control authorities, including the German Health Authority (GHA), have been conducted or are expected at our plasma collection centers in 2010. Some of these inspections are of licensed centers to assess ongoing compliance with cGMP, while others are of our currently unlicensed centers as a prerequisite to final approval of the centers’ license applications. If the FDA (or other authorities) finds these centers not to be in compliance, our ongoing operations and/or plans to expand plasma collections would be adversely affected.
We must continually monitor the performance of our products once approved and marketed for signs that their use may elicit serious and unexpected side effects, which could jeopardize our ability to continue marketing the products. We may also be required to conduct post-approval clinical trials as a condition to licensing a product.
As for all pharmaceutical products, the use of our products sometimes produces undesirable side effects or adverse reactions or events (referred to cumulatively as “adverse events”). For the most part, these adverse events are known, are expected to occur at some frequency and are described in the products’ labeling. When adverse events are reported to us, we investigate each event and circumstances surrounding it to determine whether it was caused by our product and whether it implies a previously unrecognized safety issue exists. Periodically, we report summaries of these events to the applicable regulatory authorities.
In addition, the use of our products may be associated with serious and unexpected adverse events, or with less serious reactions at a greater than expected frequency. This may be especially true when our products are used in critically ill patient populations. When these unexpected events are reported to us, we must make a thorough investigation to determine causality and implications for product safety. These events must also be specifically reported to the applicable regulatory authorities. If our evaluation concludes, or regulatory authorities perceive, that there is an unreasonable risk associated with the product, we would be obligated to withdraw the impacted lot(s) of that product. Furthermore, an unexpected adverse event of a new product could be recognized only after extensive use of the product, which could expose us to product liability risks, enforcement action by regulatory authorities and damage to our reputation and public image.
We have received reports that some Gamunex patients have experienced transient hemolysis and/or hemolytic anemia, which are known potential side effects for this class of drugs. Since 2005, a disproportionate number of these reports have been received from Canada, where our product accounted for 80% of all IGIV distributed in 2008. The Canadian product labeling was updated in 2005 after these hemolysis events were first reported to Health Canada. Subsequently, Talecris provided annual updates on these events to Health Canada from 2006 to 2008, but no further action was recommended by the Canadian regulators. A serious adverse finding concerning the risk of hemolysis by any regulatory authority for intravenous immune globulin products in general, or Gamunex in particular, could adversely affect our business and financial results.
Once we produce a product, we rely on physicians to prescribe and administer them as we have directed and for the indications described on the labeling. It is not, however, unusual for physicians to prescribe our products for “off-label” uses or in a manner that is inconsistent with our directions. For example, a physician may prescribe an infusion rate for our Gamunex IGIV product that is greater than our directed infusion rate, which in turn may reduce its efficacy or result in some other adverse affect upon the patient. Similarly, a physician may prescribe a higher or lower dosage than the dosage we have indicated, which may also reduce our product’s efficacy or result in some other adverse affect upon the patient. To the extent such off-label uses and departures from our administration directions become pervasive and produce results such as reduced efficacy or other adverse effects, the reputation of our products in the marketplace may suffer.
When a new product is approved, the FDA or other regulatory authorities may require post-approval clinical trials, sometimes called Phase IV clinical trials. For example, FDA has required such trials for A1PI products, including our recently approved A1PI next generation product, Prolastin-C. If the results of such trials are unfavorable, this could result in the loss of the license to market the product, with a resulting loss of sales.
Our products face increased competition.
Recently, certain of our products have experienced increased competition.
Until 2004, we were one of two North American suppliers with an approved liquid IGIV product. In 2004, Grifols launched Flebogamma® 5% liquid IGIV and Octapharma launched Octagam® 5% liquid IGIV. In 2005, Baxter’s Gammaguard® 10% liquid IGIV was launched. In 2007 CSL Behring received approval for Privigen® 10% liquid IGIV. Privigen® was launched in the U.S. in 2008. We expect Octapharma and Grifols to launch 10% liquid IGIV products. Omrix and Biotest are both seeking approval for liquid IGIV products in the U.S., which, if approved, will further increase competition among liquid IGIV products. Additionally, Bio Products Laboratory received approval from the FDA for its 5 percent concentration IGIV for PI. If third-party payors, group purchasing organizations and physicians, or others demand the lower-priced products of some of our competitors, we may lose sales or be forced to lower our prices.
In addition, in Canada where we have been the “supplier of record” since the 1980s, one of the Canadian blood system operators, Canadian Blood Services, has elected to pursue a dual source strategy, with our share being reduced to 65% in 2009. Overall in 2010, we expect to fractionate 70% of the plasma collected in Canada. The Canadian blood system operators are seeking to diversify their suppliers, which we expect to result in a further decline in our share of sales in Canada.
Our financial performance will suffer if we do not improve the cost efficiency of our plasma collection platform.
We believe our current cost per liter of plasma may exceed that of our larger competitors. The opening of new plasma centers, which take up to several years to reach efficient production capacity, and the creation of a corporate infrastructure to support
our vertical integration strategy have significantly increased our per liter cost of plasma. We charge excess unabsorbed overhead costs directly to cost of goods sold until our plasma collection centers reach normal operating capacities.
In the event that our plasma collection centers do not reach efficient operating capacities, or there are delays in the ability of our plasma collection centers to reach efficient operating capacities, we will continue to charge unabsorbed overhead costs directly to cost of goods sold, which will result in higher costs of operations, lower margins and lower cash flow than our competitors. If by attempting to reduce these costs, we adversely affect compliance with cGMP, we may be required to write-off plasma and any intermediates and products manufactured with non-compliant plasma and we may face shortages of plasma needed to manufacture our products.
We would become supply-constrained and our financial performance would suffer if we could not obtain adequate quantities of FDA-approved source plasma.
In order for plasma to be used in the manufacturing of our products, the individual centers at which the plasma is collected must be licensed by the FDA, and approved by the regulatory authorities, such as the GHA, of those countries in which we sell our products. When a new plasma center is opened, and on an ongoing basis after licensure, it must be inspected by the FDA and GHA for compliance with cGMP and other regulatory requirements. An unsatisfactory inspection could prevent a new center from being licensed or risk the suspension or revocation of an existing license.
In order to maintain a plasma center’s license, its operations must continue to conform to cGMP and other regulatory requirements. In the event that we determine that plasma was not collected in compliance with cGMP, we may be unable to use and may ultimately destroy plasma collected from that center, which would be recorded as a charge to cost of goods. Additionally, if non-compliance in the plasma collection process is identified after the impacted plasma has been pooled with compliant plasma from other sources, entire plasma pools, in-process intermediate materials and final products could be impacted. Consequently, we could experience significant inventory impairment provisions and write-offs which could adversely affect our business and financial results. During 2008, we experienced such an event at one of our plasma collection centers, which resulted in a charge to cost of goods sold of $23.3 million, for which we subsequently recovered $19.4 million through December 31, 2009. In this particular instance, a portion of the impacted plasma had been released to manufacturing prior to our detection of the issue.
We plan to increase our supplies of plasma for use in our manufacturing processes through increased collections at our plasma collection centers and through selective acquisitions or remodeling and relocations of existing centers. This strategy is dependent upon our ability to successfully integrate new centers, to obtain FDA and GHA approval for the remaining unlicensed plasma centers, to maintain a cGMP compliant environment in all plasma centers while changing our standard operating procedures, or SOPs, and to expand production and attract donors to our centers.
Our ability to maintain a cGMP compliant environment in all plasma centers may be challenged when we roll-out a comprehensive set of new SOPs which have been approved by the FDA. Implementing the revised SOPs will be a substantial project, which will temporarily increase cost and reduce plasma collection volumes. By December 31, 2009, we had converted 34 of 69 collection centers to these new SOP’s and expect to complete this project in 2010. The change in SOPs, although intended to improve quality and compliance, could temporarily lead to an increase in issues and audit findings by us, the FDA, the GHA or other regulatory agencies.
Our ability to expand production and increase our plasma collection centers to more efficient production levels may be affected by changes in the economic environment and population in selected regions where TPR operates plasma centers, by the entry of competitive plasma centers into regions where TPR operates, by misjudging the demographic potential of individual regions where TPR expects to expand production and attract new donors, by unexpected facility related challenges, or by unexpected management challenges at selected plasma centers.
Our financial performance is dependent upon third-party suppliers of FDA-approved source plasma.
In 2008, we obtained 25.8% of our plasma and in 2009 we obtained 14.3% of our plasma under a five-year supply arrangement with CSL Plasma Inc., a subsidiary of CSL, a major competitor. The agreement with CSL Plasma Inc. provides that our minimum purchase obligations are: (i) 550,000 liters for calendar year 2010; (ii) 300,000 liters of plasma for each of calendar years 2011 and 2012; and (iii) 200,000 liters of plasma for calendar year 2013. Each quarter, CSL Plasma Inc. is obligated to deliver at least 20% of our minimum purchase obligation for that year. Either we or CSL Plasma Inc. may terminate the agreement in the event of material nonperformance after a 30-day cure period. Another 8.5% was purchased from Interstate Blood Bank, Inc. (IBBI). The agreement with IBBI requires us to make a minimum purchase of 330,000 liters of plasma for each year during the term of the agreement, which terminates at the end of 2016. We have a right of first refusal with respect to any material quantities of plasma that IBBI has available for sale in excess of this amount, as well as a right of first refusal with respect to the transfer of any asset, equity, or controlling interest of IBBI related to any of the centers which supply us. We also agreed to provide secured financing for additional
centers approved by us and the relocation of IBBI’s plasma centers in a maximum amount of $1.0 million per center and $3.0 million in the aggregate. Either we or IBBI may terminate the agreement in the event of material nonperformance after a 30 day cure period. Were any dispute to arise or were CSL Plasma Inc. or IBBI to experience any plasma collection difficulties, it could be difficult or impossible for us to replace the shortfall, which would materially adversely affect our business.
Plasma volumes obtained under arrangements with independent third parties have not always met expectations. An inability of any of our suppliers to operate their business successfully and satisfy their obligations in a timely manner may cause a disruption in our plasma supply, which could materially adversely affect our business.
Industry-wide disruptions could reduce the availability of FDA-approved source plasma and our financial performance would suffer.
A number of other factors could disrupt our ability to increase source plasma collections, including but not limited to:
· A lack of alternative plasma supply sources. In recent years, there has been consolidation in the industry as several plasma derivatives manufacturers have acquired plasma collectors and reduced capacity. As a result, it could be difficult or impossible to resolve any significant disruption in the supply of plasma or an increased demand for plasma with plasma from alternative sources.
· A reduction in the donor pool. Regulators in most of the large markets for plasma derivative products, including the United States, restrict the use of plasma collected from specific countries and regions in the manufacture of plasma derivative products. For example, the appearance of the variant Creutzfeldt-Jakob disease, commonly referred to as “mad cow” disease (which resulted in the suspension of the use of plasma collected from U.K. residents), and concern over the safety of blood products (which has led to increased domestic and foreign regulatory control over the collection and testing of plasma and the disqualification of certain segments of the population from the donor pool), have significantly reduced the potential donor pool.
Our products have historically been subject to supply-driven price fluctuations.
Our products, particularly IGIV, have historically been subject to price fluctuations as a result of changes in the production capacity available in the industry, the availability and pricing of plasma, development of competing products and the availability of alternative therapies. Higher prices for plasma-derived products have traditionally spurred increases in plasma production and collection capacity, resulting over time in increased product supply and lower prices. As demand continues to grow, if plasma supply and manufacturing capacity do not commensurately expand, prices tend to increase.
Since 2005 the industry has experienced a favorable pricing environment for plasma products. The robust demand, particularly for IGIV, over the last few years has resulted in efforts on the part of companies, including ourselves, to increase manufacturing capacity and open new plasma collection centers to increase the availability of source plasma. Some of our competitors have announced plans to grow product supply at a rate above expected demand growth. The growth in demand for IGIV has been outpaced by the recent supply growth, as evidenced by increased supply in the distribution channel. We, or our competitors, may misjudge demand growth and over-invest in expanding plasma collection or manufacturing capacity, which ultimately may result in lower prices for, or inability to sell, our products.
While we have recently submitted a sBLA in the U.S. for FDA licensure of Gamunex subcutaneous administration for the treatment of PI, we currently do not have, and may never receive, FDA approval, which could be a competitive disadvantage. Furthermore, we believe that our competitors are developing several new products and technologies potentially offering an improved route of administration and even for indications beyond PI. If these development efforts are successful and our effort fails, then we could be at a competitive disadvantage which may impact our Gamunex sales.
Until December 2002, our A1PI product, Prolastin A1PI, was the only plasma product licensed and marketed for therapy of congenital A1PI deficiency-related emphysema in the U.S. Accordingly, until that time, Prolastin A1PI had virtually 100% market share in its category. In December 2002 and July 2003, Baxter and CSL Behring received licenses for Aralast and Zemaira, respectively, which were launched in the U.S. in 2003, and Grifols received marketing authorization for Trypsone in Spain in 2003. The competing products were introduced at significantly higher prices than Prolastin A1PI. Due in part to our inability to fully meet demand for A1PI product, as well as patient losses due to the nature of the disease, our share of sales has dropped to approximately 67% in the U.S. and 76% globally. These and other future competitors may increase their sales, lower their prices or change their distribution model which may harm our product sales and financial condition. Also, if the attrition rate of our existing Prolastin patient base accelerates faster than we have forecast, we would have fewer patients and lower sales volume. In addition, Kamada Ltd. has completed clinical trials for licensure in the U.S. and submitted a BLA for their A1PI product. In the European Union we have a 90% share of A1PI sales and have the only licensed A1PI product, other than Grifols, which has marketing authorization for Trypsone
A1PI in Spain and LFB which sells Alfalastin in France. Our competitors are currently pursuing licensing trials in Europe. Should our competitors receive approvals in the European Union sooner than expected, this will impact our unit volumes and share of sales.
New products may reduce demand for plasma-derived A1PI. A recombinant form of A1PI (recA1PI) could gain market share through the elimination of the risk of plasma-borne pathogens, or through a reduced price permitted by significantly decreased costs (since the recA1PI would not be sourced from plasma). In addition to ourselves, Arriva and GTC Biotherapeutics are in the early stages of development for a recombinant form of recA1PI. Although we are not aware of any active clinical trials for a recA1PI product, a successful recA1PI, prior to our developing a similar product, could gain first mover advantage and result in a loss of our A1PI market share. Similarly, if a new formulation of A1PI is developed that has a significantly improved rate of administration, such as aerosol inhalation, prior to our developing a similar product, the market share of Prolastin A1PI could be negatively impacted. Similarly, several companies are attempting to develop products which would be substitution threats in the A1PI sector, including retinoic acid, oral synthetic elastase inhibitors and gene therapy. While these products are all in early stages of development, the potential for successful product development and launch cannot be ruled out.
In addition, our plasma therapeutics face competition from non-plasma products and other courses of treatments. For example, two RhD hyperimmune globulins for intravenous administration, Cangene’s WinRho® SDF and CSL Behring’s Rhophylac®, are now approved for use to treat ITP, and GSK and Amgen launched thrombopoietin inhibitors targeting ITP patients in 2008 that may reduce the demand for IGIV to treat this immune disorder. There is also a risk that indications for which our products are now used will be susceptible to new treatments, such as small molecules, monoclonal or recombinant products. Recombinant Factor VIII product competes with our own plasma-derived product in the treatment of Hemophilia A and is perceived by many to have lower risks of disease transmission. Additional recombinant products or the use of monoclonal antibodies, small molecules, or stem cell transplantations could compete with our products and reduce the demand for our products. Crucell and Sanofi Pasteur have completed Phase II clinical trials for a monoclonal rabies product to compete with our rabies hyperimmune product. If successful, we estimate that the monoclonal product could take a significant portion of the rabies market in years subsequent to its introduction. Also, in February 2009, GTC Biotherapeutics obtained FDA approval of a competitive ATIII product for the treatment of hereditary antithrombin deficiency, which is derived from the milk of transgenic goats. This product now directly competes with our product, Thrombate III (Human), which had been the only FDA approved product.
We do not currently sell any recombinant products. Although we are attempting to develop recombinant versions of Plasmin, A1PI and Factor VIII, we cannot be certain that they will ever be approved or commercialized. As a result, our product offerings may remain plasma-derived, even if our competitors offer competing recombinant products.
Developments in the economy may adversely impact our business.
The recessionary economic environment may adversely affect demand for our products. Prolastin A1PI is sold directly to patients in the U.S. As a result of loss of jobs, patients may lose medical insurance and be unable to purchase supply or may be unable to pay their share of deductibles or co-payments. Gamunex IGIV is primarily sold to hospitals and specialty pharmacies. Hospitals adversely affected by the economy may steer patients to less costly therapies, resulting in a reduction in demand, or demand may shift to public health hospitals, which purchase at a lower government price. While to date we cannot directly trace any material reduction in demand to the recession, if economic conditions do not improve, the impact may become material.
We are investigating potential Foreign Corrupt Practices Act violations.
We are conducting an internal investigation into potential violations of the Foreign Corrupt Practices Act (FCPA) that we became aware of during the conduct of an unrelated review. The FCPA investigation is being conducted by outside counsel under the direction of a special committee of the Board of Directors. The investigation initially focused on sales to certain Eastern European and Middle Eastern countries, but our investigation is also reviewing sales practices in other countries as determined appropriate.
In July 2009, we voluntarily contacted the U.S. Department of Justice (DOJ) to advise them of the investigation and to offer our cooperation in any investigation that they want to conduct or they want us to conduct. The DOJ has not indicated what action it may take, if any, against us or any individual, or the extent to which it may conduct its own investigation. The DOJ or other federal agencies may seek to impose sanctions on us that may include, among other things, injunctive relief, disgorgement, fines, penalties, appointment of a monitor, appointment of new control staff, or enhancement of existing compliance and training programs. Other countries in which we do business may initiate their own investigations and impose similar penalties. As a result of this investigation, we suspended shipments to some countries while we put additional safeguards in place. In some cases, safeguards involved terminating consultants and suspending relations with or terminating distributors in countries under investigation. These actions unfavorably affected revenue from these countries in 2009. We have resumed sales in countries where we have appropriate safeguards in place and are reallocating product to other countries as necessary. To the extent that we conclude, or the DOJ concludes, that we cannot implement adequate safeguards or otherwise need to change our business practices, distributors, or
consultants in affected countries or other countries, this may result in a permanent loss of business from those countries. These sanctions or the permanent loss of business, if any, could have a material adverse effect on us or our results of operations.
A pending investigation relating to our compliance with the terms of the Pharmaceutical Pricing Agreement under the Public Health Service program may result in our being barred from allocating a fixed amount of IGIV as available for sale at the Public Health Service price.
In November 2009, the company received a letter from the United States Attorney’s Office for the Eastern District of Pennsylvania (“USAO”). The USAO requested a meeting to review the company’s compliance with the terms of the Pharmaceutical Pricing Agreement (“PPA”) under the Public Health Service program. Specifically, the USAO asked for information related to the sale of our IGIV product, Gamunex, under that program. In order to have federal financial participation apply to their products under the Medicaid program and to obtain Medicare Part B coverage, manufacturers are required to enter into a PPA. The PPA obligates manufacturers to charge covered entities the Public Health Service price for drugs intended for outpatient use. The Public Health Service price is based on the Medicaid rebate amount. The company believes that it has complied with the terms of the PPA and federal law. If the USAO determines that the company’s practices are inconsistent with the terms of the PPA, the USAO has stated that it may file a civil action against the company under the Anti-fraud Injunction Act and seek a court order directing the company to comply with the PPA or, potentially, proceed under some other legal theory. An adverse outcome in an Anti-fraud Injunction Act action could have a material adverse effect on us or our results of operation to the extent that the company is barred from allocating a fixed amount of IGIV as available for sale at the Public Health Service price and is forced to give a preference to those purchasers over all other customers. The company could also be subject to fines, damages, penalties, appointment of a monitor, or enhancement of existing compliance and training programs as a result of government action. The Company is cooperating with the investigation and intends to respond to information requests from the USAO.
Our ability to export products to Iran requires annual export licenses.
In 2009, we had sales of $22.2 million, or approximately 1.4% of our net revenue, to customers located in Iran pursuant to an export license which must be renewed annually. There can be no assurance that we will be able to renew our license. In particular, should political tensions between the U.S. and Iran escalate, the export license might be revoked or not renewed, resulting in the loss of these sales.
Our ability to continue to produce safe and effective products depends on the safety of our plasma supply against transmittable diseases.
Despite overlapping safeguards, including the screening of donors and other steps to remove or inactivate viruses and other infectious disease causing agents, the risk of transmissible disease through blood plasma products cannot be entirely eliminated. For example, since plasma-derived therapeutics involve the use and purification of human plasma, there has been concern raised about the risk of transmitting HIV, prions, West Nile virus, H1N1 virus or “swine flu” and other blood-borne pathogens through plasma-derived products. There are also concerns about the future transmission of H5N1 virus, or “bird flu.” In the 1980s, thousands of hemophiliacs worldwide were infected with HIV through the use of contaminated Factor VIII. Bayer and other producers of Factor VIII, though not us, are defendants in numerous lawsuits resulting from these infections.
New infectious diseases emerge in the human population from time to time. If a new infectious disease has a period during which time the causative agent is present in the bloodstream but symptoms are not present, it is possible that plasma donations could be contaminated by that infectious agent. Typically, early in an outbreak of a new disease, tests for the causative agent do not exist. During this early phase, we must rely on screening of donors (e.g., for behavioral risk factors or physical symptoms) to reduce the risk of plasma contamination. Screening methods are generally less sensitive and specific than a direct test as a means of identifying potentially contaminated plasma units.
During the early phase of an outbreak of a new infectious disease, our ability to manufacture safe products would depend on the manufacturing process’ capacity to inactivate or remove the infectious agent. To the extent that a product’s manufacturing process is inadequate to inactivate or remove an infectious agent, our ability to manufacture and distribute that product would be impaired.
If a new infectious disease were to emerge in the human population, the regulatory and public health authorities could impose precautions to limit the transmission of the disease that would impair our ability to procure plasma, manufacture our products or both. Such precautionary measures could be taken before there is conclusive medical or scientific evidence that a disease poses a risk for plasma-derived products.
In recent years, new testing and viral inactivation methods have been developed that more effectively detect and inactivate infectious viruses in collected plasma. There can be no assurance, however, that such new testing and inactivation methods will adequately screen for, and inactivate, infectious agents in the plasma used in the production of our products.
If our Clayton facility or other major facilities, or the facilities of our third-party suppliers, were to suffer a crippling accident, or a force majeure event materially affected our ability to operate and produce saleable products, a substantial part of our manufacturing capacity could be shut down for an extended period.
Substantially all of our revenues are derived from products manufactured, and services performed, at our plant located in Clayton, North Carolina. In addition, a substantial portion of our plasma supply is stored at facilities in Benson, North Carolina, and our Clayton facility. Although we believe we have adopted and maintain safety precautions, including separate areas for different manufacturing processes, if any of these facilities were to be impacted by an accident or a force majeure event such as an earthquake, major fire or explosion, major equipment failure or power failure lasting beyond the capabilities of our backup generators our revenues would be materially adversely affected. In this situation, our manufacturing capacity could be shut down for an extended period and we could experience a loss of raw materials, work in process or finished goods inventory. Other force majeure events such as terrorist acts, influenza pandemic or similar events could also impede our ability to operate our business. In addition, in any such event, the reconstruction of our Clayton fractionation plant or our plasma storage facilities, the regulatory approval of the new facilities, and the replenishment of raw material plasma could be time-consuming. During this period, we would be unable to manufacture our products at other plants due to the need for FDA and foreign regulatory authority inspection and certification of such facilities and processes. While we maintain property damage and business interruption insurance with limits of $1 billion, these amounts may still be insufficient to mitigate the losses from any such event. We may also be unable to recover the value of the lost plasma or work-in-progress, as well as the sales opportunities from the products we would be unable to produce.
A significant number of our plasma collection centers are in Texas and in 2009 approximately 20% of our internally sourced plasma came from collection centers located on the United States border with Mexico. Donations at these centers could be impacted by changes in U.S. visa rules. In addition, we have a number of plasma centers in regions of the southeast which could be affected by natural disasters such as hurricanes. A disruption in our source of plasma due to events arising in a geographic region where many of our collection centers are located would limit our ability to maintain our current production levels of plasma-derived products.
If we experience equipment difficulties or if the suppliers of our equipment or disposable goods fail to deliver key product components or supplies in a timely manner, our manufacturing ability would be impaired and our product sales could suffer.
We depend on a limited group of companies that supply and maintain our equipment and provide supplies such as chromatography resins, filter media, glass and stoppers used in the manufacture of our products. In some cases we have only one qualified supplier. If our equipment should malfunction, the repair or replacement of the machinery may require substantial time and cost, which could disrupt our production and other operations. Our plasma collection centers rely on disposable goods supplied by Haemonetics Corporation and information technology systems hosted by a subsidiary of Haemonetics Corporation. Our plasma centers cannot operate without an uninterrupted supply of these disposable goods and the operation of these systems. We have experienced periodic outages of these systems, but a material outage would affect our ability to operate our collection centers. Alternative sources for key component parts or disposable goods may not be immediately available. Any new equipment or change in supplied materials may require revalidation by us and/or review and approval by the FDA, or foreign regulatory authorities, including the German Health Authority, which may be time-consuming and require additional capital and other resources. We may not be able to find an adequate alternative supplier in a reasonable time period, or on commercially acceptable terms, if at all. As a result, shipments of affected products may be limited or delayed. Our inability to obtain our key source supplies for the manufacture of our products may require us to delay shipments of products, harm customer relationships and force us to curtail operations.
We purchase nearly all of our specialty plasma used for the production of hyperimmunes from a limited number of companies under short-term contracts.
We currently rely on three companies—Biotest Pharmaceuticals Corporation, Octapharma AG, and Advanced Bioservices, LLC (ABS), a subsidiary of Kedrion SpA, all of which are our direct competitors—to supply nearly all of our specialty plasma required for the production of our hyperimmunes, which represented $74.2 million, or 4.8%, of our net revenue in 2009. Specialty plasma is plasma that contains antibodies to specific diseases, usually because the donor has been vaccinated. Our contracts with suppliers of specialty plasma are usually on a short term basis. Our contracts with Octapharma and ABS are set to expire on December 31, 2010 and our agreement with Biotest expires at year-end 2011. We are negotiating with Octapharma and ABS to extend these agreements. Depending upon these competitors’ production plans, it may be difficult to increase the amounts of plasma we purchase from them or to renew our contracts in the future. Our inability to replace the volumes provided by these suppliers through our own plasma collection efforts or through increased specialty plasma deliveries from other third parties would materially adversely affect our business. To the extent that we develop a supply of specialty plasma from our own collection centers, such specialty plasma may come at the expense of the plasma we use for our other products. It would also take significant time to obtain the necessary regulatory approvals and develop a sufficient donor base.
We rely in large part on third parties for the sale, distribution and delivery of our products.
In the U.S., we regularly enter into distribution, supply and fulfillment contracts with group purchasing organizations, home care companies, alternate infusion sites, hospital groups, and others. We are highly dependent on these contracts for the successful sale, distribution and delivery of our products. For example, we rely principally on group purchasing organizations and on our distributors to sell our IGIV product and on Centric Health Resources to fulfill prescriptions for Prolastin A1PI. If the parties with which we contract breach, terminate, or otherwise fail to perform under the agreements, our ability to effectively distribute our products will be impaired and our business may be materially and adversely affected. In addition, through circumstances outside of our control, such as general economic decline, market saturation, or increased competition, we may be unable to successfully renegotiate our contracts or secure terms which are as favorable to us. In addition, we rely on distributors for sales of our products outside the U.S. Disagreements or difficulties with our distributors supporting our export business could result in a loss of sales.
Product liability lawsuits against us could cause us to incur substantial liabilities, limit sales of our existing products and limit commercialization of any products that we may develop.
Our business exposes us to the risk of product liability claims that are inherent in the manufacturing, distribution, and sale of plasma-derived therapeutic protein products. We face an inherent risk of product liability exposure related to the testing of our product candidates in human clinical trials and an even greater risk when we commercially sell any products. If we cannot successfully defend ourselves against claims that our product candidates or products caused injuries, we could incur substantial liabilities. Regardless of merit or eventual outcome, liability claims may result in:
· decreased demand for our products and any product candidates that we may develop;
· injury to our reputation;
· withdrawal of clinical trial participants;
· costs to defend the related litigation;
· substantial monetary awards to trial participants or patients;
· loss of revenue; and
· the inability to commercialize any products that we may develop.
Bayer is the defendant in continuing litigation alleging that use of products manufactured at our Clayton site in the 1980s, prior to our formation transaction and carve-out from Bayer, resulted in the transmission of Hepatitis C virus and HIV to patients. Bayer is also a defendant in litigation alleging that thimerosal, a preservative that was added to some intra muscular (hyperimmune) immune globulin products until 1996 (at which time its use was discontinued), was the cause of autism and other disorders in children who received these products. While we are not a party to any of these actions, and Bayer has agreed to fully indemnify us from any claims or losses arising out of these actions, we cannot assure you that our products or any of their constituents or additives may not someday give rise to similar product liability claims that we will be forced to defend and which may have a material adverse affect on our business.
We have a global insurance policy with limits of $100 million with a per claim deductible of $5 million and an aggregate deductible of $10 million. This amount of insurance may not be adequate to cover all liabilities that we may incur. We intend to expand our insurance coverage as our sales grow. Insurance coverage is, however, increasingly expensive. We may not be able to maintain insurance coverage at a reasonable cost and we may not be able to obtain insurance coverage that will be adequate to satisfy any liability that may arise.
Our products and manufacturing processes are subject to regulatory requirements and authority, including over our manufacturing practices and any product recalls.
Our products, and our advertising and promotional activities for such products, are subject to regulatory requirements, ongoing review, and periodic inspections by the FDA, the Office of the Inspector General of the Department of Health and Human Services and other regulatory bodies. In addition, the manufacture and packaging of plasma products are regulated by the FDA and comparable regulatory bodies in Canada, Europe and elsewhere and must be conducted in accordance with the FDA’s cGMP regulations and comparable requirements of foreign regulatory bodies, including the GHA.
Later discovery of previously unknown problems with our products or failure by us or any third-party manufacturers, including Bayer, to comply with cGMP regulations, or failure to comply with regulatory requirements, may result in, among other things:
· restrictions on such products or manufacturing processes;
· withdrawal of products from the market;
· voluntary or mandatory recall;
· suspension or withdrawal of regulatory approvals and licenses;
· cessation of our manufacturing activities, which may be for an extended or indefinite period of time;
· product seizure; and
· injunctions or the imposition of civil or criminal penalties.
We could also be required to add warnings to our packaging or labeling that could negatively differentiate our product in the view of customers or patients.
For example, we settled a dispute with a customer in September 2007 regarding intermediate material manufactured by us, which is used by this customer in their manufacturing process. We recorded a charge to cost of goods sold of $7.9 million during the year ended December 31, 2007 for inventory impairment related to this material, which we recovered in its entirety during 2008 as the related material was determined to be saleable, converted into final product, and sold to other customers. Similarly, during 2008, we recorded an additional inventory impairment provision of $2.6 million related to this dispute for products held in Europe, for which we recovered $0.8 million and $1.8 million during the years ended December 31, 2009 and 2008, respectively, as the impacted material was determined to be saleable, converted into final product, and sold to other customers.
Separately, our plans to transition from Prolastin to our next generation therapy could be affected by the approval timing of regulatory authorities. Our current plan calls for a simultaneous transition in the U.S. and Canada over several quarters. The launch in Europe will be delayed beyond the launch in North America because we have yet to receive European regulatory approval. Presently additional clinical trials are being required by European regulators as a precursor to Prolastin-C approval. Additionally, we could face further delays with respect to launches in specific European countries. To the extent regulatory authorities do not act within the same time-frame, we will need to operate both new and old manufacturing processes in parallel with overlapping crews, higher costs, and lower yields.
Certain of our other business practices are subject to scrutiny by regulatory authorities.
The laws governing our conduct are enforceable by criminal, civil and administrative penalties. Violations of laws such as the Federal Food, Drug and Cosmetic Act, the False Claims Act and the Anti-Kickback Law, and any regulations promulgated under their authority, may result in jail sentences, fines, or exclusion from federal and state programs, as may be determined by Medicare, Medicaid and the Department of Defense and other regulatory authorities. Certain business practices, such as entertainment and gifts for healthcare providers, sponsorship of educational or research grants, charitable donations, and support for continuing medical education programs, must be conducted within narrowly prescribed and controlled limits to avoid any possibility of influencing healthcare providers to prescribe particular products. Additional and stricter prohibitions could be implemented by federal and state authorities. Where such practices have been found to be improper incentives to use such products, government investigations and assessments of penalties against manufacturers have resulted. Many manufacturers have been required to enter into consent decrees or orders that prescribe allowable corporate conduct. We have developed and implemented a comprehensive Healthcare Compliance Program and provide an initial and annual refresher training for all employees whose activities may be subject to these requirements. There can be no assurance, however, that our marketing activities will not come under the scrutiny of regulators and other government authorities or that our practices will not be found to violate applicable laws rules and regulations.
In addition, while regulatory authorities generally do not regulate physicians’ discretion in their choice of treatments for their patients, they do restrict communications by manufacturers on unapproved uses of approved drugs or on the potential safety and efficacy of unapproved products in development. Companies in the U.S., Canada and European Union cannot promote approved products for other indications that are not specifically approved by the competent regulatory authorities (e.g., FDA in the U.S.), nor can companies promote unapproved products. In limited circumstances companies may disseminate to physicians information regarding unapproved uses of approved products or results of studies involving investigational products. If such activities fail to
comply with applicable regulations and guidelines of the various regulatory authorities, we may be subject to warnings from, or enforcement action by, these authorities. Furthermore, if such activities are prohibited, it may harm demand for our products.
Promotion of unapproved drugs or unapproved indications for a drug is a violation of the Federal Food, Drug and Cosmetic Act and subjects us to civil and criminal sanctions. Furthermore, sanctions under the Federal False Claims Act have recently been brought against companies accused of promoting off-label uses of drugs, because such promotion induces the use, and subsequent claims for reimbursement under Medicare and other federal programs. Similar actions for off-label promotion have been initiated by several states for Medicaid fraud. Violations or allegations of violation of the foregoing restrictions could materially and adversely affect our business.
To market and sell our products outside of the U.S., we must obtain and maintain regulatory approvals and comply with regulatory requirements in such jurisdictions. The approval procedures vary among countries in complexity and timing. We may not obtain approvals from regulatory authorities outside the United States on a timely basis, if at all, which would preclude us from commercializing our products in those markets. For example, while we completed a Mutual Recognition Procedure in the European Union, facilitating our ability to sell Prolastin A1PI in 15 European countries, we are in the process of discussing reimbursement on a country-by-country basis, which must be concluded before we can expect to significantly increase sales in a number of these countries. We have not been successful in receiving reimbursements to date and there can be no assurance when, if ever, we will receive reimbursement within those countries for Prolastin A1PI.
In addition, some countries, particularly the countries of the European Union, regulate the pricing of prescription pharmaceuticals. In these countries, pricing discussions with governmental authorities can take considerable time after the receipt of marketing approval for a product. To obtain reimbursement or pricing approval in some countries, we may be required to conduct a clinical trial that compares the cost-effectiveness of our product candidate to other available therapies. Such trials may be time-consuming, expensive, and may not show an advantage in efficacy for our products. If reimbursement of our products is unavailable or limited in scope or amount, or if pricing is set at unsatisfactory levels, in either the United States or the European Union, we could be adversely affected.
Our business involves the controlled use of hazardous materials, various biological compounds and chemicals. Although we believe that our safety procedures for handling and disposing of these materials comply with the standards prescribed by state and federal regulations, the risk of accidental contamination or injury from these materials cannot be eliminated. If an accident occurs, we could be held liable for resulting damages, which could be substantial. We are also subject to numerous environmental, health and workplace safety laws and regulations, including those governing laboratory procedures, exposure to blood-borne pathogens and the handling of biohazardous materials and chemicals. Although we maintain workers’ compensation insurance to cover us for costs and expenses we may incur due to injuries to our employees resulting from the use of these materials, this insurance may not provide adequate coverage against potential liabilities. We do not maintain insurance for environmental liability or toxic tort claims that may be asserted against us. Additional federal, state, and local laws and regulations affecting our operations may be adopted in the future. We may incur substantial costs to comply with, and substantial fines or penalties if we violate, any of these laws or regulations.
In addition, we export our products to a variety of countries whose legal regimes and business customs and practices differ significantly from those in the United States. A failure to comply with laws and regulations applicable to our international operations or export sales could expose us to significant penalties. These laws and regulations include data privacy requirements, labor relations laws, tax laws, anti-competition regulations, anti-money laundering, import and trade restrictions, export requirements, including those of the U.S. Office of Foreign Assets Control, U.S. laws such as the Foreign Corrupt Practices Act, and local laws which also prohibit corrupt payments to governmental officials. While we require our employees to comply with applicable laws and we monitor legal compliance, we cannot be certain that our employees or agents will comply in all instances or that we will promptly identify violations. Violations of these laws and regulations could result in fines, criminal sanctions against us, our officers or our employees, and prohibitions on the conduct of our business. Any such violations could result in prohibitions on our ability to offer our products in one or more countries, and could also materially damage our reputation, our products’ reputations, our international expansion efforts, our ability to attract and retain employees, our business and our operating results.
We are required to provide accurate pricing information to the U.S. government for the purpose of calculating reimbursement levels by the Centers for Medicare and Medicaid Services (CMS) and for calculating certain federal prices and federal rebate obligations.
We are required to report detailed pricing information, net of included discounts, rebates and other concessions, to CMS for the purpose of calculating national reimbursement levels, certain federal prices, and certain federal rebate obligations. We have established a system for collecting and reporting this data accurately to CMS and have instituted a compliance program to assure that the information we collect is complete in all respects. If we report pricing information that is not accurate to the federal government, we could be subject to fines and other sanctions that could adversely affect our business. In addition, the government could change its calculation of reimbursement, federal prices, or federal rebate obligations which could negatively impact us.
We seek to obtain and maintain protection for the intellectual property relating to our technology and products.
Our success depends in large part on our ability to obtain and maintain protection in the United States and other countries for the intellectual property covering or incorporated into our technology and products, especially intellectual property related to our purification processes. The patent situation in the field of biotechnology and pharmaceuticals generally is highly uncertain and involves complex legal and scientific questions. We may not be able to obtain additional issued patents relating to our technology or products. Even if issued, patents issued to us or our licensors may be challenged, narrowed, invalidated, held to be unenforceable or circumvented, which could limit our ability to stop competitors from marketing similar products or limit the length of term of patent protection we may have for our products. Additionally, most of our patents relate to the processes we use to produce our products, not the products themselves. In many cases, the plasma-derived products we produce or develop in the future will not, in and of themselves, be patentable. Since our patents relate to processes, if a competitor is able to design and utilize a process that does not rely on our protected intellectual property, that competitor could sell a plasma-derived product similar to one we developed or sell. Changes in either patent laws or in interpretations of patent laws in the United States and other countries may diminish the value of our intellectual property or narrow the scope of our patent protection. In addition, we are a party to a number of license agreements which may impose various obligations on us, including milestone and royalty payments. If we fail to comply with these obligations, the licensor may terminate the license, in which event we might not be able to market any product that is covered by the licensed patents.
Our patents also may not afford us protection against competitors with similar technology. Because patent applications in the United States and many other jurisdictions are typically not published until 18 months after filing, or in some cases not at all, and because publications of discoveries in the scientific literature often lag behind actual discoveries, neither we nor our licensors can be certain that we or they were the first to make the inventions claimed in our or their issued patents or pending patent applications, or that we or they were the first to file for protection of the inventions set forth in these patent applications. If a third party has also filed a U.S. patent application covering our product candidates or a similar invention, we may have to participate in an adversarial proceeding, known as an interference, declared by the U.S. Patent Office to determine priority of invention in the United States. The costs of these proceedings could be substantial and it is possible that our efforts could be unsuccessful, resulting in a loss of our anticipated U.S. patent position.
We also rely on unpatented technology, trade secrets, know-how and confidentiality agreements with our employees, consultants and third parties to protect our unpatented proprietary technology, processes and know-how. We require our officers, employees, consultants and advisors to execute proprietary information and invention and assignment agreements upon commencement of their relationships with us. There can be no assurance, however, that these agreements will provide meaningful protection for our inventions, trade secrets or other proprietary information in the event of unauthorized use or disclosure of such information. These agreements may be breached and we may not have adequate remedies for any such breach. In addition, our trade secrets may otherwise become known or be independently developed by competitors. If any trade secret, know-how or other technology not protected by a patent were to be disclosed to or independently developed by a competitor to develop alternative products, we could face increased competition and lose a competitive advantage.
We, like other companies in the pharmaceutical industry, may become aware of counterfeit versions of our products becoming available domestically and abroad. Counterfeit products may use different and possibly contaminated sources of plasma and other raw materials, and the purification process involved in the manufacture of counterfeit products may raise additional safety concerns, over which we have no control. Any reported adverse events involving counterfeit products that purport to be our products could harm our reputation and the sale of our products, in particular, and consumer willingness to use plasma-derived therapeutics generally.
We may infringe or be alleged to infringe intellectual property rights of third parties.
Our products or product candidates may infringe or be accused of infringing one or more claims of an issued patent or may fall within the scope of one or more claims in a published patent application that may be subsequently issued and to which we do not hold a license or other rights. Third parties may own or control these patents or patent applications in the United States and abroad. These third parties could bring claims against us or our collaborators that would cause us to incur substantial expenses and, if successful against us, could cause us to pay substantial damages. Further, if a patent infringement suit were brought against us or our collaborators, we or they could be forced to stop or delay research, development, manufacturing or sales of the product or product candidate that is the subject of the suit.
On May 21, 2008, Baxter Healthcare Corporation (Baxter) and National Genetics Institute (NGI), a wholly-owned subsidiary of Laboratory Corporation of America, filed a complaint in the U.S. District Court for the Eastern District of North Carolina alleging that we infringed U.S. Patent Nos. 5,780,222, 6,063,563, and 6,566,052. The patents deal primarily with a method of screening large
numbers of biological samples utilizing various pooling and matrix array strategies, and the complaint alleges that the patents are owned by Baxter and exclusively licensed to NGI.
If we are found to infringe the patent rights of a third party, or in order to avoid potential claims, we or our collaborators may choose or be required to seek a license from a third party and be required to pay license fees or royalties or both. These licenses may not be available on acceptable terms, or at all. Even if we or our collaborators were able to obtain a license, the rights may be nonexclusive, which could result in our competitors gaining access to the same intellectual property. Ultimately, we could be prevented from commercializing a product, or be forced to cease some aspect of our business operations, if, as a result of actual or threatened patent infringement claims, we or our collaborators are unable to enter into licenses on acceptable terms.
There has been substantial litigation and other proceedings regarding patent and other intellectual property rights in the pharmaceutical and biotechnology industries. In addition to infringement claims against us, we may become a party to other patent litigation and other proceedings, including interference proceedings declared by the United States Patent and Trademark Office and opposition proceedings in the European Patent Office, regarding intellectual property rights with respect to our products. The cost to us of any patent litigation or other proceeding, even if resolved in our favor, could be substantial. Some of our competitors may be able to sustain the costs of such litigation or proceedings more effectively than we can because of their substantially greater financial resources. Uncertainties resulting from the initiation and continuation of patent litigation or other proceedings could have a material adverse effect on our ability to compete in the marketplace. Patent litigation and other proceedings may also absorb significant management time.
Many of our employees were previously employed at universities or other biotechnology or pharmaceutical companies, including our competitors or potential competitors. We try to ensure that our employees do not use the proprietary information or know-how of others in their work for us. We may, however, be subject to claims that we or these employees have inadvertently or otherwise used or disclosed intellectual property, trade secrets or other proprietary information of any such employee’s former employer. Litigation may be necessary to defend against these claims and, even if we are successful in defending ourselves, could result in substantial costs to us or be distracting to our management. If we fail to defend any such claims, in addition to paying monetary damages, we may lose valuable intellectual property rights or personnel.
We may not be able to commercialize products in development.
Before obtaining regulatory approval for the sale of our product candidates or for marketing of existing products for new indicated uses, we must conduct, at our own expense, extensive preclinical tests to demonstrate the safety of our product candidates in animals and clinical trials to demonstrate the safety and efficacy of our product candidates in humans. Preclinical and clinical testing is expensive, difficult to design and implement, can take many years to complete and is uncertain as to outcome. A failure of one or more of our clinical trials can occur at any stage of testing. We may experience numerous unforeseen events during, or as a result of, preclinical testing and the clinical trial process that could delay or prevent our ability to receive regulatory approval or commercialize our product candidates, including:
· regulators or institutional review boards may not authorize us to commence a clinical trial or conduct a clinical trial within a country or at a prospective trial site respectively;
· the regulatory requirements for product approval may not be explicit, may evolve over time and may diverge by jurisdiction;
· our preclinical tests or clinical trials may produce negative or inconclusive results, and we may decide, or regulators may require us, to conduct additional preclinical testing or clinical trials or we may abandon projects that we had expected to be promising;
· the number of patients required for our clinical trials may be larger than we anticipate, enrollment in our clinical trials may be slower than we currently anticipate, or participants may drop out of our clinical trials at a higher rate than we anticipate, any of which would result in significant delays;
· our third-party contractors may fail to comply with regulatory requirements or meet their contractual obligations to us in a timely manner;
· we might have to suspend or terminate our clinical trials if the participants are being exposed to unacceptable health risks or if any participant experiences an unexpected serious adverse event;
· regulators or institutional review boards may require that we hold, suspend or terminate clinical research for various reasons, including non-compliance with regulatory requirements;
· undetected or concealed fraudulent activity by a clinical researcher, if discovered, could preclude the submission of clinical data prepared by that researcher, lead to the suspension or substantive scientific review of one or more of our marketing applications by regulatory agencies, and result in the recall of any approved product distributed pursuant to data determined to be fraudulent;
· the cost of our clinical trials may be greater than we anticipate;
· the supply or quality of our product candidates or other materials necessary to conduct our clinical trials may be insufficient or inadequate because we do not currently have any agreements with third-party manufacturers for the long-term commercial supply of any of our product candidates;
· an audit of preclinical or clinical studies by the FDA or other regulatory authority may reveal non-compliance with applicable regulations, which could lead to disqualification of the results and the need to perform additional studies; and
· the effects of our product candidates may not be the desired effects or may include undesirable side effects or the product candidates may have other unexpected characteristics.
If we are required to conduct additional clinical trials or other testing of our product candidates beyond those that we currently contemplate, if we are unable to successfully complete our clinical trials or other testing, if the results of these trials or tests are not positive or are only modestly positive or if there are safety concerns, we may:
· be delayed in obtaining marketing approval for our product candidates;
· not be able to obtain marketing approval;
· not be able to obtain reimbursement for our products in some countries;
· obtain approval for indications that are not as broad as intended; or
· have the product removed from the market after obtaining marketing approval.
Our product development costs will also increase if we experience delays in testing or approvals. We do not know whether any preclinical tests or clinical trials will begin as planned, will need to be restructured or will be completed on schedule, if at all. Significant preclinical or clinical trial delays also could shorten the patent protection period during which we may have the exclusive right to commercialize our product candidates or allow our competitors to bring products to market before we do and impair our ability to commercialize our products or product candidates.
Even if preclinical trials are successful, we may still be unable to commercialize the product due to difficulties in obtaining regulatory approval for the process or problems in scaling the engineering process to commercial production. Additionally, if produced, the product may not achieve an adequate level of market acceptance by physicians, patients, healthcare payors and others in the medical community to be profitable. The degree of market acceptance of our product candidates, if approved for commercial sale, will depend on a number of factors, some of which are beyond our control, including:
· the prevalence and severity of any side effects;
· the efficacy and potential advantages over alternative treatments;
· the ability to offer our product candidates for sale at competitive prices;
· relative convenience and ease of administration;
· the willingness of the target patient population to try new therapies and of physicians to prescribe these therapies; the strength of marketing and distribution support; and
· sufficient third-party coverage or reimbursement.
Therefore, we cannot guarantee that any products which we may seek to develop will ever be successfully commercialized, and to the extent they are not, such products could be a significant expense with no reward.
If we experienced material weaknesses or fail to otherwise maintain effective internal control over financial reporting, there is more than a remote likelihood that a material misstatement of our annual or interim financial statements will not be prevented or detected by our internal controls.
Our management is responsible for establishing and maintaining adequate internal control over financial reporting. Our internal control over financial reporting is a process designed to provide reasonable assurance regarding the reliability of financial reporting and the preparation of financial statements in accordance with generally accepted accounting principles. A material weakness is a control deficiency, or combination of control deficiencies, that results in more than a remote likelihood that a material misstatement of the annual or interim financial statements will not be prevented or detected. We have identified and remediated material weaknesses in internal control over financial reporting in the past.
Under the provisions of Section 404 of the Sarbanes-Oxley Act of 2002, we will be required to include a report by our management on the effectiveness of our internal control over financial reporting beginning with our Annual Report on Form 10-K for the fiscal year ending December 31, 2010. This report must contain an assessment by management of the effectiveness of our internal control over financial reporting as of the end of our fiscal year and a statement as to whether or not our internal control over financial reporting is effective. Our annual report for the fiscal year ending December 31, 2010 must also contain a statement that our independent registered public accountants have issued an attestation report on the effectiveness of our internal control over financial reporting. If we are unable to conclude that our internal control over financial reporting is effective, or if our independent registered public accountants are unable to attest to the effectiveness of our internal control over financial reporting, the market’s perception of our financial condition and the trading price of our stock may be adversely affected. Our inability to conclude that our internal control over financial reporting is effective would also adversely affect the results of the periodic management evaluations of our disclosure controls and procedures and internal control over financial reporting that will be required under the Sarbanes-Oxley Act of 2002.
Our future success depends on our ability to retain members of our senior management and to attract, retain and motivate qualified personnel.
We are highly dependent on the principal members of our executive and scientific teams. The loss of the services of any of these persons might impede the achievement of our research, development, operational and commercialization objectives. In particular, we believe the loss of the services of Lawrence D. Stern, John M. Hanson, Mary J. Kuhn, Thomas J. Lynch, John R. Perkins, Joel E. Abelson, Stephen R. Petteway, John F. Gaither, Kari D. Heerdt, Daniel L. Menichella, James R. Engle and Bruce Nogales would significantly and negatively impact our business. We do not maintain “key person” insurance on any of our executive officers. We have employment contracts only with Messrs. Stern (through March 31, 2012), Hanson (through October 10, 2010) and Gaither (through September 5, 2010) and Ms. Heerdt (through April 1, 2010) and these expire on the dates indicated unless renewed. Our risk of key employee turnover may increase after the vesting of options in April 2010.
Recruiting and retaining qualified operations, finance and accounting, scientific, clinical and sales and marketing personnel will be critical to our success. We may not be able to attract and retain these personnel on acceptable terms, given the competition among numerous pharmaceutical and biotechnology companies for similar personnel. We also experience competition for the hiring of scientific and clinical personnel from universities and research institutions. In addition, we rely on consultants and advisors, including scientific and clinical advisors, to assist us in formulating our research and development and commercialization strategy. Our consultants and advisors may be employed by employers other than us and may have commitments under consulting or advisory contracts with other entities that may limit their availability to us.
Federal cGMP regulations also require that the personnel we employ and hold responsible for the collection, processing, testing, storage or distribution of blood or blood components be adequate in number, educational background, training and experience, including professional training as necessary, or combination thereof, and have capabilities commensurate with their assigned functions, a thorough understanding of the procedures or control operations they perform, the necessary training or experience, and adequate information concerning the application of relevant cGMP requirements for their individual responsibilities. Our failure to attract, retain, and motivate qualified personnel may result in a regulatory violation, affect product quality, require recall or market withdrawal of affected product, or a suspension or termination of our license to market our products, or any combination thereof.
A substantial portion of our revenue is derived from a small number of customers, and the loss of one or more of these customers could have a material adverse effect on us.
Three customers accounted for approximately 36% and 35% of our net revenues for the years ended December 31, 2009 and 2008, respectively. Similarly, our accounts receivable balances have also been concentrated with a small number of customers. Two customers accounted for approximately 23% and 29% of our accounts receivable, net, as of December 31, 2009 and 2008, respectively. In the event that any of these customers were to suffer an adverse downturn in their business or a downturn in their supply needs, our business could be materially adversely affected. We cannot guarantee that these customers will continue purchasing our products at past volumes, or, in the event that any of them were to cease doing business with us, that we could replace such
customer on substantially similar terms or at all. Therefore, the loss of one or more of these customers could have a material adverse effect on our net sales, gross profit and financial condition. Under certain market conditions, our customers’ liquidity may worsen and they may demand longer payment terms, higher early payment discounts, volume rebates and other concessions which would have adverse financial consequences on us.
A significant amount of our U.S. Gamunex volume is contracted. As these contracts expire over the next few years, beginning in 2011, we may not be able to renew the commitments on as favorable terms, or at all.
Since the late 1980s we have been the “supplier of record” for the Canadian blood system. Under existing contracts, we are the largest supplier of plasma-derived products to the Canadian blood system operators, Canadian Blood Services and Hema Quebec. We transport plasma from Canadian Blood Services and Hema Quebec collection centers to our manufacturing facility in Clayton, North Carolina for manufacture, and return the finished product, along with commercial product, for sale to Canadian Blood Services and Hema Quebec. Pricing for our products and services is set at the beginning of the contract period, subject to adjustment for inflation. The U.S. dollar based contracts are terminable upon default, or the occurrence of certain events, including a third party obtaining Canadian regulatory approval to introduce a significantly superior product or fractionation service, our products or services becoming obsolete, or if we make certain nonrelated improvements and Canadian Blood Services or Hema Quebec do not accept the associated price increase. We were awarded new five year contracts in December 2007, which became effective April 1, 2008. The contracts may be extended for two one-year terms upon agreement of the parties. Under these contracts, we fractionate 100% of the Canadian plasma initially and a majority of the Canadian plasma throughout the contract period and supply a majority of the Canadian requirements for IGIV during the contract term as well. Canadian Blood Services has elected to pursue a dual-source strategy and although we will continue to be the primary supplier, we anticipate annual volume declines because of their strategy. Hema Quebec has a sole source strategy for fractionation of their plasma and we expect our IGIV share to remain relatively constant through the duration of the contract. We derive significant revenue and profits under these contracts, and a failure to maintain contracts with the Canadian blood system operators or any diminution in the volume or price under future contracts could have a material adverse effect on our financial results.
Potential business combinations could require significant management attention and prove difficult to integrate with our business.
If we become aware of potential business combination candidates that are complementary to our business, we may decide to combine with such businesses or acquire their equity or assets. We have acquired businesses or product lines in the past. For example, in April 2005, we acquired Precision Pharma Services, Inc., a contract fractionator located in Melville, New York, and in November 2006 and June 2007 we acquired groups of plasma collection centers in varying stages of development and assumed certain liabilities from IBR, a supplier of source plasma. We have since acquired additional plasma collection centers on a case by case basis. Business combinations generally may involve a number of difficulties and risks to our business, including:
· failure to integrate management information systems, personnel, research and development, marketing, operations, sales and support;
· potential loss of key current employees or employees of the acquired company;
· disruption of our ongoing business and diversion of management’s attention from other business concerns;
· potential loss of the acquired company’s customers;
· failure to develop further the other company’s technology successfully;
· unanticipated costs and liabilities; and
· other accounting and operational consequences.
In addition, we may not realize the anticipated benefits from any business combination we may undertake in the future and any benefits we do realize may not justify the acquisition price. Any integration process would require significant time and resources, and we may not be able to manage the process successfully. If our customers are uncertain about our ability to operate on a combined basis, they could delay or cancel orders for our products. We may not successfully evaluate or utilize the acquired technology or accurately forecast the financial impact of a combination, including accounting charges or volatility in the stock price of the combined entity. If we fail to successfully integrate other companies with which we may combine in the future, our business and financial results could be harmed.
Talecris Holdings, LLC and its affiliated entities will continue to exercise significant control over us and could delay or prevent a change in corporate control.
As of February 10, 2010, Talecris Holdings, LLC owned approximately 49.9% of our outstanding common stock. Talecris Holdings, LLC is owned by (i) Cerberus-Plasma Holdings LLC, the managing member of which is Cerberus Partners, L.P., and (ii) limited partnerships affiliated with Ampersand Ventures. Substantially all rights of management and control of Talecris Holdings, LLC are held by Cerberus-Plasma Holdings LLC.
As long as Talecris Holdings, LLC owns or controls such a substantial portion of our outstanding voting power, it may have the ability to delay or prevent a change in control of us that may be favored by other stockholders and may otherwise exercise substantial control over all corporate actions requiring stockholder approval:
· the election and removal of directors and the size of our board;
· any amendment of our certificate of incorporation or bylaws;
· the approval of mergers and other significant corporate transactions, including a sale of substantially all of our assets; or
· the defeat of any non-negotiated takeover attempt that might otherwise benefit our other stockholders.
A majority of our board of directors will not be considered “independent” under the rules of The Nasdaq Global Select Market.
Until January 21, 2010 a majority of our common stock was owned by Talecris Holdings, LLC. As a result, we are now phasing in the requirements under Nasdaq rules. A majority of the directors on each of our compensation committee and our nominating committee must continue to meet Nasdaq independence requirements after April 20, 2010. All directors on these committees will need to meet Nasdaq independence requirements by January 21, 2011. In addition, by January 21, 2011, a majority of our board of directors will need to be “independent” under Nasdaq rules. Failure to meet these requirements could result in our delisting. Currently, our board has determined that four of our directors are “independent.”
Provisions in our corporate charter documents and under Delaware law could make an acquisition of us more difficult and may prevent attempts by our stockholders to replace or remove our current management, even if beneficial to our stockholders.
Provisions in our corporate charter and our bylaws may discourage, delay or prevent a merger, acquisition or other change in control of us that stockholders may consider favorable, including transactions in which stockholders might otherwise receive a premium for their shares. These provisions could also limit the price that investors might be willing to pay in the future for shares of our common stock, thereby depressing the market price of our common stock. In addition, these provisions may frustrate or prevent any attempts by our stockholders to replace or remove our current management by making it more difficult for stockholders to replace members of our board of directors. Because our board of directors is responsible for appointing the members of our management team, these provisions could in turn affect any attempt by our stockholders to replace current members of our management team. Among others, these provisions:
· establish a classified board of directors such that not all members of the board are elected at one time;
· allow the authorized number of our directors to be changed only by the affirmative vote of two-thirds of our shares of capital stock or by resolution of our board of directors;
· limit the manner in which stockholders can remove directors from the board;
· establish advance notice requirements for stockholder proposals that can be acted on at stockholder meetings and nominations to our board of directors;
· require that stockholder actions must be effected at a duly called stockholder meeting and prohibit actions by our stockholders by written consent;
· impose a “fair price” requirement that prohibits an acquiror attempting to effect a takeover of our company from utilizing a two tier price structure as part of a two stage acquisition of our outstanding stock;
· limit who may call stockholder meetings;
· require any stockholder (or group of stockholders acting in concert) who seek to transact business at a meeting or nominate directors for election to submit a list of derivative interests in any company securities, including any short interests and synthetic equity interests held by such proposing stockholder;
· require any stockholder (or group of stockholders acting in concert) who seek to nominate directors for election to submit a list of “related party transactions” with the proposed nominee(s) (as if such nominating person were a registrant pursuant to Item 404 of Regulation S-K, and the proposed nominee was an executive officer or director of the “registrant”); and
· authorize our board of directors to issue preferred stock without stockholder approval, which could be used to institute a “poison pill” that would work to dilute the stock ownership of a potential hostile acquiror, effectively preventing acquisitions that have not been approved by our board of directors.
For example, our certificate of incorporation authorizes the board of directors to issue up to 40,000,010 shares of preferred stock. The preferred stock may be issued in one or more series, the terms of which may be determined by our board of directors at the time of issuance or fixed by resolution without further action by the stockholders. These terms may include voting rights, preferences as to dividends and liquidation, conversion rights, redemption rights, and sinking fund provisions. The issuance of preferred stock could diminish the rights of holders of our common stock, and therefore could reduce the value of our common stock. In addition, specific rights granted to holders of preferred stock could be used to restrict our ability to merge with, or sell assets to, a third party. The ability of our board of directors to issue preferred stock could make it more difficult, delay, discourage, prevent, or make it more costly to acquire or effect a change in control, thereby preserving the current stockholders’ control.
Moreover, because we are incorporated in Delaware, we are governed by the provisions of Section 203 of the Delaware General Corporation Law, which prohibits a person who owns in excess of 15% of our outstanding voting stock from merging or combining with us for a period of three years after the date of the transaction in which the person acquired in excess of 15% of our outstanding voting stock, unless the merger or combination is approved in a prescribed manner. The restrictions contained in Section 203 are not applicable to any of our existing stock holders that own 15% or more of our outstanding voting stock.
Our quarterly results of operations may fluctuate and this fluctuation may cause our stock price to decline, resulting in losses to our investors.
Our quarterly operating results are likely to fluctuate. A number of factors, many of which are not within our control, could cause variability in our operations and our operating results and may result in fluctuations in our stock price. These factors include the risks discussed elsewhere in this section, and may include:
· contamination of products or material that does not meet specifications in production or final product which could result in recalls, write-offs and other costs;
· changes in plasma procurement costs, yield, or other manufacturing costs that may increase our cost of goods sold for the period;
· non-capitalizable costs associated with our capital projects;
· seasonality of sales, particularly our hyperimmune products;
· competitor activities, including new product introductions;
· variations in product demand or price;
· regulatory developments in the United States and elsewhere;
· the departure of key personnel;
· interest rate fluctuations impacting our floating rate revolving credit facility and foreign currency exchange rate fluctuations in the international markets in which we operate; and
· general and industry-specific economic conditions that may affect our operations.
If our quarterly operating results fail to meet the expectations of stock market analysts and investors, the price of our
common stock may rapidly decline, resulting in losses to our investors.
If our stock price is volatile, purchasers of our common stock could incur substantial losses.
Our stock price is likely to be volatile. The stock market has at times experienced extreme volatility that has often been unrelated to the operating performance of particular companies. As a result of this volatility, investors may not be able to sell their common stock at or above the price at which they purchased their shares. The market price for our common stock may be influenced by many factors, including, but not limited to:
· disruptions in, or shortages of, our plasma supply;
· disruption of product supply, product availability, or product recalls;
· results of clinical trials and regulatory review of our product candidates or those of our competitors;
· introduction of competing products or the announcement by our competitors of their plans to do so;
· new therapeutic technologies that may replace plasma-derived proteins;
· regulatory or legal developments in the United States and other countries;
· variations in our financial results or those of companies that are perceived to be similar to us;
· healthcare reform legislation or other changes in the structure of healthcare payment systems;
· pricing fluctuations due to changing market conditions in the pharmaceutical and biotechnology sectors and issuance of new or changed securities analysts’ reports or recommendations;
· general economic, industry and market conditions; and
· other factors described in this “Risk Factors” section.
A significant portion of our total outstanding shares are restricted from immediate resale but may be sold into the market in the near future. This could cause the market price of our common stock to drop significantly, even if our business is doing well.
Sales of a substantial number of shares of our common stock in the public market could occur at any time. These sales, or the perception in the market that the holders of a large number of shares intend to sell shares, could reduce the market price of our common stock. We have outstanding 122,552,847 shares of common stock as of February 10, 2010. Of these shares, 61,175,236 held by Talecris Holdings, LLC and 1,689,420 shares held by our directors and employees will become eligible for sale when certain lock-up agreements expire on March 29, 2010. Talecris Holdings, LLC has rights, subject to some conditions, to require us to file registration statements covering their shares or to include their shares in registration statements that we may file for ourselves or other stockholders. We also have registered all shares of common stock that we may issue under our equity compensation plans. These shares can be freely sold in the public market upon exercise or vesting, subject to the expiration of the lock-up agreements. In addition, as of February 10, 2010, we had exercisable options to purchase 1,429,425 shares of our common stock that were not subject to lock-up agreements. On April 1, 2010, it is expected that there will be 9,722,727 additional shares subject to stock options available for exercise and 2,416,676 additional shares available for sale as a result of the vesting of stock options and restricted stock grants and expiration of the lock-up agreements. Sales of shares by our directors and employees are generally subject to the limitations discussed elsewhere in this Annual Report under the heading “Shares Eligible for Future Sale.”
We do not anticipate paying dividends in the foreseeable future.
Although we declared a $73.2 million dividend to our stockholders on December 30, 2005 and a $760.0 million dividend to our stockholders on December 6, 2006, we currently anticipate that we will retain all funds for use in the operation of our business, and we do not anticipate paying any further cash dividends on our common stock for the foreseeable future. Therefore, any return on investment in our common stock is solely dependent upon the appreciation of the price of our common stock on the open market. We cannot guarantee that our common stock will appreciate in value. See the discussion contained elsewhere in this Annual Report under the heading “Dividend Policy.”
Talecris Holdings, LLC has certain registration rights for its shares of our common stock, which, if exercised, may result in additional shares of our common stock being publicly available and may cause our stock price to decline, resulting in losses to our
investors.
Talecris Holdings, LLC, the holder of 61,175,236 shares of our common stock, has the right to require us to register these shares under the Securities Act under specified circumstances, as follows:
· Demand and Form S-3 Registration Rights. Beginning April 6, 2010, Talecris Holdings LLC, subject to specified limitations, may require that we register all or part of its shares of our common stock for sale under the Securities Act on an unlimited number of occasions. In addition, Talecris Holdings, LLC may from time to time make demand for registrations on Form S-3, a short form registration statement, when we are eligible to use this form.
· Incidental Registration Rights. If we register any of our common stock, either for our own account or for the account of other securityholders, Talecris Holdings, LLC is entitled to notice of the registration and to include its shares of common stock in the registration.
· Limitations and Expenses. Other than in a demand registration, with specified exceptions, Talecris Holdings, LLC’s right to include shares in a registration is subject to the right of the underwriters to limit the number of shares included in the offering. All fees, costs and expenses of any demand registrations and any registrations on Form S-3 will be paid by us, and all selling expenses, including underwriting discounts and commissions, will be paid by the holders of the securities being registered.
Upon exercise of any of these registration rights, additional shares of our common stock will be publicly available for purchase and this increased availability of shares in the marketplace could cause the price of our common stock to decline, resulting in losses to our investors.
Lock-up Agreements with our directors, executive officers and Talecris Holdings, LLC will soon expire, which may result in increased sales of our common stock.
We, all of our directors and executive officers and Talecris Holdings, LLC have agreed that, subject to certain exceptions, without the prior written consent of Morgan Stanley & Co. Incorporated and Goldman, Sachs & Co., we and they will not, during the period ending March 29, 2010, subject to exceptions specified in the lock-up agreements, offer, sell, contract to sell or otherwise dispose of, directly or indirectly, or hedge our common stock or securities convertible into or exchangeable for or exercisable for our common stock, sell any option or contract to purchase, purchase any option or contract to sell, grant any option, right or warrant to purchase, lend or otherwise dispose of, directly or indirectly, any shares of our common stock or any securities convertible into or exercisable for our common stock. Further, we and each such person have agreed that, during this period, they will not make any demand for, or exercise any right with respect to, the registration of our common stock or warrants or other rights to purchase the common stock. As of February 10, 2010, we had outstanding 122,552,847 shares of common stock. Of these shares, 61,175,236 shares held by Talecris Holdings, LLC and 1,689,420 shares held by our directors and employees will become eligible for resale when the lock-up agreements expire on March 29, 2010. Talecris Holdings, LLC has the right to require us to file one or more registration statements with the SEC to register the resale of the shares it holds. In addition as of February 10, 2010, we had exercisable options to purchase 1,429,425 shares of our common stock that were not subject to lock-up agreements. On April 1, 2010, it is expected that there will be 9,722,727 additional shares subject to stock options available for exercise and 2,416,676 additional shares available for sale as a result of the vesting of stock options and restricted stock grants and expiration of the lock-up agreements. Sales of shares by our directors and employees are generally subject to the limitations discussed elsewhere in this Annual Report under the heading “Shares Eligible for Future Sale.”
Once the lock-up agreements expire, sales activity for our common stock may increase. If sales activity increases, the price of our common stock may decline, resulting in losses to our investors.
Despite our current indebtedness levels, we and our subsidiaries may be able to incur substantially more debt and take other actions that could diminish our ability to make payments on the 7.75% Notes when due.
We and our subsidiaries may be able to incur substantially more additional indebtedness in the future, including by accessing approximately $323.0 million of unused available borrowing capacity under our existing revolving credit facility, based on our December 31, 2009 indebtedness. We are not fully restricted under the terms of the indenture governing the 7.75% Notes from incurring additional debt, securing existing or future debt, recapitalizing our debt or taking a number of other actions that are not prohibited by the terms of the indenture governing the 7.75% Notes, any of which actions could have the effect of diminishing our ability to make payments on the 7.75% Notes when due and further exacerbate the risks associated with our substantial indebtedness. Furthermore, the terms of the instruments governing our subsidiaries’ indebtedness may not fully prohibit us or our subsidiaries from taking such actions. Although the indenture for the 7.75% Notes and our revolving credit facility contain covenants limiting indebtedness, these covenants are subject to a number of significant exceptions and qualifications.
Although the 7.75% Notes are referred to as “senior” notes, they are effectively subordinated to our and each guarantor’s secured indebtedness and all obligations of our non-guarantor subsidiaries.
The 7.75% Notes are our unsecured senior obligations and are guaranteed by, subject to limited exceptions, our current and
future domestic subsidiaries. The 7.75% Notes are not guaranteed by our foreign subsidiaries. Subsidiaries that we may establish or acquire in the future that are foreign subsidiaries, or that we may designate as unrestricted subsidiaries in accordance with the indenture, will not guarantee the 7.75% Notes. The 7.75% Notes are not secured by any of our assets. Our borrowings under our revolving credit facility are secured by substantially all of our assets, including’ substantially all of the assets of our domestic subsidiaries (other than real property and certain accounts receivable).
As a result of this structure, the 7.75% Notes are effectively subordinated to (1) all of our and each guarantor’s secured indebtedness, to the extent of the value of the collateral, and (2) all indebtedness and other obligations, including trade payables, of our non-guarantor subsidiaries. The effect of this effective subordination is that, in the event of a bankruptcy, liquidation, dissolution, reorganization or similar proceeding involving us or a subsidiary, the assets of the affected entity could not be used to pay holders of our 7.75% Notes until after:
· all secured claims against the affected entity have been fully paid; and
· if the affected entity is a non-guarantor subsidiary, all other claims against that subsidiary, including trade payables, have been fully paid.
The lenders under our revolving credit facility or the holders of other secured indebtedness will be entitled to exercise the remedies available to a secured lender under applicable law (in addition to any remedies that may be available under documents pertaining to our revolving credit facility or our other secured indebtedness). The exercise of such remedies may adversely affect our ability to meet our financial obligations under the 7.75% Notes.
As of December 31, 2009:
· we had outstanding an aggregate of $10.0 million of secured obligations that are effectively senior to the 7.75% Notes, comprising capital leases; and
· the non-guarantor subsidiaries had outstanding an aggregate of approximately $13.8 million of obligations, consisting of trade payables and other accrued expenses, which are effectively senior to the 7.75% Notes.
Our business operations may not generate the cash needed to service and repay the 7.75% Notes or our other indebtedness.
Our ability to make payments on our indebtedness, including the 7.75% Notes, and to fund planned capital expenditures, will depend on our ability to generate cash in the future. Our ability to generate cash in the future will be subject to general economic, financial, competitive, legislative, regulatory and other factors beyond our control.
There can be no assurance that our business will generate sufficient cash flows from operations or that we will have future borrowings available under our revolving credit facility in amounts sufficient to enable us to pay the interest and principal of our indebtedness when due or to fund other liquidity needs. At maturity, the entire outstanding principal amount of the 7.75% Notes will become due and payable by us. Our revolving credit facility matures in December of 2011. We may not be able to generate sufficient funds from operations to pay the principal of the 7.75% Notes or revolving credit facility when due. In that event, we will need to raise additional funds through the refinancing of all or part of our indebtedness on or before the maturity thereof, the sale of assets or the sale of equity securities. Each of these alternatives is dependent upon financial, business and other general economic factors affecting the credit and equity markets generally or our business in particular, many of which are beyond our control, and we can make no assurances that any such alternatives would be available to us, if at all, on satisfactory terms. In particular, our ability to refinance indebtedness on commercially reasonable terms or at all depends on market conditions at the time of refinancing. The terms of refinancing indebtedness may be materially less favorable to us than the terms of our current indebtedness. In addition, while we believe that consolidated cash flow generated by our operations will provide adequate sources of long-term liquidity for operations, a significant drop in operating cash flow resulting from economic conditions, competition or other uncertainties beyond our control could increase the need for refinancing or new capital.
If we default in the payment of amounts due on the 7.75% Notes (or other outstanding indebtedness), it would give rise to an event of default under the indenture governing the 7.75% Notes and under the revolving credit facility (or the agreements governing our other debt) and possible acceleration of amounts due under the indenture and under the revolving credit facility (or those other agreements). A payment default under our revolving credit facility or any other debt document, or an acceleration of amounts due under the revolving credit facility (or other debt documents) would cause an event of default under the indenture governing the 7.75% Notes, if the amount of debt involved is $50.0 million or more. In the event of any acceleration, there can be no assurance that we will have enough cash to repay our outstanding indebtedness.
The indenture governing the 7.75% Notes and our revolving credit facility contain operating and financial restrictions on us that
may limit our flexibility in operating our business.
Under the indenture governing the 7.75% Notes and under the revolving credit facility, we are required to satisfy a number of covenants that may restrict our ability to conduct our operations. For instance, these covenants limit or prohibit, among other things, our ability to incur additional debt, pay dividends on, redeem or repurchase capital stock, make certain investments, enter into certain types of transactions with affiliates, engage in unrelated businesses, incur certain liens; make prepayments of certain indebtedness and sell certain assets or merge with or into other’ companies. These covenants could adversely affect our operating results by significantly limiting our operating and financial flexibility.
Our ability to comply with these covenants may be affected by events beyond our control, and any breach could require us to seek waivers or amendments of covenants or alternative sources of financing, or to reduce expenditures. We cannot assure you that such waivers, amendments or alternative financing could be obtained or, if obtained, would be on terms favorable to us. In addition, under our revolving credit facility, as amended, we are required to satisfy a fixed charge coverage ratio of at least 1.10 to 1.00 if our borrowing availability based on eligible collateral is less than $48.75 million. If we were unable-to meet this fixed charge coverage ratio, the lenders could elect to terminate the facility and require us to repay outstanding borrowings. In such an event, unless we are able to refinance the indebtedness coming due and replace our revolving credit facility, we would likely not have sufficient liquidity for our business needs to service our debt or fund operations.
We have a holding company structure and we will depend in part on distributions from our subsidiaries in order to pay amounts due on the 7.75% Notes; certain provisions of law or contractual restrictions could limit distributions from our subsidiaries.
We derive substantially all of our operating income from, and hold substantially all of our assets through, our subsidiaries. The effect of this structure is that we will depend in part on the earnings of our subsidiaries, and the payment or other distribution to it of these earnings, in order to meet its obligations under the 7.75% Notes and other outstanding debt. Provisions of law, such as those requiring that dividends be paid only from surplus, could limit the ability of our subsidiaries to make payments or other distributions to us. Furthermore, our subsidiaries could in certain circumstances agree to contractual restrictions on their ability to make distributions. These restrictions could also render the subsidiary guarantors financially or contractually unable to make payments under their guarantees of the 7.75% Notes.
If we experience a change of control, we will be required to make an offer to repurchase the 7.75% Notes. However, we may be unable to do so due to lack of funds or covenant restrictions.
If we experience a change of control (as defined in the indenture governing the 7.75% Notes), we will be required to make an offer to repurchase all outstanding 7.75% Notes at 101% of their principal amount, plus accrued but unpaid interest, if any, to the date of repurchase. However, we may be unable to do so because:
· we might not have enough available funds, particularly since a change of control could cause part or all of our other indebtedness to become due; and
· the agreements governing our credit facilities and other secured indebtedness would prohibit us from repurchasing the 7.75% Notes, unless we were able to obtain a waiver or refinance such indebtedness.
As a result, a holder of 7.75% Notes may have to continue to hold 7.75% Notes even after a change of control.
A failure to make an offer to repurchase the 7.75% Notes upon a change of control would give rise to an event of default under the indenture governing the 7.75% Notes and could result in an acceleration of amounts due thereunder. In addition, any such default under the indenture governing the 7.75% Notes would trigger a default under our revolving credit facility (which could result in the acceleration of all indebtedness thereunder). A change of control (as defined in the credit agreement), in and of itself, is also an event of default under our revolving credit facility, which would entitle our lenders to accelerate all amounts owing thereunder.
In the event of any such acceleration, there can be no assurance that we will have enough cash to repay our outstanding indebtedness, including the 7.75% Notes.
A guarantee could be voided if the guarantor fraudulently transferred the guarantee at the time it incurred the indebtedness, which could result in the noteholders being able to rely only on us to satisfy claims.
A guarantee that is found to be a fraudulent transfer may be voided under the fraudulent transfer laws described below. The application-of these laws requires the making of complex factual determinations and estimates as to which there may be different opinions and views.
In general, federal and state fraudulent transfer laws provide that a guarantee can be voided; or claims under a guarantee may be subordinated to all other debts of that guarantor if, among other things, at the time it incurred the indebtedness evidenced by its guarantee:
· the guarantor intended to hinder, delay or defraud any present or future creditor; or
· the guarantor received less than reasonably equivalent value or fair consideration for the incurrence of the guarantee; and
· was insolvent or rendered insolvent by reason of such incurrence;
· was engaged in a business or transaction for which the guarantor’s remaining assets constituted unreasonably small capital; or
· intended to incur, or believed that it would incur, debts beyond its ability to pay those debts as they matured.
In addition, any payment by that guarantor under a guarantee could be voided and required to be returned to the guarantor or to a fund for the benefit of the creditors of the guarantor.
The measures of insolvency for purposes of fraudulent transfer laws vary depending upon the governing law. Generally, a guarantor would be considered insolvent if:
· the sum of its debts, including contingent liabilities, was greater than the fair saleable value of all of its assets;
· the present fair saleable value of its assets was less than the amount that would be required to pay its probable liability on its existing debts, including contingent liabilities, as they become absolute and mature; or
· it could not pay its debts as they become due.
We cannot predict:
· what standard a court would apply in order to determine whether a guarantor was insolvent as of the date it issued the guarantee or whether, regardless of the method of valuation, a court would determine that the guarantor was insolvent on that date; or
· whether a court would determine that the payments under the guarantee constituted fraudulent transfers or conveyances on other grounds.
In the event that the guarantee of the 7.75% Notes by a guarantor is voided as a fraudulent conveyance, holders of the 7.75% Notes would effectively be subordinated to all indebtedness and other liabilities of that guarantor.
Our credit ratings may not reflect all the risks of any investment in our 7.75% Notes.
Our credit ratings are an independent assessment of our ability to pay debt obligations as they become due. Consequently, real, or anticipated changes in our credit ratings will generally affect the market value of the 7.75% Notes. Our credit ratings, however, may not reflect the potential impact that risks related to structural, market or other factors may have on the value of our 7.75% Notes.
A holder of our 7.75% Notes may find it difficult to sell our 7.75% Notes.
A holder of our 7.75% Notes may find it difficult to sell our 7.75% Notes because an active trading market for the 7.75% Notes may not develop.
We do not intend to apply for listing or quotation of the 7.75% Notes or, if issued, the exchange notes, on any exchange. Therefore, we do not know the extent to which investor interest will lead to the development of a trading market or how liquid that market might be. Although the initial purchasers of the 7.75% Notes have advised us that they intend to make a market in the 7.75% Notes, and, if issued, the exchange notes, they are not obligated to do so. Accordingly, any market-making activities of the initial purchasers may be discontinued at any time without notice.
If a market for the 7.75% Notes does develop, it is possible that a holder of our 7.75% Notes will not be able to sell our
7.75% Notes or, if issued, the exchange notes at a particular time or that the prices that a holder would receive upon a sale will be favorable. It is also possible that any trading market that does develop for the 7.75% Notes or any exchange notes will not be liquid. Future trading prices of the 7.75% Notes and any exchange notes will depend on many factors, including:
· our operating performance, financial condition and prospects, or the operating performance, financial condition and prospects of companies in the biopharmaceutical industry generally;
· our ability to complete, if required, the offer to exchange the 7.75% Notes for the exchange notes;
· the interest of securities dealers in making a market for the 7.75% Notes and any exchange notes;
· prevailing interest rates; and
· the market for similar securities.
Historically, the market for non-investment grade debt has been subject to disruptions that have caused volatility in prices. If a market for the 7.75% Notes develops, it is possible that the market for the 7.75% Notes and, if issued, the exchange notes will be subject to disruptions and price volatility. Any disruptions may have a negative effect on holders of the 7.75% Notes, regardless of our operating performance, financial condition and prospects.
ITEM 1B. UNRESOLVED STAFF COMMENTS
Not applicable
Our primary facilities are described below. All of our owned real estate is pledged as security under our Revolving Credit Facility.
· Clayton Site. A 182-acre site that we own, located in Clayton, North Carolina, which includes a 14-building complex of office space, lab space, warehouse, freezer storage, and biopharmaceutical manufacturing facilities consisting of 654,139 square feet. An additional 37,000 square feet of administrative office and 23,600 square feet of warehouse space are leased through December 2010 in a building located adjacent to our Clayton site. A 30,159 square foot climate controlled warehouse located next to the Clayton site is also leased through 2014.
· Research Triangle Park. A leased three-building headquarters/administrative office facility. The main building housing our corporate headquarters is leased through February 2012, and additional space in two other buildings is leased through July 2013 and December 2010.
· Raleigh Test Lab. A laboratory space located in Raleigh, North Carolina consisting of 76,000 square feet leased through August 2017, with an option to purchase through August 2011.
· Melville Site. An 11-acre site that we own, located in Melville, New York consisting of 102,922 square feet of office space, lab space, warehouse, and biopharmaceutical manufacturing facilities.
· Research Triangle Park. An 18-acre site that we own, located in Research Triangle Park, North Carolina, on which is located a R&D building, consisting of 25,000 square feet of office space and 45,000 square feet of laboratory facilities.
· Benson Warehouse. A cold storage warehouse of 39,200 square feet used for plasma storage in Benson, North Carolina leased through December 2012.
· Centennial Campus North Carolina State University. A combined office and laboratory space in Raleigh, North Carolina consisting of 21,364 square feet leased through December 2011.
· Frankfurt. A 2,552 square meters office facility located in Frankfurt Germany, which serves as our European headquarters and which is leased until June 30, 2015.
· Canada. A 6,396 square foot office facility located in Mississauga, Ontario, which serves as our Canadian headquarters and which is leased until April 30, 2011. We also lease a 2,356 square foot sales office in Ottawa, Ontario, which is leased until November 30, 2010.
· Plasma Collection Centers. As of December 31, 2009, we operated 69 plasma collection centers of various sizes under non-cancellable lease agreements expiring at various dates.
We believe our properties are adequately maintained and suitable for their intended use. We continually evaluate our properties and believe that our current facilities plus any planned expansions and upgrades are generally sufficient to meet our expected needs and expected near-term growth. Expansion projects and facility closings are undertaken as necessary in response to market needs.
We are involved in a number of judicial, regulatory and arbitration proceedings (including those described below) concerning matters arising in connection with the conduct of our businesses. We believe, based on currently available information, that the results of such proceedings, in the aggregate, will not have a material adverse effect on our financial condition, but might be material to our operating results for any particular period, depending, in part, upon the operating results for such period.
In May 2008, Baxter Healthcare Corporation (Baxter) and National Genetics Institute (NGI), a wholly-owned subsidiary of Laboratory Corporation of America, filed a complaint in the U.S. District Court for the Eastern District of North Carolina alleging that we infringed U.S. Patents Nos. 5,780,222, 6,063,563, and 6,566,052. They subsequently withdrew and re-filed the case in November 2008. The patents deal primarily with a method of screening large numbers of biological samples utilizing various pooling and matrix array strategies, and the complaint alleges that the patents are owned by Baxter and exclusively licensed to NGI. In November 2008, we filed our answer to their complaint, asserting anti-trust and other counterclaims, and filed a request for re-examination of the patents with the Patent and Trademark Office (PTO), which was subsequently granted. We filed a motion to stay litigation pending the PTO proceedings. The motion was unopposed and subsequently granted on January 30, 2009. On July 7 and July 9, 2009, the PTO mailed Notices of Intent to Issue Reexamination Certificates without amending the claims of the patents in dispute, but has not yet done so. Neither party has yet filed motions to resume the litigation. We believe that the allegations of infringement are without merit and that the patents are invalid as applied to our processes. We intend to vigorously defend against the complaint and pursue our counterclaims.
In August 2008, we notified Plasma Centers of America, LLC (PCA) that they were in breach of the Amended and Restated Plasma Sale/Purchase Agreement. We terminated the agreement in September 2008. In November 2008, we filed suit in federal court in Raleigh, North Carolina, against the G&M Crandall Limited Family Partnership and its individual partners as guarantors of obligations of PCA. A mediation held on January 8, 2009 with the objective of a global resolution of all claims among and between the various parties ended in an impasse. We were served in January 2009 in a parallel action by PCA, alleging breach of contract by TPR. The two cases are proceeding in parallel with trial in the state court action set for May 24, 2010.
In July 2009, we voluntarily contacted the U.S. Department of Justice (DOJ) to advise them that we were conducting an internal investigation into potential violations of the Foreign Corrupt Practices Act. The investigation initially focused on sales to certain Eastern European and Middle Eastern countries, but our investigation is also reviewing sales procedures in other countries as determined appropriate. The DOJ has not indicated what action it may take, if any, against us or any individual, or the extent to which it may conduct its own investigation.
In November 2009, the company received a letter from the United States Attorney’s Office for the Eastern District of Pennsylvania (“USAO”). The USAO requested a meeting to review the company’s compliance with the terms of the Pharmaceutical Pricing Agreement (“PPA”) under the Public Health Service program. Specifically, the USAO asked for information related to the sale of our IGIV product, Gamunex, under that program. In order to have federal financial participation apply to their products under the Medicaid program and to obtain Medicare Part B coverage, manufacturers are required to enter into a PPA. The PPA obligates manufacturers to charge covered entities the Public Health Service price for drugs intended for outpatient use. The Public Health Service price is based on the Medicaid rebate amount. The company believes that it has complied with the terms of the PPA and federal law. If the USAO determines that the company’s practices are inconsistent with the terms of the PPA, the USAO has stated that it may file a civil action against the company under the Anti-fraud Injunction Act and seek a court order directing the company to comply with the PPA or, potentially, proceed under some other legal theory. The company could also be subject to fines, damages, penalties, appointment of a monitor, or enhancement of existing compliance and training programs as a result of government action. The Company is cooperating with the investigation and intends to respond to information requests from the USAO.
ITEM 4. SUBMISSION OF MATTERS TO A VOTE OF SECURITY HOLDERS
On December 15, 2009, Talecris Holdings LLC, at the time our majority shareholder, exercised its rights under our Bylaws and appointed Dean Jonathan Mitchell to fill a newly created vacancy on our board of directors. This matter did not involve or require submission to a vote of our shareholders.
No other matters were submitted to a vote of our shareholders during the fourth fiscal quarter ended December 31, 2009.
ITEM 5. MARKET FOR REGISTRANT’S COMMON EQUITY, RELATED STOCKHOLDER MATTERS AND ISSUER PURCHASES OF EQUITY SECURITIES
Market Information
Our common stock, par value $0.01, has been listed on The NASDAQ Global Select Market under the symbol “TLCR” since October 1, 2009. Prior to that time, there was no public market for our common stock. The initial public offering price of our common stock on October 1, 2009 was $19.00 per share. The following table sets forth the range of the high and low market prices of our common stock for the period beginning on October 1, 2009 through December 31, 2009, as reported by The NASDAQ Global Select Market:
|
2009 |
|
High |
|
Low |
|
||
|
Fourth Quarter |
|
$ |
23.44 |
|
$ |
18.01 |
|
Stockholders
There were approximately 100 holders of record of our common stock as of the close of business on February 10, 2010. The number of holders of record is based upon the actual number of holders registered at such date and does not include holders of shares in “street names” or persons, partnerships, associates, corporations, or other entities identified in security position listings maintained by depositories. Talecris Holdings, LLC held approximately 49.9% of our outstanding common stock as of February 10, 2010.
Registration Rights
Talecris Holdings, LLC, the holder of 61,175,236 shares of our common stock, has the right to require us to register these shares under the Securities Act under specified circumstances.
Demand and Form S-3 Registration Rights. Beginning April 6, 2010, Talecris Holdings LLC, subject to specified limitations, may require that we register all or part of its shares of our common stock for sale under the Securities Act on an unlimited number of occasions. In addition, Talecris Holdings, LLC may from time to time make demand for registrations on Form S-3, a short form registration statement, when we are eligible to use this form.
Incidental Registration Rights. If we register any of our common stock, either for our own account or for the account of other securityholders, Talecris Holdings, LLC is entitled to notice of the registration and to include its shares of common stock in the registration.
Limitations and Expenses. Other than in a demand registration, with specified exceptions, Talecris Holdings, LLC’s right to include shares in a registration is subject to the right of the underwriters to limit the number of shares included in the offering. All fees, costs and expenses of any demand registrations and any registrations on Form S-3 will be paid by us, and all selling expenses, including underwriting discounts and commissions, will be paid by the holders of the securities being registered.
The above-described registration rights were granted to Talecris Holdings, LLC in connection with our formation transaction and carve-out from Bayer. Talecris Holdings, LLC is owned by (i) Cerberus-Plasma Holdings LLC, the managing member of which is Cerberus Partners, L.P., and (ii) limited partnerships affiliated with Ampersand Ventures. Substantially all rights of management and control of Talecris Holdings, LLC are held by Cerberus-Plasma Holdings LLC.
Shares Eligible for Future Sale
Future sales of substantial amounts of common stock, including shares issued upon exercise of outstanding options or in the public market, or the anticipation of those sales, could adversely affect market prices prevailing from time to time and could impair our ability to raise capital through sales of our equity securities.
As of February 10, 2010, we had outstanding 122,552,847 shares of common stock. Of these shares, 61,175,236 shares held by Talecris Holdings, LLC and 1,689,420 shares held by our directors and employees will become eligible for resale when the lock-up agreements expire on March 29, 2010. On April 1, 2010, it is expected that there will be 2,416,676 additional shares available for sale as a result of the vesting of restricted stock grants and the expiration of lock-up agreements.
After the expiration of the lock-up period, these restricted securities may be sold in the public market only if registered or if they qualify for an exemption from registration under Rule 144 or 701 under the Securities Act, which exemptions are summarized below. Talecris Holdings, LLC has the right to require us to file one or more registration statements with the SEC to register the resale of the shares it holds.
Rule 144. In general, a person who has beneficially owned shares of our common stock for at least six months, including the holding period of any prior owner other than one of our affiliates, would be entitled to sell those shares under Rule 144. For sellers who are our affiliates, sales within any three-month period the number of shares may not exceed the greater of:
· 1% of the number of shares of our common stock then outstanding, which equaled approximately 1,225,529 shares as of February 10, 2010, and
· the average weekly trading volume in our common stock on The Nasdaq Global Select Market during the four calendar weeks preceding the date of filing of a Notice of Proposed Sale of Securities Pursuant to Rule 144 with respect to the sale.
Sales by affiliates under Rule 144 are also subject to manner of sale provisions and notice requirements and to the availability of current public information about us.
A person may sell shares of common stock acquired from us without regard to manner of sale, the availability of public information about us or volume limitations, if:
· the person is not our affiliate and has not been our affiliate at any time during the three months preceding the sale; and
· the person has beneficially owned the shares proposed to be sold for at least six months, including the holding period of any prior owner other than our affiliates.
We cannot estimate the number of shares of common stock that our existing stockholders will elect to sell under Rule 144.
Rule 701. In general, under Rule 701 of the Securities Act, any of our employees, consultants or advisors who purchased shares from us in connection with a qualified compensatory stock plan or other written agreement is eligible to resell those shares 90 days after the effective date of our initial public offering in reliance on Rule 144, but without compliance with certain restrictions, including the holding period, contained in Rule 144.
Lock-up Agreements. We, all of our directors and executive officers and Talecris Holdings, LLC have agreed that, subject to certain exceptions, without the prior written consent of Morgan Stanley & Co. Incorporated and Goldman, Sachs & Co., we and they will not, during the period ending March 29, 2010, subject to exceptions specified in the lock-up agreements, offer, sell, contract to sell or otherwise dispose of, directly or indirectly, or hedge our common stock or securities convertible into or exchangeable for or exercisable for our common stock, sell any option or contract to purchase, purchase any option or contract to sell, grant any option, right or warrant to purchase, lend or otherwise dispose of, directly or indirectly, any shares of our common stock or any securities convertible into or exercisable for our common stock. Further, we and each such person have agreed that, during this period, they will not make any demand for, or exercise any right with respect to, the registration of our common stock or warrants or other rights to purchase the common stock.
Registration Rights. The holders of an aggregate of 61,175,236 shares of our common stock have the right to require us to register these shares under the Securities Act under specified circumstances. After registration pursuant to these rights, these shares will become freely tradable without restriction under the Securities Act.
Stock Options. As of February 10, 2010, we had outstanding options to purchase 11,749,865 shares of common stock, of which options to purchase 8,332,265 options were vested. We filed a registration statement on Form S-8 under the Securities Act to register all of the shares of common stock subject to outstanding options and options and other awards issuable pursuant to our 2005 Stock Option and Incentive Plan, and our 2009 Long-Term Incentive Plan. Accordingly, shares of our common stock registered under those plans are available for sale in the open market, subject to Rule 144 limitations applicable to affiliates, and subject to any vesting restrictions and lock-up agreements applicable to these shares. On April 1, 2010, it is expected that there will be 2,819,887 additional shares subject to stock options available for exercise.
Dividends
We declared a $73.2 million dividend to our stockholders on December 30, 2005 and a $760.0 million dividend to our stockholders on December 6, 2006. We currently do not anticipate paying cash dividends in the foreseeable future. Instead, we anticipate that all of our earnings, if any, in the foreseeable future will be used for working capital and to finance the growth and
development of our business. Any future determination relating to dividend policy will be made at the discretion of our board of directors and will depend on a number of factors, including our outstanding indebtedness, earnings, capital requirements, financial condition and future prospects, applicable Delaware law, which provides that dividends are only payable out of surplus or net profit for the then current and immediately preceding fiscal years, and other factors that our board of directors may deem relevant.
Our Revolving Credit Facility, as amended, permits the payment of cash dividends to holders of our common stock commencing with the first fiscal quarter of 2010, so long as (i) the Leverage Ratio determined as of the end of the immediately preceding fiscal quarter for the then most recently completed four fiscal quarters, is equal to or less than 2.00 to 1.00 and (ii) the minimum pro forma availability as of the date of such dividend (after giving effect to such cash dividend, the funding of all Revolving Loans, and the issuance of all Letters of Credit to be funded or issued as of such date) is not less than $48.75 million; provided that, the aggregate amount of Restricted Payments shall not exceed 50% of Net Income during the period from October 1, 2009 to the end of the most recently ended fiscal quarter as of the date of the Restricted Payment.
The indenture governing our 7.75% Notes permits us to make “Restricted Payments”, including the payment of dividends to holders of our common stock, only if (A) (i) there is no default or event of default under the indenture (and no default or event of default would occur as a result of the payment of dividends), (ii) we would be able to incur an additional dollar of indebtedness under the Fixed Charge Coverage Ratio test in the indenture, and (iii) the amount of such dividends along with all other Restricted Payments would not exceed our then existing Restricted Payment basket, or (B) we have availability under another specified basket to make a payment of dividends.
Recent Sales of Unregistered Securities
On October 21, 2009, we issued and sold $600.0 million aggregate principal amount of 7.75% Senior Unsecured Notes, due November 15, 2016 in a private placement conducted pursuant to Rule 144A and Regulation S under the Securities Act of 1933. The 7.75% Notes are guaranteed by certain of our existing subsidiaries and will be guaranteed by certain of our future subsidiaries and were sold pursuant to a Purchase Agreement, dated October 16, 2009.
The 7.75% Notes were issued under and are governed by an indenture dated October 21, 2009 between us, The Bank of New York Mellon Trust Company, N.A., as trustee, and the guarantors.
The 7.75% Notes were issued at a price equal to 99.321% of par. We received net proceeds of approximately $583.9 million, after deducting discounts of $4.1 million and commissions of $12.0 million. On October 21, 2009, we used the net proceeds from the offering to repay $491.0 million under our First and Second Lien Term Loans administered by Morgan Stanley Funding, Inc., which were thereby retired, and a portion of borrowings under our Revolving Credit Facility totaling $55.6 million. In addition, we used $28.7 million of the net proceeds to us to settle and terminate certain interest rate swap contracts with a notional amount of $390.0 million and $8.6 million to pay accrued interest associated with the First and Second Lien Term Loans. Interest on the 7.75% Notes will accrue at the rate of 7.75% per annum and will be payable semi-annually in arrears on May 15 and November 15 of each year, commencing on May 15, 2010. The 7.75% Notes will mature on November 15, 2016.
Issuer Purchases of Equity Securities
During the fourth fiscal quarter ended December 31, 2009, we did not repurchase any of our outstanding common stock.
Performance Graph
We have presented below the cumulative total return to our stockholders during the period from October 1, 2009, the date of our initial public offering of common stock, through December 31, 2009 in comparison to the cumulative return on the NASDAQ Composite Index and a peer group of companies during that same period. Our peer group consisted of seventeen companies which are: Abbott Laboratories, Alcon Inc, Allergan Inc, Amgen Inc, Baxter International Inc, Bristol Myers Squibb Company, Covidien PLC, Edwards Lifesciences Corp., ELI Lilly & Company, Glaxosmithkline PLC, Hospira Inc, King Pharmaceuticals Inc, Medtronic Inc, Merck & Company Inc, Pfizer Inc, Sanofi-Aventis and Takeda Pharmaceutical Company. The results assume that $100 was invested on October 1, 2009 in our common stock, in the peer group, and in the index (including reinvestment of dividends). The comparisons are based on historical data and are not indicative of, nor intended to forecast, the future performance of our common stock. The performance graph set forth below shall not be deemed incorporated by reference into any filing by us under the Securities Act of 1933 or the Securities Exchange Act of 1934 except to the extent that we specifically incorporate such information by reference, and shall not otherwise be deemed filed under such Acts.
COMPARISON OF CUMULATIVE TOTAL RETURN
Among Talecris Biotherapeutics Holdings Corp, The NASDAQ Composite Index
And a Peer Group
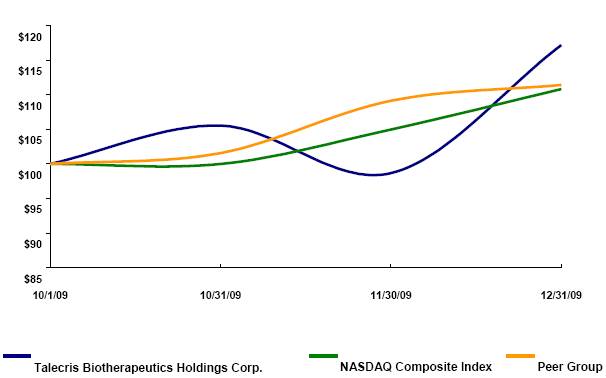
ITEM 6. SELECTED FINANCIAL DATA
The following is a summary of our historical consolidated financial data and the combined financial data for Bayer Plasma, our business predecessor, for the periods ended and at the dates indicated below. You are encouraged to read this information together with our audited consolidated financial statements and the related footnotes and “Management’s Discussion and Analysis of Financial Condition and Results of Operations” included elsewhere in this Annual Report.
The historical consolidated financial data for the years ended December 31, 2009, 2008, and 2007 and as of December 31, 2009 and 2008 has been derived from our audited consolidated financial statements, which are included elsewhere in this Annual Report. The historical consolidated financial data for the year ended December 31, 2006 and for the period from our inception through December 31, 2005 and as of December 31, 2007, 2006, and 2005 has been derived from our audited consolidated financial statements, which are not included in this Annual Report. The historical combined financial data of our Predecessor for the three months ended March 31, 2005 and as of March 31, 2005 has been derived from our Predecessor’s audited historical combined financial statements, which are not included in this Annual Report.
The historical combined financial statements of Bayer Plasma are presented on a carve-out basis from the historical financial statements of Bayer AG and its affiliates. As Predecessor, we participated in Bayer’s centralized cash management system and our net funding requirements were met by Bayer. We were not allocated interest costs from Bayer for use of these funds. The Predecessor’s combined results of operations include all net revenue and costs directly attributable to our operations as Bayer Plasma, including all costs for supporting functions and services used by us at shared sites and performed by centralized Bayer organizations, presented on a carve-out basis, prior to our March 31, 2005 formation transaction. In Predecessor periods, the expenses for these services were charged to us based on a determination of the services provided primarily using activity-based allocation methods based primarily on revenue, headcount, or square footage. In Predecessor periods, Bayer also provided certain manufacturing services to us for the production of certain products at established transfer prices, which have been included in cost of goods sold.
We believe that the comparability of our financial results between the periods presented in the table below is significantly impacted by the following items, many of which are more fully described in “Management’s Discussion and Analysis of Financial Condition and Results of Operations— Matters Affecting Comparability.”
· Financial impact related to our October 2009 IPO and refinancing transactions, including the repayment and termination of our First and Second Lien Term Loans; the issuance of our 7.75% Notes, the write-off of previously deferred debt issuance costs, and charges related to the settlement and termination of our interest rate swap contracts;
· Costs and non-operating income associated with our terminated merger agreement with CSL;
· Costs associated with our internal investigation into potential violations of the Foreign Corrupt Practices Act (FCPA);
· Costs associated with the development and vertical integration of our plasma collection center platform;
· Inventory impairment provisions, and subsequent recoveries, related to a plasma collection center cGMP issue;
· Inventory impairment provisions, and subsequent recoveries, related to a customer dispute settlement regarding intermediate material;
· Costs associated with share-based compensation awards and special recognition bonuses;
· Costs associated with transition-related activities to establish an independent company apart from Bayer;
· Non-operating income and costs related to a litigation settlement with Baxter;
· Tax benefit due to the release of our deferred tax asset valuation allowance; and
· The recognition of unallocated negative goodwill resulting from our formation transaction.
|
|
|
Predecessor |
|
Successor |
|
||||||||||||||
|
|
|
Three Months |
|
Nine Months |
|
|
|
|
|
|
|
|
|
||||||
|
|
|
Ended |
|
Ended |
|
|
|
|
|
|
|
|
|
||||||
|
|
|
March 31, |
|
December 31, |
|
Years Ended December 31, |
|
||||||||||||
|
|
|
2005 |
|
2005 |
|
2006 |
|
2007 |
|
2008 |
|
2009 |
|
||||||
|
|
|
(in thousands, except share and per share amounts) |
|
||||||||||||||||
|
Income Statement Data: |
|
|
|
|
|
|
|
|
|
|
|
|
|
||||||
|
Net revenue: |
|
|
|
|
|
|
|
|
|
|
|
|
|
||||||
|
Product |
|
$ |
245,500 |
|
$ |
654,939 |
|
$ |
1,114,489 |
|
$ |
1,196,686 |
|
$ |
1,334,550 |
|
$ |
1,507,754 |
|
|
Other |
|
— |
|
13,039 |
|
14,230 |
|
21,823 |
|
39,742 |
|
25,455 |
|
||||||
|
Total |
|
245,500 |
|
667,978 |
|
1,128,719 |
|
1,218,509 |
|
1,374,292 |
|
1,533,209 |
|
||||||
|
Cost of goods sold |
|
209,700 |
|
561,111 |
|
684,750 |
|
788,152 |
|
882,157 |
|
901,077 |
|
||||||
|
Gross profit |
|
35,800 |
|
106,867 |
|
443,969 |
|
430,357 |
|
492,135 |
|
632,132 |
|
||||||
|
Operating expenses: |
|
|
|
|
|
|
|
|
|
|
|
|
|
||||||
|
SG&A |
|
27,500 |
|
89,205 |
|
241,448 |
|
189,387 |
|
227,524 |
|
289,929 |
|
||||||
|
R&D |
|
14,800 |
|
37,149 |
|
66,801 |
|
61,336 |
|
66,006 |
|
71,223 |
|
||||||
|
Total |
|
42,300 |
|
126,354 |
|
308,249 |
|
250,723 |
|
293,530 |
|
361,152 |
|
||||||
|
(Loss) income from operations |
|
(6,500 |
) |
(19,487 |
) |
135,720 |
|
179,634 |
|
198,605 |
|
270,980 |
|
||||||
|
Other non-operating (expense) income: |
|
|
|
|
|
|
|
|
|
|
|
|
|
||||||
|
Interest expense, net |
|
— |
|
(21,224 |
) |
(40,867 |
) |
(110,236 |
) |
(96,640 |
) |
(74,491 |
) |
||||||
|
Merger termination fee |
|
— |
|
— |
|
— |
|
— |
|
— |
|
75,000 |
|
||||||
|
Equity in earnings of affiliate |
|
— |
|
197 |
|
684 |
|
436 |
|
426 |
|
441 |
|
||||||
|
Loss on extinguishment of debt |
|
— |
|
— |
|
(8,924 |
) |
— |
|
— |
|
(43,033 |
) |
||||||
|
Litigation settlement |
|
— |
|
— |
|
— |
|
12,937 |
|
— |
|
— |
|
||||||
|
(Loss) income before income taxes and extraordinary items |
|
(6,500 |
) |
(40,514 |
) |
86,613 |
|
82,771 |
|
102,391 |
|
228,897 |
|
||||||
|
(Provision) benefit for income taxes |
|
(5,100 |
) |
(2,251 |
) |
(2,222 |
) |
40,794 |
|
(36,594 |
) |
(75,008 |
) |
||||||
|
(Loss) income before extraordinary items |
|
(11,600 |
) |
(42,765 |
) |
84,391 |
|
123,565 |
|
65,797 |
|
153,889 |
|
||||||
|
Extraordinary items: |
|
|
|
|
|
|
|
|
|
|
|
|
|
||||||
|
Gain (loss) from unallocated negative goodwill |
|
— |
|
252,303 |
|
(306 |
) |
— |
|
— |
|
— |
|
||||||
|
Gain from settlement of contingent consideration due Bayer |
|
— |
|
13,200 |
|
3,300 |
|
— |
|
— |
|
— |
|
||||||
|
Net (loss) income |
|
$ |
(11,600 |
) |
$ |
222,738 |
|
$ |
87,385 |
|
$ |
123,565 |
|
$ |
65,797 |
|
$ |
153,889 |
|
|
|
|
|
|
|
|
|
|
|
|
|
|
|
|
||||||
|
(Loss) income before extraordinary items per common share: |
|
|
|
|
|
|
|
|
|
|
|
|
|
||||||
|
Basic |
|
$ |
(1.45 |
) |
$ |
(15.09 |
) |
$ |
(119.83 |
) |
$ |
65.58 |
|
$ |
39.01 |
|
$ |
4.56 |
|
|
Diluted |
|
$ |
(1.45 |
) |
$ |
(15.09 |
) |
$ |
(119.83 |
) |
$ |
1.36 |
|
$ |
0.71 |
|
$ |
1.50 |
|
|
|
|
|
|
|
|
|
|
|
|
|
|
|
|
||||||
|
Cash dividends declared per common share: |
|
|
|
|
|
|
|
|
|
|
|
|
|
||||||
|
Basic |
|
— |
|
$ |
8.37 |
|
$ |
132.82 |
|
— |
|
— |
|
— |
|
||||
|
Diluted |
|
— |
|
$ |
8.37 |
|
$ |
8.61 |
|
— |
|
— |
|
— |
|
||||
|
|
|
|
|
|
|
|
|
|
|
|
|
|
|
||||||
|
Weighted average common shares outstanding: |
|
|
|
|
|
|
|
|
|
|
|
|
|
||||||
|
Basic |
|
8,000,000 |
|
8,000,000 |
|
5,679,456 |
|
1,685,784 |
|
1,310,448 |
|
31,166,613 |
|
||||||
|
Diluted |
|
8,000,000 |
|
8,000,000 |
|
5,679,456 |
|
91,065,600 |
|
92,761,800 |
|
102,514,363 |
|
||||||
|
|
|
|
|
|
|
|
|
|
|
|
|
|
|
||||||
|
Balance Sheet Data (at period end): |
|
|
|
|
|
|
|
|
|
|
|
|
|
||||||
|
Cash and cash equivalents |
|
— |
|
$ |
10,887 |
|
$ |
11,042 |
|
$ |
73,467 |
|
$ |
16,979 |
|
$ |
65,239 |
|
|
|
Total assets |
|
$ |
1,040,800 |
|
$ |
705,249 |
|
$ |
903,474 |
|
$ |
1,142,322 |
|
$ |
1,307,399 |
|
$ |
1,445,005 |
|
|
Long-term debt and capital lease obligations |
|
— |
|
$ |
250,366 |
|
$ |
1,102,920 |
|
$ |
1,129,692 |
|
$ |
1,194,205 |
|
$ |
605,267 |
|
|
|
Redeemable preferred stock |
|
— |
|
$ |
20,631 |
|
$ |
110,535 |
|
$ |
110,535 |
|
$ |
110,535 |
|
|
— |
|
|
|
Total parent’s net investment/stockholders’ equity (deficit) |
|
$ |
943,600 |
|
$ |
152,835 |
|
$ |
(528,980 |
) |
$ |
(390,757 |
) |
$ |
(316,725 |
) |
$ |
582,154 |
|
|
|
|
|
|
|
|
|
|
|
|
|
|
|
|
||||||
|
Other Financial Data and Ratios (unaudited): |
|
|
|
|
|
|
|
|
|
|
|
|
|
||||||
|
Liters of plasma fractionated |
|
905 |
|
2,493 |
|
2,983 |
|
2,650 |
|
3,240 |
|
3,569 |
|
||||||
|
Gross margin |
|
14.6 |
% |
16.0 |
% |
39.3 |
% |
35.3 |
% |
35.8 |
% |
41.2 |
% |
||||||
|
Operating margin |
|
(2.6 |
)% |
(2.9 |
)% |
12.0 |
% |
14.7 |
% |
14.5 |
% |
17.7 |
% |
||||||
ITEM 7. MANAGEMENT’S DISCUSSION AND ANALYSIS OF FINANCIAL CONDITION AND RESULTS OF OPERATIONS
You are encouraged to read the following discussion and analysis of our financial condition and results of operations together with our audited consolidated financial statements and related footnotes included at the end of this Annual Report. This discussion and analysis contains forward-looking statements that involve risks and uncertainties. See “Risk Factors” included elsewhere in this Annual Report for a discussion of some of the important factors that could cause actual results to differ materially from those described or implied by the forward-looking statements contained in the following discussion and analysis. See “Special Note Regarding Forward-Looking Statements” included elsewhere in this Annual Report.
All tabular disclosures of dollar amounts are presented in thousands. Percentages and amounts presented herein may not calculate or sum precisely due to rounding.
A seven-for-one share dividend on our common stock was paid on September 10, 2009. All share and per-share amounts have been retroactively adjusted for all periods to reflect the share dividend.
BUSINESS OVERVIEW
We are a biopharmaceutical company that develops, produces, markets, and distributes protein-based therapies that extend and enhance the lives of people suffering from chronic and acute, often life-threatening, conditions, such as primary immune deficiencies, CIDP, alpha-1 antitrypsin deficiency, bleeding disorders, and severe trauma. Our primary products have orphan drug designation to serve populations with rare, chronic diseases. We are one of the largest producers and marketers in our industry. Our products are derived from human plasma, the liquid component of blood, which is sourced from our plasma collection centers, or purchased from third parties, located in the United States. Plasma contains many therapeutic proteins, which we extract through a process known as fractionation at our Clayton, North Carolina and/or Melville, New York facilities. The fractionated intermediates are then purified, formulated into a final bulk, and aseptically filled into final containers for distribution. We also sell the fractionated intermediate materials. Our manufacturing facilities currently have the capacity to fractionate approximately 4.2 million liters of human plasma per year. We processed approximately 3.6 million liters of plasma in 2009, which represents a utilization rate of approximately 85% of our fractionation capacity. We anticipate that we will reach our fractionation capacity in the near term depending upon the demand for our products, the availability of source plasma and the impact of variability in yield among other factors. We plan to utilize available fractionation capacity in the near term, which will result in increased inventory levels in order to maintain pace with projected growth in product demand. Purification, filling, and finishing capacities are dependent on fraction mix. We operate in an industry that has experienced volume demand growth for plasma-derived therapies, both in the United States and worldwide, for more than twenty years, as well as industry consolidation. We believe worldwide unit volume demand for plasma-derived products, including IGIV, will grow over the long-term at a compound annual rate of approximately 6% to 8%.
We have devoted significant resources on the development of our plasma collection center platform, which has included organic growth, the acquisition of plasma collection centers from IBR, and third-party plasma center development agreements, primarily with IBR, under which we provided financing for the development of plasma collection centers that are dedicated to our plasma collection. As of December 31, 2009, our integrated plasma collection center platform consisted of 69 operating centers, of which 64 were licensed and 5 were unlicensed. These centers collected approximately 62% of our plasma during the year ended December 31, 2009. Our plan is for our plasma collection center network, once it fully matures, to provide greater than 90% of our current plasma requirements. We will need to significantly increase the production in our internal plasma collection center platform over the next few years to offset the anticipated decrease in plasma supplied by third parties and planned increases in our fractionation. CSL Plasma, Inc, a subsidiary of CSL Limited (CSL) which is one of our major competitors, is currently our largest third party plasma supplier. Our minimum purchase commitments under that supply agreement decline from 550,000 liters in 2010 to 200,000 liters in 2013, the final year of the agreement. We have the ability to obtain additional annual volumes above the minimum purchase commitments under the terms of the agreement, which provides us additional flexibility as we increase internal production. The successful development and operation of our plasma collection center network depends on a number of factors, including our ability to obtain and maintain center licensure by the U.S. FDA and foreign regulatory authorities, which is required in order to release collected plasma into our manufacturing process.
We have historically experienced higher costs of production as a result of higher costs of raw materials, particularly plasma, due to limited third-party supply and the development and remediation of our internal plasma collection platform. The development of Talecris Plasma Resources, Inc. (TPR) has also resulted in excess period costs charged directly to cost of goods sold. These excess period costs reflect the under-absorption that results from lower plasma collections at newly opened centers as they scale operations and the larger TPR infrastructure necessary to support the development of our plasma collection platform. We have reduced and plan to continue to reduce both the collection cost per liter and the amount of excess period costs charged directly to cost of goods sold as TPR matures. Decreasing collection costs of our raw plasma and the planned reduction of excess period costs combined with leveraging our manufacturing facilities as a result of higher volumes have contributed and will continue, over the long term, to
contribute to improving gross margin. Our cost of goods sold reflects $44.0 million, $98.5 million, and $70.1 million for the years ended December 31, 2009, 2008, and 2007, respectively, related to excess period costs associated with TPR.
Our U.S. sales force is comprised of three specialty teams focused on Immunology/Neurology for the promotion of Gamunex for use in PI, ITP and CIDP; Pulmonary for the promotion of Prolastin and Prolastin-C with an emphasis on patient identification; and Hematology/Specialty which promotes Koate, Thrombate III and our hyperimmune products. In addition to this direct sales force, we also have a managed markets sales team that manages relationships and contracting efforts with GPO’s, distributors, home healthcare and specialty pharmacy providers and private commercial payors. In addition to our U.S. operations, we have sales and marketing operations located in Germany, Canada as well as a team dedicated to the development of other international markets. We believe that we are well positioned in the IGIV market given the features and benefits of Gamunex including that it is a sugar-free, 10% liquid that is produced with a patented caprylate process. As a result of eliminating our plasma supply constraints, the attributes of Gamunex and its approval for CIDP have resulted in significant increases in our share of sales. Our unique Prolastin direct to patient distribution model in the U.S. provides a high degree of patient loyalty and compliance. Internationally, Prolastin is the only A1PI product licensed in Canada and is the only A1PI product that has completed the European Mutual Recognition Process, which has resulted in licensure in 15 countries and we are currently established in six of these markets. These factors underpin our success in sustaining a 76% share of sales of the world wide A1PI market for 2007 according to MRB.
As a result of our past and ongoing investment in research and development (R&D), we believe that we are positioned to continue as a leader in the plasma-derived therapies industry. We have a strong commitment to science and technology with a track record of accomplishments and pipeline opportunities. We focus our R&D efforts in three key areas: continued enhancement of our process technologies (including pathogen safety), life cycle management for our existing products (including new indications), and the development of new products.
The successful development of our plasma collection platform, as well as our plasma supply agreement with CSL, have provided increasing levels of plasma liters which has yielded additional volume of plasma-derived therapies as well as operational efficiencies. Although in the near term, we plan to continue to increase the volume of liters fractionated and the production of our plasma-derived therapies, particularly Gamunex IGIV, we will continue to encounter manufacturing capacity constraints for plasma-derived Factor VIII and albumin. Consequently, as we increase production of Gamunex IGIV, we expect to be less efficient in the utilization of each incremental liter fractionated, which will negatively impact gross margin. In response to our capacity constraints, we expect to increase our capital spending to a currently estimated $750 million to $800 million over the next five years on a cumulative basis. Additional information regarding the nature of our currently planned capital projects is included in “Management’s Discussion and Analysis of Financial Condition and Results of Operations—Liquidity and Capital Resources.”
2009 HIGHLIGHTS
Our 2009 financial and business highlights are included below.
Financial Highlights
· Total net revenue increased 11.6% for the year ended December 31, 2009 to $1.533 billion as compared to $1.374 billion for the year ended December 31, 2008.
· Gross margin improved 540 basis points to 41.2% for the year ended December 31, 2009 as compared to 35.8% for the year ended December 31, 2008.
· Operating margin improved 320 basis points to 17.7% for the year ended December 31, 2009 as compared to 14.5% for the year ended December 31, 2008.
· Net income, inclusive of the $48.8 million after-tax income from the CSL merger termination fee and the $26.3 million after-tax charges incurred as a result of our refinancing transactions, increased 133.9% for the year ended December 31, 2009 to $153.9 million as compared to $65.8 million for the year ended December 31, 2008.
· Diluted earnings per share, inclusive of the CSL merger termination fee and the charges related to our refinancing transactions, were $1.50 for the year ended December 31, 2009 as compared to $0.71 for the year ended December 31, 2008.
· Operating cash flows, inclusive of the CSL merger termination fee and the charges related to our refinancing transactions, were $234.2 million for the year ended December 31, 2009, reflecting an improvement of $201.1 million over 2008.
Our U.S. GAAP financial results for the year ended December 31, 2009 include the impact of the CSL merger termination fee and charges related to our refinancing transactions. These items impact our U.S. GAAP financial results for the year ended December 31, 2009 as follows:
|
|
|
|
|
Income Tax |
|
|
|
Diluted Earnings |
|
||||
|
|
|
Pre-Tax |
|
Expense |
|
|
|
Per |
|
||||
|
|
|
Amount |
|
(Benefit) |
|
Net Income |
|
Common Share |
|
||||
|
U.S. GAAP |
|
$ |
228,897 |
|
$ |
75,008 |
|
$ |
153,889 |
|
$ |
1.50 |
|
|
Less specific items: |
|
|
|
|
|
|
|
|
|
||||
|
Merger termination fee |
|
(75,000 |
) |
26,250 |
|
(48,750 |
) |
|
(0.48 |
) |
|||
|
Write off of deferred debt issuance costs |
|
12,141 |
|
(4,711 |
) |
7,430 |
|
|
0.07 |
|
|||
|
Loss on extinguishment of interest rate swap contracts |
|
30,892 |
|
(11,986 |
) |
18,906 |
|
|
0.19 |
|
|||
|
Excluding specific items |
|
$ |
196,930 |
|
$ |
84,561 |
|
$ |
131,475 |
|
$ |
1.28 |
|
We believe that a meaningful analysis of our financial results for the year ended December 31, 2009 is enhanced by the use of non-GAAP net income and diluted earnings per share. The section titled “Non-GAAP Financial Measure” includes additional information regarding the use of non-GAAP financial measures and their limitations.
Initial Public Offering and Refinancing Highlights
· On October 6, 2009, we completed our initial public offering (IPO) of 56,000,000 shares of our common stock at an offering price of $19.00 per share for an aggregate offering of $1.064 billion. We received net proceeds of $519.7 million from the issuance of 28,947,368 new shares of common stock. These proceeds were used to repay principal under our then existing First and Second Lien Term Loans. We did not receive any proceeds from the selling stockholders’ sale of 27,052,632 shares of common stock in the offering.
· On October 15, 2009, we amended certain provisions under our Revolving Credit Facility, including increasing our capital expenditure baskets so that we will be permitted to make capital expenditures of up to $225 million in each of 2010 and 2011. Additionally, the amendment provided that the capital expenditure covenant is not applicable as long as our leverage ratio is less than or equal to 2.00 to 1.00. The amendment also provides that we will maintain minimum availability of $48.75 million.
· In October 2009, our corporate family credit ratings were increased to BB (Stable Outlook) by Standard and Poor’s and to Ba3 (Stable Outlook) by Moody’s Investor Services.
· On October 21, 2009, we completed the issuance of $600.0 million, 7.75% Senior Unsecured Notes, due November 15, 2016 at a price of 99.321% of par, in a private placement to certain qualified institutional buyers. We used the net proceeds to us of $583.9 million to repay principal and interest amounts of $499.6 million under our First and Second Lien Term Loans, which were subsequently terminated, $55.6 million to repay principal under our Revolving Credit Facility, and $28.7 million to settle and terminate certain interest rate swap contracts with a notional amount of $390.0 million. We also expensed the remaining balance of $12.1 million in deferred financing charges related to the First and Second Lien Term Loans. Subsequently, we settled and terminated our remaining interest rate swap contract with a notional amount of $50.0 million for $6.1 million.
· As of December 31, 2009, Talecris Holdings, LLC held approximately 50.1% of our outstanding common stock. Talecris Holdings, LLC is owned by (i) Cerberus-Plasma Holdings LLC, the managing member of which is Cerberus Partners, L.P., and (ii) limited partnerships affiliated with Ampersand Ventures. Substantially all rights of management and control of Talecris Holdings, LLC are held by Cerberus-Plasma Holdings LLC. Subsequent to December 31, 2009, the ownership of our outstanding common stock by Talecris Holdings, LLC was diluted below 50%.
Other Business Highlights
· In June 2009, we and CSL agreed to terminate the definitive merger agreement entered into on August 12, 2008, under which CSL agreed to acquire us for cash consideration of $3.1 billion, less net debt, as defined. The closing of the transaction was subject to the receipt of certain regulatory approvals as well as other customary conditions. The U.S. Federal Trade Commission filed an administrative complaint before the Commission challenging the merger and a complaint in Federal district court seeking to enjoin the merger during the administrative process. CSL paid us a merger termination fee of $75.0 million (after tax amount of $48.8 million), which is included as other non-operating income in
our consolidated income statement for the year ended December 31, 2009. The U.S. Federal Trade Commission’s complaints were subsequently dismissed.
· In June 2009, the Paul-Ehrlich Institute approved the inclusion of chronic inflammatory demyelinating polyneuropathy (CIDP) as a new indication for our Gamunex IGIV product. According to European Union regulations, this approval has been agreed upon by all of the Concerned Member States through a Mutual Recognition Procedure (MRP), resulting in approval of the CIDP indication in 17 European countries (16 through the MRP process and 1 (Switzerland) through a National License). We began CIDP marketing activities in two European countries in 2009 and we expect to launch marketing activities in an additional three European countries in 2010.
· In June 2009, we were granted orphan drug designation by the U.S. Food and Drug Administration (FDA) for the development of Plasmin (Human) to treat acute peripheral arterial occlusion (aPAO). We are currently investigating Plasmin in a Phase I clinical trial designed to assess its ability to treat aPAO, a condition in which arterial blood flow to the extremities, usually the legs, is blocked by a clot. We are currently in our seventh and last dosing cohort in Phase I and have begun to design a Phase II trial. Our goal is to commence this trial during 2010. In October 2009, we received approval from the Paul Ehrlich Institute to proceed with a proof of concept trial for Plasmin to treat ischemic stroke in Germany, adding to our approval in Australia, Canada, France, Spain and the United Kingdom.
· In October 2009, we received U.S. FDA approval for our next generation A1PI product, Prolastin-C. A post-approval clinical trial was required as a condition for approval. We also submitted a supplemental New Drug Submission (sNDS) to Health Canada for the approval of Prolastin-C A1PI in March 2009 and Prolastin-C A1PI was approved for use in Canada in February 2010. Presently, additional clinical trials are being required by European authorities as a precursor to Prolastin-C A1PI approval in Europe. We are currently in the process of launching Prolastin-C A1PI in the U.S. and Canada. Prolastin-C A1PI is a new concentrated version of our Prolastin A1PI product, which has improved yields and higher concentration. As a result, the infusion time for patients will be significantly reduced. The manufacturing process for Prolastin-C A1PI incorporates technological advances such as nanofiltration, a virus exclusion technology, and cation exchange chromatography, an additional purification step. The manufacturing technological advances contributed to a yield improvement of approximately 40%. Commercial production of Prolastin-C A1PI at our Clayton manufacturing facilities began in 2009 in support of the 2010 launch.
· During the fourth quarter of 2009, we completed the acquisition of the remaining two plasma collection centers under our center development agreement with International BioResources, L.L.C. and affiliated entities (IBR), completing a significant milestone in our plasma platform development, which began in 2006.
· In February 2010, we were granted orphan drug designation by the U.S. FDA for the development of an aerosol formulation of A1PI to treat congenital alpha 1- antitrypsin (AAT) deficiency. AAT deficiency is a chronic, hereditary condition that increases the risk of certain diseases, particularly emphysema. Currently, there are no approved, inhaled treatments available for the treatment of AAT. We received a similar orphan drug designation for the aerosolized form of A1PI from the European Commission in June of 2008.
BUSINESS STRATEGY
Our business strategy is summarized as follows:
Achieve Cost Efficiencies in Our Plasma Collection Platform
In 2006, we made the strategic decision to vertically integrate our plasma supply chain in order to enhance the predictability, sustainability, and profitability of our plasma supply. Our rapid vertical integration of our plasma supply was accomplished through the development of an extensive infrastructure to manage the multiple work streams necessary to accomplish the development of our current plasma collection platform. The infrastructure necessary to integrate the centers we acquired from IBR in November 2006 and to open new centers which formed our sixty-nine center system included third party consultants as well as additional management. Given that it generally takes three to four years to mature a plasma center, many of our centers are immature. We have eliminated the third party consultants used to develop the platform and reduced the management necessary to drive the platform development resulting in a significant reduction in cost. Additionally, as we increase the utilization of the platform, we achieve economies of scale that result in lower cost per liter. These factors will lead to improving cost per liter of plasma collected and the elimination of unabsorbed TPR infrastructure and start-up costs charged directly to cost of goods sold. Consequently, we expect that the improvement in our plasma collection costs will provide a near-term gross margin improvement opportunity.
Improve Operating Leverage through Increased Recovery of Plasma Proteins
We seek to improve our profitability by capitalizing on the operating leverage in our business model. A significant portion of our cost structure, other than raw materials, is relatively fixed and therefore incremental volume contributes significant additional profit. Our capital expenditure plan is designed, in part, to facilitate the production of an increasing volume of existing and new products from each liter of plasma. We currently have purification capacity constraints related to the production of albumin and Koate, our plasma-derived Factor VIII product. We also expect to be less efficient in the utilization of each incremental liter of plasma fractionated as we increase Gamunex production, which will result in gross margin erosion. Additionally, we anticipate that we will reach our fractionation capacity in the near future. Consequently, we have embarked on a capital expenditure plan which we currently estimate will be in the range of $750 million to $800 million through 2014. Key elements of this plan include a new fractionation facility currently estimated to range from $280 million to $300 million, based on conceptual engineering, to expand our fractionation capacity from 4.2 million liters to 6.0 million liters. This 43% capacity expansion will allow us to keep pace with expected demand growth for plasma-derived products and will provide a balance with our Gamunex purification capacity. We also plan to expand albumin and Koate purification capacities. We are targeting 2015 for commercial production from our new fractionation facility, with additional albumin and Koate purification capacities available in the next five to six years. This capacity expansion will allow us to improve the utilization of the proteins in each liter of plasma which should result in additional margin improvement opportunities once completed.
Enhance Growth through New Plasma-Derived and Recombinant Proteins
We continue to pursue growth through our internal development capabilities and in-licensing of new technologies and products. Increases in our research and development spending will be driven by our emphasis on new plasma-derived molecules as well as the development of our recombinant capabilities in addition to our life cycle management activities, particularly as they relate to A1PI. We believe that our plasma-derived and recombinant Plasmin therapies hold particular promise. Plasmin is a natural protein that dissolves blood clots for which we are pursuing two versions. We are developing a plasma-derived molecule, which is in a Phase I clinical trial for aPAO and a commercial process to produce a recombinant form to treat ischemic stroke. Additionally, we are developing recombinant versions of Factor VIII and A1PI through the use of human cell lines. If successful, the development of these therapies could significantly improve our revenue and profitability. In addition, our external business development will focus on proteins where we have synergies or core competencies in research, manufacturing and/or marketing.
Broaden Geographic Reach
During 2009, approximately 80% of our net revenue was generated in North America; whereas North America represented only approximately 40% of global plasma product sales in 2007, according to MRB. Although our business is concentrated in North America, we see significant opportunities to broaden our geographic reach in Europe as well as the rest of the world. In terms of A1PI, there are a number of European countries with registries of identified A1PI patients whose healthcare systems currently do not provide for reimbursement for the use of A1PI therapy. We hope to obtain reimbursement for these patients as we engage with the respective governmental healthcare organizations, patient advocacy groups and supporting physicians and scientists. We also believe that the approval for the CIDP indication in 17 European countries will facilitate Gamunex market expansion. Additionally, we believe that the demand for plasma-derived therapies, particularly IGIV, Factor VIII and albumin are increasing internationally with improving socio-economic conditions and medical education regarding the benefits of plasma-derived therapies. Until our facilities are expanded as described above, significant growth in our international distribution will be limited and our focus will be on developing channels and relationships.
PRINCIPAL PRODUCTS
The majority of our sales are concentrated in the therapeutic areas of: Immunology/Neurology, primarily through our intravenous immune globulin (IGIV) product for the treatment of primary immune deficiency and autoimmune diseases, as well as CIDP, and Pulmonology, through our alpha-1 proteinase inhibitor (A1PI) product for the treatment of alpha-1 antitrypsin deficiency-related emphysema. These therapeutic areas are served by our products, Gamunex IGIV (Gamunex or Gamunex IGIV) and Prolastin A1PI (Prolastin or Prolastin A1PI) and our recently approved next generation A1PI product, Prolastin-C. Sales of Gamunex and Prolastin together comprised 74.7%, 72.3%, and 75.8% of our net revenue for the years ended December 31, 2009, 2008, and 2007, respectively. We have contracted commitments from our customers for a substantial portion of our U.S. IGIV volume over the next three years. We are also the primary supplier of Canadian IGIV under our contracts with the Canadian Blood Services (CBS) and Hema Quebec. We also have a line of hyperimmune therapies that provide treatment for tetanus, rabies, hepatitis B, hepatitis A, and Rh factor control during pregnancy and at birth. In addition, we provide plasma-derived therapies for critical care/hemostasis including the treatment of hemophilia, an anti-coagulation factor, as well as albumin to expand blood volume. Although we sell our products worldwide, the majority of our sales were concentrated in the United States and Canada for the periods presented. Information regarding our largest two products is included below. Additional information regarding our product portfolio is included in “Business—Products.” Additional information regarding recent regulatory activities with respect to our products and product candidates is included in “Management’s Discussion and Analysis of Financial Condition and Results of Operations—2009 Highlights—Other Business Highlights.”
Gamunex IGIV
In 2003, we became the first producer to commercialize a high concentration 10% caprylate/chromatography purified liquid version of IGIV through our Gamunex product. We use a patented caprylate purification process in the production of Gamunex, which results in higher yields of the fragile IgG proteins compared to harsher purification processes. The caprylate process maintains the integrity of the IgG protein by allowing it to remain in solution during processing, maximizing the biologic integrity and purity. Gamunex is a ready-to-use, sugar-free 10% liquid, which simplifies infusions by eliminating the need for time-consuming reconstitution processes necessary with lyophilized products. Gamunex IGIV is the only IGIV product approved for CIDP in the U.S., Canada, and 17 countries in the European Union. As such, Gamunex is the only IGIV approved for any indication in neurology in North America. Further, the U.S. FDA granted Gamunex IGIV orphan drug status, which provides marketing exclusivity for the CIDP indication in the U.S. until September of 2015. We expect a number of competitors to launch 10% liquid IGIV products for other indications in the near term.
We believe it is our comprehensive set of features, together with our history as the first producer of a ready-to-use liquid IGIV product in North America and our reputation for quality and innovation, that has resulted in a high level of brand recognition among prescribing physicians and the patient community and has contributed to us maintaining a leading position in sales of IGIV in the industry. We have contracted commitments from our customers for a substantial portion of our U.S. IGIV volume over the next three years. We are also the primary supplier of Canadian IGIV under our five year contracts with CBS and Hema Quebec, which became effective April 1, 2008. We anticipate annual volume declines in Canada due to CBS’ objective to have multiple sources of supply. We expect to offset the volume decline with increased sales in Europe as well as in other international markets. We have also filed a supplemental Biologics License Application with the FDA for a subcutaneous version of Gamunex which we expect to receive approval in 2010.
Prolastin A1PI
Our Prolastin A1PI was the first A1PI product licensed and, consequently, has benefited from a first-mover advantage in the industry. Prolastin A1PI was the only A1PI licensed product until 2003, when two competitors launched competing products in the U.S. Our Prolastin A1PI product continues to maintain the leading share of sales in North America and Europe as a result of its first-mover advantage, as well as strong relationships with the primary patient advocacy groups and our unique direct-to-patient distribution and service model, Prolastin Direct, which provides easy enrollment, home infusion, access to insurance experts, and patient-centered health management. Our Prolastin Direct program with its emphasis on patient-centered health management has resulted in very high patient loyalty and patient compliance rates. New A1PI patient identification, as well as reimbursement approval in Europe, are important elements in growing our Prolastin A1PI franchise. As discussed above, we expect to launch our next generation A1PI product, Prolastin-C in the U.S. and Canada in the first half of 2010. We received FDA approval for our next generation A1PI product, Prolastin-C in October 2009 and received Health Canada approval in February 2010. Additional clinical trials are being required by the European authorities as a precursor to Prolastin-C A1PI approval in Europe.
CUSTOMER CONCENTRATIONS
For the year ended December 31, 2009, our top three customers accounted for approximately 36% of our net revenue. Similarly, our accounts receivable have also been concentrated with a small number of customers. In the event that any of these customers were to suffer an adverse downturn in their business or a downturn in their supply needs, our business could be materially adversely affected. Additional information regarding customer concentrations is included in “Risk Factors—Risks Related to Our Business—A substantial portion of our revenue is derived from a small number of customers, and the loss of one or more of these customers could have a material adverse effect on us.”
RESEARCH AND DEVELOPMENT
Our R&D expenses include the costs directly attributable to the conduct of research and development programs for new products and extensions or improvements of existing products and the related manufacturing processes. Such costs include salaries and related employee benefit costs, payroll taxes, materials (including the material required for clinical trials), supplies, depreciation on and maintenance of R&D equipment, services provided by outside contractors for clinical development and clinical trials, regulatory services, and fees. R&D also includes the allocable portion of facility costs such as rent, depreciation, utilities, insurance, and general support services. All costs associated with R&D activities are expensed as incurred. As of December 31, 2009, we had approximately 300 scientists and support staff engaged in research and development activities.
We continue to invest in R&D to provide future sources of revenue through the development of new products, as well as through additional uses for existing products. We have a strong commitment to science and technology with a track record of accomplishments and pipeline opportunities. We focus our R&D efforts in three key areas: continued enhancement of our process
technologies (including pathogen safety), life cycle management for our existing products (including new indications), and the development of new products. We expect overall R&D spending to increase in subsequent periods due to life cycle management, new product projects, and licensure of technology or products.
The following table summarizes our significant R&D projects and expenses for the periods presented:
|
|
|
Years Ended December 31, |
|
|||||||
|
|
|
2009 |
|
2008 |
|
2007 |
|
|||
|
Life Cycle Management |
|
|
|
|
|
|
|
|||
|
Gamunex IGIV CIDP |
|
$ |
200 |
|
$ |
600 |
|
$ |
1,100 |
|
|
Prolastin-C A1PI |
|
$ |
2,200 |
|
$ |
3,900 |
|
$ |
6,500 |
|
|
Prolastin Alpha-1 Aerosol |
|
$ |
8,900 |
|
$ |
6,100 |
|
$ |
5,700 |
|
|
Gamunex subcutaneous administration |
|
$ |
1,400 |
|
$ |
3,300 |
|
$ |
5,700 |
|
|
|
|
|
|
|
|
|
|
|||
|
New Product Candidates |
|
|
|
|
|
|
|
|||
|
Plasmin and recombinant Plasmin |
|
$ |
25,500 |
|
$ |
18,500 |
|
$ |
13,200 |
|
|
Other recombinant product candidates |
|
$ |
4,700 |
|
$ |
4,000 |
|
$ |
— |
|
Additional information regarding the status of our life cycle management activities and new product candidates is included in “Business—Research and Development.”
The risks and uncertainties associated with failing to complete development on schedule and the consequences to operations, financial position, and liquidity if a project is not completed timely are not expected to be material in the near term. We may reallocate our spending between product life cycle management and new product development as opportunities are assessed. We are unable to estimate the nature, timing, or costs to complete, if ever, of our projects due to the numerous risks and uncertainties associated with developing therapeutic protein products. These risks and uncertainties are described below as well as in the “Risk Factors” section of this Annual Report.
Before obtaining regulatory approval for the sale of our product candidates, we must conduct extensive preclinical testing to demonstrate the safety of our product candidates in animals and clinical trials to demonstrate the safety and efficacy of our product candidates in humans. Similar trials are required prior to marketing existing products for new indicated uses. Preclinical and clinical testing is expensive, difficult to design and implement, can take many years to complete and are uncertain as to the outcome. A failure of one or more of our clinical trials can occur in any stage of testing. We may experience events during, or as a result of, preclinical testing and the clinical trial process that could delay or prevent our ability to receive regulatory approval or commercialization of our product candidates or cause higher than expected expenses, many of which are beyond our control. There are many factors that could delay or prevent regulatory approval or commercialization of our product candidates. We have included these risk factors elsewhere in this Annual Report in the section titled, “Risk Factors—Risks Related to Our Business—We may not be able to commercialize products in development.”
Our product development costs will also increase if we experience delays in testing or approvals. We do not know whether any preclinical tests or clinical trials will begin as planned, will need to be restructured, or will be completed on schedule, if at all. Significant preclinical or clinical trial delays also could shorten the patent protection period during which we may have the exclusive right to commercialize our product candidates or allow our competitors to bring products to market before we do and impair our ability to commercialize our products or product candidates.
Even if clinical trials are successful, we may still be unable to commercialize the product due to difficulties in obtaining regulatory approval for the process or problems in scaling to commercial production. Additionally, if produced, the product may not achieve the level of acceptance by physicians, patients, healthcare payors, and others in the medical community to be profitable. The degree of acceptance of our product candidates, if approved for commercial sale, will depend on a number of factors, some of which are beyond our control. Additionally, even once approved, we may need to conduct post-marketing clinical trials, the failure of which may result in loss of acceptance.
BASIS OF PRESENTATION
Our consolidated financial statements include the accounts of Talecris Biotherapeutics Holdings Corp. and its wholly-owned subsidiaries. All significant intercompany transactions and balances have been eliminated upon consolidation. The effects of business acquisitions have been included in our consolidated financial statements from their respective date of acquisition.
The comparability of our financial results is impacted by significant events and transactions during the periods presented as described in “Management’s Discussion and Analysis of Financial Condition and Results of Operations—Matters Affecting Comparability.”
CRITICAL ACCOUNTING POLICIES AND ESTIMATES
The preparation of consolidated financial statements in accordance with accounting principles generally accepted in the United States of America (U.S. GAAP) requires us to make estimates and judgments in certain circumstances that affect the reported amounts of assets, liabilities, revenue and expenses, and the related disclosures of contingent assets and liabilities. A detailed description of our significant accounting policies is included in the footnotes to our audited consolidated financial statements included elsewhere in this Annual Report.
We believe that certain of our accounting policies are critical because they are the most important to the preparation of our consolidated financial statements. These policies require our most subjective and complex judgments, often requiring the use of estimates about the effects of matters that are inherently uncertain. We apply estimation methodologies consistently from year to year. Other than changes required due to the issuance of new accounting guidance, there have been no significant changes in our application of our critical accounting policies during 2009. We periodically review our critical accounting policies and estimates with the audit committee of our board of directors. The following is a summary of accounting policies that we consider critical to our consolidated financial statements.
Revenue Recognition and Gross-to-Net Revenue Adjustments
We recognize revenue when earned, which is generally at the time of delivery to the customer. Recognition of revenue also requires reasonable assurance of collection of sales proceeds, a fixed and determinable price, persuasive evidence that an arrangement exists, and completion of all other performance obligations. The recognition of revenue is deferred if there are significant post-delivery obligations, such as customer acceptance.
Allowances against revenues for estimated discounts, rebates, administrative fees, chargebacks, shelf-stock adjustments, and other items are established by us concurrently with the recognition of revenue. The standard terms and conditions under which products are shipped to our customers generally do not allow a right of return. In the rare instances in which we grant a right of return, revenue is reduced at the time of sale to reflect expected returns and deferred until all conditions of revenue recognition are met.
We have supply agreements with our major distributors, which require them to purchase minimum quantities of our products. We regularly review the supply levels of our products on hand at major distributors, primarily by analyzing inventory reports supplied by these distributors, available data regarding the sell-through of our products, our internal data, and other available information. When we believe distributor inventory levels have increased relative to underlying demand, we evaluate the need for sales return allowances. Factors that influence the allowance include historical sales return activity, levels of inventory in the distribution network, inventory turnover, demand history, demand projections, estimated product shelf-life, pricing, and competition. Sales returns have not been significant during the periods presented.
We have agreed to reimburse certain of our international distributors for their selling, general, and administrative expenses (SG&A) under the terms of our distribution agreements. We have reflected these charges as a reduction of net revenue.
Revenue from milestone payments for which we have no continuing performance obligations is recognized upon achievement of the related milestone. When we have continuing performance obligations, the milestone payments are deferred and recognized as revenue over the term of the arrangement as we complete our performance obligations.
We evaluate revenue from agreements that have multiple elements to determine whether the components of the arrangement represent separate units of accounting. In transactions that contain multiple elements, we recognize revenue as each product is delivered or service is provided to the customer. We allocate the total arrangement consideration to each element based on its relative fair value, based on the price for the product or service when it is sold separately.
Gross product sales are subject to a variety of deductions that are generally estimated and recorded in the same period that the revenues are recognized, and primarily represent rebates to government agencies, chargebacks to wholesalers and distributors, and customer prompt pay discounts. These gross-to-net revenue adjustments are described below.
We offer rebates to some classes of trade, which we account for by establishing an accrual at the time the sale is recorded in an amount equal to our estimate of rebates attributable to each sale. We determine our estimate of the rebates primarily based on historical experience and current contract arrangements. We consider the sales performance of products subject to rebates and the levels of inventory in the distribution channel and adjust the accrual periodically to reflect actual experience. For the portion of these
rebates that is settled as part of the product sale, there is no lag in the recognition of the rebate. The portion which is accrued upon sale is settled upon resale by our distributors. Due to the limited classes of trade that participate in rebate programs and our visibility of inventories in the channel, adjustments for actual experience have not been material.
We participate in state government-managed Medicaid programs. We account for Medicaid rebates by establishing an accrual at the time the sale is recorded in an amount equal to our estimate of the Medicaid rebate claims attributable to such sale. We determine our estimate of the Medicaid rebates accrual primarily based on historical experience regarding Medicaid rebates, legal interpretations of the applicable laws related to the Medicaid program and any new information regarding changes in the Medicaid programs’ regulations and guidelines that would impact the amount of the rebates. We consider outstanding Medicaid claims, Medicaid payments, and levels of inventory in the distribution channel and adjust the accrual periodically to reflect actual experience. While these rebate payments to the states generally occur on a one to two quarter lag, any adjustments for actual experience has not been material as Medicaid rebates on our product sales under the state Medicaid programs represents only one half of one percent of gross product revenues. The increase in the 2009 provision for rebates and other was primarily due to GPO fees, Medicaid rebates, and the potential Canadian pricing adjustment, among others.
As of December 31, 2009, our allowance for managed health care and Medicaid rebates and other items was $26.4 million. A hypothetical 10% change in payments made for managed health care and Medicaid rebates for the year ended December 31, 2009 would not have a material impact to our consolidated results of operations.
We enter into agreements with certain customers to establish contract pricing for our products, which these entities purchase from the authorized wholesaler or distributor (collectively, wholesalers) of their choice. Consequently, when our products are purchased from wholesalers by these entities at the contract price which is less than the price charged by us to the wholesaler, we provide the wholesaler with a credit referred to as a chargeback. We record the chargeback accrual at the time of the sale. The allowance for chargebacks is based on our estimate of the wholesaler inventory levels, and the expected sell-through of our products by the wholesalers at the contract price based on historical chargeback experience and other factors. We periodically monitor the factors that influence our provision for chargebacks, and make adjustments when we believe that actual chargebacks may differ from established allowances. These adjustments occur in a relatively short period of time. As these chargebacks are typically settled within 30 to 45 days of the sale, adjustments for actual experience have not been material. The increase in the provision for chargebacks in 2009 compared to 2008 was due largely to increased sales related to government contracts.
As of December 31, 2009, our allowance for chargebacks was $4.3 million. A hypothetical 10% change in credits issued for chargebacks for year ended December 31, 2009 would not have a material impact to our consolidated results of operations.
Our sales terms generally provide for up to a 2% prompt pay discount on domestic and international sales. We believe that our sales allowance accruals are reasonably determinable and are based on the information available at the time to arrive at our best estimate of the accruals at the time of the sale. Actual sales allowances incurred are dependent upon future events. We periodically monitor the factors that influence sales allowances and make adjustments to these provisions when we believe that the actual sales allowances may differ from prior estimates. If conditions in future periods change, revisions to previous estimates may be required, potentially in significant amounts. As these prompt pay discounts are typically settled within 30 to 45 days of the sale, adjustments for actual experience have not been material.
As of December 31, 2009, our allowance for cash discounts was $1.3 million. A hypothetical 10% change in credits issued for cash discounts for the year ended December 31, 2009 would not have a material impact to our consolidated results of operations.
Shelf-stock adjustments are credits issued to customers to reflect decreases in the selling prices of products. Agreements to provide this form of price protection are customary in our industry and are intended to reduce a customer’s inventory cost to better reflect current prices. Shelf-stock adjustments are based upon the amount of product that customers have remaining in their inventories at the time of a price reduction. The extent of any price reduction would be discretionary. Any amounts recorded for estimated price adjustments would be based upon the specific terms with customers, estimated declines in price, and estimates of inventory held by the customer. We have not experienced material shelf-stock adjustments during the periods presented as a result of the demand for plasma-derived products outpacing the supply due to our constraints in our industry. Recently, product supply and demand have become more balanced. We could experience material shelf-stock adjustments in the future in the event that the supply-demand dynamic become unbalanced and resulted in price declines.
We utilize information from external sources to estimate our significant gross-to-net revenue adjustments. Our estimates of inventory at wholesalers and distributors are based on written and oral information obtained from certain wholesalers and distributors with respect to their inventory levels and sell-through to customers. The inventory information received from wholesalers and distributors is a product of their record-keeping process. Our estimates are subject to inherent limitations of estimates that rely on third-party information, as certain third-party information was itself in the form of estimates, and reflect other limitations, including
lags between the date as of which the third-party information is generated and the date on which we receive third-party information. We believe, based on our experience, that the information obtained from external sources provides a reasonable basis for our estimate.
The following table summarizes our gross-to-net revenue adjustments expressed in dollars and percentages:
|
|
|
Years Ended December 31, |
|
|||||||
|
|
|
2009 |
|
2008 |
|
2007 |
|
|||
|
Gross product revenue |
|
$ |
1,593,995 |
|
$ |
1,389,542 |
|
$ |
1,251,879 |
|
|
Chargebacks |
|
(24,380 |
) |
(13,927 |
) |
(13,268 |
) |
|||
|
Cash discounts |
|
(18,710 |
) |
(15,147 |
) |
(12,918 |
) |
|||
|
Rebates and other |
|
(42,397 |
) |
(24,008 |
) |
(26,719 |
) |
|||
|
SG&A reimbursements |
|
(754 |
) |
(1,910 |
) |
(2,288 |
) |
|||
|
Product net revenue |
|
$ |
1,507,754 |
|
$ |
1,334,550 |
|
$ |
1,196,686 |
|
|
|
|
Years Ended December 31, |
|
||||
|
|
|
2009 |
|
2008 |
|
2007 |
|
|
Gross product revenue |
|
100.0 |
% |
100.0 |
% |
100.0 |
% |
|
Chargebacks |
|
(1.5 |
)% |
(1.0 |
)% |
(1.1 |
)% |
|
Cash discounts |
|
(1.2 |
)% |
(1.1 |
)% |
(1.0 |
)% |
|
Rebates and other |
|
(2.7 |
)% |
(1.7 |
)% |
(2.1 |
)% |
|
SG&A reimbursements |
|
— |
|
(0.1 |
)% |
(0.2 |
)% |
|
Product net revenue |
|
94.6 |
% |
96.1 |
% |
95.6 |
% |
The following table provides a summary of activity with respect to our allowances:
|
|
|
|
|
Cash |
|
Rebates and |
|
|
|
||||
|
|
|
Chargebacks |
|
Discounts |
|
Other |
|
Total |
|
||||
|
Balance at December 31, 2006 |
|
$ |
1,871 |
|
$ |
970 |
|
$ |
6,931 |
|
$ |
9,772 |
|
|
Provision |
|
13,268 |
|
12,918 |
|
26,719 |
|
52,905 |
|
||||
|
Credits issued |
|
(12,451 |
) |
(12,814 |
) |
(22,218 |
) |
(47,483 |
) |
||||
|
Balance at December 31, 2007 |
|
2,688 |
|
1,074 |
|
11,432 |
|
15,194 |
|
||||
|
Provision |
|
13,927 |
|
15,147 |
|
24,008 |
|
53,082 |
|
||||
|
Credits issued |
|
(12,752 |
) |
(14,727 |
) |
(23,029 |
) |
(50,508 |
) |
||||
|
Balance at December 31, 2008 |
|
3,863 |
|
1,494 |
|
12,411 |
|
17,768 |
|
||||
|
Provision |
|
24,380 |
|
18,710 |
|
42,397 |
|
85,487 |
|
||||
|
Credits issued |
|
(23,981 |
) |
(18,930 |
) |
(28,381 |
) |
(71,292 |
) |
||||
|
Balance at December 31, 2009 |
|
$ |
4,262 |
|
$ |
1,274 |
|
$ |
26,427 |
|
$ |
31,963 |
|
Concentrations of Credit Risk
Our accounts receivable, net, includes amounts due from pharmaceutical wholesalers and distributors, buying groups, hospitals, physicians’ offices, patients, and others. The following table summarizes our concentrations with customers that represented more than 10% of our accounts receivable, net:
|
|
|
December 31, |
|
||
|
|
|
2009 |
|
2008 |
|
|
Customer A |
|
14.6 |
% |
15.0 |
% |
|
Customer B |
|
<10 |
% |
14.0 |
% |
The following table summarizes our concentrations with customers that represented more than 10% of our total net revenue:
|
|
|
Years Ended December 31, |
|
||||
|
|
|
2009 |
|
2008 |
|
2007 |
|
|
Customer A |
|
14.4 |
% |
12.8 |
% |
18.2 |
% |
|
Customer B |
|
12.3 |
% |
12.0 |
% |
14.9 |
% |
|
Customer C |
|
<10 |
% |
10.6 |
% |
10.5 |
% |
Income Taxes
We calculate a provision for, or benefit from, income taxes using the asset and liability method, under which deferred tax assets and liabilities are recorded based on the difference between the financial statement and tax bases of assets and liabilities using enacted tax rates in effect for the year in which the differences are expected to reverse. A reduction in the carrying amounts of deferred tax assets by a valuation allowance is required, if, based on the available evidence, it is more likely than not that the assets will not be realized. Accordingly, we periodically assess the need to establish valuation allowances for deferred tax assets based on the more-likely-than-not realization threshold criterion. In assessing the need for a valuation allowance, we consider all available evidence, both positive and negative, including historical levels of income, expectations and risks associated with future taxable income, and ongoing prudent and feasible tax planning strategies.
We establish reserves for uncertain income tax positions, based on the technical support for the positions, our past audit experience with similar situations, and potential interest and penalties related to the matters. Our recorded reserves represent our best estimate of the amount, if any, that we will ultimately be required to pay to settle such matters. The resolution of our uncertain income tax positions is dependent on uncontrollable factors such as law changes, new case law and the willingness of the income tax authorities to settle, including the timing thereof and other factors. Although we do not anticipate significant changes to our uncertain income tax positions in the next twelve months, items outside of our control could cause our uncertain income tax positions to change in the future, which would be recorded within (provision) benefit for income taxes in our consolidated income statements. Interest and penalties related to unrecognized tax benefits are recognized as a component of our income tax provision.
Share-Based Compensation
We have granted stock options, restricted share awards, unrestricted share awards, and restricted stock units (RSU’s) of our common stock to certain employees, officers, and members of our board of directors pursuant to our share-based compensation plans. We value share-based compensation at the grant date using a fair value model and recognize this value as expense over the employees’ requisite service period, typically the period over which the share-based compensation vests. We classify share-based compensation costs consistent with each grantee’s salary. We record corporate income tax benefits realized upon exercise or vesting of an award in excess of that previously recognized in earnings as additional paid-in capital.
The fair value of our common stock on the grant date is a significant factor in determining the fair value of share-based compensation awards and the ultimate non-cash compensation cost that we will be required to record over the vesting period. Given the absence of a trading market for our common stock on grant dates prior to October 1, 2009, our board of directors, or special dividend committee or compensation committee designated by our board of directors is estimated the fair value of our common stock contemporaneously with each grant using numerous objective and subjective factors. These factors included: (i) our stage of development, our efforts to become independent from Bayer, and revenue growth; (ii) the timing of the anticipated launch of new products and new indications; (iii) business conditions and business challenges at the time; (iv) available market data, including observable market transactions, and valuations for comparable companies; (v) the illiquid nature of our stock options and stock grants; and (vi) the likelihood of achieving a liquidity event for the shares of common stock underlying the options, such as an initial public offering or sale of our company, given prevailing market conditions at the grant date. In making the assessment of common stock fair value on each award date, our board of directors or designated committee of our board of directors considered the guidance in American Institute of Certified Public Accountants Technical Practice Aid, “Valuation of Privately-Held Company Equity Securities Issued as Compensation.” The valuations were completed utilizing the market and/or an income approach and then the enterprise value was allocated using the “Probability-Weighted Expected Return Method,” which provides different probability weights of various likely scenarios (distressed; remain private; private sale; IPO), and develops valuations by determining the present value of the future expected common stock value under each of these scenarios. For option awards granted on October 1, 2009, the fair value of our common stock was determined to be the IPO price per share of $19.00. For option awards granted subsequent to our IPO, we consider the fair value of our common stock to be the closing share price as reported by The NASDAQ Global Select Market on the grant date.
We estimate the fair value of stock options at the grant date using a Black-Scholes option pricing model, which requires the use of a number of assumptions related to the risk-free interest rate, average life of options (expected term), expected volatility, and dividend yield. There was no trading market for our common stock or stock options on grant dates prior to October 1, 2009, and there is limited trading history for our common stock subsequent to October 1, 2009. Therefore, our application of the Black-Scholes pricing model incorporates historical volatility measures of similar public companies. A forfeiture rate based on historical attrition rates of award holders is used in estimating the granted awards not expected to vest. If actual forfeitures differ from the expected rate, we may be required to make additional adjustments to compensation expense in future periods. Our valuation utilized a dividend yield of zero. We believe that the valuation technique and the approach utilized to develop the underlying assumptions are appropriate in calculating the fair values of our stock options on their grant dates. Estimates of the values of these grants are not intended to predict actual future events or the value ultimately realized by employees who receive such awards.
The stock options that we have granted and will grant in the future typically have service-based and performance-based components. Restricted stock and restricted stock unit awards have typically been service-based only. Service-based awards vest annually in equal amounts over the vesting period. The performance-based component of the stock options vests annually upon the achievement of corporate performance objectives which are established by our board of directors. We make assessments as to whether the performance conditions related to the performance-based stock options will be achieved. We record compensation cost for awards with performance conditions based on the probable outcome of the performance conditions.
The Black-Scholes option pricing model was developed for use in estimating the fair value of traded options that have no vesting restrictions and are fully transferable, characteristics that are not present in our option grants. If the model permitted consideration of the unique characteristics of employee stock options, the resulting estimate of the fair value of the stock options could be different. In addition, if we had made different assumptions and estimates than those described above, the amount of our recognized and to be recognized stock-based compensation expense, net income, and earnings per share amounts could have been materially different.
Additional information regarding the assumptions used in our accounting for share-based compensation awards is included in the footnotes to our audited consolidated financial statements included elsewhere in this Annual Report.
Accounts Receivable, net
Accounts receivable, net, consists of amounts owed to us by our customers on credit sales with terms generally ranging from 30 to 120 days from the date of invoice and are presented net of an allowance for doubtful accounts receivable on our consolidated balance sheets.
We maintain an allowance for doubtful accounts receivable for estimated losses resulting from our inability to collect from customers. In extending credit, we assess our customers’ creditworthiness by, among other factors, evaluating the customers’ financial condition, credit history, and the amount involved, both initially and on an ongoing basis. Collateral is generally not required. In evaluating the adequacy of our allowance for doubtful accounts receivable, we primarily analyze accounts receivable balances, the percentage of accounts receivable by aging category, and historical bad debts. We also consider, among other things, customer concentrations and changes in customer payment terms or payment patterns.
If the financial conditions of our customers were to deteriorate, resulting in an impairment of their ability to make payments or our ability to collect, an increase to the allowance may be required. Also, should actual collections of accounts receivable be different than our estimates included in determining the allowance, the allowance would be adjusted through charges or credits to SG&A in our consolidated income statement in the period in which such changes in collection become known. If conditions change in future periods, additional allowances or reversals may be required. Such allowances or reversals could be significant. While our credit losses have historically been within our expectations and the allowance established, we may not continue to experience the same credit loss rates that we have in the past. At December 31, 2009, our allowance for doubtful accounts receivable was $3.5 million.
Inventories
Inventories consist of raw material, work-in-process, and finished goods held for sale and are stated at the lower of cost or market, which approximates actual costs determined on a first-in, first-out basis and market being determined as the lower of replacement cost or estimated net realizable value. We establish inventory reserves through inventory impairment provision charges to cost of goods sold when conditions indicate that the selling price could be less than cost. These inventory impairment provisions establish a lower cost basis for the inventory.
Our raw materials, particularly plasma, are susceptible to damage and contamination and may contain human pathogens, any of which would render the plasma unsuitable as raw material for further manufacturing. For instance, improper storage of plasma by us or third-party suppliers may require us to destroy some of our raw material. If the damaged or contaminated plasma is not identified and discarded prior to the release of the plasma to our manufacturing process, it may be necessary to discard intermediate or finished products that are made from that plasma, resulting in a charge to cost of goods sold. In the event that we determine that the plasma was not collected in accordance with our standard operating procedures (SOP) or in a current Good Manufacturing Practices (cGMP) compliant fashion or that the collection center is unable to obtain FDA licensure, we may be unable to use and may ultimately destroy plasma collected from that center, which would be recorded as a charge to cost of goods sold during the period the plasma is determined to be unrealizable. From time to time, we have experienced significant impairment charges to cost of goods sold related to raw plasma that was collected or stored in a manner not consistent with our SOP or cGMP, such as the $23.3 million charge we recorded during the first half of 2008 as discussed further in the section titled, “Management’s Discussion and Analysis of Financial Condition and Results of Operations—Matters Affecting Comparability—Plasma Center cGMP issue.”
The manufacture of our plasma-derived products is an extremely complex process of fractionation, purification, filling, and finishing. Although we attempt to maintain high standards for product testing, manufacturing, process controls, and quality assurance, our products can become non-releasable, or otherwise fail to meet our stringent specifications through a failure of one or more of these processes. Extensive testing is performed throughout the manufacturing process to ensure the safety and effectiveness of our products. We may, however, detect instances in which an unreleased product was produced without adherence to our SOP or cGMP. Such an event of non-compliance would likely result in our determination that the product should not be released and therefore would be destroyed, resulting in a charge to cost of goods sold. While we expect to write off small amounts of work-in-process inventory in the ordinary course of business, unanticipated events may lead to write-offs and other costs materially in excess of our expectations. Such write-offs and other costs could cause material fluctuations in our profitability.
Once we have manufactured our plasma-derived products, they must be handled carefully and kept at appropriate temperatures. Our failure, or the failure of third parties that supply, ship, or distribute our products, to properly care for our products may require those products be destroyed, resulting in a charge to cost of goods sold. Our finished goods are also subject to physical deterioration, obsolescence, reductions in estimated future demand, and reductions in selling prices. We generally record an inventory impairment provision for finished goods inventory six months prior to its expiry date when we do not reasonably expect to sell the product prior to expiration.
We capitalize the cost of unlicensed plasma when, based on our judgment, future economic benefit is probable. While unlicensed plasma cannot be sold to third parties or used in our manufacturing processes to make finished product until all regulatory approvals have been obtained, we have determined that it is probable that our plasma inventories are realizable. As part of the FDA licensing process for plasma collection centers, we are initially permitted to collect plasma utilizing the procedures and Quality Systems implemented and approved under our existing Biologics License Application (BLA) until such time as the FDA inspectors have conducted a pre-license inspection of the site and approved the site for inclusion in the BLA. At the conclusion of this process, we are permitted to sell or utilize previously collected plasma in the manufacturing of final product. We believe that our cumulative knowledge of the industry, standard industry practices, experience working with the FDA, established Quality Systems, and consistency with achieving licensure support our capitalization of unlicensed plasma. Total unlicensed plasma and related testing costs included in our raw material inventories was $7.6 million at December 31, 2009.
Impairment Reviews
We evaluate the recoverability of recorded goodwill and other indefinite-lived intangible asset amounts annually as of December 31 or when events or changes in circumstances indicate that evidence of potential impairment exists, using a fair value based test. This test requires us to make estimates of factors that include, but are not limited to, projected future operating results and business plans, economic projections, anticipated future cash flows, comparable marketplace data from a consistent industry group, and the cost of capital. Any applicable impairment loss is the amount, if any, by which the implied fair value is less than the carrying value.
We review the carrying amounts of other long-lived assets for potential impairment whenever events or changes in circumstances indicate that the carrying amount of the asset may not be recoverable. We periodically evaluate whether events or changes in circumstances have occurred that may warrant revision of the estimated useful lives of our long-lived assets or whether the remaining carrying amount of long-lived assets should be evaluated for possible impairment. An example of such a change in circumstances includes a significant adverse change in the extent or manner in which an asset is being used.
Recent Accounting Pronouncements Applicable to Our Company
In October 2009, the Financial Accounting Standards Board (FASB) issued new accounting guidance regarding multiple-deliverable revenue arrangements. The new guidance addresses the accounting for multiple-deliverable arrangements to enable vendors to account for products or services (deliverables) separately rather than as a combined unit. This guidance establishes a hierarchy for determining the selling price of a deliverable, which is based on: (a) vendor-specific objective evidence; (b) third-party evidence; or (c) estimates. This guidance also eliminates the residual method of allocation and requires that arrangement consideration be allocated at the inception of the arrangement to all deliverables using the relative selling price method. In addition, this guidance significantly expands required disclosures related to a vendor’s multiple-deliverable revenue arrangements. The guidance is effective prospectively for revenue arrangements entered into or materially modified in fiscal years beginning on or after June 15, 2010 and early adoption is permitted. A company may elect, but will not be required, to adopt the guidance retrospectively for all prior periods. We do not anticipate that the adoption of this guidance will have a material impact on our consolidated financial statements or related disclosures.
In August 2009, the FASB released new accounting guidance concerning measuring liabilities at fair value. The new guidance provides clarification that in circumstances in which a quoted price in an active market for the identical liability is not available, a reporting entity is required to measure fair value using certain valuation techniques. Additionally, it clarifies that a
reporting entity is not required to adjust the fair value of a liability for the existence of a restriction that prevents the transfer of the liability. This new guidance is effective for the first reporting period after its issuance, however earlier application is permitted. We do not anticipate that the adoption of this guidance will have a material impact on our consolidated financial statements or related disclosures.
In May 2009, the FASB issued authoritative guidance for subsequent events, which is effective for interim and annual financial statements ending after June 15, 2009. The guidance establishes general standards of accounting for and disclosure of subsequent events that occur after the balance sheet date. Entities are also required to disclose the date through which subsequent events have been evaluated and the basis of that date. We have evaluated subsequent events up through February 23, 2010, the date that we filed our audited consolidated financial statements with the U.S. Securities and Exchange Commission.
On January 30, 2009, the SEC released the final rules requiring all registered companies to use eXtensible Business Reporting Language (XBRL) when submitting financial statements to the SEC. The new rules initially will require interactive data reporting only by domestic and foreign large accelerated filers that prepare their financial statements in accordance with U.S. GAAP and have a worldwide public common equity float above $5.0 billion for their first quarterly period ending after June 15, 2009 and all reporting periods thereafter. We expect to be required to file using XBRL beginning with our quarterly reporting period ending March 31, 2011.
In November 2008, the SEC released a proposed roadmap regarding the potential use by U.S. issuers of financial statements prepared in accordance with International Financial Reporting Standards (IFRS). IFRS is a comprehensive series of accounting standards published by the International Accounting Standards Board. Under the proposed roadmap, we may be required in fiscal 2015 to prepare financial statements in accordance with IFRS. However, the SEC announced it will make a determination in 2011 regarding the mandatory adoption of IFRS. We are currently assessing the impact that this potential change would have on our consolidated financial statements, and will continue to monitor the development of the potential implementation of IFRS.
In March 2008, the FASB revised authoritative guidance for disclosures about derivative financial instruments and hedging activities. This guidance requires disclosures about derivatives and hedging activities including enhanced disclosure about (a) how and why an entity uses derivative instruments, (b) how derivative instruments and related hedged items are accounted and (c) how derivative instruments and related hedged items affect financial position, financial performance, and cash flows. This guidance is effective for financial statements issued for fiscal years and interim periods beginning after November 15, 2008. The adoption of this guidance did not materially impact our financial statement disclosures.
In December 2007, the FASB issued authoritative guidance, which establishes accounting and reporting standards for ownership interests in subsidiaries held by parties other than the parent, the amount of consolidated net income attributable to the parent and to the noncontrolling equity investments when a subsidiary is deconsolidated. The guidance also establishes reporting requirements that provide sufficient disclosures that clearly identify and distinguish between the interests of the parent and the interest of the noncontrolling owners. The authoritative guidance is effective for fiscal years, and interim periods within those fiscal years, beginning on or after December 15, 2008. The adoption of this guidance did not have a material impact on our consolidated financial statements based on our current ownership interests.
MATTERS AFFECTING COMPARABILITY
We believe that the comparability of our financial results between the periods presented is significantly impacted by the following items:
Financial Impact of IPO and Refinancing Transactions
The following table summarizes the changes to our indebtedness during 2009, including the impact from the application of the net proceeds to us of $519.7 million from our IPO and the net proceeds to us of $583.9 million from our refinancing transactions:
|
|
|
December 31, |
|
2009 Net |
|
October 6, 2009 |
|
October 21, 2009 |
|
|
|
December 31, |
|
||||||
|
|
|
2008 |
|
Repayments |
|
IPO |
|
Refinancing |
|
Accretion |
|
2009 |
|
||||||
|
Revolving Credit Facility |
|
$ |
179,941 |
|
$ |
(124,348 |
) |
$ |
— |
|
$ |
(55,593 |
) |
$ |
— |
|
$ |
— |
|
|
First Lien Term Loan |
|
686,000 |
|
(5,250 |
) |
(389,812 |
) |
(290,938 |
) |
— |
|
— |
|
||||||
|
Second Lien Term Loan |
|
330,000 |
|
— |
|
(129,937 |
) |
(200,063 |
) |
— |
|
— |
|
||||||
|
7.75% Notes |
|
— |
|
— |
|
— |
|
600,000 |
|
— |
|
600,000 |
|
||||||
|
Discount on 7.75% Notes |
|
— |
|
— |
|
— |
|
(4,074 |
) |
120 |
|
(3,954 |
) |
||||||
|
Total indebtedness |
|
$ |
1,195,941 |
|
$ |
(129,598 |
) |
$ |
(519,749 |
) |
$ |
49,332 |
|
$ |
120 |
|
$ |
596,046 |
|
In addition to the debt principal repayments in the preceding table, we used $28.7 million of the net proceeds to us from the issuance of the 7.75% Notes to settle and terminate certain interest rate swap contracts with a notional amount of $390.0 million and $8.6 million to pay accrued interest associated with our then outstanding First and Second Lien Term Loans. In addition to the $4.1 million of discounts on the 7.75% Notes disclosed in the table above, approximately $12.0 million of commissions were deducted from the gross issuance proceeds. Subsequently, we settled and terminated our remaining interest rate swap contract with a notional amount of $50.0 million for $6.1 million. As a result of the changes to our debt structure, we anticipate that our weighted average interest rate will be approximately 8% during the next twelve months without considering potential new interest rate swaps. We incurred other costs related to our IPO of $3.9 million, of which $1.3 million is included within SG&A in our consolidated income statement for the year ended December 31, 2009 and $2.6 million is included as a reduction of additional paid-in capital on our December 31, 2009 consolidated balance sheet.
As a result of the IPO and refinancing transactions, we recognized a charge during the fourth quarter of 2009 of $12.1 million to write-off previously deferred debt issuance costs related to our First and Second Lien Term Loans and $30.9 million related to costs associated with the settlement and termination of our interest rate swap contracts. These charges, which totaled $43.0 million, are recorded within total other non-operating expense, net, in our consolidated income statement for the year ended December 31, 2009. We capitalized $14.9 million of debt issuance costs associated with the issuance of the 7.75% Notes and the Revolving Credit Facility amendment.
The following table summarizes changes in deferred debt issuance costs during the year ended December 31, 2009:
|
|
|
December 31, |
|
Charges |
|
Newly |
|
Amortization |
|
December 31, |
|
|||||
|
Revolving Credit Facility |
|
$ |
3,014 |
|
$ |
— |
|
$ |
1,545 |
|
$ |
(1,041 |
) |
$ |
3,518 |
|
|
First Lien Term Loan |
|
9,629 |
|
(8,054 |
) |
— |
|
(1,575 |
) |
— |
|
|||||
|
Second Lien Term Loan |
|
4,744 |
|
(4,087 |
) |
— |
|
(657 |
) |
— |
|
|||||
|
7.75% Notes |
|
— |
|
— |
|
13,334 |
|
(392 |
) |
12,942 |
|
|||||
|
Total deferred debt issuance costs |
|
$ |
17,387 |
|
$ |
(12,141 |
) |
$ |
14,879 |
|
$ |
(3,665 |
) |
$ |
16,460 |
|
Definitive Merger Agreement with CSL Limited (CSL)
On August 12, 2008, we entered into a definitive merger agreement with CSL, under which CSL agreed to acquire us for cash consideration of $3.1 billion, less net debt, as defined. The closing of the transaction was subject to the receipt of certain regulatory approvals as well as other customary conditions. The U.S. Federal Trade Commission filed an administrative complaint before the Commission challenging the merger and a complaint in Federal district court seeking to enjoin the merger during the administrative process. On June 8, 2009, the merger parties agreed to terminate the definitive merger agreement. CSL paid us a merger termination fee of $75.0 million (after tax amount of $48.8 million), which is included as other non-operating income in our consolidated income statement for the year ended December 31, 2009. The U.S. Federal Trade Commission’s complaints were subsequently dismissed.
In consideration of the definitive merger agreement with CSL, our board of directors approved a retention program in August 2008 for an amount up to $20.0 million. We recorded retention expense of $8.2 million and $5.1 million, excluding fringe benefits, during the years ended December 31, 2009 and 2008, respectively. We classified the cost of this retention program consistent with each recipient’s salary. We made payments of approximately $13.3 million under this retention program during 2009. No further payments are due.
We incurred legal and other costs associated with the regulatory review process of $6.0 million and $8.3 million during the years ended December 31, 2009 and 2008, respectively, which are included in SG&A in our consolidated income statements.
Foreign Corrupt Practices Act (FCPA)
We are conducting an internal investigation into potential violations of the FCPA that we became aware of during the conduct of an unrelated review. The FCPA investigation is being conducted by outside counsel under the direction of a special committee of our board of directors. During the year ended December 31, 2009, we incurred $8.0 million of legal costs associated with our internal investigation into this matter, which are recorded in SG&A in our consolidated income statement. Additional information regarding our investigation into potential violations of the FCPA is included in Note 13 to our audited consolidated financial statements, “Commitments and Contingencies,” and in the “Risk Factors” section of this Annual Report.
As of December 31, 2009, we have $2.4 million of accounts receivable outstanding with customers related to this matter, which we fully reserved during 2009.
Unabsorbed TPR Infrastructure and Start-Up Costs
Our cost of goods sold includes $44.0 million, $98.5 million, and $70.1 million for the years ended December 31, 2009, 2008, and 2007, respectively, related to unabsorbed TPR infrastructure and start-up costs associated with the development of our plasma collection center platform. Until our plasma collection centers reach normal operating capacity, we charge unabsorbed overhead costs directly to cost of goods sold. The reduction of unabsorbed TPR infrastructure and start-up costs during 2009 resulted from higher plasma volumes collected at our plasma collection centers and improved center labor efficiencies as well as lower support costs. We anticipate that we will continue to experience improving levels of unabsorbed TPR infrastructure and start-up costs with the maturation of our plasma collection center platform.
Plasma Center cGMP Issue
During the first and second quarters of 2008, we incurred charges to cost of goods sold of $16.3 million and $7.0 million, respectively, due to deviations from our SOP and cGMP at one of our plasma collection centers. Our preliminary investigations concluded that the deviations from our SOP and cGMP resulted in impairments to the related raw material and work-in-process inventories as we concluded there was no probable future economic benefit related to the impacted inventories. Subsequently, due to further investigations and new facts and circumstances, we determined that certain impacted inventories were saleable. We record recoveries directly to cost of goods sold after the impacted material is converted into final products and sold to third parties. During the years ended December 31, 2009 and 2008, we recorded recoveries of $1.9 million and $17.5 million, respectively. For the year ended December 31, 2008, recoveries totaled $17.5 million, resulting in a net provision of $5.8 million for 2008. We do not expect to recognize significant further recoveries of the impacted inventories.
Customer Settlement
We settled a dispute with a customer in September 2007 regarding intermediate material manufactured by us, which is used by this customer in their manufacturing process. We recorded a charge to cost of goods sold of $7.9 million during the year ended December 31, 2007 for inventory impairment related to this material, which we recovered in its entirety during 2008 as the related material was determined to be saleable, converted into final product, and sold to other customers. During 2008, we recorded an additional inventory impairment provision of $2.6 million related to this dispute for products held in Europe, for which we recovered $0.8 million and $1.8 million during 2009 and 2008, respectively, as the impacted material was determined to be saleable, converted into final product, and sold to other customers. As a result of this customer settlement, we increased production of contracted PPF powder and experienced a change in product sales mix from albumin to contracted PPF powder during 2008.
Share-Based Compensation Awards
We have granted options, restricted share awards, unrestricted share awards, and RSU’s of our common stock to certain officers, employees, and members of our board of directors pursuant to our stock-based compensation plans.
The following table summarizes our share-based compensation expense:
|
|
|
Years Ended December 31, |
|
|||||||
|
Stock options |
|
2009 |
|
2008 |
|
2007 |
|
|||
|
SG&A |
|
$ |
31,348 |
|
$ |
24,237 |
|
$ |
12,103 |
|
|
R&D |
|
1,710 |
|
1,826 |
|
860 |
|
|||
|
Total operating expenses |
|
33,058 |
|
26,063 |
|
12,963 |
|
|||
|
Cost of goods sold |
|
3,439 |
|
1,829 |
|
948 |
|
|||
|
Total expense |
|
$ |
36,497 |
|
$ |
27,892 |
|
$ |
13,911 |
|
|
|
|
Years Ended December 31, |
|
|||||||
|
Restricted Share Awards and RSU’s |
|
2009 |
|
2008 |
|
2007 |
|
|||
|
SG&A |
|
$ |
9,620 |
|
$ |
9,543 |
|
$ |
6,509 |
|
|
R&D |
|
593 |
|
535 |
|
536 |
|
|||
|
Total operating expenses |
|
10,213 |
|
10,078 |
|
7,045 |
|
|||
|
Cost of goods sold |
|
836 |
|
737 |
|
285 |
|
|||
|
Total expense |
|
$ |
11,049 |
|
$ |
10,815 |
|
$ |
7,330 |
|
In addition to incremental share-based compensation expense associated with stock-based compensation awards granted during the periods presented, the following items have impacted the comparability of our share-based compensation expense:
· During the third quarter of 2009, we entered into an amended and restated employment agreement with our Chairman and Chief Executive Officer which included accelerating the vesting of options to purchase 1,008,000 shares of our common stock at an exercise price of $21.25 per common share to August 19, 2009. The acceleration of these options resulted in the recognition of a non-cash charge of $11.8 million of compensation expense during 2009. Options to purchase these shares were previously scheduled to vest in April of 2010 (504,000 options) and April of 2011 (504,000 options).
· During the second quarter of 2008, the compensation committee of our board of directors amended the exercise price of 570,400 stock options outstanding to certain employees from $21.25 per share to $11.00 per share and also amended the exercise price of 17,152 stock options outstanding to certain members of our board of directors from $21.25 per share to $11.00 per share. The stock options that were re-priced were granted during 2007.
· During the first quarter of 2008, our board of directors revised the 2008 corporate objectives related to the performance-based component of stock options scheduled to vest on April 1, 2009. In addition, during the second quarter of 2008, we began recognizing compensation cost related to the performance-based component of stock options schedule to vest on April 1, 2010 based on our probability assessment of achieving the related performance objectives.
· During the third quarter of 2007, the compensation committee of our board of directors approved an amendment to our then existing 2005 Stock Option and Incentive Plan in which the percentage of options vesting based on performance targets was changed from 65% to 35% and the percentage of options vesting based on service was changed from 35% to 65% for options scheduled to vest on April 1 of 2009 and 2010.
· During the third quarter of 2007, the compensation committee of our board of directors approved the 2008 and 2009 corporate objectives related to the performance-based component of stock options scheduled to vest on April 1 of 2009 and 2010. The objectives related to the performance-based component of the stock options scheduled to vest on April 1, 2009 were subsequently modified during the first quarter of 2008 as indicated above.
· During the first quarter of 2007, the compensation committee of our board of directors approved the 2007 corporate objectives related to the performance-based component of the stock options scheduled to vest on April 1, 2008.
In connection with our IPO, we granted 597,713 stock options with an exercise price per share equal to our IPO price per share of $19.00. These stock options will vest one-third on each of April 1 of 2011, 2012, and 2013, subject to the option holder being employed on the vesting date. The fair value of each option was determined to be $9.57, resulting in aggregate future non-cash compensation expense of approximately $5.2 million, which we expect to recognize ratably through April of 2013. In connection with our IPO, we also granted 483,100 RSU’s. These RSU’s will vest one-third on each of April 1 of 2011, 2012, and 2013, subject to the award holder being employed on the vesting date. The aggregate grant date fair value of the RSU’s was approximately $8.4 million, which we expect to recognize ratably through April of 2013.
In connection with our IPO, the compensation committee of our board of directors approved a grant of performance shares to be made in March or April of 2010. Performance shares are awards that vest based on achievement of pre-established objective performance goals, which are generally financial in nature. For performance awards, the board of directors will establish a performance period and the performance targets for each performance measure that must be achieved at the end of the performance period for awards to vest. The number of shares provided upon the vesting of the performance awards varies based on actual performance in a year relative to a defined minimum and maximum adjusted EBITDA targets for that year. It is currently contemplated that the performance shares to be granted in March or April 2010 will vest annually over a three-year performance period with the potential for 0% to 125% payout, based on the achievement of annual adjusted EBITDA targets that are established at the time of grant.
The following table summarizes the remaining unrecognized compensation cost related to our share-based compensation awards as of December 31, 2009 and the weighted average period over which non-cash compensation cost is expected to be recognized:
|
|
|
|
|
Weighted |
|
|
|
|
|
Unrecognized |
|
Average |
|
|
|
|
|
Compensation |
|
Period |
|
|
|
|
|
Cost |
|
(Years) |
|
|
|
Stock options |
|
$ |
9,878 |
|
1.75 |
|
|
Restricted share awards |
|
6,977 |
|
0.66 |
|
|
|
RSU’s |
|
7,912 |
|
3.25 |
|
|
|
Total |
|
$ |
24,767 |
|
1.92 |
|
In addition to the unrecognized compensation cost included in the table above, at December 31, 2009, $3.2 million of compensation cost was included in inventory on our consolidated balance sheet, which we expect to be recognized as non-cash compensation expense in our consolidated income statement primarily during 2010. Additional information regarding our share-based compensation awards is included in “Management’s Discussion and Analysis of Financial Condition and Results of Operations—Critical Accounting Policies— Share-Based Compensation” and in the footnotes to our audited consolidated financial statements included elsewhere in this Annual Report.
Transition-Related Activities
We incurred costs associated with the development of our internal capabilities to operate as a standalone company apart from Bayer, which we refer to as transition and other non-recurring costs, which was completed in 2007. These costs related primarily to consulting services associated with the development of an internal infrastructure to assume international sales and marketing, customer service, contract administration and government price reporting, human resources, finance, information technology, regulatory, and compliance functions. We incurred transition and non-recurring costs of $15.3 million for the year ended December 31, 2007.
Litigation Settlement
We were a co-plaintiff along with Bayer Healthcare (Bayer) in patent litigation in the United States District Court for the District of Delaware against Baxter International Inc. and Baxter Healthcare (collectively, Baxter). In this case, filed in 2005, we, as exclusive licensee of Bayer’s U.S. Patent No. 6,686,191 (the ‘191 patent), alleged that Baxter by its manufacture and importation of its liquid IGIV product, Gammagard Liquid, had infringed the ‘191 patent. We entered into a Settlement Agreement with Baxter on August 10, 2007. Under the terms of the settlement, (i) Baxter paid us $11.0 million, (ii) Baxter will pay us for a period of four years from the settlement date an amount comprising 1.2% of Baxter’s net sales in the United States of Gammagard Liquid and any other product sold by Baxter or an affiliate in the United States under a different brand name that is a liquid intravenous immunoglobulin under a separate Sublicense Agreement, (iii) Baxter provided us with approximately 2,000 kilograms of Fraction IV-I paste with specifications as per the Settlement Agreement (fair value of $1.8 million determined by reference to similar raw material purchases we have made in the past as well as current market conditions), and (iv) we will grant Baxter certain sublicense rights in the ‘191 patent and its foreign counterparties.
We incurred legal fees related to this litigation of $5.7 million during the year ended December 31, 2007, which were recorded within SG&A in our consolidated income statement. During the year ended December 31, 2007, we recorded $12.9 million related to the settlement in other non-operating income in our consolidated income statement. During the years ended December 31, 2009, 2008, and 2007, we recorded $10.6 million, $8.7 million, and $1.7 million, respectively, of fees from Baxter within other net revenue in our consolidated income statements.
Income Taxes
We record a valuation allowance to reduce our deferred tax assets to the amount that we believe is more likely than not to be realized. In assessing the need for a valuation allowance, we consider all available evidence, both positive and negative, including historical levels of income, expectations and risks associated with future taxable income, and ongoing prudent and feasible tax planning strategies. As a result of our analysis, during the third quarter of 2007 we concluded that it was more likely than not that our deferred tax assets would be realized. The release of the remaining valuation allowance related to our deferred tax assets resulted in a $48.2 million non-cash tax benefit during the year ended December 31, 2007. During the first three quarters of 2007, we also realized a portion of our deferred tax assets equal to the amount of our current Federal income tax provision.
RESULTS OF OPERATIONS
We have included information regarding our results of operations in the following table. The subsequent discussion and analysis provides information which management believes is relevant to an assessment and understanding of our consolidated results of operations. You are encouraged to read the following discussion and analysis of our financial condition and results of operations together with our audited consolidated financial statements and related footnotes included elsewhere in this Annual Report. Additional information regarding significant matters affecting comparability of our results of operations is included in the section titled “Management’s Discussion and Analysis of Financial Condition and Results of Operations—Matters Affecting Comparability.”
|
|
|
Years Ended December 31, |
|
|||||||
|
|
|
2009 |
|
2008 |
|
2007 |
|
|||
|
Net revenue: |
|
|
|
|
|
|
|
|||
|
Product |
|
$ |
1,507,754 |
|
$ |
1,334,550 |
|
$ |
1,196,686 |
|
|
Other |
|
25,455 |
|
39,742 |
|
21,823 |
|
|||
|
Total |
|
1,533,209 |
|
1,374,292 |
|
1,218,509 |
|
|||
|
Cost of goods sold |
|
901,077 |
|
882,157 |
|
788,152 |
|
|||
|
Gross profit |
|
632,132 |
|
492,135 |
|
430,357 |
|
|||
|
Operating expenses: |
|
|
|
|
|
|
|
|||
|
SG&A |
|
289,929 |
|
227,524 |
|
189,387 |
|
|||
|
R&D |
|
71,223 |
|
66,006 |
|
61,336 |
|
|||
|
Total |
|
361,152 |
|
293,530 |
|
250,723 |
|
|||
|
Income from operations |
|
270,980 |
|
198,605 |
|
179,634 |
|
|||
|
Other non-operating (expense) income: |
|
|
|
|
|
|
|
|||
|
Interest expense, net |
|
(74,491 |
) |
(96,640 |
) |
(110,236 |
) |
|||
|
Merger termination fee |
|
75,000 |
|
— |
|
— |
|
|||
|
Loss on extinguishment of debt |
|
(43,033 |
) |
— |
|
— |
|
|||
|
Equity in earnings of affiliate |
|
441 |
|
426 |
|
436 |
|
|||
|
Litigation settlement |
|
— |
|
— |
|
12,937 |
|
|||
|
Total |
|
(42,083 |
) |
(96,214 |
) |
(96,863 |
) |
|||
|
Income before income taxes |
|
228,897 |
|
102,391 |
|
82,771 |
|
|||
|
(Provision) benefit for income taxes |
|
(75,008 |
) |
(36,594 |
) |
40,794 |
|
|||
|
Net income |
|
$ |
153,889 |
|
$ |
65,797 |
|
$ |
123,565 |
|
|
|
|
|
|
|
|
|
|
|||
|
Earnings per common share: |
|
|
|
|
|
|
|
|||
|
Basic |
|
$ |
4.56 |
|
$ |
39.01 |
|
$ |
65.58 |
|
|
Diluted |
|
$ |
1.50 |
|
$ |
0.71 |
|
$ |
1.36 |
|
|
|
|
|
|
|
|
|
|
|||
|
Financial measures: |
|
|
|
|
|
|
|
|||
|
Gross margin |
|
41.2 |
% |
35.8 |
% |
35.3 |
% |
|||
|
Operating margin |
|
17.7 |
% |
14.5 |
% |
14.7 |
% |
|||
|
Effective income tax rate |
|
32.8 |
% |
35.7 |
% |
(49.3 |
)% |
|||
Primary Revenue and Expense Components
The following is a description of the primary components of our revenue and expenses:
· Product net revenue—Our product net revenue is presented net of allowances for estimated discounts, rebates, administrative fees, chargebacks, and sales allowances. Our product net revenue is also presented net of SG&A reimbursements to certain international distributors.
· Other net revenue—Our other net revenue primarily consists of royalties under our collaborative agreements, fees related to our settlement with Baxter, milestone revenues, and revenue associated with other third party contract services agreements at our Melville, New York, facility.
· Cost of goods sold—Our cost of goods sold includes material costs for the products we sell, which primarily consists of plasma and other costs associated with the manufacturing process, such as personnel costs, utilities, consumables, and overhead. In addition, our cost of goods sold includes packaging costs and distribution expenses. The most significant component of our cost of goods sold is plasma, which is the common raw material for our primary products, and represents approximately half of our cost of goods sold for the periods presented. Due to our long manufacturing cycle times, which range from 100 days to in excess of 400 days, the cost of plasma is not expensed through cost of goods sold
until a significant period of time subsequent to its acquisition. Specialty plasmas, due to their nature, can often have cycle times in excess of one year.
· Gross profit—Our gross profit is impacted by the volume, pricing, and mix of product net revenue, including the geographic location of sales, as well as the related cost of goods sold. Our profitability is significantly impacted by the efficiency of our utilization of plasma including, but not limited to, the production yields we obtain, the product reject rates that we experience, and the product through-put that we achieve.
· SG&A—Our SG&A consists primarily of salaries and related employee benefit costs for personnel in executive, sales and marketing, finance, legal, information technology, human resources, and other administrative functions, as well as fees for professional services, facilities costs, and other general and administrative costs.
· R&D—Our R&D includes the costs directly attributable to the conduct of research and development programs for new products and life cycle management. Such costs include salaries and related employee benefit costs; materials (including the material required for clinical trials); supplies; depreciation on and maintenance of R&D equipment; various services provided by outside contractors related to clinical development, trials and regulatory services; and the allocable portion of facility costs such as rent, depreciation, utilities, insurance and general support services. R&D expenses are influenced by the number and timing of in-process projects and the nature of expenses associated with these projects.
· Interest expense, net—Our interest expense, net, consists of interest expense incurred on outstanding debt and derivative financial instruments and amortization of debt issuance costs and debt discount, offset by interest income and capitalized interest associated with the construction of plant and equipment. The amount of interest expense, net, that we incur is predominately driven by our outstanding debt levels, derivative financial instruments, and associated interest rates.
· Income tax (provision) benefit—Our income tax (provision) benefit includes United States Federal, state, local, and foreign income taxes, and is based on reported pre-tax income.
Year Ended December 31, 2009 as Compared to Year Ended December 31, 2008
The following table contains information regarding our results of operations for the year ended December 31, 2009 as compared to the year ended December 31, 2008:
|
|
|
Years Ended December 31, |
|
Change |
|
|||||||
|
|
|
2009 |
|
2008 |
|
$ |
|
% |
|
|||
|
Net revenue: |
|
|
|
|
|
|
|
|
|
|||
|
Product |
|
$ |
1,507,754 |
|
$ |
1,334,550 |
|
$ |
173,204 |
|
13.0 |
% |
|
Other |
|
25,455 |
|
39,742 |
|
(14,287 |
) |
(35.9 |
)% |
|||
|
Total |
|
1,533,209 |
|
1,374,292 |
|
158,917 |
|
11.6 |
% |
|||
|
Cost of goods sold |
|
901,077 |
|
882,157 |
|
(18,920 |
) |
(2.1 |
)% |
|||
|
Gross profit |
|
632,132 |
|
492,135 |
|
139,997 |
|
28.4 |
% |
|||
|
Operating expenses: |
|
|
|
|
|
|
|
|
|
|||
|
SG&A |
|
289,929 |
|
227,524 |
|
(62,405 |
) |
(27.4 |
)% |
|||
|
R&D |
|
71,223 |
|
66,006 |
|
(5,217 |
) |
(7.9 |
)% |
|||
|
Total |
|
361,152 |
|
293,530 |
|
(67,622 |
) |
(23.0 |
)% |
|||
|
Income from operations |
|
270,980 |
|
198,605 |
|
72,375 |
|
36.4 |
% |
|||
|
Other non-operating (expense) income: |
|
|
|
|
|
|
|
|
|
|||
|
Interest expense, net |
|
(74,491 |
) |
(96,640 |
) |
22,149 |
|
22.9 |
% |
|||
|
Merger termination fee |
|
75,000 |
|
— |
|
75,000 |
|
nm |
|
|||
|
Loss on extinguishment of debt |
|
(43,033 |
) |
— |
|
(43,033 |
) |
nm |
|
|||
|
Equity in earnings of affiliate |
|
441 |
|
426 |
|
15 |
|
3.5 |
% |
|||
|
Total |
|
(42,083 |
) |
(96,214 |
) |
54,131 |
|
56.3 |
% |
|||
|
Income before income taxes |
|
228,897 |
|
102,391 |
|
126,506 |
|
123.6 |
% |
|||
|
Provision for income taxes |
|
(75,008 |
) |
(36,594 |
) |
(38,414 |
) |
(105.0 |
)% |
|||
|
Net income |
|
$ |
153,889 |
|
$ |
65,797 |
|
$ |
88,092 |
|
133.9 |
% |
|
|
|
|
|
|
|
|
|
|
|
|||
|
Earnings per common share: |
|
|
|
|
|
|
|
|
|
|||
|
Basic |
|
$ |
4.56 |
|
$ |
39.01 |
|
$ |
(34.45 |
) |
(88.3 |
)% |
|
Diluted |
|
$ |
1.50 |
|
$ |
0.71 |
|
$ |
0.79 |
|
111.3 |
% |
|
|
|
|
|
|
|
|
|
|
|
|||
|
Financial measures: |
|
|
|
|
|
|
|
|
|
|||
|
Gross profit margin |
|
41.2 |
% |
35.8 |
% |
|
|
|
|
|||
|
Operating margin |
|
17.7 |
% |
14.5 |
% |
|
|
|
|
|||
|
Effective income tax rate |
|
32.8 |
% |
35.7 |
% |
|
|
|
|
|||
nm- not meaningful
Net Revenue
The following table contains information regarding our net revenue:
|
|
|
Years Ended December 31, |
|
Change |
|
|||||||
|
|
|
2009 |
|
2008 |
|
$ |
|
% |
|
|||
|
Product net revenue: |
|
|
|
|
|
|
|
|
|
|||
|
Gamunex IGIV |
|
$ |
826,376 |
|
$ |
677,737 |
|
$ |
148,639 |
|
21.9 |
% |
|
Prolastin A1PI |
|
319,080 |
|
316,495 |
|
2,585 |
|
0.8 |
% |
|||
|
Fraction V (Albumin and Plasmanate) |
|
84,770 |
|
61,075 |
|
23,695 |
|
38.8 |
% |
|||
|
Other |
|
277,528 |
|
279,243 |
|
(1,715 |
) |
(0.6 |
)% |
|||
|
Total product net revenue |
|
1,507,754 |
|
1,334,550 |
|
173,204 |
|
13.0 |
% |
|||
|
Other net revenue |
|
25,455 |
|
39,742 |
|
(14,287 |
) |
(35.9 |
)% |
|||
|
Total net revenue |
|
$ |
1,533,209 |
|
$ |
1,374,292 |
|
$ |
158,917 |
|
11.6 |
% |
|
|
|
|
|
|
|
|
|
|
|
|||
|
United States |
|
$ |
1,011,468 |
|
$ |
906,376 |
|
$ |
105,092 |
|
11.6 |
% |
|
International |
|
521,741 |
|
467,916 |
|
53,825 |
|
11.5 |
% |
|||
|
Total net revenue |
|
$ |
1,533,209 |
|
$ |
1,374,292 |
|
$ |
158,917 |
|
11.6 |
% |
Our product net revenue was $1,507.8 million and $1,334.6 million for the years ended December 31, 2009 and 2008, respectively, representing an increase of $173.2 million, or 13.0%. The increase consisted of higher volumes of $126.8 million and improved pricing of $46.4 million, net of the effects of unfavorable foreign exchange of $8.0 million.
Our other net revenue, which consists of royalties and licensing fees, milestones, and revenues related to contracted services performed for third parties at our Melville facility, decreased $14.3 million. Our other net revenue for the year ended December 31, 2008 included the recognition of $1.9 million of previously deferred revenue as a result of the termination of a licensed technology
agreement with an unaffiliated third party and $2.6 million of a previously deferred upfront licensing fee as a result of the completion of a portion of our performance obligations under a licensed technology agreement with an unaffiliated third party. Our other net revenue for the year ended December 31, 2009 was negatively impacted by lower royalties and licensing fees of $0.7 million and lower Melville contracted services revenue of $7.3 million, as compared to 2008.
The $148.6 million increase in our Gamunex product net revenue consisted of higher volumes of $117.0 million and improved pricing of $31.6 million, net of the effects of unfavorable foreign exchange of $1.7 million. We experienced higher Gamunex volumes of $121.4 million in the U.S., Europe, and other international regions, which were partially offset by lower volumes of $4.4 million in Canada. We experienced improved Gamunex pricing of $37.5 million in the U.S. and Canada, which was partially offset by lower pricing of $5.9 million in Europe and other international regions, including $1.7 million of unfavorable foreign exchange.
In 2009, we experienced a significant increase in demand for Gamunex, driven primarily by supply availability, growth in our GPO and Specialty Pharmacy/Homecare business in the U.S., and geographic expansion. As a result of the success of our plasma collection platform, as well as our plasma supply contract with CSL, we began to alleviate our plasma supply constraints in the second half of 2008, bringing significant additional IGIV volumes to the market, to meet the pent up demand for Gamunex. We believe that this pent up demand has largely been satisfied, and consequently, we would not expect to experience the same high level of accelerated IGIV volume growth that we experienced in second half of 2008 and full year 2009, which will affect our comparative growth in sales and margins in future periods. We expect that our volume growth rate will moderate substantially and effectively grow with market at a long-term compound annual rate of approximately 6% to 8%, matching our Gamunex and fractionation capacities. The supply of IGIV inventory increased throughout the distribution channel as supply became available from the previous low levels.
The $2.6 million increase in our Prolastin product net revenue consisted of higher volumes of $3.7 million, partially offset by lower pricing of $1.1 million. Our Prolastin net revenue for the year ended December 31, 2009 was negatively impacted by unfavorable foreign exchange of $6.1 million which offset price increases of $5.5 million in Europe. In 2009, we also experienced pricing adjustments of $3.4 million in Canada related to a pricing dispute. Prolastin volumes are largely a function of our ability to identify and enroll new patients as compared to the number of patients lost due to attrition and competition. Our ability to grow our European volumes will also depend upon our ability to obtain appropriate reimbursement on a country by country basis. We anticipate the launch of our next generation A1PI product, Prolastin-C, in the U.S. and Canada in the first half of 2010. We received FDA approval for our next generation A1PI product, Prolastin-C, in October 2009 and received Health Canada approval in February 2010. Additional clinical trials are being required by the European authorities as a precursor to Prolastin-C A1PI approval in Europe.
Our Fraction V product category consists of albumin and Plasmanate, with albumin representing the majority of sales in the category. The $23.7 million increase in our Fraction V product net revenue consisted of higher volumes of $19.5 million and improved pricing of $4.2 million. The increase in Fraction V volume was primarily driven by sales in the U.S. and other international regions (excluding Canada and Europe). The increase in Fraction V pricing was primarily driven by favorable pricing in other international regions (excluding Canada and Europe). Fraction V volumes during the year ended December 31, 2008 were negatively impacted by a change in production mix to contracted PPF powder from Fraction V as a result of the settlement of a customer dispute, which occurred during 2007. This change in production mix resulted in lower quantities of Fraction V available for sale during the year ended December 31, 2008.
Our other product net revenue consists primarily of revenue related to the Canadian blood system, where in addition to commercial sales of Gamunex, we have contract manufacturing contracts with the two national Canadian blood system operators, CBS and Hema Quebec, as well as sales of Koate DVI Factor VIII (human), hyperimmunes, intermediate products, Thrombate III (human) and contracted PPF powder.
Our other product net revenue was favorably impacted by improved sales of $8.6 million related to intermediate products, such as cryoprecipitate, and increased sales of Koate DVI Factor VIII (human) of $6.2 million as a result of higher volumes in the U.S. and improved pricing in the U.S. and other international regions (excluding Canada and Europe). Our other product net revenue was negatively impacted by lower contracted PPF powder sales of $14.3 million during the year ended December 31, 2009 as compared to the prior year. During 2008, we experienced higher contracted PPF powder sales as a result of the settlement of a customer dispute as previously discussed. During the year ended December 31, 2009, we recorded a sales adjustment of $3.2 million related to our terminated Bayer European distribution agreement, which we recorded as a reduction of other net product revenue.
We increased prices for several of our products in most of our geographic regions during 2009 as a result of higher costs and generally increasing demand. Our product net revenue was negatively impacted by $8.0 million, or 0.6%, as a result of unfavorable foreign exchange rate fluctuations in relation to the U.S. dollar during the year ended December 31, 2009 as compared to the prior year.
As a result of our internal investigation related to potential FCPA violations, we suspended shipments to affected countries while we put additional safeguards in place. We also terminated several consultants and suspended relations with or terminated some distributors in countries under investigation as circumstances warranted. These actions resulted in a decline in revenue from these countries during 2009. We resumed shipments to several countries during the fourth quarter of 2009 and intend to resume shipments with new safeguards or reallocate product to other countries during 2010.
Cost of Goods Sold and Gross Profit
Our gross profit was $632.1 million and $492.1 million for the years ended December 31, 2009 and December 31, 2008, respectively, representing gross margin of 41.2% and 35.8%, respectively. In general, our gross margin and cost of goods sold are impacted by the volume and pricing of our finished products, our raw material costs, production mix, yield, and cycle times, as well as our production capacities and normal production shut-downs, and the timing and amount of release of finished product. The net impact of these items resulted in higher gross margin during the year ended December 31, 2009 as compared to the prior year.
Our cost of goods sold was $901.1 million, or 58.8% of net revenue, for the year ended December 31, 2009, as compared to $882.2 million, or 64.2% of net revenue, for the year ended December 31, 2008. The decrease in our cost of goods sold as a percentage of net revenue during 2009 was primarily attributable to lower TPR unabsorbed infrastructure and start-up costs of $54.5 million and lower inventory impairment provisions of $5.0 million. The beneficial effects of the foregoing were offset by higher costs of production and costs associated with an increase in production volumes, which aggregated $78.4 million. Due to the relatively fixed nature of our factory overhead and certain other production costs, we experienced operating leverage as production increased during 2009.
Our cost of goods sold for the year ended December 31, 2009 includes higher costs of production of $14.7 million, including foreign exchange, and higher costs associated with an increase in volumes of $52.8 million. The impact of foreign exchange in our cost of production for the year ended December 31, 2009 is not material. During 2009, we incurred non-capitalizable project and start-up costs of $36.9 million, an increase of $10.9 million, as compared to the prior year, related to capital projects. The largest component of our cost of goods sold is the cost of source plasma, which represented greater than 50% of our cost of goods sold in 2009 and 2008. The overall cost of source plasma is impacted by the fully-loaded collection cost per liter, including donor fees, labor, soft goods, facility costs, testing and unabsorbed TPR infrastructure and start-up costs, the cost of plasma purchased from third-parties and variability in protein yields, among other factors. Our internal cost per liter of plasma, including unabsorbed TPR infrastructure and start-up costs, declined by 21.4% during the year ended December 31, 2009, primarily driven by lower unabsorbed infrastructure and start-up costs. Our acquisition cost of plasma per liter of third party plasma increased slightly by 0.30% during the year ended December 31, 2009 as compared to the year ended December 31, 2008. We fractionated approximately 3.6 million liters of plasma during 2009, of which approximately 62% came from plasma collection centers we own and approximately 38% came from third-party plasma supply contracts. Due to our long manufacturing cycle times, which range from 100 days to in excess of 400 days, the cost of plasma is not expensed through cost of goods sold until a significant period of time subsequent to its acquisition.
Unabsorbed TPR infrastructure and start-up costs amounted to $44.0 million and $98.5 million for the years ended December 31, 2009 and 2008, respectively, representing approximately 2.9% and 7.2%, respectively, of our net revenue. Our cost of goods sold during 2009 benefited from lower unabsorbed TPR infrastructure and start-up costs, which resulted from higher plasma volumes collected at our plasma collection centers and improved labor efficiencies as well as lower consulting and management support costs. Unabsorbed TPR infrastructure and start-up costs during the year ended December 31, 2008 were negatively impacted by costs associated with remediation efforts at certain plasma collection centers.
Our inventory impairment provisions, net of recoveries, decreased $5.0 million during the year ended December 31, 2009 as compared to the prior year. During the year ended December 31, 2008, we recorded a net provision of $5.8 million due to the plasma center cGMP issue described in “Management’s Discussion and Analysis of Financial Condition and Results of Operations—Matters Affecting Comparability—Plasma Center cGMP issue.” During the year ended December 31, 2009, we recorded recoveries of $1.9 million related to this issue. During the years ended December 31, 2009 and 2008, we recorded net recoveries of $0.8 million and $7.1 million related to a 2007 customer settlement as described in “Management’s Discussion and Analysis of Financial Condition and Results of Operations—Matters Affecting Comparability—Customer Settlement.” During the year ended December 31, 2008, we recorded an impairment charge of $3.6 million primarily within cost of goods sold related to capital lease assets and leasehold improvements at certain of our plasma collection centers which were closed or were under development and we no longer plan to open. During the year ended December 31, 2008, we also recorded a loss of $3.4 million within cost of goods sold related to two lease commitments associated with properties that we no longer plan to operate as plasma collection centers. During the year ended December 31, 2009, we experienced a delay in the restart of our manufacturing facility located in Melville, New York, following a scheduled maintenance shut-down, which resulted in an inventory impairment provision of $3.4 million. In addition, during 2009, we recorded provisions of $4.2 million related to short-dated finished goods inventories. During the year ended December 31, 2009, we experienced lower work-in-process inventory impairment provisions of $6.9 million as compared to the prior year.
We expect unabsorbed TPR infrastructure and start-up costs to decrease substantially in 2010, primarily due to increased collections as well as cost reductions. This benefit will be partially offset by increased cost of goods sold due to yield variability, less efficient utilization of each incremental liter of plasma fractionated as we increase Gamunex production, and uncapitalizable costs associated with our capital projects, particularly the construction of our new fractionation facility.
Operating Expenses
Our SG&A was $289.9 million and $227.5 million for the years ended December 31, 2009 and 2008, respectively, representing an increase of $62.4 million, or 27.4%. As a percentage of net revenue, SG&A was 18.9% and 16.6% for the years ended December 31, 2009 and 2008, respectively. Our share-based compensation expense recorded in SG&A increased $7.2 million during 2009 as compared to the prior year, driven primarily by the acceleration of the vesting of certain of our Chairman and Chief Executive Officer’s stock options. Our SG&A included legal expenses of $6.0 million and $8.3 million and retention expenses, excluding fringe benefits, of $5.0 million and $3.0 million related to our terminated merger agreement with CSL for the years ended December 31, 2009 and 2008 respectively. Our SG&A for the year ended December 31, 2009 was negatively impacted by $8.0 million of legal costs associated with our internal investigation into potential violations of the FCPA. We experienced higher sales and marketing expenses during 2009 as a result of costs associated with our Gamunex CIDP indication, Prolastin patient identification, as well as support for other products. We also experienced higher charitable donations of $14.9 million during the year ended December 31, 2009 as compared to the prior year. Our provision for uncollectible receivables and advances was $2.1 million higher during 2008 as compared to 2009 as a result of non-cash charges related to outstanding notes receivable and other advances made to one of our plasma suppliers due to uncertainty regarding collection. In order to grow revenues through leveraging our Gamunex brand and our CIDP indication, as well as our focus on A1PI patient identification, we began a significant expansion in the size of our U.S. sales force in the third quarter of 2009. We are also increasing our sales and marketing organization in Europe as well as in other international regions. We expect the sales force expansion to result in an annual increase in SG&A of approximately $10.0 million. Additionally, we expect that our share-based compensation expense will decline subsequent to the first quarter of 2010 when substantially all grants and awards under our 2005 Stock Option and Incentive Plan, our 2006 Restricted Stock Plan and our Special Recognition Bonus Plan are fully vested. Additional information regarding certain items impacting the comparability of our results of operations is included in “Management’s Discussion and Analysis of Financial Condition and Results of Operations—Matters Affecting Comparability.”
Our R&D was $71.2 million and $66.0 million for the years ended December 31, 2009 and 2008, respectively, representing an increase of $5.2 million, or 7.9%. As a percentage of net revenue, R&D was 4.6% and 4.8% for the years ended December 31, 2009 and 2008, respectively. R&D expenses are influenced by the timing of in-process projects and the nature and extent of expenses associated with these projects. The increase in R&D year over year is primarily attributable to increased spending during 2009 related to our Plasmin and recombinant Plasmin new product candidates, partially offset by lower spending attributable to our Prolastin-C A1PI and Gamunex subcutaneous administration life cycle management projects. Additional information regarding our R&D projects is included in “Management’s Discussion and Analysis of Financial Condition and Results of Operations—Research and Development” and “Business—Research and Development.” We anticipate that R&D will increase in subsequent periods primarily as a result of increased Plasmin clinical trials related to aPAO and ischemic stroke as well as increased spending related to our development of recombinant A1PI and Factor VIII.
Total Other Non-Operating Expense, net
Our other non-operating expense, net, includes interest expense related to our indebtedness, which amounted to $56.9 million and $85.7 million for the years ended December 31, 2009 and 2008, respectively. The weighted average annualized interest rates on our outstanding indebtedness, excluding amortization of deferred debt issuance costs and debt discount, were 3.4% and 7.2% for the years ended December 31, 2009 and 2008, respectively. The benefit of the lower cost of borrowings during 2009 was partially mitigated by higher interest expense of $3.9 million related to our interest rate swaps as compared to 2008, as a result of falling three-month LIBOR as compared to our fixed interest rate swaps. The interest rate swap contracts were settled and terminated as discussed below.
As a result of our IPO and refinancing transactions, we recognized a charge during 2009 of $12.1 million to write-off previously deferred debt issuance costs related to our First and Second Lien Term Loans and $30.9 million related to costs associated with the settlement and termination of our interest rate swap contracts. Additional information regarding our IPO and refinancing transactions is included in “Management’s Discussion and Analysis of Financial Condition and Results of Operations—Matters Affecting Comparability—Financial Impact of IPO and Refinancing Transactions.”
Our total other non-operating expense, net, for the year ended December 31, 2009 also includes $75.0 million of non-operating income related to the merger termination fee as discussed in “Management’s Discussion and Analysis of Financial Condition and Results of Operations—Matters Affecting Comparability—Definitive Merger Agreement with CSL Limited (CSL).”
Provision for Income Taxes
Our income tax provision was $75.0 million and $36.6 million for the years ended December 31, 2009 and 2008, respectively, resulting in effective income tax rates of 32.8% and 35.7%, respectively. Our effective income tax rates differed from the U.S. statutory Federal income tax rate of 35% during each period due to the items discussed in the following paragraphs.
For the year ended December 31, 2009, our effective income tax rate is lower than the U.S. statutory Federal income tax rate primarily due to credits for Federal Research and Experimentation and Orphan Drug clinical testing expenditures and the deduction of previously capitalized transaction costs related to the terminated merger agreement with CSL.
For the year ended December 31, 2008, our effective income tax rate is higher than the U.S. statutory Federal income tax rate primarily because the benefit of the credits for Federal Research and Experimentation and Orphan Drug clinical testing expenditures aggregating $4.1 million offset by the effect of capitalizing transaction costs related to the CSL merger agreement, which was terminated in 2009.
At December 31, 2009, our gross unrecognized tax benefits were approximately $12.2 million, of which approximately $8.8 million would reduce our effective income tax rate if recognized.
We have not provided for U.S. Federal income and foreign withholding taxes on our non-U.S. subsidiaries’ cumulative undistributed earnings of approximately $9.7 million as of December 31, 2009 as such earnings are intended to be reinvested outside of the U.S. indefinitely. It is not practicable to estimate the amount of tax that might be payable if some or all of such earnings were to be remitted, and foreign tax credits would be available to reduce or eliminate the resulting U.S. income tax liability.
Net Income
Our net income was $153.9 million and $65.8 million for the years ended December 31, 2009 and 2008, respectively. Our net income for the year ended December 31, 2009 reflects the impact of the CSL merger termination fee of $48.8 million, net of $26.2 million income tax effect, as well as the refinancing charges of $26.3 million, net of $16.7 million income tax effect. The significant factors and events contributing to the change in our net income are discussed above.
Year Ended December 31, 2008 as Compared to Year Ended December 31, 2007
The following table contains information regarding our results of operations for the year ended December 31, 2008 as compared to the year ended December 31, 2007:
|
|
|
Years Ended December 31, |
|
Change |
|
|||||||
|
|
|
2008 |
|
2007 |
|
$ |
|
% |
|
|||
|
Net revenue: |
|
|
|
|
|
|
|
|
|
|||
|
Product |
|
$ |
1,334,550 |
|
$ |
1,196,686 |
|
$ |
137,864 |
|
11.5 |
% |
|
Other |
|
39,742 |
|
21,823 |
|
17,919 |
|
82.1 |
% |
|||
|
Total |
|
1,374,292 |
|
1,218,509 |
|
155,783 |
|
12.8 |
% |
|||
|
Cost of goods sold |
|
882,157 |
|
788,152 |
|
(94,005 |
) |
(11.9 |
)% |
|||
|
Gross profit |
|
492,135 |
|
430,357 |
|
61,778 |
|
14.4 |
% |
|||
|
Operating expenses: |
|
|
|
|
|
|
|
|
|
|||
|
SG&A |
|
227,524 |
|
189,387 |
|
(38,137 |
) |
(20.1 |
)% |
|||
|
R&D |
|
66,006 |
|
61,336 |
|
(4,670 |
) |
(7.6 |
)% |
|||
|
Total |
|
293,530 |
|
250,723 |
|
(42,807 |
) |
(17.1 |
)% |
|||
|
Income from operations |
|
198,605 |
|
179,634 |
|
18,971 |
|
10.6 |
% |
|||
|
Other non-operating (expense) income: |
|
|
|
|
|
|
|
|
|
|||
|
Interest expense, net |
|
(96,640 |
) |
(110,236 |
) |
13,596 |
|
(12.3 |
)% |
|||
|
Equity in earnings of affiliate |
|
426 |
|
436 |
|
(10 |
) |
(2.3 |
)% |
|||
|
Litigation settlement |
|
— |
|
12,937 |
|
(12,937 |
) |
(100.0 |
)% |
|||
|
Total |
|
(96,214 |
) |
(96,863 |
) |
649 |
|
(0.7 |
)% |
|||
|
Income before income taxes |
|
102,391 |
|
82,771 |
|
19,620 |
|
23.7 |
% |
|||
|
(Provision) benefit for income taxes |
|
(36,594 |
) |
40,794 |
|
(77,388 |
) |
(189.7 |
)% |
|||
|
Net income |
|
$ |
65,797 |
|
$ |
123,565 |
|
$ |
(57,768 |
) |
(46.8 |
)% |
|
|
|
|
|
|
|
|
|
|
|
|||
|
Earnings per common share: |
|
|
|
|
|
|
|
|
|
|||
|
Basic |
|
$ |
39.01 |
|
$ |
65.58 |
|
$ |
(26.57 |
) |
(40.5 |
)% |
|
Diluted |
|
$ |
0.71 |
|
$ |
1.36 |
|
$ |
(0.65 |
) |
(47.8 |
)% |
|
|
|
|
|
|
|
|
|
|
|
|||
|
Financial measures: |
|
|
|
|
|
|
|
|
|
|||
|
Gross margin |
|
35.8 |
% |
35.3 |
% |
|
|
|
|
|||
|
Operating margin |
|
14.5 |
% |
14.7 |
% |
|
|
|
|
|||
|
Effective tax rate |
|
35.7 |
% |
(49.3 |
)% |
|
|
|
|
|||
Net Revenue
The following table contains information regarding our net revenue:
|
|
|
Years Ended December 31, |
|
Change |
|
|||||||
|
|
|
2008 |
|
2007 |
|
$ |
|
% |
|
|||
|
Product net revenue: |
|
|
|
|
|
|
|
|
|
|||
|
Gamunex IGIV |
|
$ |
677,737 |
|
$ |
646,779 |
|
$ |
30,958 |
|
4.8 |
% |
|
Prolastin A1PI |
|
316,495 |
|
276,538 |
|
39,957 |
|
14.4 |
% |
|||
|
Fraction V (Albumin and Plasmanate) |
|
61,075 |
|
68,780 |
|
(7,705 |
) |
(11.2 |
)% |
|||
|
Other |
|
279,243 |
|
204,589 |
|
74,654 |
|
36.5 |
% |
|||
|
Total product net revenue |
|
1,334,550 |
|
1,196,686 |
|
137,864 |
|
11.5 |
% |
|||
|
Other net revenue |
|
39,742 |
|
21,823 |
|
17,919 |
|
82.1 |
% |
|||
|
Total net revenue |
|
$ |
1,374,292 |
|
$ |
1,218,509 |
|
$ |
155,783 |
|
12.8 |
% |
|
|
|
|
|
|
|
|
|
|
|
|||
|
United States |
|
$ |
906,376 |
|
$ |
817,276 |
|
$ |
89,100 |
|
10.9 |
% |
|
International |
|
467,916 |
|
401,233 |
|
66,683 |
|
16.6 |
% |
|||
|
Total net revenue |
|
$ |
1,374,292 |
|
$ |
1,218,509 |
|
$ |
155,783 |
|
12.8 |
% |
Our product net revenue was $1,334.6 million for the year ended December 31, 2008 as compared to $1,196.7 million for the year ended December 31, 2007, representing an increase of $137.9 million, or 11.5%. The increase consisted of improved pricing of $122.3 million, including foreign exchange benefit of $9.7 million, as well as volume increases of $15.6 million. Our other net revenue increased $17.9 million primarily due to increased royalties and licensing fees under collaborative agreements, milestones, and other third party contract servicing agreements at our Melville, New York facility.
The $31.0 million increase in our Gamunex product net revenue consisted of improved pricing of $55.0 million, including foreign exchange benefit of $1.8 million, partially offset by volume decreases of $24.0 million. The higher Gamunex pricing primarily related to U.S. and Canadian sales. We experienced lower Gamunex volumes of $35.4 million and $7.7 million in the U.S. and
Europe, respectively, which were partially offset by higher Gamunex volumes of $13.0 million and $6.1 million in Canada and other international regions, respectively. We continue to experience strong demand for Gamunex globally. Our ability to meet this demand is dependent upon our ability to secure adequate quantities of plasma and our ability to release finished product into our distribution channels.
The $40.0 million increase in our Prolastin product net revenue consisted of improved pricing of $19.0 million, including foreign exchange benefit of $7.6 million, and higher volumes of $21.0 million. The improved Prolastin pricing was largely in Europe and the U.S., which increased $10.5 million and $7.6 million, respectively. Prolastin volumes improved $12.8 million and $8.2 million in the U.S. and Europe, respectively. Increases in Prolastin volumes are largely a function of our ability to identify and enroll new patients compared to the number of patients lost due to attrition and competition. Our European growth will also depend upon our ability to obtain appropriate reimbursement on a country by country basis.
Our Fraction V product category consists of albumin and Plasmanate, with albumin representing the majority of sales in the category. The $7.7 million decrease in our Fraction V product net revenue consisted of volume decreases of $17.0 million, partially offset by improved pricing of $9.3 million. The albumin pricing increase was predominantly driven by sales in the U.S., which contributed $7.7 million to the overall pricing improvement. Albumin volumes were negatively impacted by a change in production mix during 2008 to contracted PPF powder from albumin as a result of the settlement of a customer dispute as discussed further in the section titled, “Management’s Discussion and Analysis of Financial Condition and Results of Operations—Matters Affecting Comparability—Customer Settlement.” This change in production mix resulted in lower available quantities of albumin for sale during 2008.
Our other product net revenue increased $74.6 million, or 36.5%, during the year ended December 31, 2008 as compared to the prior year. Our other product net revenue consists primarily of revenue related to the Canadian blood system, where, in addition to commercial sales of Gamunex, we have contract manufacturing contracts with the two national Canadian blood system operators, CBS and Hema Quebec, as well as sales of Koate DVI Factor VIII (human), hyperimmunes, intermediate products, Thrombate III (human), and PPF powder, less SG&A reimbursements to certain international distributors.
Our other product net revenue includes $26.3 million higher revenues during the year ended December 31, 2008 as compared to the prior year as a result of higher volumes of contracted PPF powder in order to comply with contractual commitments associated with the settlement of a customer dispute in 2007 as discussed previously. In addition, we experienced improved pricing and volume of $7.8 million and $14.9 million, respectively, related to intermediate products, such as cryoprecipitate. Our other product net revenue was also favorably impacted by increased Koate DVI Factor VIII (human) of $6.5 million, resulting primarily from improved pricing, and increased sales of Thrombate III (human) of $5.5 million. Finally, our other product net revenue benefited from higher hyperimmune pricing of $16.4 million, partially offset by lower hyperimmune volumes of $7.0 million. The increase in hyperimmune pricing was primarily generated in the U.S. where we increased pricing during the second quarter of 2008.
We increased prices for substantially all of our products in most of our geographic regions as a result of higher costs and demand. Our product net revenue was positively impacted by $9.7 million, or 0.8%, as a result of favorable foreign exchange rate fluctuations in relation to the U.S. dollar during the year ended December 31, 2008 as compared to the prior year. Prices in Canada are determined by contracts with CBS and Hema Quebec. New five year contracts with increased pricing for contract fractionation services and our commercial products, including Gamunex, Plasbumin, and certain hyperimmune products took effect on April 1, 2008. Through the life of the Canadian contracts, prices escalate annually by inflation.
Cost of Goods Sold and Gross Profit
Our gross profit was $492.1 million for the year ended December 31, 2008 as compared to $430.4 million for the year ended December 31, 2007, representing gross margin of 35.8% and 35.3%, respectively. Our gross profit is impacted by the volume, pricing, and mix of our product net revenue as discussed above, as well as the related cost of goods sold as discussed below. The net impact of these items resulted in slightly higher gross margins during the year ended December 31, 2008 as compared to the year ended December 31, 2007.
Our cost of goods sold was $882.2 million for the year ended December 31, 2008 as compared to $788.2 million for the year ended December 31, 2007, representing an increase of $94.0 million, or 11.9%. The increase in our cost of goods sold was driven primarily by higher unabsorbed TPR infrastructure and start-up costs of $28.4 million. Unabsorbed TPR infrastructure and start-up costs amounted to $98.5 million and $70.1 million for the years ended December 31, 2008 and 2007, respectively, representing approximately 7.2% and 5.8%, respectively, of total net revenue. The higher unabsorbed TPR costs during 2008 resulted from the continued expansion of our plasma collection center platform and the costs associated with our remediation efforts in certain centers acquired from IBR as well as certain new centers opened by us. Until our plasma collection centers reach normal operating capacity, we charge unabsorbed overhead costs directly to cost of goods sold.
Our cost of goods sold for the year ended December 31, 2008 includes higher costs of production of $52.3 million, including foreign exchange, and higher costs associated with an increase in volumes of $9.7 million. The impact of foreign exchange in our cost of production for the year ended December 31, 2008 is not material. During 2008, we incurred non-capitalizable project and start-up costs of $26.0 million, an increase of $4.7 million, as compared to the prior year, related to capital projects. The largest component of our cost of goods sold is the cost of source plasma which represented in excess of 50% of our cost of goods sold in 2008 and 2007. The overall cost of source plasma is impacted by the fully-loaded collection cost per liter of source plasma including donor fees, labor, soft goods, facility costs, testing and unabsorbed TPR infrastructure and start-up costs, the cost of plasma purchased from third-parties and variability in protein yields, among other factors. Our internal cost per liter of plasma, including unabsorbed TPR infrastructure and start-up costs, increased by 7.7% during the year ended December 31, 2008, primarily driven by higher unabsorbed infrastructure and start-up costs. Our acquisition cost of plasma per liter of third party plasma increased 10.7% during the year ended December 31, 2008 as compared to the year ended December 31, 2007. Due to our long manufacturing cycle times, which range from 100 days to in excess of 400 days, the cost of plasma is not expensed through cost of goods sold until a significant period of time subsequent to its acquisition.
Our inventory impairment provisions, net, increased $2.0 million during the year ended December 31, 2008 as compared to the prior year. Several of the more significant provisions and recoveries impacting 2008 and 2007 are discussed further in the paragraphs that follow, as well as in the section titled, “Management’s Discussion and Analysis of Financial Condition and Results of Operations—Matters Affecting Comparability.”
During the first and second quarters of 2008, we incurred charges to cost of goods sold of $16.3 million and $7.0 million, respectively, due to deviations from our SOP’s and cGMP at one of our plasma collection centers. As a result of further investigations and new facts and circumstances, we subsequently determined that certain impacted materials were saleable. We recorded recoveries of $17.5 million in 2008 directly to cost of goods sold as the impacted material was converted to finished goods and sold to third parties. We do not expect to recognize significant further recoveries of the impacted material.
We settled a dispute with a customer in September 2007 regarding intermediate material manufactured by us, which is used by this customer in its manufacturing process. We recorded a charge to cost of good sold of $7.9 million during the year ended December 31, 2007, which we recovered in its entirety during 2008 as the related materials were determined to be saleable, converted into finished product, and sold to other customers. During the first half of 2008, we recorded an additional inventory impairment provision of $2.6 million for products held in Europe related to this dispute, for which we subsequently recovered $1.8 million during 2008 as the impacted material was determined to be saleable, converted into finished product, and sold to other customers.
Our inventory impairment provisions, net, for the year ended December 31, 2007 were favorably impacted by a $9.0 million recovery from Bayer related to a Gamunex production incident, which we recorded as a reduction of cost of goods sold during the year ended December 31, 2007. Other production issues during the year ended December 31, 2008 resulted in higher inventory impairment provisions of $3.0 million as compared to the year ended December 31, 2007.
During the year ended December 31, 2008, we recorded an impairment charge of $3.6 million primarily within cost of goods sold related to capital lease assets and leasehold improvements at certain of our plasma collection centers which were closed or were under development and we no longer plan to open. During the year ended December 31, 2008, we also recorded a loss of $3.4 million within cost of goods sold related to two lease commitments associated with properties that we no longer plan to operate as plasma collection centers. During the year ended December 31, 2007, we recorded an impairment charge within cost of goods sold related to equipment of $2.8 million as a result of the discontinuation of a project.
During November 2007, we shut down portions of our Clayton, North Carolina facility consistent with our cGMP operating practices for unplanned maintenance for approximately two weeks. As a result of the unplanned plant maintenance, we recorded $10.0 million directly to cost of goods sold during the year ended December 31, 2007, which would normally have been capitalized to inventories.
Additionally, our cost of goods sold for the year ended December 31, 2008 reflects higher costs of production due to the higher cost of raw materials, production volume variances, and manufacturing mix and product yield variances, among other items. Our cost of goods sold is impacted by our raw material costs, production mix, cycle times, production capacities and normal production shut-downs, and the release of finished product.
Operating Expense
Our SG&A was $227.5 million for the year ended December 31, 2008 as compared to $189.4 million for the year ended December 31, 2007, representing an increase of $38.1 million, or 20.1%. As a percentage of net revenue, SG&A was 16.6% and 15.5% for the years ended December 31, 2008 and 2007, respectively. Our SG&A increased period over period as a result of higher share-based compensation expense of $15.2 million, costs of $8.3 million associated with the regulatory review process of our terminated merger with CSL, which are unlikely to recur, merger related retention expense (including fringe benefits) of $3.3 million, unfavorable foreign exchange impact of $6.7 million resulting from a strengthening U.S. dollar as compared to the euro pertaining
primarily to euro-denominated receivables, bad debt expense of $4.2 million related to outstanding notes receivables and advances to one of our plasma suppliers due to uncertainty regarding collection, and higher sales and marketing, information solutions, finance, human resources, and business development expenses. These items were partially offset by lower special recognition bonus expense of $1.5 million, the absence of legal fees of $5.7 million associated with our litigation with Baxter which was settled in 2007, and the absence of $15.3 million of transition and non-recurring expenses incurred in 2007 associated with the development of our internal capabilities to operate as a standalone company apart from Bayer. Additional information regarding the significant aforementioned items impacting comparability between the periods presented is included in the section titled “Management’s Discussion and Analysis of Financial Condition and Results of Operations—Matters Affecting Comparability.”
Our R&D was $66.0 million for the year ended December 31, 2008 as compared to $61.3 million for the year ended December 31, 2007, representing an increase of $4.7 million, or 7.6%. As a percentage of net revenue, R&D was 4.8% and 5.0% for the years ended December 31, 2008 and 2007, respectively. Research and development expenses are influenced by the timing of in-process projects and the nature of expenses associated with these projects. Our current research and development consists of a range of programs that aim to obtain new therapeutic indications for existing products, enhance product delivery, improve concentration and safety, and increase product yields. Our R&D increased period over period primarily as a result of $4.0 million in milestone payments made to Crucell under the terms of two exclusive commercial license agreements entered into during 2008. Our R&D expense was negatively impacted by higher share-based compensation expense of $1.0 million and merger related retention expense (including fringe benefits) of $0.6 million during 2008 as compared to the prior year. Our current R&D activities continue to support Plasmin studies for aPAO and ischemic stroke, Prolastin Alpha-1 aerosol studies, and the development of Gamunex for subcutaneous administration.
Total Other Non-Operating Expense, net
The primary component of our non-operating expense, net, is interest expense, net, which amounted to $97.0 million and $110.2 million for the years ended December 31, 2008 and 2007, respectively. Our weighted average interest rates on our outstanding debt were 7.2% and 9.9% for the years ended December 31, 2008 and 2007, respectively, which resulted in a lower cost of borrowing during the year ended December 31, 2008 as compared to the year ended December 31, 2007, despite higher average debt levels during 2008. The benefit of the lower cost of borrowing during 2008 was partially mitigated by higher interest expense related to our interest rate swaps of $12.0 million as compared to 2007, as a result of falling three-month LIBOR rates as compared to our fixed swap rates. At December 31, 2008, our interest rate swaps and caps hedged approximately 56.4% of our total borrowings.
As discussed further in the section titled, “Management’s Discussion and Analysis of Financial Condition and Results of Operations —Matters Affecting Comparability,” we recorded other income of $12.9 million during the year ended December 31, 2007 related to a litigation settlement with Baxter.
(Provision) Benefit for Income Taxes
Our income tax provision was $36.6 million for the year ended December 31, 2008 as compared to an income tax benefit of $40.8 million for the year ended December 31, 2007, resulting in effective income tax rates of 35.7% and (49.3)%, respectively. Our effective income tax rates were different than the U.S. statutory Federal income tax rate of 35% during each period due to the items discussed in the following paragraphs.
We recognized a tax benefit of $4.1 million and $10.0 million related to research and development tax credits and $2.0 million and $2.2 million related to qualified production activities during the years ended December 31, 2008 and 2007, respectively, and we recognized a tax benefit of $3.2 million during the year ended December 31, 2007 related to the final settlement of Bayer contingent consideration. These items were partially offset by state income taxes (net of Federal benefit) of $4.1 million and $3.2 million for the years ended December 31, 2008 and 2007, respectively.
We record a valuation allowance to reduce our deferred tax assets to the amount that we believe is more likely than not to be realized. In assessing the need for a valuation allowance, we consider all available evidence, both positive and negative, including historical levels of income, expectations and risks associated with future taxable income, and ongoing prudent and feasible tax planning strategies. As a result of our analysis of all available evidence, which included ten consecutive quarters of cumulative pre-tax profits and our expectations that we can generate sustainable consolidated taxable income for the foreseeable future, we concluded during the third quarter of 2007 that it was more likely than not that our deferred tax assets would be realized, and consequently, we released the remaining valuation allowance related to our deferred tax assets resulting in a $48.2 million non-cash tax benefit. During the year ended December 31, 2007, we also released a portion of our valuation allowance equal to the amount of the current Federal income tax provision.
At December 31, 2008, our gross unrecognized tax benefits were approximately $10.0 million, of which approximately $7.1 million would reduce our effective income tax rate if recognized.
Net Income
Our net income was $65.8 million and $123.6 million for the years ended December 31, 2008 and 2007, respectively. The significant factors and events contributing to the change in our net income are discussed above.
LIQUIDITY AND CAPITAL RESOURCES
Cash Flow Analysis
During the year ended December 31, 2009, we generated cash from operating activities of $234.2 million. We received net proceeds from our IPO and the issuance of our 7.75% Notes of $519.7 million and $583.9 million, respectively, which we used to repay outstanding amounts under our First and Second Lien Term Loans (which were terminated), repay outstanding amounts under our Revolving Credit Facility, and to settle and terminate certain interest rate swap contracts. Subsequently, we settled and terminated our remaining interest rate swap contract. We invested $75.2 million and $30.4 million in capital projects and the acquisition of twelve plasma collection centers from IBR, respectively.
The following table and subsequent discussion and analysis contain information regarding our cash flows for the years ended December 31, 2009, 2008, and 2007:
|
|
|
Years Ended December 31, |
|
|||||||
|
|
|
2009 |
|
2008 |
|
2007 |
|
|||
|
Operating activities: |
|
|
|
|
|
|
|
|||
|
Net income |
|
$ |
153,889 |
|
$ |
65,797 |
|
$ |
123,565 |
|
|
Non-cash items |
|
92,375 |
|
67,272 |
|
(34,413 |
) |
|||
|
Changes in operating assets and liabilities, excluding the effects of business acquisitions |
|
(12,109 |
) |
(100,055 |
) |
37,979 |
|
|||
|
Net cash provided by operating activities |
|
$ |
234,155 |
|
$ |
33,014 |
|
$ |
127,131 |
|
|
|
|
|
|
|
|
|
|
|||
|
Investing activities: |
|
|
|
|
|
|
|
|||
|
Purchase of property, plant, and equipment |
|
$ |
(75,163 |
) |
$ |
(86,212 |
) |
$ |
(65,833 |
) |
|
Financing arrangements with third party suppliers, net of repayments |
|
744 |
|
(16,335 |
) |
(7,866 |
) |
|||
|
Business acquisitions, net of cash acquired |
|
(30,431 |
) |
(10,272 |
) |
(17,456 |
) |
|||
|
Other |
|
232 |
|
880 |
|
510 |
|
|||
|
Net cash used in investing activities |
|
$ |
(104,618 |
) |
$ |
(111,939 |
) |
$ |
(90,645 |
) |
|
|
|
|
|
|
|
|
|
|||
|
Financing activities: |
|
|
|
|
|
|
|
|||
|
(Repayment) borrowings under Revolving Credit Facility |
|
$ |
(179,941 |
) |
$ |
66,904 |
|
$ |
33,117 |
|
|
Repayment of borrowings under term loans |
|
(1,016,000 |
) |
(7,000 |
) |
(7,000 |
) |
|||
|
Repayment of capital lease obligations |
|
(574 |
) |
(1,192 |
) |
(23 |
) |
|||
|
Proceeds from issuance of 7.75% Notes |
|
600,000 |
|
— |
|
— |
|
|||
|
Discount on 7.75% Notes |
|
(4,074 |
) |
— |
|
— |
|
|||
|
Financing transaction costs |
|
(14,879 |
) |
— |
|
(217 |
) |
|||
|
Proceeds from initial public offering, net of issuance costs |
|
519,749 |
|
— |
|
— |
|
|||
|
Costs related to initial public offering |
|
(2,557 |
) |
— |
|
— |
|
|||
|
Repurchases of common stock |
|
(4,183 |
) |
(36,118 |
) |
— |
|
|||
|
Proceeds from exercises of stock options |
|
7,581 |
|
— |
|
— |
|
|||
|
Excess tax benefits from share-based payment arrangements |
|
13,406 |
|
— |
|
— |
|
|||
|
Net cash (used in) provided by financing activities |
|
$ |
(81,472 |
) |
$ |
22,594 |
|
$ |
25,877 |
|
At December 31, 2009 and 2008, our cash and cash equivalents were $65.2 million and $17.0 million, respectively. We use our available cash balances to repay amounts outstanding under our Revolving Credit Facility. We deposit any excess cash amounts into an overnight investment account. At December 31, 2009, we had $323.0 million of unused available borrowing capacity under our Revolving Credit Facility.
We have financed our operations through a combination of equity funding and debt financing, and through internally generated funds. Our borrowing facilities contain certain default provisions and financial covenants as described below.
Cash Flows from Operating Activities
During the year ended December 31, 2009, 2008, and 2007, our net income was $153.9 million, $65.8 million, and $123.6 million, respectively. Our net income for the year ended December 31, 2009 benefited from the $75.0 million (approximately $48.8 million after tax) payment we received from CSL as a result of the termination of the definitive merger agreement. The benefit of the CSL merger termination fee was partially offset by charges totaling $43.0 million (approximately $26.3 million after tax) as a result of the settlement and termination of our interest rate swap contracts and the write-off of deferred debt issuance costs associated with our First and Second Lien Term Loans. During the year ended December 31, 2007, we recognized a non-cash tax benefit of $48.2 million as a result of the release of the remaining valuation allowance related to our deferred tax assets. Additional information regarding our net income for the periods presented is included in “Management’s Discussion and Analysis of Financial Condition and Results of Operations—Results of Operations.”
Our non-cash operating items were $92.4 million, $67.3 million, and $(34.4) million for the years ended December 31, 2009, 2008, and 2007, respectively. The following significant non-cash items impacted the comparability of the net cash provided by our operating activities during the years presented.
· Our depreciation and amortization expense for the years ended December 31, 2009, 2008, and 2007 was $28.9 million, $20.3 million, and $10.7 million, respectively. The increase in depreciation and amortization expense during the years presented reflects our cumulative capital investments primarily related to our manufacturing facilities and TPR.
· Our share-based compensation expense for the years ended December 31, 2009, 2008, and 2007 was $47.5 million, $38.7 million, and $21.2 million, respectively. The increase in the share-based compensation expense during the years presented reflects incremental expense associated with share awards granted of 1,136,036 and 2,334,024 during the years ended December 31, 2009 and 2008, respectively. In addition, during 2009, we accelerated the vesting of certain of our Chairman and Chief Executive Officer’s stock options, which resulted in a non-cash compensation charge of $11.8 million.
· During the year ended December 31, 2009, we recognized a non-cash charge of $12.1 million related to the write-off of unamortized debt issuance costs associated with our First and Second Lien Term Loans as discussed in “Management’s Discussion and Analysis of Financial Condition and Results of Operations—Matters Affecting Comparability—Financial Impact of IPO and Refinancing Transactions.”
· During the year ended December 31, 2008, we recognized previously deferred revenue of $4.8 million as discussed in “Management’s Discussion and Analysis of Financial Condition and Results of Operations—Results of Operations.” No significant amounts were recognized during the years ended December 31, 2009 and 2007.
· During the year ended December 31, 2009, our deferred tax assets decreased $15.4 million, of which $1.2 million is included in operating activities and $14.2 million is included in non-cash financing activities related to the reclassification of the unrealized losses associated with our interest rate swap contracts to earnings upon their settlement and termination. During the years ended December 31, 2008 and 2007, our deferred tax assets increased $5.5 million and $79.7 million, respectively. The increase in our deferred tax assets during the year ended December 31, 2007 resulted primarily from the non-cash tax benefit related to the release of our remaining valuation allowance as discussed previously. Additional information regarding our net deferred tax assets is included in the footnotes to our audited consolidated financial statements included elsewhere in this Annual Report.
· During the year ended December 31, 2009, we recognized excess tax benefits related to share-based compensation of $13.4 million.
Our operating assets (excluding the effects of business acquisitions), net, (increased) decreased $(12.1) million, $(100.1) million, and $38.0 million for the years ended December 31, 2009, 2008, and 2007, respectively, and were driven by the following items.
· Our accounts receivable, net, decreased (increased) $8.6 million, $(26.9) million, and $(9.2) million for the years ended December 31, 2009, 2008, and 2007, respectively. Accounts receivable, net, balances are influenced by the timing of net revenue and customer collections. Our days sales outstanding (DSO) were 32 days, 34 days, and 35 days, for the years ended December 31, 2009, 2008, and 2007, respectively. Our international sales terms generally range from 30 to 120 days due to industry and national practices outside of the U.S., which can impact our DSO results. We calculate DSO as our period end accounts receivable, net, divided by our prior three months’ net sales, multiplied by 90 days. Our calculation of DSO may not be consistent with similar calculations performed by other companies.
· Our inventories (increased) decreased $(57.5) million, $(92.9) million, and $26.8 million for the years ended December 31, 2009, 2008, and 2007, respectively. Our inventories fluctuate based upon our plasma collections, production mix and cycle times, production capacities, normal production shut-downs, finished product releases, targeted safety stock levels, and demand for our products. Our biological manufacturing processes result in relatively long inventory cycle times ranging from 100 days to in excess of 400 days in addition to a required 60 day pre-production holding period for plasma. Specialty plasma, due to its nature, can often have cycle times in excess of one year. Consequently, we have significant investment in raw material and work-in-process inventories for extended periods, and correspondingly, lower levels of finished goods inventories on hand. The increase in our inventories during 2009 was primarily driven by Thrombate III inventory build in preparation of manufacturing transfer from Bayer, increased plasma collections as compared to the prior year, and higher hyperimmune inventory levels. During 2008 and 2007, we repurchased inventories with a value of approximately $28.6 million and $81.9 million, respectively, from a Bayer affiliate in Germany, where we terminated our distribution agreement. During November 2007, we experienced unplanned plant maintenance as discussed previously, which resulted in lower inventory at December 31, 2007, thus impacting the 2008 comparability.
· Our prepaid expenses and other assets decreased (increased) $8.0 million, $(15.8) million, and $0.2 million for the years ended December 31, 2009, 2008, and 2007, respectively. The decrease in our prepaid expenses and other assets during 2009 was primarily driven by a reclassification of $10.1 million of prepaid plasma to raw material inventories as a result of plasma deliveries from IBR upon center licensures, for which we subsequently acquired the centers. This was partially offset by higher corporate prepaid amounts, including insurance and various service contracts. The increase in our prepaid expenses and other assets during 2008 was primarily driven by a $9.7 million increase in prepaid plasma and a $7.8 million increase in prepaid income taxes, partially offset by lower corporate prepaid amounts. Under the terms of our 2007 Supply Agreement with IBR, we were required to prepay 90% for unlicensed plasma. Upon center licensure, we remit the remaining 10% to IBR and reclassify the prepaid amounts to raw material inventories. The change in our prepaid expenses and other assets during 2007 was not material.
· Our operating liabilities increased $28.8 million, $35.5 million, and $20.2 million for the years ended December 31, 2009, 2008, and 2007, respectively. Our liabilities fluctuate as a result of our cash management strategies and varying due dates of accounts payable, accrued expenses, and other liabilities. The increase in our liabilities in 2009 was primarily driven by higher accounts payable obligations of $16.1 million and higher Medicaid, commercial rebates, and chargebacks of $14.2 million, partially offset by lower interest payable and accrued goods and services. The increase in our liabilities in 2008 was primarily driven by higher accounts payable obligations of $16.6 million, higher accrued payroll, bonuses, and benefits of $13.7 million, higher Medicaid, commercial rebates, and chargebacks of $2.2 million, and generally higher liabilities for accrued goods, services, and other items, partially offset by lower taxes payable of $10.6 million. The increase in our liabilities in 2007 was primarily driven by higher accounts payable obligations of $12.1 million, higher accrued payroll, bonuses, and benefits of $12.5 million, higher Medicaid, commercial rebates, and chargebacks of $5.5 million, higher interest payable of $11.8 million, higher taxes payable of $9.8 million, partially offset by lower payables to related parties of $27.3 million as a result of the termination of many of our then existing transition services and distribution agreements with Bayer, and generally lower accrued goods, services, and other items.
Cash Flows from Investing Activities
Our capital expenditures were $75.2 million, $86.2 million, and $65.8 million for the years ended December 31, 2009, 2008, and 2007, respectively. Our capital expenditures reflect investments in our facilities to support a platform for future growth and efficiency improvements, including compliance enhancements, general infrastructure upgrades, capacity expansions, and new facilities. Our capital expenditures also reflect investments in our TPR infrastructure to support our plasma collection efforts. Our capital expenditures for the year ended December 31, 2009 reflect significantly lower spending related to our TPR infrastructure as compared 2008 and 2007 as a result of the maturation of our plasma collection platform, as well as the completion of several projects. Our 2009 capital expenditures include higher spending related to reliability/compliance initiatives, as well as the initial investments in our new fractionation strategic program. In addition, significant investment which occurred in 2008 continued into 2009 for the new Thrombate III purification facility, which is now mechanically complete. Two earlier investments, our Prolastin-C A1PI facility and our Koate purification expansion Phase I project were approved by the FDA during 2009. Additional information regarding our currently planned capital programs is included in “Management’s Discussion and Analysis of Financial Condition and Results of Operations—Liquidity and Capital Resources—Sources of Credit, Access to Capital and Cash Requirements, and Credit Ratings.”
Our cash flows used in investing activities also include various cash outflows for the development of our plasma collection center platform, including the purchase price of plasma collection centers acquired from IBR and loans and advances made to third-party plasma suppliers, net of repayments, for the development of plasma collection centers for which we had the option to purchase under certain conditions. We completed the acquisition of twelve plasma centers during 2009 as compared to three centers in both 2008 and 2007. The IBR center acquisition program was completed as a result of our purchase of the remaining centers under that agreement in 2009.
Cash Flows from Financing Activities
We completed our IPO on October 6, 2009, which resulted in net proceeds to us of $519.7 million after deducting underwriters’ discounts and commissions. We used the net proceeds to us from the IPO to repay $389.8 million and $129.9 million of principal under our First and Second Lien Term Loans, respectively. We incurred legal and other costs related to our IPO of approximately $3.9 million, of which $2.6 million is included as a reduction of additional paid-in capital. On October 21, 2009, we completed a $600.0 million private placement of our 7.75% Notes at an issue price of 99.321% of par, which resulted in net proceeds to us of $583.9 million after deducting underwriters’ commissions and the discount. We used a portion of the net proceeds to us from the issuance of the 7.75% Notes to repay $290.9 million and $200.1 million under our First and Second Lien Term Loans, respectively, and $55.6 million of principal under our Revolving Credit Facility. We incurred total debt issuance costs related to the issuance of the 7.75% Notes and the Revolving Credit Facility amendment of $14.9 million. During the year ended December 31, 2009, we made contractual principal payments of $5.3 million under our First Lien Term Loan and during the years ended December 31, 2008 and 2007, we made contractual principal payments of $7.0 million under our First Lien Term Loan. Outstanding amounts under our Revolving Credit Facility fluctuate based upon our business needs.
During the year ended December 31, 2009, we repurchased 251,108 shares of our common stock from employees for $4.2 million to settle their withholding tax obligations. During the year ended December 31, 2009, we received proceeds from the exercise of 2,394,762 stock options of $7.6 million. During the year ended December 31, 2008, we repurchased 2,146,232 shares of our common stock from IBR for $33.5 million, plus accrued interest of $1.9 million, and 69,648 shares of our common stock from employees for $0.7 million to settle their withholding tax obligations. During the year ended December 31, 2009, we recognized excess tax benefits related to share-based compensation of $13.4 million.
Sources of Credit, Access to Capital and Cash Requirements, and Credit Ratings
Sources of Credit
Our sources of credit as of December 31, 2009 are summarized in the following table:
|
|
|
|
|
Reductions in |
|
|
|
|
|
||||
|
|
|
|
|
Available Credit |
|
|
|
|
|
||||
|
|
|
|
|
Facility for |
|
|
|
|
|
||||
|
|
|
Maximum |
|
Other |
|
December 31, 2009 |
|
||||||
|
|
|
Amounts |
|
Financial |
|
Amounts |
|
Amounts |
|
||||
|
Debt Instrument |
|
Available |
|
Instruments (1) |
|
Outstanding |
|
Available |
|
||||
|
7.75% Notes |
|
$ |
600,000 |
|
$ |
— |
|
$ |
600,000 |
|
$ |
— |
|
|
Revolving Credit Facility |
|
325,000 |
|
2,040 |
|
— |
|
322,960 |
|
||||
|
Total sources of credit |
|
$ |
925,000 |
|
$ |
2,040 |
|
$ |
600,000 |
|
$ |
322,960 |
|
(1) Amounts represent letters of credit used as security for utilities, insurance, and third party warehousing.
7.75% Unsecured Senior Notes, due November 15, 2016
On October 21, 2009, we completed the issuance of $600.0 million, 7.75% Senior Unsecured Notes, due November 15, 2016, at a price of 99.321% of par, in a private placement to certain qualified institutional buyers. The 7.75% Notes yield 7.875% to maturity and pay interest semi-annually on May 15 and November 15 to holders of record on the immediately preceding May 1 and November 1, respectively. The 7.75% Notes are guaranteed on a senior unsecured basis by our existing and future domestic subsidiaries. Except as described below, we will not be entitled to redeem the 7.75% Notes at our option prior to November 12, 2012.
We may redeem some or all of the 7.75% Notes, at our option, at any time on or after November 12, 2012, at the redemption prices (expressed as percentages of principal amount) set forth below plus accrued and unpaid interest and additional interest, if any, on the 7.75% Notes redeemed, to the applicable redemption date, if redeemed during the twelve-month period beginning on November 15 of the years indicated below:
|
Fiscal Year |
|
Percentage |
|
|
2012 |
|
103.875 |
% |
|
2013 |
|
102.583 |
% |
|
2014 |
|
101.292 |
% |
|
2015 and thereafter |
|
100.000 |
% |
In addition, at any time during each twelve-month period ending on November 15, 2010, 2011, and 2012, we may redeem up to 10% of the originally issued principal amount of the 7.75% Notes at a redemption price of 103% of the principal amount of the 7.75% Notes redeemed plus accrued and unpaid interest and additional interest, if any, to the redemption date, subject to the rights of the holders of the 7.75% Notes on the relevant record date to receive interest due on the relevant interest payment date.
At any time, or from time to time, on or prior to November 15, 2012, we may, at our option, redeem up to 35% of the aggregate principal amount of the 7.75% Notes issued under the indenture with the net cash proceeds to us of certain equity offerings at a redemption price equal to 107.75% of the principal amount of the 7.75% Notes plus accrued and unpaid interest and additional interest, if any, to the applicable redemption date, provided that at least 65% of the aggregate principal amount of the 7.75% Notes originally issued remains outstanding immediately after such redemption and the redemption occurs within 90 days of the date of the closing of such equity offering.
Under the Make-Whole redemption feature, we may redeem 100% of the principal plus a premium as defined under the indenture (computed using a discount rate equal to the U.S. Treasury rate as of such redemption date plus 0.50%), plus accrued and unpaid interest and additional interest, if any, prior to November 15, 2012, with respect to some or all of the 7.75% Notes, subject to the rights of the holders on the relevant record date to receive interest due on the relevant interest payment date.
We are not required to make mandatory redemption or sinking fund payments with respect to the 7.75% Notes.
Upon a change of control, the 7.75% Notes are puttable at 101% of principal plus accrued and unpaid interest and additional interest, if any.
We may incur additional indebtedness and our subsidiary guarantors may also incur additional indebtedness if our Fixed Charge Coverage Ratio for our most recently ended four full fiscal quarters immediately preceding the date on which such additional indebtedness is incurred would have been at least 2.00 to 1.00, determined on a pro forma basis.
The indenture contains certain covenants limiting, subject to exceptions, carve-outs and qualifications, our ability and our restricted subsidiaries to: (i) sell assets; (ii) pay distributions on, redeem or repurchase its capital stock or redeem or repurchase its subordinated debt; (iii) make certain investments; (iv) incur or guarantee additional indebtedness or issue preferred stock; (v) create or incur certain liens; (vi) enter into agreements that restrict distributions or other payments from our restricted subsidiaries to us; (vii) engage in certain sale and leaseback transactions; (viii) engage in certain transactions with affiliates; (ix) transfer or dispose of the capital stock of the restricted subsidiary to persons other than us or our restricted subsidiaries; and (x) create unrestricted subsidiaries. The indenture also contains certain customary events of default.
In connection with the sale of the 7.75% Notes, we and our subsidiaries that guaranteed the 7.75% Notes entered into an exchange and registration rights agreement with the initial purchasers of the 7.75% Notes on October 21, 2009, pursuant to which we are obligated, by April 19, 2010, to file with Securities and Exchange Commission under the Securities Act of 1933, as amended, a registration statement with respect to an offer to exchange the 7.75% Notes (and guarantees) for substantially identical new notes (and guarantees) of ours. If we are not able to effect this exchange offer, we have agreed to file a shelf registration statement relating to re-sales of the 7.75% Notes. We will be obligated to pay damages consisting of additional interest on the 7.75% Notes if, within the periods specified in the Registration Rights Agreement, we do not file the exchange offer registration statement or the shelf registration statement or we do not comply with certain other obligations under the Registration Rights Agreement.
Revolving Credit Facility
We have a $325.0 million asset-based credit agreement administered by Wachovia Bank, N.A., an affiliate of Wells Fargo Securities, which was amended on October 15, 2009 as described below. We use our available cash balances to repay amounts outstanding under this Revolving Credit Facility. We deposit any excess cash amounts into an overnight investment account. Outstanding principal under this facility is due and payable on the maturity date of December 6, 2011.
Borrowings under this facility bear interest at a rate based upon either ABR or LIBOR, at our option, plus applicable margins based upon borrowing availability. The ABR represents the greater of the Federal Funds Effective Rate plus 0.50% or the Prime Rate. Interest accrues on the Revolving Credit Facility at the ABR plus 0.25-0.75% or LIBOR plus 1.50-2.00%. For the years ended December 31, 2009, 2008, and 2007, the weighted average interest rates of our Revolving Credit Facility were 2.79%, 4.79%, and 7.90%, respectively. At December 31, 2008, the interest rates on the ABR and LIBOR borrowings were 3.75% and 2.82%, respectively. No amounts were outstanding under the Revolving Credit Facility at December 31, 2009.
The Revolving Credit Facility is secured by a Pledge and Security Agreement dated December 6, 2006 under which substantially all of our personal property, including manufacturing equipment, accounts receivable, inventory, and stock are pledged
as security, each as defined within the agreement.
The Revolving Credit Facility contains default provisions, and, pursuant to the October 15, 2009 amendment described below, imposes restrictions on annual capital expenditures if our leverage ratio is 2.00 to 1.00 or less, and contains a financial covenant which requires us to maintain a fixed charge coverage ratio of at least 1.10 to 1.00 if our borrowing availability based on eligible collateral is less than $48.75 million. The Revolving Credit Facility defines certain terms in calculating covenant ratios, including adjusted EBITDA and Indebtedness.
The borrowing base under our Revolving Credit Facility is based on our accounts receivable and inventory, and is calculated as (i) 85% of our eligible accounts receivable plus (ii) the lesser of (a) 65% of our eligible inventory (valued on a first-in-first-out basis), (b) 85% of the net orderly liquidation value of our eligible inventory as determined by a recent appraisal, and (c) $300 million. Only up to $100 million may be advanced to us based on the value of our work-in-process inventory (with “filled-not-packed” and “packed-not-released” inventory being considered finished goods inventory). From time to time, the collateral agent under the Revolving Credit Facility may modify our eligibility standards, establish or adjust reserves, or reduce one or more of the other elements used in computing the borrowing base.
On October 15, 2009, we entered into an amendment to the Revolving Credit Facility dated as of October 12, 2009. The Revolving Credit Facility, as amended, permitted the 7.75% Notes, described above, to be issued as long as the First and Second Lien Term Loan Credit Agreements were terminated in connection with the offering of the 7.75% Notes. The amendment also (i) increases the covenant baskets for permitted acquisitions to $250 million, (ii) permits the payment of cash dividends commencing with the first fiscal quarter of 2010 if certain conditions are met, and (iii) increases our capital expenditure baskets so that we will be permitted to make capital expenditures of up to $225 million in each of 2010 and 2011. Moreover, pursuant to the amendments, we are not subject to any limitation on our capital expenditures in any fiscal year if our leverage ratio, as defined, as of the end of the fiscal year most recently ended was less than or equal to 2.00 to 1.00. Minimum availability tests under the Revolving Credit Facility were also increased from $32.5 million to $48.75 million in connection with the amendment.
Our Revolving Credit Facility, as amended, permits the payment of cash dividends to holders of our common stock commencing with the first fiscal quarter of 2010, so long as (i) the Leverage Ratio determined as of the end of the immediately preceding fiscal quarter for the then most recently completed four fiscal quarters, is equal to or less than 2.00 to 1.00 and (ii) the minimum pro forma Availability as of the date of such dividend (after giving effect to such cash dividend, the funding of all Revolving Loans, and the issuance of all Letters of Credit to be funded or issued as of such date) is not less than $48.75 million; provided that, the aggregate amount of Restricted Payments shall not exceed 50% of Net Income during the period from October 1, 2009 to the end of the most recently ended fiscal quarter as of the date of the Restricted Payment.
First and Second Lien Term Loans
Our First and Second Lien Term Loans were repaid in full and terminated as a result of the application of the net proceeds to us from our October 6, 2009 IPO and the issuance of our 7.75% Notes on October 21, 2009. The weighted average annualized interest rates on the First Lien Term Loan were 4.66%, 6.60%, and 9.07% for the years ended December 31, 2009, 2008, and 2007, respectively, and the weighted average annualized interest rates on the Second Lien Term Loan were 7.68%, 9.63%, and 12.13% for the years ended December 31, 2009, 2008, and 2007, respectively. At December 31, 2008, the interest rate on the First and Second Lien Term Loans were 5.64% and 8.64%, respectively.
Interest Rate Swaps and Caps
We used $28.7 million of the net proceeds to us from the issuance of our 7.75% Notes to settle and terminate certain interest rate swap contracts with a notional amount of $390.0 million. Subsequently, we settled and terminated our remaining interest rate swap contract with a notional amount of $50.0 million for $6.1 million. As a result of the settlement and termination of these interest rate swap contracts, we recognized a charge of $30.9 million (approximately $18.9 million after tax) during the year ended December 31, 2009 within total other non-operating expense, net, in our consolidated income statement. At December 31, 2008, $23.3 million, net of taxes, was recorded in accumulated other comprehensive loss, related to our interest rate swap contracts. As a result of their settlement and termination, we reclassified $23.3 million out of accumulated other comprehensive loss to loss on extinguishment of debt within total other non-operating expense, net, in our consolidated income statement for the year ended December 31, 2009.
At December 31, 2008, we had five variable-to-fixed interest rate swap contracts with an aggregate notional amount of $500.0 million and two interest rate cap contracts with an aggregate notional principal amount of $175.0 million outstanding, respectively. At December 31, 2008, the fair value of our interest rate derivatives was $37.5 million, which was recorded primarily in other long-term liabilities on our consolidated balance sheet. Fair value was calculated using Level 2 inputs, which included forward LIBOR curves and credit default swap data. At December 31, 2009, we had two interest rate cap contracts with a notional principal amount of $175.0 million outstanding for which the cap rate of 6.00% was significantly higher than prevailing market interest rates; therefore, the fair market value was zero.
Access to Capital and Cash Requirements
At December 31, 2009, our cash and cash equivalents totaled $65.2 million. We use our available cash balances to repay amounts outstanding under our Revolving Credit Facility. We deposit any excess cash amounts into an overnight investment account. At December 31, 2009, no amounts were outstanding under our Revolving Credit Facility and we had unused available borrowing capacity of $323.0 million.
We expect our cash flows from operations combined with our cash balances and availability of our Revolving Credit Facility to provide sufficient liquidity to fund our current obligations, projected working capital requirements, and capital expenditures for at least the next twelve months. As of the date of this Annual Report, we believe that we are currently in compliance with all covenants or other requirements set forth in our credit facilities.
Our working capital, which is driven primarily by our accounts receivable turnover and inventory production times, including plant turnarounds, can vary significantly period to period. Our capital requirements will depend on many factors, including our rate of sales growth, acceptance of our products, costs of securing access to adequate manufacturing capacities, maintaining cGMP compliant facilities, the timing and extent of research and development activities, and changes in operating expenses, including costs of production and sourcing of plasma, all of which are subject to uncertainty. We anticipate that our cash needs will be significant and that we may need to increase our borrowings under our credit facilities in order to fund our operations and strategic initiatives. We anticipate that our working capital will increase in order to grow our business. In particular, we expect to increase inventories to optimize fractionation capacity.
Although we believe that our capital spending for the years ended December 31, 2009 and 2008 is more indicative of our annual capital spending, we anticipate significantly higher capital spending over the next five years. We expect that our capital spending over the next five years to be in the range of $750 million to $800 million on a cumulative basis, substantially higher than it has been in the past. Given the nature of our planned capital projects, we anticipate our capital spending to range from $180 million to $190 million in 2010 and to increase to a peak of $240 million to $260 million in 2011. Most of the anticipated capital spending will be necessary to support our future volume growth, particularly with the anticipation that we will reach our fractionation capacity in the near term, launch new product introductions and complete strategic initiatives. Incremental capital spending will continue to be required to ensure ongoing maintenance and compliance of our facilities.
The amount and timing of future capital spending is dependent upon a number of factors, including market conditions, regulatory requirements, and the extent and timing of particular projects, among other things. The design and construction of a new, higher-capacity fractionation facility, which we currently estimate will range from $280 million to $300 million in cost, based on conceptual engineering, and anticipate will be operational by 2015; construction of new purification facilities for Plasmin, Koate, and albumin are estimated to cost approximately $160 million; and projects to support continued new product development, among others. Our planned capital program also includes projects to increase our fractionation capacities. To the extent we discontinue a capital project, we would write-off a portion or all previously capitalized amounts through a charge to our consolidated income statement. As a result of our anticipated capacity constraints, we plan to build our Gamunex inventories, which will increase our working capital requirements. The first phase of our Factor VIII purification expansion project, as well as reliability improvements, has been completed. In addition, we have completed construction of our new Thrombate III purification facility as well as our new Prolastin-C A1PI purification facility. Capital expenditures for these facilities were approximately $30 million and $26 million, respectively, through December 31, 2009.
On an ongoing basis, we expect to evaluate means to moderate our capital spending, including implementing projects in phases, exploring government subsidies, exploring strategic partnerships, and the like. We may need to incur future debt or issue additional equity if our cash flows and capital resources are insufficient to finance these various activities, particularly in light of the scheduled maturity of our Revolving Credit Facility in December 2011. Additional funds may not be available on terms favorable to us, or at all.
Credit Ratings
Our credit ratings at December 31, 2009 were as follows:
|
|
|
|
|
Standard & |
|
|
|
|
Moody’s |
|
Poor’s |
|
|
Outlook: |
|
|
|
|
|
|
7.75% Notes |
|
B1 |
|
BB |
|
|
Corporate Family Rating |
|
Ba3 |
|
BB |
|
Factors that can affect our credit ratings and outlook include changes in our operating performance, financial position, business strategy, and the overall economic environment for the plasma-derived products business. If a downgrade of our credit ratings or outlook were to occur, it could adversely impact, among other things, our future borrowing costs and access to capital markets.
CONTRACTUAL OBLIGATIONS
The following table summarizes our significant contractual obligations as of December 31, 2009:
|
|
|
Payments Due by Period |
|
|||||||||||||
|
|
|
|
|
Less than |
|
|
|
|
|
More than |
|
|||||
|
|
|
Total |
|
1 Year |
|
1-3 Years |
|
4-5 Years |
|
5 Years |
|
|||||
|
Long-term debt (1) |
|
$ |
600,000 |
|
$ |
— |
|
$ |
— |
|
$ |
— |
|
$ |
600,000 |
|
|
Interest payments (2) |
|
328,600 |
|
49,600 |
|
139,500 |
|
93,000 |
|
46,500 |
|
|||||
|
Capital lease obligations |
|
15,157 |
|
1,740 |
|
5,356 |
|
3,455 |
|
4,606 |
|
|||||
|
Operating lease obligations |
|
50,486 |
|
16,727 |
|
24,759 |
|
5,351 |
|
3,649 |
|
|||||
|
Purchase commitments (3) |
|
719,530 |
|
202,307 |
|
350,307 |
|
108,542 |
|
58,374 |
|
|||||
|
Total |
|
$ |
1,713,773 |
|
$ |
270,374 |
|
$ |
519,922 |
|
$ |
210,348 |
|
$ |
713,129 |
|
(1) Long-term debt in the table above consists of outstanding amounts under our 7.75% Notes. We also have a $325.0 million Revolving Credit Facility, maturing on December 6, 2011, for which no amounts were outstanding at December 31, 2009. The 7.75% Notes are redeemable or puttable prior to their scheduled maturity of November 15, 2016 under certain circumstances as described further in “Management’s Discussion and Analysis of Financial Condition and Results of Operations—Liquidity and Capital Resources.”
(2) Interest payments related to long-term debt in the table above consists of interest amounts under our 7.75% Notes. We also have a $325.0 million variable rate Revolving Credit Facility, for which no amounts were outstanding at December 31, 2009.
(3) Includes material agreements to purchase goods and services that are enforceable and legally binding.
In addition to the contractual obligations disclosed in the table above, we have other contractual obligations for which the timing and extent of future payments are not known. We have described these potential obligations in the following paragraphs.
We have employment agreements and offer letters with certain of our employees which require payments generally ranging from 100% to 200% of the employee’s annual compensation if employment is terminated not for cause by us, or by the employee, for good reason, as defined. Certain of these arrangements also include provisions for payments of bonuses under our annual incentive plan and the vesting of equity awards, as well as other customary payments, such as accrued personal days, bonuses, continuing benefits, and outplacement services. Unless such termination is for cause, if such termination occurs within a specified period following a change in control of the Company, as therein defined, the agreements generally require us to vest all of the employees’ stock-based compensation.
We have two exclusive commercial license agreements for advanced protein production technology with Crucell. In consideration of the licenses that Crucell has granted us, we paid upfront license fees of $4.0 million during 2008 and additional milestones of $0.5 million during 2009 and could be required to pay up to $48.0 million of additional development milestones as certain activities are completed. Under the terms of both agreements, we may terminate either agreement by giving Crucell 90 days prior written notice and payment of all outstanding amounts owed to Crucell. If products developed under these agreements are sold, we would be required to pay royalties to Crucell ranging from 3% to 5% of net sales from recombinant Factor VIII and from 3.5% to 6% of net sales from recombinant A1PI. We currently anticipate paying milestones of $1.5 million and $2.0 million during 2010 and 2011, respectively, under these agreements.
At December 31, 2009, $11.1 million of unrecognized tax benefits have been recorded as liabilities for uncertain income tax positions. The ultimate resolution of our uncertain income tax positions is dependent on uncontrollable factors such as law changes, new case law, and the willingness of the income tax authorities to settle, including the timing thereof, and other factors. Although we do not anticipate significant changes to our uncertain income tax positions in the next twelve months, items outside of our control could cause our uncertain income tax positions to change in the future.
During 2010, we estimate our capital spending to range from $180 million to $190 million based upon our current plan. Actual
spending will vary based upon changes to the timing and scope of planned projects, including project deferral or acceleration, as well as new opportunities. Additional information regarding our planned capital projects is included in “Management’s Discussion and Analysis of Financial Condition and Results of Operations——Liquidity and Capital Resources.” At December 31, 2009, we have commitments for capital spending to be made in 2010 totaling $31.6 million.
OFF-BALANCE SHEET ARRANGEMENTS
As of December 31, 2009, we do not have any off-balance sheet arrangements that are material or reasonably likely to be material to our consolidated financial position or results of operations.
NON-GAAP FINANCIAL MEASURE
We believe that a meaningful analysis of our historical operating performance is enhanced by the use of adjusted EBITDA. Adjusted EBITDA is a financial measure that is not defined by U.S. GAAP. A non-GAAP financial measure is a numerical measure of a company’s financial performance that (i) excludes amounts, or is subject to adjustments that have the effect of excluding amounts, that are included in a comparable measure calculated and presented in accordance with U.S. GAAP in the statement of operations, such as net income, or the statement of cash flows, such as operating cash flow; or (ii) includes amounts, or is subject to adjustments that have the effect of including amounts, that are excluded from the comparable measure so calculated and presented. Adjusted EBITDA should not be considered a substitute for any performance measure determined in accordance with U.S. GAAP. We do not rely solely on adjusted EBITDA as a performance measure and also consider our U.S. GAAP results. Because adjusted EBITDA is not calculated in the same manner by all companies, it may not be comparable to similarly titled measures used by other companies. To properly and prudently evaluate our business, we encourage you to also review our U.S. GAAP consolidated financial statements included elsewhere in this Annual Report, and not to rely on any single financial measure to evaluate our business. Adjusted EBITDA has material limitations as an analytical tool and you should not consider this measure in isolation, or as a substitute for analysis of our results as reported under U.S. GAAP.
Adjusted EBITDA is used by our management, our lenders, and the compensation committee of our board of directors as follows:
· Our management uses adjusted EBITDA as one of our primary financial performance measures in the day-to-day oversight of our business to, among other things, allocate financial and human resources across our organization, determine appropriate levels of capital investment and research and development spending, determine staffing needs and develop hiring plans, manage our plants’ production plans, and assess appropriate levels of sales and marketing initiatives. Our management uses adjusted EBITDA in its decision making because this supplemental operating performance measure facilitates internal comparisons to historical operating results and external comparisons to competitors’ historical operating results by eliminating various income and expense items which are either not part of operating income or may vary significantly when comparing our results among the periods presented to our competitors or other companies.
· The compensation committee uses adjusted EBITDA as a financial performance objective because it is one of our primary financial performance measures used in the day-to-day oversight of our business to, among other things, allocate financial and human resources across our organization, determine appropriate levels of capital investment and research and development spending, determine staffing needs and develop hiring plans, manage our plants’ production plans, and assess appropriate levels of sales and marketing initiatives. In 2009 and prior years, the compensation committee used unlevered free cash flow because it measures management’s effectiveness in managing cash and the related impact on interest expense. In order to motivate top performance by our executives, we establish a target level for each of the various performance criteria that is high enough that there is no certainty it is achievable. The target level for any performance criterion changes from year to year. These target performance levels reflect challenges with respect to various factors such as sales volume and pricing, cost control, working capital management, plasma platform objectives, R&D objectives and sales and marketing objectives, among others. Our compensation committee has discretion to adjust the actual results related to the performance targets positively or negatively for items which, in the opinion of the compensation committee, were not reasonably within management’s control. The compensation committee also evaluates the manner in which actual results were achieved to determine if unusual actions or risks were taken that would impact or manipulate the results.
· Our lenders use adjusted EBITDA to determine compliance with the Leverage Ratio financial covenant under our Revolving Credit Facility, which is calculated as debt less cash divided by the last twelve months’ adjusted EBITDA. The terms of our Revolving Credit Facility remove restrictions on our annual capital expenditures if our Leverage Ratio is greater than 2.00 to 1.00. Our 7.75% Notes use a similar measure referred to as Consolidated Cash Flow to determine compliance with the Fixed Charge Coverage Ratio, which allows for the incurrence of indebtedness and issuance of
qualified and preferred stock if at least 2.00 to 1.00.
Certain items that we eliminate in calculating adjusted EBITDA have been, and we expect will continue to be, significant to our business. For example:
· Interest expense is a necessary element of our costs and is largely a function of our capital structure and reflects our debt levels;
· Depreciation and amortization primarily result from the allocation of resources relative to investment decisions by our management and board of directors;
· Income tax expense results from our performance and applying statutory tax rates in the jurisdictions in which we operate coupled with the application of income tax accounting guidance and tax planning strategies;
· Non-cash compensation expense is expected to be a recurring component of our costs, although we expect that we will not grant share-based compensation in the same magnitude in the future;
· Expenses related to our special recognition bonuses are significant, and although we do not expect to grant bonuses in this magnitude in the future, bonuses will continue to be a key component of compensation to retain and attract employees; and
· Expenses related to debt extinguishment represent a necessary element of our costs to the extent that we restructure our debt.
Although we currently believe other items such as management fees, transition and unusual or non-recurring expenses, and retention bonuses will not recur in the future in the same magnitude that they have occurred in the past, we may incur similar charges in the future. Other items, such as impairment charges, are not predictable, and therefore, we could incur similar charges in the future.
In the following table, we have presented a reconciliation of EBITDA and adjusted EBITDA, as defined in our Revolving Credit Facility, and Consolidated Cash Flow as defined in our 7.75% Notes, to the most comparable U.S. GAAP measure, net income:
|
|
|
Years Ended December 31, |
|
|||||||
|
|
|
2009 |
|
2008 |
|
2007 |
|
|||
|
Net income |
|
$ |
153,889 |
|
$ |
65,797 |
|
$ |
123,565 |
|
|
Interest expense, net (a) |
|
74,491 |
|
97,040 |
|
110,236 |
|
|||
|
Income tax provision (benefit) (b) |
|
75,008 |
|
36,594 |
|
(40,794 |
) |
|||
|
Depreciation and amortization (c) |
|
28,936 |
|
20,269 |
|
10,749 |
|
|||
|
EBITDA |
|
332,324 |
|
219,700 |
|
203,756 |
|
|||
|
Transition and other non-recurring expenses (d) |
|
— |
|
— |
|
15,251 |
|
|||
|
Management fees (e) |
|
5,715 |
|
6,871 |
|
6,097 |
|
|||
|
Non-cash share-based compensation expense (f) |
|
47,546 |
|
38,707 |
|
21,241 |
|
|||
|
Special recognition bonus expense (g) |
|
6,310 |
|
6,622 |
|
8,167 |
|
|||
|
Loss on extinguishment of debt (h) |
|
43,033 |
|
— |
|
— |
|
|||
|
Equity in earnings of affiliate (i) |
|
(441 |
) |
(426 |
) |
(436 |
) |
|||
|
Loss (gain) on disposal of property, plant, and equipment (j) |
|
1,196 |
|
48 |
|
(94 |
) |
|||
|
Asset impairment charges, net of recoveries (k) |
|
1,180 |
|
10,096 |
|
2,789 |
|
|||
|
Retention bonus awards (l) |
|
9,136 |
|
5,593 |
|
— |
|
|||
|
Other (m) |
|
1,284 |
|
605 |
|
— |
|
|||
|
Adjusted EBITDA as defined per Revolving Credit Facility |
|
447,283 |
|
287,816 |
|
256,771 |
|
|||
|
Merger termination fee (n) |
|
(75,000 |
) |
— |
|
— |
|
|||
|
Consolidated Cash Flow as defined per 7.75% Notes |
|
$ |
372,283 |
|
$ |
287,816 |
|
$ |
256,771 |
|
(a) Represents interest expense associated with our debt structure. Through the third quarter of 2009, our debt structure consisted of facilities totaling $1.355 billion, including our $700 million First Lien Term Loan, $330 million Second Lien Term Loan, and $325 million Revolving Credit Facility, as well as our interest rate cap and swap contracts. As a result of our IPO and refinancing transactions during October 2009, we reduced our credit facilities to $925 million, consisting of our $600 million 7.75% Notes and $325 million revolving credit facility. We also settled and terminated our interest rate swap contracts.
(b) Represents our income tax provision (benefit) as presented in our consolidated income statements.
(c) Represents depreciation and amortization expense associated with our property, plant, and equipment, and all other intangible assets.
(d) Represents the expense associated with the development of our internal capabilities to operate as a standalone company apart from Bayer, consisting primarily of consulting services associated with developing our corporate infrastructure.
(e) Represents the advisory fees paid to Talecris Holdings, LLC, under the Management Agreement, as amended. This agreement was terminated in connection with our IPO.
(f) Represents our non-cash share-based compensation expense associated with stock options, restricted stock, and RSU’s.
(g) Represents compensation expense associated with special recognition bonus awards granted to certain of our employees and senior executives. These awards were granted to reward past performance and were provided to these individuals in recognition of the extraordinary value realized by us and our stockholders due to the efforts of such individuals since inception of our operating activities on April 1, 2005. While the awards included deferred distributions for employee retention, we do not anticipate granting similar awards in the future.
(h) Represents charges to write-off previously capitalized financing charges associated with our First and Second Lien Term Loans as a result of their repayment and termination as well as costs associated with the settlement and termination of our interest rate swap contracts.
(i) Represents non-operating income associated with our investment in Centric, which we believe are not part of our core operations.
(j) Represents net losses (gains) on disposals of our property, plant, and equipment, which we believe are not part of our core operations.
(k) For the year ended December 31, 2009, the amount represents $3.1 million of charges related primarily to capital lease assets and leasehold improvements, offset by recoveries of $1.9 million related to our 2008 plasma center cGMP issue. For the year ended December 31, 2008, the amount represents an inventory impairment charge, net of recoveries of $5.8 million due to our plasma center cGMP issue, an impairment charge of $3.6 million related primarily to capital lease assets and leasehold improvements, and other long-lived asset impairment charges of $0.7 million. During the year ended December 31, 2007, the amount represents asset impairment charges of $2.8 million associated with the discontinuation of a capital project.
(l) Represents merger related retention expenses, including fringe benefits, related to our terminated merger agreement with CSL.
(m) For the year ended December 31, 2009, the amount represents $1.3 million of costs related to our October 6, 2009 IPO. For the year ended December 31, 2008, represents $0.9 million of costs related to the initial public offering that was discontinued during 2008, partially offset by insurance recoveries of $0.3 million.
(n) For the year ended December 31, 2009, the amount includes a $75.0 million merger termination fee that we received from CSL in connection with the termination of our definitive merger agreement.
In addition to the adjustments we make in computing adjusted EBITDA as permitted under the terms of our Revolving Credit Facility and Consolidated Cash Flow under the terms of our 7.75% Notes, our management and compensation committee also consider the impact of other items in evaluating our operating performance. Certain of these items, which impact the comparability of our historical financial results, are included in the section titled, “Management’s Discussion and Analysis of Financial Condition and Results of Operations—Matters Affecting Comparability.”
ITEM 7A. QUANTITATIVE AND QUALITATIVE DISCLOSURES ABOUT MARKET RISK
We operate on a global basis, and are exposed to the risk that our earnings and cash flows could be adversely impacted by fluctuations in interest rates, foreign exchange, and commodity prices. The overall objective of our financial risk management program is to minimize the impact of these risks through operational means and by using various financial instruments. These practices may change as economic conditions change.
INTEREST RATE RISK
At December 31, 2009, our long-term debt consisted of our 7.75% Notes ($600.0 million outstanding), which bears a fixed interest rate, and our $325.0 million Revolving Credit Facility, which bears interest at a rate based upon either ABR or LIBOR, at our option, plus applicable margins based upon borrowing availability. We were not exposed to adverse movements in ABR or LIBOR related to our Revolving Credit Facility at December 31, 2009, as no amounts were drawn. Assuming a fully drawn Revolving Credit Facility and a 100 basis point increase in applicable interest rates, our interest expense, net, would increase by $3.25 million on an annual basis.
At December 31, 2009, we had cash and cash equivalents of $65.2 million. We use our available cash balances to repay amounts outstanding under our Revolving Credit Facility. We deposit any excess amounts into an overnight investment account, which earns minimal interest. Because our cash and cash equivalents are short-term in duration, we believe that our exposure to interest rate risk is not significant and a 100 basis point movement in market interest rates would not have a significant impact on the carrying value of our cash and cash equivalents. We actively monitor changes in interest rates.
FOREIGN CURRENCY RISK
We operate internationally and enter into transactions denominated in foreign currencies. As such, our financial results are subject to the variability that arises from exchange rate movements in relation to the U.S. dollar. Our foreign currency exposures are primarily limited to the impact that fluctuations in the euro and the Canadian dollar have on our revenues and the remeasurement of our euro-denominated accounts receivable. We translate the financial statements of international subsidiaries to their U.S. dollar equivalents at end-of-period currency exchange rates for assets and liabilities and at average currency exchange rates for revenue and expenses. We record these translation adjustments as a component of other comprehensive income (loss) within stockholders’ equity (deficit). We recognize transaction gains and losses arising from fluctuations in currency exchange rates on transactions denominated in currencies other than the functional currency as incurred in our consolidated income statements. We incurred transaction gains, net, of $1.9 million for the year ended December 31, 2009, primarily related to the remeasurement of euro denominated accounts receivable.
Since we operate internationally and approximately 34% of our net revenue for the year ended December 31, 2009 was generated outside of the United States, foreign currency exchange rate fluctuations could significantly impact our financial position, results of operations, cash flows, and competitive position. Our product net revenue was negatively impacted by $8.0 million, or 0.6%, as a result of foreign currency exchange rate fluctuations in relation to the U.S. dollar during the year ended December 31, 2009.
For the purpose of specific risk analysis, we used a sensitivity analysis to measure the potential impact to our consolidated financial statements for a hypothetical 10% strengthening of the U.S. dollar compared with the Canadian dollar and euro for the year ended December 31, 2009. Assuming a 10% strengthening of the U.S. dollar, our product net revenue would have been negatively impacted by approximately $14.8 million, or 1.0%. There would have been minimal impact to transaction gains resulting from the remeasurement of euro-denominated accounts receivable during the year ended December 31, 2009. To date, we have not hedged our exposure to changes in foreign currency exchange rates. Consequently, we could incur unanticipated gains and losses as result of changes in foreign exchange rates.
COMMODITY RISK
In order to enhance the predictability, sustainability, and profitability of our plasma supply, we have devoted significant resources on the internal development of our plasma collection center platform, which has included organic growth, the acquisition of additional plasma collection centers from IBR, and strategic alliances with third parties under which we have provided financing for the development of plasma collection centers that are dedicated to our plasma collection. Plasma is the key raw material used in the production of our products, which has historically accounted for more than half of our cost of goods sold. At December 31, 2009, our plasma collection center platform consisted of 69 operating centers, of which 64 were licensed and 5 were unlicensed. These centers collected approximately 62% of our plasma during the year ended December 31, 2009 and our plan is for our plasma collection center network to provide greater than 90% of our current plasma requirements once it fully matures.
For the purpose of specific risk analysis, we used a sensitivity analysis to measure the potential impact to our consolidated financial statements for a hypothetical 10% increase in the cost of plasma used to produce the products sold during the year ended December 31, 2009. Assuming this 10% increase in the cost of plasma, our cost of goods sold would have increased by $44.4 million and our gross margin would have been negatively impacted by 290 basis points for the year ended December 31, 2009. This sensitivity analysis assumes that we would not be able to pass the hypothetical cost increase to our customers in the form of pricing increases.
We procure plasma from our plasma collection centers and from third parties, all located within the United States. In periods of rising demand for plasma, we may experience increased costs and/or limited supply. These conditions can potentially result in our inability to acquire key production materials on a timely basis, or at all, which could impact our ability to produce products and satisfy incoming sales orders on a timely basis resulting in the breach of distribution contracts, or otherwise harm our business prospects, financial condition, results of operations, and cash flows. In addition, increased costs of materials or the inability to source materials could result in higher costs of production resulting in compressed gross margin, loss of customers, a negative effect on our reputation as a reliable supplier of plasma-derived therapies, or a substantial delay in our production growth plans.
As indicated previously, we have embarked on a capital expenditure plan that is currently estimated to be in the range of $750 million to $800 million on a cumulative basis through 2014 to address our fractionation capacity constraints. As such, we anticipate that we will be subject to market risk from fluctuating prices of certain purchased commodities, such as stainless steel. While these materials will come from multiple sources, commodities are subject to market price fluctuation. We will purchase these commodities based upon market prices established with various suppliers as part of the purchasing process. To the extent that commodity prices increase and we do not have firm pricing commitments, or if the suppliers are not able to honor such prices, we may experience unplanned costs in order to continue with our capital programs. We currently do not anticipate hedging our exposures to market risks associated with our commodities.
ITEM 8. FINANCIAL STATEMENTS AND SUPPLEMENTARY DATA
Index to Consolidated Financial Statements and Financial Statement Schedule
|
|
|
Page |
|
|
|
|
|
|
110 |
|
|
|
|
|
|
Consolidated Financial Statements: |
|
|
|
|
|
|
|
|
111 |
|
|
|
|
|
|
|
112 |
|
|
|
|
|
|
|
113 |
|
|
|
|
|
|
|
114 |
|
|
|
|
|
|
|
115 |
|
|
|
|
|
|
Financial Statement Schedule: |
|
|
|
|
|
|
|
|
153 |
REPORT OF INDEPENDENT REGISTERED PUBLIC ACCOUNTING FIRM
To the Stockholders and Board of Directors of
Talecris Biotherapeutics Holdings Corp:
In our opinion, the accompanying consolidated balance sheets and related statements of income, of cash flows, and of stockholders’ equity (deficit) present fairly, in all material respects, the financial position of Talecris Biotherapeutics Holdings Corp. and its subsidiaries at December 31, 2009 and 2008, and the results of their operations and their cash flows for each of the three years in the period ended December 31, 2009 in conformity with accounting principles generally accepted in the United States of America. In addition, in our opinion, the financial statement schedule listed in the accompanying index presents fairly, in all material respects, the information set forth therein when read in conjunction with the related consolidated financial statements. These financial statements are the responsibility of the Company’s management. Our responsibility is to express an opinion on these financial statements based on our audits. We conducted our audits of these statements in accordance with the standards of the Public Company Accounting Oversight Board (United States). Those standards require that we plan and perform the audit to obtain reasonable assurance about whether the financial statements are free of material misstatement. An audit includes examining, on a test basis, evidence supporting the amounts and disclosures in the financial statements, assessing the accounting principles used and significant estimates made by management, and evaluating the overall financial statement presentation. We believe that our audits provide a reasonable basis for our opinion.
|
/s/ PricewaterhouseCoopers LLP |
|
|
|
|
|
PricewaterhouseCoopers LLP |
|
|
Raleigh, North Carolina |
|
|
|
|
|
February 23, 2010 |
|
Talecris Biotherapeutics Holdings Corp.
(in thousands, except share and per share amounts)
|
|
|
December 31, |
|
||||
|
|
|
2009 |
|
2008 |
|
||
|
Assets |
|
|
|
|
|
||
|
|
|
|
|
|
|
||
|
Current assets: |
|
|
|
|
|
||
|
Cash and cash equivalents |
|
$ |
65,239 |
|
$ |
16,979 |
|
|
Accounts receivable, net of allowances of $3,461 and $2,020, respectively |
|
136,978 |
|
148,417 |
|
||
|
Inventories |
|
644,054 |
|
581,720 |
|
||
|
Deferred income taxes |
|
88,652 |
|
76,587 |
|
||
|
Prepaid expenses and other |
|
31,466 |
|
43,552 |
|
||
|
Total current assets |
|
966,389 |
|
867,255 |
|
||
|
Property, plant, and equipment, net |
|
267,199 |
|
213,251 |
|
||
|
Investment in affiliate |
|
1,935 |
|
1,719 |
|
||
|
Intangible assets, net |
|
10,880 |
|
7,204 |
|
||
|
Goodwill |
|
172,860 |
|
135,800 |
|
||
|
Deferred income taxes |
|
5,848 |
|
33,353 |
|
||
|
Other |
|
19,894 |
|
48,817 |
|
||
|
Total assets |
|
$ |
1,445,005 |
|
$ |
1,307,399 |
|
|
|
|
|
|
|
|
||
|
Liabilities, Obligations Under Common Stock Put/Call Option, Redeemable Preferred Stock, and Stockholders’ Equity (Deficit) |
|
|
|
|
|
||
|
|
|
|
|
|
|
||
|
Current liabilities: |
|
|
|
|
|
||
|
Accounts payable |
|
$ |
71,046 |
|
$ |
54,903 |
|
|
Accrued expenses and other liabilities |
|
170,533 |
|
167,377 |
|
||
|
Current portion of long-term debt and capital lease obligations |
|
740 |
|
7,341 |
|
||
|
Total current liabilities |
|
242,319 |
|
229,621 |
|
||
|
Long-term debt and capital lease obligations |
|
605,267 |
|
1,194,205 |
|
||
|
Other |
|
15,265 |
|
60,344 |
|
||
|
Total liabilities |
|
862,851 |
|
1,484,170 |
|
||
|
Commitments and contingencies |
|
|
|
|
|
||
|
Obligations under common stock put/call option |
|
— |
|
29,419 |
|
||
|
Redeemable series A and B preferred stock; $0.01 par value, 40,000,010 shares authorized; 0 shares and 1,192,310 shares issued and outstanding, respectively |
|
— |
|
110,535 |
|
||
|
Stockholders’ equity (deficit): |
|
|
|
|
|
||
|
Common stock, $0.01 par value; 400,000,000 shares authorized; 122,173,274 shares and 2,856,288 shares issued and outstanding, respectively |
|
1,212 |
|
— |
|
||
|
Additional paid-in capital |
|
767,032 |
|
47,017 |
|
||
|
Accumulated deficit |
|
(186,446 |
) |
(340,335 |
) |
||
|
Accumulated other comprehensive income (loss), net of tax |
|
356 |
|
(23,407 |
) |
||
|
Total stockholders’ equity (deficit) |
|
582,154 |
|
(316,725 |
) |
||
|
Total liabilities, obligations under common stock put/call option, redeemable preferred stock, and stockholders’ equity (deficit) |
|
$ |
1,445,005 |
|
$ |
1,307,399 |
|
The accompanying Notes to Consolidated Financial Statements are an integral part of these consolidated financial statements.
Talecris Biotherapeutics Holdings Corp.
Consolidated Income Statements
(in thousands, except per share amounts)
|
|
|
Years Ended December 31, |
|
|||||||
|
|
|
2009 |
|
2008 |
|
2007 |
|
|||
|
Net revenue: |
|
|
|
|
|
|
|
|||
|
Product |
|
$ |
1,507,754 |
|
$ |
1,334,550 |
|
$ |
1,196,686 |
|
|
Other |
|
25,455 |
|
39,742 |
|
21,823 |
|
|||
|
Total |
|
1,533,209 |
|
1,374,292 |
|
1,218,509 |
|
|||
|
Cost of goods sold |
|
901,077 |
|
882,157 |
|
788,152 |
|
|||
|
Gross profit |
|
632,132 |
|
492,135 |
|
430,357 |
|
|||
|
Operating expenses: |
|
|
|
|
|
|
|
|||
|
Selling, general, and administrative |
|
289,929 |
|
227,524 |
|
189,387 |
|
|||
|
Research and development |
|
71,223 |
|
66,006 |
|
61,336 |
|
|||
|
Total |
|
361,152 |
|
293,530 |
|
250,723 |
|
|||
|
Income from operations |
|
270,980 |
|
198,605 |
|
179,634 |
|
|||
|
Other non-operating (expense) income |
|
|
|
|
|
|
|
|||
|
Interest expense, net |
|
(74,491 |
) |
(96,640 |
) |
(110,236 |
) |
|||
|
Merger termination fee |
|
75,000 |
|
— |
|
— |
|
|||
|
Loss on extinguishment of debt |
|
(43,033 |
) |
— |
|
— |
|
|||
|
Litigation settlement |
|
— |
|
— |
|
12,937 |
|
|||
|
Equity in earnings of affiliate |
|
441 |
|
426 |
|
436 |
|
|||
|
Total |
|
(42,083 |
) |
(96,214 |
) |
(96,863 |
) |
|||
|
Income before income taxes |
|
228,897 |
|
102,391 |
|
82,771 |
|
|||
|
(Provision) benefit for income taxes |
|
(75,008 |
) |
(36,594 |
) |
40,794 |
|
|||
|
Net income |
|
153,889 |
|
65,797 |
|
123,565 |
|
|||
|
Less dividends to preferred stockholders and other non-common stockholders’ charges |
|
(11,744 |
) |
(14,672 |
) |
(13,014 |
) |
|||
|
Net income available to common stockholders |
|
$ |
142,145 |
|
$ |
51,125 |
|
$ |
110,551 |
|
|
|
|
|
|
|
|
|
|
|||
|
Net income per common share |
|
|
|
|
|
|
|
|||
|
Basic |
|
$ |
4.56 |
|
$ |
39.01 |
|
$ |
65.58 |
|
|
|
|
|
|
|
|
|
|
|||
|
Diluted |
|
$ |
1.50 |
|
$ |
0.71 |
|
$ |
1.36 |
|
The accompanying Notes to Consolidated Financial Statements are an integral part of these consolidated financial statements.
Talecris Biotherapeutics Holdings Corp.
Consolidated Statements of Cash Flows
|
|
|
Years Ended December 31, |
|
|||||||
|
|
|
2009 |
|
2008 |
|
2007 |
|
|||
|
Cash flows from operating activities: |
|
|
|
|
|
|
|
|||
|
Net income |
|
$ |
153,889 |
|
$ |
65,797 |
|
$ |
123,565 |
|
|
Adjustments to reconcile net income to net cash provided by operating activities: |
|
|
|
|
|
|
|
|||
|
Depreciation and amortization |
|
28,936 |
|
20,269 |
|
10,749 |
|
|||
|
Amortization of deferred loan fees and debt discount |
|
3,785 |
|
3,764 |
|
3,767 |
|
|||
|
Share-based compensation expense |
|
47,546 |
|
38,707 |
|
21,241 |
|
|||
|
Amortization of deferred compensation |
|
5,714 |
|
5,922 |
|
6,753 |
|
|||
|
Write-off of unamortized debt issuance costs |
|
12,141 |
|
— |
|
— |
|
|||
|
Asset impairment |
|
3,061 |
|
4,282 |
|
2,789 |
|
|||
|
Provision for doubtful receivables and advances |
|
2,858 |
|
4,978 |
|
525 |
|
|||
|
Recognition of previously deferred revenue |
|
(230 |
) |
(4,784 |
) |
— |
|
|||
|
Equity in earnings of affiliate |
|
(441 |
) |
(426 |
) |
(436 |
) |
|||
|
Loss (gain) on disposal of property, plant, and equipment |
|
1,196 |
|
48 |
|
(94 |
) |
|||
|
Decrease (increase) in deferred tax assets |
|
1,215 |
|
(5,488 |
) |
(79,707 |
) |
|||
|
Excess tax benefits from share-based payment arrangements |
|
(13,406 |
) |
— |
|
— |
|
|||
|
Changes in assets and liabilities, excluding the effects of business acquisitions |
|
(12,109 |
) |
(100,055 |
) |
37,979 |
|
|||
|
Net cash provided by operating activities |
|
234,155 |
|
33,014 |
|
127,131 |
|
|||
|
|
|
|
|
|
|
|
|
|||
|
Cash flows from investing activities: |
|
|
|
|
|
|
|
|||
|
Purchase of property, plant, and equipment |
|
(75,163 |
) |
(86,212 |
) |
(65,833 |
) |
|||
|
Business acquisitions, net of cash acquired |
|
(30,431 |
) |
(10,272 |
) |
(17,456 |
) |
|||
|
Financing arrangements with third party suppliers, net of repayments |
|
744 |
|
(16,335 |
) |
(7,866 |
) |
|||
|
Net proceeds from disposals of property, plant, and equipment |
|
7 |
|
880 |
|
322 |
|
|||
|
Dividends from affiliate |
|
225 |
|
— |
|
188 |
|
|||
|
Net cash used in investing activities |
|
(104,618 |
) |
(111,939 |
) |
(90,645 |
) |
|||
|
|
|
|
|
|
|
|
|
|||
|
Cash flows from financing activities: |
|
|
|
|
|
|
|
|||
|
Borrowings under Revolving Credit Facility |
|
1,201,749 |
|
1,430,092 |
|
1,237,453 |
|
|||
|
Repayment of borrowings under Revolving Credit Facility |
|
(1,381,690 |
) |
(1,363,188 |
) |
(1,204,336 |
) |
|||
|
Repayment of borrowings under term loans |
|
(1,016,000 |
) |
(7,000 |
) |
(7,000 |
) |
|||
|
Repayment of capital lease obligations |
|
(574 |
) |
(1,192 |
) |
(23 |
) |
|||
|
Proceeds from issuance of 7.75% Notes |
|
600,000 |
|
— |
|
— |
|
|||
|
Discount on 7.75% Notes |
|
(4,074 |
) |
— |
|
— |
|
|||
|
Financing transaction costs |
|
(14,879 |
) |
— |
|
(217 |
) |
|||
|
Proceeds from initial public offering, net of issuance costs |
|
519,749 |
|
— |
|
— |
|
|||
|
Costs related to initial public offering |
|
(2,557 |
) |
— |
|
— |
|
|||
|
Repurchases of common stock |
|
(4,183 |
) |
(36,118 |
) |
— |
|
|||
|
Proceeds from exercises of stock options |
|
7,581 |
|
— |
|
— |
|
|||
|
Excess tax benefits from share-based payment arrangements |
|
13,406 |
|
— |
|
— |
|
|||
|
Net cash (used in) provided by financing activities |
|
(81,472 |
) |
22,594 |
|
25,877 |
|
|||
|
Effect of exchange rate changes on cash and cash equivalents |
|
195 |
|
(157 |
) |
62 |
|
|||
|
Net increase (decrease) in cash and cash equivalents |
|
48,260 |
|
(56,488 |
) |
62,425 |
|
|||
|
Cash and cash equivalents at beginning of year |
|
16,979 |
|
73,467 |
|
11,042 |
|
|||
|
Cash and cash equivalents at end of year |
|
$ |
65,239 |
|
$ |
16,979 |
|
$ |
73,467 |
|
The accompanying Notes to Consolidated Financial Statements are an integral part of these consolidated financial statements.
Talecris Biotherapeutics Holdings Corp.
Consolidated Statements of Stockholders’ Equity (Deficit)
(in thousands, except share amounts)
|
|
|
|
|
|
|
|
|
|
|
|
|
Accumulated |
|
|
|
||||||
|
|
|
|
|
|
|
Additional |
|
|
|
|
|
Other |
|
|
|
||||||
|
|
|
Common Stock |
|
Paid-in |
|
Treasury |
|
Accumulated |
|
Comprehensive |
|
|
|
||||||||
|
|
|
Shares |
|
Amount |
|
Capital |
|
Stock |
|
Deficit |
|
(Loss) Income |
|
Total |
|
||||||
|
Balance at December 31, 2006 |
|
2,426,792 |
|
$ |
— |
|
$ |
— |
|
$ |
— |
|
$ |
(529,000 |
) |
$ |
20 |
|
$ |
(528,980 |
) |
|
Net income |
|
— |
|
— |
|
— |
|
— |
|
123,565 |
|
— |
|
123,565 |
|
||||||
|
Other comprehensive loss |
|
— |
|
— |
|
— |
|
— |
|
— |
|
(11,655 |
) |
(11,655 |
) |
||||||
|
Comprehensive income |
|
— |
|
— |
|
— |
|
— |
|
— |
|
— |
|
111,910 |
|
||||||
|
Share-based compensation cost |
|
— |
|
— |
|
14,464 |
|
— |
|
— |
|
— |
|
14,464 |
|
||||||
|
Issuance of common stock to IBR |
|
2,146,232 |
|
— |
|
— |
|
— |
|
— |
|
— |
|
— |
|
||||||
|
Issuance of restricted stock |
|
762,400 |
|
— |
|
— |
|
— |
|
— |
|
— |
|
— |
|
||||||
|
Forfeitures of restricted stock |
|
(18,192 |
) |
— |
|
— |
|
— |
|
— |
|
— |
|
— |
|
||||||
|
Adoption of new income tax accounting guidance |
|
— |
|
— |
|
— |
|
— |
|
(697 |
) |
— |
|
(697 |
) |
||||||
|
Fair value of common stock issued to IBR in excess of put value |
|
— |
|
— |
|
12,106 |
|
— |
|
— |
|
— |
|
12,106 |
|
||||||
|
Interest accretion on IBR put option |
|
— |
|
— |
|
(1,614 |
) |
— |
|
— |
|
— |
|
(1,614 |
) |
||||||
|
Fair value adjustment on common stock with put/call feature |
|
— |
|
— |
|
2,054 |
|
— |
|
— |
|
— |
|
2,054 |
|
||||||
|
Balance at December 31, 2007 |
|
5,317,232 |
|
— |
|
27,010 |
|
— |
|
(406,132 |
) |
(11,635 |
) |
(390,757 |
) |
||||||
|
Net income |
|
— |
|
— |
|
— |
|
— |
|
65,797 |
|
— |
|
65,797 |
|
||||||
|
Other comprehensive loss |
|
— |
|
— |
|
— |
|
— |
|
— |
|
(11,772 |
) |
(11,772 |
) |
||||||
|
Comprehensive income |
|
— |
|
— |
|
— |
|
— |
|
— |
|
— |
|
54,025 |
|
||||||
|
Share-based compensation cost |
|
— |
|
— |
|
29,258 |
|
— |
|
— |
|
— |
|
29,258 |
|
||||||
|
Issuance of restricted stock |
|
42,720 |
|
— |
|
— |
|
— |
|
— |
|
— |
|
— |
|
||||||
|
Forfeitures of restricted stock |
|
(287,784 |
) |
— |
|
— |
|
— |
|
— |
|
— |
|
— |
|
||||||
|
Repurchases of common stock |
|
(2,215,880 |
) |
3 |
|
36,115 |
|
(36,118 |
) |
— |
|
— |
|
— |
|
||||||
|
Retirement of common stock |
|
— |
|
(3 |
) |
(36,115 |
) |
36,118 |
|
— |
|
— |
|
— |
|
||||||
|
Fair value adjustment on common stock with put/call feature |
|
— |
|
— |
|
(8,942 |
) |
— |
|
— |
|
— |
|
(8,942 |
) |
||||||
|
Interest accretion on IBR put option |
|
— |
|
— |
|
(309 |
) |
— |
|
— |
|
— |
|
(309 |
) |
||||||
|
Balance at December 31, 2008 |
|
2,856,288 |
|
— |
|
47,017 |
|
— |
|
(340,335 |
) |
(23,407 |
) |
(316,725 |
) |
||||||
|
Net income |
|
— |
|
— |
|
— |
|
— |
|
153,889 |
|
— |
|
153,889 |
|
||||||
|
Other comprehensive income |
|
— |
|
— |
|
— |
|
— |
|
— |
|
476 |
|
476 |
|
||||||
|
Reclassification of unrealized loss on derivatives to earnings |
|
— |
|
— |
|
— |
|
— |
|
— |
|
23,287 |
|
23,287 |
|
||||||
|
Comprehensive income |
|
— |
|
— |
|
— |
|
— |
|
— |
|
— |
|
177,652 |
|
||||||
|
Share-based compensation cost |
|
— |
|
— |
|
39,206 |
|
— |
|
— |
|
— |
|
39,206 |
|
||||||
|
Issuance of restricted stock |
|
14,464 |
|
— |
|
— |
|
— |
|
— |
|
— |
|
— |
|
||||||
|
Forfeitures of restricted stock |
|
(16,368 |
) |
— |
|
— |
|
— |
|
— |
|
— |
|
— |
|
||||||
|
Repurchases of common stock |
|
(251,108 |
) |
— |
|
4,132 |
|
(4,183 |
) |
— |
|
— |
|
(51 |
) |
||||||
|
Retirement of common stock |
|
— |
|
— |
|
(4,183 |
) |
4,183 |
|
— |
|
— |
|
— |
|
||||||
|
Series A and B preferred stock dividends declared |
|
— |
|
— |
|
(45,250 |
) |
— |
|
— |
|
— |
|
(45,250 |
) |
||||||
|
Conversion of Series A and B preferred stock to common stock |
|
88,227,868 |
|
882 |
|
154,903 |
|
— |
|
— |
|
— |
|
155,785 |
|
||||||
|
Initial public offering |
|
28,947,368 |
|
289 |
|
519,460 |
|
— |
|
— |
|
— |
|
519,749 |
|
||||||
|
Costs related to initial public offering |
|
— |
|
— |
|
(2,557 |
) |
— |
|
— |
|
— |
|
(2,557 |
) |
||||||
|
Fair value adjustment on common stock with put/call feature |
|
— |
|
— |
|
(6,585 |
) |
— |
|
— |
|
— |
|
(6,585 |
) |
||||||
|
Reclassificaiton of mezzanine equity to permanent equity upon cancellation of common stock put/call feature |
|
— |
|
17 |
|
39,926 |
|
— |
|
— |
|
— |
|
39,943 |
|
||||||
|
Stock option exercises |
|
2,394,762 |
|
24 |
|
7,557 |
|
— |
|
— |
|
— |
|
7,581 |
|
||||||
|
Excess tax benefit from share-based compensation |
|
— |
|
— |
|
13,406 |
|
— |
|
— |
|
— |
|
13,406 |
|
||||||
|
Balance at December 31, 2009 |
|
122,173,274 |
|
$ |
1,212 |
|
$ |
767,032 |
|
$ |
— |
|
$ |
(186,446 |
) |
$ |
356 |
|
$ |
582,154 |
|
The accompanying Notes to Consolidated Financial Statements are an integral part of these consolidated financial statements.
Talecris Biotherapeutics Holdings Corp.
Notes to Consolidated Financial Statements
1. Description of Business
We are a biopharmaceutical company that researches, develops, manufactures, markets, and sells protein-based therapies that extend and enhance the lives of individuals who suffer from chronic and acute, often life-threatening, conditions, such as primary immune deficiencies, chronic inflammatory demyelinating polyneuropathy (CIDP), alpha-1 antitrypsin deficiency, bleeding disorders, infectious diseases, and severe trauma. Our primary products have orphan drug designation to serve populations with rare, chronic diseases. Our products are derived from human plasma, the liquid component of blood, which is sourced from our plasma collection centers or purchased from third parties, located in the United States. Plasma contains many therapeutic proteins, which we extract through the process of fractionation at our Clayton, North Carolina and/or Melville, New York facilities. The fractionated intermediates are then purified, formulated into a final bulk, and aseptically filled into final containers for distribution. We also sell the fractionated intermediate materials.
The majority of our sales are concentrated in two key therapeutic areas of the plasma business: Immunology/Neurology, through our intravenous immune globulin (IGIV) product for the treatment of primary immune deficiency and autoimmune diseases, as well as CIDP, and Pulmonology, through our alpha-1 proteinase inhibitor (A1PI) product for the treatment of alpha-1 antitrypsin deficiency-related emphysema. These therapeutic areas are served by our products, Gamunex IGIV (Gamunex), Prolastin A1PI (Prolastin) and our recently approved next generation A1PI product, Prolastin-C, respectively. Sales of Gamunex and Prolastin together comprised 74.7%, 72.3%, and 75.8% of our net revenue for the years ended December 31, 2009, 2008, and 2007, respectively. We also have a line of hyperimmune therapies that provides treatment for tetanus, rabies, hepatitis B, hepatitis A, and Rh factor control during pregnancy and at birth. In addition, we provide plasma-derived therapies for critical care/hemostasis, including the treatment of hemophilia, an anti-coagulation factor (Thrombate III), as well as albumin to expand blood volume. Although we sell our products worldwide, the majority of our sales are concentrated in the United States and Canada.
We are headquartered in Research Triangle Park, North Carolina and our primary manufacturing facilities are a short distance away in Clayton, North Carolina. Our Clayton site is one of the world’s largest plasma protein processing facilities whose operations include fractionation, purification, filling, and finishing. We have an integrated plasma collection center platform, which as of December 31, 2009, consisted of 69 operating centers, of which 64 were licensed and 5 were unlicensed. In addition to the United States, we have operations in Germany and Canada to support our international sales and marketing activities.
On October 6, 2009, we completed our initial public offering (IPO), which resulted in net primary proceeds to us of $519.7 million. In addition, during October 2009, we amended our Revolving Credit Facility and completed the issuance of $600.0 million, 7.75% Unsecured Senior Notes, due November 15, 2016 (7.75% Notes), at a price of 99.321% of par, in a private placement to certain qualified institutional buyers. The issuance of the 7.75% Notes resulted in net proceeds to us of $583.9 million. Additional information regarding our IPO and refinancing transactions are included in Note 3, “Initial Public Offering and Use of Proceeds” and Note 11, “Long-Term Debt and Capital Lease Obligations,” respectively.
As of December 31, 2009, Talecris Holdings, LLC held approximately 50.1% of our outstanding common stock. Talecris Holdings, LLC is owned by (i) Cerberus-Plasma Holdings LLC, the managing member of which is Cerberus Partners, L.P., and (ii) limited partnerships affiliated with Ampersand Ventures. Substantially all rights of management and control of Talecris Holdings, LLC are held by Cerberus-Plasma Holdings LLC. Subsequent to December 31, 2009, the ownership of our outstanding common stock by Talecris Holdings, LLC was diluted below 50%.
2. Summary of Significant Accounting Policies
Throughout our consolidated financial statements, references to “Talecris Biotherapeutics Holdings Corp.,” “Talecris,” “the Company,” “we,” “us,” and “our” are references to Talecris Biotherapeutics Holdings Corp. and its wholly-owned subsidiaries.
All tabular disclosures of dollar amounts are presented in thousands. All share and per share amounts are presented at their actual amounts.
A seven-for-one share dividend on our common stock was paid on September 10, 2009. All share and per-share amounts have been retroactively adjusted for all periods presented to reflect the share dividend.
Principles of Consolidation
The accompanying consolidated financial statements include the accounts of Talecris Biotherapeutics Holdings Corp. and its wholly-owned subsidiaries. All significant intercompany transactions and balances have been eliminated upon consolidation.
Use of Estimates
The preparation of financial statements in conformity with U.S. generally accepted accounting principles (U.S. GAAP) requires us to make estimates and judgments in certain circumstances that affect the reported amounts of assets, liabilities, revenues and expenses, and the related disclosures of contingent assets and liabilities. The most significant judgments we have made include, but are not limited to, estimates used in determining values of inventories, allowances for doubtful accounts and notes receivable, long-lived and indefinite-lived assets, litigation accruals and related settlements, losses under contractual obligations, leasehold impairments, deferred income taxes, income tax provisions, accruals for uncertain income tax positions, self-insurance accruals, share-based payment transactions, derivative instruments, and other operating allowances and accruals. We also use significant judgments in applying purchase accounting to business acquisitions.
We periodically evaluate estimates used in the preparation of the financial statements for reasonableness, including estimates provided by third parties. Appropriate adjustments to the estimates are made prospectively, as necessary, based on such periodic evaluations. We base our estimates on, among other things, currently available information, market conditions, and industry and historical experience, which collectively form the basis of making judgments about the carrying values of assets and liabilities that are not readily apparent from other sources. Although we believe that our assumptions are reasonable under the circumstances, actual future results could differ materially. In addition, if we had used different estimates and assumptions, our financial position and results of operations could have differed materially from that which is presented.
Cash and Cash Equivalents
All highly liquid investments with original maturities of three months or less when purchased are considered cash equivalents and are carried at cost due to the short period of time to maturity.
Accounts Receivable, net
Accounts receivable, net, consists of amounts owed to us by our customers on credit sales with terms generally ranging from 30 to 120 days from date of invoice and are presented net of an allowance for doubtful accounts receivable on our consolidated balance sheets.
We maintain an allowance for doubtful accounts receivable for estimated losses resulting from our inability to collect from customers. In extending credit, we assess our customers’ creditworthiness by, among other factors, evaluating our customers’ financial condition, credit history, and the amount involved, both initially and on an ongoing basis. Collateral is generally not required. In evaluating the adequacy of our allowance for doubtful accounts receivable, we primarily analyze accounts receivable balances, the percentage of accounts receivable by aging category, and historical bad debts. We also consider, among other things, customer concentrations and changes in customer payment terms or payment patterns.
If the financial conditions of our customers were to deteriorate, resulting in an impairment of their ability to make payments or our ability to collect, an increase to the allowance may be required. Also, should actual collections of accounts receivable be different than our estimates included in determining the allowance, the allowance would be adjusted through charges or credits to selling, general, and administrative expenses (SG&A) in our consolidated income statements in the period in which such changes in collection become known. If conditions were to change in future periods, additional allowances or reversals may be required. Such allowances or reversals could be significant.
Concentrations of Credit Risk
Our accounts receivable, net, includes amounts due from pharmaceutical wholesalers and distributors, buying groups, hospitals, physicians’ offices, patients, and others. The following table summarizes our concentrations with customers that represented more than 10% of our accounts receivable, net:
|
|
|
December 31, |
|
||
|
|
|
2009 |
|
2008 |
|
|
Customer A |
|
14.6 |
% |
15.0 |
% |
|
Customer B |
|
<10 |
% |
14.0 |
% |
The following table summarizes our concentrations with customers that represented more than 10% of our total net revenue:
|
|
|
Years Ended December 31, |
|
||||
|
|
|
2009 |
|
2008 |
|
2007 |
|
|
Customer A |
|
14.4 |
% |
12.8 |
% |
18.2 |
% |
|
Customer B |
|
12.3 |
% |
12.0 |
% |
14.9 |
% |
|
Customer C |
|
<10 |
% |
10.6 |
% |
10.5 |
% |
Inventories
Inventories consist of raw materials, work-in-process, and finished goods held for sale and are stated at the lower of cost or market, which approximates actual costs determined on the first-in, first-out method. In evaluating whether inventory is stated at the lower of cost or market, we consider such factors as the amount of inventory on hand and in the distribution channel, the estimated time required to sell such inventory, remaining shelf life, and current and expected market conditions, including levels of competition. As appropriate, provisions are recorded to reduce inventories to their net realizable value. We record provisions for work-in-process inventory when we believe the inventory does not meet all criteria to permit release to the market. Provisions are recorded for finished goods that do not have sufficient remaining shelf lives. We record recoveries directly to cost of goods sold after the impacted material is determined to be usable and is sold to third parties.
Pre-Approval Plasma Inventories
We capitalize the cost of unlicensed plasma into raw material inventories, when, based on our judgment, future economic benefit is probable. While unlicensed plasma cannot be sold to third parties or used in our manufacturing processes to make finished product until all regulatory approvals have been obtained, we have determined that it is probable that our unlicensed plasma inventories are realizable. As part of the U.S. Food and Drug Administration (FDA) licensing process for plasma collection centers, we are initially permitted to collect plasma utilizing the procedures and quality systems implemented and approved under our existing Biologics License Application (BLA) until such time as the FDA inspectors have conducted a pre-license inspection of the site and approved the site for inclusion in the BLA. At the conclusion of this process, we are permitted to sell or utilize previously collected plasma in manufacturing of final product. We believe that our cumulative knowledge of the industry, standard industry practices, experience working with the FDA, established quality systems, and consistency in achieving licensure support our capitalization of unlicensed plasma inventory.
Our accounting for unlicensed plasma requires us to make judgments regarding the ultimate net realizable value of the inventory. This assessment is based upon an analysis of various factors, including the remaining shelf life of the inventory, current and expected market conditions, amount of inventory on hand, and our ability to obtain the requisite regulatory approvals. As a result of periodic assessments, we could be required to expense previously capitalized inventory through cost of goods sold upon an unfavorable change in such judgments.
Property, Plant, and Equipment, net
Property, plant, and equipment are recorded at cost, less accumulated depreciation and amortization. Internal engineering costs directly related to asset additions are capitalized. Major renewals and betterments are capitalized. All feasibility studies and maintenance and repair costs are expensed as incurred. Certain interest costs incurred by us during the construction period, based on our weighted average borrowing rates of debt, are capitalized and included in the cost of the related asset.
We generally depreciate and amortize property, plant, and equipment using the straight-line method over the useful lives presented in the following table:
|
Asset Type |
|
Useful Life (Years) |
|
|
Buildings |
|
10 to 45 |
|
|
Building improvements |
|
10 to 20 |
|
|
Machinery and equipment |
|
3 to 20 |
|
|
Furniture and fixtures |
|
5 to 10 |
|
|
Computer hardware and software |
|
3 to 7 |
|
|
Leasehold improvements |
|
the estimated useful life of the improvement or, if shorter, the life of the lease |
|
We lease various property and equipment. Leased property and equipment that meet certain criterion are capitalized and the present values of the related lease payments are recorded as liabilities. Capital lease payments are allocated between a reduction of the
lease obligation and interest expense using the interest rate implicit in the lease. All other leases are accounted for as operating leases and the related payments are expensed ratably over the rental period. Amortization of assets under capital leases is computed using the straight-line method over the shorter of the remaining lease term or the estimated useful life.
Business Acquisitions
Results of business acquisitions are included in our results of operations as of the respective acquisition dates. The purchase price of each acquisition is allocated to the net assets acquired based on estimates of their fair values at the date of the acquisition. Any purchase price in excess of the fair value of these net assets is recorded as goodwill. The accounting for business acquisitions requires us to make estimates and assumptions related to the estimated fair values of the net assets acquired. Significant judgments are used during this process, particularly with respect to intangible assets. Generally, definite-lived intangible assets are amortized over their estimated useful lives. Goodwill and other indefinite-lived intangible assets are not amortized, but are annually assessed for impairment. Therefore, the purchase price allocation to intangible assets and goodwill could have a significant impact on future operating results.
Identifiable Intangible Assets
Identifiable intangible assets are recorded at cost, or when acquired as part of a business acquisition, at estimated fair value. Definite-lived intangible assets are amortized over their useful lives. Indefinite-lived intangible assets, such as regulatory licenses, are not amortized, but are annually assessed for impairment.
Impairment Reviews
We evaluate the recoverability of recorded goodwill and other indefinite-lived intangible asset amounts annually as of December 31 or when events or changes in circumstances indicate that evidence of potential impairment exists, using a fair value based test. This test requires us to make estimates of factors that include, but are not limited to, projected future operating results and business plans, economic projections, anticipated future cash flows, comparable marketplace data from a consistent industry group, and the cost of capital. Any applicable impairment loss is the amount, if any, by which the implied fair value is less than the carrying value.
We review the carrying amounts of other long-lived assets for potential impairment whenever events or changes in circumstances indicate that the carrying amount of the asset may not be recoverable. We periodically evaluate whether events or changes in circumstances have occurred that may warrant revision of the estimated useful lives of our long-lived assets or whether the remaining carrying amount of long-lived assets should be evaluated for possible impairment. An example of such a change in circumstances includes a significant adverse change in the extent or manner in which an asset is being used.
Notes Receivable, net
Notes receivable, net, consists of amounts owed to us by certain plasma suppliers, including accrued interest. We evaluate our notes receivable for collectibility when events or changes in circumstances indicate that the amounts owed to us may not be collectible. We record an impairment charge, based on current information and events, when it is probable that we will be unable to collect principal and interest amounts owed to us under the contractual terms of the loan agreement. Once a note receivable is determined to be impaired, we discontinue interest accruals. Measuring impairment of a loan requires the use of management’s judgments and estimates, and the eventual outcomes may differ from those estimates. If conditions were to change in future periods, additional allowances or reversals may be required. Such allowances or reversals could be significant. At December 31, 2009 and 2008, our notes receivable, net, amounted to $1.7 million and $21.7 million, respectively, and were included in other long-term assets on our consolidated balance sheets.
Debt Issuance Costs and Debt Discount
We capitalize costs associated with the issuance of our debt and amortize these costs to interest expense, net, over the term of the related debt agreement using an effective yield amortization method, or similar method. Unamortized debt issuance costs are written off within total other non-operating expense, net, in our consolidated income statements when indebtedness under the related credit facility is repaid or restructured prior to maturity.
We record debt discounts as a reduction of the face amount of the related debt. Debt discounts are amortized to interest expense, net, over the term of the related debt agreement using an effective yield amortization method, or similar method.
Financial Instruments with Characteristics of Debt and Equity
Accounting standards require that we classify a financial instrument as a liability when that financial instrument embodies an obligation on our part. A freestanding financial instrument that, at inception, embodies an obligation to repurchase our equity shares, or is indexed to such an obligation, and requires or may require us to settle the obligation by transferring assets, is classified as a liability.
Our Redeemable Series A and B Senior Convertible Preferred Stock (Series A and B preferred stock) had deemed liquidation requirements which could have potentially resulted in cash payments to the holders thereof which were beyond our control. During 2009, the Series A and B preferred stock and related unpaid dividends were converted into common stock at the election of the holder in connection with our IPO. The unrestricted and restricted common stock that we issued to employees and members of our board of directors contained various embedded put/call features that could have potentially resulted in cash payments to the holders thereof, which were beyond our control. As such, at December 31, 2008, we classified our obligations under these financial instruments outside of permanent equity on our consolidated balance sheet within obligations under common stock put/call option or redeemable preferred stock. Both our redemption rights and the participants’ put rights related to the common stock were terminated in connection with the closing of our IPO. As a result, we reclassified the fair value of vested common stock to permanent equity in the fourth quarter of 2009.
Revenue Recognition and Gross-to-Net Revenue Adjustments
We recognize revenue when earned, which is generally at the time of delivery to the customer. Recognition of revenue also requires reasonable assurance of collection of sales proceeds, a fixed and determinable price, persuasive evidence that an arrangement exists, and completion of all other performance obligations. The recognition of revenue is deferred if there are significant post-delivery obligations, such as customer acceptance.
Allowances against revenue for estimated discounts, rebates, administrative fees, chargebacks, and shelf-stock adjustments are established by us concurrently with the recognition of revenue. The standard terms and conditions under which products are shipped to our customers generally do not allow a right of return. In the rare instances in which we grant a right of return, revenue is reduced at the time of sale to reflect expected returns and deferred until all conditions of revenue recognition are met.
We have supply agreements with our major distributors, which require them to purchase minimum quantities of our products. We regularly review the supply levels of our products on hand at major distributors, primarily by analyzing inventory reports supplied by these distributors, available data regarding the sell-through of our products, our internal data, and other available information. When we believe distributor inventory levels have increased relative to underlying demand, we evaluate the need for sales return allowances. Factors that influence the allowance include historical sales return activity, levels of inventory in the distribution network, inventory turnover, demand history, demand projections, estimated product shelf-life, pricing, and competition. Sales returns have not been material during the periods presented.
We have agreed to reimburse certain of our international distributors for their selling, general, and administrative expenses (SG&A) under the terms of our distribution agreements. We have reflected these charges as a reduction of net revenue.
Revenue from milestone payments for which we have no continuing performance obligations is recognized upon achievement of the related milestone. When we have continuing performance obligations, the milestone payments are deferred and recognized as revenue over the term of the arrangement as we complete our performance obligations.
We evaluate revenue from agreements that have multiple elements to determine whether the components of the arrangement represent separate units of accounting. In transactions that contain multiple elements, we recognize revenue as each product is delivered or service is provided to the customer. We allocate the total arrangement consideration to each element based on its relative fair value, based on the price for the product or service when it is sold separately.
Gross product sales are subject to a variety of deductions that are generally estimated and recorded in the same period that the revenue is recognized, and primarily represent rebates to government agencies, chargebacks to wholesalers and distributors, and customer prompt payment discounts. These gross-to-net revenue adjustments are described below.
We offer rebates to certain classes of trade, which we account for by establishing an accrual at the time the sale is recorded in an amount equal to our estimate of rebates attributable to each sale. We determine our estimate of the rebates primarily based on historical experience and current contract arrangements. We consider the sales performance of products subject to rebates and the levels of inventory in the distribution channel and adjust the accrual periodically to reflect actual experience. For the portion of these rebates that is settled as part of the product sale, there is no lag in the recognition of the rebate. The portion which is accrued upon sale is settled upon resale by our distributors. Due to the limited classes of trade that participate in rebate programs and our visibility of inventories in the channel, adjustments for actual experience have not been material.
We participate in state government-managed Medicaid programs. We account for Medicaid rebates by establishing an accrual at the time the sale is recorded in an amount equal to our estimate of the Medicaid rebate claims attributable to such sale. We determine our estimate of the Medicaid rebates accrual primarily based on historical experience regarding Medicaid rebates, legal interpretations of the applicable laws related to the Medicaid program and any new information regarding changes in the Medicaid programs’ regulations and guidelines that would impact the amount of the rebates. We consider outstanding Medicaid claims, Medicaid payments, and levels of inventory in the distribution channel and adjust the accrual periodically to reflect actual experience. Adjustments for actual experience have not been material.
Sales allowances are established based upon consideration of a variety of factors, including, but not limited to, our sales terms which generally provide for up to a 2% prompt pay discount on domestic and international sales, contractual agreements with customers, estimates of the amount of product in the pipeline, and prescribing patterns. We believe that our sales allowance accruals are reasonably determinable and are based on the information available at the time to arrive at our best estimate of the accruals. Actual sales allowances incurred are dependent upon future events. We periodically monitor the factors that influence sales allowances and make adjustments to these provisions when we believe that the actual sales allowances may differ from prior estimates. If conditions in future periods change, revisions to previous estimates may be required, potentially in significant amounts.
Our estimates for discounts, customer and government rebates, and administrative fees are by their nature more predictable and less subjective. Estimates for chargebacks are more subjective and, consequently, may be more variable. We enter into agreements with certain customers to establish contract pricing for our products, which these entities purchase from the wholesaler or distributor (collectively, wholesalers) of their choice. Consequently, when our products are purchased from wholesalers by these entities at the contract price which is less than the price charged by us to the wholesaler, we provide the wholesaler with a credit referred to as a chargeback. The allowance for chargebacks is based on our estimate of the wholesaler inventory levels, and the expected sell-through of our products by the wholesalers at the contract price based on historical chargeback experience and other factors. Our estimates of inventory levels at the wholesalers are subject to inherent limitations, as our estimates rely on third party data, and their data may itself rely on estimates, and be subject to other limitations. We periodically monitor the factors that influence our provision for chargebacks, and make adjustments when we believe that actual chargebacks may differ from established allowances. These adjustments occur in a relatively short period of time.
Shelf-stock adjustments are credits issued to our customers to reflect decreases in the selling prices of our products. These types of credits are customary in our industry and are intended to reduce a customer’s inventory cost to better reflect current market prices. Shelf-stock adjustments are based upon the amount of product that our customers have remaining in their inventories at the time of the price reduction. Decreases in our selling prices are discretionary decisions made by us to reflect market conditions. Amounts recorded for estimated price adjustments are based upon specified terms with customers, estimated declines in market prices, and estimates of inventory held by customers. Our estimates of inventory levels at the customer are subject to inherent limitations, as our estimates may rely on third party data, and their data may itself rely on estimates, and be subject to other limitations. We regularly monitor these factors and evaluate our reserves for shelf-stock adjustments. We have not experienced significant shelf-stock adjustments during the periods presented.
Shipping and Handling
Shipping and handling costs incurred for inventory purchases are included in cost of goods sold in our consolidated income statements. Shipping and handling costs incurred to warehouse, pick, pack, and prepare inventory for delivery to customers are included in SG&A in our consolidated income statements. Shipping and handling costs included in SG&A amounted to $3.6 million, $3.5 million, and $3.4 million for the years ended December 31, 2009, 2008, and 2007, respectively.
Advertising Costs
The costs of advertising are expensed as incurred within SG&A in our consolidated income statements. Our advertising costs consist primarily of product samples, print media, online advertising, and promotional material. We incurred advertising costs totaling $10.2 million, $10.5 million, and $9.3 million for the years ended December 31, 2009, 2008, and 2007, respectively.
Research and Development Expenses
Research and development (R&D) expenses include the costs directly attributable to the conduct of research and development programs for new products and extensions or improvements of existing products and the related manufacturing processes. Such costs include salaries and related employee benefit costs, payroll taxes, materials (including the material required for clinical trials), supplies, depreciation on and maintenance of R&D equipment, services provided by outside contractors for clinical development and clinical trials, regulatory services, and fees. R&D also includes the allocable portion of facility costs such as rent, depreciation, utilities, insurance, and general support services. All costs associated with R&D are expensed as incurred.
Share-Based Compensation
We value share-based compensation at the grant date using a fair value model and recognize this value as expense over the employees’ requisite service period, typically the period over which the share-based compensation vests. We classify share-based compensation costs consistent with each grantee’s salary. We record corporate income tax benefits realized upon exercise or vesting of an award in excess of that previously recognized in earnings as additional paid-in capital.
The fair value of our common stock on the grant date is a significant factor in determining the fair value of share-based compensation awards and the ultimate non-cash compensation cost that we will be required to record over the vesting period. Given the absence of a trading market for our common stock on grant dates prior to October 1, 2009, our board of directors, or special dividend committee or compensation committee designated by our board of directors, estimated the fair value of our common stock contemporaneously with each grant using numerous objective and subjective factors. These factors included: (i) our stage of development, our efforts to become independent from Bayer, and revenue growth; (ii) the timing of the anticipated launch of new products and new indications; (iii) business conditions and business challenges at the time; (iv) available market data, including observable market transactions, and valuations for comparable companies; (v) the illiquid nature of our stock options and stock grants; and (vi) the likelihood of achieving a liquidity event for the shares of common stock underlying the options, such as an initial public offering or sale of our company, given prevailing market conditions at the grant date. In making the assessment of common stock fair value on each award date, our board of directors or designated committee of our board of directors considered the guidance in American Institute of Certified Public Accountants Technical Practice Aid, “Valuation of Privately-Held Company Equity Securities Issued as Compensation.” The valuations were completed utilizing the market and/or an income approach and then the enterprise value was allocated using the “Probability-Weighted Expected Return Method,” which provides different probability weights of various likely scenarios (distressed; remain private; private sale; IPO), and develops valuations by determining the present value of the future expected common stock value under each of these scenarios. For option awards granted on October 1, 2009, the fair value of our common stock was determined to be the IPO price per share of $19.00. For option awards granted subsequent to our IPO, we consider the fair value of our common stock to be the closing share price as reported by The NASDAQ Global Select Market on the grant date.
We estimate the fair value of stock options at the grant date using the Black-Scholes pricing model, which requires the use of a number of assumptions related to the risk-free interest rate, average life of options (expected term), expected volatility, and dividend yield. A forfeiture rate based on historical attrition rates of award holders is used in estimating the granted awards not expected to vest. If actual forfeitures differ from the expected rate, we may be required to make additional adjustments to compensation expense in future periods. The Black-Scholes option pricing model was developed for use in estimating the fair value of traded options that have no vesting restrictions and are fully transferable, characteristics that are not present in our option grants. If the model permitted consideration of the unique characteristics of employee stock options, the resulting estimate of the fair value of the stock options, and resulting compensation expense, could be different.
The stock options that we granted to employees typically have had service-based and performance-based components. Stock option grants, restricted stock and restricted stock unit (RSU) awards to non-employee directors are service-based only. Service-based awards vest annually in equal amounts over the vesting period. The performance-based component of the stock options vests annually upon the achievement of corporate performance objectives which are established by our board of directors. We make assessments as to whether the performance conditions related to the performance-based stock options will be achieved. We record compensation cost for awards with performance conditions based on the probable outcome of the performance conditions.
Litigation Accruals
We record an accrual for our exposures to our various litigation matters as a charge to our consolidated income statements when it becomes probable and can be reasonably estimated. The exposure to legal matters is evaluated and estimated, if possible, following consultation with legal counsel. Such estimates are based on currently available information and, given the subjective nature and complexities inherent in making these estimates, the ultimate outcome of our legal matters may be significantly different than the amounts estimated. Additional information regarding our possible litigation exposures is included in Note 13, “Commitments and Contingencies.”
Environmental Costs
We record liabilities when our environmental assessments indicate that remediation efforts are probable, and the costs can be reasonably estimated. We recognize a current period expense for the liability when clean-up efforts do not benefit future periods. We capitalize costs that benefit more than one accounting period. Estimates, when applicable, of our liabilities are based on currently available facts, existing technology, and presently enacted laws and regulations taking into consideration the likely effects of inflation and other societal and economic factors, and include estimates of associated legal costs. The amounts also consider prior experience in remediating contaminated sites, other companies’ clean-up experience, and data released by the Environmental Protection Agency
(EPA) or other organizations. The estimates are subject to revision in future periods based on actual costs or new circumstances. We evaluate recoveries from insurance coverage or government sponsored programs separately from our liability, and when recovery is assured, we record and report an asset separately from the associated liability. At December 31, 2009 and 2008, no environmental related assets or liabilities are reflected on our consolidated balance sheets as no amounts are probable or estimable.
Other Contingencies
We recognize liabilities for other contingencies when we have an exposure, that, when analyzed, indicates it is both probable that an asset has been impaired or a liability incurred, and the amount of impairment or loss can be reasonably estimated. Funds spent to remedy these contingencies are charged against the accrued liability, if one exists, or expensed, if no liability was previously established. When a range of probable loss can be estimated, we accrue the most likely amount within the range of probable losses.
Self-Insurance Programs
We maintain self-insured retentions and deductibles for some of our insurance programs and limit our exposure to claims by maintaining stop-loss and/or aggregate liability coverage under which the insurer is the primary obligor to the insured. The estimate of our claims liability is subject to inherent limitations as it relies on our judgment of the likely ultimate costs that will be incurred to settle reported claims and unreported claims for incidents incurred but not reported as of the balance sheet date. When estimating our liability for such claims, we consider a number of factors, including, but not limited to, self-insured retentions, deductibles, claim experience, demographic factors, severity factors, and maximum claims exposure. If actual claims exceed these estimates, additional charges may be required.
Income Taxes
We calculate a provision for, or benefit from, income taxes using the asset and liability method, under which deferred tax assets and liabilities are recorded based on the difference between the financial statement and tax bases of assets and liabilities using enacted tax rates in effect for the year in which the differences are expected to reverse. A reduction in the carrying amounts of deferred tax assets by a valuation allowance is required, if, based on the available evidence, it is more likely than not that the assets will not be realized. Accordingly, we periodically assess the need to establish valuation allowances for deferred tax assets based on the more-likely-than-not realization threshold criterion. In assessing the need for a valuation allowance, we consider all available evidence, both positive and negative, including historical levels of income, expectations and risks associated with future taxable income, and ongoing prudent and feasible tax planning strategies.
We establish reserves for uncertain income tax positions, based on the technical support for the positions, our past audit experience with similar situations, and potential interest and penalties related to the matters. Our recorded reserves represent our best estimate of the amount, if any, that we will ultimately be required to pay to settle such matters. The resolution of our uncertain income tax positions is dependent on uncontrollable factors such as law changes, new case law and the willingness of the income tax authorities to settle, including the timing thereof and other factors. Although we do not anticipate significant changes to our uncertain income tax positions in the next twelve months, items outside of our control could cause our uncertain income tax positions to change in the future, which would be recorded within (provision) benefit for income taxes in our consolidated income statements. Interest and penalties related to unrecognized tax benefits are recognized as a component of our income tax provision.
Interest Costs
We capitalize a portion of the interest costs we incur during the construction of long-lived assets, primarily plant and equipment, as an additional cost of the related asset. The amount of interest capitalized is determined by applying our weighted average borrowing rate to the related capital spending during the construction period. We incurred interest costs related to our debt and interest rate swap contracts of $72.8 million, $97.2 million, and $110.2 million for the years ended December 31, 2009, 2008, and 2007, respectively, of which $2.0 million, $2.3 million, and $2.0 million, respectively, were capitalized related to the construction of property and equipment.
Derivative Financial Instruments
All derivative financial instruments are recorded on our consolidated balance sheets as assets or liabilities and measured at fair value, which considers the instrument’s term, notional amount, discount rate, credit risk, and other factors. For derivatives designated as hedges of the fair value of assets or liabilities, the changes in fair values of both the derivatives and the hedged items are recorded in current earnings. For derivatives designated as cash flow hedges, the effective portion of the changes in fair value of the derivatives are recorded in other comprehensive income (loss) and subsequently recognized in earnings when the hedged items impact income. Changes in the fair value of derivatives not designated as hedges and the ineffective portion of cash flow hedges are recorded in current earnings. When determining the fair value of our derivative financial instruments, we analyze the instruments from a
market participant’s perspective to determine a hypothetical exit price to the counterparty. At December 31, 2009, our derivative financial instruments consisted of two interest rate cap contracts. At December 31, 2008, our derivative financial instruments consisted of five variable-to-fixed interest rate swap contracts and two interest rate cap contracts.
Fair Value of Financial Instruments
Effective November 1, 2008, we adopted new fair value accounting guidance for financial assets and liabilities, which defines fair value, establishes a framework for measuring fair value in accordance with U.S. GAAP, and expands disclosures about fair value measurements. The guidance does not require any new fair value measurements, but provides guidance on how to measure fair value by providing a fair value hierarchy to classify the source of the information. The guidance specifies a hierarchy of valuation techniques based on whether the inputs to those valuation techniques are observable or unobservable. Observable inputs reflect market data obtained from independent sources, while unobservable inputs reflect our market assumptions. These two types of inputs create the following fair value hierarchy:
Level 1- Quoted prices in active markets for identical assets or liabilities.
Level 2- Observable inputs other than Level 1 prices such as quoted prices for similar assets or liabilities; quoted prices in markets with insufficient volume or infrequent transactions (less active markets); or model-derived valuations in which all significant inputs are observable or can be derived principally from or corroborated by observable market data for substantially the full term of the assets or liabilities.
Level 3- Unobservable inputs to the valuation methodology that are significant to the measurement of fair value of assets or liabilities.
At December 31, 2009, we had two interest rate cap contracts with a notional principal amount of $175.0 million outstanding for which the cap rate of 6.00% was significantly higher than prevailing market interest rates; therefore, the fair market value was zero. At December 31, 2008, the fair value of our interest rate swaps was calculated using Level 2 inputs, which included forward LIBOR curves and credit default swap data.
At December 31, 2009, the estimated fair value of our 7.75% Notes was $607.9 million. We calculated the fair value by reference to open bid/ask quotations of our 7.75% Notes at December 31, 2009. We had no amounts outstanding under our variable rate Revolving Credit Facility at December 31, 2009. At December 31, 2009, we have notes receivable outstanding, which bear interest at market rates, and consequently, the recorded amounts approximate fair value. The recorded amounts of all other financial instruments, which consist of cash and cash equivalents, accounts receivable, net, accounts payable, accrued expenses other liabilities, approximate fair value due to the short duration of the instruments.
Comprehensive Income
Comprehensive income is defined as the change in equity resulting from recognized transactions and other events and circumstances from non-owner sources. Comprehensive income includes net income as currently reported under U.S. GAAP and other comprehensive income (loss). Other comprehensive income (loss) considers the effect of additional economic events that are not required to be recorded in determining net income, but rather are reported as a separate component of stockholders’ equity (deficit).
The following table includes information regarding our other comprehensive income (loss):
|
|
|
Gross Amount |
|
Tax Effect |
|
Net Amount |
|
|||
|
Year ended December 31, 2009 |
|
|
|
|
|
|
|
|||
|
Foreign currency translation adjustments |
|
$ |
232 |
|
$ |
— |
|
$ |
232 |
|
|
Additional minimum pension liability |
|
244 |
|
— |
|
244 |
|
|||
|
Reclassification of unrealized loss on derivatives to earnings |
|
37,513 |
|
(14,226 |
) |
23,287 |
|
|||
|
Other comprehensive income |
|
$ |
37,989 |
|
$ |
(14,226 |
) |
$ |
23,763 |
|
|
|
|
|
|
|
|
|
|
|||
|
Year ended December 31, 2008 |
|
|
|
|
|
|
|
|||
|
Foreign currency translation adjustments |
|
$ |
(216 |
) |
$ |
— |
|
$ |
(216 |
) |
|
Net unrealized loss on derivative financial instruments |
|
(18,477 |
) |
6,973 |
|
(11,504 |
) |
|||
|
Additional minimum pension liability |
|
(52 |
) |
— |
|
(52 |
) |
|||
|
Other comprehensive loss |
|
$ |
(18,745 |
) |
$ |
6,973 |
|
$ |
(11,772 |
) |
|
|
|
|
|
|
|
|
|
|||
|
Year ended December 31, 2007 |
|
|
|
|
|
|
|
|||
|
Foreign currency translation adjustments |
|
$ |
128 |
|
$ |
— |
|
$ |
128 |
|
|
Net unrealized loss on derivative financial instruments |
|
(19,036 |
) |
7,253 |
|
(11,783 |
) |
|||
|
Other comprehensive loss |
|
$ |
(18,908 |
) |
$ |
7,253 |
|
$ |
(11,655 |
) |
The following table includes information regarding our accumulated other comprehensive income (loss):
|
|
|
December 31, |
|
||||
|
|
|
2009 |
|
2008 |
|
||
|
Foreign currency translation adjustments |
|
$ |
164 |
|
$ |
(68 |
) |
|
Net unrealized loss on derivative financial instruments |
|
— |
|
(23,287 |
) |
||
|
Additional minimum pension liability |
|
192 |
|
(52 |
) |
||
|
Accumulated other comprehensive income (loss) |
|
$ |
356 |
|
$ |
(23,407 |
) |
During the year ended December 31, 2009, we settled and terminated our interest rate swap contracts, which resulted in a loss of $30.9 million. Our accumulated other comprehensive loss at December 31, 2008 included $23.3 million, net of taxes, related to unrealized losses associated with our interest rate swap contracts. As a result of their settlement and termination, we reclassified $23.3 million out of accumulated other comprehensive loss to loss on extinguishment of debt within total other non-operating expense, net, in our consolidated income statement for the year ended December 31, 2009.
Foreign Currency Translation
For our international operations, local currencies have been determined to be the functional currencies. We translate the financial statements of international subsidiaries to their U.S. dollar equivalents at end-of-period currency exchange rates for assets and liabilities and at average currency exchange rates for revenues and expenses. We record these translation adjustments as a component of other comprehensive income (loss) within stockholders’ equity (deficit). We recognize transaction gains and losses arising from fluctuations in currency exchange rates on transactions denominated in currencies other than the functional currency as incurred within SG&A in our consolidated income statements. We incurred foreign currency transaction gains (losses) of $1.9 million, $(1.0) million, and $5.7 million for the years ended December 31, 2009, 2008, and 2007, respectively.
Business Segments
We operate our plasma-derived protein therapeutics business as a single reportable business segment since all operating activities are directed from our North Carolina headquarters and all of our products result from a common manufacturing process based on a single feedstock.
Earnings per Share
We calculate basic earnings per share based upon the weighted average number of common shares outstanding. We calculate diluted earnings per share based upon the weighted average number of common shares outstanding plus the dilutive effect of common share equivalents calculated using the treasury stock method.
Recent Accounting Pronouncements
In October 2009, the Financial Accounting Standards Board (FASB) issued new accounting guidance regarding multiple-deliverable revenue arrangements. The new guidance addresses the accounting for multiple-deliverable arrangements to enable
vendors to account for products or services (deliverables) separately rather than as a combined unit. This guidance establishes a hierarchy for determining the selling price of a deliverable, which is based on: (a) vendor-specific objective evidence; (b) third-party evidence; or (c) estimates. This guidance also eliminates the residual method of allocation and requires that arrangement consideration be allocated at the inception of the arrangement to all deliverables using the relative selling price method. In addition, this guidance significantly expands required disclosures related to a vendor’s multiple-deliverable revenue arrangements. The guidance is effective prospectively for revenue arrangements entered into or materially modified in fiscal years beginning on or after June 15, 2010 and early adoption is permitted. A company may elect, but will not be required, to adopt the guidance retrospectively for all prior periods. We do not anticipate that the adoption of this guidance will have a material impact on our consolidated financial statements or related disclosures.
In August 2009, the FASB released new accounting guidance concerning measuring liabilities at fair value. The new guidance provides clarification that in circumstances in which a quoted price in an active market for the identical liability is not available, a reporting entity is required to measure fair value using certain valuation techniques. Additionally, it clarifies that a reporting entity is not required to adjust the fair value of a liability for the existence of a restriction that prevents the transfer of the liability. This new guidance is effective for the first reporting period after its issuance; however, earlier application is permitted. We do not anticipate that the adoption of this guidance will have a material impact on our consolidated financial statements or related disclosures.
In May 2009, the FASB issued authoritative guidance for subsequent events, which is effective for interim and annual financial statements ending after June 15, 2009. The guidance establishes general standards of accounting for and disclosure of subsequent events that occur after the balance sheet date. Entities are also required to disclose the date through which subsequent events have been evaluated and the basis of that date. We have evaluated subsequent events up through February 23, 2010, the date that we filed our audited consolidated financial statements with the U.S. Securities and Exchange Commission.
In April 2009, the FASB issued new accounting guidance concerning application issues on initial recognition and measurement, subsequent measurement and accounting, and disclosure of assets and liabilities arising from contingencies in a business combination. The guidance is effective for assets or liabilities arising from contingencies in business combinations for which the acquisition date is on or after the beginning of the first annual reporting period beginning on or after December 15, 2008. The adoption of this accounting guidance did not have a material impact on our consolidated financial statements, although the future impact of this guidance will be largely dependent on the size and nature of business combinations completed after the effective date.
On January 30, 2009, the SEC released the final rules requiring all registered companies to use eXtensible Business Reporting Language (XBRL) when submitting financial statements to the SEC. The new rules initially will require interactive data reporting only by domestic and foreign large accelerated filers that prepare their financial statements in accordance with U.S. GAAP and have a worldwide public common equity float above $5.0 billion for their first quarterly period ending after June 15, 2009 and all reporting periods thereafter. We expect to be required to file using XBRL beginning with our quarterly reporting period ending March 31, 2011.
In November 2008, the SEC released a proposed roadmap regarding the potential use by U.S. issuers of financial statements prepared in accordance with International Financial Reporting Standards (IFRS). IFRS is a comprehensive series of accounting standards published by the International Accounting Standards Board. Under the proposed roadmap, we may be required in fiscal 2015 to prepare financial statements in accordance with IFRS. However, the SEC announced it will make a determination in 2011 regarding the mandatory adoption of IFRS. We are currently assessing the impact that this potential change would have on our consolidated financial statements, and will continue to monitor the development of the potential implementation of IFRS.
In March 2008, the FASB revised authoritative guidance for disclosures about derivative financial instruments and hedging activities. This guidance requires disclosures about derivatives and hedging activities including enhanced disclosure about (a) how and why an entity uses derivative instruments, (b) how derivative instruments and related hedged items are accounted and (c) how derivative instruments and related hedged items affect financial position, financial performance, and cash flows. This guidance is effective for financial statements issued for fiscal years and interim periods beginning after November 15, 2008. The adoption of this guidance did not materially impact our financial statement disclosures.
In December 2007, the FASB revised the authoritative guidance for business combinations, which establishes principles and requirements for how the acquirer in a business combination (i) recognizes and measures in its financial statements the identifiable assets acquired, the liabilities assumed, and any noncontrolling interest in the acquiree, (ii) recognizes and measures the goodwill acquired in the business combination or a gain from a bargain purchase and (iii) determines what information to disclose to enable users of the financial statements to evaluate the nature and financial effects of the business combination. The guidance is effective for business combinations for which the acquisition date is on or after the beginning of the first annual reporting period beginning on or after December 15, 2008. The adoption of this guidance did not have a material impact on our consolidated financial statements,
although the future impact of this guidance will be largely dependent on the size and nature of business combinations completed after the effective date.
In December 2007, the FASB issued authoritative guidance, which establishes accounting and reporting standards for ownership interests in subsidiaries held by parties other than the parent, the amount of consolidated net income attributable to the parent and to the noncontrolling equity investments when a subsidiary is deconsolidated. The guidance also establishes reporting requirements that provide sufficient disclosures that clearly identify and distinguish between the interests of the parent and the interest of the noncontrolling owners. The authoritative guidance is effective for fiscal years, and interim periods within those fiscal years, beginning on or after December 15, 2008. The adoption of this guidance did not have a material impact on our consolidated financial statements based on our current ownership interests.
3. Initial Public Offering and Use of Proceeds
On October 6, 2009, we completed our IPO of 56,000,000 shares of our common stock, par value $0.01 per share, at an offering price of $19.00 per share. Our IPO included 28,947,368 shares newly issued and sold by us and 27,052,632 shares sold by the selling stockholder, Talecris Holdings, LLC, including 6,000,000 shares sold by the selling stockholder pursuant to the underwriters’ option to purchase additional shares. After deducting the payment of underwriters’ discounts and commissions, the net primary proceeds to us from the sale of shares in our IPO were approximately $519.7 million, which we used to repay $389.8 million and $129.9 million of principal under our First and Second Lien Term Loans, respectively. We did not receive any proceeds from the sale of shares by the selling stockholder. In addition to the $30.3 million of underwriters’ discounts and commissions deducted from the offering proceeds, we incurred other offering costs of $3.9 million, of which $1.3 million is included in SG&A in our consolidated income statement for the year ended December 31, 2009 and $2.6 million is included as a reduction of additional paid-in capital on our December 31, 2009 consolidated balance sheet. At December 31, 2009, approximately $0.2 million of accrued offering expenses were payable to underwriters.
4. Definitive Merger Agreement with CSL Limited (CSL)
On August 12, 2008, we entered into a definitive merger agreement with CSL, under which CSL agreed to acquire us for cash consideration of $3.1 billion, less net debt, as defined. The closing of the transaction was subject to the receipt of certain regulatory approvals as well as other customary conditions. The U.S. Federal Trade Commission filed an administrative complaint before the Commission challenging the merger and a complaint in Federal district court seeking to enjoin the merger during the administrative process. On June 8, 2009, the merger parties agreed to terminate the definitive merger agreement. CSL paid us a merger termination fee of $75.0 million, which is included as other non-operating income in our consolidated income statement for the year ended December 31, 2009. The U.S. Federal Trade Commission’s complaints were subsequently dismissed.
In consideration of the definitive merger agreement with CSL, our board of directors approved a retention program in August 2008 for an amount up to $20.0 million. We recorded retention expense of $8.2 million and $5.1 million, excluding fringe benefits, during the years ended December 31, 2009 and 2008, respectively. We classified the cost of this retention program consistent with each recipient’s salary. We made payments of approximately $13.3 million under this retention program during 2009. No further payments are due.
5. Business Acquisitions
In November 2006, we acquired certain assets and assumed certain liabilities from International BioResources, L.L.C. and affiliated entities (IBR) pursuant to an Asset Purchase Agreement (APA). On June 9, 2007, the APA was amended to provide for the acceleration of all milestone and other amounts owed to IBR under the contingent consideration provision of the APA, and as a result, we issued 2,146,232 shares of our common stock to IBR in June 2007, of which 544,568 shares were immediately delivered to IBR and 1,601,664 shares were placed in escrow to secure against breaches and warranties under the APA. The shares placed in escrow were subsequently released to IBR during 2008 either through subsequent amendments to the APA or as the breaches and warranties provision lapsed.
The total fair value of the accelerated consideration of our common stock was determined to be $45.6 million, based upon the then fair value per share of our common stock as determined by our board of directors, of which $8.6 million was considered to be an inducement for IBR to enter into the June 9, 2007 Purchase and Sale of Assets Agreement (June 2007 Agreement) and the June 9, 2007 Plasma Supply Agreement, and $37.0 million was considered to be additional purchase price, and recorded as goodwill.
The $8.6 million inducement was initially recorded as an other long-term asset on our consolidated balance sheet and was allocable to the purchase price of plasma collection centers acquired from IBR under the June 2007 Agreement. At December 31,
2008, $6.0 million related to the inducement remained in other long-term assets on our consolidated balance sheet. As of December 31, 2009, the entire inducement has been allocated to the purchase price of plasma collection centers acquired during 2009 under the June 2007 Agreement.
IBR had the right to put the shares of our common stock back to us for cash ($15.61 per common share) under certain circumstances prior to June 30, 2008. IBR was entitled to interest at a rate of 8% per annum from the issuance date of the shares through December 31, 2007, and as a result we accreted our obligation to a maximum put value of $35.1 million. The difference between the put value and the fair value of the common stock on June 9, 2007 of $12.1 million was recorded as additional paid-in capital during the year ended December 31, 2007.
In January 2008, IBR exercised their put right, as amended, for 1,185,232 common shares, which we repurchased in February 2008. In March 2008, IBR exercised their put right, as amended, for the remaining 961,000 common shares, which we repurchased in April 2008. The repurchased shares were retired and the embedded put feature was cancelled.
The following table summarizes our purchase accounting for plasma collection centers acquired from IBR under the June 2007 Agreement. The plasma collection centers were acquired to support our plasma supply vertical integration strategy. The plasma collection centers’ results of operations have been included in our consolidated financial statements from their respective date of acquisition.
|
|
|
Years Ended December 31, |
|
|||||||
|
|
|
2009 |
|
2008 |
|
2007 |
|
|||
|
Payments at closing |
|
$ |
5,181 |
|
$ |
2,147 |
|
$ |
16,211 |
|
|
Notes receivable and other advances |
|
44,540 |
|
10,430 |
|
— |
|
|||
|
Performance incentive payments |
|
837 |
|
843 |
|
— |
|
|||
|
Allocable portion of accelerated contingent consideration |
|
6,020 |
|
2,580 |
|
— |
|
|||
|
Transaction costs |
|
— |
|
56 |
|
475 |
|
|||
|
Total purchase price |
|
$ |
56,578 |
|
$ |
16,056 |
|
$ |
16,686 |
|
|
|
|
|
|
|
|
|
|
|||
|
Cash and cash equivalents |
|
$ |
62 |
|
$ |
21 |
|
$ |
55 |
|
|
Inventory |
|
5,416 |
|
1,778 |
|
2,209 |
|
|||
|
Other current assets |
|
183 |
|
— |
|
— |
|
|||
|
Property, plant, and equipment |
|
10,181 |
|
1,814 |
|
1,095 |
|
|||
|
Intangible assets- regulatory licenses |
|
3,860 |
|
840 |
|
280 |
|
|||
|
Goodwill |
|
37,060 |
|
11,643 |
|
13,089 |
|
|||
|
Total assets acquired |
|
56,762 |
|
16,096 |
|
16,728 |
|
|||
|
Current liabilities assumed |
|
(184 |
) |
(40 |
) |
(42 |
) |
|||
|
Total purchase price |
|
$ |
56,578 |
|
$ |
16,056 |
|
$ |
16,686 |
|
|
|
|
|
|
|
|
|
|
|||
|
Number of plasma collection centers acquired |
|
12 |
|
3 |
|
3 |
|
|||
The purchase price for the plasma collection centers acquired from IBR during 2009 and 2008 consists of various loans and advances made to IBR and performance incentive payments for achieving certain milestones related to the timing of plasma collection center openings. The purchase price also includes the allocable portion of accelerated contingent consideration due to IBR as discussed above. We have no further financing commitments to IBR under the terms of our June 2007 Agreement.
6. Goodwill and Intangible Assets
Changes to the carrying amount of goodwill for the years ended December 31, 2009 and 2008 were as follows:
|
Balance at December 31, 2007 |
|
$ |
124,157 |
|
|
Acquisitions of plasma collection centers from IBR |
|
11,643 |
|
|
|
Balance at December 31, 2008 |
|
135,800 |
|
|
|
Acquisitions of plasma collection centers from IBR |
|
37,060 |
|
|
|
Balance at December 31, 2009 |
|
$ |
172,860 |
|
Additional information regarding our business acquisitions is included in Note 5, “Business Acquisitions.”
We assess goodwill for impairment annually as of December 31, or more frequently if events and circumstances indicate that impairment may have occurred. The impairment test requires us to allocate goodwill to our reporting units and estimate the fair value
of the reporting unit that contained goodwill. If the carrying value of a reporting unit exceeds its fair value, the goodwill of that reporting unit is potentially impaired and we proceed to step two of the impairment analysis. In step two of the analysis, we would record an impairment loss determined by the excess of the carrying amount of the reporting unit’s goodwill over its implied fair value.
We have assessed goodwill at the reporting unit level. We allocated our Company’s enterprise value to our reporting units based upon their relative contributions to one of our principal operating performance measures, adjusted EBITDA. We determined that the allocated fair value of the reporting unit exceeded its carrying value, and as a result, no adjustment to our recorded goodwill was required at December 31, 2009.
At December 31, 2009, we had $10.9 million of intangible assets recorded on our consolidated balance sheet, all of which were indefinite-lived regulatory licenses associated with our plasma collection centers. At December 31, 2008, we had $7.2 million of intangible assets recorded on our consolidated balance sheet, of which $7.0 million were indefinite-lived regulatory licenses associated with our plasma collection centers. We incurred minimal intangible asset amortization expense for the periods presented. We performed our annual impairment testing of indefinite-lived intangible assets as of December 31, 2009, which resulted in no impairment of the recorded amounts.
7. Collaborative and Other Agreements
Distribution Services and Supply Agreements with Bayer
We entered into a number of international distribution services and supply agreements with Bayer in conjunction with our 2005 formational activities under which Bayer affiliates provided supply and distribution services to us for various periods of time in a number of geographic regions outside of the United States. We have since terminated these agreements with Bayer as we have developed internal capabilities, or in certain cases, contracted with unaffiliated third parties, to assume these functions. During the years ended December 31, 2008 and 2007, we repurchased inventories with a value of approximately $28.6 million and $81.9 million, respectively, from a Bayer affiliate in Germany, where we terminated our distribution agreement.
Supply and Service Agreement
We have a Supply and Service Agreement, as amended, through 2012 to provide albumin to an unaffiliated third party, which is used in conjunction with a proprietary product manufactured by them. We earn a commission on sales of the third party’s product at a fixed rate which depends on the territory where the product is sold, as defined in the agreement. We also provide regulatory support as required. We earned commissions of $5.5 million, $8.6 million, and $7.4 million under this agreement for the years ended December 31, 2009, 2008, and 2007, respectively, which have been recorded in other net revenue in our consolidated income statements.
Licensed Technology
We licensed certain technology related to the formulation of one of our products to an unaffiliated third party. As consideration for the technology transfer, we received an upfront licensing fee of $4.0 million during 2007, of which 33% is refundable under certain conditions. We recognized $2.6 million of the licensing fee during 2008 as a result of the completion of a portion of our performance obligations, which we recorded within other net revenue in our consolidated income statement. The remaining portion has been deferred on our consolidated balance sheets at December 31, 2009 and 2008. We will recognize the remaining portion of the deferred licensing fee once our remaining performance obligations have been completed. Under the terms of this agreement, we will also receive royalty payments from this third party, which escalates with volume.
Litigation Settlement
We were a co-plaintiff along with Bayer Healthcare (Bayer) in patent litigation in the United States District Court for the District of Delaware against Baxter International Inc. and Baxter Healthcare (collectively, Baxter). In this case, filed in 2005, we, as exclusive licensee of Bayer’s U.S. Patent No. 6,686,191 (the ‘191 patent), alleged that Baxter by its manufacture and importation of its liquid IGIV product, Gammagard Liquid, had infringed the ‘191 patent. We entered into a Settlement Agreement with Baxter on August 10, 2007. Under the terms of the settlement, (i) Baxter paid us $11.0 million, (ii) Baxter will pay us for a period of four years from the settlement date an amount comprising 1.2% of Baxter’s net sales in the United States of Gammagard Liquid and any other product sold by Baxter or an affiliate in the United States under a different brand name that is a liquid intravenous immunoglobulin
under a separate Sublicense Agreement, (iii) Baxter provided us with approximately 2,000 kilograms of Fraction IV-I paste with specifications as per the Settlement Agreement (fair value of $1.8 million determined by reference to similar raw material purchases we have made in the past as well as current market conditions), and (iv) we will grant Baxter certain sublicense rights in the ‘191 patent and its foreign counterparties.
We incurred legal fees related to this litigation of $5.7 million during the year ended December 31, 2007, which were recorded within SG&A in our consolidated income statement. During the year ended December 31, 2007, we recorded $12.9 million related to the settlement in other non-operating income in our consolidated income statement. During the years ended December 31, 2009, 2008, and 2007, we recorded $10.6 million, $8.7 million, and $1.7 million, respectively, of fees from Baxter within other net revenue in our consolidated income statements.
8. Inventories and Cost of Goods Sold
Inventories consisted of the following:
|
|
|
December 31, |
|
||||
|
|
|
2009 |
|
2008 |
|
||
|
Raw material |
|
$ |
171,866 |
|
$ |
155,055 |
|
|
Work-in-process |
|
312,178 |
|
306,950 |
|
||
|
Finished goods |
|
160,010 |
|
119,715 |
|
||
|
Total inventories |
|
$ |
644,054 |
|
$ |
581,720 |
|
Our raw material inventories include unlicensed plasma and related testing costs of $7.6 million and $8.2 million at December 31, 2009 and 2008, respectively, which we believe are realizable.
Unabsorbed Talecris Plasma Resources, Inc. (TPR) Infrastructure and Start-Up Costs
Our cost of goods sold includes $44.0 million, $98.5 million, and $70.1 million for the years ended December 31, 2009, 2008, and 2007, respectively, related to unabsorbed TPR infrastructure and start-up costs associated with the development of our plasma collection center platform. Until our plasma collection centers reach normal operating capacity, we charge unabsorbed overhead costs directly to cost of goods sold.
Plasma Center current Good Manufacturing Practices (cGMP) Issue
During the first and second quarters of 2008, we incurred charges to cost of goods sold of $16.3 million and $7.0 million, respectively, due to deviations from our standard operating procedures and cGMP at one of our plasma collection centers. Our preliminary investigations concluded that the deviations from our standard operating procedures and cGMP resulted in impairments to the related raw material and work-in-process inventories as we concluded there was no probable future economic benefit related to the impacted inventories. Subsequently, due to further investigations and new facts and circumstances, we determined that certain impacted inventories were saleable. We record recoveries directly to cost of goods sold after the impacted material is converted into final products and sold to third parties. During the years ended December 31, 2009 and 2008, we recorded recoveries of $1.9 million and $17.5 million, respectively. For the year ended December 31, 2008, recoveries totaled $17.5 million, resulting in a net provision of $5.8 million for 2008. We do not expect to recognize significant further recoveries of the impacted inventories.
Customer Settlement
We settled a dispute with a customer in September 2007 regarding intermediate material manufactured by us, which is used by this customer in their manufacturing process. We recorded a charge to cost of goods sold of $7.9 million during the year ended December 31, 2007 for inventory impairment related to this material, which we recovered in its entirety during 2008 as the related material was determined to be saleable, converted into final product, and sold to other customers. During 2008, we recorded an additional inventory provision of $2.6 million related to this dispute for products held in Europe, for which we recovered $0.8 million and $1.8 million during 2009 and 2008, respectively, as the impacted material was determined to be saleable, converted into final product, and sold to other customers.
Unplanned Plant Maintenance
During November 2007, we shut down portions of our Clayton, North Carolina facility for approximately two weeks consistent with our cGMP operating practices for unplanned plant maintenance. As a result of the unplanned maintenance, we recorded a charge to cost of goods sold of $10.0 million during the year ended December 31, 2007, primarily related to unabsorbed
production costs, which would have otherwise been capitalized to inventories. There was no impact to the carrying value of inventories.
Gamunex IGIV Production Incident
In March 2005, prior to our formation as Talecris, a production incident occurred at our Clayton, North Carolina facility, which resulted in a write-off of Gamunex IGIV that had elevated levels of IgM antibodies. During March 2007, we reached an agreement with Bayer under which we recovered $9.0 million related to this production incident, which we recorded as a reduction of cost of goods sold during the year ended December 31, 2007.
9. Property, Plant, and Equipment, net
Property, plant, and equipment, net, consisted of the following:
|
|
|
December 31, |
|
||||
|
|
|
2009 |
|
2008 |
|
||
|
Land |
|
$ |
4,136 |
|
$ |
4,136 |
|
|
Buildings and improvements |
|
68,417 |
|
47,764 |
|
||
|
Machinery and equipment |
|
102,887 |
|
67,446 |
|
||
|
Furniture and fixtures |
|
5,492 |
|
4,996 |
|
||
|
Computer hardware and software |
|
54,761 |
|
42,762 |
|
||
|
Capital leases of buildings |
|
8,374 |
|
6,639 |
|
||
|
|
|
244,067 |
|
173,743 |
|
||
|
Less: accumulated depreciation and amortization |
|
(62,463 |
) |
(36,308 |
) |
||
|
|
|
181,604 |
|
137,435 |
|
||
|
Construction in progress |
|
85,595 |
|
75,816 |
|
||
|
Total property, plant, and equipment, net |
|
$ |
267,199 |
|
$ |
213,251 |
|
Depreciation expense was $28.8 million, $20.1 million, and $10.5 million for the years ended December 31, 2009, 2008, and 2007, respectively.
During 2009 and 2008, we recorded impairment charges of $3.1 million and $3.6 million, respectively, primarily within cost of goods sold in our consolidated income statements related primarily to capital lease assets and leasehold improvements at certain of our plasma collection centers which were closed or were under development and we no longer plan to open.
During 2007, we recorded an impairment charge related to equipment of $2.8 million as a result of the discontinuation of a capital project, which is included in cost of goods sold in our consolidated income statement.
10. Investment in Affiliate
At December 31, 2009, we had a 30% interest in the Class 1 common stock of Centric Health Resources, Inc. (Centric). Our investment in Centric is accounted for using the equity method of accounting based on our assessment that our interest allows us to exercise significant influence, but not control. Under the equity method, our investment, originally recorded at cost, is adjusted to recognize our share of net earnings or losses of Centric as they occur. Our recognition of losses is limited to the extent of our investment in, advances to, and commitments for the investment.
Centric provides services in the management of our Prolastin and Gamunex Direct programs. In this capacity, Centric provides warehousing, order fulfillment, distribution, home infusion, and customer relationship services for us primarily related to our U.S. sales of Prolastin. Centric maintains inventory on our behalf which they utilize to fill customer orders. Centric also provides services to us in collecting accounts receivable for sales made under the Prolastin and Gamunex Direct programs. We provide Centric a fee for each unit of product provided to patients which escalates with volume. The total fees for such services for the years ended December 31, 2009, 2008, and 2007 were $20.3 million, $17.5 million, and $14.5 million, respectively. The majority of these fees are recorded within cost of goods sold in our consolidated income statements. The value of the finished goods inventories that Centric held on our behalf was $7.1 million and $8.9 million at December 31, 2009 and 2008, respectively.
11. Long-Term Debt and Capital Lease Obligations
We were obligated under the following debt instruments:
|
|
|
December 31, |
|
||||
|
|
|
2009 |
|
2008 |
|
||
|
Revolving Credit Facility |
|
$ |
— |
|
$ |
179,941 |
|
|
7.75% Notes |
|
600,000 |
|
— |
|
||
|
Discount on 7.75% Notes |
|
(3,954 |
) |
— |
|
||
|
First Lien Term Loan |
|
— |
|
686,000 |
|
||
|
Second Lien Term Loan |
|
— |
|
330,000 |
|
||
|
Capital lease obligations |
|
9,961 |
|
5,605 |
|
||
|
Total debt and capital lease obligations |
|
606,007 |
|
1,201,546 |
|
||
|
Less: current maturities |
|
(740 |
) |
(7,341 |
) |
||
|
Long-term debt and capital lease obligations, net of current maturities |
|
$ |
605,267 |
|
$ |
1,194,205 |
|
Financial Impact of IPO and Refinancing Transactions
The following table summarizes the changes to our indebtedness during 2009, including the impact from the application of the net proceeds to us of $519.7 million from our IPO discussed in Note 3, “Initial Public Offering and Use of Proceeds,” and the net proceeds to us of $583.9 million from the refinancing transactions discussed below:
|
|
|
December 31, |
|
2009 Net |
|
October 6, 2009 |
|
October 21, 2009 |
|
|
|
December 31, |
|
||||||
|
|
|
2008 |
|
Repayments |
|
IPO |
|
Refinancing |
|
Amortization |
|
2009 |
|
||||||
|
Revolving Credit Facility |
|
$ |
179,941 |
|
$ |
(124,348 |
) |
$ |
— |
|
$ |
(55,593 |
) |
$ |
— |
|
$ |
— |
|
|
First Lien Term Loan |
|
686,000 |
|
(5,250 |
) |
(389,812 |
) |
(290,938 |
) |
— |
|
— |
|
||||||
|
Second Lien Term Loan |
|
330,000 |
|
— |
|
(129,937 |
) |
(200,063 |
) |
— |
|
— |
|
||||||
|
7.75% Notes |
|
— |
|
— |
|
— |
|
600,000 |
|
— |
|
600,000 |
|
||||||
|
Discount on 7.75% Notes |
|
— |
|
— |
|
— |
|
(4,074 |
) |
120 |
|
(3,954 |
) |
||||||
|
Total indebtedness |
|
$ |
1,195,941 |
|
$ |
(129,598 |
) |
$ |
(519,749 |
) |
$ |
49,332 |
|
$ |
120 |
|
$ |
596,046 |
|
In addition to the debt principal repayments in the preceding table, we used $28.7 million of the net proceeds to us from the issuance of the 7.75% Notes to settle and terminate certain interest rate swap contracts with a notional amount of $390.0 million and $8.6 million to pay accrued interest associated with our then outstanding First and Second Lien Term Loans. In addition to the $4.1 million of discounts on the 7.75% Notes disclosed in the table above, approximately $12.0 million of commissions were deducted from the gross issuance proceeds. Subsequently, we settled and terminated our remaining interest rate swap contract with a notional amount of $50.0 million for $6.1 million.
As a result of the IPO and refinancing transactions, we recognized a charge during the fourth quarter of 2009 of $12.1 million to write-off previously deferred debt issuance costs related to our First and Second Lien Term Loans and $30.9 million related to costs associated with the settlement and termination of our interest rate swap contracts. These charges, which totaled $43.0 million, are recorded within other non-operating expense, net, in our consolidated income statement for the year ended December 31, 2009. We capitalized $14.9 million of debt issuance costs associated with the issuance of the 7.75% Notes and the Revolving Credit Facility amendment. We incurred other costs related to our IPO of $3.9 million, of which $1.3 million is included within SG&A in our consolidated income statement for the year ended December 31, 2009 and $2.6 million is included as a reduction of additional paid-in capital on our December 31, 2009 consolidated balance sheet. The following table summarizes changes in deferred debt issuance costs during the year ended December 31, 2009:
|
|
|
|
|
|
|
Newly |
|
|
|
|
|
|||||
|
|
|
|
|
|
|
Capitalized |
|
|
|
|
|
|||||
|
|
|
December 31, |
|
|
|
Debt Issuance |
|
|
|
December 31, |
|
|||||
|
|
|
2008 |
|
Charges |
|
Costs |
|
Amortization |
|
2009 |
|
|||||
|
Revolving Credit Facility |
|
$ |
3,014 |
|
$ |
— |
|
$ |
1,545 |
|
$ |
(1,041 |
) |
$ |
3,518 |
|
|
First Lien Term Loan |
|
9,629 |
|
(8,054 |
) |
— |
|
(1,575 |
) |
— |
|
|||||
|
Second Lien Term Loan |
|
4,744 |
|
(4,087 |
) |
— |
|
(657 |
) |
— |
|
|||||
|
7.75% Notes |
|
— |
|
— |
|
13,334 |
|
(392 |
) |
12,942 |
|
|||||
|
Total deferred debt issuance costs |
|
$ |
17,387 |
|
$ |
(12,141 |
) |
$ |
14,879 |
|
$ |
(3,665 |
) |
$ |
16,460 |
|
Deferred debt issuance costs are recorded within other long-term assets on our consolidated balance sheets and are amortized to interest expense, net, in our consolidated income statements on a straight-line basis, which approximates the effective yield amortization method, over the term of the related credit facility.
7.75% Unsecured Senior Notes, due November 15, 2016
On October 21, 2009, we completed the issuance of $600.0 million, 7.75% Senior Notes, due November 15, 2016, at a price of 99.321% of par, in a private placement to certain qualified institutional buyers. The 7.75% Notes yield 7.875% to maturity and pay interest semi-annually on May 15 and November 15 to holders of record on the immediately preceding May 1 and November 1, respectively. The 7.75% Notes are guaranteed on a senior unsecured basis by our existing and future domestic subsidiaries. Except as described below, we will not be entitled to redeem the 7.75% Notes at our option prior to November 12, 2012.
We may redeem some or all of the 7.75% Notes, at our option, at any time on or after November 12, 2012, at the redemption prices (expressed as percentages of principal amount) set forth below plus accrued and unpaid interest and additional interest, if any, on the 7.75% Notes redeemed, to the applicable redemption date, if redeemed during the twelve-month period beginning on November 15 of the years indicated below:
|
Fiscal Year |
|
Percentage |
|
|
2012 |
|
103.875 |
% |
|
2013 |
|
102.583 |
% |
|
2014 |
|
101.292 |
% |
|
2015 and thereafter |
|
100.000 |
% |
In addition, at any time during each twelve-month period ending on November 15, 2010, 2011, and 2012, we may redeem up to 10% of the originally issued principal amount of the 7.75% Notes at a redemption price of 103% of the principal amount of the 7.75% Notes redeemed plus accrued and unpaid interest and additional interest, if any, to the redemption date, subject to the rights of the holders of the 7.75% Notes on the relevant record date to receive interest due on the relevant interest payment date.
At any time, or from time to time, on or prior to November 15, 2012, we may, at our option, redeem up to 35% of the aggregate principal amount of the 7.75% Notes issued under the indenture with the net cash proceeds to us of certain equity offerings at a redemption price equal to 107.75% of the principal amount of the 7.75% Notes plus accrued and unpaid interest and additional interest, if any, to the applicable redemption date, provided that at least 65% of the aggregate principal amount of the 7.75% Notes originally issued remains outstanding immediately after such redemption and the redemption occurs within 90 days of the date of the closing of such equity offering.
Under the Make-Whole redemption feature, we may redeem 100% of the principal plus a premium as defined under the indenture (computed using a discount rate equal to the U.S. Treasury rate as of such redemption date plus 0.50%), plus accrued and unpaid interest and additional interest, if any, prior to November 15, 2012, with respect to some or all of the 7.75% Notes, subject to the rights of the holders on the relevant record date to receive interest due on the relevant interest payment date.
We are not required to make mandatory redemption or sinking fund payments with respect to the 7.75% Notes.
Upon a change of control, the 7.75% Notes are puttable at 101% of principal plus accrued and unpaid interest and additional interest, if any.
We may incur additional indebtedness and our subsidiary guarantors may also incur additional indebtedness if our Fixed Charge Coverage Ratio for our most recently ended four full fiscal quarters immediately preceding the date on which such additional indebtedness is incurred would have been at least 2.00 to 1.00, determined on a pro forma basis.
The indenture contains certain covenants limiting, subject to exceptions, carve-outs and qualifications, our ability and our restricted subsidiaries’ ability to: (i) sell assets; (ii) pay distributions on, redeem or repurchase its capital stock or redeem or repurchase its subordinated debt; (iii) make certain investments; (iv) incur or guarantee additional indebtedness or issue preferred stock; (v) create or incur certain liens; (vi) enter into agreements that restrict distributions or other payments from our restricted subsidiaries to us; (vii) engage in certain sale and leaseback transactions; (viii) engage in certain transactions with affiliates; (ix) transfer or dispose of the capital stock of the restricted subsidiary to persons other than us or our restricted subsidiaries; and (x) create unrestricted subsidiaries. The indenture also contains certain customary events of default.
In connection with the sale of the 7.75% Notes, we and our subsidiaries that guaranteed the 7.75% Notes entered into an exchange and registration rights agreement with the initial purchasers of the 7.75% Notes on October 21, 2009, pursuant to which we are obligated, by April 19, 2010, to file with Securities and Exchange Commission under the Securities Act of 1933, as amended, a registration statement with respect to an offer to exchange the 7.75% Notes (and guarantees) for substantially identical new notes (and guarantees) of ours. If we are not able to effect this exchange offer, we have agreed to file a shelf registration statement relating to re-sales of the 7.75% Notes. We will be obligated to pay damages consisting of additional interest on the 7.75% Notes if, within the periods specified in the Registration Rights Agreement, we do not file the exchange offer registration statement or the shelf registration statement or we do not comply with certain other obligations under the Registration Rights Agreement.
Revolving Credit Facility
We have a $325.0 million asset-based credit agreement administered by Wachovia Bank, N.A., an affiliate of Wells Fargo Securities, which was amended on October 15, 2009 as described below. We use our available cash balances to repay amounts outstanding under our Revolving Credit Facility. We deposit any excess amounts into an overnight investment account. Outstanding principal under this facility is due and payable on the maturity date of December 6, 2011. At December 31, 2009, $2.0 million was being utilized for letters of credit and $323.0 million was unused and available. The letters of credit were used as security for utilities, insurance, and third party warehousing.
Borrowings under this facility bear interest at a rate based upon either the ABR or LIBOR, at our option, plus applicable margins based upon borrowing availability. The ABR represents the greater of the Federal Funds Effective Rate plus 0.50% or the Prime Rate. Interest accrues on the Revolving Credit Facility at the ABR plus 0.25-0.75% or LIBOR plus 1.50-2.00%. For the years ended December 31, 2009, 2008, and 2007, the weighted average interest rates of our Revolving Credit Facility were 2.79%, 4.79%, and 7.90%, respectively. At December 31, 2008, the interest rates on the ABR and LIBOR borrowings were 3.75% and 2.82%, respectively. No amounts were outstanding under the Revolving Credit Facility at December 31, 2009.
The Revolving Credit Facility is secured by a Pledge and Security Agreement dated December 6, 2006 under which substantially all of our personal property, including real estate, manufacturing equipment, accounts receivable, inventory, and stock are pledged as security, each as defined within the agreement.
The Revolving Credit Facility contains default provisions, and, pursuant to the October 15, 2009 amendment described below, imposes restrictions on annual capital expenditures if our leverage ratio is 2.00 to 1.00 or less, and contains a financial covenant which requires us to maintain a fixed charge coverage ratio of at least 1.10 to 1.00 if our borrowing availability based on eligible collateral is less than $48.75 million. The Revolving Credit Facility defines certain terms in calculating covenant ratios, including adjusted EBITDA and Indebtedness.
The borrowing base under our Revolving Credit Facility is based on our accounts receivable and inventory, and is calculated as (i) 85% of our eligible accounts receivable plus (ii) the lesser of (a) 65% of our eligible inventory (valued on a first-in-first-out basis), (b) 85% of the net orderly liquidation value of our eligible inventory as determined by a recent appraisal, and (c) $300 million. Only up to $100 million may be advanced to us based on the value of our work-in-process inventory (with “filled-not-packed” and “packed-not-released” inventory being considered finished goods inventory). From time to time, the collateral agent under the Revolving Credit Facility may modify our eligibility standards, establish or adjust reserves, or reduce one or more of the other elements used in computing the borrowing base.
On October 15, 2009, we entered into an amendment to the Revolving Credit Facility dated as of October 12, 2009. The Revolving Credit Facility, as amended, permitted the 7.75% Notes, described above, to be issued as long as the First and Second Lien Term Loan Credit Agreements were terminated in connection with the offering of the 7.75% Notes. The amendment also (i) increases the covenant baskets for permitted acquisitions to $250 million, (ii) permits the payment of cash dividends commencing with the first fiscal quarter of 2010 if certain conditions are met as described below, and (iii) increases our capital expenditure baskets so that we will be permitted to make capital expenditures of up to $225 million in each of 2010 and 2011. Moreover, pursuant to the amendments, we are not subject to any limitation on our capital expenditures in any fiscal year if our leverage ratio, as defined, as of the end of the fiscal year most recently ended was less than or equal to 2.00 to 1.00. Minimum availability tests under the Revolving Credit Facility were also increased from $32.5 million to $48.75 million in connection with the amendment.
Our Revolving Credit Facility, as amended, permits the payment of cash dividends to holders of our common stock commencing with the first fiscal quarter of 2010, so long as (i) the Leverage Ratio determined as of the end of the immediately preceding fiscal quarter for the then most recently completed four fiscal quarters, is equal to or less than 2.00 to 1.00 and (ii) the minimum pro forma Availability as of the date of such dividend (after giving effect to such cash dividend, the funding of all Revolving Loans, and the issuance of all Letters of Credit to be funded or issued as of such date) is not less than $48.75 million; provided that, the aggregate amount of Restricted Payments shall not exceed 50% of Net Income during the period from October 1, 2009 to the end of the most recently ended fiscal quarter as of the date of the Restricted Payment.
First and Second Lien Term Loans
Our First and Second Lien Term Loans were repaid in full and terminated as a result of the application of the net proceeds to us from our October 6, 2009 IPO and the issuance of our 7.75% Notes on October 21, 2009. The weighted average annualized interest rates on the First Lien Term Loan were 4.66%, 6.60%, and 9.07% for the years ended December 31, 2009, 2008, and 2007, respectively, and the weighted average annualized interest rates on the Second Lien Term Loan were 7.68%, 9.63%, and 12.13% for the years ended December 31, 2009, 2008, and 2007, respectively. At December 31, 2008, the interest rates on the First and Second Lien Term Loans were 5.64% and 8.64%, respectively.
Interest Rate Swaps and Caps
We used $28.7 million of the net proceeds to us from the issuance of our 7.75% Notes to settle and terminate certain interest rate swap contracts with a notional amount of $390.0 million. Subsequently, we settled and terminated our remaining interest rate swap contract with a notional amount of $50.0 million for $6.1 million. As a result of the settlement and termination of these interest rate swap contracts, we recognized a charge of $30.9 million (approximately $18.9 million after tax) during the year ended December 31, 2009 within total other non-operating expense, net, in our consolidated income statement. At December 31, 2008, approximately $23.3 million, net of taxes, was recorded in accumulated other comprehensive loss, related to our interest rate swap contracts. As a result of their settlement and termination, we reclassified $23.3 million out of accumulated other comprehensive loss to loss on extinguishment of debt within total other non-operating expense, net, in our consolidated income statement for the year ended December 31, 2009.
At December 31, 2008, we had five variable-to-fixed interest rate swap contracts with an aggregate notional amount of $500.0 million and two interest rate cap contracts with an aggregate notional principal amount of $175.0 million outstanding, respectively. At December 31, 2008, the fair value of our interest rate derivatives was $37.5 million, which was recorded primarily in other long-term liabilities on our consolidated balance sheet. Fair value was calculated using Level 2 inputs, which included forward LIBOR curves and credit default swap data. At December 31, 2009, we had two interest rate cap contracts with a notional principal amount of $175.0 million outstanding for which the cap rate of 6.00% was significantly higher than prevailing market interest rates; therefore, the fair market value was zero.
Additional Information Regarding Our Financial Covenants
The lenders under our Revolving Credit Facility use adjusted EBITDA as the basis of calculation of our compliance with our Leverage Ratio (Total Debt divided by the last twelve months’ adjusted EBITDA) and Interest Coverage Ratio (last twelve months’ adjusted EBITDA divided by Cash Interest Expense). Both the Leverage Ratio and the Interest Coverage Ratio are measures our lenders use to monitor our performance and ability to generate positive cash flows.
Adjusted EBITDA is defined in our Revolving Credit Facility as net income plus net interest expense, depreciation and amortization, income taxes, and other adjustments. Other adjustments include, but are not limited to, the following to the extent that they are included in net income:
· Write-offs, write-downs, asset revaluations and other non-cash charges, losses, and expenses, including non-cash equity compensation expense;
· Impairments of intangibles and goodwill;
· Extraordinary gains and losses;
· Fees paid pursuant to our Management Agreement, as amended, with Talecris Holdings, LLC, which was terminated in connection with our IPO;
· Fees and expenses incurred in connection with transactions and permitted acquisitions and investments;
· Extraordinary, unusual, or non-recurring charges and expenses including transition, restructuring, and “carve-out” expenses;
· Legal, accounting, consulting, and other expenses relating to the potential or actual issuance of equity interests, including an initial public offering of common stock;
· Costs associated with our Special Recognition Bonuses; and
· Other items.
12. Income Taxes
Components of our provision (benefit) for income taxes are as follows:
|
|
|
Years Ended December 31, |
|
|||||||
|
|
|
2009 |
|
2008 |
|
2007 |
|
|||
|
Current provision: |
|
|
|
|
|
|
|
|||
|
Federal |
|
$ |
68,960 |
|
$ |
28,639 |
|
$ |
24,394 |
|
|
State and local |
|
3,421 |
|
4,590 |
|
5,438 |
|
|||
|
Foreign |
|
1,348 |
|
1,776 |
|
1,919 |
|
|||
|
Total current provision |
|
73,729 |
|
35,005 |
|
31,751 |
|
|||
|
Deferred provision (benefit): |
|
|
|
|
|
|
|
|||
|
Federal |
|
69 |
|
7 |
|
(14,464 |
) |
|||
|
State and local |
|
1,210 |
|
1,582 |
|
(2,327 |
) |
|||
|
Total deferred provision (benefit) |
|
1,279 |
|
1,589 |
|
(16,791 |
) |
|||
|
Change in valuation allowance |
|
— |
|
— |
|
(55,754 |
) |
|||
|
Provision (benefit) for income taxes |
|
$ |
75,008 |
|
$ |
36,594 |
|
$ |
(40,794 |
) |
A reconciliation of expected income tax expense (benefit) at the U.S. Federal rate of 35% to actual income tax expense is as follows:
|
|
|
Years Ended December 31, |
|
|||||||
|
|
|
2009 |
|
2008 |
|
2007 |
|
|||
|
Amount computed at statutory rate |
|
$ |
80,114 |
|
$ |
35,837 |
|
$ |
28,969 |
|
|
State income taxes (net of Federal benefit) |
|
4,291 |
|
4,059 |
|
3,201 |
|
|||
|
Research and development credits |
|
(7,732 |
) |
(4,052 |
) |
(10,034 |
) |
|||
|
State tax credits (net of Federal benefit) |
|
(871 |
) |
(600 |
) |
(1,895 |
) |
|||
|
Federal benefit of tax deductions for qualified production activities |
|
(2,764 |
) |
(2,037 |
) |
(2,166 |
) |
|||
|
Capitalized transaction costs |
|
(2,352 |
) |
584 |
|
2,087 |
|
|||
|
Nondeductible meals and entertainment expenses |
|
504 |
|
425 |
|
520 |
|
|||
|
Bayer settlement |
|
— |
|
— |
|
(3,150 |
) |
|||
|
Other |
|
3,818 |
|
2,378 |
|
(2,572 |
) |
|||
|
Change in valuation allowance |
|
— |
|
— |
|
(55,754 |
) |
|||
|
Provision (benefit) for income taxes |
|
$ |
75,008 |
|
$ |
36,594 |
|
$ |
(40,794 |
) |
We calculate a provision for, or benefit from, income taxes using the asset and liability method. Deferred tax assets and liabilities are recognized for future consequences attributable to differences between the financial statement carrying amounts of existing assets and liabilities and their respective tax bases and operating loss and tax credit carry-forwards. Deferred tax assets and liabilities are measured using enacted tax rates expected to apply to taxable income in the years in which those temporary differences are expected to be recovered or settled. The effect on deferred tax assets and liabilities of a change in tax rates is recognized in income in the period that includes the enactment date. The major components of our deferred tax assets and liabilities are as follows:
|
|
|
December 31, |
|
||||
|
|
|
2009 |
|
2008 |
|
||
|
Current: |
|
|
|
|
|
||
|
Deferred income tax assets: |
|
|
|
|
|
||
|
Allowances on accounts receivable |
|
$ |
11,020 |
|
$ |
6,825 |
|
|
Inventories |
|
23,928 |
|
25,023 |
|
||
|
Revenue recognition |
|
7,857 |
|
6,148 |
|
||
|
Stock-based compensation |
|
30,952 |
|
20,085 |
|
||
|
Deferred bonuses |
|
4,617 |
|
9,980 |
|
||
|
Accrued expenses |
|
4,568 |
|
4,683 |
|
||
|
State tax credit carry-forward |
|
3,195 |
|
2,991 |
|
||
|
Other |
|
3,543 |
|
1,782 |
|
||
|
Total deferred income tax assets |
|
89,680 |
|
77,517 |
|
||
|
Deferred income tax liabilities: |
|
|
|
|
|
||
|
Other liabilities |
|
(1,028 |
) |
(930 |
) |
||
|
Total deferred income tax liabilities |
|
(1,028 |
) |
(930 |
) |
||
|
Net current deferred income tax assets |
|
$ |
88,652 |
|
$ |
76,587 |
|
|
|
|
|
|
|
|
||
|
Non-current: |
|
|
|
|
|
||
|
Deferred income tax assets: |
|
|
|
|
|
||
|
Property, plant, and equipment |
|
$ |
14,170 |
|
$ |
23,615 |
|
|
Interest rate swaps and caps |
|
— |
|
14,225 |
|
||
|
Other |
|
252 |
|
— |
|
||
|
Total deferred income tax assets |
|
14,422 |
|
37,840 |
|
||
|
Deferred income tax liabilities: |
|
|
|
|
|
||
|
Intangibles |
|
(8,574 |
) |
(3,973 |
) |
||
|
Other |
|
— |
|
(514 |
) |
||
|
Total deferred income tax liabilities |
|
(8,574 |
) |
(4,487 |
) |
||
|
Net non-current deferred income tax assets |
|
$ |
5,848 |
|
$ |
33,353 |
|
|
|
|
|
|
|
|
||
|
Net deferred income tax assets |
|
$ |
94,500 |
|
$ |
109,940 |
|
We record a valuation allowance to reduce our deferred tax assets to the amount that we believe is more likely than not to be realized. In assessing the need for a valuation allowance, we consider all available evidence, both positive and negative, including historical levels of income, expectations and risks associated with future taxable income, and ongoing prudent and feasible tax planning strategies. As a result of our analysis of all available evidence, which included ten consecutive quarters of cumulative pre-tax profits and our expectations that we can generate sustainable consolidated taxable income for the foreseeable future, we concluded that it was more likely than not that our deferred tax assets would be realized, and consequently, we released the remaining valuation allowance related to our deferred tax assets during the third quarter of 2007. The release of the valuation allowance related to our deferred tax assets resulted in a $48.2 million non-cash tax benefit during the year ended December 31, 2007. During the first three quarters of 2007, we also realized a portion of our deferred tax assets equal to the amount of our current Federal income tax provision.
We have not provided for U.S. Federal income and foreign withholding taxes on our non-U.S. subsidiaries’ cumulative undistributed earnings of approximately $9.7 million as of December 31, 2009 as such earnings are intended to be reinvested outside of the U.S. indefinitely. It is not practicable to estimate the amount of tax that might be payable if some or all of such earnings were to be remitted, and foreign tax credits would be available to reduce or eliminate the resulting U.S. income tax liability.
At December 31, 2009, we had state tax credit carryforwards of $4.9 million that will start expiring in 2013. Our ability to offset future taxable income with tax credit carryforwards may be limited in certain circumstances, including changes in ownership.
We adopted new income tax accounting guidance on January 1, 2007, which prescribes a two-step process for the financial statement measurement and recognition of a tax position taken or expected to be taken in a tax return. The first step involves the determination of whether it is more likely than not (greater than 50% likelihood) that a tax position will be sustained upon examination, based upon the technical merits of the position. The second step requires that any tax position that meets the more likely than not recognition threshold be measured and recognized in the financial statements at the largest amount of the benefit that is greater than 50% likely of being realized upon ultimate settlement. The new accounting guidance also provides guidance on the accounting for related interest and penalties, financial statement classification, and disclosure. The adoption of this accounting guidance resulted in a decrease to retained earnings of approximately $0.7 million.
The following table summarizes activity related to our gross unrecognized tax positions:
|
Unrecognized tax benefits at January 1, 2007 |
|
$ |
6,893 |
|
|
Additions for tax positions taken in the current year |
|
2,959 |
|
|
|
Reductions for tax positions taken in a prior year |
|
(2,967 |
) |
|
|
Unrecognized tax benefits at December 31, 2007 |
|
6,885 |
|
|
|
Additions for tax positions taken in the current year |
|
3,626 |
|
|
|
Reductions for tax positions taken in a prior year |
|
(521 |
) |
|
|
Unrecognized tax benefits at December 31, 2008 |
|
9,990 |
|
|
|
Additions for tax positions taken in the current year |
|
3,899 |
|
|
|
Reductions for tax positions taken in a prior year |
|
(1,642 |
) |
|
|
Unrecognized tax benefits at December 31, 2009 |
|
$ |
12,247 |
|
As of December 31, 2009, our total gross unrecognized tax benefits were approximately $12.2 million, of which approximately $8.8 million would reduce our effective income tax rate if recognized. Interest and penalties related to unrecognized tax benefits are included in income tax expense. No material interest or penalties were incurred during the years presented.
The Internal Revenue Service (IRS) recently completed the fieldwork related to the audit of our 2005, 2006, and 2007 Federal income tax returns. The Joint Committee on Taxation returned the 2005, 2006 and 2007 Federal income tax audit to the IRS field agent for additional review. The case will be resubmitted to the Joint Committee on Taxation and is likely to be finalized following their review. We do not believe that the outcome of this examination will have a material adverse impact on our consolidated financial condition or results of operations. However, it is reasonably possible that within the next twelve months, we will resolve with the IRS some or all of the matters presently under consideration in the examination for 2005, 2006, and 2007, primarily consisting of research and experimental credits and orphan drug credits, which may increase or decrease the unrecognized tax benefits for all open tax years. Settlement could increase earnings in an amount ranging from $0 to $4.7 million based on current estimates. Audit outcomes and the timing of audit settlements are subject to significant uncertainty.
We have analyzed our filing positions for all open years in all significant Federal, state, and foreign jurisdictions where we are required to file income tax returns. The periods subject to examination by the major tax jurisdictions where we conduct business are tax periods 2005 through 2009.
13. Commitments and Contingencies
Leases
We lease office buildings, plasma collection centers, refrigerated storage, furniture, machinery, computer equipment, and miscellaneous equipment under leasing agreements. The majority of our leases are operating leases. In addition to rent, certain of our leases require us to pay directly for taxes, insurance, maintenance, and other operating expenses. Future minimum lease payments required under our capital leases and non-cancellable operating leases as of December 31, 2009 are as follows:
|
|
|
|
|
Non-cancellable |
|
||
|
|
|
Capital |
|
Operating |
|
||
|
|
|
Leases |
|
Leases |
|
||
|
2010 |
|
$ |
1,740 |
|
$ |
16,727 |
|
|
2011 |
|
1,762 |
|
12,401 |
|
||
|
2012 |
|
1,784 |
|
7,857 |
|
||
|
2013 |
|
1,810 |
|
4,501 |
|
||
|
2014 |
|
1,778 |
|
3,212 |
|
||
|
Thereafter |
|
6,283 |
|
5,788 |
|
||
|
Total future minimum lease payments |
|
15,157 |
|
$ |
50,486 |
|
|
|
Less: amounts representing interest |
|
(5,196 |
) |
|
|
||
|
Present value of net minimum lease payments |
|
9,961 |
|
|
|
||
|
Less: current portion of capital lease obligations |
|
(740 |
) |
|
|
||
|
Total |
|
$ |
9,221 |
|
|
|
|
In the preceding table, the future minimum annual rentals payable under non-cancellable leases denominated in foreign currencies have been calculated based upon the December 31, 2009 foreign currency exchange rates. Rental cost was approximately $16.6 million, $14.8 million, and $13.0 million for the years ended December 31, 2009, 2008, and 2007, respectively.
Employment Agreements
We have employment agreements and offer letters with certain of our employees which require payments generally ranging from 100% to 200% of the employee’s annual compensation if employment is terminated not for cause by us, or by the employee, for good reason, as defined. Certain of these arrangements also include provisions for payments of bonuses under our annual incentive plan and the vesting of restricted stock and/or stock options, as well as other customary payments, such as accrued personal days, bonuses, continuing benefits, and outplacement services. Unless such termination is for cause, if such termination occurs within a specified period following a change in control of the Company, as therein defined, the agreements generally require us to vest all of the employees’ stock-based compensation.
Customer Commitments
We have supply agreements with some of our customers which require us to provide certain minimum quantities of our products for various periods. At December 31, 2009, we currently anticipate being able to fill these supply agreements in the foreseeable future and we do not consider our potential exposure for unfilled customer orders to be material.
Litigation
We are involved in various legal and regulatory proceedings that arise in the ordinary course of business. We record accruals for such contingencies to the extent that we conclude that their occurrence is both probable and estimable. We consider many factors in making these assessments, including the professional judgment of experienced members of management and our legal counsel. We have estimated the likelihood of settlement, unfavorable outcomes and the amounts of such potential losses. In our opinion, the ultimate outcome of these proceedings and claims is not anticipated to have a material adverse effect on our consolidated financial position, results of operations, or cash flows. However, the ultimate outcome of litigation is unpredictable and actual results could be materially different from our estimates. We record anticipated recoveries under applicable insurance contracts when we are assured of recovery.
National Genetics Institute/Baxter Healthcare Corporation Litigation
In May 2008, Baxter Healthcare Corporation (Baxter) and National Genetics Institute (NGI), a wholly-owned subsidiary of Laboratory Corporation of America, filed a complaint in the U.S. District Court for the Eastern District of North Carolina, alleging that we infringed U.S. Patent Nos. 5,780,222, 6,063,563, and 6,566,052. They subsequently withdrew and re-filed the case in November 2008. The patents deal primarily with a method of screening large numbers of biological samples utilizing various pooling and matrix array strategies, and the complaint alleges that the patents are owned by Baxter and exclusively licensed to NGI. In November 2008, we filed our answer to their complaint, asserting anti-trust and other counterclaims, and filed a request for re-examination of the patents with the Patent and Trademark Office (PTO), which was subsequently granted. We filed a motion to stay litigation pending the PTO proceedings. The motion was unopposed and subsequently granted on January 30, 2009. On July 7 and July 9, 2009, the PTO mailed Notices of Intent to Issue Reexamination Certificates without amending the claims of the patents in dispute. Neither party has yet filed motions to resume the litigation. We believe the allegations of infringement are without merit and that the patents are invalid as applied to our processes. We intend to vigorously defend against the complaint and pursue our counterclaims.
Plasma Centers of America, LLC and G&M Crandall Limited Family Partnership
We had a three year Amended and Restated Plasma Sale/Purchase Agreement with Plasma Centers of America, LLC (PCA) under which we were required to purchase annual minimum quantities of plasma from plasma collection centers approved by us, including the prepayment of 90% for unlicensed plasma. We were also committed to finance the development of up to eight plasma collection centers, which were to be used to source plasma for us. Under the terms of the agreement, we had the obligation to purchase such centers under certain conditions for a sum determined by a formula set forth in the agreement. We provided $3.2 million in financing, including accrued interest, related to the development of such centers, and we advanced payment of $1.0 million for unlicensed plasma.
In August 2008, we notified PCA that they were in breach of the Amended and Restated Plasma Sale/Purchase Agreement. We terminated the agreement in September 2008. In November 2008, TPR filed suit in federal court in Raleigh against the G&M Crandall Limited Family Partnership and its individual partners as guarantors of obligations of PCA. A mediation held on January 8, 2009 with the objective of a global resolution of all claims among and between the various parties ended in an impasse. We were served in January 2009 in a parallel state action by PCA, alleging breach of contract by TPR. The two cases are proceeding in parallel with trial in the state court set for May 24, 2010. During the year ended December 31, 2008, we recorded provisions of $4.2 million related to the notes receivable and advances within SG&A, due to uncertainty regarding collection.
Foreign Corrupt Practices Act
We are conducting an internal investigation into potential violations of the Foreign Corrupt Practices Act (FCPA) that we became aware of during the conduct of an unrelated review. The FCPA investigation is being conducted by outside counsel under the direction of a special committee of our board of directors. The investigation initially focused on sales to certain Eastern European and Middle Eastern countries, but our investigation is also reviewing sales practices in other countries as determined appropriate.
In July 2009, we voluntarily contacted the U.S. Department of Justice (DOJ) to advise them of the investigation and to offer our cooperation in any investigation that they want to conduct or they want us to conduct. The DOJ has not indicated what action it may take, if any, against us or any individual, or the extent to which it may conduct its own investigation. The DOJ or other federal agencies may seek to impose sanctions on us that may include, among other things, injunctive relief, disgorgement, fines, penalties, appointment of a monitor, appointment of new control staff, or enhancement of existing compliance and training programs. Other countries in which we do business may initiate their own investigations and impose similar penalties. As a result of this investigation, we have suspended shipments to some of these countries while we put additional safeguards in place. In some cases, safeguards involved terminating consultants and suspending relations with or terminating distributors in countries under investigation as circumstances warranted. These actions unfavorably affected revenue from these countries in 2009. We have resumed sales in countries where we have appropriate safeguards in place and are reallocating product to other countries as necessary. To the extent that we conclude, or the DOJ concludes, that we cannot implement adequate safeguards or otherwise need to change our business practices, distributors, or consultants in affected countries or other countries, this may result in a permanent loss of business from those countries. These sanctions or the loss of business could have a material adverse effect on us or our results of operations. Based on the information obtained to date, we have not determined that any potential liability that may result is probable or can be reasonably estimated. Therefore, we have not made any accrual in our consolidated financial statements as of December 31, 2009.
As of December 31, 2009, we have $2.4 million of accounts receivable outstanding with customers related to this matter, which we fully reserved during 2009.
Pharmaceutical Pricing Agreement under the Public Health Service Program
In November 2009, we received a letter from the United States Attorney’s Office for the Eastern District of Pennsylvania (“USAO”). The USAO requested a meeting to review our compliance with the terms of the Pharmaceutical Pricing Agreement (“PPA”) under the Public Health Service program. Specifically, the USAO asked for information related to the sale of our IGIV product, Gamunex, under that program. In order to have federal financial participation apply to their products under the Medicaid program and to obtain Medicare Part B coverage, manufacturers are required to enter into a PPA. The PPA obligates manufacturers to charge covered entities the Public Health Service price for drugs intended for outpatient use. The Public Health Service price is based on the Medicaid rebate amount. We believe that we have complied with the terms of the PPA and federal law. If the USAO determines that our practices are inconsistent with the terms of the PPA, the USAO has stated that it may file a civil action against us under the Anti-fraud Injunction Act and seek a court order directing the company to comply with the PPA or, potentially, proceed under some other legal theory. We could also be subject to fines, damages, penalties, appointment of a monitor, or enhancement of existing compliance and training programs as a result of government action. We are cooperating with the investigation and intend to respond to information requests from the USAO.
Exclusive License Agreements with Crucell N.V. (Crucell)
During September 2008, we entered into an exclusive commercial license agreement with Crucell for recombinant technology. In consideration of the license that Crucell granted us, we paid an upfront license fee of $2.5 million, which we recorded in R&D in our consolidated income statement during the year ended December 31, 2008. We could be required to pay up to $29.5 million of additional development milestones as certain activities are completed. Upon commercialization of the product, we are required to pay a royalty at a tiered rate, ranging between 3.5% and 6%, based on the related net sales of the product.
During December 2008, we entered into another exclusive commercial license agreement with Crucell for recombinant technology. In consideration of the license that Crucell granted us, we paid an upfront license fee of $1.5 million, which we recorded in R&D in our consolidated income statement for the year ended December 31, 2008. During the year ended December 31, 2009, we paid $0.5 million to Crucell, which is included in R&D in our consolidated income statement. We could be required to pay up to $18.5 million of additional development milestones as certain activities are completed. Upon commercialization of the product, we are required to pay a royalty at a tiered rate, ranging between 3% and 5%, based on the related net sales of the product.
Under the terms of both exclusive license agreements with Crucell, we may terminate either agreement by giving Crucell 90 days prior written notice and payment of all outstanding amounts owed to Crucell.
Purchase Commitments
We have purchase agreements that require us to purchase minimum annual quantities of plasma, other raw materials, and associated subcontracted manufacturing services. At December 31, 2009, our purchase commitments, generally subject to annual price negotiations, are as follows:
|
2010 |
|
$ |
202,307 |
|
|
2011 |
|
162,615 |
|
|
|
2012 |
|
101,385 |
|
|
|
2013 |
|
86,307 |
|
|
|
2014 |
|
52,947 |
|
|
|
Thereafter |
|
113,969 |
|
|
|
Total |
|
$ |
719,530 |
|
An inability of any of our suppliers to satisfy their obligations in a timely manner could cause a disruption in our plasma supply, which could materially adversely affect our business.
At December 31, 2009, we have commitments for capital spending to be made in 2010 totaling $31.6 million.
Environmental Matters
Our operations are subject to extensive and evolving federal, state, and local environmental laws and regulations. Compliance with such laws and regulations can be costly. Additionally, governmental authorities may enforce the laws and regulations with a variety of civil and criminal enforcement measures, including monetary penalties and remediation requirements. It is possible that new information or future developments could require us to reassess our potential exposure related to environmental matters. We may incur significant costs and liabilities in order to comply with existing environmental laws and regulations. It is also possible that other developments, such as increasingly strict environmental laws and regulations and claims for damages to property, employees, other persons, and the environment resulting from current or past operations, could result in substantial costs and liabilities in the future as this information becomes available, or other relevant developments occur. We establish accrued liabilities or adjust previously accrued amounts accordingly. While there are still uncertainties relating to the ultimate costs we may incur, based upon our evaluation and experience to date, we believe that compliance with all applicable laws and regulations will not have a material adverse impact on our financial position, operating results, or cash flows. At December 31, 2009 and 2008, no amounts have been accrued as we are not currently aware of any probable liabilities.
Other
All pharmaceutical companies, including us, are subject to periodic inspections by the FDA and other regulatory authorities of manufacturing and plasma collection facilities, procedures, and processes. If in the course of an inspection, the FDA or other regulatory authority notes conditions they believe are objectionable with respect to cGMP or other applicable regulations, we must implement effective corrective actions or face regulatory or enforcement sanctions.
14. Related Party Transactions
We consider Cerberus and Ampersand to be related parties during the periods presented. As of December 31, 2009, Talecris Holdings, LLC held approximately 50.1% of our outstanding common stock. Talecris Holdings, LLC is owned by (i) Cerberus-Plasma Holdings LLC, the managing member of which is Cerberus Partners, L.P., and (ii) limited partnerships affiliated with Ampersand Ventures. Substantially all rights of management and control of Talecris Holdings, LLC are held by Cerberus-Plasma Holdings LLC. Subsequent to December 31, 2009, the ownership of our outstanding common stock by Talecris Holdings, LLC was diluted below 50%.
We had a Management Agreement, as amended, with Cerberus-Plasma Holdings, LLC and an affiliate of Ampersand Ventures. Under the terms of this agreement, we were charged a management fee equal to 0.5% of our net sales for advisory services related to a number of topics including strategy, acquisitions, financing, and operational matters. We also have a Master Consulting and Advisory Services Agreement with an affiliate of Cerberus to provide certain advisory services to us outside of the scope of the Management Agreement, as amended. The Management Agreement, as amended, was terminated as of September 30, 2009 in connection with our IPO.
We have an equity investment in Centric as further discussed in Note 10, “Investment in Affiliate;” therefore, we consider Centric to be a related party during the periods presented.
The following table summarizes our related party transactions for the years ended December 31, 2009, 2008, and 2007 and our related party accounts payable balances at December 31, 2009 and 2008:
|
Related Party |
|
Activity/ Transaction |
|
Expenses |
|
|
|
|
|
|
|
|
|
|
|
|
|
Year Ended December 31, 2009 |
|
|
|
|
|
Centric |
|
Product distribution and other services |
|
$ |
20,306 |
|
|
Cerberus/ Ampersand |
|
Management fees |
|
$ |
5,715 |
|
|
Cerberus |
|
Operational support |
|
$ |
608 |
|
|
|
|
|
|
|
|
|
|
|
|
Year Ended December 31, 2008 |
|
|
|
|
|
Centric |
|
Product distribution and other services |
|
$ |
17,508 |
|
|
Cerberus/ Ampersand |
|
Management fees |
|
$ |
6,871 |
|
|
Cerberus |
|
Operational support |
|
$ |
4,184 |
|
|
|
|
|
|
|
|
|
|
|
|
Year Ended December 31, 2007 |
|
|
|
|
|
Centric |
|
Product distribution and other services |
|
$ |
14,509 |
|
|
Cerberus/ Ampersand |
|
Management fees |
|
$ |
6,097 |
|
|
Cerberus |
|
Operational support |
|
$ |
867 |
|
|
|
|
|
|
Payable |
|
||||
|
|
|
|
|
December 31, |
|
||||
|
Related Party |
|
Activity/ Transaction |
|
2009 |
|
2008 |
|
||
|
Centric |
|
Product distribution and other services |
|
$ |
5,537 |
|
$ |
3,690 |
|
|
Cerberus/ Ampersand |
|
Management fees |
|
$ |
— |
|
$ |
2,007 |
|
|
Cerberus |
|
Operational support |
|
$ |
349 |
|
$ |
708 |
|
15. Equity Transactions
On October 6, 2009, we completed our IPO of 56,000,000 shares of our common stock, par value $0.01 per share. Additional information regarding our IPO is included in Note 3, “Initial Public Offering and Use of Proceeds.”
A seven-for-one share dividend on our common stock was paid on September 10, 2009. All share and per-share amounts have been retroactively adjusted for all periods presented to reflect the share dividend.
On September 30, 2009, 1,000,000 shares of our Series A preferred stock and 192,310 shares of our Series B preferred stock were converted into an aggregate of 85,846,320 shares of our common stock in connection with our IPO. In addition, on September 30, 2009, 2,381,548 shares of our common stock were issued to settle $45.3 million of accrued dividends upon the conversion of our Series A and B preferred stock. Additional information regarding our Series A and B preferred stock is included in Note 16, “Redeemable Series A and B Senior Convertible Preferred Stock.”
During the year ended December 31, 2008, we repurchased 2,146,232 shares of our common stock from IBR for $35.4 million at a put value of $15.61 per share plus accrued charges. The shares were issued to IBR during the year ended December 31, 2007 as a result of the acceleration of the contingent consideration provision of our November 2006 Asset Purchase Agreement, as amended. Additional information regarding the shares repurchased from IBR is included in Note 5 “Business Acquisitions.”
During the year ended December 31, 2008, our board of directors approved the retirement of 2,212,640 shares of our common stock held in treasury, and approved that shares of our common stock repurchased in the future would be immediately retired by the Company.
Information regarding employee share-based compensation is included in Note 17, “Share-Based Compensation.”
16. Redeemable Series A and B Senior Convertible Preferred Stock
On September 30, 2009, 1,000,000 shares of our Series A preferred stock and 192,310 shares of our Series B preferred stock were converted into an aggregate of 85,846,320 shares of our common stock in connection with our IPO. In addition, on September 30, 2009, 2,381,548 shares of our common stock were issued to settle $45.3 million of accrued dividends upon the conversion of our Series A and B preferred stock. The fair value of the as-converted common stock was $1.676 billion on the conversion date based upon our IPO price per common share of $19.00.
At December 31, 2008, 1,000,000 shares of our Series A preferred stock and 192,310 shares of our Series B preferred stock were issued and outstanding, both of which entitled the holders to cumulative dividends at a rate of 10% per annum, compounded quarterly, based on the liquidation preference of $100.00 per share. Each share of Series A and B preferred stock was convertible at the election of the holder into 72 shares of our common stock. Holders of the Series A and B preferred stock were entitled to ten votes per share of the as-converted common stock. At December 31, 2008, undeclared dividends related to the Series A and B preferred stock totaled $33.5 million. The fair value of the Series A and B preferred stock was $1.427 billion at December 31, 2008, excluding unpaid undeclared dividends.
17. Share-Based Compensation
In connection with our IPO, we ceased further grants under our 2005 Stock Option and Incentive Plan and 2006 Restricted Stock Plan. The Talecris Biotherapeutics Holdings Corp. 2009 Long-Term Incentive Plan (2009 Plan), which was adopted by our board of directors on August 7, 2009, became effective in connection with our IPO. The 2009 Plan provides for the grant of awards in the form of incentive stock options, nonqualified stock options, share appreciation rights, restricted stock, RSU’s, unrestricted shares of common stock, deferred share units, and performance awards. Our employees, directors, and consultants are eligible to receive awards under the 2009 Plan. The maximum number of shares that we may issue for all awards under the 2009 Plan is 7,200,000. As of December 31, 2009, 6,112,896 shares remain available for grant under the 2009 Plan.
We value share-based compensation at the grant date using a fair value model and recognize this value as expense over the employees’ requisite service period, typically the period over which the share-based compensation vests. We classify share-based compensation costs consistent with each grantee’s salary. In connection with stock option exercises and restricted share vesting, we recognized net tax benefits of $20.4 million and $3.3 million for the years ended December 31, 2009 and 2008, respectively. We record income tax benefits realized upon exercise or vesting of an award in excess of that previously recognized in earnings as additional paid-in-capital. We recognized excess tax benefits related to share-based compensation of $13.4 million during the year ended December 31, 2009.
Share-based compensation expense for the years ended December 31, 2009, 2008, and 2007 was as follows:
|
|
|
Stock Options |
|
|
|
|
|
||||||
|
|
|
Service- |
|
Performance- |
|
Restricted |
|
|
|
||||
|
Year Ended December 31, 2009 |
|
Based |
|
Based |
|
Stock |
|
RSU’s |
|
||||
|
SG&A |
|
$ |
27,246 |
|
$ |
4,102 |
|
$ |
9,402 |
|
$ |
218 |
|
|
R&D |
|
1,295 |
|
415 |
|
535 |
|
58 |
|
||||
|
Cost of goods sold |
|
2,585 |
|
854 |
|
836 |
|
— |
|
||||
|
Total expense |
|
$ |
31,126 |
|
$ |
5,371 |
|
$ |
10,773 |
|
$ |
276 |
|
|
|
|
Stock Options |
|
|
|
|
|
||||||
|
|
|
Service- |
|
Performance- |
|
Restricted |
|
|
|
||||
|
Year Ended December 31, 2008 |
|
Based |
|
Based |
|
Stock |
|
Total |
|
||||
|
SG&A |
|
$ |
16,245 |
|
$ |
7,992 |
|
$ |
9,543 |
|
$ |
33,780 |
|
|
R&D |
|
1,011 |
|
815 |
|
535 |
|
2,361 |
|
||||
|
Cost of goods sold |
|
975 |
|
854 |
|
737 |
|
2,566 |
|
||||
|
Total expense |
|
$ |
18,231 |
|
$ |
9,661 |
|
$ |
10,815 |
|
$ |
38,707 |
|
|
|
|
Stock Options |
|
|
|
|
|
||||||
|
|
|
Service- |
|
Performance- |
|
Restricted |
|
|
|
||||
|
Year Ended December 31, 2007 |
|
Based |
|
Based |
|
Stock |
|
Total |
|
||||
|
SG&A |
|
$ |
4,697 |
|
$ |
7,406 |
|
$ |
6,509 |
|
$ |
18,612 |
|
|
R&D |
|
117 |
|
743 |
|
536 |
|
1,396 |
|
||||
|
Cost of goods sold |
|
484 |
|
464 |
|
285 |
|
1,233 |
|
||||
|
Total expense |
|
$ |
5,298 |
|
$ |
8,613 |
|
$ |
7,330 |
|
$ |
21,241 |
|
During the years ended December 31, 2009, 2008, and 2007, we capitalized $4.0 million, $4.0 million, and $2.3 million of share-based compensation cost within inventory. Amounts capitalized in inventory are recognized in cost of goods sold in our consolidated income statements primarily within twelve months.
The following table summarizes the remaining unrecognized compensation cost related to our share-based compensation awards as of December 31, 2009 and the weighted average period over which the non-cash compensation cost is expected to be recognized:
|
|
|
|
|
Weighted- |
|
|
|
|
|
Unrecognized |
|
Average |
|
|
|
|
|
Compensation |
|
Period |
|
|
|
|
|
Cost |
|
(Years) |
|
|
|
Stock options |
|
$ |
9,878 |
|
1.75 |
|
|
Restricted share awards |
|
6,977 |
|
0.66 |
|
|
|
RSU’s |
|
7,912 |
|
3.25 |
|
|
|
Total |
|
$ |
24,767 |
|
1.92 |
|
In addition to the unrecognized compensation cost included in the table above, at December 31, 2009, $3.2 million of compensation cost was included in inventory on our consolidated balance sheet, which we expect to be recognized as non-cash compensation expense in our consolidated income statement primarily during 2010. The amount of share-based compensation expense that we will ultimately be required to record could change in the future as a result of additional grants, changes in the fair value of shares for performance-based options, differences between our anticipated forfeiture rate and the actual forfeiture rate, the probability of achieving targets established for performance share vesting, and other actions by our board of directors or its compensation committee.
Stock Options
Stock options, which entitle the holder to purchase, after the end of a vesting term, a specified number of shares of our common stock at a price per share equal to the exercise price, are accounted for at fair value at the date of the grant. Option awards are granted with an exercise price at least equal to the fair value of our common stock at the date of grant and generally vest over periods of three to five years. The exercise price of stock options is determined by our board of directors. The stock options that we granted to employees typically have service-based and performance-based components. The stock options granted to members of our board of directors are service-based only. Our stock options generally expire ten years after the date of grant, or earlier if an option holder ceases to be employed by the Company. Stock option exercises are settled with newly issued common stock previously authorized and available for issuance.
The following is a summary of stock option activity for the years ended December 31, 2009, 2008, and 2007:
|
|
|
|
|
|
|
Weighted |
|
|
|
||
|
|
|
|
|
|
|
Average |
|
|
|
||
|
|
|
|
|
Weighted |
|
Remaining |
|
|
|
||
|
|
|
|
|
Average |
|
Contractual |
|
Aggregate |
|
||
|
|
|
|
|
Exercise |
|
Term |
|
Intrinsic |
|
||
|
|
|
Shares |
|
Price |
|
(Years) |
|
Value |
|
||
|
Outstanding at December 31, 2006 |
|
10,454,424 |
|
$ |
2.72 |
|
|
|
|
|
|
|
Granted |
|
2,637,152 |
|
$ |
21.21 |
|
|
|
|
|
|
|
Forfeited |
|
(159,232 |
) |
$ |
8.54 |
|
|
|
|
|
|
|
Outstanding at December 31, 2007 |
|
12,932,344 |
|
$ |
6.42 |
|
|
|
|
|
|
|
Granted |
|
2,291,304 |
|
$ |
10.98 |
|
|
|
|
|
|
|
Forfeited |
|
(945,232 |
) |
$ |
2.98 |
|
|
|
|
|
|
|
Outstanding at December 31, 2008 |
|
14,278,416 |
|
$ |
6.96 |
|
|
|
|
|
|
|
Granted |
|
638,472 |
|
$ |
18.91 |
|
|
|
|
|
|
|
Forfeited |
|
(392,688 |
) |
$ |
4.89 |
|
|
|
|
|
|
|
Exercised |
|
(2,394,762 |
) |
$ |
3.17 |
|
|
|
|
|
|
|
Outstanding at December 31, 2009 |
|
12,129,438 |
|
$ |
8.40 |
|
6.7 |
|
$ |
168,235 |
|
|
|
|
|
|
|
|
|
|
|
|
||
|
Exercisable at December 31, 2009 |
|
8,711,838 |
|
$ |
8.16 |
|
5.8 |
|
$ |
122,924 |
|
|
|
|
|
|
|
|
|
|
|
|
||
|
Vested and expected to vest at December 31, 2009 |
|
12,111,507 |
|
$ |
8.40 |
|
6.7 |
|
$ |
167,987 |
|
At December 31, 2008 and 2007, stock options with a weighted average exercise price of $4.02 and $2.15 were exercisable for 6,950,872 shares and 4,426,880 shares, respectively. Our estimate of the stock options vested and expected to vest at December 31, 2009 considers an expected forfeiture rate of 3%.
The aggregate intrinsic value in the table above represents the difference between the $22.27 closing price of our common stock as reported by The NASDAQ Global Select Market on December 31, 2009 and the weighted average exercise price, multiplied by the number of options outstanding or exercisable. The total intrinsic value and net cash proceeds to us from stock option exercises during the year ended December 31, 2009 were $41.6 million and $7.6 million, respectively. We do not record the aggregate intrinsic value for financial accounting purposes and the value changes based upon changes in the fair value of our common stock. The total
fair value of stock options that vested during the years ended December 31, 2009, 2008, and 2007 were $72.5 million, $24.7 million, and $20.2 million, respectively.
The weighted average grant date fair value of options granted during the years ended December 31, 2009, 2008, and 2007 were $9.49, $4.35, and $11.65, respectively. We estimated the fair value of stock options at their grant date using the Black-Scholes option pricing model. This model was developed for use in estimating the fair value of traded options that have no vesting restrictions and are fully transferable, characteristics that are not present in our option grants. If the model permitted consideration of the unique characteristics of employee stock options, the resulting estimate of the fair value of stock options could be different. The following weighted-average assumptions were used to estimate the fair value of stock options granted during the years ended December 31, 2009, 2008, and 2007:
|
|
|
Years Ended December 31, |
|
||||
|
|
|
2009 |
|
2008 |
|
2007 |
|
|
Risk-free interest rate |
|
2.66% |
|
2.65% |
|
5.00% |
|
|
Expected term (life) |
|
5.97 |
|
5.20 |
|
6.2 |
|
|
Expected volatility |
|
50% |
|
50% |
|
50% |
|
|
Expected dividend yield |
|
0% |
|
0% |
|
0% |
|
The risk-free interest rate is based upon the U.S. Treasury yield curve at the time of grant. The expected life of options is reflective of our historical experience, vesting schedules, and contractual terms. There is limited trading history for our common stock; therefore, our application of the Black-Scholes option pricing model incorporated historical volatility measures of similar public companies. We currently do not expect to pay dividends in the future. We generally apply a 3% annual forfeiture rate to the options granted over the term of the award. This rate is calculated based upon historical attrition rates and represents an estimate of the granted options not expected to vest. If actual forfeitures differ from the expected rate, we may be required to make additional adjustments to compensation expense in future periods.
Restricted Stock Units
RSU’s, which entitle the holder to receive, at the end of a vesting term, a specified number of shares of our common stock, are accounted for at fair value at the date of grant. We granted 483,100 RSU’s in connection with our IPO. These RSU’s will vest one-third on each of April 1 of 2011, 2012, and 2013, subject to the award holder being employed on the vesting date. The aggregate fair value of the RSU’s was $8.4 million, which will be recognized as compensation expense ratably through April of 2013. The following is a summary of RSU activity for the year ended December 31, 2009:
|
|
|
|
|
|
|
Weighted |
|
|
|
||
|
|
|
|
|
|
|
Average |
|
|
|
||
|
|
|
|
|
Weighted |
|
Remaining |
|
|
|
||
|
|
|
|
|
Average |
|
Contractual |
|
Aggregate |
|
||
|
|
|
|
|
Grant Date |
|
Term |
|
Intrinsic |
|
||
|
|
|
Shares |
|
Fair Value |
|
(Years) |
|
Value |
|
||
|
Outstanding at December 31, 2008 |
|
— |
|
— |
|
|
|
|
|
||
|
Granted |
|
483,100 |
|
$ |
19.00 |
|
|
|
|
|
|
|
Forfeited |
|
(3,076 |
) |
$ |
19.00 |
|
|
|
|
|
|
|
Outstanding at December 31, 2009 |
|
480,024 |
|
$ |
19.00 |
|
3.25 |
|
$ |
10,690 |
|
Restricted Stock
Restricted shares of our common stock, which entitle the holder to receive, at the end of a vesting term, a specified number of shares of our common stock, are accounted for at fair value at the date of grant. Restricted share awards vest on terms determined by our board of directors or its compensation committee at the time of the grant. The majority of our restricted share awards currently outstanding vest annually over a four-year period from the date of grant unless accelerated by the compensation committee upon the event of a change in control, as defined. Any restricted share awards that have not vested at the time of termination of service are forfeited except in the event of death, disability, or a change in control. The restricted share awards are considered issued and outstanding and have full voting rights. Any dividends declared with respect to our common stock will vest at the same time as the underlying restricted stock award. At December 31, 2009, vested and unvested restricted stock awards represented 2.1% of all shares of our common stock outstanding.
The following is a summary of restricted share activity for the years ended December 31, 2009, 2008, and 2007:
|
|
|
|
|
Weighted |
|
|
|
|
|
|
|
Average |
|
|
|
|
|
|
|
Grant Date |
|
|
|
|
|
Shares |
|
Fair Value |
|
|
|
December 31, 2006 unvested shares outstanding |
|
2,066,792 |
|
$ |
11.00 |
|
|
Granted |
|
762,400 |
|
$ |
21.25 |
|
|
Forfeited |
|
(18,192 |
) |
$ |
11.00 |
|
|
December 31, 2007 unvested shares outstanding |
|
2,811,000 |
|
$ |
13.78 |
|
|
Granted |
|
42,720 |
|
$ |
9.88 |
|
|
Forfeited |
|
(287,784 |
) |
$ |
11.00 |
|
|
Vested |
|
(870,432 |
) |
$ |
13.45 |
|
|
December 31, 2008 unvested shares outstanding |
|
1,695,504 |
|
$ |
14.40 |
|
|
Granted |
|
14,464 |
|
$ |
16.63 |
|
|
Forfeited |
|
(16,368 |
) |
$ |
11.00 |
|
|
Vested |
|
(779,744 |
) |
$ |
13.50 |
|
|
December 31, 2009 unvested shares outstanding |
|
913,856 |
|
$ |
15.27 |
|
The total fair value of restricted shares that vested during the years ended December 31, 2009 and 2008 were $13.0 million and $8.6 million, respectively.
The common shares that we have issued to employees and members of our board of directors had an embedded feature that permitted the participant (or designated beneficiary or estate) to sell, or “put,” the shares of our common stock back to us at fair market value in the event of a participant’s termination of service due to death or disability. In addition, we had the right to repurchase, or “call,” the shares of our common stock upon a participant’s termination of continuous service, as defined. Both our redemption rights and the participants’ put rights were terminated in connection with the closing of our IPO. As a result, we reclassified the fair value of vested common stock from obligations under common stock put/call option to permanent equity on our consolidated balance sheets during the year ended December 31, 2009. At December 31, 2008, $29.4 million was recorded in obligations under common stock put/call option on our consolidated balance sheet.
Other Information about our Stock Option Plan
During the third quarter of 2009, we entered into an amended and restated employment agreement with our Chairman and Chief Executive Officer which included accelerating the vesting of options to purchase 1,008,000 shares of our common stock at an exercise price of $21.25 per common share to August 19, 2009. The acceleration of these options resulted in the recognition of a non-cash charge of $11.8 million of compensation expense during the third quarter of 2009. Options to purchase these shares were previously scheduled to vest in April of 2010 (504,000 options) and April of 2011 (504,000 options).
During the second quarter of 2008, the compensation committee of our board of directors amended the exercise price of 570,400 stock options outstanding to certain employees from $21.25 per share to $11.00 per share and during the second quarter of 2008, the compensation committee also amended the exercise price of 17,152 stock options outstanding to certain members of our board of directors from $21.25 per share to $11.00 per share. The stock options that were re-priced were granted during 2007.
During the first quarter of 2008, our board of directors revised the 2008 corporate objectives related to the performance-based component of stock options scheduled to vest on April 1, 2009. In addition, during the second quarter of 2008, we began recognizing compensation cost related to the performance-based component of stock options scheduled to vest on April 1, 2010 based on our probability assessment of achieving the related performance objectives.
During the third quarter of 2007, the compensation committee of our board of directors approved an amendment to our then existing 2005 Stock Option and Incentive Plan in which the percentage of options vesting based on performance targets was changed from 65% to 35% and the percentage of options vesting based on service was changed from 35% to 65% for options scheduled to vest on April 1 of 2009 and 2010.
During the third quarter of 2007, the compensation committee of our board of directors approved the 2008 and 2009 corporate objectives related to the performance-based component of stock options scheduled to vest on April 1 of 2009 and 2010. The objectives related to the performance-based component of the stock options scheduled to vest on April 1, 2009 were subsequently modified during the first quarter of 2008 as indicated above.
During the first quarter of 2007, the compensation committee of our board of directors approved the 2007 corporate objectives related to the performance-based component of the stock options scheduled to vest on April 1, 2008.
18. Employee Benefit Plans
Savings Plan and Profit Sharing Plan
We have a defined contribution plan (Savings Plan), which qualifies as a deferred salary arrangement under Section 401 (k) of the Internal Revenue Code (IRC). Once eligible, employees may elect to contribute a portion of their wages to the Savings Plan, subject to certain limitations. We match 100% of the first 3% of employee contributions and 50% of the next 2% of employee contributions. Our contributions and the employee contributions are fully vested when contributed. The plan assets are held in trust and invested as directed by the plan participants. Matching contribution cost for the Savings Plan was $7.8 million for both the years ended December 31, 2009 and 2008 and $6.3 million for the year ended December 31, 2007, and is recorded consistent with each participant’s salary.
Under the profit sharing portion of the Savings Plan, we may elect to contribute to eligible employees’ Savings Plan accounts up to 3% of their eligible earnings, as defined. The profit sharing portion of the plan is discretionary, with the percentage amount determined by the compensation committee of our board of directors, based upon the attainment of certain financial targets as established by the compensation committee. Our cost for the profit sharing portion of the Savings Plan was $5.8 million, $7.9 million, and $6.3 million for the years ended December 31, 2009, 2008, and 2007, respectively, and is recorded consistent with each participant’s salary.
Supplemental Savings Plan
We have a Supplemental Savings Plan, which is an unfunded nonqualified deferred compensation plan in which employees at certain executive levels are eligible to defer pre-tax earnings as well as to make additional contributions, subject to certain limitations. Our matching contribution is similar to the Savings Plan described above and is fully vested when contributed. Our costs related to the Supplemental Savings Plan for the periods presented were not material to our consolidated financial statements. At December 31, 2009 and 2008, we have recorded $5.1 million and $2.9 million, respectively, within accrued expenses and other liabilities on our consolidated balance sheets.
Other Plans
We provide an unfunded defined benefit pension plan to certain of our Talecris Biotherapeutics, GmbH employees in Germany as required by statutory law. Pension cost related to this plan was not material for the periods presented. At December 31, 2009 and 2008, no material obligations related to this plan were recorded on our consolidated balance sheets.
19. Deferred Compensation
In October of 2006, the compensation committee of our board of directors approved a Special Recognition Bonus Plan (Bonus Plan) as a vehicle to award certain employees, senior executives, and members of our board of directors for the financial success of our Company from its inception through the effective date of the Bonus Plan. The Bonus Plan is an unfunded, non-qualified retirement plan as defined in the IRC. Employees eligible for awards under this Bonus Plan must be employed by us at the time bonus payments are made, or they forfeit any unpaid portion of their award. Vesting of unpaid amounts will be accelerated for a change in control, as defined, as well as for death or disability. We recorded compensation expense of $0.6 million, $0.7 million, and $1.7 million for the years ended December 31, 2009, 2008, and 2007, respectively, related to the Bonus Plan. We made payments of $0.9 million in March of 2009 and $1.2 million in both March of 2008 and 2007. The balance of the award totaling $0.9 million will be paid in March of 2010, adjusted for employee forfeitures.
In December of 2006, the compensation committee of our board of directors approved a restricted share and cash recognition award to certain employees, senior executives, and members of our board of directors for the financial success of our Company from its inception through the effective date of the award. Employees eligible for these awards must be employed by us at the time bonus payments are made, or they forfeit any unpaid portion of their award. Vesting of unpaid amounts will be accelerated for a change in control, as defined, as well as for death or disability. We funded an irrevocable trust for cash installments under this award, which are segregated from our assets and protected from our creditors. Any interest income earned on trust assets accrues for the benefit of the participants. We recorded compensation expense of $5.7 million, $5.9 million, and $6.8 million for the years ended December 31, 2009, 2008, and 2007, respectively, under the cash recognition portion of the award. We made cash payments of $6.0 million and $7.4 million in March of 2009 and 2008, respectively, out of the irrevocable trust. The balance of the award totaling $5.8 million will be paid in March of 2010, adjusted for employee forfeitures. At December 31, 2009 and 2008, unamortized deferred compensation cost related to the assets held by the irrevocable trust totaling $1.3 million and $5.4 million, respectively, was recorded within prepaid expenses and other on our consolidated balance sheets and at December 31, 2008, $1.3 million was recorded within other long-term
assets on our consolidated balance sheets. Information regarding restricted share awards is included in Note 17, “Share-Based Compensation.”
20. Segment Reporting
We operate our plasma-derived protein therapeutics business as a single reportable business segment since all operating activities are directed from our North Carolina headquarters and all of our products are derived from a single source and result from a common manufacturing process. All products are manufactured from a single raw material source, human plasma, and are processed in whole, or in part, at our principal manufacturing facilities located in Clayton, North Carolina. Our Melville, New York, facility primarily supplies intermediate plasma fractions to our Clayton facilities. Gamunex and Prolastin constitute the majority of our net revenue. Although we sell our products worldwide, the majority of our net revenue was concentrated in the United States and Canada for the periods presented.
In the following table, we have presented our net revenue by significant product category. Our Immunology/Neurology product category includes the products that are used to provide antibodies to patients who have a genetic or acquired inability to produce these antibodies, as well as a treatment for CIDP, and also products that provide antibodies to counter specific antigens such as rabies. Our Pulmonology product category is comprised of our Prolastin product, which is used to treat patients with a genetic alpha-1 antitrypsin deficiency. Our Critical Care/Hemostasis product category includes products that are used to supplement, restore, or maintain normal plasma parameters such as volume or coagulation values. Other product net revenue primarily consists of sales of PPF powder and intermediate products, such as cryoprecipitate. Other non-product revenue primarily consists of royalties under collaborative agreements as described further in Note 7, “Collaborative and Other Agreements.”
|
|
|
Years Ended December 31, |
|
|||||||
|
|
|
2009 |
|
2008 |
|
2007 |
|
|||
|
Product net revenue: |
|
|
|
|
|
|
|
|||
|
Immunology/Neurology |
|
$ |
928,054 |
|
$ |
781,408 |
|
$ |
743,128 |
|
|
Pulmonology |
|
319,080 |
|
316,495 |
|
276,538 |
|
|||
|
Critical Care/ Hemostasis |
|
167,469 |
|
134,216 |
|
127,935 |
|
|||
|
Other |
|
93,151 |
|
102,431 |
|
49,085 |
|
|||
|
Total product net revenue |
|
1,507,754 |
|
1,334,550 |
|
1,196,686 |
|
|||
|
Other revenue |
|
25,455 |
|
39,742 |
|
21,823 |
|
|||
|
Total net revenue |
|
$ |
1,533,209 |
|
$ |
1,374,292 |
|
$ |
1,218,509 |
|
In the following table, we have presented our net revenue by geographic region. Net revenue for each region is based on the geographic location of the customer.
|
|
|
Years Ended December 31, |
|
|||||||
|
|
|
2009 |
|
2008 |
|
2007 |
|
|||
|
United States |
|
$ |
1,011,468 |
|
$ |
906,376 |
|
$ |
817,276 |
|
|
Canada |
|
214,883 |
|
215,964 |
|
189,923 |
|
|||
|
Europe |
|
185,297 |
|
168,081 |
|
136,972 |
|
|||
|
Other |
|
121,561 |
|
83,871 |
|
74,338 |
|
|||
|
Total net revenue |
|
$ |
1,533,209 |
|
$ |
1,374,292 |
|
$ |
1,218,509 |
|
We did not maintain significant long-lived assets outside of the United States at December 31, 2009 and 2008.
21. Earnings per Share
The following table illustrates the calculation of our basic earnings per common share outstanding for the periods presented:
|
|
|
Years Ended December 31, |
|
|||||||
|
|
|
2009 |
|
2008 |
|
2007 |
|
|||
|
Net income |
|
$ |
153,889 |
|
$ |
65,797 |
|
$ |
123,565 |
|
|
Less: |
|
|
|
|
|
|
|
|||
|
Series A preferred stock undeclared dividends |
|
(9,602 |
) |
(11,745 |
) |
(10,641 |
) |
|||
|
Series B preferred stock undeclared dividends |
|
(2,142 |
) |
(2,619 |
) |
(2,373 |
) |
|||
|
Accretion of common stock put option |
|
— |
|
(308 |
) |
— |
|
|||
|
Net income available to common stockholders |
|
$ |
142,145 |
|
$ |
51,125 |
|
$ |
110,551 |
|
|
|
|
|
|
|
|
|
|
|||
|
Weighted average common shares outstanding |
|
31,166,613 |
|
1,310,448 |
|
1,685,784 |
|
|||
|
|
|
|
|
|
|
|
|
|||
|
Basic net income per common share |
|
$ |
4.56 |
|
$ |
39.01 |
|
$ |
65.58 |
|
|
|
|
|
|
|
|
|
|
|||
|
Pro forma basic income per common share (unaudited): |
|
|
|
|
|
|
|
|||
|
Numerator: |
|
|
|
|
|
|
|
|||
|
Net income |
|
$ |
153,889 |
|
|
|
|
|
||
|
Interest expense reduction due to debt repayment |
|
5,555 |
|
|
|
|
|
|||
|
Numerator for pro forma basic income per common share |
|
$ |
159,444 |
|
|
|
|
|
||
|
|
|
|
|
|
|
|
|
|||
|
Denominator: |
|
|
|
|
|
|
|
|||
|
Shares used above |
|
31,166,613 |
|
|
|
|
|
|||
|
Pro forma adjustments to reflect assumed weighted average effect of: |
|
|
|
|
|
|
|
|||
|
Conversion of series A preferred stock |
|
53,654,795 |
|
|
|
|
|
|||
|
Conversion of series B preferred stock |
|
10,318,354 |
|
|
|
|
|
|||
|
Shares issued for preferred stock dividend |
|
1,774,743 |
|
|
|
|
|
|||
|
Newly issued shares for IPO |
|
22,047,585 |
|
|
|
|
|
|||
|
Denominator for pro forma basic income per common share |
|
118,962,090 |
|
|
|
|
|
|||
|
|
|
|
|
|
|
|
|
|||
|
Pro forma basic income per common share (unaudited) |
|
$ |
1.34 |
|
|
|
|
|
||
The following table illustrates the calculation of our diluted earnings per common share outstanding for the periods presented:
|
|
|
Years Ended December 31, |
|
|||||||
|
|
|
2009 |
|
2008 |
|
2007 |
|
|||
|
Net income |
|
$ |
153,889 |
|
$ |
65,797 |
|
$ |
123,565 |
|
|
Less accretion of common stock put option |
|
— |
|
(308 |
) |
— |
|
|||
|
Net income available to common stockholders |
|
$ |
153,889 |
|
$ |
65,489 |
|
$ |
123,565 |
|
|
|
|
|
|
|
|
|
|
|||
|
Weighted average common shares outstanding |
|
31,166,613 |
|
1,310,448 |
|
1,685,784 |
|
|||
|
Plus incremental shares from assumed conversions: |
|
|
|
|
|
|
|
|||
|
Series A preferred stock |
|
53,654,795 |
|
72,000,000 |
|
72,000,000 |
|
|||
|
Series B preferred stock |
|
10,318,354 |
|
13,846,320 |
|
13,846,320 |
|
|||
|
Stock options and restricted shares |
|
7,374,601 |
|
5,605,032 |
|
3,533,496 |
|
|||
|
Dilutive potential common shares |
|
102,514,363 |
|
92,761,800 |
|
91,065,600 |
|
|||
|
|
|
|
|
|
|
|
|
|||
|
Diluted net income per common share |
|
$ |
1.50 |
|
$ |
0.71 |
|
$ |
1.36 |
|
|
|
|
|
|
|
|
|
|
|||
|
Pro forma diluted income per common share (unaudited): |
|
|
|
|
|
|
|
|||
|
Numerator: |
|
|
|
|
|
|
|
|||
|
Net income |
|
$ |
153,889 |
|
|
|
|
|
||
|
Interest expense reduction due to debt repayment |
|
5,555 |
|
|
|
|
|
|||
|
Numerator for pro forma diluted income per common share |
|
$ |
159,444 |
|
|
|
|
|
||
|
|
|
|
|
|
|
|
|
|||
|
Denominator: |
|
|
|
|
|
|
|
|||
|
Shares used above |
|
31,166,613 |
|
|
|
|
|
|||
|
Pro forma adjustments to reflect assumed weighted average effect of: |
|
|
|
|
|
|
|
|||
|
Conversion of series A preferred stock |
|
53,654,795 |
|
|
|
|
|
|||
|
Conversion of series B preferred stock |
|
10,318,354 |
|
|
|
|
|
|||
|
Shares issued for preferred stock dividend |
|
1,774,743 |
|
|
|
|
|
|||
|
Newly issued shares for IPO |
|
22,047,585 |
|
|
|
|
|
|||
|
Stock options and restricted shares |
|
7,374,601 |
|
|
|
|
|
|||
|
Denominator for pro forma diluted income per common share |
|
126,336,691 |
|
|
|
|
|
|||
|
|
|
|
|
|
|
|
|
|||
|
Pro forma diluted income per common share (unaudited) |
|
$ |
1.26 |
|
|
|
|
|
||
The pro forma earnings per common share calculations reflect an adjustment to net income for reduced interest expense as if the net primary proceeds to us from our IPO had been applied to repay our debt at the beginning of 2009, net of interest rate differences from the bond refinancing. The pro forma adjustment to the denominator reflects the impacts for the issuance of common shares to convert preferred stock, settle accrued dividends on the preferred stock, and complete the IPO as if these events occurred at the beginning of 2009.
Options to purchase the following number of common shares at the following weighted average exercise prices were outstanding but excluded from the computation of diluted earnings per share because their exercise prices and assumed tax benefits upon exercise were greater than the average market price for the common shares during the period, so including these options would be anti-dilutive:
|
|
|
Years Ended December 31, |
|
|||||||
|
|
|
2009 |
|
2008 |
|
2007 |
|
|||
|
Number of common share options |
|
2,168,730 |
|
2,016,000 |
|
1,073,192 |
|
|||
|
Weighted average exercise price |
|
$ |
21.09 |
|
$ |
21.25 |
|
$ |
21.25 |
|
22. Other Consolidated Balance Sheet Information
Information regarding other accounts on our consolidated balance sheets is as follows:
|
|
|
December 31, |
|
||||
|
|
|
2009 |
|
2008 |
|
||
|
Accrued expenses and other liabilities: |
|
|
|
|
|
||
|
Accrued goods and services |
|
$ |
45,044 |
|
$ |
51,449 |
|
|
Accrued payroll, bonuses, and employee benefits |
|
73,983 |
|
72,662 |
|
||
|
Medicaid, commercial rebates, and chargebacks |
|
30,771 |
|
16,544 |
|
||
|
Interest payable |
|
9,111 |
|
11,350 |
|
||
|
Other |
|
11,624 |
|
15,372 |
|
||
|
Total accrued expenses and other liabilities |
|
$ |
170,533 |
|
$ |
167,377 |
|
23. Cash Flow Supplemental Disclosures
Supplemental Disclosures of Cash Flow Information
Cash paid for:
|
|
|
Years Ended December 31, |
|
|||||||
|
|
|
2009 |
|
2008 |
|
2007 |
|
|||
|
Interest, net of amounts capitalized (1) |
|
$ |
55,131 |
|
$ |
87,213 |
|
$ |
97,369 |
|
|
Income taxes |
|
$ |
56,849 |
|
$ |
48,910 |
|
$ |
12,027 |
|
(1) Interest paid in the table above excludes payments related to our interest rate swap contracts, which amounted to $17.0 million and $9.2 million for the years ended December 31, 2009 and 2008, respectively. No amounts were paid related to our interest rate swap contracts during the year ended December 31, 2007.
Changes in assets and liabilities, excluding the effects of business acquisitions:
|
|
|
Years Ended December 31, |
|
|||||||
|
|
|
2009 |
|
2008 |
|
2007 |
|
|||
|
Changes in: |
|
|
|
|
|
|
|
|||
|
Accounts receivable |
|
$ |
8,575 |
|
$ |
(26,894 |
) |
$ |
(9,175 |
) |
|
Inventories |
|
(57,452 |
) |
(92,856 |
) |
26,756 |
|
|||
|
Prepaid expenses and other assets |
|
7,987 |
|
(15,823 |
) |
164 |
|
|||
|
Accounts payable |
|
16,143 |
|
16,594 |
|
12,095 |
|
|||
|
Interest payable |
|
(2,239 |
) |
(1,957 |
) |
11,830 |
|
|||
|
Accrued expenses and other liabilities |
|
14,913 |
|
21,626 |
|
6,114 |
|
|||
|
Deferred margin |
|
(36 |
) |
(745 |
) |
(9,805 |
) |
|||
|
Total |
|
$ |
(12,109 |
) |
$ |
(100,055 |
) |
$ |
37,979 |
|
Supplemental Schedule of Non-Cash Investing and Financing Activities
For the Year Ended December 31, 2009
We entered into a number of capital lease agreements related to buildings with an unaffiliated third party. We recorded $4.9 million directly to property, plant, and equipment, net and capital lease obligations.
The common shares that we have issued to employees and members of our board of directors under our share-based compensation plans had an embedded feature that permitted the participant (or designated beneficiary or estate) to sell, or “put,” the shares of our common stock back to us at fair market value in the event of the participant’s termination of service due to death or disability. In addition, we had the right to repurchase, or “call,” the shares of our common stock upon a participant’s termination of continuous service, as defined. We recorded a fair market value adjustment of $6.6 million related to the vested shares of our common stock to increase obligations under common stock put/call option and decrease additional paid-in capital on our consolidated balance sheet. Both our redemption rights and the participants’ put rights were terminated in connection with the closing of our IPO. As a result, we reclassified the fair value of vested common stock totaling $39.9 million from obligations under common stock put/call option to permanent equity on our consolidated balance sheet.
We declared a dividend of $45.3 million related to our Series A and B preferred stock. In connection with our IPO, 1,000,000 shares of our Series A preferred stock and 192,310 shares of our Series B preferred stock were converted into an aggregate
of 85,846,320 shares of our common stock. In addition, 2,381,548 shares of our common stock were issued to settle the $45.3 million preferred stock dividend upon conversion of our Series A and B preferred stock.
We retired 251,108 shares of our common stock, which were repurchased from employees.
We reclassified a previously unrealized loss related to our interest rate swap contracts of approximately $23.3 million, net of income tax benefit of $14.2 million, to earnings as a result of their settlement and termination. In addition, we recorded other comprehensive income of $0.5 million. Additional information regarding the components of our comprehensive income is included in Note 2, “Summary of Significant Accounting Policies.”
We entered into two plasma center development agreements related to buildings to be leased from an unaffiliated third party during 2008, for which we made the decision not to open as plasma collection centers during 2009. As a result, we recorded a loss on contract obligations of $3.4 million, which decreased our assets under capital leases.
For the Year Ended December 31, 2008
We entered into a number of capital lease agreements related to buildings with an unaffiliated third party. We recorded $6.0 million directly to property, plant, and equipment, net and capital lease obligations.
We reclassified $1.6 million of long-lived assets related to two plasma collection centers, net of impairment charges of $0.8 million, to assets held for sale within prepaid expenses and other on our consolidated balance sheet.
As a result of the put feature related to the common shares issued under our share-based compensation plans described above, we recorded a fair value adjustment of $8.9 million to increase obligations under common stock put/call option and decrease additional paid-in capital on our consolidated balance sheet.
We issued shares of our common stock, which had an embedded put option, to IBR in connection with our 2006 business acquisition as described below. We recorded accretion of $0.3 million related to the IBR put option directly to obligations under common stock put/call option and additional paid-in capital on our consolidated balance sheet.
We retired 2,215,880 shares of our common stock, of which 2,146,232 shares were repurchased from IBR and 69,648 shares were repurchased from employees.
We recorded other comprehensive loss of $11.8 million, primarily related to unrealized losses associated with our interest rate swap contracts, net of taxes.
For the Year Ended December 31, 2007
We entered into a capital lease agreement with an unaffiliated third party for the lease of a building. We recorded $0.9 million directly to property, plant, and equipment, net and capital lease obligations.
We issued 2,146,232 shares of our common stock to IBR as discussed in Note 5, “Business Acquisitions.” We recorded the put value of the shares of $33.5 million in obligations under common stock put/call option on our consolidated balance sheet and the difference between the put value and the fair value of the common stock (on the issuance date) in additional paid-in capital on our consolidated balance sheet. We also recorded $37.0 million and $8.6 million in goodwill and other long-term assets, respectively, on our consolidated balance sheet, representing the fair value of the common shares issued to IBR. In addition, we recorded accretion of $1.6 million related to the IBR put option directly to obligations under common stock put/call option and additional paid-in capital on our consolidated balance sheet.
As a result of the put feature related to the common shares issued under our share-based compensation plans described above, we recorded a fair value adjustment of $2.1 million to increase obligations under common stock put/call option and decrease additional paid-in capital on our consolidated balance sheet.
We recorded other comprehensive loss of $11.7 million, primarily related to unrealized losses associated with our interest rate swap contracts, net of taxes.
We adopted new accounting guidance regarding the accounting for uncertainty in income taxes, which resulted in a charge of $0.7 million directly to accumulated deficit.
24. Subsequent Events
We evaluated all events and transactions that occurred after December 31, 2009 up through February 23, 2010, the date that we filed these audited consolidated financial statements with the U.S. Securities and Exchange Commission.
25. Selected Unaudited Quarterly Financial Data
The following table summarizes our unaudited quarterly financial results for the years ended December 31, 2009 and 2008. In our opinion, the quarterly financial results presented below have been prepared on the same basis as our annual audited consolidated financial statements.
|
|
|
2009 Quarter Ended |
|
||||||||||
|
|
|
March 31 |
|
June 30 |
|
September 30 |
|
December 31 |
|
||||
|
Net revenue |
|
$ |
371,795 |
|
$ |
375,570 |
|
$ |
395,731 |
|
$ |
390,113 |
|
|
Cost of goods sold |
|
209,201 |
|
224,008 |
|
230,666 |
|
237,202 |
|
||||
|
Gross profit |
|
162,594 |
|
151,562 |
|
165,065 |
|
152,911 |
|
||||
|
Operating expenses |
|
88,963 |
|
81,023 |
|
95,655 |
|
95,511 |
|
||||
|
Operating income |
|
73,631 |
|
70,539 |
|
69,410 |
|
57,400 |
|
||||
|
Total other non-operating (expense) income, net |
|
(21,256 |
) |
54,582 |
|
(19,475 |
) |
(55,934 |
) |
||||
|
Income before income taxes |
|
52,375 |
|
125,121 |
|
49,935 |
|
1,466 |
|
||||
|
Provision for income taxes |
|
(18,940 |
) |
(41,849 |
) |
(14,125 |
) |
(94 |
) |
||||
|
Net income |
|
$ |
33,435 |
|
$ |
83,272 |
|
$ |
35,810 |
|
$ |
1,372 |
|
|
|
|
|
|
|
|
|
|
|
|
||||
|
Earnings per share: |
|
|
|
|
|
|
|
|
|
||||
|
Basic |
|
$ |
25.09 |
|
$ |
47.42 |
|
$ |
12.01 |
|
$ |
0.01 |
|
|
Diluted |
|
$ |
0.36 |
|
$ |
0.89 |
|
$ |
0.38 |
|
$ |
0.01 |
|
|
|
|
2008 Quarter Ended |
|
||||||||||
|
|
|
March 31 |
|
June 30 |
|
September 30 |
|
December 31 |
|
||||
|
Net revenue |
|
$ |
305,203 |
|
$ |
317,185 |
|
$ |
350,492 |
|
$ |
401,412 |
|
|
Cost of goods sold |
|
206,720 |
|
209,785 |
|
211,856 |
|
253,796 |
|
||||
|
Gross profit |
|
98,483 |
|
107,400 |
|
138,636 |
|
147,616 |
|
||||
|
Operating expenses |
|
57,607 |
|
68,005 |
|
81,650 |
|
86,268 |
|
||||
|
Operating income |
|
40,876 |
|
39,395 |
|
56,986 |
|
61,348 |
|
||||
|
Total other non-operating expense, net |
|
(24,586 |
) |
(23,509 |
) |
(24,285 |
) |
(23,834 |
) |
||||
|
Income before income taxes |
|
16,290 |
|
15,886 |
|
32,701 |
|
37,514 |
|
||||
|
Provision for income taxes |
|
(6,725 |
) |
(6,412 |
) |
(12,147 |
) |
(11,310 |
) |
||||
|
Net income |
|
$ |
9,565 |
|
$ |
9,474 |
|
$ |
20,554 |
|
$ |
26,204 |
|
|
|
|
|
|
|
|
|
|
|
|
||||
|
Earnings per share: |
|
|
|
|
|
|
|
|
|
||||
|
Basic |
|
$ |
3.35 |
|
$ |
4.94 |
|
$ |
14.65 |
|
$ |
19.40 |
|
|
Diluted |
|
$ |
0.10 |
|
$ |
0.10 |
|
$ |
0.22 |
|
$ |
0.28 |
|
Earnings per share amounts for the 2009 and 2008 quarters and full years have been computed separately. Accordingly, quarterly amounts may not add to the annual amounts because of differences in the weighted average shares outstanding during each quarter due to the effect of potentially dilutive securities only in the periods in which such effect would be dilutive.
Our net income for the second quarter of 2009 includes a $75.0 million (approximately $48.8 million after tax) payment we received from CSL as a result of the termination of the definitive merger agreement. Our net income for the fourth quarter of 2009 includes a charge of $43.0 million (approximately $26.3 million after tax) as a result of the settlement and termination of our interest rate swap contracts and the write-off of deferred debt issuance costs associated with our First and Second Lien Term Loans. Additional information regarding our terminated merger agreement with CSL is included in Note 4, “Definitive Merger Agreement with CSL Limited (CSL)” and additional information regarding our refinancing transactions is included in Note 11, “Long-Term Debt and Capital Lease Obligations.”
Talecris Biotherapeutics Holdings Corp.
Valuation and Qualifying Accounts
Years Ended December 31, 2009, 2008, and 2007
(in thousands)
|
|
|
Balance at |
|
Charges to |
|
Charges to |
|
|
|
Balance at |
|
|||||
|
|
|
Beginning of |
|
Costs and |
|
Other |
|
|
|
End of |
|
|||||
|
|
|
Period |
|
Expenses |
|
Accounts |
|
Deductions |
|
Period |
|
|||||
|
Reserve for doubtful accounts receivable: |
|
|
|
|
|
|
|
|
|
|
|
|||||
|
Year ended December 31, 2009 |
|
$ |
2,020 |
|
$ |
2,858 |
|
$ |
— |
|
$ |
(1,417 |
)(1) |
$ |
3,461 |
|
|
Year ended December 31, 2008 |
|
$ |
2,631 |
|
$ |
728 |
|
$ |
— |
|
$ |
(1,339 |
)(1) |
$ |
2,020 |
|
|
Year ended December 31, 2007 |
|
$ |
4,690 |
|
$ |
525 |
|
$ |
— |
|
$ |
(2,584 |
)(1) |
$ |
2,631 |
|
|
|
|
|
|
|
|
|
|
|
|
|
|
|||||
|
Reserve for doubtful notes receivable and other advances: |
|
|
|
|
|
|
|
|
|
|
|
|||||
|
Year ended December 31, 2009 |
|
$ |
4,250 |
|
$ |
— |
|
$ |
— |
|
$ |
— |
|
$ |
4,250 |
|
|
Year ended December 31, 2008 |
|
$ |
— |
|
$ |
4,250 |
(4) |
$ |
— |
|
$ |
— |
|
$ |
4,250 |
|
|
Year ended December 31, 2007 |
|
$ |
— |
|
$ |
— |
|
$ |
— |
|
$ |
— |
|
$ |
— |
|
|
|
|
|
|
|
|
|
|
|
|
|
|
|||||
|
Inventory reserves: |
|
|
|
|
|
|
|
|
|
|
|
|||||
|
Year ended December 31, 2009 |
|
$ |
49,766 |
|
$ |
21,758 |
|
$ |
— |
|
$ |
(27,147 |
)(2) |
$ |
44,377 |
|
|
Year ended December 31, 2008 |
|
$ |
47,534 |
|
$ |
36,840 |
|
$ |
— |
|
$ |
(34,608 |
)(2) |
$ |
49,766 |
|
|
Year ended December 31, 2007 |
|
$ |
43,381 |
|
$ |
39,043 |
|
$ |
— |
|
$ |
(34,890 |
)(2) |
$ |
47,534 |
|
|
|
|
|
|
|
|
|
|
|
|
|
|
|||||
|
Deferred tax assset valuation allowance: |
|
|
|
|
|
|
|
|
|
|
|
|||||
|
Year ended December 31, 2009 |
|
$ |
— |
|
$ |
— |
|
$ |
— |
|
$ |
— |
|
$ |
— |
|
|
Year ended December 31, 2008 |
|
$ |
— |
|
$ |
— |
|
$ |
— |
|
$ |
— |
|
$ |
— |
|
|
Year ended December 31, 2007 |
|
$ |
60,157 |
|
$ |
— |
|
$ |
— |
|
$ |
(60,157 |
)(3) |
$ |
— |
|
(1) Includes write-offs of uncollectible accounts receivable and the effects of foreign exchange.
(2) Includes the net of write-offs, reversals of reserved inventory that was sold or recoverable for other purposes such as testing, and the effects of foreign exchange.
(3) Includes $55.8 million attributable to the reversal of the valuation allowance as a 2007 non-cash income tax benefit, and $4.4 million due to the impact of the adoption of new accounting guidance related to uncertainties in income taxes.
(4) Includes a provision for $3.2 million related to notes receivables and $1.0 million related to advances for unlicensed plasma from a then existing third party supplier due to uncertainty regarding collection.
ITEM 9. CHANGES IN AND DISAGREEMENTS WITH ACCOUNTANTS ON ACCOUNTING AND FINANCIAL DISCLOSURE
There were no changes in or disagreements with our accountants on accounting and financial disclosure matters.
ITEM 9A. CONTROLS AND PROCEDURES
Evaluation of Disclosure Controls and Procedures
Our management, with the participation of our Chief Executive Officer and our Chief Financial Officer, evaluated the effectiveness of our disclosure controls and procedures (as defined in Rules 13a-15(e) and 15d-15(e) under the Exchange Act) as of the end of the period covered by this report. Based upon that evaluation, our Chief Executive Officer and Chief Financial Officer concluded that our disclosure controls and procedures were effective as of December 31, 2009.
Management’s Report on Internal Control over Financial Reporting
This Annual Report does not include a report of management’s assessment regarding internal control over financial reporting or an attestation report of the company’s registered public accounting firm due to a transition period established by rules of the Securities and Exchange Commission for newly public companies.
Changes in Internal Control over Financial Reporting
There was no change in our internal control over financial reporting (as defined in Rule 13a-15(f) and 15d-15(f) of the Exchange Act) that occurred during the quarter ended December 31, 2009 that has materially affected, or is reasonably likely to materially affect, our internal control over financial reporting.
None.
ITEM 10. DIRECTORS, EXECUTIVE OFFICERS AND CORPORATE GOVERNANCE
Executive Officers
Our executive officers and their respective ages and positions as of March 1, 2010 are as follows:
|
Name |
|
Age |
|
Position |
|
Lawrence D. Stern |
|
53 |
|
Chairman, Chief Executive Officer and Director |
|
John M. Hanson |
|
57 |
|
Executive Vice President and Chief Financial Officer |
|
John F. Gaither, Jr. |
|
60 |
|
Executive Vice President, General Counsel and Secretary |
|
Mary J. Kuhn |
|
51 |
|
Executive Vice President, Operations |
|
Stephen R. Petteway, Jr. PhD |
|
64 |
|
Executive Vice President, Research & Development |
|
Joel E. Abelson |
|
51 |
|
Senior Vice President and General Manager, Portfolio Management and International Business |
|
James R. Engle |
|
54 |
|
Senior Vice President, Information Technology |
|
Kari D. Heerdt |
|
42 |
|
Senior Vice President, Human Resources |
|
Thomas J. Lynch, PhD |
|
59 |
|
Senior Vice President, Corporate Compliance, Regulatory and Public Policy |
|
Daniel L. Menichella |
|
50 |
|
Senior Vice President, Business Development |
|
Bruce Nogales |
|
53 |
|
Senior Vice President and General Manager, Talecris Plasma Resources |
|
John R. Perkins |
|
39 |
|
Senior Vice President and General Manager, Portfolio Management and U.S. Business |
Lawrence D. Stern has served as our Chairman and Chief Executive Officer since June 2007, as a director since April 2005, and currently serves as chairman of the executive committee and as a member of our compliance committee. He was previously our Executive Chairman from April 2005 until June 2007. From December 2003 until March 2005, Mr. Stern worked primarily with Cerberus and Ampersand in connection with our formation transaction. From January through November 2003, Mr. Stern worked as an independent consultant supporting debt and equity transactions. Mr. Stern received his BS in Chemical Engineering from Cornell University and his MS from the Massachusetts Institute of Technology.
John M. Hanson has served as Executive Vice President and Chief Financial Officer for our company since October 2005. From April 2003 until he joined us in 2005, Mr. Hanson was employed at Andrx Corporation, a specialty pharmaceuticals company, where he ultimately served as Senior Vice President and Chief Financial Officer. Mr. Hanson took some time off from August 2001 to March 2003 to pursue personal interests. Mr. Hanson has an extensive history of executive experience in the pharmaceuticals industry. From November 2000 to July 2001, Mr. Hanson served as Chief Financial Officer of Mylan Laboratories and from September 1996 to October 2000, Mr. Hanson served as Chief Financial Officer of Zenith Goldline Pharmaceuticals, Inc., the U.S. generic products subsidiary of IVAX Corporation. Mr. Hanson was employed by Arthur Andersen LLP from 1984 to 1995. Mr. Hanson is a Certified Public Accountant and earned both his BS in Biology and his MPA from the University of South Dakota.
John F. Gaither, Jr. has been our Executive Vice President, General Counsel and Secretary since September 2006. Prior to joining us in 2006, Mr. Gaither served as Senior Vice President, General Counsel and Secretary of NeighborCare, Inc., one of the largest providers of institutional pharmacy services in the United States, from 2003 through 2005. Mr. Gaither earned both his BBA in Accounting and his JD from the University of Notre Dame.
Mary J. Kuhn became our Executive Vice President, Operations, in August 2009 after being our Senior Vice President, Operations since April 2005. Prior to joining us, Ms. Kuhn was a Senior Vice President of Operations at Bayer from October 2002 to April 2005. During the previous two decades, Ms. Kuhn held numerous positions with increasing responsibility within Bayer’s North American Pharmaceutical Division’s Headquarters, including Supervisor, Pharmaceutical Formulations Lab; Manager, Pharmaceutical Technical Services; Manager, Manufacturing Operations; Director, Manufacturing; and, Vice President, Technical Operations and Ethical Product Manufacturing; and Vice-President of Operations. Ms. Kuhn earned her BS in Pharmacy from Purdue
University and her EMBA from the University of New Haven.
Stephen R. Petteway, Jr., PhD became our Executive Vice President, Research and Development, in August 2009 after being our Senior Vice President, Research & Development since April 2005. Prior to our formation transaction, Dr. Petteway held various positions for Bayer Biological Products, including: Senior Director, Pathogen Safety & Research; Vice President, Pathogen Safety & Research; and Acting Head, Research & Technology. Dr. Petteway is the author of numerous scientific publications and patents related to diagnostics and therapeutics. Dr. Petteway earned his BA in Microbiology/Chemistry from the University of South Florida at Tampa, and his PhD in Molecular Cell Biology from the University of Alabama at Birmingham.
Joel E. Abelson has served as our Senior Vice President and General Manager, Portfolio Management and International Business since April 2008. Previously, he was Vice President and General Manager, International Commercial Operations from August 2007 to April 2008 and before that he was Vice President, Canada and Intercontinental Commercial Operations from March 2006 to August 2007. From April 2005 until March 2006, Mr. Abelson worked in a consulting role for Talecris supporting both the formation of the new company and the planning and establishment of our Canadian business. From July 2002 to March 2005, Mr. Abelson served as Vice President, Global Strategic Marketing for Bayer’s Biological Products Division. Mr. Abelson received his BA (Honours) degree from Carleton University and his MA degree in Public Administration from the University of Toronto.
James R. Engle has been our Senior Vice President, Information Technology since April 2005. Prior to joining us in 2005, Mr. Engle was with Aventis from 1988 to 2004. His most recent position at Aventis was Senior Vice President, IT for Aventis Behring (subsequently acquired by CSL Limited and renamed CSL Behring) from 1999 to 2004. Mr. Engle attended Delaware Valley College of Science and Agriculture, where he earned his BS in Business Administration.
Kari D. Heerdt has been our Senior Vice President, Human Resources since January 2008. Prior to joining Talecris, Ms. Heerdt served as Senior Vice President of Human Resources for Mervyns, a mid-market department store partially owned by Cerberus Capital Management, from 2004 to 2008. Prior to that, she was a consultant to Cerberus Capital Management, a leading investment management firm. From 2000 to 2004, Ms. Heerdt was a Senior Consultant for Hewitt Associates, a global Human Resources consulting firm. Ms. Heerdt earned a BA degree from Mount Holyoke College, and a MS from the Krannert Graduate School of Management at Purdue University.
Thomas J. Lynch, PhD began as our Vice President of Corporate Governance and Compliance in April 2005, and assumed his current position as Senior Vice President, Corporate Compliance, Regulatory and Public Affairs in early 2006. From 2003 to 2005, Dr. Lynch served as Vice President of Regulatory Affairs and Quality Assurance for CryoLife, Inc., a medical device and human tissue company. Prior to that, from 2000 to 2003, he served as Senior Vice President, Regulatory Affairs and Quality Assurance at Clearant, a biotechnology company engaged in pathogen inactivation research & development. From 1993 to 2000, Dr. Lynch was with the U.S. Food and Drug Administration, most recently as Deputy Director of the Division of Hematology. He holds a Ph.D. in biochemistry from Wayne State University and a JD from Georgetown University.
Daniel L. Menichella joined our company in October 2007 as Senior Vice President, Business Development. Prior to joining our company, Mr. Menichella served in various capacities related to business development and strategic planning at Merck KGaA, the global pharmaceutical and chemical company, from December 2002 until October 2007. Over the course of his five years at Merck KGaA, Mr. Menichella served as Vice President, Business Development, Vice President, Corporate Strategic Planning and Vice President, Corporate Business Development and Alliance Management. Mr. Menichella earned his AB from Harvard University and his MBA from the University of North Carolina at Chapel Hill.
Bruce Nogales joined our company in 2005 as Vice President, International, responsible for our business transitions in Europe and Intercontinental Markets. He has also served as Vice President of both the Immunology and Pulmonary Commercial Development groups. In April 2007, Mr. Nogales was named Vice President and General Manager, International Commercial Operations and in September 2007, Mr. Nogales was named Senior Vice President and General Manager, Talecris Plasma Resources. Prior to joining us, Mr. Nogales had served from 1999 through 2004 as both Vice President and General Manager of Intercontinental Commercial Operations and of the Wound Healing Business Unit at Aventis Behring (subsequently acquired by CSL Limited and renamed CSL Behring), which is engaged in the global protein therapeutics business. Mr. Nogales earned his BS in Finance from California State University, Long Beach in 1978 and completed an Executive Development Program at the University of Pennsylvania’s Wharton School of Business.
John R. Perkins joined our company in 2006 and since April 2008 has served as our Senior Vice President and General Manager, Portfolio Management and U.S. Business. Previously, he was Vice President, U.S. Commercial Operations. Prior to joining our company, Mr. Perkins was a consultant to Cerberus Capital Management where he provided executive management since 2004 for several existing portfolio companies, including the company, and operational due diligence for potential investments. Mr. Perkins joined Cerberus from General Electric where he was an executive in its Corporate Business Development group since 2001. Mr. Perkins started his career with General Electric where he held a variety of additional positions including marketing/product
management, sales, operations and corporate audit. Mr. Perkins is a graduate of General Electric’s Management Development Program. He received his BA from DePauw University and earned his MBA from Northwestern’s Kellogg School of Management.
The other information under the sections entitled “Board of Directors”, “Corporate Governance” and “Section 16(a) Beneficial Ownership Reporting Compliance” from our definitive proxy statement for the 2010 Annual Meeting, which is to be filed with the SEC not later than 120 days after the close of our fiscal year ended December 31, 2009 (the 2010 Proxy Statement), is hereby incorporated by reference.
ITEM 11. EXECUTIVE COMPENSATION
The information under the sections entitled “Compensation Discussion & Analysis”, “Executive Compensation”, “Compensation Committee Interlocks and Insider Participation”, and “Compensation Committee Report” from the 2010 Proxy Statement is hereby incorporated by reference.
ITEM 12. SECURITY OWNERSHIP OF CERTAIN BENEFICIAL OWNERS AND MANAGEMENT AND RELATED STOCKHOLDER MATTERS
Equity Compensation Plan Information
The following table sets forth certain information regarding the following equity compensation plans, pursuant to which we have made equity compensation available to eligible participants as of December 31, 2009: 2005 Stock Option and Incentive Plan (2005 Plan), 2006 Restricted Stock Plan (2006 Plan), and 2009 Long-Term Incentive Plan (2009 Plan). In connection with our IPO, we ceased further grants under our 2005 and 2006 Plans and the 2009 Plan became effective. The 2009 Plan provides for the grant of awards in the form of incentive stock options, nonqualified stock options, share appreciation rights, restricted stock, restricted stock units (RSU’s), unrestricted shares of common stock, deferred share units, and performance awards. All of our plans have been approved by our stockholders.
|
Plan Category |
|
(a) |
|
(b) |
|
(c) |
|
|
|
|
|
|
|
|
|
|
|
|
|
Equity compensation plans approved by shareholders |
|
12,129,438 |
|
$ |
8.40 |
|
6,112,896 |
|
|
Equity compensation plans not approved by shareholders |
|
— |
|
NA |
|
— |
|
|
|
Total |
|
12,129,438 |
|
$ |
8.40 |
|
6,112,896 |
|
|
(a) |
Number of securities to be issued upon exercise of outstanding options, warrants, and rights |
|
(b) |
Weighted-average exercise price of outstanding options, warrants, and rights |
|
(c) |
Number of securities remaining available for future issuance under equity compensation plans (excluding securities reflected in column (a)) |
The maximum number of shares that we may issue for all awards under the 2009 Plan is 7,200,000. At December 31, 2009, 607,080 and 480,024 stock options and RSU’s, respectively, were outstanding, and 6,112,896 securities were remaining for future issuance under the 2009 Plan.
The other information under the section entitled “Security Ownership of Certain Beneficial Holders and Management” from the 2010 Proxy Statement is hereby incorporated by reference.
ITEM 13. CERTAIN RELATIONSHIPS AND RELATED TRANSACTIONS, AND DIRECTOR INDEPENDENCE
The information under the sections entitled “Board of Directors” and “Certain Relationships and Related Person Transactions” from the 2010 Proxy Statement is hereby incorporated by reference.
ITEM 14. PRINCIPAL ACCOUNTING FEES AND SERVICES
The information under the section entitled “Audit and Non-Audit Fees” from the 2010 Proxy Statement is hereby incorporated by reference.
ITEM 15. EXHIBITS, FINANCIAL STATEMENT SCHEDULES
1. Financial Statements. The following are included in Item 8, “Financial Statements and Supplementary Data:”
Report of Independent Registered Public Accounting Firm
Consolidated Balance Sheets at December 31, 2009 and 2008
Consolidated Income Statements for the years ended December 31, 2009, 2008, and 2007
Consolidated Statements of Cash Flows for the years ended December 31, 2009, 2008, and 2007
Consolidated Statements of Stockholders’ Equity (Deficit) for the years ended December 31, 2009, 2008, and 2007
Notes to Consolidated Financial Statements
2. Financial Statement Schedule. The following is included in Item 8, “Financial Statements and Supplementary Data:”
Schedule II- Valuation and Qualifying Accounts for the years ended December 31, 2009, 2008, and 2007
All other schedules for which provision is made in the applicable accounting regulations of the SEC are not required under the related instructions or are inapplicable and therefore have been omitted.
3. Exhibits
|
Exhibit Number |
|
Exhibit Description |
|
|
|
|
|
3.1 |
|
Amended and Restated Certificate of Incorporation of Talecris Biotherapeutics Holdings Corp. (incorporated by reference to Exhibit 3.1 of Amendment No. 9 to our Registration Statement on Form S-1 (File No. 333-144941) filed on September 11, 2009) |
|
|
|
|
|
3.2 |
|
Amended and Restated By-Laws of Talecris Biotherapeutics Holdings Corp. (incorporated by reference to Exhibit 3.2 of Amendment No. 8 to our Registration Statement on Form S-1 (File No. 333-144941) filed on August 19, 2009) |
|
|
|
|
|
4.1 |
|
Indenture dated as of October 21, 2009 among Talecris Biotherapeutics Holdings Corp., the Guarantors named therein, and The Bank of New York Mellon Trust Company, N.A. (incorporated by reference to Exhibit 4.1 to our Current Report on Form 8-K filed on October 21, 2009) |
|
|
|
|
|
10.1 |
|
Revolving Credit Agreement, dated as of December 6, 2006, by and among Talecris Biotherapeutics Holdings Corp., Talecris Biotherapeutics, Inc., Precision Pharma Services, Inc., Talecris Plasma Resources, Inc., Wells Fargo Foothill, Inc. and Wachovia Bank, N.A. (incorporated by reference to Exhibit 10.12 of Amendment No. 1 to our Registration Statement on Form S-1 (File No. 333-144941) filed on September 24, 2007) |
|
|
|
|
|
10.2 |
|
First Amendment to Revolving Credit Agreement, dated as of October 12, 2009 by and among Talecris Biotherapeutics Holdings Corp., Wachovia Bank, National Association, Wells Fargo Foothill, Inc., and other signatories thereto (incorporated by reference to Exhibit 10.1 to our Current Report on Form 8-K filed on October 16, 2009) |
|
|
|
|
|
10.3 |
|
Registration Rights Agreement dated as of October 21, 2009 among Talecris Biotherapeutics Holdings Corp., Morgan Stanley & Co. Incorporated, Goldman, Sachs & Co., Wells Fargo Securities, LLC, Citigroup Global Markets Inc., and the Guarantors named therein (incorporated by reference to Exhibit 10.1 to our Current Report on Form 8-K filed on October 21, 2009) |
|
|
|
|
|
10.4 |
|
Supply Agreement, dated as of March 31, 2005, by and between Bayer Healthcare LLC, Biological Products Division, and Talecris Biotherapeutics, Inc. (F/K/A NPS Biotherapeutics, Inc.) (incorporated by reference to Exhibit 10.31 of Amendment No. 9 to our Registration Statement on Form S-1 (File No. 333-144941) filed on September 11, 2009)+ |
|
|
|
|
|
10.5 |
|
Amendment to Supply Agreement, dated as of June 30, 2008, by and between Bayer Healthcare LLC and Talecris Biotherapeutics, Inc. (incorporated by reference to Exhibit 10.31.1 of Amendment No. 9 to our Registration Statement on Form S-1 (File No. 333-144941) filed on September 11, 2009)+ |
|
|
|
|
|
10.6 |
|
Amended and Restated Plasma Sale/Purchase Agreement, dated October 13, 2006, by and between |
|
|
|
Talecris Biotherapeutics, Inc. and Interstate Blood Bank, Inc. (incorporated by reference to Exhibit 10.32 of Amendment No. 8 to our Registration Statement on Form S-1 (File No. 333-144941) filed on August 19, 2009)+ |
|
|
|
|
|
10.7 |
|
Profit Sharing Agreement, dated November 18, 2006, by and between International BioResources, L.L.C. and Talecris Plasma Resources, Inc. (incorporated by reference to Exhibit 10.19 of Amendment No. 1 to our Registration Statement on Form S-1 (File No. 333-144941) filed on September 24, 2007) |
|
|
|
|
|
10.8 |
|
Fractionation Services and Commercial Products Agreement, dated as of April 1, 2008, between and amongst Canadian Blood Services/Societe Canadienne Du Sang, Talecris Biotherapeutics, Inc. and Talecris Biotherapeutics, Ltd. (incorporated by reference to Exhibit 10.29 of Amendment No. 9 to our Registration Statement on Form S-1 (File No. 333-144941) filed on September 11, 2009)+ |
|
|
|
|
|
10.9 |
|
Fractionation Services and Commercial Products Agreement, dated as of April 1, 2008, between and amongst Héma-Québec, Talecris Biotherapeutics, Ltd. and Talecris Biotherapeutics, Inc. (incorporated by reference to Exhibit 10.30.1 of Amendment No. 9 to our Registration Statement on Form S-1 (File No. 333-144941) filed on September 11, 2009)+ |
|
|
|
|
|
10.10 |
|
Amending Agreement No. 1, effective as of May 26, 2008, to Fractionation Services and Commercial Products, dated as of April 1, 2008, by and among Héma-Québec, Talecris Biotherapeutics, Ltd. and Talecris Biotherapeutics, Inc. (incorporated by reference to Exhibit 10.30.2 of Amendment No. 6 to our Registration Statement on Form S-1 (File No. 333-144941) filed on July 2, 2009)+ |
|
|
|
|
|
10.11 |
|
Toll Manufacturing Agreement for Testing and Packaging, dated April 4, 2008, by and between Talecris Biotherapeutics, GmbH and Catalent France Limoges SAS (incorporated by reference to Exhibit 10.35 of Amendment No. 8 to our Registration Statement on Form S-1 (File No. 333-144941) filed on August 19, 2009)+ |
|
|
|
|
|
10.12 |
|
Plasma Sale/Purchase Agreement, dated as of August 12, 2008, by and between CSL Plasma Inc. (f/k/a ZLB Bioplasma Inc.) and Talecris Biotherapeutics, Inc. (incorporated by reference to Exhibit 10.33 of Amendment No. 7 to our Registration Statement on Form S-1 (File No. 333-144941) filed on July 21, 2009)+ |
|
|
|
|
|
10.13 |
|
Amended and Restated Services Agreement, dated January 1, 2009, by and between Talecris Biotherapeutics, Inc. and Centric Health Resources, Inc. (incorporated by reference to Exhibit 10.34 of Amendment No. 9 to our Registration Statement on Form S-1 (File No. 333-144941) filed on September 11, 2009)+ |
|
|
|
|
|
10.14 |
|
Retained Intellectual Property License Agreement, dated as of March 31, 2005, by and between Bayer Healthcare LLC and Talecris Biotherapeutics, Inc. (f/k/a NPS Biotherapeutics, Inc.) (incorporated by reference to Exhibit 10.31.1 of Amendment No. 1 to our Registration Statement on Form S-1 (File No. 333-144941) filed on September 24, 2007) |
|
|
|
|
|
10.15 |
|
Amendment to Retained Intellectual Property Licensing Agreement, entered into as of August 10, 2007, by and between Bayer Healthcare LLC and Talecris Biotherapeutics, Inc. (incorporated by reference to Exhibit 10.31.2 of Amendment No. 1 to our Registration Statement on Form S-1 (File No. 333-144941) filed on September 24, 2007) |
|
|
|
|
|
10.16 |
|
Management Agreement, dated as of March 31, 2005, by and between Cerberus-Plasma Holdings LLC, Ampersand 2001 Limited Partnership, Talecris Biotherapeutics Holdings Corp., and Talecris Biotherapeutics, Inc. (incorporated by reference to Exhibit 10.27.1 of Amendment No. 1 to our Registration Statement on Form S-1 (File No. 333-144941) filed on September 24, 2007) |
|
|
|
|
|
10.17 |
|
Amendment to Management Agreement, dated as of December 6, 2006, by and between Cerberus-Plasma Holdings LLC, Ampersand 2001 Limited Partnership, Talecris Biotherapeutics Holdings Corp., and Talecris Biotherapeutics, Inc. (incorporated by reference to Exhibit 10.27.2 of Amendment No. 1 to our Registration Statement on Form S-1 (File No. 333-144941) filed on September 24, 2007) |
|
|
|
|
|
10.18 |
|
Second Amendment to Management Agreement, dated August 17, 2009, by and between Cerberus-Plasma Holdings LLC, Ampersand 2001 Limited Partnership, Talecris Biotherapeutics Holdings Corp., and Talecris Biotherapeutics, Inc. (incorporated by reference to Exhibit 10.27.3 of Amendment No. 9 to our Registration Statement on Form S-1 (File No. 333-144941) filed on September 11, 2009) |
|
|
|
|
|
10.19 |
|
Stockholders Agreement, dated March 31, 2005, by and among Talecris Biotherapeutics Holdings Corp., Talecris Holdings, LLC and Bayer Healthcare LLC and its affiliates party thereto (incorporated by reference to Exhibit 10.16.1 of Amendment No. 8 to our Registration Statement on Form S-1 (File No. 333-144941) |
|
|
|
filed on August 19, 2009) |
|
|
|
|
|
10.20 |
|
First Amendment to Stockholders Agreement, dated August 17, 2009, by and among Talecris Biotherapeutics Holdings Corp. and Talecris Holdings, LLC (incorporated by reference to Exhibit 10.15.2 of Amendment No. 9 to our Registration Statement on Form S-1 (File No. 333-144941) filed on September 11, 2009) |
|
|
|
|
|
10.21 |
|
Stockholders Agreement, dated December 7, 2006, by and among Talecris Biotherapeutics Holdings Corp., Talecris Holdings, LLC and certain other stockholders of Talecris Biotherapeutics Holdings Corp. party thereto (incorporated by reference to Exhibit 10.21 of Amendment No. 1 to our Registration Statement on Form S-1 (File No. 333-144941) filed on September 24, 2007) |
|
|
|
|
|
10.22 |
|
Agreement for Domestic and Global Relocation Services, dated July 14, 2008, by and between Talecris Biotherapeutics, Inc. and GMAC Global Relocation Services, LLC (incorporated by reference to Exhibit 10.36.1 of Amendment No. 8 to our Registration Statement on Form S-1 (File No. 333-144941) filed on August 19, 2009) |
|
|
|
|
|
10.23 |
|
Amendment to Agreement for Domestic and Global Relocation Services, dated August 15, 2008, by and between Talecris Biotherapeutics, Inc. and GMAC Global Relocation Services, LLC (incorporated by reference to Exhibit 10.36.2 of Amendment No. 8 to our Registration Statement on Form S-1 (File No. 333-144941) filed on August 19, 2009) |
|
|
|
|
|
10.24 |
|
Master Consulting and Advisory Services Agreement, dated as of July 18, 2008, by and between Cerberus Operations and Advisory Company LLC and Talecris Biotherapeutics Holding Corp. (incorporated by reference to Exhibit 10.37 of Amendment No. 9 to our Registration Statement on Form S-1 (File No. 333-144941) filed on September 11, 2009)+ |
|
|
|
|
|
10.25 |
|
Talecris Biotherapeutics Holdings Corp. 2005 Stock Option and Incentive Plan (incorporated by reference to Exhibit 10.1 of Amendment No. 1 to our Registration Statement on Form S-1 (File No. 333-144941) filed on September 24, 2007)* |
|
|
|
|
|
10.26 |
|
Talecris Biotherapeutics Holdings Corp. Supplemental Savings Plan (incorporated by reference to Exhibit 10.4 of Amendment No. 1 to our Registration Statement on Form S-1 (File No. 333-144941) filed on September 24, 2007)* |
|
|
|
|
|
10.27 |
|
Talecris Biotherapeutics Holdings Corp. Irrevocable Trust Agreement, dated as of December 6, 2006, by and between Talecris Biotherapeutics Holdings Corp. and Wilmington Trust Company, as trustee (incorporated by reference to Exhibit 10.36 of Amendment No. 1 to our Registration Statement on Form S-1 (File No. 333-144941) filed on September 24, 2007)* |
|
|
|
|
|
10.28 |
|
Talecris Biotherapeutics Holdings Corp. Special Recognition Bonus Plan (incorporated by reference to Exhibit 10.5 of Amendment No. 1 to our Registration Statement on Form S-1 (File No. 333-144941) filed on September 24, 2007)* |
|
|
|
|
|
10.29 |
|
Talecris Biotherapeutics Holdings Corp. Incentive Plan (Management Bonus Plan), as amended (incorporated by reference to Exhibit 10.6 of Amendment No. 1 to our Registration Statement on Form S-1 (File No. 333-144941) filed on September 24, 2007)* |
|
|
|
|
|
10.30 |
|
Talecris Biotherapeutics Holdings Corp. 2009 Long-Term Incentive Plan (incorporated by reference to Exhibit 10.7 of Amendment No. 9 to our Registration Statement on Form S-1 (File No. 333-144941) filed on September 11, 2009)* |
|
|
|
|
|
10.31 |
|
Form of Stock Option Award Agreement under the 2009 Long-Term Incentive Plan of Talecris Biotherapeutics Holdings Corp. (incorporated by reference to Exhibit 10.7.2 of Amendment No. 11 to our Registration Statement on Form S-1 (File No. 333-144941) filed on September 28, 2009)* |
|
|
|
|
|
10.32 |
|
Form of Restricted Share Unit Award Agreement under the 2009 Long-Term Incentive Plan of Talecris Biotherapeutics Holdings Corp. (incorporated by reference to Exhibit 10.7.3 of Amendment No. 11 to our Registration Statement on Form S-1 (File No. 333-144941) filed on September 28, 2009)* |
|
|
|
|
|
10.33 |
|
Third Restated Employment Agreement, dated as of April 1, 2009, by and between Talecris Biotherapeutics Holdings Corp. and Lawrence D. Stern (incorporated by reference to Exhibit 10.22 of Amendment No. 8 to our Registration Statement on Form S-1 (File No. 333-144941) filed on August 19, 2009)* |
|
|
|
|
|
10.34 |
|
Employment Agreement, as amended and restated as of October 10, 2008, by and between Talecris Biotherapeutics Holdings Corp. and John M. Hanson (incorporated by reference to Exhibit 10.23 of Amendment No. 6 to our Registration Statement on Form S-1 (File No. 333-144941) filed on July 2, 2009)* |
|
10.35 |
|
Employment Agreement, as amended and restated as of November 6, 2008, by and between Talecris Biotherapeutics Holdings Corp. and John F. Gaither, Jr. (incorporated by reference to Exhibit 10.25 of Amendment No. 6 to our Registration Statement on Form S-1 (File No. 333-144941) filed on July 2, 2009)* |
|
|
|
|
|
10.36 |
|
Employment Letter, dated November 19, 2004, by and among NPS LLC, Bayer Healthcare LLC and Mary J. Kuhn (incorporated by reference to Exhibit 10.24.1 of Amendment No. 6 to our Registration Statement on Form S-1 (File No. 333-144941) filed on July 2, 2009)* |
|
|
|
|
|
10.37 |
|
Employment Offer Letter and supplemental termination provisions, dated February 8, 2005, by and between Talecris Biotherapeutics, Inc. and Mary J. Kuhn (incorporated by reference to Exhibit 10.24 of Amendment No. 5 to our Registration Statement on Form S-1 (File No. 333-144941) filed on July 23, 2008)* |
|
|
|
|
|
10.38 |
|
Letter Agreement, dated December 19, 2008, amending the terms of a certain Employment Letter, dated November 19, 2004, by and between Talecris Biotherapeutics, Inc. and Mary J. Kuhn (incorporated by reference to Exhibit 10.24.3 of Amendment No. 6 to our Registration Statement on Form S-1 (File No. 333-144941) filed on July 2, 2009)* |
|
|
|
|
|
10.39 |
|
Employment Offer Letter, dated March 2, 2006, by and between Talecris Biotherapeutics, Inc. and John R. Perkins (incorporated by reference to Exhibit 10.26 of Amendment No. 5 to our Registration Statement on Form S-1 (File No. 333-144941) filed on July 23, 2008)* |
|
|
|
|
|
10.40 |
|
Letter Agreement, dated December 19, 2008, amending the terms of a certain Employment Letter, dated March 2, 2006, by and between Talecris Biotherapeutics, Inc. and John R. Perkins (incorporated by reference to Exhibit 10.26.2 of Amendment No. 6 to our Registration Statement on Form S-1 (File No. 333-144941) filed on July 2, 2009)* |
|
|
|
|
|
10.41 |
|
Employment Agreement, as amended and restated as of November 26, 2008, by and between Talecris Biotherapeutics Holdings Corp. and Kari Heerdt (incorporated by reference to Exhibit 10.21 of Amendment No. 8 to our Registration Statement on Form S-1 (File No. 333-144941) filed on August 19, 2009)* |
|
|
|
|
|
21 |
|
Subsidiaries of Talecris Biotherapeutics Holdings Corp. |
|
|
|
|
|
23.1 |
|
Consent of Independent Registered Public Accounting Firm |
|
|
|
|
|
31.1 |
|
Certification of Chief Executive Officer pursuant to Section 302 of the Sarbanes-Oxley Act of 2002 |
|
|
|
|
|
31.2 |
|
Certification of Chief Financial Officer pursuant to Section 302 of the Sarbanes-Oxley Act of 2002 |
|
|
|
|
|
32.1 |
|
Certification of Chief Executive Officer pursuant to 18 U.S.C. Section 1350, as adopted pursuant to Section 906 of the Sarbanes-Oxley Act of 2002** |
|
|
|
|
|
32.2 |
|
Certification of Chief Financial Officer pursuant to 18 U.S.C. Section 1350, as adopted pursuant to Section 906 of the Sarbanes-Oxley Act of 2002** |
+ Portions of the exhibit have been omitted pursuant to an order granting confidential treatment dated September 30, 2009 by the Securities and Exchange Commission
* Management contract or compensatory plan or arrangement
** This certification shall not be deemed filed for purposes of Section 18 of the Exchange Act, or incorporated by reference in any filing under the Securities Act of 1933, as amended, or the Exchange Act, except as may be expressly set forth by specific reference in such filing
Pursuant to the requirements of Section 13 or 15(d) of the Securities Exchange Act of 1934, the registrant has duly caused this report to be signed on its behalf by the undersigned, thereunto duly authorized, in the city of Research Triangle Park, State of North Carolina, on February 23, 2010.
|
|
TALECRIS BIOTHERAPEUTICS HOLDINGS CORP. |
|
|
|
|
|
|
|
By: |
/s/ Lawrence D. Stern |
|
|
|
|
|
|
Lawrence D. Stern |
|
|
|
Chairman and Chief Executive Officer |
|
|
|
|
|
|
|
By: |
/s/ John M. Hanson |
|
|
|
|
|
|
John M. Hanson |
|
|
|
Executive Vice President and Chief Financial Officer |
|
Pursuant to the requirements of the Securities Exchange Act of 1934, this report has been signed below by the following persons in the capacities and on the dates indicated:
|
Signature |
|
Title |
|
Date |
|
|
|
|
|
|
|
/s/ Lawrence D. Stern |
|
Chairman and Chief Executive Officer |
|
February 23, 2010 |
|
Lawrence D. Stern |
|
(principal executive officer) |
|
|
|
|
|
|
|
|
|
/s/ John M. Hanson |
|
Executive Vice President and Chief |
|
February 23, 2010 |
|
John M. Hanson |
|
Financial Officer (principal financial |
|
|
|
|
|
and accounting officer) |
|
|
|
|
|
|
|
|
|
/s/ Stuart A. Auerbach |
|
Director |
|
February 23, 2010 |
|
Stuart A. Auerbach |
|
|
|
|
|
|
|
|
|
|
|
/s/ Richard A. Charpie |
|
Director |
|
February 23, 2010 |
|
Richard A. Charpie |
|
|
|
|
|
|
|
|
|
|
|
/s/ Paul N. Clark |
|
Director |
|
February 23, 2010 |
|
Paul N. Clark |
|
|
|
|
|
|
|
|
|
|
|
/s/ W. Brett Ingersoll |
|
Director |
|
February 23, 2010 |
|
W. Brett Ingersoll |
|
|
|
|
|
|
|
|
|
|
|
/s/ James T. Lenehan |
|
Director |
|
February 23, 2010 |
|
James T. Lenehan |
|
|
|
|
|
|
|
|
|
|
|
/s/ Steven F. Mayer |
|
Director |
|
February 23, 2010 |
|
Steven F. Mayer |
|
|
|
|
|
|
|
|
|
|
|
/s/ Kenneth J. Martin |
|
Director |
|
February 23, 2010 |
|
Kenneth J. Martin |
|
|
|
|
|
|
|
|
|
|
|
/s/ Dean J. Mitchell |
|
Director |
|
February 23, 2010 |
|
Dean J. Mitchell |
|
|
|
|
|
|
|
|
|
|
|
/s/ Ruedi E. Waeger |
|
Director |
|
February 23, 2010 |
|
Ruedi E. Waeger |
|
|
|
|