Attached files
Table of Contents
Index to Financial Statements
UNITED STATES
SECURITIES AND EXCHANGE COMMISSION
WASHINGTON, D.C. 20549
FORM 10-K
ANNUAL REPORT PURSUANT TO SECTION 13 OR 15(d) OF
THE SECURITIES EXCHANGE ACT OF 1934
For the fiscal year ended December 31, 2009
Commission file number 001-33334
PETROHAWK ENERGY CORPORATION
(Exact name of registrant as specified in its charter)
| Delaware | 86-0876964 | |
| (State or other jurisdiction of incorporation or organization) |
(I.R.S. Employer Identification Number) |
1000 Louisiana, Suite 5600, Houston, Texas 77002
(Address of principal executive offices including ZIP code)
(832) 204-2700
(Registrant’s telephone number)
Securities registered pursuant to Section 12(b) of the Act:
| Title of each class |
Name of each exchange on which registered | |
| Common Stock, par value $.001 per share | New York Stock Exchange |
Securities registered pursuant to Section 12(g) of the Act: None
Indicate by check mark if the registrant is a well-known seasoned issuer, as defined in Rule 405 of the Securities Act. Yes x No ¨
Indicate by check mark if the registrant is not required to file reports pursuant to Section 13 or Section 15(d) of the Act. Yes ¨ No x
Indicate by check mark whether the registrant (1) has filed all reports required to be filed by Section 13 or 15(d) of the Securities Exchange Act of 1934 during the preceding 12 months and (2) has been subject to such filing requirements for the past 90 days. Yes x No ¨
Indicate by check mark whether the registrant has submitted electronically and posted on its corporate Web site, if any, every Interactive Data File required to be submitted and posted pursuant to Rule 405 of Regulation S-T (§232.405 of this chapter) during the preceding 12 months (or for such shorter period that the registrant was required to submit and post such files). Yes x No ¨
Indicate by check mark if disclosure of delinquent filers pursuant to Item 405 of Regulation S-K is not contained herein, and will not be contained, to the best of registrant’s knowledge, in definitive proxy or information statements incorporated by reference in Part III of this Form 10-K or any amendment to this Form 10-K. ¨
Indicate by check mark whether the registrant is a large accelerated filer, an accelerated filer, a non-accelerated filer, or a smaller reporting company. See the definition of “large accelerated filer”, “accelerated filer” and “smaller reporting company” in Rule 12b-2 of the Exchange Act. (Check one):
| Large accelerated filer x | Accelerated filer ¨ | Non-accelerated filer ¨ | Smaller reporting company ¨ |
Indicate by check mark whether the registrant is a shell company (as defined in Rule 12b-2 of the Act). Yes ¨ No x
The aggregate market value of common stock, par value $.001 per share, held by non-affiliates (based upon the closing sales price on the New York Stock Exchange on June 30, 2009), the last business day of registrant’s most recently completed second fiscal quarter was approximately $6.0 billion.
As of February 17, 2010, there were 301,209,109 shares of common stock outstanding.
DOCUMENTS INCORPORATED BY REFERENCE
Information required by Part III, Items 10, 11, 12, 13 and 14, is incorporated by reference to portions of the registrant’s definitive proxy statement for its 2010 annual meeting of stockholders which will be filed on or before April 30, 2010.
Table of Contents
Index to Financial Statements
2
Table of Contents
Index to Financial Statements
Special note regarding forward-looking statements
This report on Form 10-K contains forward-looking statements within the meaning of the federal securities laws. All statements, other than statements of historical facts, concerning, among other things, planned capital expenditures, potential increases in oil and natural gas production, the number and location of wells to be drilled in the future, future cash flows and borrowings, pursuit of potential acquisition opportunities, our financial position, business strategy and other plans and objectives for future operations, are forward-looking statements. These forward-looking statements are identified by their use of terms and phrases such as “may,” “expect,” “estimate,” “project,” “plan,” “believe,” “intend,” “achievable,” “anticipate,” “will,” “continue,” “potential,” “should,” “could” and similar terms and phrases. Although we believe that the expectations reflected in these forward-looking statements are reasonable, they do involve certain assumptions, risks and uncertainties. Actual results could differ materially from those anticipated in these forward-looking statements. One should consider carefully the statements under the “Risk Factors” section of this report and other sections of this report which describe factors that could cause our actual results to differ from those anticipated in the forward-looking statements, including, but not limited to, the following factors:
| • | our ability to successfully develop our large inventory of undeveloped acreage primarily held in Louisiana, Arkansas and Texas, including our resource-style plays such as the Haynesville, Bossier, Fayetteville and Eagle Ford Shales; |
| • | volatility in commodity prices for oil and natural gas; |
| • | the possibility that the industry may be subject to future regulatory or legislative actions (including any additional taxes and changes in environmental regulation); |
| • | the presence or recoverability of estimated oil and natural gas reserves and the actual future production rates and associated costs; |
| • | the potential for production decline rates for our wells to be greater than we expect; |
| • | our ability to generate sufficient cash flow from operations, borrowings or other sources to enable us to fully develop our undeveloped acreage positions; |
| • | our ability to replace oil and natural gas reserves; |
| • | environmental risks; |
| • | drilling and operating risks; |
| • | exploration and development risks; |
| • | competition, including competition for acreage in resource-style areas; |
| • | management’s ability to execute our plans to meet our goals; |
| • | our ability to retain key members of senior management and key technical employees; |
| • | our ability to obtain goods and services, such as drilling rigs and tubulars, and access to adequate gathering systems and pipeline take-away capacity, necessary to execute our drilling program; |
| • | our ability to secure firm transportation for natural gas we produce and to sell natural gas at market prices; |
| • | general economic conditions, whether internationally, nationally or in the regional and local market areas in which we do business, may be less favorable than expected, including the possibility that the economic recession and credit crisis in the United States will be prolonged, which could adversely affect demand for oil and natural gas and make it difficult to access financial markets; |
| • | continued hostilities in the Middle East and other sustained military campaigns or acts of terrorism or sabotage; and |
3
Table of Contents
Index to Financial Statements
| • | other economic, competitive, governmental, legislative, regulatory, geopolitical and technological factors that may negatively impact our business, operations or pricing. |
Finally, our future results will depend upon various other risks and uncertainties, including, but not limited to, those detailed in the section entitled “Risk Factors” included in this report. All forward-looking statements are expressly qualified in their entirety by the cautionary statements in this paragraph and elsewhere in this document. Other than as required under the securities laws, we do not assume a duty to update these forward-looking statements, whether as a result of new information, subsequent events or circumstances, changes in expectations or otherwise.
4
Table of Contents
Index to Financial Statements
PART I
| ITEM 1. | BUSINESS |
Overview
We are an independent oil and natural gas company engaged in the exploration, development and production of predominately natural gas properties located onshore in the United States. Our business is comprised of an oil and natural gas segment and a midstream segment. Our oil and natural gas properties are concentrated in four premier domestic shale plays that we believe have decades of future development potential. We organize our oil and natural gas operations into two principal regions: the Mid-Continent, which includes our Louisiana, Arkansas and East Texas properties; and the Western, which includes our South Texas and Oklahoma properties. Our midstream segment consists of our gathering subsidiary, Hawk Field Services, LLC (Hawk Field Services) which was formed to potentially create shareholder value by integrating our active drilling program with activities of third parties and developing additional gathering and treating capacity serving the Haynesville Shale and Bossier Shale in North Louisiana, the Fayetteville Shale in Arkansas and the Eagle Ford Shale in South Texas.
At December 31, 2009, our estimated total proved oil and natural gas reserves, as prepared by our independent reserve engineering firm, Netherland, Sewell & Associates, Inc. (Netherland, Sewell), were approximately 2,750 billion cubic feet of natural gas equivalent (Bcfe), consisting of 8 million barrels (MMBbls) of oil, and 2,700 billion cubic feet (Bcf) of natural gas and natural gas liquids. Approximately 33% of our proved reserves were classified as proved developed. We maintain operational control of approximately 84% of our proved reserves. Approximately 93% of our proved reserves are in the Haynesville Shale, Eagle Ford Shale, Fayetteville Shale and Elm Grove/Caspiana Fields. Production for the fourth quarter of 2009 averaged 598 million cubic feet of natural gas equivalent (Mmcfe) per day (Mmcfe/d). Full year 2009 production averaged 502 Mmcfe/d compared to 305 Mmcfe/d in 2008. Our total operating revenues for 2009 were approximately $1.1 billion.
We seek to maintain a portfolio of long-lived, lower risk properties in resource-style plays, which typically are characterized by lower geological risk and a large inventory of identified drilling opportunities. We focus on properties within our core operating areas that we believe have significant development and exploration opportunities and where we can apply our technical experience and economies of scale to increase production and proved reserves while lowering lease operating costs. We continue to expand our leasehold position in resource-style natural gas plays within our core operating areas, particularly in the Haynesville and Bossier Shales in North Louisiana and East Texas and the Eagle Ford Shale in South Texas. We expect to continue to grow our production and reserves predominantly in resource-style, tight-gas areas.
Recent Developments
Permian Basin Sale
On October 30, 2009, we closed the previously announced sale of our Permian Basin properties for $376 million in cash, before customary closing adjustments. The effective date of the sale was July 1, 2009. Proceeds from the sale were recorded as a reduction to the carrying value of our full cost pool. In conjunction with the closing of this sale, we deposited the remaining net proceeds of $331 million with a qualified intermediary to facilitate potential like-kind exchange transactions ($37.6 million was previously received as a deposit). As of December 31, 2009, $213.7 million remained with the intermediary.
Senior Revolving Credit Facility
On October 14, 2009, we entered into our Fourth Amended and Restated Senior Revolving Credit Agreement (the Fourth Amendment), which amended and restated our senior revolving credit agreement (Senior Credit Agreement). The Fourth Amendment is a $2.0 billion facility with a borrowing base of $1.5 billion, $1.2
5
Table of Contents
Index to Financial Statements
billion of which relates to our oil and natural gas business and up to $300 million (currently limited as described below) of which relates to our midstream business. The $1.2 billion borrowing base attributable to our oil and natural gas properties was reduced $200 million to $1.0 billion upon the closing of the sale of the Permian Basin properties on October 30, 2009. The portion of the borrowing base which relates to our oil and natural gas business will be redetermined on a semi-annual basis (we and the lenders also each have the right to one annual interim unscheduled redetermination) and adjusted based on our oil and natural gas reserves, other indebtedness and other relevant factors. The component of the borrowing base related to our midstream business is limited to the lesser of $300 million or 3.5 times our midstream segment EBITDA (as defined in the Senior Credit Agreement), and is determined quarterly. Amounts outstanding under the Fourth Amendment bear interest at specified margins over the London Interbank Offered Rate (LIBOR) of 2.25% to 3.25% for Eurodollar loans or at specified margins over the Alternative Base Rate (ABR) of 0.75% to 1.75% for ABR loans. The margins fluctuate based upon our utilization of the facility. Our Senior Credit Agreement has a borrowing base of $1.2 billion at December 31, 2009.
2010 Capital budget
Our 2010 capital budget is focused on the development of non-proved reserve locations in our Haynesville, Bossier, Eagle Ford and Fayetteville Shale plays so that we can hold our acreage in these areas. We also believe these projects offer us the potential for high internal rates of return and reserve growth. Currently we plan to spend approximately $1.45 billion on drilling and completions during 2010, of which $900 million has been allocated to our Haynesville and Bossier Shale properties, $350 million to our Eagle Ford Shale properties, $100 million to our Fayetteville Shale properties and $100 million to our remaining properties. Our midstream segment will have an estimated capital program of $250 million. Additionally, we expect to spend between $100 million and $300 million on ongoing leasing activities. Our future drilling plans are subject to change based upon various factors, some of which are beyond our control, including drilling results, oil and natural gas prices, the availability and cost of capital, drilling and production costs, availability of drilling services and equipment, gathering system and pipeline transportation constraints and regulatory approvals.
We expect to fund our 2010 capital budget with cash flows from operations, proceeds from potential asset dispositions, and additional borrowings under our Senior Credit Agreement. We strive to maintain financial flexibility and may access capital markets as necessary to maintain substantial borrowing capacity under our Senior Credit Agreement, facilitate drilling on our large undeveloped acreage position and permit us to selectively expand our acreage position and infrastructure projects. In the event our cash flows or proceeds from potential asset dispositions are materially less than anticipated and other sources of capital we historically have utilized are not available on acceptable terms, we may curtail our capital spending.
Bossier Shale
We have been evaluating the Bossier Shale in North Louisiana and East Texas as a viable shale gas reservoir using an extensive data set that includes digital well logs, core analysis, and, most recently, the results of well tests by industry partners. As a result of this evaluation we currently believe that the area of prospective commercial production within our current leasehold acreage is approximately 122,000 net acres and that the rock quality is similar to that of the Haynesville Shale in a limited area of the formation.
Pending technological advances that would allow multiple zones to be completed with a single horizontal wellbore, the Bossier Shale will require wellbores independent of the Haynesville Shale. We expect to spud our first Bossier Shale horizontal well, in late first quarter 2010. Initial results from that test well should be available late in the second quarter. We are also participating in a Lower Bossier Shale test well through our joint venture in the East Texas portion of the play. The well has reached total depth and should begin completion operations shortly. We anticipate that these activities, along with an industry-wide increase in Bossier Shale drilling, should provide support for expansion of drilling activities in the Bossier Shale play.
6
Table of Contents
Index to Financial Statements
Business Strategy
Our primary objective is to increase stockholder value by focusing on the continued development of our existing properties and selectively increasing our position within our core operating areas, with a special emphasis on expanding our resource-style properties. Our strategy emphasizes:
| • | Concentrated portfolio of natural gas properties—We focus on natural gas properties within our core operating areas which we believe have significant development and exploration opportunities and where we can apply our technical experience and economies of scale. Our properties are located primarily in North Louisiana, East Texas, South Texas, and the Arkoma Basin of Arkansas. |
| • | Attractive undeveloped reserves—We seek to maintain a portfolio of long-lived, lower risk properties focused on resource-style plays within our core operating areas. Resource-style plays are typically characterized by lower geological risk and a large inventory of identified drilling opportunities, and include the Haynesville and Bossier Shales in North Louisiana and East Texas, the Fayetteville Shale in Arkansas and the Eagle Ford Shale in South Texas. We believe these properties have the potential to contribute significant production and reserves over the long term. |
| • | Reduce operating costs—We focus on reducing the per unit operating costs associated with our properties and have been successful in lowering our lease operating expenses from $0.56 per Mcfe in 2007 to $0.47 per Mcfe in 2008 and $0.43 per Mcfe in 2009. |
| • | Divestment of non-core properties—We continually evaluate our property base to identify opportunities to divest non-core, higher cost or less productive properties with limited development potential. This strategy allows us to focus on a portfolio of core properties with significant potential to increase our proved reserves and production and reduce our operating costs. To allow us to concentrate on our core properties and further enhance our liquidity position, we sold our Permian Basin assets during the fourth quarter of 2009 and we have identified several potential asset dispositions during 2010, which may include a transaction involving our midstream business, divesting our Terryville Field in northwest Louisiana, divesting our interest in the West Edmond Hunton Lime Unit in central Oklahoma, as well as divesting other non-core assets. |
| • | Maintenance of financial flexibility—We strive to maintain financial flexibility by balancing our financial resources with our plans to develop our key properties and pursuit of opportunities for growth and expansion. We intend to maintain substantial borrowing capacity under our Senior Credit Agreement to facilitate drilling on our large undeveloped acreage position in resource-style plays, permit us to selectively expand our position in these plays and expand our infrastructure projects. We may access capital markets as necessary to maintain substantial borrowing capacity under our Senior Credit Agreement. |
Oil and Natural Gas Reserves
Estimates of proved reserves at December 31, 2009, 2008, and 2007 were prepared by Netherland, Sewell & Associates, Inc. (Netherland, Sewell), our independent consulting petroleum engineers. The technical persons responsibile for preparing the reserve estimates are independent petroleum engineers and geoscientists that meet the requirements regarding qualifications, independence, objectivity, and confidentiality set forth in the Standards Pertaining to the Estimating and Auditing of Oil and Gas Reserves Information promulgated by the Society of Petroleum Engineers. Our Board of Directors has established an independent reserve committee composed of three outside directors, all of whom have experience in energy company reserve evaluations. The reserve committee is charged with ensuring the integrity of the process of selection and engagement of the independent engineering firm.
The reserves information in this Form 10-K represents only estimates. There are a number of uncertainties inherent in estimating quantities of proved reserves, including many factors beyond our control, such as commodity pricing. Reserve engineering is a subjective process of estimating underground accumulations of oil and natural gas that cannot be measured in an exact manner. The accuracy of any reserve estimate is a function of
7
Table of Contents
Index to Financial Statements
the quality of available data and of engineering and geological interpretation and judgment. As a result, estimates of different engineers may vary. In addition, results of drilling, testing and production subsequent to the date of an estimate may lead to revising the original estimate. Accordingly, initial reserve estimates are often different from the quantities of oil and natural gas that are ultimately recovered. The meaningfulness of such estimates depends primarily on the accuracy of the assumptions upon which they were based. Except to the extent we acquire additional properties containing proved reserves or conduct successful exploration and development activities or both, our proved reserves will decline as reserves are produced. For additional information regarding estimates of proved reserves, the preparation of such estimates by Netherland, Sewell and other information about our oil and natural gas reserves, see Item 8. Consolidated Financial Statements and Supplementary Data—“Supplemental Oil and Gas Information (Unaudited).”
Proved reserve estimates are based on the unweighted arithmetic average prices on the first day of each month for the 12-month period ended December 31, 2009. Average prices as of that date were as follows: West Texas Intermediate (WTI) posted price of $57.65 per barrel (Bbl) for oil and natural gas liquids, adjusted by lease for quality, transportation fees, and regional price differentials and a Henry Hub spot market price of $3.87 per million British thermal unit (Mmbtu) for natural gas, as adjusted by lease for energy content, transportation fees, and regional price differentials. All prices and costs associated with operating wells were held constant in accordance with the amended United States Securities and Exchange Commission (SEC) guidelines which were effective for financial statements for periods ending on or after December 31, 2009. The following table presents certain information as of December 31, 2009.
| Mid-Continent Region |
Western Region |
Total | ||||
| Proved Reserves at Year End (Bcfe) (1) |
||||||
| Developed |
802.1 | 103.0 | 905.1 | |||
| Undeveloped |
1,583.0 | 262.0 | 1,845.0 | |||
| Total |
2,385.1 | 365.0 | 2,750.1 | |||
| (1) | Oil and natural gas liquids are converted to equivalent gas reserves with a 6:1 equivalent ratio. |
The following table sets forth the number of productive oil and natural gas wells in which we owned an interest as of December 31, 2009 and 2008. Shut-in wells currently not capable of production are excluded from producing well information.
| Years Ended December 31, | ||||||||
| 2009 | 2008 | |||||||
| Gross | Net(1) | Gross | Net(1) | |||||
| Oil |
343.0 | 72.8 | 2,196.0 | 317.9 | ||||
| Natural Gas |
4,687.0 | 1,703.2 | 5,098.0 | 2,320.2 | ||||
| Total |
5,030.0 | 1,776.0 | 7,294.0 | 2,638.1 | ||||
| (1) | Net wells represent our working interest share of each well. The term “net” as used in “net production” throughout this document refers to amounts that include only acreage or production that we own and produce to our interest, less royalties and production due to others. |
Oil and Natural Gas Segment
During the fourth quarter of 2009, we made a strategic shift in focus on and allocation of resources to our midstream division. As a result, we identified two reportable segments: oil and natural gas and midstream. A further description of our operating segments is included in Item 8. Consolidated Financial Statements and Supplementary Data—Note 13, “Segments”.
8
Table of Contents
Index to Financial Statements
Core Operating Regions
Mid-Continent Region
In the Mid-Continent Region, we concentrate our drilling program primarily in North Louisiana, East Texas and in the Fayetteville Shale in the Arkoma Basin. We believe our Mid-Continent Region operations provide us with a solid base for future production and reserve growth. During 2009, we drilled 573 wells in this region (of which 111 were operated and 462 were non-operated), and all but one well in the Fayetteville Shale was successful. In 2010, we plan to drill approximately 170 to 180 operated wells in this region and an additional 500 - 600 non-operated wells which are dependent upon other operators for execution. In 2009, we produced 152 Bcfe in this region, or 416 Mmcfe/d. As of December 31, 2009, approximately 87% of our proved reserves, or 2,385 Bcfe, were located in our Mid-Continent Region.
| • | Haynesville Shale—The Haynesville Shale has become one of the most active natural gas plays in the United States. This area is defined by a shale formation located approximately 1,500 feet below the base of the Cotton Valley formation at depths ranging from approximately 10,500 feet to 13,000 feet. The formation is as much as 300 feet thick and is composed of an organic rich black shale. It is located across numerous parishes in Northwest Louisiana, primarily in Caddo, Bossier, Red River, DeSoto, Webster and Bienville parishes and also in East Texas, primarily in Harrison, Panola, Shelby and Nacogdoches counties. Our Elm Grove/Caspiana acreage position is located near what we believe is the center of the play. We currently own leasehold interests in approximately 360,000 net acres in the area we currently believe to be prospective for the Haynesville Shale. We own varying working and net revenue interests in this area. |
Our current drilling and completion methodology focuses on completing wells with longer laterals and maximizing the number of fracture stages, spaced approximately 325 feet apart. The objective of this technique is to minimize the total number of wells required to effectively drain the reservoir, resulting in lower overall development costs. We are currently targeting lateral lengths between 4,300 feet and 4,800 feet with up to 15 fracture stages. At year-end 2009, we had 12 operated horizontal rigs in the Haynesville Shale. Spud-to-first sales averaged approximately 60 days during 2009.
As of December 31, 2009, we had approximately 70 operated wells on production in North Louisiana producing approximately 480 Mmcfe/d gross. With the exception of two wells that had mechanical issues, the average initial production of these wells was approximately 18 Mmcfe/d. Actual decline rates may differ significantly.
In 2009, we produced 77 net Bcfe, or 211 Mmcfe/d. As of December 31, 2009, proved reserves for this field were approximately 1,529 Bcfe, of which approximately 19% were classified as proved developed and approximately 81% as proved undeveloped. The proved reserves include 160 proved developed wells and 419 proved undeveloped locations. During 2009, we drilled 184 wells (73 operated and 111 non-operated), all of which were successful. We plan to drill 110 to 120 operated wells in this area in 2010, with nine to ten wells expected to be completed per month. We have preliminarily budgeted for an additional 200 non-operated wells in 2010 which will be dependent upon other operators for execution. We expect to operate an average of 17 rigs in the play in 2010, with an emphasis on growing production and reserves while at the same time holding our acreage position.
| • | Bossier Shale—During 2009, the combination of wells we have drilled in the Haynesville Shale and wells drilled by other operators provided sufficient petrophysical and geochemical data to support the premise that there are potentially significant reserves in the Bossier Shale. The Bossier Shale is located approximately 200 feet to 400 feet above the Haynesville Shale. The net thickness of the shale is approximately the same as the Haynesville Shale and it also has many of the same reservoir parameters as the Haynesville Shale, particularly in the southern area of the Haynesville Shale trend. We currently own leasehold interests in approximately 122,000 net acres in the area that we currently believe to be prospective for the Bossier Shale. We have not drilled a horizontal well in the Bossier Shale yet, but other operators have completed a number of wells that have helped further determine the level of prospectivity and overall area that could prove to result in commercially viable gas reserves. We intend |
9
Table of Contents
Index to Financial Statements
| to drill a number of Bossier Shale horizontal wells during 2010. We own varying working and net revenue interests in this area. As of December 31, 2009, we did not have any proved reserves for the Bossier Shale. |
| • | Elm Grove and Caspiana Fields—Located primarily in Bossier and Caddo Parishes of North Louisiana, our Elm Grove and Caspiana fields produce from the Hosston and Cotton Valley formations. These zones are composed of low permeability sandstones that require fracture stimulation treatments to produce. We own varying working and net revenue interests in these fields. We produced 35 Bcfe in 2009 in these fields, or 96 Mmcfe/d. As of December 31, 2009, proved reserves for the Elm Grove/Caspiana fields were approximately 444 Bcfe, of which approximately 64% were classified as proved developed, and 36% was classified as proved undeveloped. The proved reserves include 1,039 proved developed wells and 360 proved undeveloped locations. |
During 2009, we drilled one operated well and 13 non-operated wells, all of which were successful. While this area still comprises a significant portion of our reserves and production, the vast majority of the capital that we previously committed to these fields was allocated to the Haynesville Shale during 2009 as part of our plan to hold our Haynesville Shale acreage. For 2010, we have budgeted capital to drill approximately 60 wells, which includes vertical wells targeting the Hosston and Cotton Valley Sands and horizontal wells in the Cotton Valley Sands.
| • | Fayetteville Shale—We have assembled a position of approximately 157,000 net acres in the Fayetteville Shale, which we believe holds significant potential for production and reserve growth. The Fayetteville Shale is located in the Arkoma Basin in Arkansas, at a depth of approximately 1,500 feet to 6,500 feet and ranging in thickness from 100 feet to 500 feet. The formation is a Mississippian-age shale that has similar geologic characteristics to the Barnett Shale in the Fort Worth Basin of North Texas. Drilling in the play began in 2004 and has accelerated rapidly during the past five years. Currently, we are drilling horizontal wells with lateral lengths of 2,500 feet to 3,000 feet and utilizing slickwater fracture stimulation completions. During 2009 the amount of non-operated activity increased significantly. While we have continued to achieve results that were in line with previous years, there were nine times more non-operated wells (327) than operated wells (35) in 2009. Additionally, of the 79 Mmcfe/d that we were producing during the fourth quarter of 2009, the amount of operated versus non-operated net production was approximately equal. We own varying working and net revenue interests in this area. |
As of December 31, 2009, proved reserves for this field were approximately 299 Bcfe, of which approximately 54% were classified as proved developed and approximately 46% as proved undeveloped. The proved reserves include 863 proved developed wells and 394 proved undeveloped locations. During 2009, we drilled 362 wells, 361 of which were successful. In 2010, we plan to drill approximately 370 wells in this area (15 operated and 355 non-operated). We produced 28 Bcfe in 2009 in this area, or 77 Mmcfe/d.
Western Region
The majority of the Western Region assets at the end of 2009 were in the Hawkville Field which is located in the Eagle Ford Shale play in South Texas. The Western Region also contains property that is located in Oklahoma plus other properties located in the Anadarko and Arkoma Basins. We believe our Eagle Ford Shale properties provide us with future production and reserve growth. Including the contribution from the Permian Basin properties that were sold in October 2009, net production from the region was 31 Bcfe (86 Mmcfe/d) in 2009. During 2009 we drilled 53 productive wells (24 operated and 29 non-operated) with no dry holes. As of December 31, 2009, the proved reserves for the region were approximately 365 Bcfe, or 13% of our total proved reserves. There are 82 operated wells budgeted for 2010 and an additional 20 to 30 non-operated wells.
| • | Eagle Ford Shale—We have approximately 310,000 net acres under lease or option to lease in the Eagle Ford Shale in the Hawkville Field, located in LaSalle and McMullen Counties, Texas and the Red Hawk area located in Zavala County, Texas. Our working interest and net revenue interest for the |
10
Table of Contents
Index to Financial Statements
| majority of the operated wells are 90% and 68%, respectively. The working interest for the non-operated wells range from 10% to 45% and will average over 35% for the majority of the non-op program. |
We have 20 operated and four non-operated producing wells plus four additional wells that are pending completion and three wells that were drilling at year-end in this field. Our Eagle Ford Shale wells have averaged a true vertical depth that ranges from 10,850 feet to 12,150 feet. We have encountered a formation that has an average pay thickness of over 200 feet. Our wells have been drilled with a horizontal section that is averaging approximately 4,000 feet in length. The wells are cased hole completed and fracture stimulated with an average of fourteen stages. Nine of the current completions produce no condensate and they had an average initial production rate of 9.5 million cubic feet of natural gas per day (Mmcf/d). Thirteen of the current completions produce condensate and these wells had an average initial production rate of 7 Mmcf/d and 280 barrels of oil per day (Bo/d), or 8.7 Mmcfe/d.
Gross operated production from the Eagle Ford Shale is currently 57 Mmcf/d and 1,600 Bo/d (40 Mmcfe/d net). During 2009, we produced 7 Bcfe or 20 Mmcfe/d from this field. As of December 31, 2009, the proved reserves for this field were approximately 288 Bcfe of which approximately 14% were classified as proved developed and approximately 86% as proved undeveloped. The proved reserves include 28 proved developed wells and 136 proved undeveloped locations. Twenty four operated and two non-operated Hawkville wells were drilled in 2009 and 60 operated plus 22 non-operated Hawkville wells are budgeted for 2010.
| • | Permian Basin Properties—We sold our Permian Basin properties on October 30, 2009 for $376 million before customary closing adjustments. The Waddell Ranch Complex, Crane County, Texas, Sawyer Field, Sutton County, Texas, Jalmat Field, Lea County, New Mexico and TXL North Unit, Ector County, Texas accounted for 83% of the proved reserves and 81% of the net production from our Permian Basin properties. In 2009, 11 wells were drilled with a 100% success rate and the combined production from the fields was 10 Bcfe or 27 Mmcfe/d. The Permian Basin properties had estimated proved reserves of approximately 168 Bcfe. |
Midstream Segment
During the fourth quarter of 2009, we made a strategic decision to focus on and allocate resources to our midstream division. As a result, we identified two reportable segments: oil and natural gas and midstream. A further description of our operating segments is included in Item 8. Consolidated Financial Statements and Supplementary Data—Note 13, “Segments”.
In 2008, through our subsidiary, Hawk Field Services, we initiated construction of our own gathering systems and treating facilities to service our operated wells and third party production from the Fayetteville and Haynesville Shales. Throughout 2009, we have continued to expand our facilities serving this area and initiated the development of a gathering system and treating facilities serving the Eagle Ford Shale. Our midstream business allows us to potentially improve our returns by providing greater control over the completion of our wells and the transportation of our production for delivery into major intrastate or interstate pipelines. Also, to allow producers to maximize price realizations, we have designed our systems to provide access to multiple pipeline interconnects.
| • | Haynesville Shale—We are building high pressure gathering systems to transport our production to various intrastate and interstate pipelines and we are constructing several centralized treating facilities to remove carbon dioxide (CO2) before it is delivered into those pipelines connected to our system. As of December 31, 2009, we had constructed approximately 150 miles of primarily 16-inch diameter pipeline in several of our drilling areas that we expect will optimize our operational control and access to natural gas markets. Our Haynesville Shale system throughput was 445 Mmcf/d with a capacity of 1.4 billion cubic feet of natural gas per day (Bcf/d) and a treating capacity of 735 Mmcf/d as of |
11
Table of Contents
Index to Financial Statements
| December 31, 2009. We expect to have 375 miles of pipelines completed by the end of 2010 with a total system throughput capacity of approximately 2.0 Bcf/d with associated treating capacity of 1.1 Bcf/d. |
| • | Eagle Ford Shale—During 2009, we initiated construction of a high pressure gathering system to transport our production to various intrastate and interstate pipelines. As of December 31, 2009, we had built approximately 62 miles of primarily 16-inch diameter pipeline in several of our drilling areas that we expect will optimize our operational control and access to natural gas markets. Our Eagle Ford Shale system has a throughput capacity of 550 Mmcf/d and a treating capacity of 100 Mmcf/d as of December 31, 2009. We expect to have 88 miles completed by the end of 2010 with a total system throughput capacity of approximately 550 Mmcf/d with associated treating capacity of 250 Mmcf/d. |
| • | Fayetteville Shale—To support our operations, we completed construction of three separate gathering systems which represent approximately 106 miles of pipelines that gather natural gas from our operated wells and transport it to interconnects with various interstate pipelines. As of December 31, 2009, our Fayetteville system consists of six-inch to 16-inch diameter pipelines with throughput capacity of approximately 200 Mmcf/d. We expect to have 112 miles completed by the end of 2010 with a total system throughput capacity of approximately 270 Mmcf/d with associated treating capacity of 55 Mmcf/d. |
Risk Management
We have designed a risk management policy to provide for the use of derivative instruments to provide partial protection against certain risks relating to our ongoing business operations, such as commodity price risk and interest rate risk. Derivative contracts are utilized to economically hedge our exposure to price fluctuations and reduce the variability in our cash flows associated with anticipated sales on future oil and natural gas production. We hedge a substantial, but varying, portion of anticipated oil and natural gas production for the next 12-36 months. Periodically, we enter into interest rate swaps to mitigate exposure to market rate fluctuations by converting variable interest rates (such as those on our Senior Credit Agreement) to fixed interest rates.
Our decision on the quantity and price at which we choose to hedge our production is based in part on our view of current and future market conditions. While there are many different types of derivatives available, we typically use oil and natural gas price collars, swap agreements and put options to attempt to manage price risk more effectively. The collar agreements are put and call options used to establish floor and ceiling commodity prices for a fixed volume of production during a certain time period. Periodically, we may pay a fixed premium to increase the floor price above the existing market value at the time we enter into the arrangement. All collar agreements provide for payments to counterparties if the index price exceeds the ceiling and payments from the counterparties if the index price is below the floor. The price swaps call for payments to, or receipts from, counterparties based on whether the market price of oil and natural gas for the period is greater or less than the fixed price established for that period when the swap is put in place. Under put options, we pay a fixed premium to lock in a specified floor price. If the index price falls below the floor price, the counterparty pays us net of the fixed premium. If the index price rises above floor price, we pay the fixed premium.
It is our policy to enter into derivative contracts, including interest rate swaps, only with counterparties that are creditworthy financial institutions deemed by management as competent and competitive market makers. Each of the counterparties to our derivative contracts is a lender in our Senior Credit Agreement. We will continue to evaluate the benefit of employing derivatives in the future. See Item 7A. Quantitative and Qualitative Disclosures about Market Risk for additional information.
Oil and Natural Gas Operations
Our principal properties consist of developed and undeveloped oil and natural gas leases and the reserves associated with these leases. Generally, developed oil and natural gas leases remain in force as long as
12
Table of Contents
Index to Financial Statements
production is maintained. Undeveloped oil and natural gas leaseholds are generally for a primary term of three to five years. In most cases, the term of our undeveloped leases can be extended by paying delay rentals or by producing oil and natural gas reserves that are discovered under those leases.
The table below sets forth the results of our drilling activities for the periods indicated:
| Years Ended December 31, | ||||||||||||
| 2009 | 2008 | 2007 | ||||||||||
| Gross | Net | Gross | Net | Gross | Net | |||||||
| Exploratory Wells: |
||||||||||||
| Productive (1) |
601 | 156.8 | 555 | 183.0 | 292 | 127.4 | ||||||
| Dry |
1 | 0.2 | 12 | 2.0 | 12 | 5.6 | ||||||
| Total Exploratory |
602 | 157.0 | 567 | 185.0 | 304 | 133.0 | ||||||
| Development Wells: |
||||||||||||
| Productive (1) |
24 | 5.1 | 172 | 82.4 | 113 | 72.2 | ||||||
| Dry |
— | — | — | — | 3 | 1.3 | ||||||
| Total Development |
24 | 5.1 | 172 | 82.4 | 116 | 73.5 | ||||||
| Total Wells: |
||||||||||||
| Productive (1) |
625 | 161.9 | 727 | 265.4 | 405 | 199.6 | ||||||
| Dry |
1 | 0.2 | 12 | 2.0 | 15 | 6.9 | ||||||
| Total |
626 | 162.1 | 739 | 267.4 | 420 | 206.5 | ||||||
| (1) | Although a well may be classified as productive upon completion, future changes in oil and natural gas prices, operating costs and production may result in the well becoming uneconomical, particularly exploratory wells where there is no production history. |
We own interests in developed and undeveloped oil and natural gas acreage in the locations set forth in the table below. These ownership interests generally take the form of working interests in oil and natural gas leases that have varying terms. The following table presents a summary of our acreage interests as of December 31, 2009:
| Developed Acreage | Undeveloped Acreage | Total Acreage | ||||||||||
| Gross | Net | Gross | Net | Gross | Net | |||||||
| State |
||||||||||||
| Alabama |
— | — | 22,604 | 18,836 | 22,604 | 18,836 | ||||||
| Arkansas |
68,375 | 50,955 | 164,266 | 125,363 | 232,641 | 176,318 | ||||||
| Indiana |
— | — | 7,676 | 6,984 | 7,676 | 6,984 | ||||||
| Kansas |
14,555 | 9,802 | 699 | 385 | 15,254 | 10,187 | ||||||
| Louisiana |
144,194 | 95,150 | 249,415 | 217,132 | 393,609 | 312,282 | ||||||
| Oklahoma |
226,447 | 86,957 | 9,855 | 4,193 | 236,302 | 91,150 | ||||||
| Texas |
149,590 | 72,220 | 431,037 | 299,262 | 580,627 | 371,482 | ||||||
| Total Acreage |
603,161 | 315,084 | 885,552 | 672,155 | 1,488,713 | 987,239 | ||||||
At December 31, 2009, we had estimated proved reserves of approximately 2,750 Bcfe comprised of 2,700 Bcf of natural gas and natural gas liquids and 8 MMBbls of oil. The following table sets forth, at December 31, 2009, these reserves:
| Proved Developed |
Proved Undeveloped |
Total Proved | ||||
| Gas (Bcf) (1) |
887.6 | 1,812.4 | 2,700.0 | |||
| Oil (MMBbls) |
2.9 | 5.4 | 8.3 | |||
| Equivalent (Bcfe) |
905.1 | 1,845.0 | 2,750.1 |
| (1) | Amounts include natural gas liquids (calculated with a 6:1 equivalent ratio). |
13
Table of Contents
Index to Financial Statements
At December 31, 2009, our estimated proved undeveloped (PUD) reserves were approximately 1,845 Bcfe, a significant increase over the previous year’s estimate of 626 Bcfe. The net increase of 1,219 Bcfe is comprised of additions of 1,509 Bcfe, primarily attributable to drilling in the Haynesville, Eagle Ford, and Fayetteville Shales, and partially offset by a net reduction of approximately 290 Bcfe, primarily relating to the effect of lower gas prices on the previous year’s PUD reserves and the sale of our Permian Basin properties. During 2009, the majority of our total drilling and completion capital was allocated to drilling unproved leases in the Haynesville Shale to hold acreage. Approximately $34 million in drilling and completion capital expenditures went toward developing approximately 15 Bcfe of PUD reserves. As of December 31, 2009 all of our PUD reserves have been included in the reserve report for less than five years and over 90 percent have been included for less than two years.
The estimates of quantities of proved reserves above were made in accordance with the definitions contained in SEC Release No. 33-8995, Modernization of Oil and Gas Reporting. For additional information on our oil and natural gas reserves, see Item 8. Consolidated Financial Statements and Supplementary Data—“Supplementary Oil and Gas Information (Unaudited).”
We account for our oil and natural gas producing activities using the full cost method of accounting in accordance with SEC regulations. Accordingly, all costs incurred in the acquisition, exploration, and development of proved oil and natural gas properties, including the costs of abandoned properties, dry holes, geophysical costs, and annual lease rentals are capitalized. All general and administrative corporate costs unrelated to drilling activities are expensed as incurred. Sales or other dispositions of oil and natural gas properties are accounted for as adjustments to capitalized costs, with no gain or loss recorded unless the ratio of cost to proved reserves would significantly change. Depletion of evaluated oil and natural gas properties is computed on the units of production method based on proved reserves. The net capitalized costs of evaluated oil and natural gas properties are subject to a quarterly full cost ceiling test. We recorded a full cost ceiling impairment before income taxes of approximately $1.7 billion and $1.0 billion at March 31, 2009 and December 31, 2008, respectively, at which time the West Texas Intermediate posted price was $49.66 and $41.00 per barrel for oil and the Henry Hub spot market price was $3.63 and $5.71 per Mmbtu for natural gas. At December 31, 2009, our net book value of oil and natural gas properties exceeded the ceiling amount based on the unweighted arithmetic average of the first day of each month for the 12-month period ended December 31, 2009 WTI posted price of $57.65 per barrel and the unweighted arithmetic average of the first day of each month for the 12-month period ended December 31, 2009 Henry Hub price of $3.87 per Mmbtu in accordance with SEC Release No. 33-8995, Modernization of Oil and Gas Reporting. As a result, we recorded a full cost ceiling impairment before income taxes of approximately $106 million and $65 million after taxes.
Capitalized costs of our evaluated and unevaluated properties at December 31, 2009, 2008 and 2007 are summarized as follows:
| December 31, | ||||||||||||
| 2009 | 2008 | 2007 | ||||||||||
| (In thousands) | ||||||||||||
| Oil and natural gas properties (full cost method): |
||||||||||||
| Evaluated |
$ | 5,984,765 | $ | 4,894,357 | $ | 3,247,304 | ||||||
| Unevaluated |
2,512,453 | 2,287,968 | 677,565 | |||||||||
| Gross oil and natural gas properties |
8,497,218 | 7,182,325 | 3,924,869 | |||||||||
| Less—accumulated depletion |
(4,329,485 | ) | (2,111,038 | ) | (769,197 | ) | ||||||
| Net oil and natural gas properties |
$ | 4,167,733 | $ | 5,071,287 | $ | 3,155,672 | ||||||
14
Table of Contents
Index to Financial Statements
The following table summarizes our oil and natural gas production volumes, average sales price per unit and average costs per unit. In addition, this table summarizes our production for each field that contains 15% or more of our total proved reserves:
| Years Ended December 31, | |||||||||
| 2009 | 2008 | 2007 | |||||||
| Production: |
|||||||||
| Natural gas—Mmcf (1): |
|||||||||
| Haynesville Shale |
77,117 | 6,243 | — | ||||||
| Elm Grove / Caspiana |
34,254 | 42,599 | 33,862 | ||||||
| Other |
62,665 | 53,431 | 65,644 | ||||||
| Total |
174,036 | 102,273 | 99,506 | ||||||
| Oil—MBbl |
|||||||||
| Haynesville Shale |
— | — | — | ||||||
| Elm Grove / Caspiana |
133 | 151 | 152 | ||||||
| Other |
1,387 | 1,403 | 2,664 | ||||||
| Total |
1,520 | 1,554 | 2,816 | ||||||
| Natural gas equivalent—Mmcfe |
183,156 | 111,597 | 116,402 | ||||||
| Average daily production—Mmcfe |
502 | 305 | 319 | ||||||
| Average sales price per unit: (2) |
|||||||||
| Natural Gas—per Mcf (1) |
$ | 3.70 | $ | 8.56 | $ | 6.92 | |||
| Oil—per Bbl |
56.15 | 95.16 | 68.84 | ||||||
| Natural gas equivalent—per Mcfe |
3.99 | 9.17 | 7.58 | ||||||
| Average cost per Mcfe: |
|||||||||
| Production: |
|||||||||
| Lease operating |
$ | 0.43 | $ | 0.47 | $ | 0.56 | |||
| Workover and other |
0.02 | 0.05 | 0.07 | ||||||
| Taxes other than income |
0.32 | 0.42 | 0.50 | ||||||
| Gathering, transportation and other: |
|||||||||
| Oil and natural gas |
0.38 | 0.39 | 0.28 | ||||||
| Midstream |
0.11 | 0.03 | — | ||||||
| (1) | Approximately 1%, 2% and 4% of natural gas production represents natural gas liquids (calculated with a 6:1 equivalent ratio) with an average price of $28.20 per Bbl, $56.63 per Bbl and $43.70 per Bbl for the years ended December 31, 2009, 2008 and 2007, respectively. |
| (2) | Amounts exclude the impact of cash paid or received on settled commodities derivative contracts as we did not elect to apply hedge accounting. |
The 2009, 2008 and 2007 average oil and natural gas sales prices above do not reflect the impact of cash paid on, or cash received from, settled derivative contracts as these amounts are reflected as “Other income (expenses)” in the consolidated statements of operations, consistent with our decision not to elect hedge accounting. Including this impact 2009, 2008 and 2007 average natural gas sales prices were $5.83, $8.13 and $7.41 per thousand cubic feet (Mcf) and our average oil sales prices were $58.86, $74.82 and $67.03 per Bbl, respectively.
Competitive Conditions in the Business
The oil and natural gas industry is highly competitive and we compete with a substantial number of other companies that have greater financial and other resources. Many of these companies explore for, produce and market oil and natural gas, as well as carry on refining operations and market the resultant products on a
15
Table of Contents
Index to Financial Statements
worldwide basis. The primary areas in which we encounter substantial competition are in locating and acquiring desirable leasehold acreage for our drilling and development operations, locating and acquiring attractive producing oil and natural gas properties, obtaining sufficient rig availability, obtaining purchasers and transporters of the oil and natural gas we produce and hiring and retaining key employees. There is also competition between oil and natural gas producers and other industries producing energy and fuel. Furthermore, competitive conditions may be substantially affected by various forms of energy legislation and/or regulation considered from time to time by the government of the United States. It is not possible to predict the nature of any such legislation or regulation which may ultimately be adopted or its effects upon our future operations. Such laws and regulations may substantially increase the costs of exploring for, developing or producing oil and natural gas and may prevent or delay the commencement or continuation of a given operation.
Other Business Matters
Markets and Major Customers
In 2009, two individual purchasers of our production each accounted for in excess of 10% of our total sales, collectively representing 25% of our total sales. In 2008, two individual purchasers of our production each accounted for in excess of 10% of our total sales, collectively representing 30% of our total sales. In 2007, we had one purchaser of our production that accounted for 10% of our total sales. We do not believe the loss of any one of our purchasers would materially affect our ability to sell the oil and natural gas we produce. We believe other purchasers are available in our areas of operations.
Seasonality of Business
Weather conditions affect the demand for, and prices of, natural gas and can also delay drilling activities, disrupting our overall business plans. Demand for natural gas is typically higher during the winter, resulting in higher natural gas prices for our natural gas production during our first and fourth fiscal quarters. Due to these seasonal fluctuations, our results of operations for individual quarterly periods may not be indicative of the results that we may realize on an annual basis.
Operational Risks
Oil and natural gas exploration and development involves a high degree of risk, which even a combination of experience, knowledge and careful evaluation may not be able to overcome. There is no assurance that we will discover or acquire additional oil and natural gas in commercial quantities. Oil and natural gas operations also involve the risk that well fires, blowouts, equipment failure, human error and other events may cause accidental leakage of toxic or hazardous materials, such as petroleum liquids or drilling fluids into the environment, or cause significant injury to persons or property. In such event, substantial liabilities to third parties or governmental entities may be incurred, the satisfaction of which could substantially reduce available cash and possibly result in loss of oil and natural gas properties. Such hazards may also cause damage to or destruction of wells, producing formations, production facilities and pipeline or other processing facilities.
As is common in the oil and natural gas industry, we will not insure fully against all risks associated with our business either because such insurance is not available or because we believe the premium costs are prohibitive. A loss not fully covered by insurance could have a materially adverse effect on our operating results, financial position or cash flows. For further discussion on risks see Item 1A. Risk Factors.
Regulations
All of the jurisdictions in which we own or operate producing oil and natural gas properties have statutory provisions regulating the exploration for and production of oil and natural gas, including provisions related to permits for the drilling of wells, bonding requirements to drill or operate wells, the location of wells, the method
16
Table of Contents
Index to Financial Statements
of drilling and casing wells, the surface use and restoration of properties upon which wells are drilled, sourcing and disposal of water used in the drilling and completion process, and the plugging and abandonment of wells. Our operations are also subject to various conservation laws and regulations. These include the regulation of the size of drilling and spacing units or proration units, the number of wells which may be drilled in an area, and the unitization or pooling of oil and natural gas properties, as well as regulations that generally prohibit the venting or flaring of natural gas, and impose certain requirements regarding the establishment of maximum allowable rates of production from fields and individual wells. The effect of these regulations is to limit the amount of oil and natural gas that we can produce from our wells and to limit the number of wells or the locations at which we can drill, although we can apply for exceptions to such regulations or to have reductions in well spacing. Failure to comply with applicable laws and regulations can result in substantial penalties. The regulatory burden on the industry increases the cost of doing business and affects profitability. Moreover, each state generally imposes a production or severance tax with respect to the production and sale of oil, natural gas and natural gas liquids within its jurisdiction.
Environmental Regulations
Our operations are subject to stringent federal, state and local laws regulating the discharge of materials into the environment or otherwise relating to health and safety or the protection of the environment. Numerous governmental agencies, such as the United States Environmental Protection Agency, commonly referred to as the EPA, issue regulations to implement and enforce these laws, which often require difficult and costly compliance measures. Failure to comply with these laws and regulations may result in the assessment of substantial administrative, civil and criminal penalties, as well as the issuance of injunctions limiting or prohibiting our activities. In addition, some laws and regulations relating to protection of the environment may, in certain circumstances, impose strict liability for environmental contamination, rendering a person liable for environmental damages and cleanup costs without regard to negligence or fault on the part of that person. Strict adherence with these regulatory requirements increases our cost of doing business and consequently affects our profitability.
Environmental regulatory programs typically regulate the permitting, construction and operations of a facility. Many factors, including public perception, can materially impact the ability to secure an environmental construction or operation permit. Once operational, enforcement measures can include significant civil penalties for regulatory violations regardless of intent. Under appropriate circumstances, an administrative agency can issue a cease and desist order to terminate operations. New programs and changes in existing programs are anticipated, some of which include natural occurring radioactive materials, oil and natural gas exploration and production, waste management, and underground injection of waste material. Environmental laws and regulations have been subject to frequent changes over the years, and the imposition of more stringent requirements could have a material adverse effect on our financial condition and results of operations.
Comprehensive Environmental Response, Compensation and Liability Act and Hazardous Substances
The federal Comprehensive Environmental Response, Compensation and Liability Act, referred to as CERCLA or the Superfund law, and comparable state laws impose liability, without regard to fault, on certain classes of persons that are considered to be responsible for the release of a hazardous substance into the environment. These persons include the current or former owner or operator of the disposal site or sites where the release occurred and companies that disposed or arranged for the disposal of hazardous substances that have been released at the site. Under CERCLA, these persons may be subject to joint and several liability for the costs of investigating and cleaning up hazardous substances that have been released into the environment, for damages to natural resources and for the costs of some health studies. In addition, companies that incur liability frequently confront additional claims because it is not uncommon for neighboring landowners and other third parties to file claims for personal injury and property damage allegedly caused by hazardous substances or other pollutants released into the environment.
17
Table of Contents
Index to Financial Statements
The Solid Waste Disposal Act and Waste Management
The federal Solid Waste Disposal Act, as amended by the Resource Conservation and Recovery Act of 1976, referred to as RCRA, generally does not regulate most wastes generated by the exploration and production of oil and natural gas because that act specifically excludes drilling fluids, produced waters and other wastes associated with the exploration, development or production of oil and natural gas from regulation as hazardous wastes. However, these wastes may be regulated by the EPA or state agencies as non-hazardous wastes as long as these wastes are not commingled with regulated hazardous wastes. Moreover, in the ordinary course of our operations, wastes generated in connection with our exploration and production activities may be regulated as hazardous waste under RCRA or hazardous substances under CERCLA. From time to time, releases of materials or wastes have occurred at locations we own or at which we have operations. These properties and the materials or wastes released thereon may be subject to CERCLA, RCRA and analogous state laws. Under these laws, we have been and may be required to remove or remediate these materials or wastes. At this time, with respect to any properties where materials or wastes may have been released, but of which we have not been made aware, it is not possible to estimate the potential costs that may arise from unknown, latent liability risks.
The Clean Water Act, wastewater and storm water discharges
Our operations are also subject to the federal Clean Water Act and analogous state laws. Under the Clean Water Act, the EPA has adopted regulations concerning discharges of storm water runoff. This program requires covered facilities to obtain individual permits, or seek coverage under a general permit. Some of our properties may require permits for discharges of storm water runoff and, as part of our overall evaluation of our current operations, we will apply for storm water discharge permit coverage and updating storm water discharge management practices at some of our facilities. We believe that we will be able to obtain, or be included under, these permits, where necessary, and make minor modifications to existing facilities and operations that would not have a material effect on us. The Clean Water Act and similar state acts regulate other discharges of wastewater, oil, and other pollutants to surface water bodies, such as lakes, rivers, wetlands, and streams. Failure to obtain permits for such discharges could result in civil and criminal penalties, orders to cease such discharges, and costs to remediate and pay natural resources damages. These laws also require the preparation and implementation of Spill Prevention, Control, and Countermeasure Plans in connection with on-site storage of significant quantities of oil.
The Safe Drinking Water Act, groundwater protection, and the Underground Injection Control Program
The federal Safe Drinking Water Act (SWDA) and the Underground Injection Control (UIC) program promulgated under the SWDA and state programs regulate the drilling and operation of salt water disposal wells. EPA directly administers the UIC program in some states and in others it is delegated to the state for administering. Permits must be obtained before drilling salt water disposal permits, and casing integrity monitoring must be conducted periodically to ensure the casing is not leaking saltwater to groundwater. Contamination of groundwater by oil and natural gas drilling, production, and related operations may result in fines, penalties, and remediation costs, among other sanctions and liabilities under the SWDA and state laws. In addition, third party claims may be filed by landowners and other parties claiming damages for alternative water supplies, property damages, and bodily injury. We engage third parties to provide hydraulic fracturing or other well stimulation services to us in connection with many of the wells for which we are the operator. On June 9, 2009, companion bills entitled the Fracturing Responsibility and Awareness of Chemicals (FRAC) Act of 2009 were introduced in the United States Senate (Senate Bill number 1215) and House of Representatives (House Bill number 2766). These bills would repeal the exemption for hydraulic fracturing from the SDWA, which would have the effect of allowing the EPA to promulgate regulations requiring permits and implementing potential new requirements of hydraulic fracturing under the SDWA. This could, in turn, require state regulatory agencies in states with programs delegated under the SDWA to impose additional requirements on hydraulic fracturing operations. Sponsors of the bills have asserted that chemicals used in the fracturing process may be adversely impacting drinking water supplies. The bills would require persons using hydraulic fracturing to disclose the chemical constituents of their fracturing fluids to a
18
Table of Contents
Index to Financial Statements
regulatory agency, which would make the information public via the internet. This could make it easier for third parties opposing the hydraulic fracturing process to initiate legal proceedings based on allegations that specific chemicals used in the fracturing process are impairing groundwater or causing other damage. These bills, if adopted, could establish an additional level of regulation at the federal or state level that could lead to operational delays or increased operating costs and could result in additional regulatory burdens that could make it more difficult to perform hydraulic fracturing and increase our costs of compliance and doing business. Certain states have adopted, or are considering, similar disclosure legislation.
The Clean Air Act
The federal Clean Air Act and comparable state laws regulate emissions of various air pollutants through air emissions permitting programs and the imposition of other requirements. In addition, the EPA has developed and continues to develop stringent regulations governing emissions of toxic air pollutants at specified sources. Federal and state regulatory agencies can impose administrative, civil and criminal penalties for non-compliance with air permits or other requirements of the federal Clean Air Act and associated state laws and regulations. Our operations, or the operations of service companies engaged by us, may in certain circumstances and locations be subject to permits and restrictions under these statutes for emissions of air pollutants. The EPA proposed in a consent decree, which has not been approved by a federal court, that it will issue by January 31, 2011 a proposal to revise its national emissions standards for hazardous air pollution for crude oil and natural gas production, as well as gas transmission and storage and its new source performance standards for oil and gas production.
Climate change legislation and greenhouse gas regulation
Studies over recent years have indicated that emissions of certain gases may be contributing to warming of the Earth’s atmosphere. In response to these studies, many nations have agreed to limit emissions of “greenhouse gases” or “GHGs” pursuant to the United Nations Framework Convention on Climate Change, and the “Kyoto Protocol.” Methane, a primary component of natural gas, and carbon dioxide, a byproduct of the burning of oil, natural gas, and refined petroleum products, are considered “greenhouse gases” regulated by the Kyoto Protocol. Although the United States is not participating in the Kyoto Protocol, several states have adopted legislation and regulations to reduce emissions of greenhouse gases. Restrictions on emissions of methane or carbon dioxide that may be imposed in various states could adversely affect our operations and demand for our products. Additionally, the United States Supreme Court has ruled, in Massachusetts, et al. v. EPA, that the EPA abused its discretion under the Clean Air Act by refusing to regulate carbon dioxide emissions from mobile sources. As a result of the Supreme Court decision and the change in presidential administrations, on December 7, 2009, the EPA issued a finding that serves as the foundation under the Clean Air Act to issue other rules that would result in federal greenhouse gas regulations and emissions limits under the Clean Air Act, even without Congressional action. As part of this array of new regulations, on September 22, 2009, the EPA also issued a GHG monitoring and reporting rule that requires certain parties, including participants in the oil and natural gas industry, to monitor and report their GHG emissions, including methane and carbon dioxide, to the EPA. The emissions will be published on a register to be made available on the Internet. These regulations may apply to our operations. The EPA has proposed two other rules that would regulate GHGs, one of which would regulate GHGs from stationary sources, and may affect sources in the oil and natural gas exploration and production industry and the pipeline industry. The EPA’s finding, the greenhouse gas reporting rule, and the proposed rules to regulate the emissions of greenhouse gases would result in federal regulation of carbon dioxide emissions and other greenhouse gases, and may affect the outcome of other climate change lawsuits pending in United States federal courts in a manner unfavorable to our industry.
On June 26, 2009, the United States House of Representatives approved adoption of the “American Clean Energy and Security Act of 2009,” also known as the “Waxman-Markey cap-and-trade legislation” or ACESA. On November 5, 2009 the Senate Committee on Environment and Public Works approved the “Clean Energy Jobs and American Power Act of 2009,” authored by John Kerry and Barbara Boxer, that is similar in many ways to ACESA. One of the purposes of these bills is to control and reduce emissions of greenhouse gases in the United States. These
19
Table of Contents
Index to Financial Statements
bills would establish an economy-wide cap on emissions of GHGs in the United States and would require an overall reduction in GHG emissions of 17% to 20% (from 2005 levels) by 2020, and by over 80% by 2050. Under these bills, most sources of GHG emissions would be required to obtain GHG emission “allowances” corresponding to their annual emissions of GHGs. The number of emission allowances issued each year would decline as necessary to meet the overall emission reduction goals of the bills. As the number of GHG emission allowances declines each year, the cost or value of allowances is expected to escalate significantly. The net effect of these bills would be to impose increasing costs on the combustion of carbon-based fuels such as oil, refined petroleum products, and natural gas. President Obama has indicated that he is in support of the adoption of legislation such as the two bills discussed above, and the White House is expending significant efforts to push for the legislation.
Two recent court decisions, one before the United States Second Circuit Court of Appeals and one before the United States Fifth Circuit Court of Appeals (The Fifth Circuit) have allowed cases to proceed. In the first case, Connecticut v. American Electric Power, the Second Circuit ruled that several states and other plaintiffs could continue a suit to impose GHG reductions on several utility defendants, concluding that a political question and standing objections of the defendants did not prohibit the suit from going forward. The Fifth Circuit, in Comer v. Murphy Oil, ruled that plaintiffs could similarly pursue a damage suit and the political question did not prohibit the suit. This case involves claims by plaintiffs who suffered damages from Hurricane Katrina that are seeking to recover damages from certain GHG emitters asserting their emissions contributed to their increased damages. In another case filed in the Texas District Court in Austin on October 6, 2009, a citizens group sued the Texas Commission on Environmental Quality (TCEQ) asserting that the agency was required to regulate carbon dioxide emissions from parties applying for permits under the Texas Clean Air Act. The result of this lawsuit could impose additional regulations on our operations, if the Texas courts require the TCEQ to regulate carbon dioxide and perhaps other GHGs such as methane, and these rules are applied to our operations in Texas. We may be subject to the EPA GHG monitoring and reporting rule, and potentially new EPA permitting rules if adopted to apply GHG permitting obligations and emissions limitations under the federal Clean Air Act. Even if no federal greenhouse gas regulations are enacted, or if the EPA issues regulations, more than one-third of the states have begun taking action on their own to control and/or reduce emissions of greenhouse gases. Several multi-state programs have been developed or are in the process of being developed: the Regional Greenhouse Gas Initiative involving 10 Northeastern states, the Western Climate Initiative involving seven western states, and the Midwestern Greenhouse Gas Reduction Accord involving seven states. The latter two programs have several other states acting as observers and they may join one of the programs at a later date. Any of the climate change regulatory and legislative initiatives described above could have a material adverse effect on our business, financial condition, and results of operations.
The National Environmental Policy Act
Oil and natural gas exploration and production activities on federal lands are subject to the National Environmental Policy Act, or NEPA. NEPA requires federal agencies, including the Department of the Interior, to evaluate major agency actions that have the potential to significantly impact the environment. In the course of such evaluations, an agency will prepare an Environmental Assessment that assesses the potential direct, indirect and cumulative impacts of a proposed project and, if necessary, will prepare a more detailed Environmental Impact Statement that may be made available for public review and comment. All of our current exploration and production activities, as well as proposed exploration and development plans, on federal lands require governmental permits that are subject to the requirements of NEPA. This process has the potential to delay the development of oil and natural gas projects.
Threatened and endangered species, migratory birds, and natural resources
Various state and federal statutes prohibit certain actions that adversely affect endangered or threatened species and their habitat, migratory birds, wetlands, and natural resources. These statutes include the Endangered Species Act, the Migratory Bird Treaty Act, the Clean Water Act and CERCLA. The United States Fish and Wildlife Service may designate critical habitat and suitable habitat areas that it believes are necessary for survival of threatened or endangered species. A critical habitat or suitable habitat designation could result in
20
Table of Contents
Index to Financial Statements
further material restrictions to federal land use and private land use and could delay or prohibit land access or development. Where takings of or harm to species or damages to wetlands, habitat, or natural resources occur or may occur, government entities or at times private parties may act to prevent oil and gas exploration activities or seek damages for harm to species, habitat, or natural resources resulting from drilling or construction or releases of oil, wastes, hazardous substances or other regulated materials, and may seek natural resources damages.
Hazard communications and community right to know
We are subject to federal and state hazard communications and community right to know statutes and regulations. These regulations govern record keeping and reporting of the use and release of hazardous substances, including, but not limited to, the federal Emergency Planning and Community Right-to- Know Act.
Occupational Safety and Health Act
We are subject to the requirements of the federal Occupational Safety and Health Act, commonly referred to as OSHA, and comparable state statutes that regulate the protection of the health and safety of workers. In addition, the OSHA hazard communication standard requires that information be maintained about hazardous materials used or produced in operations and that this information be provided to employees, state and local government authorities and the public.
Employees
As of December 31, 2009, we had 469 full-time employees. We hire independent contractors on an as needed basis. We have no collective bargaining agreements with our employees. We believe that our employee relationships are satisfactory.
Access to Company Reports
We file periodic reports, proxy statements and other information with the SEC in accordance with the requirements of the Securities Exchange Act of 1934, as amended. We make our annual reports on Form 10-K, quarterly reports on Form 10-Q, current reports on Form 8-K and Forms 3, 4 and 5 filed on behalf of directors and officers, and any amendments to such reports available free of charge through our corporate website at www.petrohawk.com as soon as reasonably practicable after such reports are filed with, or furnished to, the SEC. In addition, our corporate governance guidelines, code of conduct, code of ethics for our chief executive officer (CEO) and senior financial officers, audit committee charter, compensation committee charter and nominating and corporate governance committee charter are available on our website under the heading “About Us—Corporate Governance”. Within the time period required by the SEC and the New York Stock Exchange (NYSE), as applicable, we will post on our website any modifications to the code of conduct and the code of ethics for our CEO and senior financial officers and any waivers applicable to senior officers as defined in the applicable code, as required by the Sarbanes-Oxley Act of 2002. You may also read and copy any document we file with the SEC at the SEC’s Public Reference Room at 100 F Street, N.E., Washington, D.C. 20549. You may obtain information on the operation of the Public Reference Room by calling the SEC at 1-800-SEC-0330. In addition, our reports, proxy and information statements, and our other filings are also available to the public over the internet at the SEC’s website at www.sec.gov. Unless specifically incorporated by reference in this annual report on Form 10-K, information that you may find on our website is not part of this report.
| ITEM 1A. | RISK FACTORS |
We have substantial indebtedness and may incur substantially more debt. Higher levels of indebtedness make us more vulnerable to economic downturns and adverse developments in our business.
We have incurred substantial debt amounting to approximately $2.6 billion as of December 31, 2009. As a result of our indebtedness, we will need to use a portion of our cash flow to pay interest, which will reduce the
21
Table of Contents
Index to Financial Statements
amount we will have available to finance our operations and other business activities and could limit our flexibility in planning for or reacting to changes in our business and the industry in which we operate. Our indebtedness under our Senior Credit Agreement is at a variable interest rate, and so a rise in interest rates will generate greater interest expense to the extent we do not have applicable interest rate fluctuation hedges. The amount of our debt may also cause us to be more vulnerable to economic downturns and adverse developments in our business.
We may incur substantially more debt in the future. The indentures governing our outstanding senior notes contain restrictions on our incurrence of additional indebtedness. These restrictions, however, are subject to a number of qualifications and exceptions, and under certain circumstances, we could incur substantial additional indebtedness in compliance with these restrictions. Moreover, these restrictions do not prevent us from incurring obligations that do not constitute indebtedness under the indentures. Our Senior Credit Agreement is a $2.0 billion facility with a borrowing base of $1.5 billion, $1.2 billion of which relates to our oil and natural gas properties and up to $300 million of which relates to our midstream assets. The $1.2 billion borrowing base attributable to our oil and natural gas properties was reduced $200 million to $1.0 billion upon the closing of the sale of the Permian Basin properties on October 30, 2009. As of December 31, 2009, we had $203 million of debt outstanding under this facility and $1.0 billion of additional borrowing capacity.
Our ability to meet our debt obligations and other expenses will depend on our future performance, which will be affected by financial, business, economic, regulatory and other factors, many of which we are unable to control. If our cash flow is not sufficient to service our debt, we may be required to refinance debt, sell assets or sell additional shares of common stock on terms that we may not find attractive if it may be done at all. Further, our failure to comply with the financial and other restrictive covenants relating to our indebtedness could result in a default under that indebtedness, which could adversely affect our business, financial condition and results of operations.
We may not be able to drill wells on a substantial portion of our acreage.
We may not be able to drill on a substantial portion of our acreage for various reasons. We may not generate or be able to raise sufficient capital to do so. Future deterioration in commodities pricing may also make drilling some acreage uneconomic. Our actual drilling activities and future drilling budget will depend on drilling results, oil and natural gas prices, the availability and cost of capital, drilling and production costs, availability of drilling services and equipment, lease expirations, gathering system and pipeline transportation constraints, regulatory approvals and other factors. In addition, any drilling activities we are able to conduct may not be successful or add additional proved reserves to our overall proved reserves, which could have a material adverse effect on our future business, financial condition and results of operations.
Part of our strategy involves drilling in new or emerging shale formations using horizontal drilling and completion techniques. The results of our planned drilling program in these formations are subject to more uncertainties than conventional drilling programs in more established formations and may not meet our expectations for reserves or production.
The results of our drilling in new or emerging formations, such as the Haynesville, Bossier and Eagle Ford Shales, are more uncertain than drilling results in areas that are developed and have established production. Because new or emerging formations have limited or no production history, we are less able to use past drilling results in those areas to help predict our future drilling results. Further, part of our drilling strategy to maximize recoveries from the Haynesville, Bossier and Eagle Ford Shales involves the drilling of horizontal wells using completion techniques that have proven to be successful in other shale formations. Our experience with horizontal drilling in these areas to date, as well as the industry’s drilling and production history, while growing, is limited. The ultimate success of these drilling and completion strategies and techniques will be better evaluated over time as more wells are drilled and production profiles are better established.
Further, access to adequate gathering systems or pipeline takeaway capacity and the availability of drilling rigs and other services may be more challenging in new or emerging areas. If our drilling results are less than
22
Table of Contents
Index to Financial Statements
anticipated or we are unable to execute our drilling program because of capital constraints, lease expirations, access to gathering systems and takeaway capacity or otherwise, and/or natural gas and oil prices decline, our investment in these areas may not be as attractive as we anticipate and we could incur material writedowns of unevaluated properties and the value of our undeveloped acreage could decline in the future.
Certain of our undeveloped leasehold acreage is subject to leases that will expire over the next several years unless production is established on units containing the acreage.
As of December 31, 2009, we own leasehold interests in approximately 360,000 net acres in areas we believe are prospective for the Haynesville Shale and approximately 310,000 net acres in areas we believe are prospective for the Eagle Ford Shale. A large portion of the acreage is not currently held by production. Unless production in paying quantities is established on units containing these leases during their terms, these leases will expire. If our leases expire, we will lose our right to develop the related properties.
Our drilling plans for these areas are subject to change based upon various factors, including factors that are beyond our control, including drilling results, oil and natural gas prices, the availability and cost of capital, drilling and production costs, availability of drilling services and equipment, gathering system and pipeline transportation constraints, and regulatory approvals. Further, some of this acreage is located in sections where we do not hold the majority of the acreage and therefore it is likely that we will not be named operator of these sections. As a non-operating leaseholder we have less control over the timing of drilling and there is therefore additional risk of expirations occurring in sections where we are not the operator.
Increased drilling in the Haynesville Shale may cause pipeline and gathering system capacity constraints that may limit our ability to sell natural gas and/or receive market prices for our natural gas.
The Haynesville Shale has become one of the more active natural gas plays in the United States and the wells drilled to date have reported very high initial production rates, implying potentially large reserves. If drilling in the Haynesville Shale continues to be successful, the amount of gas being produced in the area from these new wells, as well as gas produced from other existing wells, could exceed the capacity of the various gathering and intrastate or interstate transportation pipelines currently available. If this occurs it will be necessary for new interstate and intrastate pipelines and gathering systems to be built.
Because of the recent volatility in natural gas prices and the current economic climate, certain pipeline projects that are planned for the Haynesville Shale area may not occur on schedule or at all because the prospective owners of these pipelines may be unable to secure the necessary financing. In addition, capital constraints could limit our ability to build intrastate gathering systems necessary to transport our natural gas to interstate pipelines. In such event, this could result in wells being shut-in awaiting a pipeline connection or capacity and/or natural gas being sold at much lower prices than those quoted on New York Mercantile Exchange (NYMEX) or than we currently project, which would adversely affect our results of operations.
We may have difficulty financing our planned capital expenditures which could adversely affect our growth.
We have experienced, and expect to continue to experience, substantial capital expenditure and working capital needs, primarily as a result of our drilling program, particularly in the Haynesville, Bossier, and Eagle Ford Shales. We intend to continue to selectively increase our acreage position in the Haynesville, Bossier, and Eagle Ford Shales, which would require additional capital in addition to the capital necessary to drill on our existing acreage. We expect to use borrowings under our Senior Credit Agreement, proceeds from potential asset dispositions and proceeds from potential future capital markets transactions, if necessary, to fund capital expenditures that are in excess of our cash flow and cash on hand.
Our Senior Credit Agreement limits our borrowings to the lesser of the borrowing base and the total commitments. Our borrowing base related to our oil and natural gas properties is $1.0 billion. Our borrowing
23
Table of Contents
Index to Financial Statements
base is determined semi-annually, and may also be redetermined periodically at the discretion of the banks. Lower oil and natural gas prices may result in a reduction in our borrowing base at the next redetermination. A reduction in our borrowing base could require us to repay any indebtedness in excess of the borrowing base. Additionally, the indentures governing our senior unsecured debt contain covenants limiting our ability to incur additional indebtedness, including borrowings under our Senior Credit Agreement, unless we meet one of two alternative tests. The first test applies to all indebtedness and requires that after giving effect to the incurrence of additional debt the ratio of our adjusted consolidated EBITDA (as defined in our indentures) to our adjusted consolidated interest expense over the trailing four fiscal quarters will be at least 2.5 to 1.0. The second test applies only to borrowings under our Senior Credit Agreement that do not meet the first test and it limits these borrowings to the greater of a fixed sum (the most restrictive indenture limit being $100 million) and a percentage (the most restrictive indenture limit being 20%) of our adjusted consolidated net tangible assets (as defined in all of our indentures), which is determined using discounted future net revenues from proved natural gas and oil reserves as of the end of each year. Currently, we are permitted to incur additional indebtedness under these incurrence tests, but may be limited in the future. Lower natural gas and oil prices in the future could reduce our adjusted consolidated EBITDA, as well as our adjusted consolidated net tangible assets, and thus could reduce our ability to incur additional indebtedness.
Additionally, our ability to complete future equity offerings is limited by the availability of authorized common stock under our certificate of incorporation and by general market conditions. If we are not able to borrow sufficient amounts under our Senior Credit Agreement and/or are unable to raise sufficient capital to fund our capital expenditures, we may be required to curtail our drilling, development, land acquisition and other activities, which could result in a decrease in our production of oil and natural gas, forfeiture of leasehold interests if we are unable or unwilling to renew them, and could force us to sell some of our assets on an untimely or unfavorable basis, each of which could have a material adverse effect on our results and future operations.
Oil and natural gas prices are volatile, and low prices could have a material adverse impact on our business.
Our revenues, profitability and future growth and the carrying value of our properties depend substantially on prevailing oil and natural gas prices. Prices also affect the amount of cash flow available for capital expenditures and our ability to borrow and raise additional capital. The amount we will be able to borrow under our Senior Credit Agreement will be subject to periodic redetermination based in part on current oil and natural gas prices and on changing expectations of future prices. Lower prices may also reduce the amount of oil and natural gas that we can economically produce and have an adverse effect on the value of our properties.
Historically, the markets for oil and natural gas have been volatile, and they are likely to continue to be volatile in the future. Among the factors that can cause volatility are:
| • | the domestic and foreign supply of oil and natural gas; |
| • | the ability of members of the Organization of Petroleum Exporting Countries and other producing countries to agree upon and maintain oil prices and production levels; |
| • | political instability, armed conflict or terrorist attacks, whether or not in oil or natural gas producing regions; |
| • | the level of consumer product demand; |
| • | the growth of consumer product demand in emerging markets, such as China; |
| • | labor unrest in oil and natural gas producing regions; |
| • | weather conditions, including hurricanes and other natural occurrences that affect the supply and/or demand of oil and natural gas; |
| • | the price and availability of alternative fuels; |
24
Table of Contents
Index to Financial Statements
| • | the price of foreign imports; |
| • | worldwide economic conditions; and |
| • | the availability of liquid natural gas imports. |
These external factors and the volatile nature of the energy markets make it difficult to estimate future prices of oil and natural gas.
The current economic and financial crisis has negatively impacted the prices for our oil and natural gas production, limited access to the credit and equity markets, increased the cost of capital, and may have other negative consequences that we cannot predict.
The current economic and financial crisis in the United States and globally creates financial challenges that will grow if conditions do not improve. Although we believe our operating and capital budget for 2010 can be funded with internally generated cash flow and existing financial resources, our cash flow from operations, borrowings under our Senior Credit Agreement and cash on hand historically have not been sufficient to fund all of our expenditures, and we have relied on the capital markets and sales of non-core assets to provide us with additional capital. Our ability to access the capital markets has, at times, been limited as a result of these crises and may be restricted at a time when we would like, or need, to raise capital. If our cash flow from operations is less than anticipated or we are not able to successfully complete a portion of our potential asset dispositions in 2010 and our access to capital is restricted, we may be required to reduce our operating and capital budget, which could have a material adverse effect on our results and future operations. Economic and financial conditions may also limit the number of participants or reduce the values we are able to realize in asset sales or other transactions we may engage in to raise capital, thus making these transactions more difficult to consummate and less economic. Additionally, the current economic situation has affected the demand for oil and natural gas and has resulted in lower prices for oil and natural gas, which could have a negative impact on our revenues. Lower prices could also adversely affect the collectibility of our trade receivables.
Unless we replace our reserves, our reserves and production will decline, which would adversely affect our financial condition, results of operations and cash flows.
Producing natural gas and oil reservoirs generally are characterized by declining production rates that vary depending upon reservoir characteristics and other factors. Decline rates are typically greatest early in the productive life of a well. For instance, we currently estimate that our Haynesville Shale wells will decline approximately 80 – 85% during the first twelve months of production. Estimates of the decline rate of an oil or natural gas well are inherently imprecise, and are less precise with respect to new or emerging oil and natural gas formations with limited production histories than for more developed formations with established production histories. Our production levels and the reserves that we currently expect to recover from our wells will change if production from our existing wells declines in a different manner than we have estimated and can change under other circumstances. Thus, our future natural gas and oil reserves and production and, therefore, our cash flow and results of operations are highly dependent upon our success in efficiently developing and exploiting our current properties and economically finding or acquiring additional recoverable reserves. We may not be able to develop, find or acquire additional reserves to replace our current and future production at acceptable costs. If we are unable to replace our current and future production, our cash flows and the value of our reserves may decrease, adversely affecting our business, financial condition and results of operations.
Estimates of proved oil and natural gas reserves are uncertain and any material inaccuracies in these reserve estimates will materially affect the quantities and the value of our reserves.
This report on Form 10-K contains estimates of our proved oil and natural gas reserves. These estimates are based upon various assumptions, including assumptions required by the SEC relating to oil and natural gas prices, drilling and operating expenses, capital expenditures, taxes and availability of funds. The process of
25
Table of Contents
Index to Financial Statements
estimating oil and natural gas reserves is complex. This process requires significant decisions and assumptions in the evaluation of available geological, geophysical, engineering and economic data for each reservoir. Therefore, these estimates are inherently imprecise.
Actual future production, oil and natural gas prices, revenues, taxes, development expenditures, operating expenses and quantities of recoverable oil and natural gas reserves will vary from those estimated. Any significant variance could materially affect the estimated quantities and the value of our reserves. Our properties may also be susceptible to hydrocarbon drainage from production by other operators on adjacent properties. In addition, we may adjust estimates of proved reserves to reflect production history, results of exploration and development, prevailing oil and natural gas prices and other factors, many of which are beyond our control.
At December 31, 2009, approximately 67% of our estimated reserves were classified as proved undeveloped. Estimates of proved undeveloped reserves are less certain than estimates of proved developed reserves. Recovery of proved undeveloped reserves requires significant capital expenditures and successful drilling operations. The reserve data assumes that we will make significant capital expenditures to develop our reserves. Although we have prepared estimates of these oil and natural gas reserves and the costs associated with development of these reserves in accordance with SEC regulations, actual capital expenditures will likely vary from estimated capital expenditures, development may not occur as scheduled and actual results may not be as estimated.
We depend substantially on the continued presence of key personnel for critical management decisions and industry contacts.
Our success depends upon the continued contributions of our executive officers and key employees, particularly with respect to providing the critical management decisions and contacts necessary to manage and maintain growth within a highly competitive industry. Competition for qualified personnel can be intense, particularly in the oil and natural gas industry, and there are a limited number of people with the requisite knowledge and experience. Under these conditions, we could be unable to attract and retain these personnel. The loss of the services of any of our executive officers or other key employees for any reason could have a material adverse effect on our business, operating results, financial condition and cash flows.
Our business is highly competitive.
The oil and natural gas industry is highly competitive in many respects, including identification of attractive oil and natural gas properties for acquisition, drilling and development, securing financing for such activities and obtaining the necessary equipment and personnel to conduct such operations and activities. In seeking suitable opportunities, we compete with a number of other companies, including large oil and natural gas companies and other independent operators with greater financial resources, larger numbers of personnel and facilities, and, in some cases, with more expertise. There can be no assurance that we will be able to compete effectively with these entities.
Our oil and natural gas activities are subject to various risks which are beyond our control.
Our operations are subject to many risks and hazards incident to exploring and drilling for, producing, transporting, marketing and selling oil and natural gas. Although we may take precautionary measures, many of these risks and hazards are beyond our control and unavoidable under the circumstances. Many of these risks or hazards could materially and adversely affect our revenues and expenses, the ability of certain of our wells to produce oil and natural gas in commercial quantities, the rate of production and the economics of the development of, and our investment in the prospects in which we have or will acquire an interest. Any of these risks and hazards could materially and adversely affect our financial condition, results of operations and cash flows. Such risks and hazards include:
| • | human error, accidents, labor force and other factors beyond our control that may cause personal injuries or death to persons and destruction or damage to equipment and facilities; |
26
Table of Contents
Index to Financial Statements
| • | blowouts, fires, hurricanes, pollution and equipment failures that may result in damage to or destruction of wells, producing formations, production facilities and equipment; |
| • | unavailability of materials and equipment; |
| • | engineering and construction delays; |
| • | unanticipated transportation costs and delays; |
| • | unfavorable weather conditions; |
| • | hazards resulting from unusual or unexpected geological or environmental conditions; |
| • | environmental regulations and requirements; |
| • | accidental leakage of toxic or hazardous materials, such as petroleum liquids or drilling fluids, into the environment; |
| • | hazards resulting from the presence of hydrogen sulfide (H2S) or other contaminants in gas we produce; |
| • | changes in laws and regulations, including laws and regulations applicable to oil and natural gas activities or markets for the oil and natural gas produced; |
| • | fluctuations in supply and demand for oil and natural gas causing variations of the prices we receive for our oil and natural gas production; and |
| • | the availability of alternative fuels and the price at which they become available. |
As a result of these risks, expenditures, quantities and rates of production, revenues and operating costs may be materially adversely affected and may differ materially from those anticipated by us.
We are subject to complex federal, state, local and other laws and regulations that could adversely affect the cost, manner or feasibility of doing business.
Companies that explore for and develop, produce, sell and transport oil and natural gas in the United States are subject to extensive federal, state and local laws and regulations, including complex tax and environmental, health and safety laws and the corresponding regulations, and are required to obtain various permits and approvals from federal, state and local agencies. If these permits are not issued or unfavorable restrictions or conditions are imposed on our drilling activities, we may not be able to conduct our operations as planned. We may be required to make large expenditures to comply with governmental regulations. Matters subject to regulation include:
| • | water discharge and disposal permits for drilling operations; |
| • | drilling bonds; |
| • | drilling permits; |
| • | reports concerning operations; |
| • | air quality, noise levels and related permits; |
| • | spacing of wells; |
| • | rights-of-way and easements; |
| • | unitization and pooling of properties; |
| • | pipeline construction; |
| • | gathering, transportation and marketing of oil and natural gas; |
| • | taxation; and |
| • | waste transport and disposal permits and requirements. |
27
Table of Contents
Index to Financial Statements
Failure to comply with these laws may result in the suspension or termination of operations and subject us to liabilities under administrative, civil and criminal penalties. Compliance costs can be significant. Moreover, these laws or the enforcement thereof could change in ways that substantially increase the costs of doing business. Any such liabilities, penalties, suspensions, terminations or regulatory changes could materially and adversely affect our business, financial condition and results of operations. Under these laws and other environmental health and safety laws and regulations, we could be held liable for personal injuries, property damage (including site clean-up and restoration costs) and other damages. Failure to comply with these laws and regulations may also result in the suspension or termination of our operations and subject us to administrative, civil and criminal penalties, including the assessment of natural resource damages. Some laws and regulations may impose strict as well as joint and several liability for environmental contamination, which could subject us to liability for the conduct of others or for our own actions that were in compliance with all applicable laws at the time such actions were taken. Environmental and other governmental laws and regulations also increase the costs to plan, design, drill, install, operate and abandon natural gas and oil wells. Moreover, public interest in environmental protection has increased in recent years, and environmental organizations have opposed, with some success, certain drilling projects. Part of the regulatory environment in which we operate includes, in some cases, federal requirements for performing or preparing environmental assessments, environmental impact studies and/or plans of development before commencing exploration and production activities. In addition, our activities are subject to the regulation by natural gas and oil-producing states relating to conservation practices and protection of correlative rights. These regulations affect our operations and limit the quantity of natural gas and oil we may produce and sell. Delays in obtaining regulatory approvals or necessary permits, the failure to obtain a permit or the receipt of a permit with excessive conditions or costs could have a material adverse effect on our ability to explore on, develop or produce our properties. Additionally, the natural gas and oil regulatory environment could change in ways that might substantially increase the financial and managerial costs to comply with the requirements of these laws and regulations and, consequently, adversely affect our profitability.
Federal and state legislation and regulatory initiatives relating to hydraulic fracturing could result in increased costs and additional operating restrictions or delays.
Legislation has been proposed in Congress to amend the federal Safe Drinking Water Act to require the disclosure of chemicals used by the oil and natural gas industry in the hydraulic fracturing process. Hydraulic fracturing involves the injection of water, sand and chemicals under pressure into rock formations to stimulate oil and natural gas production. We engage third parties to provide hydraulic fracturing or other well stimulation services to us in connection with many of the wells for which we are the operator. Sponsors of bills currently pending before the Senate and House of Representatives have asserted that chemicals used in the fracturing process may be adversely impacting drinking water supplies. The proposed legislation would require the reporting and public disclosure of chemicals used in the fracturing process, which could make it easier for third parties opposing the hydraulic fracturing process to initiate legal proceedings based on allegations that specific chemicals used in the fracturing process are impairing groundwater or causing other damage. These bills, if adopted, could establish an additional level of regulation at the federal or state level that could lead to operational delays or increased operating costs and could result in additional regulatory burdens that could make it more difficult to perform hydraulic fracturing and increase our costs of compliance and doing business. Certain states have adopted or are considering similar disclosure legislation.
Possible regulation related to global warming and climate change could have an adverse effect on our operations and demand for natural gas and oil.
Studies over recent years have indicated that emissions of certain gases may be contributing to warming of the Earth’s atmosphere. In response to these studies, governments have begun adopting domestic and international climate change regulations that requires reporting and reductions of the emission of greenhouse gases. Methane, a primary component of natural gas, and carbon dioxide, a byproduct of the burning of oil, natural gas and refined petroleum products, are considered greenhouse gases. Internationally, the United Nations Framework Convention on Climate Change, and the Kyoto Protocol address greenhouse gas emissions, and
28
Table of Contents
Index to Financial Statements
several counties including the European Union have established greenhouse gas regulatory systems. In the United States, at the state level, many states, either individually or through multi-state regional initiatives, have begun implementing legal measures to reduce emissions of greenhouse gases, primarily through the planned development of emission inventories or regional greenhouse gas cap and trade programs or have begun considering adopting greenhouse gas regulatory programs. At the federal level, in June 2009, the United States House of Representatives passed the American Clean Energy and Security Act of 2009, also known as the Waxman-Markey Bill or ACESA. The United States Senate passed out of committee the Clean Energy Jobs and American Power Act, also known as the Kerry-Boxer Bill. Although these bills differ in certain ways, they both contain provisions that would establish a cap and trade system for restricting greenhouse gas emissions in the United States. Under such a system, certain sources of greenhouse gas emissions would be required to obtain greenhouse gas emission “allowances” corresponding to their annual emissions of greenhouse gases. The number of emission allowances issued each year would decline as necessary to meet overall emission reduction goals. As the number of greenhouse gas emission allowances declines each year, the cost or value of allowances is expected to escalate significantly. The ultimate outcome of this federal legislative initiative remains uncertain.
In addition to pending climate legislation, the EPA has issued greenhouse gas monitoring and reporting regulations that went into effect January 1, 2010, and require reporting by regulated facilities by March 2011 and annually thereafter. Beyond measuring and reporting, the EPA issued an “Endangerment Finding” under section 202(a) of the Clean Air Act, concluding greenhouse gas pollution threatens the public health and welfare of current and future generations. The finding serves as a first step to issuing regulations that would require permits for and reductions in greenhouse gas emissions for certain facilities. EPA has proposed such greenhouse gas regulations and may issue final rules this year.
In the courts, several decisions have been issued that may increase the risk of claims being filed by governments and private parties against companies that have significant greenhouse gas emissions. Such cases may seek to challenge air emissions permits that greenhouse gas emitters apply for and seek to force emitters to reduce their emissions or seek damages for alleged climate change impacts to the environment, people, and property.
Any laws or regulations that may be adopted to restrict or reduce emissions of greenhouse gases could require us to incur increased operating and compliance costs, and could have an adverse effect on demand for the oil and natural gas that we produce.
The adoption of derivatives legislation by Congress could have an adverse impact on our ability to hedge risks associated with our business.
We enter into a number of commodity derivative contracts in order to hedge a portion of our oil and natural gas production and periodically interest expense. Congress is currently considering legislation to impose restrictions on certain transactions involving derivatives, which could affect the use of derivatives in hedging transactions. ACESA contains provisions that would expand the power of the Commodity Futures Trading Commission, or CFTC, to regulate derivative transactions related to energy commodities, including natural gas and oil, and to mandate clearance of such derivative contracts through registered derivative clearing organizations. Under ACESA, the CFTC’s expanded authority over energy derivatives would terminate upon the adoption of general legislation covering derivative regulatory reform. The CFTC is considering whether to set limits on trading and positions in commodities with finite supply, particularly energy commodities, such as natural gas, crude oil and other energy products. The CFTC also is evaluating whether position limits should be applied consistently across all markets and participants. Separately, two committees of the House of Representatives, the Financial Services and Agriculture Committees, acted on October 15, 2009 and October 21, 2009, respectively, to adopt legislation that would impose comprehensive regulation on the over-the-counter (OTC) derivatives marketplace. This legislation would subject swap dealers and major swap participants to substantial supervision and regulation, including capital standards, margin requirements, business conduct standards, and recordkeeping and reporting requirements. It also would require central clearing for transactions entered into between swap dealers or major swap participants, and would provide the CFTC with authority to impose position limits in the OTC derivatives
29
Table of Contents
Index to Financial Statements
markets. A major swap participant generally would be someone other than a dealer who maintains a “substantial” position in outstanding swaps other than swaps used for commercial hedging, or whose positions create substantial exposure to its counterparties or the system. Although it is not possible at this time to predict whether or when Congress may act on derivatives legislation or how any climate change bill approved by the Senate would be reconciled with ACESA, any laws or regulations that may be adopted that subject us to additional capital or margin requirements relating to, or to additional restrictions on, our commodity risk management positions could have an adverse effect on our ability to hedge risks associated with our business or on the cost of our hedging activity.
We may incur more taxes and certain of our projects may become uneconomic if certain federal income tax deductions currently available with respect to oil and natural gas exploration and development are eliminated as a result of future legislation.
The current administration’s proposed budget for fiscal year 2010 contains a proposal to eliminate certain key United States federal income tax preferences currently available to oil and natural gas exploration and production companies. These changes include, but are not limited to (i) the repeal of the percentage depletion allowance for oil and natural gas properties, (ii) the elimination of current deductions for intangible drilling and development costs, (iii) the elimination of the deduction for certain United States production activities, and (iv) an extension of the amortization period for certain geological and geophysical expenditures. The Oil Industry Tax Break Repeal Act of 2009, which was introduced in the Senate on April 23, 2009, includes many of the same proposals. It is unclear whether any of the foregoing changes will actually be enacted or how soon any such changes could become effective. The passage of any legislation as a result of the budget proposal, the Senate bill or any other similar change in United States federal income tax law could eliminate certain tax deductions that are currently available with respect to oil and natural gas exploration and development. Any such change could negatively impact our financial condition and results of operations by increasing the costs we incur, which would in turn make it uneconomic to drill some prospects if commodity prices are not sufficiently high, resulting in lower revenues and decreases in production and reserves.
We cannot be certain that the insurance coverage maintained by us will be adequate to cover all losses that may be sustained in connection with all oil and natural gas activities.
We maintain general and excess liability policies, which we consider to be reasonable and consistent with industry standards. These policies generally cover:
| • | personal injury; |
| • | bodily injury; |
| • | third party property damage; |
| • | medical expenses; |
| • | legal defense costs; |
| • | pollution in some cases; |
| • | well blowouts in some cases; and |
| • | workers compensation. |
As is common in the oil and natural gas industry, we will not insure fully against all risks associated with our business either because such insurance is not available or because we believe the premium costs are prohibitive. A loss not fully covered by insurance could have a materially adverse effect on our financial position, results of operations and cash flows. There can be no assurance that the insurance coverage that we maintain will be sufficient to cover every claim made against us in the future.
30
Table of Contents
Index to Financial Statements
Title to the properties in which we have an interest may be impaired by title defects.
We generally obtain title opinions on significant properties that we drill or acquire. However, there is no assurance that we will not suffer a monetary loss from title defects or title failure. Additionally, undeveloped acreage has greater risk of title defects than developed acreage. Generally, under the terms of the operating agreements affecting our properties, any monetary loss is to be borne by all parties to any such agreement in proportion to their interests in such property. If there are any title defects or defects in assignment of leasehold rights in properties in which we hold an interest, we will suffer a financial loss.
Assets we acquire may prove to be worth less than we paid because of uncertainties in evaluating recoverable reserves and potential liabilities.
Our recent growth is due significantly to acquisitions of exploration and production companies, producing properties and undeveloped and unevaluated leaseholds. We expect acquisitions may also contribute to our future growth. Successful acquisitions require an assessment of a number of factors, including estimates of recoverable reserves, exploration potential, future oil and natural gas prices, operating and capital costs and potential environmental and other liabilities. Such assessments are inexact and their accuracy is inherently uncertain. In connection with our assessments, we perform a review of the acquired properties which we believe is generally consistent with industry practices. However, such a review will not reveal all existing or potential problems. In addition, our review may not permit us to become sufficiently familiar with the properties to fully assess their deficiencies and capabilities. We do not inspect every well. Even when we inspect a well, we do not always discover structural, subsurface and environmental problems that may exist or arise. We are generally not entitled to contractual indemnification for preclosing liabilities, including environmental liabilities. Normally, we acquire interests in properties on an “as is” basis with limited remedies for breaches of representations and warranties. As a result of these factors, we may not be able to acquire oil and natural gas properties that contain economically recoverable reserves or be able to complete such acquisitions on acceptable terms.
Our exploration and development drilling efforts and the operation of our wells may not be profitable or achieve our targeted returns.
We require significant amounts of undeveloped leasehold acreage to further our development efforts. Exploration, development, drilling and production activities are subject to many risks, including the risk that commercially productive reservoirs will not be discovered. We invest in property, including undeveloped leasehold acreage, which we believe will result in projects that will add value over time. However, we cannot guarantee that our leasehold acreage will be profitably developed, that new wells drilled by us will be productive or that we will recover all or any portion of our investment in such leasehold acreage or wells. Drilling for oil and natural gas may involve unprofitable efforts, not only from dry wells but also from wells that are productive but do not produce sufficient net reserves to return a profit after deducting operating and other costs. In addition, wells that are profitable may not achieve our targeted rate of return. Our ability to achieve our target results are dependent upon the current and future market prices for oil and natural gas, costs associated with producing oil and natural gas and our ability to add reserves at an acceptable cost. We rely to a significant extent on 3-D seismic data and other advanced technologies in identifying leasehold acreage prospects and in conducting our exploration activities. The 3-D seismic data and other technologies we use do not allow us to know conclusively whether oil or natural gas is present or may be produced economically. The use of 3-D seismic data and other technologies also requires greater pre-drilling expenditures than traditional drilling strategies.
In addition, we may not be successful in controlling our drilling and production costs to improve our overall return. The cost of drilling, completing and operating a well is often uncertain and cost factors can adversely affect the economics of a project. We cannot predict the cost of drilling, and we may be forced to limit, delay or cancel drilling operations as a result of a variety of factors, including:
| • | unexpected drilling conditions; |
| • | pressure or irregularities in formations; |
31
Table of Contents
Index to Financial Statements
| • | equipment failures or accidents and shortages or delays in the availability of drilling rigs and the delivery of equipment; |
| • | adverse weather conditions, including hurricanes; and |
| • | compliance with governmental requirements. |
The unavailability or high cost of drilling rigs, equipment, supplies, water, personnel and oil field services could adversely affect our ability to execute our exploration and development plans on a timely basis and within our budget.
Our industry is cyclical and, from time to time, there is a shortage of drilling rigs, equipment, supplies or qualified personnel. During these periods, the costs and delivery times of rigs, equipment and supplies are substantially greater. In addition, the demand for, and wage rates of, qualified drilling rig crews rise as the number of active rigs in service increases. Increasing levels of exploration and production in response to strong prices of oil and natural gas, may increase the demand for oilfield services, and the costs of these services may increase, while the quality of these services may suffer. If the unavailability or high cost of drilling rigs, equipment, supplies or qualified personnel were particularly severe in Texas and Louisiana, we could be materially and adversely affected because our operations and properties are concentrated in those areas. In order to secure drilling rigs in these areas, we have entered into certain contracts with drilling companies that extend over several years. If demand for drilling rigs subsides during the period covered by these contracts, the price we are required to pay may be significantly more than the market rate for similar services.
We depend on the skill, ability and decisions of third party operators to a significant extent.
The success of the drilling, development and production of the oil and natural gas properties in which we have or expect to have a non-operating working interest is substantially dependent upon the decisions of such third-party operators and their diligence to comply with various laws, rules and regulations affecting such properties. The failure of any third-party operator to make decisions, perform their services, discharge their obligations, deal with regulatory agencies, and comply with laws, rules and regulations, including environmental laws and regulations in a proper manner with respect to properties in which we have an interest could result in material adverse consequences to our interest in such properties, including substantial penalties and compliance costs. Such adverse consequences could result in substantial liabilities to us or reduce the value of our properties, which could negatively affect our results of operations.
The success of our midstream segment depends upon our ability to continually obtain new sources of natural gas supply, and any decrease in demand, price, or supplies of natural gas could reduce our midstream revenues.
Our gathering systems and treating facilities are dependent on natural gas reserves and wells, from which production will naturally decline over time, which means that our cash flows associated with these facilities will also decline over time. To maintain or increase throughput levels on our gathering systems, we must continually obtain new natural gas supplies. The primary factors affecting our ability to connect new supplies of natural gas and attract new customers to our gathering systems and treating facilities are the level of successful drilling activity near our gathering systems and our ability to compete for commitments of additional volumes from third party producers.
Fluctuations in oil and natural gas prices can greatly affect production rates and investments by third parties in the development of new oil and natural gas reserves. Drilling activity generally decreases as oil and natural gas prices decrease. Other than our own drilling, we have no control over the level of drilling activity in the areas of our operations, the amount of reserves underlying the wells or the rate at which production from a well will decline. In addition, we have no control over third party producers or their production decisions, which are affected by, among other things, prevailing and projected energy prices, demand for hydrocarbons, the level of reserves, geological considerations, governmental regulations and the availability and cost of capital.
32
Table of Contents
Index to Financial Statements
If we are unable to maintain or increase the throughput on our gathering systems and treating facilities because of decreased drilling activity in the areas in which we operate or because of an inability to connect new supplies of natural gas and attract new third party producers, then our midstream business and financial results could be negatively affected.
We do not own all of the land on which our transportation pipelines and gathering systems are located, which could disrupt our operations.
We do not own all of the land on which our gathering systems have been constructed, and we are therefore subject to the possibility of increased costs to retain necessary land use. We obtain the rights to construct and operate our gathering systems on land owned by third parties and governmental agencies for a specific period of time. Our loss of these rights, through our inability to renew right-of-way contracts or otherwise, could have a material adverse effect on our business, results of operations and financial condition.
Hedging transactions may limit our potential gains and increase our potential losses.
In order to manage our exposure to price risks in the marketing of our oil and natural gas production, we have entered into oil and natural gas price hedging arrangements with respect to a portion of our anticipated production and we may enter into additional hedging transactions in the future. While intended to reduce the effects of volatile oil and natural gas prices, such transactions may limit our potential gains and increase our potential losses if oil and natural gas prices were to rise substantially over the price established by the hedge. In addition, such transactions may expose us to the risk of loss in certain circumstances, including instances in which:
| • | our production is less than expected; |
| • | there is a widening of price differentials between delivery points for our production and the delivery point assumed in the hedge arrangement; or |
| • | the counterparties to our hedging agreements fail to perform under the contracts. |
The current economic crisis may have a negative impact on the liquidity of the counterparties to our hedging arrangements, which increases the risk of those counterparties failing to perform under those agreements. If those parties do fail to perform, we will be exposed to the price risks we had sought to mitigate and our operating results, financial position and cash flows may be materially and adversely affected.
We may be required to take non-cash asset writedowns if oil and natural gas prices decline.
We may be required under full cost accounting rules to writedown the carrying value of oil and natural gas properties if oil and natural gas prices decline or if there are substantial downward adjustments to our estimated proved reserves, increases in our estimates of development costs or deterioration in our exploration results. We utilize the full cost method of accounting for oil and natural gas exploration and development activities. Under full cost accounting, we are required by SEC regulations to perform a ceiling test each quarter. The ceiling test is an impairment test and generally establishes a maximum, or “ceiling,” of the book value of oil and natural gas properties that is equal to the expected after tax present value (discounted at 10%) of the future net cash flows from proved reserves, including the effect of cash flow hedges when hedge accounting is applied, calculated using the unweighted arithmetic average of the first day of each month for the 12-month period ending at the balance sheet date. If the net book value of oil and natural gas properties (reduced by any related net deferred income tax liability and asset retirement obligation) exceeds the ceiling limitation, SEC regulations require us to impair or “writedown” the book value of our oil and natural gas properties.
Costs associated with unevaluated properties, which were $2.5 billion at December 31, 2009, are not initially subject to the ceiling test limitation. Rather, we assess all items classified as unevaluated property on a
33
Table of Contents
Index to Financial Statements
quarterly basis for possible impairment or reduction in value based upon our intentions with respect to drilling on such properties, the remaining lease term, geological and geophysical evaluations, drilling results, the assignment of proved reserves, and the economic viability of development if proved reserves are assigned. These factors are significantly influenced by our expectations regarding future commodity prices, development costs, and access to capital at acceptable cost. During any period in which these factors indicate an impairment, the cumulative drilling costs incurred to date for such property and all or a portion of the associated leasehold costs are transferred to the full cost pool and are then subject to amortization and the ceiling test limitation. Accordingly, a significant change in these factors, many of which are beyond our control, may shift a significant amount of cost from unevaluated properties into the full cost pool that is subject to amortization and the ceiling test limitation.
As of December 31, 2009, using the West Texas Intermediate unweighted 12-month average price of $57.65 per Bbl for oil and the Henry Hub unweighted 12-month average of $3.87 per Mmbtu for natural gas, our net book value of oil and gas properties exceeded the ceiling amount. As a result, we recorded a full cost ceiling impairment before income taxes of approximately $106 million, $65 million after taxes. The Company also recorded full cost ceiling impairments before tax at March 31, 2009 and December 31, 2008 of $1.7 billion and $1.0 billion, respectively. As ceiling test computations depend upon the calculated unweighted arithmetic average prices, it is impossible to predict the likelihood, timing and magnitude of any future impairments. Depending on the magnitude, a ceiling test writedown could negatively affect our results of operations.
Our results of operations could be adversely affected as a result of non-cash goodwill impairments.
In conjunction with the recording of the purchase price allocation for several of our acquisitions, we recorded goodwill which represents the excess of the purchase price paid by us for those companies plus liabilities assumed, including deferred taxes recorded in connection with the respective acquisitions, over the estimated fair market value of the tangible net assets acquired.
The Financial Accounting Standard Board’s (FASB) Accounting Standards Codification (ASC) 350, Intangibles—Goodwill and Other (ASC 350) requires that intangible assets with indefinite lives, including goodwill, be evaluated on an annual basis for impairment or more frequently if an event occurs or circumstances change that could potentially result in impairment. The goodwill impairment test requires the allocation of goodwill and all other assets and liabilities to reporting units. If the fair value of the reporting unit is less than the book value (including goodwill), then goodwill is reduced to its implied fair value and the amount of the writedown is charged against earnings. The assumptions we used in calculating our reporting unit fair value at the time of the test include our market capitalization and discounted future cash flows based on estimated reserves and production, future costs and future oil and natural gas prices. Adverse changes to any of these factors could lead to an impairment of all or a portion of our goodwill in future periods.
| ITEM 1B. | UNRESOLVED STAFF COMMENTS |
None.
| ITEM 2. | PROPERTIES |
A description of our properties is included in Item 1. Business and is incorporated herein by reference.
We believe that we have satisfactory title to the properties owned and used in our business, subject to liens for taxes not yet payable, liens incident to minor encumbrances, liens for credit arrangements and easements and restrictions that do not materially detract from the value of these properties, our interests in these properties, or the use of these properties in our business. We believe that our properties are adequate and suitable for us to conduct business in the future.
34
Table of Contents
Index to Financial Statements
| ITEM 3. | LEGAL PROCEEDINGS |
A description of our legal proceedings is included in Item 8. Consolidated Financial Statements and Supplementary Data—Note 7, “Commitments and Contingencies,” and is incorporated herein by reference.
From time to time, we may be a plaintiff or defendant in a pending or threatened legal proceeding arising in the normal course of our business. While the outcome and impact of currently pending legal proceedings cannot be predicted with certainty, our management and legal counsel believe that the resolution of these proceedings through settlement or adverse judgment will not have a material adverse effect on our condensed consolidated operating results, financial position or cash flows.
Under rules promulgated by the SEC, administrative or judicial proceedings arising under any Federal, State or local provisions that have been enacted or adopted regulating the discharge of materials into the environment or primarily for the purpose of protecting the environment are disclosed if the governmental authority is a party to such proceeding and the proceeding involves potential monetary sanctions of $100,000 or more. We are not party to any such proceedings, except as described below.
We are involved in natural gas exploration in the Fayetteville Shale play in North Central Arkansas. Our subsidiary, Hawk Field Services, LLC, constructed a pipeline to transport natural gas from wellheads. Hawk Field Services’ activities are being performed pursuant to required environmental permits issued by the Arkansas Department of Environmental Quality (ADEQ) and the United States Army Corps of Engineers (Corps). The terrain in and around the Fayetteville Shale play is very hilly and requires that the pipeline cross numerous small creeks and streams. Some of these streams ultimately drain into larger waters that are home to an endangered freshwater mussel known as the Speckled Pocketbook (Lampsilis streckeri).
In 2008, the United States Fish and Wildlife Service (USFWS) opened an investigation into the activities of Hawk Field Services and the Company in the Fayetteville Shale play. The investigation focused on the pipeline stream crossings and potential impacts on the Speckled Pocketbook. On April 22, 2009, we received a letter from the United States Attorney’s Office for the Eastern District of Arkansas and the Environmental Crimes Section of the United States Department of Justice notifying us that we are under criminal investigation for alleged violations of the Federal Clean Water Act and the Federal Endangered Species Act with respect to the endangered Speckled Pocketbook. In addition, the ADEQ has issued inspection letters that note alleged violations for failure to properly install or maintain sediment control structures in connection with construction of the pipeline. At this time, we are not able to estimate our potential exposure related to these matters. We potentially could, however, be indicted for felony violations of the Endangered Species Act and Clean Water Act, plead guilty to the violations, or enter into an alternative agreement to resolve the allegations. We could be subject to criminal and/or civil sanctions, including requirements to pay a monetary penalty and undertake certain injunctive measures, such as implementing additional construction management practices to control the discharge of sediment from our construction activities or other restrictions on our operations. The implementation of these management practices or other injunctive measures could delay or increase the cost of future construction.
We are also involved in natural gas exploration in the Haynesville Shale in Louisiana. On July 27, 2009, we received a Cease and Desist Order from the Corps alleging violations of the Federal Clean Water Act for unauthorized land clearing and discharges of dredged or fill material into wetlands associated with the development of three gas wells in Bossier, Caddo, Red River Parishes in Louisiana. On approximately December 14, 2009, the United States EPA informed us that it would be acting as lead enforcement agency regarding these alleged violations. We have identified additional well sites on which work may have been conducted without required authorizations under the Clean Water Act. Information related to these well sites has been disclosed to the Corps of Engineers and the EPA. We are investigating these allegations and are unable at this time to estimate our potential exposure related to this matter. As of this date our investigation has identified 36 additional well sites on which work was commenced while permits were still pending before the Corps of Engineers. All of this information has been disclosed to the Corps of Engineers. We could be required to pay a
35
Table of Contents
Index to Financial Statements
monetary penalty, undertake certain restoration or mitigation activities, and cease development of the subject wells until the matter is resolved. If we are required to cease development of these wells, it would delay and impact our ability to produce and sell gas from these wells.
| ITEM 4. | SUBMISSION OF MATTERS TO A VOTE OF SECURITY HOLDERS |
No matters were submitted to a vote of our stockholders during the fourth quarter of the fiscal year ended December 31, 2009.
Executive Officers
The following table sets forth the names and ages of all of our corporate officers, the positions and offices with us held by such persons, the terms of their office and the length of their continuous service as a corporate officer:
| Name |
Corporate Officer Since |
Age | Position | |||
| Floyd C. Wilson |
May 2004 | 62 | Chairman of the Board and Chief Executive Officer | |||
| Richard K. Stoneburner |
May 2004 | 55 | President and Chief Operating Officer | |||
| Mark J. Mize |
July 2005 | 37 | Executive Vice President—Chief Financial Officer and Treasurer | |||
| Larry L. Helm |
July 2004 | 61 | Executive Vice President—Finance and Administration | |||
| Stephen W. Herod |
May 2004 | 50 | Executive Vice President—Corporate Development and Assistant Secretary | |||
| David S. Elkouri |
August 2007 | 55 | Executive Vice President—General Counsel and Secretary | |||
| H. Weldon Holcombe |
March 2007 | 56 | Executive Vice President—Mid-Continent Region | |||
| Charles W. Latch |
November 2007 | 64 | Senior Vice President—Western Region | |||
| Tina S. Obut |
March 2007 | 44 | Senior Vice President—Corporate Reserves | |||
| C. Byron Charboneau |
March 2008 | 33 | Vice President—Chief Accounting Officer and Controller | |||
| Joan W. Dunlap |
July 2007 | 35 | Vice President—Investor Relations | |||
| Charles E. Cusack III |
May 2008 | 50 | Vice President—Exploration |
Our executive officers are appointed to serve until the meeting of the board of directors following the next annual meeting of stockholders and until their successors have been elected and qualified.
Floyd C. Wilson has served as our Chairman of the Board and Chief Executive Officer since May 25, 2004. Mr. Wilson also served as our President from May 25, 2004 until September 8, 2009. Prior to May 25, 2004, he was President and Chief Executive Officer of PHAWK, LLC which he founded in June 2003. Mr. Wilson was the Chairman and Chief Executive Officer of 3TEC Energy Corporation from August 1999 until its merger with Plains Exploration & Production Company in June 2003. Mr. Wilson founded W/E Energy Company L.L.C., formerly known as 3TEC Energy Company L.L.C. in 1998 and served as its President until August 1999. Mr. Wilson began his career in the energy business in Houston, Texas in 1970 as a completion engineer. He moved to Wichita, Kansas in 1976 to start an oil and gas operating company, one of several private energy ventures which preceded the formation of Hugoton Energy Corporation in 1987, where he served as Chairman, President and Chief Executive Officer. In 1994, Hugoton completed an initial public offering and was merged into Chesapeake Energy Corporation in 1998.
36
Table of Contents
Index to Financial Statements
Richard K. Stoneburner has served as our President and Chief Operating Officer since September 8, 2009. Mr. Stoneburner served as Executive Vice President—Chief Operating Officer from September 13, 2007 until September 8, 2009 and had previously has served as Executive Vice President—Exploration from August 1, 2005, until September 13, 2007. Mr. Stoneburner served as Vice President—Exploration from May 25, 2004 until August 1, 2005. Prior to joining us, he was employed by PHAWK, LLC from its formation in June 2003 until May 2004. He joined 3TEC in August 1999 and was its Vice President—Exploration from December 1999 until its merger with Plains Exploration & Production Company in June 2003. Mr. Stoneburner was employed by W/ E Energy Company as District Geologist from 1998 to 1999. Prior to joining 3TEC, Mr. Stoneburner worked as a geologist for Texas Oil & Gas, The Reach Group, Weber Energy Corporation, Hugoton and, independently through his own company, Stoneburner Exploration, Inc. Mr. Stoneburner has over 31 years of experience in the energy business.
Mark J. Mize has served as Executive Vice President—Chief Financial Officer and Treasurer since August 10, 2007. Mr. Mize was also appointed and has served as our Chief Ethics Officer and Insider Trading Compliance Officer through June 17, 2009. He served as Vice President, Chief Accounting Officer and Controller from July 2005 until August 10, 2007. Mr. Mize joined us on November 29, 2004 as Controller. Prior to joining us, he was the Manager of Financial Reporting of Cabot Oil & Gas Corporation, a public oil and gas exploration company, from January 2003 to November 2004. Prior to his employment at Cabot Oil & Gas Corporation, he was an Audit Manager with PricewaterhouseCoopers LLP from 1996 to 2002. Mr. Mize is a Certified Public Accountant.
Larry L. Helm has served as Executive Vice President—Finance and Administration since August 10, 2007. Mr. Helm served as Vice President—Chief Administrative Officer from July 15, 2004 until August 1, 2005, and as Executive Vice President—Chief Administrative Officer from August 1, 2005 until August 9, 2007. Prior to serving as an executive officer, Mr. Helm served on our Board of Directors for approximately two months. Mr. Helm was employed with Bank One Corporation from December 1989 through December 2003. Most recently Mr. Helm served as Executive Vice President of Middle Market Banking from October 2001 to December 2003. From April 1998 to August 1999, he served as Executive Vice President of the Energy and Utilities Banking Group. Prior to joining Bank One, he worked for 16 years in the banking industry primarily serving the oil and gas sector. He served as director of 3TEC Energy Corporation from 2000 to June 2003.
Stephen W. Herod has served as Executive Vice President—Corporate Development and Assistant Secretary since August 1, 2005. Mr. Herod served as Vice President—Corporate Development from May 25, 2004 until August 1, 2005. Prior to joining us, he was employed by PHAWK, LLC from its formation in June 2003 until May 2004. He served as Executive Vice President—Corporate Development for 3TEC Energy Corporation from December 1999 until its merger with Plains Exploration & Production Company in June 2003 and as Assistant Secretary from May 2001 until June 2003. Mr. Herod served as a director of 3TEC from July 1997 until January 2002. Mr. Herod served as the Treasurer of 3TEC from 1999 until 2001. From July 1997 to December 1999, Mr. Herod was Vice President—Corporate Development of 3TEC. Mr. Herod served as President and a director of Shore Oil Company from April 1992 until the merger of Shore with 3TEC’s predecessor in June 1997. He joined Shore’s predecessor as Controller in February 1991. Mr. Herod was employed by Conquest Exploration Company from 1984 until 1991 in various financial management positions, including Operations Accounting Manager. From 1981 to 1984, Superior Oil Company employed Mr. Herod as a financial analyst.
David S. Elkouri has served as Executive Vice President—General Counsel and Secretary of Petrohawk since August 1, 2007. Mr. Elkouri has also served as Chief Ethics Officer and Insider Trading Compliance Officer since June 18, 2009. Mr. Elkouri has served as lead outside counsel for Petrohawk since 2004 and has been actively involved with the Company’s growth since that time. Prior to that time he served as lead outside counsel for 3TEC Energy Corporation from its inception in 1999 until it was acquired in 2003 and for Hugoton Energy Corporation from its inception in 1994 until it was acquired in 1998. Mr. Elkouri is a co-founder of Hinkle Elkouri Law Firm L.L.C. Mr. Elkouri’s practice has focused on tax, corporate and securities law with an emphasis on the oil and gas industry. Mr. Elkouri is a graduate of the University of Kansas School of Law where he served as a Research Editor of the Kansas Law Review.
37
Table of Contents
Index to Financial Statements
H. Weldon Holcombe joined Petrohawk on July 12, 2006, effective upon the merger of KCS Energy, Inc. (KCS) with and into the Company and served as Senior Vice President—Mid-Continent Region from March 1, 2007 until October 1, 2007 when he became Executive Vice President—Mid-Continent Region. After the merger of KCS and Petrohawk, Mr. Holcombe became responsible for all of the merged company’s operations in the Mid-Continent Region including our interests in the Elm Grove and Terryville fields among others throughout the Mid-Continent Region. With the Company’s acquisition of Fayetteville Shale acreage in Arkansas and Haynesville Shale acreage in North Louisiana and East Texas, Mr. Holcombe became responsible for the growth and development of these key assets. Prior to the merger of KCS and Petrohawk, Mr. Holcombe served as Senior Vice President of KCS responsible for operations and engineering. Prior to joining KCS in 1996, he spent many years with Exxon in project and management positions associated with sour gas treatment, drilling, completions and reservoir management. Mr. Holcombe holds a degree in engineering from Auburn University.
Charles W. Latch has served as the Company’s Senior Vice President—Western Region since November 2007. From July 2006 through October 2007, Mr. Latch served as the Company’s Vice President of Operations. From 2004 until joining the Company in July 2006, Mr. Latch was employed by KCS Resources, serving as Vice President of Operations since November 2004. Mr. Latch was Senior Vice President of Technical Services with El Paso Production Company from November 2002 until joining KCS Resources.
Tina S. Obut has served as Senior Vice President—Corporate Reserves since May 15, 2008. Ms. Obut served as Vice President—Corporate Reserves from March 2007 to May 15, 2008. Ms. Obut initially joined the Company in April 2006 as Manager of Corporate Reserves. Prior to joining us, Ms. Obut was employed by El Paso Production Company as Manager of Reservoir Engineering Evaluations from July 2004 until April 2006. From 2001 to 2004, Ms. Obut was Planning and Asset Manager at Mission Resources. From 1992 to 2001, Ms. Obut was a Vice President with Ryder Scott Company, and from 1989 to 1992, she worked as a reservoir engineer with Chevron. Ms. Obut is a Registered Petroleum Engineer.
C. Byron Charboneau has served as the Company’s Vice President—Chief Accounting Officer and Controller since March 2008. From August 2007 through February 2008, Mr. Charboneau served as the Financial Controller and from January 2005 through July 2007, Mr. Charboneau served as the Company’s Director of Compliance and Accounting Research. From 1999 until joining the Company in January 2005, Mr. Charboneau was employed in the audit practice of PricewaterhouseCoopers, most recently as an audit manager with the Energy, Utilities and Mining Industry group. Mr. Charboneau is a Certified Public Accountant in New York.
Joan W. Dunlap has served as Vice President—Investor Relations since July 2007. From August 2004 until 2006, Ms. Dunlap served as the Company’s Assistant Treasurer. Prior to joining Petrohawk, she was employed as an investment banking associate with JPMorgan Chase, accredited with Series 7 and Series 63, and as a financial analyst and research assistant for the Federal Reserve Bank. Ms. Dunlap holds a bachelor’s degree in economics from Tulane University and an M.B.A. from Rice University.
Charles E. Cusack III has served as Vice President—Exploration since May 2008. Mr. Cusack currently serves as the Haynesville Shale Project Manager and has most recently served as Petrohawk’s Exploration Manager for the Gulf Coast Division. Mr. Cusack was instrumental in the growth of the region from our initial investment in 2004, to its sale in 2007. Mr. Cusack has over 25 years of exploration and exploitation experience having worked in various positions for 3TEC Energy, Cockrell Oil, Amerada Hess, Tenneco Oil, and Gulf Oil. He holds an engineering degree from Texas A&M University.
38
Table of Contents
Index to Financial Statements
PART II.
| ITEM 5. | MARKET FOR REGISTRANT’S COMMON EQUITY, RELATED STOCKHOLDER MATTERS AND ISSUER PURCHASES OF EQUITY SECURITIES |
Our common stock trades on the New York Stock Exchange (NYSE) under the symbol HK. The following table sets forth the quarterly high and low sales prices per share of our common stock as reported on the New York Stock Exchange from January 1, 2008 through December 31, 2009.
| High | Low | |||||
| 2009 |
||||||
| First Quarter |
$ | 22.87 | $ | 14.89 | ||
| Second Quarter |
26.91 | 18.50 | ||||
| Third Quarter |
25.81 | 18.01 | ||||
| Fourth Quarter |
28.49 | 20.45 | ||||
| 2008 |
||||||
| First Quarter |
$ | 20.49 | $ | 14.00 | ||
| Second Quarter |
48.82 | 19.55 | ||||
| Third Quarter |
54.49 | 17.55 | ||||
| Fourth Quarter |
21.66 | 8.49 | ||||
We have never paid cash dividends on our common stock. We intend to retain earnings for use in the operation and expansion of our business and therefore do not anticipate declaring cash dividends on our common stock in the foreseeable future. Any future determination to pay dividends on common stock will be at the discretion of the board of directors and will be dependent upon then existing conditions, including our prospects, and such other factors, as the board of directors deems relevant. We are also restricted from paying cash dividends on common stock under our Senior Credit Agreement and under the terms of the indentures governing our other long-term debt.
Approximately 549 stockholders of record as of December 31, 2009 held our common stock. In many instances, a registered stockholder is a broker or other entity holding shares in street name for one or more customers who beneficially own the shares.
Changes in Securities, Use of Proceeds and Issuer Purchases of Equity Securities
The following table sets forth certain information with respect to the surrender of our common stock by employees in exchange for the payment of certain tax withholding obligations during the three months ended December 31, 2009.
| Total Number of Shares Purchased (1) |
Average Price Paid Per Share |
Total Number of Shares Purchased as Part of Publicly Announced Plans or Programs |
Maximum Number (or Approximate Dollar Value) of Shares that May Yet Be Purchased Under the Plans or Programs | ||||||
| October 2009 |
2,554 | $ | 23.11 | — | — | ||||
| November 2009 |
1,296 | 23.86 | — | — | |||||
| December 2009 |
63,086 | 23.99 | — | — | |||||
| (1) | All of the shares were surrendered by employees in exchange for the payment of tax withholding upon the vesting of restricted stock awards. The acquisition of the surrendered shares was not part of a publicly announced program to repurchase shares of our common stock, nor were they considered as or accounted for as treasury shares. |
39
Table of Contents
Index to Financial Statements
Five-Year Stock Performance Graph
The following common stock performance graph shows the performance of Petrohawk common stock up to December 31, 2009. As required by applicable rules of the SEC, the performance graph shown below was prepared based on the following assumptions:
| • | A $100 investment was made in Petrohawk common stock and each index on December 31, 2004. |
| • | All quarterly dividends were reinvested at the average of the closing stock prices at the beginning and end of the quarter. |
The indices in the performance graph compare the annual cumulative total stockholder return on Petrohawk common stock with the cumulative total return of the Standard and Poor’s 500 Index (S&P 500) and a peer group index comprised of 12 United States companies engaged in oil and natural gas operations whose stocks were traded on the NASDAQ or the NYSE during the period from December 31, 2004 through December 31, 2009. The companies that comprise the peer group are Cabot Oil & Gas, Corp. (COG), Chesapeake Energy Corp. (CHK), Cimarex Energy Co. (XEC), Comstock Resources Inc. (CRK), EXCO Resources Inc. (XCO), Forest Oil Corp. (FST), Newfield Exploration Co. (NFX), Plains Exploration & Production Company (PXP), Range Resources Corp. (RRC), Sandridge Energy Inc. (SD), Southwestern Energy Co. (SWN), and St. Mary Land & Exploration Co. (SM), collectively referred to as (Peer Group Index).
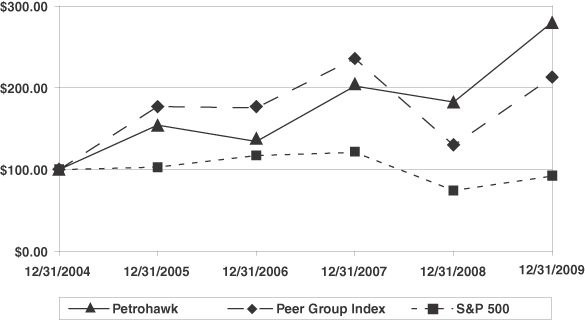
Value of Initial $100 Investment (End of Year)
| 12/31/2004 | 12/31/2005 | 12/31/2006 | 12/31/2007 | 12/31/2008 | 12/31/2009 | |||||||||||||
| Petrohawk |
$ | 100.00 | $ | 154.44 | $ | 134.35 | $ | 202.22 | $ | 182.59 | $ | 280.26 | ||||||
| Peer Group Index |
$ | 100.00 | $ | 177.21 | $ | 175.47 | $ | 235.88 | $ | 129.81 | $ | 213.12 | ||||||
| S&P 500 |
$ | 100.00 | $ | 103.00 | $ | 117.03 | $ | 121.16 | $ | 74.53 | $ | 92.01 | ||||||
40
Table of Contents
Index to Financial Statements
| ITEM 6. | SELECTED FINANCIAL DATA |
The following table presents selected historical financial data derived from our consolidated financial statements. The following data is only a summary and should be read with our historical consolidated financial statements and related notes contained in this document.
| Years Ended December 31, | ||||||||||||||||||||
| 2009 | 2008 | 2007 | 2006 | 2005 | ||||||||||||||||
| (In thousands, except per share data) | ||||||||||||||||||||
| Income Statement Data: |
||||||||||||||||||||
| Total operating revenues |
$ | 1,083,583 | $ | 1,095,210 | $ | 883,405 | $ | 587,762 | $ | 258,039 | ||||||||||
| (Loss) income from operations (1)(2) |
(1,811,248 | ) | (538,050 | ) | 250,649 | 154,540 | 103,890 | |||||||||||||
| Net (loss) income |
(1,025,451 | ) | (388,052 | ) | 52,897 | 116,563 | (16,634 | ) | ||||||||||||
| Net (loss) income available to common stockholders |
(1,025,451 | ) | (388,052 | ) | 52,897 | 116,346 | (17,074 | ) | ||||||||||||
| Net (loss) income per share of common stock: (3) |
||||||||||||||||||||
| Basic |
$ | (3.66 | ) | $ | (1.77 | ) | $ | 0.31 | $ | 0.95 | $ | (0.31 | ) | |||||||
| Diluted |
$ | (3.66 | ) | $ | (1.77 | ) | $ | 0.31 | $ | 0.92 | $ | (0.31 | ) | |||||||
| As of December 31, | ||||||||||||||||||||
| 2009 | 2008 | 2007 | 2006 | 2005 | ||||||||||||||||
| (In thousands) | ||||||||||||||||||||
| Balance sheet data: |
||||||||||||||||||||
| Working capital deficit |
$ | (313,182 | ) | $ | (77,880 | ) | $ | (171,304 | ) | $ | (85,307 | ) | $ | (37,905 | ) | |||||
| Total assets |
6,662,071 | 6,907,329 | 4,672,439 | 4,279,656 | 1,410,174 | |||||||||||||||
| Total long-term debt (4) |
2,592,544 | 2,283,874 | 1,595,127 | 1,326,239 | 495,801 | |||||||||||||||
| Stockholders’ equity |
3,323,672 | 3,404,910 | 2,008,897 | 1,928,344 | 526,458 | |||||||||||||||
| (1) | 2009 includes an approximate $1.8 billion full cost ceiling impairment charge. |
| (2) | 2008 includes an approximate $1.0 billion full cost ceiling impairment charge. |
| (3) | No cash dividends were paid for any periods presented. |
| (4) | Amount excludes the current portion of deferred premiums on derivatives for all periods presented. |
| ITEM 7. | MANAGEMENT’S DISCUSSION AND ANALYSIS OF FINANCIAL CONDITION AND RESULTS OF OPERATIONS |
The following discussion is intended to assist in understanding our results of operations and our current financial condition. Our consolidated financial statements and the accompanying notes included elsewhere in this Form 10-K contain additional information that should be referred to when reviewing this material.
Statements in this discussion may be forward-looking. These forward-looking statements involve risks and uncertainties, including those discussed below, which could cause actual results to differ from those expressed.
Overview
We are an independent oil and natural gas company engaged in the exploration, development and production of predominately natural gas properties located onshore in the United States. Our business is comprised of an oil and natural gas segment and a midstream segment. Our oil and natural gas properties are concentrated in four premier domestic shale plays that we believe have decades of future development potential. We organize our oil and natural gas operations into two principal regions: the Mid-Continent, which includes our Louisiana, Arkansas and East Texas properties; and the Western, which includes our South Texas and Oklahoma properties. Our midstream segment consists of our gathering subsidiary, Hawk Field Services which was formed
41
Table of Contents
Index to Financial Statements
to create shareholder value by integrating our active drilling program with activities of third parties and developing additional gathering and treating capacity serving the Haynesville Shale and Bossier Shale in North Louisiana, the Fayetteville Shale in Arkansas and the Eagle Ford Shale in South Texas.
Historically, we have grown through acquisitions of proved reserves and undeveloped acreage, with a focus on properties within our core operating areas which we believe have significant development and exploration opportunities and where we can apply our technical experience and economies of scale to increase production and proved reserves while lowering lease operating costs. Beginning in 2008 and continuing in 2009, we have significantly expanded our leasehold position in natural gas shale plays, particularly in the Haynesville Shale play in northern Louisiana and East Texas and the Eagle Ford Shale play in South Texas. The vast majority of our acreage in these plays is currently undeveloped. Typically, the leases we own require that production in paying quantities be established on units under the lease within the lease term (generally three to five years) or the lease will expire, although a significant percentage of the leases in the Haynesville Shale play are currently held by production from other producing zones. Lease expirations are expected to be an important factor determining our capital expenditures focus over the next two years.
At December 31, 2009, our estimated total proved oil and natural gas reserves, as prepared by our independent reserve engineering firm, Netherland, Sewell, were approximately 2,750 Bcfe, consisting of 8 MMBbls of oil, and 2,700 Bcf of natural gas and natural gas liquids. Approximately 33% of our proved reserves were classified as proved developed. We maintain operational control of approximately 84% of our proved reserves. Production for the fourth quarter of 2009 averaged 598 Mmcfe/d. Full year 2009 production averaged 502 Mmcfe/d compared to 305 Mmcfe/d in 2008. Our total operating revenues for 2009 were approximately $1.1 billion.
Our financial results depend upon many factors, but are largely driven by the volume of our oil and natural gas production and the price that we receive for that production. Our production volumes will decline as reserves are depleted unless we expend capital in successful development and exploration activities or acquire properties with existing production. The amount we realize for our production depends predominantly upon commodity prices, which are affected by changes in market demand and supply, as impacted by overall economic activity, weather, pipeline capacity constraints, inventory storage levels, basis differentials and other factors, and secondarily upon our commodity price hedging activities. Accordingly, finding and developing oil and natural gas reserves at economical costs is critical to our long-term success.
Our 2010 capital budget is focused on the development of non-proved reserve locations in our Haynesville, Bossier, Eagle Ford and Fayetteville Shale plays so that we can hold our acreage in these areas. We also believe these projects offer us the potential for high internal rates of return and reserve growth. Currently we plan to spend approximately $1.45 billion on drilling and completions during 2010, of which $900 million has been allocated to our Haynesville and Bossier Shale properties, $350 million to our Eagle Ford Shale properties, $100 million to our Fayetteville Shale properties and $100 million to our remaining properties. Our midstream segment will have an estimated capital program of $250 million. Additionally, we expect to spend between $100 million and $300 million on ongoing leasing activities. Our future drilling plans are subject to change based upon various factors, some of which are beyond our control, including drilling results, oil and natural gas prices, the availability and cost of capital, drilling and production costs, availability of drilling services and equipment, gathering system and pipeline transportation constraints and regulatory approvals. To the extent these factors lead to reductions in our drilling plans and associated capital budgets in future periods, our financial position, cash flows and operating results could be adversely impacted.
One consequence of low natural gas prices is the possibility that we may be required to recognize non-cash impairment expense under the full cost method of accounting, which we use to account for our oil and natural gas exploration and development activities. We recorded full cost ceiling impairments before income taxes of approximately $1.7 billion and $1.0 billion at March 31, 2009 and December 31, 2008, respectively, primarily due to the decrease in the Henry Hub spot market price to $3.63 from $5.71 per million British thermal units (Mmbtu). At December 31, 2009, our net book value of oil and gas properties exceeded the ceiling amount based
42
Table of Contents
Index to Financial Statements
on the unweighted arithmetic average of the first day of each month for the 12-month period ended December 31, 2009 using a WTI posted price of $57.65 per barrel and a Henry Hub price of $3.87 per Mmbtu. As a result, we recorded a full cost ceiling impairment before income taxes of approximately $106 million and $65 million after taxes. Changes in prices, production rates, levels of reserves, future development costs, and other factors will determine our actual ceiling test calculation and impairment analyses in future periods.
On October 30, 2009, we closed the previously announced sale of our Permian Basin properties for $376 million in cash, before customary closing adjustments. Proceeds from the sale were recorded as a reduction to the carrying value of our full cost pool. In conjunction with the closing of this sale, we deposited the remaining net proceeds of $331 million with a qualified intermediary to facilitate potential like-kind exchange transactions ($37.6 million was previously received as a deposit). As of December 31, 2009, $213.7 million remained with the intermediary.
During the third quarter of 2009, we announced our intent to further enhance our liquidity position by identifying potential asset dispositions for 2010, which may include a transaction involving our midstream assets, divesting Terryville Field in northwest Louisiana, divesting our interest in the West Edmond Hunton Lime Unit in central Oklahoma as well as other non-core assets.
Capital Resources and Liquidity
Our primary sources of capital resources and liquidity are internally generated cash flows from operations, availability under our Senior Credit Agreement, asset dispositions, and access to capital markets, to the extent available. The capital markets have been adversely impacted by the continued financial crisis and concerns about the economic recession. Volatility in the capital markets could adversely impact our access to capital, which could reduce our ability to execute our development and acquisition plans, our ability to replace our reserves and our production levels. We continue to monitor our liquidity and the capital markets. We continuously evaluate our development plans in light of a variety of factors, including, but not limited to, our cash flows, capital resources and drilling success.
Our future capital resources and liquidity depend, in part, on our success in developing our leasehold interests. Cash is required to fund capital expenditures necessary to offset inherent declines in our production and proven reserves, which is typical in the capital-intensive oil and natural gas industry. Future success in growing reserves and production will be highly dependent on our capital resources and our success in finding additional reserves. During 2008 and 2009, we raised $1.3 billion of debt (net of discounts and expenses) and $2.7 billion of equity capital (net of discounts and expenses). We expect to fund our future capital requirements through internally generated cash flows, borrowings under our Senior Credit Agreement, which has a borrowing base of $1.2 billion at December 31, 2009, potential asset dispositions in 2010, and accessing the capital markets, if necessary. Our ability to utilize the full amount of our borrowing capacity is influenced by a variety of factors, including semi-annual redeterminations of our borrowing base, which may also be redetermined periodically at the discretion of our lenders, and covenants under our Senior Credit Agreement and our senior unsecured debt indentures. Additionally, the indentures governing our senior unsecured debt contain covenants limiting our ability to incur additional indebtedness, including borrowings under our Senior Credit Agreement, unless we meet one of two alternative tests. The first test applies to all indebtedness and requires that after giving effect to the incurrence of additional debt the ratio of our adjusted consolidated EBITDA (as defined in our indentures) to our adjusted consolidated interest expense over the trailing four fiscal quarters will be at least 2.5 to 1.0. The second test applies only to borrowings under our Senior Credit Agreement that do not meet the first test and it limits these borrowings to the greater of a fixed sum (the most restrictive indenture limit being $100 million) and a percentage (the most restrictive indenture limit being 20%) of our adjusted consolidated net tangible assets (as defined in all of our indentures), which is determined using discounted future net revenues from proved natural gas and oil reserves as of the end of each year. Our borrowing base, EBITDA and consolidated net tangible assets are significantly influenced by, among other things, oil and natural gas prices. We strive to maintain financial flexibility while continuing our aggressive drilling plans and may access the capital markets to, among other
43
Table of Contents
Index to Financial Statements
things, maintain substantial borrowing capacity under our Senior Credit Agreement, facilitate drilling on our large undeveloped acreage position and permit us to selectively expand our acreage position and infrastructure projects. Our ability to complete future debt and equity offerings is subject to market conditions.
Our long-term cash flows are subject to a number of variables including our level of production and commodity prices, as well as various economic conditions that have historically affected the oil and natural gas industry. If oil and natural gas prices remain at their current levels for a prolonged period of time or if natural gas prices decline, our ability to fund our capital expenditures, reduce debt, meet our financial obligations and become profitable may be materially impacted.
Cash Flow
Our primary sources of cash in 2009, 2008 and 2007 were from operating and financing activities. Proceeds from the sale of common stock, the issuance of new senior debt and cash received from operations were offset by repayments of our Senior Credit Agreement and cash used in investing activities to fund our drilling program and acquisition activities, net of any divestiture activities. Operating cash flow fluctuations were substantially driven by changes in commodity prices and changes in our production volumes. Working capital was substantially influenced by these variables. Fluctuation in commodity prices and our overall cash flow may result in an increase or decrease in our future capital expenditures. Prices for oil and natural gas have historically been subject to seasonal influences characterized by peak demand and higher prices in the winter heating season; however, the impact of other risks and uncertainties have influenced prices throughout recent years. See Results of Operations below for a review of the impact of prices and volumes on sales.
| Years Ended December 31, | ||||||||||||
| 2009 | 2008 | 2007 | ||||||||||
| (In thousands) | ||||||||||||
| Cash flows provided by operating activities |
$ | 679,127 | $ | 608,955 | $ | 605,045 | ||||||
| Cash flows used in investing activities |
(1,866,638 | ) | (3,030,450 | ) | (876,696 | ) | ||||||
| Cash flows provided by financing activities |
1,182,139 | 2,426,566 | 267,870 | |||||||||
| Net (decrease) increase in cash |
$ | (5,372 | ) | $ | 5,071 | $ | (3,781 | ) | ||||
Operating Activities. Net cash flows provided by operating activities were $679.1 million, $609.0 million and $605.0 million for the years ended December 31, 2009, 2008 and 2007, respectively. Key drivers of net operating cash flows are commodity prices, production volumes and operating costs.
Net cash provided by operating activities increased in 2009 primarily due to the 65% increase in our average daily production volumes due to our recent drilling success in the Haynesville, Fayetteville and Eagle Ford Shales, which was partially offset by a 56% decrease in our average realized natural gas equivalent price compared to the same period in the prior year. Production for 2009 averaged 502 Mmcfe/d compared to 305 Mmcfe/d during 2008. Our natural gas equivalent price decreased $5.18 per Mcfe to $3.99 per Mcfe from $9.17 per Mcfe in the prior year. As a result of our capital budget program, we expect to continue to increase our production volumes throughout 2010. However, we are unable to predict future production levels or future commodity prices, and, therefore, we cannot predict future levels of net cash provided by operating activities.
Net cash flows provided by operating activities increased in 2008 primarily due to our 21% increase in average realized natural gas equivalent price, partially offset by a 4% decrease in production volumes due to the sale of our Gulf Coast properties during the fourth quarter of 2007.
Net cash flows provided by operating activities increased in 2007 primarily due to our 46% increase in production volumes primarily due to our merger with KCS in July 2006, as well as our 3% increase in our realized natural gas equivalent price.
44
Table of Contents
Index to Financial Statements
Investing Activities. The primary driver of cash used in investing activities is capital spending, inclusive of acquisitions and net of divestitures. Cash used in investing activities was $1.9 billion, $3.0 billion and $876.7 million for the years ended December 31, 2009, 2008 and 2007, respectively.
In 2009, we spent $1.7 billion on acquisitions of oil and natural gas properties and capital expenditures. We participated in the drilling of 626 gross wells (162.1 net wells). We spent an additional $309.5 million on other operating property and equipment expenditures, primarily to fund the completion of gathering systems in the Fayetteville Shale in Arkansas and the development of our gathering systems in the Haynesville Shale in Louisiana and the Eagle Ford Shale in Texas.
In 2009, we redeemed a net $123.0 million of marketable securities. These marketable securities were classified and accounted for as trading securities and were used primarily to fund a portion of our 2009 capital program. No amounts remain outstanding as of December 31, 2009.
On July 31, 2009, we purchased all outstanding membership interests in Kaiser Trading, LLC (Kaiser) for approximately $105 million. Kaiser’s only assets were transportation-related contracts including a firm transportation contract, interruptible gas transportation service agreement, parking and lending services agreement, and a pooling services agreement. The initial firm transportation contract runs-through 2013 and at no additional cost, we have the contractual right to extend firm supply through 2019. The purchase price has been allocated to the transportation related contracts at fair market value which will be amortized on a straight line basis over the life of the extended agreement.
On October 30, 2009, we sold our Permian Basin properties for $376 million in cash, before customary closing adjustments. Proceeds from the sale were recorded as a reduction to the carrying value of our full cost pool. In conjunction with the closing of this sale, we deposited the remaining net proceeds of $331 million with a qualified intermediary to facilitate potential like-kind exchange transactions ($37.6 million was previously received as a deposit). As of December 31, 2009, $213.7 million remained with the intermediary.
In 2008, we spent $3.1 billion on acquisitions of oil and natural gas properties and capital expenditures. Our acquisitions were partially funded by the remaining restricted cash that we had deposited with a qualified intermediary to facilitate like-kind exchange transactions following the sale of our Gulf Coast properties. We participated in the drilling of 739 gross wells (267.4 net wells) in 2008. We spent an additional $164.8 million on other operating property and equipment during 2008 as well, primarily to fund the development of gathering systems primarily in the Fayetteville Shale in Arkansas and the beginning stages of the development of our gathering systems in the Haynesville Shale in Louisiana.
In 2008, we used a portion of the funds from our debt and equity offerings to purchase a net $123.0 million of marketable securities. These marketable securities were classified and accounted for as trading securities and were used primarily to fund our leasing and acquisition activities in the Haynesville Shale.
In 2007, we spent $1.3 billion on acquisitions of oil and natural gas properties and capital expenditures. We spent $764.3 million on capital expenditures in conjunction with our drilling program. We participated in the drilling of 420 gross wells (206.5 net wells) in 2007. In addition, we spent $488.9 million primarily to acquire additional interests in the Fayetteville Shale in Arkansas and in both the Elm Grove and Terryville fields in Louisiana.
On November 30, 2007, we closed the sale of our Gulf Coast properties for $825 million, before customary closing adjustments, consisting of $700 million in cash and a $125 million note from the purchaser (the Note). The Note matured five years and ninety-one days from the closing date and bore interest at 12% per annum payable in kind at the purchaser’s option. The economic effective date for the sale was July 1, 2007. Proceeds from the sale were recorded as a decrease to our full cost pool. In conjunction with the closing of this sale, we deposited $650 million with a qualified intermediary to facilitate potential like-kind exchange transactions. At
45
Table of Contents
Index to Financial Statements
December 31, 2007, we had $269.8 million remaining for use in future acquisitions, all of which was utilized for property acquisitions. On April 28, 2008, the purchaser redeemed the Note for $100 million.
During the third quarter of 2007, we closed our acquisition of One TEC, LLC, with properties primarily in Arkansas and Texas, for $39.9 million, net of $2.1 million cash acquired.
Financing Activities. The primary driver of cash provided by financing activities is proceeds from our issuance of common stock and long-term debt offset by repayments of long-term debt. Net cash flows provided by financing activities were $1.2 billion, $2.4 billion and $267.9 million for the years ended December 31, 2009, 2008 and 2007, respectively.
On August 11, 2009, we sold an aggregate of 25.0 million shares of our common stock in an underwritten public offering. The net proceeds from the sale were approximately $550 million, after deducting underwriting discounts and commissions and expenses.
On March 4, 2009, we sold an aggregate of 22.0 million shares of our common stock in an underwritten public offering. The net proceeds from this offering were approximately $376 million, after deducting underwriting discounts and commissions and expenses.
On January 27, 2009, we completed a private placement to eligible purchasers of an aggregate principal amount of $600 million 10.5% senior notes due August 1, 2014 (2014 Notes). The net proceeds from the sale of the 2014 Notes were approximately $535.4 million, after deducting the initial purchasers’ discounts and offering expenses and commissions.
On August 15, 2008, we sold an aggregate of 28.8 million shares of our common stock in an underwritten public offering. The net proceeds from the sale were approximately $734 million, after deducting underwriting discounts and commissions and expenses.
On June 19, 2008, we issued $300 million aggregate principal amount of 7.875% Senior Notes due 2015 (2015 Notes) in a private placement to eligible purchasers. The net proceeds from the sale of the 2015 Notes were approximately $294 million, after deducting the initial purchaser’s discount and offering expenses.
On May 13, 2008, we issued $500 million aggregate principal amount of the 2015 Notes in a private placement to eligible purchasers. The net proceeds from the sale of the 2015 Notes were approximately $490 million, after deducting the initial purchasers discounts and offering expenses, including commissions.
On May 13, 2008, we sold an aggregate of 25.0 million shares of our common stock in an underwritten public offering. Pursuant to the underwriting agreement, we granted the underwriters a 30-day option to purchase up to an additional 3.75 million shares of common stock at the public offering price less underwriting discounts and commissions. The underwriters exercised in full their option to purchase additional shares of common stock which closed on May 23, 2008. The net proceeds from these sales were approximately $727 million, after deducting underwriting discounts and commissions and expenses.
On February 1, 2008, we sold an aggregate of 20.7 million shares of our common stock in an underwritten public offering. The net proceeds from the sale were approximately $297 million, after deducting underwriting discounts and commissions and expenses.
Capital financing and excess cash flow are used to repay debt to the extent available. In 2009, we had net borrowings of $282.0 million primarily due to the cash requirements of our drilling and acquisition activities in 2009 offset by the sale of common stock and issuances of long term debt discussed above. As of December 31, 2009, our Senior Credit Agreement had a $1.2 billion borrowing base and we had $203 million outstanding.
46
Table of Contents
Index to Financial Statements
Cash flows provided by financing activities include net borrowings of $677.7 million and $260.4 million for the years ended December 31, 2008 and 2007, respectively, primarily due to our acquisition activities and our ongoing drilling activities.
Contractual Obligations
We believe we have a significant degree of flexibility to adjust the level of our future capital expenditures as circumstances warrant. Our level of capital expenditures will vary in future periods depending on the success we experience in our acquisition, developmental and exploration activities, oil and natural gas price conditions and other related economic factors. Currently no sources of liquidity or financing are provided by off-balance sheet arrangements or transactions with unconsolidated, limited-purpose entities. The following table summarizes our contractual obligations and commitments by payment periods as of December 31, 2009.
| Contractual Obligations |
Payments Due by Period | ||||||||||||||
| Total | 2010 | 2011-2012 | 2013-2014 | 2015 and Beyond | |||||||||||
| (In thousands) | |||||||||||||||
| Senior revolving credit facility |
$ | 203,000 | $ | — | $ | — | $ | 203,000 | $ | — | |||||
| 10.5% $600 million senior notes (1) |
600,000 | — | — | 600,000 | — | ||||||||||
| 7.875% $800 million senior notes |
800,000 | — | — | — | 800,000 | ||||||||||
| 9.125% $775 million senior notes (2) |
768,725 | — | — | 768,725 | — | ||||||||||
| 7.125% $275 million senior notes (3) |
272,375 | — | 272,375 | — | — | ||||||||||
| 9.875% senior notes |
224 | — | 224 | — | — | ||||||||||
| Interest expense on long-term debt (4) |
961,871 | 226,930 | 439,268 | 269,423 | 26,250 | ||||||||||
| Deferred premiums on derivatives (5) |
53,440 | 49,370 | 4,070 | — | — | ||||||||||
| Rig commitments |
297,529 | 139,162 | 158,367 | — | — | ||||||||||
| Transportation contracts |
1,392,877 | 109,451 | 262,484 | 248,275 | 772,667 | ||||||||||
| Other commitments (6) |
92,878 | 92,878 | — | — | — | ||||||||||
| Operating leases |
33,303 | 9,183 | 11,236 | 9,601 | 3,283 | ||||||||||
| Total contractual obligations |
$ | 5,476,222 | $ | 626,974 | $ | 1,148,024 | $ | 2,099,024 | $ | 1,602,200 | |||||
| (1) | Excludes $45.8 million unamortized discount recorded in conjunction with the issuance of the notes. See “10.5% Senior Notes” below for more details. |
| (2) | Excludes $4.8 million of unamortized discount and $0.8 million of unamortized premium recorded in conjunction with the issuance of the notes. See “9.125% Senior Notes” below for more details. |
| (3) | Excludes a net $6.0 million discount recorded in conjunction with our merger with KCS. See “7.125% Senior Notes” below for more details. |
| (4) | Future interest expense was calculated based on interest rates and amounts outstanding at December 31, 2009 less required annual repayments. |
| (5) | Approximately $49.4 million of this amount has been classified as current at December 31, 2009. |
| (6) | Other commitments pertains to exploration, development and production activities including commitments for pipeline and well equipment, obtaining and processing seismic data. |
The contractual obligations table does not include obligations to taxing authorities due to the uncertainty surrounding the ultimate settlement of amounts and timing of these obligations. In addition, amounts related to our asset retirement obligations are not included in the table above given the uncertainty regarding the actual timing of such expenditures. The total amount of asset retirement obligations at December 31, 2009 is $44 million.
Senior Revolving Credit Facility
We entered into the Fourth Amended and Restated Senior Revolving Credit Agreement, dated as of October 14, 2009 (the Senior Credit Agreement), between us, each of the lenders from time to time party thereto (the Lenders), BNP Paribas, as administrative agent for the Lenders, Bank of America, N.A. and BMO Capital
47
Table of Contents
Index to Financial Statements
Markets Financing, Inc. as co-syndication agents for the Lenders, and JPMorgan Chase Bank, N.A. and Wells Fargo Bank, N.A., as co-documentation agents for the Lenders., which amends and restates its Third Amended and Restated Senior Revolving Credit Agreement dated September 10, 2008. The Senior Credit Agreement provides for a $2.0 billion facility with a borrowing base of $1.5 billion, $1.2 billion of which relates to our oil and natural gas properties and up to $300 million (currently limited as described below) of which relates to our midstream assets. The $1.2 billion borrowing base attributable to our oil and natural gas properties was reduced $200 million to $1.0 billion upon the closing of the sale of the Permian Basin properties on October 30, 2009. The portion of the borrowing base which relates to our oil and natural gas properties will be redetermined on a semi-annual basis (with us and the Lenders each having the right to one annual interim unscheduled redetermination) and adjusted based on our oil and natural gas properties, reserves, other indebtedness and other relevant factors. The component of the borrowing base related to our midstream assets is limited to the lesser of $300 million or 3.5 times midstream EBITDA, and is automatically determined quarterly. Our borrowing base is subject to a reduction equal to the product of $0.25 multiplied by the stated principal amount (without regard to any initial issue discount) of any notes that we may issue.
Amounts outstanding under the Senior Credit Agreement bear interest at specified margins over LIBOR of 2.25% to 3.25% for Eurodollar loans or at specified margins over ABR of 0.75% to 1.75% for ABR loans. Such margins will fluctuate based on the utilization of the facility. Borrowings under the Senior Credit Agreement will be secured by first priority liens on substantially all of our assets, including pursuant to the terms of the Fourth Amended and Restated Guarantee and Collateral Agreement, all of the assets of, and equity interests in, our subsidiaries. Amounts drawn down on the facility will mature on July 1, 2013.
The Senior Credit Agreement contains customary financial and other covenants, including minimum working capital levels (the ratio of current assets plus the unused commitment under the Senior Credit Agreement to current liabilities) of not less than 1.0 to 1.0 and minimum coverage of interest expenses of not less than 2.5 to 1.0. In addition, we are subject to covenants limiting dividends and other restricted payments, transactions with affiliates, incurrence of debt, changes of control, asset sales, and liens on properties. At December 31, 2009, we were in compliance with our financial debt covenants under the Senior Credit Agreement.
10.5% Senior Notes
On January 27, 2009, we issued $600 million principal amount of our 10.5% senior notes due 2014 (the 2014 Notes). The 2014 Notes were issued under and are governed by an indenture dated January 27, 2009, between us, U.S. Bank National Association, as trustee, and our subsidiaries named therein as guarantors. The 2014 Notes bear interest at 10.5% per annum, payable semi-annually on February 1 and August 1 of each year, commencing on August 1, 2009. The 2014 Notes will mature on August 1, 2014. The 2014 Notes were priced at 91.279% of the face value to yield 12.7% to maturity. The 2014 Notes are senior unsecured obligations and rank equally with all of our current and future senior indebtedness.
In conjunction with the issuance of the $600 million 2014 Notes, we recorded a discount of $52.3 million to be amortized over the remaining life of the notes utilizing the effective interest rate method. The remaining unamortized discount was $45.8 million at December 31, 2009.
7.875% Senior Notes
On May 13, 2008 and June 19, 2008, we issued $500 million principal amount and $300 million principal amount, respectively, of our 7.875% senior notes due 2015 (the 2015 Notes). The 2015 Notes were issued under and are governed by an indenture dated May 13, 2008, between us, U.S. Bank Trust National Association, as trustee, and our subsidiaries named therein as guarantors. The 2015 Notes bear interest at a rate of 7.875% per annum, payable semi-annually on June 1 and December 1 of each year, commencing December 1, 2008. The 2015 notes will mature on June 1, 2015. The 2015 Notes are senior unsecured obligations and rank equally with all of our current and future senior indebtedness. The 2015 Notes were issued at par value, with no discount or premium recorded.
48
Table of Contents
Index to Financial Statements
9.125% Senior Notes
On July 12 and 27, 2006, we issued a total of $775 million principal amount of 9.125% senior notes, also referred to as the 2013 Notes, pursuant to an Indenture dated as of July 12, 2006 (2013 Indenture) and the First Supplemental Indenture to the 2013 Notes (the 2013 First Supplemental Indenture), among us, our subsidiaries named therein as guarantors, and U.S. Bank National Association, as trustee. We issued the 2013 Notes in two tranches, $650 million on July 12, 2006 and $125 million on July 27, 2006. The additional $125 million in 2013 Notes were issued pursuant to the same Indenture at 101.125% of the face amount. We applied the net proceeds from the sale of the additional 2013 Notes to repay indebtedness outstanding under our revolving credit facility. The $650 million tranche of 2013 Notes were issued at 98.735% of the face amount for gross proceeds of approximately $642.0 million, before estimated offering expenses and the initial purchasers’ discount. We applied a portion of the net proceeds from the sale of the 2013 Notes to fund the cash paid by us to the KCS stockholders in connection with our merger with KCS and our repurchase of the 9.875% notes due 2011 (2011 Notes) pursuant to a tender offer we concluded in July 2006.
In conjunction with the issuance of the $650 million 2013 Notes, we recorded a discount of $8.2 million to be amortized over the remaining life of the notes utilizing the effective interest rate method. The remaining unamortized discount was $4.8 million at December 31, 2009. In conjunction with the issuance of the additional $125 million 2013 Notes, we recorded a premium of $1.4 million to be amortized over the remaining life of the notes utilizing the effective interest rate method. The remaining unamortized premium was $0.8 million at December 31, 2009.
7.125% Senior Notes
In our merger with KCS, we assumed (pursuant to the Second Supplemental Indenture relating to the 7.125% Senior Notes, also referred to as the 2012 Notes), all the obligations (approximately $275 million) of KCS under the 2012 Notes and the Indenture dated April 1, 2004 (the 2012 Indenture) among KCS, U.S. Bank National Association, as trustee, and the subsidiary guarantors named therein, which governs the terms of the 7.125% senior notes due 2012. The 2012 Notes are guaranteed on an unsubordinated, unsecured basis by all of our current subsidiaries. Interest on the 2012 Notes is payable semi-annually, on each April 1 and October 1.
In conjunction with the assumption of the 7.125% Notes from KCS, we recorded a discount of $13.6 million to be amortized over the remaining life of the notes utilizing the effective interest rate method. The remaining unamortized discount was $6.0 million at December 31, 2009.
9.875% Senior Notes
On April 8, 2004, Mission Resources Corporation (Mission) issued $130.0 million of its 9.875% senior notes due 2011 (the 2011 Notes). We assumed these notes upon the closing of our merger with Mission. In conjunction with our merger with KCS, we extinguished substantially all of the 2011 Notes for a premium of $14.9 million plus accrued interest of $3.5 million.
Off-Balance Sheet Arrangements
At December 31, 2009, we did not have any material off-balance sheet arrangements.
Critical Accounting Policies and Estimates
The discussion and analysis of our financial condition and results of operations are based upon our consolidated financial statements, which have been prepared in accordance with accounting principles generally accepted in the United States. The preparation of our consolidated financial statements requires us to make estimates and assumptions that affect our reported results of operations and the amount of reported assets,
49
Table of Contents
Index to Financial Statements
liabilities and proved oil and natural gas reserves. Some accounting policies involve judgments and uncertainties to such an extent that there is reasonable likelihood that materially different amounts could have been reported under different conditions, or if different assumptions had been used. Actual results may differ from the estimates and assumptions used in the preparation of our consolidated financial statements. Described below are the most significant policies we apply in preparing our consolidated financial statements, some of which are subject to alternative treatments under accounting principles generally accepted in the United States. We also describe the most significant estimates and assumptions we make in applying these policies. We discussed the development, selection and disclosure of each of these with our audit committee. See Results of Operations above and Item 8. Consolidated Financial Statements and Supplementary Data—Note 1, “Summary of Significant Events and Accounting Policies,” for a discussion of additional accounting policies and estimates made by management.
Oil and Natural Gas Activities
Accounting for oil and natural gas activities is subject to unique rules. Two generally accepted methods of accounting for oil and natural gas activities are available - successful efforts and full cost. The most significant differences between these two methods are the treatment of unsuccessful exploration costs and the manner in which the carrying value of oil and natural gas properties are amortized and evaluated for impairment. The successful efforts method requires unsuccessful exploration costs to be expensed as they are incurred upon a determination that the well is uneconomical while the full cost method provides for the capitalization of these costs. Both methods generally provide for the periodic amortization of capitalized costs based on proved reserve quantities. Impairment of oil and natural gas properties under the successful efforts method is based on an evaluation of the carrying value of individual oil and natural gas properties against their estimated fair value, while impairment under the full cost method requires an evaluation of the carrying value of oil and natural gas properties included in a cost center against the net present value of future cash flows from the related proved reserves, using the unweighted arithmetic average of the first day of the month for each of the 12-month prices for oil and natural gas within the period, holding prices and costs constant and applying a 10% discount rate.
Full Cost Method
We use the full cost method of accounting for our oil and natural gas activities. Under this method, all costs incurred in the acquisition, exploration and development of oil and natural gas properties are capitalized into a cost center (the amortization base). Such amounts include the cost of drilling and equipping productive wells, dry hole costs, lease acquisition costs and delay rentals. All general and administrative costs unrelated to drilling activities are expensed as incurred. The capitalized costs of our oil and natural gas properties, plus an estimate of our future development and abandonment costs, are amortized on a unit-of-production method based on our estimate of total proved reserves. Our financial position and results of operations could have been significantly different had we used the successful efforts method of accounting for our oil and natural gas activities.
Proved Oil and Natural Gas Reserves
Estimates of our proved reserves included in this report are prepared in accordance with accounting principles generally accepted in the United States and SEC guidelines. Our engineering estimates of proved oil and natural gas reserves directly impact financial accounting estimates, including depreciation, depletion and amortization expense and the full cost ceiling limitation. Proved oil and natural gas reserves are the estimated quantities of oil and natural gas reserves that geological and engineering data demonstrate with reasonable certainty to be recoverable in future years from known reservoirs under defined economic and operating conditions. The process of estimating quantities of proved reserves is very complex, requiring significant subjective decisions in the evaluation of all geological, engineering and economic data for each reservoir. The accuracy of a reserve estimate is a function of: (i) the quality and quantity of available data; (ii) the interpretation of that data; (iii) the accuracy of various mandated economic assumptions and (iv) the judgment of the persons preparing the estimate. The data for a given reservoir may change substantially over time as a result of numerous factors, including additional development activity, evolving production history and continual reassessment of the
50
Table of Contents
Index to Financial Statements
viability of production under varying economic conditions. Changes in oil and natural gas prices, operating costs and expected performance from a given reservoir also will result in revisions to the amount of our estimated proved reserves.
Our estimated proved reserves for the years ended December 31, 2009, 2008 and 2007 were prepared by Netherland, Sewell, an independent oil and natural gas reservoir engineering consulting firm. For more information regarding reserve estimation, including historical reserve revisions, refer to Item 8. Consolidated Financial Statements and Supplementary Data—“Supplemental Oil and Gas Information (Unaudited).”
Depreciation, Depletion and Amortization
Our rate of recording depreciation, depletion and amortization expense (DD&A) is primarily dependent upon our estimate of proved reserves, which is utilized in our unit-of-production method calculation. If the estimates of proved reserves were to be reduced, the rate at which we record DD&A expense would increase, reducing net income. Such a reduction in reserves may result from calculated lower market prices, which may make it non-economic to drill for and produce higher cost reserves. A five percent positive or negative revision to proved reserves would decrease or increase the DD&A rate by approximately $0.09 per Mcfe.
Full Cost Ceiling Limitation
Under the full cost method, we are subject to quarterly calculations of a ceiling or limitation on the amount of our oil and natural gas properties that can be capitalized on our balance sheet. If the net capitalized costs of our oil and natural gas properties exceed the cost center ceiling, we are subject to a ceiling test writedown to the extent of such excess. If required, it would reduce earnings and impact stockholders’ equity in the period of occurrence and result in lower amortization expense in future periods. The discounted present value of our proved reserves is a major component of the ceiling calculation and represents the component that requires the most subjective judgments. However, the associated prices of oil and natural gas reserves that are included in the discounted present value of the reserves do not require judgment. The ceiling calculation dictates that we use the unweighted arithmetic average price of oil and natural gas as of the first day of each month for the 12-month period ending at the balance sheet date. If average oil and natural gas prices decline, or if we have downward revisions to our estimated proved reserves, it is possible that writedowns of our oil and natural gas properties could occur in the future.
If the unweighted arithmetic average price of oil and natural gas as of the first day of each month for the 12-month period ended December 31, 2009 had been 10% lower while all other factors remained constant, our ceiling amount related to its net book value of oil and natural gas properties would have been reduced approximately $424.0 million resulting in an additional ceiling test impairment of approximately $689.9 million, before income taxes.
Future Development and Abandonment Costs
Future development costs include costs incurred to obtain access to proved reserves such as drilling costs and the installation of production equipment. Future abandonment costs include costs to dismantle and relocate or dispose of our production facilities, gathering systems and related structures and restoration costs. We develop estimates of these costs for each of our properties based upon their geographic location, type of production structure, well depth, currently available procedures and ongoing consultations with construction and engineering consultants. Because these costs typically extend many years into the future, estimating these future costs is difficult and requires management to make judgments that are subject to future revisions based upon numerous factors, including changing technology and the political and regulatory environment. We review our assumptions and estimates of future development and future abandonment costs on an annual basis. A five percent decrease or increase in future development and abandonment costs would decrease or increase the DD&A rate by approximately $0.06 per Mcfe.
51
Table of Contents
Index to Financial Statements
Asset Retirement Obligations
We have significant obligations to remove tangible equipment and facilities associated with our oil and natural gas wells and our gathering systems, and to restore land at the end of oil and natural gas production operations. Our removal and restoration obligations are associated with plugging and abandoning wells and our gathering systems. Estimating the future restoration and removal costs is difficult and requires us to make estimates and judgments because most of the removal obligations are many years in the future and contracts and regulations often have vague descriptions of what constitutes removal. Asset removal technologies and costs are constantly changing, as are regulatory, political, environmental, safety and public relations considerations. Inherent in the present value calculations are numerous assumptions and judgments including the ultimate settlement amounts, inflation factors, credit adjusted discount rates, timing of settlements and changes in the legal, regulatory, environmental and political environments.
Accounting for Derivative Instruments and Hedging Activities
We account for our derivative activities under the provisions of ASC 815, Derivatives and Hedging, (ASC 815). ASC 815 establishes accounting and reporting that every derivative instrument be recorded on the balance sheet as either an asset or liability measured at fair value. From time to time, we may hedge a portion of our forecasted oil and natural gas production. Derivative contracts entered into by us have consisted of transactions in which we hedge the variability of cash flow related to a forecasted transaction. We have elected to not designate any of our positions for hedge accounting. Accordingly, we record the net change in the mark-to-market valuation of these positions, as well as payments and receipts on settled contracts, in “Net gain (loss) on derivative contracts” on the consolidated statements of operations.
Goodwill
We account for goodwill in accordance with ASC 350, Intangibles—Goodwill and Other (ASC 350). Goodwill represents the excess of the purchase price over the estimated fair value of the assets acquired net of the fair value of liabilities assumed in an acquisition. ASC 350 requires that intangible assets with indefinite lives, including goodwill, be evaluated on an annual basis for impairment or more frequently if an event occurs or circumstances change that could potentially result in impairment. The goodwill impairment test requires the allocation of goodwill and all other assets and liabilities to reporting units. We have determined that we have two reporting units: oil and natural gas production and midstream operations. All of our goodwill has been allocated to our oil and natural gas reporting unit as all of our historical goodwill relates to our acquisitions of oil and natural gas companies.
We perform our goodwill test annually during the third quarter or more often if circumstances require. Our goodwill impairment reviews consists of a two-step process. The first step is to determine the fair value of our reporting units and compare it to the carrying value of the related net assets. Fair value is determined based on our estimates of market values. If this fair value exceeds the carrying value no further analysis or goodwill write-down is required. The second step is required if the fair value of the reporting units is less than the carrying value of the net assets. In this step the implied fair value of the reporting units is allocated to all the underlying assets and liabilities, including both recognized and unrecognized tangible and intangible assets, based on their fair values. If necessary, goodwill is then written-down to its implied fair value. If the fair value of the reporting units is less than the book value (including goodwill), then goodwill is reduced to its implied fair value and the amount of the writedown is charged against earnings. The assumptions we used in calculating its reporting unit fair values at the time of the test include our market capitalization and discounted future cash flows based on estimated reserves and production, future costs and future oil and natural gas prices. Adverse changes to any of these factors could lead to an impairment of all or a portion of our goodwill in future periods.
Income Taxes
Our provision for taxes includes both state and federal taxes. We account for income taxes using the asset and liability method wherein deferred tax assets and liabilities are recognized for the future tax consequences
52
Table of Contents
Index to Financial Statements
attributable to differences between financial statement carrying amounts of existing assets and liabilities and their respective tax bases. Deferred tax assets and liabilities are measured using enacted tax rates expected to apply to taxable income in the years in which temporary differences are expected to be recovered or settled. Deferred tax assets are reduced by a valuation allowance if, based on the weight of available evidence, it is more likely than not that some portion or all of the deferred tax assets will not be realized.
We follow ASC 740, Income Taxes, (ASC 740). ASC 740 creates a single model to address accounting for the uncertainty in income tax positions and prescribes a minimum recognition threshold a tax position must meet before recognition in the financial statements. We apply significant judgment in evaluating our tax positions and estimating our provision for income taxes. During the ordinary course of business, there are many transactions and calculations for which the ultimate tax determination is uncertain. The actual outcome of these future tax consequences could differ significantly from these estimates, which could impact our financial position, results of operations and cash flows. The evaluation of a tax position in accordance with ASC 740 is a two-step process. The first step is a recognition process to determine whether it is more likely than not that a tax position will be sustained upon examination, including resolution of any related appeals or litigation processes, based on the technical merits of the position. In evaluating whether a tax position has met the more likely than not recognition threshold, it is presumed that the position will be examined by the appropriate taxing authority with full knowledge of all relevant information. The second step is a measurement process whereby a tax position that meets the more likely than not recognition threshold is calculated to determine the amount of benefit/expense to recognize in the financial statements. The tax position is measured at the largest amount of benefit/expense that is more likely than not of being realized upon ultimate settlement.
53
Table of Contents
Index to Financial Statements
Comparison of Results of Operations
Year Ended December 31, 2009 Compared to Year Ended December 31, 2008
We reported a net loss of $1.0 billion for the year ended December 31, 2009 compared to a net loss of $388.1 million for the comparable period in 2008. The increase in our net loss of $637.4 million from the year ended December 31, 2008 was primarily driven by our full cost ceiling impairment of $1.8 billion before taxes in 2009 compared to a full cost ceiling impairment of $950.8 million in 2008. The following table summarizes key items of comparison and their related change for the periods indicated.
| In thousands (except per unit and per Mcfe amounts) |
Years Ended December 31, |
Change | ||||||||||
| 2009 | 2008 | |||||||||||
| Net loss available to common stockholders |
$ | (1,025,451 | ) | $ | (388,052 | ) | $ | (637,399 | ) | |||
| Operating revenues: |
||||||||||||
| Oil and natural gas |
732,137 | 1,025,995 | (293,858 | ) | ||||||||
| Marketing |
320,121 | 63,553 | 256,568 | |||||||||
| Midstream |
31,325 | 5,662 | 25,663 | |||||||||
| Operating expenses: |
||||||||||||
| Marketing |
316,987 | 58,581 | 258,406 | |||||||||
| Production: |
||||||||||||
| Lease operating |
78,698 | 52,477 | 26,221 | |||||||||
| Workover and other |
2,749 | 5,624 | (2,875 | ) | ||||||||
| Taxes other than income |
57,712 | 47,104 | 10,608 | |||||||||
| Gathering, transportation and other: |
||||||||||||
| Oil and natural gas |
69,287 | 43,012 | 26,275 | |||||||||
| Midstream |
21,078 | 4,297 | 16,781 | |||||||||
| General and administrative: |
||||||||||||
| General and administrative |
98,774 | 62,500 | 36,274 | |||||||||
| Stock-based compensation |
14,458 | 12,310 | 2,148 | |||||||||
| Depletion, depreciation and amortization: |
||||||||||||
| Depletion—Full cost |
380,003 | 391,042 | (11,039 | ) | ||||||||
| Depreciation—Midstream |
12,219 | 1,820 | 10,399 | |||||||||
| Depreciation—Other |
2,961 | 2,448 | 513 | |||||||||
| Accretion expense |
1,461 | 1,246 | 215 | |||||||||
| Full cost ceiling impairment |
1,838,444 | 950,799 | 887,645 | |||||||||
| Other income (expenses): |
||||||||||||
| Net gain on derivative contracts |
260,248 | 156,870 | 103,378 | |||||||||
| Interest expense and other |
(229,419 | ) | (151,825 | ) | (77,594 | ) | ||||||
| (Loss) income before income taxes: |
||||||||||||
| Oil and natural gas |
(1,802,850 | ) | (531,069 | ) | (1,271,781 | ) | ||||||
| Midstream |
22,431 | (1,936 | ) | 24,367 | ||||||||
| Income tax benefit |
754,968 | 144,953 | 610,015 | |||||||||
| Production: |
||||||||||||
| Natural gas—Mmcf (1) |
174,036 | 102,273 | 71,763 | |||||||||
| Oil—MBbl |
1,520 | 1,554 | (34 | ) | ||||||||
| Natural gas equivalent—Mmcfe |
183,156 | 111,597 | 71,559 | |||||||||
| Average daily production—Mmcfe |
502 | 305 | 197 | |||||||||
| Average sales price per unit (2) : |
||||||||||||
| Natural gas—Mcf (1) |
$ | 3.70 | $ | 8.56 | $ | (4.86 | ) | |||||
| Oil—Bbl |
56.15 | 95.16 | (39.01 | ) | ||||||||
| Natural gas equivalent—Mcfe |
3.99 | 9.17 | (5.18 | ) | ||||||||
| Average cost per Mcfe: |
||||||||||||
| Production: |
||||||||||||
| Lease operating |
0.43 | 0.47 | (0.04 | ) | ||||||||
| Workover and other |
0.02 | 0.05 | (0.03 | ) | ||||||||
| Taxes other than income |
0.32 | 0.42 | (0.10 | ) | ||||||||
| Gathering, transportation and other: |
||||||||||||
| Oil and natural gas |
0.38 | 0.39 | (0.01 | ) | ||||||||
| Midstream |
0.11 | 0.03 | 0.08 | |||||||||
| General and administrative: |
||||||||||||
| General and administrative |
0.54 | 0.56 | (0.02 | ) | ||||||||
| Stock-based compensation |
0.08 | 0.11 | (0.03 | ) | ||||||||
| Depletion—Full cost |
2.07 | 3.50 | (1.43 | ) | ||||||||
| (1) | Approximately 1% and 2% of natural gas production represents natural gas liquids (calculated with a 6:1 equivalent ratio) with an average price of $28.20 per Bbl and $56.63 per Bbl for the years ended December 31, 2009 and 2008, respectively. |
| (2) | Amounts exclude the impact of cash paid/received on settled contracts as we did not elect to apply hedge accounting. |
54
Table of Contents
Index to Financial Statements
For the year ended December 31, 2009, oil and natural gas revenues decreased $293.9 million from the same period in 2008, to $732.1 million. The decrease was primarily due to the decrease of $5.18 per Mcfe in our realized average price to $3.99 per Mcfe from $9.17 per Mcfe in the prior year. This decrease per Mcfe led to a decrease in oil and natural gas revenues of $949 million. The effect of lower prices was partially offset by an increase in production of 71,559 Mmcfe or 64% over 2008 due to our continued drilling successes in resource-style plays in Louisiana, Arkansas and Texas. Increased production contributed approximately $655 million in revenues for the year ended December 31, 2009.
We had marketing revenues of $320.1 million and marketing expenses of $317.0 million in 2009, resulting in a net margin of $3.1 million. During the fourth quarter of 2008, we began purchasing and selling third party natural gas produced from wells we operate. We report the revenues and expenses related to these marketing activities on a gross basis as part of our operating revenues and operating expenses. Marketing revenues are recorded at the time natural gas is physically delivered to third parties at a fixed or index price. Marketing expenses attributable to gas purchases are recorded as we take physical title to the natural gas and transport the purchased volumes to the point of sale.
We had gross revenues from our midstream segment of $85.8 million for the year ended December 31, 2009 compared to the same period in 2008 of $9.4 million, an increase of $76.4 million of which $50.7 million represents inter-segment revenues that are eliminated in consolidation. The remaining $25.7 million increase represents gathering and treating revenues from third party owners in our operated wells and revenues associated with third party producers. On a net basis we had revenues of $31.3 million for the year ended December 31, 2009, an increase of $25.7 million from the prior year. The increase in revenues was directly related to the increase in throughput on our gathering systems and treating facilities. Gathering throughput increased 121.7 Mmcf to 138.7 Mmcf for the year ended December 31, 2009 compared to 17.0 Mmcf for the year ended December 31, 2008. The throughput increase resulted from the constructing of 192 miles of gathering pipeline in the Haynesville, Eagle Ford and Fayetteville Shales which serviced 135 wells that came on line during 2009. Treating throughput increased 99.7 Mmcf to 101.1 Mmcf for the year ended December 31, 2009 compared to 1.4 Mmcf for the year ended December 31, 2008, which was the result of greater treating capacity from the 16 amine plants installed during 2009 in the Haynesville Shale and to a lesser extent the Eagle Ford Shale.
Lease operating expenses increased $26.2 million for the year ended December 31, 2009 as compared to the same period in 2008. This increase was primarily due to our increased production in the current year. On a per unit basis, lease operating expenses decreased $0.04 per Mcfe to $0.43 per Mcfe in 2009 from $0.47 per Mcfe in 2008. This decrease on a per unit basis is primarily due to the increase in production during 2009 from our resource-style plays which typically have a lower per unit operating cost.
Taxes other than income increased $10.6 million for the year ended December 31, 2009 as compared to the same period in 2008. The increase was primarily due to increased severance taxes resulting from increased production in the current year. Severance taxes are generally assessed as either a fixed rate based on production or as a percentage of gross oil and natural gas sales. On a per unit basis, taxes other than income decreased $0.10 per Mcfe to $0.32 per Mcfe compared to $0.42 per Mcfe in 2008. This decrease on a per unit basis is primarily attributable to the decrease in our realized oil and natural gas prices.
Gathering, transportation and other expense attributable to our oil and natural gas production segment increased $26.3 million for the year ended December 31, 2009 as compared to the same period in 2008. This increase was primarily due to the increase in production discussed above. On a per unit basis, gathering, transportation and other expense decreased $0.01 per Mcfe primarily due to increases in production in our Haynesville Shale play, which generally has lower costs.
Gathering, transportation and other expenses attributable to our midstream segment increased $16.8 million for the year ended December 31, 2009 compared to the same period in 2008. This increase was primarily due to the increase in throughput associated with the continued development of our gathering systems and treating
55
Table of Contents
Index to Financial Statements
facilities in the Haynesville, Eagle Ford and Fayetteville Shales. Gathering and treating throughput increased 221.4 Mmcf to 239.8 Mmcf for the year ended December 31, 2009 compared to 18.4 Mmcf for the year ended December 31, 2008, which includes 1.4 Mmcf of treating throughput. Gathering, transportation and other expense per Mmcf for the year ended December 31, 2009 was $0.09 per Mmcf compared to $0.23 per Mmcf for the year ended December 31, 2008, a decrease of $0.14 per Mmcf or 61% based on our total throughput. This decrease was primarily from lower compression expenses on a per unit level as a result of higher 2009 throughput producing wells in the high pressured Haynesville and Eagle Ford Shales. Compression expenses decreased $0.12 per Mmcf, to $0.03 per Mmcf for the year ended December 31, 2009 compared to $0.15 per Mmcf for the year ended December 31, 2008 based on our total throughput.
General and administrative expense for the year ended December 31, 2009 increased $36.3 million to $98.8 million compared to $62.5 million in the same period 2008. This increase is primarily attributable to our recent growth. Payroll and benefits increased $10.4 million. Office expense, other professional services, and other increased $1.3 million, $1.9 million, and $3.0 million respectively. Our legal expense increased $17.8 million to accrue for settlements and an additional $2.2 million in legal fees associated with the settlements.
Depletion for oil and natural gas properties is calculated using the unit of production method, which depletes the capitalized costs associated with evaluated properties plus future development costs based on the ratio of production volumes for the current period to total remaining reserve volumes for the evaluated properties. Depletion expense decreased $11.0 million for the year ended December 31, 2009 from the same period in 2008, to $380.0 million. On a per unit basis, depletion expense decreased $1.43 per Mcfe to $2.07 per Mcfe. This decrease on a per unit basis is primarily due to the ceiling test impairment writedown of $1.7 billion at March 31, 2009 and $950.8 million at December 31, 2008.
Depreciation expense associated with our gas gathering systems increased $10.4 million to $12.2 million for the year ended December 31, 2009. This increase was primarily due to the construction of our gas gathering systems and treating facilities of which we spent $282 million in the Haynesville, Eagle Ford and Fayetteville Shales. We depreciate our gas gathering systems over a 30 year useful life and begin depreciating on the estimated placed in service date.
We recorded a full cost ceiling impairment of approximately $1.8 billion for the year ended December 31, 2009. We utilize the full cost method of accounting to account for our oil and natural gas exploration and development activities. Under this method of accounting, we are required on a quarterly basis to determine whether the book value of our oil and natural gas properties (excluding unevaluated properties) is less than or equal to the “ceiling”, based upon the expected after tax present value (discounted at 10%) of the future net cash flows from our proved reserves. Any excess of the net book value of our oil and natural gas properties over the ceiling must be recognized as a non-cash impairment expense. For the first three quarters of 2009, we calculated the ceiling using prevailing oil and natural gas prices on the last day of the period, or a subsequent higher price under certain circumstances. At March 31, 2009, our ceiling was calculated using prices of $49.66 per barrel of oil and $3.63 per Mmbtu. Accordingly, at March 31, 2009, our costs exceeded our ceiling limitation by approximately $1.7 billion, resulting in an approximate $1.7 billion writedown of our oil and natural gas properties. At December 31, 2009, our net book value of oil and gas properties exceeded the ceiling amount based on the unweighted arithmetic average of the first day of each month for the 12-month period end December 31, 2009 WTI posted price of $57.65 per barrel and Henry Hub price of $3.87 per Mmbtu. As a result, we recorded a full cost ceiling impairment before income taxes of approximately $106 million and $65 million after taxes.
We enter into derivative commodity instruments to economically hedge our exposure to price fluctuations on our anticipated oil and natural gas production. Consistent with the prior year, we have elected not to designate any positions as cash flow hedges for accounting purposes, and accordingly, we recorded the net change in the mark-to-market value of these derivative contracts in the consolidated statement of operations. At December 31, 2009, we had a $162.9 million derivative asset, $112.4 million of which was classified as current and we had a
56
Table of Contents
Index to Financial Statements
$1.8 million derivative liability, all of which was classified as current. We recorded a net derivative gain of $260.2 million ($120.4 million net unrealized loss and $380.6 million net gain for cash received on settled contracts) for the year ended December 31, 2009 compared to a net derivative gain of $156.9 million ($230.6 million net unrealized gain and $73.7 million net loss for cash paid on settled contracts) in the prior year.
Interest expense and other was $229.4 million and $151.8 million for the years ended December 31, 2009 and 2008, respectively, increasing $77.6 million from the same period in 2008. Interest expense increased $84.0 million due to the issuance of new long-term debt ($25.5 million for the $800 million 7.875% senior notes due 2015 and $58.5 million for the $600 million 10.5% senior notes due 2014). In conjunction with the new notes, amortization of debt issue costs and amortization of the discount recorded on the 2014 Notes accounted for $10.8 million. This was partially offset by a $14.4 million reduction in interest expense associated with the decrease in our outstanding balance on our Senior Credit Agreement compared to the prior year. For the year ended 2009, interest expense included a $5.9 million reduction for the capitalization of the interest associated with the ongoing construction of our gas gathering systems. In addition, we withdrew the proposed public offering of master limited partnership units during 2008 and expensed the related costs of $3.4 million. Due to our utilization of marketable securities and miscellaneous items, interest income decreased $6.7 million.
Income tax benefit for the year ended December 31, 2009 increased $610.0 million from the prior year. The increase in our income tax benefit from the prior year was primarily due to our pre-tax loss of $1.8 billion for the year ended December 31, 2009 compared to our pre-tax loss of $533.0 million in 2008. The effective tax rates for the years ended December 31, 2009 and 2008 were 42.4% and 27.2%, respectively. The change in the effective tax rate from the prior year is primarily due to the benefit generated by the pre-tax loss and changes in estimates of tax benefits associated with amended tax filings.
57
Table of Contents
Index to Financial Statements
Year Ended December 31, 2008 Compared to Year Ended December 31, 2007
We reported a net loss of $388.1 million for the year ended December 31, 2008 compared to net income of $52.9 million for the comparable period in 2007. The change in our net income of $440.9 million from the year ended December 31, 2007 was primarily driven by our full cost ceiling impairment of $950.8 million before taxes offset by an increase in our oil and gas revenues as well as an increase in our net gain on derivative contracts. The following table summarizes key items of comparison and their related change for the periods indicated.
| In thousands (except per unit and per Mcfe amounts) |
Years Ended December 31, |
Change | ||||||||||
| 2008 | 2007 | |||||||||||
| Net (loss) income available to common stockholders |
$ | (388,052 | ) | $ | 52,897 | $ | (440,949 | ) | ||||
| Operating revenues: |
||||||||||||
| Oil and natural gas |
1,025,995 | 882,971 | 143,024 | |||||||||
| Marketing |
63,553 | — | 63,553 | |||||||||
| Midstream |
5,662 | 434 | 5,228 | |||||||||
| Operating expenses: |
||||||||||||
| Marketing |
58,581 | — | 58,581 | |||||||||
| Production: |
||||||||||||
| Lease operating |
52,477 | 64,666 | (12,189 | ) | ||||||||
| Workover and other |
5,624 | 7,700 | (2,076 | ) | ||||||||
| Taxes other than income |
47,104 | 58,347 | (11,243 | ) | ||||||||
| Gathering, transportation and other: |
||||||||||||
| Oil and natural gas |
43,012 | 32,881 | 10,131 | |||||||||
| Midstream |
4,297 | 134 | 4,163 | |||||||||
| General and administrative: |
||||||||||||
| General and administrative |
62,500 | 58,327 | 4,173 | |||||||||
| Stock-based compensation |
12,310 | 15,540 | (3,230 | ) | ||||||||
| Depletion, depreciation and amortization: |
||||||||||||
| Depletion—Full cost |
391,042 | 390,180 | 862 | |||||||||
| Depreciation—Midstream |
1,820 | 88 | 1,732 | |||||||||
| Depreciation—Other |
2,448 | 3,143 | (695 | ) | ||||||||
| Accretion expense |
1,246 | 1,750 | (504 | ) | ||||||||
| Full cost ceiling impairment |
950,799 | — | 950,799 | |||||||||
| Other income (expenses): |
||||||||||||
| Net gain (loss) on derivative contracts |
156,870 | (35,011 | ) | 191,881 | ||||||||
| Interest expense and other |
(151,825 | ) | (129,603 | ) | (22,222 | ) | ||||||
| Loss (income) before income taxes: |
||||||||||||
| Oil and natural gas |
(531,069 | ) | 85,947 | (617,016 | ) | |||||||
| Midstream |
(1,936 | ) | 88 | (2,024 | ) | |||||||
| Income tax benefit (provision) |
144,953 | (33,138 | ) | 178,091 | ||||||||
| Production: |
||||||||||||
| Natural gas—Mmcf (1) |
102,273 | 99,506 | 2,767 | |||||||||
| Oil—MBbl |
1,554 | 2,816 | (1,262 | ) | ||||||||
| Natural gas equivalent—Mmcfe |
111,597 | 116,402 | (4,805 | ) | ||||||||
| Average daily production—Mmcfe |
305 | 319 | (14 | ) | ||||||||
| Average sales price per unit (2) : |
||||||||||||
| Natural gas—Mcf (1) |
$ | 8.56 | $ | 6.92 | $ | 1.64 | ||||||
| Oil—Bbl |
95.16 | 68.84 | 26.32 | |||||||||
| Natural gas equivalent—Mcfe |
9.17 | 7.58 | 1.59 | |||||||||
| Average cost per Mcfe: |
||||||||||||
| Production: |
||||||||||||
| Lease operating |
0.47 | 0.56 | (0.09 | ) | ||||||||
| Workover and other |
0.05 | 0.07 | (0.02 | ) | ||||||||
| Taxes other than income |
0.42 | 0.50 | (0.08 | ) | ||||||||
| Gathering, transportation and other: |
||||||||||||
| Oil and natural gas |
0.39 | 0.28 | 0.11 | |||||||||
| Midstream |
0.03 | — | 0.03 | |||||||||
| General and administrative: |
||||||||||||
| General and administrative |
0.56 | 0.50 | 0.06 | |||||||||
| Stock-based compensation |
0.11 | 0.13 | (0.02 | ) | ||||||||
| Depletion |
3.50 | 3.35 | 0.15 | |||||||||
| (1) | Approximately 2% and 4% of natural gas production represents natural gas liquids (calculated with a 6:1 equivalent ratio) with an average price of $56.63 per Bbl and $43.70 per Bbl for the years ended December 31, 2008 and 2007, respectively. |
| (2) | Amounts exclude the impact of cash paid/received on settled contracts as we did not elect to apply hedge accounting. |
58
Table of Contents
Index to Financial Statements
For the year ended December 31, 2008, oil and natural gas revenues increased $143.0 million from the same period in 2007, to $1.0 billion, which was primarily due to an increase of $1.59 per Mcfe in our equivalent realized average price to $9.17 per Mcfe and resulted in an additional $177 million of revenues. The effect of the increase in price was partially offset by a decrease in production of 4,805 Mmcfe due to the sale of our Gulf Coast properties during the fourth quarter of 2007.
We had marketing revenues of $63.6 and marketing expenses of $58.6 million in 2008, resulting in a net margin of $5.0 million. During the fourth quarter of 2008, we began purchasing and selling third party natural gas produced from wells we operate. We report the revenues and expenses related to these marketing activities on a gross basis as part of our operating revenues and operating expenses. Marketing revenues are recorded at the time natural gas is physically delivered to third parties at a fixed or index price. Marketing expenses attributable to gas purchases are recorded as we take physical title to the natural gas and transport the purchased volumes to the point of sale.
We had gross revenues from our midstream segment of $9.4 million for the year ended December 31, 2008 compared to the same period in 2007 of $0.4 million, an increase of $9.0 million of which $3.7 million represents inter-segment revenues that are eliminated in consolidation. The remaining $5.3 million increase represents gathering and treating revenues from third party owners in our operated wells. On a net basis we had revenues of $5.7 million for the year ended December 31, 2008 compared to $0.4 million for the year ended December 31, 2007. The increase in revenues was directly attributable to the increase in throughput on our gathering systems and treating facilities in the Fayetteville Shale. Gathering throughput increased to 17.0 Mmcf in 2008 compared to 0.8 Mmcf which resulted from the additional 125 miles of gathering pipeline constructed in the Fayetteville Shale servicing 145 new wells added in 2008.
Lease operating expenses decreased $12.2 million for the year ended December 31, 2008. On a per unit basis, lease operating expenses decreased from $0.56 per Mcfe in 2007 to $0.47 per Mcfe in 2008. This decrease on a per unit basis is primarily due to the sale of our higher lease operating cost Gulf Coast properties during the fourth quarter of 2007 and an increase in production from lower operating cost areas in Arkansas and Louisiana.
Workover expenses decreased $2.1 million for the year ended December 31, 2008 compared to the same period in 2007. The decrease was primarily due to the sale of our Gulf Coast properties during the fourth quarter of 2007 which historically had a higher amount of workover activity compared to our ongoing operations.
Taxes other than income decreased $11.2 million for the year ended December 31, 2008 as compared to the same period in 2007. The largest components of taxes other than income are production and severance taxes which are generally assessed as either a percentage of gross oil and natural gas sales or as a fixed rate based on production. As a percentage of oil and gas sales, taxes other than income decreased from 7% in 2007 to 5% in 2008. This decrease as a percentage of revenue is primarily attributable to the sale of our Gulf Coast properties and the increase in production associated with our Louisiana and Arkansas properties.
Gathering, transportation and other expense attributable to our oil and natural gas production segment increased $10.1 million, or $0.11 per Mcfe, for the year ended December 31, 2008 as compared to the same period in 2007. This increase was primarily due to an increase in production in the Fayetteville Shale which has higher gathering, transportation and other costs.
Gathering, transportation and other expense attributable to our midstream segment increased $4.2 million for the year ended December 31, 2008 compared to the same period in 2007. This increase was primarily due to the increase in throughput associated with the development of our gathering systems in the Fayetteville Shale. Gathering and treating throughput increased 17.6 Mmcf to 18.4 Mmcf for the year end December 31, 2008 which includes 1.4 Mcf of treating throughput compared to 0.8 Mmcf for the year end December 31, 2007. Gathering, transportation and other expense for 2008 was $0.23 per Mmcf compared to $0.17 per Mmcf for the year ended December 31, 2007, an increase of $0.06 or 35% based on our total throughput. This increase was primarily due
59
Table of Contents
Index to Financial Statements
to the increased transportation expenses on a per unit level which represents $0.08 per Mmcf offset by a $0.02 per Mmcf decrease in compression expenses.
General and administrative expense for the year ended December 31, 2008 increased $4.2 million as compared to the same period in 2007 to $62.5 million. This increase was primarily attributable to additional professional fees associated with the acquisition and development of our new resource-style plays in 2008. Also contributing to the increase in general and administrative expenses from the prior year was an increase in internal costs associated with our acquisition activities and related capital raises in 2008.
Depletion for oil and natural gas properties is calculated using the unit of production method, which depletes the capitalized costs associated with the evaluated properties plus future development costs based on the ratio of production volume for the current period to total estimated remaining reserve volume for the evaluated properties. Depletion expense increased $0.9 million for the year ended December 31, 2008 from the same period in 2007, to $391.0 million. Our 4% decrease in production attributable to the sale of our Gulf Coast properties during the fourth quarter of 2007 was more than offset by the increase on a per unit basis of $0.15 per Mcfe to $3.50 per Mcfe. This increase on a per unit basis is primarily attributable to the transfer of unevaluated costs to our full cost pool and an increase in our estimated future development costs.
Depreciation expense associated with our gas gathering systems increased $1.7 million to $1.8 million for the year ended December 31, 2008. This increase was primarily due to the construction of our gas gathering systems and treating facilities of which we spent $189 million in the Haynesville and Fayetteville Shales. We depreciate our gas gathering systems over a 30 year useful life and begin depreciating on the estimated placed in service date. The majority of our 2008 projects were placed in service during the fourth quarter.
We recorded a full cost ceiling impairment of approximately $1.0 billion for the year ended December 31, 2008. A variety of economic and other factors have recently caused significant declines in oil and natural gas prices. We utilize the full cost method of accounting to account for our oil and natural gas exploration and development activities. Under this method of accounting, we are required on a quarterly basis to determine whether the book value of our oil and natural gas properties (excluding unevaluated properties) is less than or equal to the “ceiling”, based upon the expected after tax present value (discounted at 10%) of the future net cash flows from our proved reserves, calculated using prevailing oil and natural gas prices on the last day of the period, or a subsequent higher price under certain circumstances. Any excess of the net book value of our oil and natural gas properties over the ceiling must be recognized as a non-cash impairment expense. Our ceiling was calculated using prices of $41.00 per barrel of oil and $5.71 per Mmbtu. Accordingly, at December 31, 2008, our costs exceeded our ceiling limitation by approximately $1.0 billion, resulting in an approximate $1.0 billion writedown of our oil and natural gas properties.
We enter into derivative commodity instruments to economically hedge our exposure to price fluctuations on our anticipated oil and natural gas production. Consistent with the prior year, we have elected not to designate any positions as cash flow hedges for accounting purposes, and accordingly, we recorded the net change in the mark-to-market value of these derivative contracts in the consolidated statement of operations. At December 31, 2008, we had a $224.5 million derivative asset, $201.1 million of which was classified as current. The Company recorded a net derivative gain of $156.9 million ($230.6 million net unrealized gain and $73.7 million net loss for cash paid on settled contracts) for the year ended December 31, 2008 compared to a net derivative loss of $35.0 million ($79.0 million unrealized loss net of a $44.0 million net gain for cash received on settled contracts) in the prior year. This increase in our net derivative gain is primarily attributable to the recent decrease in the forward strip pricing used to value our derivatives.
Interest expense and other was $151.8 million and $129.6 million for the years ended December 31, 2008 and 2007, respectively, increasing $22.2 million from the same period in 2007. Interest expense increased $37.5 million due to the issuance of $800 million of new long-term debt in 2008. In addition, we withdrew the proposed public offering of master limited partnership units during the second quarter of 2008 and expensed the related costs of
60
Table of Contents
Index to Financial Statements
$3.4 million which is included in “Interest expense and other” on the consolidated statements of operations. These items were offset by a reduction in interest expense associated with the Senior Credit Agreement of $15.5 million from the prior year due to the decrease in our outstanding balance as well as interest income of $4.2 million primarily attributable to our investment of proceeds from the sale of our Gulf Coast properties as well as the proceeds we received from the issuance of common stock and long-term debt during 2008.
Income tax expense for the year ended December 31, 2008 decreased $178.1 million from the prior year resulting in a tax benefit of $145.0 million. The decrease in income tax expense from the prior year was primarily due to our pre-tax loss of $533.0 million for the year ended December 31, 2008 compared to our pre-tax income of $86.0 million in 2007. The effective tax rates for the years ended December 31, 2008 and 2007 were 27.2% (benefit) and 38.5%, respectively. The change in the effective tax rate from the prior year is primarily due to the benefit generated by the pre-tax loss reduced by an increase to the state effective rate due to increased operations in higher state tax jurisdictions.
Related Party Transactions
None.
Recently Issued Accounting Pronouncements
We discuss recently adopted and issued accounting standards in Item 8. Consolidated Financial Statements and Supplementary Data–Note 1, “Summary of Significant Events and Accounting Policies.”
| ITEM 7A. | QUANTITATIVE AND QUALITATIVE DISCLOSURES ABOUT MARKET RISK |
Derivative Instruments and Hedging Activity
We are exposed to various risks including energy commodity price risk. When oil and natural gas prices decline significantly our ability to finance our capital budget and operations could be adversely impacted. We expect energy prices to remain volatile and unpredictable, therefore we have designed a risk management policy which provides for the use of derivative instruments to provide partial protection against declines in oil and natural gas prices by reducing the risk of price volatility and the affect it could have on our operations. The types of derivative instruments that we typically utilize include collars, swaps, and puts. The total volumes which we hedge through the use of our derivative instruments varies from period to period, however, generally our objective is to hedge approximately 65% to 70% of our current and anticipated production for the next 12 to 36 months. Our hedge policies and objectives may change significantly as commodities prices or price futures change.
We are exposed to market risk on our open derivative contracts of non-performance by our counterparties. We do not expect such non-performance because our contracts are with major financial institutions with investment grade credit ratings. Each of the counterparties to our derivative contracts is a lender in our Senior Credit Agreement. We did not post collateral under any of these contracts as they are secured under the Senior Credit Agreement. Please refer to Item 8. Consolidated Financial Statements and Supplementary Data—Note 8, “Derivatives and Hedging Activities” for additional information.
We have also been exposed to interest rate risk on our variable interest rate debt. If interest rates increase, our interest expense would increase and our available cash flow would decrease. Periodically, we may look to utilize interest rate swaps to reduce the exposure to market rate fluctuations by converting variable interest rates to fixed interest rates. At December 31, 2009, we did not have any open positions that converted our variable interest rate debt to fixed interest rates. We continue to monitor our risk exposure as we incur future indebtedness at variable interest rates and will look to continue our risk management policy as situations present themselves.
We account for our derivative activities under the provisions of ASC 815, Derivatives and Hedging, (ASC 815). ASC 815 establishes accounting and reporting that every derivative instrument be recorded on the balance
61
Table of Contents
Index to Financial Statements
sheet as either an asset or liability measured at fair value. See Item 8. Consolidated Financial Statements and Supplementary Data—Note 8, “Derivatives and Hedging Activities” for more details.
Fair Market Value of Financial Instruments
The estimated fair values for financial instruments under ASC 825, Financial Instruments, (ASC 825) are determined at discrete points in time based on relevant market information. These estimates involve uncertainties and cannot be determined with precision. The estimated fair value of cash, cash equivalents, accounts receivable and accounts payable approximates their carrying value due to their short-term nature. See Item 8. Consolidated Financial Statements and Supplementary Data—Note 5, “Fair Value Measurements” for additional information.
Interest Sensitivity
We are also exposed to market risk related to adverse changes in interest rates. Our interest rate risk exposure results primarily from fluctuations in short-term rates, which are LIBOR and ABR based and may result in reductions of earnings or cash flows due to increases in the interest rates we pay on these obligations.
At December 31, 2009, total debt was $2.6 billion, of which approximately 92% bears interest at a weighted average fixed interest rate of 8.8% per year. The remaining 8% of our total debt balance at December 31, 2009 bears interest at floating or market interest rates that at our option are tied to prime rate or LIBOR. Fluctuations in market interest rates will cause our annual interest costs to fluctuate. At December 31, 2009, the interest rate on our variable rate debt was 2.9% per year. If the balance of our variable rate debt at December 31, 2009 were to remain constant, a 10% change in market interest rates would impact our cash flow by approximately $0.1 million per quarter.
62
Table of Contents
Index to Financial Statements
| ITEM 8. | CONSOLIDATED FINANCIAL STATEMENTS AND SUPPLEMENTARY DATA |
INDEX TO CONSOLIDATED FINANCIAL STATEMENTS
63
Table of Contents
Index to Financial Statements
MANAGEMENT’S REPORT ON INTERNAL CONTROL OVER FINANCIAL REPORTING
Management of Petrohawk Energy Corporation (the “Company”), including the Company’s Chief Executive Officer and Chief Financial Officer, is responsible for establishing and maintaining adequate internal control over financial reporting for the Company. The Company’s internal control system was designed to provide reasonable assurance to the Company’s Management and Directors regarding the preparation and fair presentation of published financial statements. Because of its inherent limitations, internal control over financial reporting may not prevent or detect misstatements. Also, projections of any evaluation of effectiveness to future periods are subject to the risk that controls may become inadequate because of changes in conditions, or that the degree of compliance with the policies or procedures may deteriorate.
Management conducted an evaluation of the effectiveness of internal control over financial reporting based on the Internal Control—Integrated Framework issued by the Committee of Sponsoring Organizations of the Treadway Commission. Based on this evaluation, management concluded that Petrohawk Energy Corporation’s internal control over financial reporting was effective as of December 31, 2009.
Deloitte & Touche LLP, the Company’s independent registered public accounting firm, has issued an attestation report on the effectiveness on our internal control over financial reporting as of December 31, 2009 which is included in Item 8. Consolidated Financial Statements and Supplementary Data.
| /s/ FLOYD C. WILSON | /s/ MARK J. MIZE | |||
| Floyd C. Wilson | Mark J. Mize | |||
| Chairman of the Board and Chief Executive Officer |
Executive Vice President, Chief Financial Officer and Treasurer | |||
Houston, Texas
February 23, 2010
64
Table of Contents
Index to Financial Statements
REPORT OF INDEPENDENT REGISTERED PUBLIC ACCOUNTING FIRM
To the Board of Directors and Stockholders of
Petrohawk Energy Corporation
Houston, Texas
We have audited the accompanying consolidated balance sheets of Petrohawk Energy Corporation and subsidiaries (the “Company”) as of December 31, 2009 and 2008, and the related consolidated statements of operations, stockholders’ equity, and cash flows for each of the three years in the period ended December 31, 2009. We also have audited the Company’s internal control over financial reporting as of December 31, 2009, based on criteria established in Internal Control—Integrated Framework issued by the Committee of Sponsoring Organizations of the Treadway Commission. The Company’s management is responsible for these financial statements, for maintaining effective internal control over financial reporting, and for its assessment of the effectiveness of internal control over financial reporting, included in the accompanying Management’s Report on Internal Control Over Financial Reporting. Our responsibility is to express an opinion on these financial statements and an opinion on the Company’s internal control over financial reporting based on our audits.
We conducted our audits in accordance with the standards of the Public Company Accounting Oversight Board (United States). Those standards require that we plan and perform the audit to obtain reasonable assurance about whether the financial statements are free of material misstatement and whether effective internal control over financial reporting was maintained in all material respects. Our audits of the financial statements included examining, on a test basis, evidence supporting the amounts and disclosures in the financial statements, assessing the accounting principles used and significant estimates made by management, and evaluating the overall financial statement presentation. Our audit of internal control over financial reporting included obtaining an understanding of internal control over financial reporting, assessing the risk that a material weakness exists, and testing and evaluating the design and operating effectiveness of internal control based on the assessed risk. Our audits also included performing such other procedures as we considered necessary in the circumstances. We believe that our audits provide a reasonable basis for our opinions.
A company’s internal control over financial reporting is a process designed by, or under the supervision of, the company’s principal executive and principal financial officers, or persons performing similar functions, and effected by the company’s board of directors, management, and other personnel to provide reasonable assurance regarding the reliability of financial reporting and the preparation of financial statements for external purposes in accordance with generally accepted accounting principles. A company’s internal control over financial reporting includes those policies and procedures that (1) pertain to the maintenance of records that, in reasonable detail, accurately and fairly reflect the transactions and dispositions of the assets of the company; (2) provide reasonable assurance that transactions are recorded as necessary to permit preparation of financial statements in accordance with generally accepted accounting principles, and that receipts and expenditures of the company are being made only in accordance with authorizations of management and directors of the company; and (3) provide reasonable assurance regarding prevention or timely detection of unauthorized acquisition, use, or disposition of the company’s assets that could have a material effect on the financial statements.
Because of the inherent limitations of internal control over financial reporting, including the possibility of collusion or improper management override of controls, material misstatements due to error or fraud may not be prevented or detected on a timely basis. Also, projections of any evaluation of the effectiveness of the internal control over financial reporting to future periods are subject to the risk that the controls may become inadequate because of changes in conditions, or that the degree of compliance with the policies or procedures may deteriorate.
In our opinion, the consolidated financial statements referred to above present fairly, in all material respects, the financial position of Petrohawk Energy Corporation and subsidiaries as of December 31, 2009 and 2008, and the results of their operations and their cash flows for each of the three years in the period ended December 31, 2009, in conformity with accounting principles generally accepted in the United States of America. Also, in our opinion, the Company maintained, in all material respects, effective internal control over financial reporting as of December 31, 2009, based on the criteria established in Internal Control — Integrated Framework issued by the Committee of Sponsoring Organizations of the Treadway Commission.
As discussed in Note 1 to the consolidated financial statements, on December 31, 2009, the Company adopted Accounting Standards Update No. 2010-3, “Oil and Gas Reserve Estimation and Disclosures”.
/s/ DELOITTE & TOUCHE LLP
Houston, Texas
February 23, 2010
65
Table of Contents
Index to Financial Statements
PETROHAWK ENERGY CORPORATION
CONSOLIDATED STATEMENTS OF OPERATIONS
(In thousands, except per share amounts)
| Years Ended December 31, | ||||||||||||
| 2009 | 2008 | 2007 | ||||||||||
| Operating revenues: |
||||||||||||
| Oil and natural gas |
$ | 732,137 | $ | 1,025,995 | $ | 882,971 | ||||||
| Marketing |
320,121 | 63,553 | — | |||||||||
| Midstream |
31,325 | 5,662 | 434 | |||||||||
| Total operating revenues |
1,083,583 | 1,095,210 | 883,405 | |||||||||
| Operating expenses: |
||||||||||||
| Marketing |
316,987 | 58,581 | — | |||||||||
| Production: |
||||||||||||
| Lease operating |
78,698 | 52,477 | 64,666 | |||||||||
| Workover and other |
2,749 | 5,624 | 7,700 | |||||||||
| Taxes other than income |
57,712 | 47,104 | 58,347 | |||||||||
| Gathering, transportation and other |
90,365 | 47,309 | 33,015 | |||||||||
| General and administrative |
113,232 | 74,810 | 73,867 | |||||||||
| Depletion, depreciation and amortization |
396,644 | 396,556 | 395,161 | |||||||||
| Full cost ceiling impairment |
1,838,444 | 950,799 | — | |||||||||
| Total operating expenses |
2,894,831 | 1,633,260 | 632,756 | |||||||||
| (Loss) income from operations |
(1,811,248 | ) | (538,050 | ) | 250,649 | |||||||
| Other income (expenses): |
||||||||||||
| Net gain (loss) on derivative contracts |
260,248 | 156,870 | (35,011 | ) | ||||||||
| Interest expense and other |
(229,419 | ) | (151,825 | ) | (129,603 | ) | ||||||
| Total other income (expenses) |
30,829 | 5,045 | (164,614 | ) | ||||||||
| (Loss) income before income taxes |
(1,780,419 | ) | (533,005 | ) | 86,035 | |||||||
| Income tax benefit (provision) |
754,968 | 144,953 | (33,138 | ) | ||||||||
| Net (loss) income available to common stockholders |
$ | (1,025,451 | ) | $ | (388,052 | ) | $ | 52,897 | ||||
| Net (loss) income per share of common stock: |
||||||||||||
| Basic |
$ | (3.66 | ) | $ | (1.77 | ) | $ | 0.31 | ||||
| Diluted |
$ | (3.66 | ) | $ | (1.77 | ) | $ | 0.31 | ||||
| Weighted average shares outstanding: |
||||||||||||
| Basic |
280,039 | 218,993 | 168,006 | |||||||||
| Diluted |
280,039 | 218,993 | 171,248 | |||||||||
The accompanying notes are an integral part of these consolidated financial statements.
66
Table of Contents
Index to Financial Statements
PETROHAWK ENERGY CORPORATION
(In thousands, except share and per share amounts)
| December 31, | ||||||||
| 2009 | 2008 | |||||||
| Current assets: |
||||||||
| Cash |
$ | 1,511 | $ | 6,883 | ||||
| Marketable securities |
— | 123,009 | ||||||
| Accounts receivable |
239,264 | 277,349 | ||||||
| Receivables from derivative contracts |
112,441 | 201,128 | ||||||
| Prepaids and other |
32,434 | 40,063 | ||||||
| Total current assets |
385,650 | 648,432 | ||||||
| Oil and natural gas properties (full cost method): |
||||||||
| Evaluated |
5,984,765 | 4,894,357 | ||||||
| Unevaluated |
2,512,453 | 2,287,968 | ||||||
| Gross oil and natural gas properties |
8,497,218 | 7,182,325 | ||||||
| Less—accumulated depletion |
(4,329,485 | ) | (2,111,038 | ) | ||||
| Net oil and natural gas properties |
4,167,733 | 5,071,287 | ||||||
| Other operating property and equipment: |
||||||||
| Gas gathering systems and equipment |
497,551 | 190,054 | ||||||
| Other operating assets |
26,002 | 20,271 | ||||||
| Gross other operating property and equipment |
523,553 | 210,325 | ||||||
| Less—accumulated depreciation |
(26,287 | ) | (11,106 | ) | ||||
| Net other operating property and equipment |
497,266 | 199,219 | ||||||
| Other noncurrent assets: |
||||||||
| Goodwill |
932,802 | 933,058 | ||||||
| Other Intangible assets |
100,395 | — | ||||||
| Debt issuance costs, net of amortization |
44,871 | 30,477 | ||||||
| Deferred income taxes |
245,413 | — | ||||||
| Receivables from derivative contracts |
50,421 | 23,399 | ||||||
| Restricted cash |
213,704 | — | ||||||
| Other |
23,816 | 1,457 | ||||||
| Total assets |
$ | 6,662,071 | $ | 6,907,329 | ||||
| Current liabilities: |
||||||||
| Accounts payable and accrued liabilities |
$ | 633,171 | $ | 639,432 | ||||
| Deferred income taxes |
14,484 | 77,454 | ||||||
| Liabilities from derivative contracts |
1,807 | — | ||||||
| Long-term debt |
49,370 | 9,426 | ||||||
| Total current liabilities |
698,832 | 726,312 | ||||||
| Long-term debt |
2,592,544 | 2,283,874 | ||||||
| Other noncurrent liabilities |
||||||||
| Asset retirement obligations |
44,000 | 28,644 | ||||||
| Deferred income taxes |
— | 460,913 | ||||||
| Other |
3,023 | 2,676 | ||||||
| Commitments and contingencies (Note 7) |
||||||||
| Stockholders’ equity: |
||||||||
| Common stock: 500,000,000 and 300,000,000 shares of $.001 par value authorized; 301,194,695 and 252,364,143 shares issued and outstanding at December 31, 2009 and 2008, respectively |
301 | 252 | ||||||
| Additional paid-in capital |
4,599,664 | 3,655,500 | ||||||
| Accumulated deficit |
(1,276,293 | ) | (250,842 | ) | ||||
| Total stockholders’ equity |
3,323,672 | 3,404,910 | ||||||
| Total liabilities and stockholders’ equity |
$ | 6,662,071 | $ | 6,907,329 | ||||
The accompanying notes are an integral part of these consolidated financial statements.
67
Table of Contents
Index to Financial Statements
PETROHAWK ENERGY CORPORATION
CONSOLIDATED STATEMENTS OF STOCKHOLDERS’ EQUITY
(In thousands)
| Common | Additional Paid-in Capital |
(Accumulated Deficit) Retained Earnings |
Total Stockholders’ Equity |
|||||||||||||||
| Shares | Amount | |||||||||||||||||
| Balances at January 1, 2007 |
168,487 | $ | 169 | $ | 1,843,862 | $ | 84,313 | $ | 1,928,344 | |||||||||
| Equity compensation vesting |
— | — | 22,230 | — | 22,230 | |||||||||||||
| Warrants exercised |
575 | — | — | — | — | |||||||||||||
| Common stock issuances |
2,159 | 2 | 2,427 | — | 2,429 | |||||||||||||
| Tax benefit from exercise of stock options |
— | — | 2,997 | — | 2,997 | |||||||||||||
| Net income |
— | — | — | 52,897 | 52,897 | |||||||||||||
| Balances at December 31, 2007 |
171,221 | 171 | 1,871,516 | 137,210 | 2,008,897 | |||||||||||||
| Sale of common stock |
78,200 | 78 | 1,831,872 | — | 1,831,950 | |||||||||||||
| Equity compensation vesting |
— | — | 16,279 | — | 16,279 | |||||||||||||
| Warrants exercised |
1,222 | 1 | 883 | — | 884 | |||||||||||||
| Common stock issuances |
1,874 | 2 | 13,661 | — | 13,663 | |||||||||||||
| Purchase of shares to cover individuals tax withholding |
(153 | ) | — | (3,798 | ) | — | (3,798 | ) | ||||||||||
| Reduction in shares to cover individuals tax withholding |
— | — | (1,150 | ) | — | (1,150 | ) | |||||||||||
| Offering costs |
— | — | (73,763 | ) | — | (73,763 | ) | |||||||||||
| Net loss |
— | — | — | (388,052 | ) | (388,052 | ) | |||||||||||
| Balances at December 31, 2008 |
252,364 | 252 | 3,655,500 | (250,842 | ) | 3,404,910 | ||||||||||||
| Sale of common stock |
47,000 | 47 | 956,453 | — | 956,500 | |||||||||||||
| Equity compensation vesting |
— | — | 19,846 | — | 19,846 | |||||||||||||
| Warrants exercised |
503 | 1 | 392 | — | 393 | |||||||||||||
| Common stock issuances |
1,623 | 1 | 3,694 | — | 3,695 | |||||||||||||
| Purchase of shares to cover individuals tax withholding |
(277 | ) | — | (5,388 | ) | — | (5,388 | ) | ||||||||||
| Offering costs |
— | — | (30,748 | ) | — | (30,748 | ) | |||||||||||
| Reduction in shares to cover individuals tax withholding |
(18 | ) | — | (85 | ) | — | (85 | ) | ||||||||||
| Net loss |
— | — | — | (1,025,451 | ) | (1,025,451 | ) | |||||||||||
| Balances at December 31, 2009 |
301,195 | $ | 301 | $ | 4,599,664 | $ | (1,276,293 | ) | $ | 3,323,672 | ||||||||
The accompanying notes are an integral part of these consolidated financial statements.
68
Table of Contents
Index to Financial Statements
PETROHAWK ENERGY CORPORATION
CONSOLIDATED STATEMENTS OF CASH FLOWS
(In thousands)
| Years Ended December 31, | ||||||||||||
| 2009 | 2008 | 2007 | ||||||||||
| Cash flows from operating activities: |
||||||||||||
| Net (loss) income |
$ | (1,025,451 | ) | $ | (388,052 | ) | $ | 52,897 | ||||
| Adjustments to reconcile net (loss) income to net cash provided by operating activities: |
||||||||||||
| Depletion, depreciation and amortization |
396,644 | 396,556 | 395,161 | |||||||||
| Full cost ceiling impairment |
1,838,444 | 950,799 | — | |||||||||
| Income tax (benefit) provision |
(754,968 | ) | (144,953 | ) | 33,138 | |||||||
| Stock-based compensation |
14,458 | 12,310 | 15,540 | |||||||||
| Net unrealized loss (gain) on derivative contracts |
120,401 | (230,640 | ) | 79,011 | ||||||||
| Other operating |
24,230 | 4,552 | 2,049 | |||||||||
| Change in operating assets and liabilities, net of acquisitions: |
||||||||||||
| Accounts receivable |
48,089 | (110,479 | ) | 18,554 | ||||||||
| Prepaid and other |
7,629 | (19,044 | ) | (3,372 | ) | |||||||
| Accounts payable and accrued liabilities |
31,663 | 135,382 | 11,846 | |||||||||
| Other |
(22,012 | ) | 2,524 | 221 | ||||||||
| Net cash provided by operating activities |
679,127 | 608,955 | 605,045 | |||||||||
| Cash flows from investing activities: |
||||||||||||
| Oil and natural gas capital expenditures |
(1,718,741 | ) | (3,121,736 | ) | (1,253,171 | ) | ||||||
| Acquisition of One Tec, LLC, net of cash acquired of $2,145 |
— | — | (39,910 | ) | ||||||||
| Proceeds received from sale of oil and natural gas properties |
357,360 | 109,268 | 689,220 | |||||||||
| Marketable securities purchased |
(1,457,608 | ) | (3,777,427 | ) | — | |||||||
| Marketable securities redeemed |
1,580,617 | 3,654,418 | — | |||||||||
| Increase in restricted cash |
(331,561 | ) | — | (650,000 | ) | |||||||
| Decrease in restricted cash |
117,857 | 269,837 | 380,163 | |||||||||
| Other operating property and equipment expenditures |
(309,454 | ) | (164,810 | ) | (2,998 | ) | ||||||
| Other intangible assets acquired |
(105,108 | ) | — | — | ||||||||
| Net cash used in investing activities |
(1,866,638 | ) | (3,030,450 | ) | (876,696 | ) | ||||||
| Cash flows from financing activities: |
||||||||||||
| Proceeds from exercise of options and warrants |
3,945 | 14,438 | 6,058 | |||||||||
| Proceeds from issuance of common stock |
956,500 | 1,831,950 | — | |||||||||
| Offering costs |
(30,748 | ) | (73,763 | ) | — | |||||||
| Proceeds from borrowings |
1,448,674 | 2,764,000 | 950,000 | |||||||||
| Repayment of borrowings |
(1,166,711 | ) | (2,086,266 | ) | (689,601 | ) | ||||||
| Debt issue costs |
(24,048 | ) | (23,793 | ) | (834 | ) | ||||||
| Other |
(5,473 | ) | — | 2,247 | ||||||||
| Net cash provided by financing activities |
1,182,139 | 2,426,566 | 267,870 | |||||||||
| Net (decrease) increase in cash |
(5,372 | ) | 5,071 | (3,781 | ) | |||||||
| Cash at beginning of period |
6,883 | 1,812 | 5,593 | |||||||||
| Cash at end of period |
$ | 1,511 | $ | 6,883 | $ | 1,812 | ||||||
The accompanying notes are an integral part of these consolidated financial statements.
69
Table of Contents
Index to Financial Statements
PETROHAWK ENERGY CORPORATION
NOTES TO THE CONSOLIDATED FINANCIAL STATEMENTS
| 1. | SUMMARY OF SIGNIFICANT EVENTS AND ACCOUNTING POLICIES |
Basis of Presentation and Principles of Consolidation
Petrohawk Energy Corporation (Petrohawk or the Company) is an independent oil and natural gas company engaged in the exploration, development and production of predominately natural gas properties located onshore in the United States. The Company operates in two segments, oil and natural gas production and midstream operations. The consolidated financial statements include the accounts of all majority-owned, controlled subsidiaries. All intercompany accounts and transactions have been eliminated. Certain prior year amounts have been reclassified to conform to the current year presentation. The Company has evaluated events or transactions through the date of issuance of this report in conjunction with the preparation of these consolidated financial statements.
Use of Estimates
The preparation of the Company’s consolidated financial statements in conformity with accounting principles generally accepted in the United States requires the Company’s management to make estimates and assumptions that affect the reported amounts of assets and liabilities and disclosure of contingent assets and liabilities, if any, at the date of the consolidated financial statements and the reported amounts of revenues and expenses during the respective reporting periods. The Company bases its estimates and judgments on historical experience and on various other assumptions and information that are believed to be reasonable under the circumstances. Estimates and assumptions about future events and their effects cannot be perceived with certainty and, accordingly, these estimates may change as new events occur, as more experience is acquired, as additional information is obtained and as the Company’s operating environment changes. Actual results may differ from the estimates and assumptions used in the preparation of the Company’s consolidated financial statements.
Marketable Securities
The Company may invest a portion of its cash in money market mutual funds which are highly liquid marketable securities. The Company accounts for marketable securities in accordance with Financial Accounting Standards Board’s (FASB) Accounting Standards Codification (ASC) 320, Investments—Debt and Equity Securities, (ASC 320) and classifies marketable securities as trading, available-for-sale, or held-to-maturity. The appropriate classification of its marketable securities is determined at the time of purchase and reevaluated at each balance sheet date.
The Company had no amounts outstanding at December 31, 2009 and $123 million at December 31, 2008, which were classified and accounted for as trading securities. Trading securities are recorded at fair value with realized gains and losses reported in “Interest expense and other” in the consolidated statements of operations.
Allowance for Doubtful Accounts
The Company establishes provisions for losses on accounts receivable if it determines that it will not collect all or part of the outstanding balance. The Company regularly reviews collectibility and establishes or adjusts the allowance as necessary using the specific identification method. There is no significant allowance for doubtful accounts at December 31, 2009 or 2008.
Oil and Natural Gas Properties
The Company accounts for its oil and natural gas producing activities using the full cost method of accounting as prescribed by the United States Securities and Exchange Commission (SEC). Accordingly, all costs incurred in the acquisition, exploration, and development of proved oil and natural gas properties, including
70
Table of Contents
Index to Financial Statements
the costs of abandoned properties, dry holes, geophysical costs, and annual lease rentals are capitalized. All general and administrative corporate costs unrelated to drilling activities are expensed as incurred. Sales or other dispositions of oil and natural gas properties are accounted for as adjustments to capitalized costs, with no gain or loss recorded unless the ratio of cost to proved reserves would significantly change. Depletion of evaluated oil and natural gas properties is computed on the units of production method based on proved reserves. The net capitalized costs of proved oil and natural gas properties are subject to a full cost ceiling limitation in which the costs are not allowed to exceed their related estimated future net revenues discounted at 10%, net of tax considerations.
Costs associated with unevaluated properties are excluded from the full cost pool until the Company has made a determination as to the existence of proved reserves. The Company reviews its unevaluated properties at the end of each quarter to determine whether the costs incurred should be transferred to the full cost pool and thereby subject to amortization.
Gas Gathering Systems and Equipment and Other Operating Assets
Gas gathering systems and equipment are recorded at cost. Depreciation is calculated using the straight-line method over a 30-year estimated useful life. Upon sale, retirement, or otherwise disposed of, the cost and accumulated depreciation are removed from the accounts and any gains or losses are reflected in current operations. Maintenance and repair costs are charged to operating expense as incurred. Material expenditures, which increase the life of an asset, are capitalized and depreciated over the estimated remaining useful life of the asset. The Company capitalized $5.9 million of interest for the year ended December 31, 2009 related to the construction of the Company’s gas gathering system.
Gas gathering systems and equipment as of December 31, 2009 and 2008 consisted of the following:
| December 31, | ||||||||
| 2009 | 2008 | |||||||
| (In thousands) | ||||||||
| Gas gathering systems and equipment |
$ | 497,551 | $ | 190,054 | ||||
| Less — accumulated depreciation |
(14,618 | ) | (2,696 | ) | ||||
| Net gas gathering systems and equipment |
$ | 482,933 | $ | 187,358 | ||||
Other operating property and equipment are recorded at cost. Depreciation is calculated using the straight-line method over the following estimated useful lives: auto, leasehold improvements, furniture and equipment, 5 years or lesser of lease term; and computers, 3 years. Upon sale, retirement, or otherwise disposed of, the cost and accumulated depreciation are removed from the accounts and any gains or losses are reflected in current operations. Maintenance and repair costs are charged to operating expense as incurred. Material expenditures, which increase the life of an asset, are capitalized and depreciated over the estimated remaining useful life of the asset.
The Company reviews its property and equipment in accordance with ASC 360, Property, Plant, and Equipment (ASC 360). ASC 360 requires the Company to evaluate property and equipment as an event occurs or circumstances change that would more likely than not reduce the fair value of the property and equipment below the carrying amount. If the carrying amount of property and equipment is not recoverable from its undiscounted cash flows, then the Company would recognize an impairment loss for the difference between the carrying amount and the current fair value. Further, the Company evaluates the remaining useful lives of property and equipment at each reporting period to determine whether events and circumstances warrant a revision to the remaining depreciation periods.
71
Table of Contents
Index to Financial Statements
Revenue Recognition
Revenues from the sale of oil and natural gas are recognized when the product is delivered at a fixed or determinable price, title has transferred, collectibility is reasonably assured and evidenced by a contract. The Company follows the “sales method” of accounting for its oil and natural gas revenue, so it recognizes revenue on all natural gas or crude oil sold to purchasers, regardless of whether the sales are proportionate to its ownership in the property. A receivable or liability is recognized only to the extent that the Company has an imbalance on a specific property greater than the expected remaining proved reserves.
Marketing Revenue and Expense
During the fourth quarter of 2008, a subsidiary of the Company began purchasing and selling third party natural gas produced from wells it operates. The revenues and expenses related to these marketing activities are reported on a gross basis as part of operating revenues and operating expenses. Marketing revenues are recorded at the time natural gas is physically delivered to third parties at a fixed or index price. Marketing expenses attributable to gas purchases are recorded as the Company takes physical title to natural gas and transports the purchased volumes to the point of sale.
Midstream Revenues
Revenues from the Company’s midstream operations are derived from providing gathering and treating services for the Company and third party producers. Revenues are recognized when services are provided at a fixed or determinable price, collectability is reasonably assured and evidenced by a contract. The midstream segment does not take title to the natural gas for which services are provided, with the exception of imbalances that are monthly cash settled. The imbalances are recorded using published natural gas market prices.
Concentrations of Credit Risk
The Company operates a substantial portion of its oil and natural gas properties. As the operator of a property, the Company makes full payments for costs associated with the property and seeks reimbursement from the other working interest owners in the property for their share of those costs. The Company’s joint interest partners consist primarily of independent oil and natural gas producers. If the oil and natural gas exploration and production industry in general were adversely affected, the ability of the Company’s joint interest partners to reimburse the Company could be adversely affected.
The purchasers of the Company’s oil and natural gas production consist primarily of independent marketers, major oil and natural gas companies and gas pipeline companies. The Company has not experienced any significant losses from uncollectible accounts. In 2009, the Company had two individual purchasers each accounting for in excess of 10% of its total sales, collectively representing 25% of its total sales. In 2008, the Company had two individual purchasers each accounting for in excess of 10% of its total sales, collectively representing 30% of its total sales. In 2007, the Company had one individual purchaser accounting for 10% of its total sales.
Risk Management Activities
The Company follows ASC 815, Derivatives and Hedging. From time to time, the Company may hedge a portion of its forecasted oil and natural gas production. Derivative contracts entered into by the Company have consisted of transactions in which the Company hedges the variability of cash flow related to a forecasted transaction. The Company has elected to not designate any of its positions for hedge accounting. Accordingly, the Company records the net change in the mark-to-market valuation of these positions, as well as payments and receipts on settled contracts, in “Net gain (loss) on derivative contracts” on the consolidated statements of operations.
72
Table of Contents
Index to Financial Statements
Income Taxes
The Company accounts for income taxes using the asset and liability method wherein deferred tax assets and liabilities are recognized for the future tax consequences attributable to differences between financial statement carrying amounts of existing assets and liabilities and their respective tax bases. Deferred tax assets and liabilities are measured using enacted tax rates expected to apply to taxable income in the years in which temporary differences are expected to be recovered or settled. Deferred tax assets are reduced by a valuation allowance if, based on the weight of available evidence, it is more likely than not that some portion or all of the deferred tax assets will not be realized.
The Company follows ASC 740, Income Taxes, (ASC 740). ASC 740 creates a single model to address accounting for the uncertainty in income tax positions and prescribes a minimum recognition threshold a tax position must meet before recognition in the financial statements.
The evaluation of a tax position in accordance with ASC 740 is a two-step process. The first step is a recognition process to determine whether it is more likely than not that a tax position will be sustained upon examination, including resolution of any related appeals or litigation processes, based on the technical merits of the position. In evaluating whether a tax position has met the more likely than not recognition threshold, it is presumed that the position will be examined by the appropriate taxing authority with full knowledge of all relevant information. The second step is a measurement process whereby a tax position that meets the more likely than not recognition threshold is calculated to determine the amount of benefit/expense to recognize in the financial statements. The tax position is measured at the largest amount of benefit/expense that is more likely than not of being realized upon ultimate settlement.
The Company includes interest and penalties relating to uncertain tax positions within “Interest expense and other” on the Company’s consolidated statements of operations. Refer to Note 10, Income Taxes, for more details.
Generally, the Company’s tax years 2006 through 2009 are either currently under audit or remain open and subject to examination by federal tax authorities or the tax authorities in Arkansas, Louisiana, New Mexico, Oklahoma and Texas, which are the jurisdictions in which the Company has its principal operations. In certain of these jurisdictions, the Company operates through more than one legal entity, each of which may have different open years subject to examination. Additionally, it is important to note that years are technically open for examination until the statute of limitations in each respective jurisdiction expires.
Tax audits may be ongoing at any point in time. Tax liabilities are recorded based on estimates of additional taxes which may be due upon the conclusion of these audits. Estimates of these tax liabilities are made based upon prior experience and are updated for changes in facts and circumstances. However, due to the uncertain and complex application of tax regulations, it is possible that the ultimate resolution of audits may result in liabilities which could be materially different from these estimates.
Asset Retirement Obligation
ASC 410, Asset Retirement and Environmental Obligations (ASC 410) requires that the fair value of an asset retirement cost, and corresponding liability, should be recorded as part of the cost of the related long-lived asset and subsequently allocated to expense using a systematic and rational method. The Company records asset retirement obligations to reflect the Company’s legal obligations related to future plugging and abandonment of its oil and natural gas wells and gas gathering systems. The Company estimates the expected cash flow associated with the obligation and discounts the amounts using a credit-adjusted, risk-free interest rate. At least annually, the Company reassesses the obligation to determine whether a change in the estimated obligation is necessary. The Company evaluates whether there are indicators that suggest the estimated cash flows underlying the obligation have materially changed. Should those indicators suggest the estimated obligation may have materially changed on an interim basis (quarterly), the Company will accordingly update its assessment.
73
Table of Contents
Index to Financial Statements
Additional retirement obligations increase the liability associated with new oil and natural gas wells and gas gathering systems as these obligations are incurred.
Goodwill
Goodwill represents the excess of the purchase price over the estimated fair value of the assets acquired net of the fair value of liabilities assumed in an acquisition. Goodwill decreased $0.3 and $0.9 million in 2009 and 2008, respectively, due to the tax effects of the exercise of stock options and the sale of restricted stock in 2009 and 2008 that were included in the Company’s original purchase price allocations for the KCS Energy, Inc. (KCS) and Mission Resources Corporation (Mission) mergers. ASC 350, Intangibles—Goodwill and Other (ASC 350) requires that intangible assets with indefinite lives, including goodwill, be evaluated on an annual basis for impairment or more frequently if an event occurs or circumstances change that could potentially result in impairment. The goodwill impairment test requires the allocation of goodwill and all other assets and liabilities to reporting units. The Company has determined that it has two reporting units: oil and natural gas production and midstream operations. All of the Company’s goodwill has been allocated to its oil and natural gas production reporting unit as all of its historical goodwill relates to its acquisitions of oil and natural gas companies.
The Company performs its goodwill test annually during the third quarter or more often if circumstances require. The Company’s goodwill impairment reviews consists of a two-step process. The first step is to determine the fair value of its reporting units and compare it to the carrying value of the related net assets. Fair value is determined based on the Company’s estimates of market values. If this fair value exceeds the carrying value no further analysis or goodwill write-down is required. The second step is required if the fair value of the Company’s reporting units are less than the carrying value of the net assets. In this step the implied fair value of the Company’s reporting units are allocated to all the underlying assets and liabilities, including both recognized and unrecognized tangible and intangible assets, based on their fair values. If necessary, goodwill is then written-down to its implied fair value. If the fair value of the Company’s reporting units is less than the book value (including goodwill), then goodwill is reduced to its implied fair value and the amount of the writedown is charged against earnings. The assumptions used by the Company in calculating its reporting unit fair values at the time of the test include the Company’s market capitalization and discounted future cash flows based on estimated reserves and production, future costs and future oil and natural gas prices. Adverse changes to any of these factors could lead to an impairment of all or a portion of the Company’s goodwill in future periods.
As a result of full cost ceiling impairments recorded by the Company for the years ended December 31, 2009 and 2008 and the quarter ended March 31, 2009, the Company reviewed its goodwill for impairment as of December 31, 2009, March 31, 2009 and December 31, 2008. The Company completed its annual goodwill impairment test during the third quarters of 2009, 2008 and 2007. Based on these reviews, no goodwill impairments were deemed necessary.
Other Intangible Assets
The Company treats the costs associated with acquired transportation contracts as intangible assets and allocates the purchase price to the transportation contract which will be amortized over the life of the extended agreement. The initial amount recorded represents the fair value of the contract at the time of acquisition, which is amortized under a straight-line method over the life of the contract. Any unamortized balance of the Company’s intangible assets will be subject to impairment testing pursuant to the Impairment or Disposal of Long-Lived Assets Subsections of ASC Subtopic 360-10.
Amortization expense was $4.7 million for the period from acquisition through December 31, 2009 and was allocated to operating expenses between “Marketing” and “Gathering, transportation and other” on the condensed consolidated statements of operations based on the usage of the contract. The estimated amortization expense will be approximately $11.1 million per year for the remainder of the contract through 2019.
74
Table of Contents
Index to Financial Statements
Intangible assets subject to amortization at December 31, 2009 are as follows:
| Gross Carrying Amount |
Accumulated Amortization |
Net Carrying Amount | ||||||||
| (In thousands) | ||||||||||
| Balance at December 31, 2009: |
||||||||||
| Transportation contracts |
$ | 105,108 | $ | (4,713 | ) | $ | 100,395 | |||
| $ | 105,108 | $ | (4,713 | ) | $ | 100,395 | ||||
401(k) Plan
The Company sponsors a 401(k) tax deferred savings plan, whereby the Company matches a portion of employees’ contributions in cash. Participation in the plan is voluntary and all employees of the Company who are 21 years of age are eligible to participate. The Company charged to expense plan contributions of $3.3 million in 2009 and $2.6 million in 2008 and 2007. The Company matches employee contributions dollar-for-dollar on the first 10% of an employee’s pretax earnings.
Recently Issued Accounting Pronouncements
In August 2009, the FASB issued Accounting Standards Update (ASU) No. 2009-05, Fair Value Measurements and Disclosures (ASU 2009-05). ASU 2009-05 amends Subtopic 820-10, Fair Value Measurements and Disclosures, to provide guidance on the fair value measurement of liabilities. ASU 2009-05 provides clarification for circumstances in which a quoted price in an active market for the identical liability is not available. ASU 2009-05 is effective for interim and annual periods beginning after August 26, 2009. The Company adopted the provisions of ASU 2009-05 for the period ended December 31, 2009. There was no impact on the Company’s operating results, financial position or cash flows.
In June 2009, the FASB issued ASU No. 2009-01, Generally Accepted Accounting Principles (ASU 2009-01). ASU 2009-01 establishes “The FASB Accounting Standards Codification,” or Codification, which became the source of authoritative GAAP recognized by the FASB to be applied by nongovernmental entities. On the effective date, the Codification superseded all then-existing non-SEC accounting and reporting standards. All other nongrandfathered non-SEC accounting literature not included in the Codification will become nonauthoritative. ASU 2009-01 is effective for interim and annual periods ending after September 15, 2009. The Company adopted the provisions of ASU 2009-01 for the period ended September 30, 2009. There was no impact on the Company’s operating results, financial position or cash flows.
In May 2009, the FASB issued SFAS No. 165, Subsequent Events (ASC 855) to establish general standards of accounting for and disclosure of events that occur after the balance sheet date but before financial statements are issued or are available to be issued. ASC 855 is effective for interim and annual reporting periods ending after June 15, 2009. The Company adopted the provisions of ASC 855 for the period ended June 30, 2009. There was no impact on the Company’s operating results, financial position or cash flows.
In April 2009, the FASB issued FASB Staff Position (FSP) No. FAS 107-1 and Accounting Principles Board (APB) 28-1, Interim Disclosures about Fair Value of Financial Instruments (ASC 825-10-65) to change the reporting requirements on certain fair value disclosures of financial instruments to include interim reporting periods. The Company adopted ASC 825-10-65 in the second quarter of 2009. There was no impact on the Company’s operating results, financial position or cash flows; however additional disclosures were added to the accompanying notes to the consolidated financial statements for the Company’s fair value of financial instruments. See Note 5 “Fair Value Measurements” for more details.
In April 2009, the FASB issued FSP No. FAS 115-2 and FAS 124-2, Recognition and Presentation of Other-Than-Temporary Impairments, (ASC 320-10-65), to expand other-than-temporary impairment guidance
75
Table of Contents
Index to Financial Statements
for debt securities to enhance the application of the guidance and improve the presentation and disclosure of other-than temporary impairments on debt and equity securities within the financial statements. The adoption of ASC 320-10-65 in the second quarter of 2009 did not have a significant impact on the Company’s operating results, financial position or cash flows.
In April 2009, the FASB issued FSP No. FAS 157-4, Determining Fair Value When the Volume and Level of Activity for the Asset or Liability Have Significantly Decreased and Identifying Transactions That Are Not Orderly, (ASC 820-10-65) to provide additional guidance for estimating fair value when the volume and level of activity for an asset or liability has significantly decreased. In addition, ASC 820-10-65 includes guidance on identifying circumstances that indicate a transaction is not orderly. The adoption of ASC 820-10-65 in the second quarter of 2009 did not have a significant impact on the Company’s operating results, financial position or cash flows.
In December 2008, the SEC issued Release No. 33-8995, Modernization of Oil and Gas Reporting (ASC 2010-3), which amends the oil and gas disclosures for oil and gas producers contained in Regulations S-K and S-X, as well as adding a section to Regulation S-K (Subpart 1200) to codify the revised disclosure requirements in Securities Act Industry Guide 2, which is being eliminated. The goal of Release No. 33-8995 is to provide investors with a more meaningful and comprehensive understanding of oil and gas reserves. Energy companies affected by Release No. 33-8995 are now required to price proved oil and gas reserves using the unweighted arithmetic average of the price on the first day of each month within the 12-month period prior to the end of the reporting period, unless prices are defined by contractual arrangements, excluding escalations based on future conditions. SEC Release No. 33-8995 is effective beginning for financial statements for fiscal years ending on or after December 31, 2009. The impact on the Company’s operating results, financial position and cash flows has been recorded in the financial statements; additional disclosures were added to the accompanying notes to the consolidated financial statements for the Company’s supplemental oil and gas disclosure. See Supplemental Oil and Gas Information for more details.
In January 2010, the FASB issued FASB Accounting Standards Update (ASU) No. 2010-03 Oil and Gas Estimations and Disclosures (ASU 2010-03). This update aligns the current oil and natural gas reserve estimation and disclosure requirements of the Extractive Industries Oil and Gas topic of the FASB Accounting Standards Codification (ASC Topic 932) with the changes required by the SEC final rule ASC 2010-3, as discussed above, ASU 2010-03 expands the disclosures required for equity method investments, revises the definition of oil- and natural gas-producing activities to include nontraditional resources in reserves unless not intended to be upgraded into synthetic oil or natural gas, amends the definition of proved oil and natural gas reserves to require 12-month average pricing in estimating reserves, amends and adds definitions in the Master Glossary that is used in estimating proved oil and natural gas quantities and provides guidance on geographic area with respect to disclosure of information about significant reserves. ASU 2010-03 must be applied prospectively as a change in accounting principle that is inseparable from a change in accounting estimate and is effective for entities with annual reporting periods ending on or after a change in accounting estimate and is effective for entities with annual reporting periods ending on or after December 31, 2009. The Company adopted ASU 2010-03 effective December 31, 2009. See Supplemental Oil and Gas Information for more details.
In March 2008, the FASB issued SFAS No. 161, Disclosures about Derivative Instruments and Hedging Activities—an amendment of FASB Statement No. 133 (ASC 815-10-65). ASC 815-10-65 requires entities that utilize derivative contracts to provide qualitative disclosures about their objectives and strategies for using such instruments, as well as any details of credit-risk-related contingent features contained within derivatives. ASC 815-10-65 also requires entities to disclose additional information about the amounts and location of derivatives located within the financial statements, how the provisions of ASC 815 have been applied, and the impact that hedges have on an entity’s operating results, financial position or cash flows. The Company adopted ASC 815-10-65 on January 1, 2009. There was no impact on the Company’s operating results, financial position or cash flows; however additional disclosures were added to the accompanying notes to the consolidated financial statements for the Company’s derivative contracts. See Note 8 “Derivatives and Hedging Activities” for more details.
76
Table of Contents
Index to Financial Statements
In December 2007, the FASB issued SFAS No. 141 (Revised 2007), Business Combinations (ASC 805), and SFAS No. 160, Accounting and Reporting of Noncontrolling Interest in Consolidated Financial Statements, an amendment of ARB No. 51 (ASC 810-10-65). ASC 805 and ASC 810-10-65 significantly change the accounting for and reporting of business combination transactions and noncontrolling (minority) interests within the financial statements. ASC 805 provides additional definitions, such as the definition of the acquirer in a purchase and improvements in the application of how the acquisition method is applied. ASC 810-65 changes the accounting and reporting for minority interests, which are re-characterized as non-controlling interests, and classified as a component of equity. The Company adopted ASC 805 and ASC 810-10-65 on January 1, 2009. There was no impact on the Company’s operating results, financial position or cash flows; however if the Company enters into future business combinations, certain transaction related expenses may be recorded within the Company’s operating results which could reduce its current period net income or increase its net loss. Additionally, valuation of certain assets may be different than under the old accounting standards.
Effective January 1, 2009, the Company adopted FSP No. FAS 157-2, Effective Date of FASB Statement No. 157 (ASC 820-10-55). ASC 820-10-55 delayed the effective date of ASC 820 for all non-financial assets and non-financial liabilities, except for items that are recognized or disclosed at fair value in the financial statements on a recurring basis (at least annually), until the beginning of the first quarter of fiscal 2009. These include goodwill and other non-amortizable intangible assets. The adoption of ASC 820-10-55 did not have a significant impact on the Company’s operating results, financial position or cash flows. See Note 6 “Asset Retirement Obligations” for more details.
In June 2008, the FASB issued Emerging Issues Task Force (EITF) 03-6-1, Determining Whether Instruments Granted in Share-Based Payment Transactions Are Participating Securities (ASC 260). ASC 260 clarifies that share-based payment awards that entitle their holders to receive non-forfeitable dividends or dividend equivalents before vesting should be considered participating securities. The adoption of ASC 260 on January 1, 2009 did not have a significant impact on the Company’s operating results, financial position or cash flows.
| 2. | ACQUISITIONS AND DIVESTITURES |
Acquisitions
Kaiser Trading, LLC
On July 31, 2009, the Company purchased all outstanding membership interests in Kaiser Trading, LLC (Kaiser) for approximately $105 million. Kaiser’s only assets were transportation-related contracts including a firm transportation contract, interruptible gas transportation service agreement, parking and lending services agreement, and a pooling services agreement. The initial firm transportation contract runs through 2013 and at no additional cost, the Company has the contractual right to extend firm supply through 2019.
Fayetteville Shale
On February 8, 2008, the Company purchased additional properties located in the Fayetteville Shale for $231.3 million after customary closing adjustments. The acquired properties included interests primarily in Van Buren and Cleburne Counties, Arkansas that were substantially undeveloped. During the second half of 2007, the Company completed three separate acquisitions for total cash consideration of approximately $409 million.
Elm Grove Field
On January 22, 2008, the Company completed an acquisition of interests in the Elm Grove Field, located primarily in Bossier and Caddo Parishes of North Louisiana, for approximately $169 million.
77
Table of Contents
Index to Financial Statements
One TEC, LLC
On August 3, 2007 the Company completed the acquisition of all of the membership interests of One TEC, LLC (One TEC) for approximately $42.0 million. The One TEC acquisition was accounted for using the purchase method of accounting under the accounting standards established in ASC 805, Business Combinations (ASC 805) and ASC 350. As a result, the Company reflected the results of operations of One TEC beginning August 3, 2007. The Company recorded the estimated fair values of the assets acquired and liabilities assumed at August 3, 2007, which primarily consisted of oil and natural gas properties of $35.0 million.
Divestitures
Permian Basin Properties
On October 30, 2009, the Company sold its Permian Basin properties to a privately-owned company for $376 million in cash, before closing adjustments. The effective date of the sale was July 1, 2009. Proceeds from the sale were recorded as a reduction to the carrying value of the Company’s full cost pool. In conjunction with the closing of this sale, the Company deposited the remaining net proceeds of $331 million with a qualified intermediary to facilitate like-kind exchange transactions ($37.6 million was previously received as a deposit).
Gulf Coast Properties
In June 2007, the Company announced a strategic repositioning involving plans to sell its Gulf Coast properties and concentrate its efforts on developing and expanding the Company’s resource-style assets, including tight-gas properties in North Louisiana and the Fayetteville Shale in central Arkansas. On November 30, 2007, the Company completed the sale of its Gulf Coast properties for $825 million, consisting of $700 million in cash and a $125 million note subject to redemption by the purchaser at any time prior to one year from November 30, 2007 for $100 million plus accrued and unpaid interest. If the redemption occurred prior to April 29, 2008, accrued interest would be waived. Proceeds from the sale were recorded as a decrease to the Company’s full cost pool. The note was recorded upon closing at $100 million less a discount of $4.8 million, or approximately $95.2 million. On April 28, 2008, the purchaser redeemed the note for $100 million.
In conjunction with the closing of this sale, the Company deposited $650 million with a qualified intermediary to facilitate potential like-kind exchange transactions, all of which was utilized for property acquisitions completed during the fourth quarter of 2007 and first quarter of 2008.
In connection with the sale of the Company’s Gulf Coast properties, the employment of certain employees was terminated, giving rise to termination benefits resulting in additional general and administrative expenses of $9.5 million recorded by the Company on November 30, 2007. In addition, outstanding stock appreciation rights, stock options and restricted share awards to employees whose employment was terminated in connection with the sale were modified to extend the exercise period from 90 days to November 30, 2008, as well as to accelerate the vesting of those awards. As a result of these two modifications, the Company recognized an additional $2.4 million of stock-based compensation expense on November 30, 2007.
78
Table of Contents
Index to Financial Statements
| 3. | OIL AND NATURAL GAS PROPERTIES |
Oil and natural gas properties as of December 31, 2009 and 2008 consisted of the following:
| December 31, | ||||||||
| 2009 | 2008 | |||||||
| (In thousands) | ||||||||
| Subject to depletion |
$ | 5,984,765 | $ | 4,894,357 | ||||
| Not subject to depletion: |
||||||||
| Exploration wells in progress |
91,227 | 95,744 | ||||||
| Other capital costs: |
||||||||
| Incurred in 2009 |
496,309 | — | ||||||
| Incurred in 2008 |
1,657,489 | 1,883,950 | ||||||
| Incurred in 2007 |
263,947 | 296,628 | ||||||
| Incurred in 2006 and prior |
3,481 | 11,646 | ||||||
| Total not subject to depletion |
2,512,453 | 2,287,968 | ||||||
| Gross oil and natural gas properties |
8,497,218 | 7,182,325 | ||||||
| Less accumulated depletion |
(4,329,485 | ) | (2,111,038 | ) | ||||
| Net oil and natural gas properties |
$ | 4,167,733 | $ | 5,071,287 | ||||
The Company uses the full cost method of accounting for its investment in oil and natural gas properties. Under this method of accounting, all costs of acquisition, exploration and development of oil and natural gas reserves (including such costs as leasehold acquisition costs, geological expenditures, dry hole costs, tangible and intangible development costs and direct internal costs) are capitalized as the cost of oil and natural gas properties when incurred. To the extent capitalized costs of evaluated oil and natural gas properties, net of accumulated depletion exceed the discounted future net revenues of proved oil and natural gas reserves net of deferred taxes, such excess capitalized costs are charged to expense. Beginning December 31, 2009, full cost companies use the unweighted arithmetic average first day of the month price for oil and natural gas for the 12-month period preceding the calculation date. Prior to December 31, 2009, companies used the price in effect at the end of each accounting quarter and had the option, under certain circumstances, to elect to use subsequent commodity prices if they increased after the end of the accounting quarter.
The Company assesses all items classified as unevaluated property on a quarterly basis for possible impairment or reduction in value. The Company assesses properties on an individual basis or as a group if properties are individually insignificant. The assessment includes consideration of the following factors, among others: intent to drill; remaining lease term; geological and geophysical evaluations; drilling results and activity; the assignment of proved reserves; and the economic viability of development if proved reserves are assigned. During any period in which these factors indicate an impairment, the cumulative drilling costs incurred to date for such property and all or a portion of the associated leasehold costs are transferred to the full cost pool and are then subject to amortization.
At December 31, 2009 the ceiling test value of the Company’s reserves was calculated based on the first day average of the 12-months ended December 31, 2009 of the West Texas Intermediate (WTI) posted price of $57.65 per barrel, adjusted by lease for quality, transportation fees, and regional price differentials, and the first day average of the 12-months ended December 31, 2009 of the Henry Hub price of $3.87 per Mmbtu, adjusted by lease for energy content, transportation fees, and regional price differentials. Using these prices, the Company’s net book value of oil and natural gas properties at December 31, 2009, exceeded the ceiling amount. As a result, the Company recorded a full cost ceiling impairment before income taxes of $106 million and $65 million after taxes. Changes in production rates, levels of reserves, future development costs, and other factors will determine the Company’s actual ceiling test calculation and impairment analyses in future periods. For the period ended March 31, 2009, the Company recorded a full cost ceiling test impairment before income taxes of $1.7 billion and $1.1 billion after taxes.
79
Table of Contents
Index to Financial Statements
At December 31, 2008, the ceiling test value of the Company’s reserves was calculated based on the December 31, 2008 West Texas Intermediate posted price of $41.00 per barrel adjusted by lease for quality, transportation fees, and regional price differentials, and the December 31, 2008 Henry Hub spot market price of $5.71 per million British thermal unit (Mmbtu) adjusted by lease for energy content, transportation fees, and regional price differentials. Using these prices, the Company’s net book value of oil and natural gas properties would have exceeded the ceiling amount by approximately $1.0 billion before tax, $574 million after tax, at December 31, 2008. Subsequent to year-end, the market price for Henry Hub gas and West Texas Intermediate oil did not increase. Accordingly, the Company recorded an approximate $1.0 billion full cost ceiling impairment at December 31, 2008.
| 4. | LONG-TERM DEBT |
Long-term debt as of December 31, 2009 and 2008 consisted of the following:
| December 31, | ||||||
| 2009 (1) | 2008 (1) | |||||
| (In thousands) | ||||||
| Senior revolving credit facility |
$ | 203,000 | $ | 450,000 | ||
| 10.5% $600 million senior notes (2) |
554,154 | — | ||||
| 7.875% $800 million senior notes |
800,000 | 800,000 | ||||
| 9.125% $775 million senior notes (3) |
764,694 | 763,773 | ||||
| 7.125% $275 million senior notes (4) |
266,402 | 264,080 | ||||
| 9.875% senior notes |
224 | 254 | ||||
| Deferred premiums on derivatives |
4,070 | 5,767 | ||||
| $ | 2,592,544 | $ | 2,283,874 | |||
| (1) | Amount excludes $49.4 million and $9.4 million of deferred premiums on derivatives which have been classified as current at December 31, 2009 and 2008, respectively. |
| (2) | Amount includes a $45.8 million unamortized discount at December 31, 2009 recorded by the Company in conjunction with the issuance of the $600.0 million notes. See “10.5% Senior Notes” below for more details |
| (3) | This amount is comprised of the $650.0 million and $125.0 million private placements consummated in July 2006. These amounts include a $4.8 million and $5.9 million discount at December 31, 2009 and 2008, respectively, recorded by the Company in conjunction with the issuance of the $650.0 million notes. Additionally, these amounts include a $0.8 million and a $1.0 million premium at December 31, 2009 and 2008, respectively, recorded by the Company in conjunction with the issuance of the $125.0 million notes. See “9.125% Senior Notes” below for more details. |
| (4) | Amount includes a $6.0 million and $8.3 million discount at December 31, 2009 and 2008, respectively, recorded by the Company in conjunction with the assumption of the notes. See “7.125% Senior Notes” below for more details. |
Senior Revolving Credit Facility
The Company’s Fourth Amended and Restated Senior Revolving Credit Agreement, dated as of October 14, 2009 (the Senior Credit Agreement), between the Company, each of the lenders from time to time party thereto (the Lenders), BNP Paribas, as administrative agent for the Lenders, Bank of America, N.A. and BMO Capital Markets Financing, Inc. as co-syndication agents for the Lenders, and JPMorgan Chase Bank, N.A. and Wells Fargo Bank, N.A., as co-documentation agents for the Lenders, amends and restates its Third Amended and Restated Senior Revolving Credit Agreement dated September 10, 2008. The Senior Credit Agreement provides for a $2.0 billion facility with a borrowing base of $1.5 billion, $1.2 billion of which relates to the Company’s oil and natural gas properties and up to $300 million (currently limited as described below) of which relates to the Company’s midstream assets. The Company’s $1.2 billion borrowing base attributable to its oil and natural gas properties was reduced $200 million to $1.0 billion upon the closing of the sale of the Company’s Permian Basin properties on October 30, 2009. The portion of the borrowing base which relates to the Company’s oil and natural gas properties will be redetermined on a semi-annual basis (with the Company and the Lenders each having the
80
Table of Contents
Index to Financial Statements
right to one annual interim unscheduled redetermination) and adjusted based on the Company’s oil and natural gas properties, reserves, other indebtedness and other relevant factors. The component of the borrowing base related to the Company’s midstream assets is limited to the lesser of $300 million or 3.5 times midstream EBITDA, and is automatically determined quarterly. The Company’s borrowing base is subject to a reduction equal to the product of $0.25 multiplied by the stated principal amount (without regard to any initial issue discount) of any notes that the Company may issue.
Amounts outstanding under the Senior Credit Agreement bear interest at specified margins over the London Interbank Offered Rate (LIBOR) of 2.25% to 3.25% for Eurodollar loans or at specified margins over the Alternate Base Rate (ABR) of 0.75% to 1.75% for ABR loans. Such margins will fluctuate based on the utilization of the facility. Borrowings under the Senior Credit Agreement are secured by first priority liens on substantially all of the Company’s assets, including pursuant to the terms of the Fourth Amended and Restated Guarantee and Collateral Agreement, all of the assets of, and equity interests in, the Company’s subsidiaries. Amounts drawn down on the facility will mature on July 1, 2013.
The Senior Credit Agreement contains customary financial and other covenants, including minimum working capital levels (the ratio of current assets plus the unused commitment under the Senior Credit Agreement to current liabilities) of not less than 1.0 to 1.0 and minimum coverage of interest expenses (as defined) of not less than 2.5 to 1.0. In addition, the Company is subject to covenants limiting dividends and other restricted payments, transactions with affiliates, incurrence of debt, changes of control, asset sales, and liens on properties. At December 31, 2009, the Company was in compliance with its financial debt covenants under the Senior Credit Agreement.
10.5% Senior Notes
On January 27, 2009, the Company completed a private placement offering to eligible purchasers of an aggregate principal amount of $600 million of its 10.5% senior notes due August 1, 2014 (the 2014 Notes). The 2014 notes were issued under and are governed by an indenture dated January 27, 2009, between the Company, U.S. Bank Trust National Association, as trustee, and the Company’s subsidiaries named therein as guarantors (the 2014 Indenture). The 2014 Notes were priced at 91.279% of the face value to yield 12.7% to maturity. Net proceeds from the offering were used to repay all outstanding borrowings on the Company’s Senior Credit Agreement.
The 2014 Notes bear interest at a rate of 10.5% per annum, payable semi-annually on February 1 and August 1 of each year, commencing August 1, 2009. The 2014 notes will mature on August 1, 2014. The 2014 Notes are senior unsecured obligations of the Company and rank equally with all of its current and future senior indebtedness. The 2014 Notes are jointly and severally guaranteed on a senior unsecured basis by the Company’s subsidiaries. Petrohawk Energy Corporation, the issuer of the Notes, has no material independent assets or operations apart from the assets and operations of its subsidiaries.
On or before February 1, 2012, the Company may redeem up to 35% of the aggregate principal amount of the 2014 Notes with the net cash proceeds of certain equity offerings at a redemption price of 110.5% of the principal amount plus accrued interest and unpaid interest to the redemption date provided that at least 65% in aggregate principal amount of the 2014 Notes originally issued under the 2014 Indenture remain outstanding immediately after the redemption. In addition, at any time prior to February 1, 2012, the Company may redeem some or all of the 2014 Notes for the principal amount thereof, plus accrued and unpaid interest plus a make whole premium equal to the excess, if any of (a) the present value at such time of (i) the redemption price of such note at February 1, 2012, (ii) plus required interest payments due on the notes, computed using a discount rate based upon the yield of United States Treasury securities with a constant maturity most nearly equal to the period from the redemption date to February 1, 2012 plus 50 basis points, over (b) the principal amount of such note.
On or after February 1, 2012, the Company may redeem some or all of the 2014 Notes at any time or from time to time at the redemption prices (expressed as a percentage of principal amount) set forth in the following
81
Table of Contents
Index to Financial Statements
table plus accrued and unpaid interest, if any, to the applicable redemption date, if redeemed during the 12-month period beginning February 1 of the years indicated below:
| Year |
Percentage | |
| 2012 |
110.500 | |
| 2013 |
105.250 | |
| 2014 |
100.000 |
The Company may be required to offer to repurchase the 2014 Notes at a purchase price of 101% of the principal amount, plus accrued and unpaid interest, if any, to the redemption date, in the event of a change of control as defined in the 2014 Indenture. The 2014 Indenture contains covenants that, among other things, restrict or limit the ability of the Company and its subsidiaries to: borrow money; pay dividends on stock; purchase or redeem stock or subordinated indebtedness; make investments; create liens; enter into transactions with affiliates; sell assets; and merge with or into other companies or transfer all or substantially all of the Company’s assets.
In conjunction with the issuance of the $600 million 2014 Notes, the Company recorded a discount of $52.3 million to be amortized over the remaining life of the notes utilizing the effective interest rate method. The remaining unamortized discount was $45.8 million at December 31, 2009.
7.875% Senior Notes
On May 13, 2008 and June 19, 2008, the Company issued $500 million principal amount and $300 million principal amount, respectively, of its 7.875% senior notes due 2015 (the 2015 Notes) pursuant to an indenture (the 2015 Indenture). The 2015 Notes were issued under and are governed by an indenture dated May 13, 2008, between the Company, U.S. Bank Trust National Association, as trustee, and the Company’s subsidiaries named therein as guarantors.
The 2015 Notes bear interest at a rate of 7.875% per annum, payable semi-annually on June 1 and December 1 of each year, commencing December 1, 2008. The 2015 Notes will mature on June 1, 2015. The 2015 Notes are senior unsecured obligations of the Company and rank equally with all of its current and future senior indebtedness. The 2015 Notes are jointly and severally guaranteed on a senior unsecured basis by the Company’s subsidiaries. Petrohawk Energy Corporation, the issuer of the Notes, has no material independent assets or operations apart from the assets and operations of its subsidiaries.
On or before June 1, 2011, the Company may redeem up to 35% of the aggregate principal amount of the 2015 Notes with the net cash proceeds of certain equity offerings at a redemption price of 107.875% of the principal amount plus accrued interest and unpaid interest to the redemption date provided that: at least 65% in aggregate principal amount of the 2015 Notes originally issued under the 2015 Indenture remain outstanding immediately after the redemption. In addition, at any time prior to June 1, 2012, the Company may redeem some or all of the 2015 Notes for the principal amount thereof, plus accrued and unpaid interest plus a make whole premium equal to the excess, if any of (a) the present value at such time of (i) the redemption price of such note at June 1, 2012, (ii) plus required interest payments due on the notes, computed using a discount rate based upon the yield of United States Treasury securities with a constant maturity most nearly equal to the period from the redemption date to June 1, 2012 plus 50 basis points, over (b) the principal amount of such note.
On or after June 1, 2012, the Company may redeem some or all of the 2015 Notes at any time or from time to time at the redemption prices (expressed as a percentage of principal amount) set forth in the following table plus accrued and unpaid interest, if any, to the applicable redemption date, if redeemed during the 12-month period beginning June 1 of the years indicated below:
| Year |
Percentage | |
| 2012 |
103.938 | |
| 2013 |
101.969 | |
| 2014 |
100.000 |
82
Table of Contents
Index to Financial Statements
The Company may be required to offer to repurchase the 2015 Notes at a purchase price of 101% of the principal amount, plus accrued and unpaid interest, if any, to the redemption date, in the event of a change of control as defined in the 2015 Indenture. The 2015 Indenture contains covenants that, among other things, restrict or limit the ability of the Company and its subsidiaries to: borrow money; pay dividends on stock; purchase or redeem stock or subordinated indebtedness; make investments; create liens; enter into transactions with affiliates; sell assets; and merge with or into other companies or transfer all or substantially all of the Company’s assets.
9.125% Senior Notes
On July 12 and 27, 2006, the Company issued a total of $775 million principal amount of its 9.125% Senior Notes due 2013 (2013 Notes), pursuant to an Indenture dated as of July 12, 2006 (2013 Indenture) and the First Supplemental Indenture to the 2013 Notes (the 2013 First Supplemental Indenture), among the Company, the Company’s subsidiaries named therein as guarantors, and U.S. Bank National Association, as trustee. The Company issued the 2013 Notes in two tranches, $650 million on July 12, 2006 and $125 million on July 27, 2006. The additional $125 million in 2013 Notes were issued pursuant to the same Indenture at 101.125% of the face amount. The Company applied the net proceeds from the sale of the additional 2013 Notes to repay indebtedness outstanding under its revolving credit facility. The $650 million tranche of 2013 Notes were issued at 98.735% of the face amount for gross proceeds of approximately $642.0 million, before estimated offering expenses and the initial purchasers’ discount. The Company applied a portion of the net proceeds from the initial sale of the 2013 Notes to fund the cash consideration paid by the Company in connection with the Company’s merger with KCS and the Company’s repurchase of the 2011 Notes pursuant to a tender offer the Company concluded in July 2006.
The 2013 Notes bear interest at the rate of 9.125% per annum, payable semi-annually on January 15 and July 15 of each year, commencing January 15, 2007. The 2013 Notes mature on July 15, 2013. The 2013 Notes are senior unsecured obligations of the Company and rank equally with all of its current and future senior indebtedness, including the 2012 Notes. The 2013 Notes rank effectively subordinate to the Company’s secured debt to the extent of the collateral, including secured debt under the Senior Credit Agreement, and senior to any future subordinated indebtedness. The 2013 Notes are jointly and severally guaranteed on a senior unsecured basis by the Company’s subsidiaries, including, pursuant to the 2013 First Supplemental Indenture, the KCS subsidiaries acquired in the Company’s merger with KCS. Petrohawk Energy Corporation, the issuer of the 2013 Notes, has no material independent assets or operations apart from the assets and operations of its subsidiaries.
In addition, before July 15, 2010, the Company may redeem all or part of the 2013 Notes upon not less than 30 nor more than 60 days notice, at a redemption price equal to the sum of (i) the principal amount, plus (ii) accrued and unpaid interest, if any, to the redemption date, plus (iii) the make whole premium at the redemption date.
On or after July 15, 2010, the Company may redeem some or all of the 2013 Notes at any time. If any of the 2013 Notes are redeemed during any 12-month period beginning on July 15 of the year indicated below, the Company must pay the following redemption prices (expressed as percentages of principal amount) plus accrued and unpaid interest thereon, if any, to the applicable redemption date:
| Year |
Percentage | |
| 2010 |
104.563 | |
| 2011 |
102.281 | |
| 2012 |
100.000 |
The Company may be required to offer to repurchase the 2013 Notes at a purchase price of 101% of the principal amount, plus accrued and unpaid interest, if any, to the redemption date, in the event of a change of control as defined in the 2013 Indenture. Additionally, the Company may be required to offer to repurchase the 2013 Notes and, to the extent required by the terms thereof, all other indebtedness (as defined in the 2013
83
Table of Contents
Index to Financial Statements
Indenture) that is pari passu with the 2013 Notes at a purchase price of 100% of the principal amount (or accreted value in the case of any such other pari passu indebtedness issued with a significant original issue discount) plus accrued and unpaid interest, if any, to the date of purchase, in the event net proceeds from assets sales are not applied as required by the 2013 Indenture.
The 2013 Indenture contains covenants that, among other things, restrict or limit the ability of the Company and its subsidiaries to: (i) borrow money; (ii) pay dividends on stock; (iii) purchase or redeem stock or subordinated indebtedness; (iv) make investments; (v) create liens; (vi) enter into transactions with affiliates; (vii) sell assets; and (viii) merge with or into other companies or transfer all or substantially all of the Company’s assets.
In conjunction with the issuance of the $650 million 2013 Notes, the Company recorded a discount of $8.2 million to be amortized over the remaining life of the notes utilizing the effective interest rate method. The remaining unamortized discount was $4.8 million and $5.9 million at December 31, 2009 and 2008, respectively. In conjunction with the issuance of the $125 million 2013 Notes, the Company recorded a premium of $1.4 million to be amortized over the remaining life of the notes utilizing the effective interest rate method. The remaining unamortized premium was $0.8 million and $1.0 million at December 31, 2009 and 2008, respectively.
7.125% Senior Notes
Upon effectiveness of the Company’s merger with KCS, the Company assumed (pursuant to the Second Supplemental Indenture relating to the 7.125% Senior Notes, also referred to as the 2012 Notes), and subsidiaries of the Company guaranteed (pursuant to the Third Supplemental Indenture relating to such notes), all the obligations (approximately $275 million) of KCS under the 2012 Notes and the Indenture dated April 1, 2004 (the 2012 Indenture) among KCS, U.S. Bank National Association, as trustee, and the subsidiary guarantors named therein, which governs the terms of the 2012 Notes. The 2012 Notes are guaranteed on an unsubordinated, unsecured basis by all of the Company’s current subsidiaries, including the subsidiaries of KCS that the Company acquired in the merger. Interest on the 2012 Notes is payable semi-annually, on each April 1 and October 1. On or after April 1, 2008, the Company may redeem all or a portion of the 2012 Notes. If the notes are redeemed during any 12-month period beginning on April 1 of the year indicated below, the Company must pay 100% of the principal price, plus a specified premium (expressed as percentages of principal amount) plus accrued and unpaid interest thereon, if any, to the applicable redemption date:
| Year |
Percentage | |
| 2010 |
100.000 | |
| 2011 |
100.000 | |
| 2012 |
100.000 |
In conjunction with the assumption of the 7.125% Senior Notes from KCS, the Company recorded a discount of $13.6 million to be amortized over the remaining life of the notes utilizing the effective interest rate method. The remaining unamortized discount was $6.0 million and $8.3 million at December 31, 2009 and 2008, respectively.
The 2012 Notes are jointly and severally guaranteed on a senior unsecured basis by the Company’s subsidiaries. Petrohawk Energy Corporation, the issuer of the Notes, has no material independent assets or operations apart from the assets and operations of its subsidiaries.
9.875% Senior Notes
On April 8, 2004, Mission issued $130.0 million of its 9.875% senior notes due 2011 (the 2011 Notes). The Company assumed these notes upon the closing of the Company’s merger with Mission. In conjunction with the Company’s merger with KCS, the Company extinguished substantially all of its 2011 Notes for a premium of $14.9 million plus accrued interest of $3.5 million. There were approximately $0.2 million and $0.3 million of
84
Table of Contents
Index to Financial Statements
the notes which were not redeemed and are still outstanding as of December 31, 2009 and 2008, respectively. In connection with the extinguishment of substantially all of the 2011 Notes, the Company requested and received from the noteholders consent to eliminate most significant debt covenants associated with the 2011 Notes.
Debt Maturities
Aggregate maturities required on long-term debt at December 31, 2009 are due in future years as follows (in thousands):
| 2010 (1) |
$ | 49,370 | |
| 2011 |
4,294 | ||
| 2012 |
272,375 | ||
| 2013 |
971,725 | ||
| 2014 |
600,000 | ||
| Thereafter |
800,000 | ||
| Total |
$ | 2,697,764 | |
| (1) | Amount represents deferred premiums on derivatives which have been classified as current at December 31, 2009. |
Debt Issuance Costs
The Company capitalizes certain direct costs associated with the issuance of long-term debt. The Company capitalized $23.8 million of debt issue costs in connection with the Company’s issuance of 2015 Notes in May and June 2008 and in connection with the Company’s amended and restated senior revolving credit facility in September 2008. The Company capitalized $13.2 million with its issuance of the 2014 Notes in January 2009 and $11.0 million in connection with the Company’s amended and restated Senior Revolving Credit Agreement in October 2009. In the first quarter of 2009, the Company wrote off $0.9 million of debt issuance costs as a result of the 2014 Notes issuance and from the reduction of our Senior Credit Agreement’s borrowing base to $950 million. At December 31, 2009 and 2008, the Company had approximately $44.9 million and $30.5 million, respectively of debt issuance costs remaining that are being amortized over the lives of the respective debt.
| 5. | FAIR VALUE MEASUREMENTS |
Effective January 1, 2008, the Company adopted new guidance codified under ASC 820. ASC 820 defines fair value, establishes a framework for measuring fair value and expands the related disclosure requirements. Pursuant to ASC 820, the Company’s determination of fair value incorporates not only the credit standing of the counterparties involved in transactions with the Company resulting in receivables on the Company’s consolidated balance sheets, but also the impact of the Company’s nonperformance risk on its liabilities.
ASC 820 defines fair value as the price that would be received to sell an asset or paid to transfer a liability in an orderly transaction between market participants at the measurement date (exit price). The Company utilizes market data or assumptions that market participants would use in pricing the asset or liability, including assumptions about risk and the risks inherent in the inputs to the valuation technique. These inputs can be readily observable, market corroborated, or generally unobservable. The Company classifies fair value balances based on the observability of those inputs. ASC 820 establishes a fair value hierarchy that prioritizes the inputs used to measure fair value. The hierarchy gives the highest priority to unadjusted quoted prices in active markets for identical assets or liabilities (level 1 measurement) and the lowest priority to unobservable inputs (level 3 measurement).
The three levels of the fair value hierarchy defined by ASC 820 are as follows:
Level 1—Quoted prices are available in active markets for identical assets or liabilities as of the reporting date. Active markets are those in which transactions for the asset or liability occur in sufficient frequency
85
Table of Contents
Index to Financial Statements
and volume to provide pricing information on an ongoing basis. Level 1 primarily consists of financial instruments such as exchange-traded derivatives, marketable securities and listed equities.
Level 2—Pricing inputs are other than quoted prices in active markets included in level 1, which are either directly or indirectly observable as of the reported date. Level 2 includes those financial instruments that are valued using models or other valuation methodologies. These models are primarily industry-standard models that consider various assumptions, including quoted forward prices for commodities, time value, volatility factors, and current market and contractual prices for the underlying instruments, as well as other relevant economic measures. Substantially all of these assumptions are observable in the marketplace throughout the full term of the instrument, can be derived from observable data or are supported by observable levels at which transactions are executed in the marketplace. Instruments in this category generally include non-exchange-traded derivatives such as commodity swaps, interest rate swaps, options and collars.
Level 3—Pricing inputs include significant inputs that are generally less observable from objective sources. These inputs may be used with internally developed methodologies that result in management’s best estimate of fair value.
The following tables set forth by level within the fair value hierarchy the Company’s financial assets and liabilities that were accounted for at fair value as of December 31, 2009 and 2008. As required by ASC 820, a financial instrument’s level within the fair value hierarchy is based on the lowest level of input that is significant to the fair value measurement. The Company’s assessment of the significance of a particular input to the fair value measurement requires judgment, and may affect the valuation of fair value assets and liabilities and their placement within the fair value hierarchy levels.
| December 31, 2009 | ||||||||||||
| Level 1 | Level 2 | Level 3 | Total | |||||||||
| (In thousands) | ||||||||||||
| Assets |
||||||||||||
| Restricted cash |
$ | 213,704 | $ | — | $ | — | $ | 213,704 | ||||
| Receivables from derivative contracts |
— | 162,862 | — | 162,862 | ||||||||
| $ | 213,704 | $ | 162,862 | $ | — | $ | 376,566 | |||||
| Liabilities |
||||||||||||
| Liabilities from derivative contracts |
$ | — | $ | 1,807 | $ | — | $ | 1,807 | ||||
| December 31, 2008 | ||||||||||||
| Level 1 | Level 2 | Level 3 | Total | |||||||||
| (In thousands) | ||||||||||||
| Assets |
||||||||||||
| Marketable securities |
$ | 123,009 | $ | — | $ | — | $ | 123,009 | ||||
| Receivables from derivative contracts |
— | 224,527 | — | 224,527 | ||||||||
| $ | 123,009 | $ | 224,527 | $ | — | $ | 347,536 | |||||
| Liabilities |
||||||||||||
| Liabilities from derivative contracts |
$ | — | $ | — | $ | — | $ | — | ||||
Marketable securities and restricted cash listed above are carried at fair value. The Company is able to value its marketable securities and restricted cash based on quoted fair values for identical instruments, which resulted in the Company reporting its marketable securities and restricted cash as Level 1.
Derivatives listed above include collars, swaps, basis swaps and puts that are carried at fair value. The Company records the net change in the fair value of these positions in “Net gain (loss) on derivative contracts”
86
Table of Contents
Index to Financial Statements
in the Company’s consolidated statements of operations. The Company is able to value the assets and liabilities based on observable market data for similar instruments, which resulted in the Company reporting its derivatives as Level 2. This observable data includes the forward curve for commodity prices based on quoted markets prices and implied volatility factors related to changes in the forward curves.
As of December 31, 2009 and 2008, the Company’s derivative contracts were with major financial institutions with investment grade credit ratings which are believed to have a minimal credit risk. As such, the Company is exposed to credit risk to the extent of nonperformance by the counterparties in the derivative contracts discussed above; however, the Company does not anticipate such nonperformance. Each of the counterparties to the Company’s derivative contracts is a lender in the Company’s Senior Credit Agreement. The Company did not post collateral under any of these contracts as they are secured under the Senior Credit Agreement.
The following disclosure of the estimated fair value of financial instruments is made in accordance with the requirements of ASC 825-10-65. The estimated fair value amounts have been determined at discrete points in time based on relevant market information. These estimates involve uncertainties and cannot be determined with precision. The estimated fair value of cash, accounts receivable and accounts payable approximates their carrying value due to their short-term nature. The estimated fair value of the Company’s Senior Credit Agreement approximates carrying value because the facility’s interest rate approximates current market rates. The following table presents the estimated fair values of the Company’s fixed interest rate debt instruments as of December 31, 2009 and 2008 (excluding premiums and discounts):
| December 31, 2009 | December 31, 2008 | |||||||||||
| Debt |
Carrying Amount |
Estimated Fair Value |
Carrying Amount |
Estimated Fair Value | ||||||||
| (In thousands) | ||||||||||||
| 10.5% $600 million senior notes |
$ | 600,000 | $ | 658,500 | $ | — | $ | — | ||||
| 7.875% $800 million senior notes |
800,000 | 804,000 | 800,000 | 591,040 | ||||||||
| 9.125% $775 million senior notes |
768,725 | 805,239 | 768,725 | 595,762 | ||||||||
| 7.125% $275 million senior notes |
272,375 | 273,056 | 272,375 | 223,348 | ||||||||
| 9.875% senior notes |
224 | 227 | 254 | 213 | ||||||||
| $ | 2,441,324 | $ | 2,541,022 | $ | 1,841,354 | $ | 1,410,363 | |||||
The fair values of the Company’s fixed interest debt instruments were calculated using quoted market prices based on trades of such debt as of December 31, 2009 and 2008.
| 6. | ASSET RETIREMENT OBLIGATION |
The Company records an asset retirement obligation (ARO) when the total depth of a drilled well is reached and the Company can reasonably estimate the fair value of an obligation to perform site reclamation, dismantle facilities or plug and abandon costs. For gas gathering systems, the Company records an ARO when the system is placed in service and the Company can reasonably estimate the fair value of an obligation to perform site reclamation and other necessary work. The Company records the ARO liability on the consolidated balance sheets and capitalizes a portion of the cost in “Oil and natural gas properties” or “Gas gathering systems and equipment” during the period in which the obligation is incurred. In general, the amount of an ARO and the costs capitalized will be equal to the estimated future cost to satisfy the abandonment obligation using current prices that are escalated by an assumed inflation factor up to the estimated settlement date and adjusted for the Company’s credit risk. This amount is then discounted back to the date that the abandonment obligation was incurred using an assumed cost of funds for the Company. After recording these amounts, the ARO is accreted to its future estimated value using the same assumed cost of funds. The Company records the accretion of its ARO liabilities in “Depletion, depreciation and amortization” expense in the consolidated statements of operations. The additional capitalized costs are depreciated on a unit-of-production basis or straight-line basis.
87
Table of Contents
Index to Financial Statements
The Company recorded the following activity related to the ARO liability for the years ended December 31, 2009 and 2008 (in thousands):
| Liability for asset retirement obligation as of December 31, 2007 |
$ | 23,800 | ||
| Liabilities settled and divested (1) |
(339 | ) | ||
| Additions |
2,780 | |||
| Acquisitions (1) |
1,157 | |||
| Accretion expense |
1,246 | |||
| Liability for asset retirement obligation as of December 31, 2008 |
28,644 | |||
| Liabilities settled and divested (1) |
(10,218 | ) | ||
| Additions |
3,744 | |||
| Acquisitions (1) |
14 | |||
| Accretion expense |
1,461 | |||
| Revisions in estimated cash flows (2) |
20,355 | |||
| Liability for asset retirement obligation as of December 31, 2009 |
$ | 44,000 | ||
| (1) | Refer to Note 2 “Acquisitions and Divestitures” for more details on the Company’s acquisition and divestiture activities. |
| (2) | During 2009, the Company recognized a revision of $20.4 million to its asset retirement obligation which resulted primarily from an overall increase in the Company’s abandonment cost estimates. |
| 7. | COMMITMENTS AND CONTINGENCIES |
Contingencies
From time to time, the Company may be a plaintiff or defendant in a pending or threatened legal proceeding arising in the normal course of its business. All known liabilities are accrued based on the Company’s best estimate of the potential loss. While the outcome and impact of currently pending legal proceedings cannot be predicted with certainty, the Company’s management and legal counsel believe that the resolution of these proceedings through settlement or adverse judgment will not have a material adverse effect on the Company’s consolidated operating results, financial position or cash flows.
Lease Commitments
The Company leases corporate office space in Houston, Texas and Tulsa, Oklahoma as well as a number of other field office locations. In addition, the Company also has lease commitments related to certain vehicles, machinery and equipment under long-term operating leases. Rent expense was $5.1 million, $4.1 million, and $3.3 million for the years ended December 31, 2009, 2008, and 2007, respectively. As of December 31, 2009, future minimum lease payments for all non-cancelable operating leases are as follows (in thousands):
| 2010 |
$ | 9,183 | |
| 2011 |
5,669 | ||
| 2012 |
5,567 | ||
| 2013 |
5,587 | ||
| 2014 |
4,014 | ||
| Thereafter |
3,283 | ||
| Total |
$ | 33,303 | |
88
Table of Contents
Index to Financial Statements
As of December 31, 2009, the Company has drilling rig commitments totaling $297.5 million as follows (in thousands):
| 2010 |
$ | 139,162 | |
| 2011 |
103,179 | ||
| 2012 |
55,188 | ||
| 2013 |
— | ||
| 2014 |
— | ||
| Thereafter |
— | ||
| Total |
$ | 297,529 | |
As of December 31, 2009, the Company has natural gas transportation commitments totaling $1.4 billion as follows (in thousands):
| 2010 |
$ | 109,451 | |
| 2011 |
124,668 | ||
| 2012 |
137,816 | ||
| 2013 |
126,384 | ||
| 2014 |
121,891 | ||
| Thereafter |
772,667 | ||
| Total |
$ | 1,392,877 | |
The Company has various other contractual commitments pertaining to exploration, development and production activities. The Company has work related commitments for, among other things, pipeline and well equipment and obtaining and processing seismic data. As of December 31, 2009, the Company is obligated pay $92.9 million as follows (in thousands):
| 2010 |
$ | 92,878 | |
| 2011 |
— | ||
| 2012 |
— | ||
| 2013 |
— | ||
| 2014 |
— | ||
| Thereafter |
— | ||
| Total |
$ | 92,878 | |
| 8. | DERIVATIVE AND HEDGING ACTIVITIES |
The Company is exposed to certain risks relating to its ongoing business operations, such as commodity price risk and interest rate risk. Derivative contracts are utilized to economically hedge its exposure to price fluctuations and reduce the variability in the Company’s cash flows associated with anticipated sales on future oil and natural gas production. The Company generally hedges a substantial, but varying, portion of anticipated oil and natural gas production for the next 12-36 months. Derivatives are carried at fair value on the consolidated balance sheets, with the changes in the fair value included in the consolidated statements of operations for the period in which the change occurs. Periodically, the Company enters into interest rate swaps to mitigate exposure to market rate fluctuations by converting variable interest rates (such as those on the Company’s Senior Credit Agreement) to fixed interest rates.
It is the Company’s policy to enter into derivative contracts, including interest rate swaps, only with counterparties that are creditworthy financial institutions deemed by management as competent and competitive
89
Table of Contents
Index to Financial Statements
market makers. Each of the counterparties to the Company’s derivative contracts is a lender in the Company’s Senior Credit Agreement. The Company did not post collateral under any of these contracts as they are secured under the Company’s Senior Credit Agreement.
At December 31, 2009 the Company has entered into commodity collars, swaps and put options. The Company has elected to not designate any of its derivative contracts for hedge accounting. Accordingly, the Company records the net change in the mark-to-market valuation of these derivative contracts, as well as all payments and receipts on settled derivative contracts, in “Net gain (loss) on derivative contracts” on the consolidated statements of operations.
During the second quarter of 2009, the Company entered into five interest rate swaps to convert a portion of its long-term debt from a fixed interest rate to a variable interest rate. During the third quarter of 2009, the Company made the decision to settle all of its outstanding interest rate swap positions which resulted in a gain of approximately $5.2 million. This gain is included in “Net gain (loss) on derivative contracts” on the consolidated statements of operations.
During the first quarter of 2009, the Company entered into three interest rate swap derivative contracts to hedge the variable rate paid on the Senior Credit Agreement. In conjunction with the issuance of the 2014 Notes in January 2009, the Company repaid all outstanding borrowings under its Senior Credit Agreement. As a result, the Company made the decision to settle all of its outstanding interest rate swap derivative contracts which resulted in a minimal gain during the first quarter of 2009. This gain is included in “Net gain (loss) on derivative contracts” on the consolidated statements of operations.
During the first quarter of 2008, the Company entered into two interest rate swap derivative contracts to hedge the variable rate paid on the Senior Credit Agreement. In conjunction with the Company’s debt and equity raises during the second quarter of 2008, the Company repaid all outstanding borrowings under its Senior Credit Agreement. As a result, the Company made the decision to settle all of its outstanding interest rate swap derivative contracts which resulted in a gain of $1.5 million during the second quarter of 2008 which is included in “Net gain (loss) on derivative contracts” on the consolidated statements of operations.
At December 31, 2009, the Company had 77 open commodity derivative contracts summarized in the tables below: 61 natural gas collar arrangements, one natural gas swap arrangement, 13 natural gas put options and two crude oil price swap arrangements. Derivative commodity contracts settle based on NYMEX West Texas Intermediate and Henry Hub prices which may differ from the actual price received by the Company for the sale of its oil and natural gas production.
At December 31, 2008, the Company had 69 open commodity derivative contracts summarized in the tables below: 52 natural gas collar arrangements, two natural gas swap arrangements, one natural gas basis swap arrangement, 10 natural gas put options and four crude oil price swap arrangements.
90
Table of Contents
Index to Financial Statements
All derivative contracts are recorded at fair market value in accordance with ASC 815 and ASC 820 and included in the consolidated balance sheets as assets or liabilities. The following table summarizes the location and fair value amounts of all derivative contracts in the consolidated balance sheets as of December 31, 2009 and 2008:
| Derivatives not designated as hedging contracts under ASC 815 |
Asset derivative contracts |
Liability derivative contracts | |||||||||||||||
| Balance sheet location |
December 31, | Balance sheet location |
December 31, | ||||||||||||||
| 2009 | 2008 | 2009 | 2008 | ||||||||||||||
| (In thousands) | (In thousands) | ||||||||||||||||
| Commodity contracts |
Current assets—receivables from derivative contracts |
$ | 112,441 | $ | 201,128 | Current liabilities— liabilities from derivative |
$ | (1,807 | ) | $ | — | ||||||
| Commodity contracts |
Other noncurrent assets— receivables from derivative contracts |
50,421 | 23,399 | Other noncurrent liabilities— liabilities from derivative contracts |
— | — | |||||||||||
| Total derivatives not designated as hedging contracts under ASC 815 |
$ | 162,862 | $ | 224,527 | $ | (1,807 | ) | $ | — | ||||||||
The following table summarizes the location and amounts of the Company’s realized and unrealized gains and losses on derivative contracts in the Company’s consolidated statements of operations:
| Derivatives not designated as hedging |
Location of gain or (loss) recognized
in |
Amount of gain or (loss) recognized in income on derivative contracts year ended December 31, |
||||||||||||
| 2009 | 2008 | 2007 | ||||||||||||
| (In thousands) | ||||||||||||||
| Commodity contracts: |
||||||||||||||
| Unrealized (loss) gain on commodity contracts |
Other (expenses) income—net gain (loss) on derivative contracts | $ | (120,401 | ) | $ | 230,640 | $ | (79,011 | ) | |||||
| Realized gain (loss) on commodity contracts |
Other income (expenses)—net gain (loss) on derivative contracts |
375,116 | (75,270 | ) | 44,000 | |||||||||
| Total net gain (loss) on commodity contracts |
$ | 254,715 | $ | 155,370 | $ | (35,011 | ) | |||||||
| Interest rate swaps: |
||||||||||||||
| Unrealized gain (loss) on interest rate swaps |
Other (expenses) income—net gain (loss) on derivative contracts | $ | — | $ | — | $ | — | |||||||
| Realized gain on interest rate swaps |
Other income (expenses)—net gain (loss) on derivative contracts | 5,533 | 1,500 | — | ||||||||||
| Total net gain on interest rate swaps |
$ | 5,533 | $ | 1,500 | $ | — | ||||||||
| Total net gain (loss) on derivative contracts |
Other income (expenses)—net gain (loss) on derivative contracts |
$ | 260,248 | $ | 156,870 | $ | (35,011 | ) | ||||||
At December 31, 2009 and 2008, the Company had the following open derivative contracts:
| Period |
Instrument |
Commodity |
December 31, 2009 | |||||||||||||||
| Volume in Mmbtu’s /Bbl’s |
Floors | Ceilings | ||||||||||||||||
| Price / Price Range |
Weighted Average Price |
Price / Price Range |
Weighted Average Price | |||||||||||||||
| January 2010—December 2010 |
Collars | Natural gas | 138,700,000 | $ | 5.00 - $7.00 | $ | 5.97 | $ | 9.00 - $10.00 | $ | 9.21 | |||||||
| January 2010—December 2010 |
Swaps | Natural gas | 1,825,000 | 8.22 | 8.22 | |||||||||||||
| January 2010—December 2010 |
Put Options | Natural gas | 25,640,000 | 4.49 - 5.00 | 4.87 | |||||||||||||
| January 2010—December 2010 |
Swaps | Oil | 273,750 | 75.15 - 75.55 | 75.28 | |||||||||||||
| January 2011—December 2011 |
Collars | Natural gas | 142,350,000 | 5.50 - 6.00 | 5.56 | 9.00 - 10.30 | 9.88 | |||||||||||
91
Table of Contents
Index to Financial Statements
| Period |
Instrument | Commodity | December 31, 2008 | |||||||||||||||
| Volume in Mmbtu’s /Bbl’s |
Floors | Ceilings | ||||||||||||||||
| Price / Price Range |
Weighted Average Price |
Price / Price Range |
Weighted Average Price | |||||||||||||||
| January 2009—December 2009 |
Collars | Natural gas | 75,730,000 | $ | 7.00 - $10.00 | $ | 7.57 | $ | 9.60 - $16.45 | $ | 11.79 | |||||||
| January 2009—December 2009 |
Swaps | Natural gas | 1,825,000 | 8.43 | 8.43 | |||||||||||||
| January 2009—December 2009 |
Put Options | Natural gas | 14,600,000 | 10.00 | 10.00 | |||||||||||||
| January 2009—December 2009 |
Swaps | Oil | 273,750 | 76.85 - 77.30 | 77.00 | |||||||||||||
| January 2010—December 2010 |
Collars | Natural gas | 29,200,000 | 7.00 | 7.00 | 10.00 | 10.00 | |||||||||||
| January 2010—December 2010 |
Swaps | Natural gas | 1,825,000 | 8.22 | 8.22 | |||||||||||||
| January 2010—December 2010 |
Swaps | Oil | 273,750 | 75.15 - 75.55 | 75.28 | |||||||||||||
| Period |
Instrument | Commodity | December 31, 2008 | |||||||||
| Volume in Mmbtu’s |
Price / Price Range |
Weighted Average Price | ||||||||||
| January 2009—December 2009 |
Basis swaps | Natural gas | 3,650,000 | $ | 0.33 | $ | 0.33 | |||||
| 9. | STOCKHOLDERS’ EQUITY |
On August 11, 2009, the Company sold an aggregate of 25.0 million shares of its common stock in an underwritten public offering. The gross proceeds from the sale were approximately $572 million, before deducting underwriting discounts and commissions and estimated expenses of $22 million.
On March 4, 2009, the Company sold an aggregate of 22.0 million shares of its common stock in an underwritten public offering. The gross proceeds from the sale were approximately $385 million, before deducting underwriting discounts and commissions and estimated expenses of $9 million.
On August 15, 2008, the Company sold an aggregate of 28.8 million shares of its common stock in an underwritten public offering. The gross proceeds from the sale were approximately $763 million, before deducting underwriting discounts and commissions and estimated expenses of $29 million.
On May 13, 2008, the Company sold an aggregate of 25.0 million shares of its common stock in an underwritten public offering. Pursuant to the underwriting agreement, the Company granted the underwriters a 30-day option to purchase up to an additional 3.75 million shares of common stock at the public offering price less underwriting discounts and commissions. The underwriters exercised in full their option to purchase additional shares of common stock which closed on May 23, 2008. The gross proceeds from these sales were approximately $759 million, before deducting underwriting discounts and commissions and estimated expenses of $32 million.
On February 1, 2008, the Company sold an aggregate of 20.7 million shares of its common stock in an underwritten public offering. The gross proceeds from the sale were approximately $311 million, before deducting underwriting discounts and commissions and estimated expenses of $14 million.
For the years ended December 31, 2009, 2008 and 2007, respectively, the Company has recognized $14.5 million, $12.3 million, and $15.5 million, respectively, of non-cash stock compensation expense.
Incentive Plans
The Company’s Incentive Plans include the Third Amended and Restated 2004 Employee Incentive Plan (2004 Employee Plan), Second Amended and Restated 2004 Non-Employee Director Incentive Plan (2004 Non-Employee Director Plan), Mission Resources Corporation 1994 Stock Incentive Plan (Mission 1994 Plan), Mission Resources Corporation 1996 Stock Incentive Plan (Mission 1996 Plan) and Mission Resources Corporation 2004 Incentive Plan (Mission 2004 Plan), KCS Energy, Inc. 2001 Employee and Directors Stock Plan (KCS 2001 Plan) and the KCS Energy, Inc. 2005 Employee and Directors Stock Plan (KCS 2005 Plan) as of December 31, 2009.
92
Table of Contents
Index to Financial Statements
Warrants, Options and Stock Appreciation Rights
Certain of the Company’s incentive plans permit awards of stock appreciation rights (SARS) and stock options. A stock appreciation right is similar to a stock option, in that it represents the right to realize the increase in market price, if any, of a fixed number of shares over the grant value of the right, which is equal to the market price of the Company’s common stock on the date of grant. Stock options, when exercised, are settled through the payment of the exercise price in exchange for shares of stock underlying the option. SARS, when exercised, are settled without cash in exchange for a net of tax number of shares of common stock valued on the date of settlement. Both SARS and stock options vest one-third annually after the original grant date and have a term of ten years from the date of grant.
The weighted average grant date fair value of options granted in 2009, 2008, and 2007 was $11.6 million, $6.1 million, and $5.4 million, respectively. At December 31, 2009, 2008, and 2007, the unrecognized compensation expense related to non-vested stock options totaled $6.7 million, $3.9 million, and $3.1 million respectively. The weighted average remaining vesting period as of December 31, 2009, 2008 and 2007 was 0.9 years for 2009, 0.9 years for 2008, and 1.8 years for 2007, respectively. There were 19,268 options, 11,559 options, and 11,650 options which expired in 2009, 2008, and 2007, respectively.
The following table sets forth the warrants, options and stock appreciation rights transactions for the years ended December 31, 2009, 2008, and 2007 (in thousands, except share and per share amounts).
| Number | Weighted Average Exercise Price Per Share |
Aggregate Intrinsic Value (1) |
Weighted Average Remaining Contractual Life (Years) | ||||||||
| Outstanding at December 31, 2006 |
9,226,213 | $ | 6.34 | $ | 47,607 | 6.0 | |||||
| Granted |
1,494,100 | 11.84 | |||||||||
| Exercised |
(2,378,593 | ) | 4.90 | ||||||||
| Forfeited |
(196,072 | ) | 11.96 | ||||||||
| Outstanding at December 31, 2007 |
8,145,648 | $ | 7.64 | $ | 78,779 | 4.9 | |||||
| Granted |
1,102,800 | 19.02 | |||||||||
| Exercised |
(3,036,031 | ) | 7.03 | ||||||||
| Forfeited |
(71,795 | ) | 13.19 | ||||||||
| Outstanding at December 31, 2008 |
6,140,622 | $ | 9.92 | $ | 45,390 | 6.3 | |||||
| Granted |
1,588,950 | 15.61 | |||||||||
| Exercised |
(1,281,304 | ) | 4.46 | ||||||||
| Forfeited |
(78,175 | ) | 16.01 | ||||||||
| Outstanding at December 31, 2009 |
6,370,093 | $ | 12.40 | $ | 74,454 | 6.9 | |||||
| (1) | The intrinsic value of a stock option is the amount by which the current market value of the underlying stock exceeds the exercise price of the option. The aggregate intrinsic value of stock options exercised during the years ended December 31, 2009, 2008, and 2007 was approximately $11.9 million, $47.5 million and $29.5 million, respectively. |
Warrants, options and stock appreciation rights outstanding at December 31, 2009 consisted of the following:
| Outstanding |
Exercisable | |||||||||||
| Range of Grant |
Number | Weighted Average Exercise Price per share |
Weighted Average Remaining Contractual Life (Years) |
Number | Weighted Average Exercise Price per share | |||||||
| $0.73 – 8.51 |
1,788,668 | $ | 6.41 | 4.5 | 1,788,668 | $ | 6.41 | |||||
| 8.80 – 11.64 |
1,537,265 | 11.09 | 6.8 | 1,229,441 | 10.95 | |||||||
| 12.00 – 15.23 |
1,890,607 | 14.93 | 8.4 | 398,305 | 13.82 | |||||||
| $15.84 – 47.16 |
1,153,553 | 19.28 | 8.3 | 362,927 | 19.02 | |||||||
93
Table of Contents
Index to Financial Statements
During the second quarter of 2004, and in connection with the recapitalization of the Company by PHAWK, LLC transaction, the Company issued PHAWK, LLC 5.0 million five-year common stock purchase warrants at a price of $3.30 per share. The warrants were exercisable at any time and expired on May 25, 2009. On July 8, 2005, shares and warrants held by PHAWK, LLC were distributed to its members, including certain members of the Company’s management. The Company had 0.6 million, 1.4 million, and 0.7 million warrants exercised and a net 0.5 million, 1.2 million, and 0.6 million shares of company stock issued during the years ended December 31, 2009, 2008, and 2007, respectively. These exercises were included within the options and warrants transactions table above.
Restricted Stock
From time to time, the Company grants shares of restricted stock to employees of the Company. Employee shares vest over a three-year period at a rate of one-third on the annual anniversary date of the grant and the non-employee directors’ shares vest six-months from the date of grant. The weighted average grant date fair value of the shares granted in 2009, 2008, and 2007 was $15.5 million, $11.4 million and $10.8 million, respectively. At December 31, 2009, 2008 and 2007, the unrecognized compensation expense related to non-vested restricted stock totaled $7.2 million, $6.8 million and $7.5 million, respectively. The weighted average remaining vesting period as of December 31, 2009, 2008, 2007 was 0.9 years, 1.4 years and 1.7 years, respectively.
The following table sets forth the restricted stock transactions for the years ended December 31, 2009, 2008 and 2007 (in thousands, except share and per share amounts).
| Number of Shares |
Weighted Average Grant Date Fair Value Per Share |
Aggregate Intrinsic Value (1) | |||||||
| Unvested outstanding shares at December 31, 2006 |
1,442,845 | $ | 12.38 | $ | 16,593 | ||||
| Granted |
867,100 | 12.52 | |||||||
| Vested |
(822,597 | ) | 12.23 | ||||||
| Forfeited |
(80,505 | ) | 12.46 | ||||||
| Unvested outstanding shares at December 31, 2007 |
1,406,843 | $ | 12.75 | $ | 24,352 | ||||
| Granted |
570,549 | 19.90 | |||||||
| Vested |
(730,964 | ) | 22.14 | ||||||
| Forfeited |
(38,286 | ) | 15.05 | ||||||
| Unvested outstanding shares at December 31, 2008 |
1,208,142 | $ | 15.31 | $ | 18,883 | ||||
| Granted |
950,214 | 16.36 | |||||||
| Vested |
(947,584 | ) | 15.21 | ||||||
| Forfeited |
(44,948 | ) | 15.27 | ||||||
| Unvested outstanding shares at December 31, 2009 |
1,165,824 | $ | 16.24 | $ | 27,968 | ||||
| (1) | The intrinsic value of restricted stock was calculated as the closing market price on December 31, 2009, 2008 and 2007 of the underlying stock multiplied by the number of restricted shares. |
Performance Shares
In conjunction with the Company’s merger with KCS, the Company assumed the KCS 2005 Plan under which performance share awards had been granted. The performance awards provide for a contingent right to receive shares of common stock. The grantee earns between 0% and 200% of the target amount of performance shares upon the achievement of pre-determined objectives over a three-year performance period. The objectives relate to the Company’s total stockholder return (as defined in the form of performance share agreement) as compared to the total stockholder return of a group of peer companies during the performance period.
94
Table of Contents
Index to Financial Statements
The fair value of the awards using a monte carlo technique was $10.89 per share. The Company recognized compensation cost of $1.5 million over the expected service life of the performance share awards whether or not the threshold is achieved. The Company recognized, $0.7 million and $0.5 million in compensation cost for the years ended December 31, 2008 and 2007, respectively. No amounts were expensed in 2009 as the performance period was completed on December 31, 2008. During the year ended December 31, 2007, approximately 19,000 net shares of restricted stock were issued as a result of the termination of certain employees with the sale of the Company’s Gulf Coast properties. A total of 200,864 shares were issued on February 16, 2009 which was equal to 200% of the target amount.
2004 Employee Incentive Plan
Upon stockholder approval and effective July 28, 2005, the Company’s Amended and Restated 2004 Employee Incentive Plan was amended and restated to be the Second Amended and Restated 2004 Employee Incentive Plan to increase the aggregate number of shares that can be issued under the 2004 Employee Plan from 2.75 million to 4.25 million. The 2004 Plan permits the Company to grant to management and other employees shares of common stock with no restrictions, shares of common stock with restrictions, stock appreciation rights and options to purchase shares of common stock.
On July 12, 2006, the Company and its stockholders approved an amendment to the 2004 Plan Employee to increase the number of shares available for issuance thereunder from 4.25 million shares to 7.05 million shares. On July 18, 2007, the Company and its stockholders approved an amendment to the 2004 Employee Plan to increase the number of shares available for issuance thereunder from 7.05 million shares to 12.55 million shares. On June 18, 2009, the Company and its stockholders approved an amendment to the 2004 Employee Plan to increase the number of shares available for issuance thereunder from 12.55 million shares to 17.85 million shares. At December 31, 2009, 8.6 million shares were available under the 2004 Employee Plan for future issuance.
2004 Non-Employee Director Incentive Plan
In July 2004 the Company adopted the 2004 Non-Employee Director Plan covering 0.20 million shares. The plan provides for the grant of both incentive stock options and restricted shares of the Company’s stock. This plan was designed to attract and retain the services of directors. At the adoption of the plan, each non-employee director received 7,500 restricted shares of the Company’s common stock and each new non-employee director would receive 7,500 shares of the Company’s common stock. Additional grants of 5,000 restricted shares of the Company’s common stock were issued to each non-employee director on each anniversary of his or her service. Effective August, 2006, the annual equity grant to both new and existing non-employee directors increased to 10,000 shares of restricted stock, with the vice chairman of the board of directors to receive 15,000 shares of restricted stock annually. Effective June 2008, the annual compensation awarded to new and existing non-employee directors changed to $150,000, as well as an additional $75,000 for the Vice Chairman. The annual compensation awards were granted in the form of restricted stock, which totaled 8,200 shares for non-employee directors and 12,300 shares for the Vice Chairman for the year-end December 31, 2009. These shares vest over a six-month period from the date of grant. Shares issued under this plan for the years ended December 31, 2009, 2008 and 2007, were 71,000, 50,200, and 85,000 shares, respectively and there had been no forfeited or cancelled shares.
On July 12, 2006, the Company and its stockholders approved an amendment to the Company’s 2004 Non-Employee Director Plan to increase the number of shares available for issuance thereunder from 0.4 million to 0.6 million shares. On June 18, 2009, the Company and its stockholders approved an amendment to the Company’s 2004 Non-Employee Director Plan to increase the number of shares available for issuance thereunder from 0.6 million to 1.1 million shares. At December 31, 2009, 0.8 million shares were available under the Plan for future issuance. At December 31, 2009, all non-employee director grants have been fully vested.
95
Table of Contents
Index to Financial Statements
KCS and Mission Incentive Plans
Upon consummation of the Company’s merger with KCS, the Company assumed the KCS 2001 Plan, as amended, the KCS 2005 Plan, as amended, and associated obligations relating to grants of restricted stock, stock options and performance shares under those plans which were granted prior to the closing of the Company’s merger with KCS. At December 31, 2009, no options were available under the Plan for future issuance.
No options were issued in 2009 and 2008 under the KCS 2005 Plan. In 2007, the Company granted stock appreciation rights covering 0.4 million shares of common stock to employees of the Company under the KCS 2005 Plan. The stock appreciation rights have an exercise price of $11.64 with a weighted average price of $11.64. These stock appreciation rights vest over a three year period at a rate of one-third on the annual anniversary date of the grant and expire ten years from the grant date.
In conjunction with the merger with Mission on July 28, 2005, the Company assumed three incentive plans. The three plans were the Mission 1994 Plan, Mission 1996 Plan and Mission 2004 Plan. At December 31, 2009, there were no options available under these plans for future issuance. No options were issued in 2009 and 2008 under the three Mission plans.
Assumptions
The assumptions used in calculating the fair value of the Company’s stock-based compensation are disclosed in the following table:
| Years Ended December 31, | |||||||||
| 2009 | 2008 | 2007 | |||||||
| Weighted average value per option granted during the period |
$ | 7.30 | $ | 5.52 | $ | 3.63 | |||
| Assumptions (1)(2)(3): |
|||||||||
| Stock price volatility |
70.0% | 39.6% | 38.0% | ||||||
| Risk free rate of return |
1.49% | 2.00% | 4.4% | ||||||
| Expected term |
3.0 years | 3.0 years | 3.0 years | ||||||
| (1) | The Company’s estimated future forfeiture is 5% based on the Company’s historical forfeiture rate. |
| (2) | Calculated using the Black-Scholes fair value based method. |
| (3) | The Company does not pay dividends on its common stock. |
| 10. | INCOME TAXES |
Income tax benefit (provision) for the indicated periods is comprised of the following:
| Years Ended December 31, | ||||||||||||
| 2009 | 2008 | 2007 | ||||||||||
| (In thousands) | ||||||||||||
| Current: |
||||||||||||
| Federal |
$ | (327 | ) | $ | 10,148 | $ | (11,011 | ) | ||||
| State |
(13,807 | ) | 5,053 | (998 | ) | |||||||
| (14,134 | ) | 15,201 | (12,009 | ) | ||||||||
| Deferred: |
||||||||||||
| Federal |
672,625 | 176,558 | (19,300 | ) | ||||||||
| State |
96,477 | (46,806 | ) | (1,829 | ) | |||||||
| 769,102 | 129,752 | (21,129 | ) | |||||||||
| Total income tax benefit (provision) |
$ | 754,968 | $ | 144,953 | $ | (33,138 | ) | |||||
96
Table of Contents
Index to Financial Statements
The actual income tax benefit (provision) differs from the expected income tax benefit (provision) as computed by applying the U.S. Federal corporate income tax rate of 35% for each period as follows:
| Years Ended December 31, | ||||||||||||
| 2009 | 2008 | 2007 | ||||||||||
| (In thousands) | ||||||||||||
| Expected income tax benefit (provision) |
$ | 623,146 | $ | 186,551 | $ | (30,112 | ) | |||||
| State income taxes, net |
63,729 | 24,651 | (1,385 | ) | ||||||||
| Change in state income tax rate (1),(2) |
21,120 | (64,796 | ) | — | ||||||||
| Change in estimate of income tax basis (3) |
49,587 | — | — | |||||||||
| Other |
(2,614 | ) | (1,453 | ) | (1,641 | ) | ||||||
| Total income tax benefit (provision) |
$ | 754,968 | $ | 144,953 | $ | (33,138 | ) | |||||
| (1) | Due to changes in estimates of income tax benefits associated with amended tax filings, the Company now expects its temporary differences to reverse at lower tax rates than it had previously estimated. As a result the Company changed its estimate of the effective income tax rate applied to its temporary differences, resulting in a decrease in deferred income tax liabilities and an income tax benefit of $21.1 million. |
| (2) | In the fourth quarter of 2008, the Company filed its federal and state income tax returns for 2007. The apportionment of the Company’s income to state income tax jurisdictions in which the Company files income tax returns changed significantly as a result of (i) the sale of the Company’s Gulf Coast properties at the end of 2007 and the reinvestment of those proceeds in 2008 in properties located in states with higher income tax rates; and (ii) the continued acquisition and development of properties located in states with higher income tax rates in 2008. Therefore, at December 31, 2008, the Company expected its temporary differences to reverse at higher income tax rates than it had previously estimated. As a result the Company changed its estimate of the effective income tax rate applied to its temporary differences, resulting in an increase in deferred income tax liabilities and income tax expense of $64.8 million. |
| (3) | Changes in estimated income tax basis in connection with the preparation of 2006 and 2007 amended federal income tax returns. |
The components of net deferred income tax assets and (liabilities) recognized are as follows:
| December 31, | ||||||||
| 2009 | 2008 | |||||||
| (In thousands) | ||||||||
| Deferred current income tax liabilities: |
||||||||
| Unrealized hedging transactions |
$ | (15,476 | ) | $ | (77,454 | ) | ||
| Other |
992 | — | ||||||
| Deferred current tax liabilities |
$ | (14,484 | ) | $ | (77,454 | ) | ||
| Deferred noncurrent income tax assets: |
||||||||
| Net operating loss carry-forwards |
$ | 438,527 | $ | 331,315 | ||||
| Stock-based compensation expense |
10,973 | 8,547 | ||||||
| Alternative minimum tax credit carryforwards |
9,209 | 8,882 | ||||||
| Asset retirement obligations |
16,984 | — | ||||||
| Other |
1,761 | 6,988 | ||||||
| Gross deferred noncurrent income tax assets |
477,454 | 355,732 | ||||||
| Valuation allowance |
(825 | ) | (825 | ) | ||||
| Deferred noncurrent income tax assets |
$ | 476,629 | $ | 354,907 | ||||
| Deferred noncurrent income tax liabilities: |
||||||||
| Book-tax differences in property basis |
$ | (212,933 | ) | $ | (806,809 | ) | ||
| Unrealized hedging transactions |
(18,283 | ) | (9,011 | ) | ||||
| Deferred noncurrent income tax liabilities |
$ | (231,216 | ) | $ | (815,820 | ) | ||
| Net noncurrent deferred income tax asset (liabilities) |
$ | 245,413 | $ | (460,913 | ) | |||
97
Table of Contents
Index to Financial Statements
ASC 740, Income Taxes (ASC 740) prescribes a recognition threshold and a measurement attribute for the financial statement recognition and measurement of income tax positions taken or expected to be taken in an income tax return. For those benefits to be recognized, an income tax position must be more-likely-than-not to be sustained upon examination by taxing authorities. There was not a material impact on the Company’s operating results, financial position or cash flows as a result of the adoption of the provisions of ASC 740. A reconciliation of the beginning and ending amount of unrecognized income tax benefits is as follows (in thousands):
| Balance at January 1, 2008 |
$ | 3,086 | ||
| Additions for income tax positions of prior years |
1,773 | |||
| Reductions for income tax positions of prior years |
(561 | ) | ||
| Lapse of statute of limitations |
(1,111 | ) | ||
| Balance at December 31, 2008 |
3,187 | |||
| Additions for income tax positions of prior years |
835 | |||
| Reductions for income tax positions of prior years |
(400 | ) | ||
| Lapse of statute of limitations |
(994 | ) | ||
| Balance at December 31, 2009 |
$ | 2,628 | ||
Generally, the Company’s income tax years 2006 through 2009 remain open and subject to examination by Federal tax authorities or the tax authorities in Arkansas, Louisiana, New Mexico, Oklahoma and Texas which are the jurisdictions where Petrohawk has its principal operations. In certain jurisdictions the Company operates through more than one legal entity, each of which may have different open years subject to examination. No material amounts of the unrecognized income tax benefits have been identified to date that would impact the Company’s effective income tax rate.
Petrohawk recognizes interest and penalties accrued to unrecognized benefits in “Interest expense and other” in its statements of operations. For the year ended December 31, 2009 and 2008, Petrohawk recognized no interest and penalties while recognizing $0.1 million for the tax year ending December 31, 2007. The Company had approximately $0.1 million, $0.1 million and $0.2 million for the payment of interest and penalties accrued as December 31, 2009, 2008 and 2007, respectively.
As of December 31, 2009, the Company had available, to reduce future taxable income, a United States federal regular net operating loss (NOL) carryforward of approximately $1,147.8 million (net of excess income tax benefits not recognized of $40.4 million), which expire in the years 2017 through 2029. Utilization of NOL carryforwards is subject to annual limitations due to stock ownership changes. The income tax net operating loss carryforward may be limited by other factors as well. The Company also has various state NOL carryforwards, reduced by the valuation allowance for losses that the Company anticipates will expire before they can be utilized, totaling approximately $276.9 million, (net of Texas credit for business loss carryforwards) at December 31, 2009, with varying lengths of allowable carryforward periods ranging from five to 20 years that can be used to offset future state taxable income. It is expected that these deferred income tax benefits will be utilized prior to their expiration.
98
Table of Contents
Index to Financial Statements
| 11. | EARNINGS PER SHARE OF COMMON STOCK |
The following represents the calculation of earnings per share of common stock:
| Years Ended December 31, | |||||||||||
| 2009 | 2008 | 2007 | |||||||||
| (In thousands, except per share amounts) | |||||||||||
| Basic |
|||||||||||
| Net (loss) income |
$ | (1,025,451 | ) | $ | (388,052 | ) | $ | 52,897 | |||
| Weighted average basic number of shares of common stock outstanding |
280,039 | 218,993 | 168,006 | ||||||||
| Basic net (loss) income per share of common stock |
$ | (3.66 | ) | $ | (1.77 | ) | $ | 0.31 | |||
| Diluted |
|||||||||||
| Net (loss) income |
$ | (1,025,451 | ) | $ | (388,052 | ) | $ | 52,897 | |||
| Weighted average basic number of shares of common stock outstanding |
280,039 | 218,993 | 168,006 | ||||||||
| Common stock equivalent shares representing shares issuable upon exercise of stock options and stock appreciation rights |
Anti-dilutive | Anti-dilutive | 1,406 | ||||||||
| Common stock equivalent shares representing shares issuable upon exercise of warrants |
Anti-dilutive | Anti-dilutive | 971 | ||||||||
| Common stock equivalent shares representing shares included upon vesting of restricted shares |
Anti-dilutive | Anti-dilutive | 865 | ||||||||
| Weighted average diluted number of shares of common stock outstanding |
280,039 | 218,993 | 171,248 | ||||||||
| Diluted net (loss) income per share of common stock |
$ | (3.66 | ) | $ | (1.77 | ) | $ | 0.31 | |||
Common stock equivalents, including stock options, SARS and warrants, totaling 7.6 million and 7.3 million shares were not included in the computation of diluted earnings per share of common stock because the effect would have been anti-dilutive due to the net loss for the years ended December 31, 2009 and 2008. Common stock equivalents, including stock options, SARS and warrants, totaling 0.1 million shares were not included in the computation of diluted earnings per share of common stock as the effect would have been anti- dilutive for the year ended December 31, 2007 because the grant prices were greater than the average market price of the common shares.
99
Table of Contents
Index to Financial Statements
| 12. | ADDITIONAL FINANCIAL STATEMENT INFORMATION |
Certain balance sheet amounts are comprised of the following:
| December 31, | ||||||
| 2009 | 2008 | |||||
| (In thousands) | ||||||
| Accounts receivable: |
||||||
| Oil and natural gas revenues |
$ | 100,294 | $ | 98,536 | ||
| Marketing revenues |
38,180 | 36,476 | ||||
| Joint interest accounts |
75,316 | 96,485 | ||||
| Income taxes receivable |
22,743 | 35,535 | ||||
| Other |
2,731 | 10,317 | ||||
| $ | 239,264 | $ | 277,349 | |||
| Prepaids and other: |
||||||
| Prepaid insurance |
$ | 2,478 | $ | 2,315 | ||
| Prepaid drilling costs |
27,617 | 35,739 | ||||
| Other |
2,339 | 2,009 | ||||
| $ | 32,434 | $ | 40,063 | |||
| Accounts payable and accrued liabilities: |
||||||
| Trade payables |
$ | 75,549 | $ | 82,028 | ||
| Revenues and royalties payable |
155,568 | 145,828 | ||||
| Accrued oil and natural gas capital costs |
175,369 | 238,691 | ||||
| Accrued midstream capital costs |
29,570 | 26,197 | ||||
| Accrued interest expense |
69,410 | 42,548 | ||||
| Prepayment liabilities |
36,714 | 59,234 | ||||
| Accrued lease operating expenses |
11,407 | 7,017 | ||||
| Accrued ad valorem taxes payable |
5,151 | 4,029 | ||||
| Accrued employee compensation |
11,820 | 11,723 | ||||
| Income taxes payable |
533 | 4,021 | ||||
| Other |
62,080 | 18,116 | ||||
| $ | 633,171 | $ | 639,432 | |||
Certain cash and non-cash related items are comprised of the following:
| Years Ended December 31, | |||||||||||
| 2009 | 2008 | 2007 | |||||||||
| (In thousands) | |||||||||||
| Cash payments: |
|||||||||||
| Interest payments |
$ | 189,905 | $ | 144,241 | $ | 128,769 | |||||
| Income tax payments (refunds), net |
4,559 | 22,274 | (931 | ) | |||||||
| Non-cash items excluded from the statements of cash flows: |
|||||||||||
| (Decrease) increase in accrued oil and natural gas capital expenditures |
(63,322 | ) | 120,943 | 6,496 | |||||||
| Increase in accrued midstream capital expenditures |
3,373 | 26,197 | — | ||||||||
| 13. | SEGMENTS |
In accordance with ASC 280, Segment Reporting, the Company has identified two reportable segments: oil and natural gas and midstream. In the beginning of the fourth quarter of 2009, the Company made a strategic decision to focus on and allocate resources to its midstream division. The decision to designate the midstream division as a separate business segment was due primarily to the recent growth and success within the division as a result of the significant investment of capital during 2009, as well as the Company’s intention to increase third party throughput. The Company’s exploration and production segment and midstream segment are managed separately due to the nature of their products and services. The exploration and production segment is responsible
100
Table of Contents
Index to Financial Statements
for acquisition, exploration, development and production of oil and natural gas properties, while the midstream segment is responsible for gathering and treating natural gas for the Company and third parties. The Company’s Chief Operating Decision Maker evaluates the performance of the reportable segments based on income before income taxes.
The Company’s oil and natural gas segment and midstream segment revenues and expenses include intersegment transactions, which are generally based on transactions made at market-related rates. Consolidated revenues and expenses reflect the elimination of all intercompany transactions. The accounting policies of the reporting segments are the same as those described in the “Summary of Significant Events and Accounting Policies” in Note 1.
For the years ended December 31, 2009 and 2008, the Company’s oil and natural gas segment had two individual purchasers of production which collectively represented 25% and 30%, respectively, of total revenues. For the year ended December 31, 2007, the Company’s oil and natural gas segment had one purchaser of production that accounted for 10% of total revenues.
On a gross basis the Company’s midstream segment had intersegment revenues which are eliminated in consolidation and represented 63% and 40% of total revenues for the years ended December 31, 2009 and 2008, respectively.
Summarized financial information concerning our reportable segments is shown in the following table:
| Oil and Natural Gas |
Midstream | Intersegment Eliminations |
Consolidated Total | |||||||||||||
| For the year ended December 31, 2009: |
||||||||||||||||
| Revenues |
$ | 1,052,258 | $ | 31,325 | $ | — | $ | 1,083,583 | ||||||||
| Intersegment revenues |
— | 54,446 | (54,446 | ) | — | |||||||||||
| Total revenues |
$ | 1,052,258 | $ | 85,771 | $ | (54,446 | ) | $ | 1,083,583 | |||||||
| Gathering, transportation and other |
(123,733 | ) | (21,078 | ) | 54,446 | (90,365 | ) | |||||||||
| Depletion, depreciation and amortization |
(384,327 | ) | (12,317 | ) | — | (396,644 | ) | |||||||||
| General and administrative |
(106,103 | ) | (7,129 | ) | — | (113,232 | ) | |||||||||
| Interest expense and other |
(207,371 | ) | (22,048 | ) | — | (229,419 | ) | |||||||||
| (Loss) income before income taxes |
$ | (1,802,850 | ) | $ | 22,431 | $ | — | $ | (1,780,419 | ) | ||||||
| Total assets |
$ | 6,174,141 | $ | 546,116 | $ | (58,186 | ) | $ | 6,662,071 | |||||||
| Capital expenditures |
$ | (1,723,717 | ) | $ | (304,478 | ) | $ | — | $ | (2,028,195 | ) | |||||
| For the year ended December 31, 2008: |
||||||||||||||||
| Revenues |
$ | 1,089,548 | $ | 5,662 | $ | — | $ | 1,095,210 | ||||||||
| Intersegment revenues |
— | 3,740 | (3,740 | ) | — | |||||||||||
| Total revenues |
1,089,548 | 9,402 | (3,740 | ) | 1,095,210 | |||||||||||
| Gathering, transportation and other |
(46,752 | ) | (4,297 | ) | 3,740 | (47,309 | ) | |||||||||
| Depletion, depreciation and amortization |
(394,721 | ) | (1,835 | ) | — | (396,556 | ) | |||||||||
| General and administrative |
(73,572 | ) | (1,238 | ) | — | (74,810 | ) | |||||||||
| Interest expense and other |
(147,997 | ) | (3,828 | ) | — | (151,825 | ) | |||||||||
| Loss before income taxes |
$ | (531,069 | ) | $ | (1,936 | ) | $ | — | $ | (533,005 | ) | |||||
| Total assets |
$ | 6,719,158 | $ | 191,911 | $ | (3,740 | ) | $ | 6,907,329 | |||||||
| Capital expenditures |
$ | (3,124,222 | ) | $ | (162,324 | ) | $ | — | $ | (3,286,546 | ) | |||||
| For the year ended December 31, 2007: |
||||||||||||||||
| Revenues |
$ | 882,971 | $ | 434 | $ | — | $ | 883,405 | ||||||||
| Intersegment revenues |
— | — | — | — | ||||||||||||
| Total revenues |
882,971 | 434 | — | 883,405 | ||||||||||||
| Gathering, transportation and other |
(32,881 | ) | (134 | ) | — | (33,015 | ) | |||||||||
| Depletion, depreciation and amortization |
(395,073 | ) | (88 | ) | — | (395,161 | ) | |||||||||
| General and administrative |
(73,867 | ) | — | — | (73,867 | ) | ||||||||||
| Interest expense and other |
(129,603 | ) | — | — | (129,603 | ) | ||||||||||
| Income before income taxes |
$ | 85,947 | $ | 88 | $ | — | $ | 86,035 | ||||||||
| Total assets |
$ | 4,670,612 | $ | 1,827 | $ | — | $ | 4,672,439 | ||||||||
| Capital expenditures |
$ | (1,256,169 | ) | $ | — | $ | — | $ | (1,256,169 | ) | ||||||
101
Table of Contents
Index to Financial Statements
SUPPLEMENTAL OIL AND GAS INFORMATION (UNAUDITED)
Oil and Natural Gas Reserves
Users of this information should be aware that the process of estimating quantities of “proved” and “proved developed” oil and natural gas reserves is very complex, requiring significant subjective decisions in the evaluation of all available geological, engineering and economic data for each reservoir. The data for a given reservoir may also change substantially over time as a result of numerous factors including, but not limited to, additional development activity, evolving production history and continual reassessment of the viability of production under varying economic conditions. As a result, revisions to existing reserve estimates may occur from time to time. Although every reasonable effort is made to ensure reserve estimates reported represent the most accurate assessments possible, the subjective decisions and variances in available data for various reservoirs make these estimates generally less precise than other estimates included in the financial statement disclosures.
Proved reserves represent estimated quantities of natural gas, crude oil and condensate that geological and engineering data demonstrate, with reasonable certainty, to be recoverable in future years from known reservoirs under economic and operating conditions in effect when the estimates were made. Proved developed reserves are proved reserves expected to be recovered through wells and equipment in place and under operating methods used when the estimates were made.
The following table illustrates the Company’s estimated net proved reserves, including changes, and proved developed reserves for the periods indicated, as estimated by Netherland, Sewell & Associates, Inc. (Netherland, Sewell). Natural gas liquids are included in natural gas reserves. The oil and natural gas liquids price as of December 31, 2009 is based on the 12-month unweighted average of the first of the month prices of the West Texas Intermediate posted price which equates to $57.65 per barrel. Oil and natural gas liquids prices as of December 31, 2008 and 2007 are based on the respective year-end West Texas Intermediate posted price of $41.00 per barrel and $92.50 per barrel. The oil and natural gas liquids prices were adjusted by lease for quality, transportation fees, and regional price differentials. The gas price as of December 31, 2009 is based on the 12-month unweighted average of the first of the month prices of the Henry Hub spot price which equates to $3.87 per Mmbtu. Gas prices as of December 31, 2008 and 2007 are based on the respective year-end Henry Hub spot market price of $5.71 per MMbtu, and $6.80 per MMbtu . All prices are adjusted by lease for energy content, transportation fees, and regional price differentials. All prices are held constant in accordance with SEC guidelines. All proved reserves are located in the United States.
| Proved Reserves | |||||||||
| Oil (MBbls) | Gas (Mmcf) | Equivalent (Mmcfe) | |||||||
| Proved reserves, December 31, 2006 |
24,411 | 929,654 | 1,076,120 | ||||||
| Extensions and discoveries (1) |
4,912 | 296,816 | 326,288 | ||||||
| Purchase of minerals in place |
184 | 42,587 | 43,691 | ||||||
| Production |
(2,816 | ) | (99,506 | ) | (116,402 | ) | |||
| Sale of minerals in place |
(11,553 | ) | (204,093 | ) | (273,411 | ) | |||
| Revision of previous estimates |
2,601 | (10,305 | ) | 5,301 | |||||
| Proved reserves, December 31, 2007 |
17,739 | 955,153 | 1,061,587 | ||||||
| Extensions and discoveries (1) |
1,293 | 456,817 | 464,575 | ||||||
| Purchase of minerals in place |
147 | 94,406 | 95,288 | ||||||
| Production |
(1,554 | ) | (102,273 | ) | (111,597 | ) | |||
| Sale of minerals in place |
(210 | ) | (2,342 | ) | (3,602 | ) | |||
| Revision of previous estimates |
(3,577 | ) | (67,076 | ) | (88,538 | ) | |||
| Proved reserves, December 31, 2008 |
13,838 | 1,334,685 | 1,417,713 | ||||||
| Extensions and discoveries (1) |
4,676 | 1,933,740 | 1,961,796 | ||||||
| Purchase of minerals in place |
— | 1,552 | 1,552 | ||||||
| Production |
(1,520 | ) | (174,036 | ) | (183,156 | ) | |||
| Sale of minerals in place |
(10,361 | ) | (108,602 | ) | (170,768 | ) | |||
| Revision of previous estimates |
1,715 | (287,297 | ) | (277,007 | ) | ||||
| Proved reserves, December 31, 2009 |
8,348 | 2,700,042 | 2,750,130 | ||||||
| (1) | Includes infill reserves in existing proved fields of 1,565,214 Mmcfe, 204,787 Mmcfe and 232,065 Mmcfe at December 31, 2009, 2008 and 2007, respectively. |
102
Table of Contents
Index to Financial Statements
| Proved Developed Reserves | ||||||
| Oil (MBbls) | Gas (Mmcf) | Equivalent (Mmcfe) | ||||
| December 31, 2009 |
2,933 | 887,559 | 905,157 | |||
| December 31, 2008 |
9,099 | 737,368 | 791,962 | |||
| December 31, 2007 |
12,142 | 533,902 | 606,754 | |||
| Proved Undeveloped Reserves | ||||||
| Oil (MBbls) | Gas (Mmcf) | Equivalent (Mmcfe) | ||||
| December 31, 2009 |
5,415 | 1,812,483 | 1,844,973 | |||
| December 31, 2008 |
4,739 | 597,317 | 625,751 | |||
| December 31, 2007 |
5,597 | 421,251 | 454,833 | |||
Noteworthy amounts included in the categories of proved reserve changes for the years 2009, 2008, and 2007 in the above tables include:
| • | Extensions and Discoveries: |
2009 — Of the 1,961,796 Mmcfe of 2009 Extensions and discoveries, 1,471,899 Mmcfe related to the Haynesville Shale in Louisiana and Texas, 293,559 Mmcfe related to the Hawkville Field in Texas, and 178,275 Mmcfe related to the Fayetteville Shale in Arkansas.
2008 — Of the 464,575 Mmcfe of 2008 Extensions and discoveries, 169,591 Mmcfe related to the Haynesville Shale area in Louisiana, 128,612 Mmcfe related to the Fayetteville Shale area in Arkansas, and 123,434 Mmcfe related to the Elm Grove/Caspiana Field in Louisiana.
2007 — Of the 326,288 Mmcfe of 2007 Extensions and discoveries, 101,827 Mmcfe related to the Elm Grove-Caspiana Field in Louisiana, 61,803 Mmcfe related to the Terryville Field in Louisiana, 36,339 Mmcfe related to the Fayetteville Shale area in Arkansas, and 29,191 Mmcfe related to the Sawyer-Sonora Field in Texas.
| • | Purchase of Minerals in Place: |
2009 — The 1,552 Mmcfe of 2009 Purchases of minerals in place consisted of a single acquisition in the Fayetteville Shale of Arkansas.
2008 — The 95,288 Mmcfe of 2008 Purchases of minerals in place consisted of five acquisitions. 84,628 Mmcfe related to acquisitions in the Elm Grove Field in Louisiana, and 10,450 Mmcfe related to an acquisition in the Fayetteville Shale of Arkansas.
2007 —The 43,691 Mmcfe of 2007 Purchases of minerals in place consisted of seven acquisitions. 20,641 Mmcfe related to an acquisition in the Elm Grove Field in Louisiana, and 20,008 Mmcfe related to an acquisition in the Fayetteville Shale of Arkansas.
| • | Sale of Minerals in Place: |
2009 — The 170,768 Mmcfe of 2009 Sales of minerals in place consisted of four divestitures. 168,023 Mmcfe related to a divestiture in the Permian Basin Properties of Texas and New Mexico.
2008 — The 3,602 Mmcfe of 2008 Sales of minerals in place consisted of six divestitures. 1,294 Mmcfe related to a divestiture in the Beckville N. Field of Texas, and 1,245 Mmcfe related to a divestiture in the Madisonville Field in East Texas.
2007 —The 273,411 Mmcfe of 2007 Sales of minerals in place consisted of three divestitures. 269,200 Mmcfe related to a disposition of our Gulf Coast Properties of Texas, Louisiana, Mississippi, and Alabama.
| • | Revisions of Previous Estimates — Proved reserves must be estimated using the assumption that prices and costs remain constant for the duration of the reservoir life. Due to significantly lower average first-day of the month gas prices calculated for the 12 months ended December 31, 2009 compared to prices as |
103
Table of Contents
Index to Financial Statements
| of December 31, 2008, certain of the Company’s proved reserves were no longer economically producible. Of the 277,007 Mmcfe of 2009 downward Revisions of Previous Estimates, 254,909 Mmcfe were related to changes in prices. |
The SEC amended its definitions of oil and natural gas reserves effective December 31, 2009. Previous periods were not restated for the new rules. Key revisions include a change in pricing used to prepare reserve estimates to a 12-month unweighted average of the first-day-of-the-month prices, the inclusion of non-traditional resources in reserves, definitional changes, and allowing the application of reliable technologies in determining proved reserves, and other new disclosures (Revised SEC rules). The Revised SEC rules allowed the Company to realize a net increase of 961 MBbls of oil and 810,575 Mmcf of natural gas as proved reserves. The Company recognized additional proved undeveloped reserves totaling 1,771 MBbls of oil and 1,115,334 Mmcf of natural gas resulting from the application of reliable technologies in determining reserves. As a result of the change in pricing used to prepare reserve estimates, the Company recognized as proved reserves 810 fewer MBbls of oil and 304,759 fewer Mmcf of natural gas than it would have under the previous single-day, year-end reserves pricing requirement.
The reserves in this report have been estimated using deterministic methods. The total proved reserve additions of 1,962 Bcfe are comprised of 453 Bcfe in proved developed and 1,509 Bcfe in proved undeveloped reserves, and are almost entirely from the Haynesville, Fayetteville, and Eagle Ford shales, driven by the active drilling program during 2009 in those areas.
For wells classified as proved developed producing where sufficient production history existed, reserves were based on individual well performance evaluation and production decline curve extrapolation techniques. For undeveloped locations and wells that lacked sufficient production history, reserves were based on analogy to producing wells within the same area exhibiting similar geologic and reservoir characteristics, combined with volumetric methods. The volumetric estimates were based on geologic maps and rock and fluid properties derived from well logs, core data, pressure measurements, and fluid samples. Well spacing was determined from drainage patterns derived from a combination of performance-based recoveries and volumetric estimates for each area or field. Proved undeveloped locations were limited to areas of uniformly high quality reservoir properties, between existing commercial producers.
Capitalized Costs Relating to Oil and Natural Gas Producing Activities
The following table illustrates the total amount of capitalized costs relating to oil and natural gas producing activities and the total amount of related accumulated depreciation, depletion and amortization.
| December 31, | ||||||||||||
| 2009 | 2008 | 2007 | ||||||||||
| (In thousands) | ||||||||||||
| Evaluated oil and natural gas properties (1) |
$ | 6,482,643 | $ | 5,084,726 | $ | 3,249,484 | ||||||
| Unevaluated oil and natural gas properties |
2,512,453 | 2,287,968 | 677,565 | |||||||||
| 8,995,096 | 7,372,694 | 3,927,049 | ||||||||||
| Accumulated depletion, depreciation and amortization (1) |
(4,344,385 | ) | (2,114,024 | ) | (770,288 | ) | ||||||
| $ | 4,650,711 | $ | 5,258,670 | $ | 3,156,761 | |||||||
| (1) | Amounts include costs and associated accumulated depletion, depreciation and amortization for our gas gathering systems and related support equipment. |
104
Table of Contents
Index to Financial Statements
Costs Incurred in Oil and Natural Gas Property Acquisition, Exploration and Development Activities
Costs incurred in property acquisition, exploration and development activities were as follows:
| Years Ended December 31, | |||||||||
| 2009 | 2008 | 2007 | |||||||
| (In thousands) | |||||||||
| Property acquisition costs, proved |
$ | 4,589 | $ | 214,315 | $ | 165,614 | |||
| Property acquisition costs, unproved |
474,800 | 1,965,429 | 356,348 | ||||||
| Exploration and extension well costs |
949,396 | 679,887 | 372,438 | ||||||
| Development costs |
550,735 | 582,575 | 379,749 | ||||||
| Total costs |
$ | 1,979,520 | $ | 3,442,206 | $ | 1,274,149 | |||
Standardized Measure of Discounted Future Net Cash Flows Relating to Proved Oil and Natural Gas Reserves
The following Standardized Measure of Discounted Future Net Cash Flow information has been developed utilizing ASC 932, Extractive Activities —Oil and Gas, (ASC 932) procedures and based on oil and natural gas reserve and production volumes estimated by the Company’s engineering staff. It can be used for some comparisons, but should not be the only method used to evaluate the Company or its performance. Further, the information in the following table may not represent realistic assessments of future cash flows, nor should the Standardized Measure of Discounted Future Net Cash Flow be viewed as representative of the current value of the Company.
The Company believes that the following factors should be taken into account when reviewing the following information:
| • | future costs and selling prices will probably differ from those required to be used in these calculations; |
| • | due to future market conditions and governmental regulations, actual rates of production in future years may vary significantly from the rate of production assumed in the calculations; |
| • | a 10% discount rate may not be reasonable as a measure of the relative risk inherent in realizing future net oil and natural gas revenues; and |
| • | future net revenues may be subject to different rates of income taxation. |
Under the Standardized Measure, for the years ended December 31, 2008 and 2007 the future cash inflows were estimated by applying year-end oil and natural gas prices to the estimated future production of year-end proved reserves. Estimates of future income taxes are computed using current statutory income tax rates including consideration for estimated future statutory depletion and tax credits. The resulting net cash flows are reduced to present value amounts by applying a 10% discount factor. Use of a 10% discount rate and year-end prices were required. At December 31, 2009, as specified by the SEC, the prices for oil and natural gas used in this calculation were the unweighted 12-month average of the first day of the month (12-month unweighted average) cash price quotes, except for volumes subject to fixed price contracts.
105
Table of Contents
Index to Financial Statements
The Standardized Measure is as follows:
| Years Ended December 31, | ||||||||||||
| 2009 | 2008 | 2007 | ||||||||||
| (In thousands) | ||||||||||||
| Future cash inflows |
$ | 10,622,760 | $ | 8,145,908 | $ | 8,434,767 | ||||||
| Future production costs |
(3,936,814 | ) | (1,971,585 | ) | (2,004,206 | ) | ||||||
| Future development costs |
(3,306,802 | ) | (1,631,050 | ) | (1,227,874 | ) | ||||||
| Future income tax expense |
(79,404 | ) | (1,058,344 | ) | (1,549,136 | ) | ||||||
| Future net cash flows before 10% discount |
3,299,740 | 3,484,929 | 3,653,551 | |||||||||
| 10% annual discount for estimated timing of cash flows |
(1,767,615 | ) | (1,651,056 | ) | (1,728,055 | ) | ||||||
| Standardized measure of discounted future net cash flows |
$ | 1,532,125 | $ | 1,833,873 | $ | 1,925,496 | ||||||
Future income tax expense as of December 31, 2009 was reduced by $978.9 million as compared to December 31, 2008 due primarily to lower prices, increased future production and development costs as a result of the additional proved undeveloped reserves under the Revised SEC rules, and $258.4 million of net tax-basis operating loss carry-forwards generated in 2009.
The effect of the adoption of the revised SEC rules decreased $522.3 million of future cash inflows, increased $637.0 million in future production costs, increased $1,203.9 million in future development costs, and decreased $911.0 million in future income tax expense resulting in a decrease of $1,236.2 million in standardized measure of discounted future net cash flows. The difference caused by adopting the 12-month unweighted average price was a decrease of $1.92 per Mmbtu of natural gas and $18.18 per Bbl of oil.
Changes in Standardized Measure of Discounted Future Net Cash Flows Relating to Proved Oil and Natural Gas Reserves
The following is a summary of the changes in the Standardized Measure of discounted future net cash flows for the Company’s proved oil and natural gas reserves during each of the years in the three year period ended December 31, 2009
| Years Ended December 31, | ||||||||||||
| 2009 | 2008 | 2007 | ||||||||||
| (In thousands) | ||||||||||||
| Beginning of year |
$ | 1,833,873 | $ | 1,925,496 | $ | 1,570,047 | ||||||
| Sale of oil and gas produced, net of production costs |
(502,613 | ) | (879,143 | ) | (719,677 | ) | ||||||
| Purchase of minerals in place |
3,316 | 220,929 | 84,889 | |||||||||
| Sales of minerals in place |
(293,711 | ) | (9,962 | ) | (903,165 | ) | ||||||
| Extensions and discoveries |
1,009,823 | 782,998 | 708,563 | |||||||||
| Changes in income taxes, net |
329,179 | 294,484 | (188,388 | ) | ||||||||
| Changes in prices and costs |
(1,595,381 | ) | (1,086,271 | ) | 817,610 | |||||||
| Development costs incurred |
550,735 | 582,575 | 379,749 | |||||||||
| Revisions of previous quantities |
(155,205 | ) | (135,634 | ) | 12,855 | |||||||
| Accretion of discount |
212,395 | 275,394 | 198,275 | |||||||||
| Changes in production rates and other |
139,714 | (136,993 | ) | (35,262 | ) | |||||||
| End of year |
$ | 1,532,125 | $ | 1,833,873 | $ | 1,925,496 | ||||||
In applying the Revised SEC rules, Changes in prices and costs was reduced by $829.8 million, Extensions and discoveries was reduced by $476.2 million, Revisions of previous quantities was reduced by $123.9 million, Changes in production rates and other was reduced by $10.3 million, and Changes in income taxes, net was increased by $204.0 million.
106
Table of Contents
Index to Financial Statements
SELECTED QUARTERLY FINANCIAL DATA (UNAUDITED)
The following table presents selected quarterly financial data derived from the Company’s unaudited consolidated interim financial statements. The following data is only a summary and should be read with the Company’s historical consolidated financial statements and related notes contained in this document.
| Quarters Ended | ||||||||||||||||
| March 31 | June 30 | September 30 | December 31 | |||||||||||||
| (In thousands, except per share amounts) | ||||||||||||||||
| 2009 |
||||||||||||||||
| Total operating revenues |
$ | 263,455 | $ | 227,300 | $ | 237,938 | $ | 354,890 | ||||||||
| (Loss) income from operations |
(1,737,578 | ) | 4,502 | (4,490 | ) | (73,682 | ) | |||||||||
| Net (loss) income available to common stockholders (1) |
(999,753 | ) | (22,004 | ) | (40,177 | ) | 36,483 | |||||||||
| Net (loss) income per share of common stock: |
||||||||||||||||
| Basic |
$ | (3.87 | ) | $ | (0.08 | ) | $ | (0.14 | ) | $ | 0.12 | |||||
| Diluted |
$ | (3.87 | ) | $ | (0.08 | ) | $ | (0.14 | ) | $ | 0.12 | |||||
| 2008 |
||||||||||||||||
| Total operating revenues |
$ | 214,938 | $ | 304,633 | $ | 304,960 | $ | 270,679 | ||||||||
| Income (loss) from operations |
82,239 | 161,593 | 147,870 | (929,752 | ) | |||||||||||
| Net (loss) income available to common stockholders (1) |
(55,612 | ) | (92,766 | ) | 305,465 | (545,139 | ) | |||||||||
| Net (loss) income per share of common stock: |
||||||||||||||||
| Basic |
$ | (0.30 | ) | $ | (0.45 | ) | $ | 1.30 | $ | (2.18 | ) | |||||
| Diluted |
$ | (0.30 | ) | $ | (0.45 | ) | $ | 1.28 | $ | (2.18 | ) | |||||
| (1) | The volatility in net (loss) income available to common stockholders is substantially due to the Company’s full cost ceiling impairment recorded during the first and fourth quarters of 2009 and fourth quarter of 2008 as well as the Company’s accounting policy to mark derivative positions to market and not apply cash flow hedge accounting. See Note 8, “Derivative and Hedging Activities” and Note 3, “Oil and Natural Gas Properties” for additional information. |
107
Table of Contents
Index to Financial Statements
| ITEM 9. | CHANGES IN AND DISAGREEMENTS WITH ACCOUNTANTS ON ACCOUNTING AND FINANCIAL DISCLOSURE |
None.
| ITEM 9A. | CONTROLS AND PROCEDURES |
Management’s Evaluation of Disclosure Controls and Procedures
In accordance with Rules 13a-15(f) and 15d-15(f), of the Exchange Act, we carried out an evaluation, under the supervision and with the participation of management, including our Chief Executive Officer and our Chief Financial Officer, of the effectiveness of our disclosure controls and procedures as of the end of the period covered by this report. Based on that evaluation, our Chief Executive Officer and Chief Financial Officer concluded that our disclosure controls and procedures were effective as of December 31, 2009 to provide reasonable assurance that information required to be disclosed in our reports filed or submitted under the Exchange Act is recorded, processed, summarized and reported within the time periods specified in the Securities and Exchange Commission’s rules and forms. Our disclosure controls and procedures include controls and procedures designed to ensure that information required to be disclosed in reports filed or submitted under the Exchange Act is accumulated and communicated to our management, including our Chief Executive Officer and Chief Financial Officer, as appropriate, to allow timely decisions regarding required disclosure.
Management’s Report on Internal Control over Financial Reporting
Management has assessed, and our independent registered public accounting firm, Deloitte & Touche LLP, has audited, our internal control over financial reporting as of December 31, 2009. The unqualified reports of management and Deloitte & Touche LLP thereon are included in Item 8 of this Annual Report on Form 10-K and are incorporated by reference herein.
Changes in Internal Control over Financial Reporting
There has been no change in our internal control over financial reporting, as defined in Rules 13a-15(f) and 15d-15(f) of the Exchange Act, during the three months ended December 31, 2009 that has materially affected, or is reasonably likely to materially affect, our internal control over financial reporting.
| ITEM 9B. | OTHER INFORMATION |
None.
108
Table of Contents
Index to Financial Statements
PART III
| ITEM 10. | DIRECTORS, EXECUTIVE OFFICERS AND CORPORATE GOVERNANCE |
The information required to be contained in this Item is incorporated herein by reference to the sections entitled “Our Board of Directors and its Committees” and “Section 16(a) Beneficial Ownership Reporting Compliance” in our definitive proxy statement to be filed with respect to our 2010 annual meeting of stockholders. See also the list of “Management” of the registrant under Item 4 of this Form 10-K, which is incorporated herein by reference.
The Company’s Code of Conduct and Code of Ethics for the Chief Executive Officer and Senior Financial Officers can be found on the Company’s internet website located at www.petrohawk.com under the heading “About Us—Corporate Governance”. Any stockholder may request a printed copy of such materials by submitting a written request to the Company’s Corporate Secretary. If the Company amends the Code of Ethics or grants a waiver, including an implicit waiver, from the Code of Ethics, the Company will disclose the information on its internet website. The waiver information will remain on the website for at least 12 months after the initial disclosure of such waiver.
| ITEM 11. | EXECUTIVE COMPENSATION |
The information required to be contained in this Item is incorporated herein by reference to the sections entitled “Executive Compensation”, “Our Board of Directors and its Committees”, “Director Compensation” and “Compensation Committee Interlocks and Insider Participation” in our definitive proxy statement to be filed with respect to our 2010 annual meeting under the heading “Executive Compensation”.
| ITEM 12. | SECURITY OWNERSHIP OF CERTAIN BENEFICIAL OWNERS AND MANAGEMENT AND RELATED STOCKHOLDER MATTERS |
Equity Compensation Plan Information
The following table sets forth certain information as of December 31, 2009 with respect to compensation plans (including individual compensation arrangements) under which our equity securities are authorized for issuance. The numbers of shares of stock issuable upon exercise of options and the per share option exercise prices, and the number of securities remaining available for future issuance under equity compensation plans used in the following table reflect an adjustment for the one-for-two reverse stock split effective May 26, 2004.
| Plan Category |
Number of Securities to be Issued Upon Exercise of Outstanding Options and Rights(a) (#) |
Weighted-Average Exercise Price of Outstanding Options and Rights |
Number of Securities Remaining Available for Future Issuance Under Equity Compensation Plans (Excluding Securities Reflected in Column(a)) (#) | |||||
| Equity compensation plans approved by security holders (1) |
7,535,917 | (2) | $ | 12.99 | 9,408,544 | |||
| Equity compensation plans not approved by security holders |
— | — | — | |||||
| 7,535,917 | (2) | $ | 12.99 | 9,408,544 | ||||
| (1) | Represents information for the 2004 Petrohawk Plan, 2004 Non-Employee Director Incentive Plan, 1,069,879 shares covered by the 2001 KCS and 2005 KCS Plans which we assumed in our merger with KCS, and 69,915 shares under plans that we assumed in our merger with Mission Resources Corporation. We do not issue new grants under these assumed plans. |
| (2) | Includes 1,165,824 shares of restricted stock. |
109
Table of Contents
Index to Financial Statements
Additional information required to be contained in this Item is incorporated herein by reference to our definitive proxy statement to be filed with respect to our 2010 annual meeting of Stockholders under the headings “Security Ownership of Certain Beneficial Owners” and “Security Ownership of Directors and Executive Officers”.
| ITEM 13. | CERTAIN RELATIONSHIPS AND RELATED TRANSACTIONS, AND DIRECTOR INDEPENDENCE |
The information required to be contained in this Item is incorporated herein by reference to our definitive proxy statement to be filed with respect to our 2010 annual meeting under the headings “Certain Relationships and Related Party Transactions” and “Related Party Transaction Review Policies and Procedures” and “Our Board of Directors and its Committees—Corporate Governance Matters—Director Independence”.
| ITEM 14. | PRINCIPAL ACCOUNTANT FEES AND SERVICES |
The information required to be contained in this Item is incorporated by reference to our definitive proxy statement to be filed with respect to our 2010 annual meeting under the heading “Accountants and Audit Committee”.
110
Table of Contents
Index to Financial Statements
PART IV
| ITEM 15. | EXHIBITS AND FINANCIAL STATEMENT SCHEDULES |
| (1) | Consolidated Financial Statements: |
The consolidated financial statements of the Company and its subsidiaries and report of independent registered public accounting firm listed in Section 8 of this Form 10-K are filed as a part of this Form 10-K.
| (2) | Consolidated Financial Statements Schedules: |
All schedules are omitted because they are inapplicable or because the required information is contained in the financial statements or included in the notes thereto.
| (3) | Exhibits: |
| Exhibit No |
Description | |
| 2.1 | Agreement and Plan of Merger, dated April 3, 2005 (and as amended through June 8, 2005), by and among Petrohawk Energy Corporation, Petrohawk Acquisition Corporation, and Mission Resources Corporation (Incorporated by reference to Annex A of our Registration Statement on Form S-4/A filed on June 22, 2005). | |
| 2.2 | Agreement and Plan of Merger, dated October 13, 2004, among Petrohawk Energy Corporation, Wynn-Crosby Energy, Inc., Ronald W. Crosby and Paige L. Crosby (Incorporated by reference to Exhibit 2.1 of our Current Report on Form 8-K filed on November 24, 2004). | |
| 2.3 | Agreement and Plan of Mergers, dated October 13, 2004, among Petrohawk Energy Corporation, Wynn-Crosby Energy, Inc., Wynn-Crosby 1994, Ltd.; Wynn-Crosby 1995, Ltd.; Wynn-Crosby 1996, Ltd.; Wynn-Crosby 1997, Ltd.; Wynn-Crosby 1998, Ltd.; Wynn-Crosby 1999, Ltd.; Wynn-Crosby 2000, Ltd.; Wynn-Crosby 2002, Ltd.; WCOG Properties, Ltd.; Kara Nicole Limited; Kristen Lee Limited; Eric Wynn Limited; Christopher David Limited; Paige Lee Limited; Bernadien Wynn Limited; Roger Lee Limited; and George Heaps Limited, and Ronald W. Crosby (Incorporated by reference to Exhibit 2.2 of our Current Report on Form 8-K filed on November 24, 2004). | |
| 2.4 | Amendment to Agreement and Plan of Mergers among Petrohawk Energy Corporation, Wynn-Crosby Energy, Inc., Wynn-Crosby 1994, Ltd.; Wynn-Crosby 1995, Ltd.; Wynn-Crosby 1996, Ltd.; Wynn-Crosby 1997, Ltd.; Wynn-Crosby 1998, Ltd.; Wynn-Crosby 1999, Ltd.; Wynn-Crosby 2000, Ltd.; Wynn-Crosby 2002, Ltd.; WCOG Properties, Ltd.; Kara Nicole Limited; Kristen Lee Limited; Eric Wynn Limited; Christopher David Limited; Paige Lee Limited; Bernadien Wynn Limited; Roger Lee Limited; and George Heaps Limited, and Ronald W. Crosby, dated October 26, 2004 (Incorporated by reference to Exhibit 2.3 of our Current Report on Form 8-K filed on November 24, 2004). | |
| 2.5 | Stock Purchase Agreement among Winwell Resources, Inc. and all of its Shareholders, as Sellers, and Petrohawk Energy Corporation, as Buyer, dated as of December 14, 2005 (Incorporated by reference to Exhibit 2.1 of our Current Report on Form 8-K filed December 20, 2005). | |
| 2.6 | Asset Purchase Agreement among Redley Company, Burris Run Company and Red Clay Minerals, collectively as Seller, and Petrohawk Energy Corporation, as Buyer, dated as of December 14, 2005 (Incorporated by reference to Exhibit 2.2 of our Current Report on Form 8-K filed December 20, 2005). | |
| 2.7 | First Amendment to Asset Purchase Agreement among Redley Company, Burris Run Company and Red Clay Minerals, collectively as Seller, and Petrohawk Energy Corporation, as Buyer, effective as of December 14, 2005 (Incorporated by reference to Exhibit 2.7 of our Annual Report on Form 10-K filed March 14, 2006). | |
111
Table of Contents
Index to Financial Statements
| Exhibit No |
Description | |
| 2.8 | Assignment Agreement between Petrohawk Properties, L.P. and Petrohawk Energy Corporation effective January 27, 2006 (Incorporated by reference to Exhibit 2.8 of our Annual Report on Form 10-K filed March 14, 2006). | |
| 2.9 | Amended and Restated Agreement and Plan of Merger executed as of May 16, 2006, and effective as of April 20, 2006 by and among KCS Energy, Inc., Petrohawk Energy Corporation and Hawk Nest Corporation (Incorporated by reference to Exhibit 2.1 of our Current Report on Form 8-K filed May 18, 2006). | |
| 2.10 | Agreement of Sale and Purchase, dated September 18, 2009, between Petrohawk Properties, LP and KCS Resources, LLC, together as seller, and Merit Management Partners I, L.P., as purchaser (Incorporated by reference to Exhibit 2.1 of our Current Report on Form 8-K filed on September 23, 2009). | |
| 2.11 | Assignment of Agreement of Sale and Purchase (Incorporated by reference to Exhibit 10.2 of our Current Report on Form 8-K filed on November 5, 2009). | |
| 3.1 | Certificate of Incorporation for Petrohawk Energy Corporation (Incorporated by reference to Exhibit 3.1 to our Form S-8 (File No. 333-117733) filed on July 29, 2004). | |
| 3.2 | Certificate of Amendment to Certificate of Incorporation for Petrohawk Energy Corporation (Incorporated by reference to Exhibit 3.1 of our Current Report on Form 8-K filed on November 24, 2004). | |
| 3.3 | Certificate of Amendment of Certificate of Incorporation of Petrohawk Energy Corporation (Incorporated by reference to Exhibit 3.1 of our Current Report on Form 8-K filed on August 3, 2005). | |
| 3.4 | Amended and Restated Bylaws of Petrohawk Energy Corporation effective as of July 12, 2006 (Incorporated by reference to Exhibit 3.2 of our Current Report on Form 8-K filed on July 17, 2006). | |
| 3.5 | Certificate of Amendment to Certificate of Incorporation of Petrohawk Energy Corporation (Incorporated by reference to Exhibit 3.1 of our Current Report on Form 8-K filed on July 17, 2006). | |
| 3.6 | Certificate of Designations of Series A Junior Preferred Stock of Petrohawk Energy Corporation effective as of October 15, 2008 (Incorporated by reference to Exhibit 3.1 of our Current Report on Form 8-K filed on October 16, 2008) | |
| 3.7 | Certificate of Amendment to Certificate of Incorporation of Petrohawk Energy Corporation (Incorporated by reference to Exhibit 3.1 of our Current Report on Form 8-K filed on June 23, 2009). | |
| 4.1 | Indenture dated as of April 8, 2004, among Mission Resources Corporation, the Guarantors named therein and The Bank of New York, as Trustee, relating to Petrohawk Energy Corporation’s 9 7/8% Senior Notes due 2011 (Incorporated by reference to Exhibit 4.1 to Mission Resources Corporation’s Current Report on Form 8-K/A filed on April 15, 2004). | |
| 4.2 | First Supplemental Indenture dated as of July 28, 2005, among Petrohawk Energy Corporation, the successor by way of merger to Mission Resources Corporation, the parties named therein as Existing Subsidiary Guarantors, the parties named therein as Additional Subsidiary Guarantors, and The Bank of New York Trust Company, N.A., as successor trustee to The Bank of New York (Incorporated by reference to Exhibit 4.2 to our Current Report on Form 8-K filed on August 3, 2005). | |
| 4.3 | Second Supplemental Indenture dated as of July 12, 2006, among Petrohawk Energy Corporation, as successor by merger to Mission Resources Corporation, the parties named therein as subsidiary guarantors, and The Bank of New York Trust Company, N.A., as trustee (Incorporated by reference to Exhibit 4.2 of our Current Report on Form 8-K filed on July 17, 2006). | |
112
Table of Contents
Index to Financial Statements
| Exhibit No |
Description | |
| 4.4 | Indenture dated April 1, 2004 among KCS Energy, Inc., U.S. Bank National Association, as trustee, and the subsidiary guarantors named therein, relating to KCS Energy, Inc.’s 7 1/8 % senior notes due 2012 (Incorporated by reference to Exhibit 4.1 to KCS Energy, Inc.’s Quarterly Report on Form 10-Q filed on May 10, 2004). | |
| 4.5 | First Supplemental Indenture, dated as of April 8, 2005, to Indenture dated as of April 1, 2004, among KCS Energy, Inc., certain of its subsidiaries and U.S. Bank National Association (Incorporated by reference to Exhibit 4.1 of KCS Energy, Inc.’s Form 8-K filed on April 11, 2005). | |
| 4.6 | Second Supplemental Indenture dated July 12, 2006 among Petrohawk Energy Corporation, the successor by way of merger to KCS Energy, Inc., the parties named therein as guarantors, and U.S. Bank National Association, as trustee (Incorporated by reference to Exhibit 4.4 to our Current Report on Form 8-K filed July 17, 2006). | |
| 4.7 | Third Supplemental Indenture dated as of July 12, 2006 among Petrohawk Energy Corporation, the successor by way of merger to KCS Energy, Inc., the parties named therein as existing guarantors, the parties named therein as new guarantors, and U.S. Bank National Association, as trustee (Incorporated by reference to Exhibit 4.5 to our Current Report on Form 8-K filed July 17, 2006). | |
| 4.8 | Fourth Supplemental Indenture dated as of August 3, 2007 among Petrohawk Energy Corporation, the successor by way of merger to KCS Energy, Inc., the parties named therein as existing guarantors, the parties named therein as new guarantors, and The Law Debenture Trust Company of New York, as the successor to U.S. Bank National Association, as trustee (Incorporated by reference to Exhibit 4.12 to our Quarterly Report on Form 10-Q filed on November 6, 2008). | |
| 4.9 | Fifth Supplemental Indenture dated as of November 28, 2008 among Petrohawk Energy Corporation, HK Energy Marketing, LLC, the parties named therein as guarantors, and The Law Debenture Trust Company of New York, as the successor to U.S. Bank National Association, as trustee (Incorporated by reference to Exhibit 4.9 to our Annual Report on Form 10-K filed on February 25, 2009). | |
| 4.10 | Sixth Supplemental Indenture dated as of January 26, 2009 among Winwell Resources, L.L.C., KCS Resources, LLC, Petrohawk Energy Corporation, the parties named therein as guarantors, and The Law Debenture Trust Company of New York, as the successor to U.S. Bank National Association, as trustee (Incorporated by reference Exhibit 4.10 to our Annual Report on Form 10-K filed on February 25, 2009). | |
| 4.11 | Seventh Supplemental Indenture dated as of August 4, 2009 among Kaiser Trading, LLC, Petrohawk Energy Corporation, the existing Guarantors, and The Law Debenture Trust Company of New York, as the successor to U.S. Bank National Association, as trustee (Incorporated by reference Exhibit 4.11 to our Quarterly Report on Form 10-Q filed on November 5, 2009). | |
| 4.12 | Indenture dated July 12, 2006 among Petrohawk Energy Corporation, U.S. Bank National Association, as trustee, and the subsidiary guarantors named therein, relating to Petrohawk Energy Corporation’s 9 7/8% senior notes due 2013 (Incorporated by reference to Exhibit 4.6 to our Current Report on Form 8-K filed July 17, 2006). | |
| 4.13 | First Supplemental Indenture dated July 12, 2006 among Petrohawk Energy Corporation, U.S. Bank National Association, as trustee, and the subsidiary guarantors named therein (Incorporated by reference to Exhibit 4.7 to our Current Report on Form 8-K filed July 17, 2006). | |
| 4.14 | Second Supplemental Indenture dated August 3, 2007 among Petrohawk Energy Corporation, One TEC, LLC, One TEC Operating, LLC, Bison Ranch, LLC, the parties named therein as existing guarantors and U.S. Bank National Association, as trustee (Incorporated by reference to Exhibit 4.10 to our Quarterly Report on Form 10-Q filed November 8, 2007). | |
113
Table of Contents
Index to Financial Statements
| Exhibit No |
Description | |
| 4.15 | Third Supplemental Indenture dated as of November 28, 2008 among Petrohawk Energy Corporation, HK Energy Marketing, LLC, the parties named therein as guarantors, and U.S. Bank National Association, as trustee (Incorporated by reference Exhibit 4.14 to our Annual Report on Form 10-K filed on February 25, 2009). | |
| 4.16 | Fourth Supplemental Indenture dated as of January 26, 2009 among Winwell Resources, L.L.C., KCS Resources, LLC, Petrohawk Energy Corporation, the parties named therein as guarantors, and U.S. Bank National Association, as trustee (Incorporated by reference Exhibit 4.15 to our Annual Report on Form 10-K filed on February 25, 2009). | |
| 4.17 | Fifth Supplemental Indenture dated as of August 4, 2009 among Kaiser Trading, LLC, Petrohawk Energy Corporation, the existing Guarantors, and U.S. Bank National Association, as trustee (Incorporated by reference Exhibit 4.17 to our Quarterly Report on Form 10-Q filed on November 5, 2009). | |
| 4.18 | Indenture, dated May 13, 2008, among Petrohawk Energy Corporation, the subsidiary guarantors named therein, and U.S. Bank Trust National Association (Incorporated by reference to Exhibit 4.1 to our Current Report on Form 8-K filed May 15, 2008). | |
| 4.19 | First Supplemental Indenture dated as of November 28, 2008 among Petrohawk Energy Corporation, HK Energy Marketing, LLC, and parties named therein as guarantors, and U.S. Bank Trust National Association, as trustee (Incorporated by reference Exhibit 4.17 to our Annual Report on Form 10-K filed on February 25, 2009). | |
| 4.20 | Second Supplemental Indenture dated as of January 26, 2009 among Winwell Resources, L.L.C., KCS Resources, LLC, Petrohawk Energy Corporation, the parties named therein as guarantors, and U.S. Bank Trust National Association, as trustee (Incorporated by reference Exhibit 4.18 to our Annual Report on Form 10-K filed on February 25, 2009). | |
| 4.21 | Third Supplemental Indenture dated as of August 4, 2009 among Kaiser Trading, LLC, Petrohawk Energy Corporation, the existing Guarantors, and U.S. Bank Trust National Association, as trustee (Incorporated by reference Exhibit 4.21 to our Quarterly Report on Form 10-Q filed on November 5, 2009). | |
| 4.22 | Rights Agreement, dated as of October 14, 2008, between Petrohawk Energy Corporation and American Stock Transfer & Trust Company, as Rights Agent (Incorporated by reference to Exhibit 4.1 to our Current Report on Form 8-K filed October 16, 2008). | |
| 4.23 | Registration Rights Agreement, dated May 13, 2008, among the Company, the subsidiary guarantors named therein, and Lehman Brothers Inc., on behalf of Lehman Brothers Inc., J.P. Morgan Securities Inc., Merrill Lynch, Pierce, Fenner & Smith Incorporated, BNP Paribas Securities Corp., Credit Suisse Securities (USA) LLC, Banc of America Securities LLC, Citigroup Global Markets Inc., BMO Capital Markets Corp., RBC Capital Markets Corporation, and Wells Fargo Securities, LLC. (Incorporated by reference to Exhibit 4.2 of our Current Report on Form 8-K filed on May 15, 2008). | |
| 4.24 | Amendment No. 1 to Rights Agreement, dated as of June 10, 2009, between Petrohawk Energy Corporation and American Stock Transfer & Trust Company, LLC, as Rights Agent (Incorporated by reference to Exhibit 4.1 of our Current Report on Form 8-K filed on June 12, 2009). | |
| 4.25 | Indenture, dated January 27, 2009, among the Company, the subsidiary guarantors named therein, and U.S. Bank Trust National Association (Incorporated by reference to Exhibit 4.1 of our Current Report on Form 8-K filed on January 28, 2009). | |
| 4.26 | First Supplemental Indenture, dated August 4, 2009, among the Kaiser Trading, LLC, Petrohawk Energy Corporation, the existing Guarantors, and U.S. Bank Trust National Association, trustee (Incorporated by reference Exhibit 4.26 to our Quarterly Report on Form 10-Q filed on November 5, 2009). | |
114
Table of Contents
Index to Financial Statements
| Exhibit No |
Description | |
| 4.27 | Registration Rights Agreement, dated January 27, 2009, among the Company, the subsidiary guarantors named therein, and J.P. Morgan Securities Inc., on behalf of J.P. Morgan Securities Inc., BNP Paribas Securities Corp., Wachovia Capital Markets, LLC, Banc of America Securities LLC, BMO Capital Markets Corp., Barclays Capital Inc., Fortis Securities LLC, Calyon Securities (USA) Inc., RBC Capital Markets Corporation, Capital One Southcoast, Inc., Wedbush Morgan Securities Inc., Natixis Bleichroeder Inc., Citigroup Global Markets Inc., BBVA Securities, Inc., and Piper Jaffray & Co. (Incorporated by reference to Exhibit 4.2 of our Current Report on Form 8-K filed on January 28, 2009). | |
| 10.1 | Fourth Amended and Restated Senior Revolving Credit Agreement dated October 14, 2009, among Petrohawk Energy Corporation, each of the Lenders from time to time party thereto, BNP Paribas, as administrative agent for the Lenders, Bank of America, N.A and Bank of Montreal, as co-syndication agents for the Lenders, and JPMorgan Chase Bank, N.A. and Wells Fargo Bank, N.A. as co-documentation agents for the Lenders (Incorporated by reference to Exhibit 10.1 of our Current Report on Form 8-K/A filed on December 3, 2009). | |
| 10.2 | Fourth Amended and Restated Guarantee and Collateral Agreement dated October 14, 2009, made by Petrohawk Energy Corporation and each of its subsidiaries, as Grantors, in favor of BNP Paribas, as Administrative Agent (Incorporated by reference to Exhibit 10.2 of our Current Report on Form 8-K filed on October 19, 2009). | |
| 10.3 | Purchase Agreement dated January 22, 2009, among the Company and J.P. Morgan Securities Inc., on behalf of J.P. Morgan Securities Inc., BNP Paribas Securities Corp., Wachovia Capital Markets, LLC, Banc of America Securities LLC, BMO Capital Markets Corp., Barclays Capital Inc., Fortis Securities LLC, Calyon Securities (USA) Inc., RBC Capital Markets Corporation, Capital One Southcoast, Inc., Wedbush Morgan Securities Inc., Natixis Bleichroeder Inc., Citigroup Global Markets Inc., BBVA Securities, Inc., and Piper Jaffray & Co. (Incorporated by reference to Exhibit 10.1 of our Current Report on Form 8-K filed January 28, 2009). | |
| 10.4† | The Petrohawk Energy Corporation Amended and Restated 1999 Incentive and Nonstatutory Stock Option Plan (Incorporated by reference to Exhibit 99.3 of our Current Report on Form 8-K filed on August 18, 2004). | |
| 10.5† | Form of Director and Officer Indemnity Agreement (Incorporated by reference to Exhibit 10.11 of our Annual Report on Form 10-K filed on March 31, 2005). | |
| 10.6† | The Petrohawk Energy Corporation Second Amended and Restated 2004 Non-Employee Director Incentive Plan (Incorporated by reference to Exhibit 10.2 of our Current Report on Form 8-K filed on June 23, 2009). | |
| 10.7† | Form of Stock Option Agreement for the Second Amended and Restated 2004 Non-Employee Director Incentive Plan (Incorporated by reference to Exhibit 10.3 to our Quarterly Report on Form 10-Q filed August 11, 2005). | |
| 10.8† | Form of Restricted Stock Agreement for the Second Amended and Restated 2004 Non-Employee Director Incentive Plan (Incorporated by reference to Exhibit 10.4 of our Second Quarter 2005 Form 10-Q filed on August 11, 2005). | |
| 10.9† | Form of Incentive Stock Agreement for the Second Amended and Restated 2004 Non-Employee Director Incentive Plan (Incorporated by reference to Exhibit 10.5 of our Second Quarter 2005 Form 10-Q filed on August 11, 2005). | |
| 10.10† | The Petrohawk Energy Corporation Third Amended and Restated 2004 Employee Incentive Plan (Incorporated by reference to Exhibit 10.1 of our Current Report on Form 8-K filed June 23, 2009). | |
| 10.11† | Form of Stock Option Agreement for the Third Amended and Restated 2004 Employee Incentive Plan (Incorporated by reference to Exhibit 10.3 of our Annual Report on Form 10-K filed March 14, 2006). | |
115
Table of Contents
Index to Financial Statements
| Exhibit No |
Description | |
| 10.12† | Form of Restricted Stock Agreement for the Third Amended and Restated 2004 Employee Incentive Plan (Incorporated by reference to Exhibit 10.8 of our Second Quarter 2005 Form 10-Q filed on August 11, 2005). | |
| 10.13† | Form of Incentive Stock Agreement for the Third Amended and Restated 2004 Employee Incentive Plan (Incorporated by reference to Exhibit 10.9 of our Second Quarter 2005 Form 10-Q filed on August 11, 2005). | |
| 10.14† | Form of Stock Appreciation Rights Agreement Annual Vesting Awards under the Petrohawk Energy Corporation Third Amended and Restated 2004 Employee Incentive Plan (Incorporated by reference to Exhibit 10.3 of our Quarterly Report on Form 10-Q filed May 10, 2007). | |
| 10.15† | KCS Energy, Inc. 2001 Employee and Directors Stock Plan (Incorporated by reference to Exhibit (10)iii to KCS Energy, Inc.’s Annual Report on Form 10-K filed April 2, 2001), as amended by the Amendment to the KCS Energy, Inc. 2001 Employee and Directors Stock Plan (Incorporated by reference to Exhibit 10.4 to KCS Energy, Inc.’s Current Report on Form 8-K filed April 25, 2006). | |
| 10.16† | Amendment No. 2 to the KCS Energy, Inc. 2001 Employees and Directors Stock Plan (Incorporated by reference to Exhibit 10.44 of our Annual Report on Form 10-K filed February 28, 2007). | |
| 10.17† | Form of Supplemental Stock Option Agreement under KCS Energy, Inc. 2001 Employee and Directors Stock Plan (Incorporated by reference to Exhibit 10.6 of KCS Energy, Inc’s Quarterly Report on Form 10-Q filed November 9, 2004). | |
| 10.18† | Form of Directors Supplemental Stock Option Agreement under KCS Energy, Inc. 2001 Employee and Directors Stock Plan (Incorporated by reference to Exhibit 10.7 of KCS Energy, Inc.’s Quarterly Report on Form 10-Q filed November 9, 2004). | |
| 10.19† | Form of Restricted Stock Award Agreement under KCS Energy, Inc. 2001 Employee and Directors Stock Plan (Incorporated by reference to Exhibit 10.8 of KCS Energy, Inc.’s Quarterly Report on Form 10-Q filed November 9, 2004). | |
| 10.20† | Form of Restricted Stock Award Agreement (with accelerated vesting provision) under 2001 KCS Energy, Inc. Employee and Directors Stock Plan (Incorporated by reference to Exhibit 10.9 of KCS Energy, Inc.’s Quarterly Report on Form 10-Q filed November 9, 2004). | |
| 10.21† | Form of Amendment to Restricted Stock Agreement under the KCS Energy, Inc. 2001 Employee and Directors Stock Plan (Incorporated by reference to Exhibit 10.5 to KCS Energy, Inc.’s Current Report on Form 8-K filed April 25, 2006). | |
| 10.22† | Form of Amendment to Supplemental Stock Option Agreement under KCS Energy, Inc.’s 2001 Employee and Directors Stock Plan (Incorporated by reference to Exhibit 10.5 to KCS Energy, Inc.’s Current Report on Form 8-K filed April 25, 2006). | |
| 10.23† | KCS Energy, Inc. 2005 Employee and Directors Stock Plan (Incorporated by reference to Exhibit 4.8 to KCS Energy, Inc’s Registration Statement on Form S-8 (File No. 333-125690) filed June 10, 2005), as amended by the First Amendment to KCS Energy, Inc. 2005 Employee and Directors Stock Plan (Incorporated by reference to Exhibit 10.1 to KCS Energy, Inc.’s Current Report on Form 8-K filed May 19, 2005). | |
| 10.24† | Amendment No. 2 to the KCS Energy, Inc. 2005 Employees and Directors Stock Plan (Incorporated by reference to Exhibit 10.43 of our Annual Report on Form 10-K filed February 28, 2007). | |
| 10.25† | Amendment No. 3 to the KCS Energy, Inc. 2005 Employee and Directors Stock Plan (Incorporated by reference to Exhibit 10.2 of our Quarterly Report on Form 10-Q filed May 10, 2007). | |
116
Table of Contents
Index to Financial Statements
| Exhibit No |
Description | |
| 10.26† | Form of Supplemental Stock Option Agreement under KCS Energy, Inc. 2005 Employee and Directors Stock Plan and related Stock Option Exercise Agreement (Incorporated by reference to Exhibit 10.3 of KCS Energy, Inc.’s Current Report on Form 8-K filed June 16, 2005). | |
| 10.27† | Form of Supplemental Stock Option Agreement for Non-Employee Directors under KCS Energy, Inc. 2005 Employee and Directors Stock Plan (Incorporated by reference to Exhibit 10.4 of KCS Energy, Inc’s Current Report on Form 8-K filed June 16, 2005). | |
| 10.28† | Form of Restricted Stock Award Agreement under KCS Energy, Inc. 2005 Employee and Directors Stock Plan (without accelerated vesting provision) and related Restricted Stock Award Certificate (Incorporated by reference to Exhibit 10.5 of KCS Energy, Inc’s Current Report on Form 8-K filed June 16, 2005). | |
| 10.29† | Form of Restricted Stock Award Agreement under KCS Energy, Inc. 2005 Employee and Directors Stock Plan (with accelerated vesting provision) and related Restricted Stock Award Certificate (Incorporated by reference to Exhibit 10.6 of KCS Energy, Inc.’s Current Report on Form 8-K filed June 16, 2005). | |
| 10.30† | Form of Amended and Restated Performance Share Award Certificate under KCS Energy, Inc. 2005 Employee and Directors Stock Plan (Incorporated by reference to Exhibit 10.19 to our Quarterly Report on Form 10-Q filed November 3, 2006). | |
| 10.31† | Form of Restricted Stock Award Certificate under the KCS Energy, Inc. 2005 Employee and Directors Stock Plan (Incorporated by reference to Exhibit 10.4 of our Quarterly Report on Form 10-Q filed May 10, 2007). | |
| 10.32† | Form of Restricted Stock Award Agreement pursuant to the KCS Energy, Inc. 2005 Employee and Directors Stock Plan (Incorporated by reference to Exhibit 10.5 of our Quarterly Report on Form 10-Q filed May 10, 2007). | |
| 10.33† | Form of Stock Appreciation Rights Agreement Annual Vesting Awards under the KCS Energy, Inc. 2005 Employee and Directors Stock Plan (Incorporated by reference to Exhibit 10.6 of our Quarterly Report on Form 10-Q filed May 10, 2007). | |
| 10.34† | Executive Employment Agreement Form A for certain executives and Petrohawk Energy Corporation (Incorporated by reference to Exhibit 10.41 of our Annual Report on Form 10-K filed February 28, 2007). | |
| 10.35† | Executive Employment Agreement Form B for certain executives and Petrohawk Energy Corporation (Incorporated by reference to Exhibit 10.42 of our Annual Report on Form 10-K filed February 28, 2007). | |
| 10.36† | Form Amendment to Employment Agreement entered into on September 1, 2007 with Floyd C. Wilson, Larry L. Helm, Mark J. Mize, Stephen W. Herod and Richard K. Stoneburner (Incorporated by reference to Exhibit 10.1 to our Current Report on Form 8-K filed September 7, 2007). | |
| 10.37† | Employment Agreement entered into August 14, 2007 effective August 1, 2007 by and between Petrohawk Energy Corporation and David S. Elkouri (Incorporated by reference to Exhibit 10.4 to our Quarterly Report on Form 10-Q filed November 8, 2007). | |
| 10.38 | Agreement of Sale and Purchase by and among Petrohawk Properties, LP, Petrohawk Energy Corporation, KCS Resources, Inc. and One TEC, LLC collectively, as Seller and Milagro Development I, LP as Purchaser—dated October 15, 2007 (Incorporated by reference to Exhibit 10.1 of our Current Report on Form 8-K filed December 7, 2007). | |
| 12.1* | Computation of Ratio of Earnings to Combined Fixed Charges and Preference Dividends. | |
117
Table of Contents
Index to Financial Statements
| Exhibit No |
Description | |
| 14.1 | Code of Ethics for Petrohawk Energy Corporation (Incorporated by reference to our Current Report on Form 8-K filed on August 10, 2009). | |
| 21.1* | Subsidiaries of the Registrant. | |
| 23.1* | Consent of Deloitte & Touche LLP. | |
| 23.2* | Consent of Netherland, Sewell & Associates, Inc. | |
| 31.1* | Certificate of Chief Executive Officer under Section 302 of the Sarbanes-Oxley Act of 2002 | |
| 31.2* | Certificate of Chief Financial Officer under Section 302 of Sarbanes-Oxley Act of 2002 | |
| 32* | Certifications required by Rule 13a-14(b) or Rule 15d-14(b) under the Securities and Exchange Act of 1934 and 18 U.S.C. Section 1350. | |
| 99.1* | Netherland, Sewell & Associates, Inc. Reserve Report. | |
| 101* | Interactive Data File | |
| * | Attached hereto. |
| † | Indicates management contract or compensatory plan or arrangement |
The registrant has not filed with this report copies of the instruments defining rights of all holders of long-term debt of the registrant and its consolidated subsidiaries based upon the exception set forth in Item 601 (b)(4)(iii)(A) of Regulation S-K. Copies of such instruments will be furnished to the Securities and Exchange Commission upon request.
118
Table of Contents
Index to Financial Statements
SIGNATURES
Pursuant to the requirements of the Securities Exchange Act of 1934, the registrant has duly caused this report to be signed on its behalf by the undersigned thereunto duly authorized.
| PETROHAWK ENERGY CORPORATION | ||||||
| Date: February 23, 2010 | By: | /S/ FLOYD C. WILSON | ||||
| Floyd C. Wilson | ||||||
| Chairman of the Board and Chief Executive Officer | ||||||
Pursuant to the requirements of the Securities Exchange Act of 1934, this report has been signed below by the following persons on behalf of the registrant and in the capacities and on the dates indicated.
| Signature |
Title |
Date | ||
| /S/ FLOYD C. WILSON Floyd C. Wilson |
Chairman of the Board and Chief Executive Officer |
February 23, 2010 | ||
| /S/ MARK J. MIZE Mark J. Mize |
Executive Vice President, Chief Financial Officer and Treasurer |
February 23, 2010 | ||
| /s/ C. BYRON CHARBONEAU C. Byron Charboneau |
Vice President, Chief Accounting Officer and Controller |
February 23, 2010 | ||
| /S/ JAMES W. CHRISTMAS James W. Christmas |
Vice Chairman and Director |
February 23, 2010 | ||
| /S/ TUCKER S. BRIDWELL Tucker S. Bridwell |
Director |
February 23, 2010 | ||
| /S/ THOMAS R. FULLER Thomas R. Fuller |
Director |
February 23, 2010 | ||
| /S/ JAMES L. IRISH III James L. Irish III |
Director |
February 23, 2010 | ||
| /S/ GARY A. MERRIMAN Gary A. Merriman |
Director |
February 23, 2010 | ||
| /S/ ROBERT G. RAYNOLDS Robert G. Raynolds |
Director |
February 23, 2010 | ||
| /S/ ROBERT C. STONE, JR. Robert C. Stone, Jr. |
Director | February 23, 2010 | ||
| /S/ CHRISTOPHER A. VIGGIANO Christopher A. Viggiano |
Director | February 23, 2010 | ||
119