Attached files
Table of Contents
UNITED STATES SECURITIES AND EXCHANGE COMMISSION
Washington, DC 20549
FORM 10-K
(Mark One)
| x | Annual Report Pursuant to Section 13 or 15 (d) of the Securities Exchange Act of 1934 |
For the fiscal year ended December 26, 2009
or
| ¨ | Transition Report Pursuant to Section 13 or 15 (d) of the Securities Exchange Act of 1934 |
For the transition period from to
Commission file number 1-10948
Office Depot, Inc.
(Exact name of registrant as specified in its charter)

| Delaware | 59-2663954 | |
| (State or other jurisdiction of incorporation or organization) |
(I.R.S. Employer Identification No.) | |
| 6600 North Military Trail, Boca Raton, Florida | 33496 | |
| (Address of principal executive offices) | (Zip Code) | |
(561) 438-4800
(Registrant’s telephone number, including area code)
Securities registered pursuant to Section 12(b) of the Act:
| Title of each class |
Name of each exchange on | |
| Common Stock, par value $0.01 per share |
New York Stock Exchange |
Securities registered pursuant to Section 12(g) of the Act: None
Indicate by check mark if the registrant is a well-known seasoned issuer, as defined in Rule 405 of the Securities Act. Yes þ No ¨
Indicate by check mark if the registrant is not required to file reports pursuant to Section 13 or 15(d) of the Act. Yes ¨ No þ
Indicate by check mark whether the registrant (1) has filed all reports required to be filed by Section 13 or 15(d) of the Securities Exchange Act of 1934 during the preceding 12 months (or for such shorter period that the registrant was required to file such reports) and (2) has been subject to such filing requirements for the past 90 days: Yes þ No ¨
Indicate by check mark whether the registrant has submitted electronically and posted on its corporate Web site, if any, every Interactive Data File required to be submitted and posted pursuant to Rule 405 of Regulation S-T (§ 232.405 of this chapter) during the preceding 12 months (or for such shorter period that the registrant was required to submit and post such files): Yes ¨ No ¨
Indicate by check mark if disclosure of delinquent filers pursuant to Item 405 of Regulation S-K (§ 229.405 of this chapter) is not contained herein, and will not be contained, to the best of registrant’s knowledge, in definitive proxy or information statements incorporated by reference in Part III of this Form 10-K or any amendment to this Form 10-K. þ
Indicate by check mark whether the registrant is a large accelerated filer, an accelerated filer, a non-accelerated filer or a smaller reporting company. See the definitions of “large accelerated filer” “accelerated filer,” and “smaller reporting company ” in Rule 12b-2 of the Exchange Act.
| Large accelerated filer þ | Accelerated filer ¨ | Non-accelerated filer ¨ |
Smaller reporting company ¨ | |||
| (Do not check if a smaller reporting company) | ||||||
Indicate by check mark whether the registrant is a shell company (as defined in Rule 12b-2 of the Act). Yes ¨ No þ
The aggregate market value of voting stock held by non-affiliates of the registrant as of June 27, 2009 (based on the closing market price on the Composite Tape on June 26, 2009) was approximately $1,253,387,286 (determined by subtracting from the number of shares outstanding on that date the number of shares held by affiliates of Office Depot, Inc.).
The number of shares outstanding of the registrant’s common stock, as of the latest practicable date: At January 23, 2010, there were 274,737,010 outstanding shares of Office Depot, Inc. Common Stock, $0.01 par value.
Documents Incorporated by Reference:
Certain information required for Part III of this Annual Report on Form 10-K is incorporated by reference to the Office Depot, Inc. definitive Proxy Statement for its 2010 Annual Meeting of Shareholders, which shall be filed with the Securities and Exchange Commission pursuant to Regulation 14A of the Securities Act of 1934, as amended, within 120 days of Office Depot, Inc.’s fiscal year end.
Table of Contents
| PART I. |
||
| 1 | ||
| 9 | ||
| 15 | ||
| 16 | ||
| 18 | ||
| 19 | ||
| PART II |
||
| 20 | ||
| 22 | ||
| Item 7. Management’s Discussion and Analysis of Financial Condition and Results of Operations |
23 | |
| Item 7A. Quantitative and Qualitative Disclosures About Market Risk |
42 | |
| 42 | ||
| Item 9. Changes in and Disagreements with Accountants on Accounting and Financial Disclosure |
42 | |
| 42 | ||
| 44 | ||
| PART III |
||
| Item 10. Directors, Executive Officers and Corporate Governance |
45 | |
| 45 | ||
| 45 | ||
| Item 13. Certain Relationships and Related Transactions, and Director Independence |
46 | |
| 46 | ||
| PART IV |
||
| 46 | ||
| 47 | ||
| EX-10.03 |
||
| EX-10.15 |
||
| EX-10.17 |
||
| EX-10.24 |
||
| EX-10.39 |
||
| EX-10.40 |
||
| EX-21 |
||
| EX-23 |
||
| EX-31.1 |
||
| EX-31.2 |
||
| EX-32 |
Table of Contents
PART I
Office Depot, Inc. is a global supplier of office products and services. The company was incorporated in 1986 with the opening of our first retail store in Fort Lauderdale, Florida. In fiscal year 2009, we sold $12.1 billion of products and services to consumers and businesses of all sizes through our three business segments: North American Retail Division, North American Business Solutions Division and International Division. Sales are processed through multiple channels, consisting of office supply stores, a contract sales force, an outbound telephone account management sales force, internet sites, direct marketing catalogs and call centers, all supported by our network of supply chain facilities and delivery operations.
Additional information regarding our business segments is presented below and in Management’s Discussion and Analysis of Financial Condition and Results of Operations (“MD&A”) and, along with financial information about geographic areas, in Note N — Segment Information of Notes to Consolidated Financial Statements located elsewhere in this Annual Report on Form 10-K.
North American Retail Division
Our North American Retail Division sells a broad assortment of merchandise through our chain of office supply stores in the U.S. and Canada. We currently offer general office supplies, computer supplies, business machines and related supplies, and office furniture from national brands as well as our own private brands. See the Merchandising section below for additional product information. Most stores also contain a Copy & Print DepotTM offering printing, reproduction, mailing, shipping, and other services. Also, we maintain nationwide availability of a PC support and network installation service that provides our customers with in-home, in-office and in-store support for their technology needs.
Our retail stores are designed to provide a positive shopping experience for the customer. We strive to optimize visual presentation, product placement, shelf capacity and in-stock positions. Our goal is to maintain sufficient inventory in the stores to satisfy current and near-term customer needs, while controlling the overall working capital invested in inventory.
In recent years, we have developed a store format that we call “M2.” This design is intended to provide improved lines of sight, effective product adjacencies and updated signage and lighting, while lowering overall operating costs. We have two versions of this format, “M2M” and “M2S”. The square footage of the M2M stores is approximately 20,000, and the square footage of the M2S stores is approximately 15,000. These formats are being used for all new store openings and remodels. While we believe the current M2 format is a desirable design and an improvement over prior designs, we may continue to modify it in the future.
At the end of 2009, our North American Retail Division operated 1,152 office supply stores throughout the U.S. and Canada. The largest concentration of our retail stores is in California, Texas and Florida, but we have broad representation across North America. The count of open stores may include locations temporarily closed for remodels or other factors. Store opening and closing activity for the last three years has been as follows:
| Open at Beginning of Period |
Opened | Closed | Open at of Period |
Relocated | ||||||
| 2007 |
1,158 | 71 | 7 | 1,222 | 3 | |||||
| 2008 |
1,222 | 59 | 14 | 1,267 | 7 | |||||
| 2009 |
1,267 | 6 | 121 | 1,152 | 6 |
| The | number of store closings in 2009 followed a strategic review of Division operations as discussed in MD&A. |
1
Table of Contents
We currently plan to add approximately 20 new retail stores in North America in 2010. Also, we will continue to review locations as leases become due and will close or relocate stores when appropriate.
During 2009, most store replenishment was handled through our crossdock flow-through distribution facilities where bulk merchandise is sorted for distribution and shipped to the requesting stores about three times per week. During 2009, we closed six crossdock facilities and transitioned the operations to existing distribution centers. These multi-purpose facilities, which share real estate, technology, warehouse management systems and inventory, satisfy the needs of both retail stores and delivery customers. Benefits of this consolidation include improved inventory management as well as improved service resulting from our ability to replenish stores five days per week. We plan to continue our supply chain consolidation efforts during 2010, resulting in an increase in the number of these combination facilities and additional crossdock closures. Additional information on our North American supply chain network is provided in the discussion of the North American Business Solutions Division below. Crossdock facility opening and closing activity for the last three years has been as follows:
| Open at Beginning of Period |
Opened | Closed | Open at of Period | |||||
| 2007 |
10 | 2 | — | 12 | ||||
| 2008 |
12 | — | — | 12 | ||||
| 2009 |
12 | — | 6 | 6 |
North American Business Solutions Division
Our North American Business Solutions Division sells nationally branded and private brand office supplies, technology products, furniture and services by means of a dedicated sales force, through catalogs and electronically through our internet sites. We strive to ensure that our customers’ needs are satisfied through various channel offerings. Our direct business is tailored to serve small- to medium-sized customers. Our direct customers can order products from our catalogs, by phone or through our public web sites (www.officedepot.com), including our public web site devoted to technology products (www.techdepot.com).
Our contract business employs a dedicated sales force that services the office supply needs of predominantly medium-sized to large customers. We believe sales representatives contribute to customer loyalty by building relationships with customers and providing information, business tools and problem-solving solutions to them. We offer contract customers the convenience of shopping on dedicated web sites and in our retail locations, while honoring their contract pricing in lieu of retail pricing. We also use telephone account management for outbound sales contacts with our customers. Sales made at retail locations to our contract customers are included in the results of our North American Retail Division.
We also entered into government contracts in response to requests for proposals and through a third-party, multi-state contract available to local and state government agencies, school districts (K-12), higher education and non-profit organizations nationwide. We were awarded this contract on January 2, 2006 with an initial expiration date of January 1, 2010. We renewed the contract for an additional year, and the contract now expires on January 1, 2011. Multi-state contracts enable individual states, municipalities or agencies to utilize the buying power of multiple entities, which results in lower costs to these customers. These contracts include an administrative fee payable to a third-party administrator. We also have some direct contracts with certain states and federal agencies. As part of the normal process of doing business with local and state governmental agencies, we are subject to audits and reviews of these government contracts. See “Part I — Item 3 — Legal Proceedings” for additional discussion.
During 2009, contract and direct customers’ orders were filled primarily through deliveries from our distribution centers (“DCs”) located across the United States. We closed four DCs during the first half of 2009. Additionally, during 2009, we disposed of our DC in Canada in conjunction with the sale of a small business in that country. We also closed six crossdock facilities and transitioned the operations to existing DCs during 2009. These
2
Table of Contents
combination facilities, which share real estate, technology, warehouse management systems and inventory, hold inventory for both North American Divisions. Benefits of this consolidation include improved inventory management as well as improved service resulting from our ability to replenish stores more frequently. We plan to continue our supply chain consolidation efforts during 2010, resulting in an increase in the number of these combination facilities and additional DC and crossdock closures. DC opening and closing activity for the last three years has been as follows:
| Open at Beginning of Period |
Opened/ Acquired |
Closed/ Sold |
Open at of Period |
||||||||
| 2007 |
20 | 1 | (1) | — | 21 | ||||||
| 2008 |
21 | — | 1 | 20 | |||||||
| 2009 |
20 | — | 5 | (1) | 15 | (2) |
| (1) | The DC added in 2007 was obtained in the acquisition of a small contract business in Canada. This business, including the DC, was sold during 2009. |
| (2) | Five of the fifteen DCs we operated as of December 26, 2009, were combination facilities. |
Inventory is held in our DCs at levels we believe sufficient to meet current and anticipated customer needs. We utilize processes to evaluate the appropriate timing and quantity of reordering with the objective of controlling our investment in inventory, while at the same time ensuring customer satisfaction. Certain purchases are sent directly from the manufacturer to our customers. Some supply chain facilities and some retail locations also house sales offices and administrative offices supporting our contract business. We have outsourced our inbound call center activities; however, in-house staff manages what we consider to be the most critical points of customer interaction.
Over the past several years, we have implemented technologies to assist with reordering, stocking, the pick-and-pack process and delivery operations. We have also increased our use of third-party delivery services and reduced our own fleet of vehicles where cost reductions could be achieved without compromising customer service levels.
Because sales and marketing efforts and catalog production have similarities between the North American Business Solutions Division and the International Division, those topics are addressed separately after the three segment discussions, though they are integral to understanding the processes and management of these Divisions. Also, the Merchandising section below provides additional product information.
International Division
As of December 26, 2009, Office Depot sold to customers in 51 countries throughout North America, Europe, Asia and Latin America. We operate wholly-owned entities, majority-owned entities or participate in other ventures covering 40 countries and have alliances in an additional 11 countries. The Merchandising section below provides information on product offerings throughout the company. International operations are managed on a geographic basis, and the International Division operates separate regional headquarters for Europe/Middle East (The Netherlands), Asia (Hong Kong) and Latin America (South Florida).
Our International Division sells office products and services through direct mail catalogs, contract sales forces, internet sites and retail stores, using a mix of company-owned operations, joint ventures, licensing and franchise agreements, alliances and other arrangements. We maintain distribution centers and call centers throughout Europe and Asia to support these operations. Currently, we have catalog offerings in 15 countries outside of North America and operate more than 40 separate web sites in the International Division. At the end of 2009, the International Division operated, through wholly-owned or majority-owned entities, 137 retail stores in France, Hungary, Israel, South Korea and Sweden. In addition, we participate under licensing and merchandise arrangements in 100 stores in South Korea, Thailand and the Middle East. Following a strategic review of the business in late 2008, we closed our retail operations in Japan during 2009.
3
Table of Contents
Since 1994, we have participated in a joint venture selling office products and services in Mexico and Central and South America. In recent years, this venture, Office Depot de Mexico, has grown in size and scope and now includes 195 retail locations in Mexico, Colombia, Costa Rica, El Salvador, Guatemala, Honduras, and Panama, as well as call centers and distribution centers to support the delivery business in certain areas. We provide services to the venture through management consultation, product selection, product sourcing and information technology services. Because we participate equally in this business with a partner, we account for the activity under the equity method and venture sales of approximately $826 million in 2009 are not reflected in our revenues nor in our consolidated retail comparable store statistics. Our portion of venture results is included in Miscellaneous income, net in the Consolidated Statements of Operations.
Including company-owned operations, joint ventures, licensing and franchise agreements we sell office products through 432 retail stores outside the U.S. and Canada.
International Division store and distribution center operations are summarized below (includes only wholly-owned and majority-owned entities):
| Office Supply Stores | |||||||||
| Open at Beginning of Period |
Opened/ Acquired |
Closed | Open at of Period | ||||||
| 2007 |
125 | 26 | 3 | 148 | |||||
| 2008 |
148 | 15 | (1) | 1 | 162 | ||||
| 2009 |
162 | 4 | 29 | 137 | |||||
| (1) | Includes 13 retail stores obtained in the acquisition of the business in Sweden. |
| Distribution Centers | |||||||||
| Open at Beginning of Period |
Opened/ Acquired |
Closed | Open at of Period | ||||||
| 2007 |
32 | 2 | 1 | 33 | |||||
| 2008 |
33 | 19 | (2) | 9 | 43 | ||||
| 2009 |
43 | 1 | 5 | 39 | |||||
| (2) | Includes 12 DCs obtained in the acquisition of the business in India and four DCs obtained in the acquisition of the business in Sweden. The majority of the DC’s obtained in the 2008 acquisitions are smaller in size than those in other geographies. |
Merchandising
Our merchandising strategy is to meet our customers’ needs by offering a broad selection of nationally branded office products, as well as private brand products and services. Our selection of private brand products has increased in breadth and level of sophistication over time. We currently offer general office supplies, computer supplies, business machines and related supplies, and office furniture under various labels, including Office Depot®, Viking Office Products®, Foray®, Ativa®, Break Escapes™, Niceday™ and Worklife™.
Total company sales by product group were as follows:
| 2009 | 2008* | 2007* | ||||
| Supplies |
66.2% | 63.2% | 61.5% | |||
| Technology |
21.9% | 23.9% | 25.9% | |||
| Furniture and other |
11.9% | 12.9% | 12.6% | |||
| 100.0% | 100.0% | 100.0% | ||||
| * | Conformed to current year product classification. |
4
Table of Contents
We classify our products into three categories: (1) supplies, (2) technology, and (3) furniture and other. The supplies category includes products such as paper, binders, writing instruments, school supplies, and ink and toner. The technology category includes products such as desktop and laptop computers, monitors, printers, cables, software, digital cameras, telephones, and wireless communications products. The furniture and other category includes products such as desks, chairs, luggage, sales in our copy and print centers, and other miscellaneous items.
We buy substantially all of our merchandise directly from manufacturers and other primary suppliers, including direct sourcing of private brand products from domestic and offshore sources. We also enter into arrangements with vendors that can lower our unit product costs if certain volume thresholds or other criteria are met. For additional discussion regarding these arrangements, see the Critical Accounting Policies section of MD&A.
We operate separate merchandising functions in North America, Europe and Asia as well as in our joint ventures. Each group is responsible for selecting, purchasing and pricing merchandise as well as managing the product life cycle of our inventory. In recent years, we have increasingly used global offerings across all regions to further reduce our product cost while maintaining product quality.
We operate a global sourcing office in Shenzhen, China, which allows us to take more direct control of our product sourcing, logistics and quality assurance. This office consolidates our purchasing power with Asian factories and, in turn, helps us to increase the scope of our private brand offerings.
Sales and Marketing
Our marketing programs are designed to attract new customers and to drive frequency of customer visits to our stores and web sites and increase the “share of wallet” of our existing customers by capturing more of what they spend in total on the products we sell. We regularly advertise in major newspapers in most of our North American markets. We also advertise through local and national radio, network and cable television advertising campaigns, and direct marketing efforts. Our direct marketing efforts have been expanding and now include advertising via the internet and social networking.
We offer customer loyalty programs that provide customers with rewards that can be applied against future Office Depot purchases or other incentives. These programs have provided us with valuable information enabling us to market more effectively to our customers. These programs may change in popularity in the future, and we may make alterations to them from time to time.
We perform periodic competitive pricing analyses to monitor each market, and prices are adjusted as necessary to adhere to our pricing philosophy and further our competitive positioning. We generally expect our everyday prices to be highly competitive with other resellers of office products.
We acquire new customers by selectively mailing specially designed catalogs and by making on-premises sales calls to prospective customers. We also make outbound sales calls using dedicated agents through our telephone account management program. We obtain the names of prospective customers in new and existing markets through the purchase of selected lists from outside marketing information services and other sources as well as through the use of a proprietary mailing list system. We also acquire customers through e-mail marketing campaigns and online affiliates. We are a primary sponsor of NASCAR® and are currently designated NASCAR® ’s official office products partner. No single customer in any of our segments accounts for more than 10% of our total sales.
We consider our business to be only somewhat seasonal, with sales generally trending lower in the second quarter, following the “back-to-business” sales cycle in the first quarter and preceding the “back-to-school” sales cycle in the third quarter and the holiday sales cycle in the fourth quarter. Certain working capital components may build and recede during the year reflecting established selling cycles. Business cycles can and have impacted our operations and financial position when compared to other periods. See “Item 1A — Risk Factors” for additional discussion.
5
Table of Contents
Catalogs
We use catalogs to market directly to both existing and prospective customers throughout our operations globally. Our catalog offerings typically include all of our products at their regular low prices. Prospecting catalogs with special offers designed to attract new customers are mailed at certain intervals. In addition, specialty and promotional catalogs may be delivered more frequently to selected customers. We also produce a Green Book® catalog, which features products that are recyclable, energy efficient, or otherwise have a reduced impact on the environment. We continually evaluate our catalog offerings for efficiency and effectiveness at generating incremental revenues.
Copy and Print
Most of our North American retail stores contain a Copy & Print DepotTM offering printing, reproduction, mailing, shipping, and other services. We participate in the exclusive “Xerox Certified Print Specialist” program, which certifies associates as experts in the area of digital imaging and printing. In addition to the in-store locations, we operate ten regional print facilities, which support copy and print orders taken in our North American Retail and North American Business Solutions Divisions. In 2009, we began offering copy and print services to our customers in the U.K. through our e-commerce business. We are currently evaluating the prospect of deploying this service to other customers in Europe.
Intellectual Property
Through our subsidiary, we hold trademark registrations domestically and worldwide and have numerous other applications pending worldwide for the names “Office Depot”, “Viking”, “Ativa”, “Foray”, “Realspace”, and others. We consider the trademark for the Office Depot name the most significant trademark held by us because of its impact on market awareness across all of our businesses and on customers’ identification with us. As with all domestic trademarks, our trademark registrations in the United States are for a ten year period and are renewable every ten years, prior to their respective expirations, as long as the trademarks are used in the regular course of trade.
Industry and Competition
We operate in a highly competitive environment in all three of our segments. We believe that we compete favorably on the basis of price, service, relationships and selection. We compete with office supply stores, wholesale clubs, discount stores, mass merchandisers, food and drug stores, computer and electronics superstores, internet-based companies and direct marketing companies. These companies, in varying degrees, compete with us in substantially all of our current markets.
Other office supply retail companies market similarly to us in terms of store format, pricing strategy, product selection and product availability in the markets where we operate, primarily those in the United States and Canada. We anticipate that in the future we will face increased competition from these chains.
Internationally, we compete on a similar basis to North America. Outside of the U.S. and Canada, we sell through contract and catalog channels in 20 countries and operate retail stores in five countries through wholly-owned or majority-owned entities. Additionally, our International Division provides office products and services in 29 countries through joint ventures, licensing and franchise agreements, cross-border transactions, alliances and other arrangements.
Employees
As of January 23, 2010, we had approximately 41,000 employees worldwide. Our workforce is largely non-union and our labor relations are generally good. In certain international locations, changes in staffing or work arrangements may need approval of local works councils or other bodies.
6
Table of Contents
Environmental Activities
As both a significant user and seller of paper products, we have developed environmental practices that are values-based and market-driven. Our environmental initiatives center on three guiding principles: (1) recycling and pollution reduction; (2) sustainable forest management; and (3) issue awareness and market development for environmentally preferable products. We offer thousands of different products containing recycled content, including from 35% to 100% post-consumer waste content paper and technology recycling services in our retail stores.
Office Depot continues to implement environmental programs in line with our stated environmental vision to “increasingly buy green, be green and sell green” — including environmental sensitivity in our packaging, operations and sales offerings. In January 2009, our “Green” retail store prototype received a Leadership in Energy and Environmental Design (LEED) Gold Certification from the U.S. Green Building Council. Additional information on our green product offerings can be found at www.officedepot.com/buygreen.
Available Information
We maintain a web site at www.officedepot.com. We make available, free of charge, on the “Investor Relations” section of our web site, our annual reports on Form 10-K, quarterly reports on Form 10-Q, current reports on Form 8-K and amendments to those reports filed or furnished pursuant to Section 13(a) or 15(d) of the Exchange Act, as soon as reasonably practicable after we electronically file or furnish such materials to the U.S. Securities and Exchange Commission (“SEC”). In addition, the public may read and copy any of the materials we file with the SEC at the SEC’s Public Reference Room at 100 F Street, NE, Washington DC 20549. The public may obtain information on the operation of the Public Reference Room by calling the SEC at 1-800-SEC-0330. The SEC maintains an internet site that contains reports, proxy and information statements and other information regarding issuers, such as the company, that file electronically with the SEC. The address of that website is www.sec.gov.
Additionally, our corporate governance materials, including governance guidelines; the charters of the Audit, Compensation, Finance, and Governance and Nominating Committees; and the code of ethical behavior may also be found under the “Investor Relations” section of our web site at www.offficedepot.com.
Executive Officers of the Registrant
Steve Odland — Age: 51
Mr. Odland has been Chairman, Chief Executive Officer and a Director since early 2005. Prior to joining Office Depot, Inc., he was Chairman, Chief Executive Officer and President of AutoZone, Inc., from 2001 until 2005. Previously he was an executive with Ahold USA from 1998 to 2000, President of the Foodservice Division of Sara Lee Bakery from 1997 to 1998 and was employed by The Quaker Oats Company from 1981 to 1996 in various executive positions. Mr. Odland is also a director of General Mills, Inc.
Charles Brown — Age: 56
Mr. Brown has been President, International since 2005. In 2007, oversight of business development was added to his role. He was the company’s Executive Vice President and Chief Financial Officer from 2001 to 2005. Prior to that, Mr. Brown was Senior Vice President, Finance and Controller since he joined our company in 1998. Before joining Office Depot, he was Senior Vice President and Chief Financial Officer of Denny’s, Inc. from 1996 until 1998; from 1994 until 1995, he was Vice President and Chief Financial Officer of ARAMARK International; and from 1989 until 1994, he was Vice President and Controller of Pizza Hut International, a Division of PepsiCo, Inc. Mr. Brown assumed the role of acting Chief Financial Officer of the company effective March 1, 2008 and served in that role until August 2008, when Michael Newman began his role as the company’s permanent Chief Financial Officer.
7
Table of Contents
Elisa Garcia — Age: 52
Ms. Garcia was appointed Executive Vice President, General Counsel and Corporate Secretary in July 2007 with overall responsibility for global compliance matters and governmental relations. Prior to joining Office Depot, Ms. Garcia served as General Counsel and Corporate Secretary of Domino’s Pizza, Inc. from April 2000. Prior to joining Domino’s Pizza, Ms. Garcia served as Latin American Regional Counsel for Philip Morris International, and Corporate Counsel for GAF Corporation.
Monica Luechtefeld — Age: 61
Ms. Luechtefeld was appointed Executive Vice President, E-Commerce and Direct Marketing in March 2009. Prior to this role, Ms. Luechtefeld held the position of Executive Vice President, Information Technology since early 2005. She was also responsible for business development from early 2005 to 2007. She assumed responsibility for supply chain from 2007 through 2008. Previously, she was Executive Vice President of E-Commerce from 2000. Prior to this role, she held several officer positions including Vice President, Marketing and Sales Administration and Vice President of Contract Marketing & Business Development. Ms. Luechtefeld joined Office Depot in 1993, serving as General Manager of the Southern California Region of Office Depot until 1996.
Michael Newman — Age: 53
Mr. Newman was appointed Executive Vice President, Chief Financial Officer in August 2008. Prior to joining Office Depot, Mr. Newman served as Chief Financial Officer of Platinum Research Organization, Inc. from April 2007 through February 2008. Prior to joining Platinum Research Organization, Mr. Newman was employed as an independent consultant since 2005. Mr. Newman also served as Chief Financial Officer of Blackstone Crystal Holdings Capital Partners from 2004 to 2005 and Chief Financial Officer of Radio Shack Corp. from 2001 to 2004. Mr. Newman also held Chief Financial Officer roles at Intimate Brands and Hussmann International (which was acquired by Ingersoll-Rand in 2000). He also spent 17 years at General Electric in a variety of management roles both in the United States and Europe.
Kevin Peters — Age: 52
Mr. Peters has been Executive Vice President, Supply Chain since October 2007. In March 2009, Mr. Peters assumed the additional responsibility of leading the company’s Information Technology organization. Prior to joining Office Depot, Mr. Peters spent five years in management roles at W. W. Grainger, Inc., most recently as Senior Vice President, Supply Chain. Prior to W. W. Grainger, Mr. Peters spent 11 years at The Home Depot, serving as the company’s Vice President and General Manager, Strategic Initiatives, Toronto/San Diego. He also has held positions in physical distribution operations, purchasing and inventory management at McMaster-Carr Supply Company.
Carl (Chuck) Rubin — Age: 50
Mr. Rubin was appointed President, North American Retail in early 2006. Prior to assuming that position, Mr. Rubin held the position of Executive Vice President, Chief Merchandising Officer and Chief Marketing Officer since 2004. Before joining the company, Mr. Rubin spent six years with Accenture Ltd., most recently as Partner, where he worked for clients, including Office Depot, across retail formats in the department, specialty and e-commerce channels, as well as new business startups. Prior to joining Accenture, Mr. Rubin spent six years in specialty retailing and 11 years in department store retailing, where he served as General Merchandise Manager and a member of the Executive Committees for two publicly-held companies.
8
Table of Contents
Steven Schmidt — Age: 55
Mr. Schmidt was appointed President, North American Business Solutions in July 2007. Prior to joining Office Depot, Mr. Schmidt spent 11 years with the ACNielsen Corporation, most recently serving as President and Chief Executive Officer. Prior to joining ACNielsen, Mr. Schmidt spent eight years at the Pillsbury Food Company, serving as President of its Canadian and Southeast Asian operations. He has also held management positions at PepsiCo and Procter & Gamble.
Daisy Vanderlinde — Age: 58
Ms. Vanderlinde was appointed Executive Vice President, Human Resources in late 2005. Prior to joining Office Depot, Ms. Vanderlinde was Senior Vice President, Human Resources and Loss Prevention, for AutoZone Inc. from 2001 to 2005, and was a member of the Executive Committee. Ms. Vanderlinde has also served as a senior HR officer for other retailers, including Tractor Supply Company, Marshalls, Inc., and The Broadway Stores.
Mark Hutchens — Age: 44
Mr. Hutchens was appointed Senior Vice President and Controller in September 2008. Prior to assuming that position, Mr. Hutchens held the position of Senior Vice President of Finance, International Division since late 2006. Prior to joining the company, Mr. Hutchens served as Assistant Treasurer at Yum! Brands, Inc., from February 2005 to November 2006 and as General Auditor from November 2003 to February 2005. In addition, Mr. Hutchens served in a variety of senior management positions at Yum! from May 1996 to November 2003. Prior to joining Yum! Mr. Hutchens served in various management positions at Ford Motor Company, where he was employed until May 1996.
Information with respect to our directors is incorporated herein by reference to information included in the Proxy Statement for our 2010 Annual Meeting of Shareholders.
In addition to risks and uncertainties in the ordinary course of business that are common to all businesses, important factors that are specific to our industry and our company could materially impact our future performance and results. We have provided below a list of these risk factors that should be reviewed when considering our securities. These are not all the risks we face, and other factors currently considered immaterial or unknown to us may impact our future operations.
Our recent transaction with funds advised by BC Partners, Inc. dilutes the interests of our common shareholders, may discourage, delay or prevent a change in control of our company and grants important rights to BC Partners, Inc. — The Series A and Series B Preferred Stock that we sold to funds advised by BC Partners, Inc. (the “Investors”) is immediately convertible into shares of the company’s common stock at an initial conversion price of $5.00 per share (subject to a conversion cap). The investment equates to an initial ownership interest of approximately 20%, assuming the full conversion of each series of preferred stock into the company’s common stock. Any sales in the public market of the shares of common stock issuable upon such conversion could adversely affect prevailing market prices of our common stock.
The initial dividend rate is 10% on both the Series A and Series B Preferred, and dividends are paid quarterly in cash or are added to the liquidation preference at the company’s option and subject to certain restrictions. To the extent that dividends are added to the liquidation preference, this will further increase the ownership interest of the Investors and further dilute the interests of the common shareholders.
9
Table of Contents
The holders of the Series A and Series B Preferred Stock are entitled to vote with the holders of the company’s common stock on an as-converted basis, subject to any limitations imposed by any New York Stock Exchange (“NYSE”) stockholder approval requirements. The Investors have agreed to cause all of their common stock and preferred stock entitled to vote at any meeting of the company’s shareholders to be present at such meeting and to vote all such shares in favor of any nominee or director nominated by the company’s Corporate Governance and Nominating Committee, against the removal of any director nominated by the company’s Corporate Governance and Nominating Committee and, with respect to any other business or proposal, in accordance with the recommendation of the board of directors (other than with respect to the approval of any proposed business combination agreement between the company and another entity). This may discourage, delay or prevent a change in control of our company, which could deprive our shareholders of an opportunity to receive a premium for their common stock as part of a sale of our company.
Furthermore, the company has entered into an Investor Rights Agreement pursuant to which the company granted certain rights to the Investors that may restrain the company’s ability to take certain actions in the future. Subject to certain exceptions, for so long as the Investors’ ownership percentage is equal to or greater than 10%, the approval of at least one of the directors designated to the company’s board of directors by the Investors is required for the company to incur any indebtedness for borrowed money in excess of $200 million in the aggregate during any fiscal year if the ratio of the consolidated debt of the company and its subsidiaries to the trailing four quarter adjusted EBITDA of the company and its subsidiaries, on a consolidated basis, is more than 4x. In addition, for so long as the Investors’ ownership percentage is (i) equal to or greater than 15%, the Investors are entitled to nominate three of our fourteen directors, (ii) less than 15% but more than 10%, the Investors are entitled to nominate two of our fourteen directors and (iii) less than 10% but more than 5%, the Investors are entitled to nominate one of our fourteen directors. There can be no assurance that the interests of the Investors are aligned with that of our other shareholders. Investor interests can differ from each other and from other corporate interests and it is possible that this significant shareholder may have interests that differ from us and those of other shareholders. If the Investors were to sell, or otherwise transfer, all or a large percentage of their holdings, our stock price could decline and we could find it difficult to raise capital, if needed, through the sale of additional equity securities.
Economic Conditions May Cause a Decline in Business and Consumer Spending Which Could Adversely Affect Our Business and Financial Performance — Our operating results and performance depend significantly on worldwide economic conditions and their impact on business and consumer spending. The decline in business and consumer spending resulting from the global recession and the deterioration of global credit markets has caused our comparable store sales to decline from prior periods and we have experienced similar declines in our other domestic and international businesses. Our business and financial performance may continue to be adversely affected by current and future economic conditions and the level of consumer debt and interest rates, which may cause a continued or further decline in business and consumer spending.
Supplier Credit and Order Fulfillment Risk — We purchase products for resale under credit arrangements with our vendors. In recent years, we have worked to set payment terms to our vendors under these credit arrangements to occur at a time approximately equal to the anticipated time it takes to sell the vendor’s products. In weak global markets, vendors may seek credit insurance to protect against non-payment of amounts due to them. If we continue to experience declining operating performance, and if we experience severe liquidity challenges, vendors may demand that we accelerate our payment for their products. If vendors begin to demand accelerated payment of amounts due to them or if they begin to require advance payments or letters of credit before goods are shipped to us, these demands could have a significant adverse impact on our operating cash flow and result in a severe drain on our liquidity. Borrowings under our existing credit facility could reach maximum levels under such circumstances and we would seek alternative liquidity measures but may not be able to meet our obligations as they become due. In addition if our suppliers are unable to access liquidity or become insolvent, they could be unable to supply us with product. Also, some of our suppliers may serve other industries. Any adverse impacts to those industries, as a result of the economic slowdown or credit crisis, could have a ripple effect on these suppliers which could adversely impact their ability to supply us as necessary. Any such
10
Table of Contents
disruptions could negatively impact our ability to deliver products and services to our customers, which in turn could have an adverse impact on our business, operating results, financial condition or cash flow.
Liquidity — Historically, we have generated positive cash flow from operating activities and have had access to broad financial markets that provide the liquidity we need to operate our business. Together, these sources have been used to fund operating and working capital needs, as well as invest in business expansion through new store openings, capital improvements and acquisitions. However, due to the downturn in the global economy our operating results have diminished. In September 2008, we entered into a $1.25 billion asset based credit facility to provide liquidity. Also, as discussed above, we issued $350 million in redeemable preferred stock in June 2009. Continued distress in the financial markets has resulted in extreme volatility in the capital markets and diminished liquidity and credit availability. There can be no assurance that our liquidity will not be adversely affected by changes in the financial markets and the global economy. In addition, deterioration in our financial results could negatively impact our credit ratings. The tightening of the credit markets or a downgrade in our credit ratings could make it more difficult for us to access funds, to refinance our existing indebtedness, to enter into agreements for new indebtedness or to obtain funding through the issuance of securities. If such conditions were to recur, we would seek alternative sources of liquidity but may not be able to meet our obligations as they become due.
Financial Covenants in Existing Credit Facility — Our asset based credit facility contains a fixed charge coverage ratio covenant that is operative only when borrowing availability is below $187.5 million or prior to a restricted transaction, such as incurring additional indebtedness, acquisitions, dispositions, dividends, or share repurchases. The agreement also contains representations, warranties, affirmative and negative covenants, and default provisions. A breach of any of these covenants could result in a default under our credit agreement. Upon the occurrence of an event of default under our credit agreement, the lenders could elect to declare all amounts outstanding to be immediately due and payable and terminate all commitments to extend further credit. If the lenders accelerate the repayment of borrowings, we may not have sufficient assets to repay our asset based credit agreement and our other indebtedness. Also, should there be an event of default, or need to obtain waivers following an event of default, we may be subject to higher borrowing costs and/or more restrictive covenants in future periods. Acceleration of any obligation under any of our material debt agreements or instruments will permit the holders of our other material debt to accelerate their obligations. See “Liquidity and Capital Resources”.
Litigation / Regulatory Risks — The company and certain of its directors and executive officers (both current and former officers) are often involved in various legal proceedings, which may involve class action lawsuits, state and federal governmental inquiries and investigations, employment, tort, consumer litigation and intellectual property litigation. Certain of these legal proceedings are described in detail in our Legal Proceedings Section. These legal proceedings may be a significant distraction to management and could expose us to significant defense costs, fines, penalties, suspensions, debarments and liability to private parties for monetary recoveries and attorneys’ fees, any of which could have a material adverse effect on our business and results of operations.
Litigation and governmental investigations could result in substantial additional costs. Certain states, and federal agencies, are investigating our pricing under certain contracts. Although we are cooperating with the governmental agencies in these matters, they may determine that we have violated some laws or regulations, and if so, we may face sanctions, including, but not limited to, significant monetary penalties, injunctive relief and loss of business. The company has reached a proposed settlement with the staff of the SEC to resolve the previously disclosed SEC inquiry that commenced in July of 2007 and the formal investigation disclosed in January of 2008 with respect to contacts and communications with financial analysts, inventory receipt and reserves, timing of vendor payments, certain intercompany loans, certain payments to foreign officials, inventory obsolescence and timing and recognition of vendor program funds. Under the proposed settlement, the company, without admitting or denying liability, has agreed to pay a civil penalty and to consent to a cease and desist order from committing or causing violations of Regulation FD and Sections 13(a) and 13(b) of the Securities Exchange
11
Table of Contents
Act of 1934 (and related rules) which require the maintenance of accurate books and records and internal controls. The proposed settlement is contingent on the review and approval of final documentation by the company and the SEC staff, and is subject to approval by the SEC Commissioners. There can be no assurance that the SEC Commissioners will approve the staff’s recommendation. The company has also been informed that the company’s CEO and two former employees each received “Wells” notices from the staff of the SEC’s Miami Regional Office advising them that the regional staff has made a preliminary decision to recommend that the SEC bring civil enforcement actions against them for possible violations of Regulation FD. Under the processes established by the SEC, these individuals will have an opportunity to present their perspective and to address the issues raised by the SEC staff prior to any action being taken by the SEC.
See “Part I — Item 3 — Legal Proceedings” for a description of pending litigation and governmental proceedings and investigations.
Competition — We compete with a variety of retailers, dealers, distributors, contract stationers, direct marketers and internet operators throughout our worldwide operations. This is a highly competitive marketplace that includes such retail competitors as office supply stores, warehouse clubs, computer and electronics stores, mass merchant retailers, local merchants, grocery and drug-store chains as well as other competitors including direct mail and internet merchants, contract stationers, and direct manufacturers. Our competitors may be local, regional, national or international. Further, competition may come from highly-specialized low-cost merchants, including ink refill stores and kiosks, original equipment manufacturers, concentrated direct marketing channels including well-funded and broad-based enterprises. There is a possibility that any or all of these competitors could become more aggressive in the future, thereby increasing the number and breadth of our competitors. In recent years, new and well-funded competitors have begun competing in certain aspects of our business. For example, two major common carriers of goods have retail outlets that allow them to compete directly for copy, printing, packaging and shipping business, and offer products and services similar to those we offer. While they do not yet have the breadth of products that we offer, they are extremely competitive in the areas of package shipping and copy and print centers. Recently, the so-called warehouse clubs have expanded upon their “in-store” offerings by adding catalog and internet sales channels, offering a broad assortment of office products for sale on a direct delivery basis. In order to achieve and maintain expected profitability levels in our three operating divisions, we must continue to grow by adding new customers and taking market share from competitors and using pricing necessary to retain existing customers. If we fail to adequately address and respond to these pressures in both North America and internationally, it could have a material adverse effect on our business, financial condition, results of operations and cash flows.
Government Contracts — One of our largest U.S. customer groups consists of various state and local governments, government agencies and non-profit organizations. Our relationship with this customer group is subject to uncertain future funding levels and federal and state procurement laws and requires restrictive contract terms; any of these factors could curtail current or future business. Contracting with state and local governments is highly competitive and can be expensive and time-consuming, often requiring that we incur significant upfront time and expense without any assurance that we will win a contract. Our ability to compete successfully for and retain business with the federal and various state and local governments is highly dependent on cost-effective performance. Our government business is also sensitive to changes in national and international priorities and U.S., state and local government budgets.
Execution of Expansion Plans — We plan to open approximately 20 stores in the North American Retail Division during 2010. Circumstances outside of our control could negatively impact these anticipated store openings. We cannot determine with certainty whether our new store openings, including some newly sized or formatted stores or retail concepts, will be successful. The failure to expand by successfully opening new stores as planned, or the failure of a significant number of these stores to perform as planned, could have a material adverse effect on our business, financial condition, results of operations and cash flows.
12
Table of Contents
International Activity — As of December 26, 2009, we sold to customers in 51 countries throughout North America, Europe, Asia and Latin America. We operate wholly-owned entities, majority-owned entities or participate in other ventures covering 40 countries and have alliances in an additional 11 countries. As a result of our global operations, we face such risks as foreign currency fluctuations, unfavorable foreign trade policies, unstable political and economic conditions, and, because some of our foreign operations are not wholly owned, the potential for compromised operating control in certain countries. In addition, we are required to comply with multiple foreign laws and regulations that may differ substantially from country to country, requiring significant management attention and cost. In addition, the business cultures in certain areas of the world are different than those that prevail in the United States, and we may be at a competitive disadvantage against other companies that do not have to comply with standards of financial controls, Foreign Corrupt Practices Act requirements, or business integrity that we are committed to maintaining as a U.S. publicly traded company. Our results may continue to be affected by all of these factors. All of these risks could have a material adverse effect on our business, financial condition, results of operations and cash flows.
Product Availability; Potential Cost Increases — In addition to selling our private brand merchandise, we are a reseller of manufacturers’ branded items and are thereby dependent on the availability and pricing of key products, including ink, toner, paper and technology products, to name a few. As a reseller, we cannot control the supply, design, function or cost of many of the products we offer for sale. Disruptions in the availability of raw materials used in production of these products may adversely affect our sales and result in customer dissatisfaction. Further, we cannot control the cost of manufacturers’ products and cost increases must either be passed along to our customers or result in an erosion of our earnings. Failure to identify desirable products and make them available to our customers when desired and at attractive prices could have a material adverse effect on our business, financial condition, results of operations and cash flows.
Global Sourcing of Products/Private Brand — In recent years, we have substantially increased the number and types of products that we sell under our private brands including Office Depot® and other proprietary brands. Sources of supply may prove to be unreliable, or the quality of the globally sourced products may vary from our expectations. Economic and civil unrest in areas of the world where we source such products, as well as shipping and dockage issues could adversely impact the availability or cost of such products, or both. Moreover, as we seek indemnities from the manufacturers of these products, the uncertainty of realization of any such indemnity and the lack of understanding of U.S. product liability laws in certain parts of Asia make it more likely that we may have to respond to claims or complaints from our customers. Most of our imported goods to the United States arrive from Asia, and the ports through which these goods are imported are located primarily on the U.S. West Coast. Therefore, we are subject to potential disruption of our supplies of goods for resale due to labor unrest, security issues or natural disasters affecting any or all of these ports. Finally, as a significant importer of manufactured goods from foreign countries, we are vulnerable to security concerns, labor unrest and other factors that may affect the availability and reliability of ports of entry for the products that we source. Any of these circumstances could have a material adverse effect on our business, financial condition, results of operations and cash flows.
Possible Business Disruption Because of Weather — Weather conditions may affect any business, especially retail businesses, including snow storms, high winds and heavy rain. Because of our heavy concentration in the southern United States (including Florida and the Gulf Coast), our company may be more susceptible than some others to the effects of tropical weather disturbances. For example, during 2004 and 2005, we sustained disruption to our businesses in the United States due to the number and severity of weather events in the Southeastern United States, including record numbers of hurricanes. Winter storm conditions in the Midwest and Southwest, areas that also have a large concentration of our business activities, could result in supply chain constraints or other business disruptions. We believe that we have taken reasonable precautions to prepare for any such weather-related events, but our precautions may not be adequate to deal with such events in the future. As these events occur in the future, if they should impact areas in which we have concentrations of retail stores or distribution facilities, such events could have a material adverse effect on our business, financial condition, results of operations and cash flows.
13
Table of Contents
New Systems and Technology — From time to time, we modify our information systems and technology to increase productivity and efficiency. We are undertaking certain system enhancements and conversions that, if not done properly, could divert the attention of our workforce during development and implementation and constrain for some time our ability to provide the level of service our customers demand as well as our ability to complete requisite filings with the SEC. Also, when implemented, the new systems and technology may not provide the benefits anticipated and could add costs and complications to our ongoing operations. A failure to effectively convert to these systems or to realize the intended efficiencies could have a material adverse effect on our business, financial condition, results of operations and cash flows.
Labor — We are heavily dependent upon our labor force to identify new customers and provide desired products and services to existing customers. We attempt to attract and retain an appropriate level of personnel in both field operations and corporate functions. Our compensation packages are designed to provide benefits commensurate with our level of expected service. However, within our retail operations, we face the challenge of filling many positions at wage scales that are appropriate to the industry and competitive factors. We operate in a number of jurisdictions. It can be cumbersome to comply with labor laws and regulations, many of which vary from jurisdiction to jurisdiction. This has added to our labor costs in some locales as we have had to add personnel to monitor and track compliance with sometimes arcane rules and regulations that impact retailers in particular. As a result of these and other factors, we face many external risks and internal factors in meeting our labor needs, including competition for qualified personnel, overall unemployment levels, works councils (in our international locations), prevailing wage rates, as well as rising employee benefit costs, including insurance costs and compensation programs. We also engage third parties in some of our processes such as delivery and transaction processing and these providers may face similar issues. Changes in any of these factors, including especially a shortage of available workforce in the areas in which we operate, could interfere with our ability to adequately provide services to customers and result in increasing our labor costs. Any failure to meet increasing demands on securing our workforce could have a material adverse effect on our business, financial condition, results of operations and cash flows.
Unionization — While our management believes that our employee relations are good, we cannot be assured that we will not experience pressure from labor unions or become the target of campaigns similar to those faced by our competitors. The potential for unionization could increase if the United States Congress passes federal legislation that would facilitate labor organization. The unionization of a significant portion of our workforce could increase our overall costs at the affected locations and adversely affect our flexibility to run our business in the most efficient manner to remain competitive or acquire new business. In addition, significant union representation would require us to negotiate wages, salaries, benefits and other terms with many of our employees collectively and could adversely affect our results of operations by increasing our labor costs or otherwise restricting our ability to maximize the efficiency of our operations.
Fuel Costs — We operate a large network of stores and delivery centers around the globe. As such, we purchase significant amounts of fuel needed to transport products to our stores and customers. We also incur significant shipping costs to bring products from overseas producers to our distribution systems. While we may hedge our anticipated fuel purchases, the underlying commodity costs associated with this transport activity have been volatile in recent periods and disruptions in availability of fuel could cause our operating costs to rise significantly to the extent not covered by our hedges. Additionally, we rely on predictable costs and available energy to light our stores and operate our equipment. Increases in any of the components of energy costs could have an adverse impact on our earnings, as well as our ability to satisfy our customers in a cost effective manner. Any of these factors that could impact the availability or cost of our energy resources could have a material adverse effect on our business, financial condition, results of operations and cash flows.
Possible Changes to Our Global Tax Rate — As a result of our operations in many foreign countries, in addition to the United States, our global tax rate is derived from a combination of applicable tax rates in the various jurisdictions in which we operate. Depending upon the sources of our income, any agreements we may have with taxing authorities in various jurisdictions, and the tax filing positions we take in various jurisdictions, our overall
14
Table of Contents
tax rate may be lower or higher than that of other companies or higher or lower than our tax rates have been in the past. At any given point in time, we base our estimate of an annual effective tax rate upon a calculated mix of the tax rates applicable to our company and to estimates of the amount of income likely to be generated in any given geography. The loss of one or more agreements with taxing jurisdictions, a change in the mix of our business from year to year and from country to country, changes in rules related to accounting for income taxes, changes in tax laws in any of the multiple jurisdictions in which we operate or adverse outcomes from the tax audits that regularly are in process in any of the jurisdictions in which we operate could result in an unfavorable change in our overall tax rate. Additionally, during the third quarter of 2009, we recorded tax expense of approximately $322 million to establish valuation allowances on deferred tax assets in certain taxing jurisdictions. Although we anticipate being able to remove the valuation allowances in future periods, as long as they are in place, we are unable to record deferred tax benefits in those jurisdictions. This consequence will cause our effective tax rate to be volatile, possibly changing from period to period. Unfavorable changes in our overall tax rate could have a material adverse effect on our business, financial condition, results of operations and cash flows.
Regulatory Environment — While businesses are subject to regulatory matters relating to the conduct of their businesses, including consumer protection laws, advertising regulations, wage and hour regulations and the like, certain jurisdictions have taken a particularly aggressive stance with respect to such matters and have stepped up enforcement, including fines and other sanctions. We transact substantial amounts of business in certain such jurisdictions, and to the extent that our business locations are exposed to what might be termed a challenging enforcement environment or legal or regulatory systems that authorize or encourage private parties to pursue relief under so-called private attorney general laws and similar authorizations for private parties to pursue enforcement of governmental laws and regulations, the resulting fines and exposure to third party liability (such as monetary recoveries and recoveries of attorneys fees) could have a material adverse effect on our business and results of operations, including the added cost of increased preventative measures that we may determine to be necessary to conduct business in such locales.
Compromises of our Information Security — Through our sales and marketing activities, we collect and store certain personal information that our customers provide to purchase products or services, enroll in promotional programs, register on our web site, or otherwise communicate and interact with us. We also gather and retain information about our associates in the normal course of business. We may share information about such persons with vendors that assist with certain aspects of our business. Despite instituted safeguards for the protection of such information, we cannot be certain that all of our systems are entirely free from vulnerability to attack. A breach of our security system resulting in customer or employee personal information being obtained by unauthorized persons could adversely affect our reputation, disrupt our operations and expose us to claims from customers, financial institutions, payment card associations and other persons, which could have a material adverse effect on our business, financial conditions and results of operations. In addition, our online operations at www.officedepot.com depend upon the secure transmission of confidential information over public networks, including information permitting cashless payments.
Disclaimer of Obligation to Update
We assume no obligation (and specifically disclaim any such obligation) to update these Risk Factors or any other forward-looking statements contained in this Annual Report to reflect actual results, changes in assumptions or other factors affecting such forward-looking statements.
Item 1B. Unresolved Staff Comments.
None.
15
Table of Contents
As of January 23, 2010, our North American Retail Division operated 1,130 office supply stores in 46 U.S. states, the District of Columbia and Puerto Rico and 21 office supply stores in five Canadian provinces. As of January 23, 2010, our International Division operated 137 office supply stores (excluding our participation in arrangements through non-consolidated entities) in five countries outside of the United States and Canada. The following table sets forth the locations of these facilities.
STORES
| State/Country |
# | State/Country |
# | |||
| UNITED STATES: |
||||||
| Alabama |
20 | North Dakota | 2 | |||
| Alaska |
2 | Ohio | 14 | |||
| Arizona |
5 | Oklahoma | 17 | |||
| Arkansas |
12 | Oregon | 19 | |||
| California |
149 | Pennsylvania | 14 | |||
| Colorado |
39 | Puerto Rico | 6 | |||
| Connecticut |
4 | South Carolina | 21 | |||
| Delaware |
3 | South Dakota | 1 | |||
| District of Columbia |
1 | Tennessee | 27 | |||
| Florida |
144 | Texas | 147 | |||
| Georgia |
49 | Utah | 9 | |||
| Hawaii |
4 | Virginia | 25 | |||
| Idaho |
6 | Washington | 37 | |||
| Illinois |
47 | West Virginia | 2 | |||
| Indiana |
22 | Wisconsin | 14 | |||
| Iowa |
3 | Wyoming | 3 | |||
| Kansas |
8 | TOTAL UNITED STATES | 1,130 | |||
| Kentucky |
21 | |||||
| Louisiana |
37 | CANADA: | ||||
| Maryland |
27 | Alberta | 6 | |||
| Massachusetts |
2 | British Columbia | 7 | |||
| Michigan |
22 | Manitoba | 2 | |||
| Minnesota |
11 | Ontario | 5 | |||
| Mississippi |
16 | Saskatchewan | 1 | |||
| Missouri |
25 | TOTAL CANADA | 21 | |||
| Montana |
4 | |||||
| Nebraska |
6 | FRANCE | 49 | |||
| Nevada |
19 | HUNGARY | 17 | |||
| New Jersey |
10 | ISRAEL | 46 | |||
| New Mexico |
7 | SOUTH KOREA | 12 | |||
| New York |
10 | SWEDEN | 13 | |||
| North Carolina |
37 | TOTAL OUTSIDE NORTH AMERICA | 137 |
We closed one North American retail store during January 2010.
16
Table of Contents
As of January 23, 2010, we had 21 North American supply chain facilities in 15 U.S. states. These facilities, which support our North American Retail and North American Business Solutions Divisions, included fifteen DCs and six crossdock facilities. Five of the fifteen DCs we operated as of January 23, 2010, were combination facilities, which share real estate, technology, warehouse management systems and inventory and satisfy the needs of both retail stores and delivery customers. As of January 23, 2010, we also had 39 DCs in 16 countries outside of the United States and Canada, which support our International Division. The following tables set forth the locations of our supply chain facilities as of January 23, 2010.
DCs (North America)
| State |
# | State |
# | |||
| UNITED STATES: |
||||||
| Arizona |
1 | Massachusetts | 1 | |||
| Florida |
1 | Minnesota | 1 | |||
| California |
2 | New Jersey | 1 | |||
| Colorado |
1 | Ohio | 1 | |||
| Georgia |
1 | Texas | 2 | |||
| Illinois |
1 | Washington | 1 | |||
| Maryland |
1 | TOTAL UNITED STATES | 15 |
Crossdock Facilities (North America)
| State |
# | State |
# | |||
| UNITED STATES: |
||||||
| Florida |
1 | Mississippi | 1 | |||
| Georgia |
1 | Pennsylvania | 1 | |||
| Illinois |
1 | Texas | 1 | |||
| TOTAL UNITED STATES | 6 |
International DCs
| Country |
# | Country |
# | |||
| Belgium |
1 | Italy | 1 | |||
| China |
6 | Japan | 1 | |||
| Czech Republic |
1 | South Korea | 1 | |||
| France |
5 | Spain | 1 | |||
| Germany |
2 | Sweden | 3 | |||
| India |
10 | Switzerland | 1 | |||
| Ireland |
1 | The Netherlands | 1 | |||
| Israel |
1 | United Kingdom | 3 | |||
| TOTAL INTERNATIONAL | 39 |
Our corporate offices in Boca Raton, Florida consist of approximately 625,000 square feet of office space in three interconnected buildings. This facility is being leased over 15 years with certain renewal options. The lease is accounted for as a capital lease. We also lease a corporate office in Venlo, the Netherlands which is approximately 226,000 square feet in size, and own a systems data center in Charlotte, North Carolina which is approximately 53,000 square feet in size.
Although we own a small number of our retail store locations and several of our European distribution centers, most of our facilities are leased or subleased, with initial lease terms expiring in various years through 2032.
17
Table of Contents
We are involved in litigation arising in the normal course of our business. While, from time to time, claims are asserted that make demands for a large sum of money (including, from time to time, actions which are asserted to be maintainable as class action suits), we do not believe that contingent liabilities related to these matters, either individually or in the aggregate, will materially affect our financial position, results of our operations or cash flows.
As previously disclosed, the company reached a proposed settlement with the staff of the U.S. Securities and Exchange Commission (“SEC”) to resolve the previously disclosed SEC inquiry that commenced in July of 2007 and the formal investigation disclosed in January of 2008 with respect to contacts and communications with financial analysts, inventory receipt and reserves, timing of vendor payments, certain intercompany loans, certain payments to foreign officials, inventory obsolescence and timing and recognition of vendor program funds. The company and its officers and employees have cooperated with the SEC staff in this investigation. The SEC staff intends to recommend to the SEC a proposed settlement with respect to the company which would conclude for the company all matters arising from the SEC investigation. Under the proposed settlement, the company, without admitting or denying liability, has agreed to pay a civil penalty and to consent to a cease and desist order from committing or causing violations of Regulation FD and Sections 13(a) and 13(b) of the Securities Exchange Act of 1934 (and related rules) which require the maintenance of accurate books and records and internal controls. Regulation FD is a rule regarding communication with analysts and investors. The proposed settlement is contingent on the review and approval of final documentation by the company and the SEC staff, and is subject to approval by the SEC Commissioners. There can be no assurance that the SEC Commissioners will approve the staff’s recommendation. The company has also been informed that the company’s CEO and two former employees each received “Wells” notices from the staff of the SEC’s Miami Regional Office advising them that the regional staff has made a preliminary decision to recommend that the SEC bring civil enforcement actions against them for possible violations of Regulation FD. Under the processes established by the SEC, these individuals will have an opportunity to present their perspective and to address the issues raised by the SEC staff prior to any action being taken by the SEC.
On January 14, 2010, the federal court in the Southern District of Florida dismissed the Second Consolidated Amended Complaint filed by the New Mexico Educational Retirement Board, lead plaintiff in a Consolidated Lawsuit, with prejudice. On February 9, 2010, the lead plaintiff filed a notice to appeal this decision. As background, in early November 2007, two putative class action lawsuits were filed against the company and certain of its executive officers alleging violations of the Securities Exchange Act of 1934. The allegations made in these lawsuits primarily related to the accounting for vendor program funds. Each of the foregoing lawsuits was filed in the Southern District of Florida and captioned as follows: (1) Nichols v. Office Depot, Inc., Steve Odland and Patricia McKay filed on November 6, 2007 and (2) Sheet Metal Worker Local 28 Pension Fund v. Office Depot, Inc., Steve Odland and Patricia McKay filed on November 5, 2007. On March 21, 2008, the court in the Southern District of Florida entered an Order consolidating the class action lawsuits (the “Consolidated Lawsuit”). Lead plaintiff in the Consolidated Lawsuit, the New Mexico Educational Retirement Board, filed its Consolidated Amended Complaint on July 2, 2008, and its Second Consolidated Amended Complaint on April 20, 2009.
In addition, in the ordinary course of business, our sales to and transactions with government customers may be subject to audits and review by governmental authorities and regulatory agencies. Many of these audits and reviews are resolved without incident; however, we have had several claims and inquiries by certain governmental agencies into contract pricing, and additional inquiries may follow. While these claims may assert large demands, we do not believe that contingent liabilities related to these matters, either individually or in the aggregate, will materially affect our financial position, results of our operations or cash flows.
18
Table of Contents
Item 4. Submission of Matters to a Vote of Security Holders.
The company held a special meeting of stockholders on October 14, 2009. Of the total number of common shares outstanding on August 28, 2009, a total of 224,590,051 were represented in person or by proxy. Results of votes with respect to proposals submitted at that meeting are as follows:
| a. | To consider a proposal to approve the conversion at the option of the holders of our 10% Series A Redeemable Convertible Participating Perpetual Preferred Stock into shares of our common stock in excess of 19.99% of the shares of our common stock outstanding on June 23, 2009, in compliance with the rules of the New York Stock Exchange. Our stockholders voted to approve this proposal with 220,850,091 votes for and 3,610,189 votes against. There were 129,771 abstentions. |
| b. | To consider a proposal to approve the conversion at the option of the holders of our 10% Series B Redeemable Conditional Convertible Participating Perpetual Preferred Stock into shares of our common stock and the right of the holders of the Series B Preferred to vote with shares of our common stock on as-converted basis. Our stockholders voted to approve this proposal with 221,614,968 votes for and 2,841,336 votes against. There were 133,747 abstentions. |
| c. | To approve the adjournment of the Special Meeting to solicit additional proxies if there are insufficient proxies at the Special Meeting to approve each of the foregoing proposals. Our stockholders voted to approve this proposal with 207,905,413 votes for and 16,510,386 votes against. There were 174,253 abstentions. |
19
Table of Contents
PART II
Item 5. Market for Registrant’s Common Equity, Related Stockholder Matters and Issuer Purchases of Equity Securities.
Our common stock is listed on the New York Stock Exchange (“NYSE”) under the symbol “ODP.” As of the close of business on January 23, 2010, there were 7,459 holders of record of our common stock. The last reported sale price of the common stock on the NYSE on January 23, 2010 was $5.99.
The following table sets forth, for the periods indicated, the high and low sale prices of our common stock, as quoted on the NYSE Composite Tape. These prices do not include retail mark-ups, markdowns or commission.
| High | Low | |||||
| 2009 |
||||||
| First Quarter |
$ | 4.170 | $ | 0.590 | ||
| Second Quarter |
5.370 | 1.250 | ||||
| Third Quarter |
6.940 | 3.480 | ||||
| Fourth Quarter |
7.840 | 5.570 | ||||
| 2008 |
||||||
| First Quarter |
$ | 15.540 | $ | 10.600 | ||
| Second Quarter |
14.390 | 10.690 | ||||
| Third Quarter |
11.430 | 5.510 | ||||
| Fourth Quarter |
5.940 | 1.450 | ||||
We have never declared or paid cash dividends on our common stock. Our asset based credit facility includes limitations in certain circumstances on restricted payments including share repurchases and the payment of cash dividends. These restrictions are based on the then-current and pro-forma fixed charge coverage ratio and borrowing availability at the point of consideration. Further, so long as investors in our redeemable preferred stock own at least 10% of the common stock voting rights, on an as-converted basis, the affirmative vote of a majority of the shares of preferred stock then outstanding and entitled to vote is required for the declaration or payment of a dividend on common stock if dividends on the preferred stock have not been paid in full in cash.
20
Table of Contents
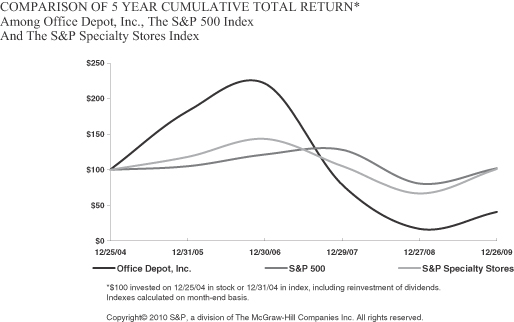
The foregoing graph shall not be deemed to be filed as part of this Form 10-K and does not constitute soliciting material and should not be deemed filed or incorporated by reference into any other filing of the company under the Securities Act of 1933, as amended, or the Securities Exchange Act of 1934, as amended, except to the extent the company specifically incorporates the graph by reference.
On April 25, 2007, the board of directors authorized a common stock repurchase program whereby we were authorized to repurchase $500 million of our common stock. The company has not made any repurchases under this authorization, and the remaining authorized amount at December 26, 2009 was $500 million. As previously mentioned, the company’s asset based credit facility includes limitations in certain circumstances on restricted payments including share repurchases.
21
Table of Contents
Item 6. Selected Financial Data.
The following table sets forth selected consolidated financial data at and for each of the five fiscal years in the period ended December 26, 2009. It should be read in conjunction with the Consolidated Financial Statements and Notes thereto, included in Item 8 of this report, and Management’s Discussion and Analysis of Financial Condition and Results of Operations, included in Item 7 of this report.
| (In thousands, except per share amounts and statistical data) | 2009 | 2008 | 2007 | 2006 | 2005(3) | ||||||||||||
| Statements of Operations Data: |
|||||||||||||||||
| Sales |
$ | 12,144,467 | $ | 14,495,544 | $ | 15,527,537 | $ | 15,010,781 | $ | 14,278,944 | |||||||
| Net earnings (loss) attributable to Office Depot, Inc (1)(2) |
$ | (596,465 | ) | $ | (1,478,938 | ) | $ | 395,615 | $ | 503,471 | $ | 273,792 | |||||
| Net earnings (loss) available to common shareholders (1)(2) |
$ | (626,971 | ) | $ | (1,478,938 | ) | $ | 395,615 | $ | 503,471 | $ | 273,792 | |||||
| Net earnings (loss) per share: |
|||||||||||||||||
| Basic |
$ | (2.30 | ) | $ | (5.42 | ) | $ | 1.45 | $ | 1.79 | $ | 0.88 | |||||
| Diluted |
(2.30 | ) | (5.42 | ) | 1.43 | 1.75 | 0.87 | ||||||||||
| Statistical Data: |
|||||||||||||||||
| Facilities open at end of period: |
|||||||||||||||||
| United States and Canada: |
|||||||||||||||||
| Office supply stores |
1,152 | 1,267 | 1,222 | 1,158 | 1,047 | ||||||||||||
| Distribution centers |
15 | 20 | 21 | 20 | 20 | ||||||||||||
| Crossdock facilities |
6 | 12 | 12 | 10 | 10 | ||||||||||||
| Call centers |
— | — | — | — | 3 | ||||||||||||
| International (4): |
|||||||||||||||||
| Office supply stores |
137 | 162 | 148 | 125 | 70 | ||||||||||||
| Distribution centers |
39 | 43 | 33 | 32 | 25 | ||||||||||||
| Call centers |
29 | 27 | 31 | 30 | 31 | ||||||||||||
| Total square footage — North American Retail Division |
28,109,844 | 30,672,862 | 29,790,082 | 28,520,269 | 26,261,318 | ||||||||||||
| Percentage of sales by segment: |
|||||||||||||||||
| North American Retail Division |
42.1% | 42.2% | 43.9% | 45.2% | 45.6% | ||||||||||||
| North American Business Solutions Division |
28.7% | 28.6% | 29.1% | 30.5% | 30.1% | ||||||||||||
| International Division |
29.2% | 29.2% | 27.0% | 24.3% | 24.3% | ||||||||||||
| Balance Sheet Data: |
|||||||||||||||||
| Total assets |
$ | 4,890,346 | $ | 5,268,226 | $ | 7,256,540 | $ | 6,557,438 | $ | 6,098,525 | |||||||
| Long-term debt, excluding current maturities |
662,740 | 688,788 | 607,462 | 570,752 | 569,098 | ||||||||||||
| Redeemable preferred stock, net |
355,308 | — | — | — | — | ||||||||||||
| (1) | Fiscal year 2009 Net loss attributable to Office Depot, Inc. and Net loss available to common shareholders include charges of approximately $322 million to establish valuation allowances on certain deferred tax assets. See Management’s Discussion and Analysis of Financial Condition and Results of Operations for additional information. |
| (2) | Fiscal year 2008 Net loss attributable to Office Depot, Inc. and Net loss available to common shareholders include impairment charges for goodwill and trade names of $1.27 billion and other asset impairment charges of $222 million. See Management’s Discussion and Analysis of Financial Condition and Results of Operations for additional information. |
| (3) | Includes 53 weeks in accordance with our 52 — 53 week reporting convention. |
| (4) | Facilities of wholly-owned or majority-owned entities operated by our International Division. |
22
Table of Contents
Item 7. Management’s Discussion and Analysis of Financial Condition and Results of Operations.
RESULTS OF OPERATIONS
OVERVIEW
Our business is comprised of three segments. The North American Retail Division includes our retail office supply stores in the U.S. and Canada, which offer office supplies and services, computers and business machines and related supplies, and office furniture. Most stores also offer a copy and print center offering printing, reproduction, mailing and shipping. The North American Business Solutions Division sells office supply products and services in the U.S. and Canada directly to businesses through catalogs, internet web sites and a dedicated sales force. Our International Division sells office products and services through catalogs, internet web sites, a dedicated sales force and retail stores.
Our fiscal year results are based on a 52- or 53-week retail calendar ending on the last Saturday in December. Each of the three years addressed in this Management’s Discussion and Analysis of Financial Condition and Results of Operations (“MD&A”) is based on 52 weeks. Our next 53 week fiscal year will occur in 2011. Our comparable store sales relate to stores that have been open for at least one year. A summary of factors important to understanding our results for 2009 is provided below and further discussed in the narrative that follows this overview.
| • | Total company sales were $12.1 billion in 2009, down 16% compared to 2008. Sales in North America decreased 16% for the year and comparable store sales in North American Retail decreased 14%. International Division sales decreased 16% in U.S. dollars and 9% in local currencies. |
| • | Gross margin for 2009 improved by 30 basis points from 2008, following a 140 basis point decline in the prior year. The increase in 2009 primarily reflects improved product margins and lower levels of inventory shrink and valuation charges partially offset by the deleveraging of fixed property costs on lower sales levels. |
| • | As part of our previously announced strategic reviews, we recorded charges of $253 million, $199 million and $40 million in 2009, 2008 and 2007, respectively. These expenses (the “Charges”) include primarily charges for lease accruals, severance expenses and asset impairments. |
| • | Total operating expenses were down $1.9 billion compared to 2008. Of this amount, $1.3 billion relates to the non-cash charges for impairment of goodwill and trade names recognized in 2008. The remaining change primarily reflects lower payroll and advertising expenses as well as reductions in distribution costs and fixed asset impairments. |
| • | During the third quarter of 2009, we recorded a non-cash tax expense to establish valuation allowances on deferred tax assets of $321.6 million ($1.18 per share) because of the uncertainty of future realizability of these assets. |
| • | Diluted (loss) earnings per share for 2009, 2008, and 2007 were $(2.30), $(5.42), and $1.43, respectively. The Charges had a per share impact of $0.86, $5.01 and $0.11 in 2009, 2008 and 2007, respectively. |
| • | Cash flow from operating activities was $296 million in 2009, compared to $468 million in 2008, primarily reflecting the reduction in business performance related to weak economic conditions. |
| • | On June 23, 2009, we issued $350 million of redeemable preferred stock and received cash, net of fees paid, of approximately $325 million. During the second half of 2009, we accrued paid-in-kind dividends on the redeemable preferred stock totaling approximately $30 million, measured at fair value. |
23
Table of Contents
OPERATING RESULTS
Our overall sales decreased 16% in 2009, and 7% in 2008, and increased 3% in 2007. Adverse economic conditions throughout our sales territories contributed to the declines for 2008 and 2009. The 2007 sales increase was driven by higher U.S. dollar sales in the International Division.
The increase in gross profit as a percentage of sales in 2009 resulted primarily from improved product margins and lower levels of inventory shrink and valuation charges partially offset by the deleveraging of fixed property costs on lower sales levels. Gross margins in 2008 reflect significant deleveraging of fixed property cost on lower sales as well as the impact of a highly promotional environment. An increase in private brand sales and a shift to core supplies benefited gross margin in 2008.
Total operating expenses as a percentage of sales was 30.1% in 2009, 38.3% in 2008 and 25.9% in 2007. The 2009, 2008 and 2007 amounts include Charges of $240 million, $183 million and $40 million, respectively. The 2008 amount also includes goodwill and trade name impairment charges of $1.3 billion and operational asset impairments of $109 million. After considering these charges, the remaining 2008 operating expenses were approximately 60 basis points lower than in 2009 and 190 basis points higher than in 2007. The 2009 and 2008 changes reflect the impact of relatively fixed levels of labor costs on a declining sales base. The 2009 change also includes the deleveraging of fixed distribution costs on lower sales while the 2008 change reflects increases in legal and professional fees and the impact of no bonus expense in 2007.
Discussion of other income and expense items, including material Charges and changes in interest and taxes follows our review of segment results.
NORTH AMERICAN RETAIL DIVISION
| (Dollars in millions) | 2009 | 2008 | 2007 | ||||||
| Sales |
$ | 5,113.6 | $ | 6,112.3 | $ | 6,813.6 | |||
| % change |
(16)% | (10)% | —% | ||||||
| Division operating profit (loss) |
$ | 105.5 | $ | (29.2) | $ | 354.5 | |||
| % of sales |
2.1% | (0.5)% | 5.2% | ||||||
Sales in our North American Retail Division decreased 16% in 2009 and 10% in 2008. During 2009, we closed 120 underperforming stores as part of the strategic review initiated during the fourth quarter of 2008. Comparable store sales in 2009 from the 1,139 stores that were open for more than one year decreased 14%. Comparable store sales in 2008 from the 1,207 stores that were open for more than one year decreased 13% for the full year and showed successive declines throughout each quarter of the year. The sales declines in both 2009 and 2008 were driven by macroeconomic factors as consumers and small business customers curtailed their spending in response to the global financial crisis that began in 2008. While transaction counts were down in 2009, a drop in average order value was the greater contributor to our sales decline. Additionally, our commitment to proactively reduce promotions in select categories resulted in lower sales compared to 2008. Within each of our three major product categories of supplies, technology and furniture, we experienced sales declines compared to 2008. The negative comparable store sales were driven by fewer sales of higher priced, discretionary categories in furniture and technology.
The North American Retail Division reported operating profit of approximately $106 million in 2009, compared to an operating loss of $29 million in 2008. This measure of operating performance is consistent with the internal reporting of results used to manage the business and allocate resources and does not include charges associated with the strategic decisions made as part of the internal review initiated during the fourth quarter of 2008. Please see Charges discussion in the “Corporate and Other” section of MD&A.
24
Table of Contents
The increase in Division operating profit for 2009 was driven by lower asset impairments, an improvement in product margins and lower operating expenses. The improvement in product margins was driven primarily by a more favorable product mix, lower levels of inventory shrinkage and valuation charges as well as lower product costs. These product margin improvements were partially offset by the deleveraging of fixed property costs on lower sales levels. During 2008, we recorded fixed asset impairment charges of approximately $98 million. Store impairment charges in 2009 totaled $3 million. Additionally, as a result of the 2008 fixed asset impairments, we experienced lower levels of depreciation expense. During 2009, we closed underperforming stores as part of the strategic review initiated during the fourth quarter of 2008 contributing to the increase in Division operating profit in 2009. Operating expenses, including distribution costs and payroll and advertising expenses were down in both 2008 and 2009. In addition to the fixed asset impairment charges, the operating loss in 2008 included increased levels of inventory shrink compared to 2007. Division operating profit in both 2008 and 2009 was negatively impacted by the unfavorable impact our sales volume decline had on gross margin and operating expenses (the “flow through” impact).
At the end of 2009, we operated 1,152 retail stores in the U.S. and Canada. We opened six new stores during 2009 and 59 stores during 2008. During 2009, we closed 121 stores in North America, of which 120 were part of the strategic review initiated during the fourth quarter of 2008. We anticipate opening approximately 20 stores in 2010. Also, we will continue to review locations as leases become due and will close or relocate stores when appropriate.
NORTH AMERICAN BUSINESS SOLUTIONS DIVISION
| (Dollars in millions) | 2009 | 2008 | 2007 | ||||||
| Sales |
$ | 3,483.7 | $ | 4,142.1 | $ | 4,518.4 | |||
| % change |
(16)% | (8)% | (1)% | ||||||
| Division operating profit |
$ | 98.2 | $ | 119.8 | $ | 220.1 | |||
| % of sales |
2.8% | 2.9% | 4.9% | ||||||
Sales in our North American Business Solutions Division decreased 16% in 2009 and 8% in 2008. The sales declines in both 2009 and 2008 reflect the impact of challenging economic conditions. The 2009 decline was principally driven by a decrease in the number of customer transactions, which resulted in part from aggressive pricing from some of our competitors in our large, national accounts and contraction in our public sector business. On a product category basis, the Division experienced weakness in durables such as furniture, technology and peripherals, as customers delayed their purchases of these products in favor of consumables like paper, ink and toner.
Division operating profit totaled $98 million in 2009, compared to $120 million in 2008. This measure of operating performance is consistent with the internal reporting of results used to manage the business and allocate resources and does not include charges associated with the strategic decisions made as part of the internal review initiated during the fourth quarter of 2008. Please see Charges discussion in the “Corporate and Other” section of MD&A.
The decrease in Division operating profit in 2009 was driven by the flow through impact of lower sales levels as well as lower product margins, reflecting a less profitable product mix and cost increases that could not be passed on to our customers. Division operating profit for 2009 also reflects increased promotions in our direct business during the first half of the year. These negative impacts were partially offset by reductions in operating expenses, including a decrease in distribution costs as well as lower payroll and advertising expenses. The decrease in Division operating profit in 2008 resulted primarily from the flow through impact of lower sales levels, an increased accrual for bad debts consistent with the economic downturn and higher costs related to advertising and professional fees.
25
Table of Contents
INTERNATIONAL DIVISION
| (Dollars in millions) | 2009 | 2008 | 2007 | ||||||
| Sales |
$ | 3,547.2 | $ | 4,241.1 | $ | 4,195.6 | |||
| % change |
(16)% | 1% | 15% | ||||||
| % change in local currency sales |
(9)% | (2)% | 6% | ||||||
| Division operating profit |
$ | 119.6 | $ | 157.2 | $ | 231.1 | |||
| % of sales |
3.4% | 3.7% | 5.5% | ||||||
Sales in our International Division in U.S. dollars decreased 16% in 2009 and increased 1% in 2008. Local currency sales decreased 9% in 2009 and 2% in 2008. The sales declines in both 2009 and 2008 resulted from the global economic crisis, which had a negative effect on both business investment and office supply expenditures and resulted in lower sales levels in both our contract and direct businesses. Although we are becoming more effective at retaining our higher value customers, sales in the direct business declined 11% in local currency in 2009 because of softness in higher priced items such as furniture and technology. Sales in the contract business declined 8% in local currency as larger businesses have reduced their workforces and their discretionary spending on office supplies. Additionally, the International Division’s sales were reduced in 2009 as a result of our exit from the retail business in Japan.
Division operating profit totaled $120 million in 2009, compared to $157 million in 2008. This measure of operating performance is consistent with the internal reporting of results used to manage the business and allocate resources and does not include charges associated with the strategic decisions made as part of the internal review initiated during the fourth quarter of 2008 nor a goodwill impairment charge of $863 million recognized at the corporate level in 2008. Please see Charges discussion in the “Corporate and Other” section of MD&A.
The decreases in Division operating profit in 2009 and 2008 were driven by the flow through impact of lower sales levels. This negative impact was partially offset by lower operating expenses, including a decrease in distribution costs as well as lower payroll and advertising expenses. Other factors, including a shift to lower margin customers and cost increases that could not be fully passed on to our customers, negatively impacted Division operating profit in both 2009 and 2008. During 2008, we also recorded a non-cash gain of approximately $13 million related to the curtailment of a defined benefit pension plan in the UK and non-cash impairment charges of approximately $11 million related to our customer list intangible assets.
For U.S. reporting, the International Division’s sales are translated into U.S. dollars at average exchange rates experienced during the year. The Division’s reported sales were negatively impacted by approximately $305 million in 2009 and positively impacted by $127 million in 2008 from changes in foreign currency exchange rates. Division operating profit was negatively impacted by $6 million in 2009 and positively impacted by $2 million in 2008 from changes in foreign exchange rates. Internally, we analyze our international operations in terms of local currency performance to allow focus on operating trends and results.
CORPORATE AND OTHER
Asset Impairments, Exit Costs and Other Charges
During the fourth quarter of 2008, we announced the launch of an internal review of assets and processes with the goal of positioning the company to deal with the degradation in the global economy and to benefit from its eventual improvement. The results of that internal review led to decisions to close stores, exit certain businesses and write off certain assets that were not seen as providing future benefit. These decisions resulted in material charges that were recognized during the fourth quarter of 2008 and fiscal year 2009. Additional information about these activities is provided below.
26
Table of Contents
As of the end of 2009, we have substantially completed all activities falling under our strategic reviews. Although we do not expect to recognize new Charges under these programs in future periods, positive and negative adjustments to previously accrued amounts as well as accretion on discounted long-term accruals such as lease obligations will continue to impact our results in future periods. We currently estimate accretion of approximately $15 million for 2010 and declining amounts in subsequent periods. All such amortizations and settlements or adjustments to related accruals will be included in store and warehouse operating and selling expenses and recognized at the corporate level, outside of Division operating profit.
During 2008, we also recognized material goodwill and trade name impairment Charges. In 2007, we recognized Charges associated with the ending stages of a previously-disclosed business review. A summary of the Charges and the line item presentation of these amounts in our accompanying Consolidated Statements of Operations is as follows.
| (Dollars in millions, except per share amounts) | 2009 | 2008 | 2007 | |||||||||
| Cost of goods sold and occupancy costs |
$ | 13 | $ | 16 | $ | — | ||||||
| Store and warehouse operating and selling expenses |
188 | 52 | 25 | |||||||||
| Goodwill and trade name impairments |
— | 1,270 | — | |||||||||
| Other asset impairments |
26 | 114 | — | |||||||||
| General and administrative expenses |
26 | 17 | 15 | |||||||||
| Total pre-tax Charges |
253 | 1,469 | 40 | |||||||||
| Income tax effect |
(19 | ) | (103 | ) | (11 | ) | ||||||
| After-tax impact |
$ | 234 | $ | 1,366 | $ | 29 | ||||||
| Per share impact |
$ | 0.86 | $ | 5.01 | $ | 0.11 | ||||||
Of the total 2009 Charges, approximately $194 million either have or are expected to require cash settlement, including longer-term lease obligations that will require cash over multi-year lease terms; approximately $59 million of Charges are non-cash items.
The primary components of Charges during 2008 and 2009 include:
| • | Goodwill and Trade Name Impairments — We perform our annual review of goodwill and other non-amortizing intangible assets during the fourth quarter. As a result of this review for 2008, we recorded non-cash Charges of $1.2 billion to write down goodwill and $57 million related to the impairment of trade names. As previously disclosed and summarized here, our recoverability assessment of these non-amortizing intangible assets considered company-specific projections, assumptions about market participant views and the company’s overall market capitalization around the testing period. No impairments were identified in 2009 or 2007. |
| • | Retail Store Initiatives — As a result of the strategic review, we closed certain stores in North America and exited our retail operations in Japan. Additionally, we reduced the planned number of North American retail store openings for 2009. In total, we closed 126 stores in North America and 27 stores in Japan. Six of the North American locations were closed during the fourth quarter of 2008 and the remaining stores were closed during 2009. The stores closed under this program were underperforming stores or stores that were no longer a strategic fit for the company. The Charges associated with the initiatives related to our retail stores totaled $122 million and $104 million in 2009 and 2008, respectively. The 2009 Charges were primarily related to lease accruals, inventory write downs, severance expenses and other facility closure costs. Included in the 2009 Charges is the impact of a reclassification to the accrued lease liability of previously accrued lease related costs such as tenant improvement allowances and various rent credits associated with facilities closed during 2009. The net effect of this reclassification was to lower the lease-related Charges recognized in 2009 by approximately $32 million. The 2008 Charges related primarily to asset impairments, inventory write downs and lease accruals. |
| • | Supply Chain Initiatives — As a result of the strategic review of our supply chain operations, we consolidated certain facilities in North America and Europe. During 2009, we closed five distribution centers and six crossdock facilities in North America and completed the consolidation of our distribution centers in Europe. |
27
Table of Contents
| Charges related to these actions totaled approximately $57 million in 2009 and related primarily to lease accruals, inventory write downs, severance expenses and other facility closure costs. The 2008 Charges under these initiatives totaled approximately $22 million and consisted primarily of accelerated depreciation, severance related costs and lease accruals. |
| • | Asset Sales and Sale-Leaseback Transactions — As a result of the strategic review and to enhance liquidity, we entered into multiple sale and sale-leaseback transactions. Total proceeds from these transactions were approximately $150 million and are included in the investing section on our Consolidated Statement of Cash Flows. Losses on these transactions are included in the Charges and totaled approximately $22 million in 2009. Gains have been deferred and will reduce rent expense over the related leaseback periods. One transaction was the sale of an asset previously classified as a capital lease. Payments to satisfy the existing capital lease obligation are included in the financing section of the Consolidated Statement of Cash Flows. An additional sale-leaseback arrangement associated with operating properties included provisions that resulted in the transaction being accounted for as a financing. Accordingly, approximately $19 million has been included in long-term debt on the Consolidated Balance Sheet at December 26, 2009. |
| • | Headcount Reductions and Other Restructuring Activities — Each of the Divisions, as well as Corporate eliminated positions in an effort to centralize activities and eliminate geographic redundancies. Total severance and termination benefit costs associated with these actions totaled approximately $22 million and $13 million during 2009 and 2008, respectively. During 2009, we also recorded Charges for contract terminations on certain leased assets totaling approximately $17 million and for other restructuring activities totaling approximately $7 million. Additionally, we recognized a non-cash loss of approximately $6 million in conjunction with the disposition of other assets during 2009. Charges for other restructuring activities in 2008 totaled approximately $60 million and related primarily to asset write downs and costs associated with the restructuring of our back office operations and call centers in Europe. |
The Charges recognized in 2007 totaled $40 million and related primarily to the consolidation of warehouses and distribution centers in North America and Europe as well as management restructuring and call center consolidation in Europe.
In addition to the Charges that relate to the strategic reviews, during 2008, we recognized other material charges because of the downturn in our business. Those charges include material asset impairments relating to stores we continue to operate, charges to impair amortizing customer relationship intangible assets, as well as an increase in our allowance for bad debts related to our private label credit card portfolio and certain other accounts receivable balances to reflect the economic downturn. As these charges are considered reflective of operating an ongoing business in difficult times, they were included in the 2008 Division operating results.
General and Administrative Expenses
Total general and administrative expenses (“G&A”) decreased from $743 million in 2008 to $723 million in 2009. The portion of G&A expenses considered directly or closely related to division activity is included in the measurement of Division operating profit. The company continues to evaluate G&A and other expense allocation across the Divisions and may refine methodologies in future periods. Other companies may charge more or less G&A expenses and other costs to their segments, and our results therefore may not be comparable to similarly titled measures used by other companies. The remainder of the total G&A expenses are considered corporate expenses. A breakdown of G&A is provided in the following table:
| (Dollars in millions) | 2009 | 2008 | 2007 | ||||||
| Division G&A |
$ | 361.7 | $ | 394.6 | $ | 341.8 | |||
| Corporate G&A |
361.4 | 348.6 | 303.9 | ||||||
| Total G&A |
$ | 723.1 | $ | 743.2 | $ | 645.7 | |||
| % of sales |
6.0% | 5.1% | 4.2% | ||||||
28
Table of Contents
Decreases in Division G&A in 2009 were primarily driven by reductions in payroll related costs and the impact of changes in foreign exchange rates offset partially by higher levels of performance-based variable pay.
Corporate G&A includes Charges of approximately $26 million, $17 million and $15 million in 2009, 2008 and 2007, respectively. After considering these charges, corporate G&A expenses increased by $4 million in 2009 and $40 million in 2008. The change in 2009 primarily reflects increased depreciation expense and higher levels of performance-based variable pay. The increase in depreciation expense resulted primarily from the capital lease associated with our new corporate campus as well as the company’s implementation of a new enterprise software system which was placed in service at the beginning of the third quarter of 2009. The increases were offset partially by reduction in legal and professional fees as well as lower payroll-related costs. Corporate G&A for 2009 also includes approximately $9 million from the effect of accelerated vesting of certain employee stock grants following approval of the redeemable preferred stock issuance. Change in control features in certain employment contracts could result in additional G&A expenses in future periods if covered executives are involuntarily, or in certain cases, voluntarily terminated. The 2008 increase primarily reflects higher performance-based variable pay, costs for professional and legal fees and approximately $7 million of severance charges related to a voluntary exit incentive program for certain corporate employees.
Gain on Sale of Building
In December 2006, in connection with a decision to move to a new, leased, headquarters facility, we sold our corporate campus and entered into a leaseback agreement pending completion of the new facility. The sale resulted in a gain of approximately $21 million recognized in 2006 and $15 million deferred over the leaseback period. We recognized approximately $7 million in amortization of the deferred gain on the sale during both 2008 and 2007. This amortization largely offset the rent expense during the leaseback period. During 2007, we entered into a longer-term lease on our current corporate campus, and we moved into this facility during the fourth quarter of 2008.
Other Income and Expense
| (Dollars in millions) | 2009 | 2008 | 2007 | |||||||||
| Interest income |
$ | 2.4 | $ | 10.0 | $ | 9.4 | ||||||
| Interest expense |
(65.6 | ) | (68.3 | ) | (63.1 | ) | ||||||
| Miscellaneous income, net |
17.1 | 23.7 | 27.8 | |||||||||
Interest expense decreased for 2009 compared to 2008, reflecting a reduction in interest expense on borrowings as we did not borrow under our asset based credit facility during the second half of 2009. Partially offsetting this positive factor was increased interest expense resulting from the amortization of debt issuance costs related to our asset based credit facility and the capital lease associated with our corporate campus. The decrease in interest income during 2009 resulted primarily from lower investment rates. The increase in interest expense in 2008 was driven by additional capital leases and a higher level of short-term borrowings throughout the year.
Our net miscellaneous income consists of our earnings of joint venture investments, royalty income, gains and losses related to foreign exchange transactions, and realized gains and impairments of other investments. The majority of miscellaneous income is attributable to equity in earnings from our joint venture in Mexico, Office Depot de Mexico. The decrease in 2009 primarily reflects lower joint venture earnings resulting from changes in foreign currency exchange rates. This decrease was partially offset by the impact of foreign currency transactions as we recognized lower foreign currency losses in 2009, compared to 2008. The decrease in 2008 reflects foreign currency losses offset partially by higher joint venture earnings.
29
Table of Contents
Income Taxes
| (Dollars in millions) | 2009 | 2008 | 2007 | ||||||
| Income tax expense (benefit) |
$ | 287.6 | $ (98.6 | ) | $ | 63.0 | |||
| Effective income tax rate* |
(92)% | 6% | 14% | ||||||
| * | Income taxes as a percentage of earnings (loss) before income taxes. |
During 2009, the company recognized income tax expense of $287.6 million. The expense primarily reflects valuation allowances recorded in the third quarter totaling $321.6 million, with $279.1 million related to domestic deferred tax assets and $42.5 million related to foreign deferred tax assets. The establishment of valuation allowances and development of projected annual effective tax rates requires significant judgment and is impacted by various estimates. Both positive and negative evidence, as well as the objectivity and verifiability of that evidence, is considered in determining the appropriateness of recording a valuation allowance on deferred tax assets. An accumulation of recent pre-tax losses is considered strong negative evidence in that evaluation. Because of the downturn in our performance during this recessionary period, as well as the significant restructuring activities and charges we have taken in response, during the third quarter of 2009 the cumulative pre-tax results for the past 36 months of certain taxing jurisdictions reached or nearly reached loss positions. While we have seen signs that cause us to be optimistic about the future, we are likely to be adding to the accumulated pre-tax losses in these jurisdictions before the projected return to profitability of these operations. We may be able to use some of these assets to reduce taxes payable in coming quarters or by carrying back to prior years. Further, we anticipate being able to remove the valuation allowances in future periods when positive evidence outweighs the negative evidence from the relevant look-back period. However, the actual timing and amount of potential removal of the valuation allowances by jurisdiction currently cannot be reliably estimated. The short-term consequence of being unable to record deferred tax benefits will cause our effective tax rate to be volatile, possibly changing significantly from period to period.
The decrease in the effective income tax rate during 2008 reflects the largely non-deductible nature of the goodwill impairment charge and non-deductible foreign interest, as well as the impact of a $47 million increase in deferred tax asset valuation allowances resulting from the change to loss positions in certain jurisdictions. The effective tax rate for 2007 reflects the impact from 2007 discrete benefits and valuation allowance changes, as well as the impact from a shift in the mix of pretax income, reflecting a higher proportion of international earnings taxed at lower rates. The 2007 discrete items include a benefit of approximately $10 million from the reversal of an accrual for uncertain tax positions and a local jurisdiction ruling that secured certain prior year filing positions. Additionally in 2007, because of a jurisdictional restructuring, changes in foreign country tax law and certain book to tax return adjustments, we recognized tax benefits totaling $48 million, primarily related to eliminations of valuation allowances on deferred tax assets.
In general, the effective tax rate in future periods can be affected by variability in our mix of domestic and foreign income, the variance of actual results to projected results, utilization of deferred tax assets, the statutory tax rates in various jurisdictions, changes in the rules related to accounting for income taxes, outcomes from tax audits that regularly are in process and our assessment of the need for accruals for uncertain tax positions.
The company periodically seeks to limit future tax expense by entering into tax ruling agreements with international jurisdictions. As part of the process of obtaining these tax ruling agreements, it is possible that the company may have to concede significant tax attributes in the negotiating process which may increase tax expense. Such a concession should not have a near-term cash tax impact.
30
Table of Contents
LIQUIDITY AND CAPITAL RESOURCES
Liquidity
At December 26, 2009, we had approximately $660 million in cash and equivalents and another $726 million available under our asset based credit facility based on the December borrowing base certificate. We consider our resources adequate to satisfy our cash needs at least over the next twelve months. We anticipate that market conditions will continue to be challenging through 2010, and in response, we are focused on maximizing cash flow. We have made strong progress towards reducing inventory levels and remain focused on accelerating the collection of our accounts receivable balances. During the first half of 2009, we entered into sale-leaseback transactions and sales of certain assets, and during the third quarter of 2009, we entered into a committed factoring arrangement in France that allows us to sell certain foreign trade receivables to a third party which provides up to approximately $85 million additional liquidity, depending on the level of eligible receivables and currency exchange rates. As of December 26, 2009, we had not sold any receivables under this agreement.
We hold cash throughout our service areas, but we principally manage our cash through regional headquarters in North America and Europe. We may move cash between those regions from time to time through short-term transactions and have used these cash transfers at the end of fiscal quarterly periods to pay down borrowings outstanding under our credit facilities. Although such transfers and debt repayments took place during the first three quarters of 2007, we completed a non-taxable distribution to the U.S. in the amount of $220 million during the fourth quarter of 2007, thereby permanently repatriating this cash. Additional distributions, including distributions of foreign earnings or changes in long-term arrangements could result in significant additional U.S. tax payments and income tax expense. Currently, there are no plans to change our expectation of foreign earnings reinvestment or the long-term nature of our intercompany arrangements, though accounting impacts of any change in these classifications would be recognized in the period of the change.
On September 26, 2008, the company entered into a Credit Agreement (the “Agreement”) with a group of lenders, which provides for an asset based, multi-currency revolving credit facility (the “Facility”) of up to $1.25 billion. The amount that can be drawn on the Facility at any given time is determined based on percentages of certain accounts receivable, inventory and credit card receivables (the “Borrowing Base”). At December 26, 2009, the company was eligible to borrow approximately $872 million of the Facility. The Facility includes a sub-facility of up to $250 million which is available to certain of the company’s European subsidiaries (the “European Borrowers”). Certain of the company’s domestic subsidiaries (the “Domestic Guarantors”) guaranty the obligations under the Facility. The Agreement also provides for a letter of credit sub-facility of up to $400 million. All loans borrowed under the Agreement may be borrowed, repaid and reborrowed from time to time until September 26, 2013 (or, in the event that the company’s existing 6.25% Senior Notes are not repaid, then February 15, 2013), on which date the Facility matures.
All amounts borrowed under the Facility, as well as the obligations of the Domestic Guarantors, are secured by a lien on the company’s and such Domestic Guarantors’ accounts receivables, inventory, cash and deposit accounts. All amounts borrowed by the European Borrowers under the Facility are secured by a lien on such European Borrowers’ accounts receivable, inventory, cash and deposit accounts, as well as certain other assets. At the company’s option, borrowings made pursuant to the Agreement bear interest at either, (i) the alternate base rate (defined as the higher of the Prime Rate (as announced by the Agent) and the Federal Funds Rate plus 1/2 of 1%) or (ii) the Adjusted LIBOR Rate (defined as the LIBOR Rate as adjusted for statutory revenues) plus, in either case, a certain margin based on the aggregate average availability under the Facility. The Agreement also contains representations, warranties, affirmative and negative covenants, and default provisions which are conditions precedent to borrowing. The most significant of these covenants and default provisions include a capital expenditure limitation of $500 million in any fiscal year and limitations in certain circumstances on acquisitions, dispositions, share repurchases and the payment of cash dividends. The cash dividend restrictions are based on the then-current and proforma fixed charge coverage ratio and borrowing availability at the point of consideration. The company has never declared or paid cash dividends on its common stock. The company was in compliance with all financial covenants at December 26, 2009. The Facility also includes provisions whereby if the global availability is less than
31
Table of Contents
$218.8 million, or the European availability is below $37.5 million, the company’s cash collections go first to the agent to satisfy outstanding borrowings. Further, if total availability falls below $187.5 million, a fixed charge coverage ratio test is required which, based on current forecasts, could effectively eliminate additional borrowing under the Facility. Any event of default that is not cured within the permitted period, including non-payment of amounts when due, any debt in excess of $25 million becoming due before the scheduled maturity date, or the acquisition of more than 40% of the ownership of the company by any person or group, could result in a termination of the Facility and all amounts outstanding becoming immediately due and payable.
At December 26, 2009, we had approximately $726 million of available credit under our asset based credit facility (the “Facility”). At December 26, 2009, there were no borrowings outstanding under the Facility and there were letters of credit outstanding under the Facility totaling approximately $146 million. An additional $0.7 million of letters of credit were outstanding under separate agreements. Average borrowings under the Facility from December 27, 2008 to June 27, 2009 were approximately $180 million at an average interest rate of 3.92%. We did not borrow under our asset based credit facility during the second half of 2009.
In addition to our borrowings under the Facility, we had short-term borrowings of $44.1 million. These borrowings primarily represent outstanding balances under various local currency credit facilities for our international subsidiaries that had an effective interest rate at the end of the year of approximately 2.35%. The majority of these short-term borrowings represent outstanding balances on uncommitted lines of credit, which do not contain financial covenants.
In December 2008, the company’s credit rating was downgraded which provided the counterparty to the company’s private label credit card program the right to terminate the agreement and require the company to repurchase the outstanding balance credit card receivables. The company and the counterparty subsequently amended the agreement to permanently eliminate this provision. The company maintains a $25 million letter of credit in support of this agreement.
Redeemable Preferred Stock Issuance
On June 23, 2009, we issued 274,596 shares of 10.00% Series A Redeemable Convertible Participating Perpetual Preferred Stock (“Series A Preferred Stock”), and 75,404 shares of 10.00% Series B Redeemable Conditional Convertible Participating Perpetual Preferred Stock (“Series B Preferred Stock” together the “Preferred Stock”) for net proceeds of approximately $325 million. Each share of Preferred Stock has an initial liquidation preference of $1,000 and the conversion rate of $5.00 per common share allow the two series of preferred stock to be initially convertible into 70 million shares of common stock. The conversion rate is subject to anti-dilution adjustments. In compliance with the rules of the New York Stock Exchange, Office Depot requested shareholder approval for the conversion and voting rights for these shares. Approval was received at the shareholder meeting on October 14, 2009.
Dividends on the Preferred Stock are payable quarterly and will be paid in-kind or, in cash, only to the extent that the company has funds legally available for such payment and a cash dividend is declared by the company’s board of directors and allowed by credit facilities. The company’s asset based credit facility currently limits the ability to make such payments. The company may seek modifications to the credit facility to allow for dividends to be paid in cash. If not paid in cash, an amount equal to the cash dividend due will be added to the liquidation preference and measured for accounting purposes at fair value. The dividend rate will be reduced to (a) 7.87% if, at any time after June 23, 2012, the closing price of the company’s common stock is greater than or equal to $6.62 per share for a period of 20 consecutive trading days, or (b) 5.75% if, at any time after June 23, 2012, the closing price of the company’s common stock is greater than or equal to $8.50 per share for a period of 20 consecutive trading days.
The board of directors approved dividends equal to the stated dividend rate on the Preferred Stock for periods through January 1, 2010. The stated-rate dividend has been added to the liquidation preference of the respective Series A and Series B Preferred Stock, in lieu of making a cash payment. This $18.1 million increase in liquidation preference in lieu of a cash payment has no impact on the Consolidated Statements of Cash Flows.
32
Table of Contents
For accounting purposes, the company measured the fair value of the dividend using a binomial simulation model that captured the intrinsic value of the underlying common stock on the declaration date and the option value of the shares and future dividends. The dividend resulted in $30.5 million in the aggregate, which includes the $18.1 million increase in liquidation preference, being charged against additional paid-in capital and added to the Preferred Stock carrying value as of December 26, 2009.
After the third anniversary of issuance the Preferred Stock is redeemable, in whole or in part, at the option of the company, subject to the right of the holder to first convert the Preferred Stock the company proposes to redeem. The redemption price is initially 107% of the liquidation preference amount and decreases by 1% each year until reaching 100% after June 23, 2019. At any time after June 23, 2011, if the closing price of the common stock is greater than or equal to $9.75 per share for a period of 20 consecutive trading days, the Preferred Stock is redeemable at 100% of the liquidation preference amount, in whole or in part, at the option of the company, subject to the right of the holder to first convert the Preferred Stock the company proposes to redeem. The Preferred Stock is redeemable at the option of the holder at 101% of the liquidation preference in the event of certain fundamental change provisions (as defined in the Certificate of Designations for each series), including sale, bankruptcy, or delisting of our common stock.
Cash Flows
Cash provided by (used in) our operating, investing and financing activities is summarized as follows:
| (Dollars in millions) | 2009 | 2008 | 2007 | ||||||||
| Operating activities |
$ | 296.4 | $ | 468.3 | $ | 411.4 | |||||
| Investing activities |
25.3 | (338.7 | ) | (372.5 | ) | ||||||
| Financing activities |
173.3 | (186.3 | ) | 7.9 | |||||||
Operating Activities
The decrease in net cash provided by operating activities in 2009 primarily reflects a reduction in business performance related to weak economic conditions. Depreciation and amortization decreased by approximately $30 million year over year primarily reflecting the impairment of fixed and intangible assets recorded in the fourth quarter of 2008. Although we did experience lower levels of bad debt expense, the decrease in charges for losses on inventories and receivables resulted primarily from lower charges for shrinkage in 2009, compared to 2008. As previously discussed, the company recognized valuation allowances of approximately $322 million related to deferred tax assets during the third quarter of 2009. This represents a non-cash expense, and therefore, it has been added back to our net loss in the Consolidated Statements of Cash Flows to arrive at cash provided by operating activities. Additionally, net cash provided by operating activities includes the impact of non-cash Charges and increases in accruals for severance and lease obligations. We received dividends from our joint venture in Mexico of approximately $14 million in 2009. Working capital was a source of cash of approximately $207 million and $187 million in 2009 and 2008, respectively. The source in 2009 was driven by our continued focus on collecting accounts receivable balances and controlling our inventory levels. Working capital is influenced by a number of factors, including the aging of inventory and timing of vendor payments. The timing of payments is subject to variability during the year depending on a variety of factors, including the flow of goods, credit terms, timing of promotions, vendor production planning, new product introductions and working capital management. For our accounting policy on cash management, see Note A of the Notes to Consolidated Financial Statements. The change in cash flows from operating activities during 2008 reflects improvement in working capital that was significantly offset by a decrease in business performance.
Investing Activities
We invested $131 million, $330 million and $461 million in capital expenditures during 2009, 2008 and 2007, respectively. The 2009 activity primarily includes investments in information technology and distribution network infrastructure costs. In 2008, capital expenditures also related to the opening, relocating and remodeling
33
Table of Contents
of retail stores in North America and expenditures related to our new corporate headquarters facility. In response to the global economic crisis, we significantly reduced our capital expenditures in 2009. As the economy improves, we plan to increase capital expenditures accordingly. We currently estimate that total capital expenditures will be approximately $200 million in 2010 for activities such as new retail stores, investments in our distribution network and ongoing maintenance across all Divisions.
Proceeds from the disposition of assets in 2009, 2008 and 2007 include proceeds from sale-leaseback transactions of $116 million, $67 million and $64 million, respectively. In 2009, we also completed the sale of an asset previously classified as a capital lease, resulting in proceeds of approximately $29 million. Payments to satisfy the existing capital lease obligation are included in the financing section of our Consolidated Statement of Cash Flows. The realized gains on the sale-leaseback transactions are being amortized over the lease terms, and the non-cash losses are reflected as other asset impairments on our Consolidated Statements of Operations. During 2008, we also purchased certain non-operating assets for approximately $39 million. We sold certain of these non-operating assets during the year. We placed restricted cash on deposit in the amount of $6 million and $18 million, respectively, for transactions that were pending at the end of 2008 and 2007.
During 2008, we acquired a majority ownership position in businesses in India and Sweden. The company has the right to acquire or may be required to purchase some or all of the minority interest shares of these businesses at various points over the next year. Also during 2008, we acquired under previously existing put options all remaining minority interest shares of our joint ventures in Israel and China. During 2007, we acquired a Canada-based office products delivery company. Additionally in both 2008 and 2007, we funded previously accrued acquisition-related payments for former owners of entities acquired in 2006.
Financing Activities
Net cash provided by financing activities totaled $173 million compared to a use of cash of $186 million in 2008. The source in 2009 resulted from our issuance of redeemable preferred stock during the second quarter. As previously discussed, we completed the $350 million issuance of redeemable preferred stock on June 23, 2009. These proceeds are shown net of fees paid of approximately $25 million on the transaction during the period. Uses of cash during 2009 period resulted from repayments of borrowings on our asset based credit facility, which totaled $139 million, and $37 million in capital lease payments. Also, during 2009, we incurred approximately $19 million in debt as a result of a land sale-leaseback that was treated as a financing transaction as well as approximately $5 million of other short-term borrowings. Net cash used in financing activities in 2008 primarily resulted from net repayments of short-term borrowings under our previously existing revolving credit facility. At the end of 2007, borrowings under that facility totaled approximately $235 million, all of which was repaid during 2008. This revolving credit facility was replaced with our asset based credit facility during the third quarter of 2008, which had an outstanding balance of approximately $139 million at the end of 2008. In conjunction with our asset based credit facility, we incurred debt issuance costs of approximately $41 million in 2008. In addition to repayments on the revolving credit facility, we also repaid certain other borrowings related to our international subsidiaries and made payments on capital leases. Net cash provided by financing activities in 2007 resulted from higher levels of short-term borrowings to support our working capital needs.
The board of directors has historically authorized a series of common stock repurchase plans, the latest of which is a $500 million authorization in 2007. Under a previously approved plan, we purchased 5.7 million shares at a cost of approximately $200 million in 2007. We did not purchase any shares of our common stock during 2008 or 2009, and as of December 26, 2009 the entire $500 million remained available for additional repurchases under the most recent board approved plan. However, common stock repurchases are currently prohibited under our asset based credit facility and, in certain circumstances, require prior approval under our Preferred Stock agreements. Proceeds from issuance of common stock under our employee related plans totaled $29 million in 2007. Additionally, upon the issuance of certain restricted stock awards, employees surrendered shares to the company equal to approximately $11 million in 2007 in exchange for our settlement of their taxes due on these shares.
34
Table of Contents
Off-Balance Sheet Arrangements
We maintain a merchant services agreement with a third-party financial services company related to our private label credit card program. Under the terms of this agreement, we have recourse for most private label credit card receivables transferred to the third party. This arrangement is a component of our overall liquidity resources, which we consider adequate to satisfy our cash needs at least over the next twelve months. We record an estimate for losses on these receivables as a liability in our Consolidated Balance Sheets. This liability totaled approximately $16 million and $23 million at December 26, 2009 and December 27, 2008, respectively. The total outstanding balance of credit card receivables transferred was approximately $148 million and $184 million at December 26, 2009 and December 27, 2008, respectively. Additionally, during the third quarter of 2009, we entered into a committed accounts receivable factoring arrangement in France that allows us to sell certain foreign trade receivables to a third party. As of December 26, 2009, we had not sold any receivables under this agreement.
As of December 26, 2009, we had no off-balance sheet arrangements, other than the agreements described in the preceding paragraph and operating leases, which are included in the table below.
Contractual Obligations
The following table summarizes our contractual cash obligations at December 26, 2009, and the effect such obligations are expected to have on liquidity and cash flow in future periods:
| Payments Due by Period | |||||||||||||||
| (Dollars in millions) | Total | Less than 1 year |
1 - 3 years | 4 - 5 years | After 5 years | ||||||||||
| Contractual Obligations |
|||||||||||||||
| Long-term debt obligations (1) |
$ | 531.9 | $ | 27.4 | $ | 54.6 | $ | 429.0 | $ | 20.9 | |||||
| Short-term borrowings and other (2) |
44.1 | 44.1 | — | — | — | ||||||||||
| Capital lease obligations (3) |
411.4 | 32.4 | 58.8 | 56.2 | 264.0 | ||||||||||
| Operating lease obligations (4) |
2,911.6 | 524.7 | 836.5 | 612.0 | 938.4 | ||||||||||
| Purchase obligations (5) |
108.4 | 51.4 | 55.2 | 1.5 | 0.3 | ||||||||||
| Other liabilities (6) |
11.3 | 11.3 | — | — | — | ||||||||||
| Total contractual cash obligations |
$ | 4,018.7 | $ | 691.3 | $ | 1,005.1 | $ | 1,098.7 | $ | 1,223.6 | |||||
| (1) | Long-term debt obligations consist primarily of our $400 million senior notes and the associated contractual interest payments. Also included in this amount are the expected payments (principal and interest) on certain long-term debt obligations related to our international subsidiaries. |
| (2) | Short-term borrowings consist of amounts outstanding under subsidiary lines of credit. |
| (3) | The present value of these obligations are included on our Consolidated Balance Sheets. See Note F of the Notes to Consolidated Financial Statements for additional information about our capital lease obligations. |
| (4) | The operating lease obligations presented reflect future minimum lease payments due under the non-cancelable portions of our leases as of December 26, 2009. Our operating lease obligations are described in Note H of the Notes to Consolidated Financial Statements. In the table above, sublease income is distributed by period. |
| (5) | Purchase obligations include all commitments to purchase goods or services of either a fixed or minimum quantity that are enforceable and legally binding on us that meet any of the following criteria: (1) they are non-cancelable, (2) we would incur a penalty if the agreement was cancelled, or (3) we must make specified minimum payments even if we do not take delivery of the contracted products or services. If the obligation is non-cancelable, the entire value of the contract is included in the table. If the obligation is cancelable, but we would incur a penalty if cancelled, the dollar amount of the penalty is included as a purchase obligation. If we can unilaterally terminate the agreement simply by providing a certain number of days notice or by |
35
Table of Contents
| paying a termination fee, we have included the amount of the termination fee or the amount that would be paid over the “notice period.” As of December 26, 2009, purchase obligations include television, radio and newspaper advertising, sports sponsorship commitments, telephone services, certain fixed assets and software licenses and service and maintenance contracts for information technology. Contracts that can be unilaterally terminated without a penalty have not been included. |
| (6) | Our Consolidated Balance Sheet as of December 26, 2009 includes $654.9 million classified as “Deferred income taxes and other long-term liabilities.” This caption primarily consists of our net long-term deferred income taxes, the unfunded portion of our pension plan, deferred lease credits, liabilities under our deferred compensation plans, and accruals for uncertain tax positions. These liabilities have been excluded from the above table as the timing and/or the amount of any cash payment is uncertain. As of December 26, 2009, accruals for uncertain tax positions, net of items offset by net operating losses, totaled approximately $112.5 million. See Note G of the Notes to Consolidated Financial Statements for additional information regarding our deferred tax positions and accruals for uncertain tax positions and Note I for a discussion of our employee benefit plans, including the pension plan and the deferred compensation plan. The table above includes scheduled, acquisition-related payments. |
In addition to the above, we have outstanding letters of credit totaling $147 million at December 26, 2009.
CRITICAL ACCOUNTING POLICIES
Our consolidated financial statements have been prepared in accordance with accounting principles generally accepted in the United States of America. Preparation of these statements requires management to make judgments and estimates. Some accounting policies have a significant impact on amounts reported in these financial statements. A summary of significant accounting policies can be found in Note A in the Notes to Consolidated Financial Statements. We have also identified certain accounting policies that we consider critical to understanding our business and our results of operations and we have provided below additional information on those policies.
Vendor arrangements — Our inventory purchases from vendors are generally under evergreen arrangements with periodic updates or annual negotiated agreements. Many of these arrangements require the vendors to make payments to us or provide credits to be used against purchases if and when certain conditions are met. We generally refer to these arrangements as “vendor programs,” and they typically fall into two broad categories, with some underlying sub-categories. The largest category is volume-based rebates. Generally, our product costs per unit decline as higher volumes of purchases are reached. Many of our vendor agreements provide that we pay higher per unit costs prior to reaching a predetermined tier, at which time the vendor rebates the per unit differential on past purchases, and also applies the lower cost to future purchases until the next milestone is reached. Current accounting rules provide that companies with a sound basis for estimating their full year purchases, and therefore the ultimate rebate level, can use that estimate to value inventory and cost of goods sold throughout the year. We believe our history of purchases with many vendors provides us with a sound basis for our estimates. If the anticipated volume of purchases is not reached, however, or if we form the belief at any given point in the year that it is not likely to be reached, cost of goods sold and the remaining inventory balances are adjusted to reflect that change in our outlook. We review sales projections and related purchases against vendor program estimates at least quarterly and adjust these balances accordingly. During the fourth quarter of 2007, it became apparent that we were not going to reach the anticipated full year purchase levels and we reduced vendor program income recognized in that period by approximately $30 million. No similar adjustments were required in any quarter in 2008 or 2009. The company has reached agreements with some vendors on terms that set future prices based on negotiation and recognition of historical rebate levels such that the volume-based tiers discussed above have been eliminated. An increase in these arrangements could reduce the impact of volume-based estimates.
The second broad category of arrangements with our vendors is event-based programs. These arrangements can take many forms, including advertising support, special pricing offered by certain of our vendors for a limited time, payments for special placement or promotion of a product, reimbursement of costs incurred to launch a
36
Table of Contents
vendor’s product, and various other special programs. These payments are classified as a reduction of costs of goods sold or inventory, as appropriate for the program. Some arrangements may meet the specific, incremental, identifiable cost criteria that allow for direct operating expense offset, but such arrangements are not significant. Additionally, we receive payments from vendors for certain of our activities that lower the vendors’ cost to ship their product to our facilities.
Vendor rebates are recognized throughout the year based on judgment and estimates and amounts due from vendors are generally settled throughout the year based on purchase volumes. The final amounts due from vendors are generally known soon after year-end. Substantially all vendor program receivables outstanding at the end of the year are settled within the three months immediately following year-end. We believe that our historic collection rates of these receivables provide a sound basis for our estimates of anticipated vendor payments throughout the year.
Inventory valuation — Inventories are valued at the lower of cost or market value. We monitor active inventory for excessive quantities and slow-moving items and record adjustments as necessary to lower the value if the anticipated realizable amount is below cost. We also identify merchandise that we plan to discontinue or have begun to phase out and assess the estimated recoverability of the carrying value. This includes consideration of the quantity of the merchandise, the rate of sale, and our assessment of current and projected market conditions. If necessary, we record a charge to reduce the carrying value of this merchandise to our estimate of the lower of cost or realizable amount. Additional promotional activities may be initiated and markdowns may be taken as considered appropriate until the product is sold or otherwise disposed. Estimates and judgments are required in determining what items to stock and at what level, and what items to discontinue and how to value them prior to sale.
We also recognize an expense in cost of sales for our estimate of physical inventory loss from theft, short shipment and other factors — referred to as inventory shrink. During the year, we adjust the estimate of our shrink rate accrual following on-hand adjustments and our physical inventory results. These changes in estimates may result in volatility within the year or impact comparisons to other periods.
During 2008, we lowered our inventory levels to lessen working capital requirements and reduce obsolescence risk. Also, following a strategic review of our business in December 2008, we decided to close certain underperforming stores in North America. To facilitate these closures, we contracted with a liquidation firm that guaranteed the amount to be realized for the inventory in those stores. During the fourth quarter of 2008, we recognized a $15 million Charge to adjust that inventory to the net contracted value. That adjustment had no impact on the remaining inventory in other stores or in our supply chain. During 2009, we completed the closure of stores in North America and Japan and certain distribution centers. In conjunction with these closures, we recognized an additional $13 million Charge to facilitate inventory liquidation. The company has no current plans for significant additional closures that could result in similar charges, though some level of closures should be anticipated each year.
Closed store accruals and asset impairments — We regularly assess the performance of each retail store against historic patterns and projections of future profitability. These assessments are based on management’s estimates for sales levels, gross margin attainments, and cash flow generation. If, as a result of these evaluations, management determines that a store will not achieve certain operating performance targets, we may decide to close the store. When a store is no longer used for operating purposes, we recognize a liability for the remaining costs related to the property, reduced by an estimate of any sublease income. The calculation of this liability requires us to make assumptions and to apply judgment regarding the remaining term of the lease (including vacancy period), anticipated sublease income, and costs associated with vacating the premises. With assistance from independent third parties to assess market conditions, we periodically review these judgments and estimates and adjust the liability accordingly. In conjunction with the strategic review initiated in the fourth quarter of 2008, we closed 126 stores in North America and 27 stores in Japan. The lease-related costs associated with these closures, which totaled approximately $89 million and $6 million in 2009 and 2008, respectively, were recorded as the facilities closed. These costs were calculated based on our assumption of an extended vacancy period, three years in most cases, reflecting the slow economic conditions and the estimated sublease rates available in
37
Table of Contents
the future. These commitments with no economic benefit to the company were discounted at the credit-adjusted discount rate at the time of each location closure. Future fluctuations in the economy and the market demand for commercial properties could result in material changes in this liability. Costs associated with facility closures are included in store and warehouse operating and selling expenses in our Consolidated Statements of Operations. Because the 2008 and 2009 facility closures are considered part of a company-wide business review, the accretion of the discounted lease liability and potential future positive and negative adjustments to the recorded amounts from settlements or changes in market conditions will be recognized at the corporate level, outside of the determination of Division operating profit. Residual costs and benefits of closures from other periods are included in Division operating profit.
In addition to the decision about whether or not to close a store, store assets are regularly reviewed for recoverability of their carrying amounts. The recoverability assessment requires judgment and estimates of a store’s future cash flows. Our impairment analysis builds a cash flow model at the individual store level, beginning with recent store performance and trending the anticipated future results based on chain-wide and individual store initiatives. If the anticipated cash flows of a store cannot support the carrying amount of the store’s assets, an impairment charge is recorded to operations as a component of store and warehouse operating and selling expenses. To the extent that management’s estimates of future performance are not realized, future assessments could result in material impairment charges. During 2008, we recognized impairment charges of approximately $98 million, which were primarily driven by the significant economic downturn.
Income taxes — Income tax accounting requires management to make estimates and apply judgments to events that will be recognized in one period under rules that apply to financial reporting and in a different period in our tax returns. In particular, judgment is required when estimating the value of future tax deductions, tax credits, and the realizability of net operating loss carryforwards (NOLs), as represented by deferred tax assets. When we believe the realization of all or a portion of a deferred tax asset is not likely, we establish a valuation allowance. Changes in judgments that increase or decrease these valuation allowances impact current earnings.
Because of the downturn in our performance during this recessionary period, as well as the significant restructuring activities and charges we have taken in response, we established valuation allowances totaling approximately $322 million during 2009. The charge to establish the valuation allowance followed the third quarter 2009 condition of reaching or nearly reaching a cumulative 36 month cumulative loss position in two taxing jurisdictions. Judgment is required in projecting when operations will be sufficiently positive to allow a conclusion that utilization of the deferred tax assets will once again be more likely than not. Positive performance in subsequent periods and projections of future positive performance will need to be evaluated against this existing negative evidence. Our effective tax rate in future periods may be positively or negatively impacted by changes in related judgments or pre-tax operations. Deferred tax assets without valuation allowances remain in certain foreign tax jurisdictions.
In addition to judgments associated with valuation accounts, our current tax provision can be affected by our mix of income and identification or resolution of uncertain tax positions. Because income from domestic and international sources may be taxed at different rates, the shift in mix during a year or over years can cause the effective tax rate to change. We base our rate during the year on our best estimate of an annual effective rate, and update those estimates quarterly, with the cumulative effect of a change in the anticipated annual rate reflected in the tax provision of that period. Such changes can result in significant interim reporting volatility.
We file our tax returns based on our best understanding of the appropriate tax rules and regulations. However, complexities in the rules and our operations, as well as positions taken publicly by the taxing authorities may lead us to conclude that accruals for uncertain tax positions are required. We generally maintain accruals for uncertain tax positions until examination of the tax year is completed by the taxing authority, available review periods expire, or additional facts and circumstances cause us to change our assessment of the appropriate accrual amount.
38
Table of Contents
Preferred stock paid-in-kind dividends — In June 2009, we issued $350 million of redeemable preferred stock. The preferred stock carries a stated dividend of 10%, subject to future decreases in certain circumstances, and allows for payment in cash or an increase in the preferred stock’s liquidation preference. The company’s asset based credit facility includes provisions that currently limit the payment of cash dividends on any stock until the company’s fixed charge coverage ratio, as defined, is at least 1.25. This provision has precluded the company from considering payment in cash of the first two quarterly preferred stock dividends. The valuation for accounting purposes of the dividend paid in-kind requires significant judgment to determine the estimated fair value. The company has used a binomial simulation model to measure values of multiple possible outcomes of the various provisions in the agreements that could impact whether the dividend rate would change based on future stock price performance, whether the company would issue a notice to call the preferred shares and whether the holders would convert their preferred stock into common stock. While the fair value of preferred stock dividends paid in-kind has no standing in the contractual rights to liquidation preference of the preferred shareholders nor any cash impact on the company, it impacts the measurement of net income available to common shareholders and reduces earnings per share. Changes in the valuation assumptions such as the risk adjusted rate, stock price volatility and time to call or convert can impact the estimated fair value and therefore the amount reported as net income available to common shareholders and earnings pre share. However, the valuation is most sensitive to changes in the underlying common stock price. For example, a one dollar change in the common stock price from approximate recent levels, holding all other factors constant, could change the estimated quarterly fair value amount by approximately $2 million. This projected sensitivity would not be valid in many circumstances, is provided only for an order of magnitude impact and should not be relied upon for planning purposes. The company believes the model used to estimate fair value is reasonable and appropriate, but the reported dividend amount could change significantly in future periods based on changes in the underlying common stock price and the model inputs. The company may seek modification to its asset based credit facility to allow for preferred stock dividends to be paid in cash, which would eliminate these judgments and estimates for any dividend paid in cash.
SIGNIFICANT TRENDS, DEVELOPMENTS AND UNCERTAINTIES
Competitive Factors — Over the years, we have seen continued development and growth of competitors in all segments of our business. In particular, mass merchandisers and warehouse clubs, as well as grocery and drugstore chains, have increased their assortment of home office merchandise, attracting additional back-to-school customers and year-round casual shoppers. Warehouse clubs have expanded beyond their in-store assortment by adding catalogs and web sites from which a much broader assortment of products may be ordered. We also face competition from other office supply stores that compete directly with us in numerous markets. This competition is likely to result in increased competitive pressures on pricing, product selection and services provided. Many of these retail competitors, including discounters, warehouse clubs, and drug stores and grocery chains, carry basic office supply products. Some of them also feature technology products. Many of them may price certain of these offerings lower than we do, but they have not shown an indication of greatly expanding their somewhat limited product offerings at this time. This trend towards a proliferation of retailers offering a limited assortment of office products is a potentially serious trend in our industry that could impact our results.
We have also seen growth in competitors that offer office products over the internet, featuring special purchase incentives and one-time deals (such as close-outs). Through our own successful internet and business-to-business web sites, we believe that we have positioned ourselves competitively in the e-commerce arena.
Another trend in our industry has been consolidation, as competitors in office supply stores and the copy/print channel have been acquired and consolidated into larger, well-capitalized corporations. This trend towards consolidation, coupled with acquisitions by financially strong organizations, is potentially a significant trend in our industry that could impact our results.
We regularly consider these and other competitive factors when we establish both offensive and defensive aspects of our overall business strategy and operating plans.
39
Table of Contents
Economic Factors — Our customers in the North American Retail Division and many of our customers in the North American Business Solutions Division are predominantly small and home office businesses. Accordingly, these customers may continue to curtail their spending in reaction to macroeconomic conditions, such as changes in the housing market and commodity costs, higher credit costs, credit availability and other factors. The downturn in the global economy experienced over the past two years negatively impacted our sales and profits.
Liquidity Factors — Historically, we have generated positive cash flow from operating activities and have had access to broad financial markets that provide the liquidity we need to operate our business. Together, these sources have been used to fund operating and working capital needs, as well as invest in business expansion through new store openings, capital improvements and acquisitions. However, due to the downturn in the global economy our operating results have diminished. In June 2009, we issued $350 million of redeemable preferred stock and in September 2008, we entered into a $1.25 billion asset based credit facility to provide liquidity. Continued distress in the financial markets has resulted in significant volatility in the capital markets and diminished liquidity and credit availability. There can be no assurance that our liquidity will not be adversely impacted by changes in the financial markets and the global economy. In addition, deterioration in our financial results could negatively impact our credit ratings. The tightening of the credit markets or a downgrade in our credit ratings could make it more difficult for us to access funds, to refinance our existing indebtedness, to enter into agreements for new indebtedness or to obtain funding through the issuance of securities.
MARKET SENSITIVE RISKS AND POSITIONS
The company has adopted an enterprise risk management process patterned after the principles set out by the Committee of Sponsoring Organizations (COSO) in 2004. Management utilizes a common view of exposure identification and risk management. A process is in place for periodic risk reviews and identification of appropriate mitigation strategies.
We have market risk exposure related to interest rates and foreign currency exchange rates. Market risk is measured as the potential negative impact on earnings, cash flows or fair values resulting from a hypothetical change in interest rates or foreign currency exchange rates over the next year. Interest rate changes on obligations may result from external market factors, as well as changes in our credit rating. We manage our exposure to market risks at the corporate level. The portfolio of interest-sensitive assets and liabilities is monitored and adjusted to provide liquidity necessary to satisfy anticipated short-term needs. Our risk management policies allow the use of specified financial instruments for hedging purposes only; speculation on interest rates or foreign currency rates is not permitted.
Interest Rate Risk
We are exposed to the impact of interest rate changes on cash equivalents and debt obligations. The impact on cash and short-term investments held at the end of 2009 from a hypothetical 10% decrease in interest rates would be a decrease in interest income of less than $1 million.
Market risk associated with our debt portfolio is summarized below:
| 2009 | 2008 | |||||||||||||||||
| (Dollars in thousands) | Carrying Value |
Fair Value |
Risk Sensitivity |
Carrying Value |
Fair Value |
Risk Sensitivity | ||||||||||||
| $400 million senior notes |
$ | 400,172 | $ | 345,966 | $ | 5,420 | $ | 400,278 | $ | 206,000 | $ | 8,380 | ||||||
| Asset based credit arrangement |
$ | — | $ | — | $ | — | $ | 139,098 | $ | 139,098 | $ | 696 | ||||||
The risk sensitivity of fixed rate debt reflects the estimated increase in fair value from a 50 basis point decrease in interest rates, calculated on a discounted cash flow basis. The sensitivity of variable rate debt reflects the possible increase in interest expense during the next period from a 50 basis point change in interest rates prevailing at year-end.
40
Table of Contents
Foreign Exchange Rate Risk
We conduct business in various countries outside the United States where the functional currency of the country is not the U.S. dollar. While our company sells directly or indirectly to customers in 51 countries, the principal operations of our International Division are in countries with Euro and British pound functional currencies. We continue to assess our exposure to foreign currency fluctuation against the U.S. dollar. As of December 26, 2009, a 10% change in the applicable foreign exchange rates would result in an increase or decrease in our operating profit of approximately $12 million.
Although operations generally are conducted in the relevant local currency, we also are subject to foreign exchange transaction exposure when our subsidiaries transact business in a currency other than their own functional currency. This exposure arises primarily from inventory purchases in a foreign currency. At December 26, 2009, the notional amount of foreign exchange forward contracts to hedge certain inventory exposures was $54 million. This amount was $67 million at its highest point during 2009. Also, from time-to-time, we enter into foreign exchange forward transactions to protect against possible changes in exchange rates related to scheduled or anticipated cash movements among our operating entities.
Generally, we evaluate the performance of our international businesses by focusing on the “local currency” results of the business, and not with regard to the translation into U.S. dollars, as the latter is impacted by external factors.
INFLATION AND SEASONALITY
Although we cannot determine the precise effects of inflation on our business, we do not believe inflation has had a material impact on our sales or the results of our operations. We consider our business to be only somewhat seasonal, with sales lower during the second quarter. Certain working capital components may build and recede during the year reflecting established selling cycles. Additionally, business cycles can and have impacted our operations and financial position when compared to other periods.
NEW ACCOUNTING STANDARDS
The Financial Accounting Standards Board (the “FASB”) has codified a single source of U.S. Generally Accepted Accounting Principles (GAAP), the Accounting Standards Codification™. Unless needed to clarify a point to readers, we will refrain from citing specific section references when discussing application of accounting principles or addressing new or pending accounting rule changes. There are no recently issued accounting standards that are expected to have a material effect on our financial condition, results of operations or cash flows.
FORWARD-LOOKING STATEMENTS
The Private Securities Litigation Reform Act of 1995 (the “Act”) provides protection from liability in private lawsuits for “forward-looking” statements made by public companies under certain circumstances, provided that the public company discloses with specificity the risk factors that may impact its future results. We want to take advantage of the “safe harbor” provisions of the Act. This Annual Report contains both historical information and other information that you can use to infer future performance. Examples of historical information include our annual financial statements and the commentary on past performance contained in our MD&A. While we have specifically identified certain information as being forward-looking in the context of its presentation, we caution you that, with the exception of information that is historical, all the information contained in this Annual Report should be considered to be “forward-looking statements” as referred to in the Act. Without limiting the generality of the preceding sentence, any time we use the words “estimate,” “project,” “intend,” “expect,” “believe,” “anticipate,” “continue” and similar expressions, we intend to clearly express that the information deals with possible future events and is forward-looking in nature. Certain information in our MD&A is clearly
41
Table of Contents
forward-looking in nature, and without limiting the generality of the preceding cautionary statements, we specifically advise you to consider all of our MD&A in the light of the cautionary statements set forth herein.
Forward-looking information involves future risks and uncertainties. Much of the information in this report that looks towards future performance of our company is based on various factors and important assumptions about future events that may or may not actually come true. As a result, our operations and financial results in the future could differ materially and substantially from those we have discussed in the forward-looking statements in this Report. Significant factors that could impact our future results are provided in Item 1A. Risk Factors included in our 2009 Annual Report on Form 10-K. Other risk factors are incorporated into the text of our MD&A, which should itself be considered a statement of future risks and uncertainties, as well as management’s view of our businesses.
Item 7A. Quantitative and Qualitative Disclosures About Market Risk.
See the information in the “Market Sensitive Risks and Positions” subsection of Management’s Discussion and Analysis of Financial Condition and Results of Operation set forth in Item 7 hereof.
Item 8. Financial Statements and Supplementary Data.
See Item 15(a) in Part IV.
Item 9. Changes in and Disagreements with Accountants on Accounting and Financial Disclosure.
None.
Item 9A. Controls and Procedures.
Disclosure Controls and Procedures
Based on management’s evaluation which included the participation of the company’s Chief Executive Officer (“CEO”), and Chief Financial Officer (“CFO”), as of December 26, 2009, the company’s CEO and CFO concluded that the company’s disclosure controls and procedures (as defined in Rules 13a-15(e) and 15d-15(e) under the Securities Exchange Act of 1934, as amended (“the Act”), were effective to provide reasonable assurance that information required to be disclosed by the company in reports that the company files or submits under the Act is recorded, processed, summarized and reported within the time periods specified in SEC rules and forms and that such information is accumulated and communicated to the company’s management, including the CEO and CFO, to allow timely decisions regarding required disclosures.
Changes in Internal Controls
There have been no changes in the company’s internal control over financial reporting that occurred during the company’s most recent fiscal year that have materially affected, or are reasonably likely to materially affect, the company’s internal control over financial reporting.
42
Table of Contents
Management’s Report on Internal Control Over Financial Reporting
Management of Office Depot is responsible for establishing and maintaining adequate internal control over financial reporting as defined in Rule 13a-15(f) under the Act. Our Internal Control structure is designed to provide reasonable assurance to our management and the board of directors regarding the reliability of financial reporting and the preparation and fair presentation of published financial statements.
Because of inherent limitations, internal control over financial reporting may not prevent or detect misstatements. Projections of any evaluation of effectiveness to future periods are subject to the risks that controls may become inadequate because of changes in conditions, or that the degree of compliance with the policies or procedures may deteriorate.
In evaluating our Internal Control, we used the criteria set forth by the Committee of Sponsoring Organizations of the Treadway Commission (COSO) in Internal Control — Integrated Framework. Based on our assessment, management has concluded that the company’s internal control over financial reporting was effective as of December 26, 2009.
Our internal control over financial reporting as of December 26, 2009, has been audited by Deloitte & Touche LLP, an independent registered public accounting firm, as stated in their report which is provided below.
43
Table of Contents
REPORT OF THE INDEPENDENT REGISTERED PUBLIC ACCOUNTING FIRM
To the Board of Directors and Stockholders of Office Depot, Inc.:
We have audited the internal control over financial reporting of Office Depot, Inc. and subsidiaries (the “Company”) as of December 26, 2009, based on criteria established in Internal Control — Integrated Framework issued by the Committee of Sponsoring Organizations of the Treadway Commission. The Company’s management is responsible for maintaining effective internal control over financial reporting and for its assessment of the effectiveness of internal control over financial reporting, included in the accompanying Management’s Report on Internal Control Over Financial Reporting. Our responsibility is to express an opinion on the Company’s internal control over financial reporting based on our audit.
We conducted our audit in accordance with the standards of the Public Company Accounting Oversight Board (United States). Those standards require that we plan and perform the audit to obtain reasonable assurance about whether effective internal control over financial reporting was maintained in all material respects. Our audit included obtaining an understanding of internal control over financial reporting, assessing the risk that a material weakness exists, testing and evaluating the design and operating effectiveness of internal control based on the assessed risk, and performing such other procedures as we considered necessary in the circumstances. We believe that our audit provides a reasonable basis for our opinion.
A company’s internal control over financial reporting is a process designed by, or under the supervision of, the company’s principal executive and principal financial officers, or persons performing similar functions, and effected by the company’s board of directors, management, and other personnel to provide reasonable assurance regarding the reliability of financial reporting and the preparation of financial statements for external purposes in accordance with generally accepted accounting principles. A company’s internal control over financial reporting includes those policies and procedures that (1) pertain to the maintenance of records that, in reasonable detail, accurately and fairly reflect the transactions and dispositions of the assets of the company; (2) provide reasonable assurance that transactions are recorded as necessary to permit preparation of financial statements in accordance with generally accepted accounting principles, and that receipts and expenditures of the company are being made only in accordance with authorizations of management and directors of the company; and (3) provide reasonable assurance regarding prevention or timely detection of unauthorized acquisition, use, or disposition of the company’s assets that could have a material effect on the financial statements.
Because of the inherent limitations of internal control over financial reporting, including the possibility of collusion or improper management override of controls, material misstatements due to error or fraud may not be prevented or detected on a timely basis. Also, projections of any evaluation of the effectiveness of the internal control over financial reporting to future periods are subject to the risk that the controls may become inadequate because of changes in conditions, or that the degree of compliance with the policies or procedures may deteriorate.
In our opinion, the Company maintained, in all material respects, effective internal control over financial reporting as of December 26, 2009, based on the criteria established in Internal Control — Integrated Framework issued by the Committee of Sponsoring Organizations of the Treadway Commission.
We have also audited, in accordance with the standards of the Public Company Accounting Oversight Board (United States), the consolidated financial statements as of and for the fiscal year ended December 26, 2009 of the Company and our report dated February 23, 2010 expressed an unqualified opinion on those financial statements.
/s/ DELOITTE & TOUCHE LLP
Certified Public Accountants
Boca Raton, Florida
February 23, 2010
None
44
Table of Contents
PART III
Item 10. Directors, Executive Officers and Corporate Governance.
Information concerning our executive officers is set forth in Item 1 of this Form 10-K under the caption “Executive Officers of the Registrant.”
Information with respect to our directors and the nomination process is incorporated herein by reference to information included in the Proxy Statement for our 2010 Annual Meeting of Shareholders.
Information regarding our audit committee and our audit committee financial experts is incorporated herein by reference to information included in the Proxy Statement for our 2010 Annual Meeting of Shareholders.
Information required by Item 405 of Regulation S-K is incorporated herein by reference to information included in the Proxy Statement for our 2010 Annual Meeting of Shareholders.
We have adopted a Code of Ethical Behavior in compliance with applicable rules of the SEC that applies to our principal executive officer, our principal financial officer, and our principal accounting officer or controller, or persons performing similar functions. A copy of the Code of Ethical Behavior is available free of charge on the “Investor Relations” section of our web site at www.offficedepot.com. We intend to satisfy any disclosure requirement under Item 5.05 of Form 8-K regarding an amendment to, or waiver from, a provision of this Code of Ethical Behavior by posting such information on our web site at the address and location specified above.
Item 11. Executive Compensation.
Information with respect to executive compensation is incorporated herein by reference to information included in the Proxy Statement for our 2010 Annual Meeting of Shareholders.
Item 12. Security Ownership of Certain Beneficial Owners and Management and Related Stockholder Matters.
Information with respect to security ownership of certain beneficial owners and management is incorporated herein by reference to information included in the Proxy Statement for our 2010 Annual Meeting of Shareholders.
Securities Authorized for Issuance Under Equity Compensation Plans
The following table provides information regarding compensation plans under which Office Depot equity securities are authorized for issuance as of December 26, 2009:
| Plan category |
Number of securities to be issued upon exercise of outstanding options, warrants, and rights (a) |
Weighted-average exercise price of outstanding options, warrants and rights (b) |
Number of securities remaining available for future issuance under equity compensation plans (c) | |||
| Equity compensation plans approved by security holders: |
||||||
| 2007 Long-Term Incentive Plan |
24,202,715 | $11.81 | 9,243,229 | |||
| Retirement Savings Plans |
Not Applicable | Not Applicable | Not Applicable | |||
| Equity compensation plans not approved by security holders: |
||||||
| None |
— | Not Applicable | — | |||
| Total |
24,202,715 | $11.81 | 9,243,229 | |||
45
Table of Contents
For a description of the equity compensation plans above, see Note I — Employee Benefit Plans included under the heading “Notes to Consolidated Financial Statements.”
Item 13. Certain Relationships and Related Transactions, and Director Independence.
Information with respect to such contractual relationships is incorporated herein by reference to the information in the Proxy Statement for our 2010 Annual Meeting of Shareholders.
Item 14. Principal Accountant Fees and Services.
Information with respect to principal accounting fees and services and pre-approval policies are incorporated herein by reference to information included in the Proxy Statement for our 2010 Annual Meeting of Shareholders.
PART IV
Item 15. Exhibits and Financial Statement Schedules.
| (a) | The following documents are filed as a part of this report: |
| 1. | The financial statements listed in “Index to Financial Statements.” |
| 2. | The financial statement schedules listed in “Index to Financial Statement Schedule.” |
| 3. | The exhibits listed in the “Index to Exhibits.” |
46
Table of Contents
Pursuant to the requirements of Section 13 or 15(d) of the Securities Exchange Act of 1934, the registrant has duly caused this report to be signed on its behalf by the undersigned, thereunto duly authorized on this 23rd day of February 2010.
| OFFICE DEPOT, INC. | ||
| By | /s/ STEVE ODLAND | |
| Steve Odland Chief Executive Officer | ||
Pursuant to the requirements of the Securities Exchange Act of 1934, this report has been signed below by the following persons on behalf of the registrant in the capacities indicated on February 23, 2010.
| Signature |
Capacity | |
| /s/ STEVE ODLAND Steve Odland |
Chief Executive Officer (Principal Executive Officer) and Chairman, Board of Directors | |
| /s/ MICHAEL D. NEWMAN Michael D. Newman |
Executive Vice President and Chief Financial Officer (Principal Financial Officer) | |
| /s/ MARK E. HUTCHENS Mark E. Hutchens |
Senior Vice President and Controller (Principal Accounting Officer) | |
| /s/ LEE A. AULT, III Lee A. Ault, III |
Director | |
| /s/ NEIL R. AUSTRIAN Neil R. Austrian |
Director | |
| /s/ JUSTIN BATEMAN Justin Bateman |
Director | |
| /s/ DAVID W. BERNAUER David W. Bernauer |
Director | |
| /s/ THOMAS J. COLLIGAN Thomas J. Colligan |
Director | |
| /s/ MARSHA JOHNSON EVANS Marsha Johnson Evans |
Director | |
| /s/ DAVID I. FUENTE David I. Fuente |
Director | |
| /s/ BRENDA J. GAINES Brenda J. Gaines |
Director | |
| /s/ MYRA M. HART Myra M. Hart |
Director | |
| /s/ W. SCOTT HEDRICK W. Scott Hedrick |
Director | |
| /s/ KATHLEEN MASON Kathleen Mason |
Director | |
| /s/ JAMES RUBIN James Rubin |
Director | |
| /s/ RAYMOND SVIDER Raymond Svider |
Director | |
47
Table of Contents
| Page | ||
| 49 | ||
| 50 | ||
| 51 | ||
| 52 | ||
| 53 | ||
| 54 | ||
| 55-85 | ||
| Report of Independent Registered Public Accounting Firm on Financial Statement Schedules |
86 | |
| 87 |
48
Table of Contents
REPORT OF INDEPENDENT REGISTERED PUBLIC ACCOUNTING FIRM
To the Board of Directors and Stockholders of Office Depot, Inc.:
We have audited the accompanying consolidated balance sheets of Office Depot, Inc. and subsidiaries (the “Company”) as of December 26, 2009 and December 27, 2008, and the related consolidated statements of operations, comprehensive income (loss), stockholders’ equity, and cash flows for each of the three fiscal years in the period ended December 26, 2009. These financial statements are the responsibility of the Company’s management. Our responsibility is to express an opinion on these financial statements based on our audits.
We conducted our audits in accordance with the standards of the Public Company Accounting Oversight Board (United States). Those standards require that we plan and perform the audit to obtain reasonable assurance about whether the financial statements are free of material misstatement. An audit includes examining, on a test basis, evidence supporting the amounts and disclosures in the financial statements. An audit also includes assessing the accounting principles used and significant estimates made by management, as well as evaluating the overall financial statement presentation. We believe that our audits provide a reasonable basis for our opinion.
In our opinion, such consolidated financial statements present fairly, in all material respects, the financial position of Office Depot, Inc. and subsidiaries at December 26, 2009 and December 27, 2008, and the results of their operations and their cash flows for each of the three fiscal years in the period ended December 26, 2009, in conformity with accounting principles generally accepted in the United States of America.
We have also audited, in accordance with the standards of the Public Company Accounting Oversight Board (United States), the Company’s internal control over financial reporting as of December 26, 2009, based on the criteria established in Internal Control — Integrated Framework issued by the Committee of Sponsoring Organizations of the Treadway Commission and our report dated February 23, 2010 expressed an unqualified opinion on the Company’s internal control over financial reporting.
/s/ DELOITTE & TOUCHE LLP
Certified Public Accountants
Boca Raton, Florida
February 23, 2010
49
Table of Contents
CONSOLIDATED BALANCE SHEETS
(In thousands, except share and per share amounts)
| December 26, 2009 |
December 27, 2008 |
|||||||
| ASSETS |
||||||||
| Current assets: |
||||||||
| Cash and cash equivalents |
$ | 659,898 | $ | 155,745 | ||||
| Receivables, net of allowances of $32,802 in 2009 and $45,990 in 2008 |
1,121,160 | 1,255,735 | ||||||
| Inventories |
1,252,929 | 1,331,593 | ||||||
| Deferred income taxes |
16,637 | 196,192 | ||||||
| Prepaid expenses and other current assets |
155,705 | 183,122 | ||||||
| Total current assets |
3,206,329 | 3,122,387 | ||||||
| Property and equipment, net |
1,277,655 | 1,557,301 | ||||||
| Goodwill |
19,431 | 19,431 | ||||||
| Other intangible assets |
25,333 | 28,311 | ||||||
| Deferred income taxes |
81,706 | 269,960 | ||||||
| Other assets |
279,892 | 270,836 | ||||||
| Total assets |
$ | 4,890,346 | $ | 5,268,226 | ||||
| LIABILITIES AND STOCKHOLDERS’ EQUITY |
||||||||
| Current liabilities: |
||||||||
| Trade accounts payable |
$ | 1,081,381 | $ | 1,251,808 | ||||
| Accrued expenses and other current liabilities |
1,280,296 | 1,173,201 | ||||||
| Income taxes payable |
6,683 | 8,803 | ||||||
| Short-term borrowings and current maturities of long-term debt |
59,845 | 191,932 | ||||||
| Total current liabilities |
2,428,205 | 2,625,744 | ||||||
| Deferred income taxes and other long-term liabilities |
654,851 | 585,861 | ||||||
| Long-term debt, net of current maturities |
662,740 | 688,788 | ||||||
| Total liabilities |
3,745,796 | 3,900,393 | ||||||
| Commitments and contingencies |
||||||||
| Redeemable preferred stock, net (liquidation preference – $368,116 in 2009) |
355,308 | — | ||||||
| Stockholders’ equity: |
||||||||
| Office Depot, Inc. stockholders’ equity: |
||||||||
| Common stock – authorized 800,000,000 shares of $.01 par value; issued and outstanding shares – 280,652,278 in 2009 and 280,800,135 in 2008 |
2,807 | 2,808 | ||||||
| Additional paid-in capital |
1,193,157 | 1,194,622 | ||||||
| Accumulated other comprehensive income |
238,379 | 217,197 | ||||||
| Retained earnings (accumulated deficit) |
(590,195 | ) | 6,270 | |||||
| Treasury stock, at cost – 5,915,268 shares in 2009 and 5,938,059 shares in 2008 |
(57,733 | ) | (57,947 | ) | ||||
| Total Office Depot, Inc. stockholders’ equity |
786,415 | 1,362,950 | ||||||
| Noncontrolling interest |
2,827 | 4,883 | ||||||
| Total stockholders’ equity |
789,242 | 1,367,833 | ||||||
| Total liabilities and stockholders’ equity |
$ | 4,890,346 | $ | 5,268,226 | ||||
The accompanying Notes to Consolidated Financial Statements are an integral part of these statements.
50
Table of Contents
CONSOLIDATED STATEMENTS OF OPERATIONS
(In thousands, except per share amounts)
| 2009 | 2008 | 2007 | ||||||||||
| Sales |
$ | 12,144,467 | $ | 14,495,544 | $ | 15,527,537 | ||||||
| Cost of goods sold and occupancy costs |
8,752,283 | 10,489,785 | 11,024,639 | |||||||||
| Gross profit |
3,392,184 | 4,005,759 | 4,502,898 | |||||||||
| Store and warehouse operating and selling expenses |
2,907,900 | 3,322,662 | 3,381,129 | |||||||||
| Goodwill and trade name impairments |
— | 1,269,893 | — | |||||||||
| Other asset impairments |
26,175 | 222,379 | — | |||||||||
| General and administrative expenses |
723,114 | 743,174 | 645,661 | |||||||||
| Gain and amortization of deferred gain on sale of building |
— | (7,308 | ) | (7,493 | ) | |||||||
| Operating profit (loss) |
(265,005 | ) | (1,545,041 | ) | 483,601 | |||||||
| Other income (expense): |
||||||||||||
| Interest income |
2,396 | 10,013 | 9,440 | |||||||||
| Interest expense |
(65,628 | ) | (68,286 | ) | (63,080 | ) | ||||||
| Miscellaneous income, net |
17,085 | 23,666 | 27,761 | |||||||||
| Earnings (loss) before income taxes |
(311,152 | ) | (1,579,648 | ) | 457,722 | |||||||
| Income tax expense (benefit) |
287,572 | (98,645 | ) | 63,018 | ||||||||
| Net earnings (loss) |
(598,724 | ) | (1,481,003 | ) | 394,704 | |||||||
| Less: Net loss attributable to the noncontrolling interest |
(2,259 | ) | (2,065 | ) | (911 | ) | ||||||
| Net earnings (loss) attributable to Office Depot, Inc. |
(596,465 | ) | (1,478,938 | ) | 395,615 | |||||||
| Preferred stock dividends |
30,506 | — | — | |||||||||
| Income (loss) available to common shareholders |
$ | (626,971 | ) | $ | (1,478,938 | ) | $ | 395,615 | ||||
| Net earnings (loss) per share: |
||||||||||||
| Basic |
$ | (2.30 | ) | $ | (5.42 | ) | $ | 1.45 | ||||
| Diluted |
(2.30 | ) | (5.42 | ) | 1.43 | |||||||
The accompanying Notes to Consolidated Financial Statements are an integral part of these statements.
51
Table of Contents
CONSOLIDATED STATEMENTS OF COMPREHENSIVE INCOME (LOSS)
(In thousands, except per share amounts)
| 2009 | 2008 | 2007 | ||||||||||
| Net earnings (loss) |
$ | (598,724 | ) | $ | (1,481,003 | ) | $ | 394,704 | ||||
| Other comprehensive income (loss), net of tax: |
||||||||||||
| Foreign currency translation adjustments |
25,769 | (248,591 | ) | 179,582 | ||||||||
| Amortization of gain on cash flow hedge |
(1,659 | ) | (1,659 | ) | (1,659 | ) | ||||||
| Change in deferred pension |
(7,523 | ) | (24,128 | ) | 23,192 | |||||||
| Change in deferred cash flow hedge |
4,657 | (4,657 | ) | — | ||||||||
| Other |
246 | — | — | |||||||||
| Total other comprehensive income (loss), net of tax |
21,490 | (279,035 | ) | 201,115 | ||||||||
| Comprehensive income (loss) |
(577,234 | ) | (1,760,038 | ) | 595,819 | |||||||
| Less: comprehensive income (loss) attributable to the noncontrolling interest |
(1,951 | ) | (2,381 | ) | (459 | ) | ||||||
| Comprehensive income (loss) attributable to Office Depot, Inc. |
$ | (575,283 | ) | $ | (1,757,657 | ) | $ | 596,278 | ||||
The accompanying Notes to Consolidated Financial Statements are an integral part of these statements.
52
Table of Contents
CONSOLIDATED STATEMENTS OF STOCKHOLDERS’ EQUITY
(In thousands, except share amounts)
| Common Stock Shares |
Common Stock Amount |
Additional Paid-in Capital |
Comprehensive Income (Loss) |
Accumulated Other Comprehensive Income (Loss) |
Retained Earnings (Accumulated Deficit) |
Treasury Stock |
Noncontrolling Interest |
Total Stockholders’ Equity |
|||||||||||||||||||||||||||
| Balance at December 30, 2006 |
426,177,619 | $ | 4,262 | $ | 1,700,976 | $ | 295,253 | $ | 3,370,538 | $ | (2,773,582 | ) | $ | 16,023 | $ | 2,613,470 | |||||||||||||||||||
| Comprehensive income, net of tax: |
|||||||||||||||||||||||||||||||||||
| Net earnings |
394,704 | 395,615 | (911 | ) | 394,704 | ||||||||||||||||||||||||||||||
| Foreign currency translation adjustments |
179,582 | 179,130 | 452 | 179,582 | |||||||||||||||||||||||||||||||
| Change in deferred pension |
23,192 | 23,192 | 23,192 | ||||||||||||||||||||||||||||||||
| Amortization of gain on cash flow hedge |
(1,659 | ) | (1,659 | ) | (1,659 | ) | |||||||||||||||||||||||||||||
| Comprehensive income, net of tax |
$ | 595,819 | $ | 595,819 | |||||||||||||||||||||||||||||||
| Adoption of FIN 48 |
17,652 | 17,652 | |||||||||||||||||||||||||||||||||
| Acquisition of treasury stock |
(210,793 | ) | (210,793 | ) | |||||||||||||||||||||||||||||||
| Grant of long-term incentive stock |
765,754 | 8 | (8 | ) | — | ||||||||||||||||||||||||||||||
| Forfeiture of restricted stock |
(87,861 | ) | (1 | ) | 1 | — | |||||||||||||||||||||||||||||
| Exercise of stock options (including income tax benefits and withholding) |
1,849,657 | 18 | 43,909 | 43,927 | |||||||||||||||||||||||||||||||
| Issuance of stock under employee stock purchase plans |
72,456 | 1 | 1,515 | 1,516 | |||||||||||||||||||||||||||||||
| Direct stock purchase plans |
46 | 26 | 72 | ||||||||||||||||||||||||||||||||
| Amortization of long-term incentive stock grant |
37,745 | 37,745 | |||||||||||||||||||||||||||||||||
| Balance at December 29, 2007 |
428,777,625 | 4,288 | 1,784,184 | 495,916 | 3,783,805 | (2,984,349 | ) | 15,564 | 3,099,408 | ||||||||||||||||||||||||||
| Acquisition of majority-owned subsidiaries |
5,995 | 5,995 | |||||||||||||||||||||||||||||||||
| Purchase of subsidiary shares from noncontrolling interest |
(14,295 | ) | (14,295 | ) | |||||||||||||||||||||||||||||||
| Comprehensive loss, net of tax: |
|||||||||||||||||||||||||||||||||||
| Net loss |
(1,481,003 | ) | (1,478,938 | ) | (2,065 | ) | (1,481,003 | ) | |||||||||||||||||||||||||||
| Foreign currency translation adjustments |
(248,591 | ) | (248,275 | ) | (316 | ) | (248,591 | ) | |||||||||||||||||||||||||||
| Change in deferred pension |
(24,128 | ) | (24,128 | ) | (24,128 | ) | |||||||||||||||||||||||||||||
| Amortization of gain on cash flow hedge |
(1,659 | ) | (1,659 | ) | (1,659 | ) | |||||||||||||||||||||||||||||
| Change in deferred cash flow hedge |
(4,657 | ) | (4,657 | ) | (4,657 | ) | |||||||||||||||||||||||||||||
| Comprehensive loss, net of tax |
$ | (1,760,038 | ) | $ | (1,760,038 | ) | |||||||||||||||||||||||||||||
| Acquisition of treasury stock |
(944 | ) | (944 | ) | |||||||||||||||||||||||||||||||
| Retirement of treasury stock |
(149,940,718 | ) | (1,499 | ) | (626,889 | ) | (2,298,597 | ) | 2,926,985 | — | |||||||||||||||||||||||||
| Grant of long-term incentive stock |
2,307,993 | 23 | (23 | ) | — | ||||||||||||||||||||||||||||||
| Forfeiture of restricted stock |
(465,175 | ) | (5 | ) | 1 | (4 | ) | ||||||||||||||||||||||||||||
| Exercise of stock options (including income tax benefits and withholding) |
109,744 | 1 | (1,222 | ) | (1,221 | ) | |||||||||||||||||||||||||||||
| Issuance of stock under employee stock purchase plans |
10,666 | — | (785 | ) | (785 | ) | |||||||||||||||||||||||||||||
| Direct stock purchase plans |
(228 | ) | 361 | 133 | |||||||||||||||||||||||||||||||
| Amortization of long-term incentive stock grant |
39,584 | 39,584 | |||||||||||||||||||||||||||||||||
| Balance at December 27, 2008 |
280,800,135 | 2,808 | 1,194,622 | 217,197 | 6,270 | (57,947 | ) | 4,883 | 1,367,833 | ||||||||||||||||||||||||||
| Purchase of subsidiary shares from noncontrolling interest |
(105 | ) | (105 | ) | |||||||||||||||||||||||||||||||
| Comprehensive loss, net of tax: |
|||||||||||||||||||||||||||||||||||
| Net loss |
(598,724 | ) | (596,465 | ) | (2,259 | ) | (598,724 | ) | |||||||||||||||||||||||||||
| Foreign currency translation adjustments |
25,769 | 25,461 | 308 | 25,769 | |||||||||||||||||||||||||||||||
| Change in deferred pension |
(7,523 | ) | (7,523 | ) | (7,523 | ) | |||||||||||||||||||||||||||||
| Amortization of gain on cash flow hedge |
(1,659 | ) | (1,659 | ) | (1,659 | ) | |||||||||||||||||||||||||||||
| Change in deferred cash flow hedge |
4,657 | 4,657 | 4,657 | ||||||||||||||||||||||||||||||||
| Other |
246 | 246 | 246 | ||||||||||||||||||||||||||||||||
| Comprehensive loss, net of tax |
$ | (577,234 | ) | $ | (577,234 | ) | |||||||||||||||||||||||||||||
| Preferred stock dividends |
(30,506 | ) | (30,506 | ) | |||||||||||||||||||||||||||||||
| Grant of long-term incentive stock |
258,074 | 3 | (3 | ) | — | ||||||||||||||||||||||||||||||
| Forfeiture of restricted stock |
(405,931 | ) | (4 | ) | — | (4 | ) | ||||||||||||||||||||||||||||
| Share-based payments (including income tax benefits and withholding) |
(4,096 | ) | (4,096 | ) | |||||||||||||||||||||||||||||||
| Direct stock purchase plans |
(179 | ) | 214 | 35 | |||||||||||||||||||||||||||||||
| Amortization of long-term incentive stock grant |
33,319 | 33,319 | |||||||||||||||||||||||||||||||||
| Balance at December 26, 2009 |
280,652,278 | $ | 2,807 | $ | 1,193,157 | $ | 238,379 | $ | (590,195 | ) | $ | (57,733 | ) | $ | 2,827 | $ | 789,242 | ||||||||||||||||||
The accompanying Notes to Consolidated Financial Statements are an integral part of these statements.
53
Table of Contents
CONSOLIDATED STATEMENTS OF CASH FLOWS
(In thousands)
| 2009 | 2008 | 2007 | ||||||||||
| Cash flows from operating activities: |
||||||||||||
| Net earnings (loss) |
$ | (598,724 | ) | $ | (1,481,003 | ) | $ | 394,704 | ||||
| Adjustments to reconcile net earnings (loss) to net cash provided by operating activities: |
||||||||||||
| Depreciation and amortization |
224,115 | 254,099 | 281,383 | |||||||||
| Charges for losses on inventories and receivables |
80,178 | 140,058 | 109,798 | |||||||||
| Net earnings from equity method investments |
(30,579 | ) | (37,113 | ) | (34,825 | ) | ||||||
| Dividends received |
13,931 | — | — | |||||||||
| Goodwill and trade name impairments |
— | 1,269,893 | — | |||||||||
| Other asset impairments |
26,175 | 222,379 | — | |||||||||
| Compensation expense for share-based payments |
33,316 | 39,561 | 37,738 | |||||||||
| Deferred income taxes and valuation allowances on deferred tax assets |
325,886 | (108,099 | ) | (1,022 | ) | |||||||
| Loss (gain) on disposition of assets |
7,655 | (13,443 | ) | (25,190 | ) | |||||||
| Other operating activities |
7,199 | (5,547 | ) | 3,838 | ||||||||
| Changes in assets and liabilities: |
||||||||||||
| Decrease in receivables |
126,131 | 133,162 | 25,909 | |||||||||
| Decrease (increase) in inventories |
37,583 | 249,849 | (191,685 | ) | ||||||||
| Net decrease (increase) in prepaid expenses and other assets |
28,165 | (16,986 | ) | (12,342 | ) | |||||||
| Net increase (decrease) in accounts payable, accrued expenses and other long-term liabilities |
15,408 | (178,554 | ) | (176,921 | ) | |||||||
| Total adjustments |
895,163 | 1,949,259 | 16,681 | |||||||||
| Net cash provided by operating activities |
296,439 | 468,256 | 411,385 | |||||||||
| Cash flows from investing activities: |
||||||||||||
| Capital expenditures |
(130,847 | ) | (330,075 | ) | (460,571 | ) | ||||||
| Acquisitions, net of cash acquired, and related payments |
— | (102,752 | ) | (48,036 | ) | |||||||
| Dividends received |
— | — | 25,000 | |||||||||
| Purchase of assets held for sale and sold |
— | (38,537 | ) | — | ||||||||
| Proceeds from disposition of assets and other |
150,131 | 120,632 | 129,182 | |||||||||
| Restricted cash for pending transaction |
— | (6,037 | ) | (18,100 | ) | |||||||
| Release of restricted cash |
6,037 | 18,100 | — | |||||||||
| Net cash provided by (used in) investing activities |
25,321 | (338,669 | ) | (372,525 | ) | |||||||
| Cash flows from financing activities: |
||||||||||||
| Net proceeds from exercise of stock options and sale of stock under employee stock purchase plans |
35 | 503 | 29,332 | |||||||||
| Tax benefit from employee share-based exercises |
— | 89 | 18,266 | |||||||||
| Acquisition of treasury stock under approved repurchase plans |
— | — | (199,592 | ) | ||||||||
| Treasury stock additions from employee related plans |
— | (944 | ) | (11,201 | ) | |||||||
| Debt issuance costs |
— | (40,793 | ) | — | ||||||||
| Proceeds from issuance of redeemable preferred stock, net |
324,801 | — | — | |||||||||
| Proceeds from issuance of borrowings |
24,321 | 139,098 | 177,413 | |||||||||
| Payments on long- and short-term borrowings |
(175,863 | ) | (284,204 | ) | (6,292 | ) | ||||||
| Net cash provided by (used in) financing activities |
173,294 | (186,251 | ) | 7,926 | ||||||||
| Effect of exchange rate changes on cash and cash equivalents |
9,099 | (10,545 | ) | 2,616 | ||||||||
| Net increase (decrease) in cash and cash equivalents |
504,153 | (67,209 | ) | 49,402 | ||||||||
| Cash and cash equivalents at beginning of period |
155,745 | 222,954 | 173,552 | |||||||||
| Cash and cash equivalents at end of period |
$ | 659,898 | $ | 155,745 | $ | 222,954 | ||||||
The accompanying Notes to Consolidated Financial Statements are an integral part of these statements.
54
Table of Contents
NOTES TO CONSOLIDATED FINANCIAL STATEMENTS
NOTE A — SUMMARY OF SIGNIFICANT ACCOUNTING POLICIES
Nature of Business: Office Depot, Inc. (“Office Depot”) is a global supplier of office products and services under the Office Depot® brand and other proprietary brand names. As of December 26, 2009, we sold to customers in 51 countries throughout North America, Europe, Asia and Latin America. We operate wholly-owned entities, majority-owned entities or participate in other ventures covering 40 countries and have alliances in an additional 11 countries.
Basis of Presentation: The consolidated financial statements of Office Depot and its subsidiaries have been prepared in accordance with accounting principles generally accepted in the United States of America. All intercompany transactions have been eliminated in consolidation. We have a majority, but not total, ownership interest in entities in South Korea, India and Sweden. Those entities have been consolidated since the date of acquisition with noncontrolling interest presented for the portion we do not own. We also participate in a joint venture selling office products and services in Mexico and Central and South America that is accounted for using the equity method with its results presented in miscellaneous income, net in the Consolidated Statements of Operations. See Note P for information on our investment in Mexico.
Effective at the beginning of the first quarter of 2009, the presentation of noncontrolling interests, previously referred to as minority interest, has been changed in the Consolidated Balance Sheets and Consolidated Statements of Stockholders’ Equity to be reflected as a component of total stockholders’ equity and in the Consolidated Statements of Operations to be a specific allocation of net earnings (loss). This change in presentation had no impact on the calculation of earnings per share. Changes to disclosures related to noncontrolling interests also resulted in the addition to our financial statements of the Consolidated Statements of Comprehensive Income (Loss).
Fiscal Year: Fiscal years are based on a 52- or 53-week period ending on the last Saturday in December. All years presented are based on 52 weeks.
Estimates and Assumptions: Preparation of these financial statements in conformity with accounting principles generally accepted in the United States of America requires management to make estimates and assumptions that affect amounts reported in the financial statements and related notes. For example, estimates are required for, but not limited to, facility closure costs, asset impairments, amounts earned under vendor programs, contingencies and accruals for valuation allowances on deferred tax assets. Actual results may differ from those estimates.
Foreign Currency: Assets and liabilities of international operations are translated into U.S. dollars using the exchange rate at the balance sheet date. Revenues, expenses and cash flows are translated at average monthly exchange rates. Translation adjustments resulting from this process are recorded in stockholders’ equity as a component of accumulated other comprehensive income (“OCI”).
Monetary assets and liabilities denominated in a currency other than a consolidated entity’s functional currency result in transaction gains or losses from the remeasurement at spot rates at the end of the period. Foreign currency gains and losses are recorded in miscellaneous income, net in the Consolidated Statements of Operations.
Cash Equivalents: All short-term highly liquid securities with maturities of three months or less from the date of acquisition are classified as cash equivalents. Approximately $7 million and $15 million of restricted cash held on deposit was included in other current assets at December 26, 2009 and December 27, 2008, respectively.
Cash Management: Our cash management process generally utilizes zero balance accounts which provide for the settlement of the related disbursement accounts on a daily basis. Accounts payable and accrued expenses as of December 26, 2009 and December 27, 2008 included $77 million and $71 million, respectively, of amounts
55
Table of Contents
not yet presented for payment drawn in excess of disbursement account book balances, after considering existing offset provisions. We may borrow on a cost effective basis during the period, which may result in higher levels of borrowings and invested cash within the period. At the end of the period, cash may be used to minimize borrowings outstanding at the balance sheet date.
Short-term Investments: We held no short-term investments at December 26, 2009 or December 27, 2008. When held, investments typically are available-for-sale debt securities and reported at fair market value, based on quoted market prices using the specific identification method.
Receivables: Trade receivables, net, totaled $770.1 million and $849.6 million at December 26, 2009 and December 27, 2008, respectively. An allowance for doubtful accounts has been recorded to reduce receivables to an amount expected to be collectible from customers. The allowance recorded at December 26, 2009 and December 27, 2008 was $32.8 million and $46.0 million, respectively. Receivables generated through a private label credit card program are transferred to a financial services company. Most of these receivables are transferred with recourse. The estimated fair value liability associated with risk of loss is included in accrued expenses.
Our exposure to credit risk associated with trade receivables is limited by having a large customer base that extends across many different industries and geographic regions. However, receivables may be adversely affected by an economic slowdown in the U.S. or internationally. No single customer accounted for more than 10% of our total sales in 2009, 2008 or 2007.
Other receivables are $351.1 million and $406.1 million as of December 26, 2009 and December 27, 2008, respectively, of which $225.4 million and $288.2 million are amounts due from vendors under purchase rebate, cooperative advertising and various other marketing programs.
Inventories: Inventories are stated at the lower of cost or market value. In-bound freight is included as a cost of inventories. Also, certain vendor allowances that are related to inventory purchases are considered to reduce the product cost. The weighted average method is used to determine the cost of a majority of our inventory and the first-in-first-out method is used for inventory held within our international operations.
Income Taxes: Income tax expense is recognized at applicable U.S. or international tax rates. Certain revenue and expense items may be recognized in one period for financial statement purposes and in a different period’s income tax return. The tax effects of such differences are reported as deferred income taxes. Valuation allowances are recorded for periods in which realization of deferred tax assets does not meet a more likely than not standard. See Note G for additional information on deferred income taxes.
Property and Equipment: Property and equipment additions are recorded at cost. Depreciation and amortization is recognized over their estimated useful lives using the straight-line method. The useful lives of depreciable assets are estimated to be 15-30 years for buildings and 3-10 years for furniture, fixtures and equipment. Computer software is amortized over three years for common office applications, five years for larger business applications and seven years for certain enterprise-wide systems. Leasehold improvements are amortized over the shorter of the estimated economic lives of the improvements or the terms of the underlying leases, including renewal options considered reasonably assured at inception of the leases.
Goodwill and Other Intangible Assets: Goodwill represents the excess of the purchase price and related costs over the value assigned to net tangible and identifiable intangible assets of businesses acquired and accounted for under the purchase method. Accounting rules require that we test at least annually for possible goodwill impairment. Unless conditions warrant earlier action, we perform our test in the fourth quarter of each year using a discounted cash flow analysis that requires that certain assumptions and estimates be made regarding industry economic factors and future profitability. During 2008, we recognized an impairment charge of $1,213.3 million related to goodwill, which is reflected in goodwill and trade name impairments in the Consolidated Statements of Operations.
56
Table of Contents
Unless conditions warrant earlier action, intangible assets with indefinite lives are tested annually for impairment during the fourth quarter and written down to fair value as required. During 2008, a charge of approximately $56.6 million was recorded to impair non-amortizing trade name intangibles. This impairment charge is included in goodwill and trade name impairments in the Consolidated Statements of Operations.
We amortize the cost of other intangible assets over their estimated useful lives. Amortizable intangible assets are reviewed at least annually to determine whether events and circumstances warrant a revision to the remaining period of amortization. During 2008, we concluded that the value of certain amortizing intangible assets was impaired, and we recognized a charge of $10.9 million to fully impair the customer list intangible assets in our International Division. This impairment charge is included in other asset impairments in the Consolidated Statements of Operations.
See Note C for information related to goodwill and other intangible asset impairment charges recognized in 2008.
Impairment of Long-Lived Assets: Long-lived assets with identifiable cash flows are reviewed for possible impairment annually or whenever events or changes in circumstances indicate that the carrying amount of such assets may not be recoverable. Impairment is assessed at the location level, considering the estimated undiscounted cash flows over the asset’s remaining life. If estimated cash flows are insufficient to recover the investment, an impairment loss is recognized equal to the estimated fair value of the asset less its carrying value and any costs of disposition. Impairment losses of $3.5 million, $97.7 million and $3.3 million were recognized in 2009, 2008 and 2007, respectively, relating to certain under-performing retail stores. For additional discussion of material asset impairment charges recognized in 2008, see Note C.
Facility Closure Costs: We regularly review store performance against expectations and close stores not meeting our performance requirements. Costs associated with store or other facility closures, principally lease cancellation costs, are recognized when the facility is no longer used in an operating capacity or when a liability has been incurred. Store assets are also reviewed for possible impairment, or reduction of estimated useful lives.
Accruals for facility closure costs are based on the future commitments under contracts, adjusted for anticipated sublease benefits and discounted at the company’s risk-adjusted rate at the time of closing. During 2008 and 2009, we recorded charges relating to leases on retail stores and supply chain facilities closed as part of a company-wide business review. These charges totaled $126 million and $10 million in 2009 and 2008, respectively. Additionally, we have recognized charges to terminate existing commitments and to adjust remaining commitments to current market values. These charges totaled $5 million and $9 million in 2009 and 2008, respectively. See Note C for information on the charges related to our company-wide business review. The accrued balance relating to our future commitments under operating leases for our closed facilities was $181 million and $54 million at December 26, 2009 and December 27, 2008, respectively. The short-term and long-term components of this liability are included in accrued expenses and other long-term liabilities, respectively, on the Consolidated Balance Sheets.
Fair Value of Financial Instruments: The estimated fair values of financial instruments recognized in the Consolidated Balance Sheets or disclosed within these Notes to Consolidated Financial Statements have been determined using available market information, information from unrelated third-party financial institutions and appropriate valuation methodologies, primarily discounted projected cash flows. However, considerable judgment is required when interpreting market information and other data to develop estimates of fair value.
Short-term Assets and Liabilities: The fair values of cash and cash equivalents, short-term investments, receivables, accounts payable and accrued expenses and other current liabilities approximate their carrying values because of their short-term nature.
57
Table of Contents
Notes Payable: The fair value of the senior notes was determined based on quoted market prices. The following table reflects the difference between the carrying value and fair value of the senior notes as of December 26, 2009 and December 27, 2008:
| 2009 | 2008 | |||||||||||
| (Dollars in thousands) | Carrying Value |
Fair Value |
Carrying Value |
Fair Value | ||||||||
| $400 million senior notes |
$ | 400,172 | $ | 345,966 | $ | 400,278 | $ | 206,000 | ||||
Interest Rate Swaps, Foreign Currency and Fuel Contracts: The fair values of our interest rate swaps, foreign currency contracts and fuel contracts are the amounts receivable or payable to terminate the agreements at the reporting date, taking into account current interest and exchange rates. The values are based on market-based inputs or unobservable inputs that are corroborated by market data. There were no interest rate swap agreements in place at the end of 2009 and the amounts receivable or payable under foreign currency and fuel contracts were not significant at the end of 2009. See Note J for additional information on our derivative instruments and hedging activities.
There were no significant differences between the carrying values and fair values of our financial instruments as of December 26, 2009 and December 27, 2008, except as disclosed above.
Accounting for Stock-Based Compensation: We account for stock-based compensation using the fair value method of expense recognition. We use the Black-Scholes valuation model and recognize compensation expense on a straight-line basis over the requisite service period of the grant. We consider alternative models if grants have characteristics that cannot be reasonably estimated using this model.
Accrued Expenses: Included in accrued expenses and other current liabilities in our Consolidated Balance Sheets are accrued payroll-related amounts of approximately $294 million and $205 million at December 26, 2009 and December 27, 2008, respectively.
Revenue Recognition: Revenue is recognized at the point of sale for retail transactions and at the time of successful delivery for contract, catalog and internet sales. Sales taxes collected are not included in reported sales. We use judgment in estimating sales returns, considering numerous factors including historical sales return rates. Although we consider our sales return accruals to be adequate and proper, changes from historical customer patterns could require adjustments to the provision for returns. We also record reductions to our revenues for customer programs and incentive offerings including special pricing agreements, certain promotions and other volume-based incentives. Revenue from sales of extended warranty service plans is either recognized at the point of sale or over the warranty period, depending on the determination of legal obligor status. All performance obligations and risk of loss associated with such contracts are transferred to an unrelated third-party administrator at the time the contracts are sold. Costs associated with these contracts are recognized in the same period as the related revenue.
We recognize a liability for future performance when gift cards are sold and recognize the related revenue when gift cards are redeemed as payment for our products. We recognize as revenue the unused portion of the gift card liability when historical data indicates that additional redemption is unlikely.
Shipping and Handling Fees and Costs: Income generated from shipping and handling fees is classified as revenues for all periods presented. Freight costs incurred to bring merchandise to stores and warehouses are included as a component of inventory and costs of goods sold. Freight costs incurred to ship merchandise to customers are recorded as a component of store and warehouse operating and selling expenses. Shipping costs, combined with warehouse handling costs, totaled $767.6 million in 2009, $911.2 million in 2008 and $963.7 million in 2007.
Advertising: Advertising costs are charged either to expense when incurred or, in the case of direct marketing advertising, capitalized and amortized in proportion to the related revenues over the estimated life of the material, which range from several months to up to one year.
58
Table of Contents
Advertising expense recognized was $453.3 million in 2009, $525.7 million in 2008 and $564.9 million in 2007. Prepaid advertising costs were $37.3 million as of December 26, 2009 and $38.1 million as of December 27, 2008.
Pre-opening Expenses: Pre-opening expenses related to opening new stores and warehouses or relocating existing stores and warehouses are expensed as incurred and included in store and warehouse operating and selling expenses.
Self-Insurance: Office Depot is primarily self-insured for workers’ compensation, auto and general liability and employee medical insurance programs. Self-insurance liabilities are based on claims filed and estimates of claims incurred but not reported. These liabilities are not discounted.
Comprehensive Income (Loss): Comprehensive income (loss) represents the change in stockholders’ equity from transactions and other events and circumstances arising from non-stockholder sources. Comprehensive income consists of net earnings (loss), foreign currency translation adjustments, realized or unrealized gains (losses) on investment securities that are available-for-sale, deferred pension gains (losses), and elements of qualifying cash flow hedges, net of applicable income taxes. As of December 26, 2009, our Consolidated Balance Sheet reflected OCI in the amount of $238 million, which consisted of $247 million in foreign currency translation adjustments, $6 million in unamortized gain on hedge and $15 million in deferred pension loss.
Vendor Arrangements: We enter into arrangements with substantially all of our significant vendors that provide for some form of consideration to be received from the vendors. Arrangements vary, but generally specify volume rebate thresholds, advertising support levels, as well as terms for payment and other administrative matters. The volume-based rebates, supported by a vendor agreement, are estimated throughout the year and reduce the cost of inventory and cost of goods sold during the year. This estimate is regularly monitored and adjusted for current or anticipated changes in purchase levels and for sales activity. Other promotional consideration received is event-based or represents general support and is recognized as a reduction of cost of goods sold or inventory, as appropriate based on the type of promotion and the agreement with the vendor. Some arrangements may meet the specific, incremental, identifiable criteria that allow for direct operating expense offset, but such arrangements are not significant.
New Accounting Standards: The Financial Accounting Standards Board (the “FASB”) has codified a single source of U.S. Generally Accepted Accounting Principles (GAAP), the Accounting Standards Codification™. Unless needed to clarify a point to readers, we will refrain from citing specific section references when discussing application of accounting principles or addressing new or pending accounting rule changes. There are no recently issued accounting standards that are expected to have a material effect on our financial condition, results of operations or cash flows.
NOTE B — REDEEMABLE PREFERRED STOCK
On June 23, 2009, Office Depot, Inc. issued 274,596 shares of 10.00% Series A Redeemable Convertible Participating Perpetual Preferred Stock, par value $0.01 per share (“Series A Preferred Stock”), and 75,404 shares of 10.00% Series B Redeemable Conditional Convertible Participating Perpetual Preferred Stock, par value $0.01 per share (“Series B Preferred Stock”), to funds advised by BC Partners, Inc., for $350 million (collectively, the “Preferred Stock”). In compliance with the rules of the New York Stock Exchange (“NYSE”), Office Depot requested shareholder approval for conversion and voting rights for these shares. Approval was received at the shareholder meeting on October 14, 2009.
The initial liquidation value of $1,000 per preferred share and the conversion rate of $5.00 per common share allow the two series of preferred stock to be initially convertible into 70 million shares of common stock. The conversion rate is subject to anti-dilution adjustments. Until converted or otherwise redeemed, the Preferred Stock is recorded outside of permanent equity on the Consolidated Balance Sheets because certain redemption
59
Table of Contents
conditions are not solely within the control of Office Depot. The balance is presented inclusive of accrued dividends and net of approximately $25 million of fees, including issuance costs paid for investment banking, legal and accounting fees, and $3.5 million paid to BC Partners, approximately $2.8 million of which was returned to the investing funds as a portion of a transaction funding fee.
Dividends are payable quarterly, beginning on October 1, 2009, and will be paid in-kind or, in cash, only to the extent that the company has funds legally available for such payment and a cash dividend is declared by the company’s board of directors and allowed by credit facilities. The company’s asset based credit facility currently limits the ability to make such payments. The company may seek modification to the credit facility to allow cash dividends in future periods. If not paid in cash, an amount equal to the cash dividend due will be added to the liquidation preference and measured for accounting purposes at fair value. After the third anniversary of issuance, the dividend rate will be reduced to:
| (i) | 7.87% if at any time after June 23, 2010, the closing price of the company’s common stock is greater than or equal to $6.62 per share for a period of 20 consecutive trading days, or |
| (ii) | 5.75% if at any time after June 23, 2010, the closing price of the company’s common stock is greater than or equal to $8.50 per share for a period of 20 consecutive trading days. |
The Preferred Stock also may participate in dividends on common stock, if declared. However, if the closing price of the common stock on the record date for a dividend payment is less than $45.00 per share, the company may not declare or pay a cash dividend on the common stock per share for any fiscal quarter in excess of the Preferred Stock dividend amounts.
The board of directors approved dividends equal to the stated dividend rate on the Preferred Stock for the quarterly periods accrued through January 1, 2010. The stated-rate dividend has been added to the liquidation preference of the respective Series A and Series B Preferred Stock, in lieu of making a cash payment. An increase in the liquidation preference in lieu of a cash payment has no impact on the Consolidated Statements of Cash Flows. The dividend has been accrued through December 26, 2009 by a charge against additional paid-in capital and an increase to the Preferred Stock carrying value. The company measured the fair value of the dividend using a binomial simulation model that captured the intrinsic value of the underlying common stock on the declaration date and the option value of the shares and future dividends. Our model used an adjusted risk rate of 13.5%, a ten-year volatility of 63.5%, the underlying common stock price on the dividend date and other assumptions including probability simulations of various outcomes. This technique resulted in a fair value estimate of approximately $30.5 million, or approximately $12.4 million above the increase in the liquidation preference amounts of the Preferred Stock. The following table reflects the changes in redeemable preferred stock.
| (Dollars in thousands) | Redeemable Preferred Stock, net |
|||
| Balance at December 27, 2008 |
$ | — | ||
| Issuance of redeemable preferred stock |
350,000 | |||
| Dividends accrued at the stated rate |
18,116 | |||
| Liquidation preference |
368,116 | |||
| Fair value in excess of dividends accrued at the stated rate |
12,390 | |||
| Fees and other |
(25,198 | ) | ||
| Balance at December 26, 2009 |
$ | 355,308 | ||
The Preferred Stock is redeemable, in whole or in part, at the option of the company at any time after June 23, 2012, subject to the right of the holder to first convert the preferred stock the company proposes to redeem. The redemption price is initially 107% of the liquidation preference amount plus any accrued but unpaid dividends
60
Table of Contents
and decreases by 1% each year until reaching 100% after June 23, 2019. At any time after June 23, 2011, if the closing price of the common stock is greater than or equal to $9.75 per share for a period of 20 consecutive trading days, the Preferred Stock is redeemable at 100% of the liquidation preference amount plus any accrued but unpaid dividends, in whole or in part, at the option of the company, subject to the right of the holder to first convert the Preferred Stock the company proposes to redeem.
The Preferred Stock is redeemable at the option of the holder at 101% of the liquidation preference amount plus any accrued but unpaid dividends in the event of a change of control of the company (as defined in the Certificate of Designations for each series), or if the company commences a voluntary bankruptcy, consents to the entry of an order against it in an involuntary bankruptcy, consents to the appointment of a custodian for all or substantially all of its property, makes a general assignment for the benefit of creditors or changes its primary business, or if the common stock ceases to be listed for trading on any of the NASDAQ Global Select Market, the NASDAQ Global Market or the NYSE without the simultaneous listing on another of such exchanges.
For so long as the Investors own 10% or more of the outstanding common stock on an as-converted basis, the affirmative vote of at least a majority of the shares of the Preferred Stock then outstanding and entitled to vote is required for (i) the declaration or payment of a dividend or distribution on the common stock or any other stock that ranks junior to or equally with the Series A Preferred Stock, subject to certain conditions specified in the Certificate of Designations; (ii) the purchase, redemption or other acquisition by the company of any common stock or other stock ranking junior to or equal with the Series A Preferred Stock, subject to certain conditions specified in the Certificate of Designations; (iii) any amendment of the company’s Certificate of Incorporation or the Series A Preferred Stock so as to adversely affect the relative rights, preferences, privileges or voting powers of the Series A Preferred Stock; or (iv) the authorization or issuance of, or reclassification into, any capital stock that would rank senior to or equal with the Series A Preferred Stock (including additional shares of Series A Preferred Stock).
In connection with the transaction, the company entered into an Investor Rights Agreement. Subject to certain exceptions, for so long as the Investors’ ownership percentage is equal to or greater than 10%, the approval of at least one of the directors designated to the company’s board of directors by the Investors is required for the company to incur any indebtedness for borrowed money in excess of $200 million in the aggregate during any fiscal year if the ratio of the consolidated debt of the company and its subsidiaries to the trailing four quarter adjusted EBITDA, as defined, of the company and its subsidiaries, on a consolidated basis, is more than 4x. In addition, for so long as the Investors’ ownership percentage is (i) equal to or greater than 15%, the Investors are entitled to nominate three of our fourteen directors, (ii) less than 15% but more than 10%, the Investors are entitled to nominate two of our fourteen directors and (iii) less than 10% but more than 5%, the Investors are entitled to nominate one of our fourteen directors. On June 23, 2009, three directors designated by the Investors were elected to the company’s board of directors.
Certain features of the Preferred Stock described above constitute derivatives separable from the preferred stock; however, those features had little or no value at issuance or December 26, 2009 and are not expected to have significant value for the foreseeable future.
In connection with the issuance of the Preferred Stock, the company’s board of directors eliminated 500,000 shares of previously authorized but not outstanding Junior Participating Preferred Stock, Series A. Further, the board of directors authorized issuance of 280,000 shares of Series A Preferred Stock, and authorized 80,000 shares of Series B Preferred Stock, of which 274,596 and 75,404, respectively, have been issued. Any such Series A or Series B Preferred Stock that is redeemed, purchased or otherwise acquired by the company or converted into another series of preferred stock shall revert to authorized but unissued shares of preferred stock.
NOTE C — ASSET IMPAIRMENTS, EXIT COSTS AND OTHER CHARGES
During the fourth quarter of 2008, we performed an internal review of assets and processes with the goal of positioning the company to deal with the degradation in the global economy and to benefit from its eventual improvement. The results of that internal review led to decisions to close stores, exit certain businesses and write off certain assets that were not seen as providing future benefit. These decisions resulted in material charges that
61
Table of Contents
were recognized during the fourth quarter of 2008 and fiscal year 2009. We also recognized material goodwill and trade name impairment charges during the fourth quarter of 2008. During 2007, we recognized charges associated with the remaining activities from a previously-disclosed business review. We manage the related costs and programs associated with these activities (collectively, the “Charges”) at a corporate level, and accordingly, these amounts are not included in determining Division operating profit.
A summary of the Charges and the line item presentation of these amounts in our accompanying Consolidated Statements of Operations is as follows.
| (Dollars in million) | 2009 | 2008 | 2007 | ||||||
| Cost of goods sold and occupancy costs |
$ | 13 | $ | 16 | $ | — | |||
| Store and warehouse operating and selling expenses |
188 | 52 | 25 | ||||||
| Goodwill and trade name impairments |
— | 1,270 | — | ||||||
| Other asset impairments |
26 | 114 | — | ||||||
| General and administrative expenses |
26 | 17 | 15 | ||||||
| Total pre-tax Charges |
$ | 253 | $ | 1,469 | $ | 40 | |||
Exit costs
The primary components of Charges associated with exit activities during 2008 and 2009 include:
| • | Retail Store Initiatives — As a result of the strategic review, we closed certain stores in North America and exited our retail operations in Japan. Additionally, we reduced the planned number of North American retail store openings for 2009. In total, we closed 126 stores in North America and 27 stores in Japan. Six of the North American locations were closed during the fourth quarter of 2008 and the remaining stores were closed during 2009. The stores closed under this program were underperforming stores or stores that were no longer a strategic fit for the company. The charges associated with the initiatives related to our retail stores totaled $122 million and $104 million in 2009 and 2008, respectively. The 2009 charges were primarily related to lease accruals, inventory write downs, severance expenses and other facility closure costs. Included in the 2009 charges is the impact of a reclassification to the accrued lease liability of previously accrued lease related costs such as tenant improvement allowances and various rent credits associated with facilities closed during 2009. The net effect of this reclassification was to lower the lease-related charges recognized in 2009 by approximately $32 million. The 2008 charges related primarily to asset impairments, inventory write downs and lease accruals. |
| • | Supply Chain Initiatives — As a result of the strategic review of our supply chain operations, we consolidated certain facilities in North America and Europe. During 2009, we closed five distribution centers and six crossdock facilities in North America and completed the consolidation of our distribution centers in Europe. Charges related to these actions totaled approximately $57 million in 2009 and related primarily to lease accruals, inventory write downs, severance expenses and other facility closure costs. The 2008 charges under these initiatives totaled approximately $22 million and consisted primarily of accelerated depreciation, severance related costs and lease accruals. |
| • | Asset Sales and Sale-Leaseback Transactions — As a result of the strategic review and to enhance liquidity, we entered into multiple sale and sale-leaseback transactions. Total proceeds from these transactions were approximately $150 million and are included in the investing section on our Consolidated Statement of Cash Flows. Losses on these transactions are included in the Charges and totaled approximately $22 million in 2009. Gains have been deferred and will reduce rent expense over the related leaseback periods. One transaction was the sale of an asset previously classified as a capital lease. Payments to satisfy the existing capital lease obligation are included in the financing section of the Consolidated Statement of Cash Flows. An additional sale-leaseback arrangement associated with operating properties included provisions that resulted in the transaction being accounted for as a financing. Accordingly, approximately $19 million has been included in long-term debt on the Consolidated Balance Sheet at December 26, 2009. |
62
Table of Contents
| • | Headcount Reductions and Other Restructuring Activities — Each of the Divisions, as well as Corporate eliminated positions in an effort to centralize activities and eliminate geographic redundancies. Total severance and termination benefit costs associated with these actions totaled approximately $22 million and $13 million during 2009 and 2008, respectively. During 2009, we also recorded charges for contract terminations on certain leased assets totaling approximately $17 million and for other restructuring activities totaling approximately $7 million. Additionally, we recognized a non-cash loss of approximately $6 million in conjunction with the disposition of other assets during 2009. This loss is reflected in other associated costs in the table below. Charges for other restructuring activities in 2008 totaled approximately $60 million and related primarily to asset write downs and costs associated with the restructuring of our back office operations and call centers in Europe. |
As previously disclosed, in 2005, we announced a series of activities to restructure operations and recognized charges associated with exit costs, as well as other asset impairments. Associated pre-tax Charges in 2007 totaled $40 million and related primarily to the consolidation of warehouses and distribution centers in North America and Europe as well as management restructuring and call center consolidation in Europe.
Exit cost accruals related to the activities described above are as follows:
| (Dollars in millions) | Beginning Balance |
Charges Incurred |
Cash Payments |
Non-cash settlements |
Adjustments | Ending Balance | |||||||||||||||
| 2009 |
|||||||||||||||||||||
| Cost of goods sold |
$ | — | $ | 13 | $ | — | $ | (13 | ) | $ | — | $ | — | ||||||||
| One-time termination benefits |
14 | 34 | (33 | ) | — | (2 | ) | 13 | |||||||||||||
| Asset impairments and accelerated depreciation |
— | 39 | — | (39 | ) | — | — | ||||||||||||||
| Lease and contract obligations |
33 | 149 | (57 | ) | 36 | 1 | 162 | ||||||||||||||
| Other associated costs |
— | 18 | (12 | ) | (7 | ) | 1 | — | |||||||||||||
| Total |
$ | 47 | $ | 253 | $ | (102 | ) | $ | (23 | ) | $ | — | $ | 175 | |||||||
| 2008 |
|||||||||||||||||||||
| Cost of goods sold |
$ | — | $ | 16 | $ | — | $ | (16 | ) | $ | — | $ | — | ||||||||
| One-time termination benefits |
13 | 32 | (28 | ) | (3 | ) | — | 14 | |||||||||||||
| Asset impairments and accelerated depreciation |
— | 124 | — | (124 | ) | — | — | ||||||||||||||
| Lease and contract obligations |
17 | 21 | (6 | ) | — | 1 | 33 | ||||||||||||||
| Other associated costs |
— | 6 | (4 | ) | (2 | ) | — | — | |||||||||||||
| Total |
$ | 30 | $ | 199 | $ | (38 | ) | $ | (145 | ) | $ | 1 | $ | 47 | |||||||
Lease accruals on closed facilities reflect the company’s best estimate of its obligations under these long-term arrangements, net of sublease assumptions, discounted at the company’s estimated unsecured borrowing rate at the time of each location closure. This accrued liability may be adjusted in future periods as actual sublease activity is better or worse than estimated. It is currently expected that any such adjustments, as well as accretion of this liability will be reflected as a component of store and warehouse operating and selling expenses and recognized at the corporate level, outside of Division operating profit, in future periods.
Other asset impairments
In addition to the exit costs discussed above, during 2008, we recognized other material charges because of the downturn in our business. Those charges include goodwill and trade name impairment charges, as well as material asset impairments relating to stores and charges to impair amortizing customer relationship intangible assets.
We perform our annual review of goodwill and other non-amortizing intangible assets during the fourth quarter. As a result of this review for 2008, we recorded non-cash charges of $1,213 million to write down goodwill and $57 million related to the impairment of trade names. Our recoverability assessment of these non-amortizing
63
Table of Contents
intangible assets considered company-specific projections, assumptions about market participant views and the company’s overall market capitalization around the testing period. We did not record any impairment charges to goodwill or other non-amortizing intangible assets in 2009 or 2007.
At least annually, we review our stores for possible impairment. Our impairment analysis is based on a cash flow model at the individual store level, beginning with recent store performance and forecasting the anticipated future results based on chain-wide and individual store initiatives. If the anticipated undiscounted cash flows of a store cannot support the carrying amount of the store’s assets, an impairment charge to bring the assets to estimated fair value is recorded to operations as a component of store and warehouse operating and selling expenses. Because of the downturn in our business in late 2008, we recorded store asset impairment charges totaling approximately $98 million in 2008. Store impairment charges totaled approximately $3 million in both 2009 and 2007.
We review our amortizing intangible assets at least annually to determine whether events and circumstances warrant a revision to the remaining period of amortization. In developing forecasts for our assessment of goodwill in 2008, we concluded that the value of certain amortizing intangible assets was impaired. Accordingly, during 2008, we incurred a charge of approximately $11 million to fully impair the customer list intangible assets in our International Division. We did not record any impairment charges to amortizing intangible assets in 2009 or 2007.
NOTE D — PROPERTY AND EQUIPMENT
Property and equipment consisted of:
| (Dollars in thousands) | December 26, 2009 |
December 27, 2008 |
||||||
| Land |
$ | 38,456 | $ | 80,783 | ||||
| Buildings |
354,630 | 472,110 | ||||||
| Leasehold improvements |
997,919 | 1,067,456 | ||||||
| Furniture, fixtures and equipment |
1,703,691 | 1,642,485 | ||||||
| 3,094,696 | 3,262,834 | |||||||
| Less accumulated depreciation |
(1,817,041 | ) | (1,705,533 | ) | ||||
| Total |
$ | 1,277,655 | $ | 1,557,301 | ||||
The 2009 changes in land and buildings resulted primarily from sale and sale-leaseback transactions completed during the year. Depreciation expense was $221.0 million, $245.1 million, and $266.7 million in 2009, 2008 and 2007, respectively. These amounts include accelerated depreciation related to the Charges discussed in Note C.
The above table of property and equipment includes assets held under capital leases as follows:
| (Dollars in thousands) | December 26, 2009 |
December 27, 2008 |
||||||
| Buildings |
$ | 269,232 | $ | 273,502 | ||||
| Furniture, fixtures and equipment |
43,443 | 70,952 | ||||||
| 312,675 | 344,454 | |||||||
| Less accumulated depreciation |
(78,143 | ) | (59,737 | ) | ||||
| Total |
$ | 234,532 | $ | 284,717 | ||||
64
Table of Contents
NOTE E — GOODWILL AND OTHER INTANGIBLE ASSETS
Goodwill
During the fourth quarter of 2008, we performed our annual goodwill impairment testing, which indicated that the goodwill in four of our five reporting units was fully impaired. This resulted in impairment charges totaling $1,213.3 million, most of which was related to acquisitions made in our International and North American Business Solutions Divisions. Approximately $19.4 million of goodwill was not impaired during the fourth quarter of 2008. This remaining goodwill is associated with our North American Business Solutions Division, and the balance has remained constant since December 27, 2008. The components of goodwill by segment are provided in the following table:
| (Dollars in thousands) | North Retail Division |
North American Business Solutions Division |
International Division |
Total | ||||||||||||
| Balance as of December 29, 2007 |
||||||||||||||||
| Goodwill |
$ | 2,315 | $ | 368,628 | $ | 911,514 | $ | 1,282,457 | ||||||||
| Accumulated impairment losses |
— | — | — | — | ||||||||||||
| 2,315 | 368,628 | 911,514 | 1,282,457 | |||||||||||||
| 2008 Changes: |
||||||||||||||||
| Goodwill acquired during the year |
— | — | 73,734 | 73,734 | ||||||||||||
| Purchase price adjustments on 2007 acquisitions |
— | 734 | — | 734 | ||||||||||||
| Foreign currency translation |
(473 | ) | (1,572 | ) | (122,114 | ) | (124,159 | ) | ||||||||
| Impairment losses |
(1,842 | ) | (348,359 | ) | (863,134 | ) | (1,213,335 | ) | ||||||||
| Balance as of December 27, 2008 |
||||||||||||||||
| Goodwill |
1,842 | 367,790 | 863,134 | $ | 1,232,766 | |||||||||||
| Accumulated impairment losses |
(1,842 | ) | (348,359 | ) | (863,134 | ) | (1,213,335 | ) | ||||||||
| — | 19,431 | — | 19,431 | |||||||||||||
| 2009 Changes |
— | — | — | — | ||||||||||||
| Balance as of December 26, 2009 |
||||||||||||||||
| Goodwill |
1,842 | 367,790 | 863,134 | $ | 1,232,766 | |||||||||||
| Accumulated impairment losses |
(1,842 | ) | (348,359 | ) | (863,134 | ) | (1,213,335 | ) | ||||||||
| $ | — | $ | 19,431 | $ | — | $ | 19,431 | |||||||||
Other Intangible Assets
Indefinite-lived intangible assets related to acquired trade names were $6.2 million and $6.1 million, at December 26, 2009 and December 27, 2008, respectively, and are included in other intangible assets in the Consolidated Balance Sheets. Indefinite-lived intangibles are not subject to amortization. Instead, they are tested for impairment at least annually. During 2008, we recorded impairment charges on indefinite-lived intangibles totaling $56.6 million. The change in the balance during 2009 resulted from changes in foreign currency rates.
Amortizing intangible assets, which are included in other intangible assets in the Consolidated Balance Sheets, include the following:
| December 26, 2009 | December 27, 2008 | |||||||||||||
| (Dollars in thousands) | Gross Carrying Value |
Accumulated Amortization |
Gross Carrying Value |
Accumulated Amortization |
||||||||||
| Customer lists |
$ | 28,000 | $ | (9,228 | ) | $ | 28,000 | $ | (6,683 | ) | ||||
| Other |
2,600 | (2,302 | ) | 2,600 | (1,706 | ) | ||||||||
| Total |
$ | 30,600 | $ | (11,530 | ) | $ | 30,600 | $ | (8,389 | ) | ||||
65
Table of Contents
We review our amortizing intangible assets at least annually to determine whether events and circumstances warrant a revision to the remaining period of amortization. During the fourth quarter of 2008, we concluded that the value of certain amortizing intangible assets was impaired, and accordingly, we incurred a charge of $10.9 million to fully impair the customer list intangible assets in our International Division.
Amortization of intangible assets was $3.1 million in 2009, $9.0 million in 2008, and $15.3 million in 2007 (at average foreign currency exchange rates).
The weighted average amortization period for the remaining finite-lived intangible assets is 7.3 years. Estimated future amortization expense for the next five years at December 26, 2009 is as follows:
| (Dollars in thousands) | |||
| 2010 |
$ | 2,843 | |
| 2011 |
2,545 | ||
| 2012 |
2,545 | ||
| 2013 |
2,545 | ||
| 2014 |
2,545 | ||
NOTE F — DEBT
Debt consists of the following:
| (Dollars in thousands) | December 26, 2009 |
December 27, 2008 | ||||
| Short-term borrowings and current maturities of long-term debt: |
||||||
| Short-term borrowings |
$ | 44,121 | $ | 176,644 | ||
| Capital lease obligations |
14,646 | 14,773 | ||||
| Current maturities of long-term debt |
1,078 | 515 | ||||
| $ | 59,845 | $ | 191,932 | |||
| Long-term debt, net of current maturities: |
||||||
| $400 million senior notes |
$ | 400,172 | $ | 400,278 | ||
| Capital lease obligations |
243,502 | 287,349 | ||||
| Other |
19,066 | 1,161 | ||||
| $ | 662,740 | $ | 688,788 | |||
On September 26, 2008, the company entered into a Credit Agreement (the “Agreement”) with a group of lenders, which provides for an asset based, multi-currency revolving credit facility (the “Facility”) of up to $1.25 billion. The amount that can be drawn on the Facility at any given time is determined based on percentages of certain accounts receivable, inventory and credit card receivables (the “Borrowing Base”). At December 26, 2009, the company was eligible to borrow approximately $872 million of the Facility based on the December borrowing base certificate. The Facility includes a sub-facility of up to $250 million which is available to certain of the company’s European subsidiaries (the “European Borrowers”). Certain of the company’s domestic subsidiaries (the “Domestic Guarantors”) guaranty the obligations under the Facility. The Agreement also provides for a letter of credit sub-facility of up to $400 million. All loans borrowed under the Agreement may be borrowed, repaid and reborrowed from time to time until September 26, 2013 (or, in the event that the company’s existing 6.25% Senior Notes are not repaid, then February 15, 2013), on which date the Facility matures.
All amounts borrowed under the Facility, as well as the obligations of the Domestic Guarantors, are secured by a lien on the company’s and such Domestic Guarantors’ accounts receivables, inventory, cash and deposit accounts. All amounts borrowed by the European Borrowers under the Facility are secured by a lien on such European Borrowers’ accounts receivable, inventory, cash and deposit accounts, as well as certain other assets.
66
Table of Contents
At the company’s option, borrowings made pursuant to the Agreement bear interest at either, (i) the alternate base rate (defined as the higher of the Prime Rate (as announced by the Agent) and the Federal Funds Rate plus 1/2 of 1%) or (ii) the Adjusted LIBOR Rate (defined as the LIBOR Rate as adjusted for statutory revenues) plus, in either case, a certain margin based on the aggregate average availability under the Facility. The Agreement also contains representations, warranties, affirmative and negative covenants, and default provisions which are conditions precedent to borrowing. The most significant of these covenants and default provisions include a capital expenditure limitation of $500 million in any fiscal year and limitations in certain circumstances on acquisitions, dispositions, share repurchases and the payment of cash dividends. The dividend restrictions are based on the then-current and proforma fixed charge coverage ratio and borrowing availability at the point of consideration. We may seek a modification to the Agreement to allow payment of Preferred Stock dividends in cash in future periods. The company has never declared or paid cash dividends on its common stock. The company was in compliance with all financial covenants at December 26, 2009. The Facility also includes provisions whereby if the global availability is less than $218.8 million, or the European availability is below $37.5 million, the company’s cash collections go first to the Agent to satisfy outstanding borrowings. Further, if total availability falls below $187.5 million, a fixed charge coverage ratio test is required which, based on current forecasts, could effectively eliminate additional borrowing under the Facility. Any event of default that is not cured within the permitted period, including non-payment of amounts when due, any debt in excess of $25 million becoming due before the scheduled maturity date, or the acquisition of more than 40% of the ownership of the company by any person or group, could result in a termination of the Facility and all amounts outstanding becoming immediately due and payable.
At December 26, 2009, the company had approximately $726.1 million of available credit under the Facility. At December 26, 2009, there were no borrowings outstanding under the Facility and there were letters of credit outstanding under the Facility totaling approximately $146.4 million. An additional $0.7 million of letters of credit were outstanding under separate agreements. Average borrowings under the Facility from December 27, 2008 to June 27, 2009 were approximately $180 million at an average interest rate of 3.92%. We did not borrow under our asset based credit facility during the second half of 2009.
At December 26, 2009, we had short-term borrowings of $44.1 million. These borrowings primarily represent outstanding balances under various local currency credit facilities for our international subsidiaries that had an effective interest rate at the end of the year of approximately 2.35%. The majority of these short-term borrowings represent outstanding balances on uncommitted lines of credit, which do not contain financial covenants.
In December 2008, the company’s credit rating was downgraded which provided the counterparty to the company’s private label credit card program the right to terminate the agreement and require the company to repurchase the outstanding balance credit card receivables. The company and the counterparty subsequently amended the agreement to permanently eliminate this provision. The company maintains a $25 million letter of credit in support of this agreement.
In August 2003, we issued $400 million senior notes due August 2013. These notes are not callable and bear interest at the rate of 6.25% per year, to be paid on February 15 and August 15 of each year. The notes contain provisions that, in certain circumstances, place financial restrictions or limitations on us. Simultaneous with completing the offering, we liquidated a treasury rate lock. The proceeds are being amortized over the term of the issue, reducing the effective interest rate to 5.87%. During 2004, we entered into a series of fixed-to-variable interest rate swap agreements as fair value hedges on the $400 million of notes. The swap agreements were terminated during 2005.
Capital lease obligations primarily relate to buildings and equipment as indicated in Note D.
67
Table of Contents
Aggregate annual maturities of long-term debt and capital lease obligations are as follows:
| (Dollars in thousands) | |||
| 2010 |
$ | 77,535 | |
| 2011 |
31,441 | ||
| 2012 |
29,430 | ||
| 2013 |
429,011 | ||
| 2014 |
29,164 | ||
| Thereafter |
279,241 | ||
| Total |
875,822 | ||
| Less amount representing interest on capital leases |
153,237 | ||
| Total |
722,585 | ||
| Less current portion |
59,845 | ||
| Total long-term debt |
$ | 662,740 | |
NOTE G — INCOME TAXES
The income tax expense (benefit) related to earnings (loss) from operations consisted of the following:
| (Dollars in thousands) | 2009 | 2008 | 2007 | |||||||||
| Current: |
||||||||||||
| Federal |
$ | (41,997 | ) | $ | (16,430 | ) | $ | 50,602 | ||||
| State |
2,228 | 6,622 | 728 | |||||||||
| Foreign |
1,455 | 19,262 | 12,710 | |||||||||
| Deferred : |
||||||||||||
| Federal |
233,398 | (125,945 | ) | 72,017 | ||||||||
| State |
46,845 | 18,606 | (38,183 | ) | ||||||||
| Foreign |
45,643 | (760 | ) | (34,856 | ) | |||||||
| Total income tax expense (benefit) |
$ | 287,572 | $ | (98,645 | ) | $ | 63,018 | |||||
The components of earnings (loss) before income taxes consisted of the following:
| (Dollars in thousands) | 2009 | 2008 | 2007 | ||||||
| North America |
$ (271,520) | $ | (733,342 | ) | $ | 276,040 | |||
| International |
(39,632) | (846,306 | ) | 181,682 | |||||
| Total |
$ (311,152) | $ | (1,579,648 | ) | $ | 457,722 | |||
68
Table of Contents
The tax-effected components of deferred income tax assets and liabilities consisted of the following:
| (Dollars in thousands) |
December 26, 2009 |
December 27, 2008 |
||||||
| Foreign and state net operating loss carryforwards |
$ | 343,343 | $ | 332,844 | ||||
| Deferred rent credit |
104,292 | 102,903 | ||||||
| Vacation pay and other accrued compensation |
85,912 | 69,706 | ||||||
| Accruals for facility closings |
54,122 | 12,009 | ||||||
| Inventory |
23,912 | 32,713 | ||||||
| Self-insurance accruals |
19,387 | 17,144 | ||||||
| Deferred revenue |
13,787 | 17,198 | ||||||
| State credit carryforwards, net of Federal benefit |
10,698 | 8,028 | ||||||
| Allowance for bad debts |
9,475 | 6,637 | ||||||
| Accrued rebates |
6,058 | 7,840 | ||||||
| Basis difference in fixed assets |
— | 66,130 | ||||||
| Other items, net |
75,553 | 61,465 | ||||||
| Gross deferred tax assets |
746,539 | 734,617 | ||||||
| Valuation allowance |
(656,943 | ) | (242,481 | ) | ||||
| Deferred tax assets |
89,596 | 492,136 | ||||||
| Internal software |
23,857 | 93,376 | ||||||
| Basis difference in fixed assets |
17,098 | — | ||||||
| Other items, net |
— | 4,669 | ||||||
| Deferred tax liabilities |
40,955 | 98,045 | ||||||
| Net deferred tax assets |
$ | 48,641 | $ | 394,091 | ||||
As of December 26, 2009, we had approximately $1.1 billion of foreign and $901.7 million of state net operating loss carryforwards. Of the foreign carryforwards, $765.0 million can be carried forward indefinitely, $27.6 million will expire in 2010, and the balance will expire between 2011 and 2029. Of the state carryforwards, $3.0 million will expire in 2010, and the balance will expire between 2011 and 2029.
U.S. income taxes have not been provided on the undistributed earnings of foreign subsidiaries, which were approximately $1.1 billion as of December 26, 2009. We have reinvested such earnings overseas in foreign operations indefinitely and expect that future earnings will also be reinvested overseas indefinitely.
Valuation allowances have been established to reduce our deferred asset to an amount that is more likely than not to be realized and is based upon the uncertainty of the realization of certain deferred tax assets related to net operating loss carryforwards and other tax attributes. Because of the downturn in our performance during this recessionary period, as well as the significant restructuring activities and charges we have taken in response, during the third quarter of 2009, the company established valuation allowances totaling $321.6 million, with $279.1 million related to domestic deferred tax assets and $42.5 million related to foreign deferred tax assets. The establishment of valuation allowances and development of projected annual effective tax rates requires significant judgment and is impacted by various estimates. Both positive and negative evidence, as well as the objectivity and verifiability of that evidence, is considered in determining the appropriateness of recording a valuation allowance on deferred tax assets. An accumulation of recent pre-tax losses is considered strong negative evidence in that evaluation. The charge to establish the valuation allowance followed the third quarter 2009 condition of reaching or nearly reaching a 36 month cumulative loss position in certain taxing jurisdictions. While the company believes positive evidence exists with regard to the realizability of these deferred tax assets, it is not considered sufficient to outweigh the objectively verifiable negative evidence, including the cumulative 36 month pre-tax loss history. Deferred tax assets without valuation allowances remain in certain foreign tax jurisdictions where supported by the evidence.
69
Table of Contents
The following is a reconciliation of income taxes at the Federal statutory rate to the provision (benefit) for income taxes:
| (Dollars in thousands) | 2009 | 2008 | 2007 | |||||||||
| Federal tax computed at the statutory rate |
$ | (108,903 | ) | $ | (552,877 | ) | $ | 160,203 | ||||
| State taxes, net of Federal benefit |
1,951 | (3,838 | ) | 8,217 | ||||||||
| Foreign income taxed at rates other than Federal |
(21,882 | ) | (29,684 | ) | (62,393 | ) | ||||||
| Non-deductible goodwill and other impairments |
— | 356,138 | — | |||||||||
| Increase (reduction) in valuation allowance |
387,735 | 47,874 | (34,195 | ) | ||||||||
| Settlement of tax audits |
— | — | (941 | ) | ||||||||
| Non-deductible foreign interest |
13,198 | 40,166 | 2,392 | |||||||||
| Change in accrual estimates relating to uncertain tax positions |
5,526 | 3,661 | (9,097 | ) | ||||||||
| Other items, net |
9,947 | 39,915 | (1,168 | ) | ||||||||
| Income tax expense (benefit) |
$ | 287,572 | $ | (98,645 | ) | $ | 63,018 | |||||
The following table summarizes the activity related to our unrecognized tax benefits during 2009:
| (Dollars in thousands) | 2009 | 2008 | ||||||
| Beginning Balance |
$ | 119,626 | $ | 110,407 | ||||
| Additions based on tax positions related to the current year |
5,505 | 10,767 | ||||||
| Additions for tax positions of prior years |
19,149 | 17,720 | ||||||
| Reductions for tax positions of prior years |
(2,820 | ) | (19,035 | ) | ||||
| Statute expirations |
(335 | ) | (233 | ) | ||||
| Settlements |
— | — | ||||||
| Ending Balance |
$ | 141,125 | $ | 119,626 | ||||
Included in the balance of $141.1 million at December 26, 2009, are $125.2 million of net unrecognized tax benefits that, if recognized, would affect the effective tax rate. The difference of $15.9 million primarily results from federal tax impacts on state tax issues and positions which if sustained would be fully offset by a valuation allowance.
We file a U.S. federal income tax return and other income tax returns in various states and foreign jurisdictions. With few exceptions, we are no longer subject to U.S. federal, state and local, or non-U.S. income tax examinations for years before 2000. Our U.S. federal filings for the years 2000 and 2002 through 2008 are under routine examination, and it is reasonably possible that audits for some of these periods will be closed prior to the end of 2010. Additionally, the U.S. federal tax return for 2009 is under concurrent year review. Significant international tax jurisdictions include the UK, the Netherlands, France and Germany. Generally, we are subject to routine examination for years 2001 and forward in these jurisdictions. It is reasonably possible that certain of these audits will close within the next 12 months, which could result in a decrease of as much as $68.5 million or an increase of as much as $35.4 million to our accrued uncertain tax positions. Additionally, we anticipate that it is reasonably possible that new issues will be raised or resolved by tax authorities that may require changes to the balance of unrecognized tax benefits, however, an estimate of such changes cannot reasonably be made.
We recognize interest related to unrecognized tax benefits in interest expense and penalties in the provision for income taxes. We recognized interest and penalties of approximately $4.4 million and $11.5 million in 2009 and 2008, respectively. We had approximately $53.3 million accrued for the payment of interest and penalties as of December 26, 2009.
70
Table of Contents
In connection with the expensing of the fair value of employee stock options, we have elected to calculate our pool of excess tax benefits under the alternative, or “short-cut” method. At adoption, this pool of benefits was approximately $55.3 million and was approximately $101.1 million as of December 26, 2009. This pool may increase in future periods if tax benefits realized are in excess of those based on grant date fair values or may decrease if used to absorb future tax deficiencies determined for financial reporting purposes.
NOTE H — COMMITMENTS AND CONTINGENCIES
Operating Leases: We lease retail stores and other facilities and equipment under operating lease agreements with initial lease terms expiring in various years through 2032. In addition to minimum rentals, there are certain executory costs such as real estate taxes, insurance and common area maintenance on most of our facility leases. Many lease agreements contain tenant improvement allowances, rent holidays, and/or rent escalation clauses. For purposes of recognizing incentives and minimum rental expenses on a straight-line basis over the terms of the leases, we use the date of initial possession to begin amortization.
We recognize a deferred rent liability for tenant improvement allowances and rent holidays and amortize these amounts over the terms of the related leases as a reduction of rent expense. Rent related accruals totaled approximately $270 million and $298 million at December 26, 2009 and December 27, 2008, respectively. The short-term and long-term components of these liabilities are included in accrued expenses and other long-term liabilities, respectively, on the Consolidated Balance Sheets. For scheduled rent escalation clauses during the lease terms or for rental payments commencing at a date other than the date of initial occupancy, we record minimum rental expenses on a straight-line basis over the terms of the leases.
Certain leases contain provisions for additional rent to be paid if sales exceed a specified amount, though such payments have been immaterial during the years presented.
The table below shows future minimum lease payments due under the non-cancelable portions of our leases as of December 26, 2009. These minimum lease payments include facility leases that were accrued as store closure costs. Additional information including optional lease renewals follows this table.
| (Dollars in thousands) | |||
| 2010 |
$ | 533,488 | |
| 2011 |
455,564 | ||
| 2012 |
396,982 | ||
| 2013 |
342,783 | ||
| 2014 |
280,630 | ||
| Thereafter |
946,383 | ||
| 2,955,830 | |||
| Less sublease income |
44,226 | ||
| Total |
$ | 2,911,604 | |
We determine the lease term at inception to be the non-cancelable rental period plus any renewal options that are considered reasonably assured. Leasehold improvements are depreciated over the shorter of their estimated useable lives or the identified lease term. Lease payments for the next five years and thereafter that include both the non-cancelable amounts from above, plus the renewal options included in our projected lease term are, $537 million for 2010; $481 million for 2011; $438 million for 2012; $401 million for 2013; $367 million for 2014 and $1,964 million thereafter, for a total of $4,188 million, $4,144 million net of sublease income.
Rent expense, including equipment rental, was $498.6 million, $525.8 million and $519.1 million in 2009, 2008, and 2007, respectively. Rent expense was reduced by sublease income of $2.9 million in 2009, $3.1 million in 2008 and $2.8 million in 2007.
71
Table of Contents
Indemnification of Private Label Credit Card Receivables: Office Depot has a private label credit card program that is managed by a third-party financial services company. We transfer the credit card receivable balance each business day, with the difference between the transferred amount and the amount received recognized in store and warehouse operating and selling expense. At December 26, 2009, the outstanding balance of credit card receivables transferred was approximately $148.3 million. The company’s estimated liability associated with risk of loss totaled approximately $16 million and $23 million at December 26, 2009 and December 27, 2008, respectively. This accrual is included in accrued expenses on the Consolidated Balance Sheets. Following the company’s credit rating downgrade in December 2008, the underlying agreement was amended to permanently eliminate a provision that allowed both parties to terminate the agreement early in the event either party suffered a material adverse change, and put in place a letter of credit arrangement supporting the company’s potential exposure on indemnification of the transferred receivable balance. See Note F for additional discussion.
Change in Control Features in Certain Employment Contracts: Following shareholder approval of our Preferred Stock transaction, the vesting of certain employee share-based awards accelerated, resulting in the recognition of approximately $9 million of compensation expense during the fourth quarter of 2009. Additionally, change in control features in certain employment contracts could result in additional expenses in future periods if covered executives are involuntarily, or in certain cases, voluntarily terminated. In February 2010, the employment agreement between the company and its Chief Executive Officer was modified to amend, among other things, certain change in control provisions. Following this amendment, if all remaining executives covered by voluntary termination provisions elected to leave, the required cash payment would aggregate to approximately $8 million.
Legal Matters: We are involved in litigation arising in the normal course of our business. While, from time to time, claims are asserted that make demands for a large sum of money (including, from time to time, actions which are asserted to be maintainable as class action suits), we do not believe that contingent liabilities related to these matters, either individually or in the aggregate, will materially affect our financial position, results of our operations or cash flows.
As previously disclosed, the company reached a proposed settlement with the staff of the U.S. Securities and Exchange Commission (“SEC”) to resolve the previously disclosed SEC inquiry that commenced in July of 2007 and the formal investigation disclosed in January of 2008 with respect to contacts and communications with financial analysts, inventory receipt and reserves, timing of vendor payments, certain intercompany loans, certain payments to foreign officials, inventory obsolescence and timing and recognition of vendor program funds. The company and its officers and employees have cooperated with the SEC staff in this investigation. The SEC staff intends to recommend to the SEC a proposed settlement with respect to the company which would conclude for the company all matters arising from the SEC investigation. Under the proposed settlement, the company, without admitting or denying liability, has agreed to pay a civil penalty and to consent to a cease and desist order from committing or causing violations of Regulation FD and Sections 13(a) and 13(b) of the Securities Exchange Act of 1934 (and related rules) which require the maintenance of accurate books and records and internal controls. Regulation FD is a rule regarding communication with analysts and investors. The proposed settlement is contingent on the review and approval of final documentation by the company and the SEC staff, and is subject to approval by the SEC Commissioners. There can be no assurance that the SEC Commissioners will approve the staff’s recommendation. The company has also been informed that the company’s CEO and two former employees each received “Wells” notices from the staff of the SEC’s Miami Regional Office advising them that the regional staff has made a preliminary decision to recommend that the SEC bring civil enforcement actions against them for possible violations of Regulation FD. Under the processes established by the SEC, these individuals will have an opportunity to present their perspective and to address the issues raised by the SEC staff prior to any action being taken by the SEC.
72
Table of Contents
On January 14, 2010, the federal court in the Southern District of Florida dismissed the Second Consolidated Amended Complaint filed by the New Mexico Educational Retirement Board, lead plaintiff in a Consolidated Lawsuit, with prejudice. On February 9, 2010, the lead plaintiff filed a notice to appeal this decision. As background, in early November 2007, two putative class action lawsuits were filed against the company and certain of its executive officers alleging violations of the Securities Exchange Act of 1934. The allegations made in these lawsuits primarily related to the accounting for vendor program funds. Each of the foregoing lawsuits was filed in the Southern District of Florida and captioned as follows: (1) Nichols v. Office Depot, Inc., Steve Odland and Patricia McKay filed on November 6, 2007 and (2) Sheet Metal Worker Local 28 Pension Fund v. Office Depot, Inc., Steve Odland and Patricia McKay filed on November 5, 2007. On March 21, 2008, the court in the Southern District of Florida entered an Order consolidating the class action lawsuits (the “Consolidated Lawsuit”). Lead plaintiff in the Consolidated Lawsuit, the New Mexico Educational Retirement Board, filed its Consolidated Amended Complaint on July 2, 2008, and its Second Consolidated Amended Complaint on April 20, 2009.
In addition, in the ordinary course of business, our sales to and transactions with government customers may be subject to audits and review by governmental authorities and regulatory agencies. Many of these audits and reviews are resolved without incident; however, we have had several claims and inquiries by certain governmental agencies into contract pricing, and additional inquiries may follow. While these claims may assert large demands, we do not believe that contingent liabilities related to these matters, either individually or in the aggregate, will materially affect our financial position, results of our operations or cash flows.
NOTE I — EMPLOYEE BENEFIT PLANS
Long-Term Incentive Plan
During 2007, the company’s board of directors adopted a new equity incentive plan which obtained shareholder approval on April 25, 2007. This plan is known as the Office Depot, Inc. 2007 Long-Term Incentive Plan (the “Plan”) and replaces the Long-Term Equity Incentive Plan which expired in October 2007. We believe the Plan aligns the interests of its officers, directors and key employees with the interests of its shareholders. The Plan permits the issuance of stock options, stock appreciation rights, restricted stock, restricted stock units, performance-based, and other equity-based incentive awards. The option exercise price for each grant of a stock option shall not be less than 100% of the fair market value of a share of common stock on the date the option is granted. Options granted under the Plan become exercisable from one to five years after the date of grant, provided that the individual is continuously employed with the company. All options granted expire no more than ten years following the date of grant.
Long-Term Incentive Stock Plan
A summary of the activity in our stock option plans for the last three years is presented below.
| 2009 | 2008 | 2007 | ||||||||||||||||
| Shares | Weighted Average Exercise Price |
Shares | Weighted Average Exercise Price |
Shares | Weighted Average Exercise Price | |||||||||||||
| Outstanding at beginning of year |
14,479,141 | $ | 22.78 | 13,594,302 | $ | 23.86 | 12,384,083 | $ | 20.14 | |||||||||
| Granted |
11,901,752 | 0.93 | 3,185,511 | 10.56 | 3,522,720 | 32.52 | ||||||||||||
| Canceled |
(2,178,178 | ) | 15.99 | (2,190,928 | ) | 21.48 | (434,863 | ) | 25.12 | |||||||||
| Exercised |
— | — | (109,744 | ) | 10.36 | (1,877,638 | ) | 16.11 | ||||||||||
| Outstanding at end of year |
24,202,715 | $ | 11.81 | 14,479,141 | $ | 22.78 | 13,594,302 | $ | 23.86 | |||||||||
73
Table of Contents
The weighted-average grant date fair values of options granted during 2009, 2008, and 2007 were $0.69, $4.64, and $10.05, respectively, using the following weighted average assumptions for grants:
| • | Risk-free interest rates of 2.1% for 2009, 2.7% for 2008, and 4.5% for 2007 |
| • | Expected lives of 4.5 years for 2009, 4.4 years for 2008, and 4.7 years for 2007 |
| • | A dividend yield of zero for all three years |
| • | Expected volatility ranging from 70% to 118% for 2009, 43% to 65% for 2008, 25% to 43% for 2007 |
The following table summarizes information about options outstanding at December 26, 2009.
| Options Outstanding | Options Exercisable | |||||||||||||
| Range of Exercise Prices |
Number Outstanding |
Weighted Average Remaining (in years) |
Weighted Price |
Number Exercisable |
Weighted Average Remaining (in years) |
Weighted Exercise | ||||||||
| $0.85- $4.42 |
11,382,252 | 6.17 | $ | 0.89 | 1,283,252 | 6.06 | $ | 0.93 | ||||||
| 4.43- 10.00 |
990,727 | 3.92 | 7.40 | 562,341 | 2.41 | 8.07 | ||||||||
| 10.01- 15.00 |
3,148,622 | 3.88 | 11.30 | 1,810,244 | 2.91 | 11.33 | ||||||||
| 15.01- 22.45 |
3,002,018 | 3.28 | 18.28 | 2,954,876 | 3.26 | 18.23 | ||||||||
| 22.46- 41.25 |
5,679,096 | 4.01 | 31.35 | 5,243,291 | 3.99 | 31.21 | ||||||||
| $0.85- $41.25 |
24,202,715 | 4.92 | $ | 11.81 | 11,854,004 | 3.79 | $ | 20.56 | ||||||
The intrinsic value of options exercised in 2008 and 2007, was $0.3 million, and $33.7 million, respectively. There were no option exercises in 2009.
As of December 26, 2009, there was approximately $12 million of total stock-based compensation expense that has not yet been recognized relating to non-vested awards granted under our option plans. This expense, net of forfeitures, is expected to be recognized over a weighted-average period of approximately 1.6 years. Of the 12.3 million unvested shares, we estimate that 11.7 million, or 95%, will vest. The number of exercisable shares was 11.9 million shares of common stock at December 26, 2009, 8.9 million shares of common stock at December 27, 2008, and 7.9 million shares of common stock at December 29, 2007.
In February 2010, the company’s board of directors approved a stock option exchange program, subject to approval by the company’s shareholders. If approved by shareholders, employees with existing stock options that have an exercise price in excess of the higher of the 52-week high closing price of our common stock or 50% greater than the stock price at start of the exchange program, may elect to exchange those options for a lesser number of new options with an equivalent value. The fair value of the surrendered and new options will be measured using the Black-Scholes option valuation model on the exchange date. The new options will vest over the succeeding three years. The program is structured to be a value-for-value exchange and no significant compensation expense is anticipated. Certain members of senior management will not be allowed to participate and other limitations and features of the proposed exchange programs exist. Approximately 600,000 surrendered options will be retained for future issuance and the remainder will be cancelled.
74
Table of Contents
Restricted Stock and Performance-Based Grants
Our employee share-based awards are generally issued in the first quarter of the year. In 2009, we granted the majority of our awards in stock options. Restricted stock grants typically vest annually over a three-year service period, however, grants made to the company’s board of directors vest immediately and are free of restrictions. In 2009, we granted approximately 22,000 shares of restricted stock with a weighted average fair value of $0.85 based on the grant date market price. As of December 26, 2009, all of the shares granted in 2009 had vested. In 2008, we granted to employees approximately 2.7 million shares of time-based restricted stock with annual vesting over a three-year service period valued at the grant date market price of $11.24 per share. A summary of the status of the company’s nonvested shares as of December 26, 2009, and changes during the year ended December 26, 2009 is presented below.
| 2009 | 2008 | 2007 | ||||||||||||||||
| Shares | Weighted Average Grant-Date Price |
Shares | Weighted Average Grant-Date Price |
Shares | Weighted Average Grant-Date Price | |||||||||||||
| Nonvested at beginning of year |
2,663,216 | $ | 14.06 | 850,115 | $ | 30.67 | 1,675,130 | $ | 19.82 | |||||||||
| Granted |
21,628 | 0.85 | 2,651,737 | 11.24 | 670,013 | 32.46 | ||||||||||||
| Vested |
(1,230,397 | ) | 14.60 | (543,068 | ) | 24.22 | (1,367,070 | ) | 18.31 | |||||||||
| Forfeited |
(136,285 | ) | 15.24 | (295,568 | ) | 17.81 | (127,958 | ) | 30.06 | |||||||||
| Nonvested at end of year |
1,318,162 | $ | 13.21 | 2,663,216 | $ | 14.06 | 850,115 | $ | 30.67 | |||||||||
As of December 26, 2009, there was approximately $8 million of total unrecognized compensation cost related to nonvested restricted stock. That cost, net of forfeitures, is expected to be recognized over a weighted-average period of 1.1 years. We estimate that 5% of these shares will be forfeited. The total grant date fair value of shares vested during 2009 was approximately $18 million.
Employee Stock Purchase Plan
Prior to the end of 2008, the company maintained an Employee Stock Purchase Plan, which was approved by Office Depot’s stockholders. This plan permitted eligible employees to purchase our common stock at 85% of its fair market value. For 2007 and 2008, compensation expense was recognized for the difference between employee cost and fair value. Share needs associated with this plan were satisfied through open market purchases. This plan was terminated, effective December 31, 2008.
Retirement Savings Plans
Eligible company employees may participate in the Office Depot, Inc. Retirement Savings Plan (401(k) Plan), which was approved by the board of directors. This plan allows those employees to contribute a percentage of their salary, commissions and bonuses, up to the higher of $16,500 in 2009 or 50% of their eligible compensation, in accordance with the provisions of Section 401(k) of the Internal Revenue Code. Prior to the end of 2008, employer matching contributions were equivalent to 50% of the first 6% of an employee’s contributions, subject to the limits of the plan. Those contributions were invested in the same manner as the participants’ pre-tax contributions. The plan also allows for a discretionary matching contribution in addition to the normal match contributions if approved by the board of directors. The compensation and benefits committee of the board of directors amended the plan to eliminate the predetermined matching contributions effective with the first payroll period of 2009.
Office Depot also sponsors the Office Depot, Inc. Non-Qualified Deferred Compensation Plan that, until December 2009, permitted eligible highly compensated employees, who were limited in the amount they could contribute to the 401(k) Plan, to alternatively defer a portion of their salary, commissions and bonuses up to maximums and under restrictive conditions specified in this plan and to participate in company matching
75
Table of Contents
provisions. The matching contributions to the deferred compensation plan were allocated to hypothetical investment alternatives selected by the participants. The compensation and benefits committee of the board of directors amended the plan to eliminate the predetermined matching contributions effective with the first payroll period beginning in 2009. Prior to the end of 2008, all deferred compensation plan participants were given the opportunity to take advantage of the transition election rules provided under the final 409A regulations of the Internal Revenue Code to modify distribution elections previously elected for plans years 2005 through 2008. In October 2009, the compensation and benefits committee amended the plan to no longer accept new deferrals.
During 2009, 2008, and 2007, $1.1 million, $12.6 million, $12.0 million, respectively, was recorded as compensation expense for company contributions to these programs and certain international retirement savings plans.
Pension Plan
The company has a defined benefit pension plan covering a limited number of employees in Europe. During 2008, curtailment of that plan was approved by the trustees and future service benefits ceased for the remaining employees, resulting in a curtailment gain of $11.4 million. Also during 2008, in accordance with accounting standards, the company modified the valuation date of plan obligations and assets from the end of October to the end of December. The impact of this change was an immaterial increase in expense which was recognized in operations rather than as an adjustment to retained earnings. The following table provides a reconciliation of changes in the projected benefit obligation, the fair value of plan assets and the funded status of the plan to amounts recognized on our balance sheets:
| (Dollars in thousands) | December 26, 2009 | December 27, 2008 | ||||||
| Changes in projected benefit obligation: |
||||||||
| Obligation at beginning of period |
$ | 154,840 | $ | 230,408 | ||||
| Service cost |
— | 1,708 | ||||||
| Interest cost |
9,006 | 13,434 | ||||||
| Member contributions |
— | 435 | ||||||
| Benefits paid |
(5,041 | ) | (6,998 | ) | ||||
| Actuarial loss (gain) |
18,107 | (14,732 | ) | |||||
| Curtailment (gain) |
— | (11,437 | ) | |||||
| Currency translation |
15,219 | (57,978 | ) | |||||
| Obligation at valuation date |
192,131 | 154,840 | ||||||
| Changes in plan assets: |
||||||||
| Fair value at beginning of period |
84,454 | 162,032 | ||||||
| Actual return on plan assets |
22,898 | (38,595 | ) | |||||
| Company contributions |
5,166 | 7,214 | ||||||
| Member contributions |
— | 435 | ||||||
| Benefits paid |
(5,041 | ) | (6,998 | ) | ||||
| Currency translation |
12,906 | (35,634 | ) | |||||
| Plan assets at valuation date |
120,383 | 88,454 | ||||||
| Benefit obligation in excess of plan assets |
(71,748 | ) | (66,386 | ) | ||||
| Net liability recognized at end of period |
$ | (71,748 | ) | $ | (66,386 | ) | ||
The net unfunded amount is classified as a non-current liability in the caption deferred taxes and other long-term liabilities on the Consolidated Balance Sheets. At December 26, 2009, the deferred loss included in OCI was $14.5 million. A valuation allowance has been recognized in the relevant jurisdiction, resulting in no tax benefit. The $14.5 million deferral is not expected to be amortized into income during 2010. At December 27, 2008, the deferred loss included in OCI was $11.9 million before tax and $7.0 million on an after-tax basis. The 2009
76
Table of Contents
change in deferred amounts reflects an actuarial loss during the period, partially offset by investment returns greater than assumed. The pre-tax and after-tax deferred gains at December 29, 2007 were $22.4 million and $17.1 million, respectively. The plan’s accumulated benefit obligations were approximately $192.1 million and $154.8 million at the 2009 and 2008 valuation dates, respectively.
The components of net periodic expense are presented below:
| (Dollars in thousands) | 2009 | 2008 | 2007 | |||||||||
| Service cost |
$ | — | $ | 1,708 | $ | 4,477 | ||||||
| Interest cost |
9,006 | 13,434 | 11,650 | |||||||||
| Expected return on plan assets |
(6,291 | ) | (11,629 | ) | (8,953 | ) | ||||||
| Curtailment and settlement |
— | (11,437 | ) | — | ||||||||
| Net periodic pension (credit) cost |
$ | 2,715 | $ | (7,924 | ) | $ | 7,174 | |||||
Assumptions used in calculating the funded status included:
| 2009 | 2008 | 2007 | ||||
| Long-term rate of return on plan assets |
6.89% | 6.62% | 6.87% | |||
| Discount rate |
5.70% | 5.50% | 5.40% | |||
| Salary increases |
— | — | 4.40% | |||
| Inflation |
3.80% | 3.10% | 3.40% |
The plan’s investment policies and strategies are to ensure assets are available to meet the obligations to the beneficiaries and to adjust plan contributions accordingly. To achieve the objectives, an investment benchmark and target returns have been established with the goal of consistently outperforming the target index by 1%. Close attention is paid to the risks which could arise through a mismatch between the plan’s assets and its liabilities and the risks which arise form lack of diversification of investments.
The long-term rate of return on assets assumption has been derived based on long-term UK government fixed income yields, having regard to the proportion of assets in each asset class. The funds invested in equities have been assumed to return 4.0% above the return on UK government securities of appropriate duration. Allowance is made for expenses of 0.5% of assets. At December 26, 2009, the long-term UK government securities yield was 4.47%.
The allocation of assets is as follows:
| Percentage of Plan Assets |
Target Allocation | |||||
| 2009 | 2008 | |||||
| Equity securities |
71% | 76% | 60% - 95% | |||
| Debt securities |
27% | 16% | 0% - 30% | |||
| Real estate |
0% | 1% | 0% - 10% | |||
| Other |
2% | 7% | 0% - 10% | |||
| Total |
100% | 100% | ||||
77
Table of Contents
The fair value of plan assets by asset category is as follows:
| (Dollars in thousands) | Fair Value Measurements at December 26, 2009 | |||||||||||
| Asset Category | Total | Quoted Prices (Level 1) |
Significant Observable Inputs (Level 2) |
Significant (Level 3) | ||||||||
| Cash |
$ | 616 | $ | 616 | $ | — | $ | — | ||||
| Equity securities |
86,191 | 86,191 | — | — | ||||||||
| Debt securities |
33,576 | 33,576 | — | — | ||||||||
| Total |
$ | 120,383 | $ | 120,383 | $ | — | $ | — | ||||
Anticipated benefit payments, at December 26, 2009 exchange rates, are as follows:
| (Dollars in thousands) | |||
| 2010 |
$ | 5,143 | |
| 2011 |
5,328 | ||
| 2012 |
5,520 | ||
| 2013 |
5,718 | ||
| 2014 |
5,924 | ||
| Next five years |
32,927 | ||
Employer contributions for 2010 are expected to be approximately $5.3 million (at end of period exchange rates) and include amounts agreed upon with the local regulator to lower the unfunded position. The company will review the funding status with the regulator during 2011 and the incremental funding provisions may change in future periods.
The pension plan was part of an entity acquired in 2003. The purchase and sale agreement included a provision whereby the seller is required to pay to the company an amount of unfunded benefit obligation as measured based on certain 2008 data. The company is in the process of resolving this uncertainty with the seller. We currently cannot predict the outcome of this matter. The after-tax effect of the payment from the seller, if any, will be recognized as a credit to income when all associated uncertainties are resolved.
In addition to the net periodic pension cost above, one foreign entity purchased approximately $5 million of nonparticipating annuity contracts in 2009 and anticipates purchasing approximately $5 million in 2010.
NOTE J — DERIVATIVE INSTRUMENTS AND HEDGING
As a global supplier of office products and services we are exposed to risks associated with changes in foreign currency exchange rates, commodity prices and interest rates. Our foreign operations are typically, but not exclusively, conducted in the currency of the local environment. We are exposed to the risk of foreign currency exchange rate changes when we make purchases, sell products, or arrange financings that are denominated in a currency different from the entity’s functional currency. Depending on the settlement timeframe and other factors, we may enter into foreign currency derivative transactions to mitigate those risks. We may designate and account for such qualifying arrangements as hedges. Gains and losses on these cash flow hedging transactions are deferred in OCI and recognized in earnings in the same period as the hedged item. Transactions that are not designated as cash flow hedges are marked to market at each period with changes in value included in earnings. Historically, we have not entered into transactions to hedge our net investment in foreign operations but may in future periods.
78
Table of Contents
We also are exposed to the risk of changing fuel prices from inbound and outbound transportation arrangements. Some transportation contracts may provide for specific identification of the fuel cost component such that the risk of fuel price changes may be offset by third-party contracts thereby allowing us to designate and qualify these offsetting contracts as cash flow hedges for accounting purposes. Deferred gains or losses associated with these arrangements would be recorded in OCI until such time as the hedged item impacts earnings. The structure of certain other transportation arrangements, however, precludes applying hedge accounting. In those circumstances, we may enter into derivative transactions to offset the risk of commodity price changes, and the value of the derivative contract is marked to market at each reporting period with changes recognized in earnings. As of December 26, 2009, no fuel contracts remained open with the company.
Interest rate changes on our obligations may result from external market factors, as well as changes in our credit rating. We manage our exposure to interest rate risks at the corporate level. Interest rate-sensitive assets and liabilities are monitored and assessed for market risk. Currently, no interest-rate related derivative arrangements are in place. At December 26, 2009 and December 27, 2008, OCI included the deferred gain from a hedge contract terminated in a prior period. This deferral is being amortized to interest expense through 2013.
In certain markets, we may contract with third parties for our future energy needs. Such arrangements are not considered derivatives because they are within the ordinary course of business and are for physical delivery. Accordingly, these arrangements are not included in the tables below.
Financial instruments authorized under the company’s established risk management policy include swaps, options, caps, forwards and futures. Use of derivative financial instruments for trading or speculative purposes is expressly prohibited.
The following tables provide information on our hedging and derivative positions and activity.
| Fair Value of Derivative Instruments As of December 26, 2009 | |||||
| (Dollars in thousands) | Balance Sheet Location | Fair Value | |||
| Derivatives designated as hedging instruments: |
|||||
| Foreign exchange contracts |
Other current liabilities | $ | 266 | ||
| Total derivatives |
$ | 266 | |||
| Derivatives not designated as hedging instruments |
Location of gain/(loss) recognized in earnings |
Amount of gain/(loss) recognized in earnings |
||||
| (Dollars in thousands) | 2009 | |||||
| Commodity contracts — fuel |
Cost of goods sold and occupancy costs & Store and warehouse operating and selling expenses* | $ | 111 | |||
| Foreign exchange contracts |
Miscellaneous income (expense), net | (7,707 | ) | |||
| Total |
$ | (7,596 | ) | |||
79
Table of Contents
| Derivatives designated as cash flow hedges |
Amount of gain/(loss) recognized in OCI |
Location of gain/(loss) reclassified from OCI into earnings |
Amount of gain/(loss) reclassified from OCI into earnings |
|||||||
| (Dollars in thousands) | 2009 | 2009 | ||||||||
| Foreign exchange contracts |
$ | (266 | ) | $ | — | |||||
| Commodity contracts — fuel hedges |
2,919 | Cost of goods sold and occupancy costs & Store and warehouse operating and selling expenses* |
(6,800 | ) | ||||||
| Total |
$ | 2,653 | $ | (6,800 | ) | |||||
| * | Approximately 60% of the losses for 2009 are reflected in cost of goods sold and occupancy costs. The remaining 40% of the losses are reflected in store and warehouse operating and selling expenses. |
As of December 26, 2009, there were no hedging arrangements requiring collateral. However, we may be required to provide collateral on certain arrangements in the future. The fair values of our foreign currency contracts and fuel contracts are the amounts receivable or payable to terminate the agreements at the reporting date, taking into account current exchange rates. The values are based on market-based inputs or unobservable inputs that are corroborated by market data.
NOTE K — CAPITAL STOCK
Preferred Stock
In connection with issuance of the Preferred Stock, the company’s board of directors eliminated 500,000 shares of previously authorized but not outstanding Junior Participating Preferred Stock, Series A. As of December 26, 2009, there were 1,000,000 shares of $0.01 par value preferred stock authorized of which none were issued or outstanding.
Treasury Stock
The Office Depot board of directors has historically authorized a series of common stock repurchase plans, the latest of which is a $500 million authorization in 2007. Under a previously approved plan, we purchased approximately 5.7 million shares at a cost of $199.6 million in 2007. We did not purchase any shares of our common stock during 2008 or 2009, and as of December 26, 2009 the entire $500 million remains available for repurchase under the current authorization. However, common stock repurchases are currently prohibited under our asset based credit facility and, in certain circumstances, require prior approval under our Preferred Stock agreements.
During the second quarter of 2008, we retired approximately 150 million shares of treasury stock. This was a non-cash transaction, and the reduction in the treasury stock account was offset by changes in other equity accounts. The par value of the retired shares was charged against common stock, and the excess of purchase price over par value was allocated between additional paid-in capital and retained earnings using a pro rata method. The impact of this transaction on the Consolidated Balance Sheet was to reduce common stock, additional paid-in capital, retained earnings and treasury stock by approximately $1.5 million, $626.9 million, $2,298.6 million and $2,927.0 million, respectively.
NOTE L — EARNINGS PER SHARE
Basic earnings per share is based on the weighted average number of shares outstanding during each period. Diluted earnings per share reflects the impact of assumed exercise of dilutive stock options, vesting of restricted stock and assumed conversion of redeemable preferred stock.
80
Table of Contents
The following table represents the calculation of net earnings (loss) per common share — basic and diluted:
| (In thousands, except per share amounts) | 2009 | 2008 | 2007 | ||||||||
| Basic Earnings Per Share |
|||||||||||
| Numerator: |
|||||||||||
| Income (loss) available to common shareholders |
$ | (626,971 | ) | $ | (1,478,938 | ) | $ | 395,615 | |||
| Denominator: |
|||||||||||
| Weighted-average shares outstanding |
272,828 | 272,776 | 272,899 | ||||||||
| Basic earnings (loss) per share |
$ | (2.30 | ) | $ | (5.42 | ) | $ | 1.45 | |||
| Diluted Earnings Per Share |
|||||||||||
| Numerator: |
|||||||||||
| Net earnings (loss) attributable to Office Depot, Inc. |
$ | (596,465 | ) | $ | (1,478,938 | ) | $ | 395,615 | |||
| Denominator: |
|||||||||||
| Weighted-average shares outstanding |
272,828 | 272,776 | 272,899 | ||||||||
| Effect of dilutive securities: |
|||||||||||
| Stock options and restricted stock |
3,836 | 289 | 3,041 | ||||||||
| Redeemable preferred stock |
36,418 | — | — | ||||||||
| Diluted weighted-average shares outstanding |
313,082 | 273,065 | 275,940 | ||||||||
| Diluted earnings (loss) per share |
N/A | N/A | $ | 1.43 | |||||||
Awards of options and nonvested shares representing an additional 14.7 million, 15.4 million and 4.3 million shares of common stock were outstanding for the years ended December 26, 2009, December 27, 2008 and December 29, 2007, respectively, but were not included in the computation of diluted earnings per share because their effect would have been antidilutive. The amount indicated in the table above for the 2009 impact of the redeemable preferred stock is the average, calculated from the date of original issuance during the year. The liquidation preference amount at December 26, 2009 would be convertible into approximately 73.6 million shares of common stock. The diluted share amounts for 2009 and 2008 are provided for informational purposes, as the net loss for the periods causes basic earnings per share to be the most dilutive.
Preferred stock dividends are deducted from net income in calculating basic earnings per share (“EPS”) and, if dilutive, the dividends are added back to the numerator while the denominator in increased for the if-converted number of shares for diluted EPS. In periods of positive earnings, and if certain conditions are met, the company will report EPS recognizing both the dividends distributed to the Preferred Stock and any participation rights the Preferred Stock may have in hypothetical distributions of earnings to common stockholders. The company has never paid a dividend on common stock and is currently precluded from such payments under its credit agreements, but the EPS calculation could be impacted in future periods. If dividends on the Preferred Stock are paid in-kind, the fair value increment over the dividend at the stated rate could be allocated to the Preferred Stock in this calculation and reduce the EPS reportable to the common stockholders. The Preferred Stock agreements do not recognize this accounting allocation and no rights are transferred to the Preferred Stockholders.
NOTE M — SUPPLEMENTAL INFORMATION ON OPERATING, INVESTING AND FINANCING ACTIVITIES
Additional supplemental information related to the Consolidated Statements of Cash Flows is as follows:
| (Dollars in thousands) | 2009 | 2008 | 2007 | |||||||
| Cash interest paid (net of amounts capitalized) |
$ | 52,631 | $ | 55,208 | $ | 53,948 | ||||
| Cash taxes paid (refunded) |
(28,320 | ) | 18,848 | 126,182 | ||||||
| Non-cash asset additions under capital leases |
1,813 | 197,912 | 18,435 | |||||||
| Non-cash paid-in-kind dividends (see Note B) |
30,506 | — | — | |||||||
81
Table of Contents
NOTE N — SEGMENT INFORMATION
Office Depot operates in three segments: North American Retail Division, North American Business Solutions Division, and International Division. Each of these segments is managed separately primarily because it serves a different customer group. The accounting policies for each segment are the same as those described in the summary of significant accounting policies (see Note A). Our measure of Division operating profit is based on the measure of performance reported internally to manage the business and for resource allocation. This measure allocates to the respective Divisions those general and administrative expense considered directly or closely related to their operations. Remaining G&A expenses and Charges that are managed at the corporate level are not allocated to the Divisions for measurement of Division operating profit. See Note C for discussion of Charges. Other companies may charge more or less of these items to their segments and our results may not be comparable to similarly titled measures used by other entities.
The following is a summary of our significant accounts and balances by segment, reconciled to our consolidated totals.
| (Dollars in thousands) | North American Retail Division |
North American Business Solutions Division |
International Division |
Eliminations and Other* |
Consolidated Total | ||||||||||||||
| Sales |
2009 | $ | 5,113,553 | $ | 3,483,724 | $ | 3,547,190 | $ | — | $ | 12,144,467 | ||||||||
| 2008 | 6,112,335 | 4,142,146 | 4,241,063 | — | 14,495,544 | ||||||||||||||
| 2007 | 6,813,575 | 4,518,356 | 4,195,606 | — | 15,527,537 | ||||||||||||||
| Division operating profit (loss) |
2009 | $ | 105,542 | $ | 98,163 | $ | 119,604 | $ | — | $ | 323,309 | ||||||||
| 2008 | (29,221 | ) | 119,766 | 157,232 | — | 247,777 | |||||||||||||
| 2007 | 354,547 | 220,137 | 231,056 | (73 | ) | 805,667 | |||||||||||||
| Capital expenditures |
2009 | $ | 40,600 | $ | 21,145 | $ | 20,281 | $ | 48,821 | $ | 130,847 | ||||||||
| 2008 | 103,973 | 9,215 | 77,859 | 139,028 | 330,075 | ||||||||||||||
| 2007 | 197,284 | 18,494 | 129,928 | 114,865 | 460,571 | ||||||||||||||
| Depreciation and amortization |
2009 | $ | 90,973 | $ | 15,471 | $ | 29,032 | $ | 88,639 | $ | 224,115 | ||||||||
| 2008 | 126,212 | 19,745 | 30,744 | 77,398 | 254,099 | ||||||||||||||
| 2007 | 133,012 | 27,135 | 45,291 | 75,945 | 281,383 | ||||||||||||||
| Charges for losses on receivables and inventories |
2009 | $ | 41,740 | $ | 16,932 | $ | 21,506 | $ | — | $ | 80,178 | ||||||||
| 2008 | 80,354 | 36,471 | 23,233 | — | 140,058 | ||||||||||||||
| 2007 | 66,036 | 33,375 | 10,387 | — | 109,798 | ||||||||||||||
| Net earnings from equity method investments |
2009 | $ | — | $ | — | $ | 30,579 | $ | — | $ | 30,579 | ||||||||
| 2008 | — | — | 37,113 | — | 37,113 | ||||||||||||||
| 2007 | — | — | 34,825 | — | 34,825 | ||||||||||||||
| Assets |
2009 | $ | 1,619,854 | $ | 726,296 | $ | 1,493,985 | $ | 1,050,211 | $ | 4,890,346 | ||||||||
| 2008 | 1,866,460 | 799,820 | 1,780,863 | 821,083 | 5,268,226 | ||||||||||||||
| * | Amounts included in “Eliminations and Other” consist of inter-segment sales, if any, which are generally recorded at the cost to the selling entity, and assets (including all cash and equivalents) and depreciation related to corporate activities. |
82
Table of Contents
A reconciliation of the measure of Division operating profit to consolidated earnings from continuing operations before income taxes follows.
| (Dollars in thousands) | 2009 | 2008 | 2007 | |||||||||
| Division operating profit |
$ | 323,309 | $ | 247,777 | $ | 805,667 | ||||||
| (Add)/subtract: |
||||||||||||
| Charges (see Note C) |
253,383 | 1,468,684 | 39,982 | |||||||||
| General and administrative expenses — corporate |
334,931 | 324,134 | 282,084 | |||||||||
| Interest expense |
65,628 | 68,286 | 63,080 | |||||||||
| Interest income |
(2,396 | ) | (10,013 | ) | (9,440 | ) | ||||||
| Miscellaneous income, net |
(17,085 | ) | (23,666 | ) | (27,761 | ) | ||||||
| Earnings (loss) before income taxes |
$ | (311,152 | ) | $ | (1,579,648 | ) | $ | 457,722 | ||||
As of December 26, 2009, we sold to customers in 51 countries throughout North America, Europe, Asia and Latin America. We operate wholly-owned entities, majority-owned entities or participate in other ventures covering 40 countries and have alliances in an additional 11 countries. There is no single country outside of the United States in which we generate 10% or more of our total revenues. Geographic financial information relating to our business is as follows (in thousands).
| Sales | Property and Equipment | ||||||||||||||||
| 2009 | 2008 | 2007 | 2009 | 2008 | |||||||||||||
| United States |
$ | 8,476,404 | $ | 10,083,984 | $ | 11,165,664 | $ | 1,059,236 | $ | 1,216,991 | |||||||
| International |
3,668,063 | 4,411,560 | 4,361,873 | 218,419 | 340,310 | ||||||||||||
| Total |
$ | 12,144,467 | $ | 14,495,544 | $ | 15,527,537 | $ | 1,277,655 | $ | 1,557,301 | |||||||
NOTE O — ACQUISITIONS
During 2008, we acquired a majority ownership position in businesses in India and Sweden, both of which are reflected in our International Division. The company has the right to acquire or may be required to purchase some or all of the noncontrolling interest shares of these businesses at various points over the next year. Also during 2008, we acquired under previously existing put options all remaining noncontrolling interest shares of our joint ventures in Israel and China.
During 2007, we acquired Axidata, Inc., a Canada-based office products delivery company. The subsequent activities have been included in our North American Business Solutions Division.
The transactions for 2008 and 2007 have been included in our consolidated results since the dates of acquisition. The size of these acquisitions is not material to periods presented.
83
Table of Contents
NOTE P — INVESTMENT IN UNCONSOLIDATED JOINT VENTURE
Since 1994, we have participated in a joint venture in Latin America, Office Depot de Mexico. Because we participate equally in this business with a partner, we account for this investment using the equity method. Our proportionate share of Office Depot de Mexico’s net income or loss is presented in miscellaneous income, net in the Consolidated Statements of Operations. During the first quarter of 2009, we received a $13.9 million dividend from this venture. Our investment balance at year end 2009 and 2008 of $168.6 million and $147.1 million, respectively, is included in other assets in the Consolidated Balance Sheets. The following tables provide summarized unaudited information from the balance sheet and statement of earnings for Office Depot de Mexico:
| (Dollars in thousands) | 2009 | 2008 | 2007 | ||||||
| Statement of earnings: |
|||||||||
| Sales |
$ | 825,603 | $ | 952,566 | $ | 850,824 | |||
| Gross profit |
243,957 | 278,764 | 245,295 | ||||||
| Net income |
61,159 | 74,226 | 69,651 | ||||||
| (Dollars in thousands) | December 31, 2009 | December 31, 2008 | ||||
| Balance Sheet: |
||||||
| Current assets |
$ | 219,030 | $ | 207,661 | ||
| Non-current assets |
260,074 | 241,726 | ||||
| Current liabilities |
141,944 | 155,017 | ||||
| Non-current liabilities |
— | — | ||||
NOTE Q — QUARTERLY FINANCIAL DATA (UNAUDITED)
| (In thousands, except per share amounts) | First Quarter | Second Quarter | Third Quarter(1) | Fourth Quarter(2) | ||||||||||||
| Fiscal Year Ended December 26, 2009 |
||||||||||||||||
| Net sales |
$ | 3,225,264 | $ | 2,824,141 | $ | 3,029,207 | $ | 3,065,855 | ||||||||
| Gross profit |
910,262 | 764,048 | 860,123 | 857,751 | ||||||||||||
| Net loss attributable to Office Depot, Inc. |
(54,739 | ) | (82,072 | ) | (398,034 | ) | (61,620 | ) | ||||||||
| Net loss available to common shareholders |
(54,739 | ) | (82,558 | ) | (412,965 | ) | (76,709 | ) | ||||||||
| Net loss per share*: |
||||||||||||||||
| Basic |
$ | (0.20 | ) | $ | (0.31 | ) | $ | (1.51 | ) | $ | (0.28 | ) | ||||
| Diluted |
(0.20 | ) | (0.31 | ) | (1.51 | ) | (0.28 | ) | ||||||||
| * | Due to rounding, the sum of the quarterly earnings per share amounts may not equal the reported earnings per share for the year. |
| (1) | Net loss for the quarter includes a charge of approximately $322 million to establish valuation allowances on certain deferred tax assets. For additional information see Note G. |
| (2) | Net loss for the quarter includes pretax Charges of approximately $58 million (aggregate of $253 million through the four quarters of 2009). For additional information on the Charges, see Note C. |
84
Table of Contents
| First Quarter | Second Quarter | Third Quarter | Fourth Quarter(1) | ||||||||||||
| Fiscal Year Ended December 27, 2008 |
|||||||||||||||
| Net sales |
$ | 3,962,017 | $ | 3,605,073 | $ | 3,657,857 | $ | 3,270,597 | |||||||
| Gross profit |
1,168,680 | 983,516 | 1,024,441 | 829,122 | |||||||||||
| Net earnings (loss) attributable to Office Depot, Inc. |
68,773 | (2,002 | ) | (6,698 | ) | (1,539,011 | ) | ||||||||
| Net earnings (loss) available to common shareholders |
68,773 | (2,002 | ) | (6,698 | ) | (1,539,011 | ) | ||||||||
| Net earnings (loss) per share*: |
|||||||||||||||
| Basic |
$ | 0.25 | $ | (0.01 | ) | $ | (0.02 | ) | $ | (5.64 | ) | ||||
| Diluted |
0.25 | (0.01 | ) | (0.02 | ) | (5.64 | ) | ||||||||
| * | Due to rounding, the sum of the quarterly earnings per share amounts may not equal the reported earnings per share for the year. |
| (1) | Net earnings (loss) for the quarter includes pretax Charges of approximately $1,437.1 million (aggregate of $1,468.9 million through the four quarters of 2008). For additional information on the Charges, see Note C. |
85
Table of Contents
REPORT OF INDEPENDENT REGISTERED PUBLIC ACCOUNTING FIRM
To the Board of Directors and Stockholders of Office Depot, Inc.:
We have audited the consolidated financial statements of Office Depot, Inc. and subsidiaries (the “Company”) as of December 26, 2009 and December 27, 2008, and for each of the three fiscal years in the period ended December 26, 2009, and the Company’s internal control over financial reporting as of December 26, 2009, and have issued our reports thereon dated February 23, 2010; such consolidated financial statements and reports are included elsewhere in this Form 10-K. Our audits also included the consolidated financial statement schedule of the Company listed in the accompanying index at Item 15(a)2. This consolidated financial statement schedule is the responsibility of the Company’s management. Our responsibility is to express an opinion based on our audits. In our opinion, such consolidated financial statement schedule, when considered in relation to the basic consolidated financial statements taken as a whole, presents fairly, in all material respects, the information set forth therein.
/s/ DELOITTE & TOUCHE LLP
Certified Public Accountants
Boca Raton, Florida
February 23, 2010
86
Table of Contents
INDEX TO FINANCIAL STATEMENT SCHEDULES
| Page | ||||
| Schedule II — Valuation and Qualifying Accounts and Reserves |
88 | |||
All other schedules have been omitted because they are not applicable, not required or the information is included elsewhere herein.
87
Table of Contents
OFFICE DEPOT, INC.
VALUATION AND QUALIFYING ACCOUNTS
(In thousands)
| Column A |
Column B | Column C | Column D | Column E | |||||
| Description | Balance at Beginning of Period |
Additions— Charged to Expense |
Deductions— Write-offs, Payments and Other Adjustments |
Balance at End of Period | |||||
| Allowance for doubtful accounts: |
|||||||||
| 2009 |
$ | 45,990 | 22,020 | 35,208 | 32,802 | ||||
| 2008 |
$ | 46,316 | 33,736 | 34,062 | 45,990 | ||||
| 2007 |
$ | 32,581 | 32,163 | 18,428 | 46,316 | ||||
88
Table of Contents
INDEX TO EXHIBITS
| Exhibit Number |
Exhibit |
|||
| 3.1 | Restated Certificate of Incorporation |
(1) | ||
| 3.2 | Amended and Restated Bylaws |
(15) | ||
| 3.3 | Certificate of Elimination of the Junior Participating Preferred Stock, Series A |
(24) | ||
| 3.4 | Certificate of Designations of the 10.00% Series A Redeemable Convertible Participating Perpetual Preferred Stock |
(24) | ||
| 3.5 | Certificate of Designations of the 10.00% Series B Redeemable Conditional Convertible Participating Perpetual Preferred Stock |
(24) | ||
| 4.1 | Form of Certificate representing shares of Common Stock |
(2) | ||
| 4.2 | Indenture, dated as of August 11, 2003, for the $400 million 6.250% Senior Notes due August 15, 2013, by and between Office Depot, Inc. and SunTrust Bank |
(3) | ||
| 4.3 | Supplemental Indenture No. 1, dated as of August 11, 2003, for the $400 million 6.250% Senior Notes due August 15, 2013, by and between Office Depot, Inc. and SunTrust Bank |
(4) | ||
| 4.4 | Supplemental Indenture No. 2, dated as of October 9, 2003, for the $400 million 6.250% Senior Notes due August 15, 2013, by and between Office Depot, Inc. and SunTrust Bank |
(4) | ||
| 4.5 | Investor Rights Agreement, dated as of June 23, 2009, by and among Office Depot, Inc., BC Partners, Inc. and the investors named in the Investor Rights Agreement |
(24) | ||
| 4.6 | Registration Rights Agreement, dated as of June 23, 2009, by and among Office Depot, Inc., BC Partners, Inc. and the investors named in the Registration Rights Agreement |
(24) | ||
| 10.01 | Lease Agreement dated November 10, 2006, by and between Office Depot, Inc. and Boca 54 North LLC |
(23) | ||
| 10.02 | First Amendment to Lease dated July 3, 2007, by and between Office Depot, Inc. and Boca 54 North LLC |
(23) | ||
| 10.03 | Amended Offer Letter dated December 31, 2008, for the Employment of Michael Newman as the Chief Financial Officer of Office Depot, Inc.* |
|||
| 10.04 | Offer Letter dated August 22, 2008, for the Employment of Michael Newman as the Chief Financial Officer of Office Depot, Inc.* |
(23) | ||
| 10.05 | Office Depot, Inc. 2007 Long-Term Incentive Plan* |
(5) | ||
| 10.06 | Form of Indemnification Agreement, dated as of September 4, 1996, by and between Office Depot, Inc. and each of David I. Fuente, Mark D. Begelman, Cynthia
R. Cohen, Herve Defforey, W. Scott Hedrick, James L. Heskett, John B. Mumford, Michael J. Myers, Peter J. Solomon, Alan L. Wurtzel, Barry J. Goldstein, F. Terry Bean, Richard M. Bennington, |
(6) | ||
| 10.07 | Severance Agreement, including Release and Non-Competition Agreement, dated September 19, 2000, by and between Office Depot, Inc. and David I. Fuente (schedules and exhibits omitted)* |
(7) | ||
| 10.08 | Lifetime Consulting and Non-Competition Agreement dated as of March 1, 2002, by and between Office Depot, Inc. and Irwin Helford* |
(8) | ||
| 10.09 | Equity Award Agreement dated as of March 2, 2007, by and between Office Depot, Inc. and Steve Odland* |
(16) | ||
89
Table of Contents
| Exhibit Number |
Exhibit |
|||
| 10.10 | Employment Agreement dated as of March 11, 2005, by and between Office Depot, Inc. and Steve Odland* |
(13) | ||
| 10.11 | Amendment to Executive Employment Agreement dated as of February 19, 2010, by and between Office Depot, Inc. and Steve Odland* |
(15) | ||
| 10.12 | Employment Offer Letter dated August 25, 2005, by and between Office Depot, Inc. and Patricia A. McKay* |
(14) | ||
| 10.13 | Amendment to Executive Employment Agreement dated as of July 26, 2005, by and between Office Depot, Inc. and Charles E. Brown* |
(10) | ||
| 10.14 | Executive Employment Agreement dated as of October 8, 2001, by and between Office Depot, Inc. and Charles E. Brown* |
(8) | ||
| 10.15 | Amended and Restated Executive Employment Agreement, dated December 31, 2008, by and between Office Depot, Inc. and Charles E. Brown* |
|||
| 10.16 | Change of Control Agreement, dated as of May 28, 1998, by and between Office Depot, Inc. and Charles E. Brown* |
(22) | ||
| 10.17 | Amended and Restated Executive Employment Agreement, dated December 31, 2008, by and between Office Depot, Inc. and Carl (Chuck) Rubin* |
|||
| 10.18 | Second Amendment to Executive Employment Agreement, dated January 23, 2006, by and between Office Depot, Inc. and Carl (Chuck) Rubin* |
(12) | ||
| 10.19 | First Amendment to Executive Employment Agreement, dated March 7, 2005, by and between Office Depot, Inc. and Carl (Chuck) Rubin* |
(11) | ||
| 10.20 | Executive Employment Agreement dated as of March 1, 2004, by and between Office Depot, Inc. and Carl (Chuck) Rubin* |
(11) | ||
| 10.21 | Employment Agreement (Change of Control Agreement), dated as of March 1, 2004, by and between Office Depot, Inc. and Carl (Chuck) Rubin* |
(11) | ||
| 10.22 | Letter Agreement dated as of March 1, 2004, by and between Office Depot, Inc. and Carl (Chuck) Rubin* |
(11) | ||
| 10.23 | Separation Agreement dated as of February 20, 2008, by and between Office Depot, Inc. and Patricia A. McKay |
(9) | ||
| 10.24 | Credit Agreement, dated as of September 26, 2008, by and among Office Depot, Inc., as borrower, and JPMorgan Chase Bank, N.A. as administrative agent, Bank of America, N.A. as syndication agent and Citibank, N.A. Wachovia Bank, N.A. and General Electric Capital Corporation as documentation agents.** |
|||
| 10.25 | Change of Control Agreement, dated as of September 17, 2008, by and between Office Depot, Inc. and Michael D. Newman* |
(19) | ||
| 10.26 | Amendment to Employment Agreement dated as of February 25, 2008, by and between Office Depot, Inc. and Steve Odland* |
(9) | ||
| 10.27 | Amended and Restated Change of Control Agreement, dated as of February 25, 2008, by and between Office Depot, Inc. and Charles E. Brown* |
(9) | ||
| 10.28 | Amended and Restated Change of Control Agreement, dated as of February 25, 2008, by and between Office Depot, Inc. and Carl (Chuck) Rubin* |
(9) | ||
90
Table of Contents
| Exhibit Number |
Exhibit |
|||
| 10.29 | Letter Agreement between Citibank, N.A. and Office Depot, Inc., dated December 28, 2008, by and between Citibank (South Dakota), N.A. and Office Depot, Inc. |
(17) | ||
| 10.30 | Agency Agreement between Gordon Brothers Retail Partners, LLC and Office Depot, Inc., dated December 9, 2008, by and between Gordon Brothers Retail Partners, LLC and Office Depot, Inc. |
(18) | ||
| 10.31 | Amended and Restated Merchant Services Agreement, dated as of February 1, 2004, by and between Office Depot, Inc. and Citibank USA, N.A. |
(17) | ||
| 10.32 | Sixth Amendment to Amended and Restated Merchant Services Agreement, dated February 6, 2009, by and between Office Depot, Inc. and Citibank (South Dakota), N.A. |
(21) | ||
| 10.33 | First Standstill Letter, dated December 28, 2008, by and between Office Depot, Inc. and Citibank (South Dakota), N.A. |
(17) | ||
| 10.34 | Second Standstill Letter, dated December 30, 2008, by and between Office Depot, Inc. and Citibank (South Dakota), N.A. |
(17) | ||
| 10.35 | Standby Letter of Credit, dated December 30, 2008, from JPMorgan Chase Bank, N.A. in favor of Citibank (South Dakota), N.A. |
(17) | ||
| 10.36 | 2008 Office Depot, Inc. Bonus Plan for Executive Management Employees* |
(20) | ||
| 10.37 | Securities Purchase Agreement, dated as of June 23, 2009, by and among Office Depot, Inc. and the investors named in the Securities Purchase Agreement |
(24) | ||
| 10.38 | Change of Control Agreement, dated as of December 14, 2007, by and between Office Depot, Inc. and Steven M. Schmidt* |
(25) | ||
| 10.39 | Amendment to Employment Offer Letter Agreement, dated December 31, 2008, by and between Office Depot, Inc. and Steven Schmidt* |
|||
| 10.40 | Employment Offer Letter Agreement, dated July 10, 2007, by and between Office Depot, Inc. and Steven Schmidt * |
|||
| 10.41 | Agreement for the Financing of Commercial Receivables, dated September 30, 2009, by and between Office Depot BS and Fortis Commercial Finance |
(26) | ||
| 10.42 | Specifications Relating to the Back-Up Line Attached to the Agreement for the Financing of Commercial Receivables, dated September 30, 2009, by and between Office Depot BS and Fortis Commercial Finance |
(26) | ||
| 10.43 | Seventh Amendment to Amended and Restated Merchant Services Agreement, dated October 13, 2009, by and between Office Depot, Inc. and Citibank N.A. |
(26) | ||
| 10.44 | Office Depot, Inc. Amended Long-Term Incentive Plan* |
(27) | ||
| 21 | List of Office Depot, Inc.’s Significant Subsidiaries |
|||
| 23 | Consent of Independent Registered Public Accounting Firm |
|||
| 31.1 | Certification of CEO required by Securities and Exchange Commission Rule 13a-14(a) or 15d-14(a) |
|||
| 31.2 | Certification of CFO required by Securities and Exchange Commission Rule 13a-14(a) or 15d-14(a) |
|||
91
Table of Contents
| Exhibit Number |
Exhibit |
|||
| 32 | Certification of CEO and CFO Pursuant to 18 U.S.C. Section 1350, as Adopted Pursuant to Section 906 of the Sarbanes-Oxley Act of 2002 |
|||
| * | Management contract or compensatory plan or arrangement. |
| ** | Denotes that confidential portions of this exhibit have been omitted in reliance on Rule 24b-2 of the Securities Exchange Act of 1934. The confidential portions have been submitted separately to the Securities and Exchange Commission. |
| (1) | Incorporated by reference from the respective annex to the Proxy Statement for Office Depot, Inc.’s 1995 Annual Meeting of Stockholders, filed with the SEC on April 20, 1995. |
| (2) | Incorporated by reference from the respective exhibit to Office Depot, Inc.’s Registration Statement No. 33-39473 on Form S-4, filed with the SEC on March 15, 1991. |
| (3) | Incorporated by reference from the respective exhibit to Office Depot, Inc.’s Registration Statement No. 333-108602 on Form S-4, filed with the SEC on September 8, 2003. |
| (4) | Incorporated by reference from Office Depot, Inc.’s Quarterly Report on Form 10-Q, filed with the SEC on October 27, 2003. |
| (5) | Incorporated by reference from the respective appendix to the Proxy Statement for Office Depot, Inc.’s 2007 Annual Meeting of Shareholders, filed with the SEC on April 2, 2007. |
| (6) | Incorporated by reference from the respective exhibit to Office Depot, Inc.’s Annual Report on Form 10-K405 for the year ended December 28, 1996, filed with the SEC on March 28, 1997. |
| (7) | Incorporated by reference from Office Depot, Inc.’s Quarterly Report on Form 10-Q, filed with the SEC on October 31, 2000. |
| (8) | Incorporated by reference from the respective exhibit to Office Depot, Inc.’s Annual Report on Form 10-K for the year ended December 29, 2001, filed with the SEC on March 19, 2002. |
| (9) | Incorporated by reference from Office Depot, Inc.’s Quarterly Report on Form 10-Q, filed with the SEC on April 29, 2008. |
| (10) | Incorporated by reference from Office Depot, Inc.’s Current Report on Form 8-K, filed with the SEC on August 1, 2005. |
| (11) | Incorporated by reference from the respective exhibit to Office Depot, Inc.’s Annual Report on Form 10-K for the year ended December 25, 2004, filed with the SEC on March 10, 2005. |
| (12) | Incorporated by reference from Office Depot, Inc.’s Current Report on Form 8-K, filed with the SEC on January 24, 2006. |
| (13) | Incorporated by reference from Office Depot, Inc.’s Current Report on Form 8-K, filed with the SEC on March 16, 2005. |
| (14) | Incorporated by reference from Office Depot, Inc.’s Current Report on Form 8-K, filed with the SEC on August 30, 2005. |
| (15) | Incorporated by reference from Office Depot, Inc.’s Current Report on Form 8-K, filed with the SEC on February 22, 2010. |
| (16) | Incorporated by reference from Office Depot, Inc.’s Current Report on Form 8-K, filed with the SEC on March 5, 2007. |
| (17) | Incorporated by reference from Office Depot, Inc.’s Current Report on Form 8-K, filed with the SEC on December 31, 2008. |
92
Table of Contents
| (18) | Incorporated by reference from Office Depot, Inc.’s Current Report on Form 8-K, filed with the SEC on December 10, 2008. |
| (19) | Incorporated by reference from Office Depot, Inc.’s Quarterly Report on Form 10-Q, filed with the SEC on October 29, 2008. |
| (20) | Incorporated by reference from the respective appendix to the Proxy Statement for Office Depot, Inc.’s 2008 Annual Meeting of Shareholders, filed with the SEC on March 13, 2008. |
| (21) | Incorporated by reference from Office Depot, Inc.’s Current Report on Form 8-K, filed with the SEC on February 11, 2009. |
| (22) | Incorporated by reference from Office Depot, Inc.’s Annual Report on Form 10-K for the year ended December 30, 2000, filed with the SEC on March 27, 2001. |
| (23) | Incorporated by reference from Office Depot, Inc.’s Annual Report on Form 10-K for the year ended December 27, 2008, filed with the SEC on February 24, 2009. |
| (24) | Incorporated by reference from Office Depot, Inc.’s Current Report on Form 8-K, filed with the SEC on June 23, 2009. |
| (25) | Incorporated by reference from Office Depot, Inc.’s Quarterly Report on Form 10-Q, filed with the SEC on July 28, 2009. |
| (26) | Incorporated by reference from Office Depot, Inc.’s Quarterly Report on Form 10-Q, filed with the SEC on October 29, 2009. |
| (27) | Incorporated by reference from the Proxy Statement for Office Depot, Inc.’s 2004 Annual Meeting of Shareholders, filed with the SEC on April 1, 2004. |
Upon request, we will furnish a copy of any exhibit to this report upon the payment of reasonable copying and mailing expenses.
93