Attached files
| file | filename |
|---|---|
| 8-K - FORM 8-K - ENDURANCE SPECIALTY HOLDINGS LTD | c96741e8vk.htm |
Exhibit 99.1

| Bank of America Merrill Lynch Insurance Conference Endurance Specialty Holdings David Cash Chief Underwriting Officer |
| 2 Forward looking statements & regulation G disclaimer Safe Harbor for Forward Looking Statements Some of the statements in this presentation include forward-looking statements which reflect our current views with respect to future events and financial performance. Such statements include forward-looking statements both with respect to us in general and the insurance and reinsurance sectors specifically, both as to underwriting and investment matters. Statements which include the words "expect," "intend," "plan," "believe," "project," "anticipate," "seek," "will," and similar statements of a future or forward-looking nature identify forward-looking statements in this presentation for purposes of the U.S. federal securities laws or otherwise. We intend these forward-looking statements to be covered by the safe harbor provisions for forward-looking statements in the Private Securities Litigation Reform Act of 1995. All forward-looking statements address matters that involve risks and uncertainties. Accordingly, there are or may be important factors that could cause actual results to differ from those indicated in the forward-looking statements. These factors include, but are not limited to, developments in the world's financial and capital markets that could adversely affect the performance of Endurance's investment portfolio or access to capital, changes in the composition of Endurance's investment portfolio, competition, possible terrorism or the outbreak of war, the frequency or severity of unpredictable catastrophic events, changes in demand for insurance or reinsurance, rating agency actions, uncertainties in our reserving process, a change in our tax status, acceptance of our products, the availability of reinsurance or retrocessional coverage, retention of key personnel, political conditions, the impact of current legislation and regulatory initiatives, changes in accounting policies, changes in general economic conditions and other factors described in our most recent Annual Report on Form 10-K. Forward-looking statements speak only as of the date on which they are made, and we undertake no obligation publicly to update or revise any forward-looking statement, whether as a result of new information, future developments or otherwise. Regulation G Disclaimer In presenting the Company's results, management has included and discussed certain non-GAAP measures. Management believes that these non-GAAP measures, which may be defined differently by other companies, better explain the Company's results of operations in a manner that allows for a more complete understanding of the underlying trends in the Company's business. However, these measures should not be viewed as a substitute for those determined in accordance with GAAP. For a complete description of non- GAAP measures and reconciliations, please review the Investor Financial Supplement on our web site at www.endurance.bm. The combined ratio is the sum of the loss, acquisition expense and general and administrative expense ratios. Endurance presents the combined ratio as a measure that is commonly recognized as a standard of performance by investors, analysts, rating agencies and other users of its financial information. The combined ratio, excluding prior year net loss reserve development, enables investors, analysts, rating agencies and other users of its financial information to more easily analyze Endurance's results of underwriting activities in a manner similar to how management analyzes Endurance's underlying business performance. The combined ratio, excluding prior year net loss reserve development, should not be viewed as a substitute for the combined ratio. Net premiums written (prior to deposit accounting adjustments) is a non-GAAP internal performance measure used by Endurance in the management of its operations. Net premiums written (prior to deposit accounting adjustments) represents net premiums written and deposit premiums, which are premiums on contracts that are deemed as either transferring only significant timing risk or transferring only significant underwriting risk and thus are required to be accounted for under GAAP as deposits. Endurance believes these amounts are significant to its business and underwriting process and excluding them distorts the analysis of its premium trends. In addition to presenting gross premiums written determined in accordance with GAAP, Endurance believes that net premiums written (prior to deposit accounting adjustments) enables investors, analysts, rating agencies and other users of its financial information to more easily analyze Endurance's results of underwriting activities in a manner similar to how management analyzes Endurance's underlying business performance. Net premiums written (prior to deposit accounting adjustments) should not be viewed as a substitute for gross premiums written determined in accordance with GAAP. Return on Average Equity (ROAE) is comprised using the average common equity calculated as the arithmetic average of the beginning and ending common equity balances for stated periods. Return on Beginning Equity (ROBE) is comprised using the beginning common equity for stated periods. The Company presents various measures of Return on Equity that are commonly recognized as a standard of performance by investors, analysts, rating agencies and other users of its financial information. |

| 3 Investor value proposition Specialty focus and strong diversification has the potential to generate industry leading returns for shareholders, with lower volatility Established a team of experienced specialized underwriters with deep expertise across business units Strong balance sheet supported by conservative investment portfolio and prudent reserving practices Transformed our business over the past four years to markedly improve the risk management and diversification of our business Management team has a proven track record of success generating superior returns Successfully executed our strategy to develop a diversified portfolio of specialized business X-Axis 1st series 2nd series 0.2014 0.77 Allied World Assurance Company Holdings, Ltd 0.1777 0.99 Arch Capital Group Ltd. 0.1154 0.92 AXIS Capital Holdings Limited 0.1651 0.87 Platinum 0.1288 0.81 Everest Re Group, Ltd. 0.1547 0.85 IPC Holdings, Ltd. 0.0845 0.89 Max Capital Group Ltd. 0.136 0.85 Montpelier Re Holdings Ltd. 0.1652 0.93 PartnerRe Ltd. 0.1663 1.05 RenaissanceRe Holdings Ltd. 0.1369 0.82 Transatlantic Holdings, Inc. 0.1635 0.86 Endurance Specialty Holdings Ltd. Price/Book vs. ROE 3-year average operating ROAE Price to book1 Endurance Common stock price as a percentage of diluted book value per share as of February 18, 2010 Note: Composite peer median based on SNL data. Includes Allied World, Arch, Ren Re, Axis, Transatlantic, Everest, Partner Re, Montpelier, Platinum and Max Capital Compelling investment opportunity Endurance offers investors a proven franchise at an attractive valuation |

| 4 Introduction to Endurance Specialty Holdings Founded in 2001 Focused on the principle of creating shareholder value through the creation of a diversified portfolio of specialized businesses Strong Market Positioning Widely diversified, global specialty insurance and reinsurance provider Over 700 employees in global offices across the United States, Bermuda, Europe, and Asia Domiciled in Bermuda Solid Financial Foundation Excellent financial strength with nearly $7.7 BN in assets, $3.4 BN in total capital and $2.8 BN in shareholders' equity as of December 31, 2009 High quality, low duration, liquid investment portfolio Prudent loss reserves Rated "A" by A.M. Best and Standard and Poor's and A2 by Moody's with stable outlooks Received the highest ERM ranking of "Excellent" from Standard and Poor's Excellent historical financial results Inception to date annualized operating ROE of 14.9% Average annual operating ROE of 18.1% from 2007 though 2009 20.2% average annualized growth in book value per share plus dividends since inception |

| 5 Financial results for full year 2009 $MM (except per share data and %) December 31, 2009 December 31, 2008 $ Change % Change Net premiums written 1,606.1 1,784.3 (178.2) (10.0) Net premiums earned 1,633.2 1,766.5 (133.3) (7.5) Net investment income 284.2 130.2 154.0 182.8 Net underwriting income 265.3 110.8 154.5 139.4 Net income 536.1 98.6 437.5 NM Operating income 520.7 198.0 322.7 NM Fully diluted net income EPS 8.69 1.31 7.38 NM Fully diluted operating EPS 8.43 2.88 5.55 NM Financial highlights December 31, 2009 December 31, 2008 Operating ROE 22.0% 8.5% Net loss ratio 53.1% 64.3% Acquisition expense ratio 16.4% 17.0% General and administrative expense ratio 14.5% 12.2% Combined ratio 84.0% 93.5% Diluted book value per share $44.61 $33.06 Investment leverage 2.49 2.57 Key operating ratios |

| 6 Full year net written premiums In $MM December 31, 2009 December 31, 2008 $ Change % Change Property 68.0 98.0 (30.0) (30.6) Casualty 91.1 86.6 4.5 5.2 Healthcare liability 78.3 80.0 (1.7) (2.1) Workers' compensation 11.4 215.8 (204.4) NM Agriculture 324.5 380.7 (56.2) (14.8) Professional lines 167.1 119.4 47.7 39.9 Total insurance 740.3 980.6 (240.3) (24.5) Insurance Segment In $MM December 31, 2009 December 31, 2008 $ Change % Change Casualty 254.9 162.6 92.3 56.8 Property 215.1 192.6 22.5 11.7 Catastrophe 302.2 302.1 0.1 - Aerospace and marine 42.6 77.0 (34.4) (44.7) Surety and other specialty 51.0 69.4 (18.4) (26.5) Total reinsurance 865.8 803.7 62.1 7.7 Reinsurance Segment |

| 7 Our strategy is focused on delivering superior returns to shareholders Our commitments to Investors Growth in book value Superior returns on equity across underwriting cycles Ethics, integrity, and transparency |

| 8 More attractive margins Better retention driven by deeper relationships and expertise Higher barriers to entry Stable earnings Why specialization matters Why Endurance is well-positioned to succeed Deep underwriting knowledge of markets and distribution across major specialty lines Technological advantage which improves our pricing ability and efficiency Customized operating model by market type Active portfolio management to deploy and retract capital in response to changing market conditions Strong balance sheet positions us well to compete, particularly against those who have faltered Focus on specialty lines of business Endurance management has actively expanded into specialty lines of business Endurance strategy at work Wind exposed business focused on regional homeowner companies vs. more volatile commercial lines and offshore energy risks Expanded our U.S. based reinsurance and insurance specialty units Acquired ARMtech, a highly specialized, agriculture insurance company |

| 9 Rapid entry into workers' compensation as the market became attractive in 2006; managed exit from the business as margins tightened in 2008 Exited the UK property business when it did not meet our business mix and profitability requirements Introduction of surety, aerospace, and agriculture businesses, which have different risk profiles than catastrophe to create a more diversified portfolio Exited offshore energy and national property accounts in 2006 following Katrina, given unanticipated volatility and lack of model clarity; decision validated by 2008 results Active portfolio management Levers we employ in portfolio management Thoughtfully but aggressively entering markets when conditions are attractive Diversify risks through the introduction of low correlation businesses Actively monitor and react to changing market conditions Reduce exposures during soft markets Increase/decrease the amount of ceded business as necessary Exit selected business lines when fundamentals dictate doing so Some examples While growing through specialization and building robust businesses that withstand both hard and soft cycles, we also maximize our returns through active portfolio management Organizational agility underpins our ability to allocate capital dynamically |

| 10 Active portfolio management We have successfully built a specialty focused and diversified portfolio of businesses Endurance's business units Full Year 2009 Net premiums written: $1.61 BN Reinsurance Insurance Agriculture Personal Accident Surety Casualty & Workers' Compensation Professional Liability Property Per Risk Small Business Direct Treaty Aerospace Casualty Clash International Property Catastrophe US Property Catastrophe Workers' Compensation Catastrophe ARMtech Agriculture US Property US Casualty US Miscellaneous E&O Healthcare Excess Casualty Professional Lines Habitational Environmental International 3% Fortune 1000 14% Middle Market 7% 20% Bermuda 23% US 28% Program 5% Casualty Marine Motor Personal Accident Professional Indemnity Property Surety Trade Credit Small Risk |

| 11 Active portfolio management Meaningfully improved risk management and diversification of our business since 2005 2002 2003 2004 2005 2006 2007 2008 2009 Bermuda 596256 498561 484497 470998 411012 420658 384437 374800 US 0 771677 718022 672209 679578 509202 334114 446000 International 29444 137731 231777 237332 121701 90233 46800 30000 30000 30000 30000 30000 30000 30000 30000 Fortune 1000 168533 276870 298111 319722 251626 221410 210326 218500 Middle market 129 21291 58661 67931 78144 75720 215356 115500 Program 86867 233725 174217 84000 Small Risk 21115 380701 324500 Growth curve of our business 2002 - 2009 Small Risk Program Middle Market International Fortune 1000 US Bermuda Reinsurance Insurance We have successfully identified new opportunities and added new underwriting expertise while remaining disciplined in softening markets |

| 12 Active portfolio management Reinsurance book has reduced due to cycle management but is highly scalable 2005 2006 2007 2008 2009 Casualty 380.3 396.7 186.8 163.5 254.9 Property 360.5 310.8 216.4 195.8 215.1 Catastrophe 297 270.1 332.4 302.1 302.2 Agriculture 33 21 9.9 Aerospace and Marine 239.5 173.6 89.4 77.8 51 Surety and other 97.6 176.7 197.9 48.6 42.6 G 7 14 H 8 8 $1,375.0 $1,023.0 We have been disciplined in writing reinsurance business as evidenced by the portfolio being down 37% from 2005 to 2009 in a softening rate environment Managing the reinsurance portfolio Active portfolio management has enhanced reinsurance portfolio: Lines of business have been actively reduced where pricing, terms or data quality have not met our requirements Casualty has declined 36% from its peak Property has declined 40% since its peak Aerospace and Marine has declined 79% from its peak Discipline in the catastrophe markets has lead to stable premiums We have maintained our underwriting expertise and are well positioned to grow as opportunities arise Reinsurance net premiums written $865.7 $803.7 $1,327.9 |

| 13 Active portfolio management Continue to expand insurance capabilities while maintaining discipline 2005 2006 2007 2008 2009 Property 91.8 61.3 47.9 98 68 Casualty 117 89.8 77.2 86.6 91.1 Healthcare 117.1 107 92.4 80 78.3 Workers' compensation 0 86.9 238.4 215.8 11.4 Agriculture 0 0 21 380.7 324.5 Professional lines 61.7 71.7 75 119.4 167.1 G 7 14 H 8 8 $387.7 $980.6 Since 2005 we have meaningfully added new capabilities and distribution relationships within our insurance franchise while exiting unprofitable lines Managing the insurance portfolio We have significantly broadened our insurance capabilities. Added agriculture line of business through the acquisition of ARMtech Opportunistically grew and exited California's workers' compensation Expanded professional lines through addition of underwriting teams and new relationships Meaningfully expanded our distribution relationships Maintained pricing and relationships in large risk insurance in an increasingly competitive environment Insurance net premiums written $740.3 $552.0 $416.6 |
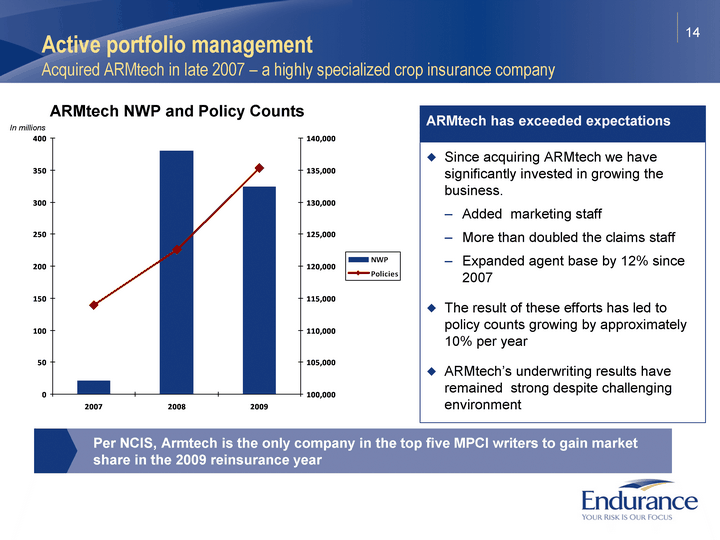
| 14 Active portfolio management Acquired ARMtech in late 2007 - a highly specialized crop insurance company 2005 2006 2007 2008 2009 Policies 113954 122520 135346 NWP 0 0 21 380.7 324.5 G 7 14 H 8 8 Per NCIS, Armtech is the only company in the top five MPCI writers to gain market share in the 2009 reinsurance year ARMtech has exceeded expectations Since acquiring ARMtech we have significantly invested in growing the business. Added marketing staff More than doubled the claims staff Expanded agent base by 12% since 2007 The result of these efforts has led to policy counts growing by approximately 10% per year ARMtech's underwriting results have remained strong despite challenging environment ARMtech NWP and Policy Counts In millions |

| 15 Strong balance sheet and efficient use of capital We have built an efficient capital base and maintain ample liquidity Strong and flexible capital structure IBNR represents 65% of company reserves 76% of long tail reserves are IBNR Prudent and strong reserves Short Tail Long Tail Other Total 2007 2008 Case Reserves 368.532 533.816 190.597 1092.945 3111.1 2804.3 IBNR 296.928 1693.28 74.435 2064.081 0.24 0.27 $MM 2003 2004 2005 2006 2007 2008 2009 Common Share Capital 1300 1213 1309 1318 1091 762 845 Retained Earnings 345 650 364 780 1221 1245 1742.4 Preferred Equity 200 200 200 200 200 Debt 103 391 447 447 449 447 448 Contingent Equity 150 150 150 Rated "A" by A.M. Best and S&P; A2 by Moody's Debt to total capital of 13.8% $MM Common Share Capital Retained Earnings Preferred Equity Debt Contingent Equity Reserves as of December 31, 2009 |

| Cash and equivalents 530 Government and agency debt 770 Agency MBS 956 Government guaranteed corporates 918 ABS 277 Foreign government 146 Investment grade and high-yield corporates and munis 693 Non-agency CMBS 530 Non-agency RMBS 257 Short term 535 Preferred equity securities 11 Other 351 Aggregate unrealized losses 186.3 Aggregate unrealized losses [placeholder] 186.3 16 Strong balance sheet and efficient use of capital Endurance maintains a prudent, highly liquid investment portfolio Market yield: 3.08% Book yield: 3.35% Average rating: Aa+/AA+ Duration: 2.30 years (1) Net of investments pending settlement $6.0 Billion in Investments Managing the investment portfolio Maintain a high quality, liquid investment portfolio 53.2% of investments are in cash, U.S. Government or U.S. Government backed securities We have actively reduced the duration of the investment portfolio to 2.3 years Protects against rising interest rates Reduces potential book market impact Retain ability to redeploy assets into higher yielding securities Some near term pressure on net investment income |
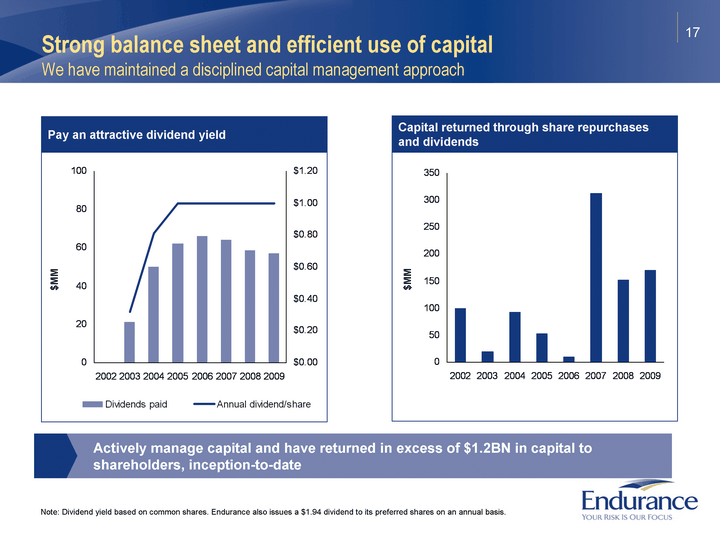
| 17 2002 2003 2004 2005 2006 2007 2008 2009 Annual dividend/share 0.32 0.81 1 1 1 1 1 Dividends paid 21 50 62 66 64 58.7 57 C 3 2.9 3.7 5 D 4 3 4.5 6 E 4 6 6.5 7 F 9 7 7.2 8 G 11 8 2 9 H 5 8 9 10 $MM 2002 2003 2004 2005 2006 2007 2008 2009 Annual dividend 0.32 0.81 1 1 1 1 Capital returned 100 20 92 52 10 312 152.7 170 C 3 2.9 3.7 5 D 4 3 4.5 6 E 4 6 6.5 7 F 9 7 7.2 8 G 11 8 2 9 H 5 8 9 10 $MM Pay an attractive dividend yield Capital returned through share repurchases and dividends Note: Dividend yield based on common shares. Endurance also issues a $1.94 dividend to its preferred shares on an annual basis. Strong balance sheet and efficient use of capital We have maintained a disciplined capital management approach Actively manage capital and have returned in excess of $1.2BN in capital to shareholders, inception-to-date |

| 18 Our results Summary Strong return to shareholders Inception to date average total return to common investors of 20.2%. Total return measured by the annual change in diluted book value per common share plus dividends divided by beginning diluted book value per share. Superior returns on equity 18.1% average annual operating ROE from 2007 through 2009, and better than peer median throughout the cycle 14.9% inception to date average annual operating ROE Exceptional underwriting performance Inception to date combined ratio of 91.1% 2009 aided by benign catastrophe season Disciplined capital management approach exemplified by Attractive dividend yield of ~3-4% In excess of $1.2 billion of capital returned to shareholders since inception |
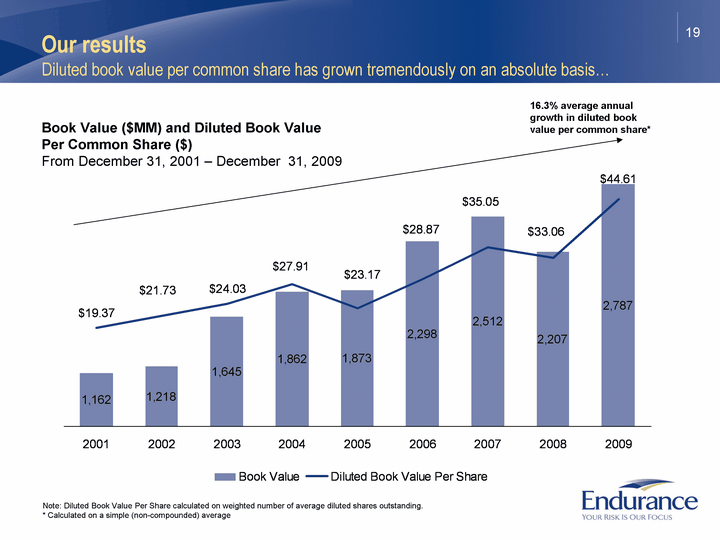
| 19 Our results Diluted book value per common share has grown tremendously on an absolute basis... Book Value ($MM) and Diluted Book Value Per Common Share ($) From December 31, 2001 - December 31, 2009 2001 2002 2003 2004 2005 2006 2007 2008 1Q09 2009 Diluted Book Value Per Share 19.37 21.73 24.03 27.91 23.17 28.87 35.05 33.06 34.34 44.61 Book Value 1162 1217.5 1644.8 1862 1873 2298 2512 2207 2254 2787.3 Note: Diluted Book Value Per Share calculated on weighted number of average diluted shares outstanding. * Calculated on a simple (non-compounded) average 16.3% average annual growth in diluted book value per common share* |

| 20 Our results Book value per common share has also grown tremendously on a relative basis Book Value Per Share Plus Dividend Growth From December 31, 2006 - December 31, 2009 AWH ENH PRE RNR ACGL AXS PTP TRH RE MRH MXGL Book Value 0.748 0.649 0.604 0.583 0.58 0.529 0.505 0.403 0.383 0.34 0.319 Note: Book value per share and dividend data provided by SNL |
| 21 Conclusion Endurance is a compelling investment opportunity Endurance offers investors significant upside potential, based on combination of: Strong franchise positions in attractive specialty markets Globally diversified portfolio of insurance and reinsurance units operated with deep and distinctive expertise Superior distribution capabilities with strong access to independent agent, middle market and retail distribution networks Active portfolio management actions have maintained strong risk adjusted return potential while reducing overall volatility Excellent balance sheet strength and liquidity High quality fixed income investment portfolio offers upside potential from current market values Prudent reserving philosophy and strong reserve position; Strong history of favorable development Industry leading ERM The outlook for Endurance's key areas of specialization remain attractive Agriculture business is price controlled and returns are enhanced by increasing inflation environment Catastrophe lines have remained disciplined and profitable Profitable niches within specialty lines exist Relative value vs. peers ENH currently trading at a discount to book, which appears unwarranted given strong absolute and relative performance and strong positioning |
