Attached files
| file | filename |
|---|---|
| EX-21 - EXHIBIT 21 - CHECKPOINT SYSTEMS INC | ex21.htm |
| EX-32 - EXHIBIT 32 - CHECKPOINT SYSTEMS INC | ex32.htm |
| EX-12 - EXHIBIT 12 - CHECKPOINT SYSTEMS INC | ex12.htm |
| EX-23 - EXHIBIT 23 - CHECKPOINT SYSTEMS INC | ex23.htm |
| EX-31.1 - EXHIBIT 31.1 - CHECKPOINT SYSTEMS INC | ex31-1.htm |
| EX-31.2 - EXHIBIT 31.2 - CHECKPOINT SYSTEMS INC | ex31-2.htm |
SECURITIES
AND EXCHANGE COMMISSION
WASHINGTON,
D.C. 20549
_______________________________
FORM 10-K
ANNUAL
REPORT PURSUANT TO SECTION 13 OR 15(d)
OF
THE SECURITIES EXCHANGE ACT OF 1934
For
the fiscal year ended December 27, 2009
Commission
File No. 1-11257
CHECKPOINT
SYSTEMS, INC.
(Exact
name of Registrant as specified in its Articles of Incorporation)
|
Pennsylvania
|
22-1895850
|
|||
|
(State
of Incorporation)
|
(IRS
Employer Identification No.)
|
|||
|
101
Wolf Drive, PO Box 188,
Thorofare,
New Jersey
|
08086
|
|||
|
(Address
of principal executive offices)
|
(Zip
Code)
|
|||
|
856-848-1800
|
||||
|
(Registrant’s
telephone number, including area code)
|
||||
Securities
to be registered pursuant to Section 12(b) of the Act:
|
Title
of each class
to
be so registered
|
Name
of each exchange on which
each
class is to be registered
|
|||
|
Common
Stock Purchase Rights
|
New
York Stock Exchange
|
|||
|
Securities
to be registered pursuant to Section 12(g) of the Act:
Common
Stock, Par Value $.10 Per Share
|
||||
|
(Title
of class)
|
||||
Indicate
by check mark if the registrant is a well-known seasoned issuer, as defined in
Rule 405 of the Securities Act.
Yes £ No R
Indicate
by check mark if the registrant is not required to file reports pursuant to
Section 13 or Section 15(d) of the Exchange Act.
Yes £ No R
Indicate
by check mark whether the registrant (1) has filed all reports required to be
filed by Section 13 or 15(d) of the Securities Exchange Act of 1934 during the
preceding 12 months (or for such shorter period that the registrant was required
to file such reports), and (2) has been subject to such filing requirements for
the past 90 days.
Yes R No
£
Indicate
by check mark whether the registrant has submitted electronically and posted on
its corporate Web site, if any, every Interactive Data File required to be
submitted and posted pursuant to Rule 405 of Regulation S-T (§ 232.05 of this
chapter) during the preceding 12 months (or for such shorter period that the
registrant was required to submit and post such files).
Yes £ No
£
Indicate
by check mark if disclosure of delinquent filers pursuant to Item 405 of
Regulation S-K is not contained herein, and will not be contained, to the
best of registrant’s knowledge, in definitive proxy or information statements
incorporated by reference in Part III of this Form 10-K or any
amendment to this Form 10-K. R
Indicate
by check mark whether the registrant is a large accelerated filer, an
accelerated filer, a non-accelerated filer, or a smaller reporting company. See
the definitions of “large accelerated filer,” “accelerated filer” and “smaller
reporting company” in Rule 12b-2 of the Exchange Act.:
|
Large
accelerated filer
þ
|
Accelerated
filer
o
|
Non-accelerated
filer
o
|
Smaller
reporting company
o
|
|||
|
(Do
not check if a smaller reporting
company)
|
||||||
Indicate
by check mark whether the registrant is a shell company (as defined in Rule
12b-2 of the Exchange Act).
Yes £ No R
As of
June 28, 2009, the aggregate market value of the Common Stock held by
non-affiliates of the Registrant was approximately $589,167,871.
As of
February 12, 2010, there were 39,100,096 shares of the Common Stock
outstanding.
DOCUMENTS
INCORPORATED BY REFERENCE
Portions
of the Registrant’s Definitive Proxy Statement for its 2010 Annual Meeting of
Shareholders are incorporated by reference into Part III of this
Form 10-K.
CHECKPOINT
SYSTEMS, INC.
FORM 10-K
Table
of Contents
|
|
|
|
Page
|
|
3-8
|
|||
|
9-12
|
|||
|
12
|
|||
|
12
|
|||
|
12
|
|||
|
12
|
|||
|
12-13
|
|||
|
14
|
|||
|
15-29
|
|||
|
29
|
|||
|
30-59
|
|||
|
60
|
|||
|
60
|
|||
|
60
|
|||
|
60
|
|||
|
60
|
|||
|
60
|
|||
|
60
|
|||
|
60
|
|||
|
61
|
|||
|
62
|
|||
|
63
|
|||
|
64
|
|||
CAUTIONARY
NOTE REGARDING FORWARD-LOOKING STATEMENTS
This
Annual Report contains forward-looking statements within the meaning of
Section 21E of the Securities Exchange Act of 1934, as amended, that
involve risks and uncertainties and reflect the Company’s judgment as of the
date of this report. Forward-looking statements often address our expected
future business and financial performance, and often contain words such as
“expect,” “forecast,” “anticipate,” “intend,” “plan,” “believe,” “seek,” or
“will.” By their nature, forward-looking statements address matters that are
subject to risks and uncertainties. Any such forward-looking statements may
involve risk and uncertainties that could cause actual results to differ
materially from any future results encompassed within the forward-looking
statements. Factors that could cause or contribute to such differences include:
changes in our senior management and other matters relating to
the implementation of our succession plan; our ability to integrate recent
acquisitions and to achieve related financial and operational goals; changes in
international business and economic conditions; foreign currency exchange rate
and interest rate fluctuations; lower than anticipated demand by retailers and
other customers for our products; slower commitments of retail customers to
chain-wide installations and/or source tagging adoption or expansion; possible
increases in per unit product manufacturing costs due to less than full
utilization of manufacturing capacity as a result of slowing economic conditions
or other factors; our ability to provide and market innovative and
cost-effective products; the development of new competitive technologies; our
ability to maintain our intellectual property; competitive pricing pressures
causing profit erosion; the availability and pricing of component parts and raw
materials; possible increases in the payment time for receivables as a result of
economic conditions or other market factors; changes in regulations or standards
applicable to our products; the ability to implement cost reduction in field
service, sales, and general and administrative expense, and our manufacturing
and supply chain operations without significantly impacting revenue and profits;
our ability to maintain effective internal control over financial reporting; a
failure to manage our growth effectively; and additional matters discussed more
fully in this report under Item 1A. “Risk Factors Related to Our Business”
and Item 7. “Management’s Discussion and Analysis.” We do not undertake to
update our forward-looking statements, except as required by applicable
securities laws.
Item
1. BUSINESS
Checkpoint
Systems, Inc. is a leading global manufacturer and provider of technology-driven
end-to-end loss prevention, merchandising and labeling solutions to the retail
and apparel industry. We provide solutions to brand, track and secure goods for
retailers, apparel manufacturers and consumer product manufacturers
worldwide.
Retailers
and manufacturers are increasingly focused on identifying and protecting assets
that are moving through the supply chain. On the sales floor, retailers need to
make sure that the right merchandise is in stock to satisfy customers and boost
sales. To address this market opportunity, we have built the necessary
infrastructure to be a single global source for shrink management, merchandise
tracking and visibility, and apparel labeling solutions.
We are a
leading provider of electronic article surveillance (EAS) systems and tags
using radio frequency (RF) and electromagnetic (EM) technology, source
tagging security solutions, secure merchandising solutions using RF and
acoustic-magnetic (AM) technology, branding tags and labels for apparel. In
Europe, we are a leading provider of retail display systems (RDS) and
hand-held labeling systems (HLS). We are also a leading provider and installer
of store monitoring solutions, including fire alarms, intrusion alarms and
digital video recorders for the retail environment in the U.S. Our labeling
systems and services are designed to consolidate tag and label requirements to
improve efficiency, reduce costs, and furnish value-added solutions for
customers across many markets and industries. Applications for tags and labels
include brand identification, automatic identification (auto-ID), retail shrink
management, fabric and woven tags and labels, and pricing and promotional
labels. We have achieved substantial international growth, primarily through
acquisitions, and now operate directly in 30 countries. Products are principally
developed and manufactured in-house and sold through direct distribution and
reseller channels.
COMPANY
HISTORY
Founded
in 1969, we were incorporated in Pennsylvania as a wholly-owned subsidiary of
Logistics Industries Corporation (Logistics). In 1977, Logistics, pursuant to
the terms of its merger into Lydall, Inc., distributed our common stock to
Logistics’ shareholders as a dividend.
Historically,
we have expanded our business both domestically and internationally through
acquisitions, internal growth using wholly-owned subsidiaries, and the
utilization of independent distributors. In 1993 and 1995, we completed two key
acquisitions that gave us direct access into Western Europe. We acquired ID
Systems International BV and ID Systems Europe BV in 1993 and Actron Group
Limited in 1995. These companies engaged in the manufacture, distribution, and
sale of EAS systems throughout Europe.
In
December 1999, we acquired Meto AG, a German multinational corporation and
a leading provider of value-added labeling solutions for article identification
and security. This acquisition doubled our revenues and provided us with an
increased breadth of product offerings and global reach.
In
January 2001, we acquired A.W. Printing Inc., a Houston, Texas-based
printer of tags, labels, and packaging material for the apparel
industry.
In
January 2006, we completed the sale of our barcode systems business to
SATO, a global leader in barcode printing, labeling, and Electronic Product Code
(EPC)/Radio Frequency Identification (RFID) solutions.
In
November 2006, we acquired ADS Worldwide (ADS). Based in Hull, England, ADS
is an established supplier of tags, labels and trim to apparel manufacturers,
retailers and brands around the world. ADS provides us with new technological
and production capabilities and is in line with our strategy to grow our apparel
labeling solutions business to create increased value for our customers and
stockholders.
In
November 2007, we acquired the Alpha S3 business from Alpha Security
Products, Inc. Based in Charlotte, North Carolina, the Alpha S3 business offers
a comprehensive line of security solutions designed to protect high-theft
merchandise in an open-display retail environment. The Alpha S3 product
portfolio combines well with our source tagging program, and is in line with our
strategy to provide retailers a comprehensive line of shrink management
solutions.
In
November 2007, we also acquired SIDEP, an established supplier of EAS
systems operating in France and China, and Shanghai Asialco Electronics Co. Ltd.
(Asialco), a China-based manufacturer of RF-EAS labels. With facilities in
Shanghai, China, Asialco significantly increased our label manufacturing
capacity in Asia. SIDEP and Asialco will help us meet the growing demand in
Asian markets.
In
January 2008, we purchased the business of Security Corporation, Inc., a
privately held company that provides technology and physical security solutions
to the financial services sector.
During
June 2008, we acquired OATSystems, Inc., a recognized leader in RFID-based
application software. The addition of OATSystems, Inc. will build on our
strategy to help retailers and suppliers with our EVOLVETM EAS
platform to more easily migrate to EPC RFID. As our industry moves to a common
EPC standard, we will be able to offer solutions that enable retailers and their
suppliers to gain deeper visibility of assets and merchandise — further reducing
shrink and increasing bottom-line profits while enhancing the on-shelf
availability of merchandise for consumers.
In August
2009, we acquired Brilliant Label Manufacturing Ltd., a China-based manufacturer
of paper, fabric and woven tags and labels. Brilliant Label, through its
facilities in Hong Kong and China, adds significant capacity to Checkpoint’s
world-class apparel labeling business. This acquisition enables us to meet
greater demand for fabric and woven tags and labels and expands our global
manufacturing footprint. Additionally, our labeling business extends the use of
paper, fabric and woven labels beyond branding, variable data and garment care
information by enabling discreet integration of RF-EAS and RFID tags. These
capabilities enable apparel retailers and vendors to brand, track and secure
their products at the point of manufacture using a single
solution.
3
Products
and Offerings
Historically,
we have reported our results of operations into three segments: Shrink
Management Solutions, Intelligent Labels, and Retail Merchandising. During the
first quarter of 2009, resulting from a change in our management structure, we
began reporting our segments into three new segments: Shrink Management
Solutions, Apparel Labeling Solutions, and Retail Merchandising Solutions. The
years ended 2008 and 2007 have been conformed to reflect the segment change.
Shrink Management Solutions now includes results of our EAS labels and library
business. Apparel Labeling Solutions, formerly referred to as Check-Net®,
includes tag and label solutions sold to apparel manufacturers and retailers,
which leverage our graphic and design expertise, strategically located service
bureaus, and our Check-Net®
e-commerce capabilities. Our apparel labeling services coupled with our EAS and
RFID capabilities provide a combination of apparel branding and identification
with loss prevention and supply chain visibility. There were no changes to the
Retail Merchandising Segment. The margins for each of the segments and the
identifiable assets attributable to each reporting segment are set forth in Note
19 “Business Segments and Geographic Information” to the consolidated financial
statements.
Each of
these segments offer an assortment of products and services that in combination
are designed to provide a comprehensive, single source solution to help
retailers, manufacturers, and distributors identify, track, and protect their
assets throughout the entire supply chain. Each segment and its respective
products and services are described below.
SHRINK
MANAGEMENT SOLUTIONS
Our
largest business is providing shrink management and merchandise visibility
solutions to retailers. Our diversified line of security products are designed
to help retailers prevent inventory losses caused by impulse theft, organized
retail theft, and employee theft, reduce selling costs through lower staff
requirements, and boost sales by having the right goods available when customers
are ready to buy. Our products facilitate the open display of merchandise, which
allows retailers to maximize sales opportunities. Offering our own proprietary
RF-EAS and EM-EAS technologies, we believe that we hold a significant share of
worldwide EAS systems installations. EAS systems revenues accounted for 29%,
35%, and 37% of our 2009, 2008, and 2007 total revenues,
respectively.
We offer
a wide variety of EAS-RF and EAS-EM labels that provide security solutions that
can be matched to specific retail requirements. Under our source tagging
program, tags can be attached or embedded in products or packaging at the
point-of-manufacture. All participants in the retail supply chain are concerned
with maximizing efficiency. Reducing time-to-market requires refined production
and logistics systems to ensure just-in-time delivery, as well as shorter
development, design, and production cycles. Services range from full-color
branding labels to tracking labels and, ultimately, fully-integrated labels that
include an EAS or a RFID circuit. This integration is based on the critical
objective of supporting the rapid delivery of goods to market while reducing
losses, whether through misdirection, tracking failure, theft or counterfeiting,
and to reduce labor costs by tagging and labeling products at the source. EAS-RF
and EAS-EM label revenues represented 16%, 12% and 14% of our total revenues for
2009, 2008, and 2007, respectively.
The
installation of store monitoring solutions through our CheckView™ business
includes fire, intrusion and digital video recording systems. For 2009, 2008,
and 2007, the CheckView™ business represented 14%, 17%, and 17% of our revenues,
respectively.
We
acquired our Alpha business on November 1, 2007. Alpha is unique in its focus on
both design and manufacturing of high theft protection products. Alpha products
are designed to offer retailers security, aesthetics, value and ease of use in
an “open display” format. For 2009, 2008, and 2007, the Alpha business
represented 10%, 9%, and 1% of our revenues, respectively.
No other
product group in this segment accounted for as much as 10% of our
revenues.
These
broad and flexible product lines, marketed and serviced by our extensive sales
and service organizations, have helped us emerge as a preferred supplier to
retailers around the world. Shrink Management Solutions represented
approximately 72%, 75%, and 73% of total revenues in 2009, 2008, and 2007,
respectively.
Electronic
Article Surveillance Systems
We have
designed EAS systems to act as a deterrent to prevent merchandise theft in
retail stores. Our diversified product lines are designed to help reduce impulse
theft, organized retail theft, and employee theft and enable retailers to sell
more by openly displaying high-margin and high-cost items.
During
early 2008, we introduced EVOLVE™, our state-of-the-art shrink management
platform. EVOLVE™ is our next-generation suite of RF and RFID-enabled products
providing enhanced system performance with advanced information management and
networking capabilities in a more aesthetically pleasing format. EVOLVE™ is
compatible with our CheckPro data analysis software and our complete line of EAS
labels and tags as well as products of other suppliers. Our business model
relies upon customer commitments for our security product installations to a
large number of their stores over a period of several months (large chain-wide
installations). This new product will allow our existing customers to upgrade
their security offerings and should result in increased installations for the
future. The enhanced capabilities of the EVOLVE™ platform should also attract
interest from new retail customers.
We offer
a wide variety of RF-EAS and EM-EAS solutions to meet the varied requirements of
retail store configurations for multiple market segments worldwide. Our EAS
systems are primarily comprised of sensors and deactivation units, which respond
to or act upon our tags and labels. Our EAS products are designed and built to
comply with applicable Federal Communications Commission (FCC) and European
Community (EC) regulations governing RF, signal strengths, and other
factors.
Electronic
Article Surveillance Consumables
We
produce EAS-RF and EAS-EM labels that work in combination with our EAS systems
to reduce merchandise theft in retail stores. Our diversified product line of
discrete, disposable labels and one-time-use hard tags are designed to enable
retailers to protect a diverse array of easily-pocketed, high shrink
merchandise. While EAS labels can be applied in retail stores and distribution
centers, an increasing percentage of our customers are taking advantage of our
source tagging program. With source tagging, EAS labels and hard tags are
configured to the merchandise and specific security requirements of the customer
and applied at the point of manufacture. Our paper thin EAS labels have
characteristics that are easily integrated with high-speed automated application
systems. We have recently launched a new generation of EAS labels with enhanced
performance EP labels. These labels are smaller yet provide superior detection
capability.
Alpha
We
provide retailers with innovative and technically advanced products engineered
to protect high-theft merchandise. Alpha is unique in its focus on both design
and manufacturing of high theft protection products. Alpha products are designed
to offer retailers security, aesthetics, value and ease of use. Alpha pioneered
the “open display” security philosophy by providing retailers a truly safe means
to bring merchandise from behind locked cabinets and openly display it. The
product line consists of keepers, spider wraps, bottle security, and hard tags.
Alpha recently introduced a new product, Showsafe, which is a line alarm system
for protecting display merchandise. All Alpha products are available in AM, RF,
or EM formats.
CheckView™
— Video, Fire and Intrusion Systems
We
provide complete physical and electronic store monitoring solutions, including
fire alarms, intrusion alarms and digital video recording systems for retail
environments. CheckView’s™ exclusive focus on retail offers centralized project
coordination supported by a large field management structure. Our product and
application teams evaluate and support new technology development and our design
department engineers each project. Our video surveillance
solutions address shoplifting and internal theft as well as customer and
employee safety and security needs. The product line consists of closed circuit
television products and services including fixed and high-speed pan/tilt/zoom
camera systems, programmable switcher controls, time-lapse recording, and remote
video surveillance.
Our fire
and intrusion systems provide life safety and property protection, completing
the line of loss prevention solutions. In addition to the system installations,
we offer a U.S.-based 24-hour central station monitoring service.
In 2008,
we expanded our systems solution offering in the U.S. by entering the financial
services sector, providing branch banks with physical and electronic security
solutions.
4
RFID
Tags and Labels
We
produce RFID tags and labels, leveraging our high volume, low cost RF circuit
production and manufacturing knowledge. In October 2006, we announced our
intention to focus our RFID initiative on our core retail customers business.
During June 2008, we acquired OATSystems, Inc., a recognized leader in
RFID-based application software. The addition of OATSystems, Inc. will build on
our strategy to help retailers and suppliers with our EVOLVETM EAS
platform to more easily migrate to EPC RFID. As our industry moves to a common
EPC standard, we will be able to offer solutions that enable retailers and their
suppliers to gain deeper visibility of assets and merchandise — further reducing
shrink and increasing bottom-line profits while enhancing the on-shelf
availability of merchandise for consumers.
APPAREL
LABELING SOLUTIONS
Apparel
Labeling Solutions (ALS) is our second largest business. We provide apparel
retailers, brand owners, and manufacturers with a single source of their apparel
labeling requirements. ALS is our web-enabled apparel labeling solutions
platform and network of 28 service bureaus located in 22 countries that supplies
customers with customized apparel tags and labels to the location where the
goods are manufactured. Our order entry, logistics, and data management
capabilities facilitates on-demand printing of variable pricing and article
identification data and barcode information onto price and apparel tags. ALS
also offers a product line that integrates our EAS-RF security labels into
customized apparel tags.
Our
service bureau network is one of the most extensive in the industry, and its
ability to offer integrated branding, barcode, and EAS security tags places it
among just a handful of suppliers who possess this capability. Our printing
capacity and service bureau network expanded in August 2009 with the acquisition
of Brilliant Label Manufacturing Ltd. The acquisition of Brilliant also enables
us to meet the greater demand for fabric and woven tags and labels.
ALS
revenues represented 18%, 15%, and 15% of our total revenues for 2009, 2008, and
2007, respectively.
RETAIL
MERCHANDISING SOLUTIONS
Our
retail merchandising solutions business includes hand-held label applicators and
tags, promotional displays, and queuing systems. These traditional products
broaden our reach among retailers. Many of the products in this business segment
represent high-margin items with a high level of recurring sales of associated
consumables such as labels. As a result of the increasing use of scanning
technology in retail, our hand-held labeling systems products are serving a
declining market. Retail merchandising solutions, which is focused on European
and Asian markets, represents approximately 10% of our business, with no product
group in this segment accounting for as much as 10% of our
revenues.
Hand-held
Labeling Systems
Hand-held
labeling systems (HLS) include a complete line of hand-held price marking and
label application solutions, primarily sold to retailers. Sales of labels,
consumables, and service generate a significant source of recurring revenues. As
retail scanning becomes widespread, in-store retail price marking applications
have continued to decline. Our HLS products possess a market leading position in
several European countries.
Retail
Merchandising Systems
Retail
merchandising systems (RMS) include a wide range of products for customers in
certain retail sectors, such as supermarkets and do-it-yourself, where
high-quality signage and in-store price promotion are important. Product
categories include traditional retail promotional systems for in-store
communication and electronic graphics systems, and customer queuing
systems.
BUSINESS
STRATEGY
Our
business strategy focuses on providing end-to-end shrink management and
merchandise visibility solutions and apparel labeling solutions that help
retailers, manufacturers, and distributors identify, track, and protect their
assets. We believe that innovative new products and expanded product offerings
will provide significant opportunities to enhance the value of legacy products
while expanding the product base in existing customer accounts. We intend to
maintain our leadership position in certain key hard goods markets
(supermarkets, drug stores, mass merchandisers, and music/electronics), expand
our market share in the soft goods markets (apparel), and maximize our position
in under-penetrated markets. We also intend to continue to capitalize on our
installed base of large global retailers to promote source tagging. Furthermore,
we plan to leverage our knowledge of RF and identification technologies to
assist retailers and manufacturers in realizing the benefits of
RFID.
To
achieve these objectives, we plan to continually enhance and expand our
technologies and products, and provide superior service to our customers. We are
focused on providing our customers with a wide variety of integrated shrink
management solutions, labeling, and retail merchandising solutions characterized
by superior quality, ease of use, good value, and enhanced merchandising
opportunities for the retailer, manufacturer, and distributor.
We
continue to evaluate our sales productivity, manufacturing and supply chain
efficiency, and our overhead structure and have taken actions where we have
identified specific opportunities to improve profitability.
Principal
Markets and Marketing Strategy
Through
our Shrink Management Solutions business segment, we market EAS systems,
software and other security solutions, and CheckView™ products and services
primarily to worldwide retailers in the hard goods market and soft goods market.
We enjoy significant market share, particularly in the supermarket, drug store,
hypermarket, and mass merchandiser market segments.
Shoplifting
and employee theft are major causes of shrinkage. Data collection systems have
highlighted the shrinkage problem to retailers. As a result, retailers recognize
that the implementation of effective electronic security solutions can
significantly reduce shrinkage and increase profitability.
In
addition to providing retail security solutions, we provide a wide variety of
integrated shrink management and merchandise visibility solutions, labeling
solutions, and retail merchandising solutions to manufacturers and retailers
worldwide. This entails a broadened focus within the entire retail supply chain
by providing branding, tracking, and shrink management solutions to retail
stores, distribution centers, and consumer product and apparel manufacturers
worldwide.
We are
focused on “Helping Retailers Grow Profitability” by providing our customers
with a wide variety of integrated solutions. Our ongoing marketing strategy
includes the following:
|
§
|
communicate
the synergies within Checkpoint’s product portfolio to demonstrate the
unique value that the collection of these products bring to customers as a
holistic, end-to-end solutions;
|
|
§
|
open
new, and expand existing retail accounts with new products that will
increase penetration through integrated value-added solutions for
labeling, security, and
merchandising;
|
|
§
|
establish
business-to-business web-based capabilities to enable retailers and
manufacturers to initiate and track their orders through the supply chain
on a global basis;
|
|
§
|
expand
market opportunities to manufacturers and distributors, including source
tagging and value-added labeling;
|
|
§
|
continue
to promote source tagging around the world with extensive integration and
automation capabilities using new EAS, RFID, and auto-ID technologies;
and
|
|
§
|
assist
retailers in understanding the benefits and implementation of the new EPC
using RFID technology.
|
5
We market
our products primarily:
|
§
|
by
providing total loss prevention solutions to the
retailer;
|
|
§
|
by
communicating, messaging and highlighting Checkpoint’s unique position as
a single source provider of integrated and complete solutions for
retailers;
|
|
§
|
by
helping retailers sell more merchandise by avoiding stock-outs and making
merchandise available to consumers;
|
|
§
|
by
serving as a single point of contact for auto-ID and EAS labeling and
ticketing needs;
|
|
§
|
through
direct sales efforts, comprehensive public relations efforts, online
marketing and targeted trade show
participation;
|
|
§
|
through
superior service and support capabilities;
and
|
|
§
|
by
emphasizing source tagging
benefits.
|
We focus
on partnering with retail suppliers worldwide in our source tagging program.
Ongoing strategies to increase acceptance of source tagging are as
follows:
|
§
|
increase
installation of EAS equipment on a chain-wide basis with leading retailers
around the world;
|
|
§
|
offer
integrated tag solutions, including custom tag conversion that addresses
the needs of branding, tracking, and loss
prevention;
|
|
§
|
assist
retailers in promoting source tagging with
vendors;
|
|
§
|
broaden
penetration of existing accounts by promoting our in-house printing,
global service bureau network, and labeling solution
capabilities;
|
|
§
|
support
manufacturers and suppliers to speed
implementation;
|
|
§
|
expand
RF tag technologies and products to accommodate the needs of the packaging
industry; and
|
|
§
|
develop
compatibility with EPC/RFID
technologies.
|
MANUFACTURING,
RAW MATERIALS, AND INVENTORY
Electronic
Article Surveillance
We
manufacture our EAS systems and labels, including Alpha S3 products, in
facilities located in Puerto Rico, Japan, China, the U.S. and the Dominican
Republic. Our manufacturing strategy for EAS products is to rely primarily on
in-house capability for core components and to outsource manufacturing to the
extent economically beneficial. We manage the integration of our in-house
capability and our outsourced manufacturing in a way that provides significant
control over costs, quality, and responsiveness to market demand, which we
believe results in a distinct competitive advantage.
We
involve customers, engineering, manufacturing, and marketing in the design and
development of our products. For RF sensor production, we purchase raw materials
from outside suppliers and assemble electronic components at our facilities in
the Dominican Republic for the majority of our sensor product lines. The
manufacture of some RF sensors sold in Europe and all EM hardware is outsourced.
For our EAS disposable tag production, we purchase raw materials and components
from suppliers and complete the manufacturing process at our facilities in
Puerto Rico, Japan, and China. For our Alpha S3 secured merchandising
production, we purchase raw materials and components from suppliers and complete
the manufacturing process at our facilities in the U.S. as well as using
outsourced manufacturing in China. The principal raw materials and components
used by us in the manufacture of our products are electronic components and
circuit boards for our systems; aluminum foil, resins, paper, and ferric
chloride and hydrochloric acid solutions for our disposable tags; and polymer
resin for our Alpha S3 products. While most of these materials are purchased
from several suppliers, there are alternative sources for all such materials.
The products that are not manufactured by us are sub-contracted to manufacturers
selected for their manufacturing and assembly skills, quality, and
price.
CheckView™
— Video, Fire and Intrusion Systems
We are
primarily an integrator of video, fire and intrusion components manufactured by
others. In the U.S., we use in-house capabilities to assemble products such as
the pan/tilt/zoom dome camera and other products such as the Advanced Public
View (APV) system. The software component of the system is added during
product assembly at our operational facilities.
Apparel
Labeling Solutions and Retail Merchandising Solutions
We
manufacture labels, tags, and hand-held tools. Our main production facilities
are located in Germany, the Netherlands, the U.S., the U.K., China, and
Malaysia. Local production facilities are also situated in Hong Kong, China and
Turkey. Our facilities in the Netherlands, the U.S., and the U.K. manufacture
labels and tags for laser overprinting. With the acquisition of Brilliant in
August 2009, we acquired fabric and woven labels manufacturing facilities in
China. ALS has a network of 28 service bureaus located in 22 countries that
supplies customers with customized apparel tags and labels to the location where
the goods are manufactured. Manufacturing in Germany is focused on HLS labels
and print heads for HLS tools. The Malaysian facility produces standard bodies
for HLS tools for Europe, complete hand-held tools for the rest of the world,
and labels for the local market.
DISTRIBUTION
For our
major product lines, we principally sell our products to end customers using our
direct sales force of more than 500 sales people. To improve our sales
efficiency, we also distribute products through an independent network of
resellers. This distribution channel supports and services smaller customers.
This indirect channel, which has primarily sold EAS solutions, will be broadened
and expanded to include more product lines as we focus on improved sales
productivity.
Electronic
Article Surveillance
We sell
our EAS systems, labels, and Alpha S3 products principally throughout North
America, South America, Europe, and the Asia Pacific region. In North America,
we market our EAS products through our own sales personnel and independent
representatives.
Internationally,
we market our EAS products principally through foreign subsidiaries which sell
directly to the end-user and through independent distributors. Our international
sales operations are currently located in 14 European countries and in
Argentina, Australia, Brazil, Canada, Hong Kong, India, Japan, Malaysia, China,
Mexico, and New Zealand.
CheckView™
— Video, Fire and Intrusion Systems
We market
video systems and services in selected countries throughout the world using our
own sales staff. These products and services are provided to our EAS retail
customers, as well as non-EAS retailers. Fire and intrusion systems are marketed
exclusively in the U.S. through a direct sales force.
Apparel
Labeling Solutions and Retail Merchandising Solutions
Our
customers in the apparel labeling solutions and retail merchandising solutions
businesses are primarily found within the retail sector and retail supply chain.
Major customers include companies within industries such as food retailing, DIY,
department stores, and apparel retailers.
Large
national and international customers are handled centrally by key account sales
specialists supported by appropriate business specialists. Smaller customers are
served by either a general sales force capable of representing all products or,
if the complexity or size of the business demands, a dedicated business
specialist.
6
BACKLOG
Our
backlog of orders was approximately $50.2 million at December 27, 2009
compared to approximately $51.8 million at December 28, 2008. We
anticipate that substantially all of the backlog at the end of 2009 will be
delivered during 2010. In the opinion of management, the amount of backlog is
not indicative of trends in our business. Our security business generally
follows the retail cycle so that revenues are weighted toward the last half of
the calendar year as retailers prepare for the holiday season.
TECHNOLOGY
We
believe that our patented and proprietary technologies are important to our
business and future growth opportunities, and provide us with distinct
competitive advantages. We continually evaluate our domestic and international
patent portfolio, and where the cost of maintaining the patent exceeds its
value, such patent may not be renewed. The majority of our revenues are derived
from products or technologies that are patented or licensed. There can be no
assurance, however, that a competitor could not develop products comparable to
ours. Our competitive position is also supported by our extensive manufacturing
experience and know-how.
PATENTS
& LICENSING
On
October 1, 1995, we acquired certain patents and improvements thereon
related to EAS products and manufacturing processes from Arthur D. Little, Inc.
for which we paid annual royalties. Our payment obligation terminated on
December 31, 2008, and since then we have held a royalty free
license.
We also
license technologies relating to RFID applications, EAS products, certain
sensors, magnetic labels, and fluid tags. These license arrangements have
various expiration dates and royalty terms, which are not considered by us to be
material.
Apparel
Labeling Solutions and Retail Merchandising Solutions
We focus
our in-house development efforts on product areas where we believe we can
achieve and sustain a competitive cost and positioning advantage, and where
delivery service is critical. We also develop and maintain technological
expertise in areas that are believed to be important for new product development
in our principal business areas. We have a base of technology expertise in the
printing, electronics, and software areas and are particularly focused on EAS
and labeling capabilities to support the development of higher value-added
labels.
SEASONALITY
Our
business is subject to seasonal influences, which generally causes us to realize
higher levels of sales and income in the second half of the year. Our business’
seasonality substantially follows the retail cycle of our customers, which
generally has revenues weighted towards the last half of the calendar year in
preparation for the holiday season.
COMPETITION
Electronic
Article Surveillance
Currently,
EAS systems and labels are sold to two principal markets: retail establishments
and libraries. Our principal global competitor in the EAS industry is Tyco
International Ltd. (Tyco), through its ADT Worldwide segment. Tyco is a
diversified global company with interests in security products and
services, fire protection and detection products and services, valves and
controls and other industrial products. Tyco’s 2009 revenues were
approximately $17.2 billion, of which $7.0 billion was attributable to the
ADT Worldwide segment.
Within
the U.S. market, additional competitors include Sentry Technology Corporation
and Ketec, Inc. in EAS systems and consumables, and All-Tag Security in EAS-RF
labels, principally in the retail market. Within our international markets,
mainly Europe, Nedap® is our most significant competitor. The largest
competitors of the Alpha S3 secured merchandising product line include Universal
Surveillance Systems, Protext International Corporation, Se-Kure Controls, Inc,
and Century.
We
believe that our product line offers a more diverse range of products than our
competition with a variety of disposable and reusable tags and labels,
integrated scan/deactivation capabilities, and RF source tagging embedded into
products or packaging. As a result, we compete in marketing our products
primarily on the basis of their versatility, reliability, affordability,
accuracy, and integration into operations. This combination provides many system
solutions and allows for protection against a variety of retail merchandise
theft. Furthermore, we believe that our manufacturing know-how and efficiencies
relating to disposable tags give us a cost advantage over our
competitors.
CheckView™
— Video, Fire and Intrusion Systems
Our
video, fire and intrusion products, which are sold domestically through our
CheckView™ Group, and video products sold internationally through our
international sales subsidiaries, compete primarily with similar products
offered by Tyco, Vector Security, Inc., and Stanley Security Solution. We
compete based on our superior design and project management services and believe
that our offerings provide our retail and non-retail customers with distinctive
system features.
Apparel
Labeling Solutions
We sell
our apparel labeling solutions services, including tags and labels, to the
retail market. Major competitors for our label products are Avery Dennison
Corporation, SML Group, and Fineline Technologies. Several competitive labeling
service companies are also customers as they purchase EAS circuits from us to
integrate into their label offerings.
Retail
Merchandising Solutions
We face
no single competitor across our entire retail merchandising solutions product
range or across all international markets. HL Display AB is our largest
competitor in the retail display systems market, primarily in Europe. In the HLS
segment, we compete with Contact, Garvey Products Inc., Hallo, Avery Dennison
Corporation, and Prix.
OTHER
MATTERS
Research
and Development
We spent
$20.4 million, $22.6 million, and $18.2 million, in research and
development activities during 2009, 2008, and 2007, respectively. The emphasis
of these activities is the continued broadening of the product lines offered by
us, cost reductions of the current product lines, and an expansion of the
markets and applications for our products. We believe that our future growth in
revenues will be dependent, in part, on the products and technologies resulting
from these efforts.
Another
important source of new products and technologies has been the acquisition of
companies and products. The August 2009 acquisition of Brilliant Label
Manufacturing Ltd has strengthened and expanded our core apparel labeling
offering. Brilliant’s woven and printed label manufacturing capabilities move us
closer to becoming a recognized global provider of apparel labeling
solutions.
The 2008
acquisition of OATSystems, Inc. will build on our strategy of helping retailers
and suppliers migrate more easily with our EVOLVE™ Electronic
Article Surveillance platform to EPC RFID. As our industry moves to a
common EPC standard, we will now be able to offer solutions that enable
retailers and their supply chains to gain deeper visibility of their assets and
merchandise - further reducing shrink and increasing the bottom-line profits by
enhancing on-shelf merchandise availability for consumers.
The
November 2007 acquisition of the Alpha S3 business has enhanced our ability
to introduce new products specifically targeted to high-theft merchandise in an
open-display retail environment.
We
continue to assess acquisitions of related businesses or products consistent
with our overall product and marketing strategies. We also continue to develop
and expand our product lines with improvements in disposable tag performance,
disposable tag manufacturing processes, and wide-aisle RF-EAS detection sensors
with integration of remote and wireless internet connectivity and RFID
integration.
7
Employees
As of
December 27, 2009, we had 5,785 employees, including seven executive
officers, 113 employees engaged in research and development activities, and 568
employees engaged in sales and marketing activities. In the United States, 9 of
our employees are represented by a union. In Europe, approximately 282 of our
employees are represented by various unions or work councils.
Financial
Information About Geographic and Business Segments
We
operate both domestically and internationally in the three distinct business
segments described previously. The financial information regarding our
geographic and business segments, which includes net revenues and gross profit
for each of the years in the three-year period ended December 27, 2009, and
long-lived assets as of December 27, 2009 and December 28, 2008, is
provided in Note 19 to the Consolidated Financial Statements.
Available
Information
Our
internet website is at www.checkpointsystems.com. Investors can obtain copies of
our annual report on Form 10-K, quarterly reports on Form 10-Q, current reports
on Form 8-K, and any amendments to those reports filed or furnished pursuant to
Section 13(a) or 15(d) of the Securities Exchange Act as soon as reasonably
practicable after we have filed such materials with, or furnished them to, the
Securities and Exchange Commission (SEC). We will also furnish a paper copy of
such filings free of charge upon request. Investors can also read and copy any
materials filed by us with the SEC at the SEC’s Public Reference Room which is
located at 100 F Street, NE, Washington, DC 20549. Information about the
operation of the Public Reference Room can be obtained by calling the SEC at
1-800-SEC-0330. Our filings can also be accessed at the SEC’s internet website:
www.sec.gov.
We have
adopted a code of business conduct and ethics (the “Code of Ethics”) as required
by the listing standards of the New York Stock Exchange and the rules of the
SEC. This Code of Ethics applies to all of our directors, officers and
employees. We have also adopted corporate governance guidelines (the “Governance
Guidelines”) and a charter for each of our Audit Committee, Compensation
Committee and Governance and Nominating Committee (collectively, the “Committee
Charters”). We have posted the Code of Ethics, the Governance Guidelines and
each of the Committee Charters on our website at www.checkpointsystems.com, and
will post on our website any amendments to, or waivers from, the Code of Ethics
applicable to any of our directors or executive officers. The foregoing
information will also be available in print upon request.
Executive
Officers of the Company
The
following table sets forth certain current information concerning our executive
officers, including their ages, position, and tenure as of the date
hereof:
|
Name
|
Age
|
Tenure
with
Company
|
Position
with the Company and
Date
of Election to Position
|
|
Robert
P. van der Merwe
|
57
|
3 years
|
Chairman
since December 2008, President and Chief Executive Officer since December
2007
|
|
Raymond
D. Andrews
|
56
|
5 years
|
Senior
Vice President and Chief Financial Officer since December
2007
|
|
Bernard
Gremillet
|
57
|
6 years
|
Executive
Vice President, Global Customer Management since January
2009
|
|
Per
H. Levin
|
52
|
15 years
|
President,
Shrink Management and Merchandise Visibility Solutions since March
2006
|
|
Steven
Davidson
|
52
|
2 year
|
President,
Global Apparel Labeling Solutions since October 2008
|
|
John
R. Van Zile
|
57
|
6 years
|
Senior
Vice President, General Counsel and Secretary since June
2003
|
|
Farrokh
Abadi
|
48
|
6 years
|
Senior
Vice President and Chief Innovation Officer since October
2008
|
Mr. van
der Merwe was appointed President and Chief Executive Officer on December 27,
2007. In December 2008, Mr. van der Merwe was appointed our Chairman of the
Board and has been a member of our Board of Directors since October 2007.
He previously served as President and Chief Executive Officer of Paxar
Corporation, a global leader in providing innovative merchandising systems to
retailers and apparel customers. He became Chairman of the Board of Paxar in
January 2007, and served in these capacities until Paxar’s sale to Avery
Dennison in June 2007. Prior to joining Paxar, Mr. van der Merwe held
numerous executive positions with Kimberly-Clark Corporation from 1980 to 1987
and from 1994 to 2005, including the positions of Group President of
Kimberly-Clark’s global consumer tissue business and Group President of Europe,
Middle East and Africa. Earlier in his career, Mr. van der Merwe held managerial
positions in South Africa at Xerox Corporation and Colgate
Palmolive.
Mr. Andrews
was appointed Senior Vice President and Chief Financial Officer on
December 6, 2007. Mr. Andrews was Senior Vice President and Chief
Accounting Officer from August 2005 until December 2007. He previously
served as Controller of INVISTA S.a’r.l., a subsidiary of Koch Industries, where
he oversaw the company’s accounting operations in North and South America,
Europe and Asia. Prior to the acquisition by Koch Industries, Mr. Andrews
was Director of Accounting Operations of INVISTA Inc. From 1998 to 2002,
Mr. Andrews served as Controller for DuPont Pharmaceuticals Company and
then Bristol-Myers Squibb Pharma Company, a subsidiary of Bristol-Myers Squibb,
when that company acquired DuPont Pharmaceuticals in 2001. Prior to being
appointed Controller, he held positions of increasing responsibility at DuPont
Merck Pharmaceutical Company and the DuPont Company. Mr. Andrews is a
Certified Public Accountant.
Mr. Gremillet
was appointed Executive Vice President Global Customer Management in
January 2009. Previously, he was Executive Vice President Geographies since
August 2007. Prior to that Mr. Gremillet was President, Europe and Latin
America from March 2006 to August 2007. Mr. Gremillet was Western
Mediterranean Unit Manager from March 2004 until March 2006 and was an
independent consultant to Checkpoint from February 2003 to March 2004.
Mr. Gremillet was Corporate Director of Engineering and Technology at
Repsol YPF SA, from December 1999 to May 2002 and Senior Vice
President Downstream at YPF SA in 1999. He held a variety of positions,
including Vice President Marketing and Development for Oilfield Services from
July 1995 to June 1997 and Vice President and General Manager for
Latin America from July 1989 to June 1993 during his 22 years
with Schlumberger from 1975 to 1997.
Mr. Levin
was appointed President, Shrink Management and Merchandise Visibility Solutions
in March 2006. He was President of Europe from June 2004 until
March 2006, Executive Vice President, General Manager, Europe from
May 2003 until June 2004, Vice President, General Manager, Europe from
February 2001 until May 2003. Mr. Levin was Regional Director,
Southern Europe from 1997 to 2001 and joined the Company in January 1995 as
Managing Director of Spain.
Mr. Davidson
joined Checkpoint in 2008 as President, Global Apparel Labeling Solutions.
Previously, he spent 16 years with the Braitrim Group, a company providing
products and services to global apparel retailers and garment manufacturers.
While with the Braitrim Group, Mr. Davidson made a significant contribution
to building their $180 million business, including establishing Sales and
Marketing and Manufacturing infrastructures throughout Asia. Following the
acquisition of Braitrim by the Spotless Group in 2002, Mr. Davidson
remained with the larger organization in the capacity of Managing Director,
EMEA, for Spotless Retailer Services. Mr. Davidson’s previous experience
includes Senior Management positions at TCI Marketing Consultancy, K Shoes Group
in the UK, and Unilever.
Mr. Van
Zile has been Senior Vice President, General Counsel and Secretary since joining
the Checkpoint in June 2003. Prior to joining us, Mr. Van Zile served
as Executive Vice President, General Counsel and Secretary of Exide Corporation
from September 2000 until October 2002, and was Vice President and General
Counsel from November 1996 until September 2000. Prior to Exide
Corporation, Mr. Van Zile held positions of increasing legal responsibility
at GM-Hughes Electronics Corporation and Coltec Industries.
Mr. Abadi
was appointed Senior Vice President and Chief Innovation Officer in
October 2008. Mr. Abadi retains responsibility for our procurement and
systems supply chain. He also served as Senior Vice President, Worldwide
Operations from April 2006 until October 2008 and Vice President and
General Manager, Worldwide Research and Development from November 2004
until April 2006. Prior to joining Checkpoint, Mr. Abadi was Senior
Vice President of Global Cross-Industry Practices at Atos Origin from
February 2004 until November 2004. Mr. Abadi held various senior
management positions with Schlumberger for over eighteen years.
8
The risks
described below are among those that could materially and adversely affect our
business, financial condition or results of operations. These risks could cause
actual results to differ materially from historical experience and from results
predicted by any forward-looking statements related to conditions or events that
may occur in the future.
Current
economic conditions could adversely impact our business and results of
operations.
Our
operations and results depend significantly on global market worldwide economic
conditions, which have experienced a recent deterioration. Current economic
factors include diminished liquidity and tighter credit conditions, leading to
decreased credit availability, as well as declines in economic growth and
employment levels. As a result of these market conditions, the cost and
availability of credit has been and may continue to be adversely affected by
illiquid credit markets and wider credit spreads. These conditions may increase
the difficulty for us to accurately forecast and plan future business. Customer
demand could be impacted by decreased spending by businesses and consumers
alike, and competitive pricing pressures could increase. Additionally, the
disruption in the credit markets may also adversely affect the availability of
financing to support our strategy for future growth through acquisitions. We are
unable to predict the length or severity of the current economic conditions. A
continuation or further deterioration of these economic factors may have a
material and adverse effect on our results of operations, financial condition,
and liquidity, and the liquidity and financial condition of our customers,
including our ability to refinance maturing liabilities and access the capital
markets to meet liquidity needs.
We
have significant foreign operations, which are subject to political, economic
and other risks inherent in operating in foreign countries.
We are a
multinational manufacturer and marketer of identification, tracking security,
and merchandising solutions for the retail industry. We have significant
operations outside of the U.S. We currently operate directly in 30 countries,
and our international operations generate approximately 66% of our revenue. We
expect net revenue generated outside of the U.S. to continue to represent a
significant portion of total net revenue. Business operations outside of the
U.S. are subject to political, economic and other risks inherent in operating in
certain countries, such as:
|
§
|
the
difficulty in enforcing agreements, collecting receivables and protecting
assets through foreign legal
systems;
|
|
§
|
trade
protection measures and import or export licensing
requirements;
|
|
§
|
difficulty
in staffing and managing widespread operations and the application of
foreign labor regulations;
|
|
§
|
compliance
with a variety of foreign laws and
regulations;
|
|
§
|
changes
in the general political and economic conditions in the countries where we
operate, particularly in emerging
markets;
|
|
§
|
the
threat of nationalization and
expropriation;
|
|
§
|
increased
costs and risks of doing business in a number of foreign
jurisdictions;
|
|
§
|
changes
in enacted tax laws;
|
|
§
|
limitations
on repatriation of earnings; and
|
|
§
|
fluctuations
in equity and revenues due to changes in foreign currency exchange
rates.
|
Changes
in the political or economic environments in the countries in which we operate,
as well as the impact of economic conditions on underlying demand for our
products could have a material adverse effect on our financial condition,
results of operations or cash flows.
Volatility
in currency exchange rates and interest rates may adversely affect our financial
condition, results of operations or cash flows.
We are
exposed to a variety of market risks, including the effects of changes in
currency exchange rates and interest rates. See Part 7A. Quantitative and
Qualitative Disclosures About Market Risk.
Our net
revenue derived from sales in non-U.S. markets is approximately 66% of our total
net revenue, and we expect revenue from non-U.S. markets to continue to
represent a significant portion of our net revenue. When the U.S. dollar
strengthens in relation to the currencies of the foreign countries where we sell
our products, our U.S. dollar reported revenue and income will decrease. Changes
in the relative values of currencies occur regularly and, in some instances, may
have a significant effect on our results of operations. Our financial statements
reflect recalculations of items denominated in non-U.S. currencies to U.S.
dollars, which is our functional currency.
We
monitor these exposures as an integral part of our overall risk management
program. In some cases, we enter into contracts to reduce the risks of currency
fluctuations on short-term inter-company receivables and payables, and on
projected future billings in non-functional currencies and use third-party
borrowings in foreign currencies to hedge a portion of our net investments in,
and cash flows derived from, our foreign subsidiaries. Nevertheless, changes in
currency exchange rates and interest rates may have a material adverse effect on
our financial condition, results of operations, or cash flows.
Our
business could be materially adversely affected as a result of lower than
anticipated demand by retailers and other customers for our products,
particularly in the current economic environment.
Our
business is heavily dependent on the retail marketplace. Changes in the economic
environment including the liquidity and financial condition of our customers or
reductions in retailer spending could adversely affect our revenues and results
of operations. In a period of decreased consumer spending, retailers could
respond by reducing their spending on new store openings and loss prevention
budgets. This reduction could directly impact our SMS business, as a reduction
in new store openings will lower demand for SMS EAS systems and consumables and
CheckView™ installations. Additionally, lower loss prevention budgets could
reduce the amount retailers will be willing to spend to upgrade existing store
technology. Label demand could also be impacted due to lower loss prevention
budgets as retailers may reduce the percentage of items covered. In addition,
our label volume increases as more items are sold through the retailer and lower
demand decreases the volume related to the items tagged by the retailer. As
retail sales volumes decline, label demand may also decline. A decrease in the
demand for our products resulting from reduced spending by retailers due to
fewer store openings, reduced loss prevention budgets and slower adoption of our
new technology could have a material adverse effect on our revenues and results
of operations.
Our
business could be materially adversely affected as a result of slower
commitments of retail customers to chain-wide installations and/or source
tagging adoption or expansion.
Our
revenues are dependent on our ability to maintain and increase our system
installation base. The SMS EAS system installation base leads to additional
revenues, which we term as “recurring revenues,” through the sale of maintenance
services and SMS EAS consumables including sensor tags. In addition, we partner
with manufacturers to include our sensor tags into the product during
manufacturing, an approach known as source tagging.
The level
of commitments for chain-wide installations may decline due to decreased
consumer spending that then results in reduced spending on loss prevention by
our retail customers, our failure to develop new technology that entices the
customer to maintain their commitment to our loss prevention products and
services, and competing technologies. A reduction in the commitment for
chain-wide installations may also impact our ability to expand utilization of
our source tagging program. A reduction in commitments to chain-wide
installations and utilization of our source tagging program could have an
adverse effect on our revenues and results of operations.
9
The
markets we serve are highly competitive and we may be unable to compete
effectively if we are unable to provide and market innovative and cost-effective
products at competitive prices.
We face
competition around the world, including competition from other large,
multinational companies and other regional companies. Some of these companies
may have substantially greater financial and other resources than the Company.
We face competition in several aspects of our business. In the SMS EAS systems
and Alpha S3 businesses and SMS EAS consumables business, we compete primarily
on the basis of integrated security solutions and diversified, sophisticated,
and quality product lines targeted at meeting the loss prevention needs of our
retail customers. In our CheckView™ business, we compete primarily on the basis
of efficient installation capability that is in place in North America. In the
ALS business, we compete primarily on the capability to effectively and quickly
deliver retail customer specified tags and labels to manufacturing sites in
multiple countries. It is possible that our competitors will be able to offer
additional products, services, lower prices, or other incentives that we cannot
offer or that will make our products less profitable. It is also possible that
our competitors will offer incentive programs or will market and advertise their
products in a way that will impact customers’ preferences, and we may not be
able to compete effectively.
We may be
unable to anticipate the timing and scale of our competitors’ activities and
initiatives, or we may be unable to successfully counteract them, which could
harm our business. In addition, the cost of responding to our competitors’
activities may affect our financial performance in the relevant period. Our
ability to compete also depends on our ability to attract and retain key talent,
protect patent and trademark rights, and develop innovative and cost-effective
products. A failure to compete effectively could adversely affect our growth and
profitability.
Our
long term success is largely dependent upon our ability to develop new
technologies, and if we are unable to successfully develop those technologies,
our business could be materially adversely affected.
Our
growth depends on continued sales of existing products, as well as the
successful development and introduction of new products, which face the
uncertainty of retail and consumer acceptance and reaction from competitors. In
addition, our ability to create new products and to sustain existing products is
affected by whether we can:
|
§
|
develop
and fund technological innovations, such as those related to our next
generation EAS product solutions, continued investment in evolving RFID
technologies, and other innovative security device, software, and systems
initiatives;
|
|
§
|
receive
and maintain necessary patent and trademark protection;
and
|
|
§
|
successfully
anticipate customer needs and
preferences.
|
The
failure to develop and launch successful new products could hinder the growth of
our business. Research and development for each of our operating segments is
complex and uncertain and requires innovation and anticipation of market trends.
Also, delay in the development or launch of a new product could compromise our
competitive position, particularly if our competitors announce or introduce new
products and services in advance of us.
An
inability to acquire, protect or maintain our intellectual property and patents
could harm our ability to compete or grow.
We have a
number of patents that will expire in the next several years. Because our
products involve complex technology and chemistry, we rely on protections of our
intellectual property and proprietary information to maintain a competitive
advantage. The expiration of these patents will reduce the barriers to entry
into our existing lines of business and may result in loss of market share and a
decrease in our competitive abilities, thus having a potential adverse effect on
our financial condition, results of operations and cash flows.
Our
business could be materially adversely affected as a result of possible
increases in per unit product manufacturing costs as a result of slowing
economic conditions or other factors.
Our
manufacturing capacity is designed to meet our current and future anticipated
demands. If our product demand decreases as a result of economic conditions and
other factors, it could increase our cost per unit. If an increase in our cost
per unit is passed on to our customers, it may decrease our competitive
position, which may have an adverse effect on our revenues and results of
operations. If an increase in cost per unit is not passed on to our customers,
it may reduce our gross margins, which may have an adverse effect on our results
of operations. Our SMS EAS consumables and ALS manufacturing have various low
price competitors globally. In order for us to maintain and improve our market
position, we need to continuously monitor and seek to improve our manufacturing
effectiveness while maintaining our high quality standard. If we are
unsuccessful in our efforts to improve manufacturing and supply chain
effectiveness, then our cost per unit may increase which could have an adverse
impact on our results of operations.
If
we cannot obtain sufficient quantities of raw materials and component parts
required for our manufacturing activities at competitive prices and quality and
on a timely basis, our financial condition, results of operations or cash flows
may suffer.
We
purchase materials and component parts from third parties for use in our
manufacturing operations. Our ability to grow earnings will be affected by
inflationary and other increases in the cost of component parts and raw
materials, including electronic components, circuit boards, aluminum foil,
resins, paper, and ferric chloride and hydrochloric acid solutions. Inflationary
and other increases in the costs of raw materials, labor, and energy have
occurred in the past and are expected to recur, and our performance depends in
part on our ability to pass these cost increases on to customers in the prices
for our products and to effect improvements in productivity. We may not be able
to fully offset the effects of higher component parts and raw material costs
through price increases, productivity improvements or cost reduction programs.
If we cannot obtain sufficient quantities of these items at competitive prices
and quality and on a timely basis, we may not be able to produce sufficient
quantities of product to satisfy market demand, product shipments may be
delayed, or our material or manufacturing costs may increase. A disruption to
our supply chain could adversely affect our sales and profitability. Any of
these problems could result in the loss of customers and revenue, provide an
opportunity for competing products to gain market acceptance and otherwise
adversely affect our financial condition, results of operations, or cash
flows.
Possible
increases in the payment time for receivables as a result of economic conditions
or other market factors could have a material effect on our results from
operations and anticipated cash from operating activities.
The
majority of our customer base is in the retail marketplace. Although we have a
rigorous process to administer credit granted to customers and believe our
allowance for doubtful accounts is adequate, we have experienced, and in the
future may experience, losses as a result of our inability to collect our
accounts receivable. During the past several years, various retailers have
experienced significant financial difficulties, which in some cases have
resulted in bankruptcies, liquidations and store closings. The financial
difficulties of a customer could result in reduced business with that customer.
We may also assume higher credit risk relating to receivables of a customer
experiencing financial difficulty. If these developments occur, our inability to
shift sales to other customers or to collect on our trade accounts receivable
from a major customer could substantially reduce our income and have a material
adverse effect on our results of operations and cash flows from operating
activities.
We
have entered into a secured credit facility agreement that restricts certain
activities, and failure to comply with this agreement may have an adverse effect
on our financial condition, results of operations and cash flows.
We
maintain a secured credit facility that contains restrictive financial
covenants, including financial covenants that require us to comply with
specified financial ratios. We may have to curtail some of our
operations to comply with these covenants. In addition, our
secured credit facility contains other affirmative and negative covenants that
could restrict our operating and financing activities. These provisions limit
our ability to, among other things, incur future indebtedness, contingent
obligations or liens, guarantee indebtedness, make certain investments and
capital expenditures, sell stock or assets and pay dividends, and consummate
certain mergers or acquisitions. Because of the restrictions on our ability
to create or assume liens, we may find it difficult to secure additional
indebtedness if required. Furthermore, if we fail to comply with the secured
credit facility requirements, we may be in default, and we may not be able to
obtain the necessary amendments to the credit agreement or waivers of an event
of default. Upon an event of default if the credit agreement is not amended
or the event of default is not waived, the lender could declare all amounts
outstanding, together with accrued interest, to be immediately due and payable.
If this happens, we may not be able to make those payments or borrow sufficient
funds from alternative sources to make those payments. Even if we were to obtain
additional financing, that financing may be on unfavorable
terms.
10
Changes
in legislation or governmental regulations, policies or standards applicable to
our products may have a significant impact on our ability to compete in our
target markets.
We
operate in regulated industries. Our U.S. operations are subject to regulation
by federal, state, and local governmental agencies with respect to safety of
operations and equipment, labor and employment matters, and financial
responsibility. Our SMS EAS products are subject to FCC regulation, and our
international operations are regulated by the countries in which they operate,
including regulation of the Conformité Européene (CE) in Europe. Failure to
comply with laws or regulations could result in substantial fines or revocation
of our operating permits or licenses. If laws and regulations change and we fail
to comply, our financial condition, results of operations, or cash flows could
be materially and adversely affected.
Our
ability to implement cost reductions in field services, selling, general and
administrative expenses, and our manufacturing and supply chain operations may
have a significant impact on our business and future revenues and
profits.
We have
taken actions to rationalize our field service, improve our sales productivity,
reduce our general and administrative expenses, and reconfigure our
manufacturing and supply chain operations. Such rationalization actions require
management judgment on the development of cost reduction strategies and
precision on the execution of those strategies. We may not realize, in full or
in part, the anticipated benefits from these initiatives, and other events and
circumstances, such as difficulties, delays, or unexpected costs may occur,
which could result in our not realizing all or any of the anticipated benefits.
We also cannot predict whether we will realize improved operating performance as
a result of any cost reduction strategies. Further, in the event the market
continues to fluctuate, we may not have the appropriate level of resources and
personnel to react to the change. We are also subject to the risk of business
disruption in connection with our restructuring initiatives, which could have a
material adverse effect on our business and future revenues and
profits.
We
continue to evaluate opportunities to restructure our business and rationalize
our operations in an effort to optimize our cost structure and
efficiencies. As a result of these evaluations, we may take similar
rationalization steps in the future. Future actions could result in
restructuring and related charges, including but not limited to workforce
reduction costs and charges relating to consolidation of excess facilities that
could be significant.
Our
ability to integrate the acquisitions of the Alpha S3, SIDEP/Asialco, OATSystems
and Brilliant businesses and to achieve our financial and operational goals for
these businesses could have an impact on future revenues and
profits.
We are in
the process of integrating our OATSystems and Brilliant businesses into our
operations. In 2007, we acquired the Alpha S3 business, and we continue to work
to take advantage of the business opportunity to utilize our existing sales
force to grow revenue. In 2007, we also acquired the SIDEP/Asialco business, and
have been integrating that business to optimize worldwide manufacturing
capabilities and improve the quality and profitability of the acquired product
lines. In June 2008, we acquired OATSystems, which will facilitate
complementary merchandise protection and inventory management applications
solutions that will enable retailers and their supply chains to gain deeper
inventory visibility. In August 2009, we acquired Brilliant, a Hong Kong and
China-based manufacturer of woven and printed labels, which will allow us to
strengthen and expand our core apparel labeling offering and provides us with
additional capacity in a key geographical location. Brilliant’s woven and
printed label manufacturing capabilities will establish us as a full range
global supplier for the apparel labeling solutions business.
Various
risks, uncertainties and costs are associated with the acquisitions. Effective
integration of systems, key business processes, controls, objectives, personnel,
management practices, product lines, markets, customers, supply chain
operations, and production facilities can be difficult to achieve and the
results are uncertain, particularly across our internationally diverse
organization. We may not be able to retain key personnel of an acquired company
and we may not be able to successfully execute integration strategies or achieve
projected performance targets set for the business segment into which an
acquired company is integrated. Our ability to execute the integration plans
could have an impact on future revenues and profits and may adversely affect our
financial condition, results of operations or cash flows. There can be no
assurance that these acquisitions or others will be successful and contribute to
our profitability.
If
we fail to manage our growth effectively, our business could be
harmed.
Our
strategy is to maximize value by achieving growth both organically and through
acquisitions. Our ability to effectively manage and control any future growth
may be limited. To manage any growth, our management must continue to improve
our operational, information and financial systems, procedures and controls and
expand, train, retain and manage our employees. If our systems, procedures and
controls are inadequate to support our operations, any expansion could decrease
or stop, and investors may lose confidence in our operations or financial
results. If we are unable to manage growth effectively, our business and
operating results could be adversely affected, and any failure to develop and
maintain adequate internal controls over financial reporting could cause the
trading price of our shares to decline substantially.
An
impairment in the carrying value of goodwill or other assets could negatively
affect our consolidated results of operations and net worth.
Pursuant
to accounting principles generally accepted in the United States, we are
required to annually assess our goodwill, intangibles and other long-lived
assets to determine if they are impaired. In addition, interim reviews must be
performed whenever events or changes in circumstances indicate that impairment
may have occurred. If the testing performed indicates that impairment has
occurred, we are required to record a non-cash impairment charge for the
difference between the carrying value of the goodwill or other intangible assets
and the implied fair value of the goodwill or other intangible assets in the
period the determination is made. Disruptions to our business, end market
conditions and protracted economic weakness, unexpected significant declines in
operating results of reporting units, divestitures and market capitalization
declines may result in additional charges for goodwill and other asset
impairments. We have significant intangible assets, including goodwill with an
indefinite life, which are susceptible to valuation adjustments as a result of
changes in such factors and conditions. We assess the potential impairment of
goodwill and indefinite lived intangible assets on an annual basis, as well as
when interim events or changes in circumstances indicate that the carrying value
may not be recoverable. We assess definite lived intangible assets when events
or changes in circumstances indicate that the carrying value may not be
recoverable.
Our 2009
annual impairment test indicated no impairment of our goodwill or intangible
assets. Although our analysis regarding the fair values of the
goodwill and indefinite lived intangible assets indicates that they exceed their
respective carrying values, materially different assumptions regarding the
future performance of our businesses or significant declines in our stock price
could result in additional goodwill impairment losses. Specifically, an
unanticipated deterioration in revenues and gross margins generated by our
Retail Merchandising Solutions segment could trigger future impairment in that
segment. We also evaluate other assets on our balance sheet whenever
events or changes in circumstances indicate that their carrying value may not be
recoverable. Materially different assumptions regarding the future performance
of our businesses could result in significant asset impairment
losses.
Our
future results may be affected by various legal and regulatory
proceedings.
We cannot
predict with certainty the outcome of litigation matters, government proceedings
and investigations, and other contingencies and uncertainties that may arise out
of the conduct of our business, including matters relating to intellectual
property, employment, commercial and other matters. Resolution of such matters
can be prolonged and costly, and the ultimate results or judgments are uncertain
due to the inherent uncertainty in litigation and other proceedings. Moreover,
our potential liabilities are subject to change over time due to new
developments, changes in settlement strategy or the impact of evidentiary
requirements, and we may be required to pay fines, damage awards or settlements,
or become subject to fines, damage awards or settlements, that could have a
material adverse effect on our results of operations, financial condition, and
liquidity.
The
failure to effectively maintain and upgrade our information systems could
adversely affect our business.
Our
business depends significantly on effective information systems, and we have
many different information systems for our various businesses. Our information
systems require an ongoing commitment of significant resources to maintain and
enhance existing systems and develop new systems in order to keep pace with
continuing changes in information processing technology, evolving industry and
regulatory standards, and changing customer preferences. In addition, we may
from time to time obtain significant portions of our systems-related or other
services or facilities from independent third parties, which may make our
operations vulnerable to such third parties’ failure to perform adequately. Our
failure to maintain effective and efficient information systems, or our failure
to efficiently and effectively consolidate our information systems to eliminate
redundant or obsolete applications, could have a material adverse effect on our
business, financial condition and results of operations. Additionally, any
disruption or failure of such networks, systems, or other technology may disrupt
our operations, cause customer dissatisfaction, and loss of customer
revenues.
11
Risks
generally associated with a company-wide implementation of an enterprise
resource planning (ERP) system may adversely affect our business and
results of operations or the effectiveness of internal control over financial
reporting.
We are
preparing to implement a company-wide ERP system to handle the business and
financial processes within our operations and corporate functions. ERP
implementations are complex and time-consuming projects that involve substantial
expenditures on system software and implementation activities that can continue
for several years. ERP implementations also require transformation of business
and financial processes in order to reap the benefits of the ERP system. Our
business and results of operations may be adversely affected if we experience
operating problems and/or cost overruns during the ERP implementation process or
if the ERP system and the associated process changes, do not give rise to the
benefits that we expect. Additionally, if we do not effectively
implement the ERP system as planned or if the system does not operate as
intended, it could adversely affect the effectiveness of our internal controls
over financial reporting.
As
a global business, we have a relatively complex tax structure, and there is a
risk that tax authorities will disagree with our tax positions.
Since we
conduct operations worldwide through our foreign subsidiaries, we are subject to
complex transfer pricing regulations in the countries in which we operate.
Transfer pricing regulations generally require that, for tax purposes,
transactions between us and our foreign affiliates be priced on a basis that
would be comparable to an arm’s length transaction and that contemporaneous
documentation be maintained to support the tax allocation. Although uniform
transfer pricing standards are emerging in many of the countries in which we
operate, there is still a relatively high degree of uncertainty and inherent
subjectivity in complying with these rules. To the extent that any foreign tax
authorities disagree with our transfer pricing policies, we could become subject
to significant tax liabilities and penalties.
Our tax
returns are subject to review by taxing authorities in the jurisdictions in
which we operate. Although we believe that we have provided for all tax
exposures, the ultimate outcome of a tax review could differ materially from our
provisions.
We record
a valuation allowance to reduce our deferred tax assets to the amount that it is
more likely than not to be realized. Our assessments about the realizability of
our deferred tax assets are based on estimates of our future taxable income by
tax jurisdiction, the prudence and feasibility of possible tax planning
strategies, and the economic environments in which we do business. Any changes
in these assessments could have a material impact on our results of
operations.
None.
Our
principal corporate offices are located at 101 Wolf Drive, Thorofare, New
Jersey. As of December 27, 2009, we owned or leased approximately
2.7 million square feet of space worldwide which is used primarily for
sales, distribution, manufacturing, and general administration. These facilities
include offices located throughout North and South America, Europe, Asia, and
Australia. Our principal manufacturing facilities are located in China, the
Dominican Republic, Germany, Japan, Malaysia, the Netherlands, Puerto Rico,
India, Hong Kong, Bangladesh, the U.K. and the U.S. We believe our current
manufacturing capacity will support our needs for the foreseeable future.
We are
involved in certain legal and regulatory actions, all of which have arisen in
the ordinary course of business, except for the matters described in the
following paragraphs. Management believes that the ultimate resolution of such
matters is unlikely to have a material adverse effect on our consolidated
results of operations and/or financial condition, except as described
below.
Matter
related to All-Tag Security S.A., et al
We
originally filed suit on May 1, 2001, alleging that the disposable,
deactivatable radio frequency security tag manufactured by All-Tag Security S.A.
and All-Tag Security Americas, Inc.’s (jointly “All-Tag”) and sold by
Sensormatic Electronics Corporation (Sensormatic) infringed on a U.S. Patent
No. 4,876,555 (Patent) owned by us. On April 22, 2004, the United
States District Court for the Eastern District of Pennsylvania granted summary
judgment to defendants All-Tag and Sensormatic on the ground that our Patent was
invalid for incorrect inventorship. We appealed this decision. On June 20,
2005, we won an appeal when the Federal Circuit reversed the grant of summary
judgment and remanded the case to the District Court for further proceedings. On
January 29, 2007 the case went to trial, and on February 13, 2007, a
jury found in favor of the defendants on infringement, the validity of the
Patent and the enforceability of the Patent. On June 20, 2008, the Court
entered judgment in favor of defendants based on the jury’s infringement and
enforceability findings. On February 10, 2009, the Court granted
defendants’ motions for attorneys’ fees under Section 285 of the Patent
Statute. The district court will have to quantify the amount of attorneys’ fees
to be awarded, but it is expected that defendants will request approximately
$5.7 million plus interest. We recognized this amount during the fourth
fiscal quarter ended December 28, 2008 in litigation settlements on the
consolidated statement of operations. We intend to appeal any award of legal
fees.
Other
Settlements
During
2009, we recorded $1.3 million of litigation expense related to the settlement
of a dispute with a consultant for $0.9 million and the acquisition of a patent
related to our Alpha business for $0.4 million. We purchased the patent for $1.7
million related to our Alpha business. A portion of this purchase price was
attributable to use prior to the date of acquisition and as a result we recorded
$0.4 million in litigation expense and $1.3 million in intangibles.
No matter
was submitted during the fourth quarter of 2009 to a vote of stockholders.
Our
common stock is listed on the New York Stock Exchange (NYSE) under the
symbol CKP. The following table sets forth, for the periods indicated, the high
and low sale prices for our common stock as reported on the NYSE Composite
Tape.
|
Market
Price
Per
Share
|
||
|
High
|
Low
|
|
|
Fiscal
year ended December 27, 2009
|
||
|
First
Quarter
|
$
11.00
|
$ 6.06
|
|
Second
Quarter
|
$
16.00
|
$ 8.50
|
|
Third
Quarter
|
$
18.10
|
$
14.49
|
|
Fourth
Quarter
|
$
16.91
|
$
13.32
|
|
Fiscal
year ended December 28, 2008
|
||
|
First
Quarter
|
$ 28.38
|
$ 21.49
|
|
Second
Quarter
|
$ 28.10
|
$ 20.80
|
|
Third
Quarter
|
$ 23.43
|
$ 17.32
|
|
Fourth
Quarter
|
$ 18.99
|
$ 9.01
|
Holders
of Record
As of
February 12, 2010, there were 646 holders of record of our common
stock.
12
Dividends
We have
never paid a cash dividend on our common stock (except for a nominal cash
distribution in April 1997 to redeem the rights outstanding under our 1988
Shareholders’ Rights Plan). We do not anticipate paying any cash dividends in
the near future. We have retained, and expect to continue to retain, our
earnings for reinvestment into the business. The declaration and payment of
dividends in the future, and their amounts, will be determined by the Board of
Directors in light of conditions then existing, including our earnings, our
financial condition and business requirements (including working capital needs),
and other factors.
Recent
Sales of Unregistered Securities
There has
been no sale of unregistered securities in fiscal years 2009, 2008 or
2007.
Equity
Compensation Plan Information
The
following table sets forth our shares authorized for issuance under our equity
compensation plan at December 27, 2009:
|
Equity
compensation
plans
approved
by
shareholders
|
Equity
compensation
plans
not
approved
by
shareholders
|
Total
|
|
|
Number
of securities to be issued upon exercise of outstanding
options
|
2,777,897(1)
|
270,000(2)
|
3,047,897
|
|
Weighted
average exercise price of outstanding options
|
$ 17.62
|
$ 22.71
|
$ 18.07
|
|
Number
of securities remaining available for future issuance under equity
compensation plans (excluding securities reflected above)
|
1,012,994
|
—
|
1,012,994
|
(1)
Includes stock options and performance based restricted stock
units.
(2)
Inducement options granted to newly elected President and CEO of Checkpoint in
connection with his hire in fiscal year 2007.
STOCK
PERFORMANCE GRAPH
The
following graph compares the cumulative total shareholder return on the Common
Stock of the Company for the period beginning December 26, 2004 and ending
on December 27, 2009, with the cumulative total return on the Center for
Research in Security Prices Index (CRSP Index) for NYSE/AMEX/NASDAQ Stock
market, and the CRSP Index for NASDAQ Electronic Components and Accessories,
assuming the investment of $100 in the Company’s Stock, the CRSP Index for
NYSE/AMEX/NASDAQ Stock market, and the CRSP Index for NASDAQ Electronic
Components and Accessories and the reinvestment of all dividends.
|
Year
|
Checkpoint
Systems,
Inc.
|
NYSE/AMEX/NASDAQ
Stock
Market Index
|
NASDAQ
Electronic
Components
and
Accessories
Index
|
|
2004
|
100.00
|
100.00
|
100.00
|
|
2005
|
136.56
|
106.14
|
104.81
|
|
2006
|
111.92
|
123.11
|
99.64
|
|
2007
|
143.99
|
129.52
|
116.01
|
|
2008
|
54.52
|
77.57
|
59.41
|
|
2009
|
84.51
|
100.12
|
95.33
|
This
Stock Performance Graph shall not be deemed incorporated by reference by any
general statement incorporating by reference this annual report into any filing
under the Securities Act of 1933, as amended, or the Securities Exchange Act of
1934, as amended, except to the extent that the Company specifically
incorporates this information by reference, and shall not otherwise be deemed
filed under such Acts.
Comparison
of 5 Year Cumulative Total Return
Assumes
Initial Investment of $100
December 2009
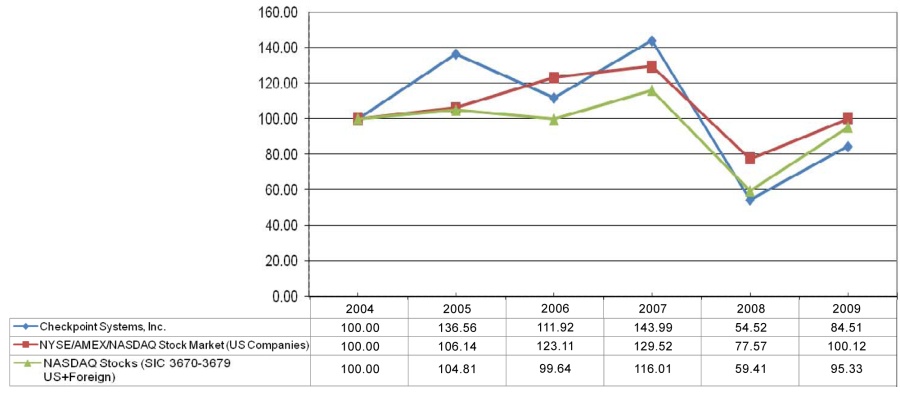
Notes:
|
A.
|
Note:
Data complete through last fiscal
year.
|
|
B.
|
Note:
Corporate Performance Graph with peer group uses peer group only
performance (excludes only
company).
|
|
C.
|
Note:
Peer group indices use beginning of period market capitalization
weighting.
|
|
D.
|
Note:
Data and graph are calculated from CRSP Total Return Index for the
NYSE/AMEX/NASDAQ Stock Market (U.S. Companies), Center for Research in
Security Prices (CRSP), Graduate School of Business, The University of
Chicago.
|
13
The
following tables set forth our selected financial data and should be read in
conjunction with Management’s Discussion and Analysis of Financial Condition and
Results of Operations and the Consolidated Financial Statements and Notes
thereto included elsewhere herein.
(dollar
amounts are in thousands except per share amounts)
|
Year
ended
|
Dec. 27,
2009
|
Dec. 28,
2008
|
Dec. 30,
2007
|
Dec. 31,
2006
|
Dec. 25,
2005
|
|
STATEMENT
OF OPERATIONS DATA
|
|||||
|
Net
revenues
|
$ 772,718
|
$
917,082
|
$
834,156
|
$
687,775
|
$
717,992
|
|
Earnings
(loss) from continuing operations before income taxes
|
$ 35,985
|
$
(29,209)
|
$
70,576
|
$
41,975
|
$
40,127
|
|
Income
taxes expense
|
$ 10,290
|
$
719
|
$
12,174
|
$
6,987
|
$
11,661
|
|
Earnings
(loss) from continuing operations
|
$ 25,695
|
$
(29,928)
|
$
58,402
|
$
34,988
|
$
28,466
|
|
Discontinued
operations, net of tax
|
$
—
|
$ —
|
$
359
|
$
903
|
$
8,108
|
|
Net
earnings (loss) attributable to Checkpoint Systems, Inc.
|
$
26,142(1)
|
$
(29,805)(2)
|
$ 58,768(3)
|
$ 35,922(4)
|
$ 36,521(5)
|
|
Earnings
(loss) attributable to Checkpoint Systems, Inc. per share from continuing
operations:
|
|||||
|
Basic
|
$
.67
|
$
(.76)
|
$
1.46
|
$
.89
|
$
.75
|
|
Diluted
|
$
.66
|
$
(.76)
|
$
1.43
|
$
.87
|
$
.72
|
|
Earnings
(loss) attributable to Checkpoint Systems, Inc. per share:
|
|||||
|
Basic
|
$
.67
|
$
(.76)
|
$
1.47
|
$
.91
|
$
.96
|
|
Diluted
|
$
.66
|
$
(.76)
|
$
1.44
|
$
.89
|
$
.93
|
|
Depreciation
and amortization
|
$
32,325
|
$
30,788
|
$
21,059
|
$
19,504
|
$
22,539
|
|
(1)
|
Includes
a $5.4 million restructuring charge ($4.0 million, net of tax),
a $1.3 million litigation settlement charge ($0.8 million, net
of tax), and a valuation allowance adjustment of $5.3
million.
|
|
(2)
|
Includes
a $59.6 million goodwill impairment charge ($58.5 million, net
of tax), a $6.4 million restructuring charge ($4.6 million, net
of tax), a $6.2 million litigation settlement charge
($3.8 million, net of tax), a $3.0 million intangible asset
impairment charge ($2.2 million, net of tax), a $1.5 million fixed
asset impairment charge ($1.1 million, net of tax), and a
$1.0 million gain from the sale of our Czech subsidiary
($1.0 million, net of tax).
|
|
(3)
|
Includes
a $2.7 million ($2.0 million, net of tax) restructuring charge,
a $4.4 million ($2.9 million, net of tax) charge related to the
CEO transition, and a $2.6 million ($2.5 million, net of tax)
gain from the sale of our Austrian
subsidiary
|
|
(4)
|
Includes
a $7.0 million ($4.8 million, net of tax) restructuring charge,
a $2.3 million ($1.5 million, net of tax) litigation settlement
charge, and a $1.8 million ($1.1 million, net of tax) gain from
the settlement of a capital lease. Also included in discontinued
operations is a $2.8 million ($1.4 million, net of tax) gain on
the divestment of our barcode
business.
|
|
(5)
|
Includes
a $12.6 million ($8.5 million, net of tax) restructuring charge,
a $1.4 million ($1.4 million, net of tax) asset impairment
charge, $2.0 million of additional tax expense related to our tax
restructuring and dividend repatriation under the American Jobs Creation
Act, and a $0.7 million ($0.7 million, net of tax) goodwill
impairment charge.
|
|
(dollar
amounts in thousands)
|
Dec. 27,
2009
|
Dec. 28,
2008
|
Dec. 30,
2007
|
Dec. 31,
2006
|
Dec. 25,
2005
|
|||||
|
AT
YEAR END
|
||||||||||
|
Working
capital
|
$ 241,809
|
$
282,752
|
$ 297,056
|
$
254,024
|
$
208,255
|
|||||
|
Total
debt
|
$ 116,872
|
$
145,286
|
$ 95,512
|
$ 16,534
|
$ 39,745
|
|||||
|
Total
equity
|
$ 552,657
|
$
505,238
|
$ 589,305
|
$
474,537
|
$
397,622
|
|||||
|
Total
assets
|
$
1,018,336
|
$
985,716
|
$
1,031,044
|
$
781,191
|
$
739,245
|
|||||
|
FOR
THE YEAR ENDED
|
||||||||||
|
Capital
expenditures
|
$ 13,757
|
$ 15,217
|
$ 13,363
|
$ 11,520
|
$ 10,846
|
|||||
|
Cash
provided by operating activities
|
$ 114,826
|
$ 77,206
|
$ 66,971
|
$ 22,386
|
$ 44,618
|
|||||
|
Cash
(used in) provided by investing activities
|
$ (38,645)
|
$
(54,704)
|
$
(106,151)
|
$ 7,963
|
$ (8,521)
|
|||||
|
Cash
(used in) provided by financing activities
|
$ (50,316)
|
$ (4,460)
|
$ 7,164
|
$ (6,945)
|
$
(18,283)
|
|||||
|
RATIOS
|
||||||||||
|
Return
on net sales(a)
|
3.38
|
%
|
(3.25)
|
%
|
7.05
|
%
|
5.22
|
%
|
5.09
|
%
|
|
Return
on average equity(b)
|
4.94
|
%
|
(5.45)
|
%
|
11.05
|
%
|
8.24
|
%
|
9.38
|
%
|
|
Return
on average assets(c)
|
2.61
|
%
|
(2.96)
|
%
|
6.49
|
%
|
4.73
|
%
|
4.84
|
%
|
|
Current
ratio(d)
|
2.00
|
2.34
|
2.42
|
2.31
|
1.99
|
|||||
|
Percent
of total debt to capital(e)
|
17.46
|
%
|
22.33
|
%
|
13.95
|
%
|
3.37
|
%
|
9.09
|
%
|
|
(a)
|
“Return
on net sales” is calculated by dividing net earnings (loss) after the
cumulative effect of change in accounting principle by net
sales
|
|
(b)
|
“Return
on average equity” is calculated by dividing net earnings
(loss) after the cumulative effect of change in accounting principle
by average equity.
|
|
(c)
|
“Return
on average assets” is calculated by dividing net earnings
(loss) after the cumulative effect of change in accounting principle
by average assets.
|
|
(d)
|
“Current
ratio” is calculated by dividing current assets by current
liabilities.
|
|
(e)
|
“Percent
of total debt to capital” is calculated by dividing total debt by total
debt and equity.
|
|
(amounts
are in thousands, except employee data)
|
Dec. 27,
2009
|
Dec. 28,
2008
|
Dec. 30,
2007
|
Dec. 31,
2006
|
Dec. 25,
2005
|
|
OTHER
INFORMATION
|
|||||
|
Weighted
average number of shares outstanding — diluted
|
39,552
|
39,408(1)
|
40,724
|
40,233
|
39,075
|
|
Number
of employees
|
5,785
|
3,878
|
3,930
|
3,213
|
3,955
|
|
Backlog
|
$
50,186
|
$ 51,799
|
$
73,462
|
$
54,899
|
$
52,234
|
|
(1)
|
Excludes
518 common shares from stock options and awards and 22 common shares from
deferred compensation arrangements as they are anti-dilutive due to our
net loss for the year.
|
14
The
following section highlights significant factors impacting the consolidated
operations and financial condition of the Company and its subsidiaries. The
following discussion should be read in conjunction with Item 6. “Selected
Financial Data” and Item 8. “Financial Statements and Supplementary
Data.”
Overview
We are a
multinational manufacturer and marketer of identification, tracking, security
and merchandising solutions primarily for the retail industry. We provide
technology-driven integrated supply chain solutions to brand, track, and secure
goods for retailers and consumer product manufacturers worldwide. We are a
leading provider of, and earn revenues primarily from the sale of, electronic
article surveillance (EAS), custom tags and labels (Apparel Labeling Solutions),
store monitoring solutions (CheckView™), hand-held labeling systems (HLS),
retail merchandising systems (RMS), and radio frequency identification
(RFID) systems and software. Applications of these products include
primarily retail security, asset and merchandise visibility, automatic
identification, and pricing and promotional labels and signage. Operating
directly in 30 countries, we have a global network of subsidiaries and
distributors and provide customer service and technical support around the
world.
Our
results are heavily dependent upon sales to the retail market. Our customers are
dependent upon retail sales, which are susceptible to economic cycles and
seasonal fluctuations. Furthermore, as approximately two-thirds of our revenues
and operations are located outside the U.S., fluctuations in foreign currency
exchange rates have a significant impact on reported results.
Historically,
we have reported our results of operations into three segments: Shrink
Management Solutions, Intelligent Labels, and Retail Merchandising. During the
first quarter of 2009, resulting from a change in our management structure, we
began reporting our segments into three new segments: Shrink Management
Solutions, Apparel Labeling Solutions, and Retail Merchandising Solutions.
Fiscal years 2008 and 2007 have been conformed to reflect the segment change.
The margins for each of the segments and the identifiable assets attributable to
each reporting segment are set forth in Note 19 “Business Segments and
Geographic Information” to the consolidated financial statements. Shrink
Management Solutions now includes results of our EAS labels and library
businesses. Apparel Labeling Solutions, formerly referred to as Check-Net®,
includes tag and label solutions sold to apparel manufacturers and retailers,
which leverage our graphic and design expertise, strategically located service
bureaus, and our Check-Net®
e-commerce capabilities. Our apparel labeling services, coupled with our EAS and
RFID capabilities, provide a combination of apparel branding and identification
with loss prevention and supply chain visibility. There were no changes to the
Retail Merchandising Solutions segment.
Our
business has been impacted by the unprecedented credit crisis and on-going
softening of the global economic environment. In response to these market
conditions, we continue to focus on providing customers with innovative products
that will be valuable in addressing shrink, which is particularly important
during a difficult economic environment. We have also implemented initiatives to
reduce costs and improve working capital to mitigate the effects of the economy
on our business. We believe that the strength of our core business and our
ability to generate positive cash flow will sustain us through this challenging
period.
During
2009, we initiated a plan focused on reducing our overall operating expenses by
consolidating certain administrative functions to improve efficiencies. The
first phase of this plan was implemented in the fourth quarter of
2009. The total anticipated costs related to the first phase of the
plan are $3.1 million of which $2.8 million were incurred during 2009. The
remaining stages of the plan will not be finalized until 2010, at which time
further details and cost impacts will be disclosed.
In
August 2008, we announced a manufacturing and supply chain restructuring
program designed to accelerate profitable growth in our ALS business and to
support incremental improvements in our EAS systems and labels businesses. We
anticipate this program to result in total restructuring charges of
approximately $3 million to $4 million, or $0.06 to $0.08 per diluted
share. We continue to expect implementation of this program to be complete in
2010 and to result in annualized cost savings of approximately
$6 million.
In July
2009, we entered into an agreement to purchase the business of Brilliant, a
China-based manufacturer of woven and printed labels, and settled the
acquisition in August 2009. The financial statements reflect the
preliminary allocations of the Brilliant purchase price based on estimated fair
values at the date of acquisition. The allocation of the purchase
price remains open for certain information related to deferred income taxes and
is expected to be completed during the first half of 2010. The results from the
acquisition and related goodwill are included in the Apparel Labeling Solutions
segment. This acquisition will allow us to strengthen and expand our core
apparel labeling offering and provides us with additional capacity in a key
geographical location. Brilliant’s woven and
printed label manufacturing capabilities will establish us as a full range
global supplier for the apparel labeling solutions business.
Future
financial results will be dependent upon our ability to expand the functionality
of our existing product lines, develop or acquire new products for sale through
our global distribution channels, convert new large chain retailers to our
solutions for shrink management, merchandise visibility and apparel labeling,
and reduce the cost of our products and infrastructure to respond to competitive
pricing pressures.
Our base
of recurring revenue (revenues from the sale of consumables into the installed
base of security systems, apparel tags and labels, and hand-held labeling tools
and services from monitoring and maintenance), repeat customer business, and our
borrowing capacity should provide us with adequate cash flow and liquidity to
execute our business plan.
Critical
Accounting Policies and Estimates
Our
discussion and analysis of our financial condition and results of operations are
based upon our consolidated financial statements, which have been prepared in
accordance with generally accepted accounting principles (GAAP) in the
United States of America. The preparation of these financial statements requires
us to make estimates and judgments that affect the reported amounts of assets,
liabilities, revenues and expenses, and the related disclosure of contingent
assets and liabilities.
Note 1 of
the notes to the consolidated financial statements describes the significant
accounting policies used in the preparation of the consolidated financial
statements. Certain of these significant accounting policies are considered to
be critical accounting policies. A critical accounting policy is defined as one
that is both material to the presentation of our consolidated financial
statements and requires management to make difficult, subjective or complex
judgments that could have a material effect on our financial condition or
results of operations.
Specifically,
these policies have the following attributes: (1) we are required to make
assumptions about matters that are highly uncertain at the time of the estimate;
and (2) different estimates we could reasonably have used, or changes in
the estimate that are reasonably likely to occur, would have a material effect
on our financial condition or results of operations. Estimates and assumptions
about future events and their effects cannot be determined with certainty. On an
on-going basis, we evaluate our estimates on historical experience and on
various other assumptions believed to be applicable and reasonable under the
circumstances. These estimates may change as new events occur, as additional
information is obtained and as our operating environment changes. These changes
have historically been minor and have been included in the consolidated
financial statements as soon as they became known. Senior management reviews the
development and selection of our accounting policies and estimates with the
Audit Committee. The critical accounting policies have been consistently applied
throughout the accompanying financial statements.
15
We believe the following accounting
policies are critical to the preparation of our consolidated financial
statements:
Revenue Recognition. We recognize revenue when
revenue is realized or realizable and earned. Revenue is realized or realizable
and earned when all of the following criteria are met: persuasive evidence of an
arrangement exists; delivery has occurred or services have been rendered; the
price to the buyer is fixed or determinable; and collectability is reasonably
assured. We enter into contracts to sell our products and services, and, while
the majority of our sales agreements contain standard terms and conditions,
there are agreements that contain multiple elements or non-standard terms and
conditions. As a result, significant contract interpretation is sometimes
required to determine the appropriate accounting, including whether the
deliverables specified in a multiple element arrangement should be treated as
separate units of accounting for revenue recognition purposes, and, if so, how
the price should be allocated among the elements and when to recognize revenue
for each element. Unearned revenue is recorded when payments are received in
advance of performing our service obligations and is recognized over the service
period.
For
arrangements with multiple elements, we determine the fair value of each element
and then allocate the total arrangement consideration among the separate
elements. We recognize revenue when installation is complete or other
post-shipment obligations have been satisfied. Equipment leased to customers
under sales-type leases is accounted for as the equivalent of a sale. The
present value of such lease revenues is recorded as net revenues, and the
related cost of the equipment is charged to cost of revenues. The deferred
finance charges applicable to these leases are recognized over the terms of the
leases. Rental revenue from equipment under operating leases is recognized over
the term of the lease. Installation revenue from SMS EAS equipment is recognized
when the systems are installed. Service revenue is recognized, for service
contracts, on a straight-line basis over the contractual period, and, for
non-contract work, as services are performed. Revenues from software license
agreements are recognized when persuasive evidence of an agreement exists,
delivery of the product has occurred, no significant vendor obligations are
remaining to be fulfilled, the fee is fixed and determinable, and collection is
probable. Revenue from software contracts for both licenses and professional
services that require significant production, modification, customization, or
implementation are recognized together using the percentage of completion method
based upon the ratio of labor incurred to total estimated labor to complete each
contract. In instances where there is a term license combined with services,
revenue is recognized ratably over the term. We record estimated reductions to
revenue for customer incentive offerings, including volume-based incentives and
rebates. We record revenues net of an allowance for estimated return activities.
Return activity was immaterial to revenue and results of operations for all
periods presented.
We
believe the following judgments and estimates have a significant effect on our
consolidated financial statements:
Allowance for Doubtful
Accounts. We maintain allowances for doubtful accounts for estimated
losses resulting from the inability of our customers to make required payments.
These allowances are based on specific facts and circumstances surrounding
individual customers as well as our historical experience. The adequacy of the
reserves for doubtful accounts is continually assessed by periodically
evaluating each customer’s receivable balance, considering our customers’
financial condition and credit history, and considering current economic
conditions. Historically, our reserves have been adequate to cover all losses
associated with doubtful accounts. If the financial condition of our customers
were to deteriorate, impairing their ability to make payments, additional
allowances may be required. If economic or political conditions were to change
in the countries where we do business, it could have a significant impact on the
results of operations, and our ability to realize the full value of our accounts
receivable. Furthermore, we are dependent on customers in the retail markets.
Economic difficulties experienced in those markets could have a significant
impact on our results of operations and our ability to realize the full value of
our accounts receivables. If our historical experiences changed by 10%, it would
require an increase or decrease of $0.3 million to our
reserve.
Inventory Valuation. We write down our
inventory for estimated obsolescence or unmarketable items equal to the
difference between the cost of the inventory and the estimated net realizable
value based upon assumptions of future demand and market conditions. If actual
market conditions are less favorable than those projected by management,
additional inventory write-downs may be required. If our estimates were to
change by 10%, it would cause a change in inventory value of
$0.7 million.
Valuation of Long-lived
Assets. Our
long-lived assets include property, plant, and equipment, goodwill, and
identified intangible assets. With the exception of goodwill and
indefinite-lived intangible assets, long-lived assets are depreciated or
amortized over their estimated useful lives, and are reviewed for impairment
whenever changes in circumstances indicate the carrying value may not be
recoverable. Recoverability is determined based upon our estimates of future
undiscounted cash flows. If the carrying value is determined to be not
recoverable an impairment charge would be necessary to reduce the recorded value
of the assets to their fair value. The fair value of the long-lived assets other
than goodwill is based upon appraisals, quoted market prices of similar assets,
or discounted cash flows.
Goodwill
and indefinite-lived intangible assets are subject to tests for impairment at
least annually or whenever events or changes in circumstances indicate that the
carrying amount of the assets may not be recoverable. We test for impairment on
an annual basis as of fiscal month end October of each fiscal year, relying on a
number of factors including operating results, business plans, and anticipated
future cash flows. Our management uses its judgment in assessing whether
goodwill has become impaired between annual impairment tests. Reporting units
are primarily determined as the geographic areas comprising our business
segments, except in situations when aggregation of the reporting units is
appropriate. Recoverability of goodwill is evaluated using a two-step process.
The first step involves a comparison of the fair value of a reporting unit with
its carrying value. If the carrying amount of the reporting unit exceeds the
fair value, then the second step of the process involves a comparison of the
implied fair value and carrying value of the goodwill of that reporting unit. If
the carrying value of the goodwill of a reporting unit exceeds the fair value of
that goodwill, an impairment loss is recognized in an amount equal to the
excess.
The
implied fair value of our reporting units is dependent upon our estimate of
future discounted cash flows and other factors. Our estimates of future cash
flows include assumptions concerning future operating performance and economic
conditions and may differ from actual future cash flows. Estimated future cash
flows are adjusted by an appropriate discount rate derived from our market
capitalization plus a suitable control premium at the date of evaluation. The
financial and credit market volatility directly impacts our fair value
measurement through our weighted average cost of capital that we use to
determine our discount rate and through our stock price that we use to determine
our market capitalization. Therefore, changes in the stock price may also affect
the result of the impairment test. Market capitalization is determined by
multiplying the shares outstanding on the assessment date by the average market
price of our common stock over a 30-day period before each assessment date. We
use this 30-day duration to consider inherent market fluctuations that may
affect any individual closing price. We believe that our market capitalization
alone does not fully capture the fair value of our business as a whole, or the
substantial value that an acquirer would obtain from its ability to obtain
control of our business. As such, in determining fair value, we add a control
premium to our market capitalization. To estimate the control premium, we
considered our unique competitive advantages that would likely provide synergies
to a market participant.
We have
not made any material changes in the methodology used in the assessment of
whether or not goodwill is impaired during the past three fiscal years.
Determining the fair value of a reporting unit is a matter of judgment and often
involves the use of significant estimates and assumptions. The use of different
assumptions would increase or decrease estimated discounted future cash flows
and could increase or decrease an impairment charge. If the use of these assets
or the projections of future cash flows change in the future, we may be required
to record impairment charges. An erosion of future business results in any of
the business units could create impairment in goodwill or other long-lived
assets and require a significant charge in future periods. Specifically, an
unanticipated deterioration in revenues and gross margins generated by our
Retail Merchandising Solutions segment could trigger future impairment in that
segment. (See Notes 1 and 5 of the Consolidated Financial
Statements.)
16
Income Taxes. In determining
income for financial statement purposes, we must make certain estimates and
judgments. These estimates and judgments affect the calculation of certain tax
liabilities and the determination of recoverability of certain of the deferred
tax assets, which arise from temporary differences between tax and financial
statement recognition of revenue and expense. We record a valuation allowance to
reduce our deferred tax assets to the amount that it is more likely than not to
be realized. In assessing the realizability of deferred tax assets, we consider
future taxable income by tax jurisdictions and tax planning strategies. If we
were to determine that we would be able to realize deferred tax assets in the
future in excess of the net recorded amount, an adjustment to the valuation
allowance would increase income in the period such determination was made.
Likewise, should we determine that we would not be able to realize all or part
of our net deferred tax assets in the future, an adjustment to the valuation
allowance would decrease income in the period such determination was made. (See
Note 13 of the Consolidated Financial Statements.)
Changes
in tax laws and rates could also affect recorded deferred tax assets and
liabilities in the future. We are not aware of any such changes that would have
a material effect on our results of operations, cash flows or financial
position.
In
addition, the calculation of our tax liabilities involves dealing with
uncertainties in the application of complex tax regulations in a multitude of
jurisdictions across our global operations. We record tax liabilities for the
anticipated settlement of tax audit issues in the U.S. and other tax
jurisdictions based on our estimate of whether, and the extent to which,
additional taxes will be due. Our income tax expense includes amounts intended
to satisfy income tax assessments that result from these audit issues.
Determining the income tax expense for these potential assessments and recording
the related assets and liabilities requires management judgments and estimates.
Due to the complexity of some of these uncertainties, the ultimate resolution
may result in a payment that is different from our estimate of tax liabilities.
If payment of these amounts ultimately proves to be greater or less than the
recorded amounts, the change of the liabilities would result in tax expense or
benefit being recognized in that period. We evaluate our uncertain tax positions
and believe that our reserve for uncertain tax positions, including related
interest, is adequate.
Pension Plans. We have various unfunded
pension plans outside the U.S. These plans have significant pension costs and
liabilities that are developed from actuarial valuations. Inherent in these
valuations are key assumptions including discount rates, expected return on plan
assets, mortality rates, and merit and promotion increases. We are required to
consider current market conditions, including changes in interest rates, in
selecting these assumptions. Changes in the related pension costs or liabilities
may occur in the future due to changes in the assumptions. A change in discount
rates of 0.25% would have less than a $0.1 million effect on pension
expense.
Stock Compensation. We recognize stock-based
compensation expense for all share-based payment awards net of an estimated
forfeiture rate and only recognize compensation cost for those shares expected
to vest. Stock compensation expense is recognized for all share-based payments
on a straight-line basis over the requisite service period of the
award.
Determining
the fair value of share-based payment awards requires the input of highly
subjective assumptions, including the expected life of the share-based payment
awards and stock price volatility. The assumptions used in calculating the fair
value of share-based payment awards represent management’s best estimates, but
these estimates involve inherent uncertainties and the application of management
judgment. As a result, if factors change and we use different assumptions, our
share-based compensation expense could be materially different in the future. In
addition, we are required to estimate the expected forfeiture rate and only
recognize expense for those shares expected to vest. If our actual forfeiture
rate is materially different from our estimate, the share-based compensation
expense could be significantly different from what we have recorded in the
current period. A change in the estimated forfeiture rate of 10% would have a
$0.2 million effect on stock compensation expense. As of December 27, 2009,
there was $3.0 million and $2.8 million of unrecognized stock-based compensation
expense related to nonvested stock options and restricted stock units,
respectively. Such costs are expected to be recognized over a weighted-average
period of 1.7 years and 1.6 years, respectively. (See Note 8 to the Consolidated
Condensed Financial Statements for further discussion on share-based
compensation.)
Liquidity
and Capital Resources
Our
liquidity needs have related to, and are expected to continue to relate to,
acquisitions, capital investments, product development costs, potential future
restructuring related to the rationalization of the business, and working
capital requirements. We have met our liquidity needs primarily through cash
generated from operations. Based on an analysis of liquidity utilizing
conservative assumptions for the next twelve months, we believe that cash
provided from operating activities and funding available under our credit
agreements should be adequate to service debt and working capital needs, meet
our capital investment requirements, other potential restructuring requirements,
and product development requirements.
The
recent financial and credit crisis has reduced credit availability and liquidity
for many companies. We believe, however, that the strength of our core business,
cash position, access to credit markets, and our ability to generate positive
cash flow will sustain us through this challenging period. We are working to
reduce our liquidity risk by accelerating efforts to improve working capital
while reducing expenses in areas that will not adversely impact the future
potential of our business. Additionally, we have increased our monitoring of
counterparty risk. We evaluate the creditworthiness of all existing and
potential counterparties for all debt, investment, and derivative transactions
and instruments. Our policy allows us to enter into transactions with nationally
recognized financial institutions with a credit rating of “A” or higher as
reported by one of the credit rating agencies that is a nationally recognized
statistical rating organization by the U.S. Securities and Exchange Commission.
The maximum exposure permitted to any single counterparty is $50.0 million.
Counterparty credit ratings and credit exposure are monitored monthly and
reviewed quarterly by our Treasury Risk Committee.
As of
December 27, 2009, our cash and cash equivalents were $162.1 million
compared to $132.2 million as of December 28, 2008. Cash and cash
equivalents increased in 2009 primarily due to $114.8 million of cash provided
by operating activities, partially offset by $50.3 million of cash used in
financing activities and $38.6 million of cash used in investing activities.
Cash from operating activities improved $37.6 million in 2009 compared to
2008, primarily due to improvements in accounts receivable and inventory
management, and increased earnings. The improvement in accounts receivable in
2009 resulted primarily from a concentrated effort to improve working capital
through enhanced collection efforts. The improvement in inventory was primarily
the result of improved inventory management, which resulted in lower inventory
levels. Cash used in investing activities was $16.1 million less in
2009 compared to 2008. This was due primarily to the amount paid for the
acquisitions of OATSystems, Inc. and Security Corporation, Inc. in 2008, which
was partially offset by the amount paid for Brilliant in 2009, and a decrease in
the acquisitions of property, plant and equipment and intangible assets in
2009. Cash used in financing activities was $45.9 million greater
in 2009 compared to 2008. This was due primarily to a $23 million payment to
retire the senior unsecured multi-currency credit facility, a $23 million
payment to reduce the Secured Credit Facility, and $15.5 million in payments to
reduce the debt acquired in the Brilliant acquisition, coupled with an increase
in borrowings in 2008 that were used to finance our stock repurchase program and
OATSystems, Inc. acquisition. The increase in cash used in financing activities
was partially offset by $13.3 million of new factoring arrangements in Europe
during 2009.
Our
percentage of total debt to total equity as of December 27, 2009, was 21.1%
compared to 28.8% as of December 28, 2008. As of December 27, 2009,
our working capital was $241.8 million compared to $282.8 million as
of December 28, 2008.
We
continue to reinvest in the Company through our investment in technology and
process improvement. During 2009, our investment in research and development
amounted to $20.4 million, as compared to $22.6 million in 2008. These
amounts are reflected in the cash generated from operations, as we expense our
research and development as it is incurred. In 2010, we anticipate spending of
approximately $21 million on research and development to support
achievement of our strategic plan.
We have
various unfunded pension plans outside the U.S. These plans have significant
pension costs and liabilities that are developed from actuarial valuations. For
fiscal 2009, our contribution to these plans was $4.6 million. Our funding
expectation for 2010 is $5.2 million. We believe our current cash position,
cash generated from operations, and the availability of cash under our revolving
line of credit will be adequate to fund these requirements. The Contractual
Obligation table details our anticipated funding requirements related to pension
obligations for the next ten years.
Acquisition
of property, plant, and equipment and intangibles during 2009 totaled $13.8
million compared to $15.2 million during 2008. During 2009, our acquisition of
property, plant, and equipment and intangibles consisted of $12.5 million of
capital expenditures and $1.3 million was related to the purchase of a patent.
We anticipate our capital expenditures, used primarily to upgrade information
technology and improve our production capabilities, to approximate
$32 million in 2010.
17
In July
2009, we entered into an agreement to purchase the business of Brilliant, a
China-based manufacturer of woven and printed labels, and settled the
acquisition on August 14, 2009 for approximately $38.3 million, including
cash acquired of $0.6 million and the assumption of debt of $19.6 million. The
payment to acquire Brilliant is reflected in the acquisition of businesses line
within investing activities on the consolidated statement of cash flows. During
2009, $15.5 million of debt payments were made and consisted of $6.8 million of
the current portion of long-term debt, $5.1 million in factoring payments, $2.8
million of bank overdraft payments, and $0.8 million of term loans. All payments
are included in the cash used in financing activities section of our
consolidated statement of cash flows.
Our
Brilliant business has variable interest rate full-recourse factoring
arrangements of accounts receivable with a maximum limit of $3.2 million (HKD
25.0 million) and totaled $1.4 million (HKD 10.9 million) as of December 27,
2009. The arrangements are secured by trade receivables as well as a fixed cash
deposit of $0.6 million (HKD 5.0 million). The arrangement bears interest of HKD
Prime Rate + 1.00%. On December 27, 2009, the interest rate was 6.00%. The
secured cash deposit is recorded within restricted cash in the accompanying
consolidated balance sheets. The factoring arrangement is included in short-term
borrowings in the accompanying consolidated balance sheets. Factoring payments
are included in the cash used in financing activities section of our
consolidated statement of cash flows.
Our
Brilliant business has term loans that totaled $1.1 million (RMB 7.2 million) on
December 27, 2009. The interest rates range from 4.89% to 5.90%. The term loans
mature at various times through July 2010. The term loans are
collateralized by land and buildings with an aggregate carrying value of
$13.1 million as of December 27, 2009. Term loan payments are included
in the cash used in financing activities section of our consolidated statement
of cash flows.
The
remaining $1.6 million of Brilliant debt is related to capital leases which
mature at various dates through 2014. Capital lease payments are included in the
cash used in financing activities section of our consolidated statement of cash
flows.
In
June 2008, we purchased the business of OATSystems, Inc., a privately held
company, for approximately $37.2 million, net of cash acquired of
$0.9 million, and including the assumption of $3.2 million of
OATSystems, Inc. debt. The transaction was paid in cash. Additionally, we
acquired $1.3 million in liabilities.
In
January 2008, we purchased the business of Security Corporation, Inc., a
privately held company, for $7.9 million plus $1.0 million of
liabilities acquired. The transaction was paid in cash.
On
November 1, 2007, Checkpoint Systems, Inc. and one of its direct
subsidiaries (collectively, the “Company”) and Alpha Security Products, Inc. and
one of its direct subsidiaries (collectively, “the Seller”) entered into an
Asset Purchase Agreement and a Dutch Assets Sale and Transfer Agreement
(collectively, the “Agreements”) under which we purchased all of the assets of
Alpha’s S3 business (the “Acquisition”) for approximately $142 million,
subject to a post-closing working capital adjustment, plus additional
performance-based contingent payments up to a maximum of $8 million plus
interest thereon. The purchase price was funded by $67 million of cash and
$75 million of borrowings under our senior unsecured credit facility.
Subject to the Agreements, contingent payments were earned if the revenue
derived from the S3 business exceeded $70 million during the period from
December 31, 2007, until December 28, 2008. In the event that the
revenue derived from the S3 business exceeded $83 million during such
period, the Seller was entitled to a maximum payment of $8 million. During
the fourth fiscal quarter ended December 28, 2008, revenues for the S3
business exceeded the minimum contingency payment thresholds. An accrual of
$6.8 million was recognized at December 28, 2008 for the contingent
payment, with a corresponding increase to goodwill recorded on the acquisition.
The payment of $6.8 million was made during the first quarter of 2009, and
is reflected in the acquisition of businesses line within investing activities
on the consolidated statement of cash flows.
During
the second quarter of 2009, our outstanding Asialco loans were paid down and a
loan was renewed in April 2009 for a 12 month period. As of December 27,
2009, our outstanding Asialco loan balance is $3.7 million
(RMB25 million) and has a maturity date of April 2010. The loan is included
in short-term borrowings in the accompanying consolidated balance sheets. Upon
maturity of the Asialco loans, we intend to renew the outstanding borrowings for
a period of one year.
In August
2009, $8.5 million (¥800 million) was paid in order to extinguish our existing
Japanese local line of credit. The line of credit was included in short-term
borrowings in the accompanying consolidated balance sheet as of December 28,
2008.
In
September 2009, we entered into a new Japanese local line of credit for $6.5
million (¥600 million). As of December 27, 2009, the Japanese local line of
credit is $6.6 million (¥600 million) and is fully drawn. The line of credit
matures in September 2010 and was included in short-term borrowings in the
accompanying consolidated balance sheet as of December 27, 2009.
In
October 2009, we entered into a $12.0 million (€8.0 million) full-recourse
factoring arrangement. The arrangement is secured by trade receivables.
Borrowings bear interest at rates of EURIBOR plus a margin of 3.00%. At December
27, 2009, the interest rate was 3.70%. As of December 27, 2009, the
factoring arrangement had a balance of $10.7 million (€7.4 million) and was
included in short-term borrowings in the accompanying consolidated balance sheet
since the agreement expires in October 2010.
On
April 30, 2009, we entered into a new $125.0 million three-year senior
secured multi-currency revolving credit agreement (the “Secured Credit
Facility”) with a syndicate of lenders. The Secured Credit Facility replaces the
$150.0 million senior unsecured multi-currency credit facility (the “Senior
Unsecured Credit Facility”) arranged in December 2005. Prior to entering
into the Secured Credit Facility, $23.0 million of the Senior Unsecured Credit
Facility was paid down during the second quarter of 2009. We paid fees of $4.0
million to enter into the Secured Credit Facility, which were capitalized as
deferred debt issuance costs and are amortized over the term of the
agreement.
The
Secured Credit Facility also includes an expansion option that gives us the
right to increase the aggregate revolving commitment by an amount up to
$50 million, for a potential total commitment of $175 million. The
expansion option allows the additional $50 million in increments of $25 million
based upon consolidated earnings before interest, taxes, and depreciation and
amortization (EBITDA) on June 28, 2009 and December 27, 2009, respectively.
Based on our consolidated EBITDA at December 27, 2009, we qualified to request
the $50 million expansion option for a total potential commitment of $175
million. We did not elect to request the $50 million expansion option at
December 27, 2009.
Borrowings
under the Secured Credit Facility bear interest at rates of LIBOR plus an
applicable margin ranging from 2.50% to 3.75% and/or prime plus 1.50% to 2.75%
based on our leverage ratio of consolidated funded debt to EBITDA. Under the
Secured Credit Facility, we pay an unused line fee ranging from 0.30% to 0.75%
per annum on the unused portion of the commitment. Our availability under the
Secured Credit Facility will be reduced by letters of credit of up to
$25 million, of which $1.4 million are outstanding at
December 27, 2009. There are no other restrictions on our ability to draw
down on the available portion of our Secured Credit Facility.
The
Secured Credit Facility contains covenants that include requirements for a
maximum debt to EBITDA ratio of 2.75, a minimum fixed charge coverage ratio of
1.25 as well as other affirmative and negative covenants. As of
December 27, 2009, we were in compliance with all covenants. Based upon our
projections, we do not anticipate any issues with meeting our existing debt
covenants over the next twelve months.
In
December 2009, we entered into new full-recourse factoring arrangements. The
arrangements are secured by trade receivables. We received a weighted average of
92.4% of the face amount of receivables that it desired to sell and the bank
agreed, at its discretion, to buy. As of December 27, 2009, the factoring
arrangement had a balance of $2.4 million (€1.7 million), of which $0.5 million
(€0.4 million) was included in short-term borrowings and $1.9 million (€1.3
million) was included in long-term borrowings in the accompanying consolidated
balance sheets since the receivables are collectable through 2016.
We have
never paid a cash dividend (except for a nominal cash distribution in
April 1997 to redeem the rights outstanding under our 1988 Shareholders’
Rights Plan). We do not anticipate paying any cash dividends in the near
future.
As we
continue to implement our strategic plan in a volatile global economic
environment, our focus will remain on operating our business in a manner that
addresses the reality of the current economic marketplace without sacrificing
the capability to effectively execute our strategy when economic conditions and
the retail environment stabilize. Based upon an analysis of liquidity using our
current forecast, management believes that our anticipated cash needs can be
funded from cash and cash equivalents on hand, the availability of cash under
the new $125.0 million Secured Credit Facility and cash generated from
future operations over the next twelve months.
18
Off-Balance
Sheet Arrangements
We do not
utilize material off-balance sheet arrangements apart from operating leases that
have, or are reasonably likely to have, a current or future effect on our
financial condition, changes in financial condition, revenue or expenses,
results of operations, liquidity, capital expenditures or capital resources. We
use operating leases as an alternative to purchasing certain property, plant,
and equipment. Our future rental commitment under all non-cancelable operating
leases was $38.1 million as of December 27, 2009. The scheduled timing of
these rental commitments is detailed in our “Contractual Obligations”
section.
Contractual
Obligations
Our
contractual obligations and commercial commitments at December 27, 2009 are
summarized below:
|
Contractual
Obligation
(dollar
amounts in thousands)
|
Total
|
Due
in less
than
1 year
|
Due
in
1-3
years
|
Due
in
3-5
years
|
Due
after
5
years
|
|
Long-term
debt (1)
|
$ 96,197
|
$ 3,600
|
$ 91,454
|
$ 781
|
$ 362
|
|
Capital
leases (2)
|
4,564
|
1,997
|
2,460
|
107
|
—
|
|
Operating
leases
|
38,074
|
15,217
|
15,626
|
6,342
|
889
|
|
Pension
obligations (3)
|
52,483
|
4,682
|
9,878
|
10,374
|
27,549
|
|
Acquisition
obligation (4)
|
5,047
|
5,047
|
—
|
—
|
—
|
|
Inventory
purchase commitments (5)
|
7,314
|
6,244
|
1,066
|
4
|
—
|
|
Total
contractual cash obligations
|
$
203,679
|
$
36,787
|
$
120,484
|
$
17,608
|
$
28,800
|
|
Commercial
Commitments
(dollar
amounts in thousands)
|
Total
|
Due
in less
than
1 year
|
Due
in
1-3
years
|
Due
in
3-5
years
|
Due
after
5
years
|
|
Standby
letters of credit
|
$
1,444
|
$
1,444
|
$ —
|
$
—
|
$
—
|
|
Surety
bonds
|
2,473
|
1,984
|
489
|
—
|
—
|
|
Total
commercial commitments
|
$
3,917
|
$
3,428
|
$
489
|
$
—
|
$
—
|
|
(1)
|
Includes
Secured Credit Facility, long-term full-recourse factoring liabilities,
and related interest payments through maturity of
$7,020.
|
|
(2)
|
Includes
interest payments through maturity of
$256.
|
|
(3)
|
Amounts
represent undiscounted projected benefit payments to our unfunded plans
over the next 10 years. The expected benefit payments are estimated
based on the same assumptions used to measure our accumulated benefit
obligation at the end of 2009 and include benefits attributable to
estimated future employee service of current
employees.
|
|
(4)
|
The
acquisition obligation represents $3.0 million of deferred payments
to the minority shareholders of Shanghai Asialco Electronics Co., Ltd., a
subsidiary of SIDEP coupled with a $2.0 million deferred payment on a
non-compete contract related to the
acquisition.
|
|
(5)
|
Inventory
purchase commitments represent our legally binding agreements to purchase
fixed or minimum quantities of goods at determinable
prices.
|
The table
above excludes our gross liability for uncertain tax positions, including
accrued interest and penalties, which totaled $21.3 million as of
December 27, 2009, since we cannot predict with reasonable reliability the
timing of cash settlements to the respective taxing authorities.
Pension
Plans
We
maintain several defined benefit pension plans, principally in Europe. The
majority of these pension plans are unfunded. Our pension expense for 2009,
2008, and 2007 was $5.7 million, $5.7 million, and $5.5 million,
respectively. Included in pension expense in 2008 and 2007 is a pension
settlement of $37 thousand and $0.5 million, respectively.
We review
our pension assumptions annually. Our assumptions for the year ended
December 27, 2009, were a discount rate of 5.75%, an expected return of
3.75% and an expected rate of increase in future compensation of
2.77%. In developing the discount rate assumption for each country,
we use a yield curve approach. The yield curve is based on the AA rated bonds
underlying the Barclays Capital corporate bond index. As of December 27, 2009,
and December 28, 2008, the weighted average discount rate was 5.77% in 2009 and
5.75%, respectively. We calculate the weighted average duration of
the plans in each country, and then select the discount rate from the
appropriate yield curve which best corresponds to the plans' liability profile.
The expected rate of the return was developed using the historical rate of
returns of the foreign government bonds currently held.
As of
December 31, 2006, we recognized previously unrecognized losses into the
accrued pension liability with an offsetting charge to accumulated other
comprehensive income. The total amount recognized for losses in accumulated
other comprehensive income as of December 31, 2006 was $14.7 million.
As of December 25, 2005, these amounts were unrecognized and amounted to
$14.5 million. The primary component of the unrecognized losses are
actuarial losses, a transition obligation, and prior period service costs. The
change in actuary losses during 2008 was attributable to changes in the discount
rate as the bond yields have increased. Unrecognized losses are amortized over
the average remaining service period of the employees expected to receive the
benefit in accordance with pension accounting rules. The weighted average
remaining service period is approximately 13 years. The impact of
recognizing the actuarial gains on 2009, 2008, and 2007 pension expense are
$0.1 million, $0.1 million, and $0.6 million, respectively. The
total projected amortization for these gains in 2010 is approximately $0.1
million.
Exposure
to Foreign Currency
We
manufacture products in the USA, the Caribbean, Europe, and the Asia Pacific
region for both the local marketplace, and for export to our foreign
subsidiaries. The subsidiaries, in turn, sell these products to customers in
their respective geographic areas of operation, generally in local currencies.
This method of sale and resale gives rise to the risk of gains or losses as a
result of currency exchange rate fluctuations on inter-company receivables and
payables. Additionally, the sourcing of product in one currency and the sales of
product in a different currency can cause gross margin fluctuations due to
changes in currency exchange rates.
We
selectively purchase currency forward exchange contracts to reduce the risks of
currency fluctuations on short-term inter-company receivables and payables.
These contracts guarantee a predetermined exchange rate at the time the contract
is purchased. This allows us to shift the effect of positive or negative
currency fluctuations to a third party. Transaction gains or losses
resulting from these contracts are recognized at the end of each reporting
period. We use the fair value method of accounting, recording realized and
unrealized gains and losses on these contracts. These gains and losses are
included in other gain (loss), net on our consolidated statements of
operations. As of December 27, 2009, we had currency forward
exchange contracts with notional amounts totaling approximately
$15.5 million. The fair values of the forward exchange contracts were
reflected as a $0.1 million asset and $0.2 million liability and are included in
other current assets and other current liabilities in the accompanying balance
sheets. The contracts are in the various local currencies covering primarily our
operations in the USA, the Caribbean, and Western
Europe. Historically, we have not purchased currency forward exchange
contracts where it is not economically efficient, specifically for our
operations in South America and Asia, with the exception of Japan.
During
the second quarter of 2007, we entered into a foreign currency option contract,
at a notional amount of €5 million, to mitigate the effect of fluctuating
foreign exchange rates on the reporting of a portion of its expected 2007
foreign currency denominated earnings. Changes in the fair value of this foreign
currency option contract, which is not designated as a hedge, are recorded in
earnings immediately. The premium paid on the option contract was $73,000. The
foreign currency option contract expired on December 28, 2007. The fair
market value on this option at the expiration date was zero.
19
Hedging
Activity
Beginning
in the second quarter of 2008, we entered into various foreign currency
contracts to reduce our exposure to forecasted Euro-denominated inter-company
revenues. These contracts were designated as cash flow hedges. The foreign
currency contracts mature at various dates from January 2010 to
September 2010. The purpose of these cash flow hedges is to eliminate the
currency risk associated with Euro-denominated forecasted inter-company revenues
due to changes in exchange rates. These cash flow hedging instruments are marked
to market and the changes are recorded in other comprehensive
income. Amounts recorded in other comprehensive income are recognized
in cost of goods sold as the inventory is sold to external parties. Any hedge
ineffectiveness is charged to other gain (loss), net on our consolidated
statements of operations. As of December 27, 2009, the fair value of
these cash flow hedges were reflected as a $0.3 million asset and a $0.1 million
liability and are included in other current assets and other current liabilities
in the accompanying consolidated balance sheets. The total notional amount of
these hedges is $18.3 million (€12.6 million) and the unrealized loss
recorded in other comprehensive income was $0.2 million (net of taxes of $4
thousand), of which the full amount is expected to be reclassified to earnings
over the next twelve months. During the year ended December 27, 2009, a $1.7
million benefit related to these foreign currency hedges was recorded to cost of
goods sold as the inventory was sold to external parties. We recognized an $8
thousand loss during the year ended December 27, 2009 for hedge
ineffectiveness.
During
the first quarter of 2008, we entered into an interest rate swap agreement with
a notional amount of $40 million and a maturity date of February 18, 2010.
The purpose of this interest rate swap agreement is to hedge potential changes
to our cash flows due to the variable interest nature of our senior unsecured
credit facility. The interest rate swap was designated as a cash flow hedge.
This cash flow hedging instrument is marked to market and the changes are
recorded in other comprehensive income. Any hedge ineffectiveness is charged to
interest expense. As of December 27, 2009, the fair value of the
interest rate swap agreement was reflected as a $0.2 million liability and
is included in other current liabilities in the accompanying consolidated
balance sheets and the unrealized loss recorded in other comprehensive income
was $0.1 million (net of taxes of $66 thousand). We estimate that the full
amount of the loss in accumulated other comprehensive income will be
reclassified to earnings over the next twelve months. We recognized no hedge
ineffectiveness during the year ended December 27, 2009.
Provision
for Restructuring
Restructuring
expense for the periods ended December 27, 2009, December 28, 2008,
and December 30, 2007 were as follows:
(amounts in
thousands)
|
December
27,
2009
|
December
28,
2008
|
December
30,
2007
|
|
|
SG&A
Restructuring Plan
|
|||
|
Severance
and other employee-related charges
|
$
2,828
|
$ —
|
$ —
|
|
Manufacturing
Restructuring Plan
|
|||
|
Severance
and other employee-related charges
|
1,481
|
699
|
—
|
|
Consulting
fees
|
—
|
838
|
—
|
|
2005
Restructuring Plan
|
|||
|
Severance
and other employee-related charges
|
1,149
|
4,563
|
1,215
|
|
Lease
termination costs
|
(57)
|
—
|
2,051
|
|
Acquisition
integration costs
|
—
|
519
|
—
|
|
Pension
curtailment
|
—
|
—
|
(420)
|
|
2003
Restructuring Plan
|
|||
|
Severance
and other employee-related charges
|
—
|
(253)
|
(145)
|
|
Lease
termination costs
|
—
|
76
|
—
|
|
Total
|
$
5,401
|
$ 6,442
|
$
2,701
|
Restructuring
accrual activity for the periods ended December 27, 2009, and
December 28, 2008, were as follows:
(amounts in
thousands)
|
Fiscal
2009
|
Accrual
at
Beginning
of
Year
|
Charged
to
Earnings
|
Charge
Reversed
to
Earnings
|
Cash
Payments
|
Other
|
Exchange
Rate
Changes
|
Accrual
at
12/27/2009
|
|
SG&A
Restructuring Plan
|
|||||||
|
Severance
and other employee-related charges
|
$ —
|
$
2,828
|
$ —
|
$ (103)
|
$ —
|
$ 85
|
$
2,810
|
|
Manufacturing
Restructuring Plan
|
|||||||
|
Severance
and other employee-related charges
|
652
|
1,614
|
(133)
|
(676)
|
—
|
24
|
1,481
|
|
2005
Restructuring Plan
|
|||||||
|
Severance
and other employee-related charges
|
3,302
|
1,500
|
(351)
|
(4,132)
|
—
|
—
|
319
|
|
Acquisition
restructuring costs (1)
|
568
|
—
|
—
|
(142)
|
(322)
|
(17)
|
87
|
|
Total
|
$
4,522
|
$
5,942
|
$
(484)
|
$
(5,053)
|
$
(322)
|
$ 92
|
$
4,697
|
(amounts in
thousands)
|
Fiscal
2008
|
Accrual
at
Beginning
of
Year
|
Charged
to
Earnings
|
Charge
Reversed
to
Earnings
|
Cash
Payments
|
Other
|
Exchange
Rate
Changes
|
Accrual
at
12/28/2008
|
|
Manufacturing
Restructuring Plan
|
|||||||
|
Severance
and other employee-related charges
|
$ —
|
$ 701
|
$ (2)
|
$ (37)
|
$ —
|
$ (10)
|
$ 652
|
|
2005
Restructuring Plan
|
|||||||
|
Severance
and other employee-related charges
|
3,015
|
5,362
|
(799)
|
(4,141)
|
—
|
(135)
|
3,302
|
|
Acquisition
restructuring costs (1)
|
1,209
|
—
|
—
|
(612)
|
—
|
(29)
|
568
|
|
Total
|
$
4,224
|
$
6,063
|
$
(801)
|
$
(4,790)
|
$ —
|
$
(174)
|
$
4,522
|
|
(1)
|
During
2007, restructuring costs of $1.2 million included as a cost of the
SIDEP acquisition ($1.1 million related to employee severance and
$0.1 million related to the cost to abandon facilities) were
accounted for under Emerging Issues Task Force Issue No. 95-3
“Recognition of Liabilities in Connection with Purchase Business
Combinations.” These costs were recognized as an assumed liability in the
acquisition and were included in the purchase price allocation at
November 9, 2007. During 2009, $0.3 million of the acquisition
restructuring liability was reversed related to the SIDEP
acquisition.
|
SG&A
Restructuring Plan
During
2009, we initiated a plan focused on reducing our overall operating expenses by
consolidating certain administrative functions to improve efficiencies. The
first phase of this plan was implemented in the fourth quarter of
2009. The remaining stages of the plan will not be finalized until
2010, at which time further details and cost impacts will be
disclosed.
As of
December 27, 2009, the net charge to earnings of $2.8 million represents the
first stage of the SG&A Restructuring Plan. The total anticipated costs
related to the first phase of the plan are $3.1 million of which $2.8 million
were incurred. The total number of employees affected by the SG&A
Restructuring Plan were 42, of which 7 have been terminated. Termination
benefits are planned to be paid one month to 24 months after termination.
Upon completion, the annual savings related to the first phase of the plan are
anticipated to be approximately $3 million.
20
Manufacturing
Restructuring Plan
In
August 2008, we announced a manufacturing and supply chain restructuring
program designed to accelerate profitable growth in our Apparel Labeling
Solutions (ALS) business, formerly Check-Net®, and to support incremental
improvements in our EAS systems and labels businesses.
For the
year ended December 27, 2009, there was a net charge to earnings of $1.5 million
recorded in connection with the Manufacturing Restructuring Plan.
The total
number of employees affected by the Manufacturing Restructuring Plan were 179,
of which 76 have been terminated. The anticipated total cost is expected to
approximate $3.0 million to $4.0 million, of which $3.0 million
has been incurred. Termination benefits are planned to be paid one month to
24 months after termination. The remaining anticipated costs are expected
to be incurred through the end of 2010. Upon completion, the annual savings are
anticipated to be approximately $6 million.
2005
Restructuring Plan
In the
second quarter of 2005, we initiated actions focused on reducing our overall
operating expenses. This plan included the implementation of a cost reduction
plan designed to consolidate certain administrative functions in Europe and a
commitment to a plan to restructure a portion of our supply chain manufacturing
to lower cost areas. During the fourth quarter of 2006, we continued to review
the results of the overall initiatives and added an additional reduction focused
on the reorganization of senior management to focus on key markets and
customers. This additional restructuring reduced our management by 25%. As of
December 27, 2009, this restructuring plan is substantially
complete.
For the
year ended December 27, 2009, a net charge of $1.1 million was
recorded in connection with the 2005 Restructuring Plan. The charge was composed
of severance accruals and related costs, partially offset by the release of a
lease termination liability.
The total
number of employees affected by the 2005 Restructuring Plan were 897, of which
all have been terminated. The anticipated total cost is expected to approximate
$31 million, of which $31 million has been incurred and $31 million
paid. Termination benefits are planned to be paid one month to 24 months
after termination. Upon completion, the annual savings are anticipated to be
approximately $36 million.
2003
Restructuring Plan
During
2008, we reversed $0.3 million of previously accrued severance and incurred
$0.1 million of lease termination costs related to the 2003 Restructuring
Plan.
During
2007, we reversed $0.1 million of previously accrued severance related to
the 2003 Restructuring Plan.
Goodwill
Impairments
We
perform an assessment of goodwill by comparing each individual reporting unit’s
carrying amount of net assets, including goodwill, to their fair value at least
annually during the fourth quarter of each fiscal year and whenever events or
changes in circumstances indicate that the carrying value may not be
recoverable. In 2009 and 2007, annual assessments did not result in an
impairment charge. Future annual assessments could result in impairment charges,
which would be accounted for as an operating expense.
During
the year ended December 28, 2008, we completed step one of our fiscal 2008
annual analysis and test for impairment of goodwill and it was determined that
certain goodwill related to the Shrink Management Solutions, Apparel Labeling
Solutions and Retail Merchandising Solutions segments were impaired. The second
step of the goodwill impairment test was not completed prior to the issuance of
the fiscal 2008 financial statements. Therefore, we recognized a charge of
$59.6 million as a reasonable estimate of the impairment loss in its fiscal
2008 financial statements. The impairment charge was recorded in goodwill
impairment on the consolidated statement of operations. The impairment charge
was attributed to a combination of a decline in our market capitalization and a
decline in the estimated forecasted discounted cash flows expected by the
Company.
During
the first quarter of fiscal 2009, we completed the second step of its fiscal
2008 annual analysis and test for impairment of goodwill and it was determined
that no further adjustment to the estimated impairment recorded at
December 28, 2008 was needed.
Asset
Impairments
In 2008,
asset impairment expense was $4.5 million, or 0.5% of revenues. There were
no asset impairment charges in 2009 and 2007.
During
our 2008 goodwill and indefinite-lived intangibles annual impairment test, we
determine that indefinite-lived trade mark intangible in our Shrink Management
Solutions segment was impaired. As a result we recorded an impairment charge of
$0.4 million in the fourth quarter of 2008. This charge was recorded in
asset impairments on the consolidated statement of operations.
As a
result of changes in business circumstances related to the customer relationship
intangible recognized in connection with the SIDEP/Asialco acquisition, we
recorded an impairment charge of $2.6 million in the fourth quarter ended
December 28, 2008. The impairment charge was recorded in asset impairments
in the Shrink Management Solutions segment on the consolidated statement of
operations.
In 2008,
we recorded a $1.5 million fixed asset impairment. The charge consisted of
$1.1 million related to the write down of a building in France and
$0.4 million related to the write down of land and a building in Japan.
These impairments were recorded in asset impairments on the consolidated
statement of operations.
Results
of Operations
(All
comparisons are with the previous fiscal year, unless otherwise
stated.)
Net
Revenues
Our unit
volume is driven by product offerings, number of direct sales personnel,
recurring sales and, to some extent, pricing. Our base of installed systems
provides a source of recurring revenues from the sale of disposable tags,
labels, and service revenues.
Our
customers are substantially dependent on retail sales, which are seasonal,
subject to significant fluctuations, and difficult to predict. In addition,
current economic trends have particularly strongly affected our customers, and
consequently our net revenues may be impacted. Such seasonality and fluctuations
impact our sales. Historically, we have experienced lower sales in the first
half of each year.
21
Analysis
of Statement of Operations
The
following table presents for the periods indicated certain items in the
consolidated statement of operations as a percentage of total revenues and the
percentage change in dollar amounts of such items compared to the indicated
prior period:
|
Percentage
of
Total
Revenues
|
Percentage
Change
in
Dollar Amount
|
|||||||||
|
Year
ended
|
December
27,
2009
(Fiscal
2009)
|
December
28,
2008
(Fiscal
2008)
|
December
30,
2007
(Fiscal
2007)
|
Fiscal
2009
vs.
Fiscal
2008
|
Fiscal
2008
vs.
Fiscal
2007
|
|||||
|
Net
revenues
|
||||||||||
|
Shrink
Management Solutions
|
71.7
|
%
|
74.9
|
%
|
73.3
|
%
|
(19.4)
|
%
|
12.5
|
%
|
|
Apparel
Labeling Solutions
|
18.4
|
14.8
|
15.2
|
4.8
|
6.9
|
|||||
|
Retail
Merchandising Solutions
|
9.9
|
10.3
|
11.5
|
(18.3)
|
(2.0)
|
|||||
|
Net
revenues
|
100.0
|
100.0
|
100.0
|
(15.7)
|
9.9
|
|||||
|
Cost
of revenues
|
57.1
|
58.8
|
58.5
|
(18.1)
|
10.4
|
|||||
|
Total
gross profit
|
42.9
|
41.2
|
41.5
|
(12.4)
|
9.3
|
|||||
|
Selling,
general, and administrative expenses
|
34.0
|
32.4
|
31.3
|
(11.5)
|
13.8
|
|||||
|
Research
and development
|
2.6
|
2.5
|
2.2
|
(10.0)
|
24.4
|
|||||
|
Restructuring
expenses
|
0.7
|
0.7
|
0.3
|
(16.2)
|
138.5
|
|||||
|
Asset
impairment
|
—
|
0.5
|
—
|
N/A
|
N/A
|
|||||
|
Goodwill
impairment
|
—
|
6.5
|
—
|
N/A
|
N/A
|
|||||
|
Litigation
settlement
|
0.2
|
0.6
|
—
|
(78.9)
|
N/A
|
|||||
|
Other
operating income
|
—
|
0.1
|
0.3
|
N/A
|
(62.3)
|
|||||
|
Operating
income (loss)
|
5.4
|
(1.9)
|
8.0
|
(342.1)
|
(125.7)
|
|||||
|
Interest
income
|
0.3
|
0.3
|
0.7
|
(25.9)
|
(51.1)
|
|||||
|
Interest
expense
|
1.0
|
0.6
|
0.3
|
28.1
|
(145.8)
|
|||||
|
Other
(loss) gain, net
|
—
|
(0.9)
|
0.1
|
N/A
|
N/A
|
|||||
|
Earnings
(loss) before income taxes
|
4.7
|
(3.1)
|
8.5
|
(223.2)
|
(141.4)
|
|||||
|
Income
taxes expense
|
1.3
|
0.1
|
1.5
|
N/A
|
(94.1)
|
|||||
|
Net
earnings (loss)
|
3.4
|
(3.2)
|
7.0
|
(185.9)
|
(150.7)
|
|||||
|
Less:
(Loss) attributable to noncontrolling interests.
|
—
|
—
|
—
|
N/A
|
N/A
|
|||||
|
Net
earnings (loss) attributable to Checkpoint Systems, Inc.
|
3.4
|
%
|
(3.2)
|
%
|
7.0
|
%
|
(187.7)
|
%
|
(150.7)
|
%
|
N/A —
Comparative percentages are not meaningful.
22
Fiscal
2009 compared to Fiscal 2008
Net
Revenues
During
2009, revenues decreased by $144.4 million, or 15.7%, from
$917.1 million to $772.7 million. Foreign currency translation had a
negative impact on revenues of $28.4 million for the full year of
2009.
(dollar amounts
in millions)
|
Year
ended
|
December
27,
2009
(Fiscal
2009)
|
December
28,
2008
(Fiscal
2008)
|
Dollar
Amount
Change
Fiscal
2009
vs.
Fiscal
2008
|
Percentage
Change
Fiscal
2009
vs.
Fiscal
2008
|
|||
|
Net
Revenues:
|
|||||||
|
Shrink
Management Solutions
|
$
553.7
|
$
687.4
|
$ (133.7)
|
(19.4)
|
%
|
||
|
Apparel
Labeling Solutions
|
141.9
|
135.3
|
6.6
|
4.8
|
|||
|
Retail
Merchandising Solutions
|
77.1
|
94.4
|
(17.3)
|
(18.3)
|
|||
|
Net
Revenues
|
$
772.7
|
$
917.1
|
$ (144.4)
|
(15.7)
|
%
|
Shrink Management
Solutions
Shrink
Management Solutions revenues decreased by $133.7 million, or 19.4%, in
2009 compared to 2008. Foreign currency translation had a negative impact of
approximately $17.9 million. The remaining revenue decrease was due
primarily to declines in EAS systems, CheckView™, and Alpha business of
$89.3 million, $41.2 million, and $5.6 million, respectively. These
declines were partially offset by a $16.7 million increase in our EAS
consumables business and a $3.6 million increase in our RFID
business.
EAS
systems revenues decreased $89.3 million in 2009 as compared to 2008. The
decrease was due primarily to declines in revenues of $52.4 million in
Europe, $22.0 million in the U.S., and $12.9 million in Asia. The
decline in Europe was due primarily to 2008 large chain-wide roll-outs in Spain,
France, Italy and Belgium without comparable roll-outs in 2009 coupled with a
general overall decline in revenues due to the weak economic conditions in
Europe. The decline in Europe was partially offset by an increase in Germany due
primarily to a new large roll-out in 2009. The decline in the U.S. was due
primarily to large installations in 2008 without comparable roll-outs during
2009. The decline in Asia was due primarily to weak economic conditions in Japan
and Hong Kong coupled with large chain-wide installations in Australia and New
Zealand during 2008 without comparable roll-outs in 2009. The decrease in Asia
was partially offset by a large chain-wide roll-out in China. Our EAS systems
business is dependent upon new store openings and the liquidity and financial
condition of our customers which has been impacted by current economic trends.
Our plan is to partially mitigate this issue by selling new solutions to
existing customers and increasing our market share through innovative products
such as Evolve™.
CheckView™
revenues decreased $41.2 million in 2009 as compared to 2008. The CheckView™
business declined primarily due to decreases in the U.S. and Asia of
$35.3 million and $5.9 million, respectively. The U.S. revenues
associated with our 2008 banking acquisitions benefited by $1.0 million due
to a full year of revenues in 2009 with only a partial year in 2008. The decline
in our U.S. retail business was $28.9 million, due primarily to an overall
decline in capital expenditures as a result of the current weak economic
conditions in the U.S. Our banking business, excluding the non-comparable
acquisition, declined $7.4 million due primarily to decreased customer
spending as a result of the current economic condition in the financial services
sector. We anticipate our U.S. CheckView™ business will continue to experience
difficulties in 2010 as constraints on capital spending by our customers and the
slowing of new store openings will likely continue as a result of the current
economic conditions. The decline in Asia was due primarily to large orders in
Japan in 2008 without comparable installations in 2009.
Our Alpha
business declined by $5.6 million during 2009 as compared to 2008. The
decrease was due primarily to declines in revenues of $5.9 million in
Europe and $1.6 million in the U.S., which was partially offset by a $1.7
million increase in Asia. The decrease in Europe was primarily due to a decrease
in volumes due to the current weak economic condition in Europe. The decrease in
the U.S. was primarily due to a decrease in volumes with several large customers
due to the current weak economic conditions in the U.S. The increase in Asia was
primarily due to an increase in Australia due to sales to several new large
customers during 2009.
EAS
consumables revenues increased by $16.7 million in 2009 as compared to 2008. The
increase was due primarily to increases in revenues of $16.5 million in
Europe and $4.2 million in the U.S., which were partially offset by a $3.9
million decrease in Asia. The increases in Europe and the U.S. were due
primarily to the implementation of our new hard tag at source program. The
decline in Asia was due primarily to the anticipated loss of customers
associated with the acquisition of SIDEP/Asialco.
RFID
revenues increased by $3.6 million during 2009 as compared to 2008. The increase
was due primarily to increases in revenues of $3.1 million in Europe and
$0.6 million in the U.S. The increase in revenues in Europe was due to the sale
of detachers associated with our hard tag at source program that are RFID
enabled for future use. The increase was partially offset by decreases in
Germany and France due to large roll-outs that were completed in 2008 with no
such comparable roll-outs during 2009. The increase in the U.S. was primarily
due to $1.4 million in non-comparable OATSystems Inc. revenues during the first
half of 2009, which was partially offset by a decline in OATSystems Inc.
revenues during the second half of 2009 due to a decrease in non-recurring
licensing fees in 2009.
Apparel Labeling
Solutions
Apparel
Labeling Solutions revenues increased by $6.6 million, or 4.8%, in 2009 as
compared to 2008. Foreign currency translation had a negative impact of
approximately $5.1 million. Apparel Labeling Solutions benefited by
$12.7 million due to our newly acquired Brilliant business. The remaining
decrease of $1.0 million was due to a general overall decline resulting from
current economic conditions.
Retail Merchandising
Solutions
Retail
Merchandising Solutions revenues decreased by $17.3 million, or 18.3%, in
2009 as compared to 2008. The negative impact of foreign currency translation
was approximately $5.4 million. The remaining decrease in our RMS business
was due to a decrease in our revenues from RDS of $8.5 million and a
decrease in revenues of HLS of $3.4 million. Our RDS decline is due to a general
reduction of store remodel work in Europe due to the current economic
environment. The decrease in HLS is due to increased competition and pricing
pressures as well as a general shift in market demand away from HLS products as
retail scanning technology continues to grow worldwide. We anticipate RDS and
HLS to continue to face difficult revenue trends in 2010 due to the impact of
current economic conditions on the RDS business and continued shifts in market
demand for HLS products.
Gross
Profit
During
2009, gross profit decreased by $46.8 million, or 12.4%, from
$378.1 million to $331.3 million. The negative impact of foreign currency
translation on gross profit was approximately $10.4 million. Gross profit, as a
percentage of net revenues, increased from 41.2% to 42.9%.
Shrink Management
Solutions
Shrink
Management Solutions gross profit as a percentage of Shrink Management Solutions
revenues increased to 43.7% in 2009, from 41.4% in 2008. The increase in the
gross profit percentage of Shrink Management Solutions was due primarily to
higher margins in EAS consumables, EAS systems, and CheckView™, partially offset
by lower margins in our Alpha business. EAS consumables margins improved due
primarily to lower royalties due to the expiration of our EAS licensing
obligation in December 2008. EAS consumables also improved due to the
favorable product mix. EAS systems margins improved due to product mix resulting
from fewer chain-wide rollouts in 2009, improved manufacturing margins, and
lower royalties due to the expiration of our EAS licensing obligation in
December 2008. CheckView™ margins improved due to better project management
during 2009 and cost control. Alpha margins decreased in 2009 due to
manufacturing variances related to lower volumes in 2009.
23
Apparel Labeling
Solutions
Apparel
Labeling Solutions gross profit as a percentage of Apparel Labeling Solutions
revenues increased to 37.0% in 2009, from 34.7% in 2008. Apparel Labeling
Solutions margins increased due primarily to better utilization of low cost
manufacturing facilities, which resulted in improved product costs and
reductions in freight.
Retail Merchandising
Solutions
The
Retail Merchandising Solutions gross profit as a percentage of Retail
Merchandising Solutions revenues decreased to 47.5% in 2009 from 49.4% in 2008.
The decrease in Retail Merchandising Solutions gross profit percentage was the
result of a decline in volumes and pricing pressures in our HLS and RDS
businesses.
Selling,
General, and Administrative Expenses
Selling,
general, and administrative (SG&A) expenses decreased $34.3 million, or
11.5%, over 2008. Foreign currency translation decreased SG&A expenses by
approximately $8.4 million. The remaining decrease was due primarily to
lower bad debt expense, lower sales and marketing expense, and lower general and
administrative expenses. The decrease was also due to $1.4 million of
deferred compensation expense in 2008 without a comparable charge in 2009. The
decrease in bad debt expense was attributable to an improved focus on working
capital during 2009. The decrease in sales and marketing expense corresponds to
the decrease in revenues over the prior year, coupled with an increased effort
by management to reduce costs. The decrease in general and administrative
expense is due to efforts to reduce costs, coupled with an additional expense
that was incurred during the second quarter of 2008 due to a change in executive
management with no comparable transition costs in 2009. The cost reduction
efforts were due primarily to better control of discretionary spending and the
impact of our temporary global payroll reduction and furlough program. These
reductions were partially offset by an increase of expenses related to our
Brilliant acquisition coupled with $2.8 million of non-comparable OATSystems,
Inc. expenses during the first half of 2009.
Research
and Development Expenses
Research
and development (R&D) expenses were $20.4 million, or 2.6% of revenues,
in 2009 and $22.6 million, or 2.5% of revenues in 2008. Foreign currency
translation decreased R&D costs by approximately $0.2 million.
Non-comparable R&D expenses generated by OATSystems, Inc. operations during
the first half of 2009 were $1.0 million. The remaining decrease was due to
efforts to reduce costs. The cost reduction efforts were due primarily to the
impact of our temporary global payroll reduction and furlough
program.
Restructuring
Expenses
Restructuring
expenses were $5.4 million, or 0.7% of revenues in 2009 compared to
$6.4 million or 0.7% of revenues in 2008. The current and the prior year
expenses are detailed in the “Provision for Restructuring” section.
Goodwill
Impairment
Goodwill
Impairment expense was $59.6 million, or 6.5% of revenues in 2008, without
a comparable charge in 2009. The 2008 expense is detailed in the “Goodwill
Impairment” section following “Liquidity and Capital Resources.”
Asset
Impairment
Asset
Impairment expense was $4.5 million, or 0.5% of revenues in 2008, without a
comparable charge in 2009. The 2008 expense is detailed in the “Asset
Impairment” section following “Liquidity and Capital Resources.”
Litigation
Settlement
Litigation
Settlement expense was $1.3 million in 2009, compared to $6.2 million in
2008. Included in the 2009 litigation expense was $0.9 million of expense
related to the settlement of a dispute with a consultant and $0.4 million
related to the acquisition of a patent related to our Alpha business. We
purchased the patent for $1.7 million related to our Alpha business. A portion
of this purchase price was attributable to use prior to the date of acquisition
and as a result we recorded $0.4 million in litigation expense and $1.3 million
in intangibles.
The 2008
litigation settlement expense is primarily attributed to a $5.7 million
litigation accrual recorded during the fourth quarter of 2008 related to a
patent infringement counter suit in which we were found to be liable for the
other party’s associated legal fees. We plan to appeal the ruling but have
accrued the full amount of the judgment. The remaining $0.5 million of the
litigation expense was due to a contract settlement with a product manufacturer
in the third quarter of 2008. We do not anticipate any additional charges
related to this issue.
Other
Operating Income
Other
operating income was $1.0 million, or 0.1% of revenues in 2008, without a
comparable gain in 2009. Other operating income was recorded in 2008 due to the
sale of our Czech Republic subsidiary, which is now operating as a distributor
of our products.
Interest
Income and Interest Expense
Interest
income for 2009 decreased $0.7 million from the comparable period in 2008.
The decrease in interest income was due to lower cash balances during 2009
compared to 2008.
Interest
expense for 2009 increased $1.6 million from the comparable period in 2008.
The increase in interest expense was due to higher debt levels in 2009 compared
to 2008.
Other
Gain (Loss), net
Other
gain (loss), net was a loss of $0.2 million in 2009 compared to a net loss
of $8.9 million in 2008. The increase of $8.7 million was due primarily to
a foreign exchange loss of $0.4 million in 2009 as compared to a foreign
exchange loss of $9.2 million in 2008. During 2008, the primary drivers of
the foreign currency loss were fluctuations in the value of the U.S. Dollar to
the Euro and the Japanese Yen, as well as the Euro to the British
Pound.
Income
Taxes
The
effective rate of tax at December 27, 2009 was 28.6%. At December 28, 2008, the
effective tax rate was (2.5%). The 2009 tax rate includes a benefit of $0.1
million in tax reserves and a net increase to the valuation allowance of $7.6
million. The main components of the valuation allowance change were a charge of
$1.1 million in connection with our Italy operations and a charge of $4.6
related to operations in Japan. The valuation allowance was also impacted by a
charge of $2.0 million in connection with state net operating losses, of which
$0.3 million was related to activity in 2009. The remainder of the
valuation allowance movement relates to benefits from the current year
utilization of deferred tax assets that a valuation was recorded against in
prior periods. A benefit of $0.1 million was recorded related to tax
audits settled in the current year.
The 2008
tax rate includes a $1.2 million change in tax reserves and a net valuation
allowance benefit of $2.9 million. The main components of the valuation
allowance benefit was a release of $4.7 million relating to net operating
losses in Brazil, a charge of $1.2 million in connection to our United Kingdom
operations, and a charge of $0.8 million in connection to state net
operating losses. A charge of $0.7 million was recorded related to tax
audits settled in the current year. In addition, an income tax benefit was not
recorded in 2008 on $58.5 million of the $59.6 million impairment as
it related to non-deductible goodwill.
Net
Earnings (Loss) Attributable to Checkpoint Systems, Inc.
Net
earnings (loss) attributable to Checkpoint Systems, Inc. were $26.1 million, or
$0.66 per diluted share, for 2009 compared to ($29.8) million, or ($0.76) per
diluted share, for 2008. The weighted average number of shares used in the
diluted earnings per share computation were 39.6 million and
39.4 million for 2009 and 2008, respectively.
24
Fiscal
2008 compared to Fiscal 2007
Net
Revenues
During
2008, revenues increased by $82.9 million, or 9.9%, from
$834.2 million to $917.1 million. Foreign currency translation had a
positive impact on revenues of $33.0 million for the full year of
2008.
(amounts in
millions)
|
Thirty-nine
weeks ended
|
December
28,
2008
(Fiscal
2008)
|
December
30,
2007
(Fiscal
2007)
|
Dollar
Amount
Change
Fiscal
2008
vs.
Fiscal
2007
|
Percentage
Change
Fiscal
2008
vs.
Fiscal
2007
|
|||
|
Net
Revenues:
|
|||||||
|
Shrink
Management Solutions
|
$
687.4
|
$
611.2
|
$ 76.2
|
12.5
|
%
|
||
|
Apparel
Labeling Solutions
|
135.3
|
126.6
|
8.7
|
6.9
|
|||
|
Retail
Merchandising Solutions
|
94.4
|
96.4
|
(2.0)
|
(2.0)
|
|||
|
Net
Revenues
|
$
917.1
|
$
834.2
|
$ 82.9
|
9.9
|
%
|
Shrink Management
Solutions
Shrink
Management Solutions revenues increased by $76.2 million, or 12.5%, in 2008
compared to 2007. Foreign currency translation had a positive impact of
approximately $24.1 million. The Alpha, SIDEP and OATSystems acquisitions
increased revenues in 2008 by $82.4 million. Additionally, CheckView™
revenues increased $4.9 million in 2008 compared to 2007. These increases
were partially offset by a decrease of $14.1 million in EAS systems
revenues, $13.2 million in our EAS consumables business, and $6.3 million in our
Library business.
The
CheckView™ business improved primarily due to increases in the U.S. of
$2.6 million coupled with an increase in Asia of $1.5 million. The
U.S. CheckView™ revenue increase was due primarily to an increase of
$11.8 million in our U.S. banking business, partially offset by a decrease
of $9.2 million in our U.S. retail business. The U.S. banking business
benefited $10.7 million due to recent acquisitions, without comparable
revenues in 2007, coupled with $1.1 million of comparable business growth.
The U.S. retail business revenue decline was due to difficult comparables in
2007 due to large 2007 installations coupled with the impact of current economic
conditions on this business resulting in reductions in 2008 orders and
installations. The increase in Asia CheckView™ revenues was due primarily to
expansion of the business model within the region during fiscal 2008. The U.S.
CheckView™ business has a significant portion of its revenue growth dependent
upon new store openings which could continue to be impacted by the current
decline in U.S. economic activity.
EAS
systems revenues, excluding the benefit of foreign currency translation and
acquisitions decreased $14.1 million for 2008 compared to 2007. The
decrease was due to declines in revenues of $15.3 million in Europe and
$1.9 million in Latin America, partially offset by an increase of $3.6
million in revenues in Asia. The decline in Europe was due primarily to general
overall business declines in the UK coupled with large chain-wide installations
in various countries during 2007 without comparable activity in 2008. These
declines in Europe revenues were partially offset by an increase in Belgium due
to a large chain-wide roll-out in 2008 without comparable revenue in 2007. The
decline in Latin America was due primarily to a decline in Mexico attributable
to large chain-wide roll-outs in 2007 without comparable revenues in 2008. The
increase in Asia was due primarily to large chain-wide roll-outs in New Zealand,
Australia, and China without comparables in 2007, partially offset by a decline
in Japan revenue attributable to large chain-wide roll-outs in 2007 without
comparable revenues in 2008. Our EAS systems business is dependent upon new
store openings and the liquidity and financial condition of our customers which
could continue to be impacted by current economic trends. Our plan is to
partially mitigate this issue by selling new solutions to existing customers and
increasing our market share through innovative products such as EvolveTM.
EAS
consumables revenues, excluding the benefit of foreign currency translation
decreased $13.2 million for 2008 compared to 2007. EAS consumables revenues
were impacted by current economic conditions resulting in decreased retail
sector sales resulting in a decreased demand for labels, coupled with
competitive pressures in certain regions. We anticipate that weak economic
conditions could continue to impact our EAS consumables volumes in future
quarters.
Library
revenues, excluding the benefit of foreign currency translation decreased
$6.3 million for 2008 compared to 2007. Library revenues declined due to
the transition period for our 3M distributor agreement compared to direct sales
in the prior year. We expect the library revenues to become comparable in 2009
as the transition to selling to a distributor was initiated at the beginning of
fiscal 2008.
Apparel Labeling
Solutions
Apparel
Labeling Solutions revenues increased by $8.7 million, or 6.9% in 2008
compared to 2007. The positive impact of foreign currency translation was
approximately $3.0 million. The remaining increase of $5.7 million was due
primarily to an increase in revenues in the U.S. and Asia, partially offset by a
decline in our Europe revenues. The U.S. revenue increase was due to increased
sales volume with existing large customers and an increase in orders from new
customers. We anticipate that weak economic conditions could continue to impact
our U.S. revenues but that our growth in orders from new customers could
partially mitigate this impact. The revenue decline in Europe and growth in Asia
is due primarily to a shift in revenues to Asia for certain customers previously
serviced from Europe. Europe also experienced a decline in revenues due to the
effects of current economic conditions of apparel retailers in the
region.
Retail Merchandising
Solutions
Retail
Merchandising Solutions revenues decreased by $2.0 million or 2.0%. The
positive impact of foreign currency translation was approximately
$5.8 million. The decrease in our RMS business was due to a decrease in our
revenues from retail display systems of $5.2 million and a decrease in
revenues of HLS of $2.6 million. Our retail display systems decline is due
to large remodel work in 2007 in Europe and Asia without such comparable
revenues in 2008. The decrease in HLS is due to increased competition and
pricing pressures as well as a general shift in market demand for HLS products
as retail scanning technology continues to grow worldwide. We anticipate RMS and
HLS to continue to face difficult revenue trends in 2009 due to impacts of
current economic conditions on the RMS business and continued shifts in market
demand for HLS products.
Gross
Profit
During
2008, gross profit increased by $32.1 million, or 9.3%, from
$346.0 million to $378.1 million. The benefit of foreign currency
translation on gross profit was approximately $13.7 million. Gross profit, as a
percentage of net revenues, decreased from 41.5% to 41.2%.
Shrink Management
Solutions
Shrink
Management Solutions gross profit as a percentage of Shrink Management Solutions
revenues decreased to 41.4% in 2008, from 41.8% in 2007. The decrease in the
gross profit percentage of Shrink Management Solutions was due primarily to
decreases in EAS consumables margins and Library margins, which was offset by
increases in EAS systems margins and the inclusion of a full year of
revenues of Alpha products at higher margin levels in 2008.
The
decline in EAS consumables margins was due primarily to increased manufacturing
variances in 2008, which were primarily attributable to volume declines and
increased production issues resulting in labor inefficiencies and increased
scrap, coupled with higher energy costs. The Library margins were negatively
impacted by the 3M deal, which shifted our business model from direct sales to
distributor revenues with lower margins. The EAS hardware margin improvement was
due to improved inventory management coupled with better sourcing costs for our
antenna components.
25
Apparel Labeling
Solutions
Apparel
Labeling Solutions gross profit as a percentage of Apparel Labeling Solutions
revenues decreased to 34.7% in 2008, from 34.9% in 2007. This decrease was due
to a general overall decline resulting from current weak economic
conditions.
Retail Merchandising
Solutions
The
Retail Merchandising Solutions gross profit as a percentage of Retail
Merchandising revenues increased to 49.4% in 2008 from 47.9% in 2007. This
increase in Retail Merchandising Solutions gross profit percentage was primarily
due to improved margins in our HLS business resulting from improved
manufacturing efficiencies.
Selling,
General, and Administrative Expenses
Selling,
general, and administrative (SG&A) expenses increased $36.1 million, or
13.8%, over 2007. Foreign currency translation increased SG&A expenses by
approximately $9.5 million. SG&A expenses generated by the recently
acquired Alpha, SIDEP, and OATSystems operations coupled with our banking
acquisitions accounted for $27.8 million of the increase over the prior
year. SG&A expenses were additionally increased due to an increase in bad
debt provisions and $1.4 million of deferred compensation expense related
to prior periods. These increases were partially offset by decreases in
management expense due to internal restructuring efforts and a decrease in
compensation related to a decrease in accrued bonuses and the reversal of
stock-based compensation related to our long-term incentive plan performance
restricted stock units. In light of current economic conditions, we are more
closely monitoring the aging of individual customer receivable balances and
associated credit risk in an effort to mitigate our exposure to bad
debt.
Research
and Development Expenses
Research
and development (R&D) expenses were $22.6 million, or 2.5% of revenues,
in 2008 and $18.2 million, or 2.2% of revenues in 2007. Foreign currency
translation increased R&D costs by approximately $0.3 million. The
increase of $4.4 million is largely attributed to R&D expenses
generated by the recently acquired Alpha, SIDEP, and OATSystems operations of
$3.9 million.
Restructuring
Expenses
Restructuring
expenses were $6.4 million, or 0.7% of revenues in 2008 compared to
$2.7 million or 0.3% of revenues in 2007. The current and the prior year
expenses are detailed in the “Provision for Restructuring” section.
Goodwill
Impairment
Goodwill
Impairment expense was $59.6 million, or 6.5% of revenues in 2008, without
a comparable charge in 2007. The current year expense is detailed in the
“Goodwill Impairment” section following “Liquidity and Capital
Resources.”
Asset
Impairment
Asset
Impairment expense was $4.5 million, or 0.5% of revenues in 2008, without a
comparable charge in 2007. The current year expense is detailed in the “Asset
Impairment” section following “Liquidity and Capital Resources.”
Litigation
Settlement
Litigation
Settlement expense was $6.2 million in 2008, without a comparable charge in
2007. The litigation settlement expense is primarily attributed to a
$5.7 million litigation accrual recorded during the fourth quarter of 2008
related to a patent infringement counter suit in which the Company was found to
be liable for the other party’s associated legal fees. The Company plans to
appeal the ruling but has accrued the full amount of the judgment. The remaining
$0.5 million of the litigation expense was due to a contract settlement
with a product manufacturer in the third quarter of 2008. We do not anticipate
any additional charges related to this issue.
Other
Operating Income
In 2008,
other operating income of $1.0 million was recorded due to the sale of our
Czech Republic subsidiary, which is now operating as a distributor of our
products.
In 2007,
other operating income of $2.6 million was recorded due to the sale of our
Austrian subsidiary. This sale resulted from our plan to move this business to
an indirect sales model.
Interest
Income and Interest Expense
Interest
income for 2008 decreased $2.8 million from the comparable period in 2007.
The decrease in interest income was due to lower cash balances during 2008
compared to 2007.
Interest
expense for 2008 increased $3.4 million from the comparable period in 2007.
The increase in interest expense was due to higher debt levels in 2008 compared
to 2007. Increased borrowings in 2008 were primarily used to finance our stock
repurchase program and the OATSystems, Inc. acquisition.
Other
Gain (Loss), net
Other
gain (loss), net was a loss of $8.9 million for 2008 compared to a net gain
of $0.7 million for 2007. The increase in loss for 2008 was due primarily
to losses on foreign currency. The primary drivers of the increase in foreign
currency loss were fluctuations in the value of the U.S. Dollar to the Euro and
the Japanese Yen, as well as the Euro to the British Pound.
Income
Taxes
The
effective rate of tax at December 28, 2008 was 2.5%. At December 30,
2007, the effective tax rate was 17.2%. The 2008 tax rate includes a
$1.2 million change in tax reserves and a net valuation allowance benefit
of $2.9 million. The main components of the valuation allowance benefit was
a release of $4.7 million relating to net operating losses in Brazil, a
charge of $1.2 million in connection to our United Kingdom operations, and a
charge of $0.8 million in connection to state net operating losses. A
charge of $0.7 million was recorded related to tax audits settled in the
current year. In addition, an income tax benefit was not recorded in 2008 on
$58.5 million of the $59.6 million impairment as it related to
non-deductible goodwill. The 2007 tax rate includes a $1.9 million change
in tax reserves, a net valuation allowance benefit of $3.2 million, a
$1.0 million tax benefit relating to statutory tax rate changes, and a
$0.9 million tax benefit relating to the sale of our Austrian subsidiary.
The two main changes to the valuation allowance in 2007 were a release of
$5.4 million relating to state net operating losses and a charge of
$2.7 million in connection to our United Kingdom operations. The 2007
effective tax rate was positively impacted by a reduction of valuation
allowances and tax reserves of $2.0 million. In addition, the Company
recorded a $1.7 million reduction in foreign tax, primarily associated with
a change in tax law in Germany.
In 2007,
we recorded an adjustment of $2.1 million to reduce deferred income tax
expense, and increase earnings from continuing operations and net earnings. We
have determined that this adjustment related to errors made in prior years
associated with the impact of changes in statutory rates on deferred taxes. Had
these errors been recorded in the proper periods, earnings from continuing
operations and net earnings as reported would increase by $0.2 million in
2006 and increase by $1.9 million for years prior to 2005. We have
determined that these adjustments did not have a material effect on the 2007 and
prior years’ financial statements. Without the reduction to our income tax
provision our 2007 effective rate would have been 20.3% rather than
17.2%.
26
Earnings
from Discontinued Operations, Net of Tax
There
were no earnings from discontinued operations, net of tax, for 2008. Earnings
from discontinued operations, net of tax, were $0.4 million in 2007. The
2007 earnings were primarily due to adjustments related to the sale in 2006 of
our barcode business.
Net
Earnings (Loss) Attributable to Checkpoint Systems, Inc.
Net
earnings (loss) attributable to Checkpoint Systems, Inc. were ($29.8) million,
or ($0.76) per diluted share, for 2008 compared to $58.8 million, or $1.44 per
diluted share, for 2007. The weighted average number of shares used in the
diluted earnings per share computation were 39.4 million and
40.7 million for 2008 and 2007, respectively.
Other
Matters
Recently
Adopted Accounting Standards
In
September 2009, we adopted ASC 105-10-05, which provides for the Financial
Accounting Standards Board (FASB) Accounting Standards Codification™ (the
“Codification”) to become the single official source of authoritative,
nongovernmental GAAP to be applied by nongovernmental entities in the
preparation of financial statements in conformity with GAAP. The Codification
does not change GAAP, but combines all authoritative standards into a
comprehensive, topically organized online database. ASC 105-10-05 explicitly
recognizes rules and interpretative releases of the Securities and Exchange
Commission (SEC) under federal securities laws as authoritative GAAP for SEC
registrants. Subsequent revisions to GAAP will be incorporated into the ASC
through Accounting Standards Updates (ASU). ASC 105-10-05 is
effective for interim and annual periods ending after September 15, 2009, and
was effective for us in the third quarter of 2009. The adoption of ASC 105-10-05
impacted the Company’s financial statement disclosures, as all references to
authoritative accounting literature were updated to and in accordance with the
Codification. Our adoption of ASC 105-10-05 did not have a material impact on
our consolidated results of operations and financial condition.
In
December 2007, the FASB issued an accounting standard codified within ASC
805, “Business Combinations” which changed the accounting for business
acquisitions. Under this standard, business combinations continue to
be required to be accounted for at fair value under the acquisition method of
accounting, but the standard changed the method of applying the acquisition
method in a number of significant aspects. Acquisition costs will generally be
expensed as incurred; noncontrolling interests will be valued at fair value at
the acquisition date; in-process research and development will be recorded at
fair value as an indefinite-lived intangible asset at the acquisition date,
until either abandoned or completed, at which point the useful lives will be
determined; restructuring costs associated with a business combination will
generally be expensed subsequent to the acquisition date; and changes in
deferred tax asset valuation allowances and income tax uncertainties after the
acquisition date generally will affect income tax expense. The standard is
effective on a prospective basis for all business combinations for which the
acquisition date is on or after the beginning of the first annual period
subsequent to December 15, 2008, with the exception of the accounting for
valuation allowances on deferred taxes and acquired tax contingencies. The
standard amends the accounting for income taxes such that adjustments made to
valuation allowances on deferred taxes and acquired tax contingencies associated
with acquisitions that closed prior to the effective date of the standard would
also apply the provisions of the new standard. Disclosure requirements were also
expanded to enable the evaluation of the nature and financial effects of the
business combination. For the Company, the standard is effective for business
combinations occurring after December 28, 2008. Adoption of the standard
did not have a significant impact on our financial position and results of
operations; however, any business combination entered into after the adoption
may significantly impact our financial position and results of operations when
compared to acquisitions accounted for under prior GAAP and result in more
earnings volatility and generally lower earnings due to the expensing of deal
costs and restructuring costs of acquired companies. This standard was applied
to business combinations disclosed in Note 2 that were completed after
2008. Also, since we have significant acquired deferred tax assets
for which full valuation allowances were recorded at the acquisition date, the
standard could significantly affect the results of operations if changes in the
valuation allowances occur subsequent to adoption. As of December 27, 2009,
such deferred tax valuation allowances amounted to
$4.6 million.
In
February 2009, the FASB issued an accounting standard codified within ASC
805, “Business Combinations” which amends the provisions related to the initial
recognition and measurement, subsequent measurement, and disclosure of assets
and liabilities arising from contingencies in a business combination. The
standard applies to all assets acquired and liabilities assumed in a business
combination that arise from contingencies that would be within the scope of ASC
450, “Contingencies”, if not acquired or assumed in a business combination,
except for assets or liabilities arising from contingencies that are subject to
specific guidance in ASC 805. The standard applies prospectively to business
combinations for which the acquisition date is on or after the beginning of the
first annual reporting period beginning on or after December 15, 2008. The
adoption of the standard effective December 29, 2008 did not have an impact
on our financial position and results of operations.
In
December 2007, the FASB issued an accounting standard codified within ASC
810, “Consolidation”. The standard establishes accounting and
reporting standards for ownership interests in subsidiaries held by parties
other than the parent, the amount of consolidated net income attributable to the
parent and to the noncontrolling interest, changes in a parent’s ownership
interest, and the valuation of retained noncontrolling equity investments when a
subsidiary is deconsolidated. Noncontrolling interest (minority
interest) is required to be recognized as equity in the consolidated financial
statements and separate from the parent’s equity. The standard also establishes
disclosure requirements that clearly identify and distinguish between the
interests of the parent and the interests of the noncontrolling owners. The
effective date of the standard is for fiscal years beginning after
December 15, 2008. We adopted the standard on December 29, 2008. As of
December 27, 2009, our noncontrolling interest totaled $0.8 million,
which is included in the stockholders’ equity section of our Consolidated
Balance Sheets. The Company has incorporated the required presentation and
disclosure requirements in our consolidated financial statements.
In March
2008, the FASB issued an accounting standard related to disclosures about
derivative instruments and hedging activities, codified within ASC 815,
“Derivatives and Hedging”. Provisions of this standard change the
disclosure requirements for derivative instruments and hedging activities
including enhanced disclosures about (a) how and why derivative instruments
are used, (b) how derivative instruments and related hedged items are
accounted for under ASC 815 and its related interpretations, and (c) how
derivative instruments and related hedged items affect our financial position,
financial performance, and cash flows. This statement was effective for
financial statements issued for fiscal years and interim periods beginning after
November 15, 2008. We adopted the standard on December 29, 2008. See
Note 15 for our enhanced disclosures required under this standard.
In
April 2008, the FASB issued an accounting standard codified within ASC 350,
“Intangibles - Goodwill and Other” which amends the factors that should be
considered in developing renewal or extension assumptions used to determine the
useful life of a recognized intangible asset Under this standard,
entities estimating the useful life of a recognized intangible asset must
consider their historical experience in renewing or extending similar
arrangements or, in the absence of historical experience, must consider
assumptions that market participants would use about renewal or
extension. The intent of the standard is to improve the consistency
between the useful life of a recognized intangible asset and the period of
expected cash flows used to measure the fair value of the asset. Adoption of the
standard was effective for financial statements issued for fiscal years
beginning after December 15, 2008, and interim periods within those fiscal
years. We adopted the standard on December 29, 2008. We do not expect the
standard to have a material impact on our accounting for future acquisitions of
intangible assets.
In
June 2008, the FASB issued an accounting standard codified within ASC 260,
“Earnings Per Share” which provides that unvested share-based payment awards
that contain nonforfeitable rights to dividends or dividend equivalents (whether
paid or unpaid) are participating securities and shall be included in the
computation of earnings per share pursuant to the two-class method. The standard
is effective for financial statements issued for fiscal years beginning after
December 15, 2008, and interim periods within those fiscal years. Upon
adoption, an entity is required to retrospectively adjust its earnings per share
data (including any amounts related to interim periods, summaries of earnings
and selected financial data) to conform to the standard’s provisions. We adopted
this pronouncement effective December 29, 2008 and the adoption did not
have an impact on our calculation of earnings per share.
27
In
November 2008, the FASB issued an accounting standard codified within ASC
350, “Intangibles - Goodwill and Other” that applies to defensive assets which
are acquired intangible assets which the acquirer does not intend to actively
use, but intends to hold to prevent its competitors from obtaining access to the
asset. The standard clarifies that defensive intangible assets are separately
identifiable and should be accounted for as a separate unit of accounting in
accordance with guidance provided within ASC 805, “Business Combinations” and
ASC 820, “Fair Value Measurements and Disclosures”. The standard is
effective for intangible assets acquired in fiscal years beginning on or after
December 15, 2008 and will be applied by us to intangible assets acquired
on or after December 29, 2008.
In
December 2008, the FASB issued an accounting standard codified within ASC
810, “Consolidation” and ASC 860, “Transfers and Servicing”. The standard was
effective for the first reporting period ending after December 15, 2008 and
requires additional disclosures concerning transfers of financial assets and an
enterprise’s involvement with variable interest entities (VIE) and qualifying
special purpose entities under certain conditions. Upon adoption in our interim
consolidated financial statements for the quarter ending March 29, 2009,
there were no additional required disclosures.
In
April 2009, the FASB issued an accounting standard codified within ASC 825,
“Financial Instruments” that requires disclosures about the fair value of
financial instruments that are not reflected in the consolidated balance sheets
at fair value whenever summarized financial information for interim reporting
periods is presented. Entities are required to disclose the methods and
significant assumptions used to estimate the fair value of financial instruments
and describe changes in methods and significant assumptions, if any, during the
period. The standard was effective for interim reporting periods ending after
June 15, 2009 and was adopted by the Company in the second quarter of
2009. See Note 15 for our disclosures required under the
standard.
In
April 2009, the FASB issued an accounting standard codified within ASC 820,
“Fair Value Measurements and Disclosures,” which provides guidance on
determining fair value when there is no active market or where the price inputs
being used represent distressed sales. The standard reaffirms the
objective of fair value measurement, which is to reflect how much an asset would
be sold for in an orderly transaction. It also reaffirms the need to use
judgment to determine if a formerly active market has become inactive, as well
as to determine fair values when markets have become inactive. The standard is
effective for interim and annual periods ending after June 15, 2009 and was
adopted by the Company in the second quarter of 2009. The adoption of this
accounting pronouncement did not have a material impact on our consolidated
results of operations and financial condition.
In
May 2009, the FASB issued an accounting standard codified within ASC 855
“Subsequent Events,” which sets forth general standards of accounting for and
disclosure of events that occur after the balance sheet date but before
financial statements are issued or are available to be issued. It
requires the disclosure of the date through which an entity has evaluated
subsequent events and the basis for that date, that is, whether that date
represents the date the financial statements were issued or were available to be
issued. The standard is effective for interim or annual periods
ending after June 15, 2009 and was adopted by the Company in the second quarter
of 2009. The adoption of this standard did not have a material impact
on our consolidated results of operations and financial
condition. See Note 1 for the required disclosures.
In August
2009, the FASB issued ASU No. 2009-04, “Accounting for Redeemable Equity
Instruments.” The ASU represents an update to ASC 480-10-S99
“Distinguishing Liabilities from Equity.” This update provides
guidance on what type of instruments should be classified as temporary versus
permanent equity, as well as guidance with respect to
measurement. The adoption of the ASU did not have a material impact
on our consolidated results of operations and financial condition.
In
December 2008, the FASB issued an accounting standard codified within ASC
715, “Compensation – Retirement Benefits” that requires enhanced disclosures
about the plan assets of a Company’s defined benefit pension and other
postretirement plans. The enhanced disclosures are intended to provide users of
financial statements with a greater understanding of: (1) how investment
allocation decisions are made, including the factors that are pertinent to an
understanding of investment policies and strategies; (2) the major
categories of plan assets; (3) the inputs and valuation techniques used to
measure the fair value of plan assets; (4) the effect of fair value
measurements using significant unobservable inputs (Level 3) on changes in plan
assets for the period; and (5) significant concentrations of risk within
plan assets. The disclosures under this standard were effective for us for the
fiscal year ending December 27, 2009. See Note 14 for the
additional disclosures required upon adoption of this standard.
In August
2009, the FASB issued ASU No. 2009-05, “Fair Value Measurements and
Disclosures – Measuring Liabilities at Fair Value.”. The ASU provides additional
guidance for the fair value measurement of liabilities under ASC 820 “Fair Value
Measurements and Disclosures”. The ASU provides clarification that in
circumstances in which a quoted price in an active market for the identical
liability is not available, a reporting entity is required to measure fair value
using certain techniques. The ASU also clarifies that when estimating the fair
value of a liability, a reporting entity is not required to include a separate
input or adjustment to other inputs relating to the existence of a restriction
that prevents the transfer of a liability. It also clarifies that both a quoted
price in an active market for the identical liability at the measurement date
and the quoted price for the identical liability when traded as an asset in an
active market when no adjustments to the quoted price of the asset are required
are Level 1 fair value measurements. We adopted the ASU in the fourth
fiscal quarter of 2009. The adoption of the ASU did not have a
material impact on our consolidated results of operations and financial
condition.
New Accounting Pronouncements and Other
Standards
In
October 2009, the FASB issued ASU 2009-13, “Multiple-Deliverable Revenue
Arrangements, (amendments to ASC Topic 605, Revenue Recognition)” (ASU 2009-13)
and ASU 2009-14, “Certain Arrangements That Include Software Elements,
(amendments to ASC Topic 985, Software)” (ASU 2009-14). ASU 2009-13
requires entities to allocate revenue in an arrangement using estimated selling
prices of the delivered goods and services based on a selling price hierarchy.
The amendments eliminate the residual method of revenue allocation and require
revenue to be allocated using the relative selling price method. ASU
2009-14 removes tangible products from the scope of software revenue guidance
and provides guidance on determining whether software deliverables in an
arrangement that includes a tangible product are covered by the scope of the
software revenue guidance. ASU 2009-13 and ASU 2009-14 should be applied on
a prospective basis for revenue arrangements entered into or materially modified
in fiscal years beginning on or after June 15, 2010, with early adoption
permitted. We are currently evaluating the impact of the adoption of these ASUs
on the Company’s consolidated results of operations or financial
condition.
In
December 2009, the FASB issued ASU No. 2009-16, “Accounting for Transfers of
Financial Assets” which amends ASC 860 “Transfers and Servicing” by: eliminating
the concept of a qualifying special-purpose entity (QSPE); clarifying and
amending the derecognition criteria for a transfer to be accounted for as a
sale; amending and clarifying the unit of account eligible for sale accounting;
and requiring that a transferor initially measure at fair value and recognize
all assets obtained (for example beneficial interests) and liabilities incurred
as a result of a transfer of an entire financial asset or group of financial
assets accounted for as a sale. Additionally, on and after the effective date,
existing QSPEs (as defined under previous accounting standards) must be
evaluated for consolidation by reporting entities in accordance with the
applicable consolidation guidance. The standard requires enhanced disclosures
about, among other things, a transferor’s continuing involvement with transfers
of financial assets accounted for as sales, the risks inherent in the
transferred financial assets that have been retained, and the nature and
financial effect of restrictions on the transferor’s assets that continue to be
reported in the statement of financial position. The standard will be
effective as of the beginning of interim and annual reporting periods that begin
after November 15, 2009, which for us would be December 28, 2009, the
first day of our 2010 fiscal year. We do not expect the adoption of
this standard to have a material effect on our consolidated results of
operations and financial condition. Any required enhancements to
disclosures will be included in our financial statements for the first quarter
ended March 29, 2010.
In
December 2009, the FASB issued ASU No. 2009-17, “Improvements to Financial
Reporting by Enterprises Involved with Variable Interest Entities” which amends
ASC 810, “Consolidation” to address the elimination of the concept of a
qualifying special purpose entity. The standard also replaces the
quantitative-based risks and rewards calculation for determining which
enterprise has a controlling financial interest in a variable interest entity
with an approach focused on identifying which enterprise has the power to direct
the activities of a variable interest entity and the obligation to absorb losses
of the entity or the right to receive benefits from the entity. This standard
also requires continuous reassessments of whether an enterprise is the primary
beneficiary of a VIE whereas previous accounting guidance required
reconsideration of whether an enterprise was the primary beneficiary of a VIE
only when specific events had occurred. The standard provides more
timely and useful information about an enterprise’s involvement with a variable
interest entity and will be effective as of the beginning of interim and annual
reporting periods that begin after November 15, 2009, which for us would be
December 28, 2009, the first day of our 2010 fiscal year. We do
not expect the adoption of this standard to have a material effect on our
consolidated results of operations and financial condition.
28
In
January 2010, the FASB issued ASU No. 2010-6, “Improving Disclosures About Fair
Value Measurements,” which provides amendments to ASC 820 “Fair Value
Measurements and Disclosures,” including requiring reporting entities to make
more robust disclosures about (1) the different classes of assets and
liabilities measured at fair value, (2) the valuation techniques and inputs
used, (3) the activity in Level 3 fair value measurements including information
on purchases, sales, issuances, and settlements on a gross basis and (4) the
transfers between Levels 1, 2, and 3. The standard is effective for
annual reporting periods beginning after December 15, 2009, except for Level 3
reconciliation disclosures which are effective for annual periods beginning
after December 15, 2010. We do not expect the adoption of this standard to have
a material impact on our consolidated financial statements.
Market
Risk Factors
Fluctuations
in interest and foreign currency exchange rates affect our financial position
and results of operations. We enter into forward exchange contracts denominated
in foreign currency to reduce the risks of currency fluctuations on short-term
inter-company receivables and payables. We also enter into various foreign
currency contracts to reduce our exposure to forecasted Euro-denominated
inter-company revenues. We have historically not used financial instruments to
minimize our exposure to currency fluctuations on our net investments in and
cash flows derived from our foreign subsidiaries. We have used third party
borrowings in foreign currencies to hedge a portion of our net investments in
and cash flows derived from our foreign subsidiaries. As of December 27,
2009, all third party borrowings were in the functional currency of the
subsidiary borrower. Additionally, we enter, on occasion, into interest rate
swaps to reduce the risk of significant interest rate increases in connection
with our floating rate debt.
We are
subject to foreign currency exchange risk on our foreign currency forward
exchange contracts which represent a $0.1 million asset position and $0.2
million liability position as of December 27, 2009, and a $0.9 liability
position as of December 28, 2008. The sensitivity analysis assumes an
instantaneous 10% change in foreign currency exchange rates from year-end
levels, with all other variables held constant. At December 27, 2009, a 10%
strengthening of the U.S. dollar versus other currencies would result in an
increase of $0.3 million in the net asset position, while a 10% weakening
of the dollar versus all other currencies would result in a decrease of
$0.3 million.
Foreign
exchange forward contracts are used to hedge certain of our firm foreign
currency cash flows. Thus, there is either an asset or cash flow exposure
related to all the financial instruments in the above sensitivity analysis for
which the impact of a movement in exchange rates would be in the opposite
direction and substantially equal to the impact on the instruments in the
analysis. There are presently no significant restrictions on the remittance of
funds generated by our operations outside the U.S. At December 27, 2009,
unremitted earnings of subsidiaries outside the United States were deemed to be
permanently reinvested.
29
Index
to Consolidated Financial Statements
|
Report
of Independent Registered Public Accounting Firm
|
31
|
|
Consolidated
Balance Sheets as of December 27, 2009 and December 28,
2008
|
32
|
|
Consolidated
Statements of Operations for each of the years in the three-year period
ended December 27, 2009
|
33
|
|
Consolidated
Statements of Stockholders’ Equity for each of the years in the three-year
period ended December 27, 2009
|
34
|
|
Consolidated
Statements of Comprehensive Income (Loss) for each of the years in the
three-year period ended December 27,
2009
|
35
|
|
Consolidated
Statements of Cash Flows for each of the years in the three-year period
ended December 27, 2009
|
36
|
|
Notes
to Consolidated Financial Statements
|
37-59
|
|
Financial
Statement Schedules, Schedule II – Valuation and Qualifying
Accounts
|
64
|
30
Report
of Independent Registered Public Accounting Firm
To The
Board of Directors and Stockholders of
Checkpoint
Systems, Inc.
In our
opinion, the accompanying consolidated balance sheets and the related
consolidated statements of operations, comprehensive income (loss), equity and
cash flows present fairly, in all material respects, the financial position of
Checkpoint Systems, Inc. and its subsidiaries at December 27, 2009 and December
28, 2008, and the results of their operations and their cash flows for each of
the three years in the period ended December 27, 2009, in conformity with
accounting principles generally accepted in the United States of
America. In addition, in our opinion, the financial statement
schedule listed in the accompanying index presents fairly, in all material
respects, the information set forth therein when read in conjunction with the
related consolidated financial statements. Also in our opinion, the
Company maintained, in all material respects, effective internal control over
financial reporting as of December 27, 2009, based on criteria established in
Internal Control - Integrated Framework issued by the Committee of Sponsoring
Organizations of the Treadway Commission (COSO). The Company's
management is responsible for these financial statements and financial statement
schedule, for maintaining effective internal control over financial reporting
and for its assessment of the effectiveness of internal control over financial
reporting, included in Management's Annual Report on Internal Control over
Financial Reporting appearing under Item 9A. Our responsibility is to
express opinions on these financial statements, on the financial statement
schedule, and on the Company's internal control over financial reporting based
on our integrated audits. We conducted our audits in accordance with
the standards of the Public Company Accounting Oversight Board (United
States). Those standards require that we plan and perform the audits
to obtain reasonable assurance about whether the financial statements are free
of material misstatement and whether effective internal control over financial
reporting was maintained in all material respects. Our audits of the
financial statements included examining, on a test basis, evidence supporting
the amounts and disclosures in the financial statements, assessing the
accounting principles used and significant estimates made by management, and
evaluating the overall financial statement presentation. Our audit of
internal control over financial reporting included obtaining an understanding of
internal control over financial reporting, assessing the risk that a material
weakness exists, and testing and evaluating the design and operating
effectiveness of internal control based on the assessed risk. Our
audits also included performing such other procedures as we considered necessary
in the circumstances. We believe that our audits provide a reasonable basis for
our opinions.
As
discussed in Note 1 to the consolidated financial statements, the Company
changed the manner in which it accounts for noncontrolling interests in
2009.
A
company’s internal control over financial reporting is a process designed to
provide reasonable assurance regarding the reliability of financial reporting
and the preparation of financial statements for external purposes in accordance
with generally accepted accounting principles. A company’s internal
control over financial reporting includes those policies and procedures that
(i) pertain to the maintenance of records that, in reasonable detail,
accurately and fairly reflect the transactions and dispositions of the assets of
the company; (ii) provide reasonable assurance that transactions are
recorded as necessary to permit preparation of financial statements in
accordance with generally accepted accounting principles, and that receipts and
expenditures of the company are being made only in accordance with
authorizations of management and directors of the company; and
(iii) provide reasonable assurance regarding prevention or timely detection
of unauthorized acquisition, use, or disposition of the company’s assets that
could have a material effect on the financial statements.
Because
of its inherent limitations, internal control over financial reporting may not
prevent or detect misstatements. Also, projections of any evaluation
of effectiveness to future periods are subject to the risk that controls may
become inadequate because of changes in conditions, or that the degree of
compliance with the policies or procedures may deteriorate.
As
described in Management's Annual Report on Internal Control over Financial
Reporting, management has excluded Brilliant Label Manufacturing Ltd from its
assessment of internal control over financial reporting as of December 27, 2009
because it was acquired by the Company in a purchase business combination during
2009. We have also excluded Brilliant Label Manufacturing Ltd from
our audit of internal control over financial reporting. Brilliant
Label Manufacturing Ltd is a wholly-owned subsidiary whose total assets and
total revenues represent 6.6% and 1.7%, respectively, of the related
consolidated financial statement amounts as of and for the year ended December
27, 2009.

PricewaterhouseCoopers
LLP
Philadelphia,
Pennsylvania
February
23, 2010
31
CHECKPOINT
SYSTEMS, INC.
CONSOLIDATED
BALANCE SHEETS
(amounts
in thousands)
|
December
27,
2009
|
December
28,
2008
|
|
|
ASSETS
|
||
|
CURRENT
ASSETS:
|
||
|
Cash
and cash equivalents
|
$ 162,097
|
$
132,222
|
|
Restricted
cash
|
645
|
—
|
|
Accounts
receivable, net of allowance of $14,524 and $18,414
|
173,057
|
196,664
|
|
Inventories
|
89,247
|
102,122
|
|
Other
current assets
|
33,068
|
41,224
|
|
Deferred
income taxes
|
24,576
|
22,078
|
|
Total
Current Assets
|
482,690
|
494,310
|
|
REVENUE
EQUIPMENT ON OPERATING LEASE, net
|
2,016
|
2,040
|
|
PROPERTY,
PLANT, AND EQUIPMENT, net
|
117,598
|
86,735
|
|
GOODWILL
|
244,062
|
235,532
|
|
OTHER
INTANGIBLES, net
|
104,733
|
113,755
|
|
DEFERRED
INCOME TAXES
|
40,492
|
36,182
|
|
OTHER
ASSETS
|
26,745
|
17,162
|
|
TOTAL
ASSETS
|
$
1,018,336
|
$
985,716
|
|
LIABILITIES
AND EQUITY
|
||
|
CURRENT
LIABILITIES:
|
||
|
Short-term
borrowings and current portion of long-term debt
|
$ 25,772
|
$ 11,582
|
|
Accounts
payable
|
61,700
|
63,872
|
|
Accrued
compensation and related taxes
|
36,050
|
32,056
|
|
Other
accrued expenses
|
45,791
|
54,123
|
|
Income
taxes
|
11,427
|
8,066
|
|
Unearned
revenues
|
23,458
|
11,005
|
|
Restructuring
reserve
|
4,697
|
4,522
|
|
Accrued
pensions — current
|
4,613
|
4,305
|
|
Other
current liabilities
|
27,373
|
22,027
|
|
Total
Current Liabilities
|
240,881
|
211,558
|
|
LONG-TERM
DEBT, LESS CURRENT MATURITIES
|
91,100
|
133,704
|
|
ACCRUED
PENSIONS
|
77,621
|
77,623
|
|
OTHER
LONG-TERM LIABILITIES
|
43,772
|
47,928
|
|
DEFERRED
INCOME TAXES
|
12,305
|
9,665
|
|
COMMITMENTS
AND CONTINGENCIES
|
||
|
CHECKPOINT
SYSTEMS, INC. STOCKHOLDERS’ EQUITY:
|
||
|
Preferred
stock, no par value, 500,000 shares authorized, none
issued
|
—
|
—
|
|
Common
stock, par value $.10 per share, 100,000,000 shares authorized,
issued
43,078,498
and 42,747,808
|
4,307
|
4,274
|
|
Additional
capital
|
390,379
|
381,498
|
|
Retained
earnings
|
200,054
|
173,912
|
|
Common
stock in treasury, at cost, 4,035,912 and 4,035,912 shares
|
(71,520)
|
(71,520)
|
|
Accumulated
other comprehensive income, net of tax
|
28,603
|
16,150
|
|
Total
Checkpoint Systems, Inc. Stockholders’ Equity
|
551,823
|
504,314
|
|
NONCONTROLLING
INTERESTS
|
834
|
924
|
|
TOTAL
EQUITY
|
552,657
|
505,238
|
|
TOTAL
LIABILITIES AND EQUITY
|
$
1,018,336
|
$
985,716
|
See notes
to consolidated financial statements.
32
CHECKPOINT
SYSTEMS, INC.
CONSOLIDATED
STATEMENTS OF OPERATIONS
|
(amounts
in thousands, except per share
data)
|
|
Year
ended
|
December
27,
2009
|
December
28,
2008
|
December
30,
2007
|
|
Net
revenues
|
$
772,718
|
$
917,082
|
$
834,156
|
|
Cost
of revenues
|
441,434
|
538,983
|
488,184
|
|
Gross
profit
|
331,284
|
378,099
|
345,972
|
|
Selling,
general, and administrative expenses
|
262,649
|
296,935
|
260,854
|
|
Research
and development
|
20,354
|
22,607
|
18,170
|
|
Restructuring
expenses
|
5,401
|
6,442
|
2,701
|
|
Litigation
settlement
|
1,300
|
6,167
|
—
|
|
Asset
impairment
|
—
|
4,510
|
—
|
|
Goodwill
impairment
|
—
|
59,583
|
—
|
|
Other
operating income
|
—
|
968
|
2,571
|
|
Operating
income (loss)
|
41,580
|
(17,177)
|
66,818
|
|
Interest
income
|
1,971
|
2,660
|
5,443
|
|
Interest
expense
|
7,386
|
5,768
|
2,347
|
|
Other
(loss) gain, net
|
(180)
|
(8,924)
|
662
|
|
Earnings
(loss) from continuing operations before income taxes
|
35,985
|
(29,209)
|
70,576
|
|
Income
taxes expense
|
10,290
|
719
|
12,174
|
|
Earnings
(loss) from continuing operations
|
25,695
|
(29,928)
|
58,402
|
|
Earnings
from discontinued operations, net of tax of $0, $0, and
$351
|
—
|
—
|
359
|
|
Net
earnings (loss)
|
25,695
|
(29,928)
|
58,761
|
|
Less:
(loss) attributable to noncontrolling interests
|
(447)
|
(123)
|
(7)
|
|
Net
earnings (loss) attributable to Checkpoint Systems, Inc.
|
$
26,142
|
$
(29,805)
|
$ 58,768
|
|
Net
earnings (loss) attributable to Checkpoint Systems, Inc. per Common
shares:
|
|||
|
Basic
Earnings (Loss) Per Share:
|
|||
|
Earnings
(loss) from continuing operations
|
$
.67
|
$ (.76)
|
$ 1.46
|
|
Earnings
from discontinued operations, net of tax
|
—
|
—
|
.01
|
|
Basic
Earnings (Loss) Per Share
|
$
.67
|
$ (.76)
|
$ 1.47
|
|
Diluted
Earnings (Loss) Per Share:
|
|||
|
Earnings
(loss) from continuing operations
|
$
.66
|
$ (.76)
|
$ 1.43
|
|
Earnings
from discontinued operations, net of tax
|
—
|
—
|
.01
|
|
Diluted
Earnings (Loss) Per Share
|
$
.66
|
$ (.76)
|
$ 1.44
|
See notes
to consolidated financial statements.
33
CHECKPOINT
SYSTEMS, INC.
CONSOLIDATED
STATEMENTS OF EQUITY
(amounts
in thousands)
|
Checkpoint
Systems, Inc. Stockholders
|
|||||||||
|
Common
Stock
|
Additional
|
Retained
|
Treasury
Stock
|
Accumulated
Other Comprehensive
|
Noncontrolling
|
Total
|
|||
|
|
Shares
|
Amount
|
Capital
|
Earnings
|
Shares
|
Amount
|
Income
|
Interests
|
Equity
|
|
Balance,
December 31, 2006
|
41,315
|
$
4,131
|
$
345,206
|
$
146,658
|
2,036
|
$
(20,621)
|
$ (1,793)
|
$
956
|
$
474,537
|
|
Net
earnings
|
58,768
|
(7)
|
58,761
|
||||||
|
Exercise
of stock-based compensation
|
522
|
52
|
6,670
|
6,722
|
|||||
|
Tax
benefit on stock-based compensation
|
881
|
881
|
|||||||
|
Stock-based
compensation expense
|
6,518
|
6,518
|
|||||||
|
Deferred
compensation plan
|
1,409
|
1,409
|
|||||||
|
Cumulative
effect of adopting a change in accounting for uncertainties in income
taxes (FIN 48)
|
(1,709)
|
(1,709)
|
|||||||
|
Amortization
of pension plan actuarial losses, net of tax
|
130
|
130
|
|||||||
|
Unrealized
gain adjustment on marketable securities, net of tax
|
16
|
16
|
|||||||
|
Recognized
gain on pension, net of tax
|
6,755
|
6,755
|
|||||||
|
Foreign
currency translation adjustment
|
35,257
|
28
|
35,285
|
||||||
|
Balance,
December 30, 2007
|
41,837
|
$
4,183
|
$
360,684
|
$
203,717
|
2,036
|
$
(20,621)
|
$ 40,365
|
$ 977
|
$
589,305
|
|
Net
(loss)
|
(29,805)
|
(123)
|
(29,928)
|
||||||
|
Exercise
of stock-based compensation and awards released
|
911
|
91
|
8,914
|
9,005
|
|||||
|
Tax
benefit on stock-based compensation
|
2,121
|
2,121
|
|||||||
|
Stock-based
compensation expense
|
7,096
|
7,096
|
|||||||
|
Deferred
compensation plan
|
2,683
|
2,683
|
|||||||
|
Repurchase
of common stock
|
2,000
|
(50,899)
|
(50,899)
|
||||||
|
Amortization
of pension plan actuarial losses, net of tax
|
72
|
72
|
|||||||
|
Change
in realized and unrealized gains on derivative hedges, net of
tax
|
880
|
880
|
|||||||
|
Unrealized
gain adjustment on marketable securities, net of tax
|
(16)
|
(16)
|
|||||||
|
Recognized
loss on pension, net of tax
|
(169)
|
(169)
|
|||||||
|
Foreign
currency translation adjustment
|
(24,982)
|
70
|
(24,912)
|
||||||
|
Balance,
December 28, 2008
|
42,748
|
$
4,274
|
$
381,498
|
$
173,912
|
4,036
|
$
(71,520)
|
$ 16,150
|
$ 924
|
$
505,238
|
|
Net
earnings
|
26,142
|
(447)
|
25,695
|
||||||
|
Exercise
of stock-based compensation and awards released
|
330
|
33
|
812
|
845
|
|||||
|
Tax
shortfall on stock-based compensation
|
(481)
|
(481)
|
|||||||
|
Stock-based
compensation expense
|
7,135
|
7,135
|
|||||||
|
Deferred
compensation plan
|
1,415
|
1,415
|
|||||||
|
Amortization
of pension plan actuarial losses, net of tax
|
84
|
84
|
|||||||
|
Change
in realized and unrealized gains on derivative hedges, net of
tax
|
(1,182)
|
(1,182)
|
|||||||
|
Recognized
gain on pension, net of tax
|
1,934
|
1,934
|
|||||||
|
Foreign
currency translation adjustment
|
11,617
|
357
|
11,974
|
||||||
|
Balance,
December 27, 2009
|
43,078
|
$
4,307
|
$
390,379
|
$
200,054
|
4,036
|
$
(71,520)
|
$ 28,603
|
$ 834
|
$
552,657
|
See
accompanying notes to the consolidated financial statements.
34
CHECKPOINT
SYSTEMS, INC.
CONSOLIDATED
STATEMENTS OF COMPREHENSIVE INCOME (LOSS)
(amounts
in thousands)
|
Year
ended
|
December
27,
2009
|
December
28,
2008
|
December
30,
2007
|
|
Net
earnings (loss)
|
$
25,695
|
$
(29,928)
|
$ 58,761
|
|
Amortization
of pension plan actuarial losses, net of tax
|
84
|
72
|
130
|
|
Change
in realized and unrealized (losses) gains on derivative hedges, net of
tax
|
(1,182)
|
880
|
—
|
|
Unrealized
gain adjustment on marketable securities, net of tax
|
—
|
(16)
|
16
|
|
Recognized
gain (loss) on pension, net of tax
|
1,934
|
(169)
|
6,755
|
|
Foreign
currency translation adjustment
|
11,974
|
(24,912)
|
35,285
|
|
Comprehensive
income (loss)
|
$
38,505
|
$
(54,073)
|
$
100,947
|
|
Less:
comprehensive (loss) earnings attributable to noncontrolling
interests
|
(90)
|
(53)
|
21
|
|
Comprehensive
income (loss) attributable to Checkpoint Systems,
Inc.
|
$
38,595
|
$
(54,020)
|
$
100,926
|
See notes
to consolidated financial statements.
35
CHECKPOINT
SYSTEMS, INC.
CONSOLIDATED
STATEMENTS OF CASH FLOWS
(amounts
in thousands)
|
Year
ended
|
December
27,
2009
|
December
28,
2008
|
December
30,
2007
|
|
Cash
flows from operating activities:
|
|||
|
Net
earnings (loss)
|
$ 25,695
|
$ (29,928)
|
$ 58,761
|
|
Adjustments
to reconcile net earnings to net cash provided by operating
activities:
|
|||
|
Depreciation
and amortization
|
32,325
|
30,788
|
21,059
|
|
Deferred
taxes
|
(7,109)
|
(13,716)
|
(7,486)
|
|
Stock-based
compensation
|
7,135
|
7,096
|
6,518
|
|
Excess
tax benefit on stock compensation
|
(12)
|
(2,229)
|
(755)
|
|
Provision
for losses on accounts receivable
|
(117)
|
5,810
|
1,846
|
|
Gain
on sale of discontinued operations
|
—
|
—
|
(359)
|
|
Gain
on sale of subsidiaries
|
—
|
(968)
|
(2,523)
|
|
Loss
(gain) on disposal of fixed assets
|
314
|
276
|
(193)
|
|
Goodwill
impairment
|
—
|
59,583
|
—
|
|
Asset
impairment
|
—
|
4,510
|
—
|
|
(Increase)
decrease in current assets, net of the effects of acquired
companies:
|
|||
|
Accounts
receivable
|
27,308
|
(215)
|
(34,186)
|
|
Inventories
|
17,078
|
5,469
|
2,186
|
|
Other
current assets
|
8,993
|
3,920
|
(2,496)
|
|
Increase
(decrease) in current liabilities, net of the effects of acquired
companies:
|
|||
|
Accounts
payable
|
(6,348)
|
(12,278)
|
17,958
|
|
Income
taxes
|
3,584
|
5,951
|
(9,144)
|
|
Unearned
revenues
|
11,654
|
(3,208)
|
4,229
|
|
Restructuring
reserve
|
459
|
546
|
(2,958)
|
|
Other
current and accrued liabilities
|
(6,133)
|
15,799
|
14,514
|
|
Net
cash provided by operating activities
|
114,826
|
77,206
|
66,971
|
|
Cash
flows from investing activities:
|
|||
|
Acquisition
of property, plant, and equipment
|
(13,757)
|
(15,217)
|
(13,363)
|
|
Acquisitions
of businesses, net of cash acquired
|
(25,535)
|
(39,629)
|
(94,522)
|
|
Net
cash (outflow) proceeds from the sale of discontinued
operations
|
—
|
—
|
(2,159)
|
|
Decrease
in restricted cash
|
516
|
—
|
2,121
|
|
Other
investing activities
|
131
|
142
|
1,772
|
|
Net
cash (used in) investing activities
|
(38,645)
|
(54,704)
|
(106,151)
|
|
Cash
flows from financing activities:
|
|||
|
Proceeds
from stock issuances
|
845
|
9,005
|
7,174
|
|
Excess
tax benefit on stock compensation
|
12
|
2,229
|
755
|
|
Proceeds
of short-term debt
|
11,215
|
3,582
|
2,899
|
|
Payment
of short-term debt
|
(12,941)
|
(3,596)
|
(8,950)
|
|
Proceeds
of long-term debt
|
93,793
|
105,898
|
6,177
|
|
Payment
of long-term debt
|
(144,650)
|
(65,813)
|
(891)
|
|
Net
change in factoring and bank overdrafts
|
5,380
|
—
|
—
|
|
Debt
issuance costs
|
(3,970)
|
—
|
—
|
|
Payment
of notes payable
|
—
|
(4,866)
|
—
|
|
Purchase
of treasury stock
|
—
|
(50,899)
|
—
|
|
Net
cash (used in) provided by financing activities
|
(50,316)
|
(4,460)
|
7,164
|
|
Effect
of foreign currency rate fluctuations on cash and cash
equivalents
|
4,010
|
(4,091)
|
6,893
|
|
Net
increase (decrease) in cash and cash equivalents
|
29,875
|
13,951
|
(25,123)
|
|
Cash
and cash equivalents:
|
|||
|
Beginning
of year
|
132,222
|
118,271
|
143,394
|
|
End
of year
|
$
162,097
|
$
132,222
|
$
118,271
|
See notes
to consolidated financial statements.
36
CHECKPOINT
SYSTEMS, INC.
NOTES
TO CONSOLIDATED FINANCIAL STATEMENTS
Note
1. SUMMARY OF SIGNIFICANT ACCOUNTING POLICIES
Nature
of Operations
We are a
multinational manufacturer and marketer of identification, tracking, security
and merchandising solutions primarily for the retail industry. We provide
technology-driven integrated supply chain solutions to brand, track, and secure
goods for retailers and consumer product manufacturers worldwide. We are a
leading provider of, and earn revenues primarily from the sale of, electronic
article surveillance (EAS), store monitoring solutions (CheckView™), custom tags
and labels (Apparel Labeling Solutions), hand-held labeling systems (HLS),
retail merchandising systems (RMS), and radio frequency identification
(RFID) systems and software. Applications of these products include
primarily retail security, asset and merchandise visibility, automatic
identification, and pricing and promotional labels and signage. Operating
directly in 30 countries, we have a global network of subsidiaries and
distributors and provide customer service and technical support around the
world.
Out
of Period Adjustments
During
the fourth quarter of 2009, we recorded a benefit to income tax expense of $1.3
million related to the settlement of a tax matter in an overseas jurisdiction
for which the assessment was received in the third quarter of
2009. This adjustment related to the third quarter of 2009 was not
material to the financial results for previously issued interim financial
data or to the fourth quarter of fiscal 2009. As a result, we did not
restate our previously issued interim financial data.
During
the fourth quarter of 2008, we identified an error in our financial statements
related to fiscal year 2006. This error related to the accounting for a building
impairment in France. We corrected the error during the fourth quarter of 2008,
which had the effect of increasing asset impairment expense $1.1 million
and reducing net income by $0.8 million. This prior period error was not
material to the financial results for previously issued annual financial
statements or previously issued interim financial data prior to fiscal 2008 as
well as for the twelve months ended December 28, 2008. As a result, we did
not restate our previously issued annual financial statements or previously
issued interim financial data.
During
the first quarter of 2008, we identified errors in our financial statements for
the fiscal years ended 1999 through fiscal year 2007. These errors primarily
related to the accounting for a deferred compensation arrangement. We
incorrectly accounted for a deferred payment arrangement to a former executive
of the Company. These deferred payments should have been appropriately accounted
for in prior periods. We corrected these errors during the first quarter of
2008, which had the effect of increasing selling, general and administrative
expenses by $1.4 million and reducing net income by $0.8 million.
These prior period errors individually and in the aggregate were not material to
the financial results for previously issued annual financial statements or
previously issued interim financial data prior to fiscal 2008 as well as the
twelve months ended December 28, 2008. As a result, we did not restate our
previously issued annual financial statements or previously issued interim
financial data.
In 2007,
we recorded an adjustment of $2.1 million to reduce deferred income tax
expense, and increase earnings from continuing operations and net earnings. We
have determined that this adjustment related to errors made in prior years
associated with the impact of changes in statutory rates on deferred taxes. Had
these errors been recorded in the proper periods, earnings from continuing
operations and net earnings as reported would increase by $0.2 million in
2006 and increase by $1.9 million for years prior to 2005. We have
determined that these adjustments did not have a material effect on the 2007 and
prior years’ financial statements.
Principles
of Consolidation
The
consolidated financial statements include the accounts of Checkpoint Systems,
Inc. and its majority-owned subsidiaries (Company). All inter-company
transactions are eliminated in consolidation.
Use
of Estimates
The
preparation of financial statements in conformity with accounting principles
generally accepted in the United States of America requires management to make
estimates and judgments that affect the reported amounts of assets and
liabilities and disclosure of contingent assets and liabilities at the date of
the financial statements and the reported amounts of revenues and expenses
during the reporting period. Actual results could differ from those
estimates.
Fiscal
Year
Our
fiscal year is the 52 or 53 week period ending the last Sunday of December.
References to 2009, 2008, and 2007, are for the 52 weeks ended
December 27, 2009, December 28, 2008, and December 30, 2007,
respectively.
Reclassifications
Certain
reclassifications and retrospective adjustments have been made to prior period
information to conform to current period presentation. These reclassifications
and retrospective adjustments result from our adoption of an accounting standard
codified within Financial Accounting Standards Board (“FASB”) Accounting
Standards Codification™ (“ASC”) 810, “Consolidation,” related to noncontrolling
interests, and our change in segment reporting to conform to our current
management structure, respectively.
Noncontrolling
Interests
On
December 29, 2008, we adopted a standard codified within ASC 810,
“Consolidation,” which establishes accounting and reporting standards for the
noncontrolling interest in a subsidiary and for the deconsolidation of a
subsidiary. This standard clarifies that a noncontrolling interest should be
reported as equity in the consolidated financial statements and requires net
income attributable to both the parent and the noncontrolling interest to be
disclosed separately on the face of the consolidated statement of income. The
presentation and disclosure requirements of this standard require retrospective
application to all prior periods presented.
On
July 1, 1997, Checkpoint Systems Japan Co. Ltd. (Checkpoint Japan), a
wholly-owned subsidiary of the Company, issued newly authorized shares to
Mitsubishi Materials Corporation (Mitsubishi) in exchange for cash. In
February 2006, Checkpoint Japan repurchased 26% of these shares from
Mitsubishi in exchange for $0.2 million in cash. The remaining shares held
by Mitsubishi represent 15% of the adjusted outstanding shares of Checkpoint
Japan. We have classified noncontrolling interests as equity on our consolidated
balance sheets as of December 27, 2009 and December 28, 2008 and
presented net income attributable to noncontrolling interests separately on our
consolidated statements of operations for the years ended December 27,
2009, December 28, 2008, and December 30, 2007. No changes in the ownership
interests of Checkpoint Japan occurred during the years ended December 27,
2009, December 28, 2008, and December 30, 2007, respectively.
Stock
Repurchase Program
During
the first half of 2008, we executed our previously approved stock repurchase
program in which we are authorized to purchase up to two million shares of the
Company’s common stock. In total, we repurchased two million shares of our
common stock at an average cost of $25.42, spending a total of
$50.9 million. Prior to 2008, no shares were repurchased under this plan.
As of December 27, 2009, no shares remain available for purchase under the
current program. Common stock obtained by the Company through the repurchase
program has been added to our treasury stock holdings.
37
Subsequent
Events
During
the second quarter of 2009, we adopted a standard codified within ASC 855,
“Subsequent Events,” which establishes general standards of accounting for and
disclosure of events that occur after the balance sheet date but before
financial statements are issued or are available to be issued. The adoption of
this standard did not have a material impact on our consolidated results of
operations and financial condition. We evaluated events or transactions that
occurred after December 27, 2009 and through February 23, 2010, the date
the financial statements were issued. During this period no events required
recognition or disclosure in the consolidated financial statements of the
Company.
Cash
and Cash Equivalents
Cash in
excess of operating requirements is invested in short-term, income-producing
instruments or used to pay down debt. Cash equivalents include commercial paper
and other securities with original maturities of 90 days or less at the
time of purchase. Book value approximates fair value because of the short
maturity of those instruments.
Accounts
Receivable
Accounts
receivables are recorded at net realizable values. We maintain an allowance for
doubtful accounts for estimated losses resulting from the inability of our
customers to make required payments. These allowances are based on specific
facts and circumstances surrounding individual customers as well as our
historical experience. Provisions for the losses on receivables are charged to
income to maintain the allowance at a level considered adequate to cover losses.
Receivables are charged off against the reserve when they are deemed
uncollectible.
Inventories
Inventories
are stated at the lower of cost (first-in, first-out method) or market. A
provision is made to reduce excess or obsolete inventory to its net realizable
value.
Revenue
Equipment on Operating Lease
The cost
of the equipment leased to customers under operating leases is depreciated on a
straight-line basis over the lesser of the length of the contract or estimated
useful life of the asset, which is usually between three and five
years.
Property,
Plant, and Equipment
Property,
plant, and equipment is carried at cost less accumulated depreciation.
Maintenance, repairs, and minor renewals are expensed as incurred. Additions,
improvements, and major renewals are capitalized. Depreciation is provided on a
straight-line basis over the estimated useful lives of the assets. Assets
subject to capital leases are depreciated over the lesser of the estimated
useful life of the asset or length of the contract. Buildings, equipment rented
to customers, and leased equipment on capitalized leases use the following
estimated useful lives of fifteen to thirty years, three to five years, and five
years, respectively. Machinery and equipment estimated useful lives range from
three to ten years. Leasehold improvement useful lives are the lesser of the
minimum lease term or the useful life of the item. The cost and accumulated
depreciation applicable to assets retired are removed from the accounts and the
gain or loss on disposition is included in income.
We review
our property, plant, and equipment for impairment whenever events or changes in
circumstances indicate that the carrying amount of the assets may not be
recoverable. If it is determined that an impairment, based on expected future
undiscounted cash flows, exists, then the loss is recognized on the consolidated
statements of operations. The amount of the impairment is the excess of the
carrying amount of the impaired asset over its fair value.
Internal-Use
Software
Included
in fixed assets is the capitalized cost of internal-use software. We capitalize
costs incurred during the application development stage of internal-use software
and amortize these costs over their estimated useful lives, which generally
range from three to five years. Costs incurred related to design or maintenance
of internal-use software are expensed as incurred.
Goodwill
Goodwill
is carried at cost and is not amortized. We test goodwill for impairment on an
annual basis as of fiscal month end October of each fiscal year, relying on a
number of factors including operating results, business plans and anticipated
future cash flows. Company management uses its judgment in assessing whether
goodwill has become impaired between annual impairment tests. Reporting units
are primarily determined as the geographic areas comprising the Company’s
business segments, except in situations when aggregation of the reporting units
is appropriate. Recoverability of goodwill is evaluated using a two-step
process. The first step involves a comparison of the fair value of a reporting
unit with its carrying value. If the carrying amount of the reporting unit
exceeds its fair value, then the second step of the process involves a
comparison of the implied fair value and carrying value of the goodwill of that
reporting unit. If the carrying value of the goodwill of a reporting unit
exceeds the fair value of that goodwill, an impairment loss is recognized in an
amount equal to the excess.
The fair
value of our reporting units is dependent upon our estimate of future discounted
cash flows and other factors. Our estimates of future cash flows include
assumptions concerning future operating performance and economic conditions and
may differ from actual future cash flows. Estimated future cash flows are
adjusted by an appropriate discount rate derived from our market capitalization
plus a suitable control premium at the date of evaluation. The financial and
credit market volatility directly impacts our fair value measurement through our
weighted average cost of capital that we use to determine our discount rate and
through our stock price that we use to determine our market capitalization.
Therefore, changes in the stock price may also affect the amount of impairment
recorded. Market capitalization is determined by multiplying the shares
outstanding on the assessment date by the average market price of our common
stock over a 30-day period before each assessment date. We use this 30-day
duration to consider inherent market fluctuations that may affect any individual
closing price. We believe that our market capitalization alone does not fully
capture the fair value of our business as a whole, or the substantial value that
an acquirer would obtain from its ability to obtain control of our business. As
such, in determining fair value, we add a control premium to our market
capitalization. To estimate the control premium, we considered our unique
competitive advantages that would likely provide synergies to a market
participant. In addition, we considered external market factors which we believe
contributed to the decline and volatility in our stock price that did not
reflect our underlying fair value. Refer to Note 5.
Other
Intangibles
Indefinite-lived
intangible assets are carried at cost and are not amortized, but are subject to
tests for impairment at least annually or whenever events or changes in
circumstances indicate that the carrying amount of the assets may not be
recoverable.
Definite-lived
intangibles are amortized on a straight-line basis over their useful lives (or
legal lives if shorter). We review our other intangible assets for impairment
whenever events or changes in circumstances indicate that the carrying amount of
the assets may not be recoverable.
If it is
determined that an impairment, based on expected future cash flows, exists, then
the loss is recognized on the consolidated statements of operations. The amount
of the impairment is the excess of the carrying amount of the impaired asset
over the fair value of the asset. The fair value represents expected future cash
flows from the use of the assets, discounted at the rate used to evaluate
potential investments. Refer to Note 5.
Other
Assets
Included
in other assets are $18.2 million and $11.5 million of net long-term
customer-based receivables at December 27, 2009 and December 28, 2008,
respectively.
38
Deferred
Financing Costs
Financing
costs are capitalized and amortized to interest expense over the life of the
debt. The net deferred financing costs at December 27, 2009 and
December 28, 2008 were $3.2 million and $0.2 million, respectively.
The financing cost amortization expense was $1.0 million,
$0.2 million, and $0.2 million, for 2009, 2008, and 2007,
respectively.
Revenue
Recognition
We
recognize revenue when revenue is realized or realizable and earned. Revenue is
realized or realizable and earned when all of the following criteria are met:
persuasive evidence of an arrangement exists; delivery has occurred or services
have been rendered; the price to the buyer is fixed or determinable; and
collectability is reasonably assured. For arrangements with multiple elements,
we determine the fair value of each element and then allocate the total
arrangement consideration among the separate elements. In instances when the
fair value is not known for the delivered items, and is known for the
undelivered items, the residual method is used. We recognize revenue when
installation is complete or other post-shipment obligations have been satisfied.
Equipment leased to customers under sales-type leases is accounted for as the
equivalent of a sale. The present value of such lease revenues is recorded as
net revenues, and the related cost of the equipment is charged to cost of
revenues. The deferred finance charges applicable to these leases are recognized
over the terms of the leases. Rental revenue from equipment under operating
leases is recognized over the term of the lease. Installation revenue from SMS
EAS equipment is recognized when the systems are installed. Service revenue is
recognized, for service contracts, on a straight-line basis over the contractual
period, and, for non-contract work, as services are performed. Unearned revenue
is recorded when payments are received in advance of performing our service
obligations and is recognized over the service period.
Revenues
from software license agreements are recognized when persuasive evidence of an
agreement exists, delivery of the product has occurred, no significant vendor
obligations are remaining to be fulfilled, the fee is fixed and determinable,
and collection is probable. Revenue from software contracts for both licenses
and professional services that require significant production, modification,
customization, or implementation are recognized together using the percentage of
completion method based upon the ratio of labor incurred to total estimated
labor to complete each contract. In instances where there is a term license
combined with services, revenue is recognized ratably over the
term.
We record
estimated reductions to revenue for customer incentive offerings, including
volume-based incentives and rebates. We record revenues net of an allowance for
estimated return activities. Return activity was immaterial to revenue and
results of operations for all periods presented.
Shipping
and Handling Fees and Costs
Shipping
and handling fees are accounted for in net revenues and shipping and handling
costs in cost of revenues.
Cost
of Revenues
The
principal elements of cost of revenues are product cost, field service and
installation cost, freight, and product royalties paid to third
parties.
Warranty
Reserves
We
provide product warranties for our various products. These warranties vary in
length depending on product and geographical region. We establish our warranty
reserves based on historical data of warranty transactions. The following table
sets forth the movement in the warranty reserve:
|
(dollar
amounts in thousands)
|
December
27,
2009
|
December
28,
2008
|
|
Balance
at beginning of year
|
$ 8,403
|
$ 8,108
|
|
Accruals
for warranties issued
|
3,708
|
6,388
|
|
Settlement
made
|
(6,163)
|
(5,882)
|
|
Acquisitions
|
—
|
89
|
|
Foreign
currency translation adjustment
|
168
|
(300)
|
|
Balance
at end of year
|
$ 6,116
|
$ 8,403
|
Royalty
Expense
Royalty
expenses related to security products approximated $0.2 million,
$3.7 million, and $3.7 million, in 2009, 2008, and 2007, respectively.
These expenses are included as part of cost of revenues. Our payment obligation
to Arthur D. Little, Inc. terminated on December 31, 2008.
Research
and Development Costs
Research
and development costs are expensed as incurred and consist of development work
associated with the Company’s existing and potential products. The Company’s
research and development expenses relate primarily to payroll costs for
engineering personnel, costs associated with various projects, including
testing, developing prototypes and related expenses.
Stock
Options
We
recognize stock-based compensation expense for all share-based payments net of
an estimated forfeiture rate and only recognize compensation cost for those
shares expected to vest. Stock compensation expense is recognized for all
share-based payments on a straight-line basis over the requisite service period
of the award.
We use
the Black-Scholes option pricing model to value all stock options. The table
below presents the weighted average expected life in years. The expected life
computation is based on historical exercise patterns and post-vesting
termination behavior. Volatility is determined using changes in historical stock
prices. The interest rate for periods within the expected life of the award is
based on the U.S. Treasury yield curve in effect at the time of
grant.
The fair
value of share-based payment units was estimated using the Black-Scholes option
pricing model with the following assumptions and weighted average fair values as
follows:
|
Year
Ended,
December
27,
2009
|
Year
Ended,
December
28,
2008
|
Year
Ended,
December
30,
2007
|
||||
|
Weighted
average fair value of grants
|
$
3.59
|
$
8.04
|
$
8.88
|
|||
|
Valuation
assumptions:
|
||||||
|
Expected
dividend yield
|
0.00
|
%
|
0.00
|
%
|
0.00
|
%
|
|
Expected
volatility
|
.4474
|
.3883
|
.3659
|
|||
|
Expected
life (in years)
|
4.86
|
4.84
|
4.56
|
|||
|
Risk-free
interest rate
|
1.700
|
%
|
2.450
|
%
|
4.264
|
%
|
See Note
8 to the Consolidated Condensed Financial Statements for a further discussion on
stock-based compensation.
Income
Taxes
Deferred
tax liabilities and assets are determined based on the difference between the
financial statement basis and the tax basis of assets and liabilities, using
enacted statutory tax rates in effect at the balance sheet date. Changes in
enacted tax rates are reflected in the tax provision as they occur. A valuation
allowance is recorded to reduce deferred tax assets when it is more likely than
not that a tax benefit will not be realized. The effect on deferred tax assets
and liabilities of a change in tax rates is recognized in income in the period
when the change is enacted.
We
utilize a two-step approach to recognizing and measuring uncertain tax positions
(tax contingencies). The first step is to evaluate the tax position for
recognition by determining if the weight of available evidence indicates it is
more likely than not that the position will be sustained on audit, including
resolution of related appeals or litigation processes. The second step is to
measure the tax benefit as the largest amount which is more than 50% likely of
being realized upon ultimate settlement. We include interest and penalties
related to our tax contingencies in income tax expense.
39
Taxes
and Value Added Collected from Customers
Sales and
value added taxes collected from customers are excluded from revenues. The
obligation is included in other current liabilities until the taxes are remitted
to the appropriate taxing authorities.
Foreign
Currency Translation and Transactions
Our
balance sheet accounts of foreign subsidiaries are translated into U.S. dollars
at the rate of exchange in effect at the balance sheet dates. Revenues, costs,
and expenses of our foreign subsidiaries are translated into U.S. dollars at the
year-to-date average rate of exchange. The resulting translation adjustments are
recorded as a separate component of shareholders’ equity. Gains or losses on
certain long-term inter-company transactions are excluded from the net earnings
(loss) and accumulated in the cumulative translation adjustment as a
separate component of consolidated stockholders’ equity. All other foreign
currency transaction gains and losses are included in net earnings
(loss).
Accounting
for Hedging Activities
We enter
into certain foreign exchange forward contracts in order to hedge anticipated
rate fluctuations in Western Europe, Canada, Japan and Australia. Transaction
gains or losses resulting from these contracts are recognized at the end of each
reporting period. We use the fair value method of accounting, recording realized
and unrealized gains and losses on these contracts. These gains and losses are
included in other gain (loss), net on our consolidated statements of
operations.
We enter
into various foreign currency contracts to reduce our exposure to forecasted
Euro-denominated inter-company revenues. These cash flow hedging instruments are
marked to market and the changes are recorded in other comprehensive income.
Amounts recorded in other comprehensive income are recognized in cost of goods
sold as the inventory is sold to external parties. Any hedge ineffectiveness is
charged to other gain (loss), net on our consolidated statements of
operations.
We enter,
on occasion, into interest rate swaps to reduce the risk of significant interest
rate increases in connection with floating rate debt. This cash flow hedging
instrument is marked to market and the changes are recorded in other
comprehensive income. Any hedge ineffectiveness is charged to interest
expense.
See Note
15 for further information.
Recently
Adopted Accounting Standards
In
September 2009, we adopted ASC 105-10-05, which provides for the FASB Accounting
Standards Codification™ (the “Codification”) to become the single official
source of authoritative, nongovernmental U.S. generally accepted accounting
principles (“GAAP”) to be applied by nongovernmental entities in the preparation
of financial statements in conformity with GAAP. The Codification does not
change GAAP, but combines all authoritative standards into a comprehensive,
topically organized online database. ASC 105-10-05 explicitly recognizes rules
and interpretative releases of the Securities and Exchange Commission (SEC)
under federal securities laws as authoritative GAAP for SEC registrants.
Subsequent revisions to GAAP will be incorporated into the ASC through
Accounting Standards Updates (ASU). ASC 105-10-05 is effective for
interim and annual periods ending after September 15, 2009, and was effective
for us in the third quarter of 2009. The adoption of ASC 105-10-05 impacted the
Company’s financial statement disclosures, as all references to authoritative
accounting literature were updated to and in accordance with the Codification.
Our adoption of ASC 105-10-05 did not have a material impact on our consolidated
results of operations and financial condition.
In
December 2007, the FASB issued an accounting standard codified within ASC
805, “Business Combinations” which changed the accounting for business
acquisitions. Under this standard, business combinations continue to
be required to be accounted for at fair value under the acquisition method of
accounting, but the standard changed the method of applying the acquisition
method in a number of significant aspects. Acquisition costs will generally be
expensed as incurred; noncontrolling interests will be valued at fair value at
the acquisition date; in-process research and development will be recorded at
fair value as an indefinite-lived intangible asset at the acquisition date,
until either abandoned or completed, at which point the useful lives will be
determined; restructuring costs associated with a business combination will
generally be expensed subsequent to the acquisition date; and changes in
deferred tax asset valuation allowances and income tax uncertainties after the
acquisition date generally will affect income tax expense. The standard is
effective on a prospective basis for all business combinations for which the
acquisition date is on or after the beginning of the first annual period
subsequent to December 15, 2008, with the exception of the accounting for
valuation allowances on deferred taxes and acquired tax contingencies. The
standard amends the accounting for income taxes such that adjustments made to
valuation allowances on deferred taxes and acquired tax contingencies associated
with acquisitions that closed prior to the effective date of the standard would
also apply the provisions of the new standard. Disclosure requirements were also
expanded to enable the evaluation of the nature and financial effects of the
business combination. For the Company, the standard is effective for business
combinations occurring after December 28, 2008. Adoption of the standard
did not have a significant impact on our financial position and results of
operations; however, any business combination entered into after the adoption
may significantly impact our financial position and results of operations when
compared to acquisitions accounted for under prior GAAP and result in more
earnings volatility and generally lower earnings due to the expensing of deal
costs and restructuring costs of acquired companies. This standard was applied
to business combinations disclosed in Note 2 that were completed after
2008. Also, since we have significant acquired deferred tax assets
for which full valuation allowances were recorded at the acquisition date, the
standard could significantly affect the results of operations if changes in the
valuation allowances occur subsequent to adoption. As of December 27, 2009,
such deferred tax valuation allowances amounted to
$4.6 million.
In
February 2009, the FASB issued an accounting standard codified within ASC
805, “Business Combinations” which amends the provisions related to the initial
recognition and measurement, subsequent measurement, and disclosure of assets
and liabilities arising from contingencies in a business combination. The
standard applies to all assets acquired and liabilities assumed in a business
combination that arise from contingencies that would be within the scope of ASC
450, “Contingencies”, if not acquired or assumed in a business combination,
except for assets or liabilities arising from contingencies that are subject to
specific guidance in ASC 805. The standard applies prospectively to business
combinations for which the acquisition date is on or after the beginning of the
first annual reporting period beginning on or after December 15, 2008. The
adoption of the standard effective December 29, 2008 did not have an impact
on our financial position and results of operations.
In
December 2007, the FASB issued an accounting standard codified within ASC
810, “Consolidation”. The standard establishes accounting and
reporting standards for ownership interests in subsidiaries held by parties
other than the parent, the amount of consolidated net income attributable to the
parent and to the noncontrolling interest, changes in a parent’s ownership
interest, and the valuation of retained noncontrolling equity investments when a
subsidiary is deconsolidated. Noncontrolling interest (minority
interest) is required to be recognized as equity in the consolidated financial
statements and separate from the parent’s equity. The standard also establishes
disclosure requirements that clearly identify and distinguish between the
interests of the parent and the interests of the noncontrolling owners. The
effective date of the standard is for fiscal years beginning after
December 15, 2008. We adopted the standard on December 29, 2008. As of
December 27, 2009, our noncontrolling interest totaled $0.8 million,
which is included in the stockholders’ equity section of our Consolidated
Balance Sheets. The Company has incorporated the required presentation and
disclosure requirements in our consolidated financial statements.
In March
2008, the FASB issued an accounting standard related to disclosures about
derivative instruments and hedging activities, codified within ASC 815,
“Derivatives and Hedging”. Provisions of this standard change the
disclosure requirements for derivative instruments and hedging activities
including enhanced disclosures about (a) how and why derivative instruments
are used, (b) how derivative instruments and related hedged items are
accounted for under ASC 815 and its related interpretations, and (c) how
derivative instruments and related hedged items affect our financial position,
financial performance, and cash flows. This statement was effective for
financial statements issued for fiscal years and interim periods beginning after
November 15, 2008. We adopted the standard on December 29, 2008. See
Note 15 for our enhanced disclosures required under this
standard.
40
In
April 2008, the FASB issued an accounting standard codified within ASC 350,
“Intangibles - Goodwill and Other” which amends the factors that should be
considered in developing renewal or extension assumptions used to determine the
useful life of a recognized intangible asset Under this standard,
entities estimating the useful life of a recognized intangible asset must
consider their historical experience in renewing or extending similar
arrangements or, in the absence of historical experience, must consider
assumptions that market participants would use about renewal or
extension. The intent of the standard is to improve the consistency
between the useful life of a recognized intangible asset and the period of
expected cash flows used to measure the fair value of the asset. Adoption of the
standard was effective for financial statements issued for fiscal years
beginning after December 15, 2008, and interim periods within those fiscal
years. We adopted the standard on December 29, 2008. We do not expect the
standard to have a material impact on our accounting for future acquisitions of
intangible assets.
In
June 2008, the FASB issued an accounting standard codified within ASC 260,
“Earnings Per Share” which provides that unvested share-based payment awards
that contain nonforfeitable rights to dividends or dividend equivalents (whether
paid or unpaid) are participating securities and shall be included in the
computation of earnings per share pursuant to the two-class method. The standard
is effective for financial statements issued for fiscal years beginning after
December 15, 2008, and interim periods within those fiscal years. Upon
adoption, an entity is required to retrospectively adjust its earnings per share
data (including any amounts related to interim periods, summaries of earnings
and selected financial data) to conform to the standard’s provisions. We adopted
this pronouncement effective December 29, 2008 and the adoption did not
have an impact on our calculation of earnings per share.
In
November 2008, the FASB issued an accounting standard codified within ASC
350, “Intangibles - Goodwill and Other” that applies to defensive assets which
are acquired intangible assets which the acquirer does not intend to actively
use, but intends to hold to prevent its competitors from obtaining access to the
asset. The standard clarifies that defensive intangible assets are separately
identifiable and should be accounted for as a separate unit of accounting in
accordance with guidance provided within ASC 805, “Business Combinations” and
ASC 820, “Fair Value Measurements and Disclosures”. The standard was
effective for intangible assets acquired in fiscal years beginning on or after
December 15, 2008 and was applied by us to intangible assets acquired on or
after December 29, 2008. We do not expect the standard to have a material
impact on our accounting for future acquisitions of intangible
assets.
In
December 2008, the FASB issued an accounting standard codified within ASC
810, “Consolidation” and ASC 860, “Transfers and Servicing”. The standard was
effective for the first reporting period ending after December 15, 2008 and
requires additional disclosures concerning transfers of financial assets and an
enterprise’s involvement with variable interest entities (VIE) and qualifying
special purpose entities under certain conditions. Upon adoption in our interim
consolidated financial statements for the quarter ending March 29, 2009,
there were no additional required disclosures.
In
April 2009, the FASB issued an accounting standard codified within ASC 825,
“Financial Instruments” that requires disclosures about the fair value of
financial instruments that are not reflected in the consolidated balance sheets
at fair value whenever summarized financial information for interim reporting
periods is presented. Entities are required to disclose the methods and
significant assumptions used to estimate the fair value of financial instruments
and describe changes in methods and significant assumptions, if any, during the
period. The standard was effective for interim reporting periods ending after
June 15, 2009 and was adopted by the Company in the second quarter of
2009. See Note 15 for our disclosures required under the
standard.
In
April 2009, the FASB issued an accounting standard codified within ASC 820,
“Fair Value Measurements and Disclosures,” which provides guidance on
determining fair value when there is no active market or where the price inputs
being used represent distressed sales. The standard reaffirms the
objective of fair value measurement, which is to reflect how much an asset would
be sold for in an orderly transaction. It also reaffirms the need to use
judgment to determine if a formerly active market has become inactive, as well
as to determine fair values when markets have become inactive. The standard is
effective for interim and annual periods ending after June 15, 2009 and was
adopted by the Company in the second quarter of 2009. The adoption of this
accounting pronouncement did not have a material impact on our consolidated
results of operations and financial condition.
In
May 2009, the FASB issued an accounting standard codified within ASC 855
“Subsequent Events,” which sets forth general standards of accounting for and
disclosure of events that occur after the balance sheet date but before
financial statements are issued or are available to be issued. It
requires the disclosure of the date through which an entity has evaluated
subsequent events and the basis for that date, that is, whether that date
represents the date the financial statements were issued or were available to be
issued. The standard is effective for interim or annual periods
ending after June 15, 2009 and was adopted by the Company in the second quarter
of 2009. The adoption of this standard did not have a material impact
on our consolidated results of operations and financial
condition. See Note 1 for the required disclosures.
In August
2009, the FASB issued ASU No. 2009-04, “Accounting for Redeemable Equity
Instruments.” The ASU represents an update to ASC 480-10-S99
“Distinguishing Liabilities from Equity.” This update provides
guidance on what type of instruments should be classified as temporary versus
permanent equity, as well as guidance with respect to
measurement. The adoption of the ASU did not have a material impact
on our consolidated results of operations and financial condition.
In
December 2008, the FASB issued an accounting standard codified within ASC
715, “Compensation – Retirement Benefits” that requires enhanced disclosures
about the plan assets of a Company’s defined benefit pension and other
postretirement plans. The enhanced disclosures are intended to provide users of
financial statements with a greater understanding of: (1) how investment
allocation decisions are made, including the factors that are pertinent to an
understanding of investment policies and strategies; (2) the major
categories of plan assets; (3) the inputs and valuation techniques used to
measure the fair value of plan assets; (4) the effect of fair value
measurements using significant unobservable inputs (Level 3) on changes in plan
assets for the period; and (5) significant concentrations of risk within
plan assets. The disclosures under this standard were effective for us for the
fiscal year ending December 27, 2009. See Note 14 for the
additional disclosures required upon adoption of this standard.
In August
2009, the FASB issued ASU No. 2009-05, “Fair Value Measurements and
Disclosures – Measuring Liabilities at Fair Value.”. The ASU provides additional
guidance for the fair value measurement of liabilities under ASC 820 “Fair Value
Measurements and Disclosures”. The ASU provides clarification that in
circumstances in which a quoted price in an active market for the identical
liability is not available, a reporting entity is required to measure fair value
using certain techniques. The ASU also clarifies that when estimating the fair
value of a liability, a reporting entity is not required to include a separate
input or adjustment to other inputs relating to the existence of a restriction
that prevents the transfer of a liability. It also clarifies that both a quoted
price in an active market for the identical liability at the measurement date
and the quoted price for the identical liability when traded as an asset in an
active market when no adjustments to the quoted price of the asset are required
are Level 1 fair value measurements. We adopted the ASU in the fourth
fiscal quarter of 2009. The adoption of the ASU did not have a
material impact on our consolidated results of operations and financial
condition.
New Accounting Pronouncements and Other
Standards
In
October 2009, the FASB issued ASU 2009-13, “Multiple-Deliverable Revenue
Arrangements, (amendments to ASC Topic 605, Revenue Recognition)” (ASU 2009-13)
and ASU 2009-14, “Certain Arrangements That Include Software Elements,
(amendments to ASC Topic 985, Software)” (ASU 2009-14). ASU 2009-13
requires entities to allocate revenue in an arrangement using estimated selling
prices of the delivered goods and services based on a selling price hierarchy.
The amendments eliminate the residual method of revenue allocation and require
revenue to be allocated using the relative selling price method. ASU
2009-14 removes tangible products from the scope of software revenue guidance
and provides guidance on determining whether software deliverables in an
arrangement that includes a tangible product are covered by the scope of the
software revenue guidance. ASU 2009-13 and ASU 2009-14 should be applied on
a prospective basis for revenue arrangements entered into or materially modified
in fiscal years beginning on or after June 15, 2010, with early adoption
permitted. We are currently evaluating the impact of the adoption of these ASUs
on the Company’s consolidated results of operations or financial
condition.
41
In
December 2009, the FASB issued ASU No. 2009-16, “Accounting for Transfers of
Financial Assets” which amends ASC 860 “Transfers and Servicing” by: eliminating
the concept of a qualifying special-purpose entity (QSPE); clarifying and
amending the derecognition criteria for a transfer to be accounted for as a
sale; amending and clarifying the unit of account eligible for sale accounting;
and requiring that a transferor initially measure at fair value and recognize
all assets obtained (for example beneficial interests) and liabilities incurred
as a result of a transfer of an entire financial asset or group of financial
assets accounted for as a sale. Additionally, on and after the effective date,
existing QSPEs (as defined under previous accounting standards) must be
evaluated for consolidation by reporting entities in accordance with the
applicable consolidation guidance. The standard requires enhanced disclosures
about, among other things, a transferor’s continuing involvement with transfers
of financial assets accounted for as sales, the risks inherent in the
transferred financial assets that have been retained, and the nature and
financial effect of restrictions on the transferor’s assets that continue to be
reported in the statement of financial position. The standard will be
effective as of the beginning of interim and annual reporting periods that begin
after November 15, 2009, which for us would be December 28, 2009, the
first day of our 2010 fiscal year. We do not expect the adoption of
this standard to have a material effect on our consolidated results of
operations and financial condition. Any required enhancements to
disclosures will be included in our financial statements for the first quarter
ended March 28, 2010.
In
December 2009, the FASB issued ASU No. 2009-17, “Improvements to Financial
Reporting by Enterprises Involved with Variable Interest Entities” which amends
ASC 810, “Consolidation” to address the elimination of the concept of a
qualifying special purpose entity. The standard also replaces the
quantitative-based risks and rewards calculation for determining which
enterprise has a controlling financial interest in a variable interest entity
with an approach focused on identifying which enterprise has the power to direct
the activities of a variable interest entity and the obligation to absorb losses
of the entity or the right to receive benefits from the entity. This standard
also requires continuous reassessments of whether an enterprise is the primary
beneficiary of a VIE whereas previous accounting guidance required
reconsideration of whether an enterprise was the primary beneficiary of a VIE
only when specific events had occurred. The standard provides more
timely and useful information about an enterprise’s involvement with a variable
interest entity and will be effective as of the beginning of interim and annual
reporting periods that begin after November 15, 2009, which for us would be
December 28, 2009, the first day of our 2010 fiscal year. We do
not expect the adoption of this standard to have a material effect on our
consolidated results of operations and financial condition.
In
January 2010, the FASB issued ASU No. 2010-6, “Improving Disclosures About Fair
Value Measurements,” which provides amendments to ASC 820 “Fair Value
Measurements and Disclosures,” including requiring reporting entities to make
more robust disclosures about (1) the different classes of assets and
liabilities measured at fair value, (2) the valuation techniques and inputs
used, (3) the activity in Level 3 fair value measurements including information
on purchases, sales, issuances, and settlements on a gross basis and (4) the
transfers between Levels 1, 2, and 3. The standard is effective for
annual reporting periods beginning after December 15, 2009, except for Level 3
reconciliation disclosures which are effective for annual periods beginning
after December 15, 2010. We do not expect the adoption of this standard to have
a material impact on our consolidated financial statements.
Note
2. ACQUISITIONS
Acquisitions
in Fiscal 2009
In July
2009, the Company entered into an agreement to purchase the business of
Brilliant, a China-based manufacturer of woven and printed labels, and settled
the acquisition on August 14, 2009 for approximately $38.3 million,
including cash acquired of $0.6 million and the assumption of debt of $19.6
million. The transaction was paid in cash and the purchase price includes the
acquisition of 100% of Brilliant’s voting equity
interests. Acquisition costs incurred in connection with the
transaction are recognized within selling, general and administrative expenses
in the consolidated statement of operations and approximate $0.6 million and
$0.7 million for the years ended December 27, 2009 and December 28, 2008,
respectively.
The
financial statements reflect the preliminary allocation of the Brilliant
purchase price based on estimated fair values at the date of acquisition. The
allocation of the purchase price remains open for certain information related to
deferred income taxes and is expected to be completed during the first half of
2010. This allocation has resulted in acquired goodwill of $4.3 million,
which is not tax deductible. Intangible assets included in this acquisition were
$1.4 million. The intangible assets were composed of a
non-compete agreement ($0.9 million), customer lists ($0.4 million), and trade
names ($0.1 million). The useful lives were 5 years for the non-compete
agreement, 10 years for the customer lists, and 3 years for the trade names. The
results from the acquisition date through December 27, 2009 are included in
the Apparel Labeling Solutions segment and were not material to the consolidated
financial statements.
Acquisitions
in Fiscal 2008
In
June 2008, the Company purchased the business of OATSystems, Inc., a
privately held company, for approximately $37.2 million, net of cash
acquired of $0.9 million, and including the assumption of $3.2 million
of OATSystems, Inc. debt. The transaction was paid in cash. Additionally, we
acquired $1.3 million in liabilities.
The
financial statements reflect the preliminary allocation of the OATSystems, Inc.
purchase price based on estimated fair values at the date of acquisition. This
allocation resulted in acquired goodwill of $22.8 million, which is not tax
deductible. We also acquired intangibles of $6.1 million consisting of a trade
name and proprietary technologies. The trade name is an indefinite-lived
intangible asset while the proprietary technologies are finite-lived intangible
assets that have a useful life of 4 years. The results from the acquisition
date through December 28, 2008 are included in the Shrink Management Solutions
segment and were not material to the consolidated financial
statements.
During
2009, we recorded working capital adjustments for the OATSystems, Inc.
acquisition which increased goodwill by $0.2 million. The working capital
adjustments were related to income tax adjustments. As of December 27, 2009, the
financial statements reflect the final allocations of the purchase price based
on estimated fair values at the date of acquisition.
In
January 2008, the Company purchased the business of Security Corporation,
Inc., a privately held company, for $7.9 million plus $1.0 million of
liabilities acquired. The transaction was paid in cash. The financial statements
reflect the final allocation of the purchase price based on estimated fair
values at the date of acquisition. This allocation has resulted in acquired
goodwill of $1.3 million, which is deductible for tax purposes. We also
acquired intangibles of $5.2 million related to customer relationships with
a useful life of 10 years. The results from the acquisition date through
December 28, 2008 are included in the Shrink Management Solutions segment
and were not material to the consolidated financial statements.
Pro forma
results of operations have not been presented individually or in the aggregate
for these acquisitions, described in “Other Acquisitions in Fiscal 2008”,
because the effects of these acquisitions were not material to our consolidated
financial statements.
Acquisitions
in Fiscal 2007
On
November 1, 2007, Checkpoint Systems, Inc. and one of its direct
subsidiaries (collectively, the “Company”) and Alpha Security Products, Inc. and
one of its direct subsidiaries (collectively, “the Seller”) entered into an
Asset Purchase Agreement and a Dutch Assets Sale and Transfer Agreement
(collectively, the “Agreements”) under which the Company purchased all of the
assets of Alpha’s S3 business (the “Acquisition”) for approximately
$142 million, subject to a post-closing working capital adjustment, plus
additional performance-based contingent payments up to a maximum of $8 million
plus interest thereon. The purchase price was funded by $67 million of cash
and $75 million of borrowings under our senior unsecured credit facility.
Subject to the Agreements, contingent payments were earned if the revenue
derived from the S3 business exceeded $70 million during the period from
December 31, 2007, until December 28, 2008. In the event that the
revenue derived from the S3 business exceeded $83 million during such
period, the Seller was entitled to a maximum payment of $8 million. During
the first quarter of 2009, a contingent payment of $6.8 million was made related
to the Alpha acquisition since revenues for the S3 business exceeded the minimum
contingency payment thresholds established in the Alpha asset purchase
agreement, with a corresponding increase to goodwill recorded on the
acquisition.
42
The S3
business includes the development, manufacture, distribution, and sale of retail
store applied security products requiring removal by store personnel at the cash
register.
The
purchase price allocation as of the date of acquisition was as
follows:
|
(dollar
amounts in thousands)
|
November
1,
2007
|
|
Cash
|
$ 67,000
|
|
Long-term
debt
|
75,000
|
|
Contingent
payment
|
6,796
|
|
Purchase
price(1)
|
148,796
|
|
Fair
value of net assets acquired:
|
|
|
Accounts
receivable
|
6,986
|
|
Inventories
|
6,882
|
|
Other
current assets
|
73
|
|
Property,
plant, and equipment
|
9,148
|
|
Intangible
assets(2)
|
71,053
|
|
Accounts
payable
|
(2,526)
|
|
Accrued
compensation and related taxes
|
(810)
|
|
Other
accrued expenses
|
(799)
|
|
Fair
value of the net assets acquired
|
90,007
|
|
Excess
cost over net assets acquired
|
58,789
|
|
Adjustment
to the realization of deferred tax assets for Checkpoint
|
(59)
|
|
Estimated
acquisition costs
|
648
|
|
Goodwill(3)
|
$ 59,378
|
Notes:
|
(1)
|
Represents
the cash, long-term debt, and contingent payment used to finance the
acquisition.
|
|
(2)
|
Intangible
assets consist of customer relationships ($33.4 million), trade names
($19.4 million), and developed technologies ($18.3 million). The
weighted-average useful lives for the customer relationships and developed
technologies are approximately 10 years. The intangible assets
related to the trade name are deemed to have an indefinite life. The
amortization of definite life intangibles are calculated on a
straight-line basis.
|
|
(3)
|
Goodwill
of $59.4 million was assigned to the Shrink Management Solutions
reporting segment. Of that total amount, $59.4 million is expected to
be deductible for tax purposes over a 15 year
period.
|
The
allocation of the purchase price for the Alpha Acquisition, which primarily used
a discounted cash flow approach with respect to identified intangible assets and
a combination of the cost and market approaches with respect to property, plant
and equipment, was finalized during fiscal year 2008. The discounted cash flow
approach was based upon management’s estimated future cash flows from the
acquired assets and liabilities and utilized a discount rate consistent with the
inherent risk associated with the acquired assets and liabilities. The results
of the assets acquired and liabilities assumed in connection with the Alpha
Acquisition have been included in the consolidated statement of operations since
the closing of the transaction on November 1, 2007, as part of the Shrink
Management Solutions segment.
The
following schedule presents 2007 supplemental unaudited pro forma information as
if the Alpha Acquisition had occurred on December 26, 2005. The unaudited
pro forma information is presented based on information available, is intended
for informational purposes only and is not necessarily indicative of and does
not purport to represent what Checkpoint’s future financial condition or
operating results will be after giving effect to the Alpha Acquisition and does
not reflect actions that may be undertaken by management in integrating these
businesses. In addition, this information does not reflect financial and
operating benefits Checkpoint expects to realize as a result of the
acquisition.
|
(dollar
amounts in thousands)
|
Pro
Forma
|
|
Year
ended
|
December
30,
2007
|
|
(Unaudited)
|
|
|
Net
revenues
|
$
880,790
|
|
Earnings
from continuing operations
|
58,225
|
|
Earnings
from discontinued operations, net of tax
|
359
|
|
Net
earnings attributable to Checkpoint Systems, Inc.
|
$ 58,584
|
|
Net
earnings attributable to Checkpoint Systems, Inc. per Common
Shares:
|
|
|
Basic
Earnings Per Share:
|
|
|
Earnings
from continuing operations
|
$ 1.46
|
|
Earnings
from discontinued operations, net of tax
|
.01
|
|
Basic
Earnings Per Share
|
$ 1.47
|
|
Diluted
Earnings Per Share:
|
|
|
Earnings
from continuing operations
|
$ 1.43
|
|
Earnings
from discontinued operations, net of tax
|
.01
|
|
Diluted
Earnings Per Share
|
$ 1.44
|
Other
Acquisitions in Fiscal 2007
In
November 2007, we purchased SIDEP, a provider of Radio Frequency
(RF) Electronic Article Surveillance (EAS) products. Upon closing, we
also acquired the remaining minority interests in a SIDEP subsidiary, Shanghai
Asialco Electronics Co., Ltd. (Asialco), a China based manufacturer of RF-EAS
labels. The total purchase price for these acquisitions was $27.9 million,
net of cash acquired. The purchase agreement was structured with deferred
payments to the minority interest owners of Asialco of $9.3 million. These
payments will be paid over a three-year period from the date of acquisition and
were recorded as a liability on the date of acquisition. The financial
statements reflect the preliminary allocations of the purchase price based on
estimated fair values at the date of acquisition. This allocation has resulted
in acquired goodwill of $14.0 million, which is non-deductible for tax
purposes. Intangible assets included in this acquisition were $10.7 million. The
intangible assets were composed of customer lists ($5.2 million),
non-compete agreement ($3.8 million), trade names ($1.1 million), and
technology ($0.6 million). The useful lives were 8 to 13 years for
customer lists, 3 years for the non-compete agreement, indefinite for trade
names, and 3 years for technology. The allocation of the purchase price was
finalized during fiscal year 2008. The results from the acquisition date through
December 30, 2007 are included in the Shrink Management Solutions segment
and were not material to the consolidated financial statements.
During
2008, we recorded working capital adjustments for the SIDEP acquisition which
increased goodwill by $1.8 million. The working capital adjustments were
primarily related to income tax adjustments. We also paid $4.9 million to
the minority interest owners of Asialco as part of the deferred payment
arrangement established in the SIDEP purchase agreement. During 2009, we
recorded working capital adjustments for the SIDEP acquisition which decreased
goodwill by $0.1 million. As of December 27, 2009, the financial statements
reflect the final allocations of the purchase price based on estimated fair
values at the date of acquisition.
In
May 2007, the Company purchased the business of SSE Southeast, LLC, for
$5.1 million plus $1.0 million of liabilities acquired. The transaction was
paid in cash. The financial statements reflect the final allocations of the
purchase price based on estimated fair values at the date of acquisition. This
allocation has resulted in acquired goodwill of $1.8 million, which is
deductible for tax purposes. We also acquired intangibles of $2.7 million
related to customer lists with a useful life of 9 years. The results from
the acquisition date through December 30, 2007 are included in the Shrink
Management Solutions segment and were not material to the consolidated financial
statements. The purchase agreement has a working capital adjustment, which was
settled during 2008.
43
In
January 2007, the Company purchased the business of Security Systems
Technology, Inc., a privately held company, for $0.8 million plus
$0.3 million of liabilities acquired. The transaction was paid in cash. The
financial statements reflect the final allocation of the purchase price based on
estimated fair values at the date of acquisition. This allocation has resulted
in acquired goodwill of $0.8 million, which is deductible for tax purposes.
We also acquired intangibles of $0.2 million related to customer lists with
a useful life of 9 years. The results from the acquisition date through
December 30, 2007 are included in the Shrink Management Solutions segment
and were not material to the consolidated financial statements.
Pro forma
results of operations have not been presented individually or in the aggregate
for these acquisitions, described in “Other Acquisitions in Fiscal 2007”,
because the effects of these acquisitions were not material to our consolidated
financial statements.
Note
3. INVENTORIES
Inventories
consist of the following:
|
(dollar
amounts in thousands)
|
December
27,
2009
|
December
28,
2008
|
|
Raw
materials
|
$
16,274
|
$ 16,287
|
|
Work-in-process
|
5,721
|
6,100
|
|
Finished
goods
|
67,252
|
79,735
|
|
Total
|
$
89,247
|
$
102,122
|
Note
4. REVENUE EQUIPMENT ON OPERATING LEASE AND PROPERTY, PLANT, AND
EQUIPMENT
The major
classes are:
|
(dollar
amounts in thousands)
|
December
27,
2009
|
December
28,
2008
|
|
Revenue
equipment on operating lease
|
||
|
Equipment
rented to customers
|
$ 20,659
|
$ 22,795
|
|
Accumulated
depreciation
|
(18,643)
|
(20,755)
|
|
Total
revenue equipment on operating lease
|
$ 2,016
|
$ 2,040
|
|
Property,
plant, and equipment
|
||
|
Land
|
$ 9,803
|
$ 9,809
|
|
Buildings
|
67,642
|
56,014
|
|
Machinery
and equipment
|
163,386
|
144,717
|
|
Leasehold
improvements
|
16,170
|
13,385
|
|
Construction
in progress
|
4,532
|
3,429
|
|
261,533
|
227,354
|
|
|
Accumulated
depreciation
|
(143,935)
|
(140,619)
|
|
Total
property, plant, and equipment
|
$ 117,598
|
$ 86,735
|
Property,
plant, and equipment under capital lease had gross values of $3.0 million
and $1.4 million and accumulated depreciation of $1.0 million and
$0.9 million, as of December 27, 2009 and December 28, 2008,
respectively.
Depreciation
expense on our revenue equipment on operating lease and property, plant, and
equipment was $18.9 million, $18.1 million, and $15.4 million,
for 2009, 2008, and 2007, respectively.
In 2008,
we recorded a $1.5 million fixed asset impairment. The charge consisted of
$1.1 million related to the write down of a building in France and
$0.4 million related to the write down of land and a building in Japan.
These impairments were recorded in asset impairments on the consolidated
statement of operations.
Note
5. GOODWILL AND OTHER INTANGIBLE ASSETS
We had
intangible assets with a net book value of $104.7 million, and
$113.8 million as of December 27, 2009 and December 28, 2008,
respectively.
The
following table reflects the components of intangible assets as of
December 27, 2009 and December 28, 2008:
|
December
27, 2009
|
December
28, 2008
|
|||||
|
(dollar
amounts in thousands)
|
Amortizable
Life
(years)
|
Gross
Amount
|
Gross
Accumulated
Amortization
|
Gross
Amount
|
Gross
Accumulated
Amortization
|
|
|
Finite-lived
intangible assets:
|
||||||
|
Customer
lists
|
6
to 20
|
$ 82,504
|
$ 37,660
|
$ 81,037
|
$ 31,184
|
|
|
Trade
name
|
3
to 30
|
31,420
|
17,193
|
30,610
|
16,107
|
|
|
Patents,
license agreements
|
3
to 14
|
63,267
|
44,624
|
60,986
|
40,277
|
|
|
Other
|
3
to 6
|
10,704
|
5,832
|
9,700
|
3,140
|
|
|
Total
amortized finite-lived intangible assets
|
187,895
|
105,309
|
182,333
|
90,708
|
||
|
Indefinite-lived
intangible assets:
|
||||||
|
Trade
name
|
22,147
|
—
|
22,130
|
—
|
||
|
Total
identifiable intangible assets
|
$
210,042
|
$
105,309
|
$
204,463
|
$
90,708
|
||
We
recorded $12.5 million, $12.5 million, and $5.5 million of
amortization expense for 2009, 2008, and 2007, respectively.
During
our 2008 annual goodwill and indefinite-lived intangibles impairment test, we
determined our indefinite-lived trade mark intangible in our Shrink Management
Solutions segment was impaired. As a result we recorded an impairment charge of
$0.4 million in the fourth quarter of 2008. This charge was recorded in
asset impairments on the consolidated statement of operations.
As a
result of changes in business circumstances related to the customer list
intangible asset recognized in connection with the SIDEP/Asialco acquisition, we
recorded an impairment charge of $2.6 million in the fourth quarter ended
December 28, 2008. The impairment charge was recorded in asset impairments
in the Shrink Management Solutions segment on the consolidated statement of
operations.
Estimated
amortization expense for each of the five succeeding years is anticipated to
be:
(amounts in
thousands)
|
2010
|
$
12,066
|
|
2011
|
$
10,588
|
|
2012
|
$ 9,787
|
|
2013
|
$ 8,632
|
|
2014
|
$ 8,155
|
44
The
changes in the carrying amount of goodwill are as follows:
|
(dollar
amounts in thousands)
|
Shrink
Management
Solutions
|
Apparel
Labeling
Solutions
|
Retail
Merchandising
Solutions
|
Total
|
|
Balance
as of December 30, 2007
|
$ 191,575
|
$ 4,683
|
$ 78,343
|
$ 274,601
|
|
Acquired
during the year
|
24,130
|
—
|
—
|
24,130
|
|
Purchase
accounting adjustment
|
9,300
|
(174)
|
—
|
9,126
|
|
Impairment
losses
|
(48,219)
|
(3,550)
|
(7,813)
|
(59,582)
|
|
Translation
adjustments
|
(7,293)
|
(959)
|
(4,491)
|
(12,743)
|
|
Balance
as of December 28, 2008
|
169,493
|
—
|
66,039
|
235,532
|
|
Acquired
during the year
|
—
|
4,278
|
—
|
4,278
|
|
Purchase
accounting adjustment
|
283
|
—
|
—
|
283
|
|
Translation
adjustments
|
2,102
|
22
|
1,845
|
3,969
|
|
Balance
as of December 27, 2009
|
$ 171,878
|
$ 4,300
|
$ 67,884
|
$ 244,062
|
The
following table reflects the components of goodwill as of December 27, 2009 and
December 28, 2008:
(dollar
amounts in thousands)
|
December
27, 2009
|
December
28, 2008
|
||||||
|
Gross
Amount
|
Accumulated
Impairment
Losses
|
Goodwill,
net
|
Gross
Amount
|
Accumulated
Impairment
Losses
|
Goodwill,
net
|
||
|
Shrink
Management Solutions
|
$
229,062
|
$ 57,184
|
$
171,878
|
$
225,509
|
$ 56,016
|
$
169,493
|
|
|
Apparel
Labeling Solutions
|
24,052
|
19,752
|
4,300
|
19,387
|
19,387
|
—
|
|
|
Retail
Merchandising Solutions
|
139,859
|
71,975
|
67,884
|
135,973
|
69,934
|
66,039
|
|
|
Total
goodwill
|
$
392,973
|
$
148,911
|
$
244,062
|
$
380,869
|
$
145,337
|
$
235,532
|
|
During
fiscal 2009, 2008, and 2007 we made multiple acquisitions which impacted
goodwill and intangible assets. Please refer to Note 2 of these consolidated
financial statements for more information on these acquisitions and their
impact.
We
perform an assessment of goodwill by comparing each individual reporting unit’s
carrying amount of net assets, including goodwill, to their fair value at least
annually during the fourth quarter of each fiscal year and whenever events or
changes in circumstances indicate that the carrying value may not be
recoverable. In 2009 and 2007, annual assessments did not result in an
impairment charge.
During
the year ended December 28, 2008, the Company completed step one of its
fiscal 2008 annual analysis and test for impairment of goodwill and it was
determined that certain goodwill related to the Shrink Management Solutions,
Apparel Labeling Solutions and Retail Merchandising Solutions segments were
impaired. The second step of the goodwill impairment test was not completed
prior to the issuance of the fiscal 2008 financial statements. Therefore, the
Company recognized a charge of $59.6 million as a reasonable estimate of
the impairment loss in its fiscal 2008 financial statements. The impairment
charge was recorded in goodwill impairment on the consolidated statement of
operations. The impairment charge was attributed to a combination of a decline
in our market capitalization of the Company and a decline in the estimated
forecasted discounted cash flows expected by the Company.
During
the first quarter of fiscal 2009, the Company completed the second step of its
fiscal 2008 annual analysis and test for impairment of goodwill and it was
determined that no further adjustment to the estimated impairment recorded at
December 28, 2008 was needed.
Determining
the fair value of a reporting unit is a matter of judgment and often involves
the use of significant estimates and assumptions. The use of different
assumptions would increase or decrease estimated discounted future cash flows
and could increase or decrease an impairment charge. If the use of these assets
or the projections of future cash flows change in the future, we may be required
to record additional impairment charges. An erosion of future business results
in any of the business units could create impairment in goodwill or other
long-lived assets and require a significant charge in future
periods.
Note
6. SHORT-TERM BORROWINGS AND CURRENT PORTION OF LONG-TERM DEBT
Short-term
borrowings and current portion of long-term debt at December 27, 2009 and
at December 28, 2008 consisted of the following:
|
(dollar
amounts in thousands)
|
December
27,
2009
|
December
28,
2008
|
|
Lines
of credit with interest rates ranging from 1.46% to 2.04% (1)
|
$ 6,578
|
$ 7,707
|
|
Asialco
loans
|
3,660
|
3,645
|
|
Full-recourse
factoring liabilities
|
12,089
|
—
|
|
Term
loans
|
1,060
|
—
|
|
Current
portion of long-term debt
|
2,385
|
230
|
|
Total
short-term borrowings and current portion of long-term
debt
|
$
25,772
|
$
11,582
|
|
(1)
|
The
weighted average interest rate for 2009 was
1.75%.
|
In
October 2009, the Company entered into an $12.0 million (€8.0 million)
full-recourse factoring arrangement. The arrangement is secured by trade
receivables. Borrowings bear interest at rates of EURIBOR plus a margin of
3.00%. At December 27, 2009, the interest rate was 3.70%. As of
December 27, 2009, the factoring arrangement had a balance of $10.7 million
(€7.4 million) and was included in short-term borrowings in the accompanying
consolidated balance sheets since the agreement expires in October
2010.
In
connection with the acquisition of Brilliant, the Company assumed debt of $19.6
million. As of December 27, 2009, $4.1 million of this amount remained
outstanding. The short-term debt outstanding of $2.5 million includes accounts
receivable factoring arrangements and term loans.
Factoring Arrangements - The
variable interest rate full-recourse factoring arrangements of accounts
receivable have a maximum limit of $3.2 million (HKD 25.0 million) and totaled
$1.4 million (HKD 10.9 million) as of December 27, 2009. The arrangements are
secured by trade receivables as well as a fixed cash deposit of $0.6 million
(HKD 5.0 million). The arrangement bears interest of HKD Prime Rate + 1.00%. On
December 27, 2009, the interest rate was 6.00%. The secured cash deposit is
recorded within restricted cash in the accompanying consolidated balance
sheets.
Term Loans – The term loans
totaled $1.1 million (RMB 7.2 million) on December 27, 2009. The interest rates
range from 4.89% to 5.90%. The term loans mature at various times through July
2010. The term loans are collateralized by land and buildings with an
aggregate carrying value of $13.1 million as of December 27,
2009.
During
the second quarter of 2009, our outstanding Asialco loans were paid down and a
loan for $3.7 million (RMB25 million) was renewed in April 2009 for a
12 month period. As of December 27, 2009, our outstanding Asialco loan
balance is $3.7 million (RMB 25 million) and has a maturity date of
April 2010. The loan is included in short-term borrowings in the accompanying
consolidated balance sheets. The loan is collateralized by land and buildings
with an aggregate carrying value of $5.6 million as of December 27,
2009.
In August
2009, $8.5 million (¥800 million) was paid in order to extinguish our existing
Japanese local line of credit.
In
September 2009, we entered into a new Japanese local line of credit for $6.5
million (¥600 million). As of December 27, 2009, the Japanese local line of
credit is $6.6 million (¥600 million) and is fully drawn. The line of credit
matures in September 2010.
45
Note
7. LONG-TERM DEBT
Long-term
debt at December 27, 2009 and December 28, 2008 consisted of the
following:
|
(dollar
amounts in thousands)
|
December
27,
2009
|
December
28,
2008
|
|
Secured
credit facility:
|
||
|
$125 million
variable interest rate revolving credit facility maturing in
2012
|
$
86,745
|
$
—
|
|
Senior
unsecured credit facility:
|
||
|
$150 million
variable interest rate revolving credit facility maturing in
2010
|
—
|
133,596
|
|
Full-recourse
factoring liabilities
|
2,432
|
—
|
|
Other
capital leases with maturities through 2014
|
4,308
|
338
|
|
Total(1)
|
93,485
|
133,934
|
|
Less
current portion
|
2,385
|
230
|
|
Total
long-term portion
|
$
91,100
|
$
133,704
|
(1) The
weighted average interest rates for 2009 and 2008 were 4.6% and 3.0%,
respectively.
In
December 2009, we entered into new full-recourse factoring arrangements. The
arrangements are secured by trade receivables. The Company received a weighted
average of 92.4% of the face amount of receivables that it desired to sell and
the bank agreed, at its discretion, to buy. As of December 27, 2009, the
factoring arrangement had a balance of $2.4 million (€1.7 million), of which
$0.5 million (€0.4 million) was included in the current portion of long-term
debt and $1.9 million (€1.3 million) was included in long-term borrowings in the
accompanying consolidated balance sheets since the receivables are collectable
through 2016.
In
connection with the acquisition of Brilliant in August 2009, the Company assumed
$8.4 million (HKD 64.8 million) of capital leases. The capital leases mature at
various dates through July 2014. As of December 27, 2009, the capital lease
balance equals $1.6 million (HKD 12.3 million), of which $0.7 million (HKD 5.2
million) is included in current portion of long-term debt and $0.9 million (HKD
7.1 million) is included in long-term borrowings in the accompanying
consolidated balance sheets. As of December 27, 2009, the weighted
average interest rate was 3.7%.
During
the second quarter of 2009, we recorded a $2.6 million capital lease related to
the purchase of software.
On
April 30, 2009, we entered into a new $125.0 million three-year senior
secured multi-currency revolving credit agreement (“Secured Credit Facility”)
with a syndicate of lenders. The Secured Credit Facility replaces the
$150.0 million senior unsecured multi-currency credit facility (“Senior
Unsecured Credit Facility”) arranged in December 2005. Prior to entering
into the Secured Credit Facility, $23.0 million of the Senior Unsecured Credit
Facility was paid down during the second quarter of 2009.
The
Secured Credit Facility also includes an expansion option that gives us the
right to increase the aggregate revolving commitment by an amount up to
$50 million, for a potential total commitment of $175 million. The
expansion option allows the additional $50 million in increments of $25 million
based upon consolidated earnings before interest, taxes, and depreciation and
amortization (EBITDA) on June 28, 2009 and December 27, 2009, respectively.
Based on our consolidated EBITDA at December 27, 2009, we qualified to request
the $50 million expansion option for a total potential commitment of $175
million. We did not elect to request the $50 million expansion option at
December 27, 2009.
The
Secured Credit Facility contains a $25.0 million sublimit for the issuance
of letters of credit, of which $1.4 million are outstanding as of
December 27, 2009. The Secured Credit Facility also contains a
$15.0 million sublimit for swingline loans. Borrowings under the Secured
Credit Facility bear interest at rates of LIBOR plus an applicable margin
ranging from 2.50% to 3.75% and/or prime plus 1.50% to 2.75%. The interest rate
matrix is based on our leverage ratio of consolidated funded debt to EBITDA, as
defined by the Secured Credit Facility Agreement (“Facility Agreement”). Under
the Facility Agreement, we pay an unused line fee ranging from 0.30% to 0.75%
per annum on the unused portion of the commitment.
All
obligations of domestic borrowers under the Secured Credit Facility are
irrevocably and unconditionally guaranteed on a joint and several basis by our
domestic subsidiaries. Foreign borrowers under the Secured Credit Facility are
irrevocably and unconditionally guaranteed on a joint and several basis by
certain of our foreign subsidiaries as well as the domestic guarantors.
Collateral under the Secured Credit Facility includes a 100% stock pledge of
domestic subsidiaries, stock powers of first-tier foreign subsidiaries, a
blanket lien on all U.S. assets excluding real estate, a guarantee of foreign
obligations and a 65% stock pledge of material foreign subsidiaries, a lien on
certain assets of our German and Hong Kong subsidiaries, and assignment of
certain bank deposit accounts. The approximate net book value of the collateral
as of December 27, 2009 is $242 million.
The
Secured Credit Facility contains covenants that include requirements for a
maximum debt to EBITDA ratio of 2.75, a minimum fixed charge coverage ratio of
1.25 as well as other affirmative and negative covenants. As of
December 27, 2009, we were in compliance with all covenants.
As of December 27, 2009, the
Company incurred $4.0 million in fees and expenses in connection with the
Secured Credit Facility, which are amortized over the term of the Secured Credit
Facility to interest expense on the consolidated statement of operations. An
immaterial amount of remaining unamortized debt issuance costs recognized in
connection with the Senior Unsecured Credit Facility was recognized in other
gain (loss) on the consolidated statement of operations in the second quarter of
fiscal 2009.
The
aggregate maturities on all long-term debt (including current portion)
are:
|
(dollar
amounts in thousands)
|
Debt
|
Capital
Leases
|
Total
Debt
|
|
2010
|
$ 557
|
$
1,828
|
$ 2,385
|
|
2011
|
441
|
1,808
|
2,249
|
|
2012
|
87,122
|
571
|
87,693
|
|
2013
|
378
|
73
|
451
|
|
2014
|
344
|
28
|
372
|
|
Thereafter
|
335
|
—
|
335
|
|
Total
|
$
89,177
|
$
4,308
|
$
93,485
|
Note
8. STOCK-BASED COMPENSATION
At
December 27, 2009, we had stock-based employee compensation plans as
described below. For the years ended December 27, 2009, December 28,
2008, and December 30, 2007, the total compensation expense (included in
selling general, and administrative expense) related to these plans was $7.1
million, $7.1 million, and $6.5 million ($5.0 million,
$4.9 million, and $4.6 million, net of tax),
respectively.
On
December 27, 2007, there was a change of our President and CEO. As a result
of this management transition and in accordance with the former CEO’s contract,
we recorded a one-time charge of $1.4 million ($1.0 million, net of tax)
related to stock compensation costs associated with the former CEO. This charge
was recorded in the fourth quarter of 2007.
In 2006,
we changed the method in which we issue share-based awards to our key employees.
In prior years, share-based compensation for key employees consisted primarily
of stock options. Upon consideration of several factors, we began in 2006 to
award key employees a combination of stock options and restricted stock units.
Therefore, this change resulted in an increase in stock-based compensation from
restricted stock units.
46
Stock
Plans
On
April 29, 2004, the shareholders approved the Checkpoint Systems, Inc. 2004
Omnibus Incentive Compensation Plan (2004 Plan). The initial shares available
under the 2004 Plan were approximately 3,500,000, which represent the shares
that were available at that time under the 1992 Stock Option Plan (1992 Plan).
All cancellations and forfeitures related to share units outstanding under the
1992 Plan will be added back to the shares available for grant under the 2004
Plan. No further awards will be issued under the 1992 Plan. The 2004 Plan is
designed to provide incentives to employees, non-employee directors, and
independent contractors through the award of stock options, stock appreciation
rights, stock units, phantom shares, dividend equivalent rights and cash awards.
The Compensation Committee (Committee) of our Board of Directors administers the
2004 Plan and determines the terms and conditions of each award. Stock options
issued under the 2004 Plan primarily vest over a three-year period and expire
not more than 10 years from date of grant. Restricted stock units vest over
three to five year periods from date of grant. On June 3, 2009, at the 2009
Annual Meeting of Shareholders of Checkpoint Systems, Inc., the shareholders of
the Company approved the Checkpoint Systems, Inc. Amended and Restated 2004
Omnibus Incentive Compensation Plan, Effective Date: February 17, 2009 (the
“Omnibus Incentive Plan”), which was amended and restated to extend the term of
the Omnibus Incentive Plan by an additional five years and to re-approve the
performance goals set forth under the Omnibus Incentive Plan. As of
December 27, 2009, there were 1,012,994 shares available for grant under
the 2004 plan.
Our 1992
Stock Option Plan (1992 Plan) allowed us to grant either Incentive Stock Options
(ISOs) or Non-Incentive Stock Options (NSOs) to purchase up to 16,000,000 shares
of common stock. Only employees were eligible to receive ISOs and both employees
and non-employee directors of the Company were eligible to receive NSOs. On
February 17, 2004, the Plan was amended to allow an independent consultant
to receive NSOs. All ISOs under the 1992 Plan expire not more than ten years
(plus six months in the case of NSOs) from the date of grant. Both ISOs and NSOs
require a purchase price of not less than 100% of the fair market value of the
stock at the date of grant. As of December 27, 2009, there were no shares
available for grant under the 1992 Plan.
On
December 27, 2007, we adopted a stand alone inducement stock option plan
authorizing the issuance of options to purchase up to 270,000 shares of our
common stock, which were granted to the newly elected President and CEO of the
Company in connection with his hire. The non-qualified stock options provide for
three vesting instances: 60% on December 31, 2010; 20% on December 31,
2011; and 20% on December 31, 2012. The options also have a market
condition. The market condition specifies that any unvested tranche will vest
immediately as soon as the Company’s stock price exceeds 200% of the
December 27, 2007, strike price of $22.71. In addition, there were 230,000
shares issued out of our Omnibus Incentive Compensation Plan with similar
vesting and market based criteria as described above.
To
determine the fair value of stock options with market conditions we used the
Monte Carlo simulation lattice model using the following assumptions:
(i) expected volatility of 37.04%, (ii) risk-free rate of 4.1%,
(iii) expected term of 10 years, and (iv) an expected dividend
yield of zero. The weighted average fair value of the stock options with market
conditions was $12.43 per share.
During
fiscal 2005, we initiated a Long-Term Incentive Plan (LTIP). Under this plan,
restricted stock units (RSUs) were awarded to eligible executives. The number of
shares for these units varies based on the Company’s operating income and
operating margin. These units cliff vest at the end of fiscal 2007. At
December 30, 2007, the Company did not achieve the operating margin
required by the plan and as a result no RSUs were earned under this plan. During
2007, $0.4 million of previously recognized compensation cost was reversed
related to the 2005 LTIP.
During
fiscal 2006, we expanded the scope of the LTIP. Under the expanded plan, RSUs
were awarded to eligible key employees. The number of shares for these units
varies based on the Company’s cash flow. These units cliff vest at the end of
fiscal 2008. During fiscal 2007, 34,996 units vested at a grant price of $28.89
per share in accordance with the former CEO’s retirement plan. At December 28,
2008, the Company did not achieve the cash flow targets required by the plan and
as a result no remaining RSUs were earned under this plan. During fiscal 2008,
$2.0 million of previously recognized compensation cost was reversed
related to the 2006 LTIP.
The LTIP
plan was further expanded during fiscal 2007. Under the 2007 LTIP plan, RSUs
were awarded to eligible key employees. The number of shares for these units
varies based on the Company’s revenue and earnings per share. These units cliff
vest at the end of fiscal 2009. As of December 30, 2007, 20,000 units vested at
a grant price of $23.91 per share in accordance with the former CEO’s retirement
plan. At December 28, 2008, we reversed $1.7 million of previously
recognized compensation cost since it was determined that the Company would not
achieve the revenue and earnings per share targets set for in the 2007 LTIP plan
during fiscal 2009. At December 27, 2009, the Company did not achieve the
targets required by the plan and as a result no remaining RSUs were earned under
this plan.
On
December 4, 2007, RSUs were awarded to certain key employees of the
Company’s Alpha Security Products Division as part of the LTIP plan. The number
of shares for these units varies based on the Company’s Alpha product revenues.
These units have the potential to vest 33% per year, over a three-year period
ending at the end of fiscal 2010. The final value of these units will be
determined by the number of shares earned. The value of these units is charged
to compensation expense on a straight-line basis over the vesting period with
periodic adjustments to account for changes in anticipated award amounts and
estimated forfeitures rates. The weighted average price for these RSUs was
$21.84 per share. For fiscal year 2009, $0.1 million was charged to
compensation expense. As of December 27, 2009, total unamortized
compensation expense for this grant was $0.2 million. As of December 27,
2009, the maximum achievable RSUs outstanding under this plan are 53,200 units.
These RSUs reduce the shares available to grant under the 2004
Plan.
On
February 17, 2009, RSUs were awarded to certain key employees of the
Company as part of the LTIP 2009 plan. The number of shares for these units
varies based on the Company achieving specific relative performance goals versus
a pool of peer companies during the January 2009 to December 2011 performance
period. The final value of these units will be determined by the number of
shares earned. The value of these units is charged to compensation expense on a
straight-line basis over the vesting period with periodic adjustments to account
for changes in anticipated award amounts and estimated forfeitures rates. The
weighted average price for these RSUs was $8.12 per share. For fiscal year 2009,
$0.2 million was charged to compensation expense. As of December 27,
2009, total unamortized compensation expense for this grant was $0.5 million. As
of December 27, 2009, the maximum achievable RSUs outstanding under this
plan are 199,020 units. These RSUs reduce the shares available to grant under
the 2004 Plan.
Stock
Options
Option
activity under the principal option plans as of December 27, 2009 and
changes during the year then ended were as follows:
|
Shares
|
Weighted-
Average
Exercise
Price
|
Weighted-
Average
Remaining
Contractual
Term
(in
years)
|
Aggregate
Intrinsic
Value
(in
thousands)
|
|
|
Outstanding
at December 28, 2008
|
2,880,326
|
$
18.85
|
6.42
|
$ 25
|
|
Granted
|
253,102
|
8.89
|
||
|
Exercised
|
(3,495)
|
11.04
|
||
|
Forfeited
or expired
|
(82,036)
|
17.48
|
||
|
Outstanding
at December 27, 2009
|
3,047,897
|
18.07
|
5.69
|
4,420
|
|
Vested
and expected to vest at December 27, 2009
|
2,891,931
|
18.07
|
5.55
|
4,090
|
|
Exercisable
at December 27, 2009
|
2,026,252
|
$
17.45
|
4.38
|
$
2,729
|
The
aggregate intrinsic value in the table above represents the total pretax
intrinsic value (the difference between the Company’s closing stock price on the
last trading day of fiscal 2009 and the exercise price, multiplied by the number
of in-the-money options) that would have been received by the option holders had
all option holders exercised their options on December 27, 2009. This
amount changes based on the fair market value of the Company’s stock. The total
intrinsic value of options exercised for the years ended December 27, 2009,
December 28, 2008, and December 30, 2007, was $19 thousand,
$8.2 million, and $3.1 million, respectively.
47
As of
December 27 2009 $3.0 million of total unrecognized compensation cost
related to stock options is expected to be recognized over a weighted-average
period of 1.7 years.
Tax
benefits resulting from tax deductions in excess of the compensation cost
recognized for those options are classified as financing cash flows. Cash
received from option exercises and purchases under the ESPP for the year ended
December 27 2009 was $0.8 million. The actual tax benefit realized for the
tax deduction from option exercises of the share-based payment units totaled
$0.4 million and $3.1million for the fiscal years ended December 27,
2009 and December 28, 2008. We have applied the “Short-cut” method in
calculating the historical windfall tax benefits. All tax short falls will be
applied against this windfall before being charged to earnings.
Restricted
Stock Units
In 2007,
2008, and 2009 we issued service-based restricted stock units with vesting
periods of three to five years. These awards are valued using their intrinsic
value on the date of grant. The compensation expense is recognized straight-line
over the vesting term.
Nonvested
service-based restricted stock units as of December 27, 2009 and changes
during the year ended December 27, 2009 were as follows:
|
Shares
|
Weighted-
Average
Vest
Date
(in
years)
|
Weighted-
Average
Grant
Date
Fair
Value
|
|
|
Nonvested
at December 28, 2008
|
552,985
|
1.34
|
$
36.45
|
|
Granted
|
204,863
|
—
|
10.29
|
|
Vested
|
(129,986)
|
—
|
11.71
|
|
Forfeited
|
(13,898)
|
—
|
21.78
|
|
Nonvested
at December 27, 2009
|
613,964
|
1.07
|
$
39.24
|
|
Vested
and expected to vest at December 27, 2009
|
530,874
|
0.95
|
|
|
Vested
at December 27, 2009
|
53,020
|
—
|
The total
fair value of restricted stock awards vested during 2009 was $1.5 million
as compared to $1.9 million during 2008. As of December 27, 2009,
there was $2.8 million unrecognized stock-based compensation expense
related to nonvested restricted stock units. That cost is expected to be
recognized over a weighted-average period of 1.6 years.
Note
9. SUPPLEMENTAL CASH FLOW INFORMATION
Cash
payments in 2009, 2008, and 2007, included payments for interest of
$6.3 million, $5.2 million, and $2.1 million, and income taxes of
$8.7 million, $17.0 million, and $18.7 million,
respectively.
Non-cash
investing and financing activities are excluded from the Consolidated Statement
of Cash Flows. During the third quarter of 2009 we transferred $5.6 million (HKD
43.0 million) of acquired Brilliant properties and relieved the associated
liability to the former Brilliant owner. This transaction was a
non-cash transaction and is excluded from our Consolidated Statement of Cash
Flows as of December 27, 2009.
Excluded
from the Consolidated Statement of Cash Flows for the year ended December 27,
2009 is a $2.5 million capital lease liability and the related capitalized
asset.
Business
Acquisitions
|
(dollar
amounts in thousands)
|
December
27,
2009
|
December
28,
2008
|
December
30,
2007
|
|
Fair
value of tangible assets acquired, less cash acquired
|
$ 52,275
|
$ 12,492
|
$ 45,883
|
|
Goodwill
and identified intangible assets
|
5,929
|
44,246
|
155,239
|
|
Liabilities
assumed
|
(32,669)
|
(17,109)
|
(31,600)
|
|
Borrowings
to fund acquisition
|
—
|
—
|
(75,000)
|
|
Cash
paid for acquisitions
|
$ 25,535
|
$ 39,629
|
$ 94,522
|
Note
10. STOCKHOLDERS’ EQUITY
In
October 2006, our Board of Directors approved a share repurchase program
that allowed for the purchase of up to 2 million shares of the Company’s
common stock. During the first six months of 2008, the Company repurchased
2 million shares of its common stock at an average cost of $25.42, spending
a total of $50.9 million. This completed the repurchase of shares under the
Company’s repurchase authorization that was put in place during the fourth
quarter of 2006. Common stock obtained by the Company through the repurchase
program has been added to our treasury stock holdings.
In
March 1997, our Board of Directors adopted a new Shareholder’s Rights Plan
(1997 Plan). The Rights under the 1997 Plan attached to the common shares of the
Company as of March 24, 1997. The Rights are designed to ensure all Company
shareholders fair and equal treatment in the event of a proposed takeover of the
Company, and to guard against partial tender offers and other abusive tactics to
gain control of the Company without paying all shareholders a fair
price.
The
Rights are exercisable only as a result of certain actions of an acquiring
person. Initially, upon payment of the exercise price (currently $100.00), each
Right will be exercisable for one share of common stock. Upon the occurrence of
certain events each Right will entitle its holder (other than the acquiring
person) to purchase a number of our or an acquiring person’s common shares
having a market value of twice the Right’s exercise price. The Rights expire on
March 10, 2017.
The
components of accumulated other comprehensive income at December 27, 2009
and at December 28, 2008 are as follows:
|
(dollar
amounts in thousands)
|
2009
|
2008
|
|
Actuarial
losses on pension plans, net of tax
|
$ (844)
|
$
(2,862)
|
|
Derivative
hedge contracts, net of tax
|
(302)
|
880
|
|
Foreign
currency translation adjustment
|
29,749
|
18,132
|
|
Total
|
$
28,603
|
$ 16,150
|
48
Note
11. EARNINGS PER SHARE
For
fiscal years 2009, 2008, and 2007, basic earnings per share are based on net
earnings divided by the weighted average number of shares outstanding during the
period. The following data shows the amounts used in computing earnings per
share and the effect on net earnings from continuing operations and the weighted
average number of shares of dilutive potential common stock:
|
(amounts
in thousands, except per share data)
|
December
27,
2009
|
December
28,
2008
|
December
30,
2007
|
|
Basic
earnings (loss) attributable to Checkpoint Systems, Inc. available to
common stockholders from continuing operations
|
$
26,142
|
$
(29,805)
|
$
58,409
|
|
Diluted
earnings (loss) attributable to Checkpoint Systems, Inc. available to
common stockholders from continuing operations
|
$
26,142
|
$
(29,805)
|
$
58,409
|
|
Shares:
|
|||
|
Weighted
average number of common shares outstanding
|
38,909
|
39,071
|
39,550
|
|
Shares
issuable under deferred compensation agreements
|
396
|
337
|
311
|
|
Basic
weighted average number of common shares outstanding
|
39,305
|
39,408
|
39,861
|
|
Common
shares assumed upon exercise of stock options and awards
|
234
|
—
|
853
|
|
Shares
issuable under deferred compensation arrangements
|
13
|
—
|
10
|
|
Dilutive
weighted average number of common shares outstanding
|
39,552
|
39,408
|
40,724
|
|
Basic
Earnings (Loss) Attributable to Checkpoint Systems, Inc. per
Share:
|
|||
|
Earnings
(loss) from continuing operations
|
$ .67
|
$ (.76)
|
$ 1.46
|
|
Earnings
from discontinued operations, net of tax
|
—
|
—
|
.01
|
|
Basic
earnings (loss) attributable to Checkpoint Systems, Inc. per
share
|
$ .67
|
$ (.76)
|
$ 1.47
|
|
Diluted
Earnings (Loss) Attributable to Checkpoint Systems, Inc. per
Share:
|
|||
|
Earnings
(loss) from continuing operations
|
$ .66
|
$ (.76)
|
$ 1.43
|
|
Earnings
from discontinued operations, net of tax
|
—
|
—
|
.01
|
|
Diluted
earnings (loss) attributable to Checkpoint Systems, Inc. per
share
|
$ .66
|
$ (.76)
|
$ 1.44
|
Anti-dilutive
potential common shares are not included in our earnings per share calculation.
The Long-term Incentive Plan restricted stock units were excluded from our
calculation due to the performance of vesting criteria not being
met.
The
number of anti-dilutive common share equivalents for the years ended
December 27, 2009, December 28, 2008, and December 30, 2007 were
as follows:
|
(share
amounts in thousands)
|
December
27,
2009
|
December
28,
2008
|
December
30,
2007
|
|
Weighted
average common share equivalents associated with anti-dilutive stock
options and restricted stock units excluded from the computation of
diluted EPS(1):
|
2,507
|
2,151
|
524
|
|
(1)
|
Adjustments
for stock options and awards of 518 shares and deferred compensation
arrangements of 22 shares were anti-dilutive in fiscal 2008 and therefore
excluded from the earnings per share calculation due to our net loss for
the year.
|
Note
12. DISCONTINUED OPERATIONS
On
January 30, 2006, the Company completed the sale of its global barcode
businesses included in our Intelligent Labels segment, and the U.S. hand-held
labeling and Turn-O-Matic®
businesses included in the Shrink Management Solutions segment for cash proceeds
of $37 million, plus the assumption of $5 million in liabilities. The
Company recorded a pre-tax gain of $2.8 million ($1.3 million, net of tax),
included in discontinued operations, net of tax in the consolidated statement of
operations. During fiscal 2007, the post closing adjustments were finalized and
an additional gain of $0.4 million, net of tax, was recorded in
discontinued operations.
Note
13. INCOME TAXES
The
domestic and foreign components of earnings from continuing operations before
income taxes and minority interest are:
|
(dollar
amounts in thousands)
|
2009
|
2008
|
2007
|
|
Domestic
|
$
(20,473)
|
$
(16,448)
|
$ 4,730
|
|
Foreign
|
56,458
|
(12,761)
|
65,846
|
|
Total
|
$ 35,985
|
$
(29,209)
|
$
70,576
|
Provision
for income taxes — continuing operations:
|
(dollar
amounts in thousands)
|
2009
|
2008
|
2007
|
|
Currently
payable
|
|||
|
Federal
|
$ (2,565)
|
$ 36
|
$ (1,240)
|
|
State
|
(41)
|
12
|
981
|
|
Puerto
Rico
|
45
|
243
|
1,058
|
|
Foreign
|
20,555
|
11,826
|
18,255
|
|
Total
currently payable
|
17,994
|
12,117
|
19,054
|
|
Deferred
|
|||
|
Federal
|
(9,042)
|
(4,259)
|
(80)
|
|
State
|
(1,050)
|
902
|
(5,493)
|
|
Puerto
Rico
|
540
|
12
|
(9)
|
|
Foreign
|
1,848
|
(8,053)
|
(1,298)
|
|
Total
deferred
|
(7,704)
|
(11,398)
|
(6,880)
|
|
Total
provision
|
$ 10,290
|
$ 719
|
$ 12,174
|
49
Deferred
tax assets/liabilities at December 27, 2009 and December 28, 2008
consist of:
|
(dollar
amounts in thousands)
|
December
27,
2009
|
December
28,
2008
|
|
Inventory
|
$ 4,613
|
$ 6,650
|
|
Accounts
receivable
|
2,449
|
2,158
|
|
Capitalized
research and development costs
|
9,265
|
3,161
|
|
Net
operating loss and foreign tax credit carryforwards
|
59,770
|
53,635
|
|
Restructuring
|
788
|
31
|
|
Deferred
revenue
|
686
|
1,345
|
|
Pension
|
5,957
|
6,555
|
|
Warranty
|
1,381
|
2,171
|
|
Deferred
compensation
|
3,483
|
1,712
|
|
Stock
based compensation
|
5,064
|
3,885
|
|
Valuation
allowance
|
(32,739)
|
(22,717)
|
|
Deferred
tax assets
|
60,717
|
58,586
|
|
Depreciation
|
(753)
|
(28)
|
|
Intangibles
|
10,978
|
10,993
|
|
Other
|
(3,058)
|
(1,095)
|
|
Withholding
tax liabilities
|
945
|
945
|
|
Deferred
tax liabilities
|
8,112
|
10,815
|
|
Net
deferred tax assets
|
$ 52,605
|
$ 47,771
|
At
December 27, 2009, the net deferred tax asset related to net operating loss
carryforwards is $17.9 million, detailed as follows:
|
Expiration
|
Federal
|
State
|
International
|
Total
|
|
2009
— 2016
|
$ —
|
$ 3,100
|
$ 2,752
|
$ 5,852
|
|
2017
— 2023
|
—
|
2,444
|
2,130
|
4,574
|
|
2024
— 2029
|
6,868
|
1,675
|
—
|
8,543
|
|
Indefinite
life
|
—
|
—
|
28,375
|
28,375
|
|
Deferred
tax asset
|
6,868
|
7,219
|
33,257
|
47,344
|
|
Valuation
allowance
|
—
|
(5,199)
|
(24,214)
|
(29,413)
|
|
Net
deferred position
|
$
6,868
|
$ 2,020
|
$ 9,043
|
$ 17,931
|
In
accordance with ASC 740, “Accounting for Income Taxes”, we evaluate our deferred
income taxes quarterly to determine if valuation allowances are required or
should be adjusted. ASC 740 requires that companies assess whether valuation
allowances should be established against their deferred tax assets based on all
available evidence, both positive and negative, using a “more likely than not”
standard. The amount of the deferred tax asset considered realizable
could change in the near term if our estimates of future taxable income during
the various carryforward periods change.
During
the third quarter of 2009, we recorded a charge of $3.6 million related to
establishing full valuation allowances against net deferred tax assets in Italy
and Japan. During the fourth quarter of 2009, we recorded a charge of $2.0
million in connection with state net operating losses, of which $0.3 million was
related to activity in 2009. Concluding that a valuation allowance is not
required is difficult when there is significant negative evidence which is
objective and verifiable, such as cumulative losses in recent years. Thus,
we concluded that our ability to rely on future income projections was limited
due to uncertainty created by cumulative losses in recent years for these
jurisdictions.
We have
U.S. foreign tax credit carryforwards of $11.5 million with expiration
dates ranging from 2012 to 2019. Realization is dependent on generating
sufficient taxable income prior to expiration of the foreign tax credit and loss
carryforwards. Although realization is not assured, management believes it is
more likely than not that the net deferred position will be
realized.
In June
2008, the Company purchased the stock of OATSystems, Inc. Upon finalizing
purchase accounting in 2009, we established an opening net deferred tax asset of
$8.2 million of which $7.7 million relates to a federal net operating loss
carryforward. The federal net operating loss carryforward is subject to IRC §
382 limitations, however we feel that it is more likely than not the loss will
be utilized in the carryforward period. In addition, OATSystems has a deferred
tax asset of $1.5 million related to state net operating loss carryforwards on
which a full valuation allowance has been provided.
In July
2009, the Company purchased the stock of Brilliant Label Manufacturing Ltd., a
China-based manufacturer of paper, fabric and woven tags and
labels. As of December 27, 2009, we have established a preliminary
opening net deferred tax liability of $3.7 million. In addition, we
have established $2.6 million of income tax liabilities under ASC 740-10-50
related to uncertain tax positions for Brilliant in pre-acquisition tax
years. The purchase accounting for Brilliant will be finalized in
2010.
At
December 27, 2009, unremitted earnings of subsidiaries outside the United
States totaling $64.0 million were deemed to be permanently reinvested. No
deferred tax liability has been recognized with regards to the remittance of
such earnings. It is not practical to estimate the income tax liability that
might be incurred if such earnings were remitted to the United
States.
In 2007,
we recorded an adjustment of $2.1 million to reduce deferred income tax
expense, and increase earnings from continuing operations and net earnings. We
have determined that this adjustment related to errors made in prior years
associated with the impact of changes in statutory rates on deferred taxes. Had
these errors been recorded in the proper periods, earnings from continuing
operations and net earnings as reported would increase by $0.2 million in
2006 and increase by $1.9 million for years prior to 2005. We have
determined that these adjustments did not have a material effect on the 2007 and
prior years’ financial statements. Without the reduction to our income tax
provision our 2007 effective rate would have been 20.3% rather than
17.2%.
A
reconciliation of the tax provision at the statutory U.S. Federal income tax
rate with the tax provision at the effective income tax rate
follows:
|
(dollar
amounts in thousands)
|
2009
|
2008
|
2007
|
|
Tax
provision at the statutory Federal income tax rate
|
$
12,595
|
$
(10,222)
|
$ 24,702
|
|
Non-deductible
goodwill
|
—
|
20,994
|
—
|
|
Non-deductible
permanent items
|
1,302
|
1,258
|
(165)
|
|
State
and local income taxes, net of Federal benefit
|
(1,077)
|
207
|
634
|
|
Foreign
losses for which no tax benefit recognized
|
4,104
|
3,122
|
1,348
|
|
Foreign
rate differentials
|
(9,346)
|
(13,356)
|
(12,028)
|
|
Tax
settlements
|
(20)
|
730
|
—
|
|
Potential
tax contingencies
|
(72)
|
1,214
|
1,984
|
|
Change
in valuation allowance
|
3,515
|
(3,574)
|
(4,527)
|
|
Stock
based compensation
|
349
|
365
|
384
|
|
Other
|
(1,060)
|
(19)
|
(158)
|
|
Tax
provision at the effective tax rate
|
$ 10,290
|
$ 719
|
$ 12,174
|
50
A
reconciliation of the beginning and ending amount of unrecognized tax benefits
is as follows:
|
(dollar
amounts in thousands)
|
December
27,
2009
|
December
28,
2008
|
December
30,
2007
|
|
Gross
unrecognized tax benefits at beginning of year
|
$ 12,520
|
$
12,714
|
$
10,197
|
|
Increases
in tax positions for prior years
|
2,502
|
—
|
384
|
|
Decreases
in tax positions for prior years
|
(1,684)
|
(966)
|
—
|
|
Increases
in tax positions for current year
|
1,442
|
1,843
|
1,128
|
|
Settlements
|
—
|
(965)
|
—
|
|
Acquisition
reserves
|
2,631
|
—
|
1,063
|
|
Lapse
in statute of limitations
|
(2,527)
|
(106)
|
(58)
|
|
Gross
unrecognized tax benefits at end of year
|
$ 14,884
|
$
12,520
|
$
12,714
|
We
adopted the provisions for accounting for uncertainty in income taxes on
January 1, 2007. As a result of adoption, we recognized a charge of
$1.7 million to the January 1, 2007, retained earnings opening
balance. The total amount of gross unrecognized tax benefits that, if
recognized, would affect the effective tax rate was $14.9 million and $12.5
million at December 27, 2009 and December 28, 2008,
respectively. Penalties and tax-related interest expense are reported
as a component of income tax expense. During fiscal years ending 2009, 2008 and
2007, we recognized interest and penalties of $0.4 million, $0.8 million,
and $0.6 million, respectively in the statement of operations. At
December 27, 2009 and December 28, 2008, the Company has accrued interest
and penalties related to unrecognized tax benefits of $6.4 million and $6.1
million, respectively.
We file
income tax returns in the U.S. and in various states, local and foreign
jurisdictions. We are routinely examined by tax authorities in these
jurisdictions. It is possible that these examinations may be resolved within
twelve months. Due to the potential for resolution of Federal, state and foreign
examinations, and the expiration of various statutes of limitation, it is
reasonably possible that the gross unrecognized tax benefits balance may change
within the next twelve months by a range of $5.3 million to
$8.2 million.
We are
currently under audit in the following major jurisdictions: United States 2005 –
2006, Germany 2002 – 2005, Sweden 2007-2008, and the United Kingdom 2005 –
2008.
Note
14. EMPLOYEE BENEFIT PLANS
Under our
defined contribution savings plans, eligible employees may make basic (up to 6%
of an employee’s earnings) and supplemental contributions. We match in cash 50%
of the participant’s basic contributions. Company contributions vest to
participants in increasing percentages over one to five years of service. Our
contributions under the plans approximated $1.1 million, $1.2 million, and
$1.0 million, in 2009, 2008, and 2007, respectively.
Generally,
all employees in the U.S. may participate in our U.S. Savings Plan. All
full-time employees of the Puerto Rico subsidiary who have completed three
months of service may participate in our Puerto Rico Savings Plan.
During
fiscal 2005, we initiated a 423(b) Employee Stock Purchase Plan (ESPP), which
was adopted by the shareholders at the Annual Shareholder Meeting on
April 29, 2004. This plan replaces the non-qualified Employee Stock
Purchase Plan. Under the provisions of the 423(b) plan, eligible employees may
contribute from 1% to 25% of their base compensation to purchase shares of our
common stock at 85 percent of the fair market value on the offering date or
the exercise date of the offering period, whichever is lower.
On June
3, 2009, at the 2009 Annual Meeting of Shareholders of Checkpoint, our
shareholders amended the ESPP in order to increase the number of shares of the
Company’s common stock reserved for issuance under the ESPP by 400,000 shares to
an aggregate of 650,000 shares. Our expense for this plan in fiscal 2009, 2008
and 2007 was $0.6 million, $0.4 million, and $0.2 million,
respectively. As of December 27, 2009, there were 343,251 shares authorized
and available to be issued. During fiscal year 2009, 132,165 shares were issued
under this plan as compared to 51,315 shares in 2008 and 52,352 shares in
2007.
We
maintain deferred compensation plans for executives and non-employee directors.
The executive deferred compensation plan allows certain executives to defer
portions of their salary and bonus (up to 50% and 100%, respectively) into a
deferred stock account. All deferrals in this plan are matched 25% by the
Company. The match vests in thirds at each calendar year end for three years
following the match. For executives over the age of 55 years old, the
matching contribution vests immediately. The settlement of this deferred stock
account is required by the plan to be made only in Company common stock. The
deferral shares held in the deferred compensation plan are considered
outstanding for purposes of calculating basic and diluted earnings per share.
The unvested match is considered in the calculation of diluted earnings per
share. Our match into the deferred stock account under the executive plan for
fiscal years 2009, 2008, and 2007 were approximately $0.3 million,
$0.3 million, and $0.4 million, respectively. The match will be
expensed ratably over a three year vesting period for executives under
55 years old and immediate for those older than 55 years.
The
director deferred compensation plan allows non-employee directors to defer their
compensation into a deferred stock account. All deferrals in this plan are
matched 25% by the Company. The match vests immediately. The settlement of this
deferred stock account is required by the plan to be made only in Company common
stock. The deferral shares held in the deferred compensation plan are considered
outstanding for purposes of calculating basic and diluted earnings per share.
Our match into the deferred stock account under the director’s plan approximated
$0.1 million for fiscal years 2009, 2008, and 2007,
respectively.
Pension
Plans
We
maintain several defined benefit pension plans, principally in Europe. The plans
covered approximately 7% of the total workforce at December 27, 2009. The
benefits accrue according to the length of service, age, and remuneration of the
employee. We recognize the funded status of our defined benefit postretirement
plans in the Company’s statement of financial position.
The
amounts recognized in accumulated other comprehensive income at
December 27, 2009, and December 28, 2008, consist of:
|
(dollar
amounts in thousands)
|
December
27,
2009
|
December
28,
2008
|
|
Transition
obligation
|
$ 351
|
$ 473
|
|
Prior
service costs
|
21
|
23
|
|
Actuarial
losses
|
2,806
|
5,441
|
|
Total
|
3,178
|
5,937
|
|
Deferred
tax
|
(2,334)
|
(3,075)
|
|
Net
|
$ 844
|
$ 2,862
|
The
amounts included in accumulated other comprehensive income at December 27,
2009 and expected to be recognized in net periodic pension cost during the year
ended December 26, 2010 is as follows:
|
(dollar
amounts in thousands)
|
December
26,
2010
|
|
Transition
obligation
|
$ 134
|
|
Prior
service costs
|
3
|
|
Actuarial
gain
|
(26)
|
|
Total
|
$ 111
|
The
Company expects to make contributions of $5.2 million during the year ended
December 26, 2010.
51
The
pension plans included the following net cost components:
|
(dollar
amounts in thousands)
|
2009
|
2008
|
2007
|
|
Service
cost
|
$
1,020
|
$
1,088
|
$ 1,420
|
|
Interest
cost
|
4,643
|
4,623
|
4,094
|
|
Expected
return on plan assets
|
(67)
|
(72)
|
(144)
|
|
Amortization
of actuarial (gain) loss
|
(10)
|
(44)
|
477
|
|
Amortization
of transition obligation
|
130
|
137
|
128
|
|
Amortization
of prior service costs
|
3
|
2
|
2
|
|
Net
periodic pension cost
|
5,719
|
5,734
|
5,977
|
|
Settlement
gain
|
—
|
(37)
|
(462)
|
|
Total
pension expense
|
$
5,719
|
$
5,697
|
$ 5,515
|
The table
below sets forth the funded status of our plans and amounts recognized in the
accompanying balance sheets.
|
(dollar
amounts in thousands)
|
December
27,
2009
|
December
28,
2008
|
|
Change
in benefit obligation
|
||
|
Net
benefit obligation at beginning of year
|
$ 83,478
|
$ 86,340
|
|
Service
cost
|
1,020
|
1,088
|
|
Interest
cost
|
4,643
|
4,623
|
|
Actuarial
gain
|
(3,147)
|
(60)
|
|
Gross
benefits paid
|
(4,449)
|
(4,366)
|
|
Plan
settlements
|
—
|
(37)
|
|
Foreign
currency exchange rate changes
|
2,089
|
(4,110)
|
|
Net
benefit obligation at end of year
|
$ 83,634
|
$ 83,478
|
|
Change
in plan assets
|
||
|
Fair
value of plan assets at beginning of year
|
$ 1,550
|
$ 1,454
|
|
Actual
return on assets
|
(383)
|
(196)
|
|
Employer
contributions
|
4,648
|
4,734
|
|
Gross
benefits paid
|
(4,449)
|
(4,366)
|
|
Foreign
currency exchange rate changes
|
34
|
(76)
|
|
Fair
value of plan assets at end of year
|
$
1,400
|
$ 1,550
|
|
Reconciliation
of funded status
|
||
|
Funded
status at end of year
|
$
(82,234)
|
$
(81,928)
|
|
(dollar
amounts in thousands)
|
December
27,
2009
|
December
28,
2008
|
|
Amounts
recognized in accrued benefit consist of:
|
||
|
Accrued
pensions — current
|
$ 4,613
|
$ 4,305
|
|
Accrued
pensions
|
77,621
|
77,623
|
|
Net
amount recognized at end of year
|
$
82,234
|
$
81,928
|
|
Other
comprehensive income attributable to change in additional minimum
liability recognition
|
$
—
|
$ —
|
|
Accumulated
benefit obligation at end of year
|
$
79,949
|
$
79,165
|
The
following table sets forth additional fiscal year-ended information for pension
plans for which the accumulated benefit is in excess of plan
assets:
|
(dollar
amounts in thousands)
|
December
27,
2009
|
December
28,
2008
|
|
Projected
benefit obligation
|
$
83,634
|
$
83,478
|
|
Accumulated
benefit obligation
|
$
79,949
|
$
79,165
|
|
Fair
value of plan assets
|
$ 1,400
|
$ 1,550
|
The
weighted average rate assumptions used in determining pension costs and the
projected benefit obligation are as follows:
|
December
27,
2009
|
December
28,
2008
|
|||
|
Weighted
average assumptions for year-end benefit obligations:
|
||||
|
Discount
rate (1)
|
5.77
|
%
|
5.75
|
%
|
|
Expected
rate of increase in future compensation levels
|
2.52
|
%
|
2.77
|
%
|
|
Weighted
average assumptions for net periodic benefit cost
development:
|
||||
|
Discount
rate (1)
|
5.75
|
%
|
5.50
|
%
|
|
Expected
rate of return on plan assets
|
3.75
|
%
|
4.25
|
%
|
|
Expected
rate of increase in future compensation levels
|
2.77
|
%
|
2.52
|
%
|
|
Measurement
Date:
|
December
31, 2009
|
December
31, 2008
|
|
(1)
|
Represents
the weighted average rate for all pension
plans.
|
In
developing the discount rate assumption for each country, we use a yield curve
approach. The yield curve is based on the AA rated bonds underlying the Barclays
Capital corporate bond index. The weighted average discount rate was 5.77% in
2009 and 5.75% in 2008. We calculate the weighted average duration of
the plans in each country, then select the discount rate from the appropriate
yield curve which best corresponds to the plans' liability profile
The
majority of our pension plans are unfunded plans. The expected rate of the
return was developed using the historical rate of returns of the foreign
government bonds currently held. This resulted in the selection of the 3.75%
long-term rate of return on asset assumption. For funded plans, all assets are
held in foreign government bonds.
The
benefits expected to be paid over the next five years and the five aggregated
years after:
(amounts in
thousands)
|
2010
|
$ 4,682
|
|
2011
|
$ 4,987
|
|
2012
|
$ 4,891
|
|
2013
|
$ 5,214
|
|
2014
|
$ 5,160
|
|
2015
through 2019
|
$
27,549
|
52
The
following table provides a summary of the fair value of the Company’s pension
plan assets at December 27, 2009 utilizing the fair value hierarchy discussed in
Note 15:
(amounts
in thousands)
|
Total
Fair
Value
Measurement
December
27,
2009
|
Quoted
Prices
In
Active
Markets
for
Identical
Assets
(Level
1)
|
Significant
Other
Observable
Inputs
(Level
2)
|
Significant
Unobservable
Inputs
(Level
3)
|
|
|
Global
insurance assets
|
$ 1,400
|
$
—
|
$
—
|
$
1,400
|
|
Total
assets
|
$ 1,400
|
$
—
|
$
—
|
$
1,400
|
All
investments consist of fixed-income global insurance. The investment objective
of fixed-income funds is to maximize investment return while preserving
investment principal.
Additional
information pertaining to the changes in the fair value of the pension plan
assets classified as Level 3 for the year ended December 27, 2009 is presented
below:
(amounts
in thousands)
|
Balance
as of
December
28,
2008
|
Actual
Return
on
Plan Assets,
relating
to
Assets
Still Held
at
the Reporting
Date
|
Actual
Return
on
Plan Assets,
Relating
to
Assets
Sold
During
the
Period
|
Purchases,
Sales
and
Settlements
|
Transfer
into
/ (out of)
Level
3
|
Change
due to
Exchange
Rate
Changes
|
Balance
as of
December
27,
2009
|
|
|
Asset
Category
|
|||||||
|
Global
insurance assets
|
$
1,550
|
$
(226)
|
$
(99)
|
$
141
|
$
—
|
$
34
|
$
1,400
|
|
Total
Level 3 Assets
|
$
1,550
|
$
(226)
|
$ (99)
|
$
141
|
$
—
|
$
34
|
$
1,400
|
Note
15. FAIR VALUE MEASUREMENT, FINANCIAL INSTRUMENTS AND RISK
MANAGEMENT
Fair
Value Measurement
We
utilize the market approach to measure fair value for our financial assets and
liabilities. The market approach uses prices and other relevant information
generated by market transactions involving identical or comparable assets or
liabilities.
Our
financial assets and liabilities are measured using a fair value hierarchy that
is intended to increase consistency and comparability in fair value measurements
and related disclosures. The fair value hierarchy is based on inputs to
valuation techniques that are used to measure fair value that are either
observable or unobservable. Observable inputs reflect assumptions market
participants would use in pricing an asset or liability based on market data
obtained from independent sources while unobservable inputs reflect a reporting
entity’s pricing based upon their own market assumptions. The fair value
hierarchy consists of the following three levels:
|
Level
1
|
Inputs
are quoted prices in active markets for identical assets or
liabilities.
|
|
|
Level
2
|
Inputs
are quoted prices for similar assets or liabilities in an active market,
quoted prices for identical or similar assets or liabilities in markets
that are not active, inputs other than quoted prices that are observable
and market-corroborated inputs which are derived principally from or
corroborated by observable market data.
|
|
|
Level
3
|
Inputs
are derived from valuation techniques in which one or more significant
inputs or value drivers are
unobservable.
|
Because
the Company’s derivatives are not listed on an exchange, the Company values
these instruments using a valuation model with pricing inputs that are
observable in the market or that can be derived principally from or corroborated
by observable market data. The Company’s methodology also incorporates the
impact of both the Company’s and the counterparty’s credit
standing.
The
following table represents our assets and liabilities measured at fair value on
a recurring basis as of December 27, 2009 and December 28, 2008 and the
basis for that measurement:
(amounts
in thousands)
|
Total
Fair
Value
Measurement
December
27,
2009
|
Quoted
Prices
In
Active
Markets
for
Identical
Assets
(Level
1)
|
Significant
Other
Observable
Inputs
(Level
2)
|
Significant
Unobservable
Inputs
(Level
3)
|
|
|
Foreign
currency forward exchange contracts
|
$ 56
|
$
—
|
$ 56
|
$
—
|
|
Foreign
currency revenue forecast contracts
|
303
|
—
|
303
|
—
|
|
Total
assets
|
$
359
|
$
—
|
$
359
|
$
—
|
|
Foreign
currency forward exchange contracts
|
$
191
|
$
—
|
$
191
|
$
—
|
|
Foreign
currency revenue forecast contracts
|
132
|
—
|
132
|
—
|
|
Interest
rate swap
|
171
|
—
|
171
|
—
|
|
Total
liabilities
|
$
494
|
$
—
|
$
494
|
$
—
|
|
Total
Fair
Value
Measurement
December
28,
2008
|
Quoted
Prices
In
Active
Markets
for
Identical
Assets
(Level
1)
|
Significant
Other
Observable
Inputs
(Level
2)
|
Significant
Unobservable
Inputs
(Level
3)
|
|
|
Foreign
currency forward exchange contracts
|
$ 10
|
$
—
|
$ 10
|
$
—
|
|
Foreign
currency revenue forecast contracts
|
263
|
—
|
263
|
—
|
|
Total
assets
|
$ 273
|
$
—
|
$ 273
|
$
—
|
|
Foreign
currency forward exchange contracts
|
$ 911
|
$
—
|
$ 911
|
$
—
|
|
Foreign
currency revenue forecast contracts
|
311
|
—
|
311
|
—
|
|
Interest
rate swap
|
916
|
—
|
916
|
—
|
|
Total
liabilities
|
$
2,138
|
$
—
|
$
2,138
|
$
—
|
53
The
following table provides a summary of the activity associated with all of our
designated cash flow hedges (interest rate and foreign currency) reflected in
accumulated other comprehensive income for the years ended December 27,
2009 and December 28, 2008:
|
(dollar
amounts in thousands)
|
December
27,
2009
|
December
28,
2008
|
|
Beginning
balance, net of tax
|
$ 880
|
$ —
|
|
Changes
in fair value gain, net of tax
|
477
|
1,508
|
|
Reclass
to earnings, net of tax
|
(1,659)
|
(628)
|
|
Ending
balance, net of tax
|
$ (302)
|
$ 880
|
We
believe that the fair values of our current assets and current liabilities
(cash, restricted cash, accounts receivable, accounts payable, and other current
liabilities) approximate their reported carrying amounts. The carrying values
and the estimated fair values of non-current financial assets and liabilities
that qualify as financial instruments and are not measured at fair value on a
recurring basis at December 27, 2009 and December 28, 2008 are
summarized in the following table:
|
December
27, 2009
|
December
28, 2008
|
||||
|
(dollar amounts in thousands)
|
Carrying
Amount
|
Estimated
Fair
Value
|
Carrying
Amount
|
Estimated
Fair
Value
|
|
|
Long-term
debt (including current maturities and excluding capital leases) (1)
|
$
89,177
|
$
89,177
|
$
133,596
|
$
133,596
|
|
|
(1)
|
The
carrying amounts are reported on the balance sheet under the indicated
captions.
|
Long-term
debt is carried at the original offering price, less any payments of principal.
Rates currently available to us for long-term borrowings with similar terms and
remaining maturities are used to estimate the fair value of existing borrowings
as the present value of expected cash flows. The Secured Credit Facility’s
maturity date is in the year 2012.
The
carrying value approximates fair value for cash, restricted cash, accounts
receivable, and accounts payable.
Financial
Instruments and Risk Management
We
manufacture products in the USA, the Caribbean, Europe, and the Asia Pacific
region for both the local marketplace, and for export to our foreign
subsidiaries. The subsidiaries, in turn, sell these products to customers in
their respective geographic areas of operation, generally in local currencies.
This method of sale and resale gives rise to the risk of gains or losses as a
result of currency exchange rate fluctuations on inter-company receivables and
payables. Additionally, the sourcing of product in one currency and the sales of
product in a different currency can cause gross margin fluctuations due to
changes in currency exchange rates.
Our major
market risk exposures are movements in foreign currency and interest rates. We
have historically not used financial instruments to minimize our exposure to
currency fluctuations on our net investments in and cash flows derived from our
foreign subsidiaries. We have used third-party borrowings in foreign currencies
to hedge a portion of our net investments in and cash flows derived from our
foreign subsidiaries. As we reduce our third party foreign currency borrowings,
the effect of foreign currency fluctuations on our net investments in and cash
flows derived from our foreign subsidiaries increases.
We enter
into forward exchange contracts to reduce the risks of currency fluctuations on
short-term inter-company receivables and payables. These contracts are entered
into with major financial institutions, thereby minimizing the risk of credit
loss. Our policy is to manage interest rates through the use of interest rate
caps or swaps. We do not hold or issue derivative financial instruments for
speculative or trading purposes. We are subject to other foreign exchange market
risk exposure resulting from anticipated non-financial instrument foreign
currency cash flows which are difficult to reasonably predict, and have
therefore not been included in the table of fair values. All listed items
described are non-trading.
The
following table presents the fair values of derivative instruments included
within the consolidated balance sheets as of December 27, 2009 and December 28,
2008:
(amounts
in thousands)
|
December
27, 2009
|
December
28, 2008
|
||||||||
|
Asset
Derivatives
|
Liability
Derivatives
|
Asset
Derivatives
|
Liability
Derivatives
|
||||||
|
Balance
Sheet
Location
|
Fair
Value
|
Balance
Sheet
Location
|
Fair
Value
|
Balance
Sheet
Location
|
Fair
Value
|
Balance
Sheet
Location
|
Fair
Value
|
||
|
Derivatives
designated as hedging instruments
|
|||||||||
|
Foreign
currency revenue forecast contracts
|
Other
current assets
|
$
303
|
Other
current liabilities
|
$
132
|
Other
current assets
|
$
263
|
Other
current liabilities
|
$ 311
|
|
|
Interest
rate swap contracts
|
Other
current assets
|
—
|
Other
current liabilities
|
171
|
Other
current assets
|
—
|
Other
long-term liabilities
|
916
|
|
|
Total
derivatives designated as hedging instruments
|
303
|
303
|
263
|
1,227
|
|||||
|
Derivatives
not designated as hedging instruments
|
|||||||||
|
Foreign
currency forward exchange contracts
|
Other
current assets
|
56
|
Other
current liabilities
|
191
|
Other
current assets
|
10
|
Other
current liabilities
|
911
|
|
|
Total
derivatives not designated as hedging instruments
|
56
|
191
|
10
|
911
|
|||||
|
Total
derivatives
|
$
359
|
$
494
|
$
273
|
$
2,138
|
|||||
54
The
following tables present the amounts affecting the consolidated statement of
operations for the years ended December 27, 2009 and December 28,
2008:
(amounts
in thousands)
|
December
27, 2009
|
December
28, 2008
|
||||||||
|
Amount of
Gain
(Loss)
Recognized
in
Other
Comprehensive
Income
on
Derivatives
|
Location
of
Gain
(Loss)
Reclassified
From
Accumulated
Other
Comprehensive
Income
into
Income
|
Amount of
Gain
(Loss)
Reclassified
From
Accumulated
Other
Comprehensive
Income into
Income
|
Amount
of
Forward
Points
Recognized
in
Other
Gain
(Loss),
net
|
Amount of
Gain
(Loss)
Recognized
in
Other
Comprehensive
Income
on
Derivatives
|
Location
of
Gain
(Loss)
Reclassified
From
Accumulated
Other
Comprehensive
Income
into
Income
|
Amount of
Gain
(Loss)
Reclassified
From
Accumulated
Other
Comprehensive
Income into
Income
|
Amount
of
Forward
Points
Recognized
in
Other
Gain
(Loss),
net
|
||
|
Derivatives
designated as cash flow hedges
|
|||||||||
|
Foreign
currency revenue forecast contracts
|
$
(21)
|
Cost
of sales
|
$ 1,693
|
$
(77)
|
$
2,114
|
Cost
of sales
|
$ 640
|
$
(206)
|
|
|
Interest
rate swap contracts
|
744
|
Interest
expense
|
(1,073)
|
—
|
(916)
|
Interest
expense
|
(138)
|
—
|
|
|
Total
designated cash flow hedges
|
$
723
|
$ 620
|
$
(77)
|
$
1,198
|
$
502
|
$
(206)
|
|||
(amounts
in thousands)
|
December
27, 2009
|
December
28, 2008
|
||||
|
Amount
of
Gain
(Loss)
Recognized
in
Income
on
Derivatives
|
Location
of
Gain
(Loss)
Recognized
in
Income
on
Derivatives
|
Amount
of
Gain
(Loss)
Recognized
in
Income
on
Derivatives
|
Location
of
Gain(Loss)
Recognized
in
Income
on
Derivatives
|
||
|
Derivatives
not designated as hedging instruments
|
|||||
|
Foreign
exchange forwards and options
|
$
(257)
|
Other
gain
(loss),
net
|
$
1,072
|
Other
gain
(loss),
net
|
|
We
selectively purchase currency forward exchange contracts to reduce the risks of
currency fluctuations on short-term inter-company receivables and payables.
These contracts guarantee a predetermined exchange rate at the time the contract
is purchased. This allows us to shift the effect of positive or negative
currency fluctuations to a third party. Transaction gains or losses
resulting from these contracts are recognized at the end of each reporting
period. We use the fair value method of accounting, recording realized and
unrealized gains and losses on these contracts. These gains and losses are
included in other gain (loss), net on our consolidated statements of
operations. As of December 27, 2009, we had currency forward
exchange contracts with notional amounts totaling approximately
$15.5 million. The fair values of the forward exchange contracts were
reflected as a $0.1 million asset and $0.2 million liability and are included in
other current assets and other current liabilities in the accompanying balance
sheets. The contracts are in the various local currencies covering primarily our
operations in the USA, the Caribbean, and Western
Europe. Historically, we have not purchased currency forward exchange
contracts where it is not economically efficient, specifically for our
operations in South America and Asia, with the exception of Japan.
Beginning
in the second quarter of 2008, we entered into various foreign currency
contracts to reduce our exposure to forecasted Euro-denominated inter-company
revenues. These contracts were designated as cash flow hedges. The foreign
currency contracts mature at various dates from January 2010 to
September 2010. The purpose of these cash flow hedges is to eliminate the
currency risk associated with Euro-denominated forecasted inter-company revenues
due to changes in exchange rates. These cash flow hedging instruments are marked
to market and the changes are recorded in other comprehensive
income. Amounts recorded in other comprehensive income are recognized
in cost of goods sold as the inventory is sold to external parties. Any hedge
ineffectiveness is charged to other gain (loss), net on our consolidated
statements of operations. As of December 27, 2009, the fair value of
these cash flow hedges were reflected as a $0.3 million asset and a $0.1 million
liability and are included in other current assets and other current liabilities
in the accompanying consolidated balance sheets. The total notional amount of
these hedges is $18.3 million (€12.6 million) and the unrealized loss
recorded in other comprehensive income was $0.2 million (net of taxes of $4
thousand), of which the full amount is expected to be reclassified to earnings
over the next twelve months. During the year ended December 27, 2009, a $1.7
million benefit related to these foreign currency hedges was recorded to cost of
goods sold as the inventory was sold to external parties. The Company
recognized an $8 thousand loss during the year ended December 27, 2009 for hedge
ineffectiveness.
During
the first quarter of 2008, we entered into an interest rate swap agreement with
a notional amount of $40 million and a maturity date of February 18, 2010.
The purpose of this interest rate swap agreement is to hedge potential changes
to our cash flows due to the variable interest nature of our senior unsecured
credit facility. The interest rate swap was designated as a cash flow hedge.
This cash flow hedging instrument is marked to market and the changes are
recorded in other comprehensive income. Any hedge ineffectiveness is charged to
interest expense. As of December 27, 2009, the fair value of the
interest rate swap agreement was reflected as a $0.2 million liability and
is included in other current liabilities in the accompanying consolidated
balance sheets and the unrealized loss recorded in other comprehensive income
was $0.1 million (net of taxes of $66 thousand). We estimate that the full
amount of the loss in accumulated other comprehensive income will be
reclassified to earnings over the next twelve months. The Company
recognized no hedge ineffectiveness during the year ended December 27,
2009.
During
the second quarter of 2007, the Company entered into a foreign currency option
contract, at a notional amount of €5 million, to mitigate the effect of
fluctuating foreign exchange rates on the reporting of a portion of its expected
2007 foreign currency denominated earnings. Changes in the fair value of this
foreign currency option contract, which is not designated as a hedge, are
recorded in earnings immediately. The premium paid on the option contract was
$73 thousand. The foreign currency option contract expired on December 28,
2007. The fair market value on this option at the expiration date was
zero.
Aggregate
foreign currency transaction gains (losses) in 2009, 2008, and 2007, were
$(0.4) million, $(9.2) million, and $0.3 million, respectively, and are
included in other gain, net on the consolidated statements of
operations.
Additionally,
there were no deferrals of gains or losses on currency forward exchange
contracts at December 27, 2009.
55
Note
16. PROVISION FOR RESTRUCTURING
Restructuring
expense for the periods ended December 27, 2009, December 28, 2008,
and December 30, 2007 were as follows:
(amounts
in thousands)
|
December
27,
2009
|
December
28,
2008
|
December
30,
2007
|
|
|
SG&A
Restructuring Plan
|
|||
|
Severance
and other employee-related charges
|
$
2,828
|
$ —
|
$ —
|
|
Manufacturing
Restructuring Plan
|
|||
|
Severance
and other employee-related charges
|
1,481
|
699
|
—
|
|
Consulting
fees
|
—
|
838
|
—
|
|
2005
Restructuring Plan
|
|||
|
Severance
and other employee-related charges
|
1,149
|
4,563
|
1,215
|
|
Lease
termination costs
|
(57)
|
—
|
2,051
|
|
Acquisition
integration costs
|
—
|
519
|
—
|
|
Pension
curtailment
|
—
|
—
|
(420)
|
|
2003
Restructuring Plan
|
|||
|
Severance
and other employee-related charges
|
—
|
(253)
|
(145)
|
|
Lease
termination costs
|
—
|
76
|
—
|
|
Total
|
$
5,401
|
$
6,442
|
$
2,701
|
Restructuring
accrual activity for the periods ended December 27, 2009, and
December 28, 2008, were as follows:
(amounts in
thousands)
|
Fiscal
2009
|
Accrual
at
Beginning
of
Year
|
Charged
to
Earnings
|
Charge
Reversed
to
Earnings
|
Cash
Payments
|
Other
|
Exchange
Rate
Changes
|
Accrual
at
12/27/2009
|
|
SG&A
Restructuring Plan
|
|||||||
|
Severance
and other employee-related charges
|
$ —
|
$
2,828
|
$ —
|
$ (103)
|
$ —
|
$ 85
|
$
2,810
|
|
Manufacturing
Restructuring Plan
|
|||||||
|
Severance
and other employee-related charges
|
652
|
1,614
|
(133)
|
(676)
|
—
|
24
|
1,481
|
|
2005
Restructuring Plan
|
|||||||
|
Severance
and other employee-related charges
|
3,302
|
1,500
|
(351)
|
(4,132)
|
—
|
—
|
319
|
|
Acquisition
restructuring costs (1)
|
568
|
—
|
—
|
(142)
|
(322)
|
(17)
|
87
|
|
Total
|
$
4,522
|
$
5,942
|
$
(484)
|
$
(5,053)
|
$
(322)
|
$ 92
|
$
4,697
|
(amounts in
thousands)
|
Fiscal
2008
|
Accrual
at
Beginning
of
Year
|
Charged
to
Earnings
|
Charge
Reversed
to
Earnings
|
Cash
Payments
|
Other
|
Exchange
Rate
Changes
|
Accrual
at
12/28/2008
|
|
Manufacturing
Restructuring Plan
|
|||||||
|
Severance
and other employee-related charges
|
$ —
|
$ 701
|
$ (2)
|
$ (37)
|
$ —
|
$ (10)
|
$ 652
|
|
2005
Restructuring Plan
|
|||||||
|
Severance
and other employee-related charges
|
3,015
|
5,362
|
(799)
|
(4,141)
|
—
|
(135)
|
3,302
|
|
Acquisition
restructuring costs (1)
|
1,209
|
—
|
—
|
(612)
|
—
|
(29)
|
568
|
|
Total
|
$
4,224
|
$
6,063
|
$
(801)
|
$
(4,790)
|
$ —
|
$
(174)
|
$
4,522
|
|
(1)
|
During
2007, restructuring costs of $1.2 million included as a cost of the
SIDEP acquisition ($1.1 million related to employee severance and
$0.1 million related to the cost to abandon facilities) were
accounted for under Emerging Issues Task Force Issue No. 95-3
“Recognition of Liabilities in Connection with Purchase Business
Combinations.” These costs were recognized as an assumed liability in the
acquisition and were included in the purchase price allocation at
November 9, 2007. During 2009, $0.3 million of the acquisition
restructuring liability was reversed related to the SIDEP
acquisition.
|
SG&A
Restructuring Plan
During
2009, we initiated a plan focused on reducing our overall operating expenses by
consolidating certain administrative functions to improve efficiencies. The
first phase of this plan was implemented in the fourth quarter of
2009. The remaining stages of the plan will not be finalized until
2010, at which time further details and cost impacts will be
disclosed.
As of
December 27, 2009, the net charge to earnings of $2.8 million represents the
first stage of the SG&A Restructuring Plan. The total anticipated costs
related to the first phase of the plan are $3.1 million of which $2.8 were
incurred. The total number of employees affected by the SG&A Restructuring
Plan were 42, of which 7 have been terminated. Termination benefits are planned
to be paid one month to 24 months after termination.
Manufacturing
Restructuring Plan
In
August 2008, we announced a manufacturing and supply chain restructuring
program designed to accelerate profitable growth in our Apparel Labeling
Solutions (ALS) business, formerly Check-Net®, and to support
incremental improvements in our EAS systems and labels businesses.
For the
year ended December 27, 2009, there was a net charge to earnings of $1.5 million
recorded in connection with the Manufacturing Restructuring Plan.
The total
number of employees affected by the Manufacturing Restructuring Plan were 179,
of which 76 have been terminated. The anticipated total cost is expected to
approximate $3.0 million to $4.0 million, of which $3.0 million
has been incurred. Termination benefits are planned to be paid one month to
24 months after termination. The remaining anticipated costs are expected
to be incurred through the end of 2010.
56
2005
Restructuring Plan
In the
second quarter of 2005, we initiated actions focused on reducing our overall
operating expenses. This plan included the implementation of a cost reduction
plan designed to consolidate certain administrative functions in Europe and a
commitment to a plan to restructure a portion of our supply chain manufacturing
to lower cost areas. During the fourth quarter of 2006, we continued to review
the results of the overall initiatives and added an additional reduction focused
on the reorganization of senior management to focus on key markets and
customers. This additional restructuring reduced our management by 25%. As of
December 27, 2009, this restructuring plan is substantially
complete.
For the
year ended December 27, 2009, a net charge of $1.1 million was
recorded in connection with the 2005 Restructuring Plan. The charge was composed
of severance accruals and related costs, partially offset by the release of a
lease termination liability.
The total
number of employees affected by the 2005 Restructuring Plan were 897, of which
all have been terminated. The anticipated total cost is expected to approximate
$31 million, of which $31 million has been incurred and $31 million
paid. Termination benefits are planned to be paid one month to 24 months
after termination.
2003
Restructuring Plan
During
2008, we reversed $0.3 million of previously accrued severance and incurred
$0.1 million of lease termination costs related to the 2003 Restructuring
Plan.
During
2007, we reversed $0.1 million of previously accrued severance related to
the 2003 Restructuring Plan.
Note
17. COMMITMENTS AND CONTINGENCIES
We lease
certain production facilities, offices, distribution centers, and equipment.
Rental expense for all operating leases approximated $18.4 million,
$15.1 million, and $26.7 million, in 2009, 2008, and 2007,
respectively.
Future
minimum payments for operating leases and capital leases having non-cancelable
terms in excess of one year at December 27, 2009 are:
|
(dollar
amounts in thousands)
|
Capital
Leases
|
Operating
Leases
|
Total
|
|
2010
|
$
1,997
|
$
15,217
|
$
17,214
|
|
2011
|
1,877
|
9,099
|
10,976
|
|
2012
|
583
|
6,527
|
7,110
|
|
2013
|
77
|
3,444
|
3,521
|
|
2014
|
30
|
2,898
|
2,928
|
|
Thereafter
|
—
|
889
|
889
|
|
Total
minimum lease payments
|
4,564
|
$
38,074
|
$
42,638
|
|
Less:
amounts representing interest
|
256
|
||
|
Present
value of minimum lease payments
|
$
4,308
|
Contingencies
We are
involved in certain legal and regulatory actions, all of which have arisen in
the ordinary course of business. Management believes that the ultimate
resolution of such matters is unlikely to have a material adverse effect on our
consolidated results of operations and/or financial condition, except as
described below.
Matter
related to All-Tag Security S.A., et al
We
originally filed suit on May 1, 2001, alleging that the disposable,
deactivatable radio frequency security tag manufactured by All-Tag Security S.A.
and All-Tag Security Americas, Inc.’s (jointly “All-Tag”) and sold by
Sensormatic Electronics Corporation (Sensormatic) infringed on a U.S. Patent
No. 4,876,555 (Patent) owned by us. On April 22, 2004, the United
States District Court for the Eastern District of Pennsylvania granted summary
judgment to defendants All-Tag and Sensormatic on the ground that our Patent was
invalid for incorrect inventorship. We appealed this decision. On June 20,
2005, we won an appeal when the Federal Circuit reversed the grant of summary
judgment and remanded the case to the District Court for further proceedings. On
January 29, 2007 the case went to trial. On February 13, 2007, a jury
found in favor of the defendants on infringement, the validity of the Patent and
the enforceability of the Patent. On June 20, 2008, the Court entered
judgment in favor of defendants based on the jury’s infringement and
enforceability findings. On February 10, 2009, the Court granted
defendants’ motions for attorneys’ fees under Section 285 of the Patent
Statute. The district court will have to quantify the amount of attorneys’ fees
to be awarded, but it is expected that defendants will request approximately
$5.7 million plus interest. We recognized this amount during the fourth
fiscal quarter ended December 28, 2008 in litigation settlements on the
consolidated statement of operations. We intend to appeal any award of legal
fees.
Other
Settlements
During
2009, we recorded $1.3 million of litigation expense related to the settlement
of a dispute with a consultant for $0.9 million and the acquisition of a patent
related to our Alpha business for $0.4 million. We purchased the patent for $1.7
million related to our Alpha business. A portion of this purchase price was
attributable to use prior to the date of acquisition and as a result we recorded
$0.4 million in litigation expense and $1.3 million in intangibles.
Note
18. CONCENTRATION OF CREDIT RISK
Our
foreign subsidiaries, along with many foreign distributors, provide diversified
international sales thus minimizing credit risk to one or a few distributors.
Our sales are well diversified among numerous retailers in the apparel, drug,
home entertainment, mass merchandise, music, shoe, supermarket, and video
markets. We perform ongoing credit evaluations of our customers’ financial
condition and generally require no collateral from our
customers.
57
Note
19. BUSINESS SEGMENTS AND GEOGRAPHIC INFORMATION
Historically,
we have reported our results of operations into three segments: Shrink
Management Solutions, Intelligent Labels, and Retail Merchandising. During the
first quarter of 2009, resulting from a change in our management structure, we
began reporting our segments into three new segments: Shrink Management
Solutions, Apparel Labeling Solutions, and Retail Merchandising Solutions. The
years ended 2008 and 2007 have been conformed to reflect the segment change.
Shrink Management Solutions now includes results of our EAS labels and library
business. Apparel Labeling Solutions, formerly referred to as Check-Net®,
includes tag and label solutions sold to apparel manufacturers and retailers,
which leverage our graphic and design expertise, strategically located service
bureaus, and our Check-Net®
e-commerce capabilities. Our apparel labeling services coupled with our EAS and
RFID capabilities provide a combination of apparel branding and identification
with loss prevention and supply chain visibility. There were no changes to the
Retail Merchandising Segment.
Our
reportable business segments are strategic business units that offer distinctive
products and services that are marketed through different channels. We have
three reportable business segments:
|
i.
|
Shrink
Management Solutions — includes electronic article surveillance
(EAS) systems, EAS consumables , Alpha, CheckView™, and radio
frequency identification (RFID) tags and
labels,
|
|
ii.
|
Apparel
Labeling Solutions — includes our web-enabled apparel labeling solutions
platform and network of service bureaus to manage the printing of variable
information on price and promotional tickets, adhesive
labels, fabric and woven tags and labels, and apparel branding
tags.
|
|
iii.
|
Retail
Merchandising Solutions — includes hand-held labeling systems
(HLS) and retail display systems
(RDS).
|
The
accounting policies of the segments are the same as those described in the
summary of significant accounting policies.
The
business segment information set forth below is that viewed by the chief
operating decision maker:
|
(A)
|
Business
Segments
|
|
(dollar
amounts in thousands)
|
2009
|
2008
|
2007
|
|
Business
segment net revenue:
|
|||
|
Shrink
Management Solutions
|
$ 553,700
|
$ 687,352
|
$ 611,227
|
|
Apparel
Labeling Solutions
|
141,910
|
135,350
|
126,581
|
|
Retail
Merchandising Solutions
|
77,108
|
94,380
|
96,348
|
|
Total
|
$ 772,718
|
$ 917,082
|
$ 834,156
|
|
Business
segment gross profit:
|
|||
|
Shrink
Management Solutions
|
$ 242,096
|
$ 284,428
|
$ 255,733
|
|
Apparel
Labeling Solutions
|
52,543
|
47,008
|
44,133
|
|
Retail
Merchandising Solutions
|
36,645
|
46,663
|
46,106
|
|
Total
gross profit
|
331,284
|
378,099
|
345,972
|
|
Operating
expenses
|
289,704(1)
|
395,276(2)
|
279,154(3)
|
|
Interest
(expense) income, net
|
(5,415)
|
(3,108)
|
3,096
|
|
Other
(loss) gain, net
|
(180)
|
(8,924)
|
662
|
|
Earnings
(loss) from continuing operations before income taxes
|
$ 35,985
|
$ (29,209)
|
$ 70,576
|
|
Business
segment total assets:
|
|||
|
Shrink
Management Solutions
|
$ 725,579
|
$ 728,010
|
|
|
Apparel
Labeling Solutions
|
158,677
|
126,285
|
|
|
Retail
Merchandising Solutions
|
134,080
|
131,421
|
|
|
Total
|
$
1,018,336
|
$ 985,716
|
|
(1)
|
Includes
a $5.4 million restructuring charge and a $1.3 million
litigation settlement charge.
|
|
(2)
|
Includes
a $59.6 million goodwill impairment charge, $6.4 million
restructuring charge, a $6.2 million litigation settlement charge, a
$3.0 million intangible asset impairment charge, a $1.5 million
fixed asset impairment charge, and a $1.0 million gain from the sale
of our Czech subsidiary.
|
|
(3)
|
Includes
a $2.7 million restructuring charge, a $4.4 million charge
related to our CEO transition, and a $2.6 million gain from the sale
of our Austria subsidiary.
|
|
(B)
|
Geographic
Information
|
Operating
results are prepared on a “country of domicile” basis, meaning that net revenues
and gross profit are included in the geographic area where the selling entity is
located. Assets are included in the geographic area in which the producing
entities are located. A direct sale from the U.S. to an unaffiliated customer in
South America is reported as a sale in the U.S. Inter-area sales between our
locations are made at transfer prices that approximate market price and have
been eliminated from consolidated net revenues. Gross profit for the individual
area includes the profitability on a transfer price basis, generated by sales of
our products imported from other geographic areas. International Americas is
defined as all countries in North and South America, excluding the United States
Puerto Rico, and Dominican Republic.
The
following table shows net revenues, gross profit, and other financial
information by geographic area for the years 2009, 2008, and 2007:
|
(dollar
amounts in thousands)
|
United
States,
Puerto
Rico, &
Dominican
Republic
|
Europe
|
International
Americas
|
Asia
Pacific
|
Total
|
|
2009
|
|||||
|
Net
revenues from unaffiliated customers
|
$
264,773
|
$
362,639
|
$
30,289
|
$
115,017
|
$
772,718
|
|
Gross
profit
|
$
113,801
|
$
148,066
|
$
12,352
|
$ 57,065
|
$
331,284
|
|
Long-lived
assets
|
$ 35,347
|
$ 19,432
|
$ 1,789
|
$ 63,046
|
$
119,614
|
|
2008
|
|||||
|
Net
revenues from unaffiliated customers
|
$ 319,929
|
$ 438,011
|
$ 35,433
|
$ 123,709
|
$ 917,082
|
|
Gross
profit
|
$ 143,795
|
$ 168,013
|
$ 14,529
|
$ 51,762
|
$ 378,099
|
|
Long-lived
assets
|
$ 36,194
|
$ 20,969
|
$ 1,724
|
$ 29,888
|
$ 88,775
|
|
2007
|
|||||
|
Net
revenues from unaffiliated customers
|
$ 275,212
|
$ 412,416
|
$ 37,125
|
$ 109,403
|
$ 834,156
|
|
Gross
profit
|
$ 122,630
|
$ 161,457
|
$ 12,462
|
$ 49,423
|
$ 345,972
|
58
Note
20. QUARTERLY INFORMATION (UNAUDITED)
|
(dollar
amounts in thousands, except per share data)
|
QUARTERS
(unaudited)
|
||||||||
|
First
|
Second
|
Third
|
Fourth
|
Year
|
|||||
|
2009
|
|||||||||
|
Net
revenues
|
$
158,950
|
$
181,913
|
$
194,078
|
$
237,777
|
$
772,718
|
||||
|
Gross
profit
|
66,530
|
77,691
|
84,674
|
102,389
|
331,284
|
||||
|
Net
(loss) earnings attributable to Checkpoint Systems, Inc.
|
(2,006)
|
(1)
|
6,930
|
(2)
|
2,639
|
(3)
|
18,579
|
(4)
|
26,142
|
|
Net
(loss) earnings attributable to Checkpoint Systems, Inc. per
share:
|
|||||||||
|
Basic
|
$ (.05)
|
$ .18
|
$ .07
|
$ .47
|
$ .67
|
||||
|
Diluted
|
$ (.05)
|
$ .18
|
$ .07
|
$ .47
|
$ .66
|
||||
|
First
|
Second
|
Third
|
Fourth
|
Year
|
|||||
|
2008
|
|||||||||
|
Net
revenues
|
$ 209,620
|
$ 236,200
|
$ 233,995
|
$ 237,267
|
$ 917,082
|
||||
|
Gross
profit
|
86,479
|
97,941
|
97,631
|
96,048
|
378,099
|
||||
|
Net
earnings (loss) attributable to Checkpoint Systems, Inc.
|
4,798
|
(5)
|
14,356
|
(6)
|
12,776
|
(7)
|
(61,735)
|
(8)(9)
|
(29,805)
|
|
Net
earnings (loss) attributable to Checkpoint Systems, Inc. per
share:
|
|||||||||
|
Basic
|
$ .12
|
$ .36
|
$ .33
|
$ (1.58)
|
$ (.76)
|
||||
|
Diluted
|
$ .12
|
$ .36
|
$ .32
|
$ (1.58)
|
$ (.76)
|
||||
|
(1)
|
Includes
a $0.3 million restructuring charge (net of tax) and a $0.8
litigation settlement expense (net of
tax).
|
|
(2)
|
Includes
a $0.4 million restructuring charge (net of
tax).
|
|
(3)
|
Includes
a $0.2 million restructuring charge (net of tax) and a
$3.6 million valuation allowance
adjustment.
|
|
(4)
|
Includes
a $3.1 million restructuring charge (net of tax) and a
$1.7 million valuation allowance adjustment. Included in fourth
quarter 2009 income tax expense is a benefit of $1.3 million related to
the settlement of a tax matter in an overseas jurisdiction for which the
assessment was received in the third quarter of
2009.
|
|
(5)
|
Includes
a $0.7 million restructuring charge (net of tax) and a $0.8 deferred
compensation adjustment (net of tax) from prior
periods.
|
|
(6)
|
Includes
a $2.1 million restructuring charge (net of tax) and a
$4.8 million valuation allowance
adjustment.
|
|
(7)
|
Includes
a $0.5 million restructuring charge (net of tax), $0.3 million
litigation settlement expense (net of tax), and a $1.0 million gain
from the sale of the Czech Republic subsidiary (net of
tax).
|
|
(8)
|
Includes
a $58.5 million goodwill impairment charge (net of tax), a
$3.5 million litigation settlement charge (net of tax), a
$2.2 million intangible asset impairment charge (net of tax), a
$1.6 million restructuring charge (net of tax), and a
$0.8 million fixed asset impairment charge (net of
tax).
|
|
(9)
|
Includes
a $0.8 million out of period adjustment related to the accounting for
a building impairment in
France.
|
59
There
are no changes or disagreements to report under this item.
Disclosure
Controls and Procedures
Under the
supervision and with the participation of our management, including our Chief
Executive Officer and Chief Financial Officer, we have evaluated the
effectiveness of our disclosure controls and procedures (as defined in
Rule 13a — 15(e) under the Exchange Act) as of the end of the period
covered by this report. Based on that evaluation, our Chief Executive Officer
and Chief Financial Officer have concluded that our disclosure controls and
procedures are effective as of December 27, 2009.
Management’s
Annual Report On Internal Control Over Financial Reporting
Management
is responsible for establishing and maintaining adequate internal control over
financial reporting for the Company. With the participation of our Chief
Executive Officer and Chief Financial Officer, management conducted an
evaluation of the effectiveness of our internal control over financial reporting
as of December 27, 2009 based on the Internal Control — Integrated
Framework issued by the Committee of Sponsoring Organizations of the
Treadway Commission. Based on this evaluation, management concluded that our
internal control over financial reporting was effective as of December 27,
2009.
The scope
of management’s assessment of internal control over financial reporting as of
December 27, 2009 excluded Brilliant because it was acquired in a purchase
business combination in August 2009. Brilliant represented 6.2% of total assets
at December 27, 2009, and generated 1.7% of total revenue during fiscal
year 2009.
Our
independent registered public accounting firm, PricewaterhouseCoopers LLP, has
issued an audit report on the effectiveness of our internal control over
financial reporting, which appears in Item 8 of this report.
Changes
in Internal Control Over Financial Reporting
There
have been no changes in our internal controls over financial reporting that
occurred during our fourth fiscal quarter of 2009 that have materially affected,
or are reasonably likely to materially affect, our internal control over
financial reporting.
None.
The
information required by this Item (except for the information regarding
executive officers called for by Item 401 of Regulation S-K, which is
included in Part I hereof in accordance with General Instruction G (3)) is
hereby incorporated by reference to the Registrant’s Definitive Proxy Statement
for its Annual Meeting of Shareholders presently scheduled to be held on
June 2, 2010, which management expects to file with the SEC within
120 days of the end of the Registrant’s fiscal year.
We have
posted the Code of Ethics, the Governance Guidelines and each of the Committee
Charters on our website at www.checkpointsystems.com,
and will post on our website any amendments to, or waivers from, the Code of
Ethics applicable to any of its directors or executive officers. The foregoing
information will also be available in print upon request.
The
information required by this Item is hereby incorporated by reference to the
Registrant’s Definitive Proxy Statement for its Annual Meeting of Shareholders
presently scheduled to be held on June 2, 2010, which management expects to
file with the SEC within 120 days of the end of the Registrant’s fiscal
year.
Note that
the section of our Definitive Proxy Statement entitled “Compensation Committee
Report” pursuant to
Regulation S-K
Item 407 (e)(5) is not deemed “soliciting material” or “filed” as part of
this report.
The
information required by this Item is hereby incorporated by reference to the
Registrant’s Definitive Proxy Statement for its Annual Meeting of Shareholders
presently scheduled to be held on June 2, 2010, which management expects to
file with the SEC within 120 days of the end of the Registrant’s fiscal
year.
60
All other
schedules are omitted either because they are not applicable, not required, or
because the required information is included in the financial statements or
notes thereto:
|
1.
|
The
following consolidated financial statements of Checkpoint Systems, Inc.
were included in Item 8
|
|
|
Consolidated
Balance Sheets as of December 27, 2009 and December 28,
2008
|
32
|
|
|
Consolidated
Statements of Operations for each of the years in the three-year period
ended December 27, 2009
|
33
|
|
|
Consolidated
Statements of Stockholders’ Equity for each of the years in the three-year
period ended December 27, 2009
|
34
|
|
|
Consolidated
Statements of Comprehensive Income (Loss) for each of the years in the
three-year period ended December 27, 2009
|
35
|
|
|
Consolidated
Statements of Cash Flows for each of the years in the three-year period
ended December 27, 2009
|
36
|
|
|
Notes
to Consolidated Financial Statements
|
37-59
|
|
|
2.
|
The
following consolidated financial statements schedules of Checkpoint
Systems, Inc. are included
Financial
Statement Schedule, Schedule II — Valuation and Qualifying
Accounts
|
64
|
61
Pursuant
to the requirements of Section 13 or 15(d) of the Securities and Exchange
Act of 1934, the Registrant has duly caused this report to be signed on its
behalf by the undersigned, thereunto duly authorized in Thorofare, New Jersey,
on February 23, 2010.
|
CHECKPOINT
SYSTEMS, INC.
|
|
/s/
Robert P. van der Merwe
|
|
Chairman
of the Board of Directors,
|
|
President
and Chief Executive Officer
|
Pursuant
to the requirements of the Securities and Exchange Act of 1934, this report has
been signed below by the following persons in the capacities and on the dates
indicated.
|
SIGNATURE
|
TITLE
|
DATE
|
|
/s/
Robert P. van der Merwe
|
Chairman
of the Board of Directors, President and
Chief
Executive Officer
|
February
23, 2010
|
|
/s/
Raymond D. Andrews
|
Senior
Vice President and Chief Financial Officer
|
February
23, 2010
|
|
/s/
William S. Antle, III
|
Director
|
February
23, 2010
|
|
/s/
George Babich, Jr.
|
Director
|
February
23, 2010
|
|
/s/
Harald Einsmann
|
Director
|
February
23, 2010
|
|
/s/
R. Keith Elliott
|
Director
|
February
23, 2010
|
|
/s/
Alan R. Hirsig
|
Director
|
February
23, 2010
|
|
/s/
Jack W. Partridge
|
Director
|
February
23, 2010
|
|
/s/
Sally Pearson
|
Director
|
February
23, 2010
|
|
/s/
Robert N. Wildrick
|
Director
|
February
23, 2010
|
62
|
Exhibit 3.1
|
Articles
of Incorporation, as amended, are hereby incorporated by reference to
Item 14(a), Exhibit 3(i) of the Registrant’s 1990
Form 10-K, filed with the SEC on March 14,
1991.
|
|
|
Exhibit 3.2
|
By-Laws,
as Amended and Restated, are hereby incorporated by reference
Item 5.03, Exhibit 3.2 of the Registrant’s Current Report on
Form 8-K filed with the SEC on December 28,
2007.
|
|
|
Exhibit 3.3
|
Articles
of Amendment to the Articles of Incorporation are hereby incorporated by
reference to Item 5.03, Exhibit 3.1 of the Registrant’s Current
Report on Form 8-K filed with the SEC on December 28,
2007.
|
|
|
Exhibit 4.1
|
Rights
Agreement by and between Registrant and American Stock and Transfer and
Trust Company dated as of March 10, 1997, is hereby incorporated by
reference to Item 14(a), Exhibit 4.1 of the Registrant’s 1996
Form 10-K filed with the SEC on March 17,
1997.
|
|
|
Exhibit 4.2
|
Amendment
No. 1 to Rights Agreement dated as of March 2, 2007 is hereby
incorporated by reference to Exhibit 4.1 of the Registrant’s Current
Report on Form 8-K filed with the SEC on March 8,
2007.
|
|
|
Exhibit 4.3
|
Amendment
No. 2 to Rights Agreement, dated August 5, 2009 between the Company and
American Stock Transfer & Trust Company, LLC as Rights Agent is hereby
incorporated by reference to Item 1.01, Exhibit 4.1 of the Registrant’s
Current Report on Form 8-K filed with the SEC on August 5,
2009.
|
|
|
Exhibit
4.4
|
Amendment
No. 3 to Rights Agreement, dated December 22, 2009 between the Company and
American Stock Transfer & Trust Company, LLC as Rights Agent is hereby
incorporated by reference to Item 1.02, Exhibit 10.1 of the Registrant’s
Current Report on Form 8-K filed with the SEC on December 23,
2009.
|
|
|
Exhibit 10.1*
|
Amended
and Restated Stock Option Plan (1992) is hereby incorporated by
reference to Registrant’s Form 10-K for 1997 filed with the SEC on
March 23, 1998.
|
|
|
Exhibit 10.2
|
Consulting
and Deferred Compensation Agreement with Albert E. Wolf, are incorporated
by reference to Item(a), Exhibit 10(c) of the Registrant’s 1994
Form 10-K.
|
|
|
Exhibit 10.3
|
Credit
Agreement dated March 4, 2005, by and among Registrant, Wachovia Bank
N.A., as Administrative Agent, and the lenders named therein, is
incorporated herein by reference to Exhibit 99.1 of the Registrant’s
Form 8-K filed on March 9, 2005.
|
|
|
Exhibit 10.4*
|
Employment
Agreement with Per Harold Levin is incorporated by reference to
Item 6(a), Exhibit 10.4 of the Registrant’s Form 10-Q filed
on May 13, 2004.
|
|
|
Exhibit 10.5*
|
Amendment
to Employment Agreement with Per Harold Levin is incorporated by reference
to Item 6(a), Exhibit 10.5 of the Registrant’s Form 10-Q
filed on May 13, 2004.
|
|
|
Exhibit 10.6*
|
Employment
Agreement with John R. Van Zile is Incorporated by reference to
Item 6(a), Exhibit 10.7 of the Registrant’s Form 10-Q filed
on May 13, 2004.
|
|
|
Exhibit 10.7*
|
2004
Omnibus Incentive Compensation Plan as Appendix A to the Company’s
Definitive Proxy Statement, filed with the SEC on March 29, 2004, is
incorporated by reference.
|
|
|
Exhibit 10.8*
|
423
Employee Stock Purchase Plan as Appendix A to the Company’s
Definitive Proxy Statement, filed with the SEC on March 29, 2004, is
incorporated by reference.
|
|
|
Exhibit 10.9*
|
Employment
Agreement by and between Robert P. van der Merwe and Checkpoint Systems,
Inc. dated December 27, 2007 is incorporated by reference to
Registrant’s Form 10-K for 2007 filed with the SEC on February 28,
2008.
|
|
|
Exhibit 10.10*
|
Amended
to Checkpoint Systems, Inc. 423 Employee Stock Purchase Plan, is hereby
incorporated by reference from Appendix A to Checkpoint System, Inc.’s
definitive proxy statement for the 2009 Annual Meeting of Shareholders
filed with the Securities and Exchange Commission on April 27, 2009 and as
Exhibit 10.1 to the Registrant’s Form 8-K, filed with the SEC on June 8,
2009.
|
|
|
Exhibit 10.11*
|
Checkpoint
Systems, Inc. Amended and Restated 2004 Omnibus Incentive Compensation
Plan is hereby incorporated by reference from Appendix B to Checkpoint
Systems, Inc.’s definitive proxy statement for the 2009 Annual Meeting of
Shareholders filed with the Securities and Exchange Commission on April
27, 2009 and as Exhibit 10.2 to the Registrant’s Form 8-K, filed with the
SEC on June 8, 2009.
|
|
|
Exhibit 10.12
|
Amendment
No. 3 to Rights Agreement, is hereby incorporated by reference to Exhibit
10.1 of the Registrant’s Current Report on Form 8-K, filed with the SEC on
December 22, 2009.
|
|
|
Exhibit 12
|
Ratio
of Earnings to Fixed Charges.
|
|
|
Exhibit 21
|
Subsidiaries
of Registrant.
|
|
|
Exhibit 23
|
Consent
of Independent Registered Public Accounting Firm.
|
|
|
Exhibit 31.1
|
Certification
of the Chief Executive Officer pursuant to Rule 13a-14(a) of the
Exchange Act, as enacted by Section 302 of the Sarbanes-Oxley Act of
2002.
|
|
|
Exhibit 31.2
|
Certification
of the Chief Financial Officer pursuant to Rule 13a-14(a) of the
Exchange Act, as enacted by Section 302 of the Sarbanes-Oxley Act of
2002.
|
|
|
Exhibit 32
|
Certification
of the Chief Executive Officer and the Chief Financial Officer pursuant to
18 United States Code Section 1350, as enacted by Section 906 of the
Sarbanes-Oxley Act of 2002.
|
*
Management contract or compensatory plan or arrangement.
63
(dollar
amounts in thousands)
Allowance
for Doubtful Accounts
|
Year
|
Balance
at
Beginning
of
Year
|
Additions
Through
Acquisition
|
Charged
to
Costs
and
Expenses
|
Deductions
(Write-Offs
and
Recoveries,
net)
|
Balance
at
End
of Year
|
|
2009
|
$
18,414
|
$ 370
|
$
(545)
|
$
(3,715)
|
$
14,524
|
|
2008
|
$
15,839
|
$ 27
|
$
5,783
|
$
(3,235)
|
$
18,414
|
|
2007
|
$
12,417
|
$
2,244
|
$
2,330
|
$
(1,152)
|
$
15,839
|
Deferred
Tax Valuation Allowance
|
Year
|
Balance
at
Beginning
of
Year
|
Additions
Through
Acquisition
|
Allowance
Recorded
on
Current
Year
Losses
|
Release
of
Allowance
on
Current
Year
Utilization
|
Release
of
Allowance
on
Losses
Expired
or
Revalued
|
Balance
at
End
of Year
|
|
2009
|
$
22,717
|
$ —
|
$
4,104
|
$
3,514
|
$ 2,404
|
$
32,739
|
|
2008
|
$
27,572
|
$
1,449
|
$
3,122
|
$
(697)
|
$
(8,729)
|
$
22,717
|
|
2007
|
$
34,510
|
$ —
|
$
1,563
|
$ 854
|
$
(9,355)
|
$
27,572
|
64