Attached files
| file | filename |
|---|---|
| 8-K - FORM 8-K - BIOMET INC | d8k.htm |
 Exhibit 99.1 |
 Biologics Bracing Microfixation Orthopaedics Osteobiologics Spine Sports Medicine Trauma 3i Forward-Looking & Non-GAAP Financial Measures 2 Forward-Looking Statements This presentation may contain forward-looking statements. They will be based upon management's current
expectations and will involve certain risks and uncertainties. Actual results may differ
materially from those contemplated by the forward looking statements due to, among others, the
following factors: the success of the Company’s principal product lines; the results of ongoing investigations by the United States Department of Justice and the United States Securities and Exchange Commission; the ability
to successfully implement new technologies; the Company’s ability to sustain sales and
earnings growth; the Company’s success in achieving timely approval or clearance of its
products with domestic and foreign regulatory entities; the impact to the business as a result of compliance with federal, state and foreign governmental regulations and with the Corporate Integrity Agreement; the impact to the
business as a result of the economic downturn in both foreign and domestic markets; the
possible enactment of federal or state health care reform; the impact of anticipated changes in
the musculoskeletal industry and the ability of the Company to react to and capitalize on those changes; the ability of the Company to successfully implement its desired cost-saving initiatives; the success of the
Company’s transition of certain manufacturing operations to China; the ability of the
Company’s customers to receive adequate levels of reimbursement from third-party payors; the Company’s ability to maintain its existing intellectual property rights and obtain future
intellectual property rights; the Company’s ability to retain existing independent sales
agents for its products; and other factors set forth in the Company’s filings with the SEC, including the Company’s most recent annual report on Form 10-K and quarterly reports on Form
10-Q. The inclusion of a forward- looking statement herein should not be regarded as a
representation by the Company that the Company’s objectives will be achieved. The Company
undertakes no obligation to update publicly or revise any forward-looking statements, whether as a result of new information, future events or otherwise. Accordingly, the reader is cautioned not to place undue reliance
on forward-looking statements which speak only as of the date on which they were
made. Non-GAAP Financial Measures This presentation contains the use of non-GAAP financial measures, such as net sales excluding dental
sales and/or the impact of foreign currency (constant currency), operating income as adjusted,
net income as adjusted, free cash flow, unlevered free cash flow, net debt, Earnings Before
Interest, Taxes, Depreciation and Amortization (EBITDA) and Adjusted EBITDA (as defined by our bank agreement, the method to calculate this is likely to be different from methods used by other companies). These
non-GAAP measures are not in accordance with, or an alternative for, generally accepted
accounting principles in the United States. Biomet management believes that these
non-GAAP measures provide useful information to investors; however, this additional non-GAAP financial information is not meant to be considered in isolation or as a substitute for financial information prepared in accordance with
GAAP. Reconciliations of these non- GAAP financial measures to the most directly
comparable GAAP measures are included on the Biomet website at Biomet.com. |
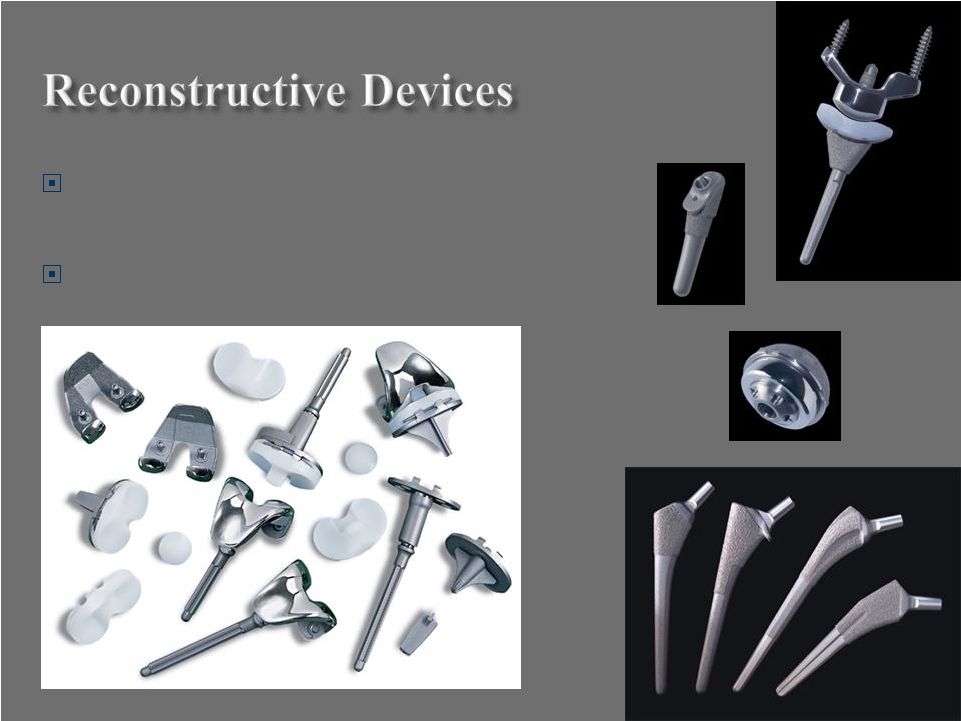
 Summary Business Overview Summary Business Overview 7,000+ team members 3,000+ sales representatives 900+ new products introduced FY 2000 – 2009 Operations in 50+ locations Products distributed in ~90 countries Eight strategic business units 3 Company Profile Asia-Pac/ROW 11% United States 61% Europe 28% FY 2009 Revenues FY 2009 Revenues by Product Segment by Product Segment $2.5B $2.5B FY 2009 Revenues FY 2009 Revenues by Geography by Geography $2.5B $2.5B Joint Reconstructive 63% Spine 9% Other (sports med +) 8% Fixation 9% Dental 11% |
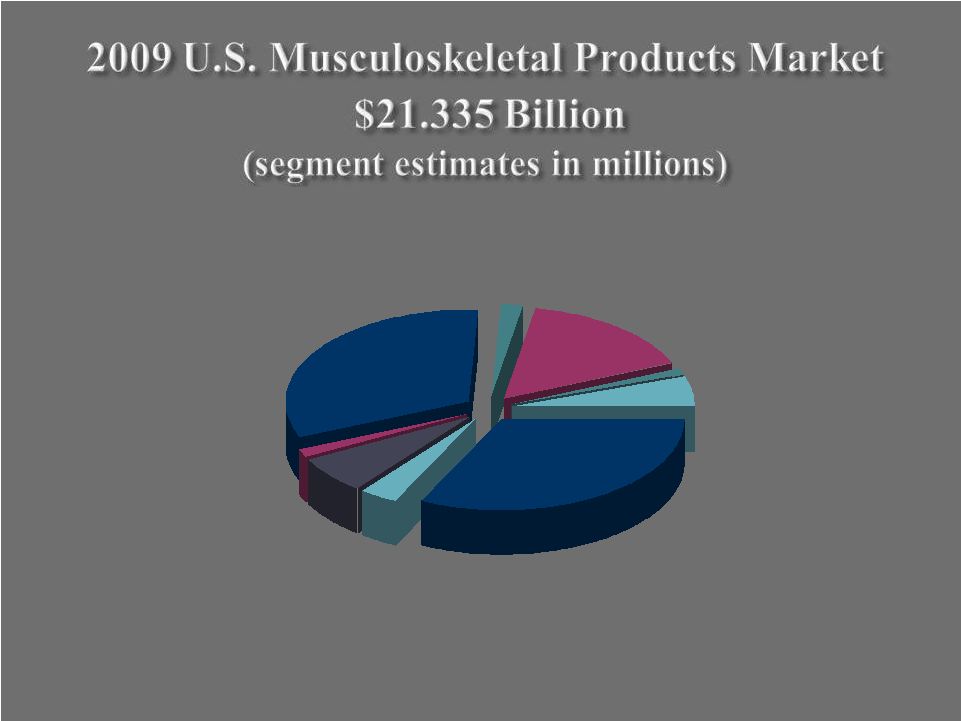 Orthopedic Reconstructive Devices $6,875 Dental Reconstructive Implants $740 Softgoods & Bracing $1,120 Sports Medicine $1,370 Bone Cements & Accessories $330 Spinal Products $6,865 O.R. Supplies $395 Fixation $3,395 Powered Surgical Equipment $245 4 |
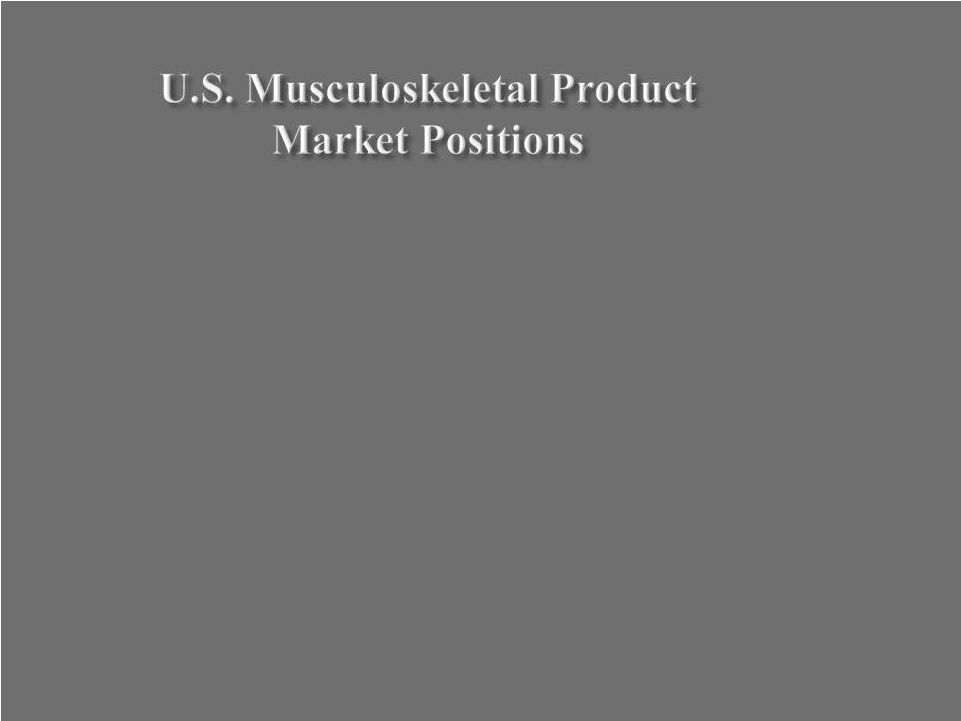 #1 J & J/DePuy #2 Stryker/Howmedica #3 Zimmer/Centerpulse #4 #4 Biomet Biomet #5 Synthes/Stratec #6 Smith & Nephew 5 |
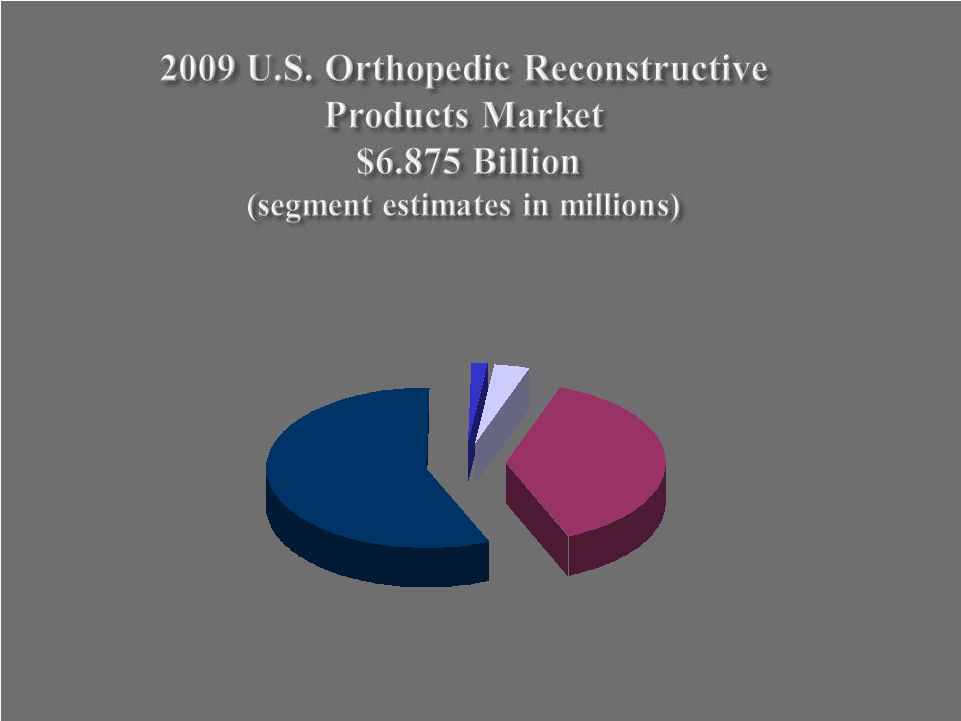 Hips $2,620 Knees $3,890 Other $110 Shoulders $255 6 |
 Demographics 55- to 75-Year-Old U.S. Population Expected to Grow > 32% in 10 Years* Expansion of Target Population New Technologies to Treat Younger Patients Greater Activity Level & Improved Health of Elderly 54.8 Million 72.4 Million 2019 2009 *U.S. Census Bureau Projections 7 |
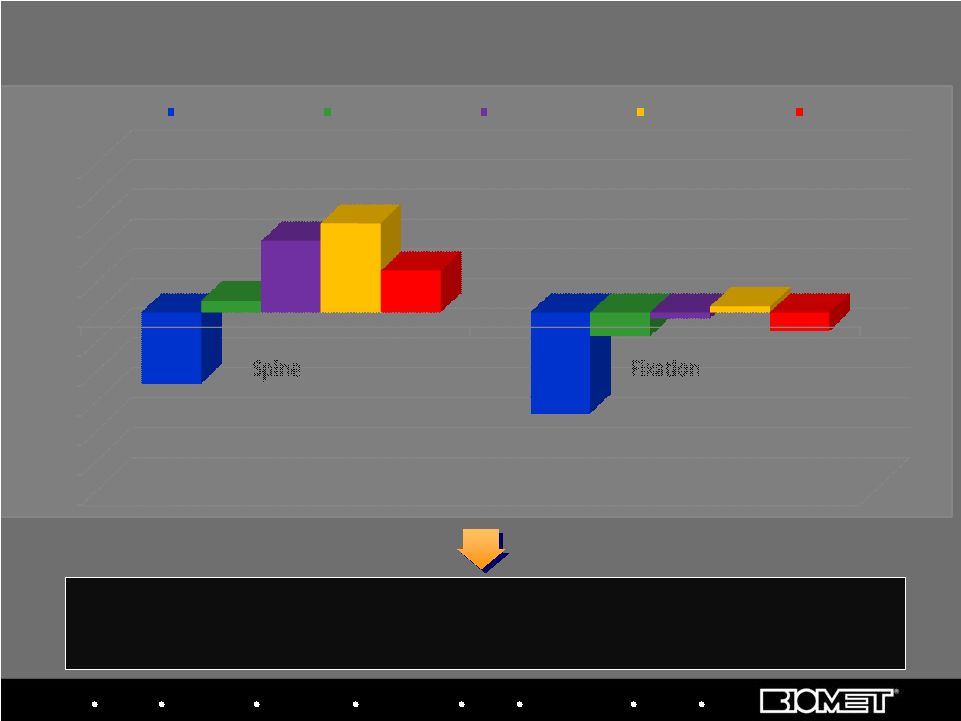
 H1 FY ’10 Growth FY 2009 Growth FY 2009 Growth FY 2008 Growth FY 2008 Growth Recon Ex-Dental 8%
13% 12% 9% Dental
12% 13% (6%) (7%) Recon
9% 13% 9% 7% Fixation
(11%) 0% 4% (1%) Spine
(8%) 0% 7% 11% Other
(1%) 6% 7% 8% Total
3% 10% 8% 6% 8 Growth has rebounded from FY’07 levels, driven by core orthopedics business off-setting
dental headwind Sales Growth by Product Segment at Constant Currency FY 2007 Growth FY 2007 Growth Total Ex-Dental 2% 9%
10% 8% Note: Rates exclude U.S. instrument sales; 2007 reflects “as previously
reported” with month lag reporting for OUS locations |
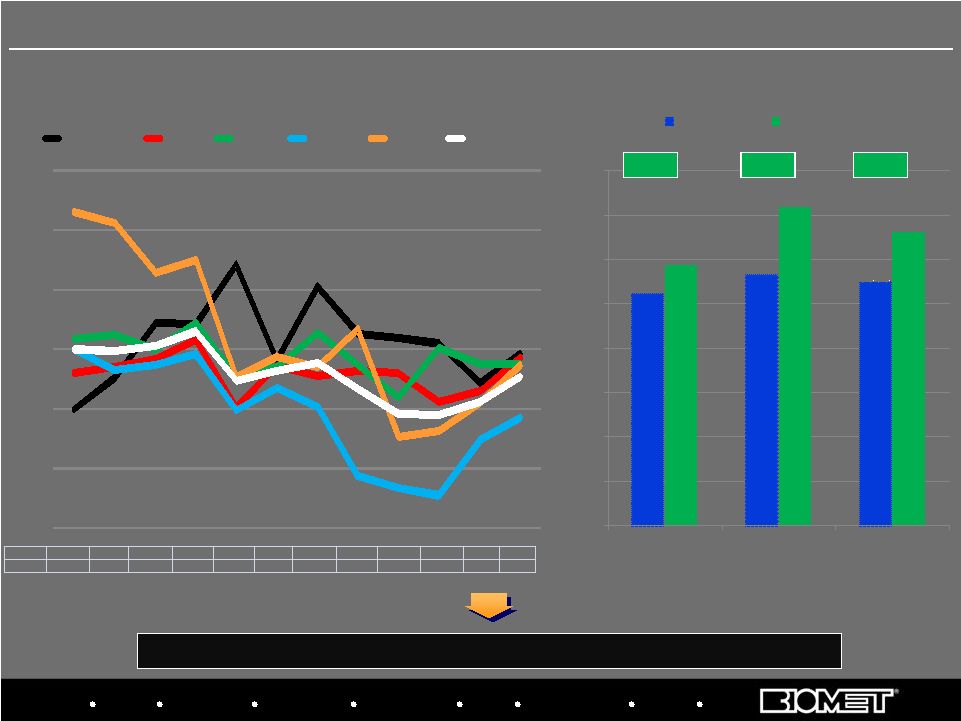 Biologics Bracing Microfixation Orthopaedics Osteobiologics Spine Sports Medicine Trauma 3i Fended off significant competitive threat and re-established sales momentum U.S. Hip/Knee Growth Rates by Calendar Quarter* BIOMET 4.9% 7.5% 12.2% 12.1% 17.1% 9.0% 15.3% 11.3% 10.9% 10.4% 7.1% 9.5% MARKET 10.0% 9.9% 10.3% 11.5% 7.3% 8.2% 8.9% 6.6% 4.5% 4.4% 5.5% 7.6% Biomet’s U.S. Hip/Knee Market Share Growth* *Based on internal estimates; Biomet data from corresponding fiscal quarters JNJ’s Q4’09 growth rate has been adjusted to exclude extra selling days 9 10.5% 11.3% 11.0% 11.8% 14.4% 13.3% 0.0% 2.0% 4.0% 6.0% 8.0% 10.0% 12.0% 14.0% 16.0% U.S. Hips U.S. Knees U.S. Hips/Knees QE 03/31/07 QE 09/30/09 +1.3% +3.1% +2.3% U.S. Orthopaedics Performance vs. Market -5.0% 0.0% 5.0% 10.0% 15.0% 20.0% 25.0% Q1'07 Q2'07 Q3'07 Q4'07 Q1'08 Q2'08 Q3'08 Q4'08 Q1'09 Q2'09 Q3'09 Q4'09 BIOMET JNJ SYK ZMH SNN MARKET |
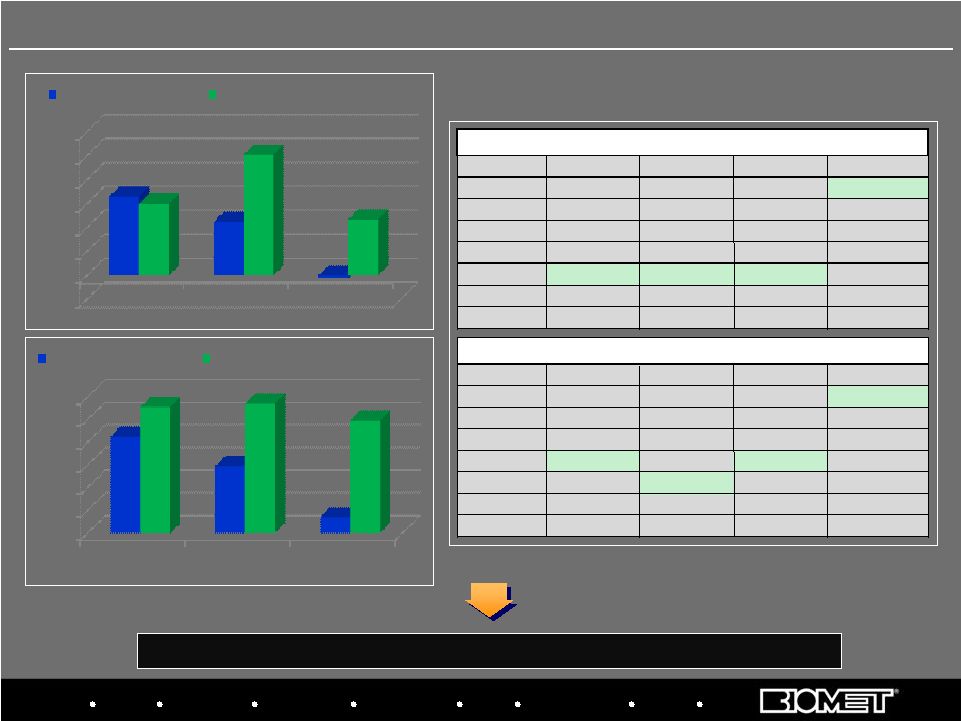 Biologics Bracing Microfixation Orthopaedics Osteobiologics Spine Sports Medicine Trauma 3i Biomet Europe has grown substantially ahead of the market in 2008 and 2009 EU Market Share Positions CY 2007 vs. H1 CY 2009 10 Biomet Europe Performance vs. Market Data based on Company estimates 0.0% 2.0% 4.0% 6.0% 8.0% 10.0% 12.0% CY 2007 CY 2008 Jan-Nov'09 8.5% 5.9% 1.4% 11.1% 11.4% 9.9% EU KNEE MARKET GROWTH BIOMET EUROPE KNEE SALES GROWTH -2.0% 0.0% 2.0% 4.0% 6.0% 8.0% 10.0% 12.0% CY 2007 CY 2008 Jan-Nov'09 6.6% 4.5% -0.2% 6.0% 10.1% 4.7% EU HIP MARKET GROWTH BIOMET EUROPE HIP SALES GROWTH POSITION TOTAL HIPS KNEES BONE CEMENT 1 Zimmer Zimmer Zimmer Biomet 2 Depuy Depuy Depuy Depuy 3 Stryker Stryker Smith&Nephew Stryker 4 Smith&Nephew Smith&Nephew Stryker Zimmer 5 Biomet Biomet Smith&Nephew 6 Aesculap Aesculap Aesculap WrightMedical 7 WrightMedical WrightMedical WrightMedical Aesculap COMPANY RANKING (Jan-Dec 2007) POSITION TOTAL HIPS KNEES BONE CEMENT 1 Zimmer Zimmer Zimmer Biomet 2 Depuy Depuy Depuy Depuy 3 SmithNephew Stryker SmithNephew Stryker 4 Biomet SmithNephew Biomet Zimmer 5 Stryker Biomet Stryker SmithNephew 6 Aesculap Aesculap Aesculap WrightMedical 7 WrightMedical WrightMedical WrightMedical Corin COMPANY RANKING (Jan-Jun 2009) Biomet |
 Biologics
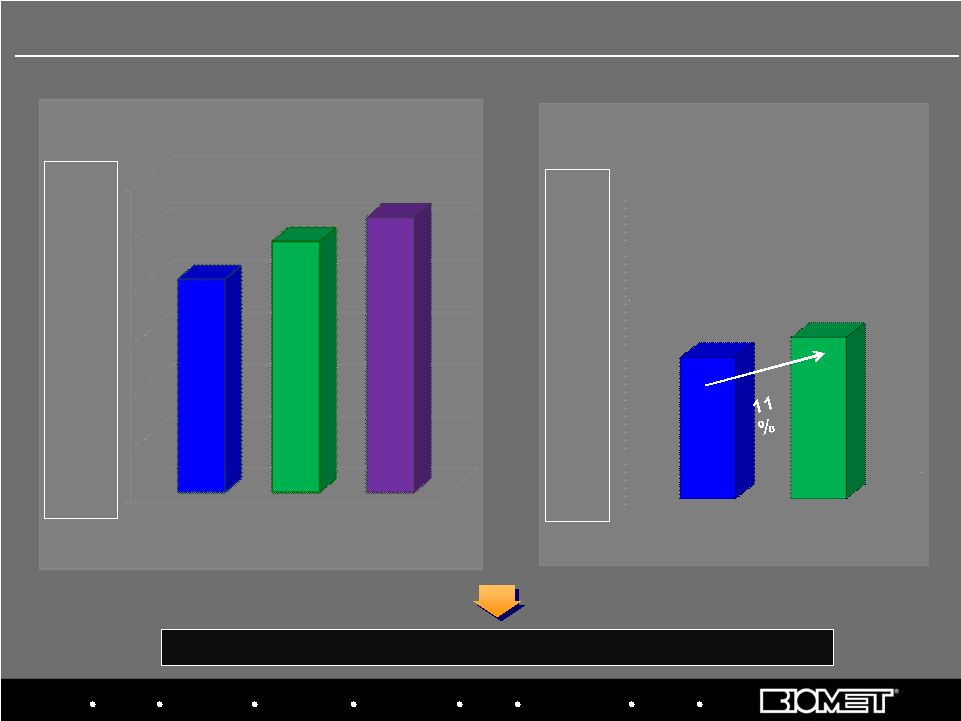
Bracing Microfixation Orthopaedics Osteobiologics Spine Sports Medicine Trauma 3i $- $50.0 $100.0 $150.0 $200.0 $250.0 $300.0 $137.1 $156.4 Primarily includes Canada, South America, Mexico and the Pacific Rim $- $50.0 $100.0 $150.0 $200.0 $250.0 $300.0 $205.0 $241.2 264.5 11 International Sales at Constant Currency Growth Rates In Millions FY’07 FY’08 FY’09 13% 12% 8% H1 FY’09 H1 FY’10 Fiscal Years 2007 - 2009 H1 FY 2009 vs. H1 FY 2010 Y/Y Constant Currency Growth Rates |
 Recon Sales Increased 6% Worldwide (C.C.) during Q2’10 Sales Increased 9% in the U.S. 12 |
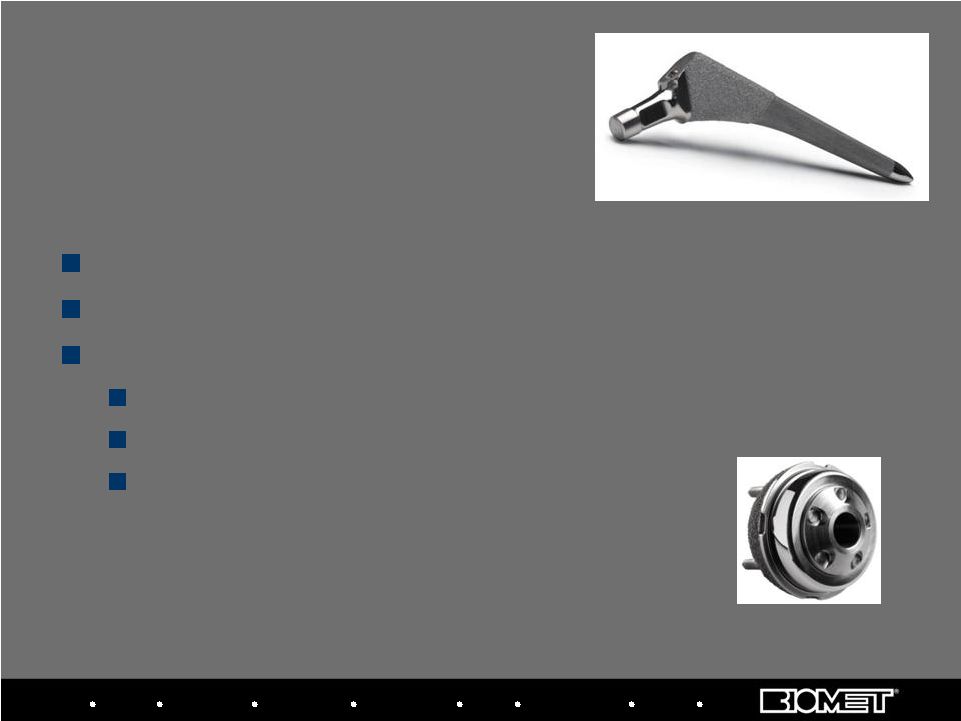 Sales Grew 4% WW (C.C.) during Q2’10 Sales Increased 7% in the U.S. New Product Introductions E1 Antioxidant Infused Technology Plus Liners Echo Bi-Metric PPS Primary Stem Magnum Tri-Spike Acetabular Components 13 Biologics Bracing Microfixation Orthopaedics Osteobiologics Spine Sports Medicine Trauma 3i Hips Hips |
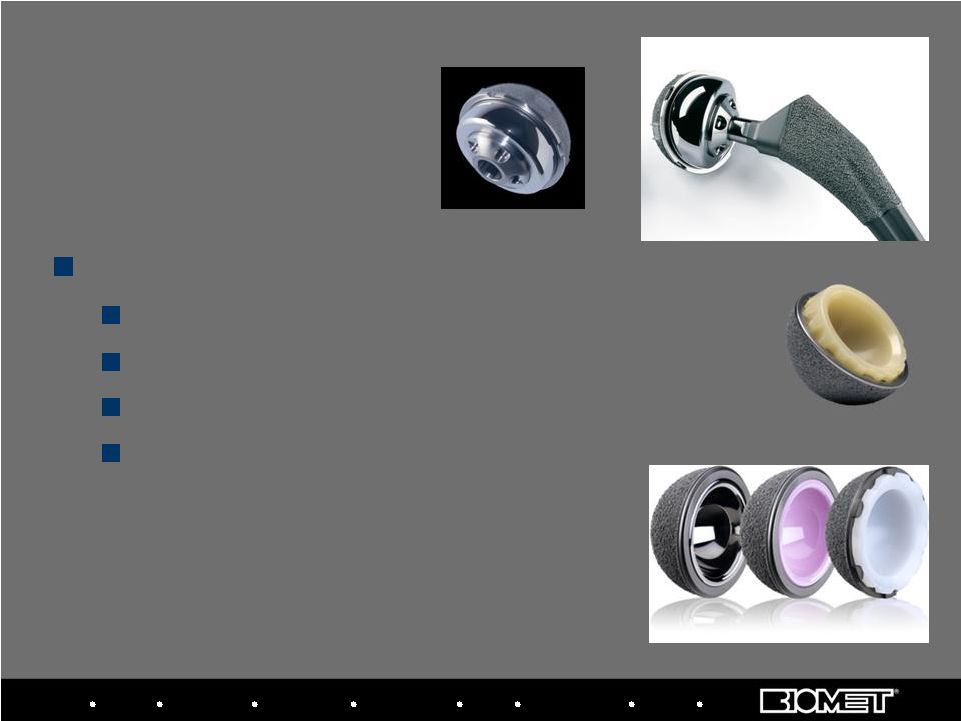 14 Biologics Bracing Microfixation Orthopaedics Osteobiologics Spine Sports Medicine Trauma 3i Hips Hips Key Products M ² a-Magnum Acetabular System Taperloc Hip Stem E1 Antioxidant Infused Acetabular Bearings Exceed ABT (Advanced Bearing Technologies) Acetabular System* *Not Available in U.S. B T |
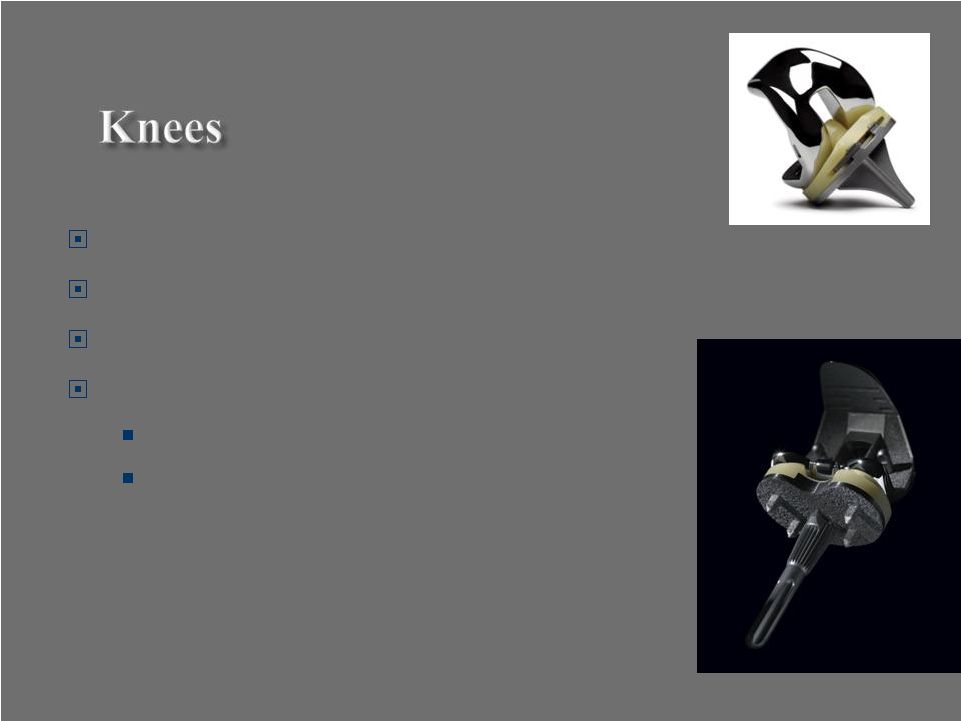 #4 U.S. Market Position Sales Grew 12% WW (C.C.) during Q2’10 Sales Increased 11% in the U.S. New Product Introductions E1 Antioxidant Infused Tibial Bearings Regenerex Press-Fit Tibia 15 |
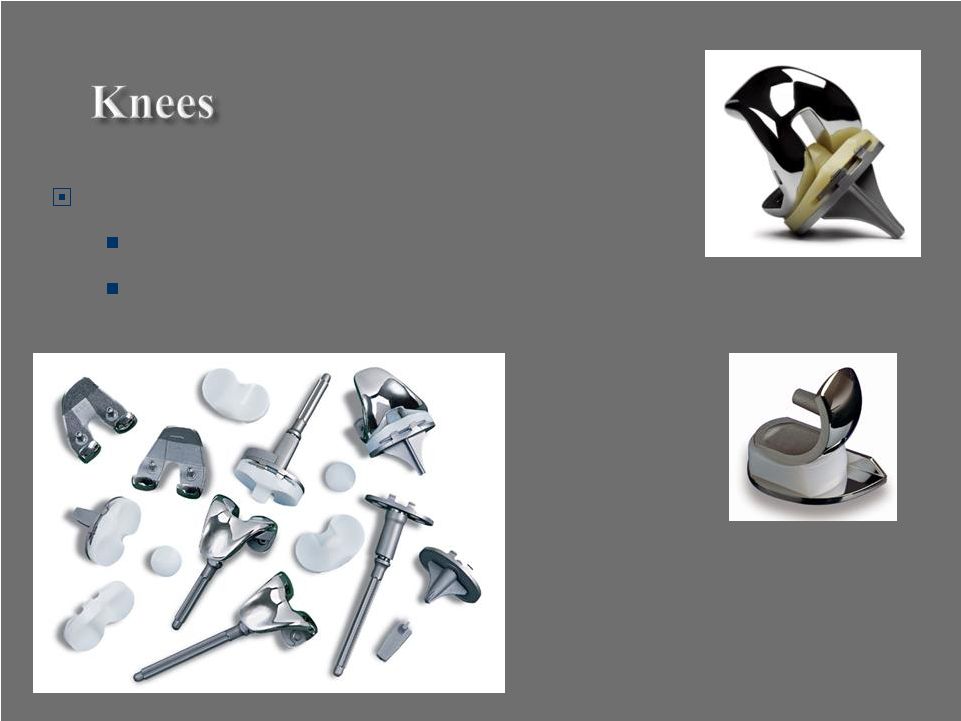 Key Products Vanguard Complete Knee System Oxford Partial Knee System 16 |
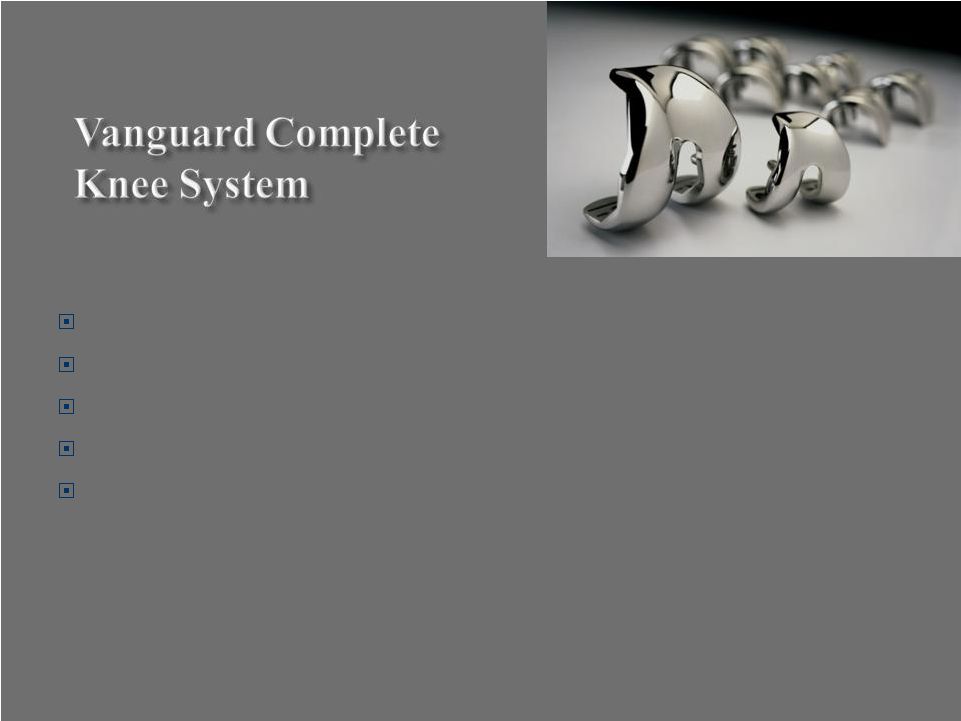 Designed to Address the Entire Population 10 Femoral and 9 Tibial Sizes, completely interchangeable No Need to “Correct” Our Sizing for the Female Population No Peer-Reviewed Studies Associating Failure with Gender Biomet Knees = 98% Survivorship at 15 Years (Mensch, JS, Knee Morphology as a Guide to Knee Replacement, CORR, 1975) 17 |
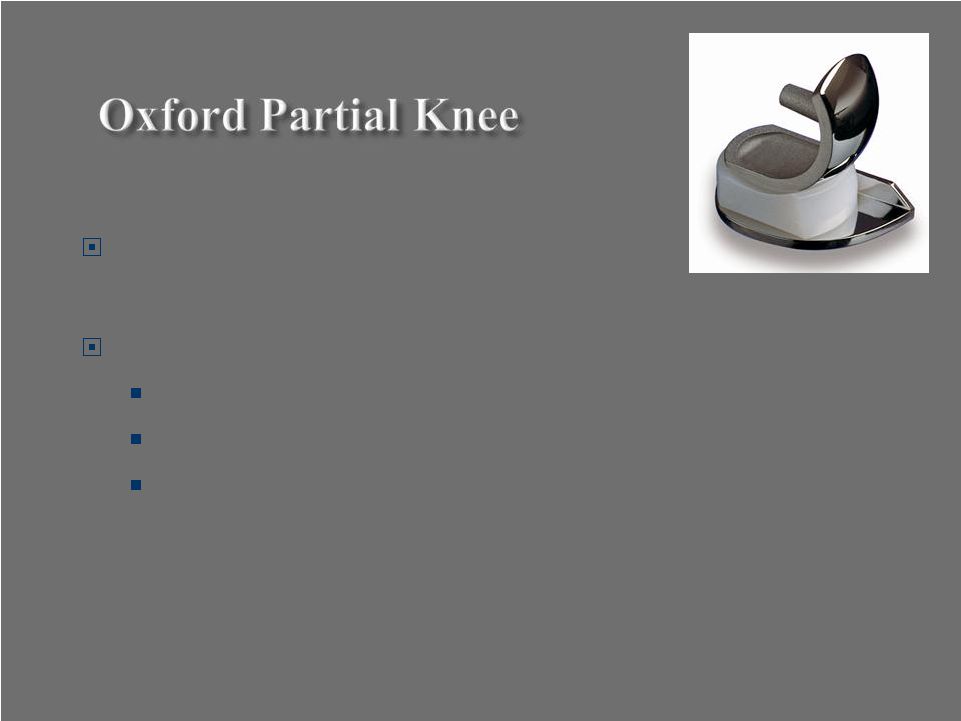 Only Free Floating Meniscal Bearing Partial Knee Approved in U.S. Excellent Long-Term Clinical Results 98% Success Rate at 10 Years 95% Success at 15 Years 92% Success at 20 Years 18 |
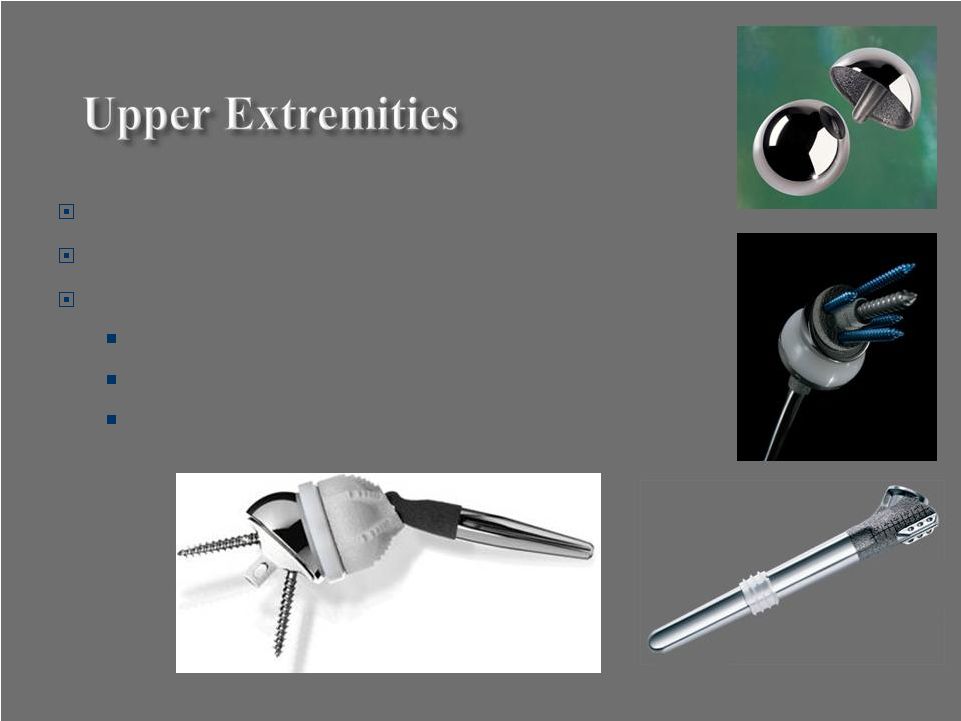 Sales Grew 27% WW (C.C.) during Q2’10 Sales Increased 44% in the U.S. Key Products Comprehensive Primary and Reverse Shoulders Copeland Humeral Resurfacing Head T.E.S.S. *Not Available in U.S. 19 (Total Evolutive Shoulder System)* |
 Key Products Cobalt G HV Bone Cement StageOne Cement Hip Spacer Molds StageOne Cement Knee Spacer Molds 20 |
 New Product Introductions Bone Graft Convenience Kit Clotalyst System Coaxial Sprayer 21 |
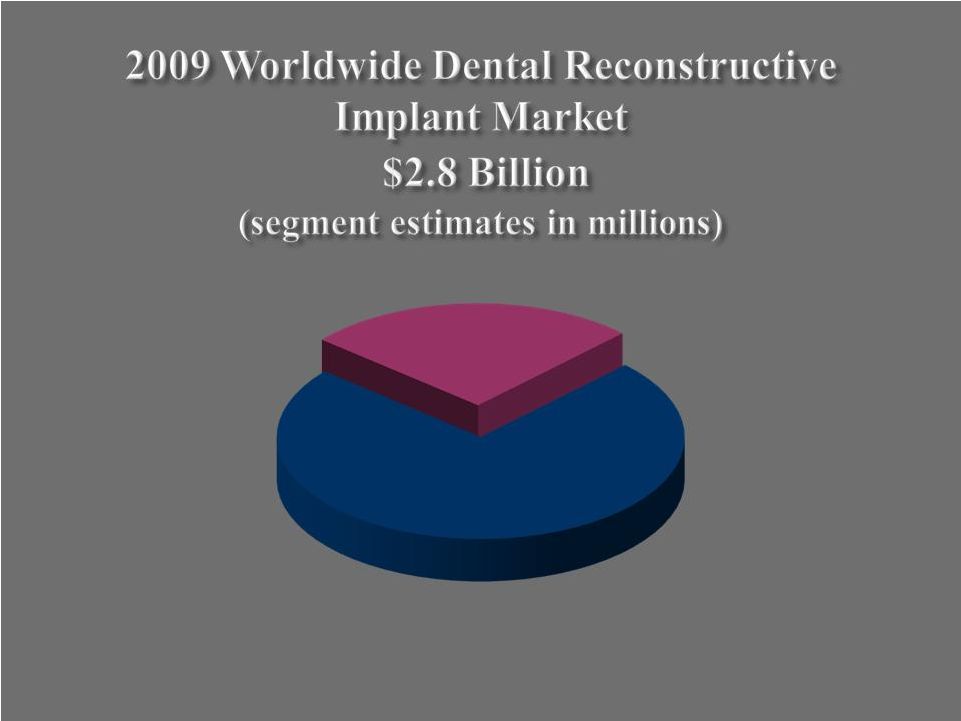 United States $740 International $2,060 22 |
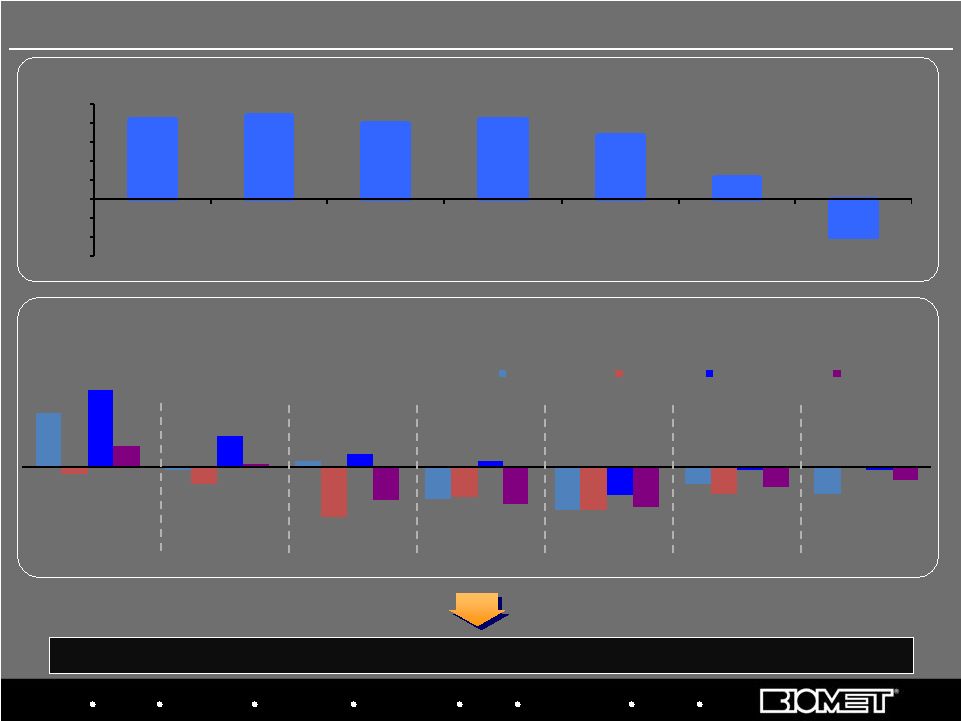 Biologics Bracing Microfixation Orthopaedics Osteobiologics Spine Sports Medicine Trauma 3i 16% (1%) 2% (10%) (13%)(13%) (5%) (8%) (2%) (5%) (15%) (9%) (8%) 0% 23% 9% 4% 2% (8%) (1%) (1%) 6% 1% (10%) (11%) (12%) (6%) (4%) Q2 2008 Q3 2008 Q4 2008 Q1 2009 Q2 2009 Q3 2009 Q4 2009 Biomet 3i Nobel Straumann Zimmer (15%) (10%) (5%) 0% 5% 10% 15% 20% 25% CY 03 CY 04 CY 05 CY 06 CY 07 CY 08 CY 09E DENTAL IMPLANT MARKET (Constant Currency Sales Growth) QUARTERLY SALES GROWTH Constant-Currency, Based on Calendar Quarters (with Biomet’s Corresponding Fiscal
Quarters) Source: Bank of America, 27-Jul-09 Biomet 3i: Industry Headwinds After years of double-digit growth, 3i and dental industry facing significant economic headwinds 23 |
 Biomet 3i’s New Introductions Encode Complete Zirconia Abutment Low Profile Conical Abutments The DU1000 Surgical Drill System ZiReal Art Ceramic Abutment 24 |
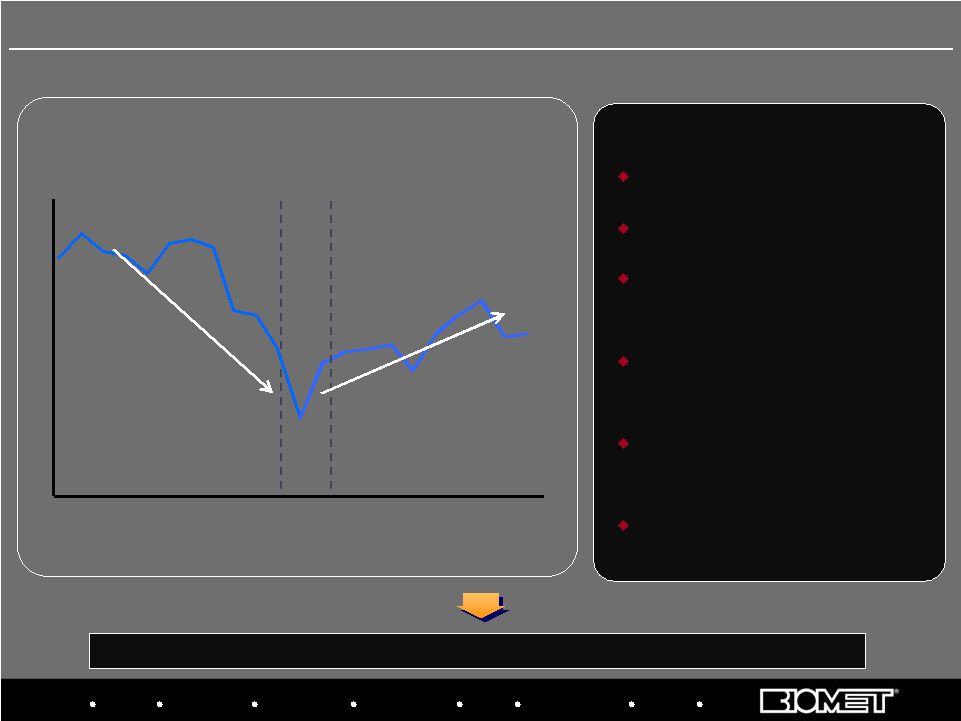 Biologics Bracing Microfixation Orthopaedics Osteobiologics Spine Sports Medicine Trauma 3i 1Q 2Q 3Q 4Q 1Q 2Q 3Q 4Q 1Q 2Q 3Q 4Q 1Q 2Q 3Q 4Q 1Q 2Q 3Q 4Q 1Q 2Q Transaction Announced Transaction Closed Overhauled management team Fixed systems issues Created focused sales forces around spine and trauma Developed tools to improve sales force metrics and effectiveness Revamped new product development processes Improved surgeon education programs KEY INITIATIVES Quarterly Sales Progress in Fiscal 2008, 2009 and H1 2010 2006 2007 2008 2005 2009 25 Strategic Priority: Turn Around U.S. Trauma and Spine Stabilization and return to growth has been led by spine, but trauma turnaround lags 2010 |
 Stabilization and return to growth has been led by spine, but trauma turnaround lags; Fixation rates reflect above market craniomaxillofacial growth, more than offset by trauma, which is expected to show growth in fiscal 2011 By Fiscal Year, FY07-FY09 and Fiscal Quarter, Q1’10 – Q2’10 26 U.S. Spine and Fixation Sales Growth Trends* -30% -25% -20% -15% -10% -5% 0% 5% 10% 15% 20% 25% Spine Fixation FY'07 FY'08 FY'09 Q1'10 Q2'10 Biologics Bracing Microfixation Orthopaedics Osteobiologics Spine Sports Medicine Trauma 3i |
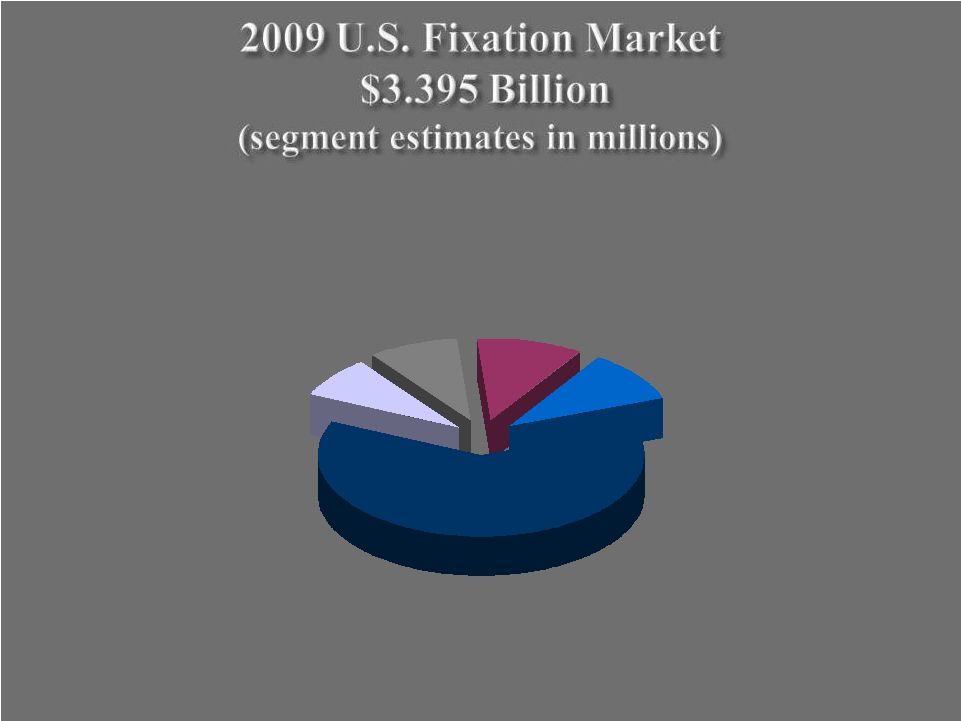 Internal Fixation $2,110 Craniomaxillofacial Fixation $275 Electrical Stimulation $300 External Fixation $365 Growth Factors & Bone Substitute Materials $345 27 |
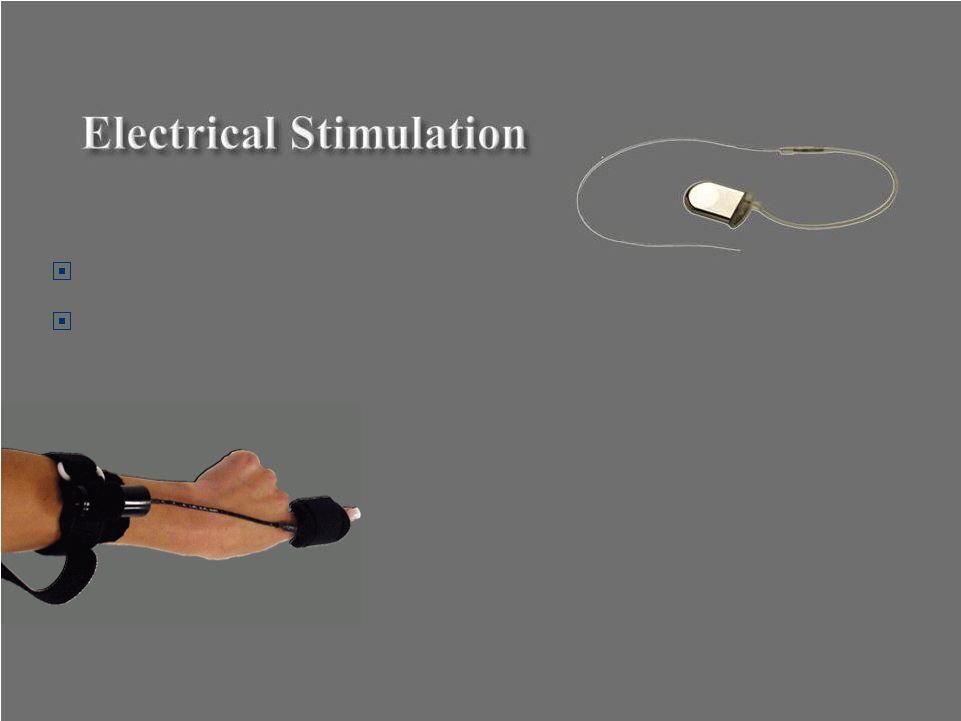 PEMF, DC, & CC Technologies FDA Acknowledged Mechanism of Action Involving Cascade of BMPs 28 |
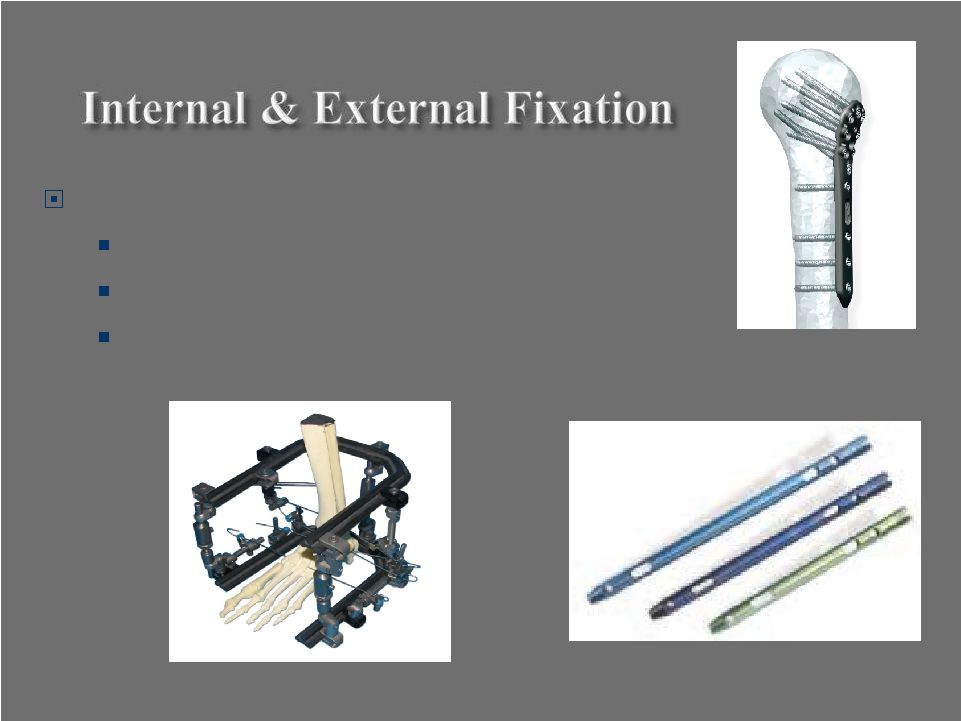 Key Products OptiLock Proximal Humeral Plating System Phoenix Ankle Arthrodesis Nail Advanced Vision Foot Ring System 29 |
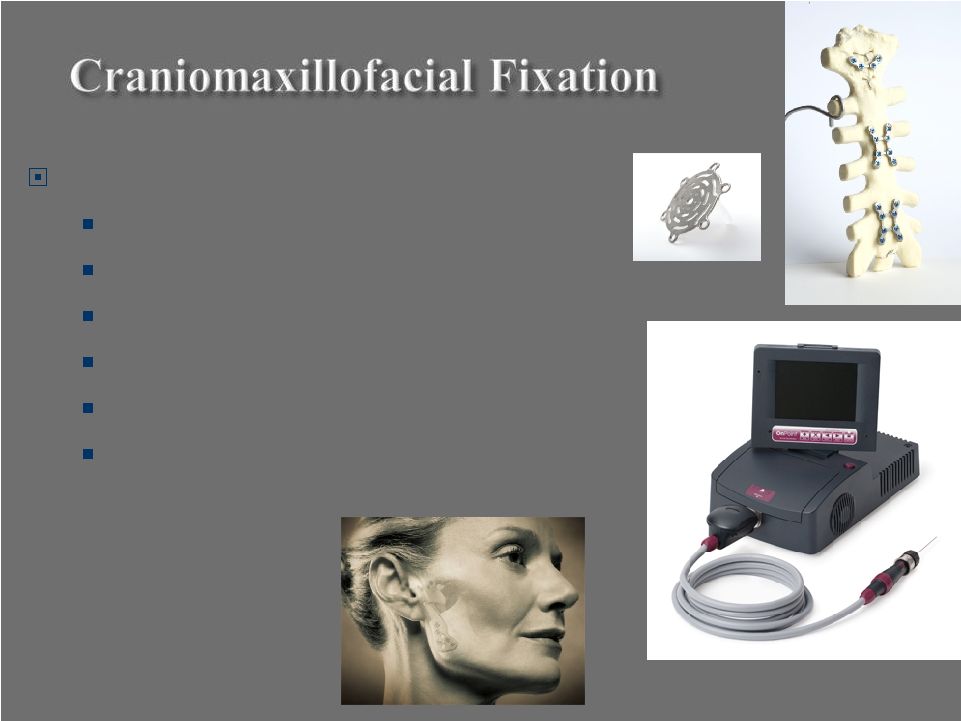 New Product Introductions Custom TMJ Innovative Screw Delivery Device Neuro NexGen Next Gen Sternalock OnPoint 1.2mm Scope System Xpander (TMJ Jaw Motion Rehab System) 30 |
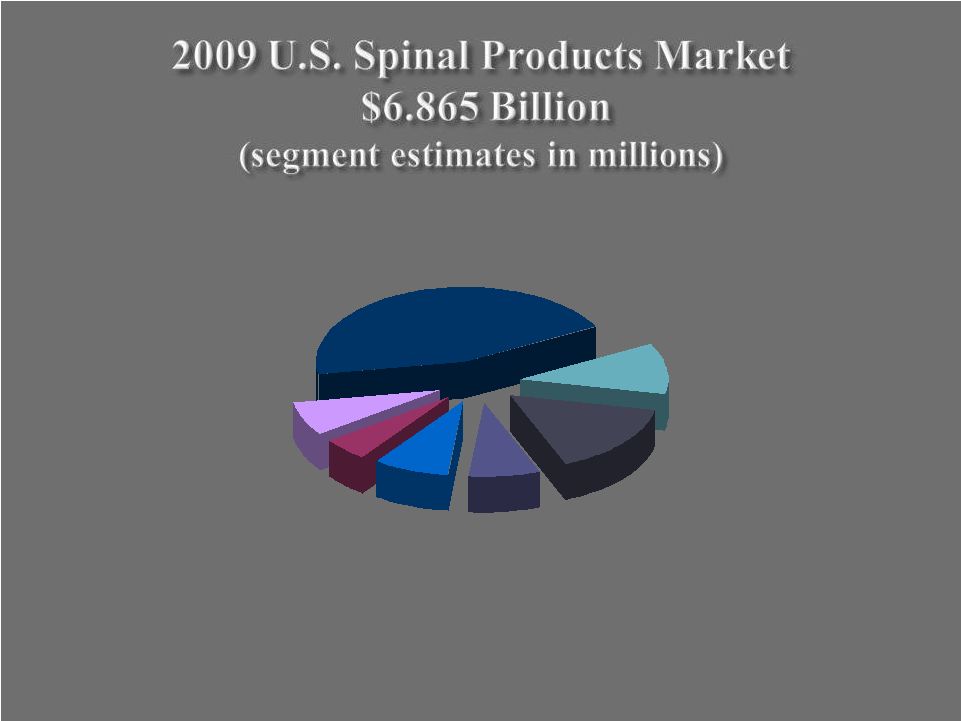 Machined Allograft $520 Growth Factors & Bone Substitutes $1,075 Intervertebral Spacers $755 Electrical Stimulation $330 Motion Preservation $590 Plates, Rods, Screws $3,095 Vertebroplasty $500 31 |
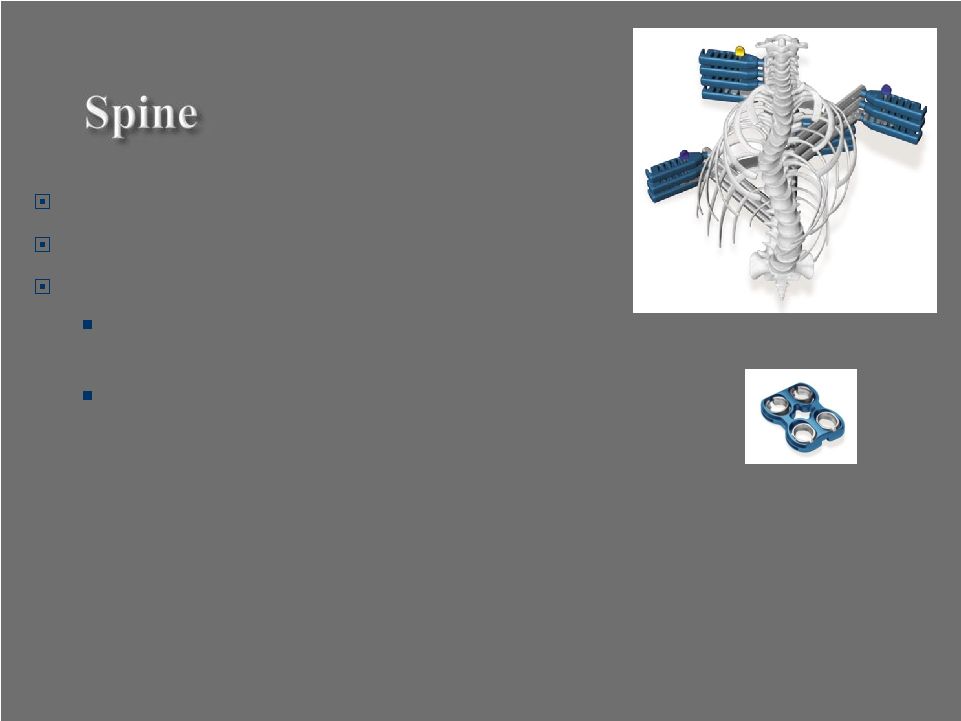 Sales Grew 6% WW (C.C.) during Q2’10 Sales Increased 7% in the U.S. New Product Introductions Polaris Deformity Direct Vertebral Column Derotation System C-Tek MaxAn Cervical Plate System* *The C-Tek MaxAn Cervical Plate System incorporates technology developed by Gary K. Michelson, M.D. 32 |
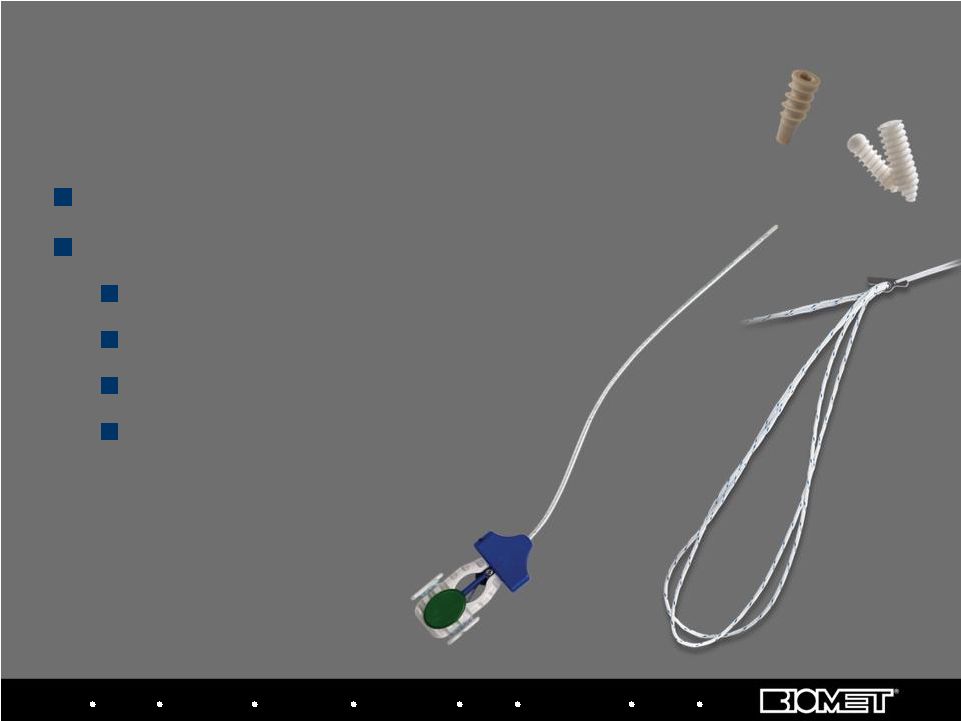 Procedure-Specific Arthroscopy Products New Product Introductions ALLthread Knotless Suture Anchor ComposiTCP Interference Screw MicroMax FLEX Suture Anchor ZipTight Fixation System 33 Sports Medicine Sports Medicine Biologics Bracing Microfixation Orthopaedics Osteobiologics Spine Sports Medicine Trauma 3i |
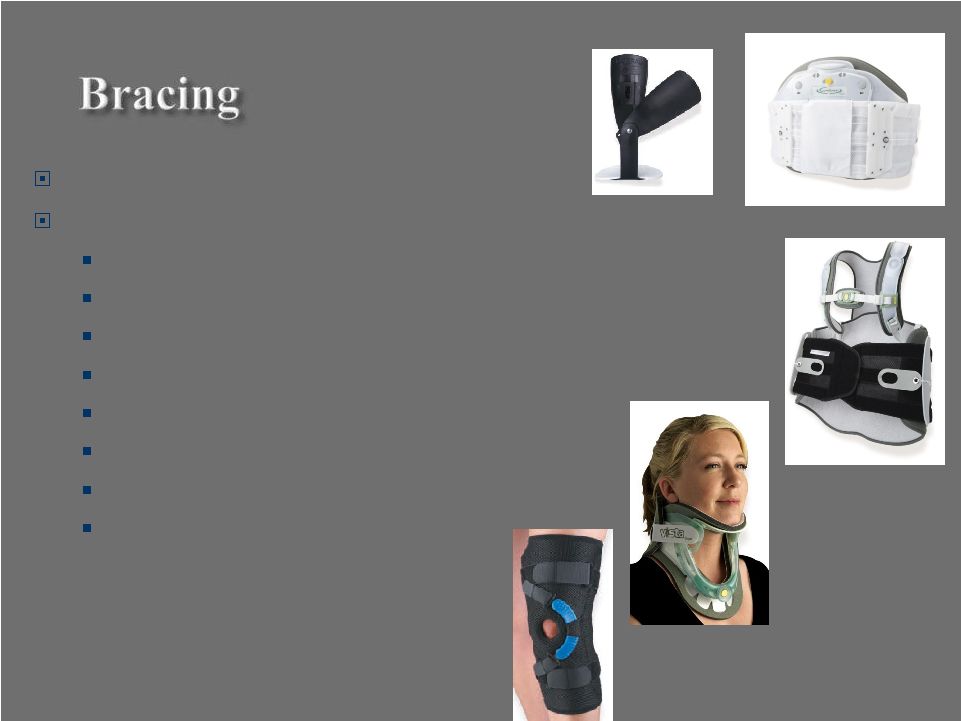 #4 U.S. Market Position New Product Introductions Active Ankle CF Pro Aspen Contour LSO
(Lumbar-Sacral-Orthosis) Aspen
Contour TLSO (Thoracic-Lumbar-Sacral Orthosis) Aspen QuickDraw RAP (R igid Anterior Panel) Aspen TX Collar Aspen Vista Collar Biomet Cool Sport P.A.S.S. Performance OTS OA Knee Brace 34 |
 35
|
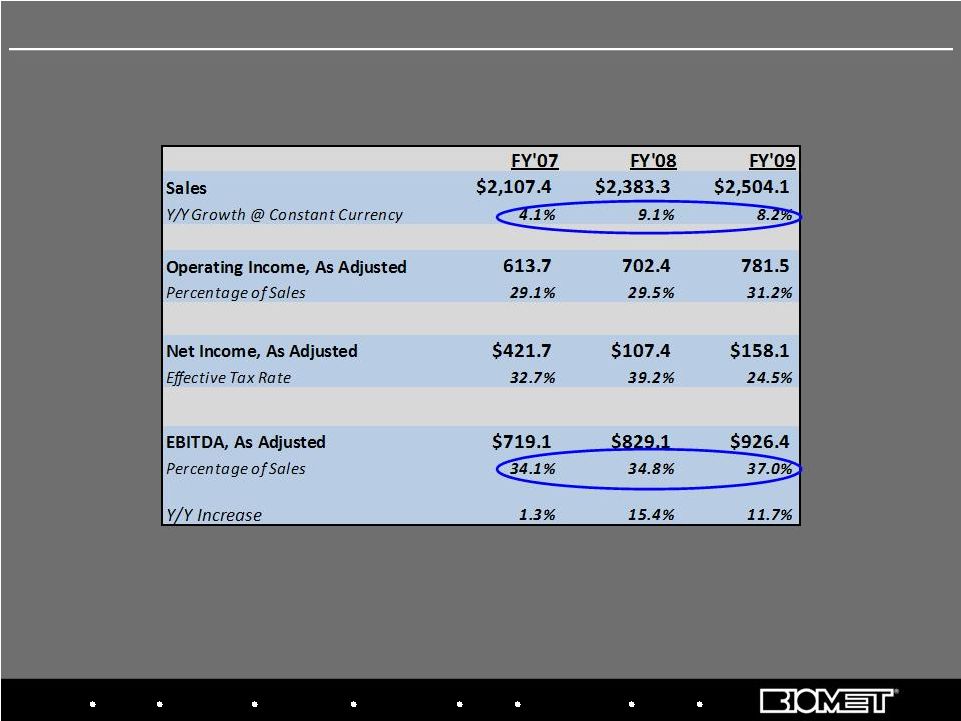 36 Adjusted Net Income and Adjusted EBITDA reflect add-backs to GAAP results for non-cash
amortization and stock comp expense, sponsor fees and other special charges Fiscal 2007 – 2009 Adjusted Operating Results Biologics Bracing Microfixation Orthopaedics Osteobiologics Spine Sports Medicine Trauma 3i |
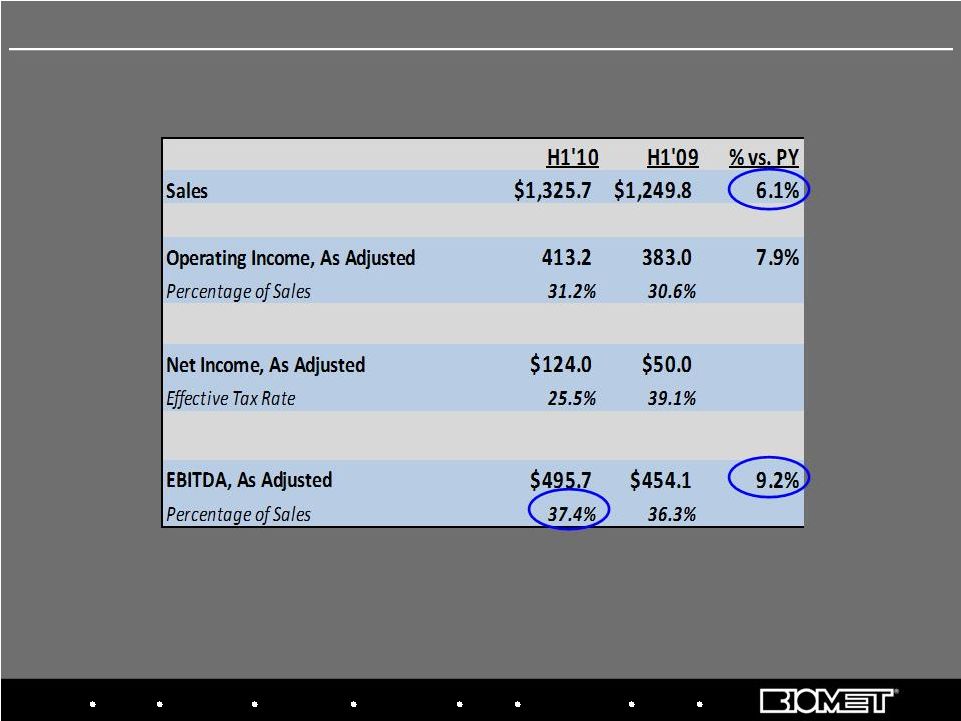 37 Adjusted Net Income and Adjusted EBITDA reflect add-backs to GAAP results for non-cash
amortization and stock comp expense, sponsor fees and other special charges H1 Fiscal 2010 vs. H1 Fiscal 2009 Adjusted Operating Results Biologics Bracing Microfixation Orthopaedics Osteobiologics Spine Sports Medicine Trauma 3i |
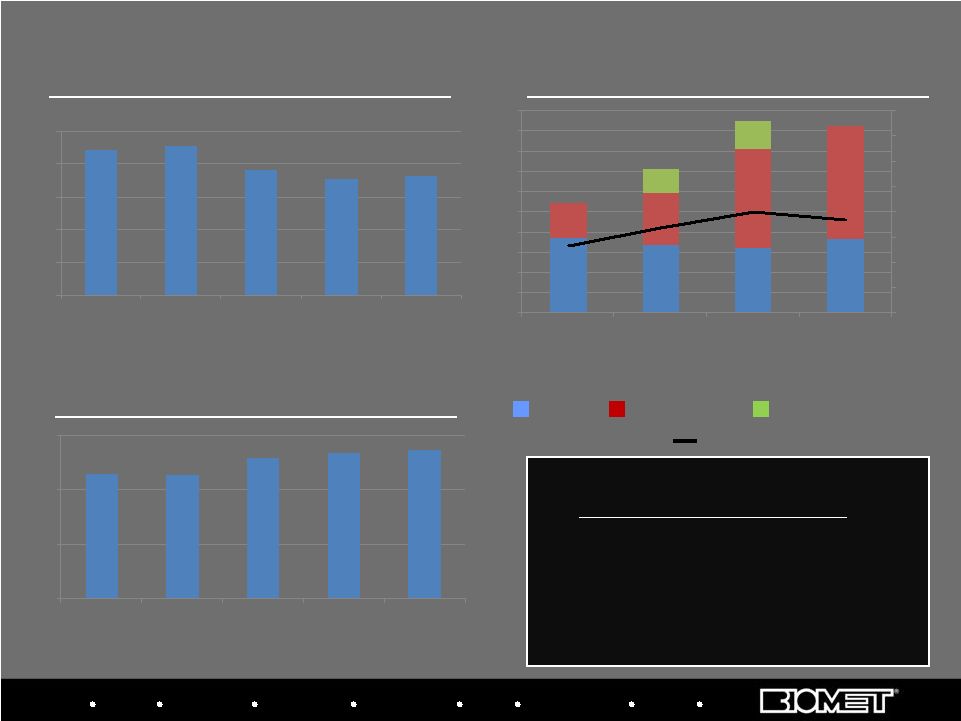 Biologics Bracing Microfixation Orthopaedics Osteobiologics Spine Sports Medicine Trauma 3i CAPITAL EXPENDITURES RECEIVABLE DAYS (1) INVENTORY TURNOVER, ADJUSTED (2) 38 88 91 76 71 73 0 20 40 60 80 100 FY 2006 FY 2007 FY 2008 FY 2009 11/30/2009 1.15 1.14 1.30 1.34 1.37 0 0.5 1 1.5 FY 2006 FY 2007 FY 2008 FY 2009 11/30/2009 74 67 64 73 35 52 99 112 24 27 5.4% 6.7% 8.0% 7.4% 0.0% 2.0% 4.0% 6.0% 8.0% 10.0% 12.0% 14.0% 16.0% 0 20 40 60 80 100 120 140 160 180 200 FY 2006 FY 2007 FY 2008 FY 2009 109 143 190 185 Balance Sheet & Cash Flow Data Other Capex Instruments Placed Distributor Instrument Buybacks As a % of Sales Working Capital Initiatives • Tax efficient global Supply Chain • Receivables Management • Centralized Treasury Simple average of the quarterly calculations (2) See reconciliation of the cost of sales to exclude special items at www.biomet. com (1) |
 In Millions, Unaudited 39 GAAP Operating Cash Flow Reconciled to Free Cash Flow (FCF) & Unlevered FCF H1 Fiscal 2010 vs. H1 Fiscal 2009 Six Months Ended Six Months Ended November 30, 2009 November 30, 2008 Change Cash From Operations 81.1 $
47.6 $
Capital
expenditures (106.0) (92.9) Free Cash Flow (24.9) $
(45.3) $
Acquisitions, net of cash
acquired (9.0) (2.2) Proceeds from sale and maturities of investments 2.5 - Capital contributions - 1.9 Repurchase of common shares (1.1) (0.6) Add back: cash paid for interest 257.1 277.1 Effect of exchange rates on cash 0.3 (7.8) Unlevered Free Cash Flow 224.9 $
223.1 $
0.8% Total Cash Special Items 84.5 26.9 Unlevered Free Cash Flow, Excluding Special Items 309.4 $
250.0 $
23.8%
|
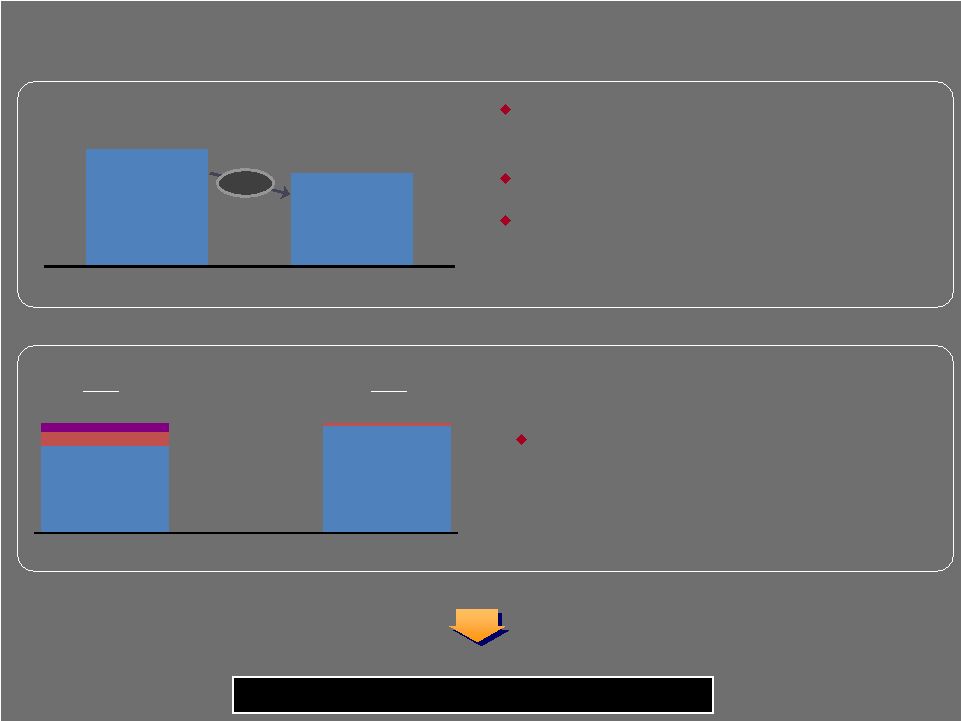 $792 $968 Total Liquidity LTM EBITDA 7.7x 6.1x At Transaction Close Today LIQUIDITY NET DEBT LEVERAGE RATIOS (including projected run rate cost savings) Flexible capital structure with significant liquidity (1) As of November 30, 2009, as defined by our Credit Agreement (2) As defined by our Credit Agreement, the Company has the option to choose the Payment in Kind (PIK) option as it relates to a portion of our debt which could provide an additional $80m of annual liquidity to the Company. This option expires in October 2012. (1) (1) Significant progress in driving down the leverage ratio since the LBO No maintenance covenants No material debt maturities until $750MM revolver (largely undrawn today) in 2013 – Remainder of debt maturities in 2015–2017 Significant available liquidity provides operational and strategic flexibility Cash Available Revolving Borrowings 21% $80 Cash Savings from 1 year PIK Toggle 40 Capital Structure $118 $27 $990 $995 RRCS Actual LTM (2) |
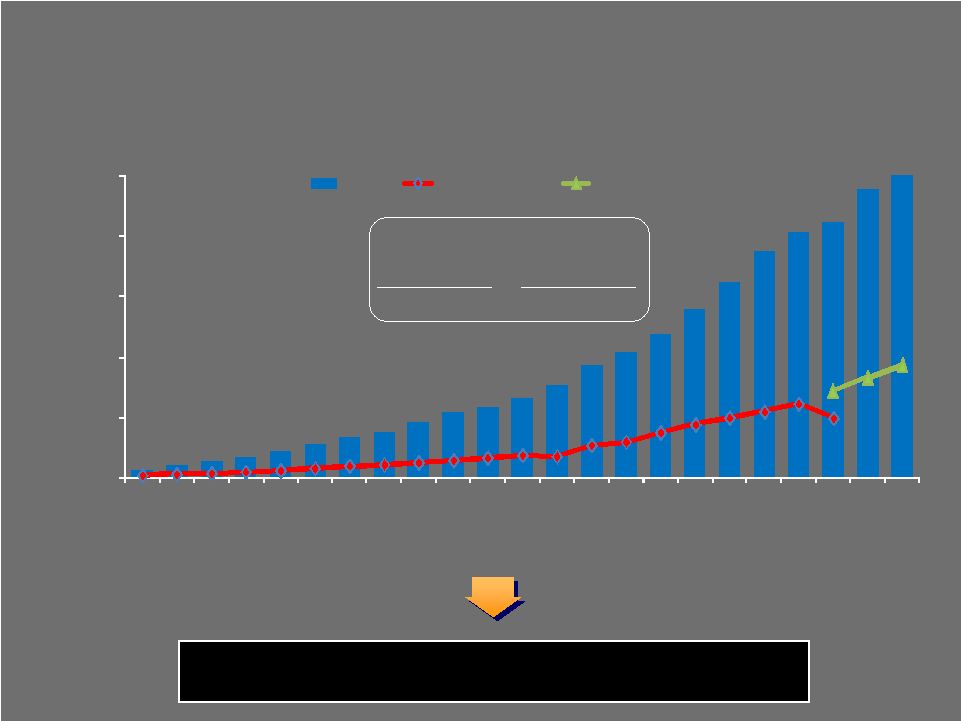 CONSOLIDATED SALES ($ in Millions) Extraordinary long-term track record of revenue and profitability growth through multiple industry and macro-economic cycles 10 Year CAGR 20 Year CAGR 11.7% 15.7% 41 Biomet Long-Term Track Record SALES $0 $500 $1,000 $1,500 $2,000 $2,500 1987 1988 1989 1990 1991 1992 1993 1994 1995 1996 1997 1998 1999 2000 2001 2002 2003 2004 2005 2006 2007 2008 2009 Sales GAAP Op inc. Adj EBITDA |