Attached files
| file | filename |
|---|---|
| 8-K - FORM 8-K - APAC CUSTOMER SERVICE INC | c96760e8vk.htm |
| EX-99.1 - EXHIBIT 99.1 - APAC CUSTOMER SERVICE INC | c96760exv99w1.htm |
| EX-99.2 - EXHIBIT 99.2 - APAC CUSTOMER SERVICE INC | c96760exv99w2.htm |
Exhibit 99.3

| Investor Presentation February 22-26, 2010 |
| Forward-Looking Statements 2 Certain statements, including discussions of the Company's expectations for 2010 and beyond, constitute forward-looking statements within the meaning of the Private Securities Litigation Reform Act of 1995. Such forward-looking statements are inherently uncertain as they are based on various expectations and assumptions about future events, and they are subject to known and unknown risks, uncertainties and other factors, which may cause actual events and results to differ materially from historical results or the future results expressed or implied by the forward-looking statements. Please refer to the Company's Annual Report on Form 10-K for the year ended December 28, 2008 and our subsequent filings on Form 10-Q for the fiscal quarters ended March 29, 2009, June 28, 2009 and September 27, 2009 for a description of the factors that could cause such results to differ. The Company intends our forward-looking statements to speak only as of the date made and undertakes no obligation to update or revise any forward- looking statements. To supplement the Company's condensed consolidated financial statements presented in accordance with GAAP, the Company uses certain measures defined as non-GAAP financial measures by the SEC. Information regarding the reconciliation of the non-GAAP information used in this presentation to our GAAP results is contained in the appendix and is also available on our website at http://www.apaccustomerservices.com and through the SEC. |
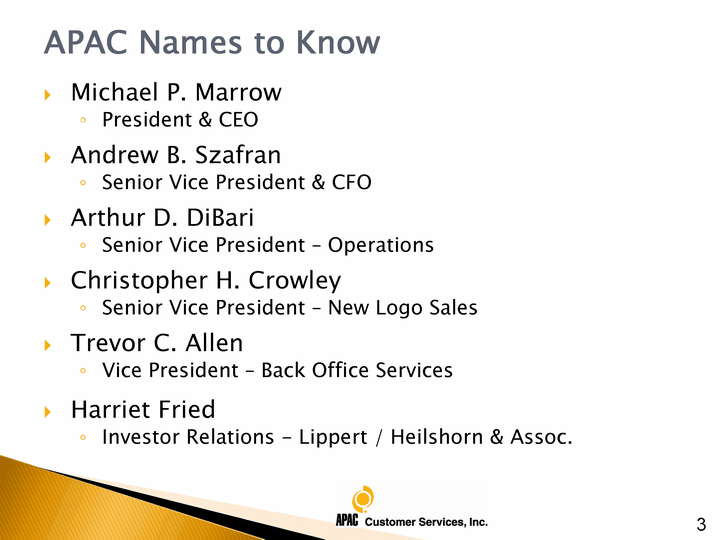
| APAC Names to Know Michael P. Marrow President & CEO Andrew B. Szafran Senior Vice President & CFO Arthur D. DiBari Senior Vice President - Operations Christopher H. Crowley Senior Vice President - New Logo Sales Trevor C. Allen Vice President - Back Office Services Harriet Fried Investor Relations - Lippert / Heilshorn & Assoc. 3 |

| APAC Overview Provide Outsourced Solutions for Clients Call Center Services Related BPO Services Customized Innovative High Quality & Cost Effective Help our Clients Care For and Retain their Customers Results Driven Clients Shareholders 4 |
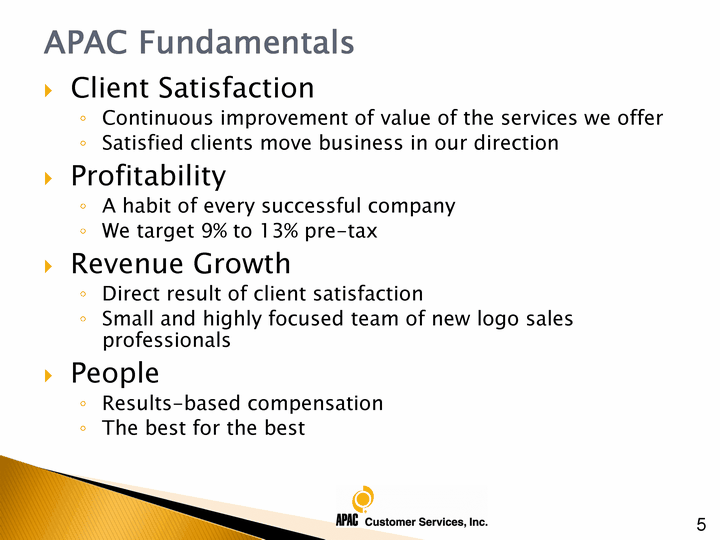
| APAC Fundamentals Client Satisfaction Continuous improvement of value of the services we offer Satisfied clients move business in our direction Profitability A habit of every successful company We target 9% to 13% pre-tax Revenue Growth Direct result of client satisfaction Small and highly focused team of new logo sales professionals People Results-based compensation The best for the best 5 |
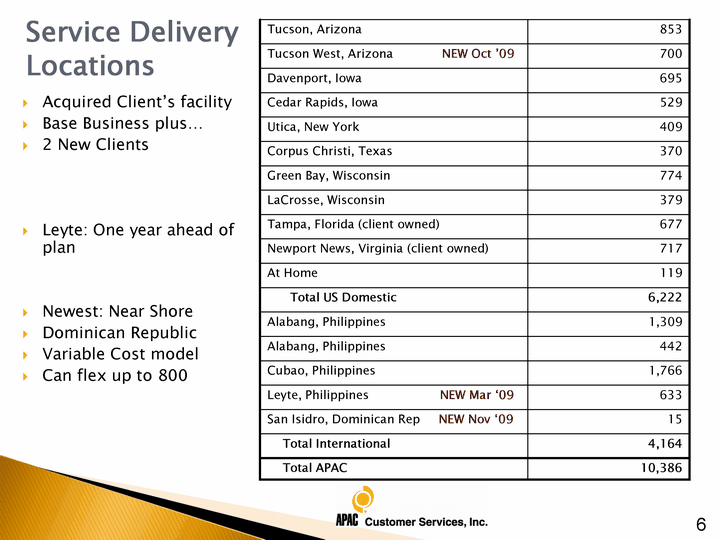
| Service Delivery Locations Tucson, Arizona 853 Tucson West, Arizona NEW Oct '09 700 Davenport, Iowa 695 Cedar Rapids, Iowa 529 Utica, New York 409 Corpus Christi, Texas 370 Green Bay, Wisconsin 774 LaCrosse, Wisconsin 379 Tampa, Florida (client owned) 677 Newport News, Virginia (client owned) 717 At Home 119 Total US Domestic 6,222 Alabang, Philippines 1,309 Alabang, Philippines 442 Cubao, Philippines 1,766 Leyte, Philippines NEW Mar '09 633 San Isidro, Dominican Rep NEW Nov '09 15 Total International 4,164 Total APAC 10,386 Acquired Client's facility Base Business plus... 2 New Clients Leyte: One year ahead of plan Newest: Near Shore Dominican Republic Variable Cost model Can flex up to 800 6 |
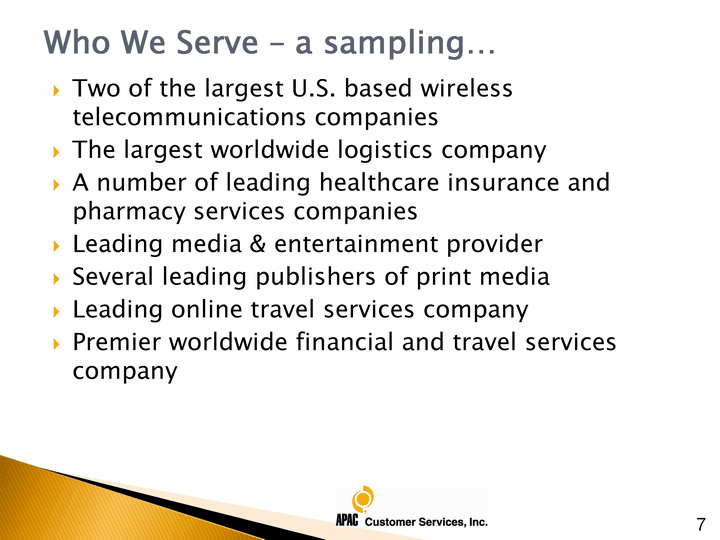
| Who We Serve - a sampling... Two of the largest U.S. based wireless telecommunications companies The largest worldwide logistics company A number of leading healthcare insurance and pharmacy services companies Leading media & entertainment provider Several leading publishers of print media Leading online travel services company Premier worldwide financial and travel services company 7 |
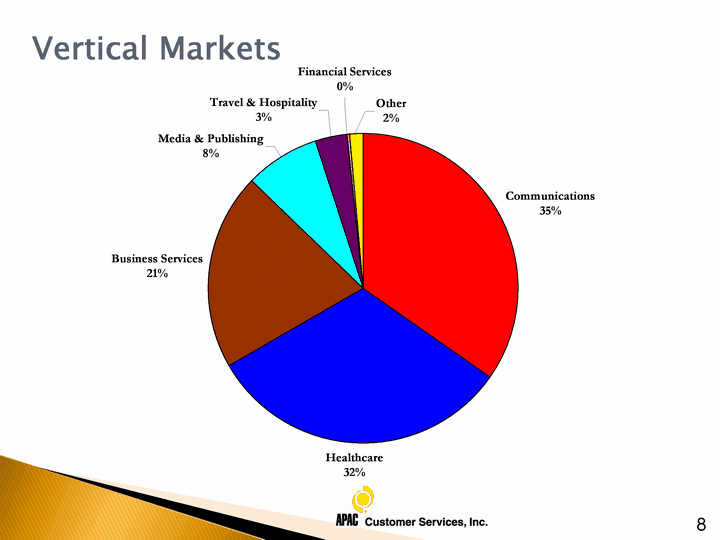
| Vertical Markets 8 |
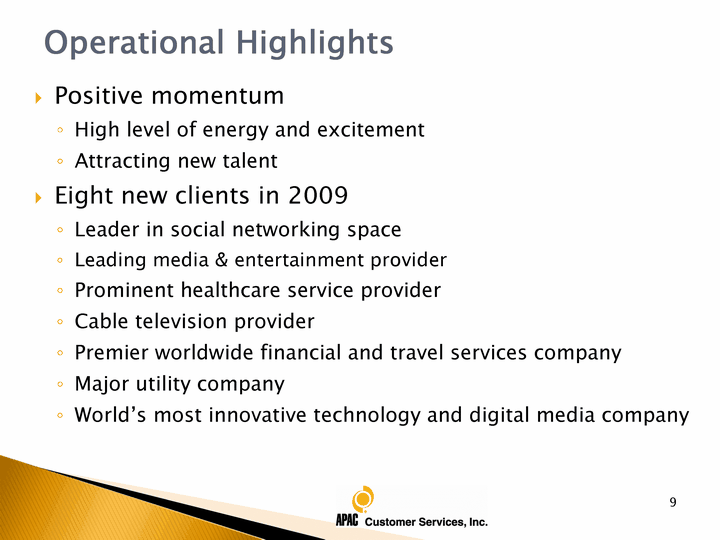
| 9 Operational Highlights Positive momentum High level of energy and excitement Attracting new talent Eight new clients in 2009 Leader in social networking space Leading media & entertainment provider Prominent healthcare service provider Cable television provider Premier worldwide financial and travel services company Major utility company World's most innovative technology and digital media company |
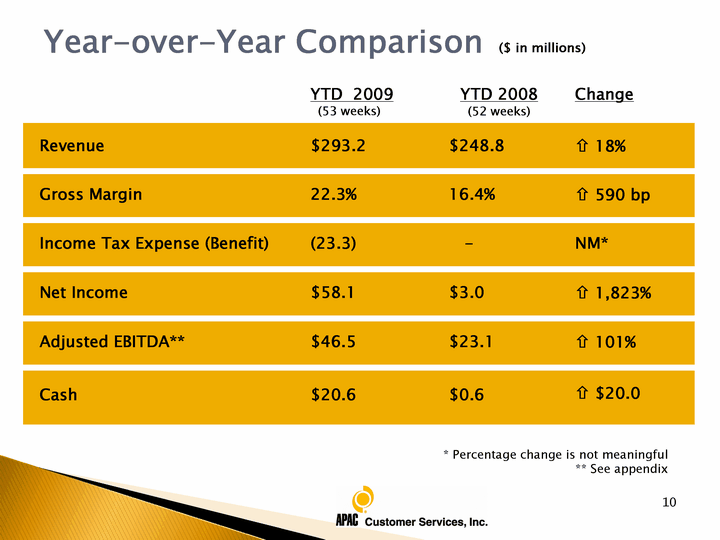
| 10 * Percentage change is not meaningful ** See appendix Year-over-Year Comparison ($ in millions) YTD 2009 (53 weeks) YTD 2008 (52 weeks) Change Revenue $293.2 $248.8 ? 18% Gross Margin 22.3% 16.4% ? 590 bp Income Tax Expense (Benefit) (23.3) - NM* Net Income $58.1 $3.0 ? 1,823% Adjusted EBITDA** $46.5 $23.1 ? 101% Cash $20.6 $0.6 ? $20.0 |
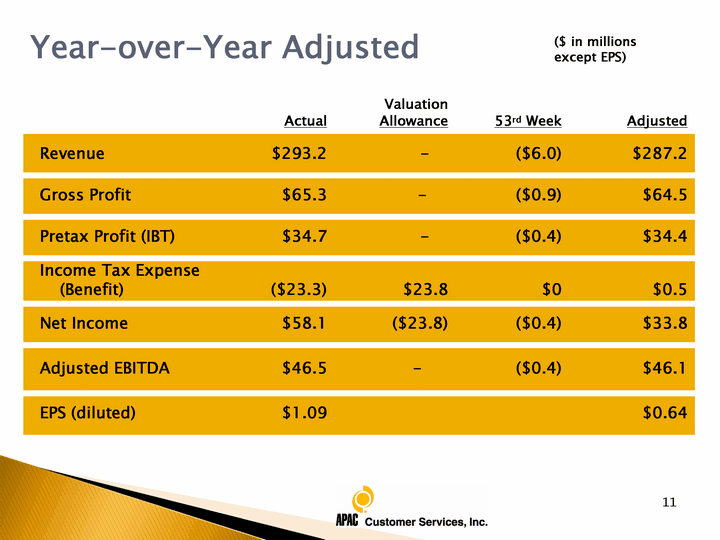
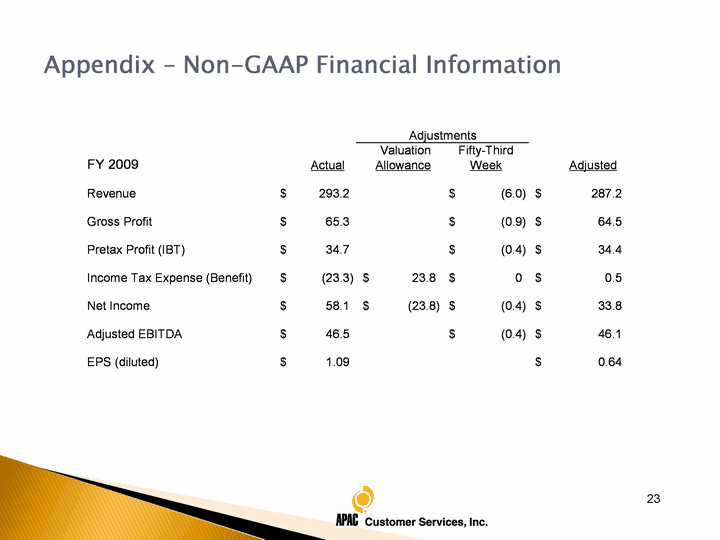
| 11 Actual Valuation Allowance 53rd Week Adjusted Revenue $293.2 - ($6.0) $287.2 Gross Profit $65.3 - ($0.9) $64.5 Pretax Profit (IBT) $34.7 - ($0.4) $34.4 Income Tax Expense (Benefit) ($23.3) $23.8 $0 $0.5 Net Income $58.1 ($23.8) ($0.4) $33.8 Adjusted EBITDA $46.5 - ($0.4) $46.1 EPS (diluted) $1.09 $0.64 Year-over-Year Adjusted ($ in millions except EPS) |
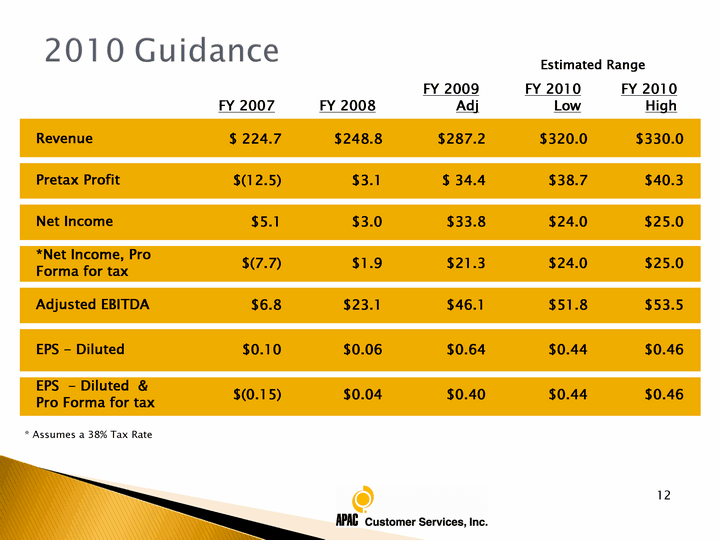
| 9 FY 2007 FY 2008 FY 2009 Adj FY 2010 Low FY 2010 High Revenue $ 224.7 $248.8 $287.2 $320.0 $330.0 Pretax Profit $(12.5) $3.1 $ 34.4 $38.7 $40.3 Net Income $5.1 $3.0 $33.8 $24.0 $25.0 *Net Income, Pro Forma for tax $(7.7) $1.9 $21.3 $24.0 $25.0 Adjusted EBITDA $6.8 $23.1 $46.1 $51.8 $53.5 EPS - Diluted $0.10 $0.06 $0.64 $0.44 $0.46 EPS - Diluted & Pro Forma for tax $(0.15) $0.04 $0.40 $0.44 $0.46 Estimated Range * Assumes a 38% Tax Rate |
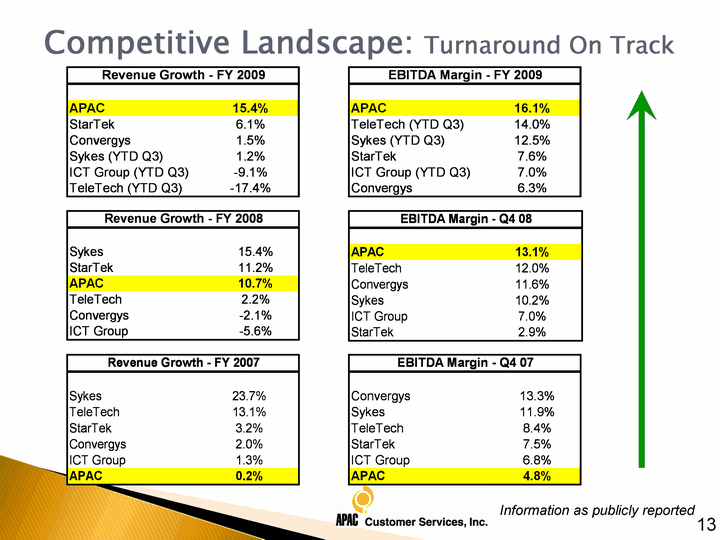
| Competitive Landscape: Turnaround On Track 13 Information as publicly reported |
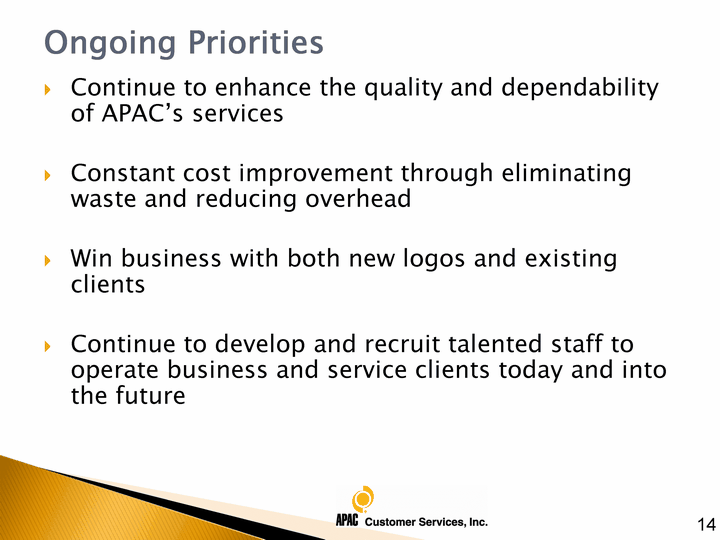
| Ongoing Priorities Continue to enhance the quality and dependability of APAC's services Constant cost improvement through eliminating waste and reducing overhead Win business with both new logos and existing clients Continue to develop and recruit talented staff to operate business and service clients today and into the future 14 |

| Outlook for FY 2010 Revenue of $320 - $330 million Growth of 11% - 15% Income Growth of 12% - 17% adjusted for taxes Earnings Per Share of $0.44 to $0.46 EBITDA of $51.8 - $53.5 million Continue to generate positive cash-flow 15 |
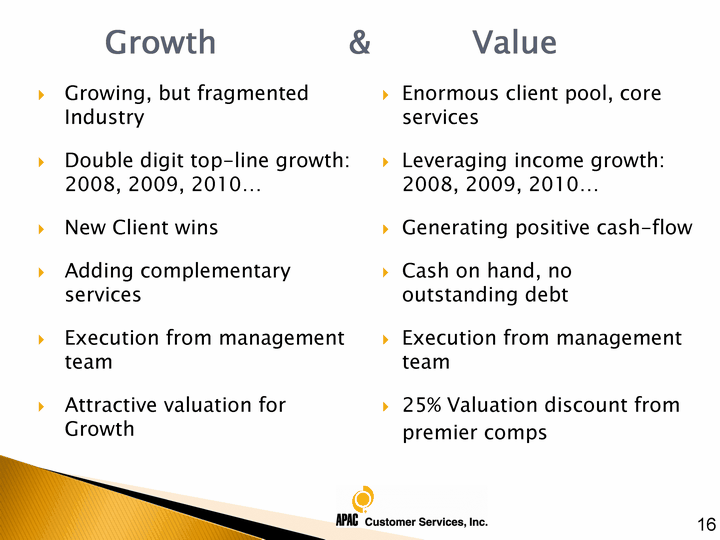
| Growth & Value Growing, but fragmented Industry Double digit top-line growth: 2008, 2009, 2010... New Client wins Adding complementary services Execution from management team Attractive valuation for Growth 16 Enormous client pool, core services Leveraging income growth: 2008, 2009, 2010... Generating positive cash-flow Cash on hand, no outstanding debt Execution from management team 25% Valuation discount from premier comps |
| Investors Nasdaq: APAC URL: www.apaccustomerservices.com Website contains: Bios for Senior Management Team Bios for Board of Directors Investor Relations Section 17 |

| APPENDIX 18 |
| 19 Appendix - Non-GAAP Financial Information To supplement our Condensed Consolidated Financial Statements presented in accordance with GAAP, we use certain non-GAAP financial information when describing our financial performance. This "non-GAAP financial information" is defined as a numerical measure of a company's financial performance that excludes or includes amounts so as to be different than the most directly comparable measure calculated and presented in accordance with U.S. GAAP ("GAAP") in the statements of operations, balance sheets or statements of cash flows of a company. We present EBITDA and adjusted EBITDA, which are defined as non-GAAP financial measures and also present the fiscal year 2009 financial results excluding the financial impact of the reversal of the valuation allowance recorded against the deferred tax asset and the financial impact of the 53rd week of operations. The presentation of this non- GAAP financial information is not intended to be considered in isolation or as a substitute for the financial information presented in accordance with GAAP. The items excluded from this non-GAAP financial information are significant components of our financial statements and must be considered in performing a comprehensive analysis of our overall financial results. We believe that this non-GAAP financial information provides meaningful supplemental information and is useful in understanding our results of operations and analyzing of trends because they exclude certain charges. We also believe that non-GAAP financial information is useful to investors and analysts in allowing for greater transparency with respect to the supplemental information used by us in our financial and operational decision-making. In addition, we believe investors, analysts and lenders benefit from referring to non-GAAP information when assessing our performance and expectations of our future performance. However, this information should not be used as a substitute for our GAAP financial information; rather it should be used in conjunction with financial statement information contained in our Condensed Consolidated Financial Statements prepared in accordance with GAAP. Pursuant to the requirements of Regulation G, we have provided a reconciliation of all non-GAAP financial information to the most directly comparable GAAP financial measure in the accompanying notes to selected financial and statistical data. More information on certain of this non-GAAP financial information can be found in the company's Annual Report on Form 10-K for the fiscal year ended December 28, 2008 and its subsequent filings on Form 10-Q for the fiscal quarters ended March 29, 2009, June 28, 2009 and September 27, 2009. |
| 20 We define EBITDA as net income plus income tax expense (benefit), depreciation and amortization, and interest expense. We define adjusted EBITDA as EBITDA adjusted for restructuring and other charges and asset impairment charges. EBITDA and adjusted EBITDA are measures used by our lenders, investors and analysts to evaluate our financial performance and our ability to pay interest and repay debt. These measures are also indicative of our ability to fund the capital investments necessary for our continued growth. We use these measures, together with our GAAP financial metrics, to assess our financial performance, allocate resources, measure our performance against debt covenants, and evaluate our overall progress towards meeting our long-term financial objectives. EBITDA and adjusted EBITDA are not intended to be considered in isolation or as a substitute for net income or cash flow from operations data presented in accordance with GAAP or as a measure of liquidity. The items excluded from EBITDA and adjusted EBITDA are significant components of our financial statements and must be considered in performing a comprehensive assessment of our overall financial results. We use consistent methods for computation of EBITDA and adjusted EBITDA. Our calculations of EBITDA and adjusted EBITDA may not be consistent with calculations of similar measures used by other companies. The accompanying table has more details on the GAAP financial measures that are most directly comparable to EBITDA and adjusted EBITDA and the related reconciliations between these financial measures. EBITDA and adjusted EBITDA can be reconciled to net income, which we believe to be the most directly comparable financial measure calculated and presented in accordance with GAAP, as follows: Appendix - Non-GAAP Financial Information |
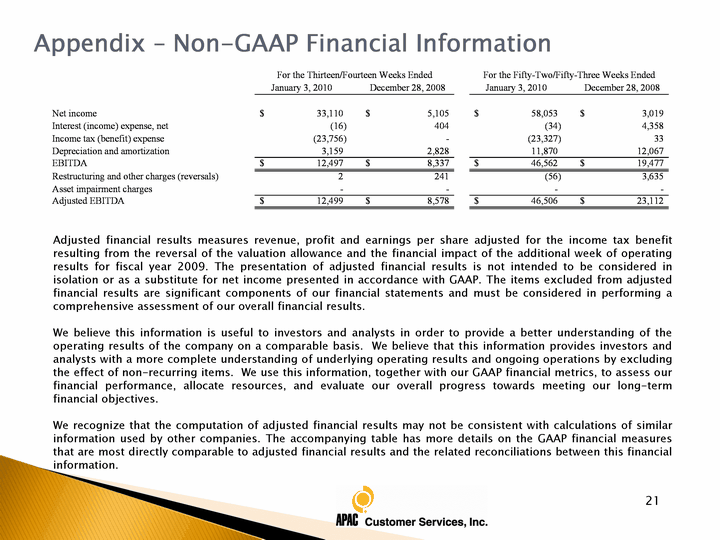
| Appendix - Non-GAAP Financial Information Appendix - Non-GAAP Financial Information Adjusted financial results measures revenue, profit and earnings per share adjusted for the income tax benefit resulting from the reversal of the valuation allowance and the financial impact of the additional week of operating results for fiscal year 2009. The presentation of adjusted financial results is not intended to be considered in isolation or as a substitute for net income presented in accordance with GAAP. The items excluded from adjusted financial results are significant components of our financial statements and must be considered in performing a comprehensive assessment of our overall financial results. We believe this information is useful to investors and analysts in order to provide a better understanding of the operating results of the company on a comparable basis. We believe that this information provides investors and analysts with a more complete understanding of underlying operating results and ongoing operations by excluding the effect of non-recurring items. We use this information, together with our GAAP financial metrics, to assess our financial performance, allocate resources, and evaluate our overall progress towards meeting our long-term financial objectives. We recognize that the computation of adjusted financial results may not be consistent with calculations of similar information used by other companies. The accompanying table has more details on the GAAP financial measures that are most directly comparable to adjusted financial results and the related reconciliations between this financial information. 21 |
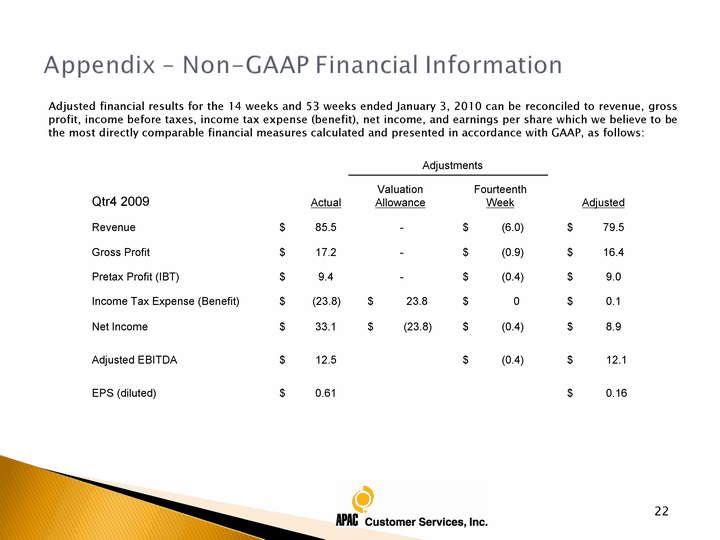
| Adjusted financial results for the 14 weeks and 53 weeks ended January 3, 2010 can be reconciled to revenue, gross profit, income before taxes, income tax expense (benefit), net income, and earnings per share which we believe to be the most directly comparable financial measures calculated and presented in accordance with GAAP, as follows: 22 Adjustments Adjustments Qtr4 2009 Actual Valuation Allowance Fourteenth Week Adjusted Revenue $ 85.5 - $ (6.0) $ 79.5 Gross Profit $ 17.2 - $ (0.9) $ 16.4 Pretax Profit (IBT) $ 9.4 - $ (0.4) $ 9.0 Income Tax Expense (Benefit) $ (23.8) $ 23.8 $ 0 $ 0.1 Net Income $ 33.1 $ (23.8) $ (0.4) $ 8.9 Adjusted EBITDA $ 12.5 $ (0.4) $ 12.1 EPS (diluted) $ 0.61 $ 0.16 |
| Appendix - Non-GAAP Financial Information Appendix - Non-GAAP Financial Information 18 |
