Attached files
| file | filename |
|---|---|
| EX-12 - EX-12 - WRIGHT MEDICAL GROUP INC | g22163exv12.htm |
| EX-32 - EX-32 - WRIGHT MEDICAL GROUP INC | g22163exv32.htm |
| EX-23 - EX-23 - WRIGHT MEDICAL GROUP INC | g22163exv23.htm |
| EX-21 - EX-21 - WRIGHT MEDICAL GROUP INC | g22163exv21.htm |
| EX-31.2 - EX-31.2 - WRIGHT MEDICAL GROUP INC | g22163exv31w2.htm |
| EX-31.1 - EX-31.1 - WRIGHT MEDICAL GROUP INC | g22163exv31w1.htm |
| EX-10.28 - EX-10.28 - WRIGHT MEDICAL GROUP INC | g22163exv10w28.htm |
Table of Contents
UNITED STATES
SECURITIES AND EXCHANGE COMMISSION
SECURITIES AND EXCHANGE COMMISSION
WASHINGTON, DC 20549
FORM 10-K
(Mark One)
| þ | ANNUAL REPORT PURSUANT TO SECTION 13 OR 15(d) OF THE SECURITIES EXCHANGE ACT OF 1934 |
For the fiscal year ended December 31, 2009
OR
| o | TRANSITION REPORT PURSUANT TO SECTION 13 OR 15(d) OF THE SECURITIES EXCHANGE ACT OF 1934 |
For the transition period from to
Commission file number: 000-32883
WRIGHT MEDICAL GROUP, INC.
(Exact name of registrant as specified in its charter)
| Delaware (State or other jurisdiction of incorporation or organization) |
13-4088127 (I.R.S. employer identification no.) |
|
| 5677 Airline Road, Arlington, Tennessee (Address of principal executive offices) |
38002 (Zip code) |
Registrant’s telephone number, including area code: (901) 867-9971
Securities registered pursuant to Section 1 2(b) of the Act:
| Title of each class | Name of each exchange on which registered | |
| Common Stock, par value $0.01 per share |
NASDAQ Global Select Market |
Securities registered pursuant to Section 12(g) of the Act: None
Indicate by check mark if the registrant is a well-known seasoned issuer, as defined in Rule 405 of
the Securities Act.
þ Yes o No
Indicate by check mark if the registrant is not required to file reports pursuant to Section 13 or
Section 15(d) of the Act.
o Yes þ No
Note — Checking the box above will not relieve any registrant required to file
reports pursuant to Section 13 or 15(d) of the Exchange Act from their obligations under
those Sections.
Indicate by check mark whether the registrant (1) has filed all reports required to be filed by
Section 13 or 15(d) of the Securities Exchange Act of 1934 during the preceding 12 months (or for
such shorter period that the registrant was required to file such reports), and (2) has been subject to such filing requirements for the past 90 days.
þ Yes o No
Indicate by check mark whether the registrant has submitted electronically and posted on its
corporate Web site, if any, every Interactive Data File required to be submitted and posted
pursuant to Rule 405 of Regulation S-T (232.405 of this chapter) during the preceding 12 months (or
for such shorter period that the registrant was required to submit and post such files).
o Yes o No
Indicate by check mark if disclosure of delinquent filers pursuant to Item 405 of Regulation S-K is
not contained herein, and will not be contained, to the best of registrant’s knowledge, in
definitive proxy or information statements incorporated by reference in Part III of this Form 10-K
or any amendment to this Form 10-K.
þ
Indicate by check mark whether the registrant is a large accelerated filer, an accelerated filer, a
non-accelerated filer, or a smaller reporting company. See definitions of “large accelerated
filer,” “accelerated filer,” and “smaller reporting company” in Rule 12b-2 of the Exchange Act.
(Check one):
(Check one):
| Large accelerated filer þ | Accelerated filer o | Non-accelerated filer o (Do not check if a smaller reporting company) |
Smaller reporting company o |
Indicate by check mark whether the registrant is a shell company (as defined in Rule 12b-2 of the
Exchange Act). o Yes þ No
The aggregate market value of the voting and non-voting common equity held by nonaffiliates
computed by reference to the price at which the common equity was last sold, or the average bid and
asked price of such common equity, as of the last business day of the registrant’s most recently
completed second fiscal quarter was $622,880,113.
As of February 17, 2010, there were 38,765,208 shares of common stock outstanding.
DOCUMENTS INCORPORATED BY REFERENCE
The information required by Part III is incorporated by reference from portions of the definitive
proxy statement to be filed within 120 days after December 31, 2009, pursuant to Regulation 14A
under the Securities Exchange Act of 1934 in connection with the annual meeting of stockholders to
be held on May 13, 2010.
WRIGHT MEDICAL GROUP, INC.
ANNUAL REPORT ON FORM 10-K
ANNUAL REPORT ON FORM 10-K
Table of Contents
| Page | ||||||||
| Item 1. | 1 | |||||||
| Item 1A. | 13 | |||||||
| Item 1B. | 26 | |||||||
| Item 2. | 26 | |||||||
| Item 3. | 26 | |||||||
| Item 4. | 27 | |||||||
| Item 5. | 28 | |||||||
| Item 6. | 30 | |||||||
| Item 7. | 32 | |||||||
| Item 7A. | 50 | |||||||
| Item 8. | 51 | |||||||
| Item 9. | 84 | |||||||
| Item 9A. | 84 | |||||||
| Item 9B. | 84 | |||||||
| Item 10. | 85 | |||||||
| Item 11. | 85 | |||||||
| Item 12. | 85 | |||||||
| Item 13. | 85 | |||||||
| Item 14. | 85 | |||||||
| Item 15. | 86 | |||||||
| Signatures | 89 | |||||||
| EX-10.28 | ||||||||
| EX-12 | ||||||||
| EX-21 | ||||||||
| EX-23 | ||||||||
| EX-31.1 | ||||||||
| EX-31.2 | ||||||||
| EX-32 | ||||||||
Table of Contents
Safe-Harbor Statement
This annual report contains “forward-looking statements” as defined under U.S. federal securities
laws. These statements reflect management’s current knowledge, assumptions, beliefs, estimates, and
expectations and express management’s current views of future performance, results, and trends and
may be identified by their use of terms such as “anticipate,” “believe,” “could,” “estimate,”
“expect,” “intend,” “may,” “plan,” “predict,” “project,” “will,” and other similar terms.
Forward-looking statements are subject to a number of risks and uncertainties that could cause our
actual results to materially differ from those described in the forward-looking statements. Such
risks and uncertainties include those discussed in our filings with the Securities and Exchange
Commission (including those described in Item 1A and elsewhere in this report and in our quarterly
reports). Readers should not place undue reliance on forward-looking statements. Such statements
are made as of the date of this annual report, and we undertake no obligation to update such
statements after this date.
Table of Contents
PART I
Item 1. Business.
Overview
Wright Medical Group, Inc., through Wright Medical Technology, Inc. and other operating
subsidiaries (Wright), is a global orthopaedic medical device company specializing in the design,
manufacture and marketing of devices and biologic products for extremity, hip, and knee repair and
reconstruction. We are a leading provider of surgical solutions for the foot and ankle market.
Reconstructive devices are used to replace or repair knee, hip and other joints and bones that have
deteriorated or have been damaged through disease or injury. Biologics are used to replace damaged
or diseased bone, to stimulate bone growth and to provide other biological solutions for surgeons
and their patients. Within these markets, we focus on the higher-growth sectors of the orthopaedic
industry, such as foot and ankle and upper extremity markets, as well as on the integration of our
biologic products into reconstructive procedures and other orthopaedic applications.
For the year ended December 31, 2009, we had net sales of $488 million and net income of $12
million. As of December 31, 2009, we had total assets of $714 million. Detailed information on our
net sales by product line and our net sales, operating income and long-lived assets by geographic
region can be found in Note 16 to the consolidated financial statements contained in “Financial
Statements and Supplementary Data.”
Orthopaedic Industry
It is estimated that the worldwide orthopaedic industry generated sales of approximately $28
billion in 2009. We believe this figure will grow by approximately 5-7% annually over the next
three years. Five multinational companies currently dominate the orthopaedic industry, each with
approximately $2 billion or more in annual sales. The size of these companies often leads them to
concentrate their marketing and research and development efforts on products they believe will have
a relatively high minimum threshold level of sales. As a result, there is an opportunity for a
mid-sized orthopaedic company, such as Wright, to focus on less contested, higher-growth sectors of
the orthopaedic market.
In recent years, we focused our efforts into growing our position in the higher-growth extremities
and biologics markets, which we estimate had combined sales of approximately $3.3 billion in 2009.
We believe that this figure will grow by approximately 9-11% annually over the next three years.
Orthopaedic devices are commonly divided into several primary sectors corresponding to the major
product categories within the orthopaedic field: reconstruction, trauma, arthroscopy, spine and
biologics. We specialize in those products used by extremity focused surgeon specialists which
include products from the reconstruction, trauma and arthroscopy markets, hip and knee
reconstructive joint devices and biologic products.
Extremity Hardware. Extremity hardware includes implants and other devices to replace or
reconstruct injured or diseased joints and bones of the foot, ankle, hand, wrist, elbow and
shoulder. Extremities hardware is one of the fastest growing market segments within orthopaedics
with annual growth rates of 9-11%. It is estimated that the extremity hardware market had sales of
approximately $2.4 billion worldwide in 2009. Major trends in extremity hardware include procedure
specific and anatomy specific devices, locking plates and an increase in total ankle arthroplasty
procedures.
Foot and Ankle Hardware
Foot and ankle reconstruction includes implants and other devices to replace or reconstruct injured
or diseased joints and bones in the foot and ankle. It is estimated that the foot and ankle
extremity hardware market had sales of approximately $1 billion worldwide in 2009. A large segment
of the foot and ankle hardware market is comprised of plating and screw systems for reconstructing
and fusing joints or repairing bones after traumatic injury. Major trends in foot and ankle
hardware include the use of external fixation devices in diabetic patients, total ankle
arthroplasty and advanced tissue fixation devices. According to two recent customer and market
surveys, we are deemed the market leader in foot and ankle surgical products, and hold 25% of the
U.S. total ankle arthroplasty market in 2009.
1
Table of Contents
Upper Extremity Reconstruction
Upper extremity reconstruction involves implanting devices to replace or reconstruct, or fixate
injured or diseased joints and bones in the hand, wrist, elbow and shoulder. It is estimated that
the upper extremity hardware market had sales of approximately $1.5 billion worldwide for 2009,
approximately 30% of which is in total shoulder replacement implants. Major trends in upper
extremity hardware include minimally invasive fracture repair devices and next generation joint
arthroplasty systems. We are the market leader in several segments of the upper extremity market
including finger joints, radial head replacement, ulnar shortening system, and intramedullary wrist
fracture repair devices.
Biologics Market. Biologic products use both biological tissue-based and synthetic materials to
regenerate damaged or diseased bone and to repair damaged or diseased soft tissue. These products
stimulate the body’s natural regenerative capabilities to heal itself, minimizing or delaying the
need for invasive implant surgery.
Our biologic products are primarily used in extremity related procedures as well as in trauma and
tumor induced voids of the long bones, joint replacements, and spine procedures. Biologic products
provide a lower morbidity solution to autograft, a procedure that involves harvesting a patient’s
own bone or soft tissue. Currently, there are three main types of biological bone grafting
products: osteoconductive, osteoinductive and osteogenic. Each category refers to the way in which
the materials affect bone growth. Osteoconductive materials serve as a scaffold that supports the
formation of bone but do not trigger new bone growth, whereas osteoinductive materials induce bone
growth. Finally, osteogenic materials combine the latter with a cell-based component. Our flagship,
PRO-DENSE® injectable regenerative graft is an osteoconductive bone graft which provides
the benefits of injectability, hardness to support bone and predictable bone regeneration.
Products such as our GRAFTJACKET® regenerative tissue matrix enable the repair of soft
tissue such as tendons (e.g., rotator cuff and Achilles), ligaments or chronic wounds (such as
diabetic foot ulcers). The need for biomaterials that speed wound healing and reduce amputation
rates is critical. Excluding viscosupplements, tissue processing services and bone morphogenic
protein, it is estimated that the biologics market generated sales of approximately $1 billion
worldwide in 2009.
Hip and Knee Reconstructive Joint Device Market
Most reconstructive joint devices are used to replace or repair joints that have deteriorated or
have been damaged as a result of disease or injury. Despite the availability of non-surgical
treatment alternatives such as oral medications, injections and joint fluid supplementation, severe
cases of disease or injury often require reconstructive joint surgery. Reconstructive joint surgery
involves the modification of the bone area surrounding the affected joint and the insertion of one
or more manufactured components, and may also involve the use of bone cement.
Knee Reconstruction. The knee joint involves the surfaces of three distinct bones: the lower end of
the femur or thigh bone, the upper end of the tibia or shin bone and the patella or kneecap.
Cartilage on any of these surfaces can be damaged due to disease or injury, leading to pain and
inflammation requiring knee reconstruction. Knee reconstruction was the largest sector of the
reconstructive joint device market in 2009, with estimated sales of approximately $6.5 billion
worldwide.
One of the major trends in knee reconstruction includes the use of alternative surface materials to
extend the implant life and increase conservation of the patient’s bone to minimize surgical trauma
and accelerate recovery. Our BIOFOAM™ material is a 70% porous material which provides a
trabecular structure that acts as an interface for bone in-growth. The microstructure of our
BIOFOAM™ material is designed to allow rigid fixation for faster biological attachment.
This material made its debut on the ADVANCE® BIOFOAM™ tibial base, and will
eventually be incorporated into a number of our products spanning from hip arthroplasty to foot and
ankle reconstruction. Another example of our innovation in knee arthroplasty was the introduction
of the PROPHECY™ pre-operative navigation system in 2009. The PROPHECY™ system allows surgeons to
visualize what the implant will look like after the surgery is performed before the skin is
dissected. This patent-pending process utilizes custom fit cutting instruments made for each
specific patient, thus reducing time in the operating room.
Hip Reconstruction. The hip joint is a ball-and-socket joint that enables the wide range of motion
that the hip performs in daily life. The hip joint is most commonly replaced due to degeneration of
the cartilage between the
head of the femur or the ball and the acetabulum or hollow portion of the pelvis or the socket.
This degeneration causes pain, stiffness and a reduction in hip mobility. It is estimated that the
worldwide hip reconstruction market had sales of approximately $4 billion in 2009.
2
Table of Contents
Similar to the knee reconstruction market, major trends in hip replacement procedures and implants
are to extend implant life and to preserve bone stock for possible future procedures. New products
have been developed that incorporate advances in bearing surfaces from the traditional polyethylene
surface. These alternative bearing surfaces include metal-on-metal, cross-linked polyethylene and
ceramic-on-ceramic combinations, which exhibit improved wear characteristics and lead to longer
implant life. One example of our commitment to the advancement of bearing technology is the
development of our A-CLASS™ metal-on-metal articulation which provides a 90% reduction in initial
(run-in) wear and 68% reduction in lifetime wear of the implant. In addition to advances in bearing
surfaces, implants that preserve more natural bone have been developed in order to minimize
surgical trauma and recovery time for patients. These implants, known as bone-conserving implants,
leave more of the hip bones intact, which is beneficial given the likelihood of future revision
replacement procedures as the average patient’s lifetime increases. Bone-conserving procedures are
intended to enable patients to delay their first total hip procedure and may significantly increase
the time from the first procedure to the time when a revision replacement implant is required. One
example of bone conserving implant technology is our CONSERVE® Plus total hip
resurfacing system, which was recently approved by the United States Food and Drug Administration
(FDA). Resurfacing of the femoral head allows surgeons to reconstruct the patients’ hip while
leaving the femoral head and neck in place. Additionally, PATH® surgical technique is a
tissue sparing hip replacement technique that offers patients quicker recovery due to a decrease of
intraoperative soft tissue trauma. The decreased soft tissue trauma results in less pain and blood
loss for the patient, as well as a lower risk of dislocation.
Government Regulation
United States
Our products are strictly regulated by the FDA under the Food, Drug, and Cosmetic Act (FDC Act).
Some of our products are also regulated by state agencies. FDA regulations and the requirements of
the FDC Act affect the pre-clinical and clinical testing, design, manufacture, safety, efficacy,
labeling, storage, recordkeeping, advertising and promotion of our medical device products. Our
tissue-based products are subject to FDA regulations, the National Organ Transplant Act (NOTA), and
various state agency regulations. We are an accredited member of the American Association of Tissue
Banks (AATB) and an FDA registered tissue establishment, which includes the packaging, processing,
storage, labeling, and distribution of tissue products regulated as medical devices and the storage
and distribution of tissue products regulated solely as human cell and tissue products. In
addition, we maintain tissue bank licenses in Florida, Maryland, New York, California, and Oregon.
Generally, before we can market a new medical device, marketing clearance from the FDA must be
obtained through either a premarket notification under Section 510(k) of the FDC Act or the
approval of a premarket approval (PMA) application. The FDA typically grants a 510(k) clearance if
the applicant can establish that the device is substantially equivalent to a predicate device. It
usually takes about three months from the date of a 510(k) submission to obtain clearance, but it
may take longer, particularly if a clinical trial is required. The FDA may find that a 510(k) is
not appropriate or that substantial equivalence has not been shown and, as a result, require a PMA
application.
PMA applications must be supported by valid scientific evidence to demonstrate the safety and
effectiveness of the device, typically including the results of human clinical trials, bench tests
and laboratory and animal studies. The PMA application must also contain a complete description of
the device and its components, and a detailed description of the methods, facilities and controls
used to manufacture the device. In addition, the submission must include the proposed labeling and
any training materials. The PMA application process can be expensive and generally takes
significantly longer than the 510(k) process. Additionally, the FDA may never approve the PMA
application. As part of the PMA application review process, the FDA generally will conduct an
inspection of the manufacturer’s facilities to ensure compliance with applicable quality system
regulatory requirements, which include quality control testing, documentation control and other
quality assurance procedures.
If human clinical trials of a medical device are required and the device presents a significant
risk, the sponsor of the trial must file an investigational device exemption (IDE) application
prior to commencing human clinical trials. The IDE application must be supported by data, typically
including the results of animal and/or laboratory testing. If the
3
Table of Contents
IDE application is approved by
the FDA and one or more institutional review boards (IRBs), human clinical trials may begin at a
specific number of institutional investigational sites with the specific number of patients
approved by the FDA. If the device presents a non-significant risk to the patient, a sponsor may
begin the clinical trial after obtaining approval for the trial by one or more IRBs without
separate approval from the FDA. Submission of an IDE does not give assurance that the FDA will
approve the IDE. If it is approved, there can be no assurance the FDA will determine that the data
derived from the trials support the safety and effectiveness of the device or warrant the
continuation of clinical trials. An IDE supplement must be submitted to and approved by the FDA
before a sponsor or investigator may make a change to the investigational plan that may affect its
scientific soundness, study indication or the rights, safety or welfare of human subjects. The
trial must also comply with the FDA’s IDE regulations, and informed consent must be obtained from
each subject.
The FDA has statutory authority to regulate allograft-based products, processing and materials. The
FDA and other international regulatory agencies have been working to establish more comprehensive
regulatory frameworks for allograft-based tissue-containing products, which are principally derived
from human cadaveric tissue. The framework developed by the FDA establishes risk-based criteria for
determining whether a particular human tissue-based product will be classified as human tissue, a
medical device or a biologic drug requiring premarket clearance or approval. All tissue-based
products are subject to extensive FDA regulation, including establishment registration
requirements, product listing requirements, good tissue practice requirements for manufacturing and
screening requirements that ensure that diseases are not transmitted to tissue recipients. The FDA
has also proposed extensive additional requirements that address sub-contracted tissue services,
tracking to the recipient/patient and donor records review. If a tissue-based product is considered
human tissue, the FDA requirements focus on preventing the introduction, transmission and spread of
communicable diseases to recipients. Neither clinical data nor review of safety and efficacy are
required before the tissue can be marketed. However, if the tissue is considered a medical device,
or a biologic drug, then FDA clearance or approval is required.
In addition to granting approvals for our products, the FDA and international regulatory
authorities periodically inspect us for compliance with regulatory requirements that apply to our
operations. These requirements include labeling regulations, manufacturing regulations, quality
system regulations, regulations governing unapproved or off-label uses and medical device
regulations. Medical device regulations require a manufacturer to report to the FDA serious adverse
events or certain types of malfunctions involving its products. The FDA periodically inspects
device and drug manufacturing facilities in the U.S. to assure compliance with applicable quality
system regulations.
Most of our products are FDA cleared through the 510(k) premarket notification process. We have
conducted clinical trials to support some of our regulatory approvals. Regulations regarding the
manufacture and sale of our products are subject to change. We cannot predict the effect, if any,
that these changes might have on our business, financial condition and results of operations. If
the FDA believes that we are not in compliance with the FDC Act, it can institute proceedings to
detain or seize products, issue a market withdrawal, enjoin future violations and/or seek civil and
criminal penalties against us and our officers and employees. If we fail to comply with these
regulatory requirements, our business, financial condition and results of operations could be
harmed.
Further, we are subject to various federal and state laws concerning healthcare fraud and abuse,
including false claims laws, anti-kickback laws and physician self-referral laws. Violations of
these laws can result in criminal and/or civil punishment, including fines, imprisonment and, in
the U.S., exclusion from participation in government healthcare reimbursement programs. If a
governmental authority were to determine that we do not comply with these laws and regulations,
then we and our officers and employees could be subject to criminal and civil sanctions.
International
All of our products sold internationally are subject to certain foreign regulatory approvals. We
must comply with extensive regulations governing product safety, quality, manufacturing and
reimbursement processes in order to market our products in all major foreign markets. These
regulations vary significantly from country to country and with respect to the nature of the
particular medical device. The time required to obtain foreign approvals to market
our products may be longer or shorter than the time required in the U.S., and requirements for such
approvals may differ from FDA requirements.
4
Table of Contents
To market our product devices in the member countries of the European Union (EU), we are required
to comply with the European Medical Device Directives and obtain CE mark certification. CE mark
certification is the European symbol of adherence to quality assurance standards and compliance
with applicable European Medical Device Directives. Under the European Medical Device Directives,
all medical devices including active implants must qualify for CE marking. We also are required to
comply with other foreign regulations, such as obtaining Ministry of Health Labor and Welfare
(MHLW) approval in Japan, Health Protection Branch (HPB) approval in Canada and Therapeutic Goods
Administration (TGA) approval in Australia.
Products
We operate as one reportable segment, offering products in four primary market sectors: extremity
reconstruction, biologics, knee reconstruction and hip reconstruction. Sales in each of these
markets represent greater than 15% of our consolidated revenue. Detailed information on our net
sales by product line can be found in Note 16 to the consolidated financial statements contained in
“Financial Statements and Supplementary Data.”
Extremity Hardware
We offer extremity products for the foot and ankle and upper extremities in a number of markets
worldwide. Some of our extremity implants have over 40 years of successful clinical history. We are
a recognized leader in the U.S. and German markets for foot and ankle surgical products.
Additionally, we hold leading positions in several segments of the upper extremity market such as
radial head repair, finger joint replacements and intramedullary wrist fracture implants.
Foot and Ankle Hardware:
Our CHARLOTTE™ foot and ankle system is an extensive offering of fixation products for
foot and ankle surgery, and includes products that feature advanced design elements for simplicity,
versatility and high performance. Adding to the CHARLOTTE™ portfolio, in 2006, we
introduced the first ever locking compressing plate designed for corrective foot surgeries. The
CLAW® plate allows surgeons to modify the length of screws used and amount of
compression to the fusion site, a strong advantage over traditional staples.
The DARCO® foot and ankle plating systems were designed to address the specific needs of
reconstructive foot and ankle surgery. The DARCO® MFS and MRS plates were the first
implants to incorporate fixed angle, locking screw technology into a comprehensive fixation set for
foot surgery. Surgeons believe that surgical repairs are more stable with locking screw technology,
thus allowing patients to return to activity faster.
Our INBONE™ total ankle system represents the third generation in ankle replacement
implants, utilizing a patented intramedullary alignment mechanism for more accurate placement of
the implant. The unique modular nature of the implant allows the surgeon to customize the fixation
stems for the tibial and talar components in order to maximize stability of the implant. Accuracy
of placement and implant stability have been shown to be key factors impacting longevity of the
implant. The INBONE™ system represents key advances in these critical arenas.
Our SIDEKICK™ line of external fixators is designed to facilitate compression or
distraction of bones in the foot from “the outside in” and in a minimally invasive manner. In many
cases, surgeons will opt for the minimally invasive nature of “external fixation” versus more
invasive plate and screw “internal fixation.” One growing application of our SIDEKICK™
is in the diabetic population for which small incisions are preferred due to wound healing
issues present with these patients.
In late 2009, we announced the commercial release of the ORTHOLOC™ polyaxial trauma plating system.
The ORTHOLOC™ system provides foot and ankle surgeons a comprehensive line of plates and
screws to address most trauma injuries of the foot and ankle. The polyaxial locking feature allows
the surgeon to customize the angle of screw placement through the plate to maximize implant to bone
fit. Additionally, we announced the limited release
of the VALOR™ TTC fusion nail. The VALOR™ nail provides surgeons with a solution for fusing the
calcaneal, talar and tibial bones required in patients suffering from severe ankle arthritis. The
combination of the INBONETM total ankle replacement system and the VALOR™ fusion nail
provide foot and ankle surgeons with what we believe to be the most compelling portfolio for
treating patients with varying degrees of ankle arthritis.
Other products in our foot and ankle portfolio include our BIOARCH™ subtalar arthoereisis implant,
our line of AM™ Surgical foot and ankle endoscopic tissue release products, and our line of Swanson
toe joints.
5
Table of Contents
Upper Extremity Hardware:
Our EVOLVE® modular radial head replacement prosthesis addresses the need for modularity
in the anatomically highly-variable joint of the elbow and is the market leading radial head
prosthesis. The EVOLVE® modular radial head device provides 150 different combinations
of heads and stems allowing the surgeon to choose implant heads and stems to accommodate the
unpredictable anatomy of each patient. The smooth stem design allows for rotational motion at the
implant and bone interface and for radiocapitellar articulation, potentially reducing capitellar
wear. Our EVOLVE® radial head plating system is for surgeons who wish to repair rather
than replace the damaged radial head. With prostheses and plating, we believe we have become the
vendor of choice for repair of radial head fractures. Further strengthening our position in the
radial head market, in 2007, we introduced our EVOLVE® proline system, which adds
additional size offerings and in-situ locking of the implant, a favorable feature for surgeons
treating patients with intact elbow ligaments.
Our line of Swanson finger joints are used in finger joint replacement for patients suffering from
rheumatoid arthritis of the hand. With nearly 40 years of clinical success, Swanson digit implants
are a foundation in our upper extremity business and are used by a loyal base of hand surgeons
worldwide.
Our MICRONAIL® intramedullary wrist fracture repair system is a next-generation
minimally invasive treatment for distal radius fractures that provides immediate fracture
stabilization with minimal soft tissue disruption. The result is rapid recovery of hand and wrist
functions. Also, as the product is implanted within the bone, it has no external profile on top of
the bone, thereby removing the potential for tendon irritation or rupture, which is an appreciable
problem with conventional plates designed to lie on top of the bone.
Our RAYHACK® system is comprised of a series of precision cutting guides and
procedure-specific plates for ulnar shortening procedures and the surgical corrections to treat
radial malunions and Keinbock’s disease.
Biologics
We offer a broad line of biologic products that are used to replace and repair damaged or diseased
bone, tendons and soft tissues and other biological solutions for surgeons and their patients.
These products focus on biological musculoskeletal repair by utilizing synthetic and human
tissue-based materials. Internationally, we offer bone graft products incorporating antibiotic
delivery.
GRAFTJACKET® matrix is a human-derived soft tissue graft designed for augmentation of
tendon and ligament repairs such as those of the rotator cuff in the shoulder and Achilles tendon
in the ankle. By augmenting the strength of the tendon repair and incorporating it biologically,
GRAFTJACKET® regenerative tissue matrix increases surgeons’ confidence in the surgical
outcome. GRAFTJACKET® Maxforce Extreme is a high strength form of GRAFTJACKET®
matrix which provides maximum suture holding power for the most challenging of tendon and
ligament repairs.
GRAFTJACKET® ulcer repair matrix is designed to repair challenging diabetic ulcers of
the foot, the primary cause of hospital admissions for all individuals with diabetes. More than
two-thirds of the amputations administered each year are performed on individuals with diabetes,
often because of difficulties associated with diabetic foot ulcers. GRAFTJACKET® ulcer
repair matrix has the ability to reliably repair deep foot wounds, which have a much higher risk of
leading to amputation. Unlike some other diabetic foot ulcer products, GRAFTJACKET®
ulcer repair matrix generally requires only one application to treat the foot ulcer, thereby
reducing the time and cost of treatment. We procure our GRAFTJACKET® product through an
exclusive distribution agreement that expires December 31, 2013.
Our BIOTAPE XM™ Reinforcement Matrix was released for sale in the U.S. and many
international markets in September 2008. The BIOTAPE XM™ matrix, an animal derived
(xenograft) soft-tissue graft, expands our market-leading portfolio of soft-tissue reinforcement
technologies and provides a less burdensome entrance into many of our international markets where
human tissue regulations make providing human tissue products difficult or impossible.
6
Table of Contents
We sell PRO-DENSE® injectable graft in the U.S. and select international markets.
PRO-DENSE® injectable graft is a composite graft of surgical grade calcium sulfate and
calcium phosphate. In animal studies, this unique graft composite has demonstrated excellent bone
regenerative characteristics, forming new bone that is over three times stronger than the natural
surrounding bone at the 13-week time point. Beyond 13 weeks, the regenerated bone gradually
remodels to natural bone strength. Subsequent clinical data series have demonstrated dense new bone
regeneration at an accelerated rate. Ultimately, we believe that this may bode well for patients to
return to their presurgery activity levels at a faster pace. PRO-STIM™ injectable inductive graft
is built on the PRO-DENSE® material platform, but adds demineralized bone matrix (DBM) for
osteoinductive potential. PRO-STIM™ graft has demonstrated accelerated healing compared to
autograft in pre-clinical testing. Since the mechanism of action is different than
PRO-DENSE® graft, PRO-STIM™ graft will allow us to expand the applicable
procedures to more challenging bone defects for the material platform. Currently available on a
limited basis to key centers, PRO-STIM™ graft is expected to be fully launched in the second half
of 2010.
Our OSTEOSET® bone graft substitute is a synthetic bone graft substitute made of
surgical grade calcium sulfate. OSTEOSET® bone graft substitute provides an attractive
alternative to autograft because it facilitates bone regeneration without requiring a painful,
secondary bone-harvesting procedure. Additionally, being purely synthetic, OSTEOSET®
pellets are cleared for use in infected sites, an advantage over tissue-based material. The human
body resorbs the OSTEOSET® material at a rate close to the rate that new bone grows. We
offer surgeons the option of custom-molding their own beads in the operating room using the
OSTEOSET® resorbable bead kit, which is available in mixable powder form.
OSTEOSET® 2 DBM graft is a unique bone graft substitute incorporating demineralized bone
matrix (DBM) into OSTEOSET® surgical-grade calcium sulfate pellets. These two bone graft
materials, each with a long clinical history, provide an ideal combination of osteoinduction via
osteoinductive DBM in OSTEOSET® DBM and osteoconduction for guided bone regeneration.
Our surgical grade calcium sulfate is manufactured using proprietary processes that consistently
produce a high quality product. Our OSTEOSET® T medicated pellets, which contain
tobramycin, are currently one of the few resorbable bone void fillers available in international
markets for the prevention and treatment of osteomyelitis, an acute or chronic infection of the
bone.
ALLOMATRIX® injectable putty combines a high content of DBM with our proprietary
surgical grade calcium sulfate carrier. The combination provides an injectable putty with the
osteoinductive properties of DBM, as well as exceptional handling qualities. Another combination we
offer is ALLOMATRIX® C bone graft putty, which includes the addition of cancellous bone
granules. The addition of the bone granules increases the stiffness of the material and thereby
improves handling characteristics, increases osteoconductivity scaffold and provides more
structural support. Our ALLOMATRIX® custom bone graft putty allows surgeons to customize
the amount of bone granules to add to the putty based on its surgical application. Most recently we
introduced ALLOMATRIX® DR graft, which is ALLOMATRIX® putty that has been
optimized for application in smaller fractures due to the smaller particle size of its cancellous
bone granules and the application-specific volume in which it is marketed.
We have signed a supply agreement with RTI Biologics, Inc., to develop advanced implants for use in
foot and ankle surgeries. Under this agreement, we offer our CANCELLO-PURE™ bone wedge
line as well as the ALLOPURETM allograft bone wedges, which offer surgeons
off-the-shelf, sterile grafts with appropriate handling characteristics. The ease of use and time
savings in the operating room have made this product line an attractive option to foot and ankle
surgeons and expand our offering in this key surgical area of need.
Knee Reconstruction
Our knee reconstruction product portfolio strategically positions us in the areas of partial, total
and revision knee reconstruction as well as limb preservation products. These products provide the
surgeon with a continuum of treatment options for improving patient care. We differentiate our
products through innovative design features that
reproduce natural movement and stability, resulting in products that more closely resemble a
healthy knee.
The ADVANCE® knee system is our primary knee product line. There are several innovative
product offerings within the ADVANCE® knee system, but our flagship is the
ADVANCE® medial-pivot knee. Launched eleven years ago, the ADVANCE®
medial-pivot knee is the first mass marketed knee designed to replicate modern concepts of anatomic
motion. It approximates the movement and stability of a healthy knee by incorporating a patented
ball-in-socket feature on its medial side which allows both surgeons and patients to feel the
stability. Studies have shown the ADVANCE® medial-pivot knee more closely approximates
natural knee motion.
7
Table of Contents
To offer better size-specificity for our patients, the ADVANCE® knee system features an
expanded number of sizing options called ADVANCE STATURE® components. These components
are designed to accommodate those male or female femora with a larger front to back dimension than
side to side. This helps ensure that patients will receive the best implant fit possible.
We provide a broad array of surgical knee instrumentation to accommodate surgeon and patient
preference. Our ODYSSEY® instrumentation is a modification of traditional total knee
instrumentation for use in contemporary less-invasive approaches. Additionally, in 2009 we launched
the PROPHECY™ pre-operative navigation system. The PROPHECY™ system enables surgeons to utilize
basic CT or MRI scan technology to plan precise implant placement and alignment before they enter
the operating room. Therefore, surgeons are able to envision the results of surgery before it
actually occurs. In contrast to utilizing traditional instruments to align the knee during surgery,
the PROPHECY™ program utilizes computer imaging to develop patient-specific guides that follow the
unique curvature of the patient’s bone anatomy. These guides allow the surgeon to complete implant
placement with accuracy. By promoting accurate alignment, providing optimal sizing and guiding
precision implant placement, our new PROPHECY™ pre-operative navigation system delivers
reproducible surgical results for knee arthroplasty. Our goal is not only to improve accuracy and
decrease patient anesthesia time, but to allow for greater function and long-term survival of the
implants by placing them in a position for optimal mechanical function.
We anticipate launching the ZEN™ tension-based knee instruments in 2010; these instruments help the
surgeon put the medial pivot knee design in natural balance by allowing the patients’ soft tissues
to guide the implant placement. We also expect an increased utilization of our ADVANCE®
BIOFOAM™ cancellous titanium tibial base, as our BIOFOAM™ tibial
base features proprietary bone-like titanium with a roughened texture that “bites” into bone for
cementless fixation of the implant. The combination of the PROPHECY™ system, our BIOFOAM™ material
and medial pivot motion allows surgeons to potentially reduce their surgery time significantly
while increasing accuracy and stability.
Our breakthrough REPIPHYSIS® technology is implanted in children and expands as they
grow. This technology, which we exclusively license, can be incorporated into a prosthetic implant
and subsequently adjusted non-invasively when lengthening of the implant is needed. The most common
application of this technology is in the field of pediatric oncology, where growing children can
have their limbs lengthened without the need for additional surgeries.
Hip Reconstruction
We offer a comprehensive line of products for hip joint reconstruction. This product portfolio
provides offerings in the areas of bone-conserving implants, total hip reconstruction, revision
replacement implants and limb preservation. Additionally, our hip products offer a combination of
unique, innovative modular designs, a complete portfolio of advanced surface bearing materials,
including ceramic-on-ceramic and metal-on-metal articulations, and innovative technology in surface
replacement implants. Therefore, we are able to offer surgeons and their patients a full continuum
of treatment options.
The CONSERVE® family of products incorporates anatomically-replicating large diameter
bearings, led recently by the A-CLASS® advanced metal technology. This proprietary
metal-on-metal articulation has undergone extensive laboratory tests which suggest that over the
life of the implant, this advanced surface technology will result in significantly less wear than
traditional metal-on-metal hip implants. This new innovation is coupled with our BFH®
technology, which is designed to reduce rates of post-operative hip dislocation. Most recently we
received clearance
from the FDA for the CONSERVE® Plus total resurfacing system. This innovative
resurfacing design conserves a patient’s natural anatomy and allows for a more kinematically
correct joint reconstruction.
The PROFEMUR® patented modular neck systems allow surgeons to carefully adjust and
implant positioning during surgery. If a surgeon requires a change in leg length, offset or
version, the PROFEMUR® hip system conveniently allows these options, as all of these
options can be changed after the hip stem is in place. Our principal PROFEMUR® stem
offerings, which provide this innovative modularity, include our PROFEMUR® Z,
PROFEMUR® Plasma Z, PROFEMUR® LX, PROFEMUR® Tapered,
PROFEMUR® RAZ, PROFEMUR® TL, PROFEMUR® Xm, and the
PROFEMUR® RENAISSANCE® stems. These stems represent the vast majority of
popular stem philosophies in the current marketplace.
8
Table of Contents
Additionally, our hip revision products include the PROFEMUR® Z Revision and
PROFEMUR® LX Revision stems which were launched in 2008 and continue to gain traction. A
North American distribution agreement with Waldemar Link GmbH for the distribution of the
LINK® MP revision stem has also proven to be an important addition to our hip product
portfolio.
In 2008, we launched our DYNASTY® acetabular system, which offers surgeons the benefit
of our BFH® technology both in metal-on-metal and metal-on-cross-linked polyethylene
options, with the added benefit of screw fixation. Screw fixation is sometimes needed in the case
of poor bone quality. Recently, we launched our patented BIOFOAM® technology in
conjunction with the DYNASTY® system. The BIOFOAM® DYNASTY®
acetabular shell allows physicians to address more complex acetabular cases along with simple
revision surgeries.
Wright continues to invest in pioneering approaches to tissue sparing hip replacement. The
PATH® surgical technique offers patients quicker recovery due to a decrease of
intraoperative soft tissue trauma. The decreased soft tissue trauma results in less pain and blood
loss for the patient, as well as a lower risk of dislocation.
Product Development
Our research and development staff focuses on developing new products in the extremity hardware,
knee and hip reconstruction and biologics markets and on expanding our current product offerings
and the markets in which they are offered. Realizing that new product offerings are a key to future
success, we are committed to a strong research and development program. In addition, we have
clinical and regulatory departments devoted to verifying the safety and efficacy of our products in
close collaboration with the FDA and other international regulatory bodies. Our research and
development expenses totaled $35.7 million, $33.3 million and $28.4 million in 2009, 2008 and 2007,
respectively.
In the extremity hardware areas our research and development activities focus on providing a
comprehensive portfolio of surgical solutions to extremity focused surgeons, including procedure
and anatomy specific products.
In the hip and knee reconstruction areas, our research and development activities continue to
explore and develop advanced bearing and fixation surfaces that improve the clinical performance of
reconstructive devices, including ceramic-on-ceramic and low-wear, metal-on-metal surfaces.
Further, we provide minimally invasive, tissue sparing techniques that allow patients to quickly
return to work and resume their daily activities as well as decreasing the time and cost
requirements of the surgical facility.
In the biologics area, we have a variety of research and development projects underway that are
designed to further expand our product offerings and provide differentiation of our advanced
materials in the marketplace. Such projects include developing new instrumentation, particularly
for use with different biomaterials, to facilitate early intervention procedures for a broad array
of clinical applications as well as the integration of new biologic products into foot and ankle
procedures, soft tissue applications and other demanding orthopaedic uses.
In 2009, we launched several extremity and biologic products. Our new foot and ankle offerings
included products such as:
| • | the CHARLOTTE™ LisFranc reconstruction system, |
| • | G-FORCE™ foot and ankle tenodesis system, | ||
| • | BIOFOAM® Evans foot and ankle wedge system, |
| • | DART-FIRE™ compression screws, |
| • | ORTHOLOC™ calcaneal fracture system, |
| • | ORTHOLOC™ 2.0/2.4 forefoot plate system, and |
| • | the VALOR™ hindfoot fusion nail. |
In addition to the foot and ankle products, in our upper extremities line of products we also
launched a second generation MICRONAIL® II distal radius implant.
9
Table of Contents
Our new biologic offerings include PRO-DENSE® CDK, the ALLOPURE™ wedge, and
the BIOTAPE® XM tissue matrix.
In 2009, we launched the DYNASTY® BIOFOAM™ cancellous titanium acetabular cup
system, which features proprietary bone-like titanium with a roughened texture for cementless
fixation of the implant. We also added to our PROFEMUR® hip product line by adding the
PROFEMUR® FC Primary stem. Additionally, we expanded our CONSERVE® family of
products by offering the CONSERVE® press-fit, which offers an uncemented option of the
CONSERVE® Plus femoral component. PROPHECY™ pre-operative navigational guides
for total knee replacement surgery were introduced to provide surgeons with a low-cost, customized,
minimally invasive alternative to traditional instrumentation and expensive computer-aided
navigation systems.
Manufacturing, Facilities and Quality
We operate a state of the art manufacturing facility in Arlington, Tennessee. At this facility, we
primarily produce orthopaedic implants and some related surgical instrumentation while utilizing
lean manufacturing philosophies. The majority of our biologic products and surgical instrumentation
are produced to our specifications by qualified subcontractors who serve medical device companies.
Our present manufacturing facility is adequate for our projected needs in the upcoming years.
We maintain a comprehensive quality system that is certified to the European standards ISO 9001 and
ISO 13485 and to the Canadian Medical Devices Assessment System (CMDCAS). We are accredited by the
AATB and have registrations with the FDA as a medical device establishment and as a tissue
establishment. These certifications and registrations require periodic audits and inspections by
various regulatory entities to determine if we have systems in place to ensure our product is safe
and effective for its intended use and that we are compliant with applicable regulatory
requirements. The quality system exists so that management has the proper oversight, designs are
evaluated and tested, production processes are established and maintained and monitoring activities
are in place to ensure products are safe, effective and manufactured according to our
specifications. Consequently, our quality system provides the way for us to ensure we design and
build quality into our products while meeting global requirements. We are committed to meet or
exceed customer needs as we improve patient outcomes.
Supply
We rely on a limited number of suppliers for the components used in our products. Our
reconstructive joint devices are produced from various surgical grades of titanium, cobalt chrome,
stainless steel, various grades of high density polyethylenes and ceramics. We rely on one source
to supply us with a certain grade of cobalt chrome alloy and one supplier for the silicone
elastomer used in our extremity products. We are aware of only two suppliers of silicone elastomer
to the medical device industry for permanent implant usage. Additionally, we rely on one supplier
of ceramics for use in our hip products. For certain biologic products, we depend on one supplier
of DBM, cancellous bone matrix (CBM) and soft tissue graft for BIOTAPE® XM . We rely
on one supplier for our GRAFTJACKET® family of soft tissue repair and graft containment
products, and one supplier for our xenograft bone wedge product. We maintain adequate stock from
these suppliers to meet market demand.
Sales and Marketing
Our sales and marketing efforts are focused primarily on orthopaedic and podiatric surgeons, who
typically are the primary decision-makers in orthopaedic device purchases. We have established
relationships with surgeons, who we
believe are leaders in their chosen orthopaedic specialties. These surgeons help us design products
to solve some of the most challenging problems facing orthopaedic surgeons today. They also help us
train other surgeons in the safe and effective use of our products and help other surgeons perfect
new surgical techniques.
We offer clinical symposia and seminars, publish advertisements and the results of clinical studies
in industry publications and offer surgeon-to-surgeon education on our products using our surgeon
advisors in an instructional capacity. Additionally, approximately 16,000 practicing orthopaedic
surgeons in the U.S. receive information on our latest products through our distribution network,
our website and brochure mailings.
We sell our products in the U.S. through a sales force of approximately 400 people as of December
31, 2009. This sales force primarily consists of independent, commission-based sales
representatives and distributors engaged
10
Table of Contents
principally in the business of supplying orthopaedic
products to hospitals in their geographic areas. However, we also directly employ 25% of our sales
force through a group of corporate sales representatives in select locations throughout the U.S.
Our U.S. field sales force is supported by our Tennessee-based sales and marketing organization.
In early 2007, we began an initiative to separate and focus our sales representatives in the U.S.
as either large joints and upper extremities specialists or foot and ankle specialists, with
biologics being sold by all reps. We now have over 100 focused foot and ankle sales
representatives, and we intend to continue to increase this number in the upcoming years.
Our independent distributors, independent sales representatives and direct sales representatives
are provided opportunities for product training throughout the year.
We believe our success in every market sector is dependent upon having a robust and compelling
product offering, and equally as important, a dedicated, highly trained, focused sales organization
to service the customer.
Our products are marketed internationally through a combination of direct sales offices
(subsidiaries) in certain key international markets and distributors in other markets. We have
subsidiaries in Italy, the United Kingdom, Belgium, Germany, France, the Netherlands, Japan, Canada
and Australia that employ direct sales employees and in some cases use independent sales
representatives to sell our products in their respective markets. Our products are sold in other
countries in Europe, Asia, Africa and Latin America using stocking distribution partners. Stocking
distributors purchase products directly from us for resale to their local customers, with product
ownership generally passing to the distributor upon shipment. As of December 31, 2009, through a
combination of our direct sales offices and approximately 75 stocking distribution partners, we
have approximately 700 international sales representatives that sell our products in approximately
60 countries.
Seasonal Nature of Business
We traditionally experience lower sales volumes in the third quarter than throughout the rest of
the year as many of our products are used in elective procedures, which generally decline during
the summer months, typically resulting in selling, general and administrative expenses and research
and development expenses as a percentage of sales that are higher during this period than
throughout the rest of the year. In addition, our first quarter selling, general and administrative
expenses include additional expenses that we incur in connection with the annual meeting held by
the American Academy of Orthopaedic Surgeons (AAOS). This meeting, which is the largest orthopaedic
meeting in the world, features the presentation of scientific papers and instructional courses for
orthopaedic surgeons. During this three-day event, we display our most recent and innovative
products for these surgeons.
Competition
Competition in the orthopaedic device industry is intense and is characterized by extensive
research efforts and rapid technological progress. Competitors include major companies in the
orthopaedic and biologics industries, as well as academic institutions and other public and private
research organizations that continue to conduct research, seek patent protection and establish
arrangements for commercializing products that will compete with our products.
The primary competitive factors facing us include price, quality, innovative design and technical
capability, breadth of product line, scale of operations and distribution capabilities. Our current
and future competitors may have greater resources and stronger name recognition than we do within
the total joint reconstruction area. Our ability to compete is affected by our ability to:
| • | develop new products and innovative technologies; |
| • | obtain regulatory clearance and reimbursement for our products; |
| • | manufacture and sell our products cost-effectively; |
| • | meet all relevant quality standards for our products and their markets; |
11
Table of Contents
| • | respond to competitive pressures specific to each of our geographic markets, including our ability to enforce non-compete agreements; |
| • | protect the proprietary technology of our products and manufacturing processes; |
| • | market our products; |
| • | attract and retain skilled employees and focused sales representatives; and |
| • | maintain and establish distribution relationships. |
Intellectual Property
We currently own or have licenses to use more than 250 patents and pending patent applications
throughout the world. We seek to aggressively protect technology, inventions and improvements that
we consider important through the use of patents and trade secrets in the U.S. and significant
foreign markets. We manufacture and market products both under patents and license agreements with
other parties. These patents have a defined life and expire from time to time.
Our knowledge and experience, creative product development, marketing staff and trade secret
information with respect to manufacturing processes, materials and product design, are as important
as our patents in maintaining our proprietary product lines. As a condition of employment, we
require all employees to execute a confidentiality agreement with us relating to proprietary
information and patent rights.
There can be no assurances that our patents will provide competitive advantages for our products,
or that competitors will not challenge or circumvent these rights. In addition, there can be no
assurances that the United States Patent and Trademark Office (USPTO) will issue any of our pending
patent applications. The USPTO may deny or require a significant narrowing of the claims in our
pending patent applications and the patents issuing from such applications. Any patents issuing
from the pending patent applications may not provide us with significant commercial protection. We
could incur substantial costs in proceedings before the USPTO. These proceedings could result in
adverse decisions as to the priority of our inventions and the narrowing or invalidation of claims
in issued patents. Additionally, the laws of some of the countries in which our products are or may
be sold may not protect our intellectual property to the same extent as the laws in the U.S. or at
all.
While we do not believe that any of our products infringe any valid claims of patents or other
proprietary rights held by others, there can be no assurances that we do not infringe any patents
or other proprietary rights held by them. If our products were found to infringe any proprietary
right of another party, we could be required to pay significant damages or license fees to such
party and/or cease production, marketing and distribution of those products. Litigation may also be
necessary to enforce patent rights we hold or to protect trade secrets or techniques we own. We are
currently involved in an intellectual property lawsuit with Howmedica Osteonics Corp., a subsidiary
of Stryker Corporation. See “Legal Proceedings” for an additional discussion of this lawsuit.
We also rely on trade secrets and other unpatented proprietary technology. There can be no
assurances that we can meaningfully protect our rights in our unpatented proprietary technology or
that others will not independently
develop substantially equivalent proprietary products or processes or otherwise gain access to our
proprietary technology. We seek to protect our trade secrets and proprietary know-how, in part,
with confidentiality agreements with employees and consultants. There can be no assurances,
however, that the agreements will not be breached, adequate remedies for any breach would be
available, or competitors will not discover or independently develop our trade secrets.
Third-Party Reimbursement
In the U.S., as well as in foreign countries, government-funded or private insurance programs,
commonly known as third-party payors, pay a significant portion of the cost of a patient’s medical
expenses. A uniform policy of coverage does not exist among all of these payors relative to payment
of claims. Therefore, coverage can be quite different from payor to payor as well as from one
region of the country to another. We believe that reimbursement is an important factor in the
success of any medical device. Consequently, we seek coverage for all of our products.
12
Table of Contents
Reimbursement in the U.S. depends, in part, upon our ability to obtain FDA clearances and approvals
to market our products. Coverage also depends on our ability to demonstrate the short-term and
long-term clinical evidence and cost-effectiveness of our products. These supportive data are
obtained from both our clinical experience and formal clinical trials. We pursue and present these
results at major scientific and medical meetings and publish them in respected, peer-reviewed
medical journals.
All U.S. and foreign third-party coverage programs, whether government funded or insured
commercially, are developing increasingly sophisticated methods of controlling healthcare costs
through yet to be defined healthcare reform measures, government-managed healthcare systems,
coverage with evidence development processes, quality initiatives, pay-for-performance, Comparative
Effectiveness Research and capitation programs, group purchasing, redesign of benefit offerings,
encouragement of healthier lifestyles and exploration of more cost-effective methods of delivering
care. All of these types of programs can potentially impact pricing structures and, subsequently,
the coverage for all medical devices and associated services.
Employees
As of December 31, 2009, we employed approximately 1,320 people in the following areas: 500 in
manufacturing, 490 in sales and marketing, 170 in administration and 160 in research and
development. We believe that we have an excellent relationship with our employees.
Environmental
Our operations and properties are subject to extensive federal, state, local and foreign
environmental protection and health and safety laws and regulations. These laws and regulations
govern, among other things, the generation, storage, handling, use and transportation of hazardous
materials and the handling and disposal of hazardous waste generated at our facilities. Under such
laws and regulations, we are required to obtain permits from governmental authorities for some of
our operations. If we violate or fail to comply with these laws, regulations or permits, we could
be fined or otherwise sanctioned by regulators. Under some environmental laws and regulations, we
could also be held responsible for all of the costs relating to any contamination at our past or
present facilities and at third-party waste disposal sites.
We believe our costs of complying with current and future environmental laws, regulations and
permits and our liabilities arising from past or future releases of, or exposure to, hazardous
substances will not materially adversely affect our business, results of operations or financial
condition, although there can be no assurances of this.
Available Information
Our website is located at www.wmt.com. We make available free of charge through this
website our annual reports on Form 10-K, quarterly reports on Form 10-Q, current reports on Form
8-K and amendments to those reports filed with or furnished to the Securities and Exchange
Commission (SEC) pursuant to Section 13(a) or 15(d) of the Securities Exchange Act of 1934, as
amended, as soon as reasonably practicable after they are electronically filed
with or furnished to the SEC.
Item 1A. Risk Factors.
Our business and its future performance may be affected by various factors, the most significant of
which are discussed below.
We are subject to substantial government regulation that could have a material adverse effect on
our business.
The production and marketing of our products and our ongoing research and development, pre-clinical
testing and clinical trial activities are subject to extensive regulation and review by numerous
governmental authorities both in the U.S. and abroad. See “Business — Government Regulation” for
further details on this process. U.S. and foreign regulations govern the testing, marketing and
registration of new medical devices, in addition to regulating manufacturing practices, reporting,
labeling and recordkeeping procedures. The regulatory process requires significant time, effort and
expenditures to bring our products to market, and we cannot be assured that any of our
13
Table of Contents
products
will be approved.
Our failure to comply with applicable regulatory requirements could result in
these governmental authorities:
| • | imposing fines and penalties on us; |
| • | preventing us from manufacturing or selling our products; |
| • | bringing civil or criminal charges against us; |
| • | delaying the introduction of our new products into the market; |
| • | recalling or seizing our products; or |
| • | withdrawing or denying approvals or clearances for our products. |
Even if regulatory approval or clearance of a product is granted, this could result in limitations
on the uses for which the product may be labeled and promoted. Further, for a marketed product, its
manufacturer and manufacturing facilities are subject to periodic review and inspection. Subsequent
discovery of problems with a product, manufacturer or facility may result in restrictions on the
product, manufacturer or facility, including withdrawal of the product from the market or other
enforcement actions. Our products can only be marketed in accordance with their FDA approved
labeling. If we were to promote the use of our products in an “off-label” manner, we would be
subject to civil and criminal sanctions.
In April 2009, the FDA issued an order requiring the manufacturers of approximately 25 Class III
devices to submit to the FDA a summary of any information known or otherwise available to them
concerning the safety and efficacy of the products. Metal-on-metal hip products, including ours,
are included in this product code. Class III devices generally require submission and approval of a
premarket approval (PMA) application prior to marketing. The FDA has historically allowed the
devices in this product code to be marketed without the requirement of a PMA application, as they
were marketed before May 28, 1976, or are substantially equivalent to devices that were marketed
before May 28, 1976 or approved under a premarket notification 510(k) since May 28, 1976, when the
Medical Device Amendments of 1976 were enacted, and Congress included transition provisions
designed to preserve availability of then-marketed Class III devices pending FDA approval of PMA
applications. The FDA will determine, for each device in this order, whether the classification of
the device should (a) remain as Class III and require submission of a PMA or a notice of completion
of a Product Development Protocol, or (b) be reclassified as Class I or II. We cannot predict the
outcome of the FDA’s review of these products; however, if we are required to submit a PMA
application for our metal-on-metal hip products, we may be unable to continue to market these
products until the FDA approves the PMA application.
We are currently conducting clinical studies of some of our products under an investigational
device exemption. Clinical studies must be conducted in compliance with FDA regulations, or the FDA
may take enforcement action. The data collected from these clinical studies will ultimately be used
to support market clearance for these products. There is no assurance that the FDA will accept the
data from these clinical studies or that it will ultimately allow market clearance for these
products.
We are subject to various foreign, federal and state laws concerning healthcare fraud and abuse,
including false claims laws, anti-kickback laws and physician self-referral laws. Violations of
these laws can result in criminal and/or civil punishment, including fines, imprisonment and, in
the U.S., exclusion from participation in government healthcare programs. Increased funding for
enforcement of these laws and regulations has resulted in greater scrutiny of marketing practices
in our industry and resulted in several government investigations by various government
authorities. If a governmental authority were to determine that we do not comply with these laws
and regulations, then we and our officers and employees could be subject to criminal and civil
sanctions, including exclusion from participation in federal healthcare reimbursement programs.
In order to market our devices in the member countries of the European Union, we are required to
comply with the European Medical Devices Directive and obtain CE mark certification. CE mark
certification is the European symbol of adherence to quality assurance standards and compliance
with applicable European Medical Device Directives. Under the European Medical Devices Directive,
all medical devices including active implants must qualify for CE marking.
14
Table of Contents
We are involved in government investigations, the results of which may adversely impact our
business and results of operations, and lead to other government investigations or actions by other
third parties.
In December 2007, we received a subpoena from the U.S. Attorney’s Office for the District of New
Jersey requesting documents for the period January 1998 through the present related to any
consulting and professional service agreements with orthopaedic surgeons in connection with U.S.
hip or knee joint replacement procedures or products. We have cooperated and intend to continue to
fully cooperate with the U.S. Department of Justice (DOJ) in this investigation. In June 2008, our
principal operating subsidiary, Wright Medical Technology, Inc., received letters from the SEC and
the DOJ informing us that they are conducting an informal investigation regarding potential
violations of the Foreign Corrupt Practices Act (FCPA) in the sale of medical devices in a number
of foreign countries by companies in the medical device industry. We understand that several other
medical device companies received similar letters. We have cooperated and intend to continue to
fully cooperate with this informal investigation.
The results of these inquiries may not be known for some time. If we are found to have violated one
or more applicable laws as a result of these investigations or we otherwise must resolve the
matters, our business, financial condition and results of operations could be materially adversely
affected and we may be required to significantly change some of our existing business practices.
These pending investigations could lead to investigations by state authorities or other government
agencies. Other companies facing similar investigations have been subject to shareholder derivative
actions. In addition, these types of inquiries could increase our exposure to lawsuits by potential
whistle blowers under the federal false claims acts. We intend to review and take appropriate
actions with respect to any such investigations or proceedings; however, we cannot assure that the
costs of investigating, defending, or resolving those investigations or proceedings would not have
a material adverse effect on our results of operations, financial condition and cash flow.
Cooperating with these inquiries requires considerable time and significant expense. During 2009
and 2008, we incurred $7.8 million and $7.6 million of expenses, respectively, associated with
these U.S. government inquiries, primarily related to legal fees. We anticipate that future
expenses related to these inquires may continue to be significant. In addition, upon the conclusion
of these inquiries, we may incur significant expenses associated with compliance and monitoring.
In 2007, as a result of a two-year government investigation regarding potential financial
inducements paid to orthopaedic surgeons, five of our competitors entered into deferred prosecution
or non-prosecution agreements with the DOJ, and four of those companies entered into settlement
agreements with the U.S. Department of Health and Human Services, Office of the Inspector General.
If we were to incur fines or enter into financial settlements, it is possible that they could have
a material adverse effect to our results of operations, financial condition and cash flow.
Modifications to our marketed devices may require FDA regulatory clearances or approvals or require
us to cease marketing or recall the modified devices until such clearances or approvals are
obtained.
We obtain premarket clearance under Section 510(k) of the FDC Act for products we market in the
U.S. We have modified some of our products and product labeling since obtaining 510(k) clearance,
but we do not believe these modifications require us to submit new 510(k) notifications. However,
if the FDA disagrees with us and requires us to submit a new 510(k) notification for modifications
to our existing products, we may be the subject of enforcement actions by the FDA and be required
to stop marketing the products while the FDA reviews the 510(k) modification. If the FDA requires
us to go through a lengthier, more rigorous examination than we had expected, our product
introductions or modifications could be delayed or canceled, which could cause our sales to
decline. In addition, the FDA may determine that future products will require clinical data to be
submitted for 510(k) clearance more regularly or may require the more costly, lengthy and uncertain
PMA application process. Products that are approved through a PMA application generally need FDA
approval before they can be modified. See “Business — Government Regulation.”
15
Table of Contents
If we lose one of our key suppliers, we may be unable to meet customer orders for our products
in a timely manner or within our budget.
We rely on a limited number of suppliers for the components used in our products. Our
reconstructive joint devices are produced from various surgical grades of titanium, cobalt chrome
and stainless steel, various grades of high-density polyethylenes, and ceramics. We rely on one
source to supply us with a certain grade of cobalt chrome alloy and one supplier for the silicone
elastomer used in some of our extremity products. We are aware of only two suppliers of silicone
elastomer to the medical device industry for permanent implant usage. Additionally, we rely on one
supplier of ceramics for use in our hip products.
Further, we rely on one supplier for our GRAFTJACKET® family of soft tissue repair and
graft containment products. To remain an exclusive distributor of this material, we must achieve
minimum two-year compound annual growth rates. If we fall below the required minimum growth rate,
we have an option to preserve our exclusivity by making an additional cash payment for the royalty
shortfall; however this payment would have an unfavorable impact on the product’s cost of sales. In
2009, we did not meet the minimum, and we intend to pay approximately $650,000 to maintain
exclusivity. No assurances can be made that we will maintain the required minimum growth rates in
future years.
In addition, certain biologic products depend upon a single supplier as our source for DBM and CBM,
and any failure to obtain DBM and CBM from this source in a timely manner will deplete levels of
on-hand raw materials inventory and could interfere with our ability to process and distribute
allograft products. During 2010, we are expecting a single not-for-profit tissue bank to meet all
of our DBM and CBM order requirements, a key component in the allograft products we currently
produce, market and distribute. In addition, we rely on a single supplier of soft tissue graft for
BIOTAPE® XM.
We cannot be sure that our supply of DBM, CBM and soft tissue graft for BIOTAPE® XM will
continue to be available at current levels or will be sufficient to meet our needs, or that future
suppliers of DBM, CBM and soft tissue graft for BIOTAPE® XM will be free from FDA
regulatory action impacting their sale of DBM, CBM and soft tissue graft for BIOTAPE®
XM. As there is a small number of suppliers, if we cannot continue to obtain DBM, CBM and soft
tissue graft for BIOTAPE® XM from our current sources in volumes sufficient to meet our
needs, we may not be able to locate replacement sources of DBM, CBM and soft tissue graft for
BIOTAPE® XM on commercially reasonable terms, if at all. This could have the effect of
interrupting our business, which could adversely affect our sales.
Suppliers of raw materials and components may decide, or be required, for reasons beyond our
control to cease supplying raw materials and components to us. FDA regulations may require
additional testing of any raw materials or components from new suppliers prior to our use of these
materials or components and in the case of a device with a PMA application, we may be required to
obtain prior FDA permission, either of which could delay or prevent our access to or use of such
raw materials or components.
If market clearance is not obtained for enhancements to the CONSERVE® Plus implant in
the U.S., growth of our hip product line could be impacted.
In November 2009, we received approval from the FDA to market our original CONSERVE® Plus total hip
resurfacing system, which enables us to initiate efforts to introduce additional enhancements to
the system which are currently available outside the U.S. We intend to incorporate these future
product options into the system’s femoral and component offerings via a PMA Supplement. There can
be no assurance that these enhancements will be cleared by the FDA in a timely manner if at all,
which could have a significant impact on the future growth of our hip product line.
Our biologics business is subject to emerging governmental regulations that can significantly
impact our business.
The FDA has statutory authority to regulate allograft-based products, processing and materials. The
FDA, European Union and Health Canada have been working to establish more comprehensive regulatory
frameworks for allograft-based, tissue-containing products, which are principally derived from
cadaveric tissue. The framework developed by the FDA establishes risk-based criteria for
determining whether a particular human tissue-based product will be
16
Table of Contents
classified as human tissue, a
medical device or biologic drug requiring premarket clearance or approval. All tissue-based
products are subject to extensive FDA regulation, including establishment registration
requirements, product listing requirements, good tissue practice requirements for manufacturing and
screening requirements that ensure that diseases are not transmitted to tissue recipients. The FDA
has also proposed extensive additional requirements that address sub-contracted tissue services,
traceability to the recipient/patient and donor records review. If a tissue-based product is
considered human tissue, the FDA requirements focus on preventing the introduction, transmission
and spread of communicable diseases to recipients. Clinical data or review of safety and efficacy
are not required before the tissue can be marketed. However, if it is considered a medical device
or biologic drug, then FDA clearance or approval is required.
Additionally, our biologics business involves the procurement and transplantation of allograft
tissue, which is subject to federal regulation under the National Organ Transplant Act (NOTA). NOTA
prohibits the sale of human organs, including bone and other human tissue, for valuable
consideration within the meaning of NOTA. NOTA permits the payment of reasonable expenses
associated with the transportation, processing, preservation, quality control and storage of human
tissue. We currently charge our customers for these expenses. In the future, if NOTA is amended or
reinterpreted, we may not be able to charge these expenses to our customers and, as a result, our
business could be adversely affected.
Our principal allograft-based biologics offerings include ALLOMATRIX®,
GRAFTJACKET® and IGNITE® products.
If we fail to compete successfully in the future against our existing or potential competitors, our
sales and operating results may be negatively affected and we may not achieve future growth.
The markets for our products are highly competitive and dominated by a small number of large
companies. We may not be able to meet the prices offered by our competitors, or offer products
similar to or more desirable than those offered by our competitors. See “Business — Competition.”
We derive a significant portion of our sales from operations in international markets that are
subject to political, economic and social instability.
We derive a significant portion of our sales from operations in international markets. Our
international distribution system consists of eight direct sales offices and approximately 75
stocking distribution partners, which combined employ approximately 700 sales representatives who
sell in approximately 60 countries. Most of these countries are, to some degree, subject to
political, social and economic instability. For the years ended December 31, 2009, 2008 and 2007,
39% of our net sales were derived from our international operations. Our international sales
operations expose us and our representatives, agents and distributors to risks inherent in
operating in foreign jurisdictions. These risks include:
| • | the imposition of additional foreign governmental controls or regulations on orthopaedic implants and biologic products; | |
| • | new export license requirements, particularly related to our biologic products; | |
| • | economic instability, including currency risk between the U.S. dollar and foreign currencies, in our target markets; | |
| • | a shortage of high-quality international salespeople and distributors; | |
| • | loss of any key personnel who possess proprietary knowledge or are otherwise important to our success in international markets; | |
| • | changes in third-party reimbursement policy that may require some of the patients who receive our implant products to directly absorb medical costs or that may necessitate our reducing selling prices for our products; | |
| • | changes in tariffs and other trade restrictions, particularly related to the exportation of our biologic products; | |
| • | work stoppages or strikes in the healthcare industry, such as those that have affected our operations in France, Canada, Korea and Finland in the past; | |
| • | a shortage of nurses in some of our target markets; and |
17
Table of Contents
| • | exposure to different legal and political standards due to our conducting business in approximately 60 countries. |
As a U.S. based company doing business in foreign jurisdictions, not only are we subject to the
laws of other jurisdictions, we are also subject to U.S. laws governing our activities in foreign
countries, such as the FCPA, as well as various import-export laws, regulations, and embargoes. If
our business activities were determined to violate these laws, regulations or rules, we could
suffer serious consequences.
Any material decrease in our foreign sales may negatively impact our profitability. Our
international sales are predominately generated in Europe. In Europe, healthcare regulation and
reimbursement for medical devices vary significantly from country to country. This changing
environment could adversely affect our ability to sell our products in some European countries.
The collectability of our accounts receivable may be affected by general economic conditions.
Our liquidity is dependent on, among other things, the collection of our accounts receivable.
Collections of our receivables may be affected by general economic conditions. Although current
economic conditions have not had a material adverse effect on our ability to collect such
receivables, we can make no assurances regarding future economic conditions or their effect on our
ability to collect our receivables, particularly from our international stocking distributors.
As of December 31, 2009, our accounts receivable balance totaled $101.7 million, and one customer,
our stocking distributor in Turkey, accounted for approximately 10% of accounts receivable. As of
December 31, 2009 and 2008, the balance due from this customer was $10.7 million, or 10.5% of our
accounts receivable balance, and $10.6 million or 10.4% of our accounts receivable balance,
respectively, a significant portion of which was past due. As of December 31, 2009, we have
recorded a $5.6 million provision for potential losses related to this trade receivable.
Recent turmoil in the credit markets and the financial services industry may negatively impact our
business.
Recently, the credit markets and the financial services industry have been experiencing a period of
unprecedented turmoil and upheaval characterized by the bankruptcy, failure, collapse or sale of
various financial institutions and an unprecedented level of intervention from the U.S. and foreign
governments. While the ultimate outcome of these events cannot be predicted, they may have an
adverse effect on our customers’ ability to borrow money from their existing lenders or to obtain
credit from other sources to purchase our products. In addition, the recent economic crisis could
also adversely impact our suppliers’ ability to provide us with materials and components, either of
which may negatively impact our business.
Efforts to enhance our corporate compliance program require the cooperation of many individuals and
may divert substantial financial and human resources from our other business activities.
We are committed to enhancing our corporate compliance program. This will require additional
financial and human resources. Successful implementation of our enhanced corporate compliance
program will require the full and sustained cooperation of our employees, distributors, and sales
agents as well as the healthcare professionals with whom they interact. These efforts will not only
require increased expenses, but will also require time and attention from management and key
employees preventing them from devoting as much time as they might otherwise spend on other
business matters.
Efforts to acquire and integrate other companies or product lines could adversely affect our
operations and financial results.
We may pursue acquisitions of other companies or product lines. Our ability to grow through
acquisitions depends upon our ability to identify, negotiate, complete and integrate suitable
acquisitions and to obtain any necessary financing. With respect to the acquisitions completed or
other future acquisitions, we may also experience:
| • | difficulties in integrating any acquired companies, personnel and products into our existing business; | |
| • | delays in realizing the benefits of the acquired company or products; |
18
Table of Contents
| • | diversion of our management’s time and attention from other business concerns; | |
| • | limited or no direct prior experience in new markets or countries we may enter; | |
| • | higher costs of integration than we anticipated; or | |
| • | difficulties in retaining key employees of the acquired business who are necessary to manage these acquisitions. |
In addition, any future acquisitions could materially impair our operating results by causing us to
incur debt or requiring us to amortize acquired assets.
Recent restructuring efforts could adversely affect our operations and financial results.
In June 2007, we announced plans to close our manufacturing, distribution and administrative
facility located in Toulon, France. The facility’s closure affected approximately 130 Toulon-based
employees. The majority of our restructuring activities were complete by the end of 2007, with
Toulon’s production being transferred to our existing manufacturing facility in Arlington,
Tennessee and its distribution activities being transferred to our European headquarters in
Amsterdam, the Netherlands.
In October 2009, we announced our plans to close our distribution and finance support office in
Creteil, France, to migrate all relevant French distribution and support functions into our
European organization based out of our European headquarters in Amsterdam. The majority of our
restructuring activities were complete by the end of 2009, with Creteil’s distribution and support
functions being transferred to our European headquarters in Amsterdam, the Netherlands.
With respect to the restructuring activities in process, we may experience:
| • | higher costs of restructuring than we anticipated; | |
| • | difficulties in completing all restructuring activities within the budgeted time; or | |
| • | diversion of our management’s time and attention from other business concerns. |
In connection with the closure of our Toulon, France facility, 103 of our former employees have
filed claims to challenge the economic justification for their dismissal. To date, we have received
judgments for 86 of those claims, the substantial majority of which were unfavorable to us. All of
these judgments have been appealed, or are expected
to be appealed, by both parties. Management has estimated the probable liability upon the ultimate
resolution of these 103 claims to be $4.6 million, and has therefore recorded this amount as a
liability within “Accrued expenses and other current liabilities” in our consolidated balance sheet
as of December 31, 2009.
If our patents and other intellectual property rights do not adequately protect our products, we
may lose market share to our competitors and be unable to operate our business profitably.
We rely on patents, trade secrets, copyrights, know-how, trademarks, license agreements and
contractual provisions to establish our intellectual property rights and protect our products. See
“Business — Intellectual Property.” These legal means, however, afford only limited protection and
may not completely protect our rights. In addition, we cannot be assured that any of our pending
patent applications will issue. The USPTO may deny or require a significant narrowing of the claims
in our pending patent applications and the patents issuing from such applications. Any patents
issuing from the pending patent applications may not provide us with significant commercial
protection. We could incur substantial costs in proceedings before the USPTO. These proceedings
could result in adverse decisions as to the priority of our inventions and the narrowing or
invalidation of claims in issued patents. In addition, the laws of some of the countries in which
our products are or may be sold may not protect our intellectual property to the same extent as
U.S. laws or at all. We also may be unable to protect our rights in trade secrets and unpatented
proprietary technology in these countries.
In addition, we hold licenses from third parties that are necessary to utilize certain technologies
used in the design and manufacturing of some of our products. The loss of such licenses would
prevent us from manufacturing, marketing and selling these products, which could harm our business.
19
Table of Contents
We seek to protect our trade secrets, know-how and other unpatented proprietary technology, in
part, with confidentiality agreements with our employees, independent distributors and consultants.
We cannot be assured, however, that the agreements will not be breached, adequate remedies for any
breach would be available or our trade secrets, know-how, and other unpatented proprietary
technology will not otherwise become known to or independently developed by our competitors.
If we lose any existing or future intellectual property lawsuits, a court could require us to pay
significant damages or prevent us from selling our products.
The medical device industry is litigious with respect to patents and other intellectual property
rights. Companies in the medical device industry have used intellectual property litigation to gain
a competitive advantage. We are currently involved in an intellectual property lawsuit with
Howmedica Osteonics Corp., a subsidiary of Stryker Corporation, where it is alleged that our
ADVANCE® knee product line infringes one of Howmedica’s patents. In 2009, we received a
favorable ruling from the district court ruling that Howmedica’s asserted patent is invalid.
However, Howmedica has the right to appeal the decision to the United States Court of Appeals for
the Federal Circuit. The judge has determined to also rule on our defense regarding patent
unenforceability before Howmedica will be allowed to appeal. See “Legal Proceedings” for more
information regarding this lawsuit. If Howmedica were to succeed in obtaining the relief it claims,
the court could award damages to Howmedica and impose an injunction against further sales of our
product. If a monetary judgment is rendered against us, we may be forced to raise or borrow funds,
as a supplement to any available insurance claim proceeds, to pay the damages award.
In the future, we may become a party to other lawsuits involving patents or other intellectual
property. A legal proceeding, regardless of the outcome, could drain our financial resources and
divert the time and effort of our management. If we lose one of these proceedings, a court, or a
similar foreign governing body, could require us to pay significant damages to third parties,
require us to seek licenses from third parties, pay ongoing royalties, redesign our products, or
prevent us from manufacturing, using or selling our products. In addition to being costly,
protracted litigation to defend or prosecute our intellectual property rights could result in our
customers or potential customers deferring or limiting their purchase or use of the affected
products until resolution of the litigation.
If product liability lawsuits are brought against us, our business may be harmed.
The manufacture and sale of medical devices exposes us to significant risk of product liability
claims. In the past, we
have had a number of product liability claims relating to our products, none of which either
individually, or in the aggregate, have resulted in a material negative impact on our business. In
the future, we may be subject to additional product liability claims, some of which may have a
negative impact on our business. Additionally, we could experience a material design or
manufacturing failure in our products, a quality system failure, other safety issues, or heightened
regulatory scrutiny that would warrant a recall of some of our products. Our existing product
liability insurance coverage may be inadequate to protect us from any liabilities we might incur.
If a product liability claim or series of claims is brought against us for uninsured liabilities or
in excess of our insurance coverage, our business could suffer. In addition, a recall of some of
our products, whether or not the result of a product liability claim, could result in significant
costs and loss of customers.
One of our insurers has reserved the right to recover from us up to approximately $10.5 million
paid by the insurer for the settlements of 33 product liability lawsuits in West Virginia during
2009. We believe that an ultimate unfavorable resolution of this matter is not probable; therefore,
no provision has been made for any claim by our insurer as of the date of this report.
If we are unable to continue to develop and market new products and technologies, we may experience
a decrease in demand for our products or our products could become obsolete, and our business would
suffer.
We are continually engaged in product development and improvement programs, and new products
represent a significant component of our growth rate. We may be unable to compete effectively with
our competitors unless we can keep up with existing or new products and technologies in the
orthopaedic implant market. If we do not continue to introduce new products and technologies, or if
those products and technologies are not accepted, we may not be successful. Additionally, our
competitors’ new products and technologies may beat our products to market, may be more effective
or less expensive than our products or may render our products obsolete. See “Business —
Competition.”
20
Table of Contents
Our inability to maintain adequate working relationships with healthcare professionals could have a
negative impact on the Company’s future operating results.
We maintain close working relationships with respected physicians and medical personnel in
hospitals and universities who assist in product research and development. We continue to place
emphasis on the development of proprietary products and product improvements to complement and
expand our existing product lines. If we are unable to maintain these relationships, our ability to
develop and market new and improved products could decrease, and future operating results could be
unfavorably affected.
Our business could suffer if the medical community does not continue to accept allograft
technology.
New allograft products, technologies and enhancements may never achieve broad market acceptance due
to numerous factors, including:
| • | lack of clinical acceptance of allograft products and related technologies; | |
| • | the introduction of competitive tissue repair treatment options that render allograft products and technologies too expensive and obsolete; | |
| • | lack of available third-party reimbursement; | |
| • | the inability to train surgeons in the use of allograft products and technologies; | |
| • | the risk of disease transmission; and | |
| • | ethical concerns about the commercial aspects of harvesting cadaveric tissue. |
Market acceptance will also depend on the ability to demonstrate that existing and new allograft
products and technologies are attractive alternatives to existing tissue repair treatment options.
To demonstrate this, we rely upon surgeon evaluations of the clinical safety, efficacy, ease of
use, reliability and cost effectiveness of our tissue repair options and technologies.
Recommendations and endorsements by influential surgeons are important to the commercial success of
allograft products and technologies. In addition, several countries, notably Japan, prohibit the
use of allografts. If allograft products and technologies are not broadly accepted in the
marketplace, we may not achieve a competitive position in the market.
If adequate levels of reimbursement from third-party payors for our products are not obtained,
surgeons and patients may be reluctant to use our products and our sales may decline.
In the U.S., healthcare providers who purchase our products generally rely on third-party payors,
principally federally-funded Medicare, state Medicaid and private health insurance plans, to pay
for all or a portion of the cost of joint reconstructive procedures and products utilized in those
procedures. We may be unable to sell our products on a profitable basis if third-party payors deny
coverage or reduce their current levels of reimbursement. Our sales depend largely on governmental
healthcare programs and private health insurers reimbursing patients’ medical expenses. Surgeons,
hospitals and other healthcare providers may not purchase our products if they do not receive
satisfactory reimbursement from these third-party payors for the cost of the procedures using our
products. Payors continue to review their coverage policies carefully for existing and new
therapies and can, without notice, deny coverage for treatments that include the use of our
products.
In addition, some healthcare providers in the U.S. have adopted or are considering a managed care
system in which the providers contract to provide comprehensive health care for a fixed cost per
person. Healthcare providers may attempt to control costs by authorizing fewer elective surgical
procedures, including joint reconstructive surgeries, or by requiring the use of the least
expensive implant available. Additionally, there is some likelihood of reform of the U.S.
healthcare system, and changes in reimbursement policies or healthcare cost containment initiatives
that limit or restrict reimbursement for our products may cause our revenues to decline.
21
Table of Contents
If adequate levels of reimbursement from third-party payors outside of the U.S. are not obtained,
international sales of our products may decline. Outside of the U.S., reimbursement systems vary
significantly by country. Many foreign markets have government-managed healthcare systems that
govern reimbursement for medical devices and procedures. Canada, and some European and Asian
countries, in particular France, Japan, Taiwan and Korea, have tightened reimbursement rates.
Additionally, some foreign reimbursement systems provide for limited payments in a given period and
therefore result in extended payment periods. See “Business — Third-Party Reimbursement” for more
information regarding reimbursement in the U.S. and abroad.
Our business could be significantly and adversely impacted if certain types of healthcare reform
programs are adopted and other legislative proposals are enacted into law.
Recently, President Obama and Congress have proposed significant reforms to the U.S. healthcare
system. The Obama administration’s fiscal year 2010 budget included proposals to limit Medicare
payments, reduce drug spending and increase taxes.
On November 7, 2009, the U.S. House of Representatives passed its healthcare reform bill, the
Affordable Health Choices Act, H.R. 3962. Among other initiatives, this bill authorizes the
creation of a national public plan that would negotiate rates with providers and would be offered
through a new national health insurance exchange market, and imposes a 2.5% deductible excise tax
on domestic sales of certain medical devices following December 31, 2012, which is estimated to
contribute approximately $20 billion to healthcare reform over a period of 10 years.
On December 24, 2009, the U.S. Senate passed its own version of a healthcare reform bill, the
Patient Protection and Affordable Health Care Act, H.R. 3590. The Senate bill contains no provision
for a national public plan but does authorize the creation of at least two multi-state plans to be
offered on a new national health insurance exchange market and also authorizes approximately $6
billion to fund a Consumer Operated and Oriented Plan to support the creation of non-profit,
member-run health insurance companies that would be offered through the exchange. The Senate bill
also includes a $2 billion annual non-deductible excise tax on medical device manufacturers and
importers, which applies to any domestic sales of certain medical devices after December 31, 2009,
rising to a $3 billion annual excise tax after 2017.
It remains unclear how or when the differences between the two bills will be resolved, or if a
final bill ultimately will be enacted. Various healthcare reform proposals have also emerged at the
state level. We cannot predict with
certainty which healthcare initiatives, if any, will be implemented at the federal or state level,
or the effect any future legislation or regulation will have on us. However, an expansion in
government’s role in the U.S. healthcare industry may lower reimbursements for our products, reduce
medical procedure volumes, significantly increase our cost of doing business, and adversely affect
our business and results of operations, possibly materially. In addition, if the excise tax
contained in the proposed legislation from either the House or Senate bills is enacted into law,
and we are unable to increase the selling prices of our products to mitigate its impact, our
effective tax rate and results of operations would be materially and adversely affected.
There is an increasing trend for more criminal prosecutions and compliance enforcement activities
for noncompliance with the Health Insurance Portability and Accountability Act (HIPAA) as well as
for data breaches involving protected health information (PHI). In the ordinary course of our
business, we may receive PHI. If we are unable to comply with HIPAA or experience a data breach
involving PHI, we could be subject to criminal and civil sanctions.
Several states have enacted or are considering enacting legislation that limit the types of
interactions we can have with Health Care Professionals (HCPs). These state laws may inhibit our
ability to train HCPs on the safe and effective use of our products as well as make it more
difficult to work with HCPs on developing new products. This could have a negative impact on our
business.
If surgeons do not recommend and endorse our products, our sales may decline or we may be unable to
increase our sales and profits.
For us to sell our products, surgeons must prescribe them. We may not obtain the necessary
recommendations or endorsements from surgeons. Acceptance of our products depends on educating the
medical community as to the
22
Table of Contents
distinctive characteristics, perceived benefits, clinical efficacy and
cost-effectiveness of our products compared to products of our competitors and on training surgeons
in the proper application of our products.
We rely on our independent sales distributors and sales representatives to market and sell our
products.
Our success depends largely upon marketing arrangements with independent sales distributors and
sales representatives, in particular their sales and service expertise and relationships with the
customers in the marketplace. Independent distributors and sales representatives may terminate
their relationships with us or devote insufficient sales efforts to our products. We do not control
our independent distributors, and they may not be successful in implementing our marketing plans.
Our failure to maintain our existing relationships with our independent distributors and sales
representatives could have an adverse effect on our operations. Similarly, our failure to recruit
and retain additional skilled, independent sales distributors and sales representatives could have
an adverse effect on our operations. We have experienced turnover with some of our independent
sales distributors in the past, which adversely affected short-term financial results while we
transitioned to new independent sales distributors. While we believe these transitions have been
managed effectively, similar occurrences could happen in the future with different results which
could have a greater adverse effect on our operations than we have previously experienced.
Fluctuations in insurance cost and availability could adversely affect our profitability or our
risk management profile.
We hold a number of insurance policies, including product liability insurance, directors’ and
officers’ liability insurance, property insurance and workers’ compensation insurance. If the costs
of maintaining adequate insurance coverage should increase significantly in the future, our
operating results could be materially adversely impacted. Likewise, if the availability of any of
our current insurance coverage should become unavailable to us or become economically impractical,
we would be required to operate our business without indemnity from commercial insurance providers.
If we cannot retain our key personnel, we will not be able to manage and operate successfully and
we may not be able to meet our strategic objectives.
Our continued success depends, in part, upon key managerial, scientific, sales and technical
personnel, as well as our
ability to continue to attract and retain additional highly qualified personnel. We compete for
such personnel with other companies, academic institutions, governmental entities and other
organizations. There can be no assurance that we will be successful in retaining our current
personnel or in hiring or retaining qualified personnel in the future. Loss of key personnel or the
inability to hire or retain qualified personnel in the future could have a material adverse effect
on our ability to operate successfully. Further, any inability on our part to enforce non-compete
arrangements related to key personnel who have left the business could have a material adverse
effect on our business.
If a natural or man-made disaster strikes our manufacturing facility, we could be unable to
manufacture our products for a substantial amount of time and our sales could be disrupted.
We rely on a single manufacturing facility in Arlington, Tennessee. The Arlington facility and the
manufacturing equipment we use to produce our products would be difficult to replace and could
require substantial lead-time to repair or replace. Our facility may be affected by natural or
man-made disasters. In the event our facility is affected by a disaster, we would be forced to rely
on third-party manufacturers. Although we believe we have adequate disaster recovery plans in place
and we possess adequate insurance for damage to our property and the disruption of our business
from casualties, such plans and insurance may not cover such disasters and all of our potential
losses and may not continue to be available to us on acceptable terms or at all.
Our business plan relies on certain assumptions about the market for our products, which, if
incorrect, may adversely affect our profitability.
We believe that the aging of the general population and increasingly active lifestyles will
continue and that these trends will increase the need for our orthopaedic implant products. The
projected demand for our products could materially differ from actual demand if our assumptions
regarding these trends and acceptance of our products by the medical community prove to be
incorrect or do not materialize, or if non-surgical treatments gain more widespread acceptance as a
viable alternative to orthopaedic implants.
23
Table of Contents
Fluctuations in foreign currency exchange rates could result in declines in our reported sales and
earnings.
Because a majority of our international sales are denominated in local currencies and not in U.S.
dollars, our reported sales and earnings are subject to fluctuations in foreign exchange rates.
Approximately 28% of our total net sales were denominated in foreign currencies during the years
ended December 31, 2009, 2008 and 2007, and we expect that foreign currencies will continue to
represent a similarly significant percentage of our net sales in the future. Our international net
sales were unfavorably impacted by the impact of foreign currency fluctuations of approximately
$3.0 million in 2009, compared to the favorable impact of $7.9 million and $6.1 million in 2008 and
2007, respectively. Operating costs related to these sales are largely denominated in the same
respective currencies, thereby partially limiting our transaction risk exposure. However, cost of
sales related to these sales are primarily denominated in U.S. dollars; therefore, as the U.S.
dollar strengthens, the gross margin associated with our sales denominated in foreign currencies
experience declines.
We currently employ a derivative program using 30-day foreign currency forward contracts to
mitigate the risk of currency fluctuations on our intercompany receivable and payable balances that
are denominated in foreign currencies. These forward contracts are expected to offset the
transactional gains and losses on the related intercompany balances. These forward contracts are
not designated as hedging instruments under Financial Accounting Standards Board (FASB) Accounting
Standard Codification (ASC) Section 815, Derivatives and Hedging Activities. Accordingly, the
changes in the fair value and the settlement of the contracts are recognized in the period
incurred. We have not historically entered into hedging activities to mitigate the risk of foreign
currency fluctuations in our statement of operations.
Our quarterly operating results are subject to substantial fluctuations, and you should not rely on
them as an indication of our future results.
Our quarterly operating results may vary significantly due to a combination of factors, many of
which are beyond our control. These factors include:
| • | demand for products, which historically has been lowest in the third quarter; | |
| • | our ability to meet the demand for our products; | |
| • | increased competition; | |
| • | the number, timing and significance of new products and product introductions and enhancements by us and our competitors; | |
| • | our ability to develop, introduce and market new and enhanced versions of our products on a timely basis; | |
| • | changes in pricing policies by us and our competitors; | |
| • | changes in the treatment practices of orthopaedic surgeons; | |
| • | changes in distributor relationships and sales force size and composition; | |
| • | the timing of material expense- or income-generating events and the related recognition of their associated financial impact; | |
| • | prevailing interest rates on our excess cash investments; | |
| • | fluctuations in foreign currency rates; | |
| • | the timing of significant orders and shipments; | |
| • | availability of raw materials; | |
| • | work stoppages or strikes in the healthcare industry; | |
| • | changes in FDA and foreign governmental regulatory policies, requirements and enforcement practices; | |
| • | changes in accounting policies, estimates and treatments; | |
| • | restructuring charges, costs associated with our U.S. governmental inquiries and other charges; |
24
Table of Contents
| • | variations in cost of sales due to the amount and timing of excess and obsolete inventory charges, commodity prices and manufacturing variances; | |
| • | income tax fluctuations; and | |
| • | general economic factors. |
We believe our quarterly sales and operating results may vary significantly in the future and
period-to-period comparisons of our results of operations are not necessarily meaningful and should
not be relied upon as indications of future performance. We cannot assure you that our sales will
increase or be sustained in future periods or that we will be profitable in any future period. Any
shortfalls in sales or earnings from levels expected by securities or orthopaedic industry analysts
could have an immediate and significant adverse effect on the trading price of our common stock in
any given period.
Conversion of our convertible senior notes into common stock could result in dilution to our
stockholders.
Our convertible senior notes due 2014, with a face amount of $200 million, are convertible at the
option of the holder, subject to certain conditions, into shares of our common stock at an initial
conversion rate of 30.6279 shares per $1,000 principal amount of the notes, which represents a
conversion price of approximately $32.65 per share, subject to adjustment, at any time before close
of business on the business day preceding December 1, 2014, the maturity date of the notes.
Beginning December 6, 2011, we may redeem the notes for cash, in whole or in part, at a redemption
price equal to 100% of the principal amount of the notes to be redeemed, plus any accrued and
unpaid interest, if the closing sales price of our common stock has exceeded 140% of the conversion
price for at least 20 trading days in any 30-day trading period. In addition, if we experience a
fundamental change event, as defined in the note agreement, we may be required to purchase for cash
all or a portion of the notes, at a price equal to 100% of the principal amount of the notes plus
any unpaid and accrued interest. Additionally, if upon a fundamental change event a holder elects
to convert its notes, we may, under certain circumstances, increase the conversion rate for the
notes surrendered. All of the above rights are subject to certain limitations imposed by our credit
facility. Any issuance of shares as a result of the conversion of the notes would result in
dilution to our stockholders.
We may be prohibited from paying the convertible senior notes when they are due or be unable to
raise the funds necessary to repay the notes when due or finance a fundamental change purchase.
At maturity, the entire outstanding principal amount, which is currently $200 million, of our
convertible senior notes due 2014 will become due and payable. In addition, upon the occurrence of
a fundamental change event, holders of notes may require us to purchase their notes. A fundamental
change event includes (1) a change in ownership, (2) a consummation of a recapitalization,
reclassification, or change of common stock, share exchange or a consolidation or merger, (3) the
first day the majority of our board of directors does not consist of continuing directors, (4)
stockholder approval of any plan or proposal for liquidation of Wright, or (5) when our common
stock ceases to be listed on the national securities exchange in the United States, except as a
result of a merger, tender offer or exchange offer for our common stock. Additionally, the
principal amount of our convertible notes will become due upon an uncured or unwaived default in
our senior credit facility. However, we may not have sufficient funds to repay the notes at
maturity or to make the required purchase of the notes.
In addition, our ability to pay the notes at maturity or to purchase the notes upon a fundamental
change event may be limited by the terms of other agreements relating to our debt outstanding at
the time, including our revolving credit facility, which limits our ability to purchase the notes
for cash in certain circumstances. Our revolving credit facility prohibits us from making any cash
payments for the purchase of the notes upon the occurrence of a fundamental change event, and hence
we may not be able to purchase the notes for cash upon the occurrence of a fundamental change event
unless the revolving credit facility is amended to eliminate these restrictions or is no longer
outstanding at the time of such required payment. Any of our future debt agreements may contain
similar restrictions. Our failure to purchase tendered notes at a time when the purchase is
required by the indenture would constitute a default under the indenture, which in turn would
constitute an event of default under our revolving credit facility or under the other future
agreements governing our indebtedness at such time. If the repayment of the related indebtedness
were to be accelerated after any applicable notice or grace periods, we may not have sufficient
funds to repay the indebtedness or purchase the notes.
25
Table of Contents
Item 1B. Unresolved Staff Comments.
None.
Item 2. Properties.
Our corporate headquarters and U.S. operations consist of a manufacturing facility, a warehouse,
and an administration building with research and development facilities located on more than 50
acres in Arlington, Tennessee. We lease the manufacturing facility from the Industrial Development
Board of the Town of Arlington (IDB) under a lease agreement that is automatically renewable
through 2049. We may exercise an option to purchase the manufacturing facility from the IDB at a
nominal price at any time during the lease term. We also own a small facility in Arlington used for
pre-production engineering and general production. We lease the warehouse from the IDB under a
lease agreement that has no predetermined expiration date. We may exercise an option to purchase
the warehouse from the IDB at a nominal price at any time during the lease term. We lease a portion
of the administration building from the IDB under a lease agreement that expires on July 8, 2011.
We may exercise an option to purchase the leased portion of the administration building from the
IDB at a price of $101,000, which we have prepaid, at any time during the lease term. We own
another portion of the administrative building that was built in 2004.
During 2009, we purchased a building to address our future warehousing and customer service space
requirements. This property was subsequently placed into a lease agreement with the Arlington IDB.
The lease agreement expires in 2020, and we can purchase the property at any time for $1,000. This
building is being renovated to meet our requirements and will be occupied in 2010.
Our international operations include warehouse, sales, research and development and administrative
facilities located in several countries. Our primary international warehouse is located in a leased
facility in the Netherlands. Our primary international research and development facility is located
in leased facilities in Milan, Italy. Our sales
offices in Italy, the United Kingdom, Germany, Belgium, Japan and Canada also include warehouse and
administrative space.
Item 3. Legal Proceedings.
From time to time, we are subject to lawsuits and claims that arise out of our operations in the
normal course of business. We are the plaintiff or defendant in various litigation matters in the
ordinary course of business, some of which involve claims for damages that are substantial in
amount.
In 2000, Howmedica Osteonics Corp. (Howmedica), a subsidiary of Stryker Corporation, filed a
lawsuit against us in the United States District Court for the District of New Jersey (District
Court) alleging that we infringed Howmedica’s U.S. Patent No. 5,824,100 related to our
ADVANCE® knee product line. The lawsuit seeks an order of infringement, injunctive
relief, unspecified damages and various other costs and relief and could impact a substantial
portion of our knee product line. We believe, however, that we have strong defenses against
Howmedica’s claims and are vigorously defending this lawsuit. In November 2005, the District Court
issued a Markman ruling on claim construction. Howmedica conceded to the District Court that, if
the claim construction as issued was applied to our knee product line, our products do not infringe
their patent. Howmedica appealed the Markman ruling. In September 2008, the U.S. Court of Appeals
for the Federal Circuit (Federal Circuit) overturned the District Court’s Markman ruling on claim
construction. The case was remanded to the District Court for further proceedings on alleged
infringement and on our affirmative defenses, which include patent invalidity and unenforceability.
In 2009, we received a favorable ruling from the District Court ruling that Howmedica’s asserted
patent is invalid. However, Howmedica has the right to appeal the decision to the Federal Circuit.
The judge has determined to also rule on our defense regarding patent unenforceability before
Howmedica will be allowed to appeal. No provision has been made for this contingency as of December
31, 2009. These claims are covered in part by our patent infringement insurance. Management does
not believe that the outcome of this lawsuit will have a material adverse effect on our
consolidated financial position or results of operations.
26
Table of Contents
In late 2004 and early 2005, approximately 120 plaintiffs sued Dr. John King in the Circuit Court
of Putnam County, West Virginia. Plaintiffs alleged that Dr. King was professionally negligent when
he performed surgery on the plaintiffs at Putnam General Hospital in Putnam County, West Virginia
between November 2002 and June 2003. In 33 of the lawsuits, plaintiffs alleged that Dr. King
inappropriately used a biologic product sold by us. In these lawsuits, plaintiffs named us as a
defendant and alleged that our products had not been properly cleared by the United States Food and
Drug Administration, that we failed to warn that our products were not safe for their intended use,
and that we knew that Dr. King was not properly trained or was performing the surgeries
inappropriately. Plaintiffs also alleged that we and two other co-defendants entered into a joint
venture with Dr. King and/or his physician assistant, David McNair, such that we could be held
liable for his/their conduct. Plaintiffs further asserted claims based on strict liability, express
and implied breach of warranty, civil conspiracy, and negligence. They sought damages related to
alleged lost income, medical expenses, future medical and life care expenses, damages relating to
pain and suffering, and punitive and other damages. During 2009, we settled these 33
lawsuits pending against us, all of which were funded by our insurance carriers.
Item 4. Submission of Matters to a Vote of Security Holders.
None.
27
Table of Contents
PART II
| Item 5. | Market for Registrant’s Common Equity, Related Stockholder Matters and Issuer Purchases of Equity Securities. |
Market Information
Our common stock is traded on the Nasdaq Global Select Market under the symbol “WMGI.” The
following table sets forth, for the periods indicated, the high and low sales prices per share of
our common stock as reported on the Nasdaq Global Select Market.
| High | Low | |||||||
Fiscal Year 2008 |
||||||||
First Quarter |
$ | 29.98 | $ | 21.06 | ||||
Second Quarter |
$ | 31.49 | $ | 23.53 | ||||
Third Quarter |
$ | 33.26 | $ | 28.00 | ||||
Fourth Quarter |
$ | 30.71 | $ | 15.18 | ||||
Fiscal Year 2009 |
||||||||
First Quarter |
$ | 22.35 | $ | 11.17 | ||||
Second Quarter |
$ | 16.97 | $ | 12.03 | ||||
Third Quarter |
$ | 18.38 | $ | 13.37 | ||||
Fourth Quarter |
$ | 19.40 | $ | 15.32 | ||||
Holders
As of February 2, 2010, there were 689 stockholders of record and an estimated 11,404 beneficial
owners of our common stock.
Dividend Policy
We have never declared or paid cash dividends on our common stock. We currently intend to retain
all future earnings for the operation and expansion of our business. We do not anticipate declaring
or paying cash dividends on our common stock in the foreseeable future. Any payment of cash
dividends on our common stock will be at the discretion of our board of directors and will depend
upon our results of operations, earnings, capital requirements, contractual restrictions and other
factors deemed relevant by our board of directors. In addition, our current credit facility
prohibits us from paying any cash dividends without the lenders’ consent.
Equity Compensation Plan Information
The table below sets forth information regarding the number of securities to be issued upon the
exercise of the outstanding stock options granted under our equity compensation plans and the
shares of common stock remaining available for future issuance under our equity compensation plans
as of December 31, 2009 (in thousands):
| Number of securities | ||||||||||||
| remaining available for | ||||||||||||
| Number of securities | future issuance under | |||||||||||
| to be issued upon exercise | Weighted-average | equity compensation | ||||||||||
| of outstanding options | exercise price of | plans | ||||||||||
| Plan Category | (in thousands) | outstanding options | (in thousands) | |||||||||
Equity compensation plans
approved by security holders |
3,965 | $ | 23.79 | 1,122 | ||||||||
Equity compensation plans
not approved by security
holders |
— | — | — | |||||||||
Total |
3,965 | $ | 23.79 | 1,122 | ||||||||
28
Table of Contents
Comparison of Total Stockholder Returns
The graph below compares the cumulative total stockholder returns for the period from December 31,
2004 to December 31, 2009, for our common stock, an index composed of U.S. companies whose stock is
listed on the Nasdaq Global Select Market (the Nasdaq U.S. Companies Index), and an index
consisting of Nasdaq-listed companies in the surgical, medical, and dental instruments and supplies
industry (the Nasdaq Medical Equipment Companies Index). The graph assumes that $100.00 was
invested on December 31, 2004, in our common stock, the Nasdaq U.S. Companies Index, and the Nasdaq
Medical Equipment Companies Index, and that all dividends were reinvested. Total returns for the
two Nasdaq indices are weighted based on the market capitalization of the companies included
therein. Historic stock price performance is not indicative of future stock price performance. We
do not make or endorse any prediction as to future stock price performance.
Cumulative Total Stockholder Returns
Based on Reinvestment of $100.00 Beginning on December 31, 2004
Based on Reinvestment of $100.00 Beginning on December 31, 2004
| 12/31/2004 | 12/31/2005 | 12/31/2006 | 12/31/2007 | 12/31/2008 | 12/31/2009 | |||||||||||||||||||
Wright Medical Group, Inc. |
$ | 100.00 | $ | 71.58 | $ | 81.67 | $ | 102.33 | $ | 71.68 | $ | 66.46 | ||||||||||||
Nasdaq U.S. Companies Index |
100.00 | 102.13 | 112.18 | 121.67 | 58.64 | 79.70 | ||||||||||||||||||
Nasdaq Medical Equipment |
100.00 | 109.81 | 115.73 | 147.16 | 79.25 | 108.49 | ||||||||||||||||||
Companies Index |
||||||||||||||||||||||||
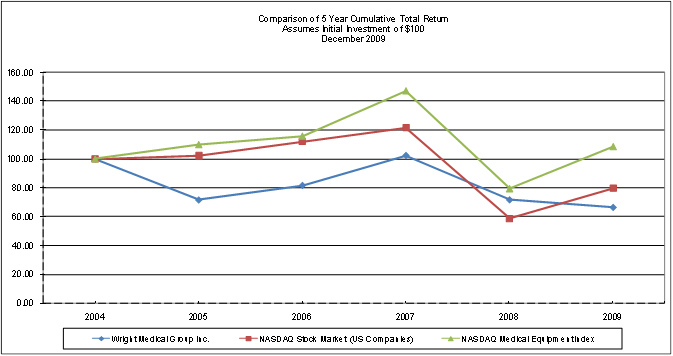
Copyright 2010: CRSP Center for Research in Security Prices, University of Chicago, Booth
School of Business. Zacks Investment Research, Inc. Used with permission. All rights reserved.
29
Table of Contents
| Item 6. | Selected Financial Data. |
The following tables set forth certain of our selected consolidated financial data as of the dates
and for the years indicated. The selected consolidated financial data was derived from our
consolidated financial statements audited by KPMG LLP. The audited consolidated financial
statements as of December 31, 2009, 2008, and 2007, and for the years then ended, are included
elsewhere in this annual report. The audited consolidated financial statements as of December 31,
2006 and 2005, and for the years then ended, are not included in this filing. Historical results
are not necessarily indicative of the results to be expected for any future period. These tables
are presented in thousands, except per share data.
| Year Ended December 31, | ||||||||||||||||||||
| 2009 | 2008 | 2007 | 2006 | 2005 | ||||||||||||||||
Statement of Operations: |
||||||||||||||||||||
Net sales |
$ | 487,508 | $ | 465,547 | $ | 386,850 | $ | 338,938 | $ | 319,137 | ||||||||||
Cost of sales (1) |
148,715 | 134,377 | 108,407 | 97,234 | 91,752 | |||||||||||||||
Cost of sales — restructuring (2) |
— | — | 2,139 | — | — | |||||||||||||||
Gross profit |
338,793 | 331,170 | 276,304 | 241,704 | 227,385 | |||||||||||||||
Operating expenses: |
||||||||||||||||||||
Selling, general and administrative
(1) |
270,456 | 261,396 | 225,929 | 192,573 | 167,365 | |||||||||||||||
Research and development (1) |
35,691 | 33,292 | 28,405 | 25,551 | 22,289 | |||||||||||||||
Amortization of intangible assets |
5,151 | 4,874 | 3,782 | 4,149 | 4,250 | |||||||||||||||
Restructuring charges (2) |
3,544 | 6,705 | 16,734 | — | — | |||||||||||||||
Acquired in-process research and
development costs (3) |
— | 2,490 | — | — | — | |||||||||||||||
Total operating expenses |
314,842 | 308,757 | 274,850 | 222,273 | 193,904 | |||||||||||||||
Operating income |
23,951 | 22,413 | 1,454 | 19,431 | 33,481 | |||||||||||||||
Interest expense (income), net |
5,466 | 2,181 | (1,252 | ) | (1,127 | ) | (176 | ) | ||||||||||||
Other expense(income), net (4) |
2,873 | (1,338 | ) | 375 | (1,643 | ) | 237 | |||||||||||||
Income before income taxes |
15,612 | 21,570 | 2,331 | 22,201 | 33,420 | |||||||||||||||
Provision for income taxes(7) |
3,481 | 18,373 | 1,370 | 7,790 | 12,355 | |||||||||||||||
Net income |
$ | 12,131 | $ | 3,197 | $ | 961 | $ | 14,411 | $ | 21,065 | ||||||||||
Net income per share: |
||||||||||||||||||||
Basic |
$ | 0.32 | $ | 0.09 | $ | 0.03 | $ | 0.42 | $ | 0.62 | ||||||||||
Diluted |
$ | 0.32 | $ | 0.09 | $ | 0.03 | $ | 0.41 | $ | 0.60 | ||||||||||
Weighted-average number of common shares
outstanding — basic |
37,366 | 36,933 | 35,812 | 34,434 | 33,959 | |||||||||||||||
Weighted-average number of common shares
outstanding — diluted |
37,443 | 37,401 | 36,483 | 35,439 | 35,199 | |||||||||||||||
30
Table of Contents
| As of December 31, | ||||||||||||||||||||
| 2009 | 2008 | 2007 | 2006 | 2005 | ||||||||||||||||
Consolidated Balance
Sheet Data: |
||||||||||||||||||||
Cash and cash equivalents |
$ | 84,409 | $ | 87,865 | $ | 229,026 | $ | 57,939 | $ | 51,277 | ||||||||||
Marketable securities |
86,819 | 57,614 | 15,535 | 30,325 | 25,000 | |||||||||||||||
Working capital |
421,647 | 401,406 | 417,817 | 220,306 | 196,126 | |||||||||||||||
Total assets |
714,284 | 692,130 | 669,985 | 409,402 | 371,810 | |||||||||||||||
Long-term liabilities |
204,919 | 205,253 | 207,820 | 14,162 | 15,547 | |||||||||||||||
Stockholders’ equity |
440,408 | 411,628 | 388,781 | 335,824 | 292,008 | |||||||||||||||
| Year Ended December 31, | ||||||||||||||||||||
| 2009 | 2008 | 2007 | 2006 | 2005 | ||||||||||||||||
Other Data: |
||||||||||||||||||||
Cash flow provided by (used in)
operating activities |
$ | 71,751 | $ | (3,610 | ) | $ | 24,424 | $ | 29,975 | $ | 5,291 | |||||||||
Cash flow used in investing activities |
(74,956 | ) | (148,942 | ) | (63,841 | ) | (28,349 | ) | (31,583 | ) | ||||||||||
Cash flow provided by (used in)
financing activities |
532 | 12,406 | 209,897 | 4,646 | (5,379 | ) | ||||||||||||||
Depreciation |
32,717 | 26,462 | 23,522 | 21,361 | 17,895 | |||||||||||||||
Stock-based compensation expense
(5) |
13,191 | 13,501 | 16,532 | 13,840 | 467 | |||||||||||||||
Capital expenditures(6) |
37,190 | 61,936 | 35,042 | 29,643 | 30,356 | |||||||||||||||
| (1) | These line items include the following amounts of non-cash, stock-based compensation expense for the periods indicated: |
| Year Ended December 31, | ||||||||||||||||||||
| 2009 | 2008 | 2007 | 2006 | 2005 | ||||||||||||||||
Cost of sales |
$ | 1,285 | $ | 1,244 | $ | 2,046 | $ | 854 | $ | 12 | ||||||||||
Selling, general and
administrative |
10,077 | 10,644 | 12,061 | 10,766 | 449 | |||||||||||||||
Research and development |
1,829 | 1,613 | 2,425 | 2,220 | 6 | |||||||||||||||
| (2) | During the years ended December 31, 2009, 2008 and 2007, we recorded pre-tax charges associated with the restructuring of our facilities in Toulon and Creteil, France, totaling $3.5 million, $6.7 million and $16.7 million, respectively. See Note 14 to our consolidated financial statements contained in “Financial Statements and Supplementary Data” for a detailed discussion of these activities and the associated charges. | |
| (3) | During the year ended December 31, 2008, we recorded $2.5 million of in-process research and development charges associated with our acquisition of Inbone Technologies, Inc. | |
| (4) | During the year ended December 31, 2009, we recorded a $2.6 million write off of the cumulative translation adjustment (CTA) balances from certain subsidiaries following the substantially complete liquidation of these entities. See Note 2 to our consolidated financial statements for additional discussion of this charge. | |
| (5) | Effective January 1, 2006, we adopted Statement of Financial Accounting Standards No. 123 (Revised 2004), Share-Based Payment (SFAS 123R), which requires stock-based compensation costs to be measured using the grant date fair value and recognized as expense over the related service period. Effective July 1, 2009, this standard was incorporated into FASB ASC Section 718, Compensation — Stock Compensation. We elected the modified prospective method of transition, under which prior periods were not revised for comparative purposes. As a result, 2009, 2008, 2007, and 2006 amounts are not comparable to 2005. | |
| (6) | During the year ended December 31, 2009 and 2008, our capital expenditures included approximately $5.9 million and $16.9 million, respectively, related to the expansion of our Arlington, Tennessee facilities. | |
| (7) | During the year ended December 31, 2008, we recorded a tax provision of $12.8 million to adjust our valuation allowance, primarily to record a valuation allowance against all of our remaining deferred tax assets associated with net operating losses in France. |
31
Table of Contents
| Item 7. | Management’s Discussion and Analysis of Financial Condition and Results of Operations. |
The following management’s discussion and analysis of financial condition and results of operations
(MD&A) describes the principal factors affecting the results of our operations, financial condition
and changes in financial condition, as well as our critical accounting estimates.
Executive Overview
Company Description. We are a global orthopaedic medical device company specializing in the design,
manufacture and marketing of devices and biologic products for extremity, hip, and knee repair and
reconstruction. We are a leading provider of surgical solutions for the foot and ankle market.
Reconstructive devices are used to replace or repair knee, hip and other joints and bones that have
deteriorated or have been damaged through disease or injury. Biologics are used to replace damaged
or diseased bone, to stimulate bone growth and to provide other biological solutions for surgeons
and their patients. Within these markets, we focus on the higher-growth sectors of the orthopaedic
industry, such as foot and ankle and upper extremity markets, as well as on the integration of our
biologic products into reconstructive procedures and other orthopaedic applications. Additionally,
in recent years we have focused significant efforts in increasing our presence in the higher-growth
extremities and biologics markets. Our extensive foot and ankle product portfolio, our over 100
specialized foot and ankle sales representatives, and our increasing level of training of
extremities-focused surgeons has resulted in our company being a recognized leader in the foot and
ankle market. We have been in business for over 50 years and have built a well-known and respected
brand name and strong relationships with orthopaedic surgeons and podiatrists.
Our corporate headquarters and U.S. operations are located in Arlington, Tennessee, where we
conduct research and development, manufacturing, warehousing and administrative activities. Our
domestic sales accounted for 61% of total revenue in 2009. Outside the U.S., we have research,
distribution and administrative facilities in Milan, Italy; distribution and administrative
facilities in Amsterdam, the Netherlands; and sales and distribution offices in Canada, Japan and
throughout Europe. We market our products in approximately 60 countries through a global
distribution system that consists of a sales force of approximately 1,100 individuals who promote
our products to orthopaedic surgeons and hospitals and other healthcare facilities. At the end of
2009, we had approximately 400 sales associates and independent sales distributors in the U.S., and
approximately 700 sales representatives internationally, who were employed through a combination of
our stocking distribution partners and direct sales offices.
Principal Products. We specialize in those products used by extremity focused surgeon specialists
which include products for the reconstruction, trauma and arthroscopy markets, hip and knee
reconstructive joint devices and biologic products. Our biologics sales encompass a broad portfolio
of products designed to stimulate and augment the natural regenerative capabilities of the human
body. We also sell orthopaedic products not considered to be part of our knee, hip, extremity or
biologics product lines.
Our extremities product line includes products for both the foot and ankle and the upper extremity
markets. Our principal foot and ankle portfolio includes the CHARLOTTE™ foot and ankle
system, the DARCO® MFS, DARCO® MRS and DARCO® FRS locked plating
systems, the INBONE™ total ankle system, the SIDEKICK™ external fixation
systems, and the SWANSON line of toe joint replacement products. Our upper extremity portfolio
includes the EVOLVE® radial head prosthesis for elbow fractures, the
MICRONAIL® intramedullary wrist fracture repair system, the RAYHACK®
osteotomy system, and the SWANSON line of finger joint replacement products.
Our biologic products focus on biological musculoskeletal repair and include synthetic and human
tissue-based materials. Our principal biologic products include the GRAFTJACKET® line of soft
tissue repair and containment membranes, the ALLOMATRIX® line of injectable tissue-based
bone graft substitutes, the PRO-DENSE® injectable regenerative graft, the
OSTEOSET® synthetic bone graft substitute, and the CANCELLO-PURE™ wedge
products.
32
Table of Contents
Our knee reconstruction products position us well in the areas of total knee reconstruction,
revision replacement implants and limb preservation products. Our principal knee product is the
ADVANCE® knee system. Additionally, in April 2009 we launched our PROPHECY™
pre-operative navigation guides for knee replacement, which enables surgeons to plan precise
implant placement and alignment before a procedure in order to increase accuracy and decrease
surgery time.
Our hip joint reconstruction product portfolio provides offerings in the areas of bone-conserving
implants, total hip reconstruction, revision replacement implants and limb preservation. Our hip
reconstruction products include the CONSERVE® family of products, the
PROFEMUR® family of hip stems, the DYNASTY™ acetabular cup system, the
ANCA-FIT™ hip system, the PERFECTA® hip system, and the
LINEAGE® acetabular system.
Significant Business Developments. Net sales grew 5% in 2009, totaling $487.5 million, compared to
$465.5 million in 2008. Our extremity product line contributed significantly to our performance in
2009, achieving a 21% growth rate. Additionally, our hip and knee product lines grew by 4% and 2%,
respectively, which were partially offset by a decline of 4% in our biologics product line.
Our domestic extremity business experienced year-over-year growth from 2008 to 2009 totaling 25%,
as a result of the continued success of our CHARLOTTE™ foot and ankle system and our
DARCO® plating systems, as well as product sales from our 2008 acquisitions of the
INBONE™ total ankle system, and the Rayhack® Osteotomy System. We anticipate
that growth within our domestic extremities business will continue to increase, as sales of our
CHARLOTTE™, DARCO®, INBONE™ and Rayhack® products
continue to increase and as we continue to expand our extremity product offerings.
Our international sales increased by 2% during 2009 as compared to 2008. This increase was driven
by growth in our Asian markets and certain European markets, offset by continued declines in
France, lower sales to our stocking distributor in Turkey and a $3.0 million unfavorable currency
impact compared to 2008.
Our net income increased to $12.1 million in 2009, from $3.2 million in 2008, primarily due to the
$11.2 million valuation allowance recorded in 2008 associated with our French net operating losses
(NOLs).
Opportunities and Challenges. Our results of operations can be substantially affected not only by
global economic conditions, but also by local operating and economic conditions, which can vary
substantially by market. Unfavorable conditions can depress sales in a given market and may result
in actions that adversely affect our margins, constrain our operating flexibility, or result in
charges which are unusual or non-recurring. The current state of the global economy has negatively
impacted industry growth rates in both domestic and international markets during 2009, and we are
unable to predict when these markets will return to historical rates of growth.
In our domestic markets, we expect that an expansion of our sales force and product offerings will
favorably impact our extremities and biologics businesses in 2010. However, we continue to expect
that our domestic hip and knee business will continue to be unfavorably impacted by the economic
downturn, and we therefore expect these businesses to grow slightly less than the market growth
rates in the latter part of 2010.
During 2010, we expect a relatively stable pricing environment internationally. Given that,
combined with the anticipated impact of our new Australian subsidiary, as well as the annualization
of the lower levels of revenues from our international stocking distributor in Turkey, we
anticipate moderate levels of sales growth
in our international business. This, however, could be impacted by foreign currency translation due
to strengthening of the U.S. dollar as compared with currencies such as the euro.
Significant Industry Factors. Our industry is impacted by numerous competitive, regulatory and
other significant factors. The growth of our business relies on our ability to continue to develop
new products and
33
Table of Contents
innovative technologies, obtain regulatory clearance and compliance for our
products, protect the proprietary technology of our products and our manufacturing processes,
manufacture our products cost-effectively, respond to competitive pressures specific to each of our
geographic markets, including our ability to enforce non-compete agreements and successfully market
and distribute our products in a profitable manner. We, and the entire industry, are subject to
extensive governmental regulation, primarily by the United States Food and Drug Administration
(FDA). Failure to comply with regulatory requirements could have a material adverse effect on our
business. Additionally, our industry is highly competitive and has recently experienced increased
pricing pressures, specifically in the areas of reconstructive joints. We devote significant
resources to assessing and analyzing competitive, regulatory and economic risks and opportunities.
In December 2007, we received a subpoena from the U.S. Attorney’s Office for the District of New
Jersey requesting certain documents related to consulting agreements with orthopaedic surgeons.
This subpoena was served shortly after several of our knee and hip competitors agreed to
resolutions with the U.S. Department of Justice (DOJ) after being subjects of investigation
involving the same subject matter. We continue to cooperate fully with the investigation by the
DOJ, and we anticipate that we may continue to incur significant expenses related to this inquiry.
In June 2008, we received a letter from the U.S. Securities and Exchange Commission (SEC) informing
us that it is conducting an informal investigation regarding potential violations of the Foreign
Corrupt Practices Act in the sale of medical devices in a number of foreign countries by companies
in the medical device industry. We understand that several other medical device companies have
received similar letters. We are cooperating fully with the SEC inquiry.
A detailed discussion of these and other factors is provided in “Risk Factors.”
34
Table of Contents
Results of Operations
Comparison of the year ended December 31, 2009 to the year ended December 31, 2008
The following table sets forth, for the periods indicated, our results of operations expressed as
dollar amounts (in thousands) and as percentages of net sales:
| Year Ended December 31, | ||||||||||||||||
| 2009 | 2008 | |||||||||||||||
| Amount | % of Sales | Amount | % of Sales | |||||||||||||
Net sales |
$ | 487,508 | 100.0 | % | $ | 465,547 | 100.0 | % | ||||||||
Cost of sales |
148,715 | 30.5 | % | 134,377 | 28.9 | % | ||||||||||
Gross profit |
338,793 | 69.5 | % | 331,170 | 71.1 | % | ||||||||||
Operating expenses: |
||||||||||||||||
Selling, general and administrative |
270,456 | 55.5 | % | 261,396 | 56.1 | % | ||||||||||
Research and development |
35,691 | 7.3 | % | 33,292 | 7.2 | % | ||||||||||
Amortization of intangible assets |
5,151 | 1.1 | % | 4,874 | 1.0 | % | ||||||||||
Restructuring charges |
3,544 | 0.7 | % | 6,705 | 1.4 | % | ||||||||||
Acquired in-process research
and development |
— | 0.0 | % | 2,490 | 0.5 | % | ||||||||||
Total operating expenses |
314,842 | 64.6 | % | 308,757 | 66.3 | % | ||||||||||
Operating income |
23,951 | 4.9 | % | 22,413 | 4.8 | % | ||||||||||
Interest expense, net |
5,466 | 1.1 | % | 2,181 | 0.5 | % | ||||||||||
Other income, net |
2,873 | 0.6 | % | (1,338 | ) | (0.3 | %) | |||||||||
Income before income taxes |
15,612 | 3.2 | % | 21,570 | 4.6 | % | ||||||||||
Provision for income taxes |
3,481 | 0.7 | % | 18,373 | 3.9 | % | ||||||||||
Net income |
$ | 12,131 | 2.5 | % | $ | 3,197 | 0.7 | % | ||||||||
The following table sets forth our net sales by product line for the periods indicated
(in thousands) and the percentage of year-over-year change:
| Year Ended December 31, | ||||||||||||
| 2009 | 2008 | % Change | ||||||||||
Hip products |
$ | 167,869 | $ | 160,788 | 4.4 | % | ||||||
Knee products |
122,178 | 119,895 | 1.9 | % | ||||||||
Extremity products |
107,375 | 88,890 | 20.8 | % | ||||||||
Biologics products |
79,120 | 82,399 | (4.0 | %) | ||||||||
Other |
10,966 | 13,575 | (19.2 | %) | ||||||||
Total net sales |
$ | 487,508 | $ | 465,547 | 4.7 | % | ||||||
35
Table of Contents
The following graphs illustrate our product line sales as a percentage of total net sales for
the years ended December 31, 2009 and 2008:
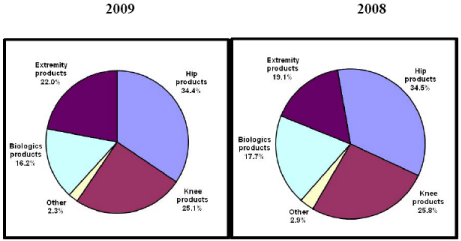
Net sales. Our domestic net sales totaled $299.6 million in 2009 and $282.1 million in 2008,
representing approximately 61% of total net sales in each year and a 6% increase in 2009 over 2008.
Our international net sales totaled $187.9 million in 2009, a 2% increase as compared to net sales
of $183.5 million in 2008. Our 2009 international net sales included an unfavorable foreign
currency impact of approximately $3.0 million when compared to 2008 net sales, principally
resulting from the 2009 performance of the Japanese yen and the euro against the U.S. dollar. The
unfavorable currency impact, continued declines in France, and a reduction in sales to our stocking
distributor in Turkey were offset by an increase in international sales due to continued growth in
our Asian markets, primarily within our hip product lines, as well as certain of our European
markets.
Our net sales growth in 2009 by product line was led by our extremities product line, which
increased 21% over 2008, while our hip and knee businesses increased 4% and 2%, respectively, and
our biologic products declined 4%.
Our extremity product net sales increased to $107.4 million in 2009, representing growth of 21%
over 2008. Our domestic extremity product net sales increased 25%, primarily resulting from the
continued success of our CHARLOTTE™ foot and ankle system and our DARCO®
plating systems, as well as sales related to our INBONE™ and Rayhack®
products, which were acquired in April 2008 and September 2008, respectively. International
extremity sales growth in our European markets and Canada was partially offset by an unfavorable
currency impact of $830,000 compared to 2008.
Our hip product net sales totaled $167.9 million in 2009, representing a 4% increase over 2008.
This increase was driven by increased sales of our PROFEMUR® hip system, as well as
higher levels of sales of our DYNASTY® acetabular cup system, which was launched during
the second quarter of 2008. Domestic hip sales were relatively flat in 2009 compared to 2008 with
growth of 1% year-over-year. Our international hip business increased in 2009 by 7% over 2008
primarily due to growth in our Asian markets. International hip sales included a $160,000 favorable
currency impact compared to 2008.
Net sales of our knee products totaled $122.2 million in 2009, representing growth of 2% over 2008.
Year-over-year growth in our ADVANCE® knee systems, primarily in our international
markets, totaled 5%, which was partially offset by declines across our other, more mature knee
product offerings. Additionally, our international knee sales include an unfavorable currency
impact of $680,000 compared to 2008.
36
Table of Contents
Net sales of our biologic products totaled $79.1 million in 2009, which represents a 4% decrease as
compared to 2008. Our domestic net sales of biologics decreased 2% from 2008, resulting from lower
levels of sales of our ALLOMATRIX® product line, partially offset by increased sales of
our PRO-DENSE® injectable regenerative graft and our GRAFTJACKET® tissue
repair products. Our international net sales of biologics decreased 15% over prior year, primarily
the result of the suspension of biologics distribution in Belgium and Turkey due to changes in
reimbursement rates and a $650,000 unfavorable currency impact.
Cost of sales. Our cost of sales as a percentage of net sales increased from 28.9% in 2008 to 30.5%
in 2009. This increase is primarily attributable to higher levels of excess and obsolete inventory
provisions, increased raw material and other manufacturing costs, and unfavorable currency exchange
rates. Our cost of sales and corresponding gross profit percentages can be expected to fluctuate in
future periods depending upon changes in our product sales mix and prices, distribution channels
and geographies, manufacturing yields, period expenses, levels of production volume and currency
exchange rates.
Selling, general and administrative. Our selling, general and administrative expenses as a
percentage of net sales totaled 55.5% and 56.1% in 2009 and 2008, respectively. Selling, general
and administrative expense for 2009 included $10.1 million of non-cash, stock-based compensation
expense (2.1% of net sales), $7.8 million of costs, primarily legal fees, associated with U.S.
government inquiries (1.6% of net sales), and a $5.6 million provision for potential losses
associated with a trade receivable (1.1% of net sales). During 2008, selling, general and
administrative expense included $10.6 million of non-cash, stock-based compensation expense (2.3%
of net sales), $7.6 million of costs, primarily legal fees, associated with U.S. government
inquiries (1.6% of net sales), and $2.3 million of expense due to an unfavorable appellate court
decision (0.5% of net sales). The remaining expenses declined by 1.0 point as a percentage of net
sales as a result of cost savings initiatives, primarily in our European subsidiaries, and lower
levels of cash incentive compensation, partially offset by increased expenses associated with
global compliance efforts.
We anticipate that our selling, general and administrative expenses will increase in absolute
dollars to the extent that additional growth in net sales results in increases in sales commissions
and royalty expense associated with those sales and requires us to expand our infrastructure.
Further, in the near term, we anticipate that these expenses may increase as a percentage of net
sales as we make strategic investments to grow our business, as we continue to incur expenses
associated with the U.S. government inquiries, which we believe may continue to be significant, and
as our spending related to the global compliance requirements of our industry increases.
Research and development. Our investment in research and development activities represented 7.3%
and 7.2% of net sales in 2009 and 2008, respectively. Our research and development expense included
non-cash, stock-based compensation expense of $1.8 million (0.4% of net sales) in 2009, compared to
$1.6 million (0.3% of net sales) in 2008. The remaining expenses were relatively flat as a
percentage of net sales as increased spending on product development grew at the same rates as
sales.
We anticipate that our research and development expenditures may increase as a percentage of net
sales and will increase in absolute dollars as we continue to increase our investment in product
development initiatives and clinical studies to support regulatory approvals and provide expanded
proof of the efficacy of our products.
Amortization of intangible assets. Charges associated with amortization of intangible assets
totaled $5.2 million in 2009, as compared to $4.9 million in 2008. The increase is attributable to
a full year of amortization during 2009 for intangible assets associated with our 2008
acquisitions. Based on the intangible assets held at December 31, 2009, we expect to amortize
approximately $2.5 million in 2010, $2.3 million in 2011, $2.2 million in 2012, $1.9 million in
2013, and $1.7 million in 2014.
37
Table of Contents
Acquired in-process research and development (IPRD). During 2008, upon our acquisition of Inbone
Technologies, Inc., we immediately recognized as expense $2.5 million in costs representing the
estimated fair value of acquired IPRD that had not yet reached technological feasibility and had no
alternative future use.
The fair value was determined by estimating the costs to develop the acquired IPRD into
commercially viable products, estimating the resulting net cash flows from this project and
discounting the net cash flows back to their present values. The resulting net cash flows from the
project were based on our management’s best estimates of revenue, cost of sales, research and
development costs, selling, general and administrative costs and income taxes from the project. A
summary of the estimates used to calculate the net cash flows for the project is as follows:
| Year net cash | Discount rate including | Acquired | ||||||||||
| in-flows expected to | factor to account for | IPRD (in | ||||||||||
| Project | begin | uncertainty of success | thousands) | |||||||||
INBONE™ Calcaneal Stem Implant |
2009 | 18 | % | $ | 2,490 | |||||||
The INBONE™ Calcaneal Stem implant (Calcaneal Stem) is an implant device designed
to attach on the INBONE™ talar dome and achieve bone implant stability by engaging the
inside of the talar bone spanning into the calcaneal bone after the two bones have been stabilized
together. We expect this device to bring increased sales to the existing INBONE™ total
ankle system. The product is complete, but it has not yet received all the necessary FDA clearances
to bring the product into a commercially viable product. Prior to our acquisition, Inbone filed a
510(k) premarket notification for the Calcaneal Stem and had received
questions from the FDA. Subsequent to the acquisition, we received additional questions from the
FDA. Due to the complexity of these additional questions and the FDA’s requirement for clinical
data in support of the safety and efficacy of the Calcaneal Stem, we are currently working on the
development of an investigational device exemption protocol that will subsequently support a
premarket approval (PMA) filing for market approval. This protocol will require two year follow-ups
of the enrolled patients; therefore market approval is not expected prior to the end of 2012. We do
not believe that this additional work will result in a material amount of expenses.
We are continuously monitoring our research and development projects. We believe that the
assumptions used in the valuation of acquired IPRD represent a reasonably reliable estimate of the
future benefits attributable to the acquired IPRD. No assurance can be given that actual results
will not deviate from those assumptions in future periods.
Interest expense (income), net. Interest expense (income), net, consists of interest expense of
$6.5 million and $7.0 million in 2009 and 2008, respectively, primarily from our $200 million of
convertible senior notes due 2014 issued in November 2007, our capital lease agreements, and
certain of our factoring agreements. This was partially offset by interest income of $1.0 million
and $4.8 million during 2009 and 2008, respectively, generated by our invested cash balances and
investments in marketable securities. The decline in interest income is due to the overall decline
in interest rates on our invested cash balances and investments in marketable securities during
2009.
The amounts of interest income we realize in 2010 and beyond are subject to variability, dependent
upon both the rate of invested returns we realize and the amount of excess cash balances on hand.
Other expense (income), net. Other expense (income), net, totaled $2.9 million of expense during
2009 compared to $1.3 million of income during 2008. During 2009, we recognized $2.6 million of
expense related to the write-off of the CTA balances for certain subsidiaries that have been
substantially liquidated. During 2008, we recognized $900,000 of deferred gain associated with the
2007 disposition of our ADCON®-Gel assets.
38
Table of Contents
Provision for income taxes. We recorded tax provisions of $3.5 million and $18.4 million in 2009
and 2008, respectively. Our effective tax rate for 2009 and 2008 was 22.3% and 85.2% respectively.
In 2009, we reduced our valuation allowance as a result of a change in estimate regarding the
jurisdiction where certain deductions would be recognized for tax purposes, which decreased our
effective tax rate by 6 percentage points. In 2008, we recognized a tax provision of $12.8 million
to adjust our valuation allowance, primarily to record a valuation allowance against all of our
remaining deferred tax assets associated with net operating losses in France, which increased our
effective tax rate by 59 percentage points.
Comparison of the year ended December 31, 2008 to the year ended December 31, 2007
The following table sets forth, for the periods indicated, our results of operations expressed as
dollar amounts (in thousands) and as percentages of net sales:
| Year Ended December 31, | ||||||||||||||||
| 2008 | 2007 | |||||||||||||||
| Amount | % of Sales | Amount | % of Sales | |||||||||||||
Net sales |
$ | 465,547 | 100.0 | % | $ | 386,850 | 100.0 | % | ||||||||
Cost of sales |
134,377 | 28.9 | % | 108,407 | 28.0 | % | ||||||||||
Cost of sales — Restructuring |
— | 0.0 | % | 2,139 | 0.6 | % | ||||||||||
Gross profit |
331,170 | 71.1 | % | 276,304 | 71.4 | % | ||||||||||
Operating expenses: |
||||||||||||||||
Selling, general and administrative |
261,396 | 56.1 | % | 225,929 | 58.4 | % | ||||||||||
Research and development |
33,292 | 7.2 | % | 28,405 | 7.3 | % | ||||||||||
Amortization of intangible assets |
4,874 | 1.0 | % | 3,782 | 1.0 | % | ||||||||||
Restructuring charges |
6,705 | 1.4 | % | 16,734 | 4.3 | % | ||||||||||
Acquired in-process research
and development |
2,490 | 0.5 | % | — | 0.0 | % | ||||||||||
Total operating expenses |
308,757 | 66.3 | % | 274,850 | 71.0 | % | ||||||||||
Operating income |
22,413 | 4.8 | % | 1,454 | 0.4 | % | ||||||||||
Interest expense (income), net |
2,181 | 0.5 | % | (1,252 | ) | (0.3 | %) | |||||||||
Other (income) expense, net |
(1,338 | ) | (0.3 | %) | 375 | 0.1 | % | |||||||||
Income before income taxes |
21,570 | 4.6 | % | 2,331 | 0.6 | % | ||||||||||
Provision for income taxes |
18,373 | 3.9 | % | 1,370 | 0.4 | % | ||||||||||
Net income |
$ | 3,197 | 0.7 | % | $ | 961 | 0.2 | % | ||||||||
The following table sets forth our net sales by product line for the periods indicated
(in thousands) and the percentage of year-over-year change:
| Year Ended December 31, | ||||||||||||
| 2008 | 2007 | % Change | ||||||||||
Hip products |
$ | 160,788 | $ | 134,251 | 19.8 | % | ||||||
Knee products |
119,895 | 102,334 | 17.2 | % | ||||||||
Extremity products |
88,890 | 62,302 | 42.7 | % | ||||||||
Biologics products |
82,399 | 76,029 | 8.4 | % | ||||||||
Other |
13,575 | 11,934 | 13.8 | % | ||||||||
Total net sales |
$ | 465,547 | $ | 386,850 | 20.3 | % | ||||||
39
Table of Contents
The following graphs illustrate our product line sales as a percentage of total net sales for
the years ended December 31, 2008 and 2007:
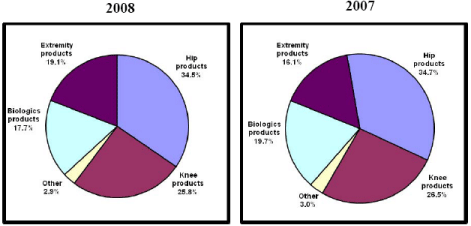
Net sales. Our domestic net sales totaled $282.1 million in 2008 and $235.7 million in 2007,
representing approximately 61% of total net sales in each year and a 20% increase over 2007. Our
international net sales totaled $183.5 million in 2008, a 21% increase as compared to net sales of
$151.1 million in 2007. Our 2008 international net sales included a favorable foreign currency
impact of approximately $7.9 million when compared to 2007 net sales, principally resulting from
the 2008 performance of the Japanese yen and the euro against the U.S. dollar. The remaining
increase in international sales is attributable to growth in our Asian and European markets,
primarily within our hip and knee product lines.
From a product line perspective, our net sales growth for 2008 was attributable to increases in
sales across all four of our principal product lines. For 2008, we experienced growth of 43%, 20%,
17%, and 8% in our extremity, hip, knee, and biologics, respectively. During 2008, our extremity
sales growth was attributable primarily to the continued success of our CHARLOTTE™ foot
and ankle system and increased sales of our DARCO® plating systems, as well as sales of
our INBONE™ products acquired during the second quarter of 2008. The increase in our hip
product sales was driven by increased sales of our PROFEMUR® hip system, our
CONSERVE® family of products, our DYNASTY® acetabular cup system and sales of
revision hip stems introduced during the second quarter 2008. Sales of our knee products increased
in 2008 compared to the prior year as a result of growth in our ADVANCE® knee systems,
which was partially offset by declines across our other, more mature knee product offerings. The
growth of our biologics business in 2008 was primarily attributable to increased sales of our
PRO-DENSE® injectable regenerative graft, our GRAFTJACKET® tissue repair and
containment membranes and our CANCELLOPURE™ wedge products.
Cost of sales. In 2008, our cost of sales as a percentage of net sales increased from 28.0% in 2007
to 28.9% in 2008. This increase was primarily attributable to unfavorable shifts in our geographic
and product line sales mix and increased raw material and other manufacturing costs, which were
partially offset by lower levels of non-cash stock-based compensation expense. Our cost of sales
included 0.3 percentage points and 0.5 percentage points of non-cash, stock-based compensation
expense in 2008 and 2007, respectively.
Cost of sales — restructuring. In 2007, we recorded $2.1 million, 0.6% of net sales, of charges
associated with
the closure of our manufacturing facility in Toulon, France for inventory write-offs and
manufacturing costs incurred during a period of abnormal production capacity which were expensed as
period costs in accordance with Financial Accounting Standards Board (FASB) Accounting Standards
Codification (ASC) Section 330, Inventory.
40
Table of Contents
Operating expenses. Our total operating expenses decreased, as a percentage of net sales, by 4.7
percentage points to 66.3% in 2008. Operating expenses include selling, general and administrative
expenses, research and development expenses, amortization of intangibles and restructuring charges.
The decrease in operating expenses was attributed primarily to decreased restructuring expenses, as
well as lower levels of expenses due to our restructuring efforts in Toulon, France, lower levels
of professional fees, decreased stock-based compensation, and the leveraging of fixed
administrative fees, all of which were partially offset by costs associated with the U.S.
government inquiries and the 2008 charge for in-process research and development.
Provision for income taxes. Our effective tax rate for 2008 and 2007 was 85.2% and 58.8%,
respectively. Our 2008 effective tax rate includes a tax provision of $12.8 million to adjust our
valuation allowance, primarily to record a valuation allowance against all of our remaining
deferred tax assets associated with net operating losses in France, which increased our effective
tax rate by 59 percentage points.
Seasonal Nature of Business
We traditionally experience lower sales volumes in the third quarter than throughout the rest of
the year as many of our products are used in elective procedures, which generally decline during
the summer months, typically resulting in selling, general and administrative expenses and research
and development expenses as a percentage of sales that are higher during this period than
throughout the rest of the year. In addition, our first quarter selling, general and administrative
expenses include additional expenses that we incur in connection with the annual meeting held by
the American Academy of Orthopaedic Surgeons. This meeting, which is the largest orthopaedic
meeting in the world, features the presentation of scientific papers and instructional courses for
orthopaedic surgeons. During this three-day event, we display our most recent and innovative
products to these surgeons.
Restructuring
Toulon, France
In 2007, we announced our plans to close our facilities in Toulon, France. This announcement came
after a thorough evaluation in which we determined that we had excess manufacturing capacity and
redundant distribution and administrative resources that would be best eliminated through the
closure of this facility. The majority of our restructuring activities were complete by the end of
2007, with production now conducted solely in our existing manufacturing facility in Arlington,
Tennessee and the distribution activities being carried out from our European headquarters in
Amsterdam, the Netherlands. We have estimated that total pre-tax restructuring charges will be
approximately $28 million to $30 million, of which we have recognized $27.0 million through
December 31, 2009. We anticipate that recording the remaining $1 million to $3 million of
restructuring expenses could have a material impact on our results of operations in the period
incurred, however we do not expect that the restructuring will have a material impact on our
financial condition or liquidity. We began realizing the benefits from this restructuring within
selling, general and administrative expenses in 2008. While we began realizing the benefits from
this restructuring within cost of sales in 2009, unfavorable currency exchange rates and increased
raw material and other manufacturing costs have offset some of those benefits. See Note 14 to our
consolidated financial statements in “Financial Statements and Supplementary Data” for further
discussion of our restructuring charges.
Creteil, France
In October 2009, we announced plans to close our distribution and finance support office in
Creteil, France, to migrate all relevant French distribution and support functions into our
European organization based out of our European headquarters in Amsterdam, the Netherlands. Direct
sales in France will continue and will be serviced by independent sales agents. We have estimated
that total pre-tax restructuring charges will be approximately $3 million to $4 million, of which
we have recognized $2.1 million through December 31, 2009. We anticipate that recording the
remaining restructuring expenses may have a material impact on our
41
Table of Contents
results of operations in the
period incurred; however we do not expect that this restructuring will have a material impact on
our financial condition or liquidity. We will realize the benefits from this restructuring within
selling, general and administrative expenses beginning in 2010. See Note 14 to our consolidated
financial statements in “Financial Statements and Supplementary Data” for further discussion of our
restructuring charges.
Liquidity and Capital Resources
The following table sets forth, for the periods indicated, certain liquidity measures (in
thousands):
| As of December 31, | ||||||||
| 2009 | 2008 | |||||||
Cash and cash equivalents |
$ | 84,409 | $ | 87,865 | ||||
Marketable securities |
86,819 | 57,614 | ||||||
Working capital |
421,647 | 401,406 | ||||||
Line of credit availability |
100,000 | 100,000 | ||||||
During the first quarter of 2008, we liquidated our investments in auction rate securities into
cash equivalents. For the remainder of 2008 and throughout 2009, we invested in treasury bills,
government bonds, agency bonds and certificates of deposit with maturities of less than 12 months.
We have classified these marketable securities as available-for-sale.
Operating Activities. Cash provided by operating activities totaled $71.8 million in 2009, as
compared to cash used by operating activities of $3.6 million in 2008 and cash provided by
operating activities of $24.4 million in 2007. The increase in cash provided by operating
activities in 2009 is primarily attributable to changes in working capital, as inventory balances
decreased significantly due to a focus on inventory management during 2009, and accounts receivable
decreased as the result of diligent collection efforts, which were partially offset by the 2008
liquidation of our investments in auction rate securities that were classified as trading
securities.
In 2008 compared to 2007, increased profitability was offset by changes in working capital.
Accounts receivable increased due to higher levels of sales in international markets that typically
have longer collection terms. Inventories increased due to recent acquisitions and distribution
agreements, and to support higher levels of sales. Finally, in 2007, our accrued expenses increased
significantly, primarily associated with restructuring charges.
Investing Activities. Our capital expenditures totaled $37.2 million in 2009, $61.9 million in 2008
and $35.0 million in 2007. The decrease in 2009 compared to 2008 is attributable to lower levels of
expenditures related to the expansion of our Arlington, Tennessee facilities ($5.9 million in 2009
and $16.9 million in 2008) as well as lower levels of investments in surgical instrumentation
related to acquired and new products. Our
industry is capital intensive, particularly as it relates to surgical instrumentation.
Historically, our capital expenditures have consisted principally of purchased manufacturing
equipment, research and testing equipment, computer systems, office furniture and equipment and
surgical instruments. We expect to incur capital expenditures of approximately $40 million in 2010
for routine capital expenditures, as well as approximately $7 million for the continued expansion
of facilities in Arlington, Tennessee.
Financing Activities. During 2009, proceeds of $680,000 were generated from the issuance of common
stock upon exercise of stock options granted under our stock-based compensation plans and purchases
under the employee stock purchase plan. These proceeds were offset by $153,000 in principal
payments related to our long-term capital lease obligations.
In early 2009, we terminated certain accounts receivable factoring agreements. While these
factoring agreements were active, the cash proceeds, net of the amount of factored receivables
collected, were reflected
42
Table of Contents
as cash flows from financing activities in our consolidated statements of cash flows. The
proceeds received under these agreements during 2008 and 2007 were $6.6 million and $3.6 million,
respectively. These proceeds were offset by payments for factored receivables collected of $7.0
million and $7.1 million in 2008 and 2007, respectively. We recorded obligations of $54,000 for the
amount of receivables factored under these agreements as of December 31, 2008, which are included
within “Accrued expenses and other current liabilities” in our consolidated balance sheet.
In 2010, we will make continued payments under our long-term capital leases, including interest, of
$352,000 and we will make scheduled interest payments under our convertible senior notes of $5.3
million.
On December 31, 2009, our revolving credit facility had availability of $100 million, which can be
increased by up to an additional $50 million at our request and subject to the agreement of the
lenders. We currently have no borrowings outstanding under the credit facility. Borrowings under
the credit facility will bear interest at the sum of an annual base rate plus an applicable annual
rate that ranges from 0% to 1.75% depending on the type of loan and our consolidated leverage
ratio, with a current annual base rate of 3.25%. The term of the credit facility extends through
June 30, 2011.
During 2007, we issued $200 million of Convertible Senior Notes due 2014, which generated net
proceeds of $193.5 million. The notes require us to pay interest semiannually at an annual rate of
2.625%. The notes are convertible into shares of our common stock at an initial conversion rate of
30.6279 shares per $1,000 principal amount of the notes, which represents a conversion price of
$32.65 per share. We will make scheduled interest payments in 2010 related to the notes totaling
$5.3 million.
Contractual Cash Obligations. At December 31, 2009, we had contractual cash obligations and
commercial commitments as follows (in thousands):
| Payments Due by Periods | ||||||||||||||||||||
| Total | 2010 | 2011-2012 | 2013-2014 | After 2014 | ||||||||||||||||
Amounts reflected in consolidated balance sheet: |
||||||||||||||||||||
Capital lease obligations(1) |
$ | 702 | $ | 352 | $ | 322 | $ | 28 | $ | — | ||||||||||
Convertible senior notes(2) |
200,000 | — | — | 200,000 | — | |||||||||||||||
Contingent consideration |
1,675 | 1,675 | — | — | — | |||||||||||||||
Amounts not reflected in consolidated balance sheet: |
||||||||||||||||||||
Operating leases |
17,792 | 9,286 | 7,887 | 508 | 111 | |||||||||||||||
Interest on convertible senior notes(3) |
25,813 | 5,250 | 10,500 | 10,063 | — | |||||||||||||||
Purchase obligations |
5,086 | 2,543 | 2,543 | — | — | |||||||||||||||
Royalty and consulting agreements |
1,370 | 242 | 484 | 374 | 270 | |||||||||||||||
Total contractual cash obligations |
$ | 252,438 | $ | 19,348 | $ | 21,736 | $ | 210,973 | $ | 381 | ||||||||||
| (1) | Payments include amounts representing interest. | |
| (2) | Represents long-term debt payment provided holders of the Convertible Senior Notes due 2014 do not exercise the option to convert each $1,000 note into 30.6279 shares of our common stock. Our convertible senior notes are discussed further in Note 7 to our consolidated financial statements contained in “Financial Statements and Supplementary Data.” | |
| (3) | Represents interest on Convertible Senior Notes due 2014 payable semiannually with an annual interest rate of 2.625%. |
The amounts reflected in the table above for capital lease obligations represent future minimum
lease payments under our capital lease agreements, which are primarily for certain property and
equipment. The present value of the minimum lease payments are recorded in our balance sheet at
December 31, 2009. The
43
Table of Contents
minimum lease payments related to these leases are discussed further in Note
7 to our consolidated financial statements contained in “Financial Statements and Supplementary
Data.”
The amounts reflected in the table above for operating leases represent future minimum lease
payments under non-cancelable operating leases primarily for certain equipment and office space.
Portions of these payments are denominated in foreign currencies and were translated in the table
above based on their respective U.S. dollar exchange rates at December 31, 2009. These future
payments are subject to foreign currency exchange rate risk. In accordance with U.S. generally
accepted accounting principles, our operating leases are not recognized in our consolidated balance
sheet; however, the minimum lease payments related to these agreements are disclosed in Note 15 to
our consolidated financial statements contained in “Financial Statements and Supplementary Data.”
Our purchase obligations reflected in the table above consist of minimum purchase obligations
related to certain supply agreements. The royalty and consulting agreements in the above table
represent minimum payments under non-cancelable contracts with consultants that are contingent upon
future services. Portions of these payments are denominated in foreign currencies and were
translated in the table above based on their respective U.S. dollar exchange rates at December 31,
2009. These future payments are subject to foreign currency exchange rate risk. Our purchase
obligations and royalty and consulting agreements are disclosed in Note 15 to our consolidated
financial statements contained in “Financial Statements and Supplementary Data.”
Our contingent consideration obligations reflected in the table above consist of minimum guaranteed
payments related to our acquisition of Inbone Technologies, Inc. Additionally, cash payments of up
to $12 million may be made related to this and certain other of our acquisitions based upon future
financial and operational performance of the acquired assets.
In addition to the contractual cash obligations discussed above, all of our domestic sales and a
portion of our international sales are subject to commissions based on net sales. A substantial
portion of our global sales are subject to royalties earned based on product sales.
Additionally, as of December 31, 2009, we had $2.8 million of unrecognized tax benefits recorded
within “Other liabilities” in our consolidated balance sheet. This represents the tax benefits
associated with various tax positions taken, or expected to be taken, on domestic and international
tax returns that have not been recognized in our financial statements due to uncertainty regarding
their resolution. We are unable to make a reliable estimate of the eventual cash flows by period
that may be required to settle these matters. Certain of these matters may not require cash
settlement due to the existence of net operating loss carryforwards. Therefore, our unrecognized
tax benefits are not included in the table above. See Note 9 to our consolidated financial
statements contained in “Financial Statements and Supplementary Data.”
Other Liquidity Information. We have funded our cash needs since 2000 through various equity and
debt issuances and through cash flow from operations. In 2001, we completed our initial public
offering of 7,500,000 shares of common stock, which generated $84.8 million in net proceeds. In
2002, we completed a secondary offering of 3,450,000 shares of common stock, which generated $49.5
million in net proceeds. In 2007, we issued $200 million of Convertible Senior Notes due 2014,
which generated net proceeds totaling $193.5 million.
Although it is difficult for us to predict our future liquidity requirements, we believe that our
current cash balance of approximately $84.4 million, our marketable securities balance of $86.8
million and our existing available credit line of $100 million will be sufficient for the
foreseeable future to fund our working capital requirements and operations, permit anticipated
capital expenditures in 2010 of approximately $47 million and meet our contractual cash obligations
in 2010.
44
Table of Contents
Critical Accounting Estimates
All of our significant accounting policies and estimates are described in Note 2 to our
consolidated financial statements contained in “Financial Statements and Supplementary Data.”
Certain of our more critical accounting estimates require the application of significant judgment
by management in selecting the appropriate assumptions in determining the estimate. By their
nature, these judgments are subject to an inherent degree of uncertainty. We develop these
judgments based on our historical experience, terms of existing contracts, our observance of trends
in the industry, information provided by our customers and information available from other outside
sources, as appropriate. Different, reasonable estimates could have been used in the current
period. Additionally, changes in accounting estimates are reasonably likely to occur from period to
period. Both of these factors could have a material impact on the presentation of our financial
condition, changes in financial condition or results of operations.
We believe that the following financial estimates are both important to the portrayal of our
financial condition and results of operations and require subjective or complex judgments. Further,
we believe that the items discussed below are properly recorded in the financial statements for all
periods presented. Our management has discussed the development, selection and disclosure of our
most critical financial estimates with the audit committee of our board of directors and with our
independent auditors. The judgments about those financial estimates are based on information
available as of the date of the financial statements. Those financial estimates include:
Revenue recognition. Our revenues are primarily generated through two types of customers, hospitals
and surgery centers, and stocking distributors, with the majority of our revenue derived from sales
to hospitals. Our products are sold through a network of employee and independent sales
representatives in the U.S. and by a combination of employee sales representatives, independent
sales representatives and stocking distributors outside the U.S. We record revenues from sales to
hospitals and surgery centers when they take title to the product, which is generally when the
product is surgically implanted in a patient.
We record revenues from sales to our stocking distributors at the time the product is shipped to
the distributor. Our stocking distributors, who sell the products to their customers, take title to
the products and assume all risks of ownership. Our distributors are obligated to pay us within
specified terms regardless of when, if ever, they sell the products. In general, our distributors
do not have any rights of return or exchange; however, in limited situations we have repurchase
agreements with certain stocking distributors. Those certain agreements require us to repurchase a
specified percentage of the inventory purchased by the distributor within a specified period of
time prior to the expiration of the contract. During those specified periods, we defer the
applicable percentage of the sales. Approximately $186,000 and $172,000 of sales related to these
types of agreements were deferred and not yet recognized as revenue as of December 31, 2009 and
2008, respectively.
We must make estimates of potential future product returns related to current period product
revenue. To do so, we analyze our historical experience related to product returns when evaluating
the adequacy of the allowance for sales returns. Judgment must be used and estimates made in
connection with establishing the allowance for product returns in any accounting period. Our
allowances for product returns of approximately
$552,000 and $490,000 are included as a reduction of accounts receivable at December 31, 2009 and
2008, respectively. Should actual future returns vary significantly from our historical averages,
our operating results could be affected.
Allowances for doubtful accounts. We experience credit losses on our accounts receivable and
accordingly, we must make estimates related to the ultimate collection of our accounts receivable.
Specifically, we analyze our accounts receivable, historical bad debt experience, customer
concentrations, customer creditworthiness and current economic trends when evaluating the adequacy
of our allowance for doubtful accounts.
The majority of our accounts receivable are from hospitals, many of which are government funded.
Accordingly, our collection history with this class of customer has been favorable. Historically,
we have
45
Table of Contents
experienced minimal bad debts from our hospital customers and more significant bad debts
from certain international stocking distributors, typically as a result of specific financial
difficulty or geo-political factors. We write off accounts receivable when we determine that the
accounts receivable are uncollectible, typically upon customer bankruptcy or the customer’s
non-response to continued collection efforts.
We believe that the amount included in our allowance for doubtful accounts has been a historically
appropriate estimate of the amount of accounts receivable that are ultimately not collected. While
we believe that our allowance for doubtful accounts is adequate, the financial condition of our
customers and the geo-political factors that impact reimbursement under individual countries’
healthcare systems can change rapidly, which would necessitate additional allowances in future
periods. Our allowances for doubtful accounts were $8.6 million and $4.0 million, at December 31,
2009 and 2008, respectively, which includes a $5.6 million provision recorded in 2009 for potential
losses related to the trade receivable balance of our stocking distributor in Turkey.
Excess and obsolete inventories. We value our inventory at the lower of the actual cost to purchase
and/or manufacture the inventory on a first-in, first-out (FIFO) basis or its net realizable value.
We regularly review inventory quantities on hand for excess and obsolete inventory and, when
circumstances indicate, we incur charges to write down inventories to their net realizable value.
Our review of inventory for excess and obsolete quantities is based primarily on our forecast of
product demand and production requirements for the next 24 months. A significant decrease in demand
could result in an increase in the amount of excess inventory quantities on hand. Additionally, our
industry is characterized by regular new product development that could result in an increase in
the amount of obsolete inventory quantities on hand due to cannibalization of existing products.
Also, our estimates of future product demand may prove to be inaccurate in which case we may be
required to incur charges for excess and obsolete inventory. In the future, if additional inventory
write-downs are required, we would recognize additional cost of goods sold at the time of such
determination. Regardless of changes in our estimates of future product demand, we do not increase
the value of our inventory above its adjusted cost basis. Therefore, although we make every effort
to ensure the accuracy of our forecasts of future product demand, significant unanticipated
decreases in demand or technological developments could have a significant impact on the value of
our inventory and our reported operating results.
Charges incurred for excess and obsolete inventory were $12.5 million, $8.7 million and $6.6
million for the years ended December 31, 2009, 2008 and 2007, respectively. Additionally, in 2007,
we recorded charges of $2.1 million associated with the closure of our manufacturing facility in
Toulon, France, for inventory write-offs and manufacturing costs incurred during a period of
abnormal production capacity.
Goodwill and long-lived assets. We have approximately $53.9 million of goodwill recorded as a
result of the acquisition of businesses. Goodwill is tested for impairment annually, or more
frequently if changes in circumstances or the occurrence of events suggest that impairment exists.
Based on our single business
approach to decision-making, planning and resource allocation, we have determined that we have only
one reporting unit for purposes of evaluating goodwill for impairment. The annual evaluation of
goodwill impairment may require the use of estimates and assumptions to determine the fair value of
our reporting unit using projections of future cash flows. We performed our annual impairment test
during the fourth quarter of 2009 and determined that the fair value of our reporting unit exceeded
its carrying value and, therefore, no impairment charge was necessary.
Our business is capital intensive, particularly as it relates to surgical instrumentation. We
depreciate our property, plant and equipment and amortize our intangible assets based upon our
estimate of the respective asset’s useful life. Our estimate of the useful life of an asset
requires us to make judgments about future events, such as product life cycles, new product
development, product cannibalization and technological obsolescence, as well as other competitive
factors beyond our control. We account for the impairment of long-lived assets in accordance with
the FASB ASC Section 360, Property, Plant and Equipment (FASB ASC 360). Accordingly, we
evaluate impairments of our property, plant and equipment based upon an analysis of estimated
undiscounted future cash flows. If we determine that a change is required in the useful life of an
46
Table of Contents
asset, future depreciation and amortization is adjusted accordingly. Alternatively, if we determine
that an asset has been impaired, an adjustment would be charged to income based on the asset’s fair
market value, or discounted cash flows if the fair market value is not readily determinable,
reducing income in that period.
Product liability claims and other litigation. Periodically, claims arise involving the use of our
products. We make provisions for claims specifically identified for which we believe the likelihood
of an unfavorable outcome is probable and an estimate of the amount of loss has been developed. We
have recorded at least the minimum estimated liability related to those claims where a range of
loss has been established. As additional information becomes available, we reassess the estimated
liability related to our pending claims and make revisions as necessary. Future revisions in our
estimates of the liability could materially impact our results of operation and financial position.
We maintain insurance coverage that limits the severity of any single claim as well as total
amounts incurred per policy year, and we believe our insurance coverage is adequate. We use the
best information available to us in determining the level of accrued product liabilities, and we
believe our accruals are adequate. Our accrual for product liability claims was approximately $1.1
million and $310,000 at December 31, 2009 and 2008, respectively.
We are also involved in legal proceedings involving contract, patent protection and other matters.
We make provisions for claims specifically identified for which we believe the likelihood of an
unfavorable outcome is probable and an estimate of the amount of loss can be developed.
Accounting for income taxes. Our effective tax rate is based on income by tax jurisdiction,
statutory rates and tax saving initiatives available to us in the various jurisdictions in which we
operate. Significant judgment is required in determining our effective tax rate and evaluating our
tax positions. This process includes assessing temporary differences resulting from differing
recognition of items for income tax and accounting purposes. These differences result in deferred
tax assets and liabilities, which are included within our consolidated balance sheet. Realization
of deferred tax assets in each taxable jurisdiction is dependent on our ability to generate future
taxable income sufficient to realize the benefits. Management evaluates deferred tax assets on an
ongoing basis and provides valuation allowances to reduce net deferred tax assets to the amount
that is more likely than not to be realized.
Our valuation allowance balances totaled $17.2 million and $18.5 million as of December 31, 2009
and 2008, respectively, due to uncertainties related to our ability to realize, before expiration,
some of our deferred tax assets for both U.S. and foreign income tax purposes. These deferred tax
assets primarily consist of the
carryforward of certain tax basis net operating losses and general business tax credits. During the
year ended December 31, 2008, we recognized a tax provision of $12.8 million to adjust our
valuation allowance, primarily to record a valuation allowance against all of our remaining
deferred tax assets associated with net operating losses in France.
In July 2006, the FASB issued FASB Interpretation No. 48, Accounting for Uncertainty in Income
Taxes (FIN 48), effective January 1, 2007, which requires the tax effects of an income tax position
to be recognized only if they are “more-likely-than-not” to be sustained based solely on the
technical merits as of the reporting date. Effective July 1, 2009, this standard was incorporated
into FASB ASC Section 740, Income Taxes. As a multinational corporation, we are subject to taxation
in many jurisdictions and the calculation of our tax liabilities involves dealing with
uncertainties in the application of complex tax laws and regulations in various taxing
jurisdictions. If we ultimately determine that the payment of these liabilities will be
unnecessary, we will reverse the liability and recognize a tax benefit in the period in which we
determine the liability no longer applies. Conversely, we record additional tax charges in a period
in which we determine that a recorded tax liability is less than we expect the ultimate assessment
to be. Our liability for unrecognized tax benefits totaled $2.8 million and $1.8 million as of
December 31, 2009 and 2008, respectively. See Note 9 to our consolidated financial statements
contained in “Financial Statements and Supplementary Data” for further discussion of our
unrecognized tax benefits.
47
Table of Contents
We operate within numerous taxing jurisdictions. We are subject to regulatory review or audit in
virtually all of those jurisdictions, and those reviews and audits may require extended periods of
time to resolve. Management makes use of all available information and makes reasoned judgments
regarding matters requiring interpretation in establishing tax expense, liabilities and reserves.
We believe adequate provisions exist for income taxes for all periods and jurisdictions subject to
review or audit.
Stock-based compensation. We calculate the grant date fair value of non-vested shares as the
closing sales price on the trading day immediately prior to the grant date. We use the
Black-Scholes option pricing model to determine the fair value of stock options and employee stock
purchase plan shares. The determination of the fair value of these stock-based payment awards on
the date of grant using an option-pricing model is affected by our stock price as well as
assumptions regarding a number of complex and subjective variables, which include the expected life
of the award, the expected stock price volatility over the expected life of the awards, expected
dividend yield and risk-free interest rate.
We estimate the expected life of options by calculating the average of the vesting period and the
contractual term of the option, as allowed by SEC Staff Accounting Bulletin No. 107. We estimate
the expected stock price volatility based upon historical volatility of our common stock. The
risk-free interest rate is determined using U.S. Treasury rates where the term is consistent with
the expected life of the stock options. Expected dividend yield is not considered as we have never
paid dividends and have no plans of doing so in the future.
The Black-Scholes option-pricing model was developed for use in estimating the fair value of traded
options that have no vesting restrictions and are fully transferable, characteristics not present
in our option grants and employee stock purchase plan shares. Existing valuation models, including
the Black-Scholes and lattice binomial models, may not provide reliable measures of the fair values
of our stock-based compensation. Consequently, there is a risk that our estimates of the fair
values of our stock-based compensation awards on the grant dates may bear little resemblance to the
actual values realized upon the exercise, expiration, early termination or forfeiture of those
stock-based payments in the future. Certain stock-based payments, such as employee stock options,
may expire worthless or otherwise result in zero intrinsic value as compared to the fair values
originally estimated on the grant date and reported in our financial statements. Alternatively,
value may be realized from these instruments that is significantly higher than the fair values
originally estimated on
the grant date and reported in our financial statements. There is not currently a market-based
mechanism or other practical application to verify the reliability and accuracy of the estimates
stemming from these valuation models.
We are required to estimate forfeitures at the time of grant and revise those estimates in
subsequent periods if actual forfeitures differ from those estimates. We use historical data to
estimate pre-vesting forfeitures and record stock-based compensation expense only for those awards
that are expected to vest. All stock-based awards are amortized on a straight-line basis over their
respective requisite service periods, which are generally the vesting periods.
If factors change and we employ different assumptions for estimating stock-based compensation
expense in future periods, such stock-based compensation expense in future periods may differ
significantly from what we have recorded in the current period and could materially affect our
operating income, net income and net income per share. A change in assumptions may also result in a
lack of comparability with other companies that use different models, methods and assumptions.
See Note 12 to our consolidated financial statements contained in “Financial Statements and
Supplementary Data” for further information regarding our stock-based compensation disclosures.
Purchase accounting. We accounted for acquired businesses using the purchase method of accounting,
which requires that the assets acquired and liabilities assumed be recorded at the date of
acquisition at their respective fair values. Our consolidated financial statements and results of
operations reflect an acquired business after the completion of the acquisition. The cost to
acquire a business, including transaction costs, is
48
Table of Contents
allocated to the underlying net assets of the
acquired business in proportion to their respective fair values. Any excess of the purchase price
over the estimated fair values of the net assets acquired is recorded as goodwill.
The amount of the purchase price allocated to intangible assets is determined by estimating the
future cash flows associated with the asset and discounting the net cash flows back to their
present values. The discount rate used is determined at the time of the acquisition in accordance
with standard valuation methods. The estimates of future cash flows include forecasted revenues,
which are inherently difficult to predict. Significant judgments and assumptions are required in
the forecast of future operating results used in the preparation of the estimated future cash
flows, including profit margins, long-term forecasts of the amounts and timing of overall market
growth and our percentage of that market, discount rates and terminal growth rates.
Effective January 1, 2009, we adopted the provisions of SFAS No. 141R, Business Combinations, which
significantly changes the accounting for acquired businesses. Effective July 1, 2009, this standard
was incorporated into FASB ASC Section 805, Business Combinations (FASB ASC 805). Under this
standard, an acquiring entity will be required to recognize all assets acquired and liabilities
assumed at the acquisition date fair value. Legal fees and other transaction-related costs will be
expensed as incurred and are no longer included in goodwill as a cost of acquiring the business.
FASB ASC 805 also requires, among other things, acquirers to estimate the acquisition-date fair
value of any contingent consideration and to recognize any subsequent changes in the fair value of
contingent consideration in earnings. In addition, restructuring costs the acquirer expected, but
was not obligated to incur, will be recognized separately from the business acquisition.
Restructuring charges. We evaluate impairment issues for long-lived assets under the provisions of
FASB ASC 360. We record severance-related expenses once they are both probable and estimable in
accordance
with the provisions of FASB ASC Section 712, Compensation-Nonretirement Postemployment Benefits,
for severance provided under an ongoing benefit arrangement. One-time termination benefit
arrangements and other costs associated with exit activities are accounted for under the provisions
of FASB ASC Section 420, Exit or Disposal Cost Obligations. We have estimated the expense for our
restructuring initiative by accumulating detailed estimates of costs, including the estimated costs
of employee severance and related termination benefits, impairment of property, plant and
equipment, contract termination payments for leases and any other qualifying exit costs. Such costs
represent management’s best estimates, which are evaluated periodically to determine if an
adjustment is required.
49
Table of Contents
| Item 7A. | Quantitative and Qualitative Disclosures About Market Risk. |
Interest Rate Risk
Our exposure to interest rate risk arises principally from the interest rates associated with our
invested cash balances. On December 31, 2009, we have invested short term cash and cash equivalents
and marketable securities of approximately $156 million. Based on this level of investment, a
decrease of 0.25% in interest rates would have a negative annual impact of $390,000 to our interest
income. We currently do not hedge our exposure to interest rate fluctuations, but may do so in the
future.
Foreign Currency Exchange Rate Fluctuations
Fluctuations in the rate of exchange between the U.S. dollar and foreign currencies could adversely
affect our financial results. Approximately 28% of our total net sales were denominated in foreign
currencies during each of the years ended December 31, 2009 and 2008, and we expect that foreign
currencies will continue to represent a similarly significant percentage of our net sales in the
future. Cost of sales related to these sales are primarily denominated in U.S. dollars; however,
operating costs related to these sales are largely denominated in the same respective currencies,
thereby partially limiting our transaction risk exposure. For sales not denominated in U.S.
dollars, an increase in the rate at which a foreign currency is exchanged for U.S. dollars will
require more of the foreign currency to equal a specified amount of U.S. dollars than before the
rate increase. In such cases, if we price our products in the foreign currency, we will receive
less in U.S. dollars than we did before the rate increase went into effect. If we price our
products in U.S. dollars and our competitors price their products in local currency, an increase in
the relative strength of the U.S. dollar could result in our prices not being competitive in a
market where business is transacted in the local currency.
A substantial majority of our sales denominated in foreign currencies are derived from European
Union countries, which are denominated in the euro, from Japan, which are denominated in the
Japanese yen, from the United Kingdom, which are denominated in the British pound, and from Canada,
which are denominated in the Canadian dollar. Additionally, we have significant intercompany
receivables from our foreign subsidiaries which are denominated in foreign currencies, principally
the euro, the yen, the British pound, and the Canadian dollar. Our principal exchange rate risk,
therefore, exists between the U.S. dollar and the euro, the U.S. dollar and the yen, the U.S.
dollar and the British pound, and the U.S. dollar and the Canadian dollar. Fluctuations from the
beginning to the end of any given reporting period result in the revaluation of our foreign
currency-denominated intercompany receivables and payables, generating currency translation gains
or losses that impact our non-operating income and expense levels in the respective period.
As discussed in Note 2 to our consolidated financial statements in “Financial Statements and
Supplementary Data,” we enter into certain short-term derivative financial instruments in the form
of foreign currency forward contracts. These forward contracts are designed to mitigate our
exposure to currency fluctuations in our intercompany balances denominated in euros, Japanese yen,
British pounds and Canadian dollars. Any change in the fair value of these forward contracts as a
result of a fluctuation in a currency exchange rate is expected to be offset by a change in the
value of the intercompany balance. These contracts are effectively closed at the end of each
reporting period.
50
Table of Contents
Item 8. Financial Statements and Supplementary Data.
Wright Medical Group, Inc.
Consolidated Financial Statements
for the Years Ended December 31, 2009, 2008 and 2007
Index to Financial Statements
Consolidated Financial Statements
for the Years Ended December 31, 2009, 2008 and 2007
Index to Financial Statements
| Page | ||||
| 52 | ||||
CONSOLIDATED FINANCIAL STATEMENTS |
||||
| 54 | ||||
| 55 | ||||
| 56 | ||||
| 57 | ||||
| 59 | ||||
51
Table of Contents
Report of Independent Registered Public Accounting Firm
The Board of Directors and Stockholders
Wright Medical Group, Inc.:
Wright Medical Group, Inc.:
We have audited the accompanying consolidated balance sheets of Wright Medical Group, Inc. and
subsidiaries (the Company) as of December 31, 2009 and 2008, and the related consolidated
statements of operations, changes in stockholders’ equity and comprehensive income, and cash
flows for each of the years in the three-year period ended December 31, 2009. These consolidated
financial statements are the responsibility of the Company’s management. Our responsibility is to
express an opinion on these consolidated financial statements based on our audits.
We conducted our audits in accordance with the standards of the Public Company Accounting
Oversight Board (United States). Those standards require that we plan and perform the audit to
obtain reasonable assurance about whether the financial statements are free of material
misstatement. An audit includes examining, on a test basis, evidence supporting the amounts and
disclosures in the financial statements. An audit also includes assessing the accounting
principles used and significant estimates made by management, as well as evaluating the overall
financial statement presentation. We believe that our audits provide a reasonable basis for our
opinion.
In our opinion, the consolidated financial statements referred to above present fairly, in all
material respects, the financial position of the Company as of December 31, 2009 and 2008, and the
results of their operations and their cash flows for each of the years in the three-year period
ended December 31, 2009, in conformity with U.S. generally accepted accounting principles.
We also have audited, in accordance with the standards of the Public Company Accounting Oversight
Board (United States), the Company’s internal control over financial reporting as of December 31,
2009, based on criteria established in Internal Control — Integrated Framework issued by the
Committee of Sponsoring Organizations of the Treadway Commission (COSO), and our report dated
February 22, 2010 expressed an unqualified opinion on the effectiveness of the Company’s internal
control over financial reporting.
| (signed) KPMG LLP |
||||
Memphis, Tennessee
February 22, 2010
February 22, 2010
52
Table of Contents
Report of Independent Registered Public Accounting Firm
The Board of Directors and Stockholders
Wright Medical Group, Inc.:
Wright Medical Group, Inc.:
We have audited the effectiveness of internal control over financial reporting of Wright Medical
Group, Inc. and subsidiaries (the Company) as of December 31, 2009, based on criteria established
in Internal Control—Integrated Framework issued by the Committee of Sponsoring Organizations of
the Treadway Commission (COSO). The Company’s management is responsible for maintaining effective
internal control over financial reporting and for its assessment of the effectiveness of internal
control over financial reporting. Our responsibility is to express an opinion on the effectiveness
of the Company’s internal control over financial reporting based on our audit.
We conducted our audit in accordance with the standards of the Public Company Accounting Oversight
Board (United States). Those standards require that we plan and perform the audit to obtain
reasonable assurance about whether effective internal control over financial reporting was
maintained in all material respects. Our audit included obtaining an understanding of internal
control over financial reporting, assessing the risk that a material weakness exists, and testing
and evaluating the design and operating effectiveness of internal control based on the assessed
risk. Our audit also included performing such other procedures as we considered necessary in the
circumstances. We believe that our audit provides a reasonable basis for our opinion.
A company’s internal control over financial reporting is a process designed to provide reasonable
assurance regarding the reliability of financial reporting and the preparation of financial
statements for external purposes in accordance with U.S. generally accepted accounting principles.
A company’s internal control over financial reporting includes those policies and procedures that
(1) pertain to the maintenance of records that, in reasonable detail, accurately and fairly reflect
the transactions and dispositions of the assets of the company; (2) provide reasonable assurance
that transactions are recorded as necessary to permit preparation of financial statements in
accordance with U.S. generally accepted accounting principles, and that receipts and expenditures
of the company are being made only in accordance with authorizations of management and directors of
the company; and (3) provide reasonable assurance regarding prevention or timely detection of
unauthorized acquisition, use, or disposition of the company’s assets that could have a material
effect on the financial statements.
Because of its inherent limitations, internal control over financial reporting may not prevent or
detect misstatements. Also, projections of any evaluation of effectiveness to future periods are
subject to the risk that controls may become inadequate because of changes in conditions, or that
the degree of compliance with the policies or procedures may deteriorate.
In our opinion, the Company maintained, in all material respects, effective internal
control over financial reporting as of December 31, 2009, based on criteria established in
Internal Control—Integrated Framework issued by the Committee of Sponsoring Organizations of
the Treadway Commission (COSO).
We also have audited, in accordance with the standards of the Public Company Accounting
Oversight Board
(United States), the consolidated balance sheets of the Company as of December 31, 2009 and
2008, and the related consolidated statements of operations, changes in stockholders’ equity
and comprehensive income, and cash flows for each of the years in the three-year period ended
December 31, 2009, and our report dated February 22, 2010 expressed an unqualified opinion on
those consolidated financial statements.
| (signed) KPMG LLP |
||||
Memphis, Tennessee
February 22, 2010
February 22, 2010
53
Table of Contents
Wright Medical Group, Inc.
Consolidated Balance Sheets
(In thousands, except share data)
Consolidated Balance Sheets
(In thousands, except share data)
| December 31, | December 31, | |||||||
| 2009 | 2008 | |||||||
Assets: |
||||||||
Current assets: |
||||||||
Cash and cash equivalents |
$ | 84,409 | $ | 87,865 | ||||
Marketable securities |
86,819 | 57,614 | ||||||
Accounts receivable, net |
101,720 | 102,046 | ||||||
Inventories |
163,535 | 176,059 | ||||||
Prepaid expenses |
13,122 | 14,263 | ||||||
Deferred income taxes |
34,824 | 29,874 | ||||||
Other current assets |
6,175 | 8,934 | ||||||
Total current assets |
490,604 | 476,655 | ||||||
Property, plant and equipment, net |
139,708 | 133,651 | ||||||
Goodwill |
53,860 | 49,682 | ||||||
Intangible assets, net |
17,727 | 21,090 | ||||||
Deferred income taxes |
5,248 | 3,034 | ||||||
Other assets |
7,137 | 8,018 | ||||||
Total assets |
$ | 714,284 | $ | 692,130 | ||||
Liabilities and Stockholders’ Equity: |
||||||||
Current liabilities: |
||||||||
Accounts payable |
$ | 13,978 | $ | 15,877 | ||||
Accrued expenses and other current liabilities |
54,643 | 59,247 | ||||||
Current portion of long-term obligations |
336 | 125 | ||||||
Total current liabilities |
68,957 | 75,249 | ||||||
Long-term debt and capital lease obligations |
200,326 | 200,136 | ||||||
Deferred income taxes |
157 | 166 | ||||||
Other liabilities |
4,436 | 4,951 | ||||||
Total liabilities |
273,876 | 280,502 | ||||||
Commitments and contingencies (Note 15) |
||||||||
Stockholders’ equity: |
||||||||
Common stock, $.01 par value,
authorized: 100,000,000 shares; issued and
outstanding: 38,668,882 shares at December 31, 2009 and
38,021,961 shares at December 31, 2008 |
374 | 372 | ||||||
Additional paid-in capital |
376,647 | 364,594 | ||||||
Accumulated other comprehensive income |
22,906 | 18,312 | ||||||
Retained earnings |
40,481 | 28,350 | ||||||
Total stockholders’ equity |
440,408 | 411,628 | ||||||
Total liabilities and stockholders’ equity |
$ | 714,284 | $ | 692,130 | ||||
The accompanying notes are an integral part of these consolidated financial statements.
54
Table of Contents
Wright Medical Group, Inc.
Consolidated Statements of Operations
(In thousands, except per share data)
Consolidated Statements of Operations
(In thousands, except per share data)
| Year ended December 31, | ||||||||||||
| 2009 | 2008 | 2007 | ||||||||||
Net sales |
$ | 487,508 | 465,547 | $ | 386,850 | |||||||
Cost of sales 1 |
148,715 | 134,377 | 108,407 | |||||||||
Cost of sales — restructuring |
— | — | 2,139 | |||||||||
Gross profit |
338,793 | 331,170 | 276,304 | |||||||||
Operating expenses: |
||||||||||||
Selling, general and administrative 1 |
270,456 | 261,396 | 225,929 | |||||||||
Research and development 1 |
35,691 | 33,292 | 28,405 | |||||||||
Amortization of intangible assets |
5,151 | 4,874 | 3,782 | |||||||||
Restructuring charges (Note 14) |
3,544 | 6,705 | 16,734 | |||||||||
Acquired in-process research and development |
— | 2,490 | — | |||||||||
Total operating expenses |
314,842 | 308,757 | 274,850 | |||||||||
Operating income |
23,951 | 22,413 | 1,454 | |||||||||
Interest expense (income), net |
5,466 | 2,181 | (1,252 | ) | ||||||||
Other expense (income), net |
2,873 | (1,338 | ) | 375 | ||||||||
Income before income taxes |
15,612 | 21,570 | 2,331 | |||||||||
Provision for income taxes |
3,481 | 18,373 | 1,370 | |||||||||
Net income |
$ | 12,131 | $ | 3,197 | $ | 961 | ||||||
Net income per share (Note 10): |
||||||||||||
Basic |
$ | 0.32 | 0.09 | $ | 0.03 | |||||||
Diluted |
$ | 0.32 | 0.09 | $ | 0.03 | |||||||
Weighted-average number of shares outstanding-basic |
37,366 | 36,933 | 35,812 | |||||||||
Weighted-average number of shares outstanding-diluted |
37,443 | 37,401 | 36,483 | |||||||||
| 1 | These line items include the following amounts of non-cash, stock-based compensation expense for the periods indicated: |
| Year Ended December 31, | ||||||||||||
| 2009 | 2008 | 2007 | ||||||||||
Cost of sales |
$ | 1,285 | $ | 1,244 | $ | 2,046 | ||||||
Selling, general and administrative |
10,077 | 10,644 | 12,061 | |||||||||
Research and development |
1,829 | 1,613 | 2,425 | |||||||||
The accompanying notes are an integral part of these consolidated financial statements.
55
Table of Contents
Wright Medical Group, Inc.
Consolidated Statements of Cash Flows
(In thousands)
Consolidated Statements of Cash Flows
(In thousands)
| Year Ended December 31, | ||||||||||||
| 2009 | 2008 | 2007 | ||||||||||
Operating activities: |
||||||||||||
Net income |
$ | 12,131 | $ | 3,197 | $ | 961 | ||||||
Adjustments to reconcile net income to net cash
provided by (used in) operating activities: |
||||||||||||
Depreciation |
32,717 | 26,462 | 23,522 | |||||||||
Stock-based compensation expense |
13,191 | 13,501 | 16,532 | |||||||||
Acquired in-process research and development
costs |
— | 2,490 | — | |||||||||
Amortization of intangible assets |
5,151 | 4,874 | 3,782 | |||||||||
Deferred income taxes |
(9,247 | ) | 18,325 | (8,708 | ) | |||||||
Non-cash write-off of cumulative translation
adjustment (CTA) balances (See Note 2) |
2,643 | — | — | |||||||||
Excess tax benefits from stock-based compensation
arrangements |
(63 | ) | (1,278 | ) | (3,633 | ) | ||||||
Non-cash restructuring charges |
— | (63 | ) | 5,295 | ||||||||
Provision for losses on accounts receivable |
5,339 | 939 | 2,339 | |||||||||
Other |
1,815 | 294 | (2,228 | ) | ||||||||
Changes in assets and liabilities: |
||||||||||||
Accounts receivable |
(4,003 | ) | (18,729 | ) | (9,831 | ) | ||||||
Inventories |
13,049 | (57,797 | ) | (27,077 | ) | |||||||
Marketable securities |
— | 15,535 | 14,790 | |||||||||
Prepaid expenses and other current assets |
5,953 | (6,666 | ) | (6,103 | ) | |||||||
Accounts payable |
(1,950 | ) | (5,009 | ) | 1,889 | |||||||
Accrued expenses and other liabilities |
(4,975 | ) | 315 | 12,894 | ||||||||
Net cash provided by (used in) operating activities |
71,751 | (3,610 | ) | 24,424 | ||||||||
Investing activities: |
||||||||||||
Capital expenditures |
(37,190 | ) | (61,936 | ) | (35,042 | ) | ||||||
Acquisition of businesses |
(6,785 | ) | (28,914 | ) | (27,758 | ) | ||||||
Purchase of intangible assets |
(1,037 | ) | (3,418 | ) | (1,041 | ) | ||||||
Proceeds from the maturity of available-for-sale marketable
securities |
71,499 | — | — | |||||||||
Investment in available-for-sale marketable securities |
(101,443 | ) | (57,037 | ) | — | |||||||
Other |
— | 2,363 | — | |||||||||
Net cash used in investing activities |
(74,956 | ) | (148,942 | ) | (63,841 | ) | ||||||
Financing activities: |
||||||||||||
Issuance of common stock |
680 | 12,018 | 17,292 | |||||||||
Proceeds from issuance of convertible senior notes |
— | — | 193,492 | |||||||||
Financing under factoring agreements, net |
(58 | ) | (605 | ) | (3,457 | ) | ||||||
Principal payments of bank and other financing |
(153 | ) | (285 | ) | (1,063 | ) | ||||||
Excess tax benefits from stock-based compensation arrangements |
63 | 1,278 | 3,633 | |||||||||
Net cash provided by financing activities |
532 | 12,406 | 209,897 | |||||||||
Effect of exchange rates on cash and cash equivalents |
(783 | ) | (1,015 | ) | 607 | |||||||
Net (decrease) increase in cash and cash equivalents |
(3,456 | ) | (141,161 | ) | 171,087 | |||||||
Cash and cash equivalents, beginning of period |
87,865 | 229,026 | 57,939 | |||||||||
Cash and cash equivalents, end of period |
$ | 84,409 | $ | 87,865 | $ | 229,026 | ||||||
The accompanying notes are an integral part of these consolidated financial statements.
56
Table of Contents
Wright Medical Group, Inc.
Consolidated Statements of Changes in Stockholders’ Equity and Comprehensive Income
For the Years Ended December 31, 2007, 2008 and 2009
(In thousands, except share data)
Consolidated Statements of Changes in Stockholders’ Equity and Comprehensive Income
For the Years Ended December 31, 2007, 2008 and 2009
(In thousands, except share data)
| Common Stock, | Accumulated | |||||||||||||||||||||||
| Voting | Additional | Other | Total | |||||||||||||||||||||
| Number of | Paid-in | Retained | Comprehensive | Stockholders’ | ||||||||||||||||||||
| Shares | Amount | Capital | Earnings | Income | Equity | |||||||||||||||||||
Balance at December 31, 2006 |
35,143,800 | $ | 351 | $ | 300,648 | $ | 16,947 | $ | 17,878 | $ | 335,824 | |||||||||||||
2007 Activity: |
||||||||||||||||||||||||
Net income |
— | — | — | 961 | — | 961 | ||||||||||||||||||
Foreign currency translation |
— | — | — | — | 6,970 | 6,970 | ||||||||||||||||||
Minimum pension liability
adjustment |
— | — | — | — | (225 | ) | (225 | ) | ||||||||||||||||
Total comprehensive income |
— | — | — | — | — | 7,706 | ||||||||||||||||||
FIN 48 adjustment to
opening balance |
— | — | — | 7,245 | — | 7,245 | ||||||||||||||||||
Issuances of common stock |
1,349,383 | 14 | 17,278 | — | — | 17,292 | ||||||||||||||||||
Tax effect of stock based
compensation activity |
— | — | 4,289 | — | — | 4,289 | ||||||||||||||||||
Stock-based compensation |
— | — | 16,425 | — | — | 16,425 | ||||||||||||||||||
Balance at December 31, 2007 |
36,493,183 | $ | 365 | $ | 338,640 | $ | 25,153 | $ | 24,623 | $ | 388,781 | |||||||||||||
2008 Activity: |
||||||||||||||||||||||||
Net income |
— | — | — | 3,197 | — | 3,197 | ||||||||||||||||||
Foreign currency translation |
— | — | — | — | (6,781 | ) | (6,781 | ) | ||||||||||||||||
Unrealized gain on
marketable securities |
— | — | — | — | 399 | 399 | ||||||||||||||||||
Minimum pension liability
adjustment |
— | — | — | — | 71 | 71 | ||||||||||||||||||
Total comprehensive loss |
(3,114 | ) | ||||||||||||||||||||||
Issuances of common stock |
616,836 | 7 | 12,011 | — | — | 12,018 | ||||||||||||||||||
Issuance of previously
granted restricted stock |
434,005 | — | — | — | — | — | ||||||||||||||||||
Grant of non-vested shares
of common stock |
558,184 | — | — | — | — | — | ||||||||||||||||||
Cancellation of non-vested
shares of common stock |
(80,247 | ) | — | — | — | — | — | |||||||||||||||||
Tax effect of stock based
compensation activity |
— | — | 720 | — | — | 720 | ||||||||||||||||||
Stock-based compensation |
— | — | 13,223 | — | — | 13,223 | ||||||||||||||||||
Balance at December 31, 2008 |
38,021,961 | $ | 372 | $ | 364,594 | $ | 28,350 | $ | 18,312 | $ | 411,628 | |||||||||||||
The accompanying notes are an integral part of these consolidated financial statements.
57
Table of Contents
Wright Medical Group, Inc.
Consolidated Statements of Changes in Stockholders’ Equity and Comprehensive Income (Continued)
For the Years Ended December 31, 2007, 2008 and 2009
Consolidated Statements of Changes in Stockholders’ Equity and Comprehensive Income (Continued)
For the Years Ended December 31, 2007, 2008 and 2009
(In thousands, except share data)
| Common Stock, | Accumulated | |||||||||||||||||||||||
| Voting | Additional | Other | Total | |||||||||||||||||||||
| Number of | Paid-in | Comprehensive | Stockholders’ | |||||||||||||||||||||
| Shares | Amount | Capital | Retained Earnings | Income | Equity | |||||||||||||||||||
2009 Activity: |
||||||||||||||||||||||||
Net income |
— | — | — | 12,131 | — | 12,131 | ||||||||||||||||||
Foreign currency translation |
— | — | — | — | 2,398 | 2,398 | ||||||||||||||||||
Unrealized loss on
marketable securities |
— | — | — | — | (438 | ) | (438 | ) | ||||||||||||||||
Minimum pension liability
adjustment |
— | — | — | — | (9 | ) | (9 | ) | ||||||||||||||||
Total comprehensive income |
14,082 | |||||||||||||||||||||||
Write-off of cumulative
translation adjustment
(CTA) balances (See Note 2) |
— | — | — | — | 2,643 | 2,643 | ||||||||||||||||||
Issuances of common stock |
64,446 | — | 680 | — | — | 680 | ||||||||||||||||||
Grant of non-vested shares
of common stock |
718,010 | — | — | — | — | — | ||||||||||||||||||
Cancellation of non-vested
shares of common stock |
(147,971 | ) | — | — | — | — | — | |||||||||||||||||
Vesting of stock-settled
phantom stock units and
non-vested shares of common
stock |
12,436 | 2 | (2 | ) | — | — | — | |||||||||||||||||
Tax effect of stock based
compensation activity |
— | — | (1,892 | ) | — | — | (1,892 | ) | ||||||||||||||||
Stock-based compensation |
— | — | 13,267 | — | — | 13,267 | ||||||||||||||||||
Balance at December 31, 2009 |
38,668,882 | $ | 374 | $ | 376,647 | $ | 40,481 | $ | 22,906 | $ | 440,408 | |||||||||||||
The accompanying notes are an integral part of these consolidated financial statements.
58
Table of Contents
WRIGHT MEDICAL GROUP, INC.
NOTES TO CONSOLIDATED FINANCIAL STATEMENTS
1. Organization and Description of Business
Wright Medical Group, Inc., through Wright Medical Technology, Inc. and other operating
subsidiaries (Wright), is a global orthopaedic medical device company specializing in the design,
manufacture and marketing of devices and biologic products for extremity, hip and knee repair and
reconstruction. We are a leading provider of surgical solutions for the foot and ankle market. Our
products are sold primarily through a network of employee sales representatives and independent
sales representatives in the United States (U.S.) and by a combination of employee sales
representatives, independent sales representatives and stocking distributors outside the U.S. We
promote our products in approximately 60 countries with principal markets in the U.S., Europe,
Canada, Australia and Japan. We are headquartered in Arlington, Tennessee.
2. Summary of Significant Accounting Policies
Principles of Consolidation. The accompanying consolidated financial statements include our
accounts and those of our wholly owned domestic and international subsidiaries. Intercompany
accounts and transactions have been eliminated in consolidation.
Use of Estimates. The preparation of financial statements in conformity with U.S. generally
accepted accounting principles requires management to make estimates and assumptions that affect
the amounts reported in the financial statements and accompanying notes. Actual results could
differ from those estimates. The most significant areas requiring the use of management estimates
relate to revenue recognition, the determination of allowances for doubtful accounts and excess and
obsolete inventories, the evaluation of goodwill and long-lived assets, product liability claims
and other litigation, income taxes, stock-based compensation, purchase accounting for business
combinations, and accounting for restructuring charges.
Cash and Cash Equivalents. Cash and cash equivalents include all cash balances and short-term
investments with original maturities of three months or less.
Marketable Securities. Our 2007 investment in marketable securities represented debt
securities, which were classified as trading securities in accordance with Financial Accounting
Standards Board (FASB) Accounting Standards Codification (ASC) Section 320, Investments — Debt and
Equity Securities (FASB ASC 320). For the year ended December 31, 2007, we did not incur any
realized or unrealized gains or losses related to these securities. During the first quarter of
2008, we liquidated all those investments into cash equivalents. During the remainder of 2008 and
throughout 2009, we invested in treasury bills, government and agency bonds, and certificates of
deposit with maturity dates of less than 12 months and certificates of deposit with maturity dates
of six months or less. Our investments in these marketable securities are classified as
available-for-sale securities in accordance with FASB ASC 320. These securities are carried at
their fair value, and all unrealized gains and losses are recorded within other comprehensive
income.
Inventories. Our inventories are valued at the lower of cost or market on a first-in, first-out
(FIFO) basis. Inventory costs include material, labor costs and manufacturing overhead. We
regularly review inventory quantities on hand for excess and obsolete inventory and, when
circumstances indicate, we incur charges to write down inventories to their net realizable value.
Our review of inventory for excess and obsolete quantities is based primarily on our estimated
forecast of product demand and production requirements for the next twenty-four months. Charges
incurred for excess and obsolete inventory included in “Cost of sales” were $12.5 million, $8.7
million, and $6.6 million for the years ended December 31, 2009, 2008, and 2007, respectively.
Additionally, in 2007, we recorded charges of $2.1 million associated with the closure of our
manufacturing facility in Toulon, France for inventory write-offs and manufacturing costs incurred
during a period of abnormal production capacity, which were expensed as period costs in accordance
with FASB ASC Section 330, Inventory.
59
Table of Contents
WRIGHT MEDICAL GROUP, INC.
NOTES TO CONSOLIDATED FINANCIAL STATEMENTS
(continued)
(continued)
Product Liability Claims and Other Litigation. We make provisions for claims specifically
identified for which we believe the likelihood of an unfavorable outcome is probable and an
estimate of the amount of loss has been developed. We have recorded at least the minimum estimated
liability related to those claims where a range of loss has been established. Our accrual for
product liability claims was $1.1 million and $310,000 at December 31, 2009
and 2008, respectively. We are also involved in legal proceedings involving contract, patent
protection and other matters. (See Note 15).
Property, Plant and Equipment. Our property, plant and equipment is stated at cost. Depreciation,
which includes amortization of assets under capital lease, is generally provided on a straight-line
basis over the estimated useful lives generally based on the following categories:
Land improvements |
15 to 25 years | |||
Buildings |
10 to 45 years | |||
Machinery and equipment |
3 to 12 years | |||
Furniture, fixtures and office equipment |
1 to 14 years | |||
Surgical instruments |
6 years | |||
Expenditures for major renewals and betterments, including leasehold improvements, that extend the
useful life of the assets are capitalized and depreciated over the remaining life of the asset or
lease term, if shorter. Maintenance and repair costs are charged to expense as incurred. Upon sale
or retirement, the asset cost and related accumulated depreciation are eliminated from the
respective accounts and any resulting gain or loss is included in income.
Intangible Assets and Goodwill. Goodwill is recognized for the excess of the purchase price over
the fair value of net assets of businesses acquired. Goodwill is required to be tested for
impairment at least annually. Unless circumstances otherwise dictate, the annual impairment test is
performed in the fourth quarter. Accordingly, during the fourth quarter of 2009, we evaluated
goodwill for impairment and determined that the fair value of our reporting unit exceeded its
carrying value, indicating that goodwill was not impaired. Based on our single business approach to
decision-making, planning and resource allocation, management has determined that we have only one
reporting unit for purposes of evaluating goodwill for impairment.
Our intangible assets with estimable useful lives are amortized on a straight line basis over their
respective estimated useful lives to their estimated residual values, and are reviewed for
impairment in accordance with FASB ASC Section 360, Property, Plant and Equipment (FASB ASC 360).
The weighted average amortization periods for completed technology, distribution channels,
trademarks, licenses, customer relationships and other are 9 years, 10 years, 7 years, 8 years, 11
years and 6 years, respectively. The weighted average amortization period of our intangible assets
on a combined basis is 9 years. Additionally, we have one trademark intangible asset that has an
indefinite life.
Valuation of Long-Lived Assets. Management periodically evaluates carrying values of long-lived
assets, including property, plant and equipment and intangible assets, when events and
circumstances indicate that these assets may have been impaired. We account for the impairment of
long-lived assets in accordance with FASB ASC 360. Accordingly, we evaluate impairment of our
property, plant and equipment based upon an analysis of estimated undiscounted future cash flows.
If it is determined that a change is required in the useful life of an asset, future depreciation
and amortization is adjusted accordingly. Alternatively, should we determine that an asset is
impaired, an adjustment would be charged to income based on the asset’s fair market value or
discounted cash flows if the fair market value is not readily determinable, reducing income in that
period.
Allowances for Doubtful Accounts. We experience credit losses on our accounts receivable and,
accordingly, we must make estimates related to the ultimate collection of our accounts receivable.
Specifically, management analyzes our accounts receivable, historical bad debt experience, customer
concentrations, customer credit-worthiness and current economic trends when evaluating the adequacy
of our allowance for doubtful accounts.
60
Table of Contents
WRIGHT MEDICAL GROUP, INC.
NOTES TO CONSOLIDATED FINANCIAL STATEMENTS
(continued)
(continued)
The majority of our accounts receivable are from hospitals, many of which are government funded.
Accordingly, our collection history with this class of customer has been favorable. Historically,
we have experienced minimal bad debts from our hospital customers and more significant bad debts
from certain international stocking distributors, typically as a result of specific financial
difficulty or geo-political factors. We write off accounts receivable when we determine that the
accounts receivable are uncollectible, typically upon customer bankruptcy or the customer’s
non-response to continued collection efforts. Our allowance for doubtful accounts totaled $8.6
million and $4.0 million
at December 31, 2009 and 2008, respectively, which includes a $5.6 million provision recorded in
2009 for potential losses related to the trade receivable balance of our stocking distributor in
Turkey.
Concentration of Credit Risk. Financial instruments which potentially subject us to concentrations
of credit risk consist principally of accounts receivable. Management attempts to minimize credit
risk by reviewing customers’ credit history before extending credit and by monitoring credit
exposure on a regular basis. An allowance for possible losses on accounts receivable is established
based upon factors surrounding the credit risk of specific customers, historical trends and other
information. Collateral or other security is generally not required for accounts receivable. As of
December 31, 2009, one customer, our stocking distributor in Turkey, accounted for more than 10% of
our accounts receivable balance. As of December 31, 2009 and 2008, the balance due from this
customer was $10.7 million and $10.6 million, respectively. As of December 31, 2009, we have
recorded a $5.6 million provision for potential losses related to the trade receivable balance of
our stocking distributor in Turkey.
Concentrations of Supply of Raw Material. We rely on a limited number of suppliers for the
components used in our products. Our reconstructive joint devices are produced from various
surgical grades of titanium, cobalt chrome, stainless steel, various grades of high density
polyethylenes, and ceramics. We rely on one source to supply us with a certain grade of cobalt
chrome alloy and one supplier for the silicone elastomer used in some of our extremity products. We
are aware of only two suppliers of silicone elastomer to the medical device industry for permanent
implant usage. Additionally, we rely on one supplier of ceramics for use in our hip products. For
certain biologic products, we depend on one supplier of demineralized bone matrix (DBM), cancellous
bone matrix (CBM) and soft tissue graft for BIOTAPE® XM. We rely on one supplier for our
GRAFTJACKET® family of soft tissue repair and graft containment products, and one
supplier for our xenograph bone wedge product. We maintain adequate stock from these suppliers in
order to meet market demand.
Income Taxes. Income taxes are accounted for pursuant to the provisions of FASB ASC Section 740,
Income Taxes (FASB ASC 740). Our effective tax rate is based on income by tax jurisdiction,
statutory rates and tax saving initiatives available to us in the various jurisdictions in which we
operate. Significant judgment is required in determining our effective tax rate and evaluating our
tax positions. This process includes assessing temporary differences resulting from differing
recognition of items for income tax and financial accounting purposes. These differences result in
deferred tax assets and liabilities, which are included within our consolidated balance sheet. The
measurement of deferred tax assets is reduced by a valuation allowance if, based upon available
evidence, it is more likely than not that some or all of the deferred tax assets will not be
realized.
We provide for unrecognized tax benefits based upon our assessment of whether a tax position is
“more-likely-than-not” to be sustained upon examination by the tax authorities. If a tax position
meets the more-likely-than-not standard, then the related tax benefit is measured based on a
cumulative probability analysis of the amount that is more-likely-than-not to be realized upon
ultimate settlement or disposition of the underlying tax position.
Other Taxes. Taxes assessed by a governmental authority that are imposed concurrent with our
revenue transactions with customers are presented on a net basis in our consolidated statement of
operations.
Revenue Recognition. Our revenues are primarily generated through two types of customers, hospitals
and surgery centers, and stocking distributors, with the majority of our revenue derived from sales
to hospitals. Our products are primarily sold through a network of employee sales representatives
and independent sales representatives in the U.S.
61
Table of Contents
WRIGHT MEDICAL GROUP, INC.
NOTES TO CONSOLIDATED FINANCIAL STATEMENTS
(continued)
(continued)
and by a combination of employee sales
representatives, independent sales representatives, and stocking distributors outside the U.S.
Revenues from sales to hospitals are recorded when the hospital takes title to the product, which
is generally when the product is surgically implanted in a patient.
We record revenues from sales to our stocking distributors outside the U.S. at the time the product
is shipped to the distributor. Stocking distributors, who sell the products to their customers,
take title to the products and assume all risks of ownership. Our distributors are obligated to pay
within specified terms regardless of when, if ever, they sell the products. In general, the
distributors do not have any rights of return or exchange; however, in limited situations we have
repurchase agreements with certain stocking distributors. Those certain agreements require us to
repurchase a specified percentage of the inventory purchased by the distributor within a specified
period of time prior to the
expiration of the contract. During those specified periods, we defer the applicable percentage of
the sales. Approximately $186,000 and $172,000 of deferred revenue related to these types of
agreements was recorded at December 31, 2009 and 2008, respectively.
We must make estimates of potential future product returns related to current period product
revenue. We develop these estimates by analyzing historical experience related to product returns.
Judgment must be used and estimates made in connection with establishing the allowance for sales
returns in any accounting period. An allowance for sales returns of $551,000 and $490,000 is
included as a reduction of accounts receivable at December 31, 2009 and 2008, respectively.
Shipping and Handling Costs. We incur shipping and handling costs associated with the shipment of
goods to customers, independent distributors and our subsidiaries. All shipping and handling
amounts billed to customers are included in net sales. All shipping and handling costs associated
with the shipment of goods to customers are included in cost of sales. All other shipping and
handling costs are included in selling, general and administrative expenses.
Research and Development Costs. Research and development costs are charged to expense as incurred.
Foreign Currency Translation. The financial statements of our international subsidiaries whose
functional currency is the local currency are translated into U.S. dollars using the exchange rate
at the balance sheet date for assets and liabilities and the weighted average exchange rate for the
applicable period for revenues, expenses, gains and losses. Translation adjustments are recorded as
a separate component of comprehensive income in stockholders’ equity. Gains and losses resulting
from transactions denominated in a currency other than the local functional currency are included
in “Other expense (income), net” in our consolidated statement of operations.
In accordance with FASB ASC Section 830, Foreign Currency Matters, we are required to recognize the
cumulative translation adjustment (CTA) balance from stockholders’ equity upon the complete or
substantially complete liquidation of a foreign subsidiary. During 2009, we wrote-off approximately
$2.6 million from the CTA balance for the substantially complete liquidation of two of our French
subsidiaries and our subsidiary in Spain. This net cumulative foreign currency loss is included in
“Other expense (income) net” in our consolidated statements of operations.
Pension Benefits. Our subsidiary in Japan provides benefits to employees under a plan that we
account for as a defined benefit plan in accordance with FASB ASC Section 715, Compensation —
Retirement Benefits. This plan is unfunded and determining the minimum pension liability requires
the use of assumptions and estimates, including discount rates and mortality rates, and actuarial
methods. Our minimum pension liability totaled $1.6 million and $1.4 million as of December 31,
2009 and 2008, respectively.
Comprehensive Income. Comprehensive income is defined as the change in equity during a period
related to transactions and other events and circumstances from non-owner sources. It includes all
changes in equity during a period except those resulting from investments by owners and
distributions to owners. The difference between our
62
Table of Contents
WRIGHT MEDICAL GROUP, INC.
NOTES TO CONSOLIDATED FINANCIAL STATEMENTS
(continued)
(continued)
net income and our comprehensive income is
attributable to foreign currency translation, adjustments to our minimum pension liability, and
unrealized gains and losses on our available-for-sale marketable securities.
Stock-Based Compensation. We account for stock-based compensation in accordance with FASB ASC
Section 718, Compensation — Stock Compensation (FASB ASC 718). Under the fair value recognition
provisions of FASB ASC 718, stock-based compensation cost is measured at the grant date based on
the fair value of the award and is recognized as expense on a straight-line basis over the
requisite service period, which is the vesting period. The determination of the fair value of
stock-based payment awards, such as options, on the date of grant using an option-pricing model is
affected by our stock price, as well as assumptions regarding a number of complex and subjective
variables, which include the expected life of the award, the expected stock price volatility over
the expected life of the awards, expected dividend yield and risk-free interest rate.
We recorded $13.2 million, $13.5 million, and $16.5 million of stock-based compensation expense
during the years ended December 31, 2009, 2008, and 2007, respectively. See Note 12 for further
information regarding our stock-based compensation assumptions and expenses.
Fair Value of Financial Instruments. The carrying value of cash and cash equivalents, accounts
receivable and accounts payable approximates the fair value of these financial instruments at
December 31, 2009 and 2008 due to their short maturities or variable rates.
The fair value of our convertible senior notes was approximately $176 million and $155 million as
of December 31, 2009 and 2008, respectively, based on a quoted price in an active market (Level 1).
Effective January 1, 2008, we adopted the provisions of Statement of Financial Accounting Standards
(SFAS) No. 157, Fair Value Measurements (SFAS 157), for financial assets and liabilities measured
at fair value on a recurring basis. SFAS 157 applies to all financial assets and liabilities that
are being measured and reported on a fair value basis, and establishes a framework for measuring
the fair value of assets and liabilities and expands disclosures about fair value measurements. The
adoption of SFAS 157 had no impact to our consolidated financial statements. Effective July 1,
2009, this standard was incorporated into the FASB ASC Section 820, Fair Value Measurements and
Disclosures (FASB ASC 820). FASB ASC 820 requires fair value measurements be classified and
disclosed in one of the following three categories:
Level 1:
|
Financial instruments with unadjusted, quoted prices listed on active market exchanges. | |
Level 2:
|
Financial instruments determined using prices for recently traded financial instruments with similar underlying terms as well as directly or indirectly observable inputs, such as interest rates and yield curves that are observable at commonly quoted intervals. | |
Level 3:
|
Financial instruments that are not actively traded on a market exchange. This category includes situations where there is little, if any, market activity for the financial instrument. The prices are determined using significant unobservable inputs or valuation techniques. |
As of December 31, 2009, we have available-for-sale marketable securities totaling $86.8 million,
consisting of investments in treasury bills, government and agency bonds and certificates of
deposits, all of which are valued at fair value using a market approach. A total of $85.4 million
of our available-for-sale marketable securities is valued based on quoted prices in active exchange
markets (Level 1). The remaining $1.4 million is valued at fair value using other observable inputs
(Level 2).
63
Table of Contents
WRIGHT MEDICAL GROUP, INC.
NOTES TO CONSOLIDATED FINANCIAL STATEMENTS
(continued)
(continued)
Derivative Instruments. We account for derivative instruments and hedging activities
under FASB ASC Section 815, Derivatives and Hedging (FASB ASC 815). Accordingly, all of our
derivative instruments are recorded in the accompanying consolidated balance sheets as either an
asset or liability and measured at fair value. The changes in the derivative’s fair value are
recognized currently in earnings unless specific hedge accounting criteria are met.
We employ a derivative program using 30-day foreign currency forward contracts to mitigate the risk
of currency fluctuations on our intercompany receivable and payable balances that are denominated
in foreign currencies. These forward contracts are expected to offset the transactional gains and
losses on the related intercompany balances. These forward contracts are not designated as hedging
instruments under FASB ASC 815. Accordingly, the changes in the fair value and the settlement of
the contracts are recognized in the period incurred in the accompanying consolidated statements of
operations.
We recorded a net gain of $655,000 for the year ended December 31, 2009, and net losses of $1.5
million and $2.8 million for the years ended December 31, 2008 and 2007, respectively, on foreign
currency contracts, which are included in “Other expense (income), net” in our consolidated
statements of operations. These losses substantially offset translation gains recorded on our
intercompany receivable and payable balances, also included in “Other expense (income), net.” At
December 31, 2009 and 2008, we had no foreign currency contracts outstanding.
Supplemental Cash Flow Information. Cash paid for interest and income taxes was as follows (in
thousands):
| Year Ended December 31, | ||||||||||||
| 2009 | 2008 | 2007 | ||||||||||
Interest |
$ | 5,492 | $ | 5,963 | $ | 1,898 | ||||||
Income taxes |
$ | 10,419 | $ | 4,960 | $ | 10,408 | ||||||
During 2008, we sold certain assets of our Toulon, France facility. As part of that sale, the buyer
assumed our capital lease obligations of approximately $700,000 for certain machinery and equipment
located in that facility. We entered into insignificant amounts of capital leases during 2007, 2008
and 2009.
Subsequent Events. We adopted the provisions of SFAS No. 165, Subsequent Events (SFAS 165) during
the three-month period ended June 30, 2009. Effective July 1, 2009, this standard was incorporated
into the FASB ASC Section 855, Subsequent Events (FASB ASC 855). FASB ASC 855 establishes general
standards of accounting for and disclosure of events that occur after the balance sheet date but
before financial statements are issued. The adoption of these standards did not impact our
financial position or results of operations. We evaluated all events or transactions that occurred
after December 31, 2009 through February 22, 2010, the date we issued these financial statements.
3. Inventories
Inventories consist of the following (in thousands):
| December 31, | ||||||||
| 2009 | 2008 | |||||||
Raw materials |
$ | 8,606 | $ | 9,502 | ||||
Work-in-process |
23,766 | 34,811 | ||||||
Finished goods |
131,163 | 131,746 | ||||||
| $ | 163,535 | $ | 176,059 | |||||
64
Table of Contents
WRIGHT MEDICAL GROUP, INC.
NOTES TO CONSOLIDATED FINANCIAL STATEMENTS
(continued)
(continued)
4. Property, Plant and Equipment
Property, plant and equipment consists of the following (in thousands):
| December 31, | ||||||||
| 2009 | 2008 | |||||||
Land and land improvements |
$ | 4,229 | $ | 4,073 | ||||
Buildings |
26,489 | 22,709 | ||||||
Machinery and equipment |
53,357 | 42,675 | ||||||
Furniture, fixtures and office equipment |
36,346 | 31,620 | ||||||
Construction in progress |
9,433 | 9,963 | ||||||
Surgical instruments |
156,232 | 143,503 | ||||||
| 286,086 | 254,543 | |||||||
Less: Accumulated depreciation |
(146,378 | ) | (120,892 | ) | ||||
| $ | 139,708 | $ | 133,651 | |||||
The components of property, plant and equipment recorded under capital leases consist of the
following (in thousands):
| December 31, | ||||||||
| 2009 | 2008 | |||||||
Buildings |
$ | 1,448 | $ | 1,448 | ||||
Machinery and equipment |
469 | 357 | ||||||
Furniture, fixtures and office equipment |
466 | 13 | ||||||
| 2,383 | 1,818 | |||||||
Less: Accumulated depreciation |
(872 | ) | (655 | ) | ||||
| $ | 1,511 | $ | 1,163 | |||||
Depreciation expense approximated $32.7 million, $26.5 million, and $23.5 million for the years
ended December 31, 2009, 2008, and 2007, respectively, and included amortization of assets under
capital leases.
5. Goodwill and Intangibles
Changes in the carrying amount of goodwill occurring during the year ended December 31, 2009, are
as follows (in thousands):
Goodwill at December 31, 2008 |
$ | 49,682 | ||
Goodwill from contingent consideration associated with
acquisitions prior to 2009 |
3,957 | |||
Foreign currency translation |
221 | |||
Goodwill at December 31, 2009 |
$ | 53,860 | ||
During 2009, we recognized contingent consideration of $2.1 million associated with our acquisition
of Inbone Technologies, Inc., completed in 2008, $292,000 associated with the acquisition of the
foot and ankle assets of A.M. Surgical, Inc., completed in 2008, $877,000 associated with the
acquisition of certain assets of R&R Medical, Inc., completed in 2007, $117,000 associated with the
acquisition of the subtalar implant assets of Koby Ventures Ltd., d/b/a Metasurg, completed in
2007, and $611,000 associated with the acquisition of assets of Creative Medical Designs and
Rayhack LLC, completed in 2008.
65
Table of Contents
WRIGHT MEDICAL GROUP, INC.
NOTES TO CONSOLIDATED FINANCIAL STATEMENTS
(continued)
(continued)
During 2009, we made payments for contingent consideration totaling $6.8 million, of which
$3.1 million was accrued as of December 31, 2008.
The components of our identifiable intangible assets are as follows (in thousands):
| December 31, 2009 | December 31, 2008 | |||||||||||||||
| Accumulated | Accumulated | |||||||||||||||
| Cost | Amortization | Cost | Amortization | |||||||||||||
Distribution channels |
$ | 22,207 | $ | 22,025 | $ | 21,625 | $ | 19,316 | ||||||||
Completed technology |
12,537 | 5,213 | 12,163 | 4,006 | ||||||||||||
Licenses |
7,245 | 3,777 | 6,301 | 3,504 | ||||||||||||
Customer relationships |
3,750 | 720 | 3,650 | 371 | ||||||||||||
Trademarks |
2,733 | 570 | 2,733 | 373 | ||||||||||||
Other |
2,620 | 1,060 | 3,360 | 1,172 | ||||||||||||
| 51,092 | $ | 33,365 | 49,832 | $ | 28,742 | |||||||||||
Less: Accumulated amortization |
(33,365 | ) | (28,742 | ) | ||||||||||||
Intangible assets, net |
$ | 17,727 | $ | 21,090 | ||||||||||||
Based on the intangible assets held at December 31, 2009, we expect to amortize approximately
$2.5 million in 2010, $2.3 million in 2011, $2.2 million in 2012, $1.9 million in 2013, and $1.7
million in 2014.
6. Accrued Expenses and Other Current Liabilities
Accrued expenses and other current liabilities consist of the following (in thousands):
| December 31 | ||||||||
| 2009 | 2008 | |||||||
Employee benefits |
$ | 11,327 | $ | 13,324 | ||||
Royalties |
5,900 | 6,336 | ||||||
Taxes other than income |
5,084 | 6,154 | ||||||
Commissions |
5,738 | 6,092 | ||||||
Professional and legal fees |
5,124 | 7,155 | ||||||
Contingent consideration |
1,912 | 3,065 | ||||||
Restructuring liability (see Note 14) |
6,781 | 4,950 | ||||||
Other |
12,777 | 12,171 | ||||||
| $ | 54,643 | $ | 59,247 | |||||
7. Long-Term Debt and Capital Lease Obligations
Long-term debt and capital lease obligations consist of the following (in thousands):
| December 31, | December 31, | |||||||
| 2009 | 2008 | |||||||
Capital lease obligations |
$ | 662 | $ | 261 | ||||
Convertible senior notes |
200,000 | 200,000 | ||||||
| 200,662 | 200,261 | |||||||
Less: current portion |
(336 | ) | (125 | ) | ||||
| $ | 200,326 | $ | 200,136 | |||||
66
Table of Contents
WRIGHT MEDICAL GROUP, INC.
NOTES TO CONSOLIDATED FINANCIAL STATEMENTS
(continued)
(continued)
In November 2007, we issued $200 million of Convertible Senior Notes due 2014. The notes will
mature on
December 1, 2014. The notes pay interest semiannually at an annual rate of 2.625% and are
convertible into shares of our common stock at an initial conversion rate of 30.6279 shares per
$1,000 principal amount of the notes, which represents a conversion price of $32.65 per share. The
holder of the notes may convert at any time on or prior to the close of business on the business
day immediately preceding the maturity date of notes. Beginning on December 6, 2011, we may redeem
the notes, in whole or in part, at a redemption price equal to 100% of the principal amount of the
notes, plus accrued and unpaid interest, if the closing price of our common stock has exceeded 140%
of the conversion price for at least 20 days during any consecutive 30-day trading period.
Additionally, if we experience a fundamental change event, as defined in the note agreement, the
holders may require us to purchase for cash all or a portion of the notes, for 100% of the
principal amount of the notes, plus accrued and unpaid interest. If upon a fundamental change
event, a holder elects to convert its notes, we may, under certain circumstances, increase the
conversion rate for the notes surrendered. The notes are unsecured obligations and are
subordinated to all existing and future secured debt, our revolving credit facility, and all
liabilities of our subsidiaries.
On December 31, 2009, our revolving credit facility had availability of $100 million, which can be
increased by up to an additional $50 million at our request and subject to the agreement of the
lenders. We currently have no borrowings outstanding under the credit facility. Borrowings under
the credit facility will bear interest at the sum of an annual base rate plus an applicable annual
rate that ranges from 0% to 1.75% depending on the type of loan and our consolidated leverage
ratio, with a current annual base rate of 3.25%. The term of the credit facility extends through
June 30, 2011.
As discussed in Note 4, we have acquired certain property and equipment pursuant to capital leases.
At December 31, 2009, future minimum lease payments under capital lease obligations, together with
the present value of the net minimum lease payments, are as follows (in thousands):
2010 |
$ | 352 | ||
2011 |
277 | |||
2012 |
45 | |||
2013 |
20 | |||
2014 |
8 | |||
Total minimum payments |
702 | |||
Less amount representing interest |
(40 | ) | ||
Present value of minimum lease payments |
662 | |||
Current portion |
(336 | ) | ||
Long-term portion |
$ | 326 | ||
8. Other Long-Term Liabilities
Other long-term liabilities consist of the following (in thousands):
| December 31 | ||||||||
| 2009 | 2008 | |||||||
Unrecognized tax benefits (See Note 9) |
$ | 2,786 | $ | 1,814 | ||||
Other |
1,650 | 3,137 | ||||||
| $ | 4,436 | $ | 4,951 | |||||
9. Income Taxes
The components of our income before income taxes are as follows (in thousands):
| Year Ended December 31, | ||||||||||||
| 2009 | 2008 | 2007 | ||||||||||
Domestic |
$ | 9,062 | $ | 3,036 | $ | 10,981 | ||||||
Foreign |
6,550 | 18,534 | (8,650 | ) | ||||||||
Income before income taxes |
$ | 15,612 | $ | 21,570 | $ | 2,331 | ||||||
67
Table of Contents
WRIGHT MEDICAL GROUP, INC.
NOTES TO CONSOLIDATED FINANCIAL STATEMENTS
(continued)
(continued)
The components of our provision for income taxes are as follows (in thousands):
| Year Ended December 31, | ||||||||||||
| 2009 | 2008 | 2007 | ||||||||||
Current provision (benefit): |
||||||||||||
Domestic: |
||||||||||||
Federal |
$ | 10,229 | $ | 3,192 | $ | 7,590 | ||||||
State |
1,003 | (720 | ) | 660 | ||||||||
Foreign |
1,453 | (2,880 | ) | 1,397 | ||||||||
Deferred (benefit) provision: |
||||||||||||
Domestic: |
||||||||||||
Federal |
(8,203 | ) | (2,812 | ) | (4,333 | ) | ||||||
State |
(1,162 | ) | (105 | ) | (329 | ) | ||||||
Foreign |
161 | 21,698 | (3,615 | ) | ||||||||
Total provision for income taxes |
$ | 3,481 | $ | 18,373 | $ | 1,370 | ||||||
A reconciliation of the statutory U.S. federal income tax rate to our effective income tax rate is
as follows:
| Year Ended December 31, | ||||||||||||
| 2009 | 2008 | 2007 | ||||||||||
Income tax provision at statutory rate |
35.0 | % | 35.0 | % | 35.0 | % | ||||||
State income taxes |
2.9 | (4.4 | ) | 12.2 | ||||||||
Stock-based compensation expense |
6.0 | 6.6 | 132.9 | |||||||||
Change in valuation allowance |
(6.0 | ) | 59.1 | (3.6 | ) | |||||||
Research and development credit |
(4.2 | ) | (8.5 | ) | (51.2 | ) | ||||||
Foreign income tax rate differences |
(9.8 | ) | (5.6 | ) | (70.0 | ) | ||||||
Non-taxable differences and other, net |
(1.6 | ) | 3.0 | 3.5 | ||||||||
Total |
22.3 | % | 85.2 | % | 58.8 | % | ||||||
68
Table of Contents
WRIGHT MEDICAL GROUP, INC.
NOTES TO CONSOLIDATED FINANCIAL STATEMENTS
(continued)
(continued)
The significant components of our deferred income taxes as of December 31, 2009 and 2008 are
as follows (in thousands):
| December 31, | ||||||||
| 2009 | 2008 | |||||||
Deferred tax assets: |
||||||||
Net operating loss carryforwards |
$ | 20,623 | $ | 22,667 | ||||
General business credit carryforward |
1,581 | 1,854 | ||||||
Reserves and allowances |
26,170 | 23,640 | ||||||
Stock-based compensation expense |
8,097 | 7,464 | ||||||
Amortization |
611 | 2,056 | ||||||
Other |
15,411 | 13,699 | ||||||
Valuation allowance |
(17,216 | ) | (18,512 | ) | ||||
Total deferred tax assets |
55,277 | 52,868 | ||||||
Deferred tax liabilities: |
||||||||
Depreciation |
7,357 | 9,121 | ||||||
Intangible assets |
3,186 | 4,237 | ||||||
Other |
4,836 | 6,794 | ||||||
Total deferred tax liabilities |
15,379 | 20,152 | ||||||
Net deferred tax assets |
$ | 39,898 | $ | 32,716 | ||||
Outside basis differences that have not been tax-effected in accordance with FASB ASC 740, are
primarily related to undistributed earnings of certain of our foreign subsidiaries. Deferred tax
liabilities for U.S. federal income taxes are not provided on the undistributed earnings of our
foreign subsidiaries that are considered permanently reinvested. The determination of the amount of
unrecognized deferred tax liabilities is not practicable.
At December 31, 2009, we had net operating loss carryforwards for U.S. federal income tax purposes
of approximately $10.7 million, which begin to expire in 2017. Additionally, we had general
business credit carryforwards of approximately $1.6 million, which expire beginning in 2010 and
extend through 2016. At December 31, 2009, we had foreign net operating loss carryforwards of
approximately $51.1 million, of which approximately $3.7 million expires beginning in 2010 and
extending through 2015.
Certain of our U.S. and foreign net operating losses and general business credit carryforwards are
subject to various limitations. We maintain valuation allowances for those net operating losses and
tax credit carryforwards that we do not expect to utilize due to these limitations and it is more
likely than not that such tax benefits will not be realized. In 2008, we recognized a tax provision
of $12.8 million to record a valuation allowance, primarily for deferred tax assets associated with
net operating losses in France. During 2009, we reduced our valuation allowance as a result of a
change in estimate regarding the jurisdiction where certain deductions would be recognized for tax
purposes.
Effective January 1, 2007, we adopted FASB Interpretation No. 48, Accounting for Uncertainty in
Income Taxes (FIN 48), which clarifies the accounting for uncertainty in income taxes recognized in
a company’s financial statements in accordance with SFAS No. 109, Accounting for Income Taxes, by
defining the criterion that an individual tax position must meet in order to be recognized in the
financial statements. FIN 48 requires that the tax effects of a position be recognized only if it
is “more-likely-than-not” to be sustained based solely on the technical merits as of the reporting
date. Effective July 1, 2009, this standard was incorporated into FASB ASC 740.
69
Table of Contents
WRIGHT MEDICAL GROUP, INC.
NOTES TO CONSOLIDATED FINANCIAL STATEMENTS
(continued)
(continued)
A reconciliation of the beginning and ending amount of unrecognized tax benefits is as
follows:
Balance at January 1, 2009 |
$ | 1,814 | ||
Additions for tax positions related to current year |
640 | |||
Additions for tax positions of prior years |
317 | |||
Reductions for tax positions of prior years |
(27 | ) | ||
Settlements |
— | |||
Foreign currency translation |
42 | |||
Balance at December 31, 2009 |
$ | 2,786 | ||
As of December 31, 2009, our liability for unrecognized tax benefits totaled $2.8 million and is
recorded in our consolidated balance sheet within “Other liabilities,” all of which, if recognized,
would affect our effective tax rate. Management does not believe that it is reasonably possible
that our unrecognized tax benefits will significantly change within the next twelve months.
FASB ASC 740 further requires that interest required to be paid by the tax law on the underpayment
of taxes should be accrued on the difference between the amount claimed or expected to be claimed
on the tax return and the tax benefit recognized in the financial statements. Management has made
the policy election to record this interest as interest expense. As of December 31, 2009, accrued
interest related to our unrecognized tax benefits totaled approximately $76,000 which is recorded
in our consolidated balance sheet within “Other liabilities.”
We file numerous consolidated and separate company income tax returns in the U.S. and in many
foreign jurisdictions, with the most significant foreign jurisdiction being France. We are no
longer subject to foreign income tax examinations by tax authorities in significant jurisdictions
for years before 2004. With few exceptions, we are subject to U.S. federal, state and local income
tax examinations for years 2006 through 2008. However, tax authorities have the ability to review
years prior to these to the extent that we utilize tax attributes carried forward from those prior
years.
10. Earnings Per Share
FASB ASC Section 260, Earnings Per Share, requires the presentation of basic and diluted earnings
per share. Basic earnings per share is calculated based on the weighted-average number of shares of
common stock outstanding during the period. Diluted earnings per share is calculated to include any
dilutive effect of our common stock equivalents. Our common stock equivalents consist of stock
options, non-vested shares of common stock, stock-settled phantom stock units, restricted stock
units, and convertible debt. The dilutive effect of the stock options, non-vested shares of common
stock, stock-settled phantom stock units, and restricted stock units is calculated using the
treasury-stock method. The dilutive effect of convertible debt is calculated by applying the
“if-converted” method. This assumes an add-back of interest, net of income taxes, to net income as
if the securities were converted at the beginning of the period. We determined that for the years
ended December 31, 2007, 2008, and 2009, the convertible debt had an anti-dilutive effect on
earnings per share and we therefore excluded it from the dilutive shares calculation.
70
Table of Contents
WRIGHT MEDICAL GROUP, INC.
NOTES TO CONSOLIDATED FINANCIAL STATEMENTS
(continued)
(continued)
The weighted-average number of common shares outstanding for basic and diluted earnings per
share purposes is as follows (in thousands):
| Year Ended December 31, | ||||||||||||
| 2009 | 2008 | 2007 | ||||||||||
Weighted-average number of common
shares outstanding — basic |
37,366 | 36,933 | 35,812 | |||||||||
Common stock equivalents |
77 | 468 | 671 | |||||||||
Weighted-average number of common
shares outstanding — diluted |
37,443 | 37,401 | 36,483 | |||||||||
The following potential common shares were excluded from the computation of diluted earnings per
share as their effect would have been anti-dilutive (in thousands):
| Year Ended December 31, | ||||||||||||
| 2009 | 2008 | 2007 | ||||||||||
Stock options |
3,872 | 2,604 | 3,328 | |||||||||
Non-vested shares, restricted stock
units, and stock-settled phantom
stock units |
1,151 | 502 | 43 | |||||||||
Convertible debt |
6,126 | 6,126 | 6,126 | |||||||||
11. Capital Stock
We are authorized to issue up to 100,000,000 shares of voting common stock. We have 61,331,118
shares of voting common stock available for future issuance at December 31, 2009.
12. Stock-Based Compensation Plans
We have three stock-based compensation plans which are described below. Amounts recognized in the
consolidated financial statements with respect to these plans are as follows:
| Year Ended December 31, | ||||||||||||
| 2009 | 2008 | 2007 | ||||||||||
Total cost of share-based payment plans |
$ | 13,267 | $ | 13,223 | $ | 16,425 | ||||||
Amounts capitalized as inventory and intangible assets |
(1,361 | ) | (1,492 | ) | (2,262 | ) | ||||||
Amortization of capitalized amounts |
1,285 | 1,770 | 2,369 | |||||||||
Charged against income before income taxes |
13,191 | 13,501 | 16,532 | |||||||||
Amount of related income tax benefit recognized in
income |
(3,901 | ) | (3,674 | ) | (3,665 | ) | ||||||
Impact to net income |
$ | 9,290 | $ | 9,827 | $ | 12,867 | ||||||
Impact to basic earnings per share |
$ | 0.25 | $ | 0.27 | $ | 0.36 | ||||||
Impact to diluted earnings per share |
$ | 0.25 | $ | 0.26 | $ | 0.35 | ||||||
As of December 31, 2009, we had $22.9 million of total unrecognized compensation cost related to
unvested stock-based compensation arrangements granted to employees. That cost is expected to be
recognized over a weighted-average period of 2.6 years.
Equity Incentive Plan. On December 7, 1999, we adopted the 1999 Equity Incentive Plan, which was
subsequently amended and restated on July 6, 2001, May 13, 2003, May 13, 2004, May 12, 2005 and May
14, 2008 and amended on October 23, 2008. The 1999 Equity Incentive Plan expired December 7, 2009.
The 2009 Equity Incentive Plan (the Plan), was adopted on May 13, 2009. The Plan authorizes us to
grant stock options and other stock-based awards, such as non-vested shares of common stock, with
respect to up to 11,217,051 shares of common stock, of
71
Table of Contents
WRIGHT MEDICAL GROUP, INC.
NOTES TO CONSOLIDATED FINANCIAL STATEMENTS
(continued)
(continued)
which full value awards (such as non-vested shares) are limited to 2,029,555 shares.
Pursuant to award agreements, under the Plan, a majority of options to purchase common stock,
non-vested shares of common stock, restricted stock units, and stock settled phantom stock units
under the 1999 Equity Incentive Plan generally are exercisable in increments of 25% annually on
each of the first through fourth anniversaries of the date of grant. These awards are recognized on
a straight-line basis over the requisite service period, which is generally four years. As of
December 31, 2009, there were 1,024,485 shares available for future issuance under the Plan, of
which full value awards are limited to 414,124 shares.
Stock options
We estimate the fair value of stock options using the Black-Scholes valuation model. The
Black-Scholes option-pricing model requires the input of estimates, including the expected life of
stock options, expected stock price volatility, the risk-free interest rate and the expected
dividend yield. The expected life of options is estimated by calculating the average of the vesting
term and the contractual term of the option, as allowed in SEC Staff Accounting Bulletin No. 107.
The expected stock price volatility assumption was estimated based upon historical volatility of
our common stock. The risk-free interest rate was determined using U.S. Treasury rates where the
term is consistent with the expected life of the stock options. Expected dividend yield is not
considered as we have never paid dividends and have no plans of doing so in the future. We are
required to estimate forfeitures at the time of grant and revise those estimates in subsequent
periods if actual forfeitures differ from those estimates. We use historical data to estimate
pre-vesting forfeitures and record stock-based compensation expense only for those awards that are
expected to vest. The fair value of stock options is amortized on a straight-line basis over the
respective requisite service period, which is generally the vesting period.
The weighted-average grant date fair value of stock options granted to employees in 2009, 2008, and
2007 was $6.23 per share, $11.17 per share, and $11.30 per share, respectively. The fair value of
each option grant is estimated on the date of grant using the Black-Scholes option valuation model
using the following assumptions:
| Year Ended December 31, | ||||||
| 2009 | 2008 | 2007 | ||||
Risk-free interest rate |
2.1% - 2.6% | 2.0% - 3.4% | 3.9% - 4.8% | |||
Expected option life |
6 years | 6 years | 6 years | |||
Expected price volatility |
39% | 36% | 39% | |||
A summary of our stock option activity during 2009 is as follows:
| Weighted- | Aggregate | |||||||||||||||
| Weighted- | Average | Intrinsic | ||||||||||||||
| Shares | Average | Remaining | Value* | |||||||||||||
| (000’s) | Exercise Price | Contractual Life | ($000’s) | |||||||||||||
Outstanding at December 31, 2008 |
4,046 | $ | 24.32 | |||||||||||||
Granted |
295 | 15.72 | ||||||||||||||
Exercised |
(38 | ) | 8.14 | |||||||||||||
Forfeited or expired |
(338 | ) | 24.77 | |||||||||||||
Outstanding at December 31, 2009 |
3,965 | $ | 23.79 | 5.9 years | $ | 2,228 | ||||||||||
Exercisable at December 31, 2009 |
2,934 | $ | 24.32 | 5.1 years | $ | 1,233 | ||||||||||
| * | The aggregate intrinsic value is calculated as the difference between the market value of our common stock as of December 31, 2009, and the exercise price of the shares. The market value as of December 31, 2009 is $18.94 |
72
Table of Contents
WRIGHT MEDICAL GROUP, INC.
NOTES TO CONSOLIDATED FINANCIAL STATEMENTS
(continued)
(continued)
| per share, which is the closing sale price of our common stock reported for transactions effected on the Nasdaq Global Select Market on December 31, 2009. |
The total intrinsic value of options exercised during 2009, 2008, and 2007 was $371,000, $5.9
million, and $17.3 million, respectively.
A summary of our stock options outstanding and exercisable at December 31, 2009, is as follows
(shares in thousands):
| Options Outstanding | Options Exercisable | |||||||||||||||||||
| Weighted | Weighted | |||||||||||||||||||
| Weighted-Average | -Average | -Average | ||||||||||||||||||
| Number | Remaining | Exercise | Number | Exercise | ||||||||||||||||
| Range of Exercise Prices | Outstanding | Contractual Life | Price | Exercisable | Price | |||||||||||||||
$0.00 — $8.50 |
63 | 0.5 years | $ | 5.28 | 63 | $ | 5.28 | |||||||||||||
$8.51 — $16.00 |
275 | 8.7 years | 15.43 | 27 | 15.01 | |||||||||||||||
$16.01 — $24.00 |
1,547 | 6.0 years | 20.80 | 1,183 | 20.89 | |||||||||||||||
$24.01 — $35.87 |
2,080 | 5.6 years | 27.69 | 1,661 | 27.64 | |||||||||||||||
| 3,965 | 5.9 years | $ | 23.79 | 2,934 | $ | 24.32 | ||||||||||||||
Non-vested shares
We calculate the grant date fair value of non-vested shares of common stock using the closing
sale prices on the trading day immediately prior to the grant date. We are required to
estimate forfeitures at the time of grant and revise those estimates in subsequent periods if
actual forfeitures differ from those estimates. We use historical data to estimate pre-vesting
forfeitures and record stock-based compensation expense only for those awards that are
expected to vest.
We granted 700,000, 526,000, and 409,000 non-vested shares of common stock to employees with
weighted-average grant-date fair values of $15.56 per share, $28.15 per share, and $24.32 per
share during 2009, 2008, and 2007, respectively. The fair value of these shares will be
recognized on a straight-line basis over the respective requisite service period, which is
generally the vesting period.
During both 2009 and 2008, we granted certain independent distributors and other non-employees
non-vested shares of common stock of 18,000 and 27,000 shares at a weighted-average grant date fair
values of $16.76 per share and $26.49 per share, respectively.
73
Table of Contents
WRIGHT MEDICAL GROUP, INC.
NOTES TO CONSOLIDATED FINANCIAL STATEMENTS
(continued)
(continued)
A summary of our non-vested shares of common stock activity during 2009 is as follows:
| Weighted- | Aggregate | |||||||||||
| Average | Intrinsic | |||||||||||
| Shares | Grant-Date | Value* | ||||||||||
| (000’s) | Fair Value | ($000’s) | ||||||||||
Non-vested at December 31, 2008 |
796 | $ | 26.75 | |||||||||
Granted |
718 | 15.59 | ||||||||||
Vested |
(216 | ) | 26.54 | |||||||||
Forfeited |
(137 | ) | 25.42 | |||||||||
Non-vested at December 31, 2009 |
1,161 | $ | 20.07 | $ | 21,983 | |||||||
| * | The aggregate intrinsic value is calculated as the market value of our common stock as of December 31, 2009. The market value as of December 31, 2009 is $18.94 per share, which is the closing sale price of our common stock reported for transactions effected on the Nasdaq Global Select Market on December 31, 2009. |
The total fair value of shares vested during 2009 and 2008 was $4.1 million and $2.6 million,
respectively.
Stock settled phantom stock units and restricted stock units
We calculate the grant date fair value of stock settled phantom stock units and restricted stock
units using the closing sale prices on the trading day immediately prior to the grant date. We
are required to estimate forfeitures at the time of the grant and revise those estimates in
subsequent periods if actual forfeitures differ from those estimates. We use historical data
to estimate pre-vesting forfeitures and record stock-based compensation expense only for those
awards that are expected to vest.
During 2009, we granted 86,000 stock settled phantom stock units and restricted stock units to
employees with a weighted-average fair value of $15.44 per share. The fair value of these
shares will be recognized on a straight-line basis over the respective requisite service
period, which is generally the vesting period.
A summary of our non-vested shares of common stock activity during 2009 is as follows:
| Weighted- | Aggregate | |||||||||||
| Average | Intrinsic | |||||||||||
| Shares | Grant-Date | Value* | ||||||||||
| (000’s) | Fair Value | ($000’s) | ||||||||||
Stock settled phantom stock
and restricted stock units at
December 31, 2008 |
— | $ | — | |||||||||
Granted |
135 | 20.21 | ||||||||||
Vested |
(12 | ) | 28.34 | |||||||||
Forfeited |
(13 | ) | 16.65 | |||||||||
Non-vested at December 31, 2009 |
110 | $ | 19.75 | $ | 2,078 | |||||||
| * | The aggregate intrinsic value is calculated as the market value of our common stock as of December 31, 2009. The market value as of December 31, 2009 is $18.94 per share, which is the closing sale price of our common stock reported for transactions effected on the Nasdaq Global Select Market on December 31, 2009. |
The total fair value of shares vested during 2009 was $236,000.
Employee Stock Purchase Plan. On May 30, 2002, our shareholders approved and adopted the 2002
Employee Stock Purchase Plan (the ESPP). The ESPP authorizes us to issue up to 200,000 shares of
common stock to our employees who work at least 20 hours per week. Under the ESPP, there are two
six-month plan periods during each calendar
74
Table of Contents
WRIGHT MEDICAL GROUP, INC.
NOTES TO CONSOLIDATED FINANCIAL STATEMENTS
(continued)
(continued)
year, one beginning January 1 and ending on June 30, and the other beginning July 1 and ending
on December 31. Under the terms of the ESPP, employees can choose each plan period to have up to 5%
of their annual base earnings, limited to $5,000, withheld to purchase our common stock. The
purchase price of the stock is 85 percent of the lower of its beginning-of-period or end-of-period
market price. Under the ESPP, we sold to employees approximately 27,000, 15,000, and 11,000 shares
in 2009, 2008, and 2007, respectively, with weighted-average fair values of $5.76, $9.09, and $7.73
per share, respectively. As of December 31, 2009, there were 97,356 shares available for future
issuance under the ESPP. During 2009, 2008, and 2007, we recorded nominal amounts of non-cash,
stock-based compensation expense related to the ESPP.
In applying the Black-Scholes methodology to the purchase rights granted under the ESPP, we used
the following assumptions:
| Year Ended December 31, | ||||||
| 2009 | 2008 | 2007 | ||||
Risk-free interest rate |
0.9% - 1.1% | 2.9% - 3.3% | 4.6% - 4.8% | |||
Expected option life |
6 months | 6 months | 6 months | |||
Expected price volatility |
39% | 36% | 39% | |||
13. Employee Benefit Plans
We sponsor a defined contribution plan under Section 401(k) of the Internal Revenue Code, which
covers U.S. employees who are 21 years of age and over. Under this plan, we match voluntary
employee contributions at a rate of 100% for the first 2% of an employee’s annual compensation and
at a rate of 50% for the next 2% of an employee’s annual compensation. Employees vest in our
contributions after three years of service. Our expense related to the plan was $1.6 million, $1.4
million, and $1.2 million in 2009, 2008, and 2007, respectively.
14. Restructuring
Toulon, France
In June 2007, we announced plans to close our manufacturing, distribution and administrative
facility located in Toulon, France. The facility’s closure affected approximately 130 Toulon-based
employees. The majority of our restructuring activities were complete by the end of 2007, with
production now conducted solely in our existing manufacturing facility in Arlington, Tennessee and
the distribution activities being carried out from our European headquarters in Amsterdam, the
Netherlands.
Management estimates that the pre-tax restructuring charges will total approximately $28 million to
$30 million. These charges consist of the following estimates:
| • | $14 million for severance and other termination benefits; | ||
| • | $3 million of non-cash asset impairments of property, plant and equipment; | ||
| • | $2 million of inventory write-offs and manufacturing period costs; | ||
| • | $3 million to $4 million of external legal and professional fees; and | ||
| • | $6 million to $7 million of other cash and non-cash charges (including employee litigation). |
75
Table of Contents
WRIGHT MEDICAL GROUP, INC.
NOTES TO CONSOLIDATED FINANCIAL STATEMENTS
(continued)
(continued)
Charges associated with the restructuring are presented in the following table. All of the
following amounts were recognized within “Restructuring charges” in our consolidated statement of
operations, with the exception of the inventory write-offs and manufacturing period costs, which
were recognized within “Cost of sales — restructuring.”
| Cumulative | ||||||||
| Year Ended | Charges as of | |||||||
| (in thousands) | December 31, 2009 | December 31, 2009 | ||||||
Severance and other termination benefits |
$ | (43 | ) | $ | 13,550 | |||
Employee litigation accrual |
887 | 5,048 | ||||||
Asset impairment charges |
— | 3,093 | ||||||
Inventory write-offs and manufacturing
period costs |
— | 2,139 | ||||||
Legal/professional fees |
648 | 3,017 | ||||||
Other |
(29 | ) | 194 | |||||
Total restructuring charges |
$ | 1,463 | $ | 27,041 | ||||
As a result of the plans to close the facilities in 2007, we performed an evaluation of the
undiscounted future cash flows of the related asset group and recorded an impairment charge in 2007
for the difference between the net book value of the assets and their estimated fair values for
those assets we intended to sell. In April 2008, these assets were sold. We also recorded an
impairment charge in 2007 for assets to be abandoned.
Activity in the restructuring liability for the year ended December 31, 2009 is presented in the
following table (in thousands):
Beginning balance as of December 31, 2008 |
$ | 4,950 | ||
Charges: |
||||
Severance and other termination benefits |
(43 | ) | ||
Litigation accrual |
887 | |||
Legal/professional fees |
648 | |||
Other |
(29 | ) | ||
Total accruals |
$ | 1,463 | ||
Payments: |
||||
Severance and other termination benefits |
(738 | ) | ||
Litigation |
(181 | ) | ||
Legal/professional fees |
(604 | ) | ||
Other |
(44 | ) | ||
Total payments |
$ | (1,567 | ) | |
Changes in foreign currency translation |
118 | |||
Restructuring liability at December 31, 2009 |
$ | 4,964 | ||
In connection with the closure of our Toulon, France facility, 103 of our former employees have
filed claims to
challenge the economic justification for their dismissal. To date, we have received judgments for
86 of those claims, the substantial majority of which were unfavorable to us. All of these
judgments have been appealed, or are expected to be appealed, by both parties. Management has
estimated the probable liability upon the ultimate resolution of these 103 claims to be $4.6
million, and has therefore recorded this amount as a liability within “Accrued expenses and other
current liabilities” in our consolidated balance sheet as of December 31, 2009.
76
Table of Contents
WRIGHT MEDICAL GROUP, INC.
NOTES TO CONSOLIDATED FINANCIAL STATEMENTS
(continued)
(continued)
Creteil, France
In October 2009, we announced plans to close our distribution and finance support office in
Creteil, France, in order to migrate all relevant French distribution and support functions into
our European organization based out of our European headquarters in Amsterdam, the Netherlands.
Management estimates that the pre-tax restructuring charges will total approximately $3 million to
$4 million. These charges consist of the following estimates:
| • | $1.0 million to $1.5 million for severance and other termination benefits; | ||
| • | $1.0 million to $1.5 million for contract termination charges; | ||
| • | $0.5 million of external legal and professional fees; and | ||
| • | $0.5 million of other restructuring related costs. |
Charges associated with the restructuring are presented in the following table. All of the
following amounts were recognized within “Restructuring charges” in our consolidated statement of
operations.
| Year Ended | ||||
| (in thousands) | December 31, 2009 | |||
Severance and other termination benefits |
$ | 824 | ||
Contract termination costs |
995 | |||
Legal/professional fees |
262 | |||
Total restructuring charges |
$ | 2,081 | ||
Activity in the restructuring liability for the year ended December 31, 2009 is presented in the
following table (in thousands):
Beginning balance as of December 31, 2008 |
$ | — | ||
Charges: |
||||
Severance and other termination benefits |
824 | |||
Contract termination costs |
995 | |||
Legal/professional fees |
262 | |||
Total accruals |
$ | 2,081 | ||
Payments: |
||||
Severance and other termination benefits |
(137 | ) | ||
Contract termination costs |
(9 | ) | ||
Legal/professional fees |
(118 | ) | ||
| $ | (264 | ) | ||
Restructuring liability at December 31, 2009 |
$ | 1,817 | ||
77
Table of Contents
WRIGHT MEDICAL GROUP, INC.
NOTES TO CONSOLIDATED FINANCIAL STATEMENTS
(continued)
(continued)
15. Commitments and Contingencies
Operating Leases. We lease certain equipment and office space under non-cancelable operating
leases. Rental expense under operating leases approximated $11.0 million, $10.1 million, and $9.7
million for the years ended December 31, 2009, 2008, and 2007, respectively. Future minimum
payments, by year and in the aggregate, under non-cancelable operating leases with initial or
remaining lease terms of one year or more, are as follows at December 31, 2009 (in thousands):
2010 |
$ | 9,286 | ||
2011 |
5,325 | |||
2012 |
2,562 | |||
2013 |
372 | |||
2014 |
136 | |||
Thereafter |
111 | |||
| $ | 17,792 | |||
Royalty and Consulting Agreements. We have entered into various royalty and other consulting
agreements with third party consultants. We incurred royalty and consulting expenses of $238,000,
$475,000, and $455,000 during the years ended December 31, 2009, 2008, and 2007, respectively,
under non-cancelable contracts with minimum obligations that were contingent upon services. The
amounts in the table below represent minimum payments to consultants that are contingent upon
future services. These fees are accrued when it is deemed probable that the performance thresholds
are met. Future minimum payments under these agreements for which we have not recorded a liability
are as follows at December 31, 2009 (in thousands):
2010 |
$ | 242 | ||
2011 |
242 | |||
2012 |
242 | |||
2013 |
187 | |||
2014 |
187 | |||
Thereafter |
270 | |||
| $ | 1,370 | |||
Purchase Obligations. We have entered into certain supply agreements for our products, which
include minimum purchase obligations. During the years ended December 31, 2009, 2008, and 2007, we
paid approximately $3.1 million, $4.5 million, and $2.3 million, respectively, under those supply
agreements. Our remaining purchase obligations under those supply agreements are as follows at
December 31, 2009 (in thousands):
2010 |
$ | 2,543 | ||
2011 |
2,543 | |||
| $ | 5,086 | |||
Portions of our payments for operating leases, royalty and consulting agreements are denominated in
foreign currencies and were translated in the tables above based on their respective U.S. dollar
exchange rates at December 31, 2009. These future payments are subject to foreign currency exchange
rate risk.
Legal Proceedings. In 2000, Howmedica Osteonics Corp. (Howmedica), a subsidiary of Stryker
Corporation, filed a lawsuit against us in the United States District Court for the District of New
Jersey (District Court) alleging that we infringed Howmedica’s U.S. Patent No. 5,824,100 related to
our ADVANCE® knee product line. The lawsuit
seeks an order of infringement, injunctive relief, unspecified damages, and various other costs and
relief and could impact a substantial portion of our knee product line. We believe, however, that
we have strong defenses
78
Table of Contents
WRIGHT MEDICAL GROUP, INC.
NOTES TO CONSOLIDATED FINANCIAL STATEMENTS
(continued)
(continued)
against Howmedica’s claims and are vigorously defending this lawsuit. In November 2005, the
District Court issued a Markman ruling on claim construction. Howmedica conceded to the District
Court that, if the claim construction as issued was applied to our knee product line, our products
do not infringe their patent. Howmedica appealed the Markman ruling. In September 2008, the U.S.
Court of Appeals for the Federal Circuit (Federal Circuit) overturned the District Court’s Markman
ruling on claim construction. The case was remanded to the District Court for further proceedings
on alleged infringement and on our affirmative defenses, which include patent invalidity and
unenforceability. In 2009, we received a favorable ruling from the District Court ruling that
Howmedica’s asserted patent is invalid. However, Howmedica has the right to appeal the decision to
the Federal Circuit. The judge has determined to also rule on our defense regarding patent
unenforceability before Howmedica will be allowed to appeal. No provision has been made for this
contingency as of December 31, 2009. These claims are covered in part by our patent infringement
insurance. Management does not believe that the outcome of this lawsuit will have a material
adverse effect on our consolidated financial position or results of operations.
We are involved in separate disputes in Italy with a former agent and two former employees.
Management believes that we have meritorious defenses to the claims related to these disputes. The
payment of any amount related to these disputes is not probable and cannot be estimated at this
time. Accordingly, no provisions have been made for these matters as of December 31, 2009.
In December 2007, we received a subpoena from the U.S. Department of Justice (DOJ) through the U.S.
Attorney for the District of New Jersey requesting documents for the period January 1998 through
the present related to any consulting and professional service agreements with orthopaedic surgeons
in connection with U.S. hip or knee joint replacement procedures or products. This subpoena was
served shortly after several of our knee and hip competitors agreed to resolutions with the DOJ
after being subjects of investigation involving the same subject matter. We are cooperating fully
with the DOJ’s investigation, and we anticipate that we will continue to incur significant expenses
related to this investigation. The conclusion of the investigation could result in sanctions
requiring the payment of criminal fines, civil fines, and/or settlement amounts. We cannot estimate
what, if any, impact any results from this investigation could have on our consolidated results of
operations or financial position.
In June 2008, we received a letter from the Securities and Exchange Commission (SEC) informing us
that it is conducting an informal investigation regarding potential violations of the Foreign
Corrupt Practices Act in the sale of medical devices in a number of foreign countries by companies
in the medical device industry. We understand that several other medical device companies have
received similar letters. We are cooperating fully with the SEC’s request. We cannot estimate what,
if any, impact any results from this inquiry could have on our consolidated results of operations
or financial position.
One of our insurers has reserved the right to recover from us up to approximately $10.5 million
paid by the insurer for the settlements of 33 product liability lawsuits in West Virginia during
2009. We believe that an ultimate unfavorable resolution of this matter is not probable; therefore,
no provision has been made for any claim by our insurer as of the date of this report.
We have a dispute with a former distributor in Belgium claiming damages of approximately $12.6
million. The case was pleaded during the first quarter of 2010. In January 2010, the former
distributor was awarded approximately $80,000, for which we have included a provision in our
consolidated balance sheet as of December 31, 2009. The former distributor does have the right to
appeal this decision. Management believes we have strong defenses against these claims and is
vigorously contesting the allegations; thus, we do not believe the results of this decision will
have a material impact on the Company’s consolidated financial position or results of operations.
79
Table of Contents
WRIGHT MEDICAL GROUP, INC.
NOTES TO CONSOLIDATED FINANCIAL STATEMENTS
(continued)
(continued)
Other. As of December 31, 2009, the trade receivable balance due from our stocking distributor in
Turkey was $10.7 million, of which a significant portion is past due. We have recorded a reserve of
$5.6 million against this balance as of December 31, 2009. It is possible that the future
realization of this accounts receivable balance could be less than the remaining unreserved balance
of $5.1 million.
In addition to those noted above, we are subject to various other legal proceedings, product
liability claims and other matters which arise in the ordinary course of business. In the opinion
of management, the amount of liability, if any, with respect to these matters, will not materially
affect our consolidated results of operations or financial position.
16. Segment Data
We have one reportable segment, orthopaedic products, which includes the design, manufacture and
marketing of devices and biologic products for extremity, hip, and knee repair and reconstruction.
Our geographic regions consist of the United States, Europe (which includes the Middle East and
Africa) and Other (which principally represents Latin America, Asia and Canada). Long-lived assets
are those assets located in each region. Revenues attributed to each region are based on the
location in which the products were sold.
Net sales of orthopaedic products by product line and information by geographic region are as
follows (in thousands):
| Year Ended December 31, | ||||||||||||
| 2009 | 2008 | 2007 | ||||||||||
Net sales by product line: |
||||||||||||
Hip products |
$ | 167,869 | $ | 160,788 | $ | 134,251 | ||||||
Knee products |
122,178 | 119,895 | 102,334 | |||||||||
Extremity products |
107,375 | 88,890 | 62,302 | |||||||||
Biologics products |
79,120 | 82,399 | 76,029 | |||||||||
Other |
10,966 | 13,575 | 11,934 | |||||||||
Total net sales |
$ | 487,508 | $ | 465,547 | $ | 386,850 | ||||||
Net sales by geographic region: |
||||||||||||
United States |
$ | 299,587 | $ | 282,081 | $ | 235,748 | ||||||
Europe |
102,379 | 112,771 | 96,336 | |||||||||
Other |
85,542 | 70,695 | 54,766 | |||||||||
Total |
$ | 487,508 | $ | 465,547 | $ | 386,850 | ||||||
Operating income (loss) by geographic region: |
||||||||||||
United States |
$ | 16,268 | $ | 21,546 | $ | 13,911 | ||||||
Europe |
(11,683 | ) | (14,909 | ) | (22,835 | ) | ||||||
Other |
19,366 | 15,776 | 10,378 | |||||||||
Total |
$ | 23,951 | $ | 22,413 | $ | 1,454 | ||||||
| December 31, | ||||||||
| 2009 | 2008 | |||||||
Long-lived assets: |
||||||||
United States |
$ | 108,389 | $ | 104,058 | ||||
Europe |
17,510 | 18,192 | ||||||
Other |
13,809 | 11,401 | ||||||
Total |
$ | 139,708 | $ | 133,651 | ||||
80
Table of Contents
WRIGHT MEDICAL GROUP, INC.
NOTES TO CONSOLIDATED FINANCIAL STATEMENTS
(continued)
(continued)
No single foreign country accounted for more than 10% of our total net sales during 2009,
2008, or 2007; however, our subsidiary in Japan represented approximately 10%, 8%, and 7% of our
total net sales in 2009, 2008, and 2007, respectively.
During 2009, 2008 and 2007, our operating income included restructuring charges associated with the
closure of our facility in Toulon, France. During 2009 our operating income also included
restructuring charges associated with the closure of our facility in Creteil, France. Our U.S.
region recognized $3.3 million, $1.6 million and $2.5 million of restructuring charges in 2009,
2008 and 2007, respectively, and our European region recognized $279,000, $5.1 million and $16.4
million of restructuring charges in 2009, 2008 and 2007, respectively. Additionally, in 2009 and
2008, our U.S. region recognized $7.8 million and $7.6 million of charges related to the ongoing
U.S. government inquiries. In 2009, our European region recognized a provision of $5.6 million
related to the trade receivable balance of our stocking distributor in Turkey. In 2008, our U.S.
region recognized $2.5 million of acquired in-process research and development costs related to our
Inbone acquisition and $2.6 million related to an unfavorable appellate court decision. In 2007,
our U.S. region recognized a $3.3 million charge as a result of an unfavorable ruling under binding
arbitration.
17. Quarterly Results of Operations (unaudited):
The following table presents a summary of our unaudited quarterly operating results for each of the
four quarters in 2009 and 2008, respectively (in thousands). This information was derived from
unaudited interim financial statements that, in the opinion of management, have been prepared on a
basis consistent with the financial statements contained elsewhere in this filing and include all
adjustments, consisting only of normal recurring adjustments, necessary for a fair statement of
such information when read in conjunction with our audited financial statements and related notes.
The operating results for any quarter are not necessarily indicative of results for any future
period.
81
Table of Contents
WRIGHT MEDICAL GROUP, INC.
NOTES TO CONSOLIDATED FINANCIAL STATEMENTS
(continued)
(continued)
| 2009 | ||||||||||||||||
| First | Second | Third | Fourth | |||||||||||||
| Quarter | Quarter | Quarter | Quarter | |||||||||||||
Net sales |
$ | 120,912 | $ | 118,926 | $ | 117,742 | $ | 129,928 | ||||||||
Cost of sales |
38,021 | 36,745 | 35,880 | 38,069 | ||||||||||||
Gross profit |
82,891 | 82,181 | 81,862 | 91,859 | ||||||||||||
Operating expenses: |
||||||||||||||||
Selling, general and administrative |
66,609 | 65,821 | 63,703 | 74,323 | ||||||||||||
Research and development |
8,906 | 9,017 | 8,537 | 9,231 | ||||||||||||
Amortization of intangible assets |
1,317 | 1,308 | 1,274 | 1,252 | ||||||||||||
Restructuring charges |
66 | 794 | 131 | 2,553 | ||||||||||||
Total operating expenses |
76,898 | 76,940 | 73,645 | 87,359 | ||||||||||||
Operating income |
$ | 5,993 | $ | 5,241 | $ | 8,217 | $ | 4,500 | ||||||||
Net income |
$ | 3,317 | $ | 2,427 | $ | 4,152 | $ | 2,235 | ||||||||
Net income per share, basic |
$ | 0.09 | $ | 0.07 | $ | 0.11 | $ | 0.06 | ||||||||
Net income per share, diluted |
$ | 0.09 | $ | 0.06 | $ | 0.11 | $ | 0.06 | ||||||||
| 2008 | ||||||||||||||||
| First | Second | Third | Fourth | |||||||||||||
| Quarter | Quarter | Quarter | Quarter | |||||||||||||
Net sales |
$ | 115,865 | $ | 118,477 | $ | 111,096 | $ | 120,109 | ||||||||
Cost of sales |
32,438 | 34,811 | 32,038 | 35,090 | ||||||||||||
Gross profit |
83,427 | 83,666 | 79,058 | 85,019 | ||||||||||||
Operating expenses: |
||||||||||||||||
Selling, general and administrative |
66,589 | 68,875 | 61,897 | 64,035 | ||||||||||||
Research and development |
7,999 | 8,378 | 8,338 | 8,577 | ||||||||||||
Amortization of intangible assets |
1,041 | 1,276 | 1,287 | 1,270 | ||||||||||||
Restructuring charges |
1,815 | 3,095 | 685 | 1,110 | ||||||||||||
Acquired in-process research
and development |
— | 2,490 | — | — | ||||||||||||
Total operating expenses |
77,444 | 84,114 | 72,207 | 74,992 | ||||||||||||
Operating income |
$ | 5,983 | $ | (448 | ) | $ | 6,851 | $ | 10,027 | |||||||
Net income |
$ | 4,058 | $ | (2,357 | ) | $ | 4,187 | $ | (2,691 | ) | ||||||
Net income per share, basic |
$ | 0.11 | $ | (0.06 | ) | $ | 0.11 | $ | (0.07 | ) | ||||||
Net income per share, diluted |
$ | 0.11 | $ | (0.06 | ) | $ | 0.11 | $ | (0.07 | ) | ||||||
Our operating income included charges related to the ongoing U.S. government inquiries, for
which we recognized $4.1 million, $2.0 million, and $1.6 million during the first, second, and
third quarters of 2009, respectively. A minimal amount was recognized in the fourth quarter of
2009. In addition, our operating income during the fourth quarter of 2009 included $2.1 million of
restructuring charges related to the closure of our office in Creteil, France, $2.6 million of
charges related to the write-off of CTA balances from three foreign subsidiaries following their
substantially complete liquidation (see Note 2), and a $5.6 million provision for the trade
receivable balance from our stocking distributor in Turkey. Net income in 2009 included the
after-tax effect of these amounts.
82
Table of Contents
WRIGHT MEDICAL GROUP, INC.
NOTES TO CONSOLIDATED FINANCIAL STATEMENTS
(continued)
(continued)
Our operating income in 2008 included charges related to the ongoing U.S. government inquiries, for
which we recognized $1.7 million, $1.5 million, $1.5 million and $2.9 million during the first,
second, third and fourth quarters of 2008, respectively. In addition, our operating income during
the second quarter of 2008 included charges of $2.6 million related to an unfavorable appellate
court decision and $2.5 million of acquired in-process research and development costs related to
our Inbone acquisition. Net income in 2008 included the after-tax effect of these amounts.
Additionally, our fourth quarter 2008 net income included a $12.8 million charge for our valuation
allowance, primarily for deferred tax assets associated with French net operating losses.
83
Table of Contents
| Item 9. | Changes in and Disagreements with Accountants on Accounting and Financial Disclosure. |
Not applicable.
| Item 9A. | Controls and Procedures. |
Evaluation of Disclosure Controls and Procedures
We have established disclosure controls and procedures, as such term is defined in Rule 13a-15(e)
under the Securities Exchange Act of 1934. Our disclosure controls and procedures are designed to
ensure that material information relating to us, including our consolidated subsidiaries, is made
known to our principal executive officer and principal financial officer by others within our
organization. Under the supervision and with the participation of our management, including our
principal executive officer and principal financial officer, we conducted an evaluation of the
effectiveness of our disclosure controls and procedures as of December 31, 2009 to ensure that the
information required to be disclosed by us in the reports that we file or submit under the
Securities Exchange Act of 1934 is recorded, processed, summarized, and reported within the time
periods specified in the SEC’s rules and forms. Disclosure controls and procedures include, without
limitation, controls and procedures designed to ensure that information required to be disclosed by
us in the reports that we file or submit under the Securities Exchange Act of 1934 is accumulated
and communicated to our management, including our principal executive officer and principal
financial officer as appropriate, to allow timely decisions regarding required disclosure. Based on
this evaluation, our principal executive officer and principal financial officer concluded that our
disclosure controls and procedures were effective as of December 31, 2009.
Management’s Annual Report on Internal Control Over Financial Reporting
Our management is responsible for establishing and maintaining adequate internal control over
financial reporting. Under the supervision and with the participation of our management, including
our principal executive officer and principal financial officer, we conducted an evaluation of the
effectiveness of our internal control over financial reporting as of December 31, 2009, based on
the criteria established in Internal Control — Integrated Framework issued by the Committee of
Sponsoring Organizations of the Treadway Commission (COSO). Based on this evaluation, our
management concluded that our internal control over financial reporting was effective as of
December 31, 2009. Our internal control over financial reporting as of December 31, 2009, has been
audited by KPMG LLP, an independent registered public accounting firm, as stated in their report
which is included herein.
Changes in Internal Control Over Financial Reporting
During the twelve months ended December 31, 2009, we implemented a new sales and inventory system
within our Japanese operations. This event represented a change that has materially affected our
internal control over financial reporting. Accordingly, under the supervision and with the
participation of our management, including our principal executive officer and principal financial
officer, we conducted an evaluation of this change in internal control over financial reporting.
Based on this evaluation, our management concluded that this change did not diminish the design of
our internal control over financial reporting.
| Item 9B. | Other Information. |
Not applicable.
84
Table of Contents
PART III
Item 10. Directors, Executive Officers, and Corporate Governance.
The information required by this item is incorporated by reference from the definitive proxy
statement to be filed within 120 days after December 31, 2009, pursuant to Regulation 14A under the
Securities Exchange Act of 1934 in connection with the annual meeting of stockholders to be held on
May 13, 2010.
Item 11. Executive Compensation.
The information required by this item is incorporated by reference from the definitive proxy
statement to be filed within 120 days after December 31, 2009, pursuant to Regulation 14A under the
Securities Exchange Act of 1934 in connection with the annual meeting of stockholders to be held on
May 13, 2010.
Item 12. Security Ownership of Certain Beneficial Owners and Management and Related Stockholder
Matters.
The information required by this item is incorporated by reference from the definitive proxy
statement to be filed within 120 days after December 31, 2009, pursuant to Regulation 14A under the
Securities Exchange Act of 1934 in connection with the annual meeting of stockholders to be held on
May 13, 2010.
Item 13. Certain Relationships and Related Transactions, and Director Independence.
The information required by this item is incorporated by reference from the definitive proxy
statement to be filed within 120 days after December 31, 2009, pursuant to Regulation 14A under the
Securities Exchange Act of 1934 in connection with the annual meeting of stockholders to be held on
May 13, 2010.
Item 14. Principal Accountant Fees and Services.
The information required by this item is incorporated by reference from the definitive proxy
statement to be filed within 120 days after December 31, 2009, pursuant to Regulation 14A under the
Securities Exchange Act of 1934 in connection with the annual meeting of stockholders to be held on
May 13, 2010.
85
Table of Contents
PART IV
Item 15. Exhibits and Financial Statement Schedules.
Financial Statements
See Index to Consolidated Financial Statements in “Financial Statements and Supplementary Data.”
Financial Statement Schedules
See Schedule II — Valuation and Qualifying Accounts on page S-1 of this report.
Index to Exhibits
| Exhibit | ||
| No. | Description | |
3.1
|
Fourth Amended and Restated Certificate of Incorporation of Wright Medical Group, Inc., (1) as amended by Certificate of Amendment of Fourth Amended and Restated Certificate of Incorporation of Wright Medical Group, Inc. (2) | |
3.2
|
Second Amended and Restated By-laws of Wright Medical Group, Inc. (3) | |
4.1
|
Form of Common Stock certificate. (1) | |
4.2
|
Indenture, dated as of November 26, 2007, between Wright Medical Group, Inc. and The Bank of New York as trustee (including form of 2.625% Convertible Senior Notes due 2014). (4) | |
4.3
|
Underwriting Agreement, dated as of November 19, 2007, among Wright Medical Group, Inc. and J.P. Morgan Securities Inc., Piper Jaffray & Co. and Wachovia Capital Markets, LLC. (4) | |
10.1
|
Credit Agreement dated as of June 30, 2006, among Wright Medical Group, Inc., its domestic subsidiaries, the lenders named therein, Bank of America, N.A. and SunTrust Bank., as amended by First Amendment to Credit Agreement dated as of November 16, 2007. (5) | |
10.2
|
Fifth Amended and Restated 1999 Equity Incentive Plan (the 1999 Plan), (7) as amended by First Amendment to the 1999 Plan. (8) | |
10.3
|
2009 Equity Incentive Plan (2009 Plan) (9) | |
10.4*
|
Form of Executive Stock Option Agreement pursuant to the 2009 Plan. (10) | |
10.5*
|
Form of Non-US Employee Stock Option Agreement pursuant to the 2009 Plan. (10) | |
10.6*
|
Form of Non-Employee Director Stock Option Agreement (one year vesting) pursuant to the 2009 Plan. (10) | |
10.7*
|
Form of Non-Employee Director Stock Option Agreement (four year vesting) pursuant to the 2009 Plan. (10) | |
10.8*
|
Form of Executive Restricted Stock Grant Agreement pursuant to the 2009 Plan. (10) | |
10.9*
|
Form of Non-US Employee Restricted Stock Grant Agreement pursuant to the 2009 Plan. (10) | |
10.10*
|
Form of Non-Employee Director Restricted Stock Grant Agreement (one year vesting) pursuant to the 2009 Plan. (10) | |
10.11*
|
Form of Non-Employee Director Restricted Stock Grant Agreement (four year vesting) pursuant to the 2009 Plan. (10) | |
10.12*
|
Form of Non-US Employee Restricted Stock Unit Grant Agreement pursuant to the 2009 Plan. (10) | |
10.13*
|
Form of Executive Stock Option Agreement pursuant to the 1999 Plan. (10) | |
10.14*
|
Form of Non-US Employee Stock Option Agreement pursuant to the 1999 Plan. (10) | |
10.15*
|
Form of Non-Employee Director Stock Option Agreement (one year vesting) pursuant to the 1999 Plan. (10) | |
10.16*
|
Form of Non-Employee Director Stock Option Agreement (four year vesting) pursuant to the 1999 Plan. (10) | |
10.17*
|
Form of Executive Restricted Stock Grant Agreement pursuant to the 1999 Plan. (10) | |
10.18*
|
Form of Non-US Employee Phantom Stock Unit Grant Agreement pursuant to the 1999 Plan(10) | |
10.19*
|
Form of Non-Employee Director Restricted Stock Grant Agreement (four year vesting) pursuant to the 1999 Plan. (11) | |
10.20*
|
Wright Medical Group, Inc. Executive Performance Incentive Plan. (12) | |
10.21*
|
Form of Indemnification Agreement between Wright Medical Group, Inc. and its directors and executive officers. (13) | |
10.22*
|
Employment Agreement dated as of March 1, 2007, between Wright Medical Netherlands B.V. and Paul R. Kosters. (14) | |
10.23*
|
Employment Agreement dated as of April 2, 2009, between Wright Medical Technology, Inc. and Gary D. Henley. (13) |
86
Table of Contents
| Exhibit | ||
| No. | Description | |
10.24*
|
Separation Pay Agreement dated as of April 1, 2009 between Wright Medical Technology, Inc. and Lance A. Berry. (16) | |
10.25*
|
Separation Pay Agreement dated as of April 1, 2009 between Wright Medical Technology, Inc. and Eric A. Stookey. (13) | |
10.26*
|
Separation Pay Agreement dated as of April 1, 2009 between Wright Medical Technology, Inc. and Frank S. Bono. (15) | |
10.27*
|
Settlement Agreement dated as of January 19, 2010 between Wright Medical Netherlands B.V. and Paul R. Kosters. (17) | |
10.28†
|
Supply and Development Agreement dated April 1, 2002 between Wright Medical Technology, Inc. and LifeCell Corporation, as amended January 14, 2003; February 25, 2003; May 9, 2003; July 18, 2003; March 4, 2004 and April 22, 2005. | |
11
|
Computation of earnings per share (included in Note 10 of the Notes to Consolidated Financial Statements in “Financial Statements and Supplementary Data”). | |
12
|
Ratio of Earnings to Fixed Charges. | |
14
|
Code of Ethics. (6) | |
21
|
Subsidiaries of Wright Medical Group, Inc. | |
23
|
Consent of KPMG LLP. | |
31.1
|
Certification of Chief Executive Officer Pursuant to Rule 13a-14(a) Under the Securities Exchange Act of 1934. | |
31.2
|
Certification of Chief Financial Officer Pursuant to Rule 13a-14(a) Under the Securities Exchange Act of 1934. | |
32
|
Certification of Chief Executive Officer and Chief Financial Officer Pursuant to Rule 13a-14(b) Under the Securities Exchange Act of 1934 and Section 1350 of Chapter 63 of Title 18 of the United States Code. |
| (1) | Incorporated by reference to our Registration Statement on Form S-1 (Registration No. 333-59732), as amended. | |
| (2) | Incorporated by reference to our Registration Statement on Form S-8 filed on May 14, 2004. | |
| (3) | Incorporated by reference to our current report on Form 8-K filed on February 19, 2008. | |
| (4) | Incorporated by reference to our current report on Form 8-K filed on November 26, 2007. | |
| (5) | Incorporated by reference to our quarterly report on Form 10-Q filed on August 4, 2009. | |
| (6) | Incorporated by reference to our current report on Form 8-K filed on March 31, 2004. | |
| (7) | Incorporated by reference to our definitive Proxy Statement filed on April 14, 2008. | |
| (8) | Incorporated by reference to our quarterly report on Form 10-Q for the quarter ended September 30, 2008. | |
| (9) | Incorporated by reference to our definitive Proxy Statement filed on April 15, 2009. | |
| (10) | Incorporated by reference to our quarterly report on Form 10-Q for the quarter ended June 30, 2009. | |
| (11) | Incorporated by reference to our Registration Statement on Form S-8 filed on June 18, 2008. | |
| (12) | Incorporated by reference to our current report on Form 8-K filed on February 10, 2005. | |
| (13) | Incorporated by reference to our current report on Form 8-K filed on April 7, 2009. | |
| (14) | Incorporated by reference to our quarterly report on Form 10-Q filed on April 25, 2008. | |
| (15) | Incorporated by reference to our quarterly report on Form 10-Q for the quarter ended March 31, 2009. | |
| (16) | Incorporated by reference to our current report on Form 8-K filed on November 16, 2009. |
87
Table of Contents
| (17) | Incorporated by reference to our current report on Form 8-K filed on January 22, 2010. | |
| * | Denotes management contract or compensatory plan or arrangement. | |
| † | Confidential treatment requested under 17 CFR 24b-2. The confidential portions of this exhibit have been omitted and are marked accordingly. The confidential portions have been filed separately with the Securities and Exchange Commission pursuant to the Confidential Treatment Request. |
88
Table of Contents
SIGNATURES
Pursuant to the requirements of Section 13 or 15(d) of the Securities Exchange Act of
1934, the registrant has duly caused this report to be signed on its behalf by the undersigned,
thereunto duly authorized.
February 22, 2010
| Wright Medical Group, Inc. |
||||
| By: | /s/ Gary D. Henley | |||
| Gary D. Henley | ||||
| President and Chief Executive Officer | ||||
Pursuant to the requirements of the Securities Exchange Act of 1934, this report has been
signed below by the following persons on behalf of the registrant and in the capacity and on the
dates indicated.
| Signature | Title | Date | ||
/s/ Gary D. Henley
|
President, Chief Executive
Officer and Director (Principal Executive Officer) |
February 22, 2010 | ||
/s/ Lance A. Berry
|
Chief Financial Officer (Principal Financial Officer and Principal Accounting Officer) |
February 22, 2010 | ||
/s/ David D. Stevens
|
Chairman of the Board | February 22, 2010 | ||
David D. Stevens |
||||
/s/ Gary D. Blackford
|
Director | February 22, 2010 | ||
Gary D. Blackford |
||||
/s/ Carmen L. Diersen
|
Director | February 22, 2010 | ||
Carmen L. Diersen |
||||
/s/ Martin J. Emerson
|
Director | February 22, 2010 | ||
Martin J. Emerson |
||||
/s/ Lawrence W. Hamilton
|
Director | February 22, 2010 | ||
Lawrence W. Hamilton |
||||
/s/ John L. Miclot
|
Director | February 22, 2010 | ||
John L. Miclot |
||||
/s/ Amy S. Paul
|
Director | February 22, 2010 | ||
Amy S. Paul |
||||
/s/ Robert J. Quillinan
|
Director | February 22, 2010 | ||
Robert J. Quillinan |
89
Table of Contents
Report of Independent Registered Public Accounting Firm
The Board of Directors and Stockholders
Wright Medical Group, Inc.:
Wright Medical Group, Inc.:
Under date of February 22, 2010, we reported on the consolidated balance sheets of Wright Medical
Group, Inc. and subsidiaries (the Company) as of December 31, 2009 and 2008, and the related
consolidated statements of operations, changes in stockholders’ equity and comprehensive income,
and cash flows for each of the years in the three-year period ended December 31, 2009. These
consolidated financial statements, and our report thereon, are included in the annual report on
Form 10-K for the year ended December 31, 2009. In connection with our audits of the
aforementioned consolidated financial statements, we also audited the related financial statement
schedule listed in Item 15 in the annual report on Form 10-K. The financial statement schedule is
the responsibility of the Company’s management. Our responsibility is to express an opinion on the
financial statement schedule based on our audits.
In our opinion, the financial statement schedule, when considered in relation to the basic
consolidated financial statements taken as a whole, presents fairly, in all material respects,
the information set forth therein.
(signed) KPMG LLP
Memphis, Tennessee
February 22, 2010
February 22, 2010
Table of Contents
Wright Medical Group, Inc.
Schedule II-Valuation and Qualifying Accounts
(In thousands)
Schedule II-Valuation and Qualifying Accounts
(In thousands)
| Balance at | Charged to | Balance at | ||||||||||||||
| Beginning | Cost and | Deductions | End of | |||||||||||||
| of Period | Expenses | and Other | Period | |||||||||||||
Allowance for doubtful accounts: |
||||||||||||||||
For the period ended: |
||||||||||||||||
December 31, 2009 |
$ | 4,007 | $ | 5,339 | $ | (702 | ) | $ | 8,644 | |||||||
December 31, 2008 |
$ | 5,201 | $ | 939 | $ | (2,133 | ) | $ | 4,007 | |||||||
December 31, 2007 |
$ | 2,850 | $ | 2,339 | $ | 12 | $ | 5,201 | ||||||||
Sales returns and allowance: |
||||||||||||||||
For the period ended: |
||||||||||||||||
December 31, 2009 |
$ | 490 | $ | 61 | $ | — | $ | 551 | ||||||||
December 31, 2008 |
$ | 564 | $ | (74 | ) | $ | — | $ | 490 | |||||||
December 31, 2007 |
$ | 350 | $ | 214 | $ | — | $ | 564 | ||||||||
S-1