Attached files
UNITED
STATES
SECURITIES
AND EXCHANGE COMMISSION
Washington,
D.C. 20549
________________________
FORM
10-K
|
[X]
|
ANNUAL REPORT
PURSUANT TO SECTION 13 OR 15(d) OF THE SECURITIES EXCHANGE ACT OF
1934
|
For the fiscal year
ended December 31, 2009
OR
|
[ ]
|
TRANSITION
REPORT PURSUANT TO SECTION 13 OR 15(d) OF THE SECURITIES EXCHANGE ACT OF
1934
|
|
|
For the
transition period from ________ to
___________
|
Commission file
number 1-5571
________________________

RADIOSHACK
CORPORATION
(Exact name of
registrant as specified in its charter)
|
Delaware
|
75-1047710
|
|
(State or
other jurisdiction of incorporation or organization)
|
(I.R.S.
Employer Identification No.)
|
|
Mail
Stop CF3-201, 300 RadioShack Circle, Fort Worth, Texas
|
76102
|
|
(Address of
principal executive offices)
|
(Zip
Code)
|
|
Registrant's
telephone number, including area code (817)
415-3011
|
|
________________________
SECURITIES
REGISTERED PURSUANT TO SECTION 12(b) OF THE ACT:
|
Name of each
exchange
|
|
|
Title of each
class
|
on which
registered
|
|
Common Stock,
par value $1 per share
|
New York
Stock Exchange
|
SECURITIES REGISTERED PURSUANT TO
SECTION 12(g) OF THE ACT: None
Indicate by check
mark if the registrant is a well-known seasoned issuer, as defined in Rule 405
of the Securities Act. Yes X
No __
Indicate by check
mark if the registrant is not required to file reports pursuant to Section 13 or
Section 15(d) of the Act. Yes __ No X
Indicate by check
mark whether the registrant (1) has filed all reports required to be filed by
Section 13 or 15(d) of the Securities Exchange Act of 1934 during the preceding
12 months (or for such shorter period that the registrant was required to file
such reports), and (2) has been subject to such filing requirements for the past
90 days. Yes X
No __
1
Indicate by check
mark whether the registrant has submitted electronically and posted on its
corporate Web site, if any, every Interactive Data File required to be submitted
and posted pursuant to Rule 405 of Regulation S-T during the preceding 12 months
(or for such shorter period that the registrant was required to submit and post
such files). Yes __ No __
Indicate by check
mark if disclosure of delinquent filers pursuant to Item 405 of Regulation S-K
is not contained herein, and will not be contained, to the best of registrant's
knowledge, in definitive proxy or information statements incorporated
by reference in Part III of this Form 10-K or any amendment to this
Form 10-K.__
Indicate by check
mark if the registrant is a large accelerated filer, an accelerated filer, a
non-accelerated filer or a smaller reporting company. See the definitions of
“large accelerated filer,” “accelerated filer” and “smaller reporting company”
in Rule 12b-2 of the Exchange Act.
|
Large
accelerated filer [ X ]
|
Accelerated
filer [ ]
|
|
Non-accelerated
filer [ ]
|
Smaller
reporting company [ ]
|
Indicate by check
mark whether the registrant is a shell company (as defined in Rule 12b-2 of the
Act).
Yes __ No X
As
of June 30, 2009, the aggregate market value of the voting common stock of the
registrant held by non-affiliates of the registrant was $1,295,767,233 based on
the New York Stock Exchange closing price. For the purposes of this disclosure
only, the registrant has assumed that its directors, executive officers and
beneficial owners of 5% or more of the registrant’s common stock as of June 30,
2009, are the affiliates of the registrant.
As
of February 16, 2010,
there were 125,236,678
shares of the registrant's Common Stock outstanding.
Documents
Incorporated by Reference
Portions of the
Proxy Statement for the 2010 Annual Meeting of Stockholders are incorporated by
reference into Part III.
2
|
TABLE OF CONTENTS
|
|||
|
Page
|
|||
|
PART
I
|
|||
|
Business
|
4
|
||
|
Risk
Factors
|
8
|
||
|
Unresolved
Staff Comments
|
13
|
||
|
Properties
|
13
|
||
|
Legal
Proceedings
|
16
|
||
|
Submission of
Matters to a Vote of Security Holders
|
16
|
||
|
Executive
Officers of the Registrant
|
16
|
||
|
PART
II
|
|||
|
Market for
Registrant’s Common Equity, Related Stockholder Matters and Issuer
Purchases of Equity Securities
|
18
|
||
|
Selected
Financial Data
|
20
|
||
|
Management’s
Discussion and Analysis of Financial Condition and Results of
Operations
|
22
|
||
|
Quantitative
and Qualitative Disclosures about Market Risk
|
40
|
||
|
Financial
Statements and Supplementary Data
|
40
|
||
|
Changes in
and Disagreements with Accountants on Accounting and Financial
Disclosure
|
41
|
||
|
Controls and
Procedures
|
41
|
||
|
Other
Information
|
41
|
||
|
PART
III
|
|||
|
Directors,
Executive Officers and Corporate Governance
|
41
|
||
|
Executive
Compensation
|
42
|
||
|
Security
Ownership of Certain Beneficial Owners and Management and Related
Stockholder Matters
|
42
|
||
|
Certain
Relationships and Related Transactions, and Director
Independence
|
42
|
||
|
Principal
Accountant Fees and Services
|
43
|
||
|
PART
IV
|
|||
|
Exhibits,
Financial Statement Schedules
|
43
|
||
|
44
|
|||
|
45
|
|||
|
46
|
|||
|
82
|
|||
3
PART
I
GENERAL
RadioShack
Corporation was incorporated in Delaware in 1967. We primarily engage in the
retail sale of consumer electronics goods and services through our RadioShack
store chain and non-RadioShack-branded kiosk operations. Our strategy is to
provide cost-effective solutions to meet the routine electronics needs and
distinct electronics wants of our customers. Throughout this report, the terms
“our,” “we,” “us” and “RadioShack” refer to RadioShack Corporation,
including its subsidiaries.
Our day-to-day
focus is concentrated in four major areas:
|
·
|
Provide our
customers a positive in-store
experience
|
|
·
|
Grow gross
profit dollars by increasing the overall value of each
ticket
|
|
·
|
Control costs
continuously throughout the
organization
|
|
·
|
Utilize the
funds generated from operations appropriately and invest only in projects
that have an adequate return or are operationally
necessary
|
Additional
information regarding our business segments is presented below and in
Management’s Discussion and Analysis of Financial Condition and Results of
Operations (“MD&A”) elsewhere in this Annual Report on Form 10-K. For
information regarding the net sales and operating revenues and operating income
for each of our business segments for fiscal years ended December 31, 2009, 2008
and 2007, please see Note 15 – “Segment Reporting” in the Notes to Consolidated
Financial Statements.
U.S.
RADIOSHACK COMPANY-OPERATED STORES
At
December 31, 2009, we operated 4,476 U.S. company-operated stores under the
RadioShack brand located throughout the United States, as well as in Puerto Rico
and the U.S. Virgin Islands. These stores are located in major shopping malls
and strip centers, as well as individual storefronts. Each location carries a
broad assortment of both name brand and private brand consumer electronics
products.
Our product lines
are categorized into a number of platforms. Our wireless platform includes
postpaid and prepaid wireless handsets and communication devices such as
scanners and GPS products. Our accessory platform includes home entertainment,
wireless, music, computer, video game and GPS accessories; media storage; power
adapters; digital imaging products and headphones. Our modern home platform
includes home audio and video end-products, personal computing products,
residential telephones, and Voice over Internet Protocol products. Our personal
electronics platform includes digital cameras, digital music players, toys,
satellite radios, video gaming hardware, camcorders, and general radios. Our
power platform includes general and special purpose batteries and battery
chargers. Our technical platform includes wire and cable, connectivity products,
components and tools, and hobby products. We also provide consumers access to
third-party services such as wireless telephone activation, prepaid wireless
airtime, extended service plans, and AT&T’s ConnecTech service.
KIOSKS
At
December 31, 2009, we operated 562 kiosks located throughout the United States.
These kiosks are primarily inside Sam’s Club and Target store locations. These
locations, which are not RadioShack-branded, primarily offer wireless handsets
and their associated accessories. We also provide consumers access to
third-party wireless telephone services.
In
February 2009, we signed a contract extension with Sam’s Club through March 31,
2011, with a transition period ending June 30, 2011, to continue operating
kiosks in certain Sam’s Club locations. As part of the terms of the contract
extension, we assigned the operation of 66 kiosk locations to Sam’s Club in
2009. We will assign at least 22 locations to Sam’s Club in 2010, and Sam’s Club
still has the right to assume the operations of up to 23 additional kiosk
locations.
In
April 2009 we agreed with Sprint Nextel to cease our arrangement to jointly
operate the Sprint-branded kiosks in operation at that date. This agreement
allowed us to operate these kiosks under the Sprint name
4
for a reasonable
period of time, allowing us to transition the kiosks to a new format. In August
2009, we transitioned these kiosks to multiple wireless carrier
RadioShack-branded locations. They are now managed and reported as extensions of
existing RadioShack company-operated stores located in the same shopping
malls.
We
are currently conducting a test rollout of kiosk locations in approximately 100
Target stores. This test will be completed in 2010. At the conclusion of the
test, a determination will be made with Target regarding whether these
operations will be expanded or closed.
OTHER
In
addition to the reportable segments discussed above, we have other sales
channels and support operations described as follows:
Dealer Outlets: At December
31, 2009, we had a network of 1,308 RadioShack dealer outlets, including 34
located outside of North America. Our North American outlets provide name brand
and private brand products and services, typically to smaller communities. These
independent dealers are often engaged in other retail operations and augment
their businesses with our products and service offerings. Our dealer sales
derived outside of the United States are not material.
RadioShack.com: Products and
information are available through our commercial Web site www.radioshack.com. Online
customers can purchase, return or exchange various products available through
this Web site. Additionally, certain products ordered online may be picked up,
exchanged or returned at RadioShack stores.
RadioShack Service Centers: We maintain a service
and support network to service the consumer electronics and personal computer
retail industry in the U.S. We are a vendor-authorized service provider for many
top tier manufacturers, such as Hewlett-Packard, LG Electronics, Motorola, Nokia
and Sony, among others. In addition, we perform repairs for third-party extended
service plan providers. At December 31, 2009, we had six RadioShack service
centers in the U.S. and one in Puerto Rico.
International Operations: As
of December 31, 2009, there were 204 company-operated stores under the
RadioShack brand, 10 dealers, and one distribution center in Mexico. Prior to
December 2008, these operations were overseen by a joint venture in which we
were a slightly less than 50% minority owner with Grupo Gigante, S.A.B. de C.V.
In December 2008, we acquired 100% ownership of this joint venture. All of our
23 locations in Canada were closed by January 31, 2007.
Support
Operations:
Our retail stores,
along with our kiosks and dealer outlets, are supported by an established
infrastructure. Below are the major components of this support
structure.
Distribution Centers - At
December 31, 2009, we had four U.S. distribution centers shipping approximately
875,000 cartons each month, on average, to our U.S. retail stores and dealer
outlets. One of these distribution centers also serves as a fulfillment center
for our online customers. Additionally, we have a distribution center that ships
fixtures to our U.S. company-operated stores. During the first half of 2008, we
closed our distribution center in Columbus, Ohio.
RadioShack Technology Services
(“RSTS”) - Our management information system architecture is composed of
a distributed, online network of computers that links all stores, customer
channels, delivery locations, service centers, credit providers, distribution
facilities and our home office into a fully integrated system. Each store has
its own server to support the point-of-sale (“POS”) system. The majority of our
U.S. company-operated stores communicate through a broadband network, which
provides efficient access to customer support data. This design also allows
store management to track daily sales and inventory at the product or sales
associate level. RSTS provides the majority of our programming and systems
analysis needs.
RadioShack Global Sourcing (“RSGS”)
- RSGS serves our wide-ranging international import/export, sourcing,
evaluation, logistics and quality control needs. RSGS’s activities support our
name brand and private brand businesses.
5
Consumer Electronics Manufacturing
- We operate two manufacturing facilities in the United States and one in
China. These three manufacturing facilities employed approximately 2,100
employees as of December 31, 2009. We manufacture a variety of products,
primarily sold through our retail outlets, including telephones, antennas, wire
and cable products, and a variety of “hard-to-find” parts and accessories for
consumer electronics products.
SEASONALITY
As
with most other specialty retailers, our net sales and operating revenues,
operating income and cash flows are greater during the fourth quarter, which
includes the majority of the holiday shopping season in the U.S., than during
other periods of the year. There is a corresponding pre-seasonal inventory
build-up, which requires working capital related to the anticipated increased
sales volume. This is described in “Cash Requirements” under MD&A. Also,
refer to Note 16 – “Quarterly Data (Unaudited)” in the Notes to Consolidated
Financial Statements for data showing seasonality trends. We expect this
seasonality to continue.
PATENTS
AND TRADEMARKS
We
own or are licensed to use many trademarks and service marks related to our
RadioShack stores in the United States and in foreign countries. We believe the
RadioShack name and marks are well recognized by consumers, and that the name
and marks are associated with high-quality products and services. We also
believe the loss of the RadioShack name and RadioShack marks would materially
adversely affect our business. Our private brand manufactured products are sold
primarily under the RadioShack, AUVIO, Accurian, Enercell or Gigaware
trademarks. We also own various patents and patent applications relating to
consumer electronics products.
We
do not own any material patents or trademarks associated with our kiosk
operations.
SUPPLIERS
AND NAME BRAND RELATIONSHIPS
Our business
strategy depends, in part, upon our ability to offer name brand and private
brand products, as well as to provide our customers access to third-party
services. We utilize a large number of suppliers located in various parts of the
world to obtain raw materials and private brand merchandise. We do not expect a
lack of availability of raw materials or any single private brand product to
have a material effect on our operations overall or on any of our operating
segments. We have formed vendor and third-party service provider relationships
with well-recognized companies such as Sprint Nextel, AT&T, T-Mobile, Apple,
Casio, Garmin, Hewlett-Packard, Microsoft, Research In Motion, Samsung, and
SanDisk. In the aggregate, these relationships have or are expected to have a
significant effect on both our operations and financial strategy. Certain of
these relationships are important to our business; the loss of or disruption in
supply from these relationships could materially adversely affect our net sales
and operating revenues. Additionally, we have been limited from time to time by
various vendors and suppliers on an economic basis where demand has exceeded
supply.
ORDER
BACKLOG
We
have no material backlog of orders in any of our operating segments for the
products or services we sell.
COMPETITION
Due to consumer
demand for wireless products and services, as well as rapid consumer acceptance
of new digital technology products, the consumer electronics retail business
continues to be highly competitive, driven primarily by technology and product
cycles.
In
the consumer electronics retailing business, competitive factors include price,
quality, features, product availability, consumer services, manufacturing and
distribution capability, brand reputation and the number of competitors. We
compete in the sale of our products and services with several retail formats
including national, regional, and independent consumer electronics retailers. We
compete with department and specialty retail stores in more select product
categories. We compete with wireless providers in the wireless telephone
category through their own retail and online presence. We compete with mass
merchandisers and other alternative channels of distribution, such as mail order
and e-commerce retailers, on a more widespread basis. Numerous domestic and
foreign companies also
6
manufacture
products similar to ours for other retailers, which are sold under
nationally-recognized brand names or private brands.
Management believes
two primary factors differentiate us from our competition. First, we have an
extensive physical retail presence with convenient locations throughout the
United States. Second, our specially trained sales staff is capable of providing
cost-effective solutions for our customers’ routine electronics needs and
distinct electronics wants, assisting with the selection of appropriate products
and accessories and, when applicable, assisting customers with service
activation.
We
cannot give assurance that we will compete successfully in the future, given the
highly competitive nature of the consumer electronics retail business. Also, in
light of the ever-changing nature of the consumer electronics retail industry,
we would be adversely affected if our competitors were able to offer their
products at significantly lower prices. Additionally, we would be adversely
affected if our competitors were able to introduce innovative or technologically
superior products not yet available to us, or if we were unable to obtain
certain products in a timely manner or for an extended period of time.
Furthermore, our business would be adversely affected if we failed to offer
value-added solutions or if our competitors were to enhance their ability to
provide these value-added solutions.
EMPLOYEES
As
of December 31, 2009, we employed approximately 36,700 people, including 1,900
temporary seasonal employees. Our employees are not covered by collective
bargaining agreements, nor are they members of labor unions. We consider our
relationship with our employees to be good.
AVAILABLE
INFORMATION
We
are subject to the reporting requirements of the Securities Exchange Act of
1934, as amended, and rules and regulations adopted by the SEC under that Act.
The Exchange Act requires us to file reports, proxy statements and other
information with the SEC. Copies of these reports, proxy statements and other
information can be inspected and copied at:
SEC Public
Reference Room
100 F Street,
N.E.
Room
1580
Washington,
D.C. 20549-0213
You may obtain
information on the operation of the Public Reference Room by calling the SEC at
1-800-SEC-0330. You may also obtain copies of any material we have
filed with the SEC by mail at prescribed rates from:
Public Reference
Section
Securities and
Exchange Commission
100 F Street,
N.E.
Washington,
D.C. 20549-0213
You may obtain
these materials electronically by accessing the SEC’s home page on the Internet
at:
http://www.sec.gov
In
addition, we make available, free of charge on our corporate Web site, our
Annual Report on Form 10-K, Quarterly Reports on Form 10-Q, Current Reports on
Form 8-K, and amendments to these reports filed or furnished pursuant to Section
13(a) or 15(d) of the Exchange Act, as well as our proxy statements, as soon as
reasonably practicable after we electronically file this material with, or
furnish it to, the SEC. You may review these documents, under the heading
“Investor Relations,” by accessing our corporate Web site:
http://www.radioshackcorporation.com
7
One should
carefully consider the following risks and uncertainties described below, as
well as other information set forth in this Annual Report on Form 10-K. There
may be additional risks that are not presently material or known, and the
following list should not be construed as an exhaustive list of all factors that
could cause actual results to differ materially from those expressed in
forward-looking statements made by us. If any of the events described below
occur, our business, financial condition, results of operations, liquidity or
access to the capital markets could be materially adversely
affected.
We
may be unable to successfully execute our strategy to provide cost-effective
solutions to meet the routine consumer electronics needs and distinct consumer
electronics wants of our customers.
To
achieve our strategy, we have undertaken a variety of strategic initiatives. Our
failure to successfully execute our strategy or the occurrence of certain
events, including the following, could materially adversely affect our ability
to maintain or grow our comparable store sales and our business
generally:
|
·
|
Our inability
to keep our extensive store distribution system updated and conveniently
located near our target customers
|
|
·
|
Our
employees’ inability to provide solutions, answers, and information
related to increasingly complex consumer electronics
products
|
|
·
|
Our inability
to recognize evolving consumer electronics trends and offer products that
customers need or want
|
Adverse
changes in national and world-wide economic conditions could negatively affect
our business.
The continued
uncertainty in the economy could have a significant negative effect on U.S.
consumer spending, particularly discretionary spending for consumer electronics
products, which, in turn, could directly affect our sales. Consumer confidence,
recessionary and inflationary trends, equity market levels, consumer credit
availability, interest rates, consumers’ disposable income and spending levels,
energy prices, job growth, income tax rates and unemployment rates may affect
the volume of customer traffic and level of sales in our locations. Continued
negative trends of any of these economic conditions, whether national or
regional in nature, could adversely affect our results of operations, including
our net sales and profitability.
In
addition, potential disruptions in the capital and credit markets could have a
significant effect on our ability to access the U.S. and global capital and
credit markets, if needed. These potential disruptions in the capital and credit
market conditions could affect our ability to borrow under our credit facility,
or adversely affect the banks that underwrote our credit facility. The
availability of financing will depend on a variety of factors, such as economic
and market conditions and the availability of credit and our credit ratings. If
needed, we may not be able to successfully obtain any necessary additional
financing on favorable terms, or at all.
Our
inability to increase or maintain profitability of our operations could
adversely affect our results.
A
critical component of our business strategy is to improve our overall
profitability. Our ability to increase profitable sales in existing stores may
be affected by:
|
·
|
Our success
in attracting customers into our
stores
|
|
·
|
Our ability
to choose the correct mix of products to
sell
|
|
·
|
Our ability
to keep stores stocked with merchandise customers will
purchase
|
|
·
|
Our ability
to maintain fully-staffed stores with appropriately trained
employees
|
|
·
|
Our ability
to remain relevant to the consumer
|
8
Any
reductions or changes in the growth rate of the wireless industry or changes in
the dynamics of the wireless communications industry could materially adversely
affect our results of operations.
Sales of wireless
handsets and the related commissions and residual income constitute a
significant portion of our total revenue. Consequently, changes in the wireless
industry, such as those discussed below, could materially adversely affect our
results of operations and financial condition.
Lack of growth in
the overall wireless industry tends to have a corresponding effect on our
wireless sales. Because growth in the wireless industry is often driven by the
adoption rate of new wireless handset and wireless service technologies, the
absence of these new technologies, our suppliers not providing us with these new
technologies, or the lack of consumer interest in adopting these new
technologies, could adversely affect our business.
Another change in
the wireless industry that could materially adversely affect our profitability
is wireless industry consolidation. Consolidation in the wireless industry could
lead to a concentration of competitive strength within a few wireless carriers,
which could adversely affect our business if our ability to obtain competitive
offerings from our wireless suppliers is reduced or as competition from wireless
carrier stores increases.
Our
competition is both intense and varied, and our failure to effectively compete
could materially adversely affect our results of operations.
In
the retail consumer electronics marketplace, the level of competition is
intense. We compete with consumer electronics retail stores similarly situated
to our stores as well as big-box retailers, large specialty retailers and
discount or warehouse retailers and, to a lesser extent, with alternative
channels of distribution such as e-commerce, telephone shopping services and
mail order. We also compete with wireless carriers’ retail presence, as
discussed above. Some of these other competitors are larger than us and have
greater market presence and financial and other resources than us, which may
provide them with a competitive advantage.
Changes in the
amount and degree of promotional intensity or merchandising strategy exerted by
our current competitors and potential new competition could present us with
difficulties in retaining existing customers and attracting new customers. In
addition, pressure from our competitors could require us to reduce prices or
increase our costs in one product category or across all our product categories.
As a result of this competition, we may experience lower sales, margins or
profitability, which could materially adversely affect our results of
operations.
In
addition, some of our competitors may use strategies such as lower pricing,
wider selection of products, larger store size, higher advertising intensity,
improved store design, and more efficient sales methods. While we attempt to
differentiate ourselves from our competitors by focusing on the electronics
specialty retail market, our business model may not enable us to compete
successfully against existing and future competitors.
We
may not be able to maintain our historical gross margin levels.
Historically, we
have maintained gross margin levels ranging from 45% to 48%. We may not be able
to maintain these margin levels in the future due to various factors, including
increased sales of lower margin products, such as personal electronics products
and name brand products, or declines in average selling prices of key products.
If sales of lower margin items continue to increase and become a larger
percentage of our business, our gross margin will be adversely
affected.
9
Our
inability to effectively manage our receivable levels, particularly with our
service providers, could adversely affect our results of
operations.
We
maintain significant receivable balances from various service providers, such as
Sprint Nextel, AT&T, and T-Mobile, consisting of commissions, residuals and
other funds related to these relationships. Changes in the financial markets or
financial condition of these service providers could cause a delay or failure in
receiving these funds. A significant delay or failure to receive these payments
could adversely affect our financial results or financial
condition.
Our
inability to effectively manage our inventory levels, particularly excess or
inadequate amounts of inventory, could adversely affect our results of
operations.
We
source inventory both domestically and internationally, and our inventory levels
are subject to a number of factors, some of which are beyond our control. These
factors, including technology advancements, reduced consumer spending and
consumer disinterest in our product offerings, could lead to excess inventory
levels. Additionally, we may not accurately assess product life cycles, leaving
us with excess inventory. To reduce this excess inventory, we may be required to
lower our prices, adversely affecting our results of operations.
Alternatively, we
may have inadequate inventory levels for particular items, including popular
selling merchandise, due to factors such as unanticipated high demand for
certain products, unavailability of products from our vendors, import delays,
labor unrest, untimely deliveries or the disruption of international, national
or regional transportation systems. The effect of the occurrence of any of these
factors on our inventory supply could adversely affect our results of operations
or financial condition.
Our
inability to attract, retain and grow an effective management team or changes in
the cost or availability of a suitable workforce to manage and support our
strategies could adversely affect our results of operations.
Our success depends
in large part upon our ability to attract, motivate and retain a qualified
management team and employees. Qualified individuals needed to fill necessary
positions could be in short supply. The inability to recruit and retain such
individuals on a continuous basis could result in high employee turnover at our
stores and in our company generally, which could materially adversely affect our
business and results of operations. Additionally, competition for qualified
employees requires us to continually assess our compensation structure.
Competition for qualified employees has required, and in the future could
require, us to pay higher wages to attract a sufficient number of qualified
employees, resulting in higher labor compensation expense. In addition, mandated
changes in the federal minimum wage may adversely affect our compensation
expense.
Our
inability to successfully identify and enter into relationships with developers
of new technologies or the failure of these new technologies to be adopted by
the market could adversely affect our ability to increase or maintain our sales
and profitability. Additionally, the absence of new services or products and
product features in the merchandise categories we sell could adversely affect
our sales and profitability.
Our ability to
maintain and increase revenues depends, to a large extent, on the periodic
introduction and availability of new products and technologies. If we fail to
identify these new products and technologies, or if we fail to enter into
relationships with their developers prior to widespread distribution within the
market, our sales and profitability could be adversely affected. Any new
products or technologies we identify may have a limited sales life.
Furthermore, it is
possible that new products or technologies will never achieve widespread
consumer acceptance, also adversely affecting our sales and profitability.
Finally, the lack of innovative consumer electronics products, features or
services that can be effectively featured in our store model could also
adversely affect our ability to increase or maintain our sales and
profitability.
10
Failure
to create, maintain and renew profitable relationships with name brand product
and service providers could adversely affect our sales and
profitability.
Our large selection
of name brand products and service providers makes up a significant portion of
our overall sales. In the aggregate, these relationships have or are expected to
have a significant effect on both our operations and financial strategy. If we
are unable to create, maintain or renew our relationships with such third
parties on profitable terms or at all, our sales and our profitability could be
adversely affected.
The
occurrence of severe weather events or natural disasters could significantly
damage or destroy our retail locations, could prohibit consumers from traveling
to our retail locations, or could prevent us from resupplying our stores or
distribution centers, especially during the peak winter holiday shopping
season.
If
severe weather or a catastrophic natural event, such as a hurricane or
earthquake, occurs in a particular region and damages or destroys a significant
number of our stores in that area, our sales would be reduced accordingly. In
addition, if severe weather, such as heavy snowfall or extreme temperatures,
discourages or restricts customers in a particular region from traveling to our
stores, our sales would also be adversely affected. If severe weather occurs
during the fourth quarter holiday season, the adverse effect on our sales and
gross profit could be even greater than at other times during the year because
we generate a significant portion of our sales and gross profit during this
period.
We
have continuing obligations under leases related to discontinued retail
operations that could materially adversely affect our results of
operations.
We
have ongoing obligations under retail leases for locations that we assigned to
other businesses. The majority of these lease obligations arose from leases, for
which CompUSA Inc. assumed responsibility as part of the sale of our Computer
City, Inc. subsidiary to CompUSA in August 1998. Because the company that
assumed responsibility for these leases has ceased operations, we may be
responsible for rent due under the leases, which could materially adversely
affect our results of operations.
Failure
to comply with, or the additional implementation of, laws, rules, and
regulations regarding our business could adversely affect our business and our
results of operations.
We
are subject to various foreign, federal, state, and local laws, rules and
regulations including, but not limited to, the Fair Labor Standards Act and
ERISA, each as amended, and regulations promulgated by the Federal Trade
Commission, Securities and Exchange Commission, Internal Revenue Service, United
States Department of Labor, Occupational Safety and Health Administration, and
Environmental Protection Agency. Failure to properly adhere to these and other
applicable laws, rules and regulations could result in the imposition of
penalties or adverse legal judgments and could adversely affect our business and
our results of operations. Similarly, the cost of complying with
newly-implemented laws, rules and regulations could adversely affect our
business and our results of operations.
Risks
associated with the suppliers from whom our raw materials and products are
sourced could materially adversely affect our sales and
profitability.
We
utilize a large number of suppliers located in various parts of the world to
obtain raw materials, private brand merchandise, and other products. If any of
our key vendors fail to supply us with products, we may not be able to meet the
demands of our customers, and our sales and profitability could be adversely
affected.
We
purchase a significant portion of our inventory from manufacturers located in
China. Changes in trade regulations (including tariffs on imports) could
increase the cost of those items. Although our purchases are denominated in U.S.
dollars, changes in the Chinese currency exchange rate against the U.S. dollar
or other foreign currencies could cause our vendors to increase the prices of
items we purchase from them. The occurrence of any of these events could
materially adversely affect our results of operations.
11
Our ability to find
qualified vendors that meet our standards and supply products in a timely and
efficient manner is a significant challenge, especially with respect to goods
sourced from outside the United States. Merchandise quality issues, product
safety concerns, trade restrictions, difficulties in enforcing intellectual
property rights in foreign countries, work stoppages, transportation capacity
and costs, tariffs, political or financial instability, foreign currency
exchange rates, monetary, tax and fiscal policies, inflation, deflation,
outbreak of pandemics and other factors relating to foreign trade are beyond our
control. These and other issues affecting our vendors could materially adversely
affect our sales and profitability.
Our
business is heavily dependent upon information systems, which could result in
higher maintenance costs and business disruption.
Our business is
heavily dependent upon information systems, given the number of individual
transactions we process each year. Our information systems include an in-store
point-of-sale system that provides information used to track sales performance,
inventory replenishment, product availability information, product margin
information and customer information. In addition, we are in the process of
upgrading our in-store point-of-sale system and related processes. These systems
are complex and require integration with each other, with some of our service
providers, and with business processes, which may increase the risk of
disruption.
Our information
systems are also subject to damage or interruption from power outages, computer
and telecommunications failures, computer viruses, security breaches,
catastrophic events and usage errors by our employees. If we encounter damage to
our systems, difficulty implementing new systems, or difficulty maintaining and
upgrading current systems, our business operations could be disrupted, our sales
could decline, and our expenses could increase.
Failure
to protect the integrity and security of our customers’ information could expose
us to litigation, as well as materially damage our standing with our
customers.
Increasing costs
associated with information security, including increased investments in
technology, the costs of compliance with consumer protection laws, and costs
resulting from consumer fraud could cause our business and our results of
operations to be adversely affected. Additionally, if a significant compromise
in the security of our customer information, including personal identification
data, were to occur, it could materially adversely affect our reputation,
business, results of operations, or financial condition, and could increase the
costs we incur to protect against such security breaches.
We
are subject to other litigation risks and may face liabilities as a result of
allegations and negative publicity.
Our operations
expose us to litigation risks, such as class action lawsuits involving
employees, consumers and shareholders. For example, from time to time putative
class actions have been brought against us relating to various labor matters.
Defending against lawsuits and other proceedings may involve significant expense
and divert management’s attention and resources from other matters. In addition,
if any lawsuits were brought against us and resulted in a finding of substantial
legal liability, it could cause significant reputational harm to us and
otherwise materially adversely affect our business, results of operations, or
financial condition.
Terrorist
activities and governmental efforts to thwart them could materially adversely
affect our results of operations.
A
terrorist attack or series of attacks on the United States could have a
significant adverse effect on its economy. This downturn in the economy could,
in turn, materially adversely affect our results of operations. The potential
for future terrorist attacks, the national and international responses to
terrorist attacks, and other acts of war or hostility could cause greater
uncertainty and cause the economy to suffer in ways that we cannot
predict.
12
We
conduct business outside the United States, which presents potential
risks.
Some of our assets
are held and a portion of our revenue is generated in Mexico, China and Hong
Kong. Part of our growth strategy is to expand our international business
because we believe the growth rates and the opportunity to implement operating
improvements may be greater than those typically achievable in the United
States. International operations entail significant risks and uncertainties,
including, without limitation:
|
·
|
Economic,
social and political instability in any particular country or
region
|
|
·
|
Changes in
currency exchange rates
|
|
·
|
Changes in
government restrictions on converting currencies or repatriating
funds
|
|
·
|
Unexpected
changes in foreign laws and regulations or in trade, monetary or fiscal
policies
|
|
·
|
High
inflation and monetary fluctuations
|
|
·
|
Changes in
restrictions on imports and exports
|
|
·
|
Difficulties
in hiring, training and retaining qualified personnel, particularly
finance and accounting personnel with U.S. GAAP
expertise
|
|
·
|
Inability to
obtain access to fair and equitable political, regulatory, administrative
and legal systems
|
|
·
|
Changes in
government tax policy
|
|
·
|
Difficulties
in enforcing our contractual rights or enforcing judgments or obtaining a
just result in local jurisdictions
|
|
·
|
Potentially
adverse tax consequences of operating in multiple
jurisdictions
|
Any of these
factors, by itself or in combination with others, could materially adversely
affect our business, results of operations or financial condition.
We
may be unable to keep existing stores in current locations or open new stores in
desirable locations, which could adversely affect our sales and
profitability.
We
may be unable to keep existing stores in current locations or open new stores in
desirable locations in the future. We compete with other retailers and
businesses for suitable locations for our stores. Local land use, local zoning
issues, environmental regulations and other regulations may affect our ability
to find suitable locations and also influence the cost of leasing, building or
buying our stores. We also may have difficulty negotiating real estate leases
and purchase agreements on acceptable terms. Further, to relocate or open new
stores successfully, we must hire and train employees for the new location.
Construction, environmental, zoning and real estate delays may negatively affect
store openings and increase costs and capital expenditures. In addition, when we
open new stores in markets where we already have a presence, our existing
locations may experience a decline in sales as a result, and when we open stores
in new markets, we may encounter difficulties in attracting customers due to a
lack of customer familiarity with our brand, our lack of familiarity with local
customer preferences, and seasonal differences in the market. We cannot be
certain that new or relocated stores will produce the anticipated sales or
return on investment or that existing stores will not be adversely affected by
new or expanded competition in their market areas.
None.
Information on our
properties is located in MD&A and the financial statements included in this
Annual Report on Form 10-K and is incorporated into this Item 2 by
reference.
The following items
are discussed further in the Notes to Consolidated Financial
Statements:
|
Property,
Plant and Equipment
|
Note
3
|
|
Commitments
and Contingencies
|
Note
13
|
13
We
lease, rather than own, most of our retail facilities. Our stores are located in
shopping malls, stand-alone buildings and shopping centers owned by other
entities. We lease administrative offices throughout the United States and one
manufacturing plant in China. We closed our leased distribution center in
Columbus, Ohio, during the first half of 2008. We own the property on which our
five distribution centers and two manufacturing facilities are located within
the United States. In 2008, we amended the lease for the buildings and certain
property at our corporate headquarters located in downtown Fort Worth, Texas.
The amended lease is for a reduced amount of space, requires no lease payments,
and expires in June of 2011, with one two-year option to renew approximately
half of the space at market-based rents.
RETAIL
LOCATIONS
The table below
shows our retail locations at December 31, 2009, allocated among U.S. and Mexico
company-operated stores, kiosks and dealer and other outlets.
|
Average
|
||||||||||||||||
|
Store
Size
|
At December
31,
|
|||||||||||||||
|
(Sq.
Ft.)
|
2009
|
2008
|
2007
|
|||||||||||||
|
U.S.
RadioShack company-operated
stores
|
2,504 | 4,476 | 4,453 | 4,447 | ||||||||||||
|
Kiosks (1) (2)
(3) (4)
|
76 | 562 | 688 | 739 | ||||||||||||
|
Mexico
RadioShack company-operated
stores
|
1,288 | 204 | 200 | -- | ||||||||||||
|
Dealer and
other outlets (5)
|
N/A | 1,321 | 1,411 | 1,484 | ||||||||||||
|
Total number
of retail locations
|
6,563 | 6,752 | 6,670 | |||||||||||||
|
(1)
|
In April 2009
we agreed with Sprint Nextel to cease our arrangement to jointly operate
the Sprint-branded kiosks in operation at that date. This agreement
allowed us to operate these kiosks under the Sprint name for a reasonable
period of time, allowing us to transition the kiosks to a new format. In
August 2009, we transitioned these kiosks to multiple wireless carrier
RadioShack-branded locations. We managed and reported 111 of these
locations as extensions of existing RadioShack company-operated stores
located in the same shopping malls at December 31,
2009.
|
|
(2)
|
In February
2009, we signed a contract extension with Sam’s Club through March 31,
2011, with a transition period ending June 30, 2011, to continue operating
kiosks in certain Sam’s Club locations. As part of the terms of the
contract extension, we assigned the operation of 66 kiosk locations to
Sam’s Club in 2009. We will assign at least 22 locations to Sam’s Club in
2010, and Sam’s Club still has the right to assume the operations of up to
23 additional kiosk locations.
|
|
(3)
|
We are
currently conducting a test rollout of kiosk locations in approximately
100 Target stores. This test will be completed in 2010. At the conclusion
of the test, a determination will be made with Target regarding whether
these operations will be expanded or closed.
|
|
(4)
|
The decrease
of 51 locations during 2008 was primarily related to our decision not to
renew leases on underperforming Sprint-branded kiosks.
|
|
(5)
|
Our dealer
and other outlets decreased by 90 and 73 locations, net of new openings,
during 2009 and 2008, respectively. These declines were primarily due to
the closure of lower volume
outlets.
|
Real
Estate Owned and Leased
|
Approximate
Square Footage
At December
31,
|
||||||||||||||||||||||||
|
2009
|
2008
|
|||||||||||||||||||||||
|
(In
thousands)
|
Owned
|
Leased
|
Total
|
Owned
|
Leased
|
Total
|
||||||||||||||||||
|
Retail
|
||||||||||||||||||||||||
|
RadioShack
company-
operated
stores
|
10 | 11,209 | 11,219 | 13 | 11,141 | 11,154 | ||||||||||||||||||
|
Kiosks
|
-- | 43 | 43 | -- | 68 | 68 | ||||||||||||||||||
|
Mexico
company-
operated
stores
|
-- | 263 | 263 | -- | 253 | 253 | ||||||||||||||||||
|
Support
Operations
|
||||||||||||||||||||||||
|
Manufacturing
|
134 | 320 | 454 | 134 | 320 | 454 | ||||||||||||||||||
|
Distribution
centers
and
office space
|
2,077 | 334 | 2,411 | 2,229 | 1,021 | 3,250 | ||||||||||||||||||
| 2,221 | 12,169 | 14,390 | 2,376 | 12,803 | 15,179 | |||||||||||||||||||
14
Below is
a listing at December 31, 2009, of our retail locations within the United States
and its territories:
|
U.S.
RadioShack
Stores
|
Kiosks
|
Dealers and
Other *
|
Total
|
|||||||||||||
|
Alabama
|
48 | 11 | 34 | 93 | ||||||||||||
|
Alaska
|
-- | -- | 23 | 23 | ||||||||||||
|
Arizona
|
79 | 11 | 29 | 119 | ||||||||||||
|
Arkansas
|
25 | 3 | 40 | 68 | ||||||||||||
|
California
|
550 | 108 | 43 | 701 | ||||||||||||
|
Colorado
|
63 | 16 | 34 | 113 | ||||||||||||
|
Connecticut
|
70 | 2 | 2 | 74 | ||||||||||||
|
Delaware
|
19 | 1 | -- | 20 | ||||||||||||
|
Florida
|
299 | 35 | 28 | 362 | ||||||||||||
|
Georgia
|
100 | 23 | 44 | 167 | ||||||||||||
|
Hawaii
|
24 | -- | -- | 24 | ||||||||||||
|
Idaho
|
19 | -- | 17 | 36 | ||||||||||||
|
Illinois
|
173 | 16 | 36 | 225 | ||||||||||||
|
Indiana
|
98 | 15 | 42 | 155 | ||||||||||||
|
Iowa
|
35 | 2 | 47 | 84 | ||||||||||||
|
Kansas
|
37 | 4 | 30 | 71 | ||||||||||||
|
Kentucky
|
56 | 5 | 37 | 98 | ||||||||||||
|
Louisiana
|
67 | 9 | 17 | 93 | ||||||||||||
|
Maine
|
22 | 3 | 12 | 37 | ||||||||||||
|
Maryland
|
98 | 12 | 7 | 117 | ||||||||||||
|
Massachusetts
|
113 | 2 | 5 | 120 | ||||||||||||
|
Michigan
|
120 | 23 | 48 | 191 | ||||||||||||
|
Minnesota
|
62 | 19 | 37 | 118 | ||||||||||||
|
Mississippi
|
37 | 6 | 21 | 64 | ||||||||||||
|
Missouri
|
72 | 4 | 53 | 129 | ||||||||||||
|
Montana
|
7 | -- | 28 | 35 | ||||||||||||
|
Nebraska
|
21 | 2 | 20 | 43 | ||||||||||||
|
Nevada
|
38 | 6 | 9 | 53 | ||||||||||||
|
New
Hampshire
|
32 | 4 | 6 | 42 | ||||||||||||
|
New
Jersey
|
159 | 12 | 6 | 177 | ||||||||||||
|
New
Mexico
|
32 | 5 | 13 | 50 | ||||||||||||
|
New
York
|
333 | 14 | 17 | 364 | ||||||||||||
|
North
Carolina
|
124 | 22 | 40 | 186 | ||||||||||||
|
North
Dakota
|
6 | -- | 5 | 11 | ||||||||||||
|
Ohio
|
187 | 14 | 33 | 234 | ||||||||||||
|
Oklahoma
|
39 | -- | 31 | 70 | ||||||||||||
|
Oregon
|
51 | -- | 25 | 76 | ||||||||||||
|
Pennsylvania
|
210 | 20 | 29 | 259 | ||||||||||||
|
Rhode
Island
|
21 | -- | -- | 21 | ||||||||||||
|
South
Carolina
|
53 | 8 | 22 | 83 | ||||||||||||
|
South
Dakota
|
11 | -- | 12 | 23 | ||||||||||||
|
Tennessee
|
68 | 15 | 31 | 114 | ||||||||||||
|
Texas
|
374 | 68 | 92 | 534 | ||||||||||||
|
Utah
|
28 | 8 | 19 | 55 | ||||||||||||
|
Vermont
|
9 | -- | 7 | 16 | ||||||||||||
|
Virginia
|
124 | 14 | 40 | 178 | ||||||||||||
|
Washington
|
91 | 6 | 33 | 130 | ||||||||||||
|
West
Virginia
|
28 | 3 | 8 | 39 | ||||||||||||
|
Wisconsin
|
70 | 10 | 49 | 129 | ||||||||||||
|
Wyoming
|
7 | 1 | 16 | 24 | ||||||||||||
|
District of
Columbia
|
13 | -- | -- | 13 | ||||||||||||
|
Puerto
Rico
|
51 | -- | -- | 51 | ||||||||||||
|
U.S. Virgin
Islands
|
3 | -- | -- | 3 | ||||||||||||
| 4,476 | 562 | 1,277 | 6,315 | |||||||||||||
* Does
not include international dealers.
15
Refer to Note 13 –
“Commitments and Contingencies” in the Notes to Consolidated Financial
Statements.
No
matters were submitted to a vote of security holders during the fourth quarter
of 2009.
EXECUTIVE
OFFICERS OF THE REGISTRANT (SEE ITEM 10 OF PART III).
The following is a
list, as of February 9, 2010, of our executive officers and their ages and
positions.
|
Name
|
Position
(Date Appointed to Current
Position)
|
Executive
Officer Since
|
Age
|
|
Julian C. Day
(1)
|
Chief
Executive Officer and Chairman of the Board (July 2006)
|
2006
|
57
|
|
Lee D.
Applbaum (2)
|
Executive
Vice President – Chief Marketing Officer (September 2008)
|
2008
|
39
|
|
Bryan Bevin
(3)
|
Executive
Vice President – Store Operations (January 2008)
|
2008
|
47
|
|
James F.
Gooch (4)
|
Executive
Vice President and Chief Financial Officer (August 2006)
|
2006
|
42
|
|
John G.
Ripperton (5)
|
Senior Vice
President – Supply Chain (August 2006)
|
2006
|
56
|
|
Martin O.
Moad (6)
|
Vice
President and Controller (August 2007)
|
2007
|
53
|
There are no family
relationships among the executive officers listed, and there are no undisclosed
arrangements or understandings under which any of them were appointed as
executive officers. All executive officers of RadioShack Corporation are
appointed by the Board of Directors to serve until their successors are
appointed or until their death, resignation, retirement, or removal from
office.
|
(1)
|
Mr. Day was
appointed Chief Executive Officer and Chairman of the Board of RadioShack
in July 2006. Prior to his appointment, Mr. Day was a private
investor. Mr. Day became the President and Chief Operating Officer of
Kmart Corporation, a mass merchandising company, in March 2002 and served
as Chief Executive Officer of Kmart from January 2003 to October 2004.
Following the merger of Kmart and Sears, Roebuck and Co., a broadline
retailer, Mr. Day served as a Director of Sears Holding Corporation (the
parent company of Sears, Roebuck and Co. and Kmart Corporation) until
April 2006. Mr. Day joined Sears as Executive Vice President and Chief
Financial Officer in 1999, and was promoted to Chief Operating Officer and
a member of the Office of the Chief Executive, where he served until
2002.
|
|
(2)
|
Mr. Applbaum
was appointed Executive Vice President and Chief Marketing Officer in
September 2008. Previously, Mr. Applbaum was Chief Marketing Officer for
The Schottenstein Stores Corporation, a private retail holding company,
from February 2007 until August 2008, and Senior Vice President and Chief
Marketing Officer for David's Bridal Group, a national bridal retailer,
from April 2004 until February 2007. Prior to joining David's
Bridal Group, Mr. Applbaum served in various capacities for Footstar,
Inc., a footwear retail holding company, from April 2000 until April 2004,
including Chief Marketing Officer of Footstar Athletic and Vice President
of Marketing for Footaction USA.
|
16
|
(3)
|
Mr. Bevin was
appointed Executive Vice President – Store Operations in January 2008.
Before joining RadioShack, Mr. Bevin was Senior Vice President, U.S.
Operations, for Blockbuster Entertainment, a media entertainment company,
from January 2006 until October 2007, and Senior Vice President/General
Manager – Games from June 2005 until December 2005. Prior to joining
Blockbuster, Mr. Bevin was Vice President of Retail for Cingular, a
wireless mobile communications provider, and Managing Director for
Interactive Telecom Solutions, a telecommunications management
firm.
|
|
(4)
|
Mr. Gooch was
appointed Executive Vice President and Chief Financial Officer in August
2006. Previously, Mr. Gooch served as Executive Vice President
– Chief Financial Officer of Entertainment Publications, a discount and
promotions company, from May 2005 to August 2006. From 1996 to
May 2005, Mr. Gooch served in various positions at Kmart Corporation, a
mass merchandising company, including Vice President, Controller and
Treasurer, and Vice President, Corporate Financial Planning and
Analysis.
|
|
(5)
|
Mr. Ripperton
was appointed Senior Vice President – Supply Chain Management in August
2006. Mr. Ripperton joined RadioShack in 2000 and has served as Vice
President – Distribution, Division Vice President - Distribution, Group
General Manager, and Distribution Center Manager.
|
|
(6)
|
Mr. Moad was
appointed Vice President and Controller in August 2007. He has worked for
RadioShack for more than 25 years, and has served as Vice President and
Treasurer, Vice President - Investor Relations, Director - Investor
Relations, Vice President – Controller (InterTAN, Inc.), Vice President –
Assistant Secretary (InterTAN, Inc.), Assistant Secretary (InterTAN,
Inc.), Controller – International Division, and Staff Accountant –
International Division. InterTAN, Inc. was an NYSE-registered
spin-off of RadioShack’s international units.
|
17
PART
II
PRICE
RANGE OF COMMON STOCK
Our common stock is
listed on the New York Stock Exchange and trades under the symbol "RSH." The
following table presents the high and low trading prices for our common stock,
as reported in the composite transaction quotations of consolidated trading for
issues on the New York Stock Exchange, for each quarter in the two years ended
December 31, 2009.
|
Dividends
|
||||||||||||
|
Quarter
Ended
|
High
|
Low
|
Declared
|
|||||||||
|
December 31,
2009
|
$20.57 | $14.82 | $0.25 | |||||||||
|
September 30,
2009
|
17.45 | 12.66 | -- | |||||||||
|
June 30,
2009
|
15.20 | 8.38 | -- | |||||||||
|
March 31,
2009
|
12.95 | 6.47 | -- | |||||||||
|
December 31,
2008
|
$17.28 | $8.06 | $0.25 | |||||||||
|
September 30,
2008
|
19.90 | 11.56 | -- | |||||||||
|
June 30,
2008
|
17.62 | 11.93 | -- | |||||||||
|
March 31,
2008
|
19.46 | 13.31 | -- | |||||||||
HOLDERS
OF RECORD
At
February 16, 2010, there were 18,050 holders of record of our common
stock.
DIVIDENDS
The Board of
Directors annually reviews our dividend policy. On November 9, 2009, our Board
of Directors declared an annual dividend of $0.25 per share. The dividend was
paid on December 16, 2009, to stockholders of record on November 27,
2009.
The following table
sets forth information concerning purchases made by or on behalf of RadioShack
or any affiliated purchaser (as defined in the SEC’s rules) of RadioShack common
stock for the periods indicated.
PURCHASES
OF EQUITY SECURITIES BY RADIOSHACK
|
Total
Number
of
Shares
Purchased
|
Average
Price
Paid
per
Share
|
Total
Number
of
Shares
Purchased
as
Part of
Publicly
Announced
Plans
or
Programs
(1)
|
Approximate
Dollar Value
of
Shares That
May
Yet
Be
Purchased
Under
the Plans
or
Programs
(1)
(2)
|
|||||||||||||
|
October 1 –
31, 2009
|
1,732 | (3) | $15.58 | -- | $290,042,027 | |||||||||||
|
November 1 –
30, 2009
|
-- | -- | -- | $290,042,027 | ||||||||||||
|
December 1 –
31, 2009
|
-- | -- | -- | $290,042,027 | ||||||||||||
|
Total
|
1,732 | -- | ||||||||||||||
|
(1)
|
RadioShack
announced a $200 million share repurchase program on July 24, 2008, which
has no stated expiration date. On August 20, 2009, we announced a $200
million increase in this share repurchase program. As of December 31,
2009, $290 million of the total authorized amount was available for share
repurchases under this program.
|
|
(2)
|
During the
period covered by this table, no publicly announced program expired or was
terminated, and no determination was made by RadioShack to suspend or
cancel purchases under our program.
|
|
(3)
|
Shares
acquired by RadioShack for tax withholdings upon vesting of restricted
stock awards, which were not repurchased pursuant to a share repurchase
program.
|
18
RADIOSHACK
STOCK COMPARATIVE PERFORMANCE GRAPH
The
following stock performance graph and related information shall not be deemed
“soliciting material” or “filed” with the SEC, nor shall such information be
incorporated by reference into any of our future filings under the Securities
Act of 1933, as amended, or the Exchange Act, except to the extent that we
specifically incorporate it by reference in the filing.
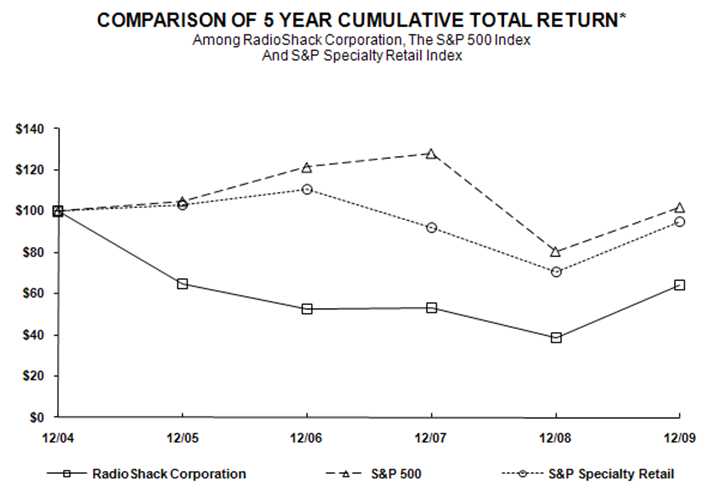
The graph below
compares the cumulative total shareholder return on RadioShack common stock for
the last five years with the cumulative total return on the Standard &
Poor's 500 Index, of which we are a component, and the Standard & Poor's
Specialty Retail Index, of which we are also a component. The S&P Specialty
Retail Index is a capitalization-weighted index of domestic equities traded on
the NYSE and NASDAQ, and includes high-capitalization stocks representing the
specialty retail sector of the S&P 500. The graph assumes an investment of
$100 at the close of trading on December 31, 2004, in RadioShack common stock,
the S&P 500 Index and the S&P Specialty Retail Index.
| 12/04 | 12/05 | 12/06 | 12/07 | 12/08 | 12/09 | |||||||||||||||||||
|
RadioShack
Corporation
|
$ | 100.00 | $ | 64.66 | $ | 52.34 | $ | 53.32 | $ | 38.77 | $ | 64.19 | ||||||||||||
|
S&P 500
Index
|
100.00 | 104.91 | 121.48 | 128.16 | 80.74 | 102.11 | ||||||||||||||||||
|
S&P
Specialty Retail Index
|
100.00 | 103.11 | 110.49 | 92.19 | 70.48 | 94.97 |
*
Cumulative Total Return assumes dividend reinvestment.
Information Source:
Standard & Poor's, a division of The McGraw-Hill Companies Inc.
19
RADIOSHACK
CORPORATION AND SUBSIDIARIES
|
Year
Ended December 31,
|
||||||||||||||||||||
|
(Dollars and
shares in millions, except per share
amounts,
ratios,
locations and square footage)
|
2009
|
2008
(4)
|
2007
|
2006
(5)
|
2005
|
|||||||||||||||
|
Statements
of Income Data
|
||||||||||||||||||||
|
Net sales and
operating revenues
|
$ | 4,276.0 | $ | 4,224.5 | $ | 4,251.7 | $ | 4,777.5 | $ | 5,081.7 | ||||||||||
|
Operating
income
|
$ | 369.4 | $ | 322.2 | $ | 381.9 | $ | 156.9 | $ | 349.9 | ||||||||||
|
Net
income
|
$ | 205.0 | $ | 189.4 | $ | 236.8 | $ | 73.4 | $ | 267.0 | ||||||||||
|
Net income per
share:
|
||||||||||||||||||||
|
Basic
|
$ | 1.63 | $ | 1.47 | $ | 1.76 | $ | 0.54 | $ | 1.80 | ||||||||||
|
Diluted
|
$ | 1.63 | $ | 1.47 | $ | 1.74 | $ | 0.54 | $ | 1.79 | ||||||||||
|
Shares used in
computing income per share:
|
||||||||||||||||||||
|
Basic
|
125.4 | 129.0 | 134.6 | 136.2 | 148.1 | |||||||||||||||
|
Diluted
|
126.1 | 129.1 | 135.9 | 136.2 | 148.8 | |||||||||||||||
|
Gross profit
as a percent of sales
|
45.9 | % | 45.5 | % | 47.6 | % | 44.6 | % | 44.6 | % | ||||||||||
|
SG&A
expense as a percent of sales
|
35.3 | % | 35.7 | % | 36.2 | % | 37.9 | % | 35.5 | % | ||||||||||
|
Operating
income as a percent of sales
|
8.6 | % | 7.6 | % | 9.0 | % | 3.3 | % | 6.9 | % | ||||||||||
|
Balance
Sheet Data
|
||||||||||||||||||||
|
Inventories
|
$ | 670.6 | $ | 636.3 | $ | 705.4 | $ | 752.1 | $ | 964.9 | ||||||||||
|
Total
assets
|
$ | 2,429.3 | $ | 2,254.0 | $ | 1,989.6 | $ | 2,070.0 | $ | 2,205.1 | ||||||||||
|
Working
capital
|
$ | 1,361.2 | $ | 1,154.4 | $ | 818.8 | $ | 615.4 | $ | 641.0 | ||||||||||
|
Capital
structure:
|
||||||||||||||||||||
|
Current
debt
|
$ | 41.6 | $ | 39.3 | $ | 61.2 | $ | 194.9 | $ | 40.9 | ||||||||||
|
Long-term
debt
|
$ | 627.8 | $ | 659.5 | $ | 348.2 | $ | 345.8 | $ | 494.9 | ||||||||||
|
Total
debt
|
$ | 669.4 | $ | 698.8 | $ | 409.4 | $ | 540.7 | $ | 535.8 | ||||||||||
|
Cash and cash equivalents less
total debt
|
$ | 238.8 | $ | 116.0 | $ | 100.3 | $ | (68.7 | ) | $ | (311.8 | ) | ||||||||
|
Stockholders'
equity
|
$ | 1,048.3 | $ | 860.8 | $ | 769.7 | $ | 653.8 | $ | 588.8 | ||||||||||
|
Total capitalization (1)
|
$ | 1,717.7 | $ | 1,559.6 | $ | 1,179.1 | $ | 1,194.5 | $ | 1,124.6 | ||||||||||
|
Long-term debt as a % of total
capitalization (1)
|
36.6 | % | 42.3 | % | 29.5 | % | 29.0 | % | 44.0 | % | ||||||||||
|
Total debt as a % of total
capitalization (1)
|
39.0 | % | 44.8 | % | 34.7 | % | 45.3 | % | 47.6 | % | ||||||||||
|
Book value per share at year
end
|
$ | 8.37 | $ | 6.88 | $ | 5.87 | $ | 4.81 | $ | 4.36 | ||||||||||
|
Financial
Ratios
|
||||||||||||||||||||
|
Return on
average stockholders' equity
|
21.5 | % | 22.9 | % | 33.2 | % | 11.8 | % | 35.3 | % | ||||||||||
|
Return on
average assets
|
8.9 | % | 9.3 | % | 12.3 | % | 3.4 | % | 11.3 | % | ||||||||||
|
Annual
inventory turnover
|
3.6 | 3.5 | 3.3 | 2.9 | 2.7 | |||||||||||||||
|
Other
Data
|
||||||||||||||||||||
|
Adjusted EBITDA (2)
|
$ | 462.3 | $ | 421.3 | $ | 494.6 | $ | 285.1 | $ | 473.7 | ||||||||||
|
Dividends
declared per share
|
$ | 0.25 | $ | 0.25 | $ | 0.25 | $ | 0.25 | $ | 0.25 | ||||||||||
|
Capital
expenditures
|
$ | 81.0 | $ | 85.6 | $ | 45.3 | $ | 91.0 | $ | 170.7 | ||||||||||
|
Number of
retail locations at year end:
|
||||||||||||||||||||
|
U.S. RadioShack
company-operated stores
|
4,476 | 4,453 | 4,447 | 4,467 | 4,972 | |||||||||||||||
|
Kiosks
|
562 | 688 | 739 | 772 | 777 | |||||||||||||||
|
Mexico RadioShack
company-operated stores
|
204 | 200 | -- | -- | -- | |||||||||||||||
|
Dealer and other
outlets
|
1,321 | 1,411 | 1,484 | 1,596 | 1,711 | |||||||||||||||
|
Total
|
6,563 | 6,752 | 6,670 | 6,835 | 7,460 | |||||||||||||||
|
Average square
footage per U.S. RadioShack
company-operated
store
|
2,504 | 2,505 | 2,527 | 2,496 | 2,489 | |||||||||||||||
|
Comparable store sales increase
(decrease) (3)
|
1.3 | % | (0.6 | %) | (8.2 | %) | (5.6 | %) | 0.9 | % | ||||||||||
|
Shares
outstanding
|
125.2 | 125.1 | 131.1 | 135.8 | 135.0 | |||||||||||||||
This table should
be read in conjunction with MD&A and the Consolidated Financial Statements
and related Notes.
20
|
(1)
|
Capitalization
is defined as total debt plus total stockholders'
equity.
|
|
(2)
|
Adjusted
EBITDA, a non-GAAP financial measure, is defined as earnings before
interest, taxes, depreciation and amortization. Our calculation of
adjusted EBITDA is also adjusted for other (loss) income and cumulative
effect of change in accounting principle. The comparable financial measure
to adjusted EBITDA under GAAP is net income. Adjusted EBITDA is used by
management to evaluate the operating performance of our business for
comparable periods and is a metric used in the computation of annual and
long-term incentive management bonuses. Adjusted EBITDA should not be used
by investors or others as the sole basis for formulating investment
decisions as it excludes a number of important items. We compensate for
this limitation by using GAAP financial measures as well in managing our
business. In the view of management, adjusted EBITDA is an important
indicator of operating performance because adjusted EBITDA excludes the
effects of financing and investing activities by eliminating the effects
of interest and depreciation costs.
|
|
(3)
|
Comparable
store sales include the sales of U.S. RadioShack company-operated stores
and kiosks with more than 12 full months of recorded sales. Following the
termination of the Sprint-branded kiosk business, these former
Sprint-branded kiosks were transformed into multiple wireless carrier
RadioShack-branded locations. We managed and reported 111 of these
locations as extensions of existing RadioShack company-operated stores
located in the same shopping malls at December 31, 2009; current year
results of such kiosks are included with these RadioShack company-operated
stores for purposes of comparable store sales. For more information
regarding the transition of the Sprint-branded kiosks to
RadioShack-branded locations, see Item 1 – “Business” in this Annual
Report on Form 10-K.
|
|
(4)
|
Due to our
adoption of the FASB’s new rules regarding accounting for convertible
debt, certain 2008 amounts have been adjusted from the amounts included in
our Annual Report on Form 10-K for the year ended December 31, 2008. Refer
to Note 2 – “Summary of Significant Accounting Policies” under the section
titled “New Accounting Standards” in the Notes to Consolidated Financial
Statements for discussion of these adjustments.
|
|
(5)
|
These amounts
were affected by our 2006 restructuring program. For more information,
please refer to our Consolidated Financial Statements and related Notes
included in our 2006 Annual Report on Form
10-K.
|
The following table
is a reconciliation of adjusted EBITDA to net income.
|
Year
Ended December 31,
|
||||||||||||||||||||
|
(In
millions)
|
2009
|
2008
(4)
|
2007
|
2006
(5)
|
2005
|
|||||||||||||||
|
Reconciliation
of Adjusted EBITDA to Net Income
|
||||||||||||||||||||
|
Adjusted
EBITDA
|
$ | 462.3 | $ | 421.3 | $ | 494.6 | $ | 285.1 | $ | 473.7 | ||||||||||
|
Interest
expense, net of interest income
|
(39.3 | ) | (20.3 | ) | (16.2 | ) | (36.9 | ) | (38.6 | ) | ||||||||||
|
Provision for
income taxes
|
(123.5 | ) | (110.1 | ) | (129.8 | ) | (38.0 | ) | (51.6 | ) | ||||||||||
|
Depreciation
and amortization
|
(92.9 | ) | (99.1 | ) | (112.7 | ) | (128.2 | ) | (123.8 | ) | ||||||||||
|
Other (loss)
income
|
(1.6 | ) | (2.4 | ) | 0.9 | (8.6 | ) | 10.2 | ||||||||||||
|
Cumulative
effect of change in accounting
principle,
net of $1.8 million tax benefit
|
-- | -- | -- | -- | (2.9 | ) | ||||||||||||||
|
Net
income
|
$ | 205.0 | $ | 189.4 | $ | 236.8 | $ | 73.4 | $ | 267.0 | ||||||||||
21
This MD&A
section discusses our results of operations, liquidity and financial condition,
risk management practices, critical accounting policies, and estimates and
certain factors that may affect our future results, including economic and
industry-wide factors. Our MD&A should be read in conjunction with our
consolidated financial statements and accompanying notes, included in this
Annual Report on Form 10-K, as well as the Risk Factors set forth in Item 1A
above.
OVERVIEW
Highlights related
to the year ended December 31, 2009, include:
|
·
|
Net sales and
operating revenues increased $51.5 million, or 1.2%, to $4,276.0 million
when compared with last year. Comparable store sales increased 1.3%. This
increase was driven primarily by increased sales in our Sprint Nextel
postpaid wireless business, the addition of T-Mobile as a postpaid
wireless carrier in our company-operated stores, increased sales of
prepaid wireless handsets and airtime, increased sales of netbooks, and
increased sales of digital televisions, but was partially offset by sales
declines in GPS products, digital-to-analog converter boxes, wireless
accessories, digital music players, batteries, and digital cameras.
Consolidated net sales and operating revenues also benefited from the
consolidation of our Mexico subsidiary for all of
2009.
|
|
·
|
Gross margin
increased 40 basis points to 45.9% from last year. Gross margin was
positively impacted by improved product mix combined with fewer markdowns
as a result of more effective promotional productivity, inventory
management and higher sell-through of seasonal
products.
|
|
·
|
Selling,
general and administrative (“SG&A”) expense decreased $1.9 million
when compared with last year. As a percentage of net sales and operating
revenues, SG&A decreased by 40 basis points to 35.3%. Significant
changes within SG&A expense include the full year results of our
Mexican subsidiary, more incentive compensation, and lower advertising
expense.
|
|
·
|
As a result
of the factors above, operating income increased $47.2 million, or 14.6%,
to $369.4 million when compared with last
year.
|
|
·
|
Net income
increased $15.6 million to $205.0 million when compared with last year.
Net income per diluted share was $1.63 compared with $1.47 last
year.
|
|
·
|
Adjusted
EBITDA increased $41.0 million, or 9.7%, to $462.3 million when compared
with last year.
|
22
RESULTS
OF OPERATIONS
Due to our adoption
of the FASB’s new rules regarding accounting for convertible debt, certain 2008
amounts have been adjusted from the amounts included in our Annual Report on
Form 10-K for the year ended December 31, 2008. Refer to Note 2 – “Summary of
Significant Accounting Policies” under the section titled “New Accounting
Standards” in the Notes to Consolidated Financial Statements for discussion of
these adjustments.
Net
Sales and Operating Revenues
Consolidated net sales
increased 1.2% or $51.5 million to $4,276.0 million for the year ended December
31, 2009, compared with $4,224.5 million in
2008. This increase was primarily due to a comparable store sales increase of
1.3% in 2009.
The increase in comparable store sales was driven primarily by increased sales
in our wireless and modern home platforms, but was partially offset by decreased
sales in our accessory and personal electronics platforms.
Consolidated net
sales and operating revenues for our two reportable segments and other sales are
as follows:
|
Year Ended
December 31,
|
||||||||||||
|
(In millions)
|
2009
|
2008
|
2007
|
|||||||||
|
U.S.
RadioShack company-operated stores
|
$ | 3,650.9 | $ | 3,611.1 | $ | 3,637.7 | ||||||
|
Kiosks
|
250.0 | 283.5 | 297.0 | |||||||||
|
Other (1)
|
375.1 | 329.9 | 317.0 | |||||||||
|
Consolidated
net sales and operating revenues
|
$ | 4,276.0 | $ | 4,224.5 | $ | 4,251.7 | ||||||
|
Consolidated
net sales and operating
revenues increase
(decrease)
|
1.2 | % | (0.6 | %) | (11.0 | %) | ||||||
|
Comparable
store sales increase (decrease) (2)
|
1.3 | % | (0.6 | %) | (8.2 | %) | ||||||
|
(1)
|
Net sales and
operating revenues for 2009 include the consolidation of our Mexican
subsidiary.
|
|
(2)
|
Comparable
store sales include the sales of U.S. RadioShack company-operated stores
and kiosks with more than 12 full months of recorded sales. Following the
termination of the Sprint-branded kiosk business, these former
Sprint-branded kiosks were transformed into multiple wireless carrier
RadioShack-branded locations. We managed and reported 111 of these
locations as extensions of existing RadioShack company-operated stores
located in the same shopping malls at December 31, 2009; current year
results of such kiosks are included with these RadioShack company-operated
stores for purposes of comparable store sales. For more information
regarding the transition of the Sprint-branded kiosks to
RadioShack-branded locations, see Item 1 – “Business” in this Annual
Report on Form 10-K.
|
The following table
provides a summary of our consolidated net sales and operating revenues by
platform and as a percent of net sales and operating revenues. These
consolidated platform sales include sales from our U.S. RadioShack
company-operated stores and kiosks, as well as other sales.
|
Consolidated
Net Sales and Operating Revenues
|
||||||||||||||||||||||||
|
Year Ended
December 31,
|
||||||||||||||||||||||||
|
(In millions)
|
2009
|
2008
|
2007
|
|||||||||||||||||||||
|
Wireless
|
$ | 1,633.3 | 38.2 | % | $ | 1,387.3 | 32.8 | % | $ | 1,415.8 | 33.3 | % | ||||||||||||
|
Accessory
|
1,058.6 | 24.8 | 1,174.6 | 27.8 | 1,019.2 | 24.0 | ||||||||||||||||||
|
Modern
home
|
561.0 | 13.1 | 531.8 | 12.6 | 557.1 | 13.1 | ||||||||||||||||||
|
Personal
electronics
|
454.9 | 10.6 | 549.2 | 13.0 | 657.2 | 15.5 | ||||||||||||||||||
|
Power
|
227.6 | 5.3 | 244.9 | 5.8 | 251.7 | 5.9 | ||||||||||||||||||
|
Technical
|
181.1 | 4.2 | 184.6 | 4.4 | 185.5 | 4.4 | ||||||||||||||||||
|
Service
|
115.3 | 2.7 | 95.5 | 2.3 | 100.3 | 2.3 | ||||||||||||||||||
|
Other sales
(1)
|
44.2 | 1.1 | 56.6 | 1.3 | 64.9 | 1.5 | ||||||||||||||||||
|
Consolidated
net sales and
operating revenues
|
$ | 4,276.0 | 100.0 | % | $ | 4,224.5 | 100.0 | % | $ | 4,251.7 | 100.0 | % | ||||||||||||
|
(1)
|
Other sales
include outside sales from repair services and outside sales of our global
sourcing operations and domestic and overseas manufacturing
facilities.
|
23
2009
COMPARED WITH 2008
U.S.
RadioShack Company-Operated Stores Segment
The following table
provides a summary of our net sales and operating revenues by platform and as a
percent of net sales and operating revenues for the U.S. RadioShack
company-operated stores segment.
|
Net Sales and
Operating Revenues
|
||||||||||||||||||||||||
|
Year Ended
December 31,
|
||||||||||||||||||||||||
|
(In millions)
|
2009
|
2008
|
2007
|
|||||||||||||||||||||
|
Wireless
|
$ | 1,342.1 | 36.8 | % | $ | 1,070.7 | 29.7 | % | $ | 1,085.6 | 29.8 | % | ||||||||||||
|
Accessory
|
968.6 | 26.5 | 1,085.0 | 30.0 | 941.1 | 25.9 | ||||||||||||||||||
|
Modern
home
|
471.8 | 12.9 | 462.6 | 12.8 | 494.5 | 13.6 | ||||||||||||||||||
|
Personal
electronics
|
384.7 | 10.5 | 492.3 | 13.6 | 596.6 | 16.4 | ||||||||||||||||||
|
Power
|
204.7 | 5.6 | 227.3 | 6.3 | 235.8 | 6.5 | ||||||||||||||||||
|
Technical
|
167.3 | 4.6 | 170.9 | 4.7 | 173.3 | 4.7 | ||||||||||||||||||
|
Service
|
109.3 | 3.0 | 93.1 | 2.6 | 97.2 | 2.7 | ||||||||||||||||||
|
Other
|
2.4 | 0.1 | 9.2 | 0.3 | 13.6 | 0.4 | ||||||||||||||||||
|
Net sales and
operating
revenues
|
$ | 3,650.9 | 100.0 | % | $ | 3,611.1 | 100.0 | % | $ | 3,637.7 | 100.0 | % | ||||||||||||
Sales in our
wireless platform (includes postpaid and prepaid wireless handsets, commissions,
residual income and communication devices such as scanners and GPS products)
increased 25.3%
in 2009. This sales increase was driven by increased sales in our Sprint Nextel
postpaid wireless business, the addition of T-Mobile as a postpaid wireless
carrier, and increased sales of prepaid wireless handsets. These increases were
partially offset by decreased sales of GPS products.
Sales in our
accessory platform (includes home entertainment, wireless, music, computer,
video game and GPS accessories; media storage; power adapters; digital imaging
products and headphones) decreased 10.7% in 2009. This
sales decrease was primarily driven by decreased sales in digital-to-analog
converter boxes, wireless accessories, imaging accessories, and media storage,
but was partially offset by increased sales of television antennas. Consolidated
sales of converter boxes were $170.1 million and $204.8 million in 2009 and
2008, respectively. The decrease in converter box sales occurred in the second
half of the year after the transition to digital television occurred in June
2009. We expect sales of converter boxes to be minimal in 2010.
Sales in our modern
home platform (includes home audio and video end-products, personal computing
products, residential telephones, and Voice over Internet Protocol (“VoIP”)
products) increased 2.0% in 2009. In this
platform we recorded sales gains in netbooks, digital televisions, and VoIP
products, which were substantially offset by sales declines in laptops,
residential telephones, and DVD players.
Sales in our
personal electronics platform (includes digital cameras, digital music players,
toys, satellite radios, video gaming hardware, camcorders, and general radios)
decreased 21.9%
in 2009. This decrease was driven primarily by sales declines in digital
cameras, digital music players, video game consoles, satellite radios, and
toys.
Sales in our power
platform (includes general and special purpose batteries and battery chargers)
decreased 9.9%
in 2009. This decrease was primarily driven by decreased sales of both general
and special purpose batteries. Our sales performance in this platform was
negatively affected by the disruption during the transition process of the
assortment to our Enercell brand. This transition process will be complete in
the first quarter of 2010.
Sales in our
technical platform (includes wire and cable, connectivity products, components
and tools, and hobby products) decreased 2.1% in 2009. We
recorded an increase in sales of wire and cable products, which was more than
offset by decreased sales across most of the other product categories in this
platform.
24
Sales in our
service platform (includes prepaid wireless airtime, extended service plans,
AT&T’s ConnecTech service, and bill payment revenue) increased 17.4% in 2009. This
increase was driven primarily by increased sales of prepaid wireless airtime and
extended service plans.
Kiosks
Segment
Kiosk sales consist
primarily of handset sales, postpaid and prepaid commission revenue and related
wireless accessory sales. Kiosk sales decreased 11.8% or $33.5 million in 2009.
We realized a sales increase in our Sam’s Club business, which was offset by a
reduced number of kiosk locations. This decrease in locations was partially due
to the closure of underperforming Sprint-branded kiosk locations in the first
half of 2009 and the closure of the remainder of our Sprint-branded kiosks in
the third quarter. For more information regarding the reduction in kiosk
outlets, see the Retail Locations table in Item 2 – “Properties” in this Annual
Report on Form 10-K.
In
June 2009, Sam’s Club notified us of their intent to exercise their right to
assume operation of certain kiosk locations. This could result in the transfer
of up to approximately 45 kiosks to Sam’s Club starting in the first quarter of
2010. For more information
regarding our arrangement with Sam’s Club, see the Kiosks section in Item 1 –
“Business” in this Annual Report on Form 10-K.
Other
Sales
Other sales include
sales to our independent dealers, outside sales through our service centers,
sales generated by our www.radioshack.com Web site
and our Mexican subsidiary, sales to commercial customers, and outside sales of
our global sourcing operations and manufacturing. Other sales increased $45.2
million or 13.7% in 2009. This sales increase was primarily attributable to the
consolidation of our Mexican subsidiary for all of 2009, but was partially
offset by decreased sales to our independent dealers. Our Mexican subsidiary
represented less than 5% of consolidated net sales and operating revenues in
2009.
Gross
Profit
Consolidated gross
profit and gross margin are as follows:
|
Year Ended
December 31,
|
||||||||||||
|
(In millions)
|
2009
|
2008
|
2007
|
|||||||||
|
Gross
profit
|
$ | 1,962.5 | $ | 1,922.7 | $ | 2,025.8 | ||||||
|
Gross profit
increase (decrease)
|
2.1 | % | (5.1 | %) | (4.9 | %) | ||||||
|
Gross
margin
|
45.9 | % | 45.5 | % | 47.6 | % | ||||||
Consolidated gross
profit and gross margin for 2009 were $1,962.5 million and 45.9%, respectively,
compared with $1,922.7 million and 45.5% in 2008, resulting in a 2.1% increase
in gross profit dollars and a 40 basis point increase in our gross
margin.
The improvement in
gross margin was partially driven by improved product mix combined with fewer
markdowns as a result of more effective promotional productivity, inventory
management and higher sell-through of seasonal products.
25
Selling,
General and Administrative Expense
Our consolidated
SG&A expense decreased 0.1% or $1.9 million in 2009. This
represents a 40 basis point decrease as a percentage of net sales and operating
revenues compared to 2008.
The table below
summarizes the breakdown of various components of our consolidated SG&A
expense and its related percentage of total net sales and operating
revenues.
|
Year Ended
December 31,
|
||||||||||||||||||||||||
|
2009
|
2008
|
2007
|
||||||||||||||||||||||
|
%
of
|
%
of
|
%
of
|
||||||||||||||||||||||
|
Sales
&
|
Sales
&
|
Sales
&
|
||||||||||||||||||||||
|
(In millions)
|
Dollars
|
Revenues
|
Dollars
|
Revenues
|
Dollars
|
Revenues
|
||||||||||||||||||
|
Compensation
|
$ | 655.7 | 15.3 | % | $ | 617.5 | 14.6 | % | $ | 638.6 | 15.0 | % | ||||||||||||
|
Rent and
occupancy
|
289.7 | 6.8 | 292.6 | 6.9 | 301.5 | 7.1 | ||||||||||||||||||
|
Advertising
|
193.0 | 4.5 | 214.5 | 5.1 | 208.8 | 4.9 | ||||||||||||||||||
|
Other taxes
(excludes
income taxes)
|
102.0 | 2.4 | 87.9 | 2.1 | 103.0 | 2.4 | ||||||||||||||||||
|
Utilities
|
55.3 | 1.3 | 58.7 | 1.4 | 61.4 | 1.4 | ||||||||||||||||||
|
Insurance
|
47.5 | 1.1 | 55.0 | 1.3 | 58.1 | 1.4 | ||||||||||||||||||
|
Credit card
fees
|
37.7 | 0.9 | 37.7 | 0.9 | 37.8 | 0.9 | ||||||||||||||||||
|
Professional
fees
|
23.9 | 0.6 | 23.7 | 0.6 | 16.6 | 0.4 | ||||||||||||||||||
|
Repairs and
maintenance
|
22.3 | 0.5 | 19.5 | 0.5 | 14.1 | 0.3 | ||||||||||||||||||
|
Licenses
|
11.5 | 0.3 | 12.4 | 0.3 | 12.7 | 0.3 | ||||||||||||||||||
|
Printing,
postage and office
supplies
|
8.1 | 0.2 | 8.1 | 0.2 | 9.6 | 0.2 | ||||||||||||||||||
|
Matching
contributions to
savings plans
|
6.0 | 0.1 | 6.5 | 0.2 | 7.2 | 0.2 | ||||||||||||||||||
|
Recruiting,
training &
employee relations
|
5.4 | 0.1 | 6.9 | 0.2 | 6.8 | 0.2 | ||||||||||||||||||
|
Travel
|
4.6 | 0.1 | 5.4 | 0.1 | 5.2 | 0.1 | ||||||||||||||||||
|
Warranty and
product repair
|
2.7 | 0.1 | 4.2 | 0.1 | 5.1 | 0.1 | ||||||||||||||||||
|
Other
|
42.5 | 1.0 | 59.2 | 1.2 | 52.0 | 1.3 | ||||||||||||||||||
| $ | 1,507.9 | 35.3 | % | $ | 1,509.8 | 35.7 | % | $ | 1,538.5 | 36.2 | % | |||||||||||||
Compensation
expense increased in dollars and as a percentage of net sales and operating
revenues. This increase was driven by more incentive compensation and the
consolidation of our Mexican subsidiary for all of 2009.
Total rent and
occupancy decreased from 2008. This decrease was primarily driven by reduced
rent related to our amended headquarters lease, discussed below, and the closing
of our Sprint-branded kiosks. These decreases were partially offset by the
consolidation of our Mexican subsidiary for all of 2009.
Advertising expense
decreased in 2009 primarily due to reduced spending in the second quarter of the
year. While our advertising expense in the second half of the year was
consistent with the same period last year, we shifted a significant portion of
our advertising expenditures from product specific promotional activities to
building awareness of our new brand creative platform, THE SHACK™.
The increase in
other taxes was partially driven by increased payroll taxes associated with
increased compensation expense. Additionally, we recorded an $8.2 million sales
and use tax benefit from the settlement of a sales tax issue in
2008.
Our insurance
expense has decreased in recent years due to lower workers’ compensation costs.
This has been the result of better claims experience during this
time.
26
The decrease in
other SG&A expense was primarily due to a $12.1 million non-cash charge
recorded in connection with our amended headquarters lease in 2008. See below
for further discussion.
Amended Corporate Headquarters Lease:
In June 2008, Tarrant County College District (“TCC”) announced that it
had purchased from Kan Am Grund Kapitalanlagegesellschaft mbH (“Kan Am”) the
buildings and real property comprising our corporate headquarters in Fort Worth,
Texas, which we had previously sold to Kan Am and then leased for a period of 20
years in a sale and lease-back transaction in December 2005.
In
connection with the above sale to TCC, we entered into an agreement with TCC to
convey certain personal property located in the corporate headquarters and
certain real property located in close proximity to the corporate headquarters
in exchange for an amended and restated lease to occupy a reduced portion of the
corporate headquarters for a shorter time period. The amended and restated lease
agreement provides for us to occupy approximately 40% of the corporate
headquarters complex for a primary term of three years with no rental payments
required during the term. The agreement also provides for one two-year option to
renew approximately half of the space at market-based rents.
This agreement
resulted in a non-cash net charge to other SG&A expense of $12.1 million for
the second quarter of 2008. This net amount consisted of a net loss of $2.8
million related to the assets conveyed to TCC and a $9.3 million charge to
reduce a receivable for economic development incentives associated with the
corporate headquarters to its net realizable value.
Depreciation
and Amortization
The table below
gives a summary of our total depreciation and amortization by
segment.
|
Year Ended
December 31,
|
||||||||||||
|
(In millions)
|
2009
|
2008
|
2007
|
|||||||||
|
U.S.
RadioShack company-operated stores
|
$ | 45.8 | $ | 52.9 | $ | 53.4 | ||||||
|
Kiosks
|
3.2 | 5.8 | 6.3 | |||||||||
|
Other
|
5.8 | 1.8 | 1.7 | |||||||||
|
Unallocated
|
38.1 | 38.6 | 51.3 | |||||||||
|
Total
depreciation and amortization
|
$ | 92.9 | $ | 99.1 | $ | 112.7 | ||||||
The table below
provides an analysis of total depreciation and amortization.
|
Year Ended
December 31,
|
||||||||||||
|
(In millions)
|
2009
|
2008
|
2007
|
|||||||||
|
Depreciation
and amortization expense
|
$ | 83.7 | $ | 87.9 | $ | 102.7 | ||||||
|
Depreciation
and amortization included in
cost of products sold
|
9.2 | 11.2 | 10.0 | |||||||||
|
Total
depreciation and amortization
|
$ | 92.9 | $ | 99.1 | $ | 112.7 | ||||||
Total depreciation
and amortization for 2009 declined $6.2 million or 6.3%. This decrease was
primarily due to reduced capital expenditures in recent years when compared with
prior years.
Impairment
of Long-Lived Assets
Impairment of
long-lived assets was $1.5 million and $2.8 million for 2009 and 2008,
respectively. These amounts were related primarily to underperforming U.S.
RadioShack company-operated stores and kiosk locations.
27
Net
Interest Expense
Consolidated net
interest expense, which is interest expense net of interest income, was $39.3 million for 2009 compared with
$20.3 million
for 2008.
Interest expense
primarily consists of interest paid on the stated coupon rate for our
outstanding bonds, the non-cash amortization of discounts and premiums on our
outstanding bonds, cash paid or received on our interest rate swaps, and the
non-cash change in fair value of our interest rate swaps in 2009. Interest
expense increased $9.2 million in 2009. This increase was
primarily driven by increased interest expense related to our 2013 convertible
notes. These notes were outstanding for twelve months in 2009 and four months in
2008. This increase was partially offset by increased payments received
on our interest rate swap contracts in 2009 and the repurchase of $43.2 million
of our notes due in May 2011. Non-cash interest expense was
$13.7 million in 2009 compared with $5.0 million in 2008.
Interest income
decreased $9.8
million in 2009.
This decrease was due to a lower interest rate environment in 2009, but was
partially offset by larger average cash balances in 2009.
Other
Loss
During 2009 we
recorded a loss of $1.6 million compared with a loss of $2.4 million in 2008.
The 2009 loss was recognized in conjunction with the repurchase of a portion of
our 2011 Notes. The 2008 loss represented losses related to our derivative
exposure to Sirius XM Radio, Inc. warrants as a result of our fair value
measurements of these warrants. At December 31, 2008, the fair value of these
warrants was zero, and these warrants expired in the first quarter of
2009.
Income
Tax Expense
Our effective tax
rate for 2009 was 37.6% compared with 36.8% for 2008. The 2009 effective tax
rate was affected by the net reversal of approximately $6.1 million in
previously unrecognized tax benefits, deferred tax assets and accrued interest
due to the effective settlement of state income tax matters during the period.
These discrete items lowered the effective tax rate by 1.9 percentage
points.
The 2008 effective
tax rate was affected by the execution of a closing agreement with respect to a
Puerto Rico income tax matter during the year, which resulted in a credit to
income tax expense; this discrete item lowered the effective tax rate for 2008
by 1.0 percentage point. In addition, the 2008 effective tax rate was affected
by the net reversal of approximately $4.1 million in unrecognized tax benefits,
deferred tax assets and accrued interest related to the settlement of various
state income tax matters and the expiration of the statute of limitations with
respect to our 2002 taxable year; this net reversal lowered the effective tax
rate for 2008 by 1.4 percentage points.
2008
COMPARED WITH 2007
Net
Sales and Operating Revenues
Consolidated net sales
decreased 0.6% or $27.2 million to $4,224.5 million in 2008, from $4,251.7 million in
2007. This decrease was primarily due to a comparable store sales decline of
0.6% in 2008.
The decrease in comparable store sales was primarily caused by decreased sales
in our personal electronics and modern home platforms, but was offset by
increased sales in our accessory platform.
U.S.
RadioShack Company-Operated Stores Segment
Sales in our
wireless platform decreased 1.4% in 2008. While we
recorded sales gains related to our AT&T postpaid wireless business and
prepaid wireless handsets, these gains were substantially offset by declines in
the Sprint Nextel postpaid wireless business and, to a lesser extent, sales of
GPS devices.
Sales in our
accessory platform increased 15.3% in 2008. This
increase was driven by sales of digital-to-analog television converter boxes. We
also experienced sales gains in video game accessories in 2008. This increase
was partially offset by decreases in wireless, music, and imaging accessories
sales.
28
Sales in our modern
home platform decreased 6.5% in 2008. This
decrease was primarily the result of declines in sales of DVD players and
recorders, cordless telephones, and flat panel televisions, but was partially
offset by increased sales of laptop computers.
Sales in our
personal electronics platform decreased 17.5% in 2008. This
decrease was driven primarily by sales declines in digital music players, toys,
and satellite radios, but was partially offset by increased sales of video game
consoles.
Sales in our power
platform decreased 3.6% in 2008. This
decrease was primarily the result of decreased sales of certain special purpose
and general purpose batteries.
Sales in our
technical platform decreased 1.4% in
2008.
Sales in our
service platform decreased 4.2% in 2008. This
decrease was driven primarily by declines in bill payment revenue and sales of
extended service plans, but was partially offset by increased sales of prepaid
wireless airtime.
Kiosks
Segment
Kiosk sales
decreased 4.5%
or $13.5 million
in 2008. This sales decrease was driven primarily by a decline in the number of
our Sprint-branded kiosks, but was partially offset by sales gains at our Sam’s
Club kiosks.
Other
Sales
Other sales
increased $12.9
million or 4.1%
in 2008. This sales increase was driven primarily by increased sales at our
RadioShack.com Web site and the recognition of 100% of the sales for RadioShack
de Mexico in the month of December. If we had owned 100% of RadioShack de Mexico
for all of 2008, we would have recognized approximately $100 million in
additional net sales and operating revenues for the year. Sales to independent
dealers did not significantly change from 2007.
Gross
Profit
Consolidated gross
profit and gross margin for 2008 were $1,922.7 million and 45.5%, respectively,
compared with $2,025.8 million and 47.6% in 2007, resulting in a 5.1% decrease
in gross profit dollars and a 210 basis point decrease in our gross
margin.
This decrease was
primarily driven by increased sales of lower margin products such as
digital-to-analog television converter boxes, video gaming products and
accessories, and laptop computers, as well as a product shift away from
higher-rate new activations to lower-rate existing customer upgrades in our
postpaid wireless business. Gross margin was also negatively affected by lower
average selling prices in GPS and media storage and by aggressive pricing
required in our wireless platform in the first quarter to respond to a more
competitive market environment.
Additionally, the
2007 gross margin was favorably affected by refunds for federal
telecommunications excise taxes we recorded in 2007. A portion of these refunds
totaling $18.8 million was recorded as a reduction to cost of products sold,
which accounted for a 44 basis point increase in our gross margin.
Selling,
General and Administrative Expense
Our consolidated
SG&A expense decreased 1.9% or $28.7 million in 2008. This represents a 50
basis point decrease as a percentage of net sales and operating revenues
compared with 2007.
Payroll and
commissions expense decreased in dollars and as a percentage of net sales and
operating revenues. This decrease was partially driven by lower incentive
compensation paid to store and corporate personnel and fewer employees in our
kiosk operations, distribution centers, and at our corporate headquarters.
Additionally, in 2007 we reduced our accrued vacation liability by $14.3 million
in connection with the modification of our employee vacation policy and recorded
an $8.5 million charge for employee separation charges.
29
Rent expense
decreased primarily due to lower rent expense associated with our corporate
headquarters for the second half of 2008. See above for further
discussion.
The decrease in
other taxes was partially driven by reduced payroll taxes associated with the
decreased compensation expense. Additionally, we recorded an $8.2 million sales
and use tax benefit from the settlement of a sales tax issue.
The increase in
other SG&A was primarily due to a $12.1 million non-cash charge recorded in
connection with our amended headquarters lease in 2008 as previously
discussed.
Depreciation
and Amortization
Total depreciation
and amortization for 2008 declined $13.6 million or 12.1%. This decrease was
primarily due to reduced capital expenditures in 2006 and 2007 when compared
with prior years.
Impairment
of Long-Lived Assets
Impairment of
long-lived assets and other charges was $2.8 million and $2.7 million for 2008
and 2007, respectively. These amounts were related primarily to our
Sprint-branded kiosk operations and underperforming U.S. RadioShack
company-operated stores. We recorded this amount based on the remaining
estimated future cash flows related to these specific stores. It was determined
that the net book value of many of the stores' long-lived assets was not
recoverable. For the stores with insufficient estimated cash flows, we wrote
down the associated long-lived assets to their estimated fair
value.
Net
Interest Expense
Consolidated
interest expense, net of interest income, was $20.3 million for 2008 versus
$16.2 million for 2007, an increase of $4.1 million or 25.3%.
Interest expense
decreased $3.9 million to $34.9 million in 2008 from $38.8 million in 2007. This
decrease was primarily attributable to lower interest rates on our floating rate
debt exposure resulting from our interest rate swaps, but was partially offset
by additional interest expense related to our 2013 convertible
notes.
Interest income
decreased $8.0 million to $14.6 million in 2008 from $22.6 million in 2007. This
decrease was primarily due to a lower interest rate environment. Additionally,
we recorded interest income related to the federal telecommunications excise tax
refunds of $0.5 million in 2008 and $1.4 million in 2007.
Other
(Loss) Income
During 2008 we
recorded a loss of $2.4 million compared with income of $0.9 million in 2007.
These amounts represent unrealized losses and gains related to our derivative
exposure to Sirius XM Radio, Inc. warrants as a result of our fair value
measurements of these warrants. At December 31, 2008, the fair value of these
warrants was zero.
Income
Tax Expense
Our effective tax
rate for 2008 was 36.8% compared with 35.4% for 2007. The 2008 effective tax
rate was affected by the execution of a closing agreement with respect to a
Puerto Rico income tax issue during the year, which resulted in a credit to
income tax expense; this discrete item lowered the effective tax rate for 2008
by 1.0 percentage point. In addition, the 2008 effective tax rate was affected
by the net reversal of approximately $4.1 million in unrecognized tax benefits,
deferred tax assets and accrued interest related to the settlement of various
state income tax issues and the expiration of the statute of limitations with
respect to our 2002 taxable year; this net reversal lowered the effective tax
rate for 2008 by 1.4 percentage points.
30
The 2007 effective
tax rate was affected by the net reversal in June 2007 of approximately $10.0
million in unrecognized tax benefits, deferred tax assets and accrued interest.
This $10.0 million reversal lowered our effective tax rate 2.7 percentage points
for the year ended December 31, 2007.
Acquisition
of RadioShack de Mexico
In
December 2008, we acquired the remaining interest (slightly more than 50%) of
our Mexican joint venture - RadioShack de Mexico, S.A. de C.V. - with Grupo
Gigante, S.A.B. de C.V. We now own 100% of this subsidiary, which consisted of
200 RadioShack-branded stores and 14 dealers throughout Mexico at the time of
acquisition. The purchase price was $44.9 million which consisted of $42.2
million in cash paid and transaction costs, net of cash acquired, plus $2.7
million in assumed debt. The acquisition was accounted for using the purchase
method of accounting in accordance with the FASB’s accounting guidance for
business combinations. The purchase price allocation resulted in an excess of
purchase price over net tangible assets acquired of $35.5 million, all of which
was attributed to goodwill. The goodwill will not be subject to amortization for
book purposes but rather an annual test for impairment. The premium we paid in
excess of the fair value of the net assets acquired was based on the established
business in Mexico and our ability to expand our business in Mexico and possibly
other countries. The goodwill will not be deductible for tax purposes. Results
of the acquired business have been included in our operations from December 1,
2008, and were immaterial for 2008. If we had owned 100% of RadioShack de Mexico
for all of 2008, we would have recognized approximately $100 million in
additional net sales and operating revenues for the year.
RECENTLY
ISSUED ACCOUNTING PRONOUNCEMENTS
Refer to Note 2 –
“Summary of Significant Accounting Policies” under the section titled “New
Accounting Standards” in the Notes to Consolidated Financial
Statements.
LIQUIDITY
AND CAPITAL RESOURCES
Cash
Flow Overview
Operating Activities: Cash
provided by operating activities in 2009 was $245.8 million, compared with
$274.6 million in 2008. This decrease was primarily driven by less cash received
from customers, dealers and service providers than in 2008. This decrease in
cash receipts was attributable to higher outstanding accounts receivable
balances at December 31, 2009, related to our increased commissions on wireless
sales. We collected a significant portion of these receivables in early 2010.
The decrease in cash received from customers, dealers and service providers was
partially offset by less cash paid to suppliers and employees than in 2008; this
was primarily attributable to our continued focus on managing our inventory and
accounts payable balances. We also received less interest on our cash balance
and paid more interest on our long-term debt than in 2008.
Investing Activities: Cash
used in investing activities was $80.8 million and $124.3 million in 2009 and
2008, respectively. The decrease from 2008 was primarily the result of $42.0
million in cash paid in 2008 for our acquisition of RadioShack de Mexico.
Capital expenditures of $81.0 million in 2009 were consistent with last year.
Capital expenditures primarily relate to our U.S. RadioShack company-operated
stores and information system projects.
Financing Activities: Net cash
used in financing activities was $71.6 million in 2009 compared with net cash
provided by financing activities of $154.8 million in 2008. This change was
partially driven by the repurchase of $43.2 million of our 2011 Notes in 2009.
The change was also driven by the issuance of our 2013 convertible notes and
associated hedge and warrant transactions in 2008. We also repurchased $111.3
million of our common stock in 2008 under our share repurchase program, compared
with no repurchases in 2009.
Free Cash Flow: Our free cash
flow, defined as cash flows from operating activities less dividends paid and
additions to property, plant and equipment, was $133.5 million in 2009, $157.7
million in 2008, and $300.9 million in 2007. The decrease in free cash flow for
2009 was attributable to decreased cash flow from operating activities as
described above.
31
We
believe free cash flow is a relevant indicator of our ability to repay maturing
debt, change dividend payments or fund other uses of capital that management
believes will enhance shareholder value. The comparable financial measure to
free cash flow under generally accepted accounting principles is cash flows from
operating activities, which was $245.8 million in 2009, $274.6 million in 2008,
and $379.0 million in 2007. We do not intend for the presentation of free cash
flow, a non-GAAP financial measure, to be considered in isolation or as a
substitute for measures prepared in accordance with GAAP, nor do we intend to
imply that free cash flow represents cash flow available for discretionary
expenditures.
The following table
is a reconciliation of cash flows from operating activities to free cash
flow.
|
Year Ended
December 31,
|
||||||||||||
|
(In millions)
|
2009
|
2008
|
2007
|
|||||||||
|
Net cash
provided by operating activities
|
$ | 245.8 | $ | 274.6 | $ | 379.0 | ||||||
|
Less:
|
||||||||||||
|
Additions to property, plant and
equipment
|
81.0 | 85.6 | 45.3 | |||||||||
|
Dividends paid
|
31.3 | 31.3 | 32.8 | |||||||||
|
Free cash
flow
|
$ | 133.5 | $ | 157.7 | $ | 300.9 | ||||||
SOURCES
OF LIQUIDITY
As
of December 31, 2009, we had $908.2 million in cash and cash equivalents.
Additionally, we have a credit facility of $325 million. As of December 31,
2009, we had $291.3 million available under this credit facility due to the
issuance of standby letters of credit. We have not borrowed from this facility.
We believe that our cash flows from operations and available cash and cash
equivalents will adequately fund our operations, our capital expenditures, and
our maturing debt obligations. Additionally, our credit facility is available
for additional working capital needs or investment opportunities.
The table below
lists our credit commitments from various financial institutions.
|
(In
millions)
|
Commitment
Expiration per Period
|
|||||||||||||||||||
|
Credit
Commitments
|
Total Amounts
Committed
|
Less
Than
1
Year
|
1-3
Years
|
3-5
Years
|
Over
5
Years
|
|||||||||||||||
|
Lines of
credit
|
$ | 325.0 | $ | -- | $ | 325.0 | $ | -- | $ | -- | ||||||||||
|
Standby
letters of credit
|
-- | -- | -- | -- | -- | |||||||||||||||
|
Total
commercial commitments
|
$ | 325.0 | $ | -- | $ | 325.0 | $ | -- | $ | -- | ||||||||||
Available Financing: As of
December 31, 2009, we had $291.3 million in borrowing capacity available under
our existing credit facility due to the issuance of standby letters of credit.
We incurred no borrowings from this facility during 2009. This facility expires
in May of 2011.
Our $325 million
credit facility provides us a source of liquidity. This facility is provided by
a syndicate of lenders with a majority of the facility provided by Wells Fargo,
Citigroup, and Bank of America. We incurred no borrowings from this facility in
2009. Interest charges under this facility are derived using a base LIBOR rate
plus a margin which changes based on our credit ratings. Our credit facility has
customary terms and covenants, and we were in compliance with these covenants at
December 31, 2009.
Credit Ratings: Below are the
agencies’ ratings by category, as well as their respective current outlook for
the ratings, as of February 8, 2010.
|
Rating
Agency
|
Rating
|
Outlook
|
||||
|
Standard and
Poor’s
|
BB
|
Stable
|
||||
|
Moody's
|
Ba1
|
Stable
|
||||
|
Fitch
|
BB
|
Stable
|
32
On
October 20, 2009, Fitch updated our rating outlook to stable from negative.
Other than the change in Fitch’s outlook, these ratings are consistent with the
ratings and outlooks reported in our Annual Report on Form 10-K for the year
ended December 31, 2008. Factors that could affect our future credit ratings
include free cash flow and cash levels, changes in our operating performance,
the adoption of a more aggressive financial strategy, the economic environment,
conditions in the retail and consumer electronics industries, sales declines in
comparable stores, our financial position and changes in our business strategy.
If downgrades occur, which we do not expect, they will adversely affect our
future borrowing costs, access to debt capital markets, vendor financing terms
and future new store occupancy costs.
CASH
REQUIREMENTS
Capital Expenditures: We
anticipate that our capital expenditure requirements for 2010 will range from
$100 million to $120 million. U.S. RadioShack company-operated store remodels
and relocations, as well as information systems projects, will account for the
majority of our anticipated 2010 capital expenditures. Cash and cash equivalents
and cash generated from operating activities will be used to fund future capital
expenditure needs.
Seasonal Inventory Buildup:
Typically, our annual cash requirements for pre-seasonal inventory
buildup range between $150 million and $250 million. The funding required for
this buildup comes primarily from cash on hand and cash generated from net sales
and operating revenues. Additionally, our credit facility could be utilized to
fund the inventory buildup.
Contractual
Obligations
The following
tables, as well as the information contained in Note 5 - "Indebtedness and
Borrowing Facilities" to our Notes to Consolidated Financial Statements, provide
a summary of our various contractual commitments, debt and interest repayment
requirements, and available credit lines.
The table below
contains our known contractual commitments as of December 31, 2009.
|
(In
millions)
|
Payments Due
by Period
|
|||||||||||||||||||
|
Contractual
Obligations
|
Total Amounts
Committed
|
Less
Than
1
Year
|
1-3
Years
|
3-5
Years
|
Over
5
Years
|
|||||||||||||||
|
Long-term
debt obligations
|
$ | 682.8 | $ | -- | $ | 306.8 | $ | 376.0 | $ | -- | ||||||||||
|
Interest
obligations
|
64.6 | 32.0 | 27.1 | 5.5 | -- | |||||||||||||||
|
Operating
lease obligations
|
573.4 | 200.1 | 242.8 | 90.5 | 40.0 | |||||||||||||||
|
Purchase
obligations (1)
|
314.1 | 292.7 | 20.8 | 0.6 | -- | |||||||||||||||
|
Other
long-term liabilities
reflected
on the balance sheet (2)
|
98.7 | 28.5 | 11.1 | 24.0 | ||||||||||||||||
|
Total
|
$ | 1,733.6 | $ | 524.8 | $ | 626.0 | $ | 483.7 | $ | 64.0 | ||||||||||
|
(1)
|
Purchase
obligations include our product commitments, marketing agreements and
freight commitments.
|
|
(2)
|
Includes a
$35.1 million
liability for unrecognized tax benefits. We are not able to reasonably
estimate the timing of the payments or the amount by which the liability
will increase or decrease over time; therefore, the related balances have
not been reflected in the ‘‘Payments Due by Period’’ section of the
table.
|
For more
information regarding long-term debt and lease commitments, refer to Note 5 –
“Indebtedness and Borrowing Facilities” and Note 13 – “Commitments and
Contingencies,” respectively, of our Notes to Consolidated Financial
Statements.
2013 Convertible Notes: In
August 2008, we issued $375 million principal amount of convertible senior notes
due August 1, 2013, (the “2013 Convertible Notes”) in a private offering. Each
$1,000 of principal of the 2013 Convertible Notes is initially convertible,
under certain circumstances, into 41.2414 shares of our common stock (or a total
of approximately 15.5 million shares), which is the equivalent of $24.25 per
share, subject to adjustment upon the occurrence of specified events set forth
under terms of the 2013 Convertible Notes. Upon conversion, we would pay the
holder the cash value of the applicable number of shares of our common stock, up
to the principal amount of the note. Amounts in excess of the
principal
33
amount, if any,
(the “excess conversion value”) may be paid in cash or in stock, at our option.
Holders may convert their 2013 Convertible Notes into common stock on the net
settlement basis described above at any time from May 1, 2013, until the close
of business on July 29, 2013, or if, and only if, one of the following
conditions has been met:
|
·
|
During any
calendar quarter, and only during such calendar quarter, in which the
closing price of our common stock for at least 20 trading days in the
period of 30 consecutive trading days ending on the last trading day of
the preceding calendar quarter exceeds 130% of the conversion price per
share of common stock in effect on the last day of such preceding calendar
quarter
|
|
·
|
During the
five consecutive business days immediately after any 10 consecutive
trading day period in which the average trading price per $1,000 principal
amount of 2013 Convertible Notes was less than 98% of the product of the
closing price of the common stock on such date and the conversion rate on
such date
|
|
·
|
We make
specified distributions to holders of our common stock or specified
corporate transactions occur
|
The 2013
Convertible Notes were not convertible at the holders' option at any time during
2009.
Holders who convert
their 2013 Convertible Notes in connection with a change in control may be
entitled to a make-whole premium in the form of an increase in the conversion
rate. In addition, upon a change in control, liquidation, dissolution or
delisting, the holders of the 2013 Convertible Notes may require us to
repurchase for cash all or any portion of their 2013 Convertible Notes for 100%
of the principal amount of the notes plus accrued and unpaid interest, if any.
As of December 31, 2009, none of the conditions allowing holders of the 2013
Convertible Notes to convert or requiring us to repurchase the 2013 Convertible
Notes had been met.
Concurrent with the
issuance of the 2013 Convertible Notes, we entered into note hedge transactions
with Citigroup and Bank of America whereby we have the option to purchase up to
15.5 million shares of our common stock at a price of $24.25 per share (the
“Convertible Note Hedges”), and we sold warrants to the same financial
institutions whereby they have the option to purchase up to 15.5 million shares
of our common stock at a per share price of $36.60 (the “Warrants”). The
Convertible Note Hedges and Warrants were structured to reduce the potential
future share dilution associated with the conversion of the 2013 Convertible
Notes. The Convertible Note Hedges and Warrants are separate contracts with the
two financial institutions, are not part of the terms of the 2013 Convertible
Notes, and do not affect the rights of holders under the 2013 Convertible Notes.
A holder of the 2013 Convertible Notes does not have any rights with respect to
the Convertible Note Hedges or Warrants.
The net proceeds
retained by RadioShack as a result of the issuance of the 2013 Convertible
Notes, the purchase of the Convertible Note Hedges, and the proceeds received
from the issuance of the Warrants were approximately $319.2 million. We
completed these transactions to secure a source of liquidity in preparation for
our $300 million credit facility expiring in June of 2009. On September 11,
2008, we terminated this credit facility.
For a more detailed
description of the 2013 Convertible Notes, Convertible Note Hedges and Warrants,
please see Note 5 – “Indebtedness and Borrowing Facilities” and Note 6 –
“Stockholders’ Equity” in the Notes to Consolidated Financial
Statements.
Long-Term Notes: On May 11,
2001, we issued $350 million of 10-year 7.375% notes in a private offering to
qualified institutional buyers under SEC Rule 144A. In August 2001, under the
terms of an exchange offering filed with the SEC, we exchanged substantially all
of these notes for a similar amount of publicly registered notes. The exchange
resulted in substantially all of the notes becoming registered with the SEC and
did not result in additional debt being issued. The annual interest rate on the
notes is 7.375% per annum with interest payable on November 15 and May 15 of
each year. The notes contain certain non-financial covenants and mature on May
15, 2011.
34
In
June and August 2003, we entered into interest rate swap agreements with
underlying notional amounts of debt of $100 million and $50 million,
respectively, and both with maturities in May 2011. Our counterparty for these
swaps is Citigroup. These swaps effectively convert a portion of our long-term
fixed rate debt to a variable rate. For more information regarding our interest
rate swaps, refer to Note 11 – “Derivative Financial Instruments.”
In
September 2009, we completed a tender offer to purchase for cash any and all of
these notes. Upon expiration of the offer, $43.2 million of the aggregate
outstanding principal amount of the notes was validly tendered and accepted. We
paid a total of $46.6 million, which consisted of the purchase price of $45.4
million for the tendered notes plus $1.2 million in accrued and unpaid interest,
to the holders of the tendered notes.
Operating Leases: We use
operating leases, primarily for our retail locations and our corporate campus,
to lower our capital requirements.
Continuing Lease Obligations:
We have obligations under retail leases for locations that we assigned to other
businesses. The majority of these lease obligations arose from leases for which
CompUSA Inc. (“CompUSA”) assumed responsibility as part of its purchase of our
Computer City, Inc. subsidiary in August 1998. Because the company that assumed
responsibility for these leases has ceased operations, we may be responsible for
rent due under the leases.
Following an
announcement by CompUSA in February 2007 of its intention to close as many as
126 stores and an announcement in December 2007 that it had been acquired by
Gordon Brothers Group, CompUSA’s stores ceased operations in January 2008. We
may be responsible for rent due on a portion of the leases that relate to the
closed stores. As of February 8, 2010, we had been named as a defendant in a
total of 12 lawsuits from lessors seeking payment from us, six of which had been
resolved.
Based on all
available information pertaining to the status of these lawsuits, and after
applying the FASB’s accounting guidance on accounting for contingencies, the
balance of our accrual for these obligations was $6.2 million and $9.0 million
at December 31, 2009 and 2008, respectively. We have continued to monitor this
situation and will update our accrual to reflect new information on outstanding
litigation and settlements as more information becomes available.
Capitalization
The following table
sets forth information about our capitalization on the dates
indicated.
|
December
31,
|
||||||||||||||||
|
2009
|
2008
|
|||||||||||||||
|
(Dollars in millions)
|
Dollars
|
% of Total
Capitalization
|
Dollars
|
% of Total
Capitalization
|
||||||||||||
|
Short-term
debt
|
$ | 41.6 | 2.4 | % | $ | 39.3 | 2.5 | % | ||||||||
|
Long-term
debt
|
627.8 | 36.6 | 659.5 | 42.3 | ||||||||||||
|
Total
debt
|
669.4 | 39.0 | 698.8 | 44.8 | ||||||||||||
|
Stockholders’
equity
|
1,048.3 | 61.0 | 860.8 | 55.2 | ||||||||||||
|
Total
capitalization
|
$ | 1,717.7 | 100.0 | % | $ | 1,559.6 | 100.0 | % | ||||||||
Our debt-to-total
capitalization ratio decreased in 2009 from 2008, due to the repurchase of $43.2
million of our 2011 Notes and an increase in stockholders’ equity primarily due
to 2009 net income.
Dividends: We have paid common
stock cash dividends for 23 consecutive years. On November 9, 2009, our Board of
Directors declared an annual dividend of $0.25 per share. The dividend was paid
on December 16, 2009, to stockholders of record on November 27, 2009. The
dividend payment of $31.3 million was funded from cash on hand.
35
Share Repurchases: In July
2008, our Board of Directors approved a share repurchase program with no
expiration date authorizing management to repurchase up to $200 million of our
common stock. In August 2009, our Board of Directors approved a $200 million
increase in the dollar amount of this program. As of December 31, 2009, $290
million of the total authorized amount was available for share repurchases under
this program. No shares were repurchased under this program in
2009.
OFF-BALANCE
SHEET ARRANGEMENTS
Other than the
operating leases described above, we do not have any off-balance sheet financing
arrangements, transactions, or special purpose entities.
INFLATION
With the exception
of increased energy costs in 2007 and the first half of 2008, inflation has not
significantly affected us over the past three years. We do not expect inflation
to have a significant effect on our operations in the foreseeable
future.
CRITICAL
ACCOUNTING POLICIES AND ESTIMATES
Our consolidated
financial statements are prepared in accordance with generally accepted
accounting principles (“GAAP”) in the United States. The application of GAAP
requires us to make estimates and assumptions that affect the reported values of
assets and liabilities at the date of the financial statements, the reported
amount of revenues and expenses during the reporting period, and the related
disclosures of contingent assets and liabilities. The use of estimates is
pervasive throughout our financial statements and is affected by management’s
judgment and uncertainties. Our estimates, assumptions and judgments are based
on historical experience, current market trends and other factors that we
believe to be relevant and reasonable at the time the consolidated financial
statements are prepared. We continually evaluate the information used to make
these estimates as our business and the economic environment change. Actual
results may differ materially from these estimates under different assumptions
or conditions.
In
the Notes to Consolidated Financial Statements, we describe the significant
accounting policies used in the preparation of our consolidated financial
statements. The accounting policies and estimates we consider most critical are
revenue recognition; inventory valuation; estimation of reserves and valuation
allowances specifically related to insurance, tax and legal contingencies;
valuation of long-lived assets and intangibles, including goodwill; and
stock-based compensation.
We
consider an accounting policy or estimate to be critical if it requires
difficult, subjective or complex judgments, and is material to the portrayal of
our financial condition, changes in financial condition or results of
operations. The selection, application and disclosure of our critical accounting
policies and estimates have been reviewed by the Audit and Compliance Committee
of our Board of Directors.
Revenue
Recognition
Description
Our revenue is
derived principally from the sale of name brand and private brand products and
services to consumers. Revenue is recognized, net of an estimate for customer
refunds and product returns, when persuasive evidence of an arrangement exists,
delivery has occurred or services have been rendered, the sales price is fixed
or determinable, and collectability is reasonably assured.
Certain products,
such as wireless telephone handsets, require the customer to use the services of
a third-party service provider. The third-party service provider pays us an
upfront commission for obtaining a new customer and, in some cases, a monthly
recurring residual amount based upon the ongoing arrangement between the service
provider and the customer. Our sale of an activated wireless telephone handset
is the single event required to meet the delivery criterion for both the upfront
commission and the residual revenue. Upfront commission revenue, net of
estimated service deactivations, is generally recognized at the time an
activated wireless telephone handset is sold to the customer at the
point-of-sale. Recurring residual income is recognized as earned under the terms
of each contract with the service provider, which is typically as the service
provider bills its customer, generally on a monthly basis.
36
Judgments
and uncertainties involved in the estimate
Our revenue
recognition accounting methodology contains uncertainties because it requires us
to estimate future sales returns and service plan deactivations. These estimates
are subject to management judgment. Our estimate for product refunds and
returns, service plan deactivations, residual revenue and commission revenue
adjustments are based on historical information pertaining to these items. Based
on our extensive history in selling activated wireless telephone handsets, we
have been able to establish reliable deactivation estimates.
Effect
if actual results differ from assumptions
We
have not made any material changes in the methodology used to estimate sales
returns or service deactivations during the past three fiscal years, and we do
not believe there is a reasonable likelihood that there will be a material
change in the future estimates or assumptions for these items. However, if
actual results differ from our estimates due to various factors, the amount of
revenue recorded could be materially affected. A 10% difference in our reserves
for the estimates noted above would have affected net sales and operating
revenues by approximately $4.1 million in 2009.
Inventory
Valuation
Description
Our inventory
consists primarily of finished goods available for sale at our retail locations
or within our distribution centers and is recorded at the lower of average cost
(which approximates FIFO) or market. The cost components recorded within
inventory are the vendor invoice cost and certain allocated freight,
distribution, warehousing and other costs relating to merchandise acquisition
required to bring the merchandise from the vendor to the location where it is
offered for sale.
Judgments
and uncertainties involved in the estimate
Typically, the
market value of our inventory is higher than its aggregate cost. Determination
of the market value may be very complex and, therefore, requires a high degree
of judgment. In order for management to make the appropriate determination of
market value, the following items are commonly considered: inventory turnover
statistics, current selling prices, seasonality factors, consumer trends,
competitive pricing, performance of similar products or accessories, planned
promotional incentives, technological obsolescence, and estimated costs to sell
or dispose of merchandise such as sales commissions.
If
the estimated market value, calculated as the amount we expect to realize, net
of estimated selling costs, from the ultimate sale or disposal of the inventory,
is determined to be less than the recorded cost, we record a provision to reduce
the carrying amount of the inventory item to its net realizable
value.
Effect
if actual results differ from assumptions
We
have not made any material changes in the methodology used to establish our
inventory valuation or the related reserves during the past three fiscal years,
and we do not believe there is a reasonable likelihood that there will be a
material change in the future estimates or assumptions we use to estimate our
inventory valuation reserves. Differences between management estimates and
actual performance and pricing of our merchandise could result in inventory
valuations that differ from the amount recorded at the financial statement date
and could also cause fluctuations in the amount of recorded cost of products
sold. If our estimates regarding market value are inaccurate or changes in
consumer demand affect certain products in an unforeseen manner, we may be
exposed to material losses or gains in excess of our established valuation
reserve. We believe that we have sufficient current and historical knowledge to
record reasonable estimates for our inventory valuation reserves. However, it is
possible that actual results could differ from recorded reserves.
Estimation
of Reserves and Valuation Allowances
Description
The amount of
liability we record for claims related to insurance, tax and legal contingencies
requires us to make judgments about the amount of expenses that will ultimately
be incurred. We are insured for certain losses related to workers' compensation,
property and other liability claims, with deductibles up to $1.0 million per
occurrence. This insurance coverage limits our exposure for any catastrophic
claims that
37
result in liability
in excess of the deductible. We also have a self-insured health program
administered by a third-party covering the majority of our employees that
participate in our health insurance programs. We estimate the amount of our
reserves for all insurance programs discussed above at the end of each reporting
period. This estimate is based on historical claims experience, demographic
factors, severity factors, and other factors we deem relevant.
We
are subject to periodic audits from multiple domestic and foreign tax
authorities related to income tax, sales and use tax, personal property tax, and
other forms of taxation. These audits examine our tax positions, timing of
income and deductions, and allocation procedures across multiple jurisdictions.
Our accounting for tax estimates and contingencies requires us to evaluate tax
issues and establish reserves in our consolidated financial statements based on
our estimate of current probable tax exposures. Depending on the nature of the
tax issue, we could be subject to audit over several years; therefore, our
estimated reserve balances might exist for multiple years before an issue is
resolved by the taxing authority.
We
are involved in legal proceedings and governmental inquiries associated with
employment and other matters. Our accounting for legal contingencies requires us
to estimate the probable losses in these matters. This estimate has been
developed in consultation with in-house and outside legal counsel and is based
upon a combination of litigation and settlement strategies.
Judgments
and uncertainties involved in the estimate
Our liabilities for
insurance, tax and legal contingencies contain uncertainties because we are
required to make assumptions and to apply judgment to estimate the exposures
associated with these items. We use our history and experience, as well as other
specific circumstances surrounding these claims, in evaluating the amount of
liability we should record. As additional information becomes available, we
assess the potential liability related to our various claims and revise our
estimates as appropriate. These revisions could materially affect our results of
operations and financial position or liquidity.
Effect
if actual results differ from assumptions
We
have not made any material changes in the methodology used to estimate our
insurance reserves during the past three fiscal years, and we do not believe
there is a reasonable likelihood that there will be a material change in the
future estimates or assumptions for these items. However, a 10% change in our
insurance reserves at December 31, 2009, would have affected net income by
approximately $5.0 million. As of December 31, 2009, actual losses had not
exceeded our expectations. Additionally, for claims that exceed our deductible
amount, we record a gross liability and corresponding receivable representing
expected recoveries, since we are not legally relieved of our obligation to the
claimant.
Although we believe
that our tax and legal reserves are based on reasonable judgments and estimates,
actual results could differ, which may expose us to material gains or losses in
future periods. These actual results could materially affect our effective tax
rate, earnings, deferred tax balances and cash flows in the period of
resolution.
Valuation
of Long-Lived Assets and Intangibles, including Goodwill
Description
Long-lived assets,
such as property and equipment, are reviewed for impairment when events or
changes in circumstances indicate that the carrying amount may not be
recoverable, such as negative cash flows or plans to dispose of or sell
long-lived assets before the end of their previously estimated useful lives. The
carrying amount is considered not recoverable if it exceeds the sum of the
undiscounted cash flows expected to result from the use and eventual disposition
of the asset. If the carrying amount is not recoverable, we recognize an
impairment loss equal to the amount by which the carrying amount exceeds fair
value. We estimate fair value based on projected future discounted cash flows.
Impairment losses, if any, are recorded in the period in which the impairment
occurs. The carrying value of the asset is adjusted to the new carrying value,
and any subsequent increases in fair value are not recorded. Additionally, if it
is determined that the estimated remaining useful life of the asset should be
decreased, the periodic depreciation expense is adjusted based on the new
carrying value of the asset. Our policy is to evaluate long-lived assets for
impairment at a store level for retail operations.
38
We
have acquired goodwill and other separately identifiable intangible assets
related to business acquisitions. The original valuation of these intangible
assets is based on estimates of future profitability, cash flows and other
judgmental factors. Goodwill represents the excess of the purchase price over
the fair value of net assets acquired. We review our goodwill and other
intangible asset balances on an annual basis, during the fourth quarter, and
whenever events or changes in circumstances indicate the carrying value of a
reporting unit or an intangible asset might exceed their fair
value. If the carrying amount of an intagible asset or a reporting unit
exceeds its fair value, we recognize an impairment loss for this
difference.
Judgments
and uncertainties involved in the estimate
Our impairment loss
calculations for long-lived assets contain uncertainties because they require us
to apply judgment and estimates concerning future cash flows, strategic plans,
useful lives and assumptions about market performance. We also apply judgment in
the selection of a discount rate that reflects the risk inherent in our current
business model.
Our impairment loss
calculations for intangible assets and goodwill contain uncertainties because
they require us to estimate fair values related to these assets. We estimate
fair values based on various valuation techniques such as discounted cash flows
and other comparable market analyses. These types of analyses contain
uncertainties because they require us to make judgments and assumptions
regarding future profitability, industry factors, planned strategic initiatives,
discount rates and other factors.
Effect
if actual results differ from assumptions
We
have not made any material changes in the accounting methodologies we use to
assess impairment loss for long-lived assets, intangible assets, or goodwill
during the past three fiscal years, and we do not believe there is a reasonable
likelihood that there will be a material change in the estimates or assumptions
we use in calculating these impairment losses. However, if actual results or
performance of certain business units are not consistent with our estimates and
assumptions, we may be exposed to additional impairment charges, which could be
material to our results of operations.
The total value of
our goodwill and intangible assets at December 31, 2009, was $40.3 million. Of
this amount, $35.6 million related to goodwill from the purchase of RadioShack
de Mexico. Based on our most recent review of goodwill impairment, we noted that
the fair values of our reporting units were substantially greater than their
carrying values.
Stock-Based
Compensation
Description
We
have historically granted certain stock-based awards to employees and directors
in the form of non-qualified stock options, incentive stock options, restricted
stock and deferred stock units. See Note 2 - “Summary of Significant Accounting
Policies” and Note 7 - “Stock-Based Incentive Plans” for a more complete
discussion of our stock-based compensation programs.
At
the date an award is granted, we determine the fair value of the award and
recognize the compensation expense over the requisite service period, which
typically is the period over which the award vests. The restricted stock and
deferred stock units are valued at the fair market value of our stock on the
date of grant. The fair value of stock options with only service conditions is
estimated using the Black-Scholes-Merton option-pricing model. The fair value of
stock options with service and market conditions is valued utilizing a lattice
model with Monte Carlo simulations.
Judgments
and uncertainties involved in the estimate
The
Black-Scholes-Merton and lattice models require management to apply judgment and
use highly subjective assumptions, including expected option life, volatility of
stock prices, and employee forfeiture rate. We use historical data and judgment
to estimate the expected option life and employee forfeiture rate, and use
historical and implied volatility when estimating the stock price volatility.
Changes in these assumptions can materially affect the fair value
estimate.
39
Effect
if actual results differ from assumptions
We have not made
any material changes in the accounting methodologies used to record stock-based
compensation during the past three years. While the assumptions that we develop
are based on our best expectations, they involve inherent uncertainties based on
market conditions and employee behavior that are outside of our control.
If actual results are not consistent with the assumptions used, the stock-based
compensation expense reported in our financial statements may not be
representative of the actual economic cost of the stock-based compensation.
Additionally, if actual employee forfeitures significantly differ from our
estimated forfeitures, we may have an adjustment to our financial statements in
future periods. A 10% change in our stock-based compensation expense in 2009
would have affected our net income by approximately $1.2
million.
FACTORS
THAT MAY AFFECT FUTURE RESULTS
Matters discussed
in MD&A and in other parts of this report include forward-looking statements
within the meaning of the federal securities laws, including Section 27A of
the Securities Act of 1933, as amended, and Section 21E of the Securities
Exchange Act of 1934, as amended. These forward-looking statements are
statements that are not historical and may be identified by the use of words
such as “expect,” “believe,” “anticipate,” “estimate,” “intend,” “potential” or
similar words. These matters include statements concerning management’s plans
and objectives relating to our operations or economic performance and related
assumptions. We specifically disclaim any duty to update any of the information
set forth in this report, including any forward-looking statements.
Forward-looking statements are made based on management’s current expectations
and beliefs concerning future events and, therefore, involve a number of
assumptions, risks and uncertainties, including the risk factors described in
Item 1A, “Risk Factors,” of this Annual Report on Form 10-K. Management
cautions that forward-looking statements are not guarantees, and our actual
results could differ materially from those expressed or implied in the
forward-looking statements.
At
December 31, 2009, the only derivative instruments that materially increased our
exposure to market risks for interest rates, foreign currency rates, commodity
prices or other market price risks were interest rate swaps, which serve as an
economic hedge on our long-term debt. We do not use derivatives for speculative
purposes. Refer to Note 11 – “Derivative Financial Instruments” in Notes to
Consolidated Financial Statements of this Annual Report on Form 10-K for
additional information.
Our exposure to
interest rate risk results from changes in short-term interest rates. Interest
rate risk exists with respect to our net investment position at December 31,
2009, of $670.5 million, consisting of fluctuating short-term investments of
$820.5 million and offset by $150 million of indebtedness which, because of our
interest rate swaps, effectively bears interest at short-term floating rates. A
hypothetical increase or decrease of 100 basis points in the interest rate
applicable to this floating-rate net exposure would result in a change in annual
net interest expense of $6.7 million and an approximate $2.3 million change to
the fair value of our interest rate swaps, which would also affect net interest
expense. This hypothesis assumes no change in the principal or investment
balance.
We
have market risk arising from changes in foreign currency exchange rates related
to our purchase of inventory from manufacturers located in China and other areas
outside of the U.S. Our purchases are denominated in U.S. dollars; however, the
strengthening of the Chinese currency, or other currencies, against the U.S.
dollar could cause our vendors to increase the prices of items we purchase from
them. It is not possible to estimate the effect of foreign currency exchange
rate changes on our purchases of this inventory. We are also exposed to foreign
currency fluctuations related to our Mexican subsidiary, which represented less
than 5% of consolidated net sales and operating revenues in 2009.
The Index to our
Consolidated Financial Statements is found on page 45. Our Consolidated
Financial Statements and Notes to Consolidated Financial Statements follow the
index.
40
Evaluation
of Disclosure Controls and Procedures
We
have established a system of disclosure controls and other procedures that are
designed to ensure that information required to be disclosed by us in the
reports that we file or submit under the Securities Exchange Act of 1934
(“Exchange Act”), is recorded, processed, summarized and reported within the
time periods specified by the SEC’s rules and forms, and that such information
is accumulated and communicated to management, including our Chief Executive
Officer and Chief Financial Officer, as appropriate to allow timely decisions
regarding required disclosure. An evaluation of the effectiveness of the design
and operation of our disclosure controls and procedures (as defined in Rule
13a-15(e) under the Exchange Act) was performed as of the end of the period
covered by this annual report. This evaluation was performed under the
supervision and with the participation of management, including our CEO and
CFO.
Based upon that
evaluation, our CEO and CFO have concluded that these disclosure controls and
procedures were effective.
Management’s
Report on Internal Control Over Financial Reporting
Our management is
responsible for establishing and maintaining adequate internal control over
financial reporting, as such term is defined in Exchange Act
Rule 13a-15(f). Under the supervision and with the participation of our
management, including our CEO and CFO, we conducted an evaluation of the
effectiveness of our internal control over financial reporting based on the
framework in “Internal Control – Integrated Framework” issued by the
Committee of Sponsoring Organizations of the Treadway Commission. Based on our
evaluation under the framework in “Internal Control – Integrated
Framework,” our
management concluded that our internal control over financial reporting was
effective as of December 31, 2009. The effectiveness of our internal control
over financial reporting as of December 31, 2009, has been audited by
PricewaterhouseCoopers LLP, an independent registered public accounting firm, as
stated in their report which is included herein.
Changes
in Internal Controls
There were no
changes in our internal control over financial reporting that occurred during
our last fiscal quarter that have materially affected, or are reasonably likely
to materially affect, our internal control over financial
reporting.
None.
PART
III
We
will file a definitive proxy statement with the Securities and Exchange
Commission on or about April 16, 2010. The information called for by this Item
with respect to directors and the Audit and Compliance Committee of the Board of
Directors is incorporated by reference from the Proxy Statement for the 2010
Annual Meeting under the headings “Item 1 - Election of Directors” and “Meetings
and Committees of the Board.” For information relating to our Executive
Officers, see Part I of this report. The Section 16(a) reporting
41
information is
incorporated by reference from the Proxy Statement for the 2010 Annual Meeting
under the heading “Section 16(a) Beneficial Ownership Reporting Compliance.”
Information regarding our Financial Code of Ethics is incorporated by reference
from the Proxy Statement for the 2010 Annual Meeting under the heading
“Corporate Governance – Code of Conduct and Financial Code of
Ethics.”
The information
called for by this Item with respect to executive compensation is incorporated
by reference from the Proxy Statement for the 2010 Annual Meeting under the
headings “Compensation Discussion and Analysis,” “Executive Compensation,”
“Non-Employee Director Compensation,” “Other Matters Involving Executive
Officers,” “Compensation Committee Interlocks and Insider Participation” and
“Report of the Management Development and Compensation Committee on Executive
Compensation.”
The information
called for by this Item with respect to security ownership of certain beneficial
owners and management is incorporated by reference from the Proxy Statement for
the 2010 Annual Meeting under the heading “Ownership of
Securities.”
EQUITY
COMPENSATION PLANS
The following table
provides a summary of information as of December 31, 2009, relating to our
equity compensation plans in which our common stock is authorized for
issuance.
Equity
Compensation Plan Information
|
(Share amounts in
thousands)
|
(a)
Number of
shares to
be issued
upon
exercise
of
outstanding
options,
warrants and
rights
|
(b)
Weighted-average
exercise
price of
outstanding options,
warrants and
rights
|
(c)
Number of
shares
remaining
available for
future
issuance under
equity
compensation
plans
(excluding
shares
reflected in
column
(a))
|
|||||||||
|
Equity
compensation plans approved by
shareholders (1)
|
4,941 | (2) | $16.28 | 11,230 | (3) | |||||||
|
Equity
compensation plans not approved by
shareholders (4)
|
5,606 | $23.43 | -- | |||||||||
|
Total
|
10,547 | $20.28 | 11,230 | |||||||||
|
(1)
|
Includes the
1997 Incentive Stock Plan (“ISP”), the 2001 ISP, the 2004 Deferred Stock
Unit Plan for Non-Employee Directors, the 2007 Restricted Stock Plan
(“RSP”), and the 2009 ISP. Refer to Note 7 - “Stock-Based Incentive Plans”
of our Notes to Consolidated Financial Statements for further information.
The 1997 ISP expired on February 27, 2007, and no further grants may be
made under this plan. The 2001 ISP and the 2007 RSP terminated upon
shareholder approval of the 2009 ISP on May 21, 2009. No further grants
may be made under the 2001 ISP or the 2007 RSP.
|
|
(2)
|
This amount
includes approximately 331,000 shares of restricted stock and
approximately 179,000 deferred stock units.
|
|
(3)
|
This amount
includes approximately 736,000 deferred stock units.
|
|
(4)
|
Includes the
1999 ISP and options granted as an inducement grant in connection with our
Chief Executive Officer’s employment with RadioShack in the third quarter
of 2006. Refer to Note 7 for more information concerning the 1999 ISP and
the third quarter 2006 inducement grant. The 1999 ISP expired on February
23, 2009, and no further grants may be made under this
plan.
|
The information
called for by this Item with respect to certain relationships and transactions
with management and others is incorporated by reference from the Proxy Statement
for the 2010 Annual Meeting under the heading “Review and Approval of
Transactions with Related Persons” and “Corporate Governance - Director
Independence.”
42
The information
called for by this Item with respect to principal accounting fees and services
is incorporated by reference from the Proxy Statement for the 2010 Annual
Meeting under the headings “Fees and Services of the Independent Auditors” and
“Policy for Pre-Approval of Audit and Permissible Non-Audit Services of
Independent Auditors.”
PART
IV
Documents filed as
part of this Annual Report on Form 10-K.
|
1)
|
The financial
statements listed in the "Index to Consolidated Financial Statements"
on page
45.
|
2) None
|
3)
|
A list of the
exhibits required by Item 601 of Regulation S-K to be filed as part of
this report is set forth in the Index to Exhibits beginning on page 82,
which immediately precedes such
exhibits.
|
Certain instruments
defining the rights of holders of our long-term debt are not filed as exhibits
to this report because the total amount of securities authorized thereunder does
not exceed ten percent of our total assets on a consolidated basis. We will
furnish the SEC copies of such instruments upon request.
43
Pursuant to the
requirements of Section 13 or 15(d) of the Securities Exchange Act of 1934, as
amended, RadioShack Corporation has duly caused this Annual Report on Form 10-K
to be signed on its behalf by the undersigned, thereunto duly
authorized.
|
RADIOSHACK
CORPORATION
|
||
|
February 22,
2010
|
/s/ Julian C.
Day
|
|
|
Julian C.
Day
|
||
|
Chairman of
the Board and Chief Executive
Officer
|
Pursuant to the
requirements of the Securities Exchange Act of 1934, as amended, this Annual
Report on Form 10-K has been signed below by the following persons on behalf of
RadioShack Corporation and in the capacities indicated on this 22nd day of
February, 2010.
|
Signature
|
Title
|
|||
|
/s/ Julian C.
Day
|
Chairman of
the Board and Chief Executive Officer
|
|||
|
Julian C.
Day
|
(Principal
Executive Officer)
|
|||
|
/s/ James F.
Gooch
|
Executive
Vice President and Chief Financial Officer
|
|||
|
James F.
Gooch
|
(Principal
Financial Officer)
|
|||
|
/s/ Martin O.
Moad
|
Vice
President and Controller
|
|||
|
Martin O.
Moad
|
(Principal
Accounting Officer)
|
|||
|
/s/ Frank J.
Belatti
|
Director
|
/s/ Jack L.
Messman
|
Director
|
|
|
Frank J.
Belatti
|
Jack L.
Messman
|
|||
|
/s/ Daniel R.
Feehan
|
Director
|
/s/ Thomas G.
Plaskett
|
Director
|
|
|
Daniel R.
Feehan
|
Thomas G.
Plaskett
|
|||
|
/s/ H. Eugene
Lockhart
|
Director
|
/s/ Edwina D.
Woodbury
|
Director
|
|
|
H. Eugene
Lockhart
|
Edwina D.
Woodbury
|
|||
44
RADIOSHACK
CORPORATION
|
Page
|
|
|
Report of
Independent Registered Public Accounting Firm
|
46
|
|
Consolidated
Statements of Income for each of the three years in the
period ended December 31,
2009
|
47
|
|
Consolidated
Balance Sheets at December 31, 2009 and 2008
|
48
|
|
Consolidated
Statements of Cash Flows for each of the three years in the
period ended December 31,
2009
|
49
|
|
Consolidated
Statements of Stockholders' Equity and Comprehensive
Income for each of the three years in
the period ended December 31, 2009
|
50
|
|
Notes to
Consolidated Financial Statements
|
51 –
81
|
All financial
statement schedules have been omitted because they are not applicable, not
required, or the information is included in the consolidated financial
statements or notes thereto.
45
To the Board of Directors
and Stockholders of RadioShack Corporation:
In
our opinion, the consolidated financial statements listed in the accompanying
index present fairly, in all material respects, the financial position of
RadioShack Corporation and its subsidiaries at December 31,
2009 and 2008, and the results of their operations and their cash
flows for each of the three years in the period ended December 31, 2009 in conformity with
accounting principles generally accepted in the United States of
America. Also in our opinion, the Company maintained, in all material
respects, effective internal control over financial reporting as of December 31,
2009, based on criteria established in Internal Control - Integrated
Framework issued by the Committee of Sponsoring Organizations of the
Treadway Commission (COSO). The Company's management is responsible
for these financial statements, for maintaining effective internal control over
financial reporting and for its assessment of the effectiveness of internal
control over financial reporting, included in Management's Report on
Internal Control over Financial Reporting appearing under Item
9A. Our responsibility is to express opinions on these financial
statements and on the Company's internal control over financial reporting based
on our integrated audits. We conducted our audits in accordance with
the standards of the Public Company Accounting Oversight Board (United
States). Those standards require that we plan and perform the audits
to obtain reasonable assurance about whether the financial statements are free
of material misstatement and whether effective internal control over financial
reporting was maintained in all material respects. Our audits of the
financial statements included examining, on a test basis, evidence supporting
the amounts and disclosures in the financial statements, assessing the
accounting principles used and significant estimates made by management, and
evaluating the overall financial statement presentation. Our audit of
internal control over financial reporting included obtaining an understanding of
internal control over financial reporting, assessing the risk that a material
weakness exists, and testing and evaluating the design and operating
effectiveness of internal control based on the assessed risk. Our
audits also included performing such other procedures as we considered necessary
in the circumstances. We believe that our audits provide a reasonable basis for
our opinions.
As
discussed in Note 2 and Note 9 to the consolidated financial statements, the
Company changed the manner in which it accounts for convertible debt instruments
in 2009 and the manner in which it accounts for income taxes in 2007,
respectively.
A
company’s internal control over financial reporting is a process designed to
provide reasonable assurance regarding the reliability of financial reporting
and the preparation of financial statements for external purposes in accordance
with generally accepted accounting principles. A company’s internal
control over financial reporting includes those policies and procedures that
(i) pertain to the maintenance of records that, in reasonable detail,
accurately and fairly reflect the transactions and dispositions of the assets of
the company; (ii) provide reasonable assurance that transactions are
recorded as necessary to permit preparation of financial statements in
accordance with generally accepted accounting principles, and that receipts and
expenditures of the company are being made only in accordance with
authorizations of management and directors of the company; and
(iii) provide reasonable assurance regarding prevention or timely detection
of unauthorized acquisition, use, or disposition of the company’s assets that
could have a material effect on the financial statements.
Because of its
inherent limitations, internal control over financial reporting may not prevent
or detect misstatements. Also, projections of any evaluation of
effectiveness to future periods are subject to the risk that controls may become
inadequate because of changes in conditions, or that the degree of compliance
with the policies or procedures may deteriorate.
PricewaterhouseCoopers LLP
Fort Worth,
Texas
February 22,
2010
46
Consolidated
Statements of Income
|
Year
Ended December 31,
|
||||||||||||||||||||||||
|
2009
|
2008
|
2007
|
||||||||||||||||||||||
|
%
of
|
%
of
|
%
of
|
||||||||||||||||||||||
|
(In
millions, except per share amounts)
|
Dollars
|
Revenues
|
Dollars
|
Revenues
|
Dollars
|
Revenues
|
||||||||||||||||||
|
Net
sales and operating revenues
|
$ | 4,276.0 | 100.0 | % | $ | 4,224.5 | 100.0 | % | $ | 4,251.7 | 100.0 | % | ||||||||||||
|
Cost of
products sold (includes depreciation
amounts of $9.2 million, $11.2
million
and $10.0 million,
respectively)
|
2,313.5 | 54.1 | 2,301.8 | 54.5 | 2,225.9 | 52.4 | ||||||||||||||||||
|
Gross
profit
|
1,962.5 | 45.9 | 1,922.7 | 45.5 | 2,025.8 | 47.6 | ||||||||||||||||||
|
Operating
expenses:
|
||||||||||||||||||||||||
|
Selling, general and
administrative
|
1,507.9 | 35.3 | 1,509.8 | 35.7 | 1,538.5 | 36.2 | ||||||||||||||||||
|
Depreciation and
amortization
|
83.7 | 2.0 | 87.9 | 2.1 | 102.7 | 2.4 | ||||||||||||||||||
|
Impairment of long-lived
assets
|
1.5 | -- | 2.8 | 0.1 | 2.7 | -- | ||||||||||||||||||
|
Total
operating expenses
|
1,593.1 | 37.3 | 1,600.5 | 37.9 | 1,643.9 | 38.6 | ||||||||||||||||||
|
Operating
income
|
369.4 | 8.6 | 322.2 | 7.6 | 381.9 | 9.0 | ||||||||||||||||||
|
Interest
income
|
4.8 | 0.1 | 14.6 | 0.3 | 22.6 | 0.5 | ||||||||||||||||||
|
Interest
expense
|
(44.1 | ) | (1.0 | ) | (34.9 | ) | (0.8 | ) | (38.8 | ) | (0.9 | ) | ||||||||||||
|
Other (loss)
income
|
(1.6 | ) | -- | (2.4 | ) | -- | 0.9 | -- | ||||||||||||||||
|
Income
before income taxes
|
328.5 | 7.7 | 299.5 | 7.1 | 366.6 | 8.6 | ||||||||||||||||||
|
Income tax
expense
|
123.5 | 2.9 | 110.1 | 2.6 | 129.8 | 3.0 | ||||||||||||||||||
|
Net
income
|
$ | 205.0 | 4.8 | % | $ | 189.4 | 4.5 | % | $ | 236.8 | 5.6 | % | ||||||||||||
|
Net
income per share:
|
||||||||||||||||||||||||
|
Basic
|
$ | 1.63 | $ | 1.47 | $ | 1.76 | ||||||||||||||||||
|
Diluted:
|
$ | 1.63 | $ | 1.47 | $ | 1.74 | ||||||||||||||||||
|
Shares used in
computing net income
per
share:
|
||||||||||||||||||||||||
|
Basic
|
125.4 | 129.0 | 134.6 | |||||||||||||||||||||
|
Diluted
|
126.1 | 129.1 | 135.9 | |||||||||||||||||||||
The accompanying
notes are an integral part of these consolidated financial
statements.
47
RADIOSHACK
CORPORATION AND SUBSIDIARIES
Consolidated
Balance Sheets
|
December
31,
|
||||||||
|
(In
millions, except for share amounts)
|
2009
|
2008
|
||||||
|
Assets
|
||||||||
|
Current
assets:
|
||||||||
|
Cash and cash
equivalents
|
$ | 908.2 | $ | 814.8 | ||||
|
Accounts and notes receivable,
net
|
322.5 | 241.9 | ||||||
|
Inventories
|
670.6 | 636.3 | ||||||
|
Other current assets
|
114.4 | 98.6 | ||||||
|
Total current
assets
|
2,015.7 | 1,791.6 | ||||||
|
Property,
plant and equipment, net
|
282.3 | 306.4 | ||||||
|
Goodwill,
net
|
38.9 | 36.7 | ||||||
|
Other assets,
net
|
92.4 | 119.3 | ||||||
|
Total
assets
|
$ | 2,429.3 | $ | 2,254.0 | ||||
|
Liabilities
and Stockholders’ Equity
|
||||||||
|
Current
liabilities:
|
||||||||
|
Short-term debt
|
$ | 41.6 | $ | 39.3 | ||||
|
Accounts payable
|
223.0 | 206.4 | ||||||
|
Accrued expenses and other current
liabilities
|
359.0 | 367.3 | ||||||
|
Income taxes payable
|
30.9 | 24.2 | ||||||
|
Total current
liabilities
|
654.5 | 637.2 | ||||||
|
Long-term
debt
|
627.8 | 659.5 | ||||||
|
Other
non-current liabilities
|
98.7 | 96.5 | ||||||
|
Total
liabilities
|
1,381.0 | 1,393.2 | ||||||
|
Commitments
and contingencies
|
||||||||
|
Stockholders’
equity:
|
||||||||
|
Preferred stock, no par value,
1,000,000
shares authorized:
|
||||||||
|
Series A junior participating, 300,000
shares
designated and none
issued
|
-- | -- | ||||||
|
Common stock, $1 par value,
650,000,000
shares authorized;191,033,000 shares
issued
|
191.0 | 191.0 | ||||||
|
Additional paid-in
capital
|
161.8 | 152.5 | ||||||
|
Retained earnings
|
2,323.9 | 2,150.2 | ||||||
|
Treasury stock, at cost; 65,806,000
and
65,950,000 shares,
respectively
|
(1,621.9 | ) | (1,625.9 | ) | ||||
|
Accumulated other comprehensive
loss
|
(6.5 | ) | (7.0 | ) | ||||
|
Total stockholders’
equity
|
1,048.3 | 860.8 | ||||||
|
Total
liabilities and stockholders’ equity
|
$ | 2,429.3 | $ | 2,254.0 | ||||
The accompanying
notes are an integral part of these consolidated financial
statements.
48
Consolidated
Statements of Cash Flows
|
Year
Ended December 31,
|
||||||||||||
|
(In
millions)
|
2009
|
2008
|
2007
|
|||||||||
|
Cash
flows from operating activities:
|
||||||||||||
|
Net income
|
$ | 205.0 | $ | 189.4 | $ | 236.8 | ||||||
|
Adjustments to reconcile net income to
net cash
|
||||||||||||
|
provided by operating
activities:
|
||||||||||||
|
Depreciation and
amortization
|
92.9 | 99.1 | 112.7 | |||||||||
|
Amortization of discount on convertible
notes
|
13.8 | 5.0 | -- | |||||||||
|
Impairment of long-lived
assets
|
1.5 | 2.8 | 2.7 | |||||||||
|
Stock-based compensation
|
12.1 | 12.8 | 12.7 | |||||||||
|
Net change in liability for unrecognized
tax benefits
|
(5.0 | ) | 4.6 | (11.9 | ) | |||||||
|
Deferred income taxes
|
7.6 | 11.7 | 16.5 | |||||||||
|
Other non-cash items
|
5.4 | 13.5 | (11.0 | ) | ||||||||
|
Provision for credit losses and bad
debts
|
0.4 | 0.6 | 0.4 | |||||||||
|
Changes in operating assets and
liabilities:
|
||||||||||||
|
Accounts and notes
receivable
|
(79.6 | ) | 15.2 | (0.7 | ) | |||||||
|
Inventories
|
(34.7 | ) | 93.6 | 46.8 | ||||||||
|
Other current assets
|
(2.8 | ) | (8.7 | ) | 5.3 | |||||||
|
Accounts payable, accrued expenses,
income taxes
payable and other
|
29.2 | (165.0 | ) | (31.3 | ) | |||||||
|
Net cash
provided by operating activities
|
245.8 | 274.6 | 379.0 | |||||||||
|
Cash
flows from investing activities:
|
||||||||||||
|
Additions to property, plant and
equipment
|
(81.0 | ) | (85.6 | ) | (45.3 | ) | ||||||
|
Proceeds from sale of property, plant
and equipment
|
0.4 | 0.9 | 1.5 | |||||||||
|
Acquisition of Mexican subsidiary, net
of cash acquired
|
(0.2 | ) | (42.0 | ) | -- | |||||||
|
Other investing
activities
|
-- | 2.4 | 1.8 | |||||||||
|
Net cash used
in investing activities
|
(80.8 | ) | (124.3 | ) | (42.0 | ) | ||||||
|
Cash
flows from financing activities:
|
||||||||||||
|
Repayments of borrowings
|
(43.2 | ) | (5.0 | ) | (150.0 | ) | ||||||
|
Payments of dividends
|
(31.3 | ) | (31.3 | ) | (32.8 | ) | ||||||
|
Changes in short-term borrowings and
outstanding
checks in excess of cash balances,
net
|
2.2 | (16.8 | ) | 10.7 | ||||||||
|
Proceeds from exercise of stock
options
|
0.7 | -- | 81.3 | |||||||||
|
Purchases of treasury
stock
|
-- | (111.3 | ) | (208.5 | ) | |||||||
|
Issuance of convertible
notes
|
-- | 375.0 | -- | |||||||||
|
Convertible notes issuance
costs
|
-- | (9.4 | ) | -- | ||||||||
|
Purchase of convertible notes
hedges
|
-- | (86.3 | ) | -- | ||||||||
|
Sale of common stock
warrants
|
-- | 39.9 | -- | |||||||||
|
Net cash
(used in) provided by financing activities
|
(71.6 | ) | 154.8 | (299.3 | ) | |||||||
|
Net
increase in cash and cash equivalents
|
93.4 | 305.1 | 37.7 | |||||||||
|
Cash and cash
equivalents, beginning of period
|
814.8 | 509.7 | 472.0 | |||||||||
|
Cash and cash
equivalents, end of period
|
$ | 908.2 | $ | 814.8 | $ | 509.7 | ||||||
|
Supplemental
cash flow information:
|
||||||||||||
|
Interest
paid
|
$ | 30.3 | $ | 26.5 | $ | 42.6 | ||||||
|
Income taxes
paid
|
122.4 | 123.2 | 112.2 | |||||||||
The accompanying
notes are an integral part of these consolidated financial
statements.
49
Consolidated
Statements of Stockholders’ Equity and Comprehensive Income
|
Shares at
December 31,
|
Dollars at
December 31,
|
|||||||||||||||||||||||
|
(In
millions)
|
2009
|
2008
|
2007
|
2009
|
2008
|
2007
|
||||||||||||||||||
|
Common
stock
|
||||||||||||||||||||||||
|
Beginning and
end of year
|
191.0 | 191.0 | 191.0 | $ | 191.0 | $ | 191.0 | $ | 191.0 | |||||||||||||||
|
Treasury
stock
|
||||||||||||||||||||||||
|
Beginning of
year
|
(65.9 | ) | (59.9 | ) | (55.2 | ) | $ | (1,625.9 | ) | $ | (1,516.5 | ) | $ | (1,409.1 | ) | |||||||||
|
Purchase of treasury
stock
|
-- | (6.1 | ) | (8.7 | ) | -- | (111.3 | ) | (208.5 | ) | ||||||||||||||
|
Issuance of common
stock
|
0.1 | 0.1 | 0.5 | 3.1 | 1.9 | 12.8 | ||||||||||||||||||
|
Exercise of stock
options
|
-- | -- | 3.5 | 0.9 | -- | 88.3 | ||||||||||||||||||
|
End of
year
|
(65.8 | ) | (65.9 | ) | (59.9 | ) | $ | (1,621.9 | ) | $ | (1,625.9 | ) | $ | (1,516.5 | ) | |||||||||
|
Additional
paid-in capital
|
||||||||||||||||||||||||
|
Beginning of
year
|
$ | 152.5 | $ | 108.4 | $ | 92.6 | ||||||||||||||||||
|
Issuance of common
stock
|
(1.7 | ) | (1.3 | ) | 5.3 | |||||||||||||||||||
|
Exercise of stock
options
|
(0.2 | ) | -- | (8.4 | ) | |||||||||||||||||||
|
Stock-based
compensation
|
11.2 | 11.7 | 11.6 | |||||||||||||||||||||
|
Net stock-based
compensation
income tax
benefits
|
-- | -- | 7.3 | |||||||||||||||||||||
|
Conversion option of
convertible notes
|
-- | 76.9 | -- | |||||||||||||||||||||
|
Purchase of convertible notes
hedges
|
-- | (86.3 | ) | -- | ||||||||||||||||||||
|
Tax benefit from purchase
of
convertible notes
hedges
|
-- | 3.2 | -- | |||||||||||||||||||||
|
Sale of common stock
warrants
|
-- | 39.9 | -- | |||||||||||||||||||||
|
End of
year
|
$ | 161.8 | $ | 152.5 | $ | 108.4 | ||||||||||||||||||
|
Retained
earnings
|
||||||||||||||||||||||||
|
Beginning of
year
|
$ | 2,150.2 | $ | 1,992.1 | $ | 1,780.9 | ||||||||||||||||||
|
Net
income
|
205.0 | 189.4 | 236.8 | |||||||||||||||||||||
|
Cash dividends
declared
|
(31.3 | ) | (31.3 | ) | (32.8 | ) | ||||||||||||||||||
|
Cumulative effect of adoption
of new
accounting principle for
uncertainty in
income
taxes
|
-- | -- | 7.2 | |||||||||||||||||||||
|
End of
year
|
$ | 2,323.9 | $ | 2,150.2 | $ | 1,992.1 | ||||||||||||||||||
|
Accumulated
other comprehensive
loss
|
||||||||||||||||||||||||
|
Beginning of
year
|
$ | (7.0 | ) | $ | (5.3 | ) | $ | (1.6 | ) | |||||||||||||||
|
Other comprehensive income
(loss)
|
0.5 | (1.7 | ) | (3.7 | ) | |||||||||||||||||||
|
End of
year
|
$ | (6.5 | ) | $ | (7.0 | ) | $ | (5.3 | ) | |||||||||||||||
|
Total
stockholders' equity
|
$ | 1,048.3 | $ | 860.8 | $ | 769.7 | ||||||||||||||||||
|
Comprehensive
income
|
||||||||||||||||||||||||
|
Net
income
|
$ | 205.0 | $ | 189.4 | $ | 236.8 | ||||||||||||||||||
|
Other comprehensive income
(loss),
all net of
tax:
|
||||||||||||||||||||||||
|
Foreign currency
translation
adjustments
|
1.1 | (2.5 | ) | (4.0 | ) | |||||||||||||||||||
|
Pension
adjustments
|
(0.5 | ) | 0.8 | 0.4 | ||||||||||||||||||||
|
Amortization of gain on cash
flow
hedge
|
(0.1 | ) | -- | (0.1 | ) | |||||||||||||||||||
|
Other comprehensive income
(loss)
|
0.5 | (1.7 | ) | (3.7 | ) | |||||||||||||||||||
|
Comprehensive
income
|
$ | 205.5 | $ | 187.7 | $ | 233.1 | ||||||||||||||||||
The accompanying
notes are an integral part of these consolidated financial
statements.
50
Notes
to Consolidated Financial Statements
The Notes to our
Consolidated Financial Statements are important and should be read in
conjunction with your review of the Consolidated Financial Statements. Below is
a list of the notes.
|
Note
1
|
Description
of Business
|
|
Note
2
|
Summary of
Significant Accounting Policies
|
|
Note
3
|
Supplemental
Balance Sheet Disclosures
|
|
Note
4
|
Acquisitions
|
|
Note
5
|
Indebtedness
and Borrowing Facilities
|
|
Note
6
|
Stockholders’
Equity
|
|
Note
7
|
Stock-Based
Incentive Plans
|
|
Note
8
|
Employee
Benefit Plans
|
|
Note
9
|
Income
Taxes
|
|
Note
10
|
Net Income
Per Share
|
|
Note
11
|
Derivative
Financial Instruments
|
|
Note
12
|
Fair Value
Measurements
|
|
Note
13
|
Commitments
and Contingencies
|
|
Note
14
|
Corporate and
Field Headcount Reduction
|
|
Note
15
|
Segment
Reporting
|
|
Note
16
|
Quarterly
Data (Unaudited)
|
51
NOTE
1 - DESCRIPTION OF BUSINESS
RadioShack
Corporation was incorporated in Delaware in 1967. We primarily engage in the
retail sale of consumer electronics goods and services through our RadioShack
store chain. We seek to differentiate ourselves from our various competitors by
providing cost-effective solutions to meet the routine electronics needs and
distinct electronics wants of our customers. Throughout this report, the terms
“our,” “we,” “us” and “RadioShack” refer to RadioShack Corporation, including
its subsidiaries.
U.S.
RADIOSHACK COMPANY-OPERATED STORES
At
December 31, 2009, we operated 4,476 U.S. company-operated stores under the
RadioShack brand located throughout the United States, as well as in Puerto Rico
and the U.S. Virgin Islands. These stores are located in major shopping malls
and strip centers, as well as individual storefronts. Each location carries a
broad assortment of both name brand and private brand consumer electronics
products.
Our product lines
are categorized into a number of platforms. Our wireless platform includes
postpaid and prepaid wireless handsets and communication devices such as
scanners and GPS products. Our accessory platform includes home entertainment,
wireless, music, computer, video game and GPS accessories; media storage; power
adapters; digital imaging products and headphones. Our modern home platform
includes home audio and video end-products, personal computing products,
residential telephones, and Voice over Internet Protocol products. Our personal
electronics platform includes digital cameras, digital music players, toys,
satellite radios, video gaming hardware, camcorders, and general radios. Our
power platform includes general and special purpose batteries and battery
chargers. Our technical platform includes wire and cable, connectivity products,
components and tools, and hobby products. We also provide consumers access to
third-party services such as wireless telephone activation, prepaid wireless
airtime, extended service plans, and AT&T’s ConnecTech service.
KIOSKS
At
December 31, 2009, we operated 562 kiosks located throughout the United States.
These kiosks are primarily inside Sam’s Club and Target store locations. These
locations, which are not RadioShack-branded, offer primarily wireless handsets
and their associated accessories. We also provide consumers access to
third-party wireless telephone services.
In
February 2009, we signed a contract extension with Sam’s Club through March 31,
2011, with a transition period ending June 30, 2011, to continue operating
kiosks in certain Sam’s Club locations. As part of the terms of the contract
extension, we assigned the operation of 66 kiosk locations to Sam’s Club in
2009. We will assign at least 22 locations to Sam’s Club in 2010, and Sam’s Club
still has the right to assume the operations of up to 23 additional kiosk
locations.
In
April 2009 we agreed with Sprint Nextel to cease our arrangement to jointly
operate the Sprint-branded kiosks in operation at that date. This agreement
allowed us to operate these kiosks under the Sprint name for a reasonable period
of time, allowing us to transition the kiosks to a new format. In August 2009,
we transitioned these kiosks to multiple wireless carrier RadioShack-branded
locations. They are now managed and reported as extensions of existing
RadioShack company-operated stores located in the same shopping
malls.
We
are currently conducting a test rollout of kiosk locations in approximately 100
Target stores. This test will be completed in 2010. At the conclusion of the
test, a determination will be made with Target regarding whether these
operations will be expanded or closed.
OTHER
In
addition to the reportable segments discussed above, we have other sales
channels and support operations described as follows:
Dealer Outlets: At December
31, 2009, we had a network of 1,308 RadioShack dealer outlets, including 34
located outside of North America. Our North American outlets provide name brand
and private brand products and services, typically to smaller communities. These
independent dealers are often engaged in other retail operations and augment
their businesses with our products and service offerings. Our dealer sales
derived outside of the United States are not material.
52
RadioShack.com: Products and
information are available through our commercial Web site www.radioshack.com. Online
customers can purchase, return or exchange various products available through
this Web site. Additionally, certain products ordered online may be picked up,
exchanged or returned at RadioShack stores.
RadioShack Service Centers: We maintain a service
and support network to service the consumer electronics and personal computer
retail industry in the U.S. We are a vendor-authorized service provider for many
top tier manufacturers, such as Hewlett-Packard, LG Electronics, Motorola, Nokia
and Sony, among others. In addition, we perform repairs for third-party extended
service plan providers. At December 31, 2009, we had six RadioShack service
centers in the U.S. and one in Puerto Rico.
International Operations: As
of December 31, 2009, there were 204 company-operated stores under the
RadioShack brand, 10 dealers, and one distribution center in Mexico. Prior to
December 2008, these operations were overseen by a joint venture in which we
were a slightly less than 50% minority owner with Grupo Gigante, S.A.B. de C.V.
In December 2008, we acquired 100% ownership of this joint venture. All of our
23 locations in Canada were closed by January 31, 2007.
Support
Operations:
Our retail stores,
along with our kiosks and dealer outlets, are supported by an established
infrastructure. Below are the major components of this support
structure.
Distribution Centers - At
December 31, 2009, we had four U.S. distribution centers shipping approximately
875,000 cartons each month, on average, to our U.S. retail stores and dealer
outlets. One of these distribution centers also serves as a fulfillment center
for our online customers. Additionally, we have a distribution center that ships
fixtures to our U.S. company-operated stores. During the first half of 2008, we
closed our distribution center in Columbus, Ohio.
RadioShack Technology Services
(“RSTS”) - Our management information system architecture is composed of
a distributed, online network of computers that links all stores, customer
channels, delivery locations, service centers, credit providers, distribution
facilities and our home office into a fully integrated system. Each store has
its own server to support the point-of-sale (“POS”) system. The majority of our
U.S. company-operated stores communicate through a broadband network, which
provides efficient access to customer support data. This design also allows
store management to track daily sales and inventory at the product or sales
associate level. RSTS provides the majority of our programming and systems
analysis needs.
RadioShack Global Sourcing (“RSGS”)
- RSGS serves our wide-ranging international import/export, sourcing,
evaluation, logistics and quality control needs. RSGS’s activities support our
name brand and private brand businesses.
Consumer Electronics Manufacturing
- We operate two manufacturing facilities in the United States and one in
China. These three manufacturing facilities employed approximately 2,100
employees as of December 31, 2009. We manufacture a variety of products,
primarily sold through our retail outlets, including telephones, antennas, wire
and cable products, and a variety of “hard-to-find” parts and accessories for
consumer electronics products.
NOTE
2 - SUMMARY OF SIGNIFICANT ACCOUNTING POLICIES
Basis of Presentation The
consolidated financial statements include the accounts of RadioShack Corporation
and all majority-owned domestic and foreign subsidiaries. All intercompany
accounts and transactions are eliminated in consolidation. We have evaluated
subsequent events for recognition or disclosure through February 22, 2010, which
was the date we filed this Annual Report on Form 10-K with the Securities and
Exchange Commission (“SEC”).
Use of Estimates: The
preparation of financial statements in accordance with accounting principles
generally accepted in the United States requires us to make estimates and
assumptions that affect the reported amounts of assets and liabilities, related
revenues and expenses, and the disclosure of gain and
53
loss contingencies
at the date of the financial statements and during the periods presented. We
base these estimates on historical results and various other assumptions
believed to be reasonable, all of which form the basis for making estimates
concerning the carrying values of assets and liabilities that are not readily
available from other sources. Actual results could differ materially from those
estimates.
Cash and Cash Equivalents:
Cash on hand in stores, deposits in banks and all highly liquid investments with
a maturity of three months or less at the time of purchase are considered cash
and cash equivalents. We carry our cash equivalents at cost, which approximates
fair value because of the short maturity of the instruments. The weighted
average interest rates were 0.3% and 1.0% at December 31, 2009 and 2008,
respectively, for cash equivalents totaling $820.5 million and $747.8 million,
respectively. We maintain zero balance cash disbursement accounts with
certain banks. Outstanding checks in excess of deposits with these banks
are classified as short-term debt in the Consolidated Balance Sheets.
Changes in these overdrafts from period to period are reported in the
Consolidated Statements of Cash Flows as a financing acitivity.
Accounts Receivable and Allowance for
Doubtful Accounts: Concentrations of credit risk with respect to customer
and dealer receivables are limited due to the large number of customers, dealers
and their location in many different geographic areas of the country. We
establish an allowance for doubtful accounts based on factors surrounding the
credit risk of specific customers, historical trends and other information.
Historically, such losses, in the aggregate, have not exceeded our expectations.
Account balances are charged against the allowance when we believe it is
probable that the receivable will not be recovered. We have concentration of
credit risk from service providers in the wireless telephone industry, primarily
Sprint Nextel, AT&T and T-Mobile.
Inventories: Our inventories
are stated at the lower of cost (principally based on average cost, which
approximates FIFO) or market value and are comprised primarily of finished
goods. Included in the cost of the inventories are in-bound freight expenses to
our distribution centers, out-bound freight expenses to our retail outlets, and
other direct costs relating to merchandise acquisition and distribution. If the
calculated net realizable value of the inventory is determined to be less than
the recorded cost, a provision is made to reduce the carrying amount of the
inventory.
Property, Plant and Equipment:
We state our property, plant and equipment at cost, less accumulated
depreciation and amortization. Depreciation and amortization are calculated
using the straight-line method over the following useful lives: 10-40 years for
buildings; 2-15 years for furniture, fixtures, equipment and software; leasehold
improvements are amortized over the shorter of the terms of the underlying
leases, including certain renewal periods, or the estimated useful lives of the
improvements. Major additions and betterments that substantially extend the
useful life of an asset are capitalized and depreciated. Expenditures for normal
maintenance and repairs are charged directly to expense as
incurred.
Capitalized Software Costs: We
capitalize qualifying costs related to the acquisition or development of
internal-use software. Capitalization of costs begins after the conceptual
formulation stage has been completed. Capitalized costs are amortized over the
estimated useful life of the software, which ranges between three and five
years. Capitalized software costs at December 31, 2009, 2008 and 2007, totaled
$46.6 million, $50.3 million and $50.4 million, net of accumulated amortization
of $132.2 million, $124.2 million and $100.1 million, respectively.
Impairment of Long-Lived Assets:
We review long-lived assets (primarily property, plant and equipment)
held and used, or to be disposed of, for impairment whenever events or changes
in circumstances indicate that the net book value of the asset may not be
recoverable. Recoverability is assessed based on estimated undiscounted cash
flows from the useful asset. If the carrying amount of an asset is not
recoverable, we recognize an impairment loss equal to the amount by which the
carrying amount exceeds fair value. We estimate fair value based on projected
future discounted cash flows. Our policy is to evaluate long-lived assets for
impairment at a store level for retail operations.
Leases: For lease agreements
that provide for escalating rent payments or free-rent occupancy periods, we
recognize rent expense on a straight-line basis over the non-cancelable lease
term and certain option renewal periods that appear to be reasonably assured at
the inception of the lease term. The lease term commences on the date we take
possession of or control the physical use of the property. Deferred rent is
included in other current liabilities in the Consolidated Balance
Sheets.
54
Goodwill and Intangible
Assets: Goodwill represents the excess of the purchase price over the
fair value of net assets acquired. Goodwill and intangible assets with
indefinite useful lives are reviewed at least annually for impairment (and in
interim periods if certain events occur indicating that the carrying value of
goodwill and intangible assets may be impaired). We estimate fair values
utilizing valuation methods such as discounted cash flows. We have elected the
fourth quarter to complete our annual goodwill impairment test. As a result of
the fourth quarter impairment analyses, we determined that no impairment charges
are required. The changes in the carrying amount of goodwill by segment were as
follows for the years ended December 31, 2009 and 2008:
|
(In millions)
|
U.S.
RadioShack
Stores
|
Kiosks
|
Other
|
Total
|
||||||||||||
|
Balances
at December 31, 2007
|
||||||||||||||||
|
Goodwill
|
$ | 2.4 | $ | 18.6 | $ | 2.0 | $ | 23.0 | ||||||||
|
Accumulated impairment
losses
|
-- | (18.6 | ) | (1.5 | ) | (20.1 | ) | |||||||||
| 2.4 | -- | 0.5 | 2.9 | |||||||||||||
|
Dealer
conversions
|
0.4 | -- | -- | 0.4 | ||||||||||||
|
Acquisition
of RadioShack de Mexico
|
-- | -- | 35.2 | 35.2 | ||||||||||||
|
Foreign
currency translation adjustment
|
-- | -- | (1.8 | ) | (1.8 | ) | ||||||||||
|
Balances
at December 31, 2008
|
||||||||||||||||
|
Goodwill
|
2.8 | 18.6 | 35.4 | 56.8 | ||||||||||||
|
Accumulated impairment
losses
|
-- | (18.6 | ) | (1.5 | ) | (20.1 | ) | |||||||||
| 2.8 | -- | 33.9 | 36.7 | |||||||||||||
|
Purchase
accounting adjustments
related to acquisition of
RadioShack
de Mexico
|
-- | -- | 0.3 | 0.3 | ||||||||||||
|
Foreign
currency translation adjustment
|
-- | -- | 1.9 | 1.9 | ||||||||||||
|
Balances
at December 31, 2009
|
||||||||||||||||
|
Goodwill
|
2.8 | 18.6 | 37.6 | 59.0 | ||||||||||||
|
Accumulated impairment
losses
|
-- | (18.6 | ) | (1.5 | ) | (20.1 | ) | |||||||||
| $ | 2.8 | $ | -- | $ | 36.1 | $ | 38.9 | |||||||||
Self-Insurance: We are
self-insured for certain claims relating to workers’ compensation, automobile,
property, employee health-care, and general and product liability claims,
although we obtain third-party insurance coverage to limit our exposure to these
claims. We estimate our self-insured liabilities using historical claims
experience and actuarial assumptions followed in the insurance industry.
Although we believe we have the ability to reasonably estimate losses related to
claims, it is possible that actual results could differ from recorded
self-insurance liabilities.
Income Taxes: Income taxes are
accounted for using the asset and liability method. Deferred taxes are
recognized for the tax consequences of temporary differences by applying enacted
statutory tax rates applicable to future years to differences between the
financial statement carrying amounts and the tax bases of existing assets and
liabilities. The effect on deferred taxes of a change in tax rates is recognized
in income in the period that includes the enactment date. In addition, we
recognize future tax benefits to the extent that such benefits are more likely
than not to be realized. Income tax expense includes U.S. and international
income taxes, plus the provision for U.S. taxes on undistributed earnings of
international subsidiaries not deemed to be permanently invested.
Revenue Recognition: Our
revenue is derived principally from the sale of name brand and private brand
products and services to consumers. Revenue is recognized, net of an estimate
for customer refunds and product returns, when persuasive evidence of an
arrangement exists, delivery has occurred or services have been rendered, the
sales price is fixed or determinable, and collectability is reasonably
assured.
Certain products,
such as wireless telephone handsets, require the customer to use the services of
a third-party service provider. The third-party service provider pays us an
upfront commission for obtaining a new customer and, in some cases, a monthly
recurring residual amount based upon the ongoing
55
arrangement between
the service provider and the customer. Our sale of an activated wireless
telephone handset is the single event required to meet the delivery criterion
for both the upfront commission and the residual revenue. Upfront commission
revenue, net of estimated service deactivations, is generally recognized at the
time an activated wireless telephone handset is sold to the customer at the
point-of-sale. Based on our extensive history in selling activated wireless
telephone handsets, we have been able to establish reliable deactivation
estimates. Recurring residual income is recognized as earned under the terms of
our contracts with the service providers, which is typically as the service
provider bills its customer, generally on a monthly basis. Sales of wireless
handsets and the related commissions and residual income constitute more than
one-third of our total revenue. Our three largest third-party wireless service
providers are Sprint Nextel, AT&T, and T-Mobile.
Cost of Products Sold: Cost of
products sold primarily includes the total cost of merchandise inventory sold,
direct costs relating to merchandise acquisition and distribution (including
depreciation and excise taxes), costs of services provided, in-bound freight
expenses to our distribution centers, out-bound freight expenses to our retail
outlets, physical inventory valuation adjustments and losses, customer shipping
and handling charges, and certain vendor allowances (see “Vendor Allowances”
below).
Vendor Allowances: We receive
allowances from third-party service providers and product vendors through a
variety of promotional programs and arrangements as a result of purchasing and
promoting their products and services in the normal course of business. We
consider vendor allowances received to be a reduction in the price of a vendor's
products or services and record them as a component of inventory until the
product is sold, at which point we record them as a component of cost of
products sold unless the allowances represent reimbursement of specific,
incremental and identifiable costs incurred to promote a vendor's products and
services. In this case, we record the vendor reimbursement when earned as an
offset to the associated expense incurred to promote the applicable products
and/or services.
Advertising Costs: Our
advertising costs are expensed the first time the advertising takes place. We
receive allowances from certain third-party service providers and product
vendors that we record when earned as an offset to advertising expense incurred
to promote the applicable products and/or services only if the allowances
represent reimbursement of specific, incremental and identifiable costs (see
“Vendor Allowances” above). Advertising expense was $193.0 million, $214.5
million and $208.8 million for the years ended December 31, 2009, 2008 and 2007,
respectively.
Stock-Based Compensation: We
measure all employee stock-based compensation awards using a fair value method
and record this expense in the consolidated financial statements. Our
stock-based compensation relates to stock options, restricted stock awards, and
other equity-based awards issued to our employees and directors. On the date
that an award is granted, we determine the fair value of the award and recognize
the compensation expense over the requisite service period, which typically is
the period over which the award vests.
Fair Value Measurements:
Certain assets and liabilities are required to be measured at fair value either
on a recurring basis or non-recurring basis. We estimate fair values based on
one or more of the following valuation techniques: the market approach
(comparable market prices), the income approach (present value of future income
or cash flow), or the cost approach (cost to replace the service capacity of an
asset or replacement cost). See Note 12 - “Fair Value Measurements” for
additional disclosures of our fair value measurements.
Derivative Instruments and Hedging
Activities: We recognize all derivative financial instruments in the
consolidated financial statements at fair value. Changes in the fair value of
derivative financial instruments that qualify for hedge accounting are recorded
in stockholders’ equity as a component of comprehensive income or as an
adjustment to the carrying value of the hedged item. Changes in fair values of
derivatives not qualifying for hedge accounting are reported in
earnings.
We
maintain internal controls over our hedging activities, which include policies
and procedures for risk assessment and the approval, reporting and monitoring of
all derivative financial instrument activities. We monitor our hedging positions
and creditworthiness of our counter-parties and do not anticipate
losses
56
due to our
counter-parties’ nonperformance. We do not hold or issue derivative financial
instruments for trading or speculative purposes. To qualify for hedge
accounting, derivatives must meet defined correlation and effectiveness
criteria, be designated as a hedge and result in cash flows and financial
statement effects that substantially offset those of the position being
hedged.
Foreign Currency Translation:
The functional currency of substantially all operations outside the U.S. is the
applicable local currency. Translation gains or losses related to net assets
located outside the United States are included as a component of accumulated
other comprehensive (loss) income and are classified in the stockholders’ equity
section of the accompanying Consolidated Balance Sheets.
Reclassifications: Certain
amounts in the December 31, 2008 and 2007, financial statements have been
reclassified to conform with the December 31, 2009, presentation. These
reclassifications had no effect on net income or total stockholders’ equity as
previously reported.
New Accounting Standards: In
September 2006, the Financial Accounting Standards Board (“FASB”) issued new
accounting guidance related to fair value measurements and related disclosures.
This new guidance defines fair value, establishes a framework for measuring fair
value, and expands disclosures about fair value measurements. We adopted this
new guidance on January 1, 2008, as required, for our financial assets and
financial liabilities. However, the FASB deferred the effective date of this new
guidance for one year as it relates to fair value measurement requirements for
nonfinancial assets and nonfinancial liabilities that are not recognized or
disclosed at fair value on a recurring basis. We adopted these remaining
provisions effective January 1, 2009. The adoption of this accounting guidance
did not have a material effect on our consolidated financial
statements.
In
December 2007, the FASB issued new accounting guidance related to the accounting
for business combinations and related disclosures. This new guidance addresses
the recognition and accounting for identifiable assets acquired, liabilities
assumed, and noncontrolling interests in business combinations. The guidance
also establishes expanded disclosure requirements for business combinations. The
guidance was effective for us on January 1, 2009, and we will apply this new
guidance prospectively to all business combinations subsequent to the effective
date.
In
December 2007, the FASB issued new accounting guidance related to the accounting
for noncontrolling interests in consolidated financial statements. This guidance
establishes accounting and reporting standards for the noncontrolling interest
in a subsidiary and for the deconsolidation of a subsidiary. This guidance
requires that noncontrolling interests in subsidiaries be reported in the equity
section of the controlling company’s balance sheet. It also changes the manner
in which the net income of the subsidiary is reported and disclosed in the
controlling company’s income statement. This guidance was effective for fiscal
years beginning after December 15, 2008. We adopted this guidance effective
January 1, 2009, and it had no effect on our consolidated financial
statements.
In
March 2008, the FASB issued new accounting guidance related to disclosures about
derivative instruments and hedging activities. This guidance amends and expands
disclosure requirements to provide a better understanding of how and why an
entity uses derivative instruments, how derivative instruments and related
hedged items are accounted for, and their effect on an entity’s financial
position, financial performance, and cash flows. This guidance was effective for
fiscal years beginning after November 15, 2008. We adopted this guidance
effective January 1, 2009, and have applied its requirements on a prospective
basis. Accordingly, disclosures related to periods prior to the date of adoption
have not been presented. See Note 11 - “Derivative Financial Instruments” for
these new disclosures.
57
In
May 2008, the FASB issued new accounting guidance related to the accounting for
convertible debt instruments that may be settled in cash upon conversion. This
guidance requires us to account separately for the liability and equity
components of our convertible notes in a manner that reflects our nonconvertible
debt borrowing rate when interest cost is recognized in subsequent periods. This
guidance requires bifurcation of a component of the debt, classification of that
component in equity, and then accretion of the resulting discount on the debt as
part of interest expense being reflected in the income statement. The guidance
requires retrospective application to all periods presented and was effective
for fiscal years beginning after December 15, 2008.
On
January 1, 2009, as a result of adopting the new accounting guidance, we
recorded an adjustment to reduce the carrying value of our 2013 Convertible
Notes by $73.0 million. The adoption resulted in a carrying amount for the 2013
Convertible Notes of $302.0 million at December 31, 2008. The carrying amount
for the equity component is $78.0 million. See Note 5 - "Indebtedness and
Borrowing Facilities" for additional disclosures. The following table summarizes
the application of the FASB’s new accounting guidance on our previously reported
results:
|
(In millions, except per share
amounts)
|
As
Adjusted
|
As
Previously
Reported
|
||||||
|
For
the Year Ended December 31, 2008
|
||||||||
|
Depreciation
and amortization
|
$ | 87.9 | $ | 88.1 | ||||
|
Interest
expense
|
34.9 | 29.9 | ||||||
|
Income tax
expense
|
110.1 | 111.9 | ||||||
|
Net
income
|
189.4 | 192.4 | ||||||
|
Basic and
diluted net income per share
|
$ | 1.47 | $ | 1.49 | ||||
|
As
of December 31, 2008
|
||||||||
|
Other current
assets
|
$ | 98.6 | $ | 99.0 | ||||
|
Other assets,
net
|
156.0 | 185.1 | ||||||
|
Long-term
debt
|
659.5 | 732.5 | ||||||
|
Additional
paid-in capital
|
152.5 | 106.0 | ||||||
|
Retained
earnings
|
2,150.2 | 2,153.2 | ||||||
In
June 2009, the FASB issued new accounting guidance related to the accounting and
disclosures of subsequent events. This guidance incorporates the subsequent
events guidance contained in the auditing standards literature into
authoritative accounting literature. It also requires entities to disclose the
date through which they have evaluated subsequent events and whether the date
corresponds with the release of their financial statements. This guidance was
effective for all interim and annual periods ending after June 15, 2009. We
adopted this guidance upon its issuance and it had no material effect on our
consolidated financial statements. See Note 2 - “Basis of Presentation” for this
new disclosure.
In
June 2009, the FASB issued new accounting guidance related to the accounting and
disclosures for transfers of financial assets. This guidance will require
entities to provide more information about sales of securitized financial assets
and similar transactions, particularly if the seller retains some risk with
respect to the assets. This guidance is effective for fiscal years beginning
after November 15, 2009. We adopted this guidance effective January 1, 2010, and
the adoption had no effect on our consolidated financial
statements.
58
In
June 2009, the FASB issued new accounting guidance to improve financial
reporting by companies involved with variable interest entities and to provide
more relevant and reliable information to users of financial statements. This
guidance is effective for fiscal years beginning after November 15, 2009. We
adopted this guidance effective January 1, 2010, and the adoption had no effect
on our consolidated financial statements.
In
August 2009, the FASB issued new accounting guidance to provide clarification on
measuring liabilities at fair value when a quoted price in an active market is
not available. This guidance became effective for us on October 1, 2009. We
adopted this guidance effective October 1, 2009, and it had no effect on our
consolidated financial statements.
NOTE
3 – SUPPLEMENTAL BALANCE SHEET DISCLOSURES
Accounts and Notes Receivable,
Net: As of December 31, 2009 and 2008, we had the following accounts and
notes receivable outstanding in the accompanying Consolidated Balance
Sheets:
|
December
31,
|
||||||||
|
(In millions)
|
2009
|
2008
|
||||||
|
Receivables
from vendors and service
providers, net
|
$ | 247.5 | $ | 144.2 | ||||
|
Trade
accounts receivable
|
49.1 | 68.6 | ||||||
|
Other
receivables
|
27.7 | 30.6 | ||||||
|
Allowance for
doubtful accounts
|
(1.8 | ) | (1.5 | ) | ||||
|
Accounts and
notes receivable, net
|
$ | 322.5 | $ | 241.9 | ||||
Receivables from
vendors and service providers relate to earned wireless activation commissions,
rebates, residual income, promotions, marketing development funds and other
payments from our third-party service providers and product vendors, after
taking into account estimates for service providers’ customer deactivations and
non-activations, which are factors in determining the amount of wireless
activation commissions and residual income earned.
The change in the
allowance for doubtful accounts is as follows:
|
December
31,
|
||||||||||||
|
(In millions)
|
2009
|
2008
|
2007
|
|||||||||
|
Balance at
the beginning of the year
|
$ | 1.5 | $ | 2.5 | $ | 2.5 | ||||||
|
Provision for
bad debts included in selling,
|
||||||||||||
|
general and administrative
expense
|
0.4 | 0.6 | 0.4 | |||||||||
|
Uncollected
receivables written off, net
|
(0.1 | ) | (1.6 | ) | (0.4 | ) | ||||||
|
Balance at
the end of the year
|
$ | 1.8 | $ | 1.5 | $ | 2.5 | ||||||
Other
Current Assets, Net:
|
December
31,
|
||||||||
|
(In millions)
|
2009
|
2008
|
||||||
|
Deferred
income taxes
|
$ | 68.8 | $ | 63.9 | ||||
|
Other
|
45.6 | 34.7 | ||||||
|
Total other
current assets, net
|
$ | 114.4 | $ | 98.6 | ||||
59
Property, Plant and Equipment,
Net:
|
December
31,
|
||||||||
|
(In millions)
|
2009
|
2008
|
||||||
|
Land
|
$ | 2.4 | $ | 2.7 | ||||
|
Buildings
|
55.2 | 55.0 | ||||||
|
Furniture,
fixtures, equipment and
software
|
663.2 | 679.6 | ||||||
|
Leasehold
improvements
|
360.9 | 358.6 | ||||||
|
Total
PP&E
|
1,081.7 | 1,095.9 | ||||||
|
Less
accumulated depreciation
and amortization
|
(799.4 | ) | (789.5 | ) | ||||
|
Property,
plant and equipment, net
|
$ | 282.3 | $ | 306.4 | ||||
Other
Assets, Net:
|
December
31,
|
||||||||
|
(In millions)
|
2009
|
2008
|
||||||
|
Notes
receivable
|
$ | 10.0 | $ | 10.3 | ||||
|
Deferred
income taxes
|
53.1 | 66.8 | ||||||
|
Other
|
29.3 | 42.2 | ||||||
|
Total other
assets, net
|
$ | 92.4 | $ | 119.3 | ||||
Accrued
Expenses and Other Current Liabilities:
|
December
31,
|
||||||||
|
(In millions)
|
2009
|
2008
|
||||||
|
Payroll and
bonuses
|
$ | 67.0 | $ | 50.3 | ||||
|
Insurance
|
75.9 | 84.2 | ||||||
|
Sales and
payroll taxes
|
41.9 | 41.5 | ||||||
|
Rent
|
36.8 | 41.0 | ||||||
|
Advertising
|
31.4 | 31.7 | ||||||
|
Gift card
deferred revenue
|
19.4 | 20.5 | ||||||
|
Other
|
86.6 | 98.1 | ||||||
|
Total accrued
expenses and other
current liabilities
|
$ | 359.0 | $ | 367.3 | ||||
Other
Non-Current Liabilities:
|
December
31,
|
||||||||
|
(In millions)
|
2009
|
2008
|
||||||
|
Deferred
compensation
|
$ | 33.1 | $ | 35.2 | ||||
|
Liability for
unrecognized tax benefits
|
35.1 | 46.1 | ||||||
|
Other
|
30.5 | 15.2 | ||||||
|
Total other
non-current liabilities
|
$ | 98.7 | $ | 96.5 | ||||
NOTE
4 – ACQUISITIONS
RadioShack de Mexico: In
December 2008, we acquired the remaining interest (slightly more than 50%) of
our Mexican joint venture - RadioShack de Mexico, S.A. de C.V. - with Grupo
Gigante, S.A.B. de C.V. We now own 100% of this subsidiary, which consisted of
200 RadioShack-branded stores and 14 dealers throughout Mexico at the time of
acquisition. The purchase price was $44.9 million which consisted of $42.2
million in cash paid and transaction costs, net of cash acquired, plus $2.7
million in assumed debt. The acquisition was accounted for using the purchase
method of accounting in accordance with the FASB’s accounting guidance for
business combinations. The purchase price allocation resulted in an excess of
purchase price over net tangible assets acquired of $35.5 million, all of which
was attributed to goodwill. The goodwill will not be subject to amortization for
book purposes but rather an annual test for impairment. The premium we paid in
excess of the fair value of the net assets acquired was based on the established
business in Mexico and our ability to expand our business in Mexico and possibly
other countries. The goodwill will not be deductible for tax purposes. Results
of the acquired business have been included in our operations from December 1,
2008.
60
NOTE
5 - INDEBTEDNESS AND BORROWING FACILITIES
Long-Term
Debt:
|
December
31,
|
||||||||
|
(In millions)
|
2009
|
2008
|
||||||
|
Five year
2.5% unsecured convertible notes due in 2013
|
$ | 375.0 | $ | 375.0 | ||||
|
Ten-year
7.375% unsecured note payable due in 2011
|
306.8 | 350.0 | ||||||
|
Other
|
1.0 | 1.0 | ||||||
| 682.8 | 726.0 | |||||||
|
Unamortized
debt discounts and other costs
|
(59.4 | ) | (73.2 | ) | ||||
|
Basis
adjustment due to interest rate swaps
|
4.4 | 6.7 | ||||||
|
Total
long-term debt
|
$ | 627.8 | $ | 659.5 | ||||
Long-term
borrowings outstanding at December 31, 2009, mature as follows:
|
Long-Term
|
||||
|
(In millions)
|
Borrowings
|
|||
|
2010
|
$ | -- | ||
|
2011
|
306.8 | |||
|
2012
|
-- | |||
|
2013
|
375.0 | |||
|
2014
|
1.0 | |||
|
2015 and
thereafter
|
-- | |||
|
Total
|
$ | 682.8 | ||
2013 Convertible Notes: In
August 2008, we issued $375 million principal amount of convertible senior notes
due August 1, 2013, (the “2013 Convertible Notes”) in a private offering to
qualified institutional buyers under SEC Rule 144A. The 2013 Convertible Notes
were issued at par and bear interest at a rate of 2.50% per annum. Interest is
payable semiannually, in arrears, on February 1 and August 1.
Each $1,000 of
principal of the 2013 Convertible Notes is initially convertible, under certain
circumstances, into 41.2414 shares of our common stock (or a total of
approximately 15.5 million shares), which is the equivalent of $24.25 per share,
subject to adjustment upon the occurrence of specified events set forth under
terms of the 2013 Convertible Notes. Upon conversion, we would pay the holder
the cash value of the applicable number of shares of our common stock, up to the
principal amount of the note. Amounts in excess of the principal amount, if any,
(the “excess conversion value”) may be paid in cash or in stock, at our option.
Holders may convert their 2013 Convertible Notes into common stock on the net
settlement basis described above at any time from May 1, 2013, until the close
of business on July 29, 2013, or if, and only if, one of the following
conditions has been met:
|
·
|
During any
calendar quarter, and only during such calendar quarter, in which the
closing price of our common stock for at least 20 trading days in the
period of 30 consecutive trading days ending on the last trading day of
the preceding calendar quarter exceeds 130% of the conversion price per
share of common stock in effect on the last day of such preceding calendar
quarter
|
|
·
|
During the
five consecutive business days immediately after any 10 consecutive
trading day period in which the average trading price per $1,000 principal
amount of 2013 Convertible Notes was less than 98% of the product of the
closing price of the common stock on such date and the conversion rate on
such date
|
|
·
|
We make
specified distributions to holders of our common stock or specified
corporate transactions occur
|
The 2013
Convertible Notes were not convertible at the holders' option at any time during
2009.
Holders who convert
their 2013 Convertible Notes in connection with a change in control may be
entitled to a make-whole premium in the form of an increase in the conversion
rate. In addition, upon a change in control, liquidation, dissolution or
delisting, the holders of the 2013 Convertible Notes may require us
to
61
repurchase for cash
all or any portion of their 2013 Convertible Notes for 100% of the principal
amount of the notes plus accrued and unpaid interest, if any. As of December 31,
2009, none of the conditions allowing holders of the 2013 Convertible Notes to
convert or requiring us to repurchase the 2013 Convertible Notes had been
met.
In
connection with the issuance of the 2013 Convertible Notes, we entered into
separate convertible note hedge transactions and separate warrant transactions
with respect to our common stock to reduce the potential dilution upon
conversion of the 2013 Convertible Notes (collectively referred to as the “Call
Spread Transactions”). The convertible note hedges and warrants will generally
have the effect of increasing the economic conversion price of the 2013
Convertible Notes to $36.60 per share of our common stock, representing a 100%
conversion premium based on the closing price of our common stock on August 12,
2008. See Note 6 - “Stockholders’ Equity,” for more information on the Call
Spread Transactions.
Because the
principal amount of the 2013 Convertible Notes will be settled in cash upon
conversion, the 2013 Convertible Notes will only affect diluted earnings per
share when the price of our common stock exceeds the conversion price (initially
$24.25 per share). We will include the effect of the additional shares that may
be issued from conversion in our diluted net income per share calculation using
the treasury stock method.
Application of the FASB’s New
Accounting Guidance: On January 1, 2009, as a result of adopting the new
accounting guidance related to the accounting for convertible debt instruments
that may be settled in cash upon conversion, we recorded an adjustment to reduce
the carrying value of our 2013 Convertible Notes by $73.0 million. The adoption
resulted in a carrying amount for the 2013 Convertible Notes of $302.0 million
at December 31, 2008. The carrying amount for the equity component is $78.0
million. The adjustment to the carrying value of the 2013 Convertible Notes was
based on the calculated fair value of a similar debt instrument in August 2008
(at issuance) that does not have an associated equity component. The annual
interest rate calculated for a similar debt instrument in August 2008 was 7.6%.
The resulting discount is being amortized to interest expense over the remaining
term of the convertible notes. The carrying value of the 2013 Convertible Notes
was $315.8 million and $302.0 million at December 31, 2009 and 2008,
respectively. We recognized interest expense of $9.4 million and $3.5 million in
2009 and 2008, respectively, related to the stated 2.50% coupon. We recognized
non-cash interest expense of $13.8 million and $5.0 million in 2009 and 2008,
respectively, for the amortization of the discount on the liability
component.
Debt issuance costs
of $7.5 million were capitalized and are being amortized to interest expense
over the term of the 2013 Convertible Notes. Unamortized debt issuance costs
were $5.3 million at December 31, 2009. Debt issuance costs of $1.9 million were
related to the equity component and were recorded as a reduction of additional
paid-in capital.
For federal income
tax purposes, the issuance of the 2013 Convertible Notes and the purchase of the
convertible note hedges are treated as a single transaction whereby we are
considered to have issued debt with an original issue discount. The amortization
of this discount in future periods is deductible for tax purposes. Therefore,
upon issuance of the debt, we recorded an adjustment to increase our deferred
tax assets (included in other assets, net) and additional paid-in capital for
these future tax deductions. Upon adoption of the new accounting guidance in the
first quarter of 2009, this adjustment was reduced by $27.8 million because our
recorded interest expense for book purposes more closely aligns with federal tax
treatment.
2011 Long-Term Notes: On May
11, 2001, we issued $350 million of 10-year 7.375% notes (“2011 Notes”) in a
private offering to qualified institutional buyers under SEC Rule 144A. In
August 2001, under the terms of an exchange offering filed with the SEC, we
exchanged substantially all of these notes for a similar amount of publicly
registered notes. The exchange resulted in substantially all of the notes
becoming registered with the SEC and did not result in additional debt being
issued.
The annual interest
rate on the notes is 7.375% per annum, with interest payable on November 15 and
May 15 of each year. The notes contain certain non-financial covenants and
mature on May 15, 2011. In
62
September 2009, we
completed a tender offer to purchase for cash any and all of these notes. Upon
expiration of the offer, $43.2 million of the aggregate outstanding principal
amount of the notes was validly tendered and accepted. We paid a total of $46.6
million, which consisted of the purchase price of $45.4 million for the tendered
notes plus $1.2 million in accrued and unpaid interest, to the holders of the
tendered notes. We incurred $0.2 million in expenses and adjusted the carrying
value of the tendered notes by an incremental $0.8 million to reflect a
proportionate write-off of the balance associated with our fair value hedge
included in long-term debt. This transaction resulted in a loss of $1.6 million
classified as other loss on our consolidated statements of income.
A
portion of these notes were hedged by our interest rate swaps. Upon repurchase
of these notes, we were required to discontinue the hedge accounting treatment
associated with these derivative instruments which used the short-cut method.
The remaining balance associated with our fair value hedge was recorded as an
adjustment to the carrying value of these notes and is being amortized to
interest expense over the remaining term of the notes. At December 31, 2009,
this carrying value adjustment was $4.4 million. See Note 11 - “Derivative
Financial Instruments,” for more information on our interest rate
swaps.
Credit Facilities: Our $325
million credit facility provides us a source of liquidity. Interest charges
under this facility are derived using a base LIBOR rate plus a margin which
changes based on our credit ratings. This facility has customary terms and
covenants, and we were in compliance with these covenants at December 31, 2009.
As of December 31, 2009, we had $291.3 million in borrowing capacity available
under our existing credit facility due to the issuance of standby letters of
credit. We incurred no borrowings from this facility during 2009. This facility
expires in May of 2011.
On
September 11, 2008, we terminated our $300 million credit facility, which was
set to expire in June of 2009. This facility was no longer required due to the
issuance of our 2013 Convertible Notes.
NOTE
6 - STOCKHOLDERS’ EQUITY
Stock Repurchase Programs: In
February 2005, our Board of Directors approved a share repurchase program with
no expiration date authorizing management to repurchase up to $250 million of
our common stock in open market purchases. During 2008, we repurchased
approximately 0.1 million shares or $1.4 million of our common stock under this
program. As of December 31, 2008, there were no further share repurchases
authorized under this program.
In
July 2008, our Board of Directors approved a share repurchase program with no
expiration date authorizing management to repurchase up to $200 million of our
common stock. During the third quarter of 2008, we repurchased 6.0 million
shares or $110.0 million of our common stock under this program. As of December
31, 2008, there was $90.0 million available for share repurchases under this
program. In August 2009, our Board of Directors approved a $200 million increase
in this share repurchase program. As of December 31, 2009, $290 million of the
total authorized amount was available for share repurchases under this
program.
Dividends Declared: We
declared an annual dividend of $0.25 per share in November of 2009, 2008 and
2007. The dividends were paid in December of each year.
Call Spread Transactions: In
connection with the issuance of the 2013 Convertible Notes (see Note 5 –
“Indebtedness and Borrowing Facilities”), we entered into separate convertible
note hedge transactions and separate warrant transactions related to our common
stock with Citigroup and Bank of America to reduce the potential dilution upon
conversion of the 2013 Convertible Notes.
Under the terms of
the convertible note hedge arrangements (the “Convertible Note Hedges”), we paid
$86.3 million for a forward purchase option contract under which we are entitled
to purchase a fixed number of shares of our common stock at a price per share of
$24.25. In the event of the conversion of the 2013 Convertible Notes, this
forward purchase option contract allows us to purchase, at a fixed price equal
to the implicit conversion price of common shares issued under the 2013
Convertible Notes, a number of common shares equal to the common shares that we
issue to a note holder upon conversion. Settlement terms of this forward
purchase option allow us to elect cash or share settlement based on the
settlement option we choose in settling the conversion feature of the 2013
Convertible Notes. The Convertible Note Hedges expire on August 1,
2013.
63
Also concurrent
with the issuance of the 2013 Convertible Notes, we sold warrants (the
“Warrants”) permitting the purchasers to acquire shares of our common stock. The
Warrants are currently exercisable for 15.5 million shares of RadioShack common
stock at a current exercise price of $36.60 per share. We received $39.9 million
in proceeds for the sale of the Warrants. The Warrants may be settled at various
dates beginning in November 2013 and ending in March 2014. The Warrants provide
for net share settlement. In no event will we be required to deliver a number of
shares in connection with the transaction in excess of twice the aggregate
number of Warrants.
We
determined that the Convertible Note Hedges and Warrants meet the requirements
of the FASB’s accounting guidance for accounting for derivative financial
instruments indexed to, and potentially settled in, a company's own stock and
other relevant guidance and, therefore, are classified as equity transactions.
As a result, we recorded the purchase of the Convertible Note Hedges as a
reduction in additional paid-in capital and the proceeds of the Warrants as an
increase to additional paid-in capital in the Consolidated Balance Sheets, and
we will not recognize subsequent changes in the fair value of the agreements in
the financial statements.
In
accordance with the FASB’s accounting guidance in calculating earnings per
share, the Warrants will have no effect on diluted net income per share until
our common stock price exceeds the per share strike price of $36.60 for the
Warrants. We will include the effect of additional shares that may be issued
upon exercise of the Warrants using the treasury stock method. The Convertible
Note Hedges are antidilutive and, therefore, will have no effect on diluted net
income per share.
NOTE
7 – STOCK-BASED INCENTIVE PLANS
We
have implemented several plans to award employees with stock-based compensation,
which are described below.
Stock Option Plans: Under the
Incentive Stock Plans (“ISPs”) described below, the exercise price of options
must be equal to or greater than the fair market value of a share of our common
stock on the date of grant. The Management Development and Compensation
Committee (“MD&C”) of our Board of Directors specifies the terms for grants
of options under these ISPs; terms of these options may not exceed ten years.
Grants of options generally vest over three years and grants typically have a
term of seven or ten years. Option agreements issued under the ISPs generally
provide that, in the event of a change in control, all options become
immediately and fully exercisable. Repricing or exchanging options for lower
priced options is not permitted under the ISPs without shareholder approval. A
brief description of each of our incentive stock plans with unexercised options
still outstanding is described below:
1993 Incentive Stock Plan (“1993
ISP”): The 1993 ISP permitted the grant of up to 12.0 million shares in
the form of incentive stock options (“ISOs”), non-qualified stock options
(options which are not ISOs) (“NQs”) and restricted stock. The 1993 ISP expired
March 28, 2003, and no further grants may be made under this plan.
1997 Incentive Stock Plan (“1997
ISP”): The 1997 ISP permitted the grant of up to 11.0 million shares in
the form of ISOs, NQs and restricted stock. The 1997 ISP expired on February 27,
2007, and no further grants may be made under this plan.
1999 Incentive Stock Plan (“1999
ISP”): The 1999 ISP permitted the grant of up to 9.5 million shares in
the form of NQs. Grants of restricted stock, performance awards and options
intended to qualify as ISO’s under the Internal Revenue Code were not authorized
under this plan. The 1999 ISP also permitted directors to elect to receive
shares in lieu of cash payments for their annual retainer fees and board and
committee meeting fees. The 1999 ISP expired on February 23, 2009, and no
further grants may be made under this plan.
2001 Incentive Stock Plan (“2001
ISP”): The 2001 ISP permitted the grant of up to 9.2 million shares in
the form of ISOs and NQs. The 2001 ISP also permitted directors to elect to
receive shares in lieu of cash payments for their annual retainer fees and board
and committee meeting fees. The 2001 ISP was terminated in 2009 upon the
shareholder approval of the 2009 ISP and no further grants may be made under
this plan.
64
2009 Incentive Stock Plan (“2009
ISP”): The 2009 ISP permits the grant of up to 11.0 million shares in the
form of ISOs, NQs, restricted stock, restricted stock units, stock appreciation
rights, or other stock-based awards. The 2009 ISP also permits directors to
elect to receive shares in lieu of cash payments for their annual retainer fees
and board and committee meeting fees. Full-value awards granted under the 2009
ISP, such as restricted stock and restricted stock units, will reduce the number
of shares available for grant by 1.68 shares for each share or unit granted.
Stock options and stock appreciation rights will reduce the number of shares
available for grant by one share for each stock option or stock appreciation
right granted. This plan expires on February 18, 2019. As of December 31, 2009,
there were 10.5 million shares available for grants under the 2009
ISP.
During the third
quarter of 2006, we granted 1.7 million options under the 1997, 1999 and 2001
ISPs to our Chief Executive Officer and Chief Financial Officer. These options
vest over four years from the date of grant and have a term of seven years. We
also granted 2.5 million non-plan options to our Chief Executive Officer as part
of an inducement grant related to the terms of his employment. These options
vest over four years from the date of grant and have a term of seven years. An
additional market condition is attached to 2.0 million of these non-plan options
that restricts exercise until certain stock price hurdles are achieved. The
market condition was met in 2007, and all stock price hurdles were
achieved.
The fair value of
the stock options granted during the years ended December 31, 2009, 2008 and
2007, was estimated using the Black-Scholes-Merton option-pricing model. The
Black-Scholes-Merton model requires the use of certain subjective assumptions.
The following table lists the assumptions used in calculating the fair value of
stock options granted during each year:
|
Valuation
Assumptions(1)
|
2009
|
2008
|
2007
|
|||||||||
|
Risk free
interest rate(2)
|
2.0 | % | 2.8 | % | 4.2 | % | ||||||
|
Expected
dividend yield
|
1.8 | % | 1.0 | % | 1.0 | % | ||||||
|
Expected
stock price volatility(3)
|
50.38 | % | 40.49 | % | 32.7 | % | ||||||
|
Expected life
of stock options (in years)(4)
|
5.4 | 4.6 | 4.6 | |||||||||
|
(1)
|
Forfeitures
are estimated using historical experience and projected employee
turnover.
|
|
(2)
|
Based on the
U.S. Treasury constant maturity interest rate whose term is consistent
with the expected life of our stock options.
|
|
(3)
|
We consider
both the historical volatility of our stock price, as well as implied
volatilities from exchange-traded options on our stock.
|
|
(4)
|
We estimate
the expected life of stock options based upon historical
experience.
|
The
weighted-average fair values of options granted during fiscal years 2009, 2008
and 2007, were $4.32, $6.33 and $6.99, respectively.
Information with
respect to stock option activity under the above plans is as
follows:
|
Shares
(In
thousands)
|
Weighted
Average
Exercise
Price
|
Remaining
Contractual
Life
(in
years)
|
Aggregate
Intrinsic
Value
(in
millions)
|
|||||||||||||
|
Outstanding
at January 1, 2009
|
12,619 | $ | 27.43 | |||||||||||||
|
Grants
|
1,538 | 7.16 | ||||||||||||||
|
Exercised
|
(38 | ) | 18.57 | |||||||||||||
|
Expired
|
(1,559 | ) | 37.99 | |||||||||||||
|
Forfeited
|
(2,546 | ) | 36.95 | |||||||||||||
|
Outstanding
at December 31, 2009
|
10,014 | $ | 20.28 | 3.3 | $ | 41.7 | ||||||||||
|
Exercisable
at December 31, 2009
|
7,059 | $ | 23.89 | 2.6 | $ | 18.3 | ||||||||||
65
The compensation
cost charged against income for stock-based compensation plans was $12.1
million, $12.8 million and $12.7 million in 2009, 2008 and 2007, respectively.
The total income tax benefit recognized for these stock-based compensation plans
was $3.9 million, $3.4 million and $2.6 million in 2009, 2008 and 2007,
respectively.
The aggregate
intrinsic value of options exercised under our stock option plans was $0.1
million, zero, and $22.9 million for 2009, 2008 and 2007, respectively. The
aggregate intrinsic value is the amount by which the market price of our common
stock on the date of exercise exceeded the exercise price of the
option.
The following table
summarizes information concerning currently outstanding and exercisable options
to purchase our common stock:
|
(Share
amounts
in thousands)
|
Options
Outstanding
|
Options
Exercisable
|
||||||||||||||||||||
|
Range
of
Exercise
Prices
|
Shares
Outstanding
at Dec. 31,
2009
|
Weighted
Average
Remaining
Contractual
Life
(in
years)
|
Weighted
Average
Exercise
Price
|
Shares
Exercisable
at Dec. 31,
2009
|
Weighted
Average
Exercise
Price
|
|||||||||||||||||
| $ | 7.05 – 13.58 | 1,417 | 6.2 | $ | 7.17 | -- | $ | -- | ||||||||||||||
| 13.82 – 13.82 | 4,000 | 3.5 | 13.82 | 3,100 | 13.82 | |||||||||||||||||
| 14.71 – 24.41 | 2,022 | 3.7 | 19.62 | 1,384 | 20.06 | |||||||||||||||||
| 29.35 – 38.35 | 1,852 | 1.5 | 35.88 | 1,852 | 35.88 | |||||||||||||||||
| 39.03 – 60.16 | 723 | 0.3 | 43.70 | 723 | 43.70 | |||||||||||||||||
| $ | 7.05 – 60.16 | 10,014 | 3.3 | $ | 20.28 | 7,059 | $ | 23.89 | ||||||||||||||
The number of
exercisable options outstanding at December 31, 2009, 2008 and 2007, was 7.1
million, 9.6 million and 11.4 million, respectively.
At
December 31, 2009, there was $4.1 million of unrecognized compensation expense
related to the unvested portion of our stock options that is expected to be
recognized over a weighted average period of 1.0 years. The total fair value of
stock options vested was $7.2 million, $8.5 million and $14.1 million in 2009,
2008 and 2007, respectively.
Restricted Stock Plan: The
2007 Restricted Stock Plan (“2007 RSP”) permitted the grant of up to 0.5 million
shares of restricted stock to selected officers of the company, as determined by
the MD&C. This plan was terminated in 2009 upon shareholder approval of the
2009 ISP, and no further grants may be made under this plan. Restricted stock
awards are valued at the market price of a share of our common stock on the date
of grant. We granted approximately 346,000, 158,000, and 122,500 shares of
restricted stock in 2009, 2008 and 2007, respectively, under the 1997 ISP and
the 2007 RSP. In general, these awards vest at the end of a three-year period
from the date of grant and are expensed on a straight-line basis over that
period, which is considered to be the requisite service period. This expense
totaled $1.8 million, $1.5 million, and $0.9 million for the years ended
December 31, 2009, 2008 and 2007, respectively. As of December 31, 2009, there
were approximately 353,000 shares of restricted stock outstanding under the 1997
ISP and 2007 RSP.
Deferred Stock Units: In 2004, the
stockholders approved the RadioShack 2004 Deferred Stock Unit Plan for
Non-Employee Directors (“Deferred Plan”). The Deferred Plan replaced the
one-time and annual stock option grants to non-employee directors (“Directors”)
as specified in the 1997, 1999 and 2001 ISPs. New Directors received a one-time
grant of 5,000 deferred stock units (“Units”) on the date they attend their
first Board meeting. The Deferred Plan also specified that each Director who has
served one year or more as of June 1 of any year will automatically be granted
3,500 Units on the first business day of June of each year in which he or she
serves as a Director.
66
In
February 2007, the Board of Directors amended the Deferred Plan to provide that,
in lieu of the original amounts described above, each non-employee director now
receives a one-time initial grant of units equal to the number of shares of our
common stock that represent a fair market value of $150,000 on the grant date,
and an annual grant of units equal to the number of shares of our common stock
that represent a fair market value of $105,000 on the annual grant
date.
Under the Deferred
Plan, one-third of the Units vest annually over three years from the date of
grant. Vesting of outstanding awards is accelerated under certain circumstances.
At termination of service, death, disability or change in control of RadioShack,
Directors will receive shares of common stock equal to the number of vested
Units. Directors may receive these shares in a lump sum or they may defer
receipt of these shares in equal installments over a period of up to ten years.
We granted 47,300, 62,600, and 30,300 Units in 2009, 2008 and 2007,
respectively. There were 179,076 Units outstanding and 736,413 Units available
for grant at December 31, 2009.
NOTE
8 – EMPLOYEE BENEFIT PLANS
The following
benefit plans were in place during the periods covered by the financial
statements
Deferred Compensation Plans:
The Executive Deferred Compensation Plan (“EDCP”) and the Executive Deferred
Stock Plan (“EDSP”) became effective in April of 1998 and permitted employees to
defer portions of their base salary, bonuses, and delivery of any restricted
stock or stock acquired under a non-qualified stock option exercise that would
otherwise vest.
Employee deferrals
and employer contributions to the EDCP and EDSP were discontinued effective
January 1, 2007, and any unvested matching company contributions remaining as of
December 31, 2006, were immediately vested. All account balances, including
matching company contributions, under these plans were distributed in the first
quarter of 2007. Accruals related to these plans were recorded as a current
liability in our Consolidated Balance Sheets, totaling $27.8 million at December
31, 2006, and were eliminated upon distribution during the first half of
2007.
RadioShack 401(k) Plan: The
RadioShack 401(k) Plan (“401(k) Plan”), a defined contribution plan, was amended
and restated effective July 1, 2008, and allows a participant to defer, by
payroll deductions, from 1% to 75% of their annual compensation, limited to
certain annual maximums set by the Internal Revenue Code. The amended 401(k)
Plan also presently provides that our contribution to each participant’s account
maintained under the 401(k) Plan be an amount equal to 100% of the participant’s
contributions up to 4% of their annual compensation. This percentage
contribution made by us is discretionary and may change in the future. Our
contributions go directly to the 401(k) Plan and are made in cash and invested
according to the investment elections made by the participant for their own
contributions. Company contributions to the 401(k) Plan were $6.6 million, $7.2
million and $8.0 million for 2009, 2008 and 2007, respectively.
Supplemental
Executive Retirement Plan: Prior to January 1, 2006, certain officers of
the Company were participants in RadioShack’s Salary Continuation Plan (“SCP”)
or its Deferred Compensation Plan (“DCP” and, together with the SCP, the
“Plans”), which provided a defined benefit to be paid out over a ten-year period
upon retirement between the ages of 55 and 70. Participation in the Plans and
the benefit payments were based solely on the discretion and approval of the
Management Development and Compensation Committee of the Board of Directors, and
the benefit payments did not bear any relationship to a participant’s present
compensation, final compensation or years of service. We accrued benefit
payments earned based on the provisions set forth by the MD&C for each
individual person. Based on the method by which the Plans were administered and
because there was not a specific plan governing the benefit payment calculation,
the accounting and disclosure provisions of the FASB’s accounting guidance for
pensions were not previously required.
67
The Company adopted
an unfunded Supplemental Executive Retirement Plan (“SERP”) effective January 1,
2006, for selected officers of the Company. Upon retirement at age 55 years or
older, participants in the SERP are eligible to receive, for ten years, an
annual amount equal to a percentage of the average of their five highest
consecutive years of compensation (base salary and bonus), to be paid in 120
monthly installments. The amount of the percentage increases by 2 ½% for each
year of participation in the SERP, up to a maximum of 50%.
To
be a participant in the SERP, officers who were participants in the SCP or DCP
had to withdraw from the applicable plan and would then only receive benefits
under the SERP. The benefits for these officers are calculated under the SERP
using a formula that calculates the benefit under each plan (SERP, SCP or DCP)
and pays the participant the highest dollar benefit.
If
a SERP participant terminates employment due to retirement or disability between
the ages of 55 and 70, the participant is entitled to their normal vested SERP
benefit, paid in 120 equal monthly payments.
Based on the
effective date of the SERP of January 1, 2006, fiscal year 2006 was the initial
year in which an actuarial valuation was performed. The projected benefit
obligation at the beginning of 2006 represents the actuarial valuation that was
performed as of January 1, 2006, based on the information and assumptions
developed at that time. Participants in the SERP as of January 1, 2006, were
given credit for prior service as an officer of the Company. Therefore, this
service credit generated prior service costs that are not required to be
immediately recognized, but that are amortized for purposes of the net periodic
benefit cost calculation over the estimated average remaining service period for
active employee participants.
We
use the last day of our fiscal year as the measurement date for determining SERP
obligations and conduct an actuarial valuation at that date. The change in
benefit obligation, plan assets, and funded status for 2009 and 2008 are as
follows:
|
Year
Ended
|
||||||||
|
December
31,
|
||||||||
|
(In millions)
|
2009
|
2008
|
||||||
|
Change in
benefit obligation:
|
||||||||
|
Benefit obligation at beginning of
year
|
$ | 26.5 | $ | 30.7 | ||||
|
Service cost – benefits earned during the
year
|
0.5 | 0.6 | ||||||
|
Interest cost on projected benefit
obligation
|
1.4 | 1.6 | ||||||
|
Actuarial loss (gain)
|
0.8 | (1.1 | ) | |||||
|
Benefits paid
|
(5.2 | ) | (5.3 | ) | ||||
|
Benefit obligation at end of
year
|
24.0 | 26.5 | ||||||
|
Change in
plan assets:
|
||||||||
|
Fair value of plan assets at beginning
of year
|
-- | -- | ||||||
|
Employer contribution
|
5.2 | 5.3 | ||||||
|
Benefits paid
|
(5.2 | ) | (5.3 | ) | ||||
|
Fair value of plan assets at end of
year
|
-- | -- | ||||||
|
Underfunded
status
|
$ | (24.0 | ) | $ | (26.5 | ) | ||
The accumulated
benefit obligation was $22.9 million and $25.7 million at December 31, 2009 and
2008, respectively.
Amounts recognized
as liabilities in the Consolidated Balance Sheets consist of:
|
December
31,
|
||||||||
|
(In millions)
|
2009
|
2008
|
||||||
|
Accrued
expenses and other current liabilities
|
$ | 5.0 | $ | 5.1 | ||||
|
Other
non-current liabilities
|
19.0 | 21.4 | ||||||
|
Net amount
recognized
|
$ | 24.0 | $ | 26.5 | ||||
68
The cost of the
SERP defined benefit plan included the following components for the last three
years:
|
(In millions)
|
2009
|
2008
|
2007
|
|||||||||
|
Service cost
– benefits earned during the year
|
$ | 0.5 | $ | 0.6 | $ | 0.7 | ||||||
|
Interest cost
on projected benefit obligation
|
1.4 | 1.6 | 1.9 | |||||||||
|
Amortization
of prior service cost
|
0.1 | 0.1 | 0.2 | |||||||||
|
Charge
(benefit) due to curtailments
|
-- | -- | (0.7 | ) | ||||||||
|
Net periodic
benefit cost
|
$ | 2.0 | $ | 2.3 | $ | 2.1 | ||||||
Amounts not yet
reflected in net periodic benefit cost and included in accumulated other
comprehensive loss (pre-tax) included prior service cost of $0.8 million, $0.9
million, and $1.1 million at December 31, 2009, 2008 and 2007, respectively, and
an actuarial gain of $0.3 million and $1.1 million at December 31, 2009 and
2008, respectively. The amount of prior service cost that will be amortized from
accumulated other comprehensive income into net periodic benefit cost in 2010 is
estimated to be $0.1 million.
Assumptions used to
determine benefit obligations at December 31 were as follows:
|
2009
|
2008
|
2007
|
||||||||||
|
Discount
rate
|
4.7 | % | 5.9 | % | 5.7 | % | ||||||
|
Rate of
compensation increase
|
3.5 | % | 3.5 | % | 3.5 | % | ||||||
Actuarial
assumptions used to determine net periodic benefit cost for the years ended
December 31 were as follows:
|
2009
|
2008
|
2007
|
||||||||||
|
Discount
rate
|
5.9 | % | 5.7 | % | 5.9 | % | ||||||
|
Rate of
compensation increase
|
3.5 | % | 3.5 | % | 3.5 | % | ||||||
We
base our discount rate on the rates of return available on high-quality bonds
with maturities approximating the expected period over which the pension
benefits will be paid. The rate of compensation increase is based on historical
and expected increases.
As
the SERP is an unfunded plan, benefit payments are made from the general assets
of RadioShack. The expected future benefit payments based upon the assumptions
described above and including benefits attributable to future employee service
for the following periods are as follows:
|
(In millions)
|
|
|
2010
|
$ 5.1
|
|
2011
|
4.0
|
|
2012
|
3.4
|
|
2013
|
3.4
|
|
2014
|
3.0
|
|
2015 through
2019
|
5.7
|
In
2010, we expect to make contributions to the plan of $5.1 million in the form of
benefit payments.
69
NOTE
9 - INCOME TAXES
The following is a
reconciliation of the federal statutory income tax rate to our income tax
expense:
|
Year Ended
December 31,
|
||||||||||||
|
(In millions)
|
2009
|
2008
|
2007
|
|||||||||
|
Components of
income from
|
||||||||||||
|
continuing operations:
|
||||||||||||
|
United States
|
$ | 326.4 | $ | 289.6 | $ | 357.4 | ||||||
|
Foreign
|
2.1 | 9.9 | 9.2 | |||||||||
|
Income before
income taxes
|
328.5 | 299.5 | 366.6 | |||||||||
|
Statutory tax
rate
|
x 35.0 | % | x 35.0 | % | x 35.0 | % | ||||||
|
Federal
income tax expense at statutory rate
|
115.0 | 104.8 | 128.3 | |||||||||
|
State income
taxes, net of federal benefit
|
9.2 | 8.4 | 9.2 | |||||||||
|
Unrecognized
tax benefits
|
(3.1 | ) | 2.3 | (2.5 | ) | |||||||
|
Other,
net
|
2.4 | (5.4 | ) | (5.2 | ) | |||||||
|
Total income
tax expense
|
$ | 123.5 | $ | 110.1 | $ | 129.8 | ||||||
|
Effective tax
rate
|
37.6 | % | 36.8 | % | 35.4 | % | ||||||
The components of
income tax expense were as follows:
|
Year Ended
December 31,
|
||||||||||||
|
(In millions)
|
2009
|
2008
|
2007
|
|||||||||
|
Current:
|
||||||||||||
|
Federal
|
$ | 105.3 | $ | 92.2 | $ | 99.3 | ||||||
|
State
|
7.1 | 14.0 | 13.0 | |||||||||
|
Foreign
|
2.6 | (7.8 | ) | 1.0 | ||||||||
| 115.0 | 98.4 | 113.3 | ||||||||||
|
Deferred:
|
||||||||||||
|
Federal
|
8.6 | 8.9 | 12.4 | |||||||||
|
State
|
0.2 | 2.8 | 4.1 | |||||||||
|
Foreign
|
(0.3 | ) | -- | -- | ||||||||
| 8.5 | 11.7 | 16.5 | ||||||||||
|
Income tax
expense
|
$ | 123.5 | $ | 110.1 | $ | 129.8 | ||||||
The tax effect of
cumulative temporary differences that gave rise to the deferred tax assets and
liabilities were as follows:
|
December
31,
|
||||||||
|
(In millions)
|
2009
|
2008
|
||||||
|
Deferred tax
assets:
|
||||||||
|
Depreciation and
amortization
|
$ | 22.9 | $ | 27.3 | ||||
|
Insurance reserves
|
18.0 | 20.4 | ||||||
|
Reserve for estimated wireless
service
deactivations
|
14.1 | 8.9 | ||||||
|
Deferred compensation
|
13.6 | 14.0 | ||||||
|
Indirect effect of unrecognized tax
benefits
|
10.1 | 15.7 | ||||||
|
Accrued average rent
|
8.7 | 10.6 | ||||||
|
Deferred revenue
|
7.9 | 12.3 | ||||||
|
Convertible debt original issue
discount
|
2.5 | 3.0 | ||||||
|
Other
|
42.7 | 32.3 | ||||||
|
Total
deferred tax assets
|
140.5 | 144.5 | ||||||
70
|
Deferred tax
liabilities:
|
||||||||
|
Deferred taxes on foreign
operations
|
6.2 | 3.6 | ||||||
|
Other
|
12.4 | 10.2 | ||||||
|
Total
deferred tax liabilities
|
18.6 | 13.8 | ||||||
|
Net deferred
tax assets
|
$ | 121.9 | $ | 130.7 | ||||
Deferred tax assets
and liabilities were included in the Consolidated Balance Sheets as
follows:
|
December
31,
|
||||||||
|
(In millions)
|
2009
|
2008
|
||||||
|
Other current
assets
|
$ | 68.8 | $ | 63.9 | ||||
|
Other
non-current assets
|
53.1 | 66.8 | ||||||
|
Net deferred
tax assets
|
$ | 121.9 | $ | 130.7 | ||||
We
anticipate that we will generate sufficient pre-tax income in the future to
realize the full benefit of U.S. deferred tax assets related to future
deductible amounts. Accordingly, a valuation allowance was not required at
December 31, 2009 or 2008. We have not recorded deferred U.S. income taxes or
foreign withholding taxes on temporary differences resulting from earnings for
certain foreign subsidiaries which are considered permanently invested outside
the United States. The cumulative amount of these earnings and the amount of the
unrecognized deferred tax liability related to these earnings were not material
to the financial statements.
We
adopted the FASB’s new accounting guidance for uncertainty in income taxes
effective January 1, 2007. As a result of the implementation of this new
accounting guidance, we recognized a $7.2 million net decrease in unrecognized
tax benefits with a corresponding increase in retained earnings. The total
effect at the time of adoption was a $19.8 million increase in our non-current
deferred tax assets, a $53.0 million decrease in income tax payable to
reclassify unrecognized tax benefits to non-current liabilities, a $65.6 million
increase in our non-current liabilities representing the liability for
unrecognized tax benefits and accrued interest, and the previously mentioned
$7.2 million increase to retained earnings. As of January 1, 2007, after the
implementation of this new accounting guidance, our unrecognized tax benefits,
exclusive of accrued interest, were $49.0 million.
A
reconciliation of the consolidated liability for gross unrecognized income tax
benefits (excluding interest) from January 1, 2008, to December 31, 2009, is as
follows:
|
(In millions)
|
2009
|
2008
|
2007
|
|||||||||
|
Balance at
beginning of year
|
$ | 38.1 | $ | 45.6 | $ | 49.0 | ||||||
|
Increases
related to prior period tax positions
|
-- | 1.5 | 3.8 | |||||||||
|
Decreases
related to prior period tax positions
|
(5.5 | ) | (2.8 | ) | -- | |||||||
|
Increases
related to current period tax
positions
|
1.9 | 4.6 | 3.9 | |||||||||
|
Settlements
|
(7.2 | ) | (8.8 | ) | (1.7 | ) | ||||||
|
Lapse in
applicable statute of limitations
|
(0.8 | ) | (2.0 | ) | (9.4 | ) | ||||||
|
Balance at
end of year
|
$ | 26.5 | $ | 38.1 | $ | 45.6 | ||||||
The amounts of net
unrecognized tax benefits that, if recognized, would affect the effective tax
rate as of December 31, 2009 was $20.4 million.
We
recognize accrued interest and penalties associated with uncertain tax positions
as part of the tax provision. As of December 31, 2009 and 2008, we had $10.1
million and $13.9 million of accrued interest expense associated with uncertain
tax positions, respectively. Income tax expense for the periods ended December
31, 2009, 2008, and 2007, included interest of $3.7 million, $5.5 million, and
$4.2 million, respectively, associated with uncertain tax
positions.
71
We
expect approximately $1.2 million of changes in unrecognized tax benefit
liabilities over the next 12 months and this amount is classified in other
current liabilities on the Consolidated Balance Sheets as of December 31, 2009.
The remaining amount of our unrecognized tax benefit liabilities are now
classified in other non-current liabilities.
RadioShack
Corporation and its U.S. subsidiaries join in the filing of a U.S. federal
consolidated income tax return. The U.S. federal statute of limitations is
closed for all years prior to 2004. Foreign and U.S. state jurisdictions have
statutes of limitations generally ranging from 3 to 5 years. Our tax returns are
currently under examination in various federal, state and foreign jurisdictions.
While one or more of these examinations may be concluded within the next twelve
months, we do not expect this to have a significant effect on our results of
operations or financial position. Our effective tax rate for future periods may
be affected by the settlement of tax controversies or by the expiration of the
statute of limitations for periods for which a liability has been
established.
NOTE
10 –NET INCOME PER SHARE
Basic net income
per share is computed based only on the weighted average number of common shares
outstanding for each period presented. Diluted net income per share reflects the
potential dilution that would have occurred if securities or other contracts to
issue common stock were exercised, converted, or resulted in the issuance of
common stock that would have then shared in the earnings of the
entity.
The following table
reconciles the numerator and denominator used in the basic and diluted earnings
per share calculations for the years ended December 31, 2009, 2008 and
2007.
|
(In millions, except per share
amounts)
|
2009 | 2008 | 2007 | |||||||||
|
Numerator:
|
||||||||||||
|
Net income
|
$ | 205.0 | $ | 189.4 | $ | 236.8 | ||||||
|
Denominator:
|
||||||||||||
|
Weighted-average common
shares
outstanding
|
125.4 | 129.0 | 134.6 | |||||||||
|
Dilutive effect of stock-based
awards
|
0.7 | 0.1 | 1.3 | |||||||||
|
Weighted average shares for
diluted
net income per share
|
126.1 | 129.1 | 135.9 | |||||||||
|
Basic net
income per share
|
$ | 1.63 | $ | 1.47 | $ | 1.76 | ||||||
|
Diluted net
income per share
|
$ | 1.63 | $ | 1.47 | $ | 1.74 | ||||||
Weighted-average
shares for diluted net income per share exclude the effect of approximately 4.6
million options and 15.5 million warrants to purchase shares of common stock in
2009, 8.6 million options and 15.5 million warrants in 2008, and 9.5 million
options in 2007 because the exercise prices exceeded the average market price of
our common stock during these years, and the effect of their inclusion would be
antidilutive. These securities could be dilutive in future periods.
Weighted-average
shares for diluted net income per share exclude the effect of approximately 15.5
million shares that underlie our convertible debt instruments in 2009 and 2008
because the conversion price exceeded the average market price of our common
stock during these years, and the effect of their inclusion would be
antidilutive. These securities could be dilutive in future periods.
72
NOTE
11 – DERIVATIVE FINANCIAL INSTRUMENTS
We
enter into derivative instruments for risk management purposes only, including
derivatives designated as hedging instruments under the FASB’s accounting
guidance on the accounting for derivative instruments and hedging activities. We
do not hold or issue derivative financial instruments for trading or speculative
purposes. To qualify for hedge accounting, derivatives must meet defined
correlation and effectiveness criteria, be designated as a hedge and result in
cash flows and financial statement effects that substantially offset those of
the position being hedged.
By
using these derivative instruments, we expose ourselves, from time to time, to
credit risk and market risk. Credit risk is the potential failure of the
counterparty to perform under the terms of the derivative contract. When the
fair value of a derivative contract is positive, the counterparty owes us, which
creates credit risk for us. We minimize this credit risk by entering into
transactions with high quality counterparties and do not anticipate significant
losses due to our counterparties’ nonperformance. Market risk is the adverse
effect on the value of a financial instrument that results from a change in the
rate or value of the underlying item being hedged. We minimize this market risk
by establishing and monitoring internal controls over our hedging activities,
which include policies and procedures that limit the types and degree of market
risk that may be undertaken.
Interest Rate Swap Agreements:
We use interest rate-related derivative instruments to manage our
exposure to fluctuations of interest rates. In June and August 2003, we entered
into interest rate swap agreements with underlying notional amounts of debt of
$100 million and $50 million, respectively, and both with maturities in May
2011. These swaps effectively convert a portion of our long-term fixed rate debt
to a variable rate. We entered into these agreements to balance our fixed versus
floating rate debt portfolio to continue to take advantage of lower short-term
interest rates. Under these agreements, we have contracted to pay a variable
rate of LIBOR plus a markup and to receive fixed rates of 7.375%.
The swap agreements
were originally designated as fair value hedges of the related debt and met the
requirements to be accounted for under the short-cut method, resulting in no
ineffectiveness in the hedging relationship. The periodic interest settlements,
which occur at the same interval as the interest payments on the 2011 Notes, are
recorded as interest expense. The gain or loss on these derivatives, as well as
the offsetting loss or gain on the related debt, was recognized in current
earnings, but had a net earnings effect of zero due to short-cut method
accounting.
In
September 2009, we repurchased $43.2 million of our 7.375% unsecured notes due
in 2011. A portion of these notes were hedged by our interest rate swaps. Upon
repurchase of these notes, we were required to discontinue the hedge accounting
treatment associated with these derivative instruments which used the short-cut
method. We intend to hold these instruments until their maturities. Changes in
fair value of these instruments are recorded in earnings as an adjustment to
interest expense.
73
NOTE
12 – FAIR VALUE MEASUREMENTS
Assets
and Liabilities Measured at Fair Value on a Recurring Basis
|
Basis of Fair
Value Measurements
|
||||||||||||||||
|
Quoted
Prices
|
Significant
|
|||||||||||||||
|
in
Active
|
Other
|
Significant
|
||||||||||||||
|
Fair
Value
|
Markets
for
|
Observable
|
Unobservable
|
|||||||||||||
|
of
Assets
|
Identical
Items
|
Inputs
|
Inputs
|
|||||||||||||
|
(In millions)
|
(Liabilities)
|
(Level
1)
|
(Level
2)
|
(Level
3)
|
||||||||||||
|
As
of December 31, 2009
|
||||||||||||||||
|
Derivatives
Not Designated as
Hedging Instruments:
|
||||||||||||||||
|
Interest rate swaps (1)
(2)
|
$ | 5.3 | -- | $ | 5.3 | -- | ||||||||||
|
As
of December 31, 2008
|
||||||||||||||||
|
Derivatives
Designated as
Hedging Instruments:
|
||||||||||||||||
|
Interest rate swaps (1)
(2)
|
$ | 6.7 | -- | $ | 6.7 | -- | ||||||||||
|
(1)
|
These
interest rate swaps serve as economic hedges on our 2011
Notes
|
|
(2)
|
Included in
other assets, net
|
The FASB’s
accounting guidance utilizes a fair value hierarchy that prioritizes the inputs
to the valuation techniques used to measure fair value into three broad
levels:
|
·
|
Level
1: Observable inputs such as quoted prices (unadjusted) in
active markets for identical assets or
liabilities
|
|
·
|
Level
2: Inputs, other than quoted prices, that are observable for
the asset or liability, either directly or indirectly; these include
quoted prices for similar assets or liabilities in active markets and
quoted prices for identical or similar assets or liabilities in markets
that are not active
|
|
·
|
Level
3: Unobservable inputs that reflect the reporting entity’s own
assumptions
|
The fair values of
our interest rate swaps are based on quotes to acquire these swaps from a
commercial bank that was ready to transact and, therefore, the interest rate
swaps are considered a level 2 item.
Other financial
instruments not measured at fair value on a recurring basis include cash and
cash equivalents, accounts receivable, short-term debt, accounts payable,
accrued liabilities, and long-term debt. With the exception of long-term debt,
the financial statement carrying amounts of these items approximate their fair
values due to their short-term nature. Estimated fair values for long-term debt
have been determined using recent trading activity and/or bid ask
spreads.
Carrying amounts
and the related estimated fair value of our long-term debt are as
follows:
|
December 31,
2009
|
December 31,
2008
|
|||||||||||||||
|
(In millions)
|
Carrying
Amount
|
Fair
Value
|
Carrying
Amount
|
Fair
Value
|
||||||||||||
|
Long-term
debt
|
$ | 627.8 | $ | 740.2 | $ | 659.5 | $ | 653.4 | ||||||||
The fair values of
our 2013 Convertible Notes and 2011 Notes at December 31, 2009, were $422.5
million and $316.7 million, respectively, compared with $305.9 million and
$346.5, respectively, at December 31, 2008.
74
Assets
and Liabilities Measured at Fair Value on a Nonrecurring Basis
|
Basis of Fair
Value Measurements
|
||||
|
Quoted
Prices
|
Significant
|
|||
|
In
Active
|
Other
|
Significant
|
||
|
Fair
Value
|
Markets
for
|
Observable
|
Unobservable
|
|
|
of
Assets
|
Identical
Items
|
Inputs
|
Inputs
|
|
|
(In millions)
|
(Liabilities)
|
(Level
1)
|
(Level
2)
|
(Level
3)
|
|
Year
Ended December 31, 2009
|
||||
|
Long-lived
assets held and used
|
$ 1.0
|
--
|
--
|
$ 1.0
|
In
2009, long-lived assets held and used in our U.S. RadioShack company-operated
stores and kiosks with a carrying value of $2.5 million were written down to
their fair value of $1.0 million, resulting in an impairment charge of $1.5
million, which was included in earnings for the period. The inputs used to
calculate the fair value of these long-lived assets included the projected cash
flows and a risk-adjusted rate of return that we estimated would be used by a
market participant in valuing these assets. In 2008, we recorded $2.8 million in
impairment charges for long-lived assets held and used in our U.S. RadioShack
company-operated stores and kiosks.
NOTE
13 - COMMITMENTS AND CONTINGENCIES
Lease Commitments: We lease
rather than own most of our facilities. Our lease agreements expire at various
dates through 2024. Some of these leases are subject to renewal options and
provide for the payment of taxes, insurance and maintenance. Our retail
locations comprise the largest portion of our leased facilities. These locations
are primarily in major shopping malls and shopping centers owned by other
companies. Some leases are based on a minimum rental plus a percentage of the
store's sales in excess of a stipulated base figure (contingent rent). Certain
leases contain escalation clauses. We also lease a distribution center and our
corporate campus. Additionally, we lease automobiles and information systems
equipment.
Future minimum rent
commitments at December 31, 2009, under non-cancelable operating leases (net of
immaterial amounts of sublease rent income), are included in the following
table.
|
(In millions)
|
Operating
Leases
|
|||
|
2010
|
$ | 200.1 | ||
|
2011
|
146.1 | |||
|
2012
|
96.7 | |||
|
2013
|
58.8 | |||
|
2014
|
31.7 | |||
|
2015 and
thereafter
|
40.0 | |||
|
Total minimum
lease payments
|
$ | 573.4 | ||
On
June 25, 2008, Tarrant County College District (“TCC”) announced that it had
purchased from Kan Am Grund Kapitalanlagegesellschaft mbH (“Kan Am”) the
buildings and real property comprising our corporate headquarters in Fort Worth,
Texas, which we had previously sold to Kan Am and then leased for a period of 20
years in a sale and lease-back transaction in December 2005.
In
connection with the above sale to TCC, we entered into an agreement with TCC to
convey certain personal property located in the corporate headquarters and
certain real property located in close proximity to the corporate headquarters
in exchange for an amended and restated lease to occupy a reduced
portion
75
of
the corporate headquarters for a shorter time period. The amended and
restated lease agreement provides for us to occupy approximately 40% of the
corporate headquarters complex for a primary term of three years with no rental
payments required during the term The agreement also provides for one two-year
option to renew approximately half of the space at market-based
rents.
This agreement
resulted in a non-cash net charge to selling, general and administrative expense
of $12.1 million for the second quarter of 2008. This net amount
consisted of a net loss of $2.8 million related to the assets conveyed to TCC
and a $9.3 million charge to reduce a receivable for economic development
incentives associated with the corporate headquarters to its net realizable
value. As a result of the amended and restated lease agreement, the
future minimum lease payments required by the corporate headquarters lease have
decreased from $289.7 million at December 31, 2007, to zero.
Rent
Expense:
|
Year Ended
December 31,
|
||||||||||||
|
(In millions)
|
2009
|
2008
|
2007
|
|||||||||
|
Minimum
rents
|
$ | 228.7 | $ | 228.8 | $ | 237.1 | ||||||
|
Occupancy
cost
|
39.4 | 38.2 | 43.3 | |||||||||
|
Contingent
rents
|
23.7 | 27.8 | 24.2 | |||||||||
|
Total rent
expense
|
$ | 291.8 | $ | 294.8 | $ | 304.6 | ||||||
Litigation: On
October 10, 2008, the Los Angeles County Superior Court granted RadioShack's
second Motion for Class Decertification in the class action lawsuit of Brookler v. RadioShack
Corporation. Plaintiffs’ claims that RadioShack violated
California's wage and hour laws relating to meal periods was originally
certified as a class action on February 8, 2006. RadioShack's first Motion for
Decertification of the class was denied on August 29, 2007. However, after the
California Appellate Court's favorable decision on similar facts in Brinker Restaurant Corporation v.
Superior Court, RadioShack again sought class decertification. Based on
the California Appellate Court’s decision in Brinker, the trial court
granted RadioShack’s second motion. The plaintiffs in Brookler have appealed this
ruling. Due to the unsettled nature of California state law regarding the
standard of liability for meal period violations, RadioShack and the Brookler plaintiffs agreed to
a stay with respect to the plaintiffs’ appeal of the class decertification
ruling, pending the California Appellate court’s decision in Brinker. The outcome of this
action is uncertain and the ultimate resolution of this matter could have a
material adverse effect on RadioShack’s financial position, results of
operations, and cash flows in the period in which any such resolution is
recorded. However, management believes the outcome of this case will not have
such an effect.
On
June 7, 2007, a purported class action lawsuit, Richard Stuart v. RadioShack
Corporation, et al, was filed against RadioShack in the U.S. District
Court for the Northern District of California, based on allegations that
RadioShack failed to properly reimburse employees in California for mileage
expenses associated with their use of personal vehicles to make transfers of
merchandise between Company stores. On February 9, 2009, the court granted the
plaintiffs’ Motion for Class Certification. Following a mediation held on
October 5, 2009, the parties reached a tentative settlement of the lawsuit
subject to court approval. The parties reached agreement on all terms of the
proposed settlement agreement in January 2010, and the plaintiffs will be filing
a Motion for Preliminary Approval. Until the settlement is approved by the
court, the outcome of this action remains uncertain, although it is unlikely
that the ultimate resolution of this matter will have a material adverse effect
on RadioShack’s financial position, results of operations, and cash flows in the
period in which any such resolution is recorded.
We
have various other pending claims, lawsuits, disputes with third parties,
investigations and actions incidental to the operation of our business,
including certain cases discussed generally below under “Continuing Lease
Obligations”. Although occasional adverse settlements or resolutions may occur
and negatively affect earnings in the period or year of settlement, it is our
belief that their ultimate resolution will not have a material adverse effect on
our financial condition or liquidity.
76
Continuing Lease Obligations:
We have obligations under retail leases for locations that we assigned to other
businesses. The majority of these lease obligations arose from leases for which
CompUSA Inc. (“CompUSA”) assumed responsibility as part of its purchase of our
Computer City, Inc. subsidiary in August 1998. Because the company that assumed
responsibility for these leases has ceased operations, we may be responsible for
rent due under the leases.
Following an
announcement by CompUSA in February 2007 of its intention to close as many as
126 stores and an announcement in December 2007 that it had been acquired by
Gordon Brothers Group, CompUSA’s stores ceased operations in January 2008. We
may be responsible for rent due on a portion of the leases that relate to the
closed stores. As of February 8, 2010, we had been named as a defendant in a
total of 12 lawsuits from lessors seeking payment from us, six of which had been
resolved.
Based on all
available information pertaining to the status of these lawsuits, and after
applying the FASB’s accounting guidance on accounting for contingencies, the
balance of our accrual for these obligations was $6.2 million and $9.0 million
at December 31, 2009 and 2008, respectively. We have continued to monitor this
situation and will update our accrual to reflect new information on outstanding
litigation and settlements as more information becomes available.
Purchase Obligations: We had
purchase obligations of $314.1 million at December 31, 2009, which include
product commitments, marketing agreements and freight commitments. Of this
amount, $292.7 million related to 2010.
NOTE
14 – CORPORATE AND FIELD HEADCOUNT REDUCTION
During the first
quarter ended March 31, 2007, we recorded $8.5 million of pre-tax employee
separation charges in selling, general and administrative expense in connection
with the termination of employment of approximately 280 of our corporate support
staff. We made cash payments to these individuals during 2008 and 2007 in the
amounts of $1.9 million and $6.6 million, respectively. The reserve balance for
these separation charges was zero at both December 31, 2009 and
2008.
NOTE
15 - SEGMENT REPORTING
We
have two reportable segments, U.S. RadioShack company-operated stores and
kiosks. The U.S. RadioShack company-operated store segment consists solely of
our 4,476 U.S. company-operated retail stores, all operating under the
RadioShack brand name. Kiosks consist of our network of 562 kiosks, primarily
located in Sam’s Club and Target locations. In April 2009 we agreed with Sprint
Nextel to cease our arrangement to jointly operate the Sprint-branded kiosks in
operation at that date. This agreement allowed us to operate these kiosks under
the Sprint name for a reasonable period of time, allowing us to transition the
kiosks to a new format. In August 2009, we transitioned these kiosks to multiple
wireless carrier RadioShack-branded locations. They are now managed and reported
as extensions of existing RadioShack company-operated stores located in the same
shopping malls. Both of our reportable segments engage in the sale of consumer
electronics products; however, our kiosks primarily offer wireless products and
associated accessories. These reportable segments are managed separately due to
our kiosks’ narrow product offerings and performance relative to
size.
We
evaluate the performance of each reportable segment based on operating income,
which is defined as sales less cost of products sold and certain direct
operating expenses, including labor, rent, and occupancy costs. Asset balances
by reportable segment have not been included in the segment table below, as
these are managed on a company-wide level and are not fully allocated to each
segment for management reporting purposes.
77
Amounts in the
other category reflect our business activities that are not separately
reportable, which include our dealer network, e-commerce, third-party service
centers, manufacturing and foreign operations.
|
(In millions)
|
Year Ended
December 31,
|
|||||||||||
|
2009
|
2008
|
2007
|
||||||||||
|
Net
sales and operating revenues:
|
||||||||||||
|
U.S.
RadioShack company-operated stores
|
$ | 3,650.9 | $ | 3,611.1 | $ | 3,637.7 | ||||||
|
Kiosks
|
250.0 | 283.5 | 297.0 | |||||||||
|
Other (1)
|
375.1 | 329.9 | 317.0 | |||||||||
| $ | 4,276.0 | $ | 4,224.5 | $ | 4,251.7 | |||||||
|
Operating
income:
|
||||||||||||
|
U.S.
RadioShack company-operated stores (2)
(3)
|
$ | 702.8 | $ | 716.4 | $ | 780.9 | ||||||
|
Kiosks (4)
|
15.4 | 8.4 | 15.8 | |||||||||
|
Other (1)
(5)
|
39.9 | 44.1 | 52.8 | |||||||||
| 758.1 | 768.9 | 849.5 | ||||||||||
|
Unallocated
(2) (6)
(7)
|
(388.7 | ) | (446.7 | ) | (467.6 | ) | ||||||
|
Operating
income
|
369.4 | 322.2 | 381.9 | |||||||||
|
Interest
income
|
4.8 | 14.6 | 22.6 | |||||||||
|
Interest
expense
|
(44.1 | ) | (34.9 | ) | (38.8 | ) | ||||||
|
Other (loss)
income
|
(1.6 | ) | (2.4 | ) | 0.9 | |||||||
|
Income before
income taxes
|
$ | 328.5 | $ | 299.5 | $ | 366.6 | ||||||
|
Depreciation
and amortization:
|
||||||||||||
|
U.S.
RadioShack company-operated stores
|
$ | 45.8 | $ | 52.9 | $ | 53.4 | ||||||
|
Kiosks
|
3.2 | 5.8 | 6.3 | |||||||||
|
Other
|
5.8 | 1.8 | 1.7 | |||||||||
| 54.8 | 60.5 | 61.4 | ||||||||||
|
Unallocated
(8)
|
38.1 | 38.6 | 51.3 | |||||||||
| $ | 92.9 | $ | 99.1 | $ | 112.7 | |||||||
|
(1)
|
Net sales and
operating revenues and operating income for 2009 include the consolidation
of our Mexican subsidiary.
|
|
(2)
|
Amounts have
been retrospectively adjusted to conform to current year presentations.
Certain prior year inter-company amounts have been reallocated between the
segment and the unallocated category.
|
|
(3)
|
Operating
income for 2007 includes an $18.8 million federal excise tax refund and an
accrued vacation reduction of $11.0 million in connection with the
modification of our employee vacation policy.
|
|
(4)
|
Operating
income for 2007 includes $1.1 million in connection with the modification
of our employee vacation policy.
|
|
(5)
|
Operating
income for 2007 includes an accrued vacation reduction of $1.3 million in
connection with the modification of our employee vacation
policy.
|
|
(6)
|
The
unallocated category included in operating income relates to our overhead
and corporate expenses that are not allocated to our operating segments
for management reporting purposes. Unallocated costs include corporate
departmental expenses such as labor and benefits, as well as advertising,
insurance, distribution and information technology costs plus certain
unusual or infrequent gains or losses.
|
|
(7)
|
Unallocated
operating income for 2008 includes net charges aggregating $12.1 million
associated with the amended lease for our corporate
headquarters.
|
|
(8)
|
Depreciation
and amortization included in the unallocated category primarily relate to
our information technology assets.
|
78
Product Sales Information: Our
consolidated net sales and operating revenues are summarized by groups of
similar products and services, as follows:
|
Consolidated
Net Sales and Operating Revenues
|
||||||||||||||||||||||||
|
Year Ended
December 31,
|
||||||||||||||||||||||||
|
(In millions)
|
2009
|
2008
|
2007
|
|||||||||||||||||||||
|
Wireless
|
$ | 1,633.3 | 38.2 | % | $ | 1,387.3 | 32.8 | % | $ | 1,415.8 | 33.3 | % | ||||||||||||
|
Accessory
|
1,058.6 | 24.8 | 1,174.6 | 27.8 | 1,019.2 | 24.0 | ||||||||||||||||||
|
Modern
home
|
561.0 | 13.1 | 531.8 | 12.6 | 557.1 | 13.1 | ||||||||||||||||||
|
Personal
electronics
|
454.9 | 10.6 | 549.2 | 13.0 | 657.2 | 15.5 | ||||||||||||||||||
|
Power
|
227.6 | 5.3 | 244.9 | 5.8 | 251.7 | 5.9 | ||||||||||||||||||
|
Technical
|
181.1 | 4.2 | 184.6 | 4.4 | 185.5 | 4.4 | ||||||||||||||||||
|
Service
|
115.3 | 2.7 | 95.5 | 2.3 | 100.3 | 2.3 | ||||||||||||||||||
|
Other
sales
|
44.2 | 1.1 | 56.6 | 1.3 | 64.9 | 1.5 | ||||||||||||||||||
|
Consolidated
net sales and
operating revenues
|
$ | 4,276.0 | 100.0 | % | $ | 4,224.5 | 100.0 | % | $ | 4,251.7 | 100.0 | % | ||||||||||||
79
NOTE
16 - QUARTERLY DATA (UNAUDITED)
As
our operations are predominantly retail oriented, our business is subject to
seasonal fluctuations, with the fourth quarter generally being the most
significant in terms of sales and profits because of the winter holiday selling
season.
|
Three Months
Ended
|
||||||||||||||||
|
(In
millions, except per share amounts)
|
Mar.
31
|
Jun.
30
|
Sep.
30
|
Dec.
31
|
||||||||||||
|
Year
ended December 31, 2009:
|
||||||||||||||||
|
Net
sales and operating revenues
|
$ | 1,002.1 | $ | 965.7 | $ | 990.0 | $ | 1,318.2 | ||||||||
|
Cost of
products sold
|
534.5 | 520.9 | 518.9 | 739.2 | ||||||||||||
|
Gross
profit
|
467.6 | 444.8 | 471.1 | 579.0 | ||||||||||||
|
SG&A
expense
|
365.8 | 335.7 | 380.7 | 425.7 | ||||||||||||
|
Depreciation
and amortization
|
21.5 | 21.1 | 20.5 | 20.6 | ||||||||||||
|
Impairment of
long-lived assets
|
0.2 | 0.3 | 0.5 | 0.5 | ||||||||||||
|
Total operating
expenses
|
387.5 | 357.1 | 401.7 | 446.8 | ||||||||||||
|
Operating
income
|
80.1 | 87.7 | 69.4 | 132.2 | ||||||||||||
|
Interest
income
|
1.5 | 1.5 | 0.9 | 0.9 | ||||||||||||
|
Interest
expense
|
(11.5 | ) | (11.1 | ) | (11.2 | ) | (10.3 | ) | ||||||||
|
Other
loss
|
-- | -- | (1.6 | ) | -- | |||||||||||
|
Income
before taxes
|
70.1 | 78.1 | 57.5 | 122.8 | ||||||||||||
|
Income tax
expense
|
27.0 | 29.3 | 20.1 | 47.1 | ||||||||||||
|
Net
income
|
$ | 43.1 | $ | 48.8 | $ | 37.4 | $ | 75.7 | ||||||||
|
Net
income per share:
|
||||||||||||||||
|
Basic and
diluted
|
$ | 0.34 | $ | 0.39 | $ | 0.30 | $ | 0.60 | ||||||||
|
Shares
used in computing income per
share:
|
||||||||||||||||
|
Basic
|
125.4 | 125.4 | 125.5 | 125.5 | ||||||||||||
|
Diluted
|
125.4 | 125.8 | 126.3 | 127.1 | ||||||||||||
80
|
Three Months
Ended
|
||||||||||||||||
|
(In
millions, except per share amounts)
|
Mar.
31
|
Jun.
30
|
Sep.
30
|
Dec.
31
|
||||||||||||
|
Year
ended December 31, 2008:
|
||||||||||||||||
|
Net sales and operating
revenues (1)
|
$ | 949.0 | $ | 994.9 | $ | 1,021.9 | $ | 1,258.7 | ||||||||
|
Cost of
products sold
|
499.4 | 525.5 | 544.5 | 732.4 | ||||||||||||
|
Gross
profit
|
449.6 | 469.4 | 477.4 | 526.3 | ||||||||||||
|
SG&A
expense (2)
|
362.4 | 375.4 | 370.4 | 401.6 | ||||||||||||
|
Depreciation
and amortization
|
22.4 | 22.1 | 21.5 | 21.9 | ||||||||||||
|
Impairment of
long-lived assets
|
0.6 | 0.6 | 0.6 | 1.0 | ||||||||||||
|
Total operating
expenses
|
385.4 | 398.1 | 392.5 | 424.5 | ||||||||||||
|
Operating
income
|
64.2 | 71.3 | 84.9 | 101.8 | ||||||||||||
|
Interest
income
|
3.6 | 3.4 | 3.9 | 3.7 | ||||||||||||
|
Interest
expense
|
(7.1 | ) | (6.7 | ) | (9.3 | ) | (11.8 | ) | ||||||||
|
Other
loss
|
(1.5 | ) | (0.6 | ) | (0.1 | ) | (0.2 | ) | ||||||||
|
Income
before taxes
|
59.2 | 67.4 | 79.4 | 93.5 | ||||||||||||
|
Income tax
expense
|
20.4 | 26.0 | 30.3 | 33.4 | ||||||||||||
|
Net
income
|
$ | 38.8 | $ | 41.4 | $ | 49.1 | $ | 60.1 | ||||||||
|
Net
income per share:
|
||||||||||||||||
|
Basic and
diluted
|
$ | 0.30 | $ | 0.32 | $ | 0.38 | $ | 0.48 | ||||||||
|
Shares
used in computing income per
share:
|
||||||||||||||||
|
Basic
|
131.2 | 131.2 | 128.4 | 125.2 | ||||||||||||
|
Diluted
|
131.3 | 131.2 | 128.8 | 125.2 | ||||||||||||
|
(1)
|
In the third
quarter of 2008, we recorded $12.2 million in previously deferred
revenue.
|
|
(2)
|
The second
quarter of 2008 includes net charges aggregating $12.1 million associated
with the amended lease for our corporate headquarters.
|
The sum of the
quarterly net income per share amounts may not total to each full year amount
because these computations are made independently for each quarter and for the
full year and take into account the weighted average number of common stock
equivalent shares outstanding for each period, including the effect of dilutive
securities for that period.
81
RADIOSHACK
CORPORATION
Number Description
|
3.1
|
|
Certificate
of Amendment of Restated Certificate of Incorporation dated May 18, 2000
(filed as Exhibit 3a to RadioShack’s Form 10-Q filed on August 11, 2000,
for the fiscal quarter ended June 30, 2000, and incorporated herein by
reference).
|
|
3.2
|
|
Restated
Certificate of Incorporation of RadioShack Corporation1 dated July 26, 1999 (filed as Exhibit
3a(i) to RadioShack’s Form 10-Q filed on August 11, 1999, for the fiscal
quarter ended June 30, 1999, and incorporated herein by
reference).
|
|
3.3
|
|
Certificate of Elimination of
Series C Conversion Preferred Stock of RadioShack Corporation1 dated July 26, 1999 (filed as
Exhibit 3a(ii) to RadioShack’s Form 10-Q filed on
August 11, 1999, for the fiscal quarter ended June 30, 1999,
and incorporated herein by reference).
|
|
3.4
|
|
Amended Certificate of
Designations, Preferences and Rights of Series A Junior Participating
Preferred Stock of RadioShack Corporation1 dated July 26, 1999 (filed as
Exhibit 3a(iii) to RadioShack’s Form 10-Q filed on August 11, 1999, for
the fiscal quarter ended June 30, 1999, and incorporated herein by
reference).
|
|
3.5
|
|
Certificate
of Designations of Series B TESOP Convertible Preferred Stock dated June
29, 1990 (filed as Exhibit 4A to RadioShack's 1993, Form S-8 for the
RadioShack Corporation Incentive Stock Plan, Reg. No. 33-51603, filed on
November 12, 1993, and incorporated herein by reference).
|
|
3.6
|
|
RadioShack
Corporation Bylaws, amended and restated as of September 11, 2008 (filed
as Exhibit 3.1 to RadioShack’s Form 8-K filed on September 17, 2008, and
incorporated herein by reference).
|
|
4.1
|
Indenture,
dated as of May 11, 2001, between RadioShack Corporation, as Issuer, and
The Bank of New York, as Trustee (filed as Exhibit 4.1 to RadioShack’s
Form S-4, filed on June 8, 2001, and incorporated herein by
reference).
|
|
|
4.2
|
Form of New
Note due 2011 (filed as Exhibit 4.2 to RadioShack’s Form S-4, filed on
June 8, 2001, and incorporated herein by reference).
|
|
|
4.3
|
|
Indenture,
dated as of August 18, 2008, between RadioShack Corporation and The Bank
of New York Mellon Trust Company, N.A., as trustee (filed as Exhibit 4.1
to RadioShack's Form 8-K filed on August 18, 2008, and incorporated herein
by reference).
|
|
4.4
|
|
Form of the
2.50% Convertible Senior Notes due 2013 (included as Exhibit A to the
Indenture filed as Exhibit 4.1 to RadioShack's Form 8-K filed on August
18, 2008, and incorporated herein by reference).
|
|
4.5
|
|
Master Terms
and Conditions for Warrants Issued by RadioShack Corporation, dated August
12, 2008, between Citibank, N.A. and RadioShack Corporation (filed as
Exhibit 10.5 to RadioShack’s Form 8-K filed on August 18, 2008, and
incorporated herein by reference).
|
|
4.6
|
|
Master Terms
and Conditions for Warrants Issued by RadioShack Corporation, dated August
12, 2008, between Bank of America, N.A. and RadioShack Corporation (filed
as Exhibit 10.6 to RadioShack’s Form 8-K filed on August 18, 2008, and
incorporated herein by reference).
|
82
|
4.7
|
|
Confirmation
for Warrants, dated August 12, 2008, between Citibank, N.A. and RadioShack
Corporation (filed as Exhibit 10.7 to RadioShack’s Form 8-K filed on
August 18, 2008, and incorporated herein by reference).
|
|
|
4.8
|
|
Confirmation
for Warrants, dated August 12, 2008, between Bank of America, N.A. and
RadioShack Corporation (filed as Exhibit 10.8 to RadioShack’s Form 8-K
filed on August 18, 2008, and incorporated herein by
reference).
|
|
|
10.1
|
|
Master Terms
and Conditions for Convertible Bond Hedging Transactions, dated August 12,
2008, between Citibank, N.A. and RadioShack Corporation (filed as Exhibit
10.1 to RadioShack’s Form 8-K filed on August 18, 2008, and incorporated
herein by reference).
|
|
|
10.2
|
|
Master Terms
and Conditions for Convertible Bond Hedging Transactions, dated August 12,
2008, between Bank of America, N.A. and RadioShack Corporation (filed as
Exhibit 10.2 to RadioShack’s Form 8-K filed on August 18, 2008, and
incorporated herein by reference).
|
|
|
|
Confirmation
for Convertible Bond Hedging Transactions, dated August 12, 2008, between
Citibank and RadioShack Corporation (filed as Exhibit 10.3 to RadioShack’s
Form 8-K filed on August 18, 2008, and incorporated herein by
reference).
|
||
|
10.4
|
|
Confirmation
for Convertible Bond Hedging Transactions, dated August 12, 2008, between
Bank of America, N.A. and RadioShack Corporation (filed as Exhibit 10.4 to
RadioShack’s Form 8-K filed on August 18, 2008, and incorporated herein by
reference).
|
|
|
10.5
|
|
Five Year
Credit Agreement, dated as of June 12, 2006, among RadioShack Corporation,
the Initial Lenders named therein, Citibank, N.A., as Administrative Agent
and Paying Agent, Bank of America, N.A., as Administrative Agent and
Initial Issuing Bank, Wachovia Bank, National Association, as
Co-Syndication Agent and Initial Issuing Bank, Wells Fargo, National
Association, as Co-Syndication Agent, Citigroup Global Markets Inc. and
Banc of America Securities LLC, as Joint Lead Arrangers and Bookrunners
(filed as Exhibit 10.1 to RadioShack’s Form 8-K filed on June 16, 2006,
and incorporated herein by reference).
|
|
|
10.6
|
|
Overnight
Share Repurchase Agreement, dated August 5, 2005, between RadioShack
Corporation and Bank of America, N.A. (filed as Exhibit 10.1 to
RadioShack’s Form 8-K filed on August 8, 2005, and incorporated herein by
reference).
|
|
|
10.7
|
|
Purchase and
Sale Agreement, dated June 25, 2008, between RadioShack Corporation and
Tarrant County College District (filed as Exhibit 10.1 to RadioShack’s
Form 8-K filed on June 25, 2008, and incorporated herein by
reference).
|
|
|
10.8
|
|
Amended and
Restated Lease, dated June 25, 2008, between Tarrant County College
District as Landlord, and RadioShack Corporation, as Tenant (filed as
Exhibit 10.2 to RadioShack’s Form 8-K filed on June 25, 2008, and
incorporated herein by reference).
|
|
|
10.9
|
|
Stock
Purchase Agreement, dated December 15, 2008, by and among Tandy
International Corporation and ITC Services, Inc., and Grupo Gigante,
S.A.B. de C.V. (filed as Exhibit 10.1 to RadioShack’s Form 8-K filed on
December 16, 2008, and incorporated herein by reference).
|
|
|
10.10
|
2
|
RadioShack
Corporation1
Officers Deferred Compensation Plan as restated July 10, 1992 (filed as
Exhibit 10d to RadioShack’s Form 10-K filed on March 30, 1994, for the
fiscal year ended December 31, 1993, and incorporated herein by
reference).
|
|
83
|
10.11
|
2
|
Second
Amended and Restated RadioShack Corporation Officers Deferred Compensation
Plan, effective as of December 31, 2008 (filed as Exhibit 10.54 to
RadioShack’s Form 10-K filed on February 24, 2009, and incorporated herein
by reference).
|
|
10.12
|
2
|
RadioShack
Corporation 1993 Incentive Stock Plan as amended (filed as Exhibit 10a to
RadioShack's Form 10-Q filed on November 14, 2001, for the fiscal quarter
ended September 30, 2001, and incorporated herein by
reference).
|
|
10.13
|
2
|
Salary
Continuation Plan for Executive Employees of RadioShack Corporation1
and Subsidiaries (Restated) (filed as Exhibit 10a to RadioShack’s Form
10-K filed on March 30, 1994, for the fiscal year ended December 31, 1993,
and incorporated herein by reference).
|
|
10.14
|
2
|
Second
Amended and Restated Salary Continuation Plan for Executive Employees of
RadioShack Corporation and Subsidiaries, effective as of December 31, 2008
(filed as Exhibit 10.53 to RadioShack’s Form 10-K filed on February 24,
2009, and incorporated herein by reference).
|
|
10.15
|
2
|
Forms of
Termination Protection Agreements for (i) Corporate Executives, (ii)
Division Executives, and (iii) Subsidiary Executives (filed as Exhibit 10m
to RadioShack’s Form 10-Q filed on August 11, 1995, for the fiscal quarter
ended June 30, 1995, and incorporated herein by reference).
|
|
10.16
|
2
|
First Amended
and Restated Termination Protection Agreement for Corporate Executives,
between RadioShack Corporation and James F. Gooch, effective as of
December 31, 2008 (filed as Exhibit 10.60 to RadioShack’s Form 10-K filed
on February 24, 2009, and incorporated herein by reference).
|
|
10.17
|
2
|
Amended and
Restated RadioShack Corporation 1997 Incentive Stock Plan (filed as
Exhibit 10.1 to RadioShack’s Form 8-K filed on May 24, 2005, and
incorporated herein by reference).
|
|
10.18
|
2
|
Form of
Restricted Stock Agreement under RadioShack Corporation 1997 Incentive
Stock Plan (filed as Exhibit 10a to RadioShack’s Form 10-Q filed on May 6,
2005, for the fiscal quarter ended March 31, 2005, and incorporated herein
by reference).
|
|
10.19
|
2
|
Form of
September 30, 1997 Deferred Compensation Agreement between RadioShack
Corporation1
and Leonard H. Roberts (filed as Exhibit 10aa to RadioShack’s Form 10-Q
filed on May 13, 1998, for the fiscal quarter ended March 31, 1998, and
incorporated herein by reference).
|
|
10.20
|
2
|
Amended and
Restated RadioShack Corporation 1999 Incentive Stock Plan (filed as
Exhibit 10.2 to RadioShack’s Form 8-K filed on May 24, 2005, and
incorporated herein by reference).
|
|
10.21
|
2
|
RadioShack
Corporation Unfunded Deferred Compensation Plan for Directors as amended
and restated July 22, 2000 (filed as Exhibit 10x to RadioShack’s Form 10-K
filed on March 28, 2003, for the fiscal year ended December 31, 2002, and
incorporated herein by reference).
|
|
10.22
|
2
|
Second
Amended and Restated RadioShack Corporation Unfunded Deferred Compensation
Plan for Directors, effective as of December 31, 2008 (filed as Exhibit
10.57 to RadioShack’s Form 10-K filed on February 24, 2009, and
incorporated herein by reference).
|
|
10.23
|
2
|
Amended and
Restated RadioShack Corporation 2001 Incentive Stock Plan (filed as
Exhibit 10.3 to RadioShack’s Form 8-K filed on May 24, 2005, and
incorporated herein by reference).
|
84
|
10.24
|
2
|
Death Benefit
Agreement effective December 27, 2001, among Leonard H. Roberts, Laurie
Roberts and RadioShack Corporation (filed as Exhibit 10a to RadioShack’s
Form 10-Q filed on May 13, 2002, for the fiscal quarter ended March 31,
2002, and incorporated herein by reference).
|
|
10.25
|
2
|
RadioShack
2004 Annual and Long-Term Incentive Compensation Plan (the written
description of which is contained on pages 26 through 29 of RadioShack's
Proxy Statement filed on April 8, 2004, for the 2004 Annual Meeting of
Stockholders, and incorporated herein by reference).
|
|
10.26
|
2
|
Amendment to
RadioShack 2004 Annual and Long-Term Incentive Compensation Plan (the
written description of which is contained on pages 32 and 33 of
RadioShack's Proxy Statement filed on April 12, 2007, and incorporated
herein by reference).
|
|
10.27
|
2
|
Amended and
Restated RadioShack Corporation 2004 Deferred Stock Unit Plan for
Non-Employee Directors (filed as Exhibit 10.4 to RadioShack’s Form 8-K
filed on May 24, 2005, and incorporated herein by reference).
|
|
10.28
|
2
|
Form of
Notice of Grant of Deferred Stock Units and Deferred Stock Unit Agreement
under the RadioShack 2004 Deferred Stock Unit Plan for Non-Employee
Directors (filed as Exhibit 10.2 to RadioShack’s Form 8-K filed on June 6,
2005, and incorporated herein by reference).
|
|
10.29
|
2
|
Second
Amended and Restated RadioShack 2004 Deferred Stock Unit Plan for
Non-Employee Directors (filed as Exhibit 10.3 to RadioShack’s Form 10-Q
filed on April 30, 2007, and incorporated herein by
reference).
|
|
2
|
Third Amended
and Restated RadioShack 2004 Deferred Stock Unit Plan for Non-Employee
Directors, effective as of December 31, 2008 (filed as Exhibit 10.58 to
RadioShack’s Form 10-K filed on February 24, 2009, and incorporated herein
by reference).
|
|
|
10.31
|
2
|
Form of
Incentive Stock Plan(s) Stock Option Agreement for Officers (filed as
Exhibit 10a to RadioShack’s Form 10-Q filed on November 5, 2004, for the
fiscal quarter ended September 30, 2004, and incorporated herein by
reference).
|
|
2
|
RadioShack
Corporation Long-Term Incentive Plan (filed as Exhibit 10.4 to
RadioShack’s Form 8-K filed on February 28, 2005, and incorporated herein
by reference).
|
|
|
10.33
|
2
|
Form of
Indemnification Agreement (filed as Exhibit 10.1 to RadioShack’s Form 8-K
filed on June 6, 2005, and incorporated herein by reference).
|
|
10.34
|
2
|
RadioShack
Corporation Officer’s Supplemental Executive Retirement Plan (filed as
Exhibit 10.52 to RadioShack’s Form 10-K filed on March 15, 2006, for the
fiscal year ended December 31, 2005, and incorporated herein by
reference).
|
|
10.35
|
2
|
Form of
RadioShack Corporation Officer’s Supplemental Executive Retirement Plan
Agreement (filed as Exhibit 10.53 to RadioShack’s Form 10-K filed on March
15, 2006, for the fiscal year ended December 31, 2005, and incorporated
herein by reference).
|
|
10.36
|
2
|
Form of
RadioShack Corporation Officer’s Supplemental Executive Retirement Plan
Agreement for Existing Participants in the Salary Continuation Plan (filed
as Exhibit 10.54 to RadioShack’s Form 10-K filed on March 15, 2006, for
the fiscal year ended December 31, 2005, and incorporated herein by
reference).
|
85
|
10.37
|
2
|
First Amended
and Restated RadioShack Corporation Officer’s Supplemental Executive
Retirement Plan (filed as Exhibit 10.59 to RadioShack’s Form 10-K filed on
February 24, 2009, and incorporated herein by reference).
|
|
10.38
|
2
|
RadioShack
Corporation Officers’ Severance Program (filed as Exhibit 10.3 to
RadioShack’s Form 8-K filed on May 23, 2006, and incorporated herein by
reference).
|
|
10.39
|
2
|
First Amended
and Restated RadioShack Corporation Officers' Severance Program, effective
as of December 31, 2008 (filed as Exhibit 10.56 to RadioShack’s Form 10-K
filed on February 24, 2009, and incorporated herein by
reference).
|
|
10.40
|
2
|
Letter
Agreement, dated July 6, 2006, between RadioShack Corporation and Julian
C. Day (filed as Exhibit 10.1 to RadioShack’s Form 8-K filed on July 7,
2006, and incorporated herein by reference).
|
|
10.41
|
2
|
Incentive
Stock Plan Non-Qualified Stock Option Agreement under the 1997 Incentive
Stock Plan, dated July 6, 2006, between RadioShack Corporation and Julian
C. Day (filed as Exhibit 10.2 to RadioShack’s Form 8-K filed on July 7,
2006, and incorporated herein by reference).
|
|
10.42
|
2
|
Incentive
Stock Plan Non-Qualified Stock Option Agreement under the 1999 Incentive
Stock Plan, dated July 6, 2006, between RadioShack Corporation and Julian
C. Day (filed as Exhibit 10.3 to RadioShack’s Form 8-K filed on July 7,
2006, and incorporated herein by reference).
|
|
10.43
|
2
|
Incentive
Stock Plan Non-Qualified Stock Option Agreement under the 2001 Incentive
Stock Plan, dated July 6, 2006, between RadioShack Corporation and Julian
C. Day (filed as Exhibit 10.4 to RadioShack’s Form 8-K filed on July 7,
2006, and incorporated herein by reference).
|
|
10.44
|
2
|
Incentive
Stock Plan Non-Qualified Stock Option Agreement, dated July 6, 2006,
between RadioShack Corporation and Julian C. Day (filed as Exhibit 10.5 to
RadioShack’s Form 8-K filed on July 7, 2006, and incorporated herein by
reference).
|
|
10.45
|
2
|
Incentive
Stock Plan Non-Qualified Stock Option Agreement, dated July 6, 2006,
between RadioShack Corporation and Julian C. Day (filed as Exhibit 10.6 to
RadioShack’s Form 8-K filed on July 7, 2006, and incorporated herein by
reference).
|
|
10.46
|
2
|
Agreement on
Nonsolicitation, Confidentiality, Noncompetition and Intellectual
Property, dated July 6, 2006, between RadioShack Corporation and Julian C.
Day (filed as Exhibit 10.7 to RadioShack’s Form 8-K filed on July 7, 2006,
and incorporated herein by reference).
|
|
10.47
|
2
|
Employment
Offer Letter to James F. Gooch from RadioShack Corporation, dated July 27,
2006 (filed as Exhibit 10.8 to RadioShack’s Form 10-Q filed on October 25,
2006, for the fiscal quarter ended September 30, 2006, and incorporated
herein by reference).
|
|
10.48
|
2
|
Description
of 2008 Annual Incentive Bonus Performance Measures (filed as Exhibit 10.1
to RadioShack’s Form 8-K filed on February 26, 2008, and incorporated
herein by reference).
|
|
10.49
|
2
|
Description
of Long-Term Incentive Performance Measures for the 2008 through 2009
Performance Cycle (filed as Exhibit 10.2 to RadioShack’s Form 8-K filed on
February 26, 2008, and incorporated herein by reference).
|
|
10.50
|
2
|
Description
of Long-Term Incentive Performance Measures for the 2008 through 2010
Performance Cycle (filed as Exhibit 10.3 to RadioShack’s Form 8-K filed on
February 26, 2008, and incorporated herein by reference).
|
86
|
2
|
RadioShack
Corporation 2007 Restricted Stock Plan (included as Appendix A to
RadioShack's Proxy Statement filed on April 12, 2007, and incorporated
herein by reference).
|
|
|
10.52
|
2
|
Form of
Restricted Stock Agreement under the RadioShack Corporation 2007
Restricted Stock Plan (filed as Exhibit 10.2 to RadioShack's Form 8-K
filed on May 18, 2007, and incorporated herein by reference).
|
|
10.53
|
2
|
Employment
Offer Letter to Bryan Bevin from RadioShack Corporation, dated December
11, 2007, as modified effective September 11, 2008 (filed as Exhibit 10.67
to RadioShack’s Form 10-K filed on February 26, 2008), and incorporated
herein by reference).
|
|
10.54
|
2,
3
|
Employment
Offer Letter to Lee D. Applbaum from RadioShack Corporation, dated
September 27, 2008.
|
|
10.55
|
2
|
Second
Amended and Restated RadioShack Corporation Termination Protection Plan
(Level I), effective as of December 31, 2008 (filed as Exhibit 10.55 to
RadioShack’s Form 10-K filed on February 24, 2009, and incorporated herein
by reference).
|
|
10.56
|
2
|
2009
RadioShack Corporation Annual & Long-Term Incentive Compensation Plan
(included as Appendix A to RadioShack’s Proxy Statement filed on April 17,
2009, and incorporated herein by reference).
|
|
10.57
|
2
|
RadioShack
Corporation 2009 Incentive Stock Plan (included as Appendix B to
RadioShack's Proxy Statement filed on April 17, 2009, and incorporated
herein by reference).
|
|
10.58
|
2
|
Form of Stock
Option Agreement under the RadioShack Corporation 2009 Incentive Stock
Plan (filed as Exhibit 10.3 to RadioShack's Form 10-Q filed on July 27,
2009, and incorporated herein by reference).
|
|
10.59
|
2,
3
|
Form of
Restricted Stock Agreement under the RadioShack Corporation 2009 Incentive
Stock Plan.
|
|
10.60
|
2,
3
|
Form of
Restricted Stock Unit Agreement under the RadioShack Corporation 2009
Incentive Stock Plan.
|
|
21
|
3
|
RadioShack
Significant Subsidiaries.
|
|
23
|
3
|
Consent of
PricewaterhouseCoopers LLP.
|
|
31(a)
|
3
|
Rule
13a-14(a) Certification of the Chief Executive Officer of RadioShack
Corporation.
|
|
31(b)
|
3
|
Rule
13a-14(a) Certification of the Chief Financial Officer of RadioShack
Corporation.
|
|
32
|
3
|
Section 1350
Certifications.4
|
___________________
1 RadioShack
Corporation was known as Tandy Corporation until May 18, 2000.
2 Management
contract or compensatory plan or arrangement required to be filed as an exhibit
pursuant to Item 15(b) of Form 10-K.
3 Filed
with this report.
4 These
Certifications shall not be deemed “filed” for purposes of Section 18 of the
Exchange Act, as amended, or otherwise subject to the liability of that
section. These Certifications shall not be deemed to be incorporated
by reference into any filing under the Securities Act of 1933, as amended, or
the Exchange Act, except to the extent that the Company specifically
incorporates it by reference.
87