Attached files
| file | filename |
|---|---|
| EX-21.1 - SUBSIDIARIES - Intermec, Inc. | exhibit211.htm |
| EX-32.1 - MANAGEMENT CERTIFICATION 906 - Intermec, Inc. | exhibit32.htm |
| EX-31.1 - MANAGEMENT CERTIFICATION 302 - Intermec, Inc. | exhibit31.htm |
| EX-32.2 - MANAGEMENT CERTIFICATION 906 - Intermec, Inc. | exhibit322.htm |
| EX-31.2 - MANAGEMENT CERTIFICATION 302 - Intermec, Inc. | exhibit312.htm |
| EX-10.24 - SERP FREEZE AMENDMENT - Intermec, Inc. | exhibit1024.htm |
| EX-10.22 - RESTORATION PLAN AMENDMENT - Intermec, Inc. | exhibit1022.htm |
| EX-10.18 - DEFERRED COMPENSATION PLAN AMENDMENT - Intermec, Inc. | exhibit1018.htm |
| EX-23.1 - CONSENT FROM INDEPENDENT AUDITORS - Intermec, Inc. | exhibit23.htm |
UNITED
STATES
SECURITIES
AND EXCHANGE COMMISSION
Washington,
D.C. 20549
FORM 10-K
|
(Mark
One)
|
|
|
x
|
ANNUAL
REPORT PURSUANT TO SECTION 13 OR 15(d) OF THE SECURITIES
EXCHANGE ACT OF 1934
|
|
For
the fiscal year ended December 31, 2009
|
|
|
OR
|
|
|
o
|
TRANSITION
REPORT PURSUANT TO SECTION 13 OR 15(d) OF THE SECURITIES
EXCHANGE ACT OF 1934
|
Commission
file number 001-13279

Intermec, Inc.
(Exact
name of registrant as specified in its charter)
|
Delaware
|
95-4647021
|
|
|
(State
or other jurisdiction of
|
(I.R.S.
Employer Identification No.)
|
|
|
incorporation
or organization)
|
||
|
6001
36th Avenue West
|
98203-1264
|
|
|
Everett,
Washington
|
(Zip
Code)
|
|
|
www.intermec.com
|
||
|
(Address
of principal executive offices)
|
Registrant’s
telephone number, including area code: (425) 265-2400
Securities
registered pursuant to Section 12(b) of the Act:
|
Title
of each class
|
Name
of each exchange on which registered
|
|
|
Common
Stock, par value $0.01 per share
|
New
York Stock Exchange
|
|
Securities
registered pursuant to Section 12(g) of the Act: None
Indicate
by check mark if the registrant is a well-known seasoned issuer, as defined in
Rule 405 of the Securities Act. Yes x
No o
Indicate
by check mark if the registrant is not required to file reports pursuant to
Section 13 or 15(d) of the Exchange Act.
Yes o No x
Indicate
by check mark whether the Registrant (1) has filed all reports required to
be filed by Section 13 or 15(d) of the Securities Exchange Act of 1934
during the preceding 12 months (or for such shorter period that the Registrant
was required to file such reports), and (2) has been subject to such filing
requirements for the past 90 days. Yes x No
o
Indicate
by check mark whether the registrant has submitted electronically and posted on
its corporate Web site, if any, every Interactive Data File required to be
submitted and posted to Rule 405 of Regulation S-T (§229.405 of this chapter)
during the preceding 12 months (or for such shorter period that the registrant
was required to submit and post such files). Yes ¨ No ¨
Indicate
by check mark if disclosure of delinquent filers pursuant to Item 405 of
Regulation S-K is not contained herein, and will not be contained, to the best
of Registrant’s knowledge, in definitive proxy or information statements
incorporated by reference in Part III of this Form 10-K or any
amendment to this Form 10-K x.
Indicate
by check mark whether the registrant is a large accelerated filer, an
accelerated filer, a non-accelerated filer, or a smaller reporting company. See
the definitions of “large accelerated filer,” “accelerated filer” and “smaller
reporting company” in Rule 12b-2 of the Exchange
|
Large
Accelerated Filer x
|
Accelerated
Filer o
|
|||
|
Non-accelerated
filer o
|
Smaller
reporting company Filer o
|
|||
|
(Do
not check if a smaller reporting company)
|
Indicate
by check mark whether the registrant is a shell company (as defined in
Rule 12b-2 of the Exchange Act). Yes o No
x
As of
June 26, 2009, which was the last business day of the registrant’s most recent
second fiscal quarter, the aggregate market value of the registrant’s common
stock held by non-affiliates of the registrant was approximately $750.7 million,
based on the closing sale price as reported on the New York Stock
Exchange.
On
February 15, 2010, there were 61,696,242
shares of Common Stock outstanding, exclusive of treasury
shares.
Documents
Incorporated by Reference
Certain
information required to be reported in Part III of this Annual report on
Form 10-K is herein incorporated by reference from the registrant’s Definitive
Proxy Statement to be filed with the Securities and Exchange Commission with
respect to the registrant’s Annual Meeting of Shareholders scheduled to be held
on May 26, 2010.
INTERMEC,
INC.
TABLE
OF CONTENTS TO ANNUAL REPORT
ON
FORM 10-K
|
Page
|
||
|
Part
I.
|
||
| 4 | ||
| 13 | ||
| 19 | ||
| 20 | ||
| 20 | ||
| 20 | ||
|
Part
II.
|
||
| 21 | ||
| 23 | ||
| 24 | ||
| 37 | ||
| 38 | ||
| 38 | ||
| 38 | ||
| 39 | ||
|
Part
III.
|
||
| 40 | ||
| 40 | ||
| 40 | ||
| 40 | ||
| 40 | ||
|
Part
IV.
|
||
| 41 | ||
| 42 |
PART I
FORWARD-LOOKING
STATEMENTS AND RISK FACTORS; SAFE HARBOR
Statements
made in this filing and any related statements that express Intermec’s or our
management’s intentions, hopes, indications, beliefs, expectations, guidance,
estimates, forecasts or predictions of the future constitute forward-looking
statements, as defined by the Private Securities Litigation Reform Act of 1995,
and relate to matters that are not historical facts. They include, without
limitation, statements about our view of general economic and market conditions,
our cost reduction plans, our revenue, expense, earnings or financial outlook
for the current or any future period, our ability to develop, produce, market or
sell our products, either directly or through third parties, to reduce or
control expenses, to improve efficiency, to realign resources, or to continue
operational improvement and year-over-year or sequential growth, and about the
applicability of accounting policies used in our financial reporting. When used
in this document and in documents it refers to, the words “anticipate,”
“believe,” “will,” “intend,” “project” and “expect” and similar expressions as
they relate to us or our management are intended to identify such
forward-looking statements. These statements represent beliefs and expectations
only as of the date they were made. We may elect to update forward-looking
statements but we expressly disclaim any obligation to do so, even if our
beliefs and expectations change.
Actual results may differ from those expressed or
implied in our forward-looking statements.
Such forward-looking statements involve and are subject to certain risks and
uncertainties, which may cause our actual results to differ materially
from those discussed in a forward-looking statement. These include, but are
not
limited to, risks and uncertainties described more fully in our reports filed or
to be filed with the Securities and Exchange Commission including, but not
limited to, our annual reports on Form 10-K and quarterly reports on Form 10-Q,
which are available on our website at www.intermec.com.
You are encouraged to review the Risk Factors
portion of Item 1A of Part I of this filing which discusses the risk factors
associated with our business.
|
ITEM
1.
|
BUSINESS
|
Intermec, Inc. (“Intermec”,
“us”, “we”, “our”) became an independent public company on October 31,
1997. Intermec is a Delaware corporation and our headquarters are in Everett,
Washington. Our major offices and repair facilities are in the states of
Washington, Iowa, North Carolina and Ohio and in more than 20 countries
internationally, including the United Kingdom, the European Union, Canada,
Mexico, Brazil, and Singapore.
Information
on our company may be found at the Internet website www.intermec.com. Our annual
reports on Form 10-K and certain of our other filings with the Securities
and Exchange Commission (“SEC”) are available in PDF format through our Investor
Relations website at http://www.intermec.com/about_us/investor_relations/index.aspx.
Our annual reports on Form 10-K, quarterly reports on Form 10-Q,
current reports on Form 8-K and amendments to those reports are also
available on the SEC website at www.sec.gov. The contents of
these websites are not incorporated by reference into this report or in any
other report or document we file. Our references to the addresses of these
websites are intended to be inactive textual references only. Shareholders may
request a free copy of the annual reports on Form 10-K and quarterly
reports on Form 10-Q from:
Intermec, Inc.
Attention:
Investor Relations
6001 36th
Avenue West
Everett,
WA 98203-1264
Continuing
Operations
We
design, develop, integrate, sell, resell and repair wired and wireless automated
identification and data collection (“AIDC”) products and provide related
services. Our products include mobile computing products, bar code scanners,
wired and wireless bar code printers and label media products, and radio
frequency identification (“RFID”) products.
We sell
products worldwide for field mobility applications, including asset
management, direct store delivery, maintenance and repair, in-transit
visibility, and routing and navigation, as well as for in-premise applications,
including asset management, freight yard operations, inventory management,
warehouse operations, and work-in-process management. The mobile and
in-premise work environments in which our products are used present physically
demanding conditions. Our products are designed to be more rugged
than consumer mobility devices, to withstand harsh conditions and heavy
use.
4
|
ITEM
1.
|
BUSINESS
(continued)
|
We
generate our revenues primarily through:
● The
sale of wired and wireless AIDC products, including mobile computing products,
bar code scanners, wired and wireless bar code printers, label media and RFID
products; and
● The
sale of service contracts to customers who want “extended” or post-warranty
service, maintenance or repairs for the products they have purchased from us or
from a value-added reseller.
Products
|
|
Mobile
Computers
|
Our
mobile computers allow a customer’s employees to automatically and wirelessly
collect and send data to remote computers, and to automatically and
wirelessly receive data from those remote computers. These products can be
used to collect and analyze data and to transmit the data to enterprise resource
planning systems, warehouse management systems, order fulfillment,
transportation and logistics systems and other business intelligence
applications.
Our
mobile computer product line includes handheld computers and vehicle-mounted
computers (principally on forklifts) that facilitate local-area and
wide-area voice and data communications. These mobile products typically contain
multiple wireless technologies such as wide-area GPRS and CDMA, local-area
802.11 and Bluetooth. Our mobile computer portfolio also includes devices with
barcode scanning, GPS or RFID capabilities.
Our
mobile computers use Microsoft Windows®,
Windows® CE
and Windows Mobile®, and
Windows XP operating systems, as well as scanning and Internet Protocol-based
data communication capabilities. They range from relatively low-cost, handheld
batch and wireless data collection devices to higher-cost computers with
on-board computing, data storage and network capabilities.
|
|
|
|
|
Bar
Code Scanners
|
Our bar
code scanning portfolio includes fixed, handheld and forklift-mounted laser
scanners and linear and area imagers. These products are able to collect,
to decode bar codes, and to transmit the resulting data to standard
enterprise resource planning systems, warehouse management systems, order
fulfillment, transportation and logistics systems and other business
intelligence applications.
|
|
Printers and Label
Media
|
We sell
fixed, desktop and portable barcode and RFID printers ranging from relatively
low-cost, light-duty models to higher-cost, heavy-duty models. Our specialty
printers provide custom capabilities, including color printing, a global
language enabler and high resolution printing that produces sharp typefaces
and precise graphics even on small labels such as those used by the electronics
industry. Our label media products include pressure-sensitive bar code labels
and thermal transfer ribbons. We also design and manufacture
specialized labels to meet customer requirements for extreme environments such
as clean rooms, chemical baths and high humidity.
5
|
ITEM
1.
|
BUSINESS
(continued)
|
Radio
Frequency Identification (RFID) Products
RFID
systems are wireless systems for the collection, storage and transmission of
data. RFID systems can be used to wirelessly collect and transmit
more information than barcode systems and they do not require “line-of-sight” as
barcode systems do. Customers use RFID technology to track pallets,
cartons, containers and individual goods and assets.
These
systems typically consist of RFID readers and RFID tags. RFID tags, which
consist of a computer chip and antenna encased in a protective
covering, are programmed by users with product or asset information such as
name, serial number, and manufacturer. Certain RFID tags contain read/write
memory to allow updates and tag reuse.
We sell
fixed, handheld and forklift-mounted RFID readers, high value rigid RFID tags
and high value inserts for RFID tags. Our RFID product line is
currently focused on passive UHF technology and consists of RFID tags, readers,
printers, software and related equipment. Our RFID products comply
with the EPCglobal Generation 2 UHF standard and other standards around the
world.
Product
Manufacture and Assembly
We use
contract manufacturers and other suppliers to fabricate the products we sell and
to provide the spare parts for repairs. We also use third parties for
other activities related to our supply chain and business
processes.
In
December 2008, we entered into a Manufacturing Services Framework Agreement (the
“Agreement”) with Venture Corporation Limited and its affiliates (collectively,
“Venture”). Beginning in 2008, we relocated the final assembly of our
then-existing product lines from our headquarters location in Everett,
Washington, to Venture. Under an earlier manufacturing services
contract, Venture had manufactured printed circuit board assemblies and some
finished goods for us. The Agreement supersedes and replaces the
earlier manufacturing services contract.
Venture’s manufacturing services include material and component procurement and equipment manufacturing, testing, packaging and shipment of finished goods. Venture will generally purchase and own raw material, component, and finished goods inventories, but in certain limited circumstances, Intermec may take ownership of portions of those inventories. Intermec takes the lead in selecting and negotiating with suppliers and contract manufacturers on key components to be purchased by Venture.
For
substantially all of the products we offered for sale at the time the Agreement
was entered into in December 2008, Venture is our exclusive
manufacturer. The Agreement provides that Intermec products introduced to
the marketplace after the effective date of the Agreement will not be
automatically included in the Agreement, but they may be included by mutual
agreement. With respect to new products, we decide whether to use
Venture or some other contract manufacturer on a case-by-case
basis. The Agreement does not require Intermec to purchase minimum
quantities of its products from Venture.
We are
currently using one other contract manufacturer in Asia for one of our product
lines.
In
addition to the use of contract manufacturers and suppliers, we also use U.S.
and non-U.S. third party service providers, including transportation and
logistics management. We may, in the future, take advantage of
similar opportunities to use service providers to streamline our business and to
enhance our flexibility and responsiveness to global
markets.
6
ITEM
1. BUSINESS
(continued)
Business
Strategy
We
provide rugged mobile business solutions that help our customers improve their
visibility and control of their businesses and, in the process, lower their
costs, increase their revenues and improve customer satisfaction and
loyalty. These business solutions are a collaborative effort between
Intermec and our channel partners.
We and
our channel partners are focused on the following applications:
● Field Mobility
♦ Asset management. Many firms
have employees in the field who are using, operating, installing or retrieving
valuable assets such as machinery, tools, equipment, components and parts.
Tracking those assets and their condition while they are in the field allows our
customers to reduce capital expenditures, operating expenses, working capital
requirements and cash consumption.
♦ Direct store delivery. Direct
store delivery (“ DSD”) is the delivery of consumer goods from a supplier or
distributor directly to a retail store, bypassing a warehouse. DSD activities
typically include in-store inventory management, store-level authorized item
management, store-level ordering, forecasting, product pricing, promotion,
invoicing, the physical delivery and return of merchandise, the electronic
exchange of delivery data, and shelf merchandising. Our products and
services allow our customers to manage these activities while they are in
progress in the field and, in this manner, increase orders and revenue, achieve
just-in-time inventory replenishment, update and confirm pricing “on the fly,”
track promotion costs and product returns, etc.
♦ Field
Service. Many firms perform in-field maintenance, repair
and refurbishment services for their own products or for products manufactured
by others. These services typically involve the steps of finding the
specific location of the equipment within a residence, facility or a yard,
evaluating or confirming the nature of the work required, resolving technical or
other issues that arise while the work is being performed, testing to confirm
that the work had the desired effect, reporting the completion of the work,
updating equipment service and repair records, invoicing for parts and labor,
etc. Our products and services allow our customers to manage these
activities while their employees are in the field and, in this manner, enhance
revenue and decrease the cost, time and trouble of in-field maintenance and
repair.
♦ Postal Services. Private and
public postal and package delivery services have many employees in the field
picking up, sorting, transporting and delivering mail and
packages. These customers want to improve the timeliness, efficiency
and quality of the work being performed in the field while the work is in
progress. Our products and services make this possible by allowing
the customer to use automated systems to transmit data to and receive data from
workers in the field and to provide those workers with on-board data analysis
tools as well as dynamic routing and navigation support
systems. Our products and services also allow postal customers
to cut costs and improve revenue with automated route and revenue optimization
systems that can impact field activities while those activities are in
progress.
♦ Transportation and Logistics.
Shippers and transporters often want to know where their shipment is, who
received the shipment, when it was delivered, the conditions and events that may
have impacted the shipment in transit (e.g., temperature, humidity, shocks), the
condition of the shipment on delivery, etc. Our products and services allow our
customers to acquire, transmit, analyze and manage this information while the
shipments are in the field and, in this manner, reduce the cost and simplify the
management of outbound and inbound shipments. Our products and services also
allow transportation and logistics firms to use automated route and revenue
optimization systems, dynamic routing systems and navigation support systems
while their transportation assets are in the field.
7
ITEM
1. BUSINESS
(continued)
● In-Premise Applications
♦ Asset management. Many of our
customers’ employees are using, operating, installing or retrieving valuable
assets such as machinery, tools, equipment, components and parts in their
facilities owned or leased by their employers. Our products and
services allow our customers to remotely track these assets and their condition
and, in this manner, reduce shrinkage, and reduce capital expenditures,
operating expenses, working capital requirements and cash
consumption.
♦ Freight yard
operations. Firms operating transportation fleets want to use
information about their freight yards to increase revenues, improve efficiency
and productivity and reduce costs. Our products and services allow
these firms to automatically collect, transmit, analyze and dynamically act on
data from the yard such as inbound and outbound vehicles, yard location of
equipment, equipment and operator availability, vehicle / trailer mismatches and
goods loaded or offloaded from vehicles or trailers.
♦ Inventory
management. Many of our customers want an efficient method of
regularly gathering inventory data so that they can establish optimal inventory
policies and to rapidly respond to unplanned changes in demand and
supply. Our products and services meet this need by allowing firms to
automatically collect, transmit, analyze and act on inventory data whether the
inventory is in a plant, warehouse or a retail store.
♦ Manufacturing. Our
manufacturing customers often want to use work-in-process (“WIP”) data to reduce
waste and other inefficiencies in the manufacturing process. Our
products and services meet this need by providing an automatic method of
collecting, transmitting, analyzing and using WIP data to align production to
demand, smooth production flow and reduce waste and rework.
♦ Warehouse
operations. Many firms with warehouse operations want to streamline
and improve those operations through automatic data collection and
processing. Our products and services meet this need by providing an
automatic method of collecting, transmitting, analyzing and acting on data
concerning the arrival, departure, storage location and condition of goods,
equipment and workers.
We and
our channel partners are focused on private and public sector customers in the
following categories:
♦ Consumer Goods. These
customers make products for retailers and other firms that sell directly to
businesses and consumers. Segments within this category include firms that
produce foods, beverages, consumer packaged goods, footwear and apparel, health
products and pharmaceuticals, beauty products, housewares and appliances,
electronics, recreation products and services, and media and
publications.
♦ Healthcare. These customers
provide healthcare products and services to healthcare providers, laboratories
or patients. Segments within this category include firms that provide
preventative and emergency medical services in hospitals, clinics and medical
offices, firms that provide laboratory and test services, and firms that produce
the medical and test equipment, pharmaceuticals and other products used in
hospitals, clinics, medical offices and laboratories.
♦ Industrial
Goods. Some customers in this category supply raw materials,
components and assemblies to manufacturers and service providers in a variety of
industries, including aerospace, automotive, chemicals, electronics, and oil and
gas. Other customers in this category produce durable goods for businesses and
consumers, including automobiles, computers and household
appliances.
♦ Postal. Customers in this
category may be wholly-owned or partially-owned by national or regional
governments or they may be private companies. These firms typically
collect, transport and deliver mail and small to medium-sized packages using
their own employees, independent contractors or some combination of the
two.
8
ITEM
1. BUSINESS
(continued)
♦ Retail. These customers sell
a wide variety of products and services to businesses and consumers through
brick-and-mortar retail and mall stores, specialty outlets, department stores,
warehouse-style mega-stores and the Internet. Segments within this
category include firms that sell foods, beverages and other grocery items,
pharmaceuticals, health and beauty products, electronics, housewares,
appliances, footwear, apparel, office products, and books, magazines and other
media products.
♦ Transportation and Logistics.
These firms provide shipping, transportation and logistics services using their
own personnel and equipment or third party resources. Segments within this
category include motor freight, air transport, railways, waterborne
transportation and logistics service providers.
Markets
and Customers
Because
AIDC solutions can be used by a company of any size, the AIDC market is large.
Market growth is driven by the need for technologies and solutions that reduce
capital expenditures, operating expenses, working capital requirements and cash
consumption, increase revenues and accelerate revenue recognition or improve
productivity, quality, and customer service and support.
We cover
the AIDC market through a combination of: our own direct sales and service
organization; two-tier distributors; resellers; and independent hardware,
software and service vendors. Our indirect sales channel accounts for
approximately 70% of our product sales.
Our
direct sales organization serves customers from offices throughout the Americas,
Europe, the Middle East and Africa and in selected Asia Pacific countries,
including China and Australia. Our two-tiered sales channel is also global and
includes value-added distributors, resellers and independent software
vendors.
Our
customer base consists of private and public entities of many
sizes. Some customers are end user customers, and others are
distributors, resellers and other vendors. In 2009, 2008 and 2007,
one customer, ScanSource, Inc.("ScanSource") and its affiliated companies
accounted for more than 10% of our revenues. ScanSource is a
distributor of our products, and not an end user customer. Total sales to this
customer were $123.0 million, $113.8 million, and $108.7 million for the years
ended December 31, 2009, 2008 and 2007, respectively.
The AIDC
market is highly competitive and there are many firms capable of becoming and,
we believe, willing to become distributors for Intermec in addition to those now
engaged in that role. We do not believe that Intermec is
substantially dependent upon any contractual arrangements with ScanSource or its
affiliated companies.
Competition
The
market for AIDC products is fragmented, highly competitive and rapidly changing.
Independent market surveys suggest that we are one of the larger participants
measured by revenues. Motorola, Inc. and its wholly-owned subsidiary, Symbol
Technologies, Inc., are major competitors with respect to barcode, mobile
computing and RFID products and services. We also face strong competition in
individual AIDC product lines from suppliers such as Zebra Technologies
Corporation, which supplies barcode and RFID printers, and Honeywell
Corporation, which supplies barcode imagers and mobile computers. In the
label media area, we face competition from a number of large and small media
producers, including, among many others, Avery Denison and Brady.
We
compete in our target markets primarily on the basis of our technology and
expertise, but our support services, product functionality, performance,
ruggedness and overall product quality are also important elements of our
competitive offerings.
Research
and Development
Research
and development expenditures, net of credits, amounted to $59.6 million,
$67.9 million, and $68.7 million, all of which we sponsored in the years ended
December 31, 2009, 2008 and 2007, respectively.
9
ITEM
1. BUSINESS
(continued)
Intellectual
Property
We strive
to protect our investment in technology and to secure competitive advantage by
obtaining intellectual property (“IP”) protection. We currently have
approximately 580 active patents and a number of trademarks, copyrights and
trade secrets. When appropriate, we have obtained licenses to use IP controlled
by other organizations. As we expand our product offerings, we try to obtain
patents and other IP rights related to such offerings and, when appropriate,
seek licenses to use IP owned by third parties.
To
distinguish our products and services from those of our competitors, we have
obtained certain trademarks and trade names, and as we expand our product and
service offerings, we try to obtain trademarks and trade names to cover those
new offerings. We protect certain details of our processes, products and
strategies as trade secrets by restricting access to that information. We have
ongoing programs designed to maintain the confidentiality of such
information.
We
license our IP to generate revenue or to facilitate our effort to market and
sell our products and services. We have more than 150 RFID patents and
more than 20 companies have taken royalty-bearing licenses under those patents,
including Avery Dennison, Cisco, Honeywell Corporation, Motorola,
Inc., Texas Instruments and Zebra Technologies, Inc. We
also have over 400 non-RFID patents covering wireless communication, networking,
Internet access, imaging and similar technologies and have a licensing program
for those patents as well.
We try to
protect our investment in technology, generate revenue and secure competitive
advantage by enforcing our IP rights. The nature, timing and geographic location
of these efforts depends, in part, on the types of legal protection given to
different types of IP rights in various countries.
Seasonality
and Backlog
Our
quarterly results reflect seasonality in the sale of our products and services,
since our revenues are typically highest in the fourth fiscal quarter and the
lowest in the first fiscal quarter. See “Quarterly Financial Information” on
page 78 of this Form 10-K for quarterly revenues and
expenses.
Sales
backlog from continuing operations was $44.2 million, $80.9 million, and
$71.1 million at December 31, 2009, 2008 and 2007, respectively. Our
business typically operates without a significant backlog of firm orders, and we
do not consider backlog to be a significant indicator of future
sales.
Employees
At
December 31, 2009, we had 1,734 full-time employees, of which 1,721 were
employed by our wholly-owned subsidiary, Intermec Technologies Corporation,
and 13 were employed by our holding company, Intermec, Inc. Approximately
62% of our full-time employees are in the United States, approximately 18% are
in Europe, the Middle East and Africa (“EMEA”), and the remaining 20% are
employed throughout the rest of the world, including the Asia Pacific region,
Latin America, Canada and Mexico.
Discontinued
Operations
In 2005,
we divested our Industrial Automation Systems ("IAS") businesses, which
comprised the Cincinnati Lamb and Landis Grinding Systems divisions. The IAS
businesses are classified as discontinued operations for accounting purposes in
our consolidated financial statements and related notes. At the time of
divestiture, the IAS businesses were producers of manufacturing products and
services, including integrated manufacturing systems, machining systems,
stand-alone machine tools and precision grinding and abrasives operations
primarily serving the global aerospace, automotive, off-road vehicle and diesel
engine industries as well as the industrial components, heavy equipment and
general job shop markets. At the point of divestiture, we retained
some leased and owned facilities that have not been integrated into our current
operations. We are attempting to sublease or sell these unused
facilities.
10
|
ITEM
1.
|
BUSINESS
(Continued)
|
EXECUTIVE
OFFICERS OF THE REGISTRANT.
Our
executive officers are elected each year by the Board of Directors at its first
meeting following the Annual Meeting of Shareholders to serve during the ensuing
year and until their respective successors are elected and qualified or until
their earlier resignation or removal. Newly-hired executive officers are elected
at the time of their employment to serve until the next Board of Directors
meeting first following an Annual Meeting of Stockholders and until their
successors are elected and qualified or until their earlier resignation or
removal. There are no family relationships between any of our executive officers
and any director or other executive officer. The following information indicates
the positions and ages of our executive officers on February 19, 2010, and their
business experience during the prior five years.
|
Name
|
Age
|
Position with Company and Principal Business Affiliations
During Past Five Years
|
|||
|
Patrick
J. Byrne
|
49 |
Chief
Executive Officer and President, and member of the Board of Directors
since July 2007. Prior to joining Intermec, Mr. Byrne served as a Senior
Vice President of Agilent Technologies Inc., a bio-analytical and
electronic measurement company, and President of its Electronic
Measurement Group from February 2005 to March 2007. Prior to assuming
that position, Mr. Byrne served as Vice President and General Manager
for Agilent’s Electronic Products and Solutions Group's Wireless Business
Unit from September 2001 to February 2005.
|
|||
|
Robert
J. Driessnack
|
51 |
Senior
Vice President and Chief Financial Officer since January 19, 2009.
Prior to his appointment as our Chief Financial Officer, Mr. Driessnack
served as Vice President and Controller of HNI Corporation, a manufacturer
and distributor of office furniture and hearth products, from 2004 until
joining Intermec.
|
|||
|
Janis
L. Harwell
|
55 |
Senior
Vice President and General Counsel since September 2004 and Corporate
Secretary since January 2006. In February 2009, Ms. Harwell also was
appointed Senior Vice President Corporate Strategy.
|
|||
|
Dennis
A. Faerber
|
57 |
Senior
Vice President, Global Supply Chain Operations and Global Services, of
Intermec Technologies Corporation, since February 2008 for Global Supply
Chain Operations, and since February 2009 for Global
Services. Prior to joining Intermec, Mr. Faerber was employed by
Applied Materials, Inc. from January 2007 through January 2008 as
Corporate Vice President (Global Supply Chains) and by KLA-Tencor
Corporation from March 2004 through January 2007 as Group Vice President
and Chief Quality Officer.
|
|||
|
James
P. McDonnell
|
55 |
Senior
Vice President, Global Sales of Intermec Technologies Corporation, since
January 2010. Prior to joining Intermec, Mr. McDonnell was Vice
President of Global Sales-Enterprise Storage and Servers Group at
Hewlett-Packard from 2007 to January 2010. Prior to assuming
that position, Mr. McDonnell was Senior Vice President, Solutions Partners
Organization for Hewlett-Packard, from 2004 to 2007.
|
|||
|
Earl
R. Thompson
|
48 |
Senior
Vice President, Mobile Solutions Business Unit since October
2008. Mr. Thompson previously served as Vice President and
General Manager of our Printer/Media Business from April 2008 to October
2008. Prior to joining Intermec, Mr. Thompson was Vice
President and General Manager, Wireless Division of Agilent Technologies,
Inc. from 2004 to 2007.
|
|||
11
|
ITEM
1.
|
BUSINESS
(Continued)
|
Environmental
and Regulatory Matters
In
January 2003, the European Parliament and Council adopted Directive
2002/95/EC on the Restriction of the Use of Certain Hazardous Substances in
Electrical and Electronic Equipment (the “RoHS Directive”). The RoHS Directive
went into effect on July 1, 2006, and prohibits firms from putting on the
European Union ("EU") market new electrical and electronic equipment that
contains more than permitted levels of lead, cadmium, hexavalent chromium,
polybrominated biphenyl ("PBB") and polybrominated diphenyl ether ("PBDE"). The
RoHS Directive does not apply to units of equipment already placed on the EU
market prior to July 1, 2006. In addition, the RoHS Directive contains
exemptions for (a) certain types of equipment; (b) reuse of equipment
placed on the EU market prior to July 1, 2006; and (c) spare parts for
the repair of equipment placed on the EU market prior to July 1,
2006.
The State
of California also has adopted restrictions on the use of certain materials in
electronic products that are intended to harmonize with the RoHS Directive.
Those restrictions went into effect in 2007. Other U.S. states are considering
similar legislation or are in the process of implementing enacted
legislation.
Similarly,
China has promulgated environmental regulations covering the same substances as
the RoHS Directive. China’s regulations became effective on March 1, 2007 and
imposed various marking and substance content disclosures (above defined
thresholds) of electronic products imported into China. We have
implemented a program to comply with these requirements. China
has defined lead, mercury, cadmium, hexavalent chromium, PBB, and PBDE as
restricted substances in electronic equipment sold in China. Other
countries outside of the EU and China are in various stages of establishing RoHS
requirements and may adopt RoHS-type regulations in the future. China
also has exceptions similar to those contained in the RoHS
Directive.
In
addition, the State of California adopted restrictions on the energy efficiency
of external alternating current power supplies used with many of the products we
manufacture and sell. No significant costs were incurred in 2009 for
our product and system re-certification to U.S. requirements due to migration to
newer, more efficient power supplies. Additional certification costs
may be incurred in 2010 and beyond as similar requirements are adopted in other
countries in which we sell or intend to sell.
We have
redesigned some of our current products to bring them into compliance with the
RoHS Directive and similar regulations in other jurisdictions. In other cases,
we are replacing non-compliant products with new products that comply with these
regulations. No costs other than planned R&D expenditures were incurred in
2009 to comply with these regulations. We expect to incur additional costs in
the future for compliance with the RoHS Directive and similar regulations in
other jurisdictions. The amount and timing of such expenditures are uncertain
due to uncertainties about the effective date and final content of RoHS-type
regulations in various jurisdictions and the possibility that RoHS-type
regulations in one jurisdiction will not be consistent with RoHS-type
regulations in other jurisdictions.
Radio
emissions are the subject of governmental regulation in all countries in which
we currently conduct or expect to conduct business. In North America, both the
Canadian and U.S. governments publish radio emission regulations and changes
thereto after public hearings. In other countries, regulatory changes can be
introduced with little or no grace period for implementation. Furthermore, there
is little consistency among the regulations of various countries. Future
regulatory changes in North America, China and other jurisdictions are possible.
These conditions introduce uncertainty into our product-planning process and
could have an adverse effect on our ability to sell our wireless products in a
given country or adversely affect our cost of supplying wireless products in a
given country.
Raw
Materials
We use a
variety of raw materials in the manufacture of our products, and we obtain such
raw materials from a variety of suppliers. In general, the raw materials we use
are available from numerous alternative sources. As is customary for our
industry, we at various times enter into certain single-source component part
supply agreements. We believe these agreements will be renewed in the ordinary
course of business.
12
|
ITEM
1A.
|
RISK
FACTORS
|
You are encouraged to review the discussion of
Forward Looking Statements and Risk Factors appearing in this report at Part II,
Item 7, “Management’s Discussion and Analysis of Financial Condition and Results
of Operation.”
In
addition to the other information set forth in this report, you should carefully
consider the following factors, which could materially affect our business,
financial condition or operating results. The risks described in this report are
not the only risks facing us. Additional risks and uncertainties not currently
known to us or that we currently deem to be immaterial also may materially
adversely affect our business, financial condition or operating
results.
|
·
|
Our
business may be adversely affected if we do not continue to improve our
business processes and systems and transform our supply chain or if those
efforts have unintended results. In order to increase sales and
profits, we must continue to expand our operations into new product and
geographic markets and deepen our penetration of the markets we currently
serve, and do so in ways that are cost effective and efficient from an
operational and a tax perspective. To achieve our
objectives, we need to continue to streamline our sales systems, supply
chain and business processes and continue to improve our financial,
information technology and enterprise resource planning
systems. This may require us to significantly reorganize or
restructure our business and, in the case of restructurings, recognize the
anticipated costs of such restructurings. Such reorganizations
and restructurings may at times be large, complex
undertakings. Those activities might not proceed as planned,
could result in unintended consequences or might not accomplish the
intended goals, any of which could have a material adverse impact on our
sales, profits, results of operations and
earnings.
|
|
·
|
Our
industry is characterized by rapid technological change, and our success
depends upon the timely introduction of new products and our ability to
mitigate the risk of product obsolescence. Customer requirements
for AIDC products are rapidly evolving and technological changes in our
industry occur rapidly. To keep up with new customer requirements and
distinguish Intermec from our competitors, we must frequently introduce
new products and enhancements of existing products through potentially
significant investments in research and development
(“R&D”). We may not have adequate resources to invest in
R&D that will keep pace with technological changes in our industry,
and any such investments may not result in competitive
products. Furthermore, we may not be able to launch new
products before our competition launches comparable
products. Any of these factors could cause our business to
suffer.
|
Rapid
technological change, whether through our or our competitors’ introduction of
new products or technologies, could also render our products obsolete and result
in substantial excess inventories. In such event, we might have to sell all or a
portion of the excess or obsolete inventory at a substantial discount to the
planned resale price or the cost of making or acquiring that inventory and write
off the difference. If our response to technological changes and our ability to
introduce new products and product enhancements is not effective, and we do not
mitigate the risk of product obsolescence, our financial results could be
materially and adversely affected.
13
|
ITEM
1A.
|
RISK
FACTORS (Continued)
|
|
·
|
Macroeconomic
conditions beyond our control could lead to decreases in demand for our
products, reduced profitability or deterioration in the quality of our
accounts receivable. Domestic and international economic,
political and social conditions are uncertain due to a variety of factors,
including
|
|
Ÿ
|
global,
regional and national economic
downturns;
|
|
Ÿ
|
the
availability and cost of credit;
|
|
Ÿ
|
volatility
in stock and credit markets;
|
|
Ÿ
|
energy
costs;
|
|
Ÿ
|
fluctuations
in currency exchange rates;
|
|
Ÿ
|
the
risk of global conflict;
|
|
Ÿ
|
the
risk of terrorism and war in a given country or region;
and
|
|
Ÿ
|
public
health issues.
|
Our
business depends on our customers’ demand for our products and services, the
general economic health of current and prospective customers, and their desire
or ability to make investments in technology. A
deterioration of global, regional or local political, economic or social
conditions could affect potential customers in a way that reduces demand for our
products and disrupts our manufacturing and sales plans and
efforts. These global, regional or local conditions also could
disrupt commerce in ways that could interrupt our supply chain and our ability
to get products to our customers. These conditions may also affect
our ability to conduct business as usual. Changes in foreign currency
exchange rates may negatively impact reported revenue and
expenses. In addition, our sales are typically made on unsecured
credit terms that are generally consistent with the prevailing business
practices in the country in which the customer is located. A deterioration of
political, economic or social conditions in a given country or region could
reduce or eliminate our ability to collect accounts receivable in that country
or region. In any of these events, our results of operations could be materially
and adversely affected.
|
·
|
Some of our
competitors are substantially larger and more profitable than we are,
which may give them a competitive advantage. We operate in a highly
competitive industry. Due to acquisitions and other
consolidation of the AIDC industry, competition is likely to
intensify. Some of our competitors have substantially more
revenue or profit than we do. The scale advantage of these companies may
allow them to invest more in R&D, sales and marketing, and customer
support than we can or to achieve more efficient economies of scale in
manufacturing and distribution. The scale advantage may also allow them to
acquire or make complementary products that alone or in combination with
other AIDC products could afford them a competitive advantage.
These advantages may enable our larger competitors to weather market
downturns longer or adapt more quickly to emerging technology
developments, market trends or price declines than we can. Those
competitors may also be able to precipitate such market changes by
introducing new technologies, reducing their prices or otherwise changing
their activities. There is no assurance that our strategies to counteract
our competitors’ advantages will successfully offset all or a portion of
this scale imbalance. If we are unable to offset all or a significant
portion of this imbalance, our earnings may be materially and adversely
affected.
|
|
·
|
Business
combinations and similar transactions might occur, alter the structure of
the AIDC industry, intensify competition and create other risks for our
business. Our industry could experience a new
series of acquisitions, joint ventures, strategic alliances or private
equity transactions, These events could alter the structure of the AIDC
industry and intensify competition within our industry by expanding the
presence of companies that have greater business and financial resources
than the firms they acquired or by increasing the market share of some
companies in our industry. Such increased competition could
have material adverse impacts to our revenues, revenue growth and results
of operations. There is no assurance that any of the strategies
we employ to respond to the structural changes and related increased
competition will be successful.
|
14
|
ITEM
1A.
|
RISK
FACTORS (Continued)
|
|
·
|
As part of
our growth strategy, we may acquire or make investments in other
businesses, patents, technologies, products or services, and our failure
to do so successfully may adversely affect our competitive position or
financial results. Our
growth could be hampered if we are unable to identify suitable
acquisitions and investments or agree on the terms of any such acquisition
or investment. We may not be able to consummate any such
transaction if we lack sufficient resources to finance the transaction on
our own and cannot obtain financing at a reasonable cost. If we
are not able to complete such transactions, our competitive position may
suffer, which could have adverse impacts on our revenues, revenue growth
and results of
operations.
|
|
·
|
Our
business combinations or other transactions may not succeed in generating
the intended benefits and therefore adversely affect shareholder value or
our financial results. Integration of new
businesses or technologies into our business may have any of the following
adverse effects:
|
|
·
|
We
may have difficulty transitioning customers and other business
relationships to Intermec.
|
|
·
|
We
may have problems unifying management following a
transaction.
|
|
·
|
We
may lose key employees from our existing or acquired
businesses.
|
|
·
|
We
may experience intensified competition from other companies seeking to
expand sales and market share during the integration
period.
|
Furthermore,
in order to complete such transactions, we may have to use cash, issue new
equity securities with dilutive effects on existing shareholders, take on new
debt, assume contingent liabilities or amortize assets or expenses in a manner
that might have a material adverse effect on our balance sheet or results of
operations. We may also consume considerable management time and
attention on the integration that would divert resources from the development
and operation of our existing business. These and other potential
problems could prevent us from realizing the benefits of such transactions and
have a material adverse impact on our revenues, revenue growth, balance sheet
and results of operations.
|
·
|
Growth of
and changes in our revenues and profits depend on the customer,
product and geographic mix of our sales. Fluctuations in our
sales mix could have an adverse impact on or increase the volatility of
our revenues, gross margins and profits. Sales
to large enterprises tend to have lower prices and gross margins than
sales to smaller firms. In addition, our gross
margins vary depending on the product or service and the
geographic region in which sales are made. Growth in our
revenues and gross margins therefore depends on the customer,
product and geographic mix of our sales. If we are unable to execute
a sales strategy that results in a favorable sales mix, our revenues,
gross margins and earnings may decline. Further,
changes in the mix of our sales from quarter-to-quarter or
year-to-year may make our revenues, gross margins and earnings more
volatile and difficult to predict.
|
15
|
ITEM
1A.
|
RISK
FACTORS (Continued)
|
|
·
|
Fluctuations
in currency exchange rates may adversely impact our cash flows and
earnings. Due to our global
operations, our cash flows, revenue and earnings are exposed to currency
exchange rate fluctuations. Our international sales are
typically quoted, billed and collected in the customer’s local currency,
but our product costs are largely denominated in U.S.
dollars. Therefore, our product margins are exposed to changes
in foreign exchange rates. In addition, foreign exchange rate
fluctuations may also affect the cost of goods and services that we
purchase and personnel that we employ outside of the United
States. When appropriate, we may attempt to limit our exposure
to exchange rate changes by entering into short-term currency exchange
contracts. There is no assurance that we will hedge or will be able to
hedge such foreign currency exchange risk or that our hedges will be
successful.
|
Our
currency exchange gains or losses (net of hedges) may materially and adversely
impact our cash flows and earnings. Additionally, adverse movements
in currency exchange rates could result in increases in our cost of goods sold
or reduction in growth in international orders, materially impacting our cash
flows and earnings.
|
·
|
Our
reliance on third-party distributors could adversely affect our business,
revenues and earnings. In addition to
offering our products to certain customers and resellers directly, we rely
to a significant and increasing degree on third-party distributors and
integrators to sell our products to end-users. In 2008 and
2009, one distributor, ScanSource, Inc., accounted for more than 10% of
our sales, and it or other distributors may account for a substantial
portion of our sales in the future. Changes in markets,
customers or products, or negative developments in general economic and
financial conditions and the availability of credit, may adversely affect
the ability of these distributors to effectively bring our products to
market at the right time and in the right locations. In
addition, if a significant distributor, such as ScanSource, were to become
unavailable or substantially reduce its purchases from us, we would be
required to obtain alternative sources of distribution or enhance our
internal sales force. Such a disruption in the distribution of
our products could impair or delay sales of our products to end users and
increase our costs of distribution, which could adversely affect our sales
or income.
|
|
·
|
We face
risks as a global company that could adversely affect our revenues, gross
profit margins and results of operations. Due to the global nature
of our business, we face risks that companies operating in a single
country or region do not have. U.S. and foreign government
restrictions on the export or import of technology could prevent us from
selling some or all of our products in one or more countries. Our sales
could also be materially and adversely affected by burdensome laws,
regulations, security requirements, tariffs, quotas, taxes, trade barriers
or capital flow restrictions imposed by the U.S. or foreign governments.
In addition, political and economic instability in a particular country or
region could reduce demand for our products or impair or eliminate our
ability to sell or deliver those products to customers in those countries
or put our assets at risk. Any of the foregoing factors could
adversely affect our ability to continue or expand sales of our products
in any market, and disruptions of our sales could materially and adversely
impact our revenues, revenue growth, gross profit margins and results of
operations.
|
A
significant percentage of our products and components for those products are
designed, manufactured, produced, delivered, serviced or supported in countries
outside of the U.S. From time to time, we contract with companies
outside of the U.S. to perform one or more of these activities, or portions of
these activities. For operational, legal or other reasons, we may have to change
the mix of domestic and international operations or move outsourced activities
from one overseas vendor to another. In addition, U.S. or foreign government
actions or economic or political instability and potentially weaker foreign IP
protections may disrupt or require changes in our international operations or
international outsourcing arrangements. The process of implementing such changes
and dealing with such disruptions is complex and can be expensive. There is no
assurance that we will be able to accomplish these tasks in an efficient or
cost-effective manner, if at all. If we encounter difficulties in making such
transitions, our revenues, gross profit margins and results of operations could
be materially and adversely affected.
16
|
ITEM
1A.
|
RISK
FACTORS (Continued)
|
|
·
|
We are
dependent on Venture Corporation Limited for the manufacture of
substantially all of our current
products
and any failure or inability of Venture to provide its manufacturing
services to us could adversely affect our business. In relying on
Venture to assemble our current products, we no longer have direct
physical control over the manufacturing process and
operations. This might adversely affect our ability to control
the quality of our current products and the timeliness of their delivery
to our customers. Either of those potential consequences could
adversely affect our customer relationships and our
revenues. Furthermore, Venture’s access to our IP could
possibly increase the risk of infringement or misappropriation of our
assets.
|
If
Venture were unable to manufacture our current products at one or more of its
facilities for any extended period, we would be required to obtain alternative
sources of manufacturing. There is no assurance that any such sources
would be available in a timely manner or at comparable cost. Any such
interruption of Venture’s manufacturing capabilities could increase our costs,
impair our ability to provide our customers with our products in a timely and
efficient manner and adversely affect our customer relationships and our
financial results.
|
·
|
Use of
third-party suppliers and service providers could adversely affect our
product quality, delivery schedules or customer satisfaction, any of which
could have an adverse effect on our financial
results. Third-party suppliers that we approve will be
providing the components that Venture or other of our contract
manufacturers will use in the final assembly of our
products. Some of these components may be available only from a
single source or limited sources, and if they become unavailable for any
reason, we or our contract manufacturers may be unable to obtain
alternative sources of supply on a timely basis. We
also outsource a number of services to U.S. and non-U.S. third party
service providers, including transportation and logistics management of
spare parts. Our products and services may be adversely
affected by the quality control of these third-party suppliers and service
providers, or by their inability to ship product, manage our product
inventory, or meet delivery deadlines. Failure of these
third-party suppliers and service providers in any of these respects may
negatively affect our revenue and customer
relationships. Furthermore, these suppliers and service
providers may have access to our IP, which may increase the risk of
infringement or misappropriation.
|
|
·
|
Our failure
to expand our IP portfolio could adversely affect the growth of our
business and results of operations. Expansion of our IP
portfolio is one of the available methods of growing our revenues and
our profits. This involves a complex and costly set of
activities with uncertain outcomes. Our ability to obtain
patents and other IP can be adversely affected by insufficient
inventiveness of our employees, by changes in IP laws, treaties, and
regulations, and by judicial and administrative interpretations of
those laws treaties and regulations. Our ability to expand our
IP portfolio could also be adversely affected by the lack of valuable IP
for sale or license at affordable prices. There is no assurance
that we will be able to obtain valuable IP in the jurisdictions where we
and our competitors operate or that we will be able to use or license that
IP or that we will be able to generate meaningful royalty revenue or
profits from our IP.
|
|
·
|
Our
inability to successfully defend or enforce our intellectual
property rights could adversely affect the growth of our business and
results of operations. To protect our IP
portfolio, we may be required to initiate patent infringement lawsuits. IP
infringement lawsuits are complex proceedings, and the results are very
difficult to predict. There is no assurance that we will prevail in all or
any of these cases or that we will achieve the desired outcome in terms of
injunctive relief or damages or that the other parties will be able to pay
the damages awarded. Adverse results in such lawsuits could give
competitors the legal right to compete with us and with our licensees
using technology that is similar to or the same as ours. Adverse outcomes
in IP lawsuits could also reduce our royalty revenues. In some
periods, IP litigation recoveries and expenses could result in large
fluctuations from prior periods, increase the volatility of our financial
results or have a material adverse impact on our operating profits,
results of earnings or earnings per
share.
|
Since our
business strategy includes global expansion, we are operating in developing
countries where the institutional structures for creating and enforcing IP
rights are very new or non-existent and where government agencies, courts and
market participants have little experience with IP rights. There is no assurance
that we will be able to protect our technology in such countries because we may
not be able to enforce IP rights in those jurisdictions and alternative methods
of protecting our IP rights may not be effective. Our inability to prevent
competitors in these developing markets from misappropriating our technology
could materially and adversely affect our sales, revenues and results of
operations.
17
|
ITEM
1A.
|
RISK
FACTORS (Continued)
|
|
·
|
Our
inability to successfully defend ourselves from the intellectual property
infringement claims of others could have an adverse affect on the growth
of our business and results of operations. Our
competitors, our potential competitors and other companies may have IP
rights covering products and services similar to those we market and sell.
These firms may try to use their IP right to prevent us from selling some
of our products, to collect royalties from us, or to deter us from
enforcing our IP rights against them. Those efforts may include
infringement lawsuits against us or our customers. These
lawsuits are complex proceedings with uncertain outcomes. There is no
assurance that we or our customers will prevail in any IP lawsuits
initiated by third parties. If the results of such litigation
are adverse to us or our customers, we could be enjoined from selling and
our customers could be enjoined from using our products or services and
ordered to pay for past damages. We might also be required to pay future
royalties or be forced to incur the cost of designing around the third
party’s IP. In some periods, IP litigation expenses could
result in large fluctuations from prior periods. Any of these events could
increase the volatility of our financial results or have a material
adverse effect on our sales, revenues, operating profits, results of
operations or earnings per share.
|
|
·
|
Our
effective tax rate is impacted by a number of factors that could have a
material impact on our financial results and could increase the volatility
of those results. Due to the global nature of our business, we are
subject to national and local taxation in many different countries, and we
file a significant number of tax returns that are subject to audit by the
tax authorities in those countries. Tax audits are often complex and may
require several years to resolve. There is no assurance that all or any of
these tax audits will be resolved in our favor. In addition,
under applicable accounting rules, the value that we report for our
deferred tax assets reflects our estimate for these assets, net of those
that we believe are more likely than not to expire before being
utilized. Our financial results may include favorable or
unfavorable adjustments to our estimated tax liabilities or deferred tax
assets in the periods when the tax assessments are made or resolved or
when statutes of limitations on the tax assessments or tax attributes
expire. The outcome of these tax assessments or estimates could have a
material positive or negative impact on our earnings and increase the
volatility of our earnings relative to prior periods. In some
jurisdictions, favorable tax rates are subject to our compliance with
agreements we have reached with the relevant government
agencies. If we are unable to meet the requirements of those
agreements, the tax rate in that jurisdiction might change in an
unfavorable manner and could have a material adverse impact on our
effective tax rate and our financial
results.
|
|
·
|
Global
regulation and regulatory compliance, including environmental,
technological and standards setting regulations, may limit our sales or
increase our costs, which could adversely impact our revenues and results
of operations. We are subject to domestic and international
technical and environmental standards and regulations that govern or
influence the design, components or operation of our products. Such
standards and regulations may also require us to pay for specified
collection, recycling, treatment and disposal of past and future covered
products. Our ability to sell AIDC products in a given country and the
gross margins on products sold in a given country could be affected by
such regulations. We are also subject to self-imposed standards setting
activities sponsored by organizations such as ISO, AIM, IEEE and EPCglobal
that provide our customers with the ability to seamlessly use our products
with products from other AIDC vendors, which our customers
demand. Changes in standards and regulations may be introduced
at any time and with little or no time to bring products into compliance
with the revised technical standard or regulation. Standards and
regulations may:
|
|
·
|
prevent
us from selling one or more of our products in a particular
country;
|
|
·
|
increase
our cost of supplying our products by requiring us to redesign existing
products or to use more expensive designs or
components;
|
|
·
|
require
us to obtain services or create infrastructure in a particular country to
address collection, recycling and similar obligations;
or
|
|
·
|
require
us to license our patents on a royalty free basis and prevent us from
seeking damages and injunctive relief for patent
infringements.
|
In these
cases, we may experience unexpected disruptions in our ability to supply
customers with our products or may have to incur unexpected costs to bring our
products into compliance. Due to these uncertainties and compliance
burdens, our customers may postpone or cancel purchases of our
products. As a result, global regulation and compliance could have an
adverse effect on our revenues, gross profit margins and results of operations
and increase the volatility of our financial results.
18
|
ITEM
1A.
|
RISK
FACTORS (Continued)
|
|
·
|
Our
business may be adversely affected if we are unable to attract and retain
skilled managers and employees. Competition for skilled employees is high in
our industry, and we must remain competitive in terms of compensation and
other employee benefits to retain key employees. If we are
unsuccessful in hiring and retaining skilled managers and employees, we
will be unable to maintain and expand our
business.
|
|
ITEM
1B.
|
UNRESOLVED
STAFF COMMENTS
|
19
|
ITEM
2.
|
PROPERTIES
|
Our executive offices are located at 6001 36th Avenue
West, Everett, Washington. Our continuing operations have an aggregate floor
area of approximately 892,413 square feet, of which 645,736 square feet, or 72%,
are located in the United States, and 246,677 square feet, or 28%, are located
outside the United States, primarily in the Netherlands, France, Spain, Germany
and Canada.
Approximately
92,000 square feet, or 10%, of our principal plant, office and commercial floor
area associated with continuing operations, is owned by us, and the balance is
held under lease.
The U.S.
plants and offices associated with our continuing operations are located in the
following states (in square feet):
|
Washington
|
312,000 | |||
|
Ohio
|
97,483 | |||
|
Iowa
|
184,927 | |||
|
Other
states
|
51,326 | |||
|
Total
|
645,736 |
The
above-mentioned facilities are in satisfactory condition and suitable for the
particular purposes for which they were acquired, constructed or leased and are
adequate for present operations.
The
foregoing information excludes the following properties:
|
|
● Plants
or offices that, when added to all other of our plants and offices in the
same city, have a total floor area of less than 10,000 square
feet.
|
|
|
● Facilities
held under lease that we are subleasing to third parties, comprising
26,000 square feet in New Mexico.
|
|
|
● Various
properties we own that are not used for operations are classified as other
assets as of December 31, 2009. These properties total 1.6 million square
feet and include 1.3 million square feet, located in Ohio, and
251,000 square feet, located in
Illinois.
|
|
|
● Approximately
312,000 square feet held under lease, previously used in a discontinued
business located in Michigan.
|
ITEM
3. LEGAL PROCEEDINGS
We currently, and from time to time, are
involved in claims, lawsuits and other proceedings, including, but not limited
to, IP, commercial, and employment matters, which arise in the ordinary course
of business. We do not expect the ultimate resolution of currently pending
matters to be material in relation to our business, financial condition, results
of operations or liquidity.
|
ITEM
4.
|
SUBMISSION
OF MATTERS TO A VOTE OF SECURITY
HOLDERS
|
No matters were submitted to a vote of
security holders, through the solicitation of proxies or otherwise, during
the quarter ended December 31, 2009.
20
PART II
|
MARKET
FOR THE REGISTRANT’S COMMON EQUITY, RELATED SHAREHOLDER MATTERS AND ISSUER
PURCHASES OF EQUITY SECURITIES
|
The high and low sales prices of our common stock, by
quarter, in the years ended December 31, 2009 and 2008, are as
follows:
|
Year
Ended December 31,
|
||||||||||||||||
|
2009
|
2008
|
|||||||||||||||
|
High
|
Low
|
High
|
Low
|
|||||||||||||
|
First
Quarter
|
$ | 14.50 | $ | 8.68 | $ | 24.86 | $ | 17.53 | ||||||||
|
Second
Quarter
|
12.80 | 9.98 | 24.96 | 19.56 | ||||||||||||
|
Third
Quarter
|
15.64 | 12.02 | 23.00 | 15.09 | ||||||||||||
|
Fourth
Quarter
|
15.16 | 10.36 | 19.65 | 9.29 | ||||||||||||
Our
common stock is traded on the New York Stock Exchange under the symbol IN. As of
February 3,
2010, there were approximately 10,055 holders of record and 17,773
beneficial owners of our common stock. No cash dividends were paid during 2009
or 2008.
No shares
of common stock were repurchased in the fourth quarter of 2009.
21
|
ITEM
5.
|
MARKET
FOR THE REGISTRANT’S COMMON EQUITY, RELATED SHAREHOLDER MATTERS AND ISSUER
PURCHASES OF EQUITY SECURITIES
(Continued)
|
STOCK PERFORMANCE GRAPH
Set forth
below is a line graph comparing the percentage change in the cumulative total
shareholder return on our common stock for the five-year period ended December
31, 2009, with the cumulative total return for the same period of the Standard
& Poor’s Midcap 400 Index and the Standard & Poor’s 1500 Electronic
Equipment and Instruments index. The graph assumes an investment of $100 at the
beginning of the period in our common stock, in the S&P Midcap 400 Index and
in the companies included in the Standard & Poor’s 1500 Electronic Equipment
and Instruments index. Total shareholder return was calculated on the basis that
in each case all dividends were reinvested. The stock price performance shown in
the graph is not necessarily indicative of future price
performance.
| 12/04 | 12/05 | 12/06 | 12/07 | 12/08 | 12/09 | |||||||||||||||||||
|
Intermec,
Inc
|
100 | 133.65 | 95.97 | 80.31 | 52.51 | 50.85 | ||||||||||||||||||
|
S&P
Midcap 400
|
100 | 112.55 | 124.17 | 134.08 | 85.5 | 117.46 | ||||||||||||||||||
|
S&P
1500 Electronic Equipment & Instruments
|
100 | 123.47 | 137.28 | 156.26 | 89.64 | 127.23 |
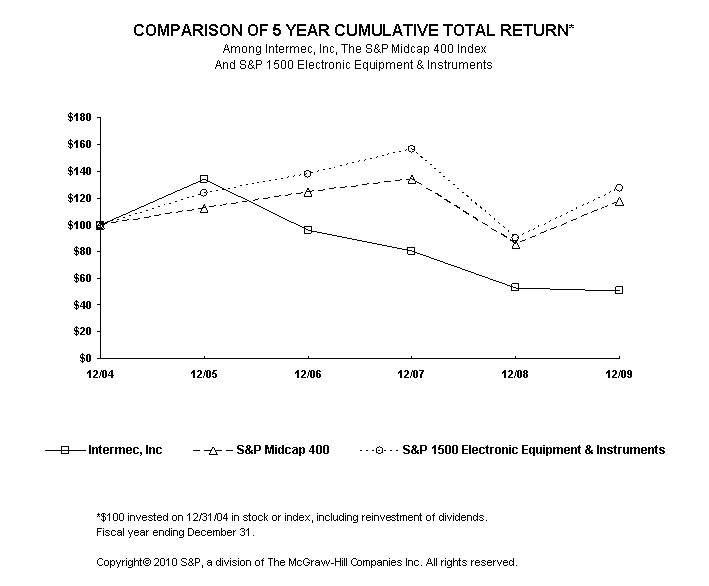
22
|
ITEM
6.
|
SELECTED
FINANCIAL DATA
|
(In
millions, except for per share data)
|
Year
Ended December 31,
|
||||||||||||||||||||
|
2009
|
2008
|
2007
|
2006
|
2005
|
||||||||||||||||
|
Operating
Results:
|
||||||||||||||||||||
|
Revenues
|
$ | 658.2 | $ | 890.9 | $ | 849.2 | $ | 850.0 | $ | 875.5 | ||||||||||
|
Operating
(loss) profit from continuing operations (a)
|
$ | (19.5 | ) | $ | 47.0 | $ | 37.4 | $ | 36.7 | $ | 58.6 | |||||||||
|
(Loss)
earnings from continuing operations
|
(10.8 | ) | 35.7 | 24.4 | 35.0 | 40.7 | ||||||||||||||
|
(Loss)
earnings from discontinued operations
|
(1.0 | ) | - | (1.3 | ) | (3.0 | ) | 21.1 | ||||||||||||
|
Net
(loss) earnings
|
$ | (11.8 | ) | $ | 35.7 | $ | 23.1 | $ | 32.0 | $ | 61.8 | |||||||||
|
Basic
(loss) earnings per share
|
||||||||||||||||||||
|
Continuing
operations
|
$ | (0.17 | ) | $ | 0.58 | $ | 0.40 | $ | 0.56 | $ | 0.66 | |||||||||
|
Discontinued
operations
|
(0.02 | ) | - | (0.02 | ) | (0.05 | ) | 0.34 | ||||||||||||
|
Net
(loss) earnings per share
|
$ | (0.19 | ) | $ | 0.58 | $ | 0.38 | $ | 0.51 | $ | 1.00 | |||||||||
|
Diluted
(loss) earnings per share
|
||||||||||||||||||||
|
Continuing
operations
|
$ | (0.17 | ) | $ | 0.58 | $ | 0.40 | $ | 0.55 | $ | 0.64 | |||||||||
|
Discontinued
operations
|
(0.02 | ) | - | (0.02 | ) | (0.05 | ) | 0.34 | ||||||||||||
|
Net
(loss) earnings per share
|
$ | (0.19 | ) | $ | 0.58 | $ | 0.38 | $ | 0.50 | $ | 0.98 | |||||||||
|
(In
thousands)
|
||||||||||||||||||||
|
Shares
used for basis (loss) earnings per share
|
61,644 | 61,183 | 60,359 | 62,535 | 61,785 | |||||||||||||||
|
Shares
used for diluted (loss) earnings per share
|
61,644 | 61,658 | 61,163 | 63,830 | 63,350 | |||||||||||||||
|
Financial
Position (at end of year):
|
||||||||||||||||||||
|
Total
assets
|
$ | 771.4 | $ | 789.9 | $ | 900.6 | $ | 810.3 | $ | 902.7 | ||||||||||
|
Working
capital
|
$ | 352.3 | $ | 371.4 | $ | 323.5 | $ | 350.2 | $ | 440.4 | ||||||||||
|
Current
ratio
|
3.2 | 3.1 | 2.0 | 3.0 | 3.0 | |||||||||||||||
_______
(a) Includes restructuring charges of $20.6 million in 2009, $5.7 million in 2008 and $11.6 million in 2006. Also includes pre-tax gains on IP settlements of $16.5 million in 2006.
(a) Includes restructuring charges of $20.6 million in 2009, $5.7 million in 2008 and $11.6 million in 2006. Also includes pre-tax gains on IP settlements of $16.5 million in 2006.
The
following discussion should be read in conjunction with the Consolidated
Financial Statements and the notes thereto that are incorporated by reference
from Item 8 of this annual report on Form 10-K.
Overview
Intermec
designs, develops, integrates, sells, resells and services wired and wireless
automated identification and data collection (“AIDC”) products and provides
related services. Our products include mobile computing products, bar code
scanners, wired and wireless bar code printers and label media products and
radio frequency identification (“RFID”) products. These products and services
allow customers to identify, track and manage their assets and other resources
in ways that improve the efficiency and effectiveness of their business
operations. Our products are designed to withstand mobile use and rugged
warehouse and field conditions. These are our continuing
operations.
The key
element of our strategy is to provide rugged mobile business solutions that help
our customers improve their visibility and control of their businesses and, in
the process, lower their costs, increase their revenues and improve customer
satisfaction and loyalty. These business solutions are a
collaborative effort between Intermec and our channel partners. In
the pursuit of this strategy, we target high growth opportunities in selected
application markets; focus on developing and selling differentiated new products
and services; emphasize sales through multi-tiered channel arrangements; and
continue the evolution of our supply chain and other initiatives to enhance the
efficiency of our global operations.
Our
reportable segments comprise products and services. The product segment
generates revenue from the design, development, manufacture, sale and resale of
wired and wireless AIDC products, mobile computing products, wired and wireless
bar code printers, label media and RFID products and license fees. We sell
products worldwide for field mobility applications, including asset
management, direct store delivery, maintenance and repair, in-transit
visibility, and routing and navigation, as well as in-premise applications,
including asset management, freight yard operations, inventory management,
warehouse operations, and work-in-process management. Our service segment
generates revenue from customer support, product maintenance and professional
services related to the products and to systems integration.
The
unfavorable global economy adversely affected our business and revenue in fiscal
2009 as customers cut back on spending. To mitigate the impact on our
business due to the economic downturn, we implemented various cost containment
programs in 2009, including adjustments to our cost structure. As a result of
these programs, we reached our objective of lowering annualized break-even point
in the third and fourth quarters of 2009 and achieving profitability
exiting 2009. At the same time that we were reducing expenses, we remained
focused on new products launches and channel expansion.
Our
financial reporting currency is the U.S. Dollar, and changes in exchange
rates can significantly affect our financial trends and reported
results. Our consolidated revenues and operating expenses are
vulnerable to the fluctuations of foreign exchange rates; however, our cost of
revenues is primarily denominated in U.S. dollars, and therefore, is less
affected by changes in foreign exchange rates. If the U.S. Dollar weakens
year-over-year relative to currencies in our international locations, our
consolidated revenues, costs of revenues and operating expenses will be higher
than if currencies had remained constant. If the U.S. Dollar strengthens
year-over-year relative to currencies in our international locations, our
consolidated revenues, costs of revenues and operating expenses will be lower
than if currencies had remained constant. We believe it is important to evaluate
our operating results and growth rates before and after the effect of foreign
currency changes.
In 2005,
we divested businesses unrelated to our continuing operations. The
divested businesses are our discontinued operations. Please refer to
Note A to our consolidated financial statements.
24
|
ITEM
7.
|
MANAGEMENT’S
DISCUSSION AND ANALYSIS OF FINANCIAL CONDITION AND RESULTS OF OPERATIONS
(Continued)
|
Results
of Operations
The
following discussion compares our historical results of operations for the years
ended December 31, 2009, 2008 and 2007.
The
results of operations and percentage of revenues were as follows (in millions,
except for per share data):
|
Year
Ended December 31,
|
||||||||||||||||||||||||
|
2009
|
2008
|
2007
|
||||||||||||||||||||||
|
Amounts
|
Percent
of Revenues
|
Amounts
|
Percent
of Revenues
|
Amounts
|
Percent
of Revenues
|
|||||||||||||||||||
|
Revenues
|
$ | 658.2 | $ | 890.9 | $ | 849.2 | ||||||||||||||||||
|
Costs
and expenses:
|
||||||||||||||||||||||||
|
Cost
of revenues
|
409.6 | 62.2 | % | 536.1 | 60.2 | % | 522.4 | 61.5 | % | |||||||||||||||
|
Research
and development
|
59.6 | 9.1 | % | 67.9 | 7.6 | % | 68.7 | 8.1 | % | |||||||||||||||
|
Selling,
general and administrative
|
187.8 | 28.5 | % | 233.1 | 26.2 | % | 220.7 | 26.0 | % | |||||||||||||||
|
Flood
related charge
|
- | - | 1.1 | 0.1 | % | - | - | |||||||||||||||||
|
Restructuring
charge
|
20.6 | 3.1 | % | 5.7 | 0.7 | % | - | - | ||||||||||||||||
|
Total
costs and expenses
|
677.6 | 102.9 | % | 843.9 | 94.7 | % | 811.8 | 95.6 | % | |||||||||||||||
|
Operating
(loss) profit from continuing operations
|
(19.4 | ) | (2.9 | %) | 47.0 | 5.3 | % | 37.4 | 4.4 | % | ||||||||||||||
|
Interest,
net
|
0.3 | 0.0 | % | 2.3 | 0.3 | % | 1.8 | 0.2 | % | |||||||||||||||
|
(Loss)
earnings from continuing operations before income taxes
|
(19.1 | ) | (2.9 | %) | 49.3 | 5.5 | % | 39.2 | 4.6 | % | ||||||||||||||
|
Income
tax (benefit) expense
|
(8.3 | ) | (1.3 | %) | 13.6 | 1.5 | % | 14.8 | 1.8 | % | ||||||||||||||
|
(Loss)
earnings from continuing operations, net of tax
|
(10.8 | ) | (1.6 | %) | 35.7 | 4.0 | % | 24.4 | 2.9 | % | ||||||||||||||
|
Loss
from discontinued operations, net of tax
|
(1.0 | ) | (0.2 | %) | - | - | (1.3 | ) | (0.2 | %) | ||||||||||||||
|
Net
(loss) earnings
|
$ | (11.8 | ) | (1.8 | %) | 35.7 | 4.0 | % | $ | 23.1 | 2.7 | % | ||||||||||||
|
Basic
(loss) earnings per share:
|
||||||||||||||||||||||||
|
Continuing
operations
|
$ | (0.17 | ) | $ | 0.58 | $ | 0.40 | |||||||||||||||||
|
Discontinued
operations
|
(0.02 | ) | - | (0.02 | ) | |||||||||||||||||||
|
Net
(loss) earnings per share
|
$ | (0.19 | ) | $ | 0.58 | $ | 0.38 | |||||||||||||||||
|
Diluted
(loss) earnings per share:
|
||||||||||||||||||||||||
|
Continuing
operations
|
$ | (0.17 | ) | $ | 0.58 | $ | 0.40 | |||||||||||||||||
|
Discontinued
operations
|
(0.02 | ) | - | (0.02 | ) | |||||||||||||||||||
|
Net
(loss) earnings per share
|
$ | (0.19 | ) | $ | 0.58 | $ | 0.38 | |||||||||||||||||
25
|
ITEM
7.
|
MANAGEMENT’S
DISCUSSION AND ANALYSIS OF FINANCIAL CONDITION AND RESULTS OF OPERATIONS
(Continued)
|
Revenues
Revenues
by category and as a percentage of total revenues from continuing operations for
the years ended December 31, 2009, 2008 and 2007, as well as the
year-over-year product and service revenue changes were as follows (in
millions):
|
Year
Ended December 31,
|
||||||||||||||||||||||||
|
2009
|
2008
|
2007
|
||||||||||||||||||||||
|
Amount
|
Percent
of Revenues
|
Amount
|
Percent
of Revenues
|
Amount
|
Percent
of Revenues
|
|||||||||||||||||||
|
Revenues
by category:
|
||||||||||||||||||||||||
|
Systems
and solutions
|
$ | 368.2 | 55.9 | % | $ | 542.1 | 60.8 | % | $ | 485.6 | 57.2 | % | ||||||||||||
|
Printer
and media
|
151.4 | 23.0 | % | 196.3 | 22.0 | % | 206.4 | 24.3 | % | |||||||||||||||
|
Total
product
|
519.6 | 78.9 | % | 738.4 | 82.8 | % | 692.0 | 81.5 | % | |||||||||||||||
|
Service
|
138.6 | 21.1 | % | 152.5 | 17.2 | % | 157.2 | 18.5 | % | |||||||||||||||
|
Total
revenues
|
$ | 658.2 | 100.0 | % | $ | 890.9 | 100.0 | % | $ | 849.2 | 100.0 | % | ||||||||||||
| 2009 v. 2008 | 2008 v. 2007 | |||||||||||||||||||||||
|
Product
and service revenue change:
|
Amount
|
Percent
|
Amount
|
Percent
|
||||||||||||||||||||
|
Systems
and solutions
|
$ | (173.9 | ) | (32.1 | %) | $ | 56.5 | 11.6 | % | |||||||||||||||
|
Printer
and media
|
(44.9 | ) | (22.9 | %) | (10.1 | ) | (4.9 | %) | ||||||||||||||||
|
Total
product
|
(218.8 | ) | (29.6 | %) | 46.4 | 6.7 | % | |||||||||||||||||
|
Service
|
(13.9 | ) | (9.1 | %) | (4.7 | ) | (3.0 | %) | ||||||||||||||||
|
Total revenues
|
$ | (232.7 | ) | (26.1 | %) | $ | 41.7 | 4.9 | % | |||||||||||||||
Revenues by geographic region and as a percentage of related revenues from continuing operations for the years ended December 31, 2009, 2008 and 2007, as well as the year-over-year geographic region revenue changes were as follows (in millions):
|
Year
Ended December 31,
|
||||||||||||||||||||||||
|
2009
|
2008
|
2007
|
||||||||||||||||||||||
|
Amount
|
Percent
of Revenues
|
Amount
|
Percent
of Revenues
|
Amount
|
Percent
of Revenues
|
|||||||||||||||||||
|
Revenues
by geographic region:
|
||||||||||||||||||||||||
|
North
America
|
$ | 373.2 | 56.7 | % | $ | 492.8 | 55.3 | % | $ | 422.9 | 49.8 | % | ||||||||||||
|
Europe,
Middle East and Africa (EMEA)
|
186.8 | 28.4 | % | 290.4 | 32.6 | % | 290.6 | 34.2 | % | |||||||||||||||
|
All
others
|
98.2 | 14.9 | % | 107.7 | 12.1 | % | 135.7 | 16.0 | % | |||||||||||||||
|
Total
revenues
|
$ | 658.2 | 100.0 | % | $ | 890.9 | 100.0 | % | $ | 849.2 | 100.0 | % | ||||||||||||
| 2009 v. 2008 | 2008 v. 2007 | |||||||||||||||||||||||
|
Geographic
region revenue change:
|
Amount
|
Percent
|
Amount
|
Percent
|
||||||||||||||||||||
|
North
America
|
$ | (119.6 | ) | (24.3 | %) | $ | 69.9 | 16.5 | % | |||||||||||||||
|
Europe,
Middle East and Africa (EMEA)
|
(103.6 | ) | (35.7 | %) | (0.2 | ) | 0.0 | % | ||||||||||||||||
|
All
others
|
(9.5 | ) | (8.8 | %) | (28.0 | ) | (20.6 | %) | ||||||||||||||||
|
Total revenues
|
$ | (232.7 | ) | (26.1 | %) | $ | 41.7 | 4.9 | % | |||||||||||||||
26
|
ITEM
7.
|
MANAGEMENT’S
DISCUSSION AND ANALYSIS OF FINANCIAL CONDITION AND RESULTS OF OPERATIONS
(Continued)
|
Revenues
declined across all of our product lines and geographic regions in 2009
primarily driven by reduced product volumes due to the global economic downturn.
The unfavorable impact of foreign currency exchange rates on total revenues was
$18.3 million in 2009, or 2 percentage points, as compared to 2008.
The
decrease in product revenues from 2008 to 2009 consisted of a decrease in system
and solutions revenues of $173.9 million and a decrease in printer and media
revenues of $44.9 million. The decline in system and solutions revenues from
2008 to 2009 was primarily attributable to reduced product sales in North
American market of $82.5 million, or 47.4%, and in the European market of $75.0
million, or 43.1%, as customers cut back on capital spending. Sales for printer
and media products followed a similar trend in 2009, with North American market
accounting for $22.6 million, or 50.3%, and European market accounting for $21.3
million, or 47.4%, of the total decrease in printer and media revenues as
compared with 2008.
The
decrease in service revenues was primarily from North American and European
markets, which corresponded to lower product volumes in these markets in 2009 as
compared with 2008.
Geographically,
product and service revenues decreased in all regions, with the largest declines
in North American and EMEA in 2009 as compared with 2008. The changes in foreign
currency conversion rates unfavorably impacted EMEA revenue by $16.1 million in
2009, or 6 percentage points, as compared to 2008. Additionally, 2008 revenues
in EMEA included a European enterprise postal
deployment, which was not repeated in 2009 and accounted for 6
percentage points of the decline in the EMEA region from 2008 to 2009. The lower
product revenues in Latin America accounted for approximately 68% of total
revenue decrease in the Rest of the World (“ROW”).
Product
revenues in 2008 increased $46.4 million, or 6.7%, compared to 2007. The
growth in our 2008 product revenue was driven by system and solutions revenues,
which increased $56.5 million, or 11.6%, in 2008 as compared to 2007. This
increase resulted from North America systems and solutions revenue growth as a
result of larger direct accounts, sales to the U.S. Government Department of
Defense and higher revenue through our distribution partners. The increase in
revenues from systems and solutions in 2008 was offset by a $10.1 million, or
4.9%, decline in our printer and media revenue for the comparable periods. The
decrease in printer and media revenue in 2008 was primarily related to less
revenue in Latin America, which had a number of large direct accounts that
included significant printer revenue in 2007. Product revenues in Europe, the
Middle East and Africa (EMEA) were flat in 2008 compared to 2007, which includes
approximately $8.4 million from favorable changes in currency exchange rates in
2008 compared to 2007. Product revenue in the ROW decreased 23%, primarily due
to lower product revenue in Latin America, which had a number of large direct
accounts in 2007.
Service
revenues of $152.5 million for 2008 were down $4.7 million, or 3.0%, compared to
2007. We experienced higher 2008 service revenue in EMEA, which was more than
offset by lower service revenue in North America and Latin America in 2008
compared to 2007. The decrease in North America service revenues from 2007 to
2008 was primarily a result of fewer time-and-material repairs.
Geographically,
for the year ended December 31, 2008, product and service revenues increased in
North America by 16.5%, while EMEA remained flat and ROW decreased 20.6% as
compared to 2007. The growth in North America revenue in 2008 was primarily
attributable to strong system and solutions revenue. The revenue decrease in ROW
in 2008 was primarily attributable to lower product revenue in Latin America,
which had a number of sales to large direct accounts in 2007.
27
|
ITEM
7.
|
MANAGEMENT’S
DISCUSSION AND ANALYSIS OF FINANCIAL CONDITION AND RESULTS OF OPERATIONS
(Continued)
|
Gross
Profit
Gross
profit and gross margin by revenue category for the years ended
December 31, 2009, 2008 and 2007, were as follows (in
millions):
|
Year
Ended December 31,
|
||||||||||||||||||||||||
|
2009
|
2008
|
2007
|
||||||||||||||||||||||
|
Gross
Profit
|
Gross
Margin
|
Gross
Profit
|
Gross
Margin
|
Gross
Profit
|
Gross
Margin
|
|||||||||||||||||||
|
Product
|
$ | 188.5 | 36.3 | % | $ | 290.2 | 39.3 | % | $ | 259.9 | 37.6 | % | ||||||||||||
|
Service
|
60.1 | 43.3 | % | 64.6 | 42.4 | % | 67.0 | 42.6 | % | |||||||||||||||
|
Total
gross profit and gross margin
|
$ | 248.6 | 37.8 | % | $ | 354.8 | 39.8 | % | $ | 326.9 | 38.5 | % | ||||||||||||
The total gross profit in 2009 decreased by $106.2 million and the total gross margin decreased by 200 basis points compared to 2008. The decrease in total gross margin in 2009 was primarily due to a decrease in product gross margin, partially offset by an increase in service gross margin. The decrease in total gross profit was primarily due to a $101.7 million decrease in product gross profit, which was driven by reduced product volumes, less favorable product and geographic related mix, the unfavorable impact of currency translation and competitive pricing. The decrease in product gross margin in 2009 was primarily attributable to reduced product volumes, less favorable product and geographic related mix, the unfavorable impact of currency translation and competitive pricing.
The
increase in service gross margin was mainly attributable to the reduced service
costs from the U.S. service depot consolidation program implemented in the third
quarter of 2008, and ongoing cost management.
Total
gross profit for the year ended December 31, 2008, increased $27.9 million, or
8.5%, compared to 2007. That increase in total gross profit was primarily due to
the 6.7% increase in product revenue, combined with a 170 basis point
improvement in the related gross margin as compared with 2007. The increase in
product gross margins in 2008 was primarily a result of a higher proportion of
our product revenue from systems and solutions, the favorable impact from
foreign exchange rate movements, component cost reductions and higher capacity
utilization related to the revenue growth. Service gross profit decreased by
$2.4 million, or 3.6%, in 2008 compared to 2007 due primarily to the 3.0%
decrease in related revenue.
Research
and Development Expense, net (In millions)
|
Year
Ended December 31,
|
||||||||||||||||||||
|
2009
|
2008
|
2007
|
||||||||||||||||||
|
Amount
|
Change
from prior year
|
Amount
|
Change
from prior year
|
Amount
|
||||||||||||||||
|
Research
and development expense, net
|
$ | 59.6 | $ | (8.3 | ) | $ | 67.9 | $ | (0.8 | ) | $ | 68.7 | ||||||||
Research and development (“R&D”) expense decreased $8.3 million, or 12.2%, in 2009, compared to 2008. The decrease in R&D expense was primarily driven by various cost reduction programs we implemented in 2009, including labor-related savings of $6.1 million. Additionally, included in 2009 R&D expense were $2.6 million in credits from U.S. and foreign governments relating to reimbursement of certain R&D expenses. R&D expense accounted for 9.1% of revenues in 2009, compared to 7.6% and 8.1% of revenues in 2008 and 2007, respectively. R&D expense decreased in absolute dollars in 2009, while R&D expense as a percentage of total revenues increased in 2009, reflecting our continued focus on product development and product releases.
R&D
expense decreased $0.8 million in 2008 compared to 2007. This decrease in
R&D expense resulted from a $1.8 million credit recorded for the
reimbursement of certain R&D expenses under a foreign grant program that
we received during 2008.
28
|
ITEM 7.
|
MANAGEMENT’S DISCUSSION AND
ANALYSIS OF FINANCIAL CONDITION AND RESULTS OF OPERATIONS
(Continued)
|
Selling,
General and Administrative Expense (In millions)
|
Year
Ended December 31,
|
||||||||||||||||||||
|
2009
|
2008
|
2007
|
||||||||||||||||||
|
Amount
|
Change
from prior year
|
Amount
|
Change
from prior year
|
Amount
|
||||||||||||||||
|
Selling,
general and administrative expense
|
$ | 187.9 | $ | (45.1 | ) | $ | 233.0 | $ | 12.3 | $ | 220.7 | |||||||||
Selling, general and administrative expense (“SG&A”) decreased $45.1 million, or 19.4%, in 2009, compared to 2008. The decrease in SG&A expense reflected various cost reduction programs we implemented in 2009. Labor-related savings was approximately $29.3 million, accounting for 65% of the total decrease in SG&A expense in 2009. Foreign exchange fluctuations in 2009 had a favorable impact on our SG&A expense by $2.3 million. Substantially all of the remaining decrease in SG&A was attributable to a reduction in indirect and discretionary spending.
The
increase in SG&A expense in 2008 of $12.3 million compared to 2007 was
primarily attributable to a $4.1 million increase for information systems
expense, primarily resulting from higher depreciation expense and consulting
costs, as a result of our ERP upgrade, a $3.2 million increase due to the impact
of international costs translated to U.S. dollars at less favorable average
exchange rates during 2008, a $3.2 million increase in foreign exchange contract
and re-measurement losses, and higher labor costs.
Flood
Related Charges
In June
2008, our Cedar Rapids, Iowa facilities were flooded, and we incurred damages to
both a facility that we own and one that we lease. A portion of these damages
was covered by insurance. While the flood caused extensive damage, we were able
to redirect the work performed by our Cedar Rapids groups to temporary locations
and avoided significant interruptions of our business. For the year ended
December 31, 2008, we had $5.1 million in clean up costs and property damages
that were partially offset by $4.0 million of insurance proceeds for a
net charge of $1.1 million.
Restructuring
Costs
2009
Restructuring Charges:
In
January 2009, we committed to a business restructuring plan intended to
reorganize our sales function, reduce our operating cost structure and improve
efficiency. The total restructuring costs for this plan are expected to be
approximately $9.8 million, including employee termination costs of
approximately $8.4 million, and $1.4 million of other transitional costs. We
recorded $9.5 million of the restructuring charge in 2009, and the
remainder will be recorded through 2010. We anticipate that substantially all of
the severance related and periodic transitional costs will be cash expenditures.
We expect to achieve an annual labor-related savings of $14.0 to $16.0 million
upon completion of this restructuring plan.
In April
2009, we committed to a business restructuring plan primarily consisting of a
reduction of our work force. At the time we adopted this plan, we estimated that
the total restructuring costs would be in a pre-tax range of $15.0 to $17.0
million. Due to a very successful operational and expense management, we were
able to reduce the number of positions impacted by this plan and the related
severance charges in the third quarter of 2009. As a result, we reduced our
estimate of the total restructuring costs of this plan to an anticipated pre-tax
range of $11.0 to $13.0 million, including employee termination costs
of $10.0 to $11.0 million, and $1.0 to $2.0 million of other transitional
costs. We recorded $11.1 million of the restructuring charges in 2009, and
expect to record the remainder through 2010. We anticipate that
substantially all of the severance-related and periodic transitional costs will
be cash expenditures. We expect to achieve annualized labor-related savings of
$17.0 to $19.0 million upon completion of this restructuring plan.
29
|
ITEM 7.
|
MANAGEMENT’S DISCUSSION AND
ANALYSIS OF FINANCIAL CONDITION AND RESULTS OF OPERATIONS
(Continued)
|
2008
Restructuring Charges:
In July
2008, we committed to a business restructuring plan intended to reduce our cost
structure and streamline operations, which included the relocation of product
final assembly to a contract manufacturer in Asia, the consolidation of North
American service depot locations and the transfer of on-site repair in North
America to a third party service provider. All severance and other periodic
transitional costs were cash expenditures. All restructuring costs related to
this action were accrued in 2008. The total restructuring charges incurred for
the 2008 restructuring plan were $5.7 million.
We
believe these restructuring actions were appropriate strategically and were
prudent in light of the generally weakened global economy and uncertain market
conditions.
Interest,
net (In millions)
|
Year
Ended December 31,
|
||||||||||||||||||||
|
2009
|
2008
|
2007
|
||||||||||||||||||
|
Amount
|
Change
from prior year
|
Amount
|
Change
from prior year
|
Amount
|
||||||||||||||||
|
Interest,
net
|
$ | 0.3 | $ | (2.0 | ) | $ | 2.3 | $ | 0.5 | $ | 1.8 | |||||||||
The decrease of net interest income of $2.0 million was primarily due to lower average interest rates in 2009, compared to 2008. Interest rates were low during global recession as governments reduced borrowing rates to promote the resumption of sustainable economic growth and to preserve price stability.
Net
interest income for the year ended December 31, 2008, increased $0.5 million
compared 2007 due to the reduction of interest expense as a result of our $100
million debt repayment during March 2008.
Income
Tax (Benefit) Expense (In millions)
|
Year
Ended December 31,
|
||||||||||||||||||||
|
2009
|
2008
|
2007
|
||||||||||||||||||
|
Amount
|
Change
from prior year
|
Amount
|
Change
from prior year
|
Amount
|
||||||||||||||||
|
Income
taxes (benefit) expense
|
$ | (8.3 | ) | $ | (21.9 | ) | $ | 13.6 | $ | (1.2 | ) | $ | 14.8 | |||||||
The tax provision (benefit) for the year ended December 31, 2009, reflects an effective tax rate for continuing operations of (43.2%), compared to a U.S. statutory rate of 35%. In the fourth quarter of 2009, Intermec recognized a US tax settlement benefit of approximately $1.0 million which favorably impacted our rate for the quarter and the year. The effective tax rate for the year exceeded the statutory tax rate primarily due to research tax credit benefits, tax settlements and lower foreign tax rates, which were partially offset by nondeductible incentive stock based compensation.
The tax
provision for the year ended December 31, 2008, reflects an effective tax rate
for continuing operations of 27.6%, compared to a U.S. statutory rate
of 35%. In the fourth quarter of 2008, the provision for income taxes included a
favorable adjustment of $4.0 million as a result of our new manufacturing
structure and future foreign income expectations. During the year, we also
recorded benefits for 2008 research credits and provisions for state taxes
and nondeductible incentive stock based compensation.
In the
normal course of our business, we seek lawful, tax efficient means of managing
our income tax expense. Please refer to Note J to our consolidated financial
statements.
30
|
ITEM
7.
|
MANAGEMENT’S
DISCUSSION AND ANALYSIS OF FINANCIAL CONDITION AND RESULTS OF OPERATIONS
(Continued)
|
Foreign
Currency Transactions and Effect of Foreign Exchange Rates
We are
subject to the effects of currency fluctuations due to the global nature of our
operations. Currency exposures are hedged as part of our global risk management
program, which is designed to minimize short-term exposure to foreign currency
fluctuations. Movements in foreign exchange rates, net of hedging activities,
resulted in net foreign currency transaction losses of $2.2, $2.6 million and
$1.5 million for the years ended December 31, 2009, 2008 and 2007,
respectively. In 2008, $2.1 million was reported in error in foreign currency
transaction loss.
For
fiscal year 2009, our operations derived approximately 42.1% of revenues from
non-U.S. customers. At December 31, 2009, long-lived assets attributable to
countries outside of the U.S. comprised 10% of total long-lived assets. The
largest components of these assets are attributable to Mexico, where we maintain
product repair facilities, followed by France, where we maintain a research and
development center.
Liquidity
and Capital Resources
Our principal sources of liquidity are our cash, cash equivalents and
short-term investments, as well as the cash flow that we generate from our
operations.
Cash
Flow Summary
Our cash
flows were summarized in the following table (in thousands):
|
Year
Ended December 31,
|
||||||||||||
|
2009
|
2008
|
2007
|
||||||||||
|
Net
cash provided by operating activities
|
$ | 21,363 | $ | 70,488 | $ | 56,625 | ||||||
|
Net
cash (used in) provided by investing activities
|
(49,765 | ) | 16,449 | (17,428 | ) | |||||||
|
Net
cash provided by (used in) financing activities
|
2,150 | (91,966 | ) | 12,753 | ||||||||
At December 31, 2009, cash, cash equivalents and short-term investments totaled $238.2 million, an increase of $16.7 million compared to the December 31, 2008, balance of $221.5 million. Our short-term investments consist primarily of low risk securities, including bond funds and time deposits. We invest in these short-term securities mainly to facilitate liquidity and for capital preservation. Due to the nature of these instruments, we consider it reasonable to expect that their fair market values will not be significantly impacted by a change in interest rates, and that they can be liquidated for cash upon demand.
Cash
provided by operating activities consisted of net (loss) earnings adjusted for
non-cash items and the effect of changes in working capital and other
activities. Cash provided by operating activities from continuing operations in
2009 was $21.4 million and consisted of net loss from continuing operations of
$10.9 million, adjustments for non-cash items of $8.8 million and cash provided
by working capital and other activities of $23.5 million. Operating activities
in 2009 provided lower cash flows compared to 2008, primarily due to a net loss
of $11.8 million including discontinued operations and cash payment of $19.0
million for restructuring activities. However, cash provided by working capital
and other activities in 2009 increased by $18.1 million compared to 2008,
primarily due to our efforts in inventory reduction. In 2008, the $70.5
million of cash provided by operating activities of continuing operations was
primarily due to net earnings of $35.7 million and a $53.4 million decrease in
accounts receivable, offset partially by a decrease in accounts payable and
accrued expenses of $25.9 million. In 2007, the $56.6 million of cash provided
by operating activities of continuing operations was primarily due to net
earnings from continuing operations of $24.3 million and a $35.8 million
increase in accounts payable and accrued expenses, offset partially by an
increase in accounts receivable of $25.2 million.
In 2009,
investing activities of continuing operations used $49.8 million of cash
primarily due to our purchase of short-term investments of $35.8 million and
capital expenditures of $11.0 million. In 2008, investing activities of
continuing operations provided $16.4 million of cash primarily due to sale of
investments of $28.5 million and sale of property, plant and equipment of $5.5
million. In 2007, investing activities of continuing operations used $17.4
million of cash primarily due to capital expenditures of $15.8
million.
31
|
ITEM
7.
|
MANAGEMENT’S
DISCUSSION AND ANALYSIS OF FINANCIAL CONDITION AND RESULTS OF OPERATIONS
(Continued)
|
Liquidity and
Capital Resources (continued)
Financing
activities of continuing operations in 2009 provided cash of $2.2 million,
related primarily to the issuance of stock under our Employee Stock Purchase
Plan and exercised stock options. Financing activities of continuing
operations in 2008 used $92.0 million of cash, primarily for the
$100.0 million debt repayment in March of 2008. Financing activities of
continuing operations in 2007 provided $12.8 million primarily due to $8.4
million in proceeds from stock option exercises and $2.1 million in excess tax
benefits from stock-based payment arrangements.
Net cash
provided by investing activities of discontinued operations in 2007 was $20.2
million, related primarily to note receivable maturities.
Capital
Resources
Our
principal capital resources include cash, cash equivalents and short-term
investments. In addition, we have an unsecured Revolving Credit Facility (the
“Revolving Facility”) with a maximum amount available under the Revolving
Facility of $50.0 million. Net of outstanding letters of credit and limitations
on availability, we had borrowing capacity at December 31, 2009, of $48.5
million under the Revolving Facility. We had no borrowings under the Revolving
Facility as of December 31, 2009. As of December 31, 2009, we were in
compliance with the financial covenants of the Revolving Facility. The Revolving
Facility matures in October 2012.
The key
terms of the Revolving Facility are as follows:
|
·
|
Loans
will bear interest at a variable rate equal to (at our option) (i) LIBOR
plus the applicable margin, which ranges from 0.60% to 1.00%, or (ii) the
Bank’s prime rate, less the applicable margin, which ranges from 0.25% to
1.00%. If an event of default occurs and is continuing, then
the interest rate on all obligations under the Revolving Facility may be
increased by 2.0% above the otherwise applicable rate, and the Bank may
declare any outstanding obligations under the Revolving Facility to be
immediately due and payable.
|
|
·
|
A
fee ranging from 0.60% to 1.00% on the maximum amount available to be
drawn under each letter of credit that is issued and outstanding under the
Revolving Facility. The fee on the unused portion of the Revolving
Facility ranges from 0.125% to
0.20%.
|
|
·
|
Certain
of our domestic subsidiaries have guaranteed the Revolving
Facility.
|
|
·
|
The
Revolving Facility contains various restrictions and covenants, including
restrictions on our ability and the ability of our subsidiaries to
consolidate or merge, make acquisitions, create liens, incur additional
indebtedness or dispose of assets.
|
|
·
|
Financial
covenants include a Maximum Leverage test and a Minimum Tangible Net Worth
test, each as defined in the Revolving Facility. The minimum
tangible net worth required is $426,764,000 and the maximum funded
debt to EBITDA allowed is
2.50:1.
|
We
believe that cash, cash equivalents, and short-term investments combined
with projected cash flows from operations will provide adequate funding to
meet our expected working capital, restructuring cost, capital expenditure and
pension contribution requirements for the next twelve months. From
time to time, we may look for potential acquisition
targets for growth opportunities within our market, or to expand into new
markets.
The
business restructuring plan that we committed to in April 2009 reduced our
workforce and resulted in the curtailment of pension benefits to the terminated
employees who were participants in our U.S. pension plans. Additionally, on
December 31, 2009, we announced the decision to amend our pension plans and
freeze the remainder of our U.S. pension plans effective February 28, 2010.
These actions are expected to substantially reduce our future pension benefits
cost. We are not required to make minimum funding for these plans under the
Employee Retirement Income Security Act of 1974 (“ERISA”) or other rules
governing funding of pension plans. However, we may make discretionary
contributions to fund these plans in future years. We anticipate contributing
approximately $4.9 million to our pension plans in 2010.
32
|
ITEM
7.
|
MANAGEMENT’S
DISCUSSION AND ANALYSIS OF FINANCIAL CONDITION AND RESULTS OF OPERATIONS
(Continued)
|
Liquidity and
Capital Resources (continued)
Depending
on our assessment of the economic environment from time-to-time, we may decide
to hold more cash than may be required to fund our future investment in working
capital, capital expenditures and research and development and to
implement changes in our cost structure. Projected cash flows from operations
are largely based on our revenue estimates, cost estimates, and the related
timing of cash receipts and cash disbursements. If actual performance differs
from estimated performance, cash flows from operations could be positively or
negatively impacted.
Contractual
Obligations
The
following table summarizes our significant contractual commitments for
continuing operations as of December 31, 2009 (in millions). The table does
not include amounts recorded on our consolidated balance sheet as current
liabilities.
|
Payments
Due by Period
|
||||||||||||||||||||
|
Total
|
Less
than 1 Year
|
1
- 3 Years
|
3
- 5 Years
|
After
5 Years
|
||||||||||||||||
|
Operating
leases
|
$ | 42.0 | $ | 11.5 | $ | 15.7 | $ | 10.7 | $ | 4.1 | ||||||||||
|
Purchase
commitments
|
14.8 | 0.8 | 14.0 | - | - | |||||||||||||||
|
Pension
and other postretirement cash funding requirements
|
- | - | - | - | - | |||||||||||||||
|
Total contractual obligations
|
$ | 56.8 | $ | 12.3 | $ | 29.7 | $ | 10.7 | $ | 4.1 | ||||||||||
Operating leases are discussed in Note F to our consolidated
financial statements. Pension and other postretirement plans are discussed in
Note K to our consolidated financial statements.
Purchase
orders or contracts for the purchase of finished goods or raw materials or other
goods and services are not included in the table above. We are not able to
determine the aggregate amount of such purchase orders that represent
contractual obligations, as purchase orders may represent authorizations to
purchase rather than binding agreements. Our purchase orders are based on
current manufacturing needs and are fulfilled by vendors within short time
horizons.
We are
not required to provide minimum funding for our pension and other postretirement
benefits plans under ERISA regulations, although we may make future
discretionary contributions to the
extent such contributions are actuarially determined to be required in order to
adequately fund the plans, and to match a portion of the employees’
contribution. See
Note K to our consolidated financial statements for
details.
Our
liability for unrecognized tax benefits of $27.6 million at December 31, 2009,
has been omitted from the table above, because we cannot determine with
certainty when this liability will be settled.
We expect
to fund these contractual obligations with our existing cash, cash equivalents,
short-term investments and cash flows from operations.
Off-Balance
Sheet Arrangements
We are a
party to certain off-balance sheet arrangements including certain
indemnification and reimbursement agreements. For discussion of these
arrangements, see Note L to our consolidated financial statements.
33
|
ITEM
7.
|
MANAGEMENT’S
DISCUSSION AND ANALYSIS OF FINANCIAL CONDITION AND RESULTS OF OPERATIONS
(Continued)
|
Critical
Accounting Policies and Estimates
We
believe that the following critical accounting policies affect our more
significant judgments and estimates used in the preparation of our consolidated
financial statements.
Revenue Recognition.We record revenue, net of excise and sales taxes,
when it is realized, or realizable, and earned. We consider these criteria met
when persuasive evidence of an arrangement exists, delivery has occurred or
services have been rendered, the sales price is fixed or determinable and
collectability is reasonably assured. Royalty revenue is recorded when earned,
the amount due is fixed or determinable and collectability is reasonably
assured.
For
product sales, revenue is recognized when the customer has assumed risk of loss
of the goods sold and all performance obligations are complete. These sales may
contain discounts, price exception, return provision or other customer
incentives. We reduce revenue by providing allowances for estimated customer
returns, price exception and other incentives that occur under sales programs
established by us directly or with our distributors and resellers. The sales
allowances are based on management’s best estimate of the amount of allowances
that the customer will ultimately receive and was based on our historical
experience taking into account the type of products sold and type of customers
involved. We accrue the estimated cost of basic product warranties at the
time we recognize revenue based on historical experience. In addition to basic
product warranties, we frequently offer extended warranties, including renewal,
to our customers in the form of product maintenance services. Our product and
maintenance services are typically separately priced. We defer the stated amount
of the separately priced product maintenance services contracts and recognized
the deferred revenue as services are rendered, generally straight-line over the
contract term.
We
infrequently enter into multiple-element arrangements with our customers,
and these sales may include deliverables such as hardware, software,
professional consulting services and maintenance support services. For
arrangements involving multiple deliverables, where deliverables include
software and non-software products and services, we apply the provisions of
multiple elements accounting to separate the deliverables and allocate the total
arrangement consideration. Each unit of accounting is then accounted for under
the applicable revenue recognition guidance.
We
sell products with embedded software to our customers. The embedded software is
not sold separately, it is not a significant focus of the marketing effort and
we do not provide post-contract customer support specific to the software or
incur significant costs related to creating software products. Additionally, the
functionality that the software provides is marketed as part of the overall
product. The software embedded in the product is incidental to the equipment as
a whole such that software revenue recognition is not generally applicable. In
certain infrequent situations where our solutions contain software that is
more than incidental to the hardware and services, revenue related to the
software and software-related elements is recognized in accordance with software
revenue recognition accounting.
Our customers may request that delivery and passage
of title and risk of loss occur on a bill and hold basis. For these
transactions, we recognize revenue in accordance with guidance specific to bill
and hold transactions. For each of the three years ended December 31, 2009,
the amount from bill and hold transactions approximated less
than 1% of total revenue.
Inventory Obsolescence. The valuation of inventory
requires us to estimate obsolete or excess inventory as well as inventory that
is not of saleable quality. The determination of obsolete or excess inventory
requires us to estimate the future demand for our products and market
conditions. If future demand and market conditions are less favorable than
our assumptions, or there are technology or design changes, additional
inventory write-downs could be required, which would negatively impact our gross
margin. Likewise, favorable future demand and market conditions, and/or
technology or design changes, could positively impact future operating
results if previously written-down inventory is sold. Management continues
to evaluate market and technology conditions and design changes to ensure that
we are adequately reserved.
34
|
ITEM
7.
|
MANAGEMENT’S
DISCUSSION AND ANALYSIS OF FINANCIAL CONDITION AND RESULTS OF OPERATIONS
(Continued)
|
Critical
Accounting Policies and Estimates (Continued)
Income Taxes. We account
for income taxes using the asset and liability approach, which requires the
recognition of deferred tax assets and liabilities for the expected future tax
consequences of temporary differences between the carrying amounts and the tax
bases of assets and liabilities. This method also requires the recognition of
future tax benefits, such as net operating loss carry forwards and other tax
credits. Deferred tax assets and liabilities are measured using enacted tax
rates expected to apply to taxable income in the years in which those temporary
differences are expected to reverse. Valuation allowances are provided to reduce
deferred tax assets to an amount that is more likely than not to be realized. We
consider future market growth, forecasted earnings, future taxable income, and
the mix of earnings in the jurisdictions in which we operate and prudent,
feasible and permissible tax planning strategies in determining the
realizability of deferred tax assets. If we were to determine that we would not
be able to realize a portion of our net deferred tax asset in the future for
which there is currently no valuation allowance, an adjustment to the valuation
allowance would be charged to earnings in the period such determination was
made. Conversely, if we were to make a determination that it is more likely than
not that the deferred tax assets for which there is currently a valuation
allowance would be realized, the related valuation allowance would be reduced
and a benefit to earnings would be recorded.
We
conduct business in various countries throughout the world and are subject to
tax in numerous jurisdictions. As a result of our business activities, we file a
significant number of tax returns that are subject to audit by various tax
authorities. Tax audits are often complex and may require several years to
resolve. We also recognize the largest amount of benefits from uncertain tax
positions that are greater than 50% determined by cumulative probability of
being realized upon ultimate settlement with the tax authority. Such amounts are
based on management’s judgment and best estimate as to the ultimate outcome of
tax audits. However, our future results may include favorable or unfavorable
adjustments to our estimated tax liabilities in the period the assessments are
made or resolved or when statutes of limitation on potential assessments expire.
As a result, our effective tax rate may fluctuate significantly on a quarterly
and annual basis.
Pension and Other Postretirement
Benefits. We have qualified and nonqualified pension plans
that cover some of our employees. Some of these pension plans were
partially frozen in June 2006. Additionally,
on December 30, 2009, we made the decision to fully freeze our U.S. qualified
pension plan, effective February 28, 2010. Our U.S. nonqualified plans were
fully frozen effective December 31, 2009. Annual
employer contributions are made to the extent such contributions are actuarially
determined to be required in order to adequately fund the plans, and to match a
portion of the employees’ contribution. Retiree benefits are based on the amount
of participant contributions over the term of the participant’s
employment.
We
perform an annual measurement of our projected obligations and plan assets or
when major events occurred requiring for remeasurement. These measurements
require several assumptions, the most important of which are the discount rate,
the expected long-term rate of return on plan assets, and health care cost
projections. These assumptions could vary materially from actual results due to
economic events or different rates of retirement, mortality or withdrawal,
positively or negatively affecting our future annual expense and projected
benefit obligation.
The rate
used to discount future cash flows of benefit obligations back to the
measurement date, reflects the market rate for high-quality fixed-income debt
instruments. The discount rates for our domestic and foreign plans as of
December 31, 2009, were 6.04%and 5.32% respectively, compared to 6.24% and
5.80% as of December 31, 2008. The decrease in the discount rate used for
domestic plans reflects lower interest rates in the current market. A one-half
percentage point decrease in our discount rate on pension cost would result in
an increase in benefit obligation of $14.9 million. The expected return on plan
assets is based on the market-related value of assets. For the market-related
value of assets, a calculated basis is used to reflect a smoothed actuarial
value of assets, equal to a moving average of market values in which investment
income is recognized over a five-year period for U.S. plans and a three-year
period for non-U.S. plans. To determine the expected long-term rate of
return, we use historic market trends combined with current market conditions.
The weighted average expected long-term rate of return for our domestic and
foreign plans was 8.00% and 5.41%, respectively. A one-half percentage point
decrease in the expected long-term rate of return would result in an
increase in our net periodic pension cost of $0.7 million.
35
|
ITEM
7.
|
MANAGEMENT’S
DISCUSSION AND ANALYSIS OF FINANCIAL CONDITION AND RESULTS OF OPERATIONS
(Continued)
|
Critical
Accounting Policies and Estimates (Continued)
Actuarial
assumptions used to measure the accumulated benefit obligation for other
postretirement benefits include a discount rate of 5.50% and 6.40% at
December 31, 2009, and 2008, respectively. The effect on our postretirement
benefit cost of one-half percentage point decrease in the discount rate would be
immaterial. The assumed health care cost trend rate for fiscal year 2009 was
8.5% and is projected to decrease over 19 years to 4.5%, where it is expected to
remain thereafter. The effect of a one-percentage-point increase or decrease in
the assumed health care cost trend rate on the service cost and interest cost
components of the net periodic postretirement benefit cost is not material. A
one-percentage-point increase or decrease in the assumed health care cost trend
rate on the postretirement benefit obligation would result in an increase or
decrease of approximately $0.1 million.
The
difference between actual amounts and estimates based on actuarial assumptions
is recognized in other comprehensive income (loss) in the period in which they
occur. See Note K to our consolidated financial statements for
details.
Recent
Accounting Pronouncements Not Yet Adopted
In
October 2009, the Financial Accounting Standards Board (“FASB”)
updated its guidance on software revenue recognition rules. According to this
update, tangible products containing software components and non-software
components that function together to deliver the tangible product’s essential
functionality are no longer within the scope of the software revenue guidance.
This update requires that hardware components of a tangible product containing
software components always be excluded from the software revenue guidance. This
update provides additional guidance on how to determine which software, if any,
relating to the tangible product should be excluded from the scope of the
software revenue guidance. This update will be effective prospectively for
revenue arrangements entered into or materially modified in fiscal years
beginning on or after June 15, 2010, but early adoption is permitted. This
update must be adopted in the same period using the same transition method as
indicated below in the update to revenue arrangements with multiple
deliverables. We are currently assessing the potential impact that adoption of
this update may have on our consolidated financial statements.
In
October 2009, the FASB updated its guidance on revenue arrangements with
multiple deliverables. It alters the criteria for separating
consideration in multiple-deliverable arrangements. This update establishes a
selling price hierarchy for determining the selling price of a deliverable. The
selling price used for each deliverable will be based on vendor-specific
objective evidence if available, third-party evidence if vendor-specific
objective evidence is not available, or estimated selling price if neither
vendor-specific objective evidence nor third-party evidence is available. This
update also replaces the term fair value in the revenue
allocation guidance with selling price to clarify that
the allocation of revenue is based on entity-specific assumptions rather than
assumptions of a market participant. It also eliminates the residual method of
allocation and requires that arrangement consideration be allocated at the
inception of the arrangement to all deliverables using the relative selling
price method. This update will be effective prospectively for revenue
arrangements entered into or materially modified in fiscal years beginning on or
after June 15, 2010, but early adoption is permitted. We are currently assessing
the potential impact that adoption of this guidance may have on our consolidated
financial statements.
36
|
ITEM
7A.
|
QUANTITATIVE
AND QUALITATIVE DISCLOSURES ABOUT MARKET
RISK
|
Currency
Exchange Rates: Due to our global operations, our cash flow and
earnings are exposed to risk based on movements in foreign exchange rates. We
conduct business in approximately 99 countries throughout the world and
generally invoice customers in their local currency and have a resulting foreign
currency denominated revenue transaction and accounts receivable balance. Our
subsidiaries also purchase certain raw materials and other items in local
currencies.
Our
treasury policies allow us to offset the risks associated with the effects of
certain foreign currency exposures through the purchase of foreign exchange
forward contracts. Our policy prohibits speculation in financial instruments for
profit on the exchange rate price fluctuation. We enter into foreign exchange
forward contracts primarily to hedge the impact of fluctuations of
foreign exchange arising from intercompany transactions, specifically for
inventory purchases made by our subsidiaries that are denominated in U.S.
dollars. Our foreign exchange forward contracts are not designated as hedging
instruments for accounting purposes. Accordingly, we record these contracts at
fair value on the consolidated balance sheets, with changes in fair value
recognized in earnings in the period of change. These contracts do not contain
any credit-risk-related contingent features. We attempt to manage the
counterparty risk associated with these foreign exchange forward contracts by
limiting transactions to counterparties with which we have an established
banking relationship. In addition, these contracts generally settle in
approximately 30 days.
We
performed a sensitivity analysis assuming a hypothetical 10 percent movement in
currency exchange rates applied to the exposure described above. As of
December 31, 2009, the analysis indicated that if our hedges of exchange
exposure were not in place, such market movements would have an impact of
approximately $14.5 million on our results of operations. The actual gains
or losses in the future may differ significantly from that analysis, if changes
in the timing and amount of currency exchange rate movements and our
hedging activities are different from 2009.
During
2009, our sales comprised $399.4 million or 60.7%, denominated in U.S. dollars,
$119.1 million, or 18.1%, denominated in Euros, $50.3 million, or 7.6%,
denominated in British pounds, and $89.4 million, or 13.6% denominated in other
foreign currencies. Fluctuations in foreign currency translation rates
negatively impacted our sales by approximately $18.3 million in 2009, in
comparison to 2008.
37
|
ITEM
8.
|
FINANCIAL
STATEMENTS AND SUPPLEMENTARY DATA
|
|
|
|
|
CHANGES
IN AND DISAGREEMENTS WITH ACCOUNTANTS ON ACCOUNTING AND FINANCIAL
DISCLOSURE
|
|
ITEM
9A.
|
CONTROLS
AND PROCEDURES
|
We performed an evaluation under the
supervision and with the participation of management, including the Chief
Executive Officer and Chief Financial Officer, of our disclosure controls and
procedures as required by Exchange Act Rule 13a-15(b). Based on that evaluation,
our Chief Executive Officer and Chief Financial Officer concluded that, as of
the end of the period covered by this Annual Report on Form 10-K, our disclosure
controls and procedures are effective.
There has
been no change in our internal control over financial reporting during our most
recently completed year that has materially affected, or is reasonably likely to
materially affect, our internal control over financial reporting.
Management’s Report on Internal Control over Financial
Reporting
Our
management is responsible for establishing and maintaining adequate internal
control over financial reporting to provide reasonable assurance regarding the
reliability of our financial reporting and the preparation of financial
statements for external purposes in accordance with accounting principles
generally accepted in the United States. Internal control over financial
reporting includes those policies and procedures that (i) pertain to the
maintenance of records that in reasonable detail accurately and fairly reflect
the transactions and dispositions of the assets of the company; (ii) provide
reasonable assurance that transactions are recorded as necessary to permit
preparation of financial statements in accordance with accounting
principles generally accepted in the United States, and that receipts and
expenditures of the company are being made only in accordance with
authorizations of management and directors of the company; and (iii) provide
reasonable assurance regarding prevention or timely detection of unauthorized
acquisition, use, or disposition of the company’s assets that could have a
material effect on the financial statements.
Management
assessed our internal control over financial reporting as of December 31, 2009,
the end of our fiscal year. Management based its assessment on criteria
established in Internal
Control—Integrated Framework issued by the Committee of Sponsoring
Organizations of the Treadway Commission. Management’s assessment included
evaluation of elements such as the design and operating effectiveness of key
financial reporting controls, process documentation, accounting policies, and
our overall control environment.
Based on
our assessment, management has concluded that our internal control over
financial reporting was effective as of the end of the fiscal year to provide
reasonable assurance regarding the reliability of financial reporting and the
preparation of financial statements for external reporting purposes in
accordance with accounting principles generally accepted in the United States.
The effectiveness of the Company's internal control over financial reporting as
of December 31, 2009, has been audited by Deloitte & Touche LLP, an
independent registered public accounting firm, as stated in their report which
appears in Item 8.
38
The
certifications of the Chief Executive Officer and Chief Financial Officer
required by the Sarbanes-Oxley Act have been included as Exhibits 31 and 32 in
the Form 10-K.
|
/s/
Patrick J. Byrne
|
|
Patrick
J. Byrne
|
|
Chief
Executive Officer
|
|
/s/
Robert J. Driessnack
|
|
Robert
J. Driessnack
|
|
Senior
Vice President and
|
|
Chief
Financial Officer
|
Report of the Independent Registered
Public Accounting Firm
The operating effectiveness of our internal control over financial
reporting as of December 31, 2009, has been audited by Deloitte & Touche
LLP, an independent registered public accounting firm, as stated in their report
which is on page 43 of this annual report on Form 10-K.
|
ITEM
9B.
|
OTHER
INFORMATION
|
39
PART III
|
ITEM
10.
|
DIRECTORS,
EXECUTIVE OFFICERS AND CORPORATE
GOVERNANCE.
|
We have adopted a code of business conduct and
ethics for all directors, officers and employees, known as the Standards of
Conduct. The Standards of Conduct are available on our website under Investor
Information at http://www.intermec.com. We
intend to disclose on our website any amendment to, or waiver of, the Standards
of Conduct related to our senior officers. Shareholders may request a free copy
of the Standards of Conduct from:
Intermec, Inc.
Attention:
Investor Relations
6001
36th Avenue
West
Everett,
WA 98203-1264
We are
permitted to incorporate by reference into this report certain information that
will be contained in our definitive Proxy Statement relating to the Annual
Meeting of Shareholders to be held on May 26, 2010 (the “2010 Proxy Statement”).
Information to be included in Part III, Item 10, will be included in our 2010
Proxy Statement, and is incorporated herein by this reference. Certain
information regarding our executive officers is set forth under the caption
“Executive Officers of the Registrant” in Part I of this report.
|
ITEM
11.
|
EXECUTIVE
COMPENSATION.
|
Information to be included in Part III, Item 11,
will be included in our 2010 Proxy Statement, and is incorporated herein this by
this reference.
|
ITEM
12.
|
SECURITY
OWNERSHIP OF CERTAIN BENEFICIAL OWNERS AND MANAGEMENT AND RELATED
SHAREHOLDER MATTERS.
|
Information to be included in Part III, Item
12, will be included in our 2010 Proxy Statement, and is incorporated herein by
this reference.
|
ITEM
13.
|
CERTAIN
RELATIONSHIPS AND RELATED TRANSACTIONS, AND DIRECTOR
INDEPENDENCE.
|
Information to be included in Part III,
Item 13, will be included in our 2010 Proxy Statement, and is incorporated
herein by this reference.
|
ITEM
14.
|
PRINCIPAL
ACCOUNTANT FEES AND SERVICES.
|
Information to be included in Part III,
Item 14, will be included in our 2010 Proxy Statement, and is incorporated
herein by this reference.
40
PART IV
|
ITEM
15.
|
EXHIBITS
AND FINANCIAL STATEMENT SCHEDULES.
|
(b) Index
to Exhibits at page 80 of this annual report on Form
10-K.
Pursuant
to the requirements of Section 13 or 15(d) of the Securities Exchange
Act of 1934, the Registrant has duly caused this report to be signed on its
behalf by the undersigned, thereunto duly authorized.
|
Intermec, Inc.
|
||
|
/s/
Robert J. Driessnack
|
||
|
Robert
J. Driessnack
|
||
|
Senior
Vice President and Chief Financial Officer
|
||
|
February
19, 2010
|
Pursuant
to the requirements of the Securities Exchange Act of 1934, this report has been
signed below by the following persons on behalf of the Registrant and in the
capacities and on the dates indicated:
|
/s/
Patrick J. Byrne
|
Director,
President and
|
February
19, 2010
|
|
Patrick
J. Byrne
|
Chief
Executive Officer
|
|
|
/s/
Allen J. Lauer
|
Director
and Chairman of the Board
|
February
19, 2010
|
|
Allen
J. Lauer
|
||
|
/s/
Eric J. Draut
|
Director
|
February
19, 2010
|
|
Eric
J. Draut
|
||
|
/s/
Gregory K. Hinckley
|
Director
|
February
19, 2010
|
|
Gregory
K. Hinckley
|
||
|
/s/
Lydia H. Kennard
|
Director
|
February
19, 2010
|
|
Lydia
H. Kennard
|
||
|
/s/
Stephen P. Reynolds
|
Director
|
February
19, 2010
|
|
Stephen
P. Reynolds
|
||
|
/s/
Steven B. Sample
|
Director
|
February
19, 2010
|
|
Steven
B. Sample
|
||
|
/s/
Oren G. Shaffer
|
Director
|
February
19, 2010
|
|
Oren
G. Shaffer
|
||
|
/s/
Larry D. Yost
|
Director
|
February
19, 2010
|
|
Larry
D. Yost
|
||
|
/s/
Robert J. Driessnack
|
Senior
Vice President and Chief Financial Officer
|
February
19, 2010
|
|
Robert
J. Driessnack
|
(Principal
Financial Officer and Principal Accounting Officer)
|
|
To the
Board of Directors and Shareholders of
Intermec, Inc.
Everett,
Washington
We have
audited the accompanying consolidated balance sheets of Intermec, Inc. and
subsidiaries (the “Company”) as of December 31, 2009 and 2008, and the
related consolidated statements of operations, changes in shareholders’ equity,
and of cash flows for each of the three years in the period ended
December 31, 2009. Our audits also included the financial statement
schedules listed in the Index at Item 8. We also have audited the Company’s
internal control over financial reporting as of December 31, 2009, based on
criteria established in Internal Control — Integrated
Framework issued by the Committee of Sponsoring Organizations of the
Treadway Commission. The Company’s management is responsible for these financial
statements and the financial statement schedules, for maintaining effective
internal control over financial reporting, and for its assessment of the
effectiveness of internal control over financial reporting, included in the
accompanying Management’s Report on Internal Control over Financial Reporting.
Our responsibility is to express an opinion on these consolidated financial
statements and financial statement schedules and an opinion on the Company’s
internal control over financial reporting based on our audits.
We
conducted our audits in accordance with the standards of the Public Company
Accounting Oversight Board (United States). Those standards require that we plan
and perform the audit to obtain reasonable assurance about whether the financial
statements are free of material misstatement and whether effective internal
control over financial reporting was maintained in all material respects. Our
audits of the financial statements included examining, on a test basis, evidence
supporting the amounts and disclosures in the financial statements, assessing
the accounting principles used and significant estimates made by management, and
evaluating the overall financial statement presentation. Our audit of internal
control over financial reporting included obtaining an understanding of internal
control over financial reporting, assessing the risk that a material weakness
exists, testing and evaluating the design and operating effectiveness of
internal control based on the assessed risk. Our audits also included performing
such other procedures as we considered necessary in the circumstances. We
believe that our audits provide a reasonable basis for our
opinions.
A
company’s internal control over financial reporting is a process designed by, or
under the supervision of, the company’s principal executive and principal
financial officers, or persons performing similar functions, and effected by the
company’s board of directors, management, and other personnel to provide
reasonable assurance regarding the reliability of financial reporting and the
preparation of financial statements for external purposes in accordance with
generally accepted accounting principles. A company’s internal control over
financial reporting includes those policies and procedures that (1) pertain
to the maintenance of records that, in reasonable detail, accurately and fairly
reflect the transactions and dispositions of the assets of the company;
(2) provide reasonable assurance that transactions are recorded as
necessary to permit preparation of financial statements in accordance with
generally accepted accounting principles and that receipts and expenditures of
the company are being made only in accordance with authorizations of management
and directors of the company; and (3) provide reasonable assurance
regarding prevention or timely detection of unauthorized acquisition, use, or
disposition of the company’s assets that could have a material effect on the
financial statements.
Because
of the inherent limitations of internal control over financial reporting,
including the possibility of collusion or improper management override of
controls, material misstatements due to error or fraud may not be prevented or
detected on a timely basis. Also, projections of any evaluation of the
effectiveness of the internal control over financial reporting to future periods
are subject to the risk that the controls may become inadequate because of
changes in conditions, or that the degree of compliance with the policies or
procedures may deteriorate.
In our
opinion, the consolidated financial statements referred to above present fairly,
in all material respects, the financial position of the Company as of
December 31, 2009 and 2008, and the results of its operations and its cash
flows for each of the three years in the period ended December 31, 2009, in
conformity with accounting principles generally accepted in the United States of
America. Also, in our opinion, such financial statement schedules, when
considered in relation to the basic consolidated financial statements taken as a
whole, present fairly, in all material respects, the information set forth
therein. Also, in our opinion, the Company maintained, in all material respects,
effective internal control over financial reporting as of December 31,
2009, based on the criteria established in Internal Control — Integrated
Framework issued by the Committee of Sponsoring Organizations of the
Treadway Commission.
/s/
Deloitte & Touche LLP
Seattle,
Washington
February 19,
2010
43
INTERMEC,
INC.
CONSOLIDATED STATEMENTS OF OPERATIONS
(In
thousands, except for per share data)
|
Year
Ended December 31,
|
||||||||||||
|
2009
|
2008
|
2007
|
||||||||||
|
Revenues:
|
||||||||||||
|
Product
|
$ | 519,603 | $ | 738,426 | $ | 692,050 | ||||||
|
Service
|
138,602 | 152,457 | 157,170 | |||||||||
|
Total
revenues
|
658,205 | 890,883 | 849,220 | |||||||||
|
Costs
and expenses:
|
||||||||||||
|
Cost
of product revenues
|
331,128 | 448,216 | 432,166 | |||||||||
|
Cost
of service revenues
|
78,519 | 87,881 | 90,188 | |||||||||
|
Research
and development, net of credits of $2,600, $1,800 and $0
|
59,566 | 67,899 | 68,722 | |||||||||
|
Selling,
general and administrative
|
187,867 | 232,983 | 220,726 | |||||||||
|
Restructuring
charges
|
20,577 | 5,748 | - | |||||||||
|
Flood
related charge
|
- | 1,122 | - | |||||||||
|
Total
costs and expenses
|
677,657 | 843,849 | 811,802 | |||||||||
|
Operating
(loss) profit from continuing operations
|
(19,452 | ) | 47,034 | 37,418 | ||||||||
|
Interest
income
|
1,312 | 4,787 | 10,706 | |||||||||
|
Interest
expense
|
(995 | ) | (2,520 | ) | (8,946 | ) | ||||||
|
(Loss)
earnings from continuing operations before income taxes
|
(19,135 | ) | 49,301 | 39,178 | ||||||||
|
Income
tax (benefit) expense
|
(8,263 | ) | 13,615 | 14,843 | ||||||||
|
(Loss)
earnings from continuing operations
|
(10,872 | ) | 35,686 | 24,335 | ||||||||
|
Loss
from discontinued operations, net of tax
|
(971 | ) | - | (1,283 | ) | |||||||
|
Net
(loss) earnings
|
$ | (11,843 | ) | $ | 35,686 | $ | 23,052 | |||||
|
Basic
(loss) earnings per share
|
||||||||||||
|
Continuing
operations
|
$ | (0.17 | ) | $ | 0.58 | $ | 0.40 | |||||
|
Discontinued
operations
|
(0.02 | ) | - | (0.02 | ) | |||||||
|
Net
(loss) earnings per share
|
$ | (0.19 | ) | $ | 0.58 | $ | 0.38 | |||||
|
Diluted
(loss) earnings per share
|
||||||||||||
|
Continuing
operations
|
$ | (0.17 | ) | $ | 0.58 | $ | 0.40 | |||||
|
Discontinued
operations
|
(0.02 | ) | - | (0.02 | ) | |||||||
|
Net
(loss) earnings per share
|
$ | (0.19 | ) | $ | 0.58 | $ | 0.38 | |||||
|
Shares
used in computing basic (loss) earnings per share
|
61,644 | 61,183 | 60,359 | |||||||||
|
Shares
used in computing diluted (loss) earnings per share
|
61,644 | 61,658 | 61,163 | |||||||||
See
accompanying notes to consolidated financial statements
44
INTERMEC,
INC.
(In
thousands)
|
December
31,
|
||||||||
|
2009
|
2008
|
|||||||
|
ASSETS
|
||||||||
|
Current
assets:
|
||||||||
|
Cash
and cash equivalents
|
$ | 201,884 | $ | 221,335 | ||||
|
Short-term
investments
|
36,301 | 156 | ||||||
|
Accounts
receivable, net of allowance for doubtful accounts and sales returns of
$10,333 and $10,789
|
106,890 | 138,549 | ||||||
|
Inventories,
net
|
101,537 | 116,949 | ||||||
|
Current
deferred tax assets, net
|
51,140 | 56,295 | ||||||
|
Other
current assets
|
16,826 | 14,405 | ||||||
|
Total current assets
|
514,578 | 547,689 | ||||||
|
Property,
plant and equipment, net
|
37,383 | 41,348 | ||||||
|
Other
acquired intangibles, net
|
2,587 | 3,521 | ||||||
|
Deferred
tax assets, net
|
182,457 | 167,834 | ||||||
|
Other
assets
|
34,404 | 29,503 | ||||||
|
Total assets
|
$ | 771,409 | $ | 789,895 | ||||
|
LIABILITIES
AND SHAREHOLDERS’ EQUITY
|
||||||||
|
Current
liabilities:
|
||||||||
|
Accounts
payable and accrued expenses
|
$ | 102,607 | $ | 112,772 | ||||
|
Payroll
and related expenses
|
20,683 | 24,799 | ||||||
|
Deferred
revenue
|
39,038 | 38,712 | ||||||
|
Total current liabilities
|
162,328 | 176,283 | ||||||
|
Long-term
deferred revenue
|
22,010 | 25,980 | ||||||
|
Pension
and other postretirement benefits liabilities
|
81,897 | 92,129 | ||||||
|
Other
long-term liabilities
|
14,891 | 13,747 | ||||||
| Commitments | ||||||||
|
Shareholders’
equity:
|
||||||||
|
Common
stock (250,000 shares authorized, 62,203 and 61,766 shares issued and
outstanding)
|
622 | 618 | ||||||
|
Additional
paid-in capital
|
703,590 | 694,296 | ||||||
|
Accumulated
deficit
|
(174,245 | ) | (162,402 | ) | ||||
|
Accumulated
other comprehensive loss
|
(39,684 | ) | (50,756 | ) | ||||
|
Total
shareholders’ equity
|
490,283 | 481,756 | ||||||
|
Total liabilities and shareholders’ equity
|
$ | 771,409 | $ | 789,895 | ||||
See accompanying notes to consolidated financial
statements
45
INTERMEC,
INC.
(In
thousands)
|
Year
Ended December 31,
|
||||||||||||
|
2009
|
2008
|
2007
|
||||||||||
|
Cash
and cash equivalents at beginning of the year
|
$ | 221,335 | $ | 237,247 | $ | 155,027 | ||||||
|
Cash
flows from operating activities of continuing operations:
|
||||||||||||
|
Net
(loss) earnings
|
(11,843 | ) | 35,686 | 23,052 | ||||||||
|
Loss
from discontinued operations
|
971 | - | 1,283 | |||||||||
|
Adjustments
to reconcile net (loss) earnings to net cash provided by operating
activities:
|
||||||||||||
|
Depreciation
and amortization
|
15,913 | 16,493 | 13,314 | |||||||||
|
Impairment
loss on certain property
|
- | 802 | - | |||||||||
|
Loss
(gain) on sale of property, plant and equipment
|
134 | (2,873 | ) | - | ||||||||
|
Change
in pension and other postretirement plans, net
|
(2,922 | ) | (749 | ) | (5,290 | ) | ||||||
| Deferred taxes | (12,169 | ) | 9,759 | 7,643 | ||||||||
|
Stock-based
compensation
|
7,875 | 7,027 | 9,037 | |||||||||
|
Excess
tax benefit from stock-based payment arrangements
|
- | (937 | ) | (2,050 | ) | |||||||
|
Changes
in operating assets and liabilities:
|
||||||||||||
|
Accounts
receivable
|
31,211 | 52,938 | (25,204 | ) | ||||||||
| Inventories | 15,072 | (7,781 | ) | 8,060 | ||||||||
|
Other
current assets
|
(2,421 | ) | 285 | (1,662 | ) | |||||||
|
Accounts
payable and accrued expenses
|
(10,059 | ) | (25,853 | ) | 35,805 | |||||||
|
Payroll
and related expenses
|
(4,116 | ) | (7,371 | ) | (815 | ) | ||||||
|
Deferred
revenue
|
(4,160 | ) | (3,740 | ) | 5,652 | |||||||
|
Other operating activities
|
(2,123 | ) | (3,198 | ) | (12,200 | ) | ||||||
|
Net cash provided by operating activities of
continuing operations
|
21,363 | 70,488 | 56,625 | |||||||||
|
Cash
flows from investing activities of continuing operations:
|
||||||||||||
|
Additions
to property, plant and equipment
|
(11,038 | ) | (13,766 | ) | (15,779 | ) | ||||||
|
Purchases
of investments
|
(35,790 | ) | (760 | ) | - | |||||||
|
Sales
of investments
|
- | 28,515 | 2,002 | |||||||||
|
Capitalized
patent legal fees
|
(4,704 | ) | (3,637 | ) | (2,398 | ) | ||||||
|
Sale
of property, plant and equipment
|
1,867 | 5,497 | - | |||||||||
|
Other
investing activities
|
(100 | ) | 600 | (1,253 | ) | |||||||
|
Net cash (used in) provided by investing
activities of continuing operations
|
(49,765 | ) | 16,449 | (17,428 | ) | |||||||
|
Cash
flows from financing activities of continued operations:
|
||||||||||||
| Repayment of debt | - | (100,000 | ) | - | ||||||||
|
Excess
tax benefit from stock-based payment arrangements
|
- | 937 | 2,050 | |||||||||
|
Proceeds
from stock options exercised
|
619 | 4,362 | 8,434 | |||||||||
|
Other
financing activities
|
1,531 | 2,735 | 2,269 | |||||||||
|
Net cash provided by (used in) financing
activities of continued operations
|
2,150 | (91,966 | ) | 12,753 | ||||||||
|
Net
cash (used in) provided by continuing operations
|
(26,252 | ) | (5,029 | ) | 51,950 | |||||||
|
Net
cash provided by investing activities of discontinued
operations
|
- | - | 20,178 | |||||||||
|
Effect
of exchange rate changes on cash and cash equivalents
|
6,801 | (10,883 | ) | 10,092 | ||||||||
|
Resulting
(decrease) increase in cash and cash equivalents
|
(19,451 | ) | (15,912 | ) | 82,220 | |||||||
|
Cash
and cash equivalents at end of the year
|
$ | 201,884 | $ | 221,335 | $ | 237,247 | ||||||
|
Supplemental
Information
|
||||||||||||
|
Cash
payments:
|
||||||||||||
|
Interest
on debt
|
- | (3,500 | ) | (7,000 | ) | |||||||
|
Income
taxes paid
|
(5,166 | ) | (5,889 | ) | (5,943 | ) | ||||||
See
accompanying notes to consolidated financial statements
46
INTERMEC,
INC.
CONSOLIDATED STATEMENTS OF CHANGES IN SHAREHOLDERS’
EQUITY
(In
thousands)
|
Common
Stock
|
Additional
Paid-in Capital
|
Accumulated
Deficit
|
Accumulated
Other Comprehensive (Loss) Income
|
Total
|
||||||||||||||||
|
Balance,
January 1, 2007
|
$ | 598 | $ | 657,468 | $ | (212,903 | ) | $ | (27,561 | ) | $ | 417,602 | ||||||||
|
Comprehensive
income:
|
||||||||||||||||||||
| Net earnings | 23,052 | 23,052 | ||||||||||||||||||
|
Foreign
currency translation adjustment
|
5,851 | 5,851 | ||||||||||||||||||
|
Pension
adjustment, net of tax
|
22,668 | 22,668 | ||||||||||||||||||
|
Unrealized
gain on securities, net of tax
|
95 | 95 | ||||||||||||||||||
|
Comprehensive
income
|
51,666 | |||||||||||||||||||
|
Adoption
of accounting for uncertainty in income taxes
|
(6,944 | ) | (6,944 | ) | ||||||||||||||||
|
Stock
based activity
|
14 | 21,773 | 21,787 | |||||||||||||||||
|
Balance,
December 31, 2007
|
$ | 612 | $ | 679,241 | $ | (196,795 | ) | $ | 1,053 | $ | 484,111 | |||||||||
|
Comprehensive
loss:
|
||||||||||||||||||||
| Net earnings | 35,686 | 35,686 | ||||||||||||||||||
|
Foreign
currency translation adjustment
|
(9,729 | ) | (9,729 | ) | ||||||||||||||||
|
Pension
adjustment, net of tax
|
(41,761 | ) | (41,761 | ) | ||||||||||||||||
|
Unrealized
loss on securities, net of tax
|
(319 | ) | (319 | ) | ||||||||||||||||
| Comprehensive loss | (16,123 | ) | ||||||||||||||||||
|
Pension and other postretirement benefits adoption of new accounting
standards
|
(1,293 | ) | (1,293 | ) | ||||||||||||||||
|
Stock
based activity
|
6 | 15,055 | 15,061 | |||||||||||||||||
|
Balance,
December 31, 2008
|
$ | 618 | $ | 694,296 | $ | (162,402 | ) | $ | (50,756 | ) | $ | 481,756 | ||||||||
|
Comprehensive
loss:
|
||||||||||||||||||||
| Net loss | (11,843 | ) | (11,843 | ) | ||||||||||||||||
|
Foreign
currency translation adjustment
|
4,692 | 4,692 | ||||||||||||||||||
|
Pension
adjustment, net of tax
|
6,243 | 6,243 | ||||||||||||||||||
|
Unrealized
gain on securities, net of tax
|
137 | 137 | ||||||||||||||||||
| Comprehensive loss | (771 | ) | ||||||||||||||||||
|
Stock
based activity
|
4 | 9,294 | 9,298 | |||||||||||||||||
|
Balance,
December 31, 2009
|
$ | 622 | $ | 703,590 | $ | (174,245 | ) | $ | (39,684 | ) | $ | 490,283 | ||||||||
See
accompanying notes to consolidated financial statements
47
INTERMEC,
INC.
NOTES TO CONSOLIDATED FINANCIAL STATEMENTS
Intermec designs,
develops, integrates, sells, resells and services wired and wireless automated
identification and data collection (“AIDC”) products and provides related
services. Our products include mobile computing products, bar code scanners,
wired and wireless bar code printers and label media products, including radio
frequency identification (“RFID”) products. These products and services allow
customers to identify, track and manage their assets and other resources in ways
that improve the efficiency and effectiveness of their business operations. Our
products are designed to withstand mobile use and rugged warehouse and field
conditions.
We
provide rugged mobile business solutions that help our customers improve their
visibility and control of their businesses and, in the process, lower their
costs, increase their revenues and improve customer satisfaction and
loyalty. These business solutions are a collaborative effort between
us and our channel partners.
In 2005,
we divested our Industrial Automation Systems (“IAS”) businesses, which
comprised the Cincinnati Lamb and Landis Grinding Systems divisions. The IAS
businesses are classified as discontinued operations for accounting purposes in
our consolidated financial statements and related notes. In 2007, the loss from
discontinued operations, after tax, included the write-off of a $1.3 million
account receivable related to the sale of the Cincinnati Lamb business. We
received the final payments of approximately $20.2 million of notes receivable
from the sale of Cincinnati Lamb and Landis Grinding Systems in 2007. In 2009,
we adjusted our long-term lease liability for the retained property
that is held as available for sublease and classified it as loss from
discontinued operations on the Consolidated Statements of
Operations.
Principles of
Consolidation. The consolidated financial statements include the
accounts of Intermec, Inc., our wholly owned subsidiaries and companies in
which we have a controlling interest. All intercompany transactions and balances
have been eliminated in consolidation. We have no unconsolidated
subsidiaries.
Foreign Currencies. Our
consolidated financial statements are presented in U.S. dollars. The financial
statements of our operations outside the U.S., whose functional currencies are
not the U.S. dollar, are translated into U.S. dollars at the exchange rates in
effect at the balance sheet dates for assets and liabilities and at average
rates for the period for revenues and expenses. The unrealized translation gains
and losses on our net investment in these operations, including long-term
intercompany advances considered part of the net investment, are accumulated as
a component of other comprehensive income (loss). Gains and losses resulting
from foreign currency remeasurement are included in the selling, general and
administrative expenses on the consolidated statements of operations. Operating
results include net foreign currency transaction losses of $2.2, $2.6
and $1.5 million for the years ended December 31, 2009, 2008 and 2007,
respectively.
Use of Estimates in the Preparation
of Financial Statements. The preparation of financial statements in
conformity with accounting principles generally accepted in the United States of
America requires management to make estimates and assumptions that affect the
reported amounts of assets and liabilities, the disclosure of contingent assets
and liabilities at the date of the financial statements and the reported amounts
of revenues and expenses for each reported period. Actual results could differ
from those estimates. Significant estimates and assumptions were used to
determine the provision for uncollectible accounts receivable, allowance for
sales returns, excess and obsolete inventory, tax valuation allowances, the
liabilities for uncertain tax provisions, warranty costs, pension and
postretirement obligations, and stock-based compensation.
Revenue Recognition. We record revenue, net of excise and sales taxes,
when it is realized, or realizable, and earned. We consider these criteria met
when persuasive evidence of an arrangement exists, delivery has occurred or
services have been rendered, the sales price is fixed or determinable and
collectability is reasonably assured. Royalty revenue is recorded when earned,
the amount due is fixed or determinable and collectability is reasonably
assured.
48
INTERMEC,
INC.
NOTES TO CONSOLIDATED FINANCIAL STATEMENTS
Note
A: Significant Accounting Policies (continued)
For
product sales, revenue is recognized when the customer has assumed risk of loss
of the goods sold and all performance obligations are complete. These sales may
contain discounts, price exception, return provision or other customer
incentives. We reduce revenue by providing allowances for estimated customer
returns, price exception and other incentives that occur under sales programs
established by us directly or with our distributors and resellers. The sales
allowances are based on management’s best estimate of the amount of allowances
that the customer will ultimately receive and was based on our historical
experience taking into account the type of products sold and type of customers
involved. We accrue the estimated cost of basic product warranties at the
time we recognize revenue based on historical experience. In addition to basic
product warranties, we frequently offer extended warranties, including renewal,
to our customers in the form of product maintenance services. Our product and
maintenance services are typically separately priced. We defer the stated amount
of the separately priced product maintenance services contracts and recognized
the deferred revenue as services are rendered, generally straight-line over the
contract term.
We
infrequently enter into multiple-element arrangements with our customers,
and these sales may include deliverables such as hardware, software,
professional consulting services and maintenance support services. For
arrangements involving multiple deliverables, where deliverables include
software and non-software products and services, we apply the provisions of
multiple elements accounting to separate the deliverables and allocate the total
arrangement consideration. Each unit of accounting is then accounted for under
the applicable revenue recognition guidance.
We
sell products with embedded software to our customers. The embedded software is
not sold separately, it is not a significant focus of the marketing effort and
we do not provide post-contract customer support specific to the software or
incur significant costs related to creating software products. Additionally, the
functionality that the software provides is marketed as part of the overall
product. The software embedded in the product is incidental to the equipment as
a whole such that software revenue recognition is not generally applicable. In
certain infrequent situations where our solutions contain software that is
more than incidental to the hardware and services, revenue related to the
software and software-related elements is recognized in accordance with software
revenue recognition accounting.
Our customers may request that delivery and passage
of title and risk of loss occur on a bill and hold basis. For these
transactions, we recognize revenue in accordance with guidance specific to bill
and hold transactions. For each of the three years ended December 31, 2009,
the amount from bill and hold transactions approximated less
than 1% of total revenue.
Financial Instruments. We consider highly liquid investments purchased within three months of their date of maturity to be cash equivalents. The fair value of these investments approximates their carrying value. In general, investments with original maturities of greater than three months and remaining maturities of less than one year are classified as short-term investments. All short-term investments are classified as available-for-sale. Changes in market value of these securities are reflected in accumulated other comprehensive loss as unrealized gains or losses. Investments are considered to be impaired when a decline in fair value is judged to be other-than-temporary. Once a decline in fair value is determined to be other-than-temporary, an impairment charge is recorded to our statement of operations, and a new cost basis in the investment is established.
Derivative
instruments are recognized as either assets or liabilities and are measured at
fair value.
Allowance for Doubtful Accounts and
Sales Returns. We provide an allowance for doubtful accounts equal
to the estimated uncollectible accounts receivable. This estimate is based on
historical collection experience, the aging of the accounts receivable, current
international, political, economic and market conditions, and a review of the
current status of specific customer’s trade accounts receivable. We reduce
revenue by providing allowances for estimated customer returns, price exceptions
and other incentives that occur under sales programs established by us directly
or with our distributors and resellers. Our allowance for doubtful accounts and
sales returns was $10.3 and $10.8 million at December 31, 2009, and 2008,
respectively.
Inventories. Inventories
are stated at the lower of cost or market. Cost is determined using the
first-in, first-out method. Inventoried costs include material, labor and
manufacturing overhead. General and administrative costs are expensed as
incurred. The valuation of inventory requires us to estimate obsolete or excess
inventory as well as inventory that is not of saleable quality. The
determination of obsolete or excess inventory requires us to estimate the future
demand for our products and market conditions. If future demand and market
conditions are less favorable than our assumptions, or there are
technology or design changes, additional inventory write-downs could be
required, which would negatively impact our gross margin. Likewise,
favorable future demand and market conditions, and/or technology or design
changes, could positively impact future operating results if previously
written-down inventory is sold. Management continues to evaluate market and
technology conditions and design changes to assure that we have adequate
reserves for obsolete inventory.
49
INTERMEC,
INC.
Pension and Other Postretirement
Benefits. We have qualified
and nonqualified pension plans that cover some of our employees. Some
of these pension plans were partially frozen in June 2006. Additionally,
on December 30, 2009, we made the decision to fully freeze our U.S. qualified
pension plan, effective February 28, 2010. Our U.S. nonqualified plans were
fully frozen effective December 31, 2009. Annual
employer contributions are made to the extent such contributions are actuarially
determined to be required in order to adequately fund the plans, and to match a
portion of the employees’ contribution. Retiree benefits are based on the amount
of participant contributions over the term of the participant’s
employment.
We
perform an annual measurement of our projected obligations and plan assets or
when major events occurred requiring for remeasurement. These measurements
require several assumptions, the most critical of which are the discount rate,
the expected long-term rate of return on plan assets, and health care cost
projections. These assumptions could vary materially from actual results due to
economic events or different rates of retirement, mortality or withdrawal,
positively or negatively affecting our future annual net
periodic pension and postretirement costs.
Income Taxes. We account
for income taxes using the asset and liability approach, which requires the
recognition of deferred tax assets and liabilities for the expected future tax
consequences of temporary differences between the carrying amounts and the tax
bases of assets and liabilities. This method also requires the recognition of
future tax benefits, such as net operating loss carry forwards and other tax
credits. Deferred tax assets and liabilities are measured using enacted tax
rates expected to apply to taxable income in the years in which those temporary
differences are expected to reverse. Valuation allowances are provided to reduce
deferred tax assets to an amount that is more likely than not to be realized. We
evaluate the likelihood of realizing our deferred tax assets by estimating
sources of future taxable income and the impact of tax planning strategies. Our
deferred tax assets include future tax benefits of discontinued operations that
remain with us. Effective January 1, 2007, we began recording benefits from
uncertain tax positions. Accordingly, we recognize the largest amount of benefit
with greater than 50% cumulative probability of being realized upon ultimate
settlement with the tax authority.
Concentrations of Credit
Risk. Financial instruments that potentially subject us to
concentrations of credit risk consist primarily of cash and cash equivalents,
short-term investments and accounts receivable. We generally place our cash and
cash equivalents and investments with high-credit-quality counterparties, and by
policy, limit the amount of credit exposure to any one counterparty based on our
analysis of that counterparty’s relative credit standing. Our short-term
investments are comprised primarily of low-risk bond fund and time deposits.
Concentrations of credit risk with respect to trade receivables are limited
because a large number of geographically diverse customers make up our customer
base, thus spreading the credit risk. We evaluate the creditworthiness of our
customers and maintain an allowance for anticipated losses. For 2009, 2008 and
2007, one customer, ScanSource accounted for more than 10% of our revenues.
Total sales to this customer were 19%, 13% and 13% of total revenue for the
years ended December 31, 2009, 2008, and 2007,
respectively. Additionally, ScanSource accounted for 18% of our accounts
receivable as of December 31, 2009. We believe that the
receivable balance from ScanSource does not represent a significant credit risk
based on past collection experience.
Intangible
Assets. Intangible assets with finite lives are amortized
generally on a straight-line basis over the estimated useful life. A majority of
our finite-lived intangible assets pertain to a portion of our patent portfolio
and have estimated useful lives of up to 18 years. See Note G to the
consolidated financial statements for additional information.
Impairment of Long-Lived Assets
including Intangible Assets. We assess the recoverability of
long-lived assets when events or circumstances indicate that the carrying amount
of an asset may not be fully recoverable. If undiscounted expected cash flows to
be generated by a long-lived asset or asset group are less than its carrying
amount, we record an impairment to write down the long-lived asset or asset
group to its estimated fair value. Fair value is estimated based on discounted
expected future cash flows. We recorded approximately $0.8 million of
impairment loss for certain property for the year ended December 31, 2008. No
impairment of long-lived assets was considered necessary for the year ended
December 31, 2009.
50
INTERMEC,
INC.
Capitalized Legal Patent
Costs. We capitalize external legal costs incurred in the defense of
our patents where we believe that there is an evident increase in the value of
the patent and that the successful outcome of the legal action is probable. We
monitor the legal costs incurred and the anticipated outcome of the legal action
and, if changes in the anticipated outcome occur, capitalized costs are charged
to expense in the period in which the change is determined. As of December
31, 2009, and 2008, $11.4 and $6.7 million of legal patent defense costs have
been capitalized, respectively. The capitalized legal patent costs are recorded
in other assets on our consolidated balance sheets.
Research and
Development. Research and development (“R&D”) costs, net of
credits, are expensed as incurred. Included in R&D expense were
$2.6, $1.8 and $0 million in credits from U.S. and foreign governments
relating to reimbursement of certain R&D expenses, respectively. Total
expenditures on R&D activities amounted to $59.6, $67.9 and $68.7 million
for the years ended December 31, 2009, 2008 and 2007, respectively. These
expenditures were for Company-sponsored R&D and were primarily for labor,
materials and other administrative costs. We incurred no costs associated with
R&D sponsored by customers or other external parties.
Subsequent Events. We have
evaluated subsequent events through the date the consolidated financial
statements were issued on February 19, 2010.
Out of Period Adjustments.
The results of operations for the year ended December 31, 2009, include a
write-down of receivables, other than trade, and other adjustments totaling $2.1
million which increased the loss from continuing operations by $2.1 million and
net loss by $1.3 million. These out of period adjustments would have
decreased net earnings by $0.1 and $1.2 million for the years ended December 31,
2008 and 2007, respectively. These amounts are immaterial to all
periods presented.
Reclassification. Certain
reclassifications have been made to prior periods to conform to the current year
presentation.
Recent
Accounting Pronouncements Not Yet Adopted
In
October 2009, FASB updated its guidance on software revenue recognition
rules. According
to this update, tangible products containing software components and
non-software components that function together to deliver the tangible product’s
essential functionality, are no longer within the scope of the software revenue
guidance. This update requires that hardware components of a tangible product
containing software components always be excluded from the software revenue
guidance. This update provides additional guidance on how to determine which
software, if any, relating to the tangible product should be excluded from the
scope of the software revenue guidance. This update will be effective
prospectively for revenue arrangements entered into or materially modified in
fiscal years beginning on or after June 15, 2010, but early adoption is
permitted. This update must be adopted in the same period using the same
transition method as indicated below in the update to revenue arrangements with
multiple deliverables. The adoption of this guidance will not have a material
impact on our consolidated financial statements.
In
October 2009, the FASB updated its guidance on revenue arrangements with
multiple deliverables. This guidance alters the criteria for
separating consideration in multiple-deliverable arrangements. This update
establishes a selling price hierarchy for determining the selling price of a
deliverable. The selling price used for each deliverable will be based on
vendor-specific objective evidence if available, third-party evidence if
vendor-specific objective evidence is not available, or estimated selling price
if neither vendor-specific objective evidence nor third-party evidence is
available. This update also replaces the term fair value in the revenue
allocation guidance with selling price to clarify that
the allocation of revenue is based on entity-specific assumptions rather than
assumptions of a market participant. It also eliminates the residual method of
allocation and requires that arrangement consideration be allocated at the
inception of the arrangements to all deliverables using the relative selling
price method. This update will be effective prospectively for revenue
arrangements entered into or materially modified in fiscal years beginning on or
after June 15, 2010, but early adoption is permitted. We are currently assessing
the potential impact that adoption of this guidance may have on our consolidated
financial statements.
51
INTERMEC,
INC.
NOTES
TO CONSOLIDATED FINANCIAL STATEMENTS
Note
B: Cash and Cash Equivalents, Short-term Investments
Cash and
cash equivalents amounted to $201.9 and $221.3 million at December 31,
2009, and 2008, respectively, and consisted mainly of bank deposits and money
market funds. We have invested in a Wells Fargo & Company money market
fund which represents 36% and 44% of cash and cash equivalents at December 31,
2009 and 2008, respectively.
Short-term
investments totaled $36.3 and $0.2 million at December 31, 2009, and 2008,
respectively. Our short-term investments consisted primarily of the following
available-for-sale securities at December 31 (in thousands):
|
2009
|
2008
|
|||||||||||||||||||||||||||||||
|
Cost
|
Gross Unrealized
Gain
|
Gross
Unrealized Loss
|
Fair
Value
|
Cost
|
Gross Unrealized
Gain
|
Gross
Unrealized Loss
|
Fair
Value
|
|||||||||||||||||||||||||
|
Equity
security
|
$ | 405 | $ | - | $ | (239 | ) | $ | 166 | $ | 405 | $ | - | $ | (249 | ) | $ | 156 | ||||||||||||||
|
Bond
fund
|
30,270 | 189 | - | 30,459 | - | - | - | - | ||||||||||||||||||||||||
|
Time
deposit
|
5,676 | - | - | 5,676 | - | - | - | - | ||||||||||||||||||||||||
| $ | 36,351 | $ | 189 | $ | (239 | ) | $ | 36,301 | $ | 405 | $ | - | $ | (249 | ) | $ | 156 | |||||||||||||||
On
September 27, 2007, we entered into an unsecured Revolving Credit Facility with
Wells Fargo Bank, National Association (the “Revolving Facility”) with a maximum
amount available under the Revolving Facility of $50.0 million. Net of
outstanding letters of credit and limitations on availability, we had borrowing
capacity at December 31, 2009, of $48.5 million under the Revolving Facility. We
had no outstanding borrowings under the Revolving Facility as of December 31,
2009. As of December 31, 2009, we were in compliance with the financial
covenants of the Revolving Facility. The Revolving Facility matures in October
2012.
The key
terms of the Revolving Facility are as follows:
|
·
|
Loans
will bear interest at a variable rate equal to (at our option) (i) LIBOR
plus the applicable margin, which ranges from 0.60% to 1.00%, or (ii) the
Bank’s prime rate, less the applicable margin, which ranges from 0.25% to
1.00%. If an event of default occurs and is continuing, then
the interest rate on all obligations under the Revolving Facility may be
increased by 2.0% above the otherwise applicable rate, and the Bank may
declare any outstanding obligations under the Revolving Facility to be
immediately due and payable.
|
|
·
|
A
fee ranging from 0.60% to 1.00% on the maximum amount available to be
drawn under each letter of credit that is issued and outstanding under the
Revolving Facility will be required. The fee on the unused portion of
the Revolving Facility ranges from 0.125% to
0.20%.
|
|
·
|
Certain
of our domestic subsidiaries have guaranteed the Revolving
Facility.
|
|
·
|
The
Revolving Facility contains various restrictions and covenants, including
restrictions on our ability and the ability of our subsidiaries to
consolidate or merge, make acquisitions, create liens, incur additional
indebtedness or dispose of assets.
|
|
·
|
Financial
covenants include a Maximum Leverage test and a Minimum Tangible Net Worth
test, each as defined in the Revolving Facility. The minimum tangible
net worth required is $426,764,000 and the maximum funded debt to EBITDA
allowed is 2.50:1.
|
52
INTERMEC,
INC.
NOTES
TO CONSOLIDATED FINANCIAL STATEMENTS
Note
C: Fair Value Measurements
Financial
assets and liabilities are classified and disclosed in one of the following
three categories:
§ Level
1: Inputs based on quoted market prices for identical assets or liabilities in
active markets.
§ Level
2: Observable market based inputs or unobservable inputs that are corroborated
by market data.
§ Level
3: Unobservable inputs that are not corroborated by market data.
Our level
1 financial instrument values are based on quoted market prices in active
markets for identical assets, which we use to value our certificates of deposit,
money market funds and equity securities. Our level 2 financial instrument
values are based on comparable sales, such as quoted market rates for similar
contracts. We do not have any financial instruments that require valuation using
level 3 inputs.
Assets
and Liabilities Measured at Fair Value on a Recurring Basis
Our
financial assets and liabilities subject to these fair value measurement
provisions as of December 31, 2009 and 2008 consisted of the following (in
thousands):
|
Level
1
|
Level
2
|
Level
3
|
Balance
at December 31, 2009
|
|||||||||||||
|
Money
market funds
|
$ | 111,971 | $ | - | $ | - | $ | 111,971 | ||||||||
|
Certificates
of deposit
|
12,142 | - | - | 12,142 | ||||||||||||
|
Bond
fund
|
30,459 | - | - | 30,459 | ||||||||||||
|
Stock
|
166 | - | - | 166 | ||||||||||||
|
Derivative
instruments – assets
|
- | 1,743 | - | 1,743 | ||||||||||||
|
Total assets at fair value
|
$ | 154,738 | $ | 1,743 | $ | - | $ | 156,481 | ||||||||
|
Level
1
|
Level
2
|
Level
3
|
Balance
at December 31, 2009
|
|||||||||||||
|
Derivative
instruments – liabilities
|
$ | - | $ | (1,199 | ) | $ | - | $ | (1,199 | ) | ||||||
|
Total liabilities at fair value
|
$ | - | $ | (1,199 | ) | $ | - | $ | (1,199 | ) | ||||||
|
Level
1
|
Level
2
|
Level
3
|
Balance
at December 31, 2008
|
|||||||||||||
|
Money
market funds
|
$ | 132,309 | $ | - | $ | - | $ | 132,309 | ||||||||
|
Certificates
of deposit
|
3,709 | - | - | 3,709 | ||||||||||||
|
Stock
|
156 | - | - | 156 | ||||||||||||
|
Derivative
instruments – assets
|
- | 3,712 | - | 3,712 | ||||||||||||
|
Total assets at fair value
|
$ | 136,174 | $ | 3,712 | $ | - | $ | 139,886 | ||||||||
|
Level
1
|
Level
2
|
Level
3
|
Balance
at December 31, 2008
|
|||||||||||||
|
Derivative
instruments – liabilities
|
$ | - | $ | (7,271 | ) | $ | - | $ | (7,271 | ) | ||||||
|
Total liabilities at fair value
|
$ | - | $ | (7,271 | ) | $ | - | $ | (7,271 | ) | ||||||
53
INTERMEC,
INC.
NOTES
TO CONSOLIDATED FINANCIAL STATEMENTS
Note
C: Fair Value Measurements (continued)
Assets
and Liabilities Measured at Fair Value on a Nonrecurring Basis
All other
nonfinancial assets and liabilities measured at fair values in the financial
statements on a nonrecurring basis are subject to fair value measurements
and disclosures. Nonfinancial nonrecurring assets and liabilities included on
our condensed consolidated balance sheets include long lived assets that are
measured at fair value to test for and measure impairment, when necessary. No
such nonfinancial assets or liabilities were subject to fair value measurements
for the year ended December 31, 2009 and 2008.
The
estimated fair values of cash and cash equivalents, accounts
receivable, accounts payable and accrued expenses, and payroll and related
expenses at December 31, 2009 and 2008, approximate their carrying values due to
their short-term nature.
Note
D: Derivative Instruments
Due to
our global operations, we are exposed to foreign currency exchange rate
fluctuations in the normal course of our business. Our treasury policies allow
us to offset the risks associated with the effects of certain foreign currency
exposures through the purchase of foreign exchange forward contracts. Our
policy prohibits speculation in financial instruments for profit on the exchange
rate price fluctuation. We enter into foreign exchange forward
contracts primarily to hedge the impact of fluctuations of foreign exchange
arising from intercompany transactions, including inventory purchases made by
our subsidiaries that are denominated in U.S. dollars. Our foreign exchange
forward contracts are not designated as hedging instruments for accounting
purposes; accordingly, we record these contracts at fair value on the
consolidated balance sheets, with changes in fair value recognized in earnings
in the period of change. The aggregate notional amounts of the forward contracts
we held for foreign currencies were $107.3 million as of December 31,
2009. These contracts do not contain any credit-risk-related contingent
features.
We
attempt to manage the counterparty risk associated with these foreign exchange
forward contracts by limiting transactions to counterparties with which we have
an established banking relationship. In addition, these contracts generally
settle in approximately 30 days. See Note C, Fair Value Measurements, for
information on the fair value of these contracts.
The net
gain resulted from these contracts recorded in selling, general and
administrative expense was not material for the years ended December 31,
2009.
Note
E: Inventories
Inventories
consisted of the following (in thousands):
|
December
31,
|
||||||||
|
2009
|
2008
|
|||||||
|
Raw
Materials
|
$ | 45,449 | $ | 44,503 | ||||
|
Service
parts
|
7,794 | 8,772 | ||||||
|
Work
in process
|
252 | 269 | ||||||
|
Finished
goods
|
48,042 | 63,405 | ||||||
|
Inventories, net
|
$ | 101,537 | $ | 116,949 | ||||
In
addition to the inventories described above, service parts inventories totaling
$4.3 and $4.0 million that were not expected to be sold within the next 12
months are classified as other assets as of December 31, 2009, and 2008,
respectively.
54
INTERMEC,
INC.
NOTES
TO CONSOLIDATED FINANCIAL STATEMENTS
Note
F: Property, Plant and Equipment
The
components of property, plant and equipment were as follows (in
thousands):
|
December
31,
|
||||||||
|
2009
|
2008
|
|||||||
|
Land
|
$ | 4,924 | $ | 4,924 | ||||
|
Buildings
and improvements
|
7,007 | 6,502 | ||||||
|
Machinery
and equipment
|
142,884 | 137,795 | ||||||
|
Total
property, plant and equipment, at cost
|
154,815 | 149,221 | ||||||
|
Less:
accumulated depreciation
|
(117,432 | ) | (107,873 | ) | ||||
|
Total
property, plant and equipment, net
|
$ | 37,383 | $ | 41,348 | ||||
Depreciation
expense from continuing operations was $14.9, $15.5 and $12.6 million for the
years ended December 31, 2009, 2008 and 2007, respectively. Depreciation is
calculated principally on the straight-line method over the estimated useful
lives of the assets. The ranges of estimated useful lives of the major classes
of assets are:
|
Buildings
|
21-30
years
|
|
Building
improvements
|
2-10
years
|
|
Machinery
and equipment
|
2-10
years
|
Various
properties we own that are not used for operations are classified as other
assets with a total carrying value of $7.1 million and $9.2 million as
of December 31, 2009 and 2008, respectively.
As of
December 31, 2009, and 2008, we have remaining deferred gains of $2.4 and
$2.8 million, respectively, related to sale-leaseback transactions. These
deferred gains are being amortized straight-line over the terms of the related
leases. Payments due under non-cancelable future leases during the next five
years are as follows (in millions): 2010 - $11.5; 2011 - $8.8; 2012 - $6.9; 2013
- $6.5 and 2014 - $4.3.
Rental
expense for operating leases from continuing operations, including amounts for
short-term leases with nominal, if any, future rental commitments, was $12.1,
$11.9 and $9.1 million for the years ended December 31, 2009, 2008 and
2007, respectively.
Aggregate
future minimum rental income to be received under non-cancelable subleases is
not material at December 31, 2009.
55
INTERMEC,
INC.
NOTES
TO CONSOLIDATED FINANCIAL STATEMENTS
Note G: Intangibles
For the
year ended December 31, 2009, and 2008, intangibles, net, consisted of $2.6 and
$3.5 million, respectively, related to our patent portfolio. The gross carrying
amount and accumulated amortization of our finite-lived intangibles were as
follows (in thousands):
|
December
31,
|
||||||||
|
2009
|
2008
|
|||||||
|
Gross
carrying amount
|
$ | 12,059 | $ | 11,962 | ||||
|
Less:
accumulated amortization
|
(9,472 | ) | (8,441 | ) | ||||
|
Intangibles, net
|
$ | 2,587 | $ | 3,521 | ||||
Amortization
expense on intangible assets was $1.1, $1.0 and $0.7 million, for the years
ended December 31, 2009, 2008 and 2007, respectively.
Estimated
amortization expense for the succeeding five fiscal years is as follows (in
millions): 2010 - $0.8; 2011 - $0.5; 2012 - $0.4; 2013 - $0.4 and 2014 -
$0.4.
56
INTERMEC,
INC.
NOTES
TO CONSOLIDATED FINANCIAL STATEMENTS
Note
H: Shareholders’ Equity
Stock
Options
We
account for stock-based compensation based on the estimated value
method using the Black-Scholes valuation model. Stock-based compensation cost is
recognized as expense over the applicable vesting period of the stock award
using a straight-line amortization method, net of estimated forfeitures. When
estimating forfeitures, we consider voluntary termination behaviors as well as
trends of actual option forfeitures. The impact on our results of operations of
recording stock-based compensation for the years ended December 31 is as follows
(in thousands):
|
For
the Year Ended December 31,
|
||||||||||||
|
2009
|
2008
|
2007
|
||||||||||
|
Cost
of revenues
|
$ | 252 | $ | 229 | $ | 507 | ||||||
|
Selling,
general and administrative
|
7,152 | 6,462 | 8,464 | |||||||||
| Total | $ | 7,404 | $ | 6,691 | $ | 8,971 | ||||||
Cash flows resulting from excess tax benefits are classified as a part of cash flows from financing activities. Excess tax benefits are realized tax benefits from tax deductions for exercised options in excess of the deferred tax asset attributable to stock compensation costs for such options. Excess tax benefits of approximately $0.0, $0.9 and $2.1 million have been classified as a source of cash from financing activities for the years ended December 31, 2009, 2008 and 2007, respectively. Cash received from option exercises under all share-based payment arrangements for the years ended December 31, 2009, 2008 and 2007 was $0.6, $4.4 and $8.4 million, respectively. The total income tax benefit recognized in the statement of operations for stock-based compensation costs was $0.7, $2.4 and $3.4 million for the years ended December 31, 2009, 2008 and 2007, respectively. We calculated the fair value of each option award on the date of grant using the Black-Scholes option pricing model. The following assumptions were used for each respective period for options granted to our employees:
|
2009
|
2008
|
2007
|
||||||||||
|
Risk-free
interest rate
|
2.33 | % | 3.08 | % | 4.72 | % | ||||||
|
Expected
term in years
|
5.05 | 4.73 | 4.90 | |||||||||
|
Expected
stock price volatility
|
47.11 | % | 42.12 | % | 38.35 | % | ||||||
|
Expected
dividend yield
|
0.00 | % | 0.00 | % | 0.00 | % | ||||||
The
average fair value of the options granted to employees based on the above
assumptions was $5.05, $8.38 and $9.87 per option for the years ended December
31, 2009, 2008 and 2007, respectively. All grants of our options under all plans
must be approved or authorized by the Compensation Committee of the Board of
Directors, which consists entirely of non-employee directors.
We
granted 85,560 options to our directors in 2009 with an average fair value of
$5.48 per option. The average fair value of the options granted to directors was
$11.05 per option and $10.92 per option for the years ended December 31, 2008
and 2007, respectively. The Black-Scholes assumptions used for these
calculations were as follows:
|
2009
|
2008
|
2007
|
||||||||||
|
Risk-free
interest rate
|
2.38 | % | 3.15 | % | 4.66 | % | ||||||
|
Expected
term in years
|
6.45 | 6.59 | 5.78 | |||||||||
|
Expected
stock price volatility
|
46.86 | % | 46.00 | % | 40.14 | % | ||||||
|
Expected
dividend yield
|
0.00 | % | 0.00 | % | 0.00 | % | ||||||
57
INTERMEC,
INC.
NOTES
TO CONSOLIDATED FINANCIAL STATEMENTS
Note
H: Shareholders’ Equity (Continued)
Our
computation of expected stock price volatility is based on a combination of
historical and market-based implied volatility. The implied volatility
is derived from weighted average of traded options of our own
stocks and traded options of a group of peer stocks. Our computation
of expected life is determined based on historical experience of similar awards,
giving consideration to the contractual terms of the stock-based awards, vesting
schedules and expectations of future employee behavior. The risk-free interest
rate for periods within the contractual life of the award is based on the
U.S. Treasury yield curve in effect at the time of grant.
Our 2008
Omnibus Incentive Plan was approved by our shareholders on May 23, 2008 (the
“2008 Omnibus Plan”). The 2008 Omnibus Plan provides for the grant of incentive
awards to officers, other employees, directors and consultants. Previously, we
made grants of incentive awards under the 2004 Omnibus Incentive Compensation
Plan, the 2002 Director Stock Option and Fee Plan, the 2001 Stock Incentive
Plan, and the 1999 Stock Incentive Plan (collectively, the “Prior Plans”).
However, as of the date of shareholder approval of the 2008 Omnibus Plan, the
2008 Omnibus Plan replaced the Prior Plans and no new grants will be made under
any of the Prior Plans.
The
numbers of shares of common stock authorized for issuance under the 2008 Omnibus
Plan is 3,650,000. In addition, (a) any shares not subject to awards under the
Prior Plans as of May 23, 2008 (the date of stockholder approval of the 2008
Omnibus Plan) plus (b) any shares subject to outstanding awards under the Prior
Plans as of May 23, 2008, that cease to be subject to such awards (other than
from exercise or settlement of the awards in vested shares, such as from awards
expiring, terminating or being forfeited) will automatically become available
for issuance under the 2008 Omnibus Plan, up to an aggregate maximum of
4,764,363 shares. Including the number of shares that may become available for
issuance under the 2008 Omnibus Plan from the Prior Plans, as of May 23, 2008,
the maximum number of shares that may be issued under the 2008 Omnibus Plan was
8,414,363 shares.
Shares of
common stock covered by an award granted under the 2008 Omnibus Plan will not be
counted as used unless and until they are issued and delivered to a participant.
Such shares may also become available again for issuance under the 2008 Omnibus
Plan if the awards to which the shares are subject are forfeited, lapse or
expire, are settled in cash, or the shares are withheld for payment of taxes or
the purchase price of an award.
As of
December 31, 2009, there were 1,997,749 shares subject to outstanding awards
granted under the 2008 Omnibus Plan. As of December 31, 2009, there were
2,220,084 shares subject to outstanding awards granted under the Prior
Plans.
Incentive
awards may be granted in the form of nonqualified or incentive stock options,
stock appreciation rights, restricted stock, stock units and performance units,
performance shares or other stock or cash-based awards. Under the 2008 Omnibus
Plan (with limited exceptions) and under the Prior Plans, stock options may not
be granted at an exercise price less than the fair market value of our common
stock on the date of grant. Options granted under the 2008 Omnibus Plan
generally vest in equal increments over four years and expire in ten years,
except in the case of earlier termination of employment or service; options
granted under the Prior Plans generally vest in equal increments over five years
and expire in ten years, except in the case of earlier termination of employment
or service.
The 2002
Director Stock Option and Fee Plan (“2002 DSOP”) was one of the Prior Plans.
Upon approval of the 2008 Omnibus Plan, the 2002 DSOP was amended and restated
and renamed the “Director Deferred Compensation Plan.” The 2002 DSOP and the
1997 Director Stock Option Plan (“1997 DSOP” and, collectively, “DSOPs”)
provided for the grant of stock options to our non-employee directors. The
number of shares authorized for grant under the 2002 DSOP was 745,000. No
additional shares are authorized under the 1997 DSOP. Subsequent to the grant of
255,000 options under the 1997 DSOP, it was frozen upon the approval of the 2002
DSOP. Under the 2002 DSOP, stock options were granted annually at an exercise
price equal to the fair market value of our common stock on the date of grant.
The number of options granted annually to each director was fixed by the 2002
DSOP. Prior to 2006, such options became fully exercisable on the first
anniversary of their date of grant. Pursuant to an amendment, the grant made to
the directors in January 2006, vested immediately. Therefore, the corresponding
expense was recorded in the quarter ended April 2, 2006. For 2007, the options
granted to our directors under the 2002 DSOP vested over four
quarters.
58
INTERMEC,
INC.
NOTES
TO CONSOLIDATED FINANCIAL STATEMENTS
Note
H: Shareholders’ Equity (Continued)
Beginning
in 2008, upon approval of the 2008 Omnibus Plan, grants of stock options and
other awards are made to our non-employee directors under the 2008 Omnibus Plan.
Under the “Director Compensation Program under the 2008 Omnibus Incentive Plan”
(the “2008 Program”), directors are annually granted a combination of stock
options and restricted deferred stock units. The number of stock options and
restricted deferred stock units is determined under the terms of the 2008
Program. Certain pro rata grants were made in 2008 to reflect the transition
from the arrangements in prior calendar years, and these grants vested on
December 31, 2008. In 2009, the Board made a one-time 25% reduction in the
number of stock options and restricted deferred stock units that would have been
granted under the 2008 Program. Otherwise, annual option grants generally vest
and become exercisable in four equal installments on the first business day of
each fiscal quarter, beginning on the date of grant, and generally expire seven
years from the date of grant. Restricted deferred stock unit grants become fully
vested on the date of the annual meeting of stockholders following the date of
grant provided a director continues to serve on the Board during that period. In
the event of a director’s termination of service prior to vesting, all unvested
restricted deferred stock units are automatically forfeited to the Company. All
restricted deferred stock unit grants to directors under the 2008 Program will
automatically be deferred into and subject to the Director Deferred Compensation
Plan.
As of
December 31, 2009, there were 3.82 million shares available for grant under
our 2008 Omnibus Plan. The following table summarizes outstanding options under
both the 2008 Omnibus Plan and under our Prior Plans:
|
Number
of Shares
|
Weighted-Average
Exercise Price Per Share
|
Weighted-Average
Remaining Contractual Term (In Years)
|
Aggregate
Intrinsic Value
|
|||||||||||||
|
Outstanding
at January 1, 2009
|
3,280,232 | $ | 20.66 | |||||||||||||
|
Granted
|
829,002 | 11.52 | ||||||||||||||
|
Exercised
|
(89,850 | ) | 6.54 | |||||||||||||
|
Forfeited
|
(23,501 | ) | 12.05 | |||||||||||||
|
Canceled
|
(615,882 | ) | 20.34 | |||||||||||||
|
Outstanding
at December 31, 2009
|
3,380,001 | 18.83 | 2.82 | $ | 3,059,726 | |||||||||||
|
Vested
and expected to vest at December 31, 2009
|
1,882,921 | 19.80 | 5.93 | $ | 2,136,773 | |||||||||||
|
Exercisable
at December 31, 2009
|
1,681,689 | 19.80 | 5.67 | $ | 1,994,705 | |||||||||||
The
aggregate intrinsic value in the table above is the amount, by which the market
value of the underlying stock exceeded the exercise price of outstanding
options, is before applicable income taxes and represents the amount the option
holder would have realized if all in-the-money options had been exercised on the
last business day of the period indicated.
As of
December 31, 2009, there was $8.7 million of total unrecognized
compensation cost related to non-vested options. That cost is expected to be
recognized over a weighted average period of 2.1 years.
During
fiscal years 2009, 2008, and 2007, the following activity occurred under our
plans:
|
(in thousands)
|
2009
|
2008
|
2007
|
|||||||||
|
Total
intrinsic value of stock options exercised
|
$ | 594 | $ | 7,932 | $ | 8,004 | ||||||
|
Total
fair value of stock awards vested
|
515 | 30 | 1,330 | |||||||||
|
Total
fair value of shared performance stock awards vested
|
855 | 855 | 1,236 | |||||||||
59
INTERMEC,
INC.
NOTES
TO CONSOLIDATED FINANCIAL STATEMENTS
Note
H: Shareholders’ Equity (Continued)
Stock
Awards
The fair
value of each restricted stock award (“RSA”) and unit (“RSU”) is the market
price of the underlying stock as of the date of grant. As of December 31, 2009,
there was $2.9 million of total unrecognized compensation cost related to
non-vested RSU’s. That cost is expected to be recognized over a weighted average
period of 17 months.
Shared
Performance Stock Awards are a form of stock award in which the number of shares
ultimately received depends on our performance against specified performance
targets. The performance period is January 1 through December 31 and covers a
period of 3 fiscal years. At the end of the performance period, the number of
shares of stock and stock awards issued will be determined by adjusting upward
or downward from the target in a range between 0% and 200%. The final
performance percentage, on which the payout will be based, considering
performance metrics established for the performance period, will be determined
by the Board of Directors or a committee of the Board in its sole discretion.
Shares of stock will be issued following the end of the performance period.
Shared Performance Stock Awards are amortized over the vesting period (generally
32 months) using the straight-line method. There was no unrecognized
compensation cost related to non-vested shared performance stock awards at
December 31, 2009.
The
following table summarizes changes in non-vested restricted stock awards and
non-vested shared performance stock awards:
|
Restricted
stock awards:
|
Number
of Shares
|
Weighted-Average
Grant Date Fair Value
|
||||||
|
Non-vested
balance at January 1, 2009
|
46,667 | $ | 18.61 | |||||
|
Granted
|
240,017 | 11.01 | ||||||
|
Vested
|
(42,666 | ) | 12.06 | |||||
|
Forfeited
|
(28,177 | ) | 11.38 | |||||
|
Non-vested
balance at December 31, 2009
|
215,841 | 11.54 | ||||||
|
Shared
performance stock awards:
|
||||||||
|
Non-vested
balance at January 1, 2009
|
276,748 | $ | 22.84 | |||||
|
Granted
|
153,194 | 10.88 | ||||||
|
Vested
|
(81,836 | ) | 10.45 | |||||
|
Forfeited
|
(94,385 | ) | 16.17 | |||||
|
Non-vested
balance at December 31, 2009
|
253,721 | 15.62 | ||||||
Employee Stock Purchase
Plan
Our 2008
Employee Stock Purchase Plan was approved by our shareholders on May 23, 2008
(the “2008 ESPP”) and became effective on July 1, 2008 (the “2008 ESPP”). Under
the 2008 ESPP, 1,500,000 shares of our common stock are authorized and reserved
for issuance.
The 2008
ESPP provides for the issuance to our employees of shares of our common stock
pursuant to options granted under: (a) an employee stock purchase plan that is
intended to qualify under the terms of Internal Revenue Code Section 423(b) (the
“423 Plan”); and (b) an employee stock purchase plan that is not intended to
qualify under Internal Revenue Code Section 423(b) (the “Non-423 Plan”).
Participants granted options under the 423 Plan must have the same rights and
privileges within the meaning of U.S. federal tax laws, except as may be
required by other applicable laws.
60
INTERMEC,
INC.
NOTES
TO CONSOLIDATED FINANCIAL STATEMENTS
Note
H: Shareholders’ Equity (Continued)
If an
Intermec subsidiary participates either in the 423 Plan or in the Non-423 Plan,
all eligible employees of that subsidiary may elect to participate in the 2008
ESPP. Eligible employees who elect to participate in the 2008 ESPP may authorize
payroll deductions for the purchase of our common stock but may not purchase
more than $25,000 worth of shares in any calendar year (based on the fair market
value of a share as of the beginning of an offering period). Participants may,
at any time and for any reason, cancel their payroll deduction authorizations
and have accumulated payroll deductions applied to the purchase of shares under
the 2008 ESPP or have the amount refunded to them. Offering periods under the
2008 ESPP begin on the first day of the quarter and end on the last day of that
quarter. Accumulated payroll deductions are used to purchase our common stock at
85 percent of the fair market value of a share as of the last day of an offering
period.
Before
the 2008 ESPP became effective, we administered an employee stock purchase plan
that had been adopted by our Board and approved by our shareholders in 1997 (the
“Prior ESPP”). The Prior ESPP terminated on July 1, 2008. Under the Prior ESPP,
5,000,000 shares of our common stock were reserved for issuance. The eligibility
of employees to participate in the Prior ESPP, contribute payroll deductions and
cancel payroll deduction authorizations was substantially the same as described
in the preceding paragraph regarding the 2008 ESPP. Similarly, the offering
period and purchase price of our common stock (i.e., 85 percent of the fair
market value of a share as of the grant date applicable to the participant) was
the same under the Prior ESPP as it is currently under the 2008
ESPP.
The
company incurs a compensation expense equal to the value of the 15 percent
discount given to participants for the purchase of shares under the 2008 ESPP
and, previously, under the Prior ESPP. The aggregate compensation expense
related to the 2008 ESPP and the Prior ESPP for the years ended December 31,
2009, 2008 and 2007, was $0.5, $0.5 and $0.5 million, respectively. The
compensation expense under our 2008 ESPP and Prior ESPP is recognized ratably
over the period from the start of the offering period to the date shares are
purchased, which is three-month period.
Capital
Stock
At
December 31, 2009, and 2008, 250 million shares of common stock, par value
$0.01, and 50 million shares of preferred stock, par value $0.01 were authorized
for issuance. At December 31, 2009, and 2008, 62,203,496 and 61,766,095 shares
of common stock were outstanding, respectively. There were no shares of
preferred stock outstanding at December 31, 2009, or 2008.
(Loss)
Earnings Per Share
Basic
(loss) earnings per share is calculated using the weighted average number of
common shares outstanding for the year. Diluted (loss) earnings per share is
computed using basic weighted average outstanding shares plus the dilutive
effect on income of unvested restricted stock and outstanding stock options
using the “treasury stock” method.
Shares
used for basic and diluted (loss) earnings per share were computed as follows
for the years ended December 31:
|
2009
|
2008
|
2007
|
||||||||||
|
Weighted
average common shares - basic
|
61,643,892 | 61,182,854 | 60,358,552 | |||||||||
|
Dilutive
effect of options, unvested restricted shares and other common stock
equivalents
|
- | 475,306 | 804,658 | |||||||||
|
Weighted
average shares - diluted
|
61,643,892 | 61,658,160 | 61,163,210 | |||||||||
At
December 31, 2009, and 2008, employees and directors held options to
purchase 2,309,465 and 2,864,405 shares, respectively, of common stock that were
anti-dilutive to the computation of diluted (loss) earnings per share from
continuing operations due to the exercise price of these options exceeding the
average fair value of our common stock for the period. These options could
become dilutive in future periods if the average market price of our common
stock exceeds the exercise price of the outstanding options and we report net
earnings.
61
INTERMEC,
INC.
NOTES
TO CONSOLIDATED FINANCIAL STATEMENTS
Note
H: Shareholders’ Equity (Continued)
Accumulated
Other Comprehensive Loss
At
December 31, 2009 and 2008, accumulated other comprehensive loss comprised
the following (in thousands):
|
December
31,
|
||||||||
|
2009
|
2008
|
|||||||
|
Foreign
currency translation adjustment
|
$ | 3,900 | $ | (792 | ) | |||
|
Unamortized
benefit plan costs, net of tax
|
(43,402 | ) | (49,645 | ) | ||||
|
Unrealized
loss on securities, net of tax
|
(182 | ) | (319 | ) | ||||
|
Accumulated
other comprehensive loss
|
$ | (39,684 | ) | $ | (50,756 | ) | ||
Comprehensive (loss) income for the years ended December 31, 2009, 2008 and
2007 was as follows (in thousands):
|
For
the Year Ended
|
||||||||||||
|
December
31, 2009
|
December
31, 2008
|
December
31, 2007
|
||||||||||
|
Net
(loss) earnings
|
$ | (11,843 | ) | $ | 35,686 | $ | 23,052 | |||||
|
Other
comprehensive income (loss):
|
||||||||||||
|
Foreign
currency translation adjustments
|
4,692 | (9,729 | ) | 5,851 | ||||||||
|
Unrealized
gain (loss) on investment, net of tax
|
137 | (319 | ) | 95 | ||||||||
|
Remeasurement
and amortization of benefit plan costs (credits), net of
tax
|
6,243 | (41,761 | ) | 22,668 | ||||||||
|
Total
other comprehensive income (loss)
|
11,072 | (51,809 | ) | 28,614 | ||||||||
|
Total
comprehensive (loss) income
|
$ | (771 | ) | $ | (16,123 | ) | $ | 51,666 | ||||
Note I: Restructuring
2009
Restructuring Charges:
In
January 2009, we committed to a business restructuring plan intended to
reorganize our sales function and to reduce our operating cost structure and
improve efficiency. The total restructuring costs for this plan are expected to
be approximately $9.8 million, including employee termination costs of
approximately $8.4 million, and $1.4 million of other transitional costs. We
recorded most of the restructuring charges in 2009, and the remainder will be
recorded through 2010. We anticipate that substantially all of the
severance-related and periodic transitional costs will be cash expenditures. We
made cash payments of $9.5 million in 2009 for the January restructuring
plan.
In April
2009, we committed to a business restructuring plan primarily consisting of a
reduction of our work force. The total restructuring costs for this plan are
expected to be in a pre-tax range of $11.0 to $13.0 million, including
employee termination costs of $10.0 to $11.0 million, and $1.0 to $2.0
million of other transitional costs. We recorded most of the restructuring
charges in 2009, and expect to record the remainder through 2010. We anticipate
that substantially all of the severance-related and periodic transitional costs
will be cash expenditures. We made cash payments of $8.3 million in 2009 for the
April restructuring plan.
2008
Restructuring Charges:
In July
2008, we committed to a business restructuring plan intended to reduce our cost
structure and streamline operations, which included the relocation of product
final assembly to a contract manufacturer in Asia, the consolidation of North
American service depot locations and the transfer of on-site repair in North
America to a third party service provider. We commenced implementation of
the plan in the third quarter of 2008, and it was fully implemented in the
second quarter of 2009. All severance and other periodic transitional costs were
cash expenditures. All restructuring costs related to this action were accrued
in 2008. We made cash payments of $1.2 million in 2009 for the 2008
restructuring plan.
We
believe these restructuring actions were appropriate strategically and were
prudent in light of the generally weakened global economy and uncertain market
conditions.
62
INTERMEC,
INC.
NOTES
TO CONSOLIDATED FINANCIAL STATEMENTS
Note
I: Restructuring (continued)
The
following table displays the restructuring charges incurred by business segment
for the year ended December 31, 2009, and 2008 (in millions):
|
Restructuring
Charges Recorded for the Year Ended
|
||||||||||||||||
|
Segment
|
Total
Charges Expected to be Incurred for 2008 and 2009 Restructuring
Plans
|
December
31, 2009
|
December
31, 2008
|
Total
Restructuring Charges Incurred to Date
|
||||||||||||
|
Product
|
$ | 3.4 | $ | 1.4 | $ | 1.7 | $ | 3.1 | ||||||||
|
Service
|
3.2 | 1.4 | 1.4 | 2.8 | ||||||||||||
|
Unallocated
|
22.3 | 17.8 | 2.6 | 20.4 | ||||||||||||
|
Total
|
$ | 28.9 | $ | 20.6 | $ | 5.7 | $ | 26.3 | ||||||||
The
reconciliation of accrued restructuring charges for the years ended December 31,
2009 and 2008 is summarized in the table below (in millions):
|
Accrued
Employee Termination Costs per Contract
|
Accrued
One-Time Employee Termination Costs
|
Accrued
Total Employee Termination Costs
|
Accrued
Other Costs
|
Total
Accrued Restructuring Charges
|
||||||||||||||||
|
Restructuring
charges for 2008 restructuring plan
|
$ | 3.0 | $ | 2.0 | $ | 5.0 | $ | 0.7 | $ | 5.7 | ||||||||||
|
Utilization
of 2008 restructuring plan
|
(1.8 | ) | (2.0 | ) | (3.8 | ) | (0.6 | ) | (4.4 | ) | ||||||||||
|
Balance
at December 31, 2008
|
1.2 | - | 1.2 | 0.1 | 1.3 | |||||||||||||||
|
2009
restructuring charges
|
8.5 | 10.7 | 19.2 | 1.4 | 20.6 | |||||||||||||||
|
Utilization
of 2008 restructuring plan
|
(1.2 | ) | - | (1.2 | ) | - | (1.2 | ) | ||||||||||||
|
Utilization
of 2009 restructuring plans
|
(5.9 | ) | (10.4 | ) | (16.3 | ) | (1.5 | ) | (17.8 | ) | ||||||||||
|
Balance
at December 31, 2009
|
$ | 2.6 | $ | 0.3 | $ | 2.9 | $ | - | $ | 2.9 | ||||||||||
63
INTERMEC,
INC.
NOTES
TO CONSOLIDATED FINANCIAL STATEMENTS
Note
J: Income Taxes
(Loss)
earnings from continuing operations before income taxes by geographic area are
as follows (in thousands):
|
Year
Ended December 31,
|
||||||||||||
|
2009
|
2008
|
2007
|
||||||||||
|
United
States
|
$ | (26,871 | ) | $ | 34,205 | $ | 26,180 | |||||
|
International
|
7,736 | 15,096 | 12,998 | |||||||||
|
(Loss) earnings from continuing operations before income
taxes
|
$ | (19,135 | ) | $ | 49,301 | $ | 39,178 | |||||
Income
taxes for continuing operations consist of the following provision (in
thousands):
|
Year
Ended December 31,
|
||||||||||||
|
2009
|
2008
|
2007
|
||||||||||
|
Current:
|
||||||||||||
|
United
States
|
$ | (708 | ) | $ | (484 | ) | $ | - | ||||
|
State
|
1,993 | 744 | - | |||||||||
|
International
|
2,619 | 3,596 | 6,488 | |||||||||
|
Total
current
|
3,904 | 3,856 | 6,488 | |||||||||
|
Deferred:
|
||||||||||||
|
United
States
|
(10,553 | ) | 8,110 | 7,688 | ||||||||
|
State
|
(1,836 | ) | 1,958 | 865 | ||||||||
|
International
|
222 | (309 | ) | (198 | ) | |||||||
|
Total
deferred
|
(12,167 | ) | 9,759 | 8,355 | ||||||||
|
Provision (benefit)
for income taxes
|
$ | (8,263 | ) | $ | 13,615 | $ | 14,843 | |||||
The following is a reconciliation of income taxes at the U.S. statutory rate to the provision for income taxes:
|
Year
Ended December 31,
|
||||||||||||
|
2009
|
2008
|
2007
|
||||||||||
|
Tax
at U.S. statutory rate
|
(35.0 | %) | 35.0 | % | 35.0 | % | ||||||
|
State
income taxes, net of federal benefit
|
0.8 | % | 3.7 | % | 1.2 | % | ||||||
|
Research
and experimentation tax credits
|
(4.9 | %) | (1.8 | %) | (3.4 | %) | ||||||
|
U.S.
tax on repatriation of earnings
|
0.4 | % | 0.1 | % | (0.9 | %) | ||||||
|
Foreign
net earnings taxed at other than U.S. statutory rate
|
(3.9 | %) | (2.9 | %) | 2.3 | % | ||||||
|
Foreign
Tax Credit adjustments
|
(0.0 | )% | (10.8 | %) | (0.0 | )% | ||||||
|
Tax
settlement
|
(4.2 | %) | (0.3 | %) | 0.0 | % | ||||||
|
Change
in tax contingencies
|
(0.0 | )% | 0.0 | % | (3.3 | %) | ||||||
|
Change
in valuation allowance
|
1.0 | % | 1.1 | % | 5.6 | % | ||||||
|
Stock
compensation expense
|
4.1 | % | 1.8 | % | 2.2 | % | ||||||
|
Officers'
life insurance
|
(0.0 | )% | 0.0 | % | (2.1 | %) | ||||||
|
Other
items
|
(1.5 | %) | 1.7 | % | 1.3 | % | ||||||
|
Provision
(benefit) for income taxes
|
(43.2 | %) | 27.6 | % | 37.9 | % | ||||||
64
INTERMEC,
INC.
NOTES
TO CONSOLIDATED FINANCIAL STATEMENTS
Note
J: Income Taxes (Continued)
Deferred
income taxes reflect the net tax effect of transactions which are recognized in
different periods for financial and tax reporting purposes. The primary
components of our deferred tax assets and liabilities are as follows (in
thousands):
|
December
31,
|
||||||||
|
2009
|
2008
|
|||||||
|
Current
deferred tax assets:
|
||||||||
|
Accrued
expenses
|
$ | 10,593 | $ | 13,246 | ||||
|
Receivable
and inventories
|
11,991 | 12,476 | ||||||
|
Deferred
income
|
12,400 | - | ||||||
|
Net
operating loss carryforwards
|
1,986 | 23,901 | ||||||
|
Capitalized
R&D
|
5,084 | 3,346 | ||||||
|
Tax
credit carryforwards
|
9,439 | 6,265 | ||||||
|
Other
items
|
139 | 1,342 | ||||||
|
Total
current deferred tax assets
|
51,632 | 60,576 | ||||||
|
Valuation
allowance
|
(492 | ) | (4,281 | ) | ||||
|
Net
current deferred tax assets
|
51,140 | 56,295 | ||||||
|
Long-term
deferred tax assets:
|
||||||||
|
Postretirement
obligations
|
30,641 | 33,652 | ||||||
|
Intangibles
|
4,395 | 6,413 | ||||||
|
Tax
credit carryforwards
|
77,053 | 89,376 | ||||||
|
Deferred
income
|
26,372 | 6,312 | ||||||
|
Fixed
assets
|
1,578 | 1,381 | ||||||
|
Net
operating loss carryforwards
|
1,919 | 1,092 | ||||||
|
Capitalized
R&D
|
37,266 | 25,103 | ||||||
|
Cumulative
translation adjustments
|
684 | 1,158 | ||||||
|
Other
items
|
4,214 | 8,273 | ||||||
|
Total
long-term deferred tax assets
|
184,122 | 172,760 | ||||||
|
Valuation
allowance
|
(1,665 | ) | (4,926 | ) | ||||
|
Net
long-term deferred tax assets
|
182,457 | 167,834 | ||||||
|
Net
total deferred tax assets
|
$ | 233,597 | $ | 224,129 | ||||
65
INTERMEC,
INC.
NOTES
TO CONSOLIDATED FINANCIAL STATEMENTS
Note
J: Income Taxes (Continued)
We have
considered future market growth, forecasted earnings, future taxable income and
the mix of earnings in the jurisdictions in which we operate along with prudent,
feasible and permissible tax planning strategies in determining the
realizability of deferred tax assets. Projections inherently include a level of
uncertainty that could result in lower than expected future taxable income. If
we were to determine that it was not more likely than not that we
would be able to realize a portion of our net deferred tax asset in
the future for which there is currently no valuation allowance, an adjustment to
the net deferred tax asset would be charged to earnings in the period such
determination was made. Conversely, if we were to make a determination that it
is more likely than not that the deferred tax assets for which there is
currently a valuation allowance would be realized, the related valuation
allowance would be reduced and a benefit to earnings would be recorded. Our
deferred tax assets include tax losses and tax credits that remain with us from
discontinued operations.
In 2009,
as part of our supply chain restructuring, we licensed non-U.S. IP exploitation
rights from our domestic corporations to a wholly owned non-U.S. subsidiary
related to our product manufacturing and supply chain operations. This
transaction did not impact the 2009 effective tax rate or operating
results.
In 2009,
we reduced our deferred tax assets and the corresponding valuation allowance by
$7.4 million for expired tax attributes, including R&D credits and state
losses attributed to discontinued operations.
We had
available at December 31, 2009, $34.3 million of general business credit
carry-forwards and $52.0 million of foreign tax credit carry-forwards. The
general business credit carry-forwards have expiration dates ranging from 2010
through 2029. The foreign tax credit carry-forwards have expiration dates
ranging from 2010 to 2019. We have no valuation allowance for these assets at
December 31, 2009.
At
December 31, 2009, we had foreign net operating tax loss carry-forwards in
Canada that resulted in a deferred tax asset of $0.3 million; in Italy that
resulted in a deferred tax asset of $0.1 million; and in the Netherlands that
resulted in a deferred tax asset of $0.3 million after considering a valuation
allowance of $0.5 million.
We had
available at December 31, 2009, capital tax loss carry-forwards in the
United States of approximately $8.2 million, which expire in 2010. We also had
available at December 31, 2009, capital loss carry-forwards in the U.K. of
approximately $23.0 million, which carry forward indefinitely. No
deferred tax asset has been recognized for capital loss carry-forwards in the
United States or the U.K.
We have
recognized deferred tax assets of $1.7 million at December 31, 2009, for state
net operating loss carry-forwards from continuing operations.
We
conduct business in various countries throughout the world and we are subject to
tax in numerous jurisdictions. As a result of our business activities, we file a
significant number of tax returns that are subject to audit by various tax
authorities. Tax audits are often complex and may require several years to
resolve. Our future results may include favorable or unfavorable adjustments to
our estimated tax liabilities in the period the assessments are made or resolved
or when statutes of limitation on potential assessments expire. As a result, our
effective tax rate may fluctuate significantly on a quarterly and annual
basis.
We have
not provided deferred U.S. income taxes on undistributed earnings of certain
foreign subsidiaries that we intend to reinvest permanently outside of the U.S.;
the total amount of such earnings as of December 31, 2009, was $71.3
million. Should we distribute earnings of foreign subsidiaries in the form of
dividends or otherwise, we may be subject to U.S. income taxes. Due to
complexities in tax laws and various assumptions that would have to be made, it
is not practicable to estimate the amount of unrecognized deferred U.S. taxes on
these earnings.
66
INTERMEC,
INC.
NOTES
TO CONSOLIDATED FINANCIAL STATEMENTS
Note
J: Income Taxes (Continued)
The
following table sets forth the reconciliation of the beginning and ending amount
of unrecognized tax benefits (in thousands):
|
2009
|
2008
|
2007
|
||||||||||
|
Balance
at January 1
|
$ | 19,938 | $ | 19,951 | 21,132 | |||||||
|
Additions
related to positions taken this year
|
7,760 | 288 | - | |||||||||
|
Additions
for tax positions of prior years
|
- | - | 641 | |||||||||
|
Reductions
for tax positions of prior years
|
- | (42 | ) | (1,633 | ) | |||||||
|
Reductions
for tax positions of prior years-lapse of statute
|
(93 | ) | (150 | ) | (189 | ) | ||||||
|
Settlements
|
- | (109 | ) | - | ||||||||
|
Balance
at December 31
|
$ | 27,605 | $ | 19,938 | 19,951 | |||||||
Interest
and penalties related to the underpayment of income taxes are classified as a
component of tax expense in the consolidated statement of operations. We
recognized no significant interest or penalties for the year ended December 31,
2009. We had approximately $0.1 million for the payment of interest
and penalties accrued at December 31, 2009.
We file
our tax returns as prescribed by the tax laws of the jurisdictions in which we
operate. In the U.S., our tax years 1997 to 2009 remain effectively open to
examination by the Internal Revenue Service, as well as various state
jurisdictions. In the normal course of business, we are subject to examination
by taxing authorities throughout the world, including such major jurisdictions
as Australia, Brazil, Canada, Denmark, France, Germany, Italy, Mexico, the
Netherlands, Norway, Spain, Singapore, Sweden and the United Kingdom. In many
cases, our uncertain tax positions are related to tax years that remain subject
to examination by the relevant taxing authorities.
It is not
reasonably possible that the unrecognized tax benefits for tax positions taken
in previously filed tax returns will materially change within the next twelve
months from those recorded as liabilities for uncertain tax positions in our
consolidated financial statements at December 31, 2009. This is
based on the current status of relevant examinations for specific
jurisdictions.
67
INTERMEC,
INC.
NOTES
TO CONSOLIDATED FINANCIAL STATEMENTS
Note
K: Pension and Other Postretirement Benefit Plans
We have
retirement and pension plans that cover most of our employees. Most of our U.S.
employees, as well as the employees of certain non-U.S. subsidiaries, are
covered by contributory defined benefit plans under which employees may
contribute up to 4% of covered compensation annually. Annual contributions are
made to the extent such contributions are actuarially determined to adequately
fund the plans. Retiree benefits are based on the amount of participant
contributions over the term of the participant’s employment. There are also
defined contribution voluntary savings programs generally available for U.S.
employees, which are intended to qualify under Sections 401(a) and
401(k) of the Internal Revenue Code. These plans are designed to enhance
the retirement programs of participating employees. Under these plans, we match
up to 80% of a certain portion of participants’ contributions. Matching
contributions for these plans were $2.4 and $2.8 million in fiscal years 2009
and 2008, respectively.
Our
business restructuring plan in April 2009 reduced our workforce and resulted in
the curtailment of pension benefits to the terminated employees who were
participants in the U.S. pension plans. Additionally, on December 30, 2009, we
made the decision to fully freeze benefit accruals under our U.S. Financial
Security and Savings Program and U.S. Pension Plan, effective February 28, 2010.
Also, we fully froze additional benefit accruals under the U.S. Restoration
Plan and U.S. Supplemental Executive Retirement Plan, effective December
31, 2009. We have recorded a total of $0.7 million of gain in 2009 consolidated
statements of operations for these two curtailments.
We
started to measure our plan assets and benefit obligations at fiscal year
end. The following table sets forth the change in benefit obligations and
plan assets of our pension plans and the funded status (in
thousands):
|
2009
|
2008
|
|||||||||||||||
|
U.S.
|
Non-U.S.
|
U.S.
|
Non-U.S.
|
|||||||||||||
|
Change
in benefit obligations:
|
||||||||||||||||
|
Benefit
obligation at beginning of year
|
$ | 191,122 | $ | 33,687 | $ | 174,263 | $ | 48,267 | ||||||||
|
Service
cost
|
1,018 | - | 1,698 | 289 | ||||||||||||
|
Interest
cost
|
11,795 | 1,846 | 13,727 | 2,458 | ||||||||||||
|
Special
termination benefits
|
(66 | ) | - | 851 | - | |||||||||||
|
Plan
participants' contributions
|
3,698 | - | 3,064 | - | ||||||||||||
|
Actuarial
loss (gain)
|
5,101 | 9,496 | 5,772 | (3,583 | ) | |||||||||||
|
Benefits
paid
|
(7,740 | ) | (2,757 | ) | (7,597 | ) | (2,838 | ) | ||||||||
|
Curtailment gain
|
(6,311 | ) | - | (656 | ) | - | ||||||||||
|
Foreign
currency translation adjustment
|
- | 3,574 | - | (10,906 | ) | |||||||||||
|
Benefit
obligation at end of year
|
$ | 198,617 | $ | 45,846 | $ | 191,122 | $ | 33,687 | ||||||||
|
Change
in plan assets:
|
||||||||||||||||
|
Fair
value of plan assets at beginning of year
|
$ | 100,409 | $ | 32,897 | $ | 139,633 | $ | 55,908 | ||||||||
|
Actual
return on plan assets
|
23,663 | 4,966 | (38,481 | ) | (8,700 | ) | ||||||||||
|
Plan
participants' contributions
|
3,698 | - | 3,064 | - | ||||||||||||
|
Employer
contributions
|
3,405 | 978 | 3,790 | 755 | ||||||||||||
|
Benefits
paid
|
(7,740 | ) | (2,757 | ) | (7,597 | ) | (2,838 | ) | ||||||||
|
Foreign
currency translation adjustment
|
- | 3,517 | - | (12,228 | ) | |||||||||||
|
Fair
value of plan assets at end of year
|
$ | 123,435 | $ | 39,601 | $ | 100,409 | $ | 32,897 | ||||||||
|
Funded
status
|
(75,182 | ) | (6,245 | ) | (90,713 | ) | (790 | ) | ||||||||
|
Net
amount recognized
|
$ | (75,182 | ) | $ | (6,245 | ) | $ | (90,713 | ) | $ | (790 | ) | ||||
68
INTERMEC,
INC.
NOTES
TO CONSOLIDATED FINANCIAL STATEMENTS
Note
K: Pension and Other Postretirement Benefit Plans (Continued)
Amounts
pertaining to our U.S. and non-U.S. pension plans recognized on our consolidated
balance sheets are classified as follows (in thousands):
|
December
31, 2009
|
December
31, 2008
|
|||||||||||||||
|
U.S.
|
Non-U.S.
|
U.S.
|
Non-U.S.
|
|||||||||||||
|
Noncurrent
assets
|
$ | - | $ | - | $ | - | $ | 260 | ||||||||
|
Current
liabilities
|
(3,427 | ) | - | (3,427 | ) | - | ||||||||||
|
Noncurrent
liabilities
|
(71,755 | ) | (6,245 | ) | (87,286 | ) | (1,050 | ) | ||||||||
|
Net
amount recognized
|
$ | (75,182 | ) | $ | (6,245 | ) | $ | (90,713 | ) | $ | (790 | ) | ||||
The accumulated benefit obligation for the U.S. plans was $198.6 and $184.4 million as of December 31, 2009, and 2008, respectively. The accumulated benefit obligation for the non-U.S. plans was $45.8 and $33.9 million as of December 31, 2009, and 2008, respectively.
Amounts
recognized in accumulated other comprehensive loss for the year ended
December 31, 2009 and 2008 are as follows (in thousands):
|
For
the Year Ended
|
||||||||
|
December
31, 2009
|
December
31, 2008
|
|||||||
|
Prior
service cost
|
$ | - | $ | (826 | ) | |||
|
Actuarial
gain
|
(67,320 | ) | (76,238 | ) | ||||
|
Total
in accumulated other comprehensive loss
|
$ | (67,320 | ) | $ | (77,064 | ) | ||
The
estimated amount that will be amortized from accumulated other comprehensive
loss into net periodic pension cost during the year ended December 31, 2010 is
as follows (in thousands):
|
Pension
Plans
|
||||
|
Recognized
actuarial gain
|
$ |
(230)
|
||
|
Transition
assets
|
(139)
|
|||
|
Total
|
$ |
(369)
|
||
The table below sets forth amounts for our pension plans with accumulated benefit obligations in excess of fair value of plan assets (in thousands):
|
December
31, 2009
|
December
31, 2008
|
|||||||||||||||
|
U.S.
|
Non-U.S.
|
U.S.
|
Non-U.S.
|
|||||||||||||
|
Projected
benefit obligation
|
$ | 198,617 | $ | 45,846 | $ | 191,122 | $ | 2,568 | ||||||||
|
Accumulated
benefit obligation
|
$ | 198,617 | $ | 45,846 | $ | 184,392 | $ | 1,518 | ||||||||
|
Fair
value of plan assets
|
$ | 123,435 | $ | 39,601 | $ | 100,409 | $ | 2,022 | ||||||||
We expect to contribute approximately $3.6 and $1.3 million to our U.S. and non-U.S. pension plans, respectively, in 2010.
69
INTERMEC,
INC.
NOTES
TO CONSOLIDATED FINANCIAL STATEMENTS
Note
K: Pension and Other Postretirement Benefit Plans (Continued)
The
weighted average actuarial assumptions used to determine benefit obligations at
the end of the 2009 and 2008 fiscal years are as follows:
|
December
31, 2009
|
December
31, 2008
|
|||||||||||||||
|
U.S.
|
Non-U.S.
|
U.S.
|
Non-U.S.
|
|||||||||||||
|
Discount
rate
|
6.04 | % | 5.32 | % | 6.24 | % | 5.80 | % | ||||||||
|
Expected
return on plan assets
|
8.00 | % | 5.41 | % | 8.50 | % | 6.37 | % | ||||||||
|
Rate
of compensation increase
|
4.00 | % | 3.51 | % | 4.00 | % | 2.80 | % | ||||||||
A summary of the components of net periodic pension cost (income) for our defined benefit plans and defined contribution plans is as follows (in thousands):
|
Year
Ended December 31,
|
||||||||||||||||||||||||
|
2009
|
2008
|
2007
|
||||||||||||||||||||||
|
U.S.
|
Non-U.S.
|
U.S.
|
Non-U.S.
|
U.S.
|
Non-U.S.
|
|||||||||||||||||||
|
Components
of net periodic pension cost (income):
|
||||||||||||||||||||||||
|
Service
cost
|
$ | 1,018 | $ | 296 | $ | 1,332 | $ | 290 | $ | 1,810 | $ | - | ||||||||||||
|
Interest
cost
|
11,795 | 1,846 | 11,022 | 2,458 | 10,712 | 2,591 | ||||||||||||||||||
|
Expected
return on plan assets
|
(10,745 | ) | (2,236 | ) | (11,428 | ) | (3,137 | )(a) | (10,443 | ) | (3,127 | ) | ||||||||||||
|
Amortization
of prior service cost
|
425 | - | 576 | - | 577 | - | ||||||||||||||||||
|
Recognized
net actuarial loss
|
25 | 37 | 769 | - | 3,768 | 411 | ||||||||||||||||||
|
Amortization
of transition asset
|
- | (125 | ) | - | (125 | ) | - | (169 | ) | |||||||||||||||
|
Special
termination benefits
|
- | - | 851 | - | - | - | ||||||||||||||||||
|
Curtailment
(gain) loss
|
(722 | ) | - | 7 | - | - | - | |||||||||||||||||
|
Subtotal
|
1,796 | (182 | ) | 3,129 | (514 | ) | 6,423 | (294 | ) | |||||||||||||||
|
Defined
contribution plans
|
116 | - | 129 | - | 350 | 730 | ||||||||||||||||||
|
Net periodic pension cost (income)
|
$ | 1,912 | $ | (182 | ) | $ | 3,258 | $ | (514 | ) | $ | 6,773 | $ | 436 | ||||||||||
_______
|
(a)
|
In
2008, we disclosed $3.8 million of expected return on plan
assets in error. There was no impact on our consolidated financial
statements.
|
The weighted average actuarial assumptions used to determine net periodic pension cost are as follows:
|
U.S.
|
Non-U.S.
|
|||||||||||||||||||||||
|
12
Months Ended December 31, 2009
|
15
Months Ended December 31, 2008
|
12
Months Ended September 30, 2007
|
12
Months Ended December 31, 2009
|
15
Months Ended December 31, 2008
|
12
Months Ended September 30, 2007
|
|||||||||||||||||||
|
Discount
rate
|
7.31 | % | 5.80 | % | 6.35 | % | 5.79 | % | 5.05 | % | 5.90 | % | ||||||||||||
|
Expected
return on plan assets
|
8.00 | % | 8.50 | % | 8.75 | % | 5.41 | % | 6.37 | % | 6.40 | % | ||||||||||||
|
Rate
of compensation increase
|
4.00 | % | 4.00 | % | 4.00 | % | 2.71 | % | 2.80 | % | 3.00 | % | ||||||||||||
Our analysis of the asset rate of return assumptions for the U.S. plans supports a long-term rate of approximately 8.00% for the December 31, 2009, measurement date based on the long-term perspective of the investments and the historical results of investment funds.
Our
analysis of the asset rate of return assumptions for the non-U.S. plans
supports a long term rate of return of approximately 5.41% based on the
long-term perspective of the investments and the historical results of
investment funds.
70
INTERMEC,
INC.
NOTES
TO CONSOLIDATED FINANCIAL STATEMENTS
Note
K: Pension and Other Postretirement Benefit Plans
(Continued)
The table
below sets forth the expected future pension benefit payments for the next five
years and the following five-year period (in thousands):
|
Years
|
U.S.
|
Non-U.S.
|
||||||
|
2010
|
$ | 7,434 | $ | 2,289 | ||||
|
2011
|
7,837 | 2,336 | ||||||
|
2012
|
8,587 | 2,381 | ||||||
|
2013
|
9,295 | 2,430 | ||||||
|
2014
|
9,851 | 2,478 | ||||||
|
2015
through 2019
|
59,354 | 13,019 | ||||||
Plan
Assets
U.S. plan
assets consist primarily of equity securities, U.S. government securities,
corporate bonds and 31,475 shares of our common stock at December 31, 2009
and 2008. The asset allocation for our U.S pension plans as of December 31,
2009, and 2008, and the target allocation, by asset category, are as
follows:
|
Allocation
of Plan Assets at Measurement Date
|
||||||||||||
|
U.S.
Pension Plans
|
Target
Allocation
|
2009
|
2008
|
|||||||||
|
Equity
securities
|
65 | % | 57 | % | 52 | % | ||||||
|
Debt
securities
|
29 | % | 36 | % | 38 | % | ||||||
|
Other
|
5 | % | 3 | % | 5 | % | ||||||
|
Cash
and cash equivalents
|
1 | % | 4 | % | 5 | % | ||||||
|
Total
|
100 | % | 100 | % | 100 | % | ||||||
Our U.S.
pension obligations pay out primarily 20 to 30 years in the future. Consistent
with this obligation, our investment strategy for the plan assets is to
diversify risk through asset allocation and to achieve strong long-term returns.
As a result of market conditions in recent years, the allocation of assets among
asset categories is different from our target allocation. Our objective is to
adjust the investment allocation to reflect the target allocation as markets
improve and certain alternative investments liquidate. Alternative investments,
classified as other in the above table, are $3.5 and $5.7 million at December
31, 2009, and 2008, respectively. They include holdings in partnerships and
funds that invest in public and private debt and equity and emerging markets
real estate. These investments reflect fair value, as determined by active
trades, appraisals and other relevant data.
Non-U.S.
plan assets consist primarily of a pooled unit fund of equity securities and a
pooled unit fund of corporate bonds. Our investment strategy for the plan assets
is to invest for strong long-term returns. The asset allocation for
our non-U.S. pension plans as of December 31, 2009, and 2008, and the
target allocation, by asset category, are as follows:
|
Allocation
of Plan Assets at Measurement Date
|
||||||||||||
|
Non-U.S.
Pension Plans
|
Target
Allocation
|
2009
|
2008
|
|||||||||
|
Equity
securities:
|
50 | % | 53 | % | 50 | % | ||||||
|
Debt
securities:
|
50 | % | 45 | % | 49 | % | ||||||
|
Cash
and cash equivalents and other
|
- | 2 | % | 1 | % | |||||||
|
Total
|
100 | % | 100 | % | 100 | % | ||||||
71
INTERMEC,
INC.
NOTES
TO CONSOLIDATED FINANCIAL STATEMENTS
Note
K: Pension and Other Postretirement Benefit Plans (Continued)
Effective
December 31, 2009, we are required to disclose fair value measurements of
pension assets and define the fair value hierarchy for valuation inputs. The
hierarchy prioritized the inputs into three levels based on the extent to which
inputs used in measuring fair value are observable in the market. Our U.S. and
non-U.S. pension assets are classified and disclosed in one of the following
three categories:
|
§
|
Level
1: Inputs based on quoted market prices for identical assets or
liabilities in active markets.
|
|
§
|
Level
2: Observable market based inputs or unobservable inputs that are
corroborated by market data.
|
|
§
|
Level
3: Unobservable inputs that are not corroborated by market data and
typically reflect management’s estimates of assumptions that market
participants would use in pricing the asset. The fair values are
then determined using model-based
techniques.
|
Our level
1 U.S. pension assets’ fair values are based on quoted market prices in
active markets for identical assets, which we use to value our trade securities,
receivables/payables for pending sales and purchases of trade securities and
other similar securities. Our level 2 U.S. pension assets’ values are based on
comparable sales, such as quoted market rates for similar funds, which we use to
value our private money market fund. Our level 3 U.S. pension assets consist
primarily of alternative investments held in limited partnerships and private
equity funds. The values of their underlying holdings are based on third party
valuations using standard valuation methodologies, or cost if no other valuation
method is deemed sufficient by the investment manager or general
partner.
The table
below summarized our U.S. pension assets in accordance with fair value
measurement provisions for the year ended December 31, 2009 (in
thousands):
|
Level
1
|
Level
2
|
Level
3
|
Balance
at December 31, 2009
|
|||||||||||||
|
Cash
and cash equivalents (a)
|
$ | - | $ | 14,402 | $ | - | $ | 14,402 | ||||||||
|
Corporate
debt securities (b)
|
22,671 | - | - | 22,671 | ||||||||||||
|
Corporate
stocks:
|
||||||||||||||||
|
U.S.
large cap value
|
28,681 | - | - | 28,681 | ||||||||||||
|
U.S.
large cap growth
|
28,798 | - | - | 28,798 | ||||||||||||
|
Limited
partnerships (c )
|
- | - | 1,089 | 1,089 | ||||||||||||
|
Mortgage-backed
securities (d)
|
20,048 | - | - | 20,048 | ||||||||||||
|
Private
equity fund (e)
|
- | - | 2,407 | 2,407 | ||||||||||||
|
U.S.
Treasury notes
|
2,099 | - | - | 2,099 | ||||||||||||
|
U.S.
corporate stock large cap mutual fund
|
12,410 | - | - | 12,410 | ||||||||||||
|
Total
investments
|
114,707 | 14,402 | 3,496 | 132,605 | ||||||||||||
|
Net
payable for investments purchased
|
(9,847 | ) | - | - | (9,847 | ) | ||||||||||
|
Other
receivables
|
- | - | 677 | 677 | ||||||||||||
|
Total
pension assets
|
$ | 104,860 | $ | 14,402 | $ | 4,173 | $ | 123,435 | ||||||||
_______
|
(a)
|
Cash
and cash equivalents include cash in a private money market fund managed
by the Plan’s trustee.
|
|
(b)
|
Corporate
debt securities are investment grade bonds of U.S. issuers in a wide range
of industries.
|
|
(c)
|
Limited
partnerships include a partnership invested in debt and equity issued by
distressed companies in the U.S. and a partnership invested in emerging
markets real estate.
|
|
(d)
|
Mortgage-backed
securities held were issued primarily by Federal Home Loan Mortgage
Corporation (FHLMC) and Federal National Mortgage Association (FNMA),
which are government-sponsored enterprises of the U.S. federal government.
Securities are guaranteed by the
issuer.
|
|
(e)
|
The
private equity fund is invested in debt and equity issued by distressed
companies in the U.S.
|
72
INTERMEC,
INC.
NOTES
TO CONSOLIDATED FINANCIAL STATEMENTS
Note
K: Pension and Other Postretirement Benefit Plans (Continued)
The
following table presents the changes in Level 3 investments measured at fair
value for the year ended December 31, 2009 (in thousands):
|
Limited
Partnerships
|
Private
Equity Fund
|
Other
Receivables (payables), net
|
Total
|
|||||||||||||
|
Balance
at December 31, 2008
|
2,279 | 3,447 | 461 | 6,187 | ||||||||||||
|
Actual
return on plan assets:
|
||||||||||||||||
|
Relating
to assets still held at the reporting date
|
(576) | (1,040) | 216 | (1,400) | ||||||||||||
|
Relating
to assets sold during the period
|
(614) | - | - | (614) | ||||||||||||
|
Balance
at December 31, 2009
|
1,089 | 2,407 | 677 | 4,173 | ||||||||||||
The
values of the underlying holdings of above Level 3 pension assets are not
dependent upon credit and equity markets for value as their financing is from
private sources. The ability to redeem certain holdings through a sale is
limited at this time by general market conditions. However, this condition is
expected to clear in the next year and there appears to be sufficient funding
for limited partnerships and private equity fund to continue without redemptions
through several years of continued operations.
Our level
1 non-U.S. pension assets’ fair values are based on quoted market prices in
active markets for identical assets, which we use to value our cash and cash
equivalents. Our level 2 non-U.S. pension assets’ fair values are based on
observable input from similar assets, such as the underlying assets of the
policy fund in active markets, which we use to value our unit-linked pooled
policies and insurance and reinsurance contracts. We do not have any non-U.S.
pension assets that require valuation using Level 3 inputs.
The table
below summarized our non-U.S. pension assets in accordance with fair value
measurement provisions for the year ended December 31, 2009 (in
thousands):
|
Level
1
|
Level
2
|
Level
3
|
Balance
at December 31, 2009
|
|||||||||||||
|
Cash
and cash equivalents
|
$ | 748 | $ | - | $ | - | $ | 748 | ||||||||
|
Corporate
debt pooled unit funds (a)
|
- | 16,985 | - | 16,985 | ||||||||||||
|
Global
corporate stock pooled unit funds (b)
|
- | 20,325 | - | 20,325 | ||||||||||||
|
Insurance
and reinsurance contracts
|
- | 1,543 | - | 1,543 | ||||||||||||
|
Total
pension assets
|
$ | 748 | $ | 38,853 | $ | - | $ | 39,601 | ||||||||
_______
|
(a)
|
Corporate
debt pooled unit fund includes units held in unit-linked pooled policies
structured under U.K. securities and pension regulations. The policy
managers invested in investment grade corporate debt securities issued in
developed markets for the benefit of the
policy.
|
|
(b)
|
Global
corporate stock pooled unit fund includes units held in unit-linked pooled
policies structured under U.K. securities and pension regulations. The
policy managers invested in corporate stocks issued in markets in the
U.S., U.K., European continent, Japan and other Asian
countries.
|
There
were no significant concentrations of credit risk or other types of risk in our
U.S. and non-U.S. pension assets investments at December 31, 2009, and
2008.
73
INTERMEC,
INC.
NOTES
TO CONSOLIDATED FINANCIAL STATEMENTS
Note
K: Pension and Other Postretirement Benefit Plans (Continued)
Other
Postretirement Benefits
In
addition to pension benefits, certain U.S. employees are covered by
postretirement health care and life insurance benefit plans provided by us.
These benefit plans are unfunded. The following table sets forth the change in
benefit obligation of our other postretirement benefits and amounts recognized
on our consolidated balance sheets (in thousands):
|
Year
Ended December 31,
|
||||||||
|
2009
|
2008
|
|||||||
|
Change
in postretirement benefit obligations:
|
||||||||
|
Benefit
obligation at beginning of year
|
$ | 4,161 | $ | 3,026 | ||||
|
Adjustment
to retained earnings at January 1, 2008
|
- | 1,370 | ||||||
|
Interest
cost
|
255 | 298 | ||||||
|
Actuarial
loss (gain)
|
45 | (143 | ) | |||||
|
Benefits
paid
|
(194 | ) | (390 | ) | ||||
|
Benefit obligation at end of year
|
$ | 4,267 | $ | 4,161 | ||||
|
Funded
status
|
$ | (4,267 | ) | $ | (4,161 | ) | ||
|
Accrued
postretirement benefit obligation
|
$ | (4,267 | ) | $ | (4,161 | ) | ||
Amounts pertaining to our postretirement benefits recognized on our consolidated balance sheets are classified as follows (in thousands):
|
Year
Ended December 31,
|
||||||||
|
2009
|
2008
|
|||||||
|
Current
liabilities
|
$ | (371 | ) | $ | (371 | ) | ||
|
Noncurrent
liabilities
|
(3,896 | ) | (3,790 | ) | ||||
|
Net
amount recognized
|
$ | (4,267 | ) | $ | (4,161 | ) | ||
A summary of our net periodic postretirement cost is as follows (in thousands):
|
Year
Ended December 31,
|
||||||||||||
|
2009
|
2008
|
2007
|
||||||||||
|
Components
of net periodic postretirement cost:
|
||||||||||||
|
Interest
cost
|
$ | 254 | $ | 254 | $ | 177 | ||||||
|
Net
periodic postretirement cost
|
$ | 254 | $ | 254 | $ | 177 | ||||||
Actuarial assumptions used to measure the postretirement benefit obligation include a discount rate of 5.50% and 6.40% at December 31, 2009, and 2008, respectively. The weighted average discount rates used to measure net periodic benefit cost for the years ended December 31, 2009, 2008 and 2007 were 6.40%, 6.10% and 5.70%, respectively. The assumed health care cost trend rate for fiscal year 2009 was 8.5% and is projected to decrease over nineteen years to 4.5%, where it is expected to remain thereafter. The effect of a one-percentage-point increase or decrease in the assumed health care cost trend rate on the service cost and interest cost components of the net periodic postretirement cost is not material. A one-percentage-point increase or decrease in the assumed health care cost trend rate on the postretirement benefit obligation results in an increase or decrease of approximately $0.1 million.
Estimated
future gross benefit payments are $0.4 million for each of the next five years,
2010 through 2014, and $1.9 million in aggregate for the subsequent five-year
period, 2015 through 2019.
74
INTERMEC,
INC.
NOTES
TO CONSOLIDATED FINANCIAL STATEMENTS
Note
L: Litigation, Commitments and Contingencies
Provisions
for estimated expenses related to product warranties are made at the time
products are sold. These estimates are established using historical information
on the nature, frequency, and average cost of warranty claims. Management
regularly studies trends of warranty claims and takes action to improve product
quality and minimize warranty claims. The following table indicates the change
in our warranty liability during the years ended December 31, 2009, and
2008 (in thousands):
|
Year
Ended December 31,
|
||||||||
|
2009
|
2008
|
|||||||
|
Beginning
balance
|
$ | 4,220 | $ | 4,305 | ||||
|
Payments
or parts usage
|
(5,789 | ) | (2,402 | ) | ||||
|
Additional
provision
|
4,482 | 2,317 | ||||||
|
Ending
balance
|
$ | 2,913 | $ | 4,220 | ||||
We have
entered into a variety of agreements with third parties that include
indemnification clauses, both in the ordinary course of business and in
connection with our divestitures of certain product lines. These clauses require
us to compensate these third parties for certain liabilities and damages that
may be incurred by them. Fair value of guarantees is required to be recorded as
a liability. We do not believe that we have any significant exposure related to
such guarantees and therefore have not recorded a liability as of December 31,
2009 and 2008. We have not made any significant indemnification payments as a
result of these clauses.
At December 31, 2009, we had
letter-of-credit reimbursement agreements totaling $2.1 million, compared to
$3.7 million at December 31, 2008. These letter-of-credit agreements relate to
performance on contracts with our customers and vendors.
We
currently, and from time to time, are subject to claims and lawsuits arising in
the ordinary course of business. The ultimate resolution of currently pending
proceedings is not expected to have a material adverse effect on our business,
financial condition, results of operations or liquidity.
Note
M: Segment Reporting
Our
reportable segments comprise products and services. The product segment
generates revenue from development, manufacture, sale and resale of wired
and wireless AIDC products, mobile computing products, wired and wireless bar
code printers, label media and RFID products and license fees. The service
segment generates revenue from customer support, product maintenance and
professional services related to the products and systems
integration.
The
accounting policies of our two reportable segments are the same as those used to
prepare our consolidated financial statements. Performance and resource
allocation are primarily measured by sales and standard gross profit. All other
earnings, costs and expenses are aggregated and reported on a consolidated
basis. It is not practicable to segregate total assets by segment. Total assets
for the years ended December 31, 2009 and 2008 were $771.4 and $789.9 million,
respectively.
75
INTERMEC,
INC.
NOTES
TO CONSOLIDATED FINANCIAL STATEMENTS
Note
M: Segment Reporting (Continued)
The
following table sets forth our operations by reportable segment (in
thousands):
|
Year
Ended December 31,
|
||||||||||||
|
2009
|
2008
|
2007
|
||||||||||
|
Revenues:
|
||||||||||||
|
Product
|
$ | 519,603 | $ | 738,426 | $ | 692,050 | ||||||
|
Service
|
138,602 | 152,457 | 157,170 | |||||||||
|
Total
|
$ | 658,205 | $ | 890,883 | $ | 849,220 | ||||||
|
Gross
profit:
|
||||||||||||
|
Product
|
$ | 188,475 | $ | 290,210 | $ | 259,884 | ||||||
|
Service
|
60,083 | 64,576 | 66,982 | |||||||||
|
Total
|
$ | 248,558 | $ | 354,786 | $ | 326,866 | ||||||
For 2009,
2008 and 2007, ScanSource accounted for more than 10% of our consolidated
revenues. Total sales to this customer were $123.0, $113.8 and $108.7 million
for the years ended December 31, 2009, 2008 and 2007, respectively, and
primarily related to product sales.
The
following table sets forth our revenues by product line (in
thousands):
|
Year
Ended December 31,
|
||||||||||||
|
2009
|
2008
|
2007
|
||||||||||
|
Revenues
by product line:
|
||||||||||||
|
Systems
and solutions
|
$ | 368,188 | $ | 542,100 | $ | 485,637 | ||||||
|
Printer
and media
|
151,415 | 196,326 | 206,414 | |||||||||
|
Service
|
138,602 | 152,457 | 157,170 | |||||||||
|
Total
|
$ | 658,205 | $ | 890,883 | $ | 849,221 | ||||||
Revenues
by geographic region are determined based on the location of the customer.
European revenues and long-lived assets relate primarily to the United Kingdom,
Germany and France. No individual country, other than the U.S., exceeds 10% of
consolidated revenues. The following table sets forth our revenues by geographic
region (in thousands):
|
Year
Ended December 31,
|
||||||||||||
|
2009
|
2008
|
2007
|
||||||||||
| Revenues by geographic region: | ||||||||||||
|
North America
|
$ | 373,199 | $ | 492,807 | $ | 422,934 | ||||||
|
Europe, Middle East and Africa
|
186,816 | 290,351 | 290,395 | |||||||||
|
All others
|
98,190 | 107,725 | 135,892 | |||||||||
|
Total
|
$ | 658,205 | $ | 890,883 | $ | 849,221 | ||||||
76
INTERMEC,
INC.
NOTES
TO CONSOLIDATED FINANCIAL STATEMENTS
Note
M: Segment Reporting (Continued)
The
following table sets forth our long-lived assets, excluding deferred tax assets,
by geographic region (in thousands):
|
Year
Ended December 31,
|
||||||||
|
2009
|
2008
|
|||||||
|
North
America
|
$ | 67,753 | $ | 69,543 | ||||
|
Europe,
Middle East and Africa
|
3,074 | 3,066 | ||||||
|
All
others
|
3,166 | 1,764 | ||||||
|
Total
|
$ | 73,993 | $ | 74,373 | ||||
77
INTERMEC,
INC.
Below is
unaudited quarterly financial information for 2009 and 2008 (in millions, except
for earnings per share and common stock sales price):
|
2009
|
||||||||||||||||
| Q1 | Q2 | Q3 | Q4 | |||||||||||||
|
Revenues
|
$ | 162.6 | $ | 157.7 | $ | 158.8 | $ | 179.1 | ||||||||
|
Gross
profit
|
59.1 | 57.1 | 61.3 | 71.1 | ||||||||||||
|
Net
(loss) earnings
|
(10.4 | ) | (6.5 | ) | 0.0 | 5.1 | ||||||||||
|
Basic
(loss) earnings per share
|
$ | (0.17 | ) | $ | (0.11 | ) | $ | 0.00 | $ | 0.08 | ||||||
|
Diluted
(loss) earnings per share
|
$ | (0.17 | ) | $ | (0.11 | ) | $ | 0.00 | $ | 0.08 | ||||||
|
Common
stock sales price per share:
|
||||||||||||||||
|
High
|
$ | 14.50 | $ | 12.80 | $ | 15.64 | $ | 15.16 | ||||||||
|
Low
|
$ | 8.68 | $ | 9.98 | $ | 12.02 | $ | 10.36 | ||||||||
|
2008
|
||||||||||||||||
| Q1 | Q2 | Q3 | Q4 | |||||||||||||
|
Revenues
|
$ | 216.8 | $ | 218.3 | $ | 234.4 | $ | 221.5 | ||||||||
|
Gross
profit
|
87.4 | 88.9 | 91.6 | 86.8 | ||||||||||||
|
Net
earnings
|
7.7 | 7.7 | 11.0 | 9.3 | ||||||||||||
|
Basic
earnings per share
|
$ | 0.13 | $ | 0.13 | $ | 0.18 | $ | 0.15 | ||||||||
|
Diluted
earnings per share
|
$ | 0.13 | $ | 0.13 | $ | 0.18 | $ | 0.15 | ||||||||
|
Common
stock sales price per share:
|
||||||||||||||||
|
High
|
$ | 24.86 | $ | 24.96 | $ | 23.00 | $ | 19.65 | ||||||||
|
Low
|
$ | 17.53 | $ | 19.56 | $ | 15.09 | $ | 9.29 | ||||||||
VALUATION
AND QUALIFYING ACCOUNTS
Years
Ended December 31, 2009, 2008, and 2007
(In
thousands)
|
Balance
at Beginning of Period
|
Costs
Charged to Expenses
|
Deductions
and Write-offs
|
Balance
at End of Period
|
|||||||||||||
|
As
of December 31, 2009
|
||||||||||||||||
|
Allowance
for uncollectible accounts receivable
|
$ | 2,085 | $ | 992 | $ | (1,750 | ) | $ | 1,327 | |||||||
|
Allowance
for sales returns
|
8,704 | 302 | - | 9,006 | ||||||||||||
|
As
of December 31, 2008
|
||||||||||||||||
|
Allowance
for uncollectible accounts receivable
|
$ | 3,836 | $ | (441 | ) | $ | (1,310 | ) | $ | 2,085 | ||||||
|
Allowance
for sales returns
|
9,018 | (314 | ) | - | 8,704 | |||||||||||
|
As
of December 31, 2007
|
||||||||||||||||
|
Allowance
for uncollectible accounts receivable
|
$ | 3,653 | $ | 342 | $ | (159 | ) | $ | 3,836 | |||||||
|
Allowance
for sales returns
|
4,143 | - | 4,875 | 9,018 | ||||||||||||
79
INTERMEC,
INC.
INDEX
TO EXHIBITS
|
Exhibit No.
|
Description
of Exhibit
|
||
| 3.1 |
Restated
Certificate of Incorporation of Intermec, Inc. (formerly, UNOVA, Inc. and
referred to below as the “Company”), filed as Exhibit 3.1 to the Company’s
May 17, 2006 current report on Form 8-K, and incorporated herein by
reference.
|
||
| 3.2 |
Amended
and Restated By-Laws of the Company, as amended as of September 11, 2008
and filed as Exhibit 3.1 to the Company’s September 11, 2008
current report on Form 8-K, and incorporated herein by
reference.
|
||
| 4.1 |
Credit
Agreement between the Company, as the Borrower, and Wells Fargo Bank,
National Association, as the Lender, dated as of September 27,
2007, filed as Exhibit 10.6 to the Company’s September 30, 2007
quarterly report on Form 10-Q, and incorporated herein by
reference.
|
||
| 4.2 |
Revolving
Line of Credit Note between the Company, as the Borrower, and Wells
Fargo Bank, National Association, as the Lender, amended as of December
12, 2008, filed as Exhibit 4.2 to the Company’s 2008 annual report on Form
10-K, and incorporated herein by reference.
|
||
| 4.3 |
Continuing
Guaranty by Intermec IP Corp., as the Guarantor, to Wells Fargo Bank,
National Association, as the Bank, dated as of September 27,
2007, filed as Exhibit 10.8 to the Company’s September 30, 2007
quarterly report on Form 10-Q, and incorporated herein by
reference.
|
||
| 4.4 |
Continuing
Guaranty by Intermec Technologies Corporation, as the Guarantor, to Wells
Fargo Bank, National Association, as the Bank, dated as of September 27,
2007, filed as Exhibit 10.9 to the Company’s September 30, 2007
quarterly report on Form 10-Q, and incorporated herein by
reference.
|
||
| 10.1 |
Distribution
and Indemnity Agreement, dated October 31, 1997, between Western
Atlas Inc. and the Company, filed as Exhibit 10.1 to the Company’s
September 30, 1997 quarterly report on Form 10-Q, and
incorporated herein by reference.
|
||
| 10.2 |
Tax
Sharing Agreement, dated October 31, 1997 between Western Atlas Inc.
and the Company, filed as Exhibit 10.2 to the Company’s
September 30, 1997 quarterly report on Form 10-Q, and
incorporated herein by reference.
|
||
| 10.3 |
Intellectual
Property Agreement, dated October 31, 1997 between Western Atlas Inc.
and the Company, filed as Exhibit 10.4 to the Company’s
September 30, 1997 quarterly report on Form 10-Q, and
incorporated herein by reference.
|
||
| 10.4 |
Employee
Benefits Agreement, dated October 31, 1997, between Western Atlas
Inc. and the Company, filed as Exhibit 10.3 to the Company’s
September 30, 1997 quarterly report on Form 10-Q, and
incorporated herein by reference.**
|
||
| 10.5 |
Purchase
and Sale Agreement, dated as of March 17, 2005, among the Company,
UNOVA Industrial Automation Systems, Inc., UNOVA U.K. Limited,
Cincinnati Machine U.K. Limited (now UNOVA Operations U.K. Limited),
Honsberg Lamb Sonderwerkzeugmachinen GmbH (now UNOVA Germany GmbH), UNOVA
Canada, Inc., and UNOVA IP Corp., as Selling entities, and R&B
Plastics Holdings, Inc. and MAG Industrial Automation Systems, LLC,
as Purchasing Entities (the “Cincinnati Purchase and Sale Agreement”),
filed as Exhibit 4.1 to the Company’s April 3, 2005, quarterly
report on Form 10-Q, and incorporated herein by
reference.
|
||
| 10.6 |
First
Amendment to the Cincinnati Purchase and Sale Agreement, dated
April 1, 2005, filed as Exhibit 4.2 to the Company’s
April 3, 2005 quarterly report on Form 10-Q, and incorporated
herein by reference.
|
||
| 10.7 |
Purchase
and Sale of Cincinnati Lamb Group—Settlement Agreement, dated
June 30, 2005, filed as Exhibit 10.7 to the Company’s
July 3, 2005 quarterly report on Form 10-Q, and incorporated
herein by reference.
|
||
80
INTERMEC, INC.
INDEX
TO EXHIBITS
| 10.8 |
Purchase
and Sale Agreement, dated as of October 27, 2005, among the Company,
UNOVA Industrial Automation Systems, Inc., UNOVA IP Corp. and UNOVA
U.K. Limited, as Selling Entities, and Compagnie De Fives-Lille, Cinetic
Landis Grinding Corp. and Cinetic Landis Grinding Limited, as Purchasing
Entities, filed as Exhibit 10.42 to the Company’s 2005 annual report on
Form 10-K, and incorporated herein by reference.
|
||
| 10.9 |
Venture
Manufacturing Services Framework Agreement, dated December 3, 2008,
between Venture Corporation Limited and the Company, filed as Exhibit 10.9
to the Company’s 2008 annual report on Form 10-K, and incorporated herein
by reference. +
|
||
| 10.10 |
Director
Compensation Program under the Company’s 2008 Omnibus Incentive Plan,
filed as Exhibit 10.6 to the Company’s June 29, 2008 quarterly report on
Form 10-Q, and incorporated herein by reference.**
|
||
| 10.11 |
Amendment
No. 1 to the Director Compensation Program under the Company’s 2008
Omnibus Incentive Plan, effective January 1, 2009, filed as Exhibit 10.1
to the Company’s February 5, 2009 current report on Form 8-K, and
incorporated herein by reference.**
|
||
| 10.12 |
Amendment
No. 2 to the Director Compensation Program under the Company’s 2008
Omnibus Incentive Plan, effective May 26, 2009, filed as Exhibit 10.1 to
the Company’s May 28, 2009 current report on Form 8-K, and incorporated
herein by reference.**
|
||
| 10.13 |
Form
of Stock Option Grant Notice and Stock Option Agreement for Non-Employee
Directors under the Company’s 2008 Omnibus Incentive Plan, filed as
Exhibit 10.7 to the Company’s June 29, 2008 quarterly report on Form 10-Q,
and incorporated herein by reference.**
|
||
| 10.14 |
Director
Deferred Compensation Plan, filed as Exhibit 10.8 to the Company’s June
29, 2008 quarterly report on Form 10-Q, and incorporated herein by
reference.**
|
||
| 10.15 |
Director
Stock Option and Fee Plan, As Amended Effective November 19, 2007,
filed as Exhibit 10.6 to the Company’s 2007 annual report on Form 10-K,
and incorporated herein by reference.**
|
||
| 10.16 |
The
Company’s Deferred Compensation Plan, filed as Exhibit 10.4 to the
Company’s July 2, 2006 quarterly report on Form 10-Q, and
incorporated herein by reference.**
|
||
| 10.17 |
Adoption
Agreement to the Company’s Deferred Compensation Plan, dated June 29,
2006, filed as Exhibit 10.25 to the Company’s 2007 annual report on
Form 10-K, and incorporated herein by reference.**
|
||
| 10.18 |
Action
and Amendment to the Company’s Deferred Compensation Plan, dated December
18, 2009.* **
|
||
| 10.19 |
Intermec,
Inc. Change of Control Severance Plan, effective January 7, 2009, filed as
Exhibit 10.1 to the Company’s January 8, 2009 current report on
Form 8-K, and incorporated herein by reference.**
|
||
| 10.20 |
Corporate
Executive Severance Plan for Chief Executive Officer and Elected Officers
of Intermec, Inc. and Certain other Designated and Section 16 Officers,
filed as Exhibit 10.3 to the Company’s April 3, 2009 current report on
Form 8-K and incorporated herein by
reference.**
|
81
INTERMEC,
INC.
INDEX
TO EXHIBITS
| 10.21 |
Restoration
Plan, Amended and Restated as of January 1, 2008, filed as Exhibit 10.6 to
the Company’s July 1, 2007 quarterly report on Form 10-Q, and incorporated
herein by reference.**
|
||
| 10.22 |
First
Amendment to the Company’s Restoration Plan, dated December 18, 2009.*
**
|
||
| 10.23 |
Supplemental
Executive Retirement Plan, Amended and Restated as of January 1, 2008,
filed as Exhibit 10.7 to the Company’s July 1, 2007, quarterly
report on Form 10-Q, and incorporated herein by
reference.**
|
||
| 10.24 |
First
Amendment to the Company’s Supplemental Executive Retirement Plan, dated
December 18, 2009.* **
|
||
| 10.25 |
Summary
of Executive Life Insurance Benefit, filed as Exhibit 10.22 to the
Company’s 2008 annual report on Form 10-K and incorporated herein by
reference.**
|
||
| 10.26 |
2008
Employee Stock Purchase Plan, approved by stockholders May 23, 2008 and
effective July 1, 2008, filed as Exhibit 10.9 to the Company’s June 28,
2008 quarterly report on Form 10-Q and incorporated herein by
reference.**
|
||
| 10.27 |
2008
Omnibus Incentive Plan, as amended effective July 16, 2009, filed as
Exhibit 10.1 to the Company’s July 30, 2009 current report on Form 8-K and
incorporated herein by reference.**
|
||
| 10.28 |
Executive
Change of Control Policy for 2008 Omnibus Incentive Plan, filed as Exhibit
10.25 to the Company’s 2008 annual report on Form 10-K, and incorporated
herein by reference.**
|
||
| 10.29 |
Standard
Change of Control Policy for 2008 Omnibus Incentive Plan, filed as Exhibit
10.26 to the Company’s 2008 annual report on Form 10-K, and incorporated
herein by reference.**
|
||
| 10.30 |
Form
of Employee Stock Option Grant Notice and Stock Option Agreement under the
Company’s 2008 Omnibus Incentive Plan, filed as Exhibit 10.2 to the
Company’s June 28, 2008 quarterly report on Form 10-Q, and incorporated
herein by reference.**
|
||
| 10.31 |
Form
of Employee Restricted Stock Unit Agreement under the Company’s 2008
Omnibus Incentive Plan, filed as Exhibit 10.3 to the Company’s June 28,
2008 quarterly report on Form 10-Q, and incorporated herein by
reference.**
|
||
| 10.32 |
2008
Long-Term Performance Share Program under the Company’s 2008 Omnibus
Incentive Plan, as amended March 31, 2009, filed as Exhibit 10.1 to the
Company’s April 3, 2009 current report on Form 8-K, and incorporated
herein by reference.**
|
||
| 10.33 |
Form
of Employee Long-Term Performance Share Program Agreement under the
Intermec, Inc. 2008 Omnibus Incentive Plan, filed as Exhibit 10.5 to the
Company’s June 28, 2008 quarterly report on Form 10-Q, and incorporated
herein by reference.**
|
||
| 10.34 |
2008
Long-Term Performance Share Program Agreement for the Award Period January
1, 2009 through December 31, 2011, filed as Exhibit 10.2 to the Company’s
April 3, 2009 current report on Form 8-K, and incorporated herein by
reference.**
|
||
| 10.35 |
2004
Omnibus Compensation Plan, Approved May 6, 2004, Amended and Restated as
of January 1, 2008, filed as Exhibit 10.11 to the Company’s July 1, 2007
quarterly report on Form 10-Q, and incorporated herein by
reference.**
|
82
INTERMEC,
INC.
INDEX
TO EXHIBITS
| 10.36 |
Form of
Incentive Stock Option Agreement for awards under the 2004 Plan, filed as
Exhibit 10.1 to the Company’s July 3, 2005 quarterly report on
Form 10-Q, and incorporated herein by reference.**
|
|||
| 10.37 |
Form of
Non-Qualified Stock Option Agreement for awards under the 2004 Plan, filed
as Exhibit 10.2 to the Company’s July 3, 2005 quarterly report
on Form 10-Q, and incorporated herein by reference.**
|
|||
| 10.38 |
Form
of Restricted Stock Unit Agreement for awards under the 2004 Plan, filed
as Exhibit 10.5 to the Company’s September 30, 2004, quarterly
report on Form 10-Q, and incorporated herein by
reference.**
|
|||
| 10.39 |
Form of
Restricted Stock Agreement for awards under the 2004 Plan, filed as
Exhibit 10.4 to the Company’s September 30, 2004 quarterly
report on Form 10-Q, and incorporated herein by
reference.**
|
|||
| 10.40 |
Form
of Performance Share Unit Agreement under the Company’s 2004 Long-Term
Agreement, filed as Exhibit 10.1 to the Company’s March 30, 2008 quarterly
report on Form 10-Q, and incorporated herein by reference.**
|
|||
| 10.41 |
Form of
Amendment dated December 23, 2005, to all Performance Share Unit
Agreements for Performance Periods begun in 2004 and 2005, filed as
Exhibit 10.31 to the Company’s 2005 annual report on Form 10-K, and
incorporated herein by reference.**
|
|||
| 10.42 |
2004
Long Term Performance Share Program, a sub-plan under the 2004 Omnibus
Incentive Compensation Plan, filed as exhibit 10.12 to the Company’s July
1, 2007 quarterly report on Form 10-Q, and incorporated herein by
reference.**
|
|||
| 10.43 |
2004
Long-Term Performance Share Program (the “Long-Term Program”), a sub-plan
under the Company’s 2004 Omnibus Incentive Compensation Plan (the “2004
Plan”), as amended effective January 1, 2006, filed as Exhibit 10.27
to the Company’s 2005 annual report on Form 10-K, and incorporated
herein by reference.**
|
|||
| 10.44 |
2001
Stock Incentive Plan, Amended and Restated as of January 1, 2008, filed as
Exhibit 10.9 to the Company’s July 1, 2007 quarterly
report on Form 10-Q, and incorporated herein by
reference.**
|
|||
| 10.45 |
Form of
Incentive Stock Option Agreement for awards under the 2001 Plan, filed as
Exhibit 10.3 to the Company’s July 3, 2005 quarterly report on
Form 10-Q, and incorporated herein by reference.**
|
|||
| 10.46 |
Form of
Non-Qualified Stock Option Agreement for awards under the 2001 Plan, filed
as Exhibit 10.4 to the Company’s July 3, 2005 quarterly report
on Form 10-Q, and incorporated herein by reference.**
|
|||
| 10.47 |
Amendment
of Restricted Stock Agreements under 2001 Plan, dated as of
September 12, 2002, filed as Exhibit 10.30 to the Company’s
September 30, 2002 quarterly report on Form 10-Q, and
incorporated herein by reference.**
|
|||
| 10.48 |
Form of
Restricted Stock Agreement for awards under the 2001 Plan, filed as
Exhibit 10.4 to the Company’s September 30, 2004 quarterly
report on Form 10-Q, and incorporated herein by
reference.**
|
|||
| 10.49 |
2001
Plan Document Relating to Election to Receive Employee Stock Options in
Lieu of Certain Cash Compensation Payable to Company Officers in Fiscal
Year 2002, filed as Exhibit 10.6 to the Company’s 2001 annual report
on Form 10-K, and incorporated herein by reference.**
|
|||
| 10.50 |
1999
Stock Incentive Plan, Amended and Restated as of January 1, 2008, filed as
Exhibit 10.8 to the Company’s July 1, 2007 quarterly report on
Form 10-Q, and incorporated herein by reference.**
|
|||
| 10.51 |
Form of
Incentive Stock Option Agreement for awards under the 1999 Stock Incentive
Plan (the “1999 Plan”), filed as Exhibit 10.5 to the July 3,
2005 quarterly report on Form 10-Q, and incorporated herein by
reference.**
|
|||
83
INTERMEC,
INC.
INDEX
TO EXHIBITS
| 10.52 |
Form of
Non-Qualified Stock Option Agreement for awards under the 1999 Plan, filed
as Exhibit 10.6 to the July 3, 2005 quarterly report on
Form 10-Q, and incorporated herein by reference.**
|
||
| 10.53 |
Amendment
of Restricted Stock Agreements under 1999 Plan, dated as of
September 12, 2002, filed as Exhibit 10.30 to the Company’s
September 30, 2002 quarterly report on Form 10-Q, and
incorporated herein by reference.**
|
||
| 10.54 |
1999
Plan Document Relating to Election to Receive Employee Stock Options in
Lieu of Certain Cash Compensation Payable to Company Officers in Fiscal
Year 2002, filed as Exhibit 10.6 to the Company’s 2001 annual report
on Form 10-K, and incorporated herein by reference.**
|
||
| 10.55 |
1997
Stock Incentive Plan, as amended March 30, 2007, filed as
Exhibit 10.4 to the Company’s April 1, 2007 quarterly report on
Form 10-Q, and incorporated herein by reference.**
|
||
| 10.56 |
Summary
Sheet – Compensation Arrangements for Patrick J. Byrne, President and
Chief Executive Officer, filed as Exhibit 10.13 to the Company’s
July 1, 2007 quarterly report on Form 10-Q, and incorporated
herein by reference.**
|
||
| 10.57 |
Summary
Sheet – Compensation Arrangements for Robert J. Driessnack, Senior Vice
President and Chief Financial Officer, filed as Exhibit 10.52 to the
Company’s 2008 annual report on Form 10-K, and incorporated herein by
reference.**
|
||
| 10.58 | Summary Sheet – Amended Relocation Benefits for Robert J. Driessnack, Senior Vice President and Chief Financial Officer, field as Exhibit 10.1 to the Company’s September 27, 2009 quarterly report on Form 10-Q, and incorporated herein by reference. ** | ||
| 10.59 | Summary Sheet – Compensation Arrangements for Dennis A. Faerber, Senior Vice President, Global Supply Chain Operations.** | ||
| 21.1 |
Subsidiaries
of the Registrant.*
|
||
| 23.1 |
Consent
of Independent Registered Public Accounting Firm.*
|
||
| 31.1 |
Certification
pursuant to section 302 of the Sarbanes-Oxley Act of 2002 (subsections
(a) and (b) of section 1350, chapter 63 of Title 18, United
States Code), dated February 19, 2010.*
|
||
| 31.2 |
Certification
pursuant to section 302 of the Sarbanes-Oxley Act of 2002 (subsections
(a) and (b) of section 1350, chapter 63 of Title 18, United
States Code), dated February 19, 2010.*
|
||
| 32.1 |
Certification
pursuant to section 906 of the Sarbanes-Oxley Act of 2002 (subsections
(a) and (b) of section 1350, chapter 63 of Title 18, United
States Code), dated February 19, 2010.*
|
||
| 32.2 |
Certification
pursuant to section 906 of the Sarbanes-Oxley Act of 2002 (subsections
(a) and (b) of section 1350, chapter 63 of Title 18, United
States Code), dated February 19,
2010.*
|
|
|
|
* Copies
of these exhibits are included in this Annual Report on Form 10-K filed
with the Securities and Exchange Commission.
**
Compensatory plan or arrangement.
+ Portions
of this exhibit were omitted and have been filed separately with the Secretary
of the Securities and Exchange Commission pursuant to the Registrant’s
application requesting confidential treatment under Rule 406 of the Securities
Act of 1933 or Rule 24b-2 of the Securities Exchange Act of
1934.
84