Attached files
| file | filename |
|---|---|
| EX-23.1 - EY CONSENT - COMPASS MINERALS INTERNATIONAL INC | eyconsent.htm |
| EX-31.2 - CFO 302 CERTIFICATION - COMPASS MINERALS INTERNATIONAL INC | cfo302cert.htm |
| EX-31.1 - CEO 302 CERTIFICATION - COMPASS MINERALS INTERNATIONAL INC | ceo302cert.htm |
| EX-12.1 - FIXED CHARGE CALCULATION - COMPASS MINERALS INTERNATIONAL INC | fixedchargecalc.htm |
| EX-32 - SECTION 1350 CERTIFICATION - COMPASS MINERALS INTERNATIONAL INC | section1350cert.htm |
| EX-21.1 - SUBSIDIARY LISTING - COMPASS MINERALS INTERNATIONAL INC | subsidiarylistingexhibit.htm |
| EX-10.14 - NONEMPLOYEE DIRECTOR COMPENSATION PROGRAM - COMPASS MINERALS INTERNATIONAL INC | nonemployeedircompexhibit.htm |
| EX-10.30 - LISTING OF PARTIES TO CHANGE IN CONTROL AGREEMENT - COMPASS MINERALS INTERNATIONAL INC | listofchangeincontrolexhibit.htm |
United
States
Securities
and Exchange Commission
Washington,
D.C. 20549
FORM
10-K
(MARK ONE)
R ANNUAL
REPORT PURSUANT TO SECTION 13 OR 15(d) OF THE
SECURITIES
EXCHANGE ACT OF 1934
For the
fiscal year ended December 31, 2009
OR
£ TRANSITION
REPORT PURSUANT TO SECTION 13 OR 15(d) OF
THE
SECURITIES ACT OF 1934
For the
transition period from _______ to _______
Commission
File Number 001-31921

Compass Minerals
International, Inc.
(Exact name of Registrant
as specified in its charter)
|
Delaware
|
36-3972986
|
|
(State
or other jurisdiction of incorporation or organization)
|
(I.R.S.
Employer Identification No.)
|
|
9900
West 109th
Street, Suite 600
|
66210
|
|
Overland
Park, Kansas
|
(Zip
Code)
|
|
(Address
of principal executive offices)
|
Registrant’s
telephone number, including area code:
(913)
344-9200
Securities
Registered Pursuant to Section 12(b) of the Act:
|
Title
of each class
|
Name
of each exchange on which registered
|
|
Common
stock, par value $0.01 per share
|
New
York Stock Exchange
|
|
Preferred
Stock Purchase Rights
|
New
York Stock Exchange
|
Securities
Registered Pursuant to Section 12(g) of the Act: None
Indicate by check mark if the registrant is a well-known seasoned issuer, as defined in Rule 405 of the Securities Act. Yes R No £
Indicate
by check mark if the registrant is not required to file reports pursuant to
Section 13 or Section 15(d) of the Exchange Act. Yes £ No R
Indicate
by check mark whether the registrant (1) has filed all reports required to be
filed by Section 13 or 15(d) of the Securities Exchange Act of 1934 during the
preceding 12 months (or for such shorter period that the registrant was required
to file such reports), and (2) has been subject to such filing requirements for
the past 90 days. Yes RNo £
Indicate
by check mark whether the registrant has submitted electronically and posted on
its corporate Website, if any, every Interactive Data File required to be
submitted and posted pursuant to Rule 405 of Regulation S-T during the preceding
12 months (or for such shorter period that the registrant was required to submit
and post such files). Yes £ No £
Indicate
by check mark if disclosure of delinquent filers pursuant to Item 405 of
Regulation S-K is not contained herein, and will not be contained, to the best
of registrant's knowledge, in definitive proxy or information statements
incorporated by reference in Part III of this Form 10-K or any amendment to this
Form 10-K. £
Indicate
by check mark whether the registrant is a large accelerated filer, an
accelerated filer, a non-accelerated filer, or a smaller reporting
company. See definitions of “large accelerated filer,“ “accelerated
filer” and “smaller reporting company” in Rule 12b-2 of the Exchange
Act.
Large accelerated filer R Accelerated
filer £
Non-accelerated
filer £ Smaller reporting
company £
Indicate
by check mark whether the registrant is a shell company (as defined in Rule
12b-2 of the Exchange Act).Yes
£ No R
As of
June 30, 2009, the aggregate market value of the registrant’s common stock held
by non-affiliates of the registrant was $1,789,653,626, based on the closing
sale price of $54.91 per share, as reported on the New York Stock
Exchange.
The
number of shares outstanding of the registrant’s $0.01 par value common stock at
February 17, 2010 was 32,661,149 shares.
DOCUMENTS
INCORPORATED BY REFERENCE
Document Parts into which
Incorporated
Portions
of the Proxy Statement for the Annual Meeting
of Part III, Items 10, 11,
12, 13 and 14
Stockholders
to be held May 5, 2010 (Proxy Statement)
COMPASS
MINERALS INTERNATIONAL, INC. 2009 FORM 10-K
TABLE OF CONTENTS
|
PART
I
|
Page
No.
|
||||
|
Item
1.
|
3 | ||||
|
Item
1A.
|
14 | ||||
|
Item
1B.
|
22 | ||||
|
Item
2.
|
22 | ||||
|
Item
3.
|
22 | ||||
|
Item
4.
|
23 | ||||
|
PART
II
|
|||||
|
Item
5.
|
24 | ||||
|
Item
6.
|
25 | ||||
|
Item
7.
|
26 | ||||
|
Item
7A.
|
36 | ||||
|
Item
8.
|
38 | ||||
|
Item
9.
|
65 | ||||
|
Item
9A.
|
65 | ||||
|
Item
9B.
|
65 | ||||
|
PART
III
|
|||||
|
Item
10.
|
66 | ||||
|
Item
11.
|
66 | ||||
|
Item
12.
|
66 | ||||
|
Item
13.
|
66 | ||||
|
Item
14.
|
66 | ||||
|
PART
IV
|
|||||
|
Item
15.
|
67 | ||||
| 72 | |||||
|
PART
I
|
CAUTIONARY
NOTE REGARDING FORWARD-LOOKING STATEMENTS
This
annual report on Form 10-K (the “report”) contains forward-looking statements.
These statements relate to future events or our future financial performance,
and involve known and unknown risks, uncertainties and other factors that may
cause our actual results, levels of activity, performance or achievements to be
materially different from any future results, levels of activity, performance or
achievements, expressed or implied, by these forward-looking statements. These
risks and other factors include, among other things, those listed under Item 1A,
“Risk Factors” and elsewhere in this report. In some cases, you can identify
forward-looking statements by terminology such as “may,” “might,” “will,”
“should,” “could,” “expects,” “intends,” “plans,” “anticipates,” “believes,”
“estimates,” “predicts,” “potential,” “continue” or the negative of these terms
or other comparable terminology. These statements are only predictions. Actual
events or results may differ materially. In evaluating these statements, you
should specifically consider various factors, including the risks outlined under
Item 1A, “Risk Factors.” These factors may cause our actual results to differ
materially from any forward-looking statement.
Although
we believe that the expectations reflected in the forward-looking statements are
reasonable, we cannot guarantee future results, levels of activity, performance
or achievements. We undertake no duty to update any of the forward-looking
statements after the date of this report. Factors that could cause actual
results, levels of activity, performance or achievements to differ materially
from those expressed or implied by the forward-looking statements include, but
are not limited to, the following:
|
·
|
domestic
and international general business and economic
conditions;
|
|
·
|
hazards
of underground mining;
|
|
·
|
governmental
policies affecting the highway maintenance programs, consumer and
industrial industry or agricultural industry in localities where we or our
customers operate;
|
|
·
|
weather
conditions;
|
|
·
|
the
impact of competitive products;
|
|
·
|
pressure
on prices realized by us for our
products;
|
|
·
|
constraints
on supplies of raw materials used in manufacturing certain of our products
or the price or lack of availability of transportation
services;
|
|
·
|
our
ability to attract and retain skilled personnel or a disruption in our
workforce;
|
|
·
|
capacity
constraints limiting the production of certain
products;
|
|
·
|
difficulties
or delays in the development, production, testing and marketing of
products;
|
|
·
|
difficulties
or delays in receiving required governmental and regulatory
approvals;
|
|
·
|
market
acceptance issues, including the failure of products to generate
anticipated sales levels;
|
|
·
|
the
effects of and changes in trade, monetary, environmental and fiscal
policies, laws and regulations;
|
|
·
|
the
impact of indebtedness and interest
rates;
|
|
·
|
foreign
exchange rates and fluctuations in those
rates;
|
|
·
|
the
costs and effects of legal proceedings, including environmental and
administrative proceedings involving
us;
|
|
·
|
customer
expectations about future potash market prices and availability and
agricultural economics;
|
|
·
|
credit
and capital markets, including the risk of customer and counterparty
defaults and declining credit
availability;
|
|
·
|
changes
in tax laws or estimates; and
|
|
·
|
other
risk factors included in this Form 10-K and reported from time to time in
our filings with the Securities and Exchange Commission
(“SEC”). See “Where You Can Find More
Information.”
|
MARKET
AND INDUSTRY DATA AND FORECASTS
This
report includes market share and industry data and forecasts that we obtained
from internal company surveys, market research, consultant surveys, publicly
available information and industry publications and surveys. Industry surveys,
publications, consultant surveys and forecasts generally state that the
information contained therein has been obtained from sources believed to be
reliable, but there can be no assurance as to the accuracy and completeness of
such information. We have not independently verified any of the data from
third-party sources nor have we ascertained the underlying economic assumptions
relied upon therein. Similarly, internal company surveys, industry forecasts and
market research, which we believe to be reliable based upon management’s
knowledge of the industry, have not been verified by any independent sources.
Except where otherwise noted, references to North America include only the
continental United States and Canada, and statements as to our position relative
to our competitors or as to market share refer to the most recent available
data. Statements concerning (a) North American consumer and industrial salt are
generally based on historical sales volumes, (b) North American highway deicing
salt are generally based on historical production capacity, (c) sulfate of
potash are generally based on historical sales volumes and (d) United Kingdom
highway deicing salt sales are generally based on historical sales volumes.
Except where otherwise noted, all references to tons refer to “short tons.” One
short ton equals 2,000 pounds. Except where otherwise noted, all
amounts are in U.S. dollars.
WHERE
YOU CAN FIND MORE INFORMATION
We file
annual, quarterly and current reports and other information with the SEC. Our
SEC filings are available to the public over the Internet at the SEC’s website
at http://www.sec.gov.
Please note that the SEC’s website is included in this report as an active
textual reference only. The information contained on the SEC’s website is not
incorporated by reference into this report and should not be considered a part
of this report. You may also read and copy any document we file with the SEC at
the SEC’s public reference facility at 100 F Street, N.E., Washington, D.C. You
may also obtain copies of the documents at prescribed rates by writing to the
Public Reference Section of the SEC at 100 F Street, N.E., Washington, D.C.
20549. For further information on the operation of the public
reference facility call the SEC at 1-800-SEC-0330.
You may
also request a copy of any of our filings, at no cost, by writing or
telephoning:
Investor
Relations
Compass
Minerals
9900 West
109th
Street, Suite 600
Overland
Park, Kansas 66210
For
general inquiries concerning the Company please call (913)
344-9200.
Alternatively,
copies of these documents are also available free of charge on our website,
www.compassminerals.com.
The information on our website is not part of this report and is not
incorporated by reference into this report.
Unless the context requires
otherwise, references in this annual report to the “Company,” “Compass,” “Compass
Minerals,” “CMP,” “we,” “us” and “our” refer to Compass Minerals International,
Inc. (“CMI,” the parent holding company) and its consolidated subsidiaries
collectively.
|
ITEM
1.
|
BUSINESS
|
COMPANY
OVERVIEW
Based in
the Kansas City metropolitan area, Compass Minerals is a leading producer of
minerals, including salt, sulfate of potash specialty fertilizer and magnesium
chloride. We currently operate 11 production and packaging facilities, including
the largest rock salt mine in the world in Goderich, Ontario and the largest
salt mine in the United Kingdom in Winsford, Cheshire. Our solar
evaporation facility located in Ogden, Utah is the largest solar salt production
site in the United States. Our salt products are used for highway
deicing, dust control, consumer deicing, water conditioning, consumer and
industrial food preparation, agricultural and industrial applications. Compass
Minerals is North America’s leading producer of sulfate of potash (“SOP”), which
is used in the production of specialty fertilizers for high-value crops and
turf. In the U.K., we operate a records management business utilizing
excavated areas of our Winsford salt mine with two other locations in London,
England. Our North American salt mines and SOP production facility
are near either water or rail transport systems, which reduces our shipping and
handling costs.
Prior to
December 2003, the Company was privately owned. In December 2003 and
again in July 2004 and November 2004, the
Company completed public offerings. The Company received no proceeds
from the offerings.
Prior to
December 2007, all of our operating subsidiaries were owned by Compass Minerals
Group, Inc. (“CMG”), a wholly-owned subsidiary of CMI. In December
2007, CMG was merged into CMI.
SALT
SEGMENT
Salt is
indispensable and enormously versatile with more than 14,000 uses. In addition,
there is an absence of cost-effective alternatives. As a result, our cash flows
have not been materially impacted by economic cycles. We are among the
lowest-cost salt producers in our markets because our salt deposits are
high-grade quality and among the most extensive in the world, and because we use
effective mining techniques and efficient production processes.
Through
our salt segment we mine, produce, process and distribute sodium chloride and
magnesium chloride in North America and the United Kingdom, including rock,
evaporated and solar salt and liquid and flake magnesium chloride. We also
purchase potassium chloride and calcium chloride to sell as finished products or
to blend with sodium chloride to produce specialty products. Sodium
chloride (either as a single mineral or in combination with other chlorides)
represents the vast majority of our products produced and sold, and accordingly,
we refer to these products collectively as “salt”, unless otherwise
noted. Our salt products are marketed primarily in the United States,
Canada and the United Kingdom. Salt is used in a wide variety of applications,
including as a deicer for both highway and consumer or professional use (rock
salt and specialty deicers, which include pure or blended magnesium chloride,
potassium chloride and calcium chloride salts with sodium chloride), an
ingredient in the production of chemicals, for water treatment and a variety of
other consumer and industrial uses, such as a flavor enhancer and preservative
in food, a nutrient and trace mineral delivery vehicle in animal feeds, an
essential component in both industrial and residential water softeners and as an
additive to aid in the disinfection of spas and swimming pools. The demand for
salt has historically remained relatively stable during periods of rising prices
and during economic cycles due to its relatively low cost and high value with a
diverse number of end uses.
However,
demand for deicing products is affected by changes in winter weather conditions.
On average, over the last three years, approximately 70% of our deicing product
sales (or 37% of consolidated sales) occurred during the months of November
through March when winter weather was most severe. See Note 13 of the
Company’s Consolidated Financial Statements for segment financial
information.
Salt
Industry Overview
The salt
industry is characterized by a long history of modest growth and steady price
increases across various grades. Salt is one of the most common and widely
consumed minerals in the world due to its low relative cost and its utility in a
variety of applications, including highway deicing, food processing, water
conditioning, industrial chemical processing, and nutritional supplements for
animal stock. We estimate that the consumption of rock salt in North America is
approximately 29 million tons per year (approximately 22 million tons per year
in the markets we serve), while the consumer and industrial market totals
approximately 13 million tons per year. In the United Kingdom, we estimate that
the size of the highway deicing market is approximately 2 million tons per year.
According to the latest available data from the U.S. Geological Survey (“USGS”),
during the thirty-year period ending 2008, the production of salt used in
highway deicing and for consumer and industrial products in the United States
has increased at an historical average of approximately 1% - 2% per
year.
Salt
prices vary according to purity and its pricing differences reflect, among other
things, the more extensive refining and packaging processes for a purer-grade
salt. According to the latest USGS data, during the thirty-year period ending
2008, prices for salt used in highway deicing and consumer and industrial
products in the United States have increased at an historical average of
approximately 3% - 4% per year. Due to salt’s relatively low market cost,
transportation and handling costs tend to be a significant component of the
total delivered cost making logistics management and customer service key
competitive factors in the industry. The high relative cost associated with
transportation tends to favor the supply of salt by manufacturers located in
close proximity to their customers.
Processing
Methods
Our
current production capacity, including salt and other minerals purchased under
contracts, is approximately 15.2 million tons of salt per
year. Mining, other production activities and packaging are currently
conducted at 11 of our facilities. Additionally, finished product is
purchased from a supplier under contracts at three facilities. The
three processing methods we use to produce salt are summarized
below.
Underground Rock Salt Mining -
We use a drill and blast mining technique at our North American
underground rock salt mines. Mining machinery moves salt from the salt face to
conveyor belts, which transport the salt to the mill center where it is crushed
and screened. Salt is then hoisted to the surface where it is loaded onto
shipping vessels, railcars or trucks. At our Winsford, U.K. facility, we also
use a continuous mining process. The primary power sources for each of our rock
salt mines are electricity and diesel fuel. Rock salt is primarily sold as our
highway deicing product line and for numerous applications in our consumer and
industrial product lines. Underground rock salt mining represents approximately
84% of our current annual salt production capacity. See Item
1A, “Risk Factors - Our operations are dependent on our rights and ability to
mine our property and having received the required permits and approvals from
third parties and governmental authorities.”
Mechanical Evaporation - The
mechanical evaporation method involves obtaining salt brine from underground
salt deposits
through a
series of brine wells and subjecting that salt-saturated brine to vacuum
pressure and heat generated by an energy source to precipitate and crystallize
salt. The resulting product has both a high purity and uniform physical shape.
Evaporated salt is primarily sold through our consumer and industrial salt
product lines. Mechanical evaporation represents approximately 6% of our current
annual salt production capacity.
Solar Evaporation - The solar
evaporation method is used in areas of the world where high-salinity brine is
available and where weather conditions provide for a high natural evaporation
rate. The brine is pumped into a series of large open ponds where sun and wind
evaporate the water and crystallize the salt, which is then mechanically
harvested and processed through washing, drying and screening. Solar salt is
sold through both our consumer and industrial salt product lines and in our
highway deicing applications. Solar evaporation represents approximately 10% of
our current annual salt production capacity.
We also
produce magnesium chloride through the solar evaporation process. We precipitate
sodium chloride and potassium-rich salts from the brine, leaving a concentrated
magnesium chloride. This resulting concentrated brine becomes the raw
material used to produce several magnesium chloride products, which are sold
through both our consumer and industrial and highway deicing product
lines.
Operations
and Facilities
United States - Our Central
and Midwestern United States consumer and industrial customer base is served
primarily by our mechanical evaporation plant in Lyons, Kansas. Additionally, we
serve areas around the Great Lakes with evaporated salt purchased from a
supplier’s facility in Michigan. The Cote Blanche, Louisiana rock salt mine
serves chemical customers and agricultural customers in the Southern and
Midwestern United States, and highway deicing customers through a series of
depots located along the Mississippi and Ohio Rivers (and their major
tributaries). Our solar evaporation facility located in Ogden, Utah is the
largest solar salt production site in the United States. This facility
principally serves the Midwestern and Western United States’ consumer and
industrial markets, provides salt for chemical applications and highway deicing,
and provides magnesium chloride, which is used in deicing, dust control and soil
stabilization applications. The production capacity for solar-evaporated salt at
our Ogden facility is currently only limited by demand. We also operate three
salt packaging facilities in Illinois, Minnesota and Wisconsin, which serve
consumer deicing and water conditioning customers in the Central, Midwestern and
parts of the Northeastern United States.
Canada - We produce finished
products at four different locations in Canada. From the Goderich, Ontario rock
salt mine, we serve the highway deicing markets and the consumer and industrial
markets in Canada and the Great Lakes region of the United States, principally
through a series of depots located around the Great Lakes. Mechanically
evaporated salt used for consumer and industrial product lines is produced at
three facilities strategically located throughout Canada: Amherst, Nova Scotia
in Eastern Canada; Goderich, Ontario in Central Canada; and Unity, Saskatchewan
in Western Canada. We also purchase salt and other products, including potassium
chloride (“KCl”), from a potash producer’s facilities located in Saskatchewan,
which serve both the consumer and industrial and the highway deicing markets in
the U.S. and Canada.
United Kingdom - Our United
Kingdom highway deicing customer base is served by the Winsford rock salt mine
in Northwest England, near Manchester.
The
following table shows the current annual production capacity and type of salt
produced at each of our owned or leased production locations:
|
Location
|
Annual
Production
Capacity
(tons)
|
Product
Type
|
|||
|
North
America
|
|||||
|
Goderich,
Ontario Mine (a)
|
7,500,000 |
Rock
salt
|
|||
|
Cote
Blanche, Louisiana Mine
|
3,300,000 |
Rock
salt
|
|||
|
Ogden,
Utah:
|
|||||
|
Salt
Plant
|
1,500,000 |
Solar
salt
|
|||
|
Magnesium
Chloride Plant (b)
|
500,000 |
Magnesium
chloride
|
|||
|
Lyons,
Kansas Plant
|
450,000 |
Evaporated
salt
|
|||
|
Unity,
Saskatchewan Plant
|
175,000 |
Evaporated
salt
|
|||
|
Goderich,
Ontario Plant
|
175,000 |
Evaporated
salt
|
|||
|
Amherst,
Nova Scotia Plant
|
120,000 |
Evaporated
salt
|
|||
|
United
Kingdom
|
|||||
|
Winsford,
Cheshire Mine
|
1,500,000 |
Rock
salt
|
|||
|
(a)
|
Our
Goderich mine expansion project is expected to increase our capacity to
approximately 9,000,000 tons, as demand
warrants.
|
|
(b)
|
The
magnesium chloride amount includes both brine and
flake.
|
Salt
production, including magnesium chloride, at these facilities totaled an
aggregate of 15.1 million tons, 13.4 million tons and 10.7 million tons for the
years ended December 31, 2009, 2008 and 2007,
respectively. Variations in production volumes are typically entirely
attributable to variations in the winter season weather ending in March of each
year, which impacts the demand during the winter for highway and consumer
deicing products. We increased our annual capacity by 750,000 tons
related to the first phase of an expansion project at our Goderich rock salt
mine. The second phase of this expansion project, scheduled to
partially come on-line during 2010 with full availability as demand warrants,
and is expected to ultimately increase that mine’s annual capacity to 9.0
million tons.
Salt is
found throughout the world and, where it is commercially produced, it is
typically deposited in extremely large quantities. Our mines at Goderich, Cote
Blanche and Winsford, as well as at our other operating facilities, have access
to vast mineral deposits. In most of our production locations, we estimate the
recoverable salt reserves to reach at least several more decades at current
production rates and capacities. Our rights to extract those minerals may
currently be contractually limited by either geographic boundaries or time. We
believe that we will be able to continue to extend these agreements, as we have
in the past, at commercially reasonable terms, without incurring substantial
costs or incurring material modifications to the existing lease terms and
conditions, thereby allowing us to extract the additional salt necessary to
fully develop our existing mineral rights.
Our
underground mines in Canada (Goderich, Ontario), the United States (Cote
Blanche, Louisiana) and the United Kingdom (Winsford, Cheshire) make up 84% of
our salt producing capacity (see Item 1A. “Risk Factors - Our operations are
dependent on our rights and ability to mine our property and having received the
required permits and approvals from third parties and governmental
authorities.”). Each of these mines is operated with modern mining equipment and
utilizes subsurface improvements such as vertical shaft lift systems, milling
and crushing facilities, maintenance and repair shops and extensive raw
materials handling systems. We believe our properties and our operating
equipment are maintained in good working condition.
The mine
site at the Goderich mine is owned. We also maintain a mineral lease at Goderich
with the provincial government, which grants us the right to mine salt. This
lease expires in 2022 with the option to renew until 2043. The Cote Blanche mine
is operated under land and mineral leases with third-party landowners who grant
us the right to mine salt. The leases expire in 2060. The mine site and salt
reserves at the Winsford mine are owned.
Our mines
at Goderich, Cote Blanche and Winsford have been in operation for approximately
50, 44 and 164 years, respectively. At current average rates of production, we
estimate that our remaining years of production for the recoverable minerals we
presently own or lease to be 124, 74 and 21 years, respectively. Our mineral
interests are amortized on an individual basis over estimated useful lives not
to exceed 99 years using primarily the units-of-production method. Our estimates
are based on, among other things, the results of reserve studies completed by a
third-party geological engineering firm. The reserve estimates are primarily a
function of the area and volume covered by the mining rights and estimates of
extraction rates utilized by us with the reasonable expectation of reliably
operating the mines on a long-term basis. Established criteria for proven and
probable reserves are primarily applicable to mining deposits of discontinuous
metal, where both presence of ore and its variable grade need to be precisely
identified. However, the massive continuous nature of evaporative deposits, such
as salt, requires proportionately less data for the same degree of confidence in
mineral reserves, both in terms of quantity and quality. Reserve
studies performed by a third-party engineering firm suggest that our salt
reserves most closely resemble probable reserves and we have therefore
classified our reserves as probable reserves.
We
package salt products at three additional facilities. The table below shows the
packaging capacity at each of these facilities:
|
Location
|
Annual
Packaging
Capacity
(tons)
|
|||
|
Kenosha,
Wisconsin
|
150,000 | |||
|
Chicago,
Illinois
|
150,000 | |||
|
Duluth,
Minnesota
|
100,000 | |||
We also
have contracts to purchase finished salt and potassium chloride from a supplier
at three North American locations. One of these locations has a
minimum purchasing commitment for evaporated salt, which is cancelable if we
give one year’s notice.
Products and Sales - We sell
our salt products as highway deicing salt (including liquid magnesium chloride,
calcium chloride and treated rock salt) and consumer and industrial salt
(including flake magnesium chloride, calcium chloride and KCl). Highway deicing,
including salt sold to chemical customers, constituted approximately 47% of our
gross sales in 2009. Principal customers are states, provinces, counties,
municipalities and road maintenance contractors that purchase bulk deicing salt,
both untreated and treated, for ice control on public roadways. Highway deicing
salt is sold primarily through an annual tendered bid contract process as well
as through some longer-term contracts, with price, product quality and delivery
being the primary competitive market factors (see Item 1A. “Risk Factors -
Environmental laws and regulation may subject us to significant liability and
require us to incur additional costs in the future. Additionally, our
business is subject to numerous laws and regulations with which we must comply
in order to operate our business and obtain contracts with governmental
entities). Some sales also occur through a negotiated sales contract with
third-party customers, particularly in the U.K. In North America, the locations
of the salt sources and distribution outlets also play a significant role in
determining a supplier. We have an extensive network of approximately 85 depots
for storage and distribution of highway deicing salt in North America. The
majority of these depots are
located
on the Great Lakes and the Mississippi and Ohio River systems (and their major
tributaries) where our Goderich, Ontario and Cote Blanche, Louisiana mines are
located to serve those markets. Salt and liquid magnesium chloride from our
Ogden, Utah facility are also used for highway deicing in the Western and upper
Midwest regions of the U.S. Treated rock salt is sold throughout our
markets and is typically rock salt treated with liquid magnesium chloride and
other organic materials, which enhance the performance of the
product.
We
produce highway deicing salt in the United Kingdom at our mining facility at
Winsford, Cheshire, the largest rock salt mine in the United Kingdom. We believe
our production capability and favorable logistics position enhance our ability
to meet winter demands. Because of our strong position, we are recognized as a
key strategic provider by the United Kingdom’s Highway Agency. As such, we help
the Highway Agency develop standards for deicing products and services that are
provided to them through their deicing application contractors. In the United
Kingdom approximately 70% of our highway deicing business is on multi-year
contracts.
Winter
weather variability, particularly in the U.K., is the most significant factor
affecting salt sales for deicing applications because mild winters reduce the
need for salt used in ice and snow control. On average, over the last three
years, approximately 70% of our deicing product sales (or 37% of consolidated
sales) occurred during the months of November through March when winter weather
was most severe. Lower than expected sales during this period could have a
material adverse effect on our results of operations. The vast majority of our
North American deicing sales are made in Canada and the Midwestern United States
where inclement weather during the winter months causes dangerous road
conditions. In keeping with industry practice, we stockpile quantities of salt
to meet estimated requirements for the next winter season. See Item 1A, “Risk
Factors — The seasonal demand for our products and the variations in our
operations from quarter to quarter due to weather conditions may have an adverse
effect on our results of operations and the price of our common stock” and Item
7, “Management’s Discussion and Analysis of Financial Condition and Results of
Operations — Seasonality.”
Our
principal chemical customers are producers of intermediate chemical products
used in the production of vinyls and other chemicals and pulp and paper as well
as water treatment and a variety of other industrial uses. Our customer
locations typically do not have a captive source of brine. Distribution into the
chemical market is made primarily through multi-year supply agreements, which
are negotiated privately. Price, service, product quality and security of supply
are the major competitive market factors.
Sales of
our consumer and industrial products accounted for approximately 39% of our 2009
gross sales. We are the third largest producer of consumer and industrial salt
products in the North America. This product line includes commercial and
consumer applications, such as table salt, water conditioning, consumer and
professional ice control, food processing, pool salt, agricultural applications,
as well as a variety of industrial applications. We believe that we are among
the largest private-label producers of water conditioning and table salt
products in the North America. Our Sifto® brand encompasses a full line of salt
products, which are well recognized in the Canadian market.
The
Company’s consumer and industrial market is driven by private label products,
emerging brands and strong customer relationships. Sales in the
consumer and industrial product line occur through many segments including, but
not limited to, retail, agricultural, industrial, janitorial and sanitation, and
distributors. Distribution in the consumer and industrial product
line is channeled through the Company’s plants to third-party warehouses to our
customers, wholesalers or distributors using a combination of direct sales
personnel, contract personnel and a network of brokers or manufacturers’
representatives.
The table
below shows our shipments of salt products:
|
Year
ended December 31,
|
||||||||||||||||||||||||
|
2009
|
2008
|
2007
|
||||||||||||||||||||||
|
(thousands
of tons)
|
Tons
|
%
|
Tons
|
%
|
Tons
|
%
|
||||||||||||||||||
|
Highway
Deicing
|
9,608 | 80 | 12,237 | 81 | 10,373 | 81 | ||||||||||||||||||
|
Consumer
and Industrial
|
2,463 | 20 | 2,852 | 19 | 2,412 | 19 | ||||||||||||||||||
|
Total
|
12,071 | 100 | 15,089 | 100 | 12,785 | 100 | ||||||||||||||||||
Competition – We face strong
competition in each of the markets in which we operate. In North America, other
large, nationally recognized companies compete against our salt products. In
addition, there are also several smaller regional producers of salt. There are
several importers of salt into North America but these mostly impact the East
Coast and West Coast of the United States where we have minimal positions. In
the United Kingdom, there are two other companies that produce highway deicing
salt, one in Northern England and the other in Northern Ireland. There are no
significant imports of highway deicing salt into the United Kingdom (see Item
1A, “Risk Factors — Competition in our markets could limit our ability to
attract and retain customers, force us to continuously make capital investments,
alter supply levels and put pressure on the prices we can charge for our
products. Additionally, with regard to our specialty fertilizer product,
economic conditions in the agricultural markets, and supply and demand
imbalances for competing potash products can also impact the price of or demand
for our products”).
SPECIALTY
FERTILIZER SEGMENT
Fertilizers
in general serve a significant role in efficient crop production around the
world. Potassium is a vital nutrient in some fertilizers, which
assists in regulating plants’ growth and improving durability. Potassium is
contained in the two major forms of potash fertilizer, SOP and
KCl. SOP is primarily used as a specialty fertilizer, providing
essential potassium to increase the yield and quality of crops, which tend to
be, though are not necessarily, high-value or chloride-sensitive, such as
vegetables, fruits, potatoes, nuts, tobacco and turf grass. We are the leading
SOP producer and marketer in North America and we also market SOP products
internationally. We offer several sizes of SOP products, which are designed to
better serve the special needs of our customers. Our SOP plant is the largest in
North America and one of only three solar brine SOP operations in the world. In
2009, the specialty fertilizer segment accounted for approximately 13% of our
gross sales. See Note 13 of the Company’s Consolidated Financial Statements for
segment financial information.
Potash Industry
Overview
The
average annual worldwide consumption of all potash fertilizers is approximately
65 million tons. KCl is the most common source of potassium and accounts for
approximately 89% of all potash consumed in fertilizer production. SOP
represents approximately 10% of potash consumption. The remainder is supplied in
the forms of potassium magnesium sulfate, potassium nitrate and, to a lesser
extent, potassium thiosulfate and monopotassium phosphate. All of these products
contain varying concentrations of potassium expressed as potassium oxide
(“K2O”) and
different combinations of co-nutrients.
KCl is
the most widely used potassium source for most crops and is typically a less
expensive form of potash fertilizer than SOP. SOP is generally priced at a
premium to KCl and market conditions affecting KCl have similar implications to
SOP. SOP (containing approximately 50% K2O) is
utilized by growers for many high-value crops, especially where there are needs
for fertilizers with low chloride content. The use of SOP has been
scientifically proven to improve the yield or quality of certain crops such as
potatoes, citrus fruits, grapes, almonds, some vegetables, tobacco and
turfgrass, including turf for golf courses.
Through
2008, world-wide consumption of potash increased in response to growing
populations and reduced arable land per capita requiring improved crop yield
efficiencies. In addition, relatively high energy prices in 2008
improved the economics of ethanol and bio-diesel production, which utilize
agricultural products as feedstock. The increased demand and limited
supply of potash at current capacity levels, led to improved overall potash
market prices, most significantly in 2008. However, general worldwide
declines in economic growth, reduced access to credit for growers, falling crop
prices, general crop and economic uncertainty for growers and inventory
de-stocking in the supply chain suppressed demand for fertilizers beginning late
in 2008 triggering a subsequent decline in most fertilizer
prices. Additionally, we believe growers have refined application
techniques to reduce inefficiencies while also depleting existing potassium
levels in the soil. Although potash prices have declined, they
remained above historical levels throughout 2009, unlike other commodity
fertilizer products. Consequently, demand throughout 2009 remained
low with considerable uncertainty in the market about price
expectations.
Approximately
77% of our annual SOP sales volumes in 2009 were made to domestic customers,
which include retail fertilizer dealers and distributors of professional turf
care products. These dealers and distributors combine or blend SOP with other
fertilizers and minerals to produce fertilizer blends tailored to individual
requirements. (see Item 1A, “Risk Factors — Competition in our markets could
limit our ability to attract and retain customers, force us to continuously make
capital investments, alter supply levels and put pressure on the prices we can
charge for our products. Additionally, with regard to our specialty fertilizer
product, economic conditions in the agricultural markets, and supply and demand
imbalances for competing potash products can also impact the price of and demand
for our products”).
Operations
and Facilities
All of
our SOP production is located at the Great Salt Lake west of Ogden, Utah. It is
the largest SOP production facility in North America. The evaporation system
utilizes solar energy and operates over 40,000 acres of evaporation ponds to
produce salt, SOP and magnesium chloride from the brine of the Great Salt Lake.
The property utilized in our operation is both owned and leased under annually
renewing leases. This facility currently has the capacity to produce
approximately 500,000 tons (including approximately 300,000 tons from solar
ponds) of SOP, approximately 500,000 tons of magnesium chloride, and over 1.5
million tons of salt annually. These recoverable minerals exist in vast
quantities in the Great Salt Lake. We believe the recoverable minerals exceed
100 years of reserves at current production rates and capacities and are so vast
that quantities will not be significantly impacted by our production. Our rights
to extract these minerals are contractually limited although we believe we will
be able to extend our lease agreements, as we have in the past, at commercially
reasonable terms, without incurring substantial costs or incurring material
modifications to the existing lease terms and conditions, thereby allowing us to
continue extracting minerals.
We draw
lake water, or brine from the Great Salt Lake into our solar evaporation
ponds. The water moves through our various solar evaporation ponds in
stages. Water has the capacity to hold only a limited amount of
minerals. As the water evaporates and the mineral concentration increases,
some of those minerals must naturally precipitate out of the water where they
are deposited on the floors of the solar evaporation ponds. In our ponds, the
salt (sodium chloride) minerals are the first to precipitate. We monitor
the changing mineral composition during evaporation and manage deposition of
specific compounds by either pumping or allowing the brine to flow by gravity to
the next pond in the series, where this process continues. Eventually,
potassium compounds drop from the brine, leaving a floor of potassium enriched
salts. The remaining brine, now almost exclusively magnesium compounds,
flows to holding ponds before it is processed into magnesium chloride products
for sale.
The
potassium-bearing salts are mechanically harvested out of the solar evaporation
ponds and refined to high purity SOP in our production facility that has been in
operation since 1967. We believe that our property and operating
equipment are maintained in good working condition.
We can
also use KCl as a raw material feedstock to supplement the Company’s solar
harvest. We currently have a contract with a supplier for the purchase of KCl
that is subject to annual price changes based on prior year changes in the
market price of KCl. Over the past three years, we have produced
approximately 40% of our finished SOP from raw materials purchased under this
KCl supply contract. The market price for KCl has increased
significantly in recent years, causing continued price increases under our KCl
supply contract. However, due to the time lag and formula for the
annual contract price adjustment, our contract pricing has been favorable to
market since 2005. Although we cannot predict future changes in market prices
for KCl, our 2009 per ton KCl purchase costs were higher than the 2008 unit
costs. We expect our 2010 per ton KCl unit costs under the contract
would increase significantly from the 2009 unit costs (see Item 1A. “Risk
Factors – Our production process consumes large amounts of natural gas, steam
and electricity. Additionally, KCl is a raw material feedstock used
to supplement our SOP solar harvest, produce some of our deicing products and
sell for water conditioning applications. A significant interruption
in the supply or an increase in the price of any of these products or services
could have a material adverse effect on our financial condition or results of
operations”). During 2009, we purchased our full contractual
allotment under this KCl supply contract. A significant portion of
these purchases were utilized to immediately convert to SOP. Since
demand remained soft throughout 2009, we built higher than typical SOP
inventories. As a result, when combined with our expected increase in
capacity from our existing solar pond facilities, we currently anticipate
purchasing substantially less KCl, if any, in 2010 and beyond under this supply
contract to produce SOP.
In 2007
we began the initial phase of a multi-phased plan to strengthen our low cost
solar pond-based SOP production through upgrades to our processing plant and
expansion of our solar evaporation ponds. The initial phase includes
some modification to our existing solar evaporation ponds and increases in the
extraction yields and processing capacity of our SOP plant. These improvements
are expected to increase our solar pond-based SOP production capacity
progressively through 2011, achieving pond-based capacity of approximately
350,000 tons annually by 2011. In addition to this initial yield
improvement phase, we are seeking to add new solar evaporation ponds to our
existing pond acreage to produce more SOP feedstock in order to significantly
reduce or eliminate our purchases of higher cost potassium chloride. During
2008, we secured leases on approximately 23,000 additional acres on and around
the Great Salt Lake (and adjacent to our existing solar ponds), which we believe
to be suitable for mineral extraction. We are currently seeking the
permits required to develop 60,000 acres, which includes 8,000 underdeveloped
acres previously leased, into solar evaporation ponds. The process
for granting leases for this expansion project has been challenged by
third-party organizations. To this end, we are currently
participating in an environmental study and performing other activities required
of us in order to obtain the permits, which would allow us to expand our solar
evaporation ponds. The final scope of the second phase expansion will be
determined following our detailed engineering analysis and the Army Corps of
Engineers’ comprehensive permitting process. We do not expect to
begin construction on any portion of the additional lease lands before
2011. There can be no assurance that these permits will be received
on all or any portion of these leased lands, nor if received, that the lands
will be developed to produce marketable product. See Item 1A. “Risk Factors –
Our operations are dependent on our rights and ability to mine our property and
having received the required permits and approvals from third parties and
governmental authorities.” If we are unable to obtain all or a
portion of the required permits, the previously capitalized costs associated
with the project would be evaluated for impairment. As of December
31, 2009, total capital expenditures related to this project were $3.5
million.
Products and Sales - Our
domestic sales of SOP are concentrated in the western and southeastern portions
of the United States where the crops and soil conditions favor the use of SOP as
a source of potassium nutrients. International SOP sales volumes in 2009 were
23% of our annual SOP sales (see Note 13 to our Consolidated Financial
Statements). We have an experienced global sales group focusing on the specialty
aspects and benefits of SOP as a source of potassium nutrients.
The table
below shows our domestic and export shipments of SOP:
|
Year
Ended December 31,
|
||||||||||||||||||||||||
|
2009
|
2008
|
2007
|
||||||||||||||||||||||
|
(thousands
of tons)
|
Tons
|
%
|
Tons
|
%
|
Tons
|
%
|
||||||||||||||||||
|
U.S.
|
118 | 77 | 248 | 63 | 301 | 71 | ||||||||||||||||||
|
Export(a)
|
35 | 23 | 143 | 37 | 122 | 29 | ||||||||||||||||||
|
Total
|
153 | 100 | 391 | 100 | 423 | 100 | ||||||||||||||||||
|
(a)
|
Export sales include product sold
to foreign customers at U.S.
ports.
|
Competition - Approximately
38% of the world SOP capacity is located in Europe, 7% in the United States and
the remaining 55% in various other countries. The world capacity of SOP totals
about 8.0 million tons. Our major competition for SOP sales in North America
includes imports from Germany, Chile, Canada and Belgium. In addition, there is
also some functional competition between SOP and other forms of potash. For
exports into Asia, the Pacific Rim countries and Latin America, we compete on a
global level with various other producers (see Item 1A, “Risk Factors —
Competition in our markets could limit our ability to attract and retain
customers, force us to continuously make capital investments, alter supply
levels and put pressure on
the
prices we can charge for our products. Additionally, with regard to our
specialty fertilizer product, economic conditions in the agricultural markets,
and supply and demand imbalances for competing potash products can also impact
the price of and demand for our products”).
OTHER
DeepStore
is a records management business in the U.K. that utilizes certain excavated
portions of our salt mine in Winsford, Cheshire for secure document
storage. In January 2007, DeepStore acquired Interactive Records
Management Limited, a records management business with two locations in London,
England. At present, neither of these operations, individually or
combined, has a significant share of the document storage market, nor are they
material in comparison to our salt and specialty fertilizer
segments.
INTELLECTUAL
PROPERTY
We rely
on a combination of patents, trademarks, copyright and trade secret protection,
employee and third-party non-disclosure agreements, license arrangements and
domain name registrations to protect our intellectual property. We sell many of
our products under a number of registered trademarks that we believe are widely
recognized in the industry. The following items are some of our registered
trademarks pursuant to applicable intellectual property laws and are the
property of our subsidiaries: “American Stockman®,”
“FreezGard®,”
“K-Life®,”
“Nature’s Own®,”
“ProSoft®,”
“Safe Step®,”
“Sifto®,”
“Sure Soft®,”
“Thawrox®,”
“Winter Storm®,”
“Organic K+®,”
“Choice®,” and
“Turf Blend®.” No
single patent, trademark or trade name is material to our business as a
whole.
Any
issued patents that cover our proprietary technology and any of our other
intellectual property rights may not provide us with substantial protection or
be commercially beneficial to us. The issuance of a patent is not conclusive as
to its validity or its enforceability. Competitors may also be able to design
around our patents. If we are unable to protect our patented technologies, our
competitors could commercialize our technologies.
With
respect to proprietary know-how, we rely on trade secret protection and
confidentiality agreements. Monitoring the unauthorized use of our technology is
difficult and the steps we have taken may not prevent unauthorized use of our
technology. The disclosure or misappropriation of our intellectual property
could harm our ability to protect our rights and our competitive position. See
Item 1A. “Risk Factors — Protection of proprietary technology — Our intellectual
property may be misappropriated or subject to claims of
infringement.”
EMPLOYEES
As of
December 31, 2009, we had 1,792 employees, of which 892 are employed in the
United States, 738 in Canada and 162 in the United Kingdom. Approximately 30% of
our U.S. workforce and approximately 50% of our global workforce is represented
by labor unions. Of our ten material collective bargaining agreements, four will
expire in 2010, three will expire in 2011, two will expire in 2012 and one will
expire in 2013. Additionally, approximately 9% of our workforce is employed in
Europe where trade union membership is common. We consider our labor relations
to be generally good. See Item 1A. “Risk Factors – If we are
unsuccessful in negotiating new collective bargaining agreements we may
experience significant increases in the cost of labor or a disruption in our
operations.”
PROPERTIES
We have
leases for packaging and other facilities, which are not material to our
business. The table below sets forth our principal
properties:
|
Land
and Related Surface Rights
|
Mineral
Reserves
|
||||||||||
|
Location
|
Use
|
Owned/
Leased
|
Expiration
of Lease
|
Owned/
Leased
|
Expiration
of
Lease
|
||||||
|
Cote
Blanche, Louisiana
|
Rock
salt production facility
|
Leased
|
2060
|
Leased
|
2060
|
||||||
|
Lyons,
Kansas
|
Evaporated
salt production facility
|
Owned
|
N/A |
Owned
|
N/A | ||||||
|
Ogden,
Utah
|
SOP,
solar salt and magnesium chloride production facility
|
Owned
|
N/A |
Leased
|
(1) | ||||||
|
Amherst,
Nova Scotia, Canada
|
Evaporated
salt production facility
|
Owned
|
N/A |
Leased
|
2023(2) | ||||||
|
Goderich,
Ontario, Canada
|
Rock
salt production facility
|
Owned
|
N/A |
Leased
|
2022(2) | ||||||
|
Goderich,
Ontario, Canada
|
Evaporated
salt production facility
|
Owned
|
N/A |
Owned
|
N/A | ||||||
|
Unity,
Saskatchewan, Canada
|
Evaporated
salt production facility
|
Owned
|
N/A |
Leased
|
2016/2030(3) | ||||||
|
Winsford,
Cheshire, U.K.
|
Rock
salt production facility; records management
|
Owned
|
N/A |
Owned
|
N/A | ||||||
|
London,
England
|
Records
management
|
Leased
|
2025 |
N/A
|
N/A | ||||||
|
Overland
Park, Kansas
|
Corporate
headquarters
|
Leased
|
2020 |
N/A
|
N/A | ||||||
|
(1)
|
The
Ogden lease renews on an annual
basis.
|
|
(2)
|
Subject
to our right of renewal through
2043.
|
|
(3)
|
Consists
of two leases expiring in 2016 and 2030 subject to our right of renewal
through 2037 and 2051,
respectively.
|
With
respect to each facility at which we extract salt, brine or SOP permits or
licenses are obtained as needed in the normal course of business based on our
mine plans and federal, state, provincial and local regulatory provisions
regarding mine permitting and licensing. Based on our historical permitting
experience, we expect to be able to continue to obtain necessary mining permits
to support historical rates of production.
Our
mineral leases have varying terms. Some will expire after a set term of years,
while others continue indefinitely. Many of these leases provide for a royalty
payment to the lessor based on a specific amount per ton of mineral extracted or
as a percentage of revenue. We believe we will be able to continue to extend our
material mineral lease agreements, as we have in the past, at commercially
reasonable terms, without incurring substantial costs or incurring material
modifications to the existing lease terms and conditions. In addition, we own a
number of properties and are party to non-mining leases that permit us to
perform activities that are ancillary to our mining operations, such as surface
use leases for storage at depots and warehouse leases. We also lease
two warehouses in London, England to facilitate our records management
business. Both of these leases expire in 2025. We believe
that all of our leases were entered into at market terms.
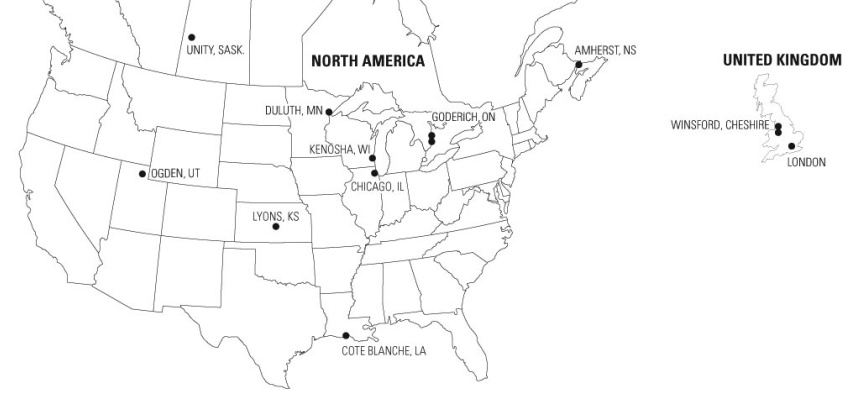
The
following map shows the locations of our principal mineral extraction, packaging
and document storage operating facilities:
ENVIRONMENTAL,
HEALTH AND SAFETY MATTERS
We
produce and distribute crop and animal nutrients, salt and deicing products.
These activities subject us to an evolving set of international, federal, state,
provincial and local environmental, health and safety (“EHS”) laws that
regulate, or propose to regulate: (i) product content; (ii) use of products by
both us and our customers; (iii) conduct of mining and production operations,
including safety procedures followed by employees; (iv) management and handling
of raw materials; (v) air and water quality impacts from our facilities; (vi)
disposal, storage and management of hazardous and solid wastes; (vii)
remediation of contamination at our facilities and third-party sites; and (viii)
post-mining land reclamation. For new regulatory programs, it is difficult for
us to ascertain future compliance obligations or estimate future costs until
implementation of the regulations has been finalized and definitive regulatory
interpretations have been adopted. We address regulatory requirements by making
necessary modifications to our facilities and/or operating
procedures.
We have
expended, and anticipate that we will continue to expend, substantial financial
and managerial resources to comply with EHS standards. We estimate that our 2010
EHS capital expenditures will total approximately $4.2 million. We expect that
our estimated expenditures in 2010 for reclamation activities will be
approximately $0.2 million. It is possible that greater than anticipated EHS
capital expenditures or reclamation expenditures will be required in 2010 or in
the future.
We
maintain accounting accruals for certain contingent environmental liabilities
and believe these accruals comply with generally accepted accounting principles.
We record accruals for environmental investigatory and non-capital remediation
costs when we believe it’s probable that we will be responsible, in whole or in
part, for environmental remediation activities and the expenditures for such
activities are reasonably estimable. Based on current information, it is the
opinion of management that our contingent liabilities arising from EHS matters,
taking into account established accruals, will not have a material adverse
effect on our business, financial condition or results of operations. As of
December 31, 2009, we had recorded environmental accruals of $1.8
million.
Product
Requirements and Impacts
International,
federal, state and provincial standards (i) require registration of many of our
products before such products can be sold; (ii) impose labeling requirements on
those products; and (iii) require producers to manufacture the products to
formulations set forth on the labels. Environmental, natural resource and public
health agencies at all regulatory levels continue to evaluate alleged health and
environmental impacts that might arise from the handling and use of products
such as those we manufacture. The U.S. Environmental Protection Agency, or the
“EPA,” the State of California and The Fertilizer Institute have each completed
independent assessments of potential risks posed by crop nutrient materials.
These assessments concluded that, based on the available data, crop nutrient
materials generally do not pose harm to human health. It is unclear whether any
further evaluations may result in additional standards or regulatory
requirements for the producing industries, including us, or for our customers.
It is the opinion of management that the potential impact of these standards on
the market for our products or on
the
expenditures that may be necessary to meet new requirements will not have a
material adverse effect on our business, financial condition or results of
operations.
In 2001,
the Canadian government released a Priority Substances List Assessment Report
for road salts. This report found that use of road salts may cause adverse
effects to the environment. Based on this report, the Minister of Environment
proposed regulating road salt under the Canadian Environmental Protection Act.
Canada’s federal cabinet did not take final action with respect to this
regulatory proposal. In lieu of any regulatory action, in 2004, Environment
Canada published a Code of Practice to serve as voluntary guidelines for users
of road salts. The Code of Practice requires large users of road salts across
Canada develop salt management plans. On a provincial level, in the 2006–2007
Annual Report, the Environmental Commissioner of Ontario recommended, along with
other items, the development of a comprehensive, mandatory, province-wide road
salts management strategy. We do not believe that these activities
have had or will have a material direct effect on us, but further development of
salt management plans and road salts management strategies could lead to changes
in the application or amount of road salts used in Canada, particularly in
Ontario.
Given the
importance of road salts for traffic safety and the current lack of any
practical substitute, we deem it unlikely that any guidelines or regulations
would result in a complete ban on the use of road salts. As noted in the 2001
report, the use of road salts and other deicing agents “is an important
component of strategies to keep roadways open and safe during the winter and
minimize traffic crashes, injuries and mortality under icy and snowy
conditions.” Since the dissemination of the 2001 report, we have endeavored to
work more closely with the Canadian government as well as provinces and
municipalities to better manage the storage and use of our road salts. We cannot
predict whether road salts would be subject to future regulation. Standardized
guidelines for the storage and use of road salts or any alternate deicing
products may cause us to encounter reduced sales and incur substantial costs and
expenses that could have a material adverse effect on our business, financial
condition and results of operations. In addition, although we are not aware of
any similar regulatory proposals governing road salts in either the United
States or the United Kingdom, we cannot guarantee that such proposals will not
arise.
Operating
Requirements and Impacts
We hold
numerous environmental and mining permits, water rights and other permits or
approvals authorizing operations at each of our facilities. Our operations are
subject to permits for extraction of salt and brine, discharges of process
materials to air and surface water, and injection of brine and wastewater to
subsurface wells. Some of our proposed activities may require waste storage
permits. A decision by a government agency to deny or delay issuing a new or
renewed permit or approval, or to revoke or substantially modify an existing
permit or approval, could have a material adverse effect on our ability to
continue operations at the affected facility. In addition, changes to
environmental and mining regulations or permit requirements could have a
material adverse effect on our ability to continue operations at the affected
facility. Expansion of our operations also is predicated upon securing the
necessary environmental or other permits or approvals. See Item 1A, “Risk
Factors - Environmental laws and regulation may subject us to significant
liability and require us to incur additional costs in the
future. Additionally, our business is subject to numerous laws and
regulations with which we must comply in order to operate our business and
obtain contracts with third parties and governmental entities.”
We have
also developed alternative mine uses. For example, we sold an excavated portion
of our salt mine in the United Kingdom to a subsidiary of Veolia Environnement
(“Veolia”), a business with operations in the waste management
industry. That business is permitted by the jurisdictional
environmental agency to dispose of certain stable types of hazardous waste in
the area of the salt mine owned by them. We believe that the mine is stable and
provides a secure disposal location separate from our mining and records
management operations. However, we recognize that any temporary or permanent
storage of hazardous waste may involve risks to the environment. Although we
believe that we have taken these risks into account during our planning process,
and Veolia is required by U.K. statute to maintain adequate security for any
potential closure obligation, it is possible that material expenditures could be
required in the future to further reduce this risk or to remediate any future
contamination.
Remedial
Activities
Remediation at Our Facilities -
Many of our formerly owned and current facilities have been in operation
for a number of years. Operations have historically involved the use and
handling of regulated chemical substances, salt and by-products or process
tailings by us and predecessor operators, which have resulted in soil, surface
water and groundwater contamination.
At many
of these facilities, spills or other releases of regulated substances have
occurred previously and potentially could occur in the future, possibly
requiring us to undertake or fund cleanup efforts under the U.S. Comprehensive
Environmental Response, Compensation, and Liability Act, or “CERCLA,” or state
and provincial or United Kingdom laws governing cleanup or disposal of hazardous
substances. In some instances, we have agreed, pursuant to consent orders or
agreements with the appropriate governmental agencies, to undertake
investigations, which currently are in progress, to determine whether remedial
action may be required to address such contamination. At other locations, we
have entered into consent orders or agreements with appropriate governmental
agencies to perform required remedial activities that will address identified
site conditions. At still other locations, we have undertaken voluntary
remediation, and have removed formerly used underground storage tanks.
Expenditures for these known conditions currently are not expected, individually
or in the aggregate, to be material. However, material expenditures could be
required in the future to remediate the contamination at these or at other
current or former sites. In addition, in connection with the recapitalization
through which Compass became a stand-alone entity, The Mosaic Company, a former
owner of the Company, agreed to indemnify us against liabilities for certain
known and unknown conditions at existing and former sites.
The
Wisconsin Department of Agriculture, Trade and Consumer Protection (“DATCP”) has
information indicating that
agricultural
chemicals are present in the ground water in the vicinity of the Kenosha,
Wisconsin plant. DATCP directed us to conduct an investigation into the possible
presence of agricultural chemicals in soil and ground water at the Kenosha
plant. We have conducted ongoing investigations of the soils and ground water at
the Kenosha site and continue to provide the findings to DATCP. DATCP, in
conjunction with the Wisconsin Department of Natural Resources, will determine
whether any further investigation or remediation is necessary, or whether no
further action is required. All investigations to date, and any
potential future remediation work, are being conducted under the Wisconsin
Agricultural Chemical Cleanup Program, which would provide for reimbursement of
some of the costs. None of the identified contaminants have been used in
association with Compass Minerals site operations. We would also expect to seek
participation by, or cost reimbursement from, other parties responsible for the
presence of any agricultural chemicals found in soils at this site if we do not
receive a liability exemption and are required to conduct further investigation
or remedial actions.
Remediation at Third-Party
Facilities - Along with impacting the sites at which we have operated,
various third parties have alleged that our past operations have resulted in
contamination to neighboring off-site areas or third-party facilities including
third-party disposal facilities for regulated substances generated by our
operating activities. CERCLA imposes liability, without regard to fault or to
the legality of a party’s conduct, on certain categories of persons who are
considered to have contributed to the release of “hazardous substances” into the
environment. Under CERCLA, or its various state analogues, one party may
potentially be required to bear more than its proportional share of cleanup
costs at a site where it has liability if payments cannot be obtained from other
responsible parties.
We have
entered into “de minimis”
settlement agreements with the EPA with respect to several CERCLA sites,
pursuant to which we have made one-time cash payments and received statutory
protection from future claims arising from those sites. In some cases, however,
such settlements have included “reopeners,” which could result in additional
liability at such sites in the event of newly discovered contamination or other
circumstances.
At other
sites for which we have received notice of potential CERCLA liability, we have
provided information to the EPA that we believe demonstrates that we are not
liable, and the EPA has not asserted claims against us with respect to such
sites. In some instances, we have agreed, pursuant to orders from or agreements
with appropriate governmental agencies or agreements with private parties, to
undertake or fund investigations, some of which currently are in progress, to
determine whether remedial action, under CERCLA or otherwise, may be required to
address contamination. At other locations, we have entered into consent orders
or agreements with appropriate governmental agencies to perform required
remedial activities that will address identified site conditions.
At
present, we are not aware of any additional sites for which we expect to receive
a notice from the EPA or any other party of potential CERCLA liability that
would have a material affect on our financial condition, results of operations
or cash flows. However, based on past operations, there is a
potential that we may receive notices in the future for sites of which we are
currently unaware or that our liability at currently known sites may
increase. Expenditures for our known environmental liabilities and
site conditions currently are not expected, individually or in the aggregate, to
be material or have a material adverse effect on our business, financial
condition, results of operations, or cash flows.
|
ITEM
1A.
|
RISK FACTORS
|
You
should carefully consider the following risks and all of the information set
forth in this annual report on Form 10-K. The risks described below are not the
only ones facing our company. Additional risks and uncertainties not currently
known to us or that we currently deem to be immaterial may also materially and
adversely affect our business, financial condition or results of
operations.
Risks
Related to Our Business
Mining,
manufacturing and distribution operations are subject to a variety of risks and
hazards, which may not be covered by insurance.
The
process of mining, manufacturing and distribution involves risks and hazards,
including environmental hazards, industrial accidents, labor disputes, unusual
or unexpected geological conditions or acts of nature. Our rock salt
mines are located near bodies of water and industrial
operations. These risks and hazards could lead to uncontrolled water
intrusion or flooding or other events or circumstances, which could result in
the complete loss of a mine or could otherwise result in damage or impairment
to, or destruction of, mineral properties and production facilities,
environmental damage, delays in mining and business interruption, and could
result in personal injury or death. Our products are converted into
finished goods inventories of salt and specialty fertilizer products and are
stored in various locations throughout North America. These
inventories may become impaired either through accidents or
obsolescence.
Our salt
mines located in Cote Blanche, Louisiana and Goderich, Ontario, Canada
constitute approximately 75% of our total salt production
capacity. These underground salt mines supply substantially all of
the salt product necessary to support almost all of our North American highway
deicing product line and significant portions of our consumer and industrial
salt products. Although sales of our deicing products and
profitability of the salt segment can vary from year to year due to weather
variations in our markets, over the last three years, sales of highway deicing
products have averaged approximately 40% of our consolidated
sales. An extended production interruption or catastrophic event at
either of these facilities could result in an inability to have product
available for sale or to fulfill our highway deicing sales contracts and could
have a material adverse effect on our financial condition, results of operations
and cash flows.
Although
we evaluate our risks and carry insurance policies to mitigate the risk of loss
where economically feasible, not all of these risks are reasonably insurable and
our insurance coverage may contain limits, deductibles, exclusions and
endorsements. We cannot assure you that our coverage will be
sufficient to meet our needs in the event of loss. Such a loss may
have a material adverse effect on the Company.
Our
operations are dependent on our rights and ability to mine our property and
having received the required permits and approvals from third parties and
governmental authorities.
We hold
numerous governmental, environmental, mining and other permits, water rights and
approvals authorizing operations at each of our facilities. A decision by a
third-party or a governmental agency to deny or delay issuing a new or renewed
permit or approval, or to revoke or substantially modify an existing permit or
approval, could have a material adverse effect on our ability to continue
operations at the affected facility.
Expansion
of our existing operations is also predicated upon securing the necessary
environmental or other permits, water rights or approvals, which we may not
receive in a timely manner or at all. Furthermore, many of our
facilities are located on land leased from governmental
authorities. Expansion of these operations may require securing
additional leases, which we may not obtain in a timely manner, or at
all. Our leases generally require us to continue mining in order to
retain the lease, the loss of which could adversely affect our ability to mine
the associated reserves. In addition, our facilities are located near
existing and proposed third-party industrial operations that could affect our
ability to fully extract or the manner in which we extract the mineral deposits
to which we have rights to mine.
We are
currently working to expand our solar evaporation ponds at the Great Salt Lake,
which requires both leases and permits by governmental
authorities. The permitting process is both lengthy and
complicated. We have obtained the leases for 40,000 acres and are
seeking to acquire leases for an additional 35,000 acres. We are
currently involved in an environmental study and other activities, which are
required to obtain the necessary leases and permits. Certain organizations have
challenged the process for granting leases for this expansion
project. If we are unable to obtain all or a portion of the required
leases and permits, the previously capitalized costs associated with the project
would be evaluated for impairment. As of December 31, 2009, capital
expenditures related to this project were $3.5 million.
With
respect to our solar evaporation ponds at the Great Salt Lake, in January 2010
we applied for modification to our existing State of Utah water discharge permit
to include additional operating activities at that location. These
activities have been conducted for over a decade, and some activities much
longer, and the State of Utah has been aware of the activities since they began.
We have been in discussions with the State of Utah regarding these activities
and have entered into a consent decree with the state. Under this
consent decree, we have agreed to suspend certain activities until the
permitting process is complete and the State of Utah has agreed to expedite that
process. If the permit modification is significantly delayed or
denied, it would require us to maintain and operate some of our solar
evaporation ponds in a more costly manner which could have a material adverse
effect on our cash flows and results of operations in the future. An
environmental group has issued a notice of its intent to file a lawsuit under
the Clean Water Act for alleged unpermitted discharges and if filed, such a
lawsuit could seek fines and injunctive relief. Similar
remedies could be sought through an administrative challenge to an issued
permit. The Company believes it is entitled to the modified
permits.
In
addition, we are aware of an aboriginal land claim filed by The Chippewas of
Nawash and the Chippewas of Saugeen (the “Chippewas”) in the Ontario Superior
Court against The Attorney General of Canada and Her Majesty The Queen In Right
of Ontario. The Chippewas claim that a large part of the land under Lake Huron
was never conveyed by treaty and therefore belongs to the Chippewas. The land
claimed includes land under which our Goderich mine operates and has mining
rights granted to it by the government of Ontario. We are not a party to this
court action.
Similar
claims are pending with respect to other parts of the Great Lakes by other
aboriginal claimants. We have been informed by the Ministry of the Attorney
General of Ontario that “Canada takes the position that the common law does not
recognize aboriginal title to the Great Lakes and its connecting waterways.” We
do not believe that this action will result in a material adverse financial
effect on the Company.
In some
instances, we have received access rights or easements from third parties, which
allow for a more efficient operation than would exist without the access or
easement. We do not believe any action will be taken to suspend these
accesses or easements. However, no assurance can be made that a
third-party will not take any action to suspend the access or easement nor that
any such action would not be materially adverse to our results of operation or
financial condition.
Mining
is a capital-intensive business, and the inability to fund necessary capital
expenditures in order to develop or expand our operations could have an adverse
effect on our growth and profitability.
We intend
to make significant capital expenditures over the next several years to expand
our rock salt production capacity at our Goderich mine and our SOP production at
our Great Salt Lake facility. Capital expenditures required for these
projects may increase due to factors beyond our control. Although we
currently finance most of our capital expenditures through cash provided by
operations, we may depend on the availability of credit to fund future capital
expenditures. We could have difficulty finding or obtaining the
financing required to fund our capital expenditures, which could limit our
expansion ability or increase our debt service requirements, which could have a
material adverse effect on our cash flows and profitability.
In
addition, our credit agreement contains covenants including restrictions of the
amount of capital expenditures in any one year. We may pursue other
financing arrangements, including leasing transactions as a method of financing
our capital needs.
If we are
unable to obtain suitable lease financing, our expansion plans may not be able
to be completed. A failure to complete our expansion plans could
negatively impact our growth and profitability.
The
seasonal demand for our products and the variations in our operations from
quarter to quarter due to weather conditions may have an adverse effect on our
results of operations and the price of our common stock.
Our
deicing product line is seasonal, with operating results varying from quarter to
quarter as a result of weather conditions and other factors. On average, over
the last three years, approximately 70% of our deicing product sales (or 37% of
consolidated sales) occurred during the months of November through March when
winter weather was most severe. Winter weather events are not predictable
outside of a relatively short time-frame, yet we must stand ready to deliver
deicing products under our highway deicing contracts. As a result, we
need to stockpile sufficient highway deicing salt in the last three fiscal
quarters to meet estimated demand for the winter season.
In
addition, winter weather events can be influenced by climate change, weather
cycles and other natural events. Any prolonged change in weather patterns in our
relevant geographic markets could impact demand for our deicing
products. Weather conditions that impact our highway deicing product
line include temperature, levels of wintry precipitation, number of snowfall
events and the potential for, and duration and timing of snowfall or icy
conditions in our relevant geographic markets. Lower than expected sales during
the winter season could have a material adverse effect on our results of
operations and the price of our common stock.
Our SOP
operating results are dependent in part upon conditions in the agriculture
markets. The agricultural products business can be affected by a number of
factors, the most important of which, for U.S. markets, are weather patterns,
field conditions (particularly during periods of traditionally high crop
nutrients application) and quantities of crop nutrients imported to and exported
from North America. Additionally, our ability
to produce SOP at our solar evaporation ponds is dependent upon sufficient lake
water levels and arid summer weather conditions. Extended periods of
precipitation or a prolonged lack of sunshine would hinder the evaporation rate
and hence our production levels, which may result in lower sales volumes and
higher unit production costs. Additionally, our ability to harvest minerals
through our evaporation ponds could be negatively impacted by any prolonged
change in weather patterns leading to changes in mountain snowfall that could
result in changes in fresh water run-off and significant impacts on lake levels,
or by increased rainfall during the summer months at our solar evaporation ponds
at the Great Salt Lake.
Customer
expectations about future potash market prices, availability and agricultural
economics as well as customer application rates can have a significant effect on
the demand for our specialty fertilizer product, which can affect our sales
volumes and prices.
When
customers anticipate increased SOP selling prices or improving agricultural
economics, they tend to accumulate inventories prior to the anticipated price
increases, which may result in a delay in the realization of price increases for
our products. In addition, customers may delay their purchases when
they anticipate future SOP selling prices may remain constant or decline, or
when they anticipate declining agricultural economics, which may adversely
affect our sales volumes and selling prices. Customer expectations
about availability of SOP can have similar effects on sales volumes and
prices.
Growers
are continually seeking to maximize their economic return, which may impact the
application rates for potash products. Growers’ decisions regarding
the application rate for potash, including whether to forgo application
altogether, may vary based upon many factors, including, crop and potash prices
and nutrient levels in the soil. Growers are more likely to increase
application rates when crop prices are relatively high or when potash prices and
soil nutrient levels are relatively low. Growers are more likely to reduce
application rates or forgo application of potash when crop prices are relatively
low and when potash prices and soil nutrient levels are relatively
high. This variability can materially impact our sales prices and
volumes.
Our
production process consumes large amounts of natural gas, steam and
electricity. Additionally, KCl is a raw material feedstock sometimes
used to supplement our SOP solar harvest, produce some of our deicing products
and sell for water conditioning applications. A significant
interruption in the supply or an increase in the price of any of these products
or services could have a material adverse effect on our financial condition or
results of operations.
Energy
costs, primarily natural gas and electricity, represented approximately 10% of
our total production costs in 2009. Natural gas is a primary fuel source used in
the evaporated salt production process. Our profitability is impacted by the
price and availability of natural gas we purchase from third parties. We have a
policy of hedging natural gas prices through the use of futures forward swap
contracts. We have not entered into any long-term contracts for the purchase of
natural gas. Our contractual arrangements for the supply of natural gas do not
specify quantities and are automatically renewed annually unless either party
elects not to do so. We do not have arrangements in place with back-up
suppliers. In addition, potential climate change regulations could result in
higher production costs for energy, which may be passed on to us, in whole or in
part. A significant increase in the price of energy that is not
recovered through an increase in the price of our products or covered through
our hedging arrangements, or an extended interruption in the supply of natural
gas, steam or electricity to our production facilities, could have a material
adverse effect on our business, financial condition, results of operations and
cash flows.
We can
use KCl as a raw material feedstock in our SOP production process to supplement
our solar harvest. We also use KCl as an additive to some of our consumer
deicing products and to sell for water conditioning applications. We
have purchased substantially all of our KCl under contracts where the pricing is
typically determined by reference to a formula and has been favorable to market
in recent years. Large positive or negative fluctuations can occur to
the price we pay for product without a corresponding change in sales price for
our customers. This could change the profitability of these products,
which
could
materially affect our results of operations and cash
flows. Consequently this could reduce the amount of blended deicing
and water conditioning products available, which could adversely affect our
results of operations and cash flows.
Increasing
costs or a lack of availability of transportation services could have an adverse
effect on our ability to deliver products at competitive prices.
Transportation
and handling costs tend to be a significant component of the total delivered
cost of sales for our products, particularly salt due to its relatively low
market cost. The high relative cost of transportation tends to favor
manufacturers located close to the customer. We contract bulk shipping vessels,
barges, trucking and rail services to move salt from our production facilities
to the distribution outlets and customers. In many instances, we have committed
to deliver salt, under penalty of non-performance, up to nine months or more
prior to having produced the salt for delivery to our customers. A
reduction in the dependability or availability of transportation services or a
significant increase in transportation service rates could impair our ability to
deliver salt and specialty fertilizer economically to our markets and impair our
ability to expand our markets.
Competition
in our markets could limit our ability to attract and retain customers, force us
to continuously make capital investments, alter supply levels and put pressure
on the prices we can charge for our products. Additionally, with regard to our
specialty fertilizer product, economic conditions in the agriculture markets,
and supply and demand imbalances for competing potash products can also impact
the price of or demand for our products.
We
encounter competition in all areas of our business. Competition in our product
lines is based on a number of considerations, including product performance,
transportation costs in salt distribution, brand reputation, price, quality of
customer service and support. Customers for our products are attempting to
reduce the number of vendors from which they purchase in order to increase their
efficiency. Our customers increasingly demand a broad product range
and we must continue to develop our expertise in order to manufacture and market
these products successfully. To remain competitive, we will need to invest
continuously in manufacturing, marketing, customer service and support and our
distribution networks. We may have to adjust the prices of some of our products
to stay competitive. We may not have sufficient resources to continue to make
such investments or maintain our competitive position. Additionally, a
significant portion of our specialty fertilizer business is dependent upon
international sales, which accounted for approximately 23% of SOP sales volumes
in 2009. As such, we face intense global competition from both SOP
and other potash producers and new competitors may enter the markets in which we
sell into at any time. Changes in potash competitors’ production or
marketing focus, could have a material impact on our business. Some
of our competitors may have greater financial and other resources than we
do.
KCl is
the least expensive form of potash fertilizer based on the concentration of
K2O
and consequently, it is the most widely used potassium source for most
crops. SOP is utilized by growers for many high-value crops,
especially crops for which low-chloride content fertilizers improve quality and
yield. Economic conditions for agricultural products can affect the
type and amount of crops grown as well as the type of fertilizer product
used. Potash is a commodity and consequently, its market is highly
competitive and affected by global supply and demand. An over-supply
of either type of potash product in the domestic or world-wide markets could
unfavorably impact the sales prices we can charge for our specialty potash
fertilizer, as a large price disparity between the potash products could cause
growers to choose a less-expensive alternative.
Our
business is dependent upon highly skilled personnel, and the loss of key
personnel may have a material adverse effect on our results of
operations.
The
success of our business is dependent on our ability to attract and retain highly
skilled managers and other personnel. We cannot assure you that we will be able
to attract and retain the personnel necessary for the efficient operation of our
business. The loss of the services of key personnel or the failure to attract
additional personnel as required could have a material adverse effect on our
results of operations and could lead to higher labor costs or the use of
less-qualified personnel. We do not currently maintain “key person” life
insurance on any of our key employees.
If
we are unsuccessful in negotiating new collective bargaining agreements, we may
experience significant increases in the cost of labor or a disruption in our
operations.
Labor
costs, including benefits, represent approximately 31% of our total production
costs in 2009. As of December 31, 2009, we had 1,792 employees, of
which 892 are employed in the United States, 738 in Canada and 162 in the United
Kingdom. Approximately 30% of our U.S. workforce and 50% of our global workforce
is represented by labor unions. Of our ten material collective bargaining
agreements, four will expire in 2010, three will expire in 2011, two will expire
in 2012 and one will expire in 2013. Additionally, approximately 9% of our
workforce is employed in Europe where trade union membership is common. Although
we believe that our relations with our employees are generally good, as a result
of general economic, financial, competitive, legislative, political and other
factors beyond our control, we cannot assure you that we will be successful in
negotiating new collective bargaining agreements, that such negotiations will
not result in significant increases in the cost of labor or that a breakdown in
such negotiations will not result in the disruption of our
operations.
Environmental
laws and regulation may subject us to significant liability and require us to
incur additional costs in the future. Additionally, our business is
subject to numerous laws and regulations with which we must comply in order to
operate our business and obtain contracts with governmental
entities.
We are
subject to numerous business, environmental, health and safety laws and
regulations in the United States, Canada and Europe, including laws and
regulations relating to land reclamation and remediation of hazardous substance
releases, and discharges to soil, air and water with which we must comply to
effectively operate our business. Environmental laws and
regulations
with which we currently comply may become more stringent and require material
expenditures for continued compliance. Environmental remediation laws
such as CERCLA, impose liability, without regard to fault or to the legality of
a party’s conduct, on certain categories of persons (known as “potentially
responsible parties” (“PRPs”)) who are considered to have contributed to the
release of “hazardous substances” into the environment. Although we are not
currently incurring material liabilities pursuant to CERCLA, in the future we
may incur material liabilities under CERCLA and other environmental cleanup
laws, with regard to our current or former facilities, adjacent or nearby
third-party facilities, or off-site disposal locations. Under CERCLA, or its
various state analogues, one party may, under some circumstances, be required to
bear more than its proportional share of cleanup costs at a site where it has
liability if payments cannot be obtained from other responsible parties.
Liability under these laws involves inherent uncertainties. Violations of
environmental, health and safety laws are subject to civil, and in some cases,
criminal sanctions.
We have
received notices from governmental agencies that we may be a PRP at certain
sites under CERCLA or other environmental cleanup laws. In some cases, we have
entered into “de minimis” settlement agreements with the United States with
respect to certain CERCLA sites, pursuant to which we have made one-time cash
payments and received statutory protection from future claims arising from those
sites. At other sites for which we have received notice of potential CERCLA
liability, we have provided information to the EPA that we believe demonstrates
that we are not liable and the EPA has not asserted claims against us with
respect to such sites. In some instances, we have agreed, pursuant to consent
orders or agreements with the appropriate governmental agencies, to undertake
investigations, which currently are in progress, to determine whether remedial
action may be required to address such contamination. At other locations, we
have entered into consent orders or agreements with appropriate governmental
agencies to perform remedial activities that will address identified site
conditions.
At
present, we are not aware of any additional sites for which we expect to receive
a notice from the EPA of potential CERCLA liability that would have a material
effect on our financial condition or results of operations. However, based on
past operations, there is a potential that we may receive such notices in the
future for sites of which we are currently unaware. We currently do not expect
our known environmental liabilities and site conditions, individually or in the
aggregate, to have a material adverse impact on our financial position. However,
material expenditures could be required in the future to remediate the
contamination at these or at other current or former sites.
We have
also developed alternative mine uses. For example, we sold an excavated portion
of our salt mine in the United Kingdom to a subsidiary of Veolia, a business
with operations in the waste management industry. That business
is permitted by the jurisdictional environmental agency to dispose of certain
stable types of hazardous waste in the area of the salt mine owned by them. We
believe that the mine is stable and provides a secure disposal location separate
from our mining and records management operations. However, we recognize that
any temporary or permanent storage of hazardous waste may involve risks to the
environment. Although we believe that we have taken these risks into account
during our planning process, and Veolia is required by U.K. statute to maintain
adequate security for any potential closure obligation, it is possible that
material expenditures could be required in the future to further reduce this
risk or to remediate any future contamination.
Continued
government and public emphasis on environmental issues, including climate
change, can be expected to result in increased future investments for
environmental controls at ongoing operations, which would be charged against
income from future operations. The U.S. is currently considering legislation
that would regulate greenhouse gas emissions and some form of federal climate
change legislation is possible in the future and Canada has already committed to
reducing greenhouse gas emissions. Present and future environmental
laws and regulations applicable to our operations may require substantial
capital expenditures and may have a material adverse effect on our business,
financial condition and results of operations. For more information, see Item 1,
“Business — Environmental, Health and Safety Matters.”
Our
highway deicing customers principally consist of municipalities, counties,
states, provinces and other governmental entities in North America and the
U.K. This product line represented approximately 47% of our annual
sales in 2009. We are required to comply with numerous laws and
regulations administered by federal, state, local and foreign governments
relating to, but not limited to, the production, transporting and storing of our
products as well as the commercial activities conducted by our employees and our
agents. Failure to comply with applicable laws and regulations could
preclude us from conducting business with governmental agencies and lead to
penalties, injunctions, civil remedies or fines.
The Canadian government’s past
proposal to regulate the use of road salt could have a material adverse effect
on our business, including reduced sales and the incurrence of substantial costs
and expenditures.
In 2001,
the Canadian government released a Priority Substances List Assessment Report
for road salts. This report found that use of road salts may cause adverse
effects to the environment. Based on this report, the Minister of Environment
proposed regulating road salt under the Canadian Environmental Protection Act.
Canada’s federal cabinet did not take final action with respect to this
regulatory proposal. In lieu of any regulatory action, in 2004, Environment
Canada published a Code of Practice to serve as voluntary guidelines for users
of road salts. The Code of Practice requires large users of road salts across
Canada develop salt management plans. On a provincial level, in the 2006–2007
Annual Report, the Environmental Commissioner of Ontario recommended, along with
other items, the development of a comprehensive, mandatory, province-wide road
salts management strategy. We do not believe that these activities
have had or will have a material direct effect on us, but further development of
salt management plans and road salts management strategies could lead to changes
in the application or amount of road salts used in Canada, particularly in
Ontario.
As noted
in the 2001 report, the use of road salts and other deicing agents “is an
important component of strategies to keep roadways open and safe during the
winter and minimize traffic crashes, injuries and mortality under icy and snowy
conditions.” Since the dissemination of the 2001 report, we have endeavored to
work more closely with the Canadian government as well as
provinces
and municipalities to better manage the storage and use of our road salts. We
cannot predict whether road salts would be subject to future regulation.
Standardized guidelines for the storage and use of road salts or any alternate
deicing products may cause us to encounter reduced sales and incur substantial
costs and expenses that could have a material adverse effect on our business,
financial condition and results of operations. In addition, although we are not
aware of any similar regulatory proposals governing road salts in either the
United States or the United Kingdom, we cannot guarantee that such proposals
will not arise.
Protection
of proprietary technology — Our intellectual property may be misappropriated or
subject to claims of infringement.
We
protect our intellectual property rights primarily through a combination of
patent, trademark, and trade secret protection. We have obtained patents on some
of our products and processes, and from time to time we file new patent
applications. Our patents, which vary in duration, may not preclude
others from selling competitive products or using similar production
processes. We cannot assure you that pending applications for
protection of our intellectual property rights will be approved. Many
of our important brand names are registered as trademarks in the United States
and foreign countries. These registrations can be renewed if the
trademark remains in use. These trademark registrations may not
prevent our competitors from using similar brand names. We also rely
on trade secret protection to guard confidential unpatented technology and when
appropriate, we require that employees and third-party consultants or advisors
enter into confidentiality agreements. These agreements may not provide
meaningful protection for our trade secrets, know-how or other proprietary
information in the event of any unauthorized use, misappropriation or
disclosure. It is possible that our competitors could independently
develop the same or similar technology or otherwise obtain access to our
unpatented technology. If we are unable to maintain the proprietary
nature of our technologies, we may lose the competitive advantage provided by
our intellectual property. As a result, our results of operations may be
adversely affected. Additionally, third parties may claim that our
products infringe their patents or other proprietary rights and seek
corresponding damages or injunctive relief.
Economic
and other risks associated with international sales and operations could
adversely affect our business, including economic loss and a negative impact on
earnings.
Since we
manufacture and sell our products primarily in the United States, Canada and the
United Kingdom, our business is subject to risks associated with doing business
internationally. Our sales outside the United States, as a percentage of our
total sales, were 28% for the year ended December 31, 2009. Accordingly, our
future results could be adversely affected by a variety of factors,
including:
|
·
|
changes
in foreign currency exchange rates;
|
|
·
|
exchange
controls;
|
|
·
|
tariffs,
other trade protection measures and import or export licensing
requirements;
|
|
·
|
potentially
negative consequences from changes in tax
laws;
|
|
·
|
differing
labor regulations;
|
|
·
|
requirements
relating to withholding taxes on remittances and other payments by
subsidiaries;
|
|
·
|
restrictions
on our ability to own or operate subsidiaries, make investments or acquire
new businesses in these
jurisdictions;
|
|
·
|
restrictions
on our ability to repatriate dividends from our subsidiaries;
and
|
|
·
|
changes
in regulatory requirements.
|
Fluctuations
in the value of the U.S. dollar relative to the Canadian dollar or British pound
sterling may adversely affect our results of operations. Because our
consolidated financial results are reported in U.S. dollars, if we generate
sales or earnings in other currencies, the translation of those results into
U.S. dollars can result in a significant increase or decrease in the amount of
those sales or earnings. In addition, our debt service requirements are
primarily in U.S. dollars even though a significant percentage of our cash flow
is generated in Canadian dollars and pounds sterling. Significant changes in the
value of Canadian dollars and pounds sterling relative to the U.S. dollar could
have a material adverse effect on our financial condition and our ability to
meet interest and principal payments on U.S. dollar-denominated
debt.
In
addition to currency translation risks, we incur currency transaction risk
whenever we or one of our subsidiaries enter into either a purchase or a sales
transaction using a currency other than the local currency of the transacting
entity. Given the volatility of exchange rates, we cannot assure you that we
will be able to effectively manage our currency transaction and/or translation
risks. It is possible that volatility in currency exchange rates could have a
material adverse effect on our financial condition or results of operations. We
have experienced and expect to experience economic loss and a negative impact on
earnings from time to time as a result of foreign currency exchange rate
fluctuations. See “Management’s Discussion and Analysis of Financial Condition
and Results of Operations — Effects of Currency Fluctuations and Inflation and
Management’s Discussion and Analysis of Financial Condition and Results of
Operations — Market Risk.”
Our
overall success as a global business depends, in part, upon our ability to
succeed in differing economic and political conditions. We cannot assure you
that we will continue to succeed in developing and implementing policies and
strategies that are effective in each location where we do
business.
If
we cannot successfully complete acquisitions or integrate acquired businesses,
our growth may be limited and our financial condition adversely
affected.
Our
business strategy includes supplementing internal growth by pursuing
acquisitions of complementary businesses. We may be unable to complete
acquisitions on acceptable terms, identify suitable businesses to acquire or
successfully integrate acquired businesses in the future. We compete with other
potential buyers for the acquisition of other complementary businesses. These
competition and regulatory considerations may result in fewer acquisition
opportunities. If we cannot complete acquisitions, our growth may be limited and
our financial condition may be adversely affected.
Our
indebtedness could adversely affect our financial condition and impair our
ability to operate our business. Furthermore, CMI is a holding
company with no operations of its own and is dependent on our subsidiaries for
cash flows.
As of
December 31, 2009, Compass Minerals had $490.7 million of outstanding
indebtedness, including $97.6 million of senior notes (“8% Senior Notes”) and
approximately $393.1 million of borrowings under the two senior secured term
loan facilities. Our indebtedness could have important consequences,
including the following:
|
·
|
it
may limit our ability to borrow money or sell stock to fund our working
capital, capital expenditures and debt service
requirements;
|
|
·
|
it
may limit our flexibility in planning for, or reacting to, changes in our
business;
|
|
·
|
we
may be more highly leveraged than some of our competitors, which may place
us at a competitive disadvantage;
|
|
·
|
it
may make us more vulnerable to a downturn in our business or the
economy;
|
|
·
|
it
may require us to dedicate a substantial portion of our cash flow from
operations to the repayment of our indebtedness, thereby reducing the
availability of our cash flow for other purposes;
and
|
|
·
|
it
may materially and adversely affect our business and financial condition
if we are unable to service our indebtedness or obtain additional
financing, as needed.
|
Although
our operations are conducted through our subsidiaries, none of our subsidiaries
is obligated to make funds available to CMI for payment on our Senior Notes or
to pay dividends on our capital stock. Accordingly, CMI’s ability to make
payments on our Senior Notes and distribute dividends to our stockholders is
dependent on the earnings and the distribution of funds to CMI from our
subsidiaries, and our compliance with the terms of our senior secured credit
facilities, including the total leverage ratio and interest coverage ratio.
Furthermore, we must also comply with the terms of our indenture, which limits
the amount of dividends we can pay to our stockholders. We cannot
assure you that we will remain in compliance with these ratios nor can we assure
you that the agreements governing the current and future indebtedness of our
subsidiaries will permit our subsidiaries to provide CMI with sufficient
dividends, distributions or loans to fund scheduled interest and principal
payments on the Senior Notes, when due. If we consummate an acquisition, our
debt service requirements could increase. Furthermore, we may need to refinance
all or a portion of our indebtedness on or before maturity, however we cannot
assure you that we will be able to refinance any of our indebtedness on
commercially reasonable terms or at all.
An
increase in interest rates would have an adverse affect on our interest expense
under our senior secured credit facilities. Additionally, the
restrictive covenants in the agreements governing our indebtedness may limit our
ability to pursue our business strategies or may require accelerated payments on
our debt.
We pay
variable interest on our senior secured credit facilities based on LIBOR or the
alternate base rate. As of December 31, 2009, $150 million of our
variable rate borrowings totaling $393.1 million has been hedged through
interest rate swap agreements. In both March and December 2010, $50
million of our interest rate swap agreements will expire and the related debt
will no longer be hedged. Consequently, significant increases in
interest rates will adversely affect our cost of debt for the portion that has
not been hedged.
Our
senior secured credit facilities and indebtedness limit our ability and the
ability of our subsidiaries, among other things, to:
|
·
|
incur
additional indebtedness or contingent
obligations;
|
|
·
|
pay
dividends or make distributions to our
stockholders;
|
|
·
|
repurchase
or redeem our stock;
|
|
·
|
make
investments;
|
|
·
|
grant
liens;
|
|
·
|
make
capital expenditures;
|
|
·
|
enter
into transactions with our stockholders and
affiliates;
|
|
·
|
sell
assets; and
|
|
·
|
acquire
the assets of, or merge or consolidate with, other
companies.
|
In
addition, our senior secured credit facilities require us to maintain financial
ratios. These financial ratios include an interest coverage ratio and a total
leverage ratio. Although we have historically been able to maintain these
financial ratios, we may not
be able
to maintain these ratios in the future. Covenants in our senior secured credit
facilities may also impair our ability to finance future operations or capital
needs or to enter into acquisitions or joint ventures or engage in other
favorable business activities.
If we
default under our senior secured credit facilities, the lenders could require
immediate payment of the entire principal amount. These circumstances include
nonpayment of principal, interest, fees or other amounts when due, a change of
control, default under agreements governing our other indebtedness, material
judgments in excess of $15,000,000, failure to provide timely audited financial
statements or inaccuracy of representations and warranties. Any default under
our senior secured credit facilities or agreements governing our other
indebtedness could lead to an acceleration of principal payments under our other
debt instruments that contain cross-acceleration or cross-default provisions. If
the lenders under our senior secured credit facilities would require immediate
repayment, we would not be able to repay them and also repay our other
indebtedness in full. Our ability to comply with these covenants and
restrictions contained in our senior secured credit facilities and other
agreements governing our other indebtedness may be affected by changes in the
economic or business conditions or other events beyond our control.
Economic
conditions and credit and capital markets could impair our ability to operate
our business and implement our strategies.
The
Company, our customers and suppliers depend on the availability of credit to
operate. The economic downturn has resulted in a tightening in the
credit markets and has reduced the availability of credit to borrowers
worldwide. A prolonged economic downturn could adversely affect the
cash flows of our customers (including state, provincial and other local
governmental entities) and the availability of credit for all parties, including
the Company. Our customers may not be able to purchase our products
or there may be delays in payment or nonpayment for delivered products, which
would negatively impact our revenues, cash flows and profitability.
Our banks
may become insolvent, which would jeopardize cash deposits in excess of the
federally insured amounts as well as limit our access to credit. In
addition, we are subject to the risk that the counterparties to our interest
rate swap and natural gas swap agreements may not be able to fulfill their
obligations, which could impact our consolidated financial statements
adversely.
Our
tax liabilities are based on existing tax laws in our relevant tax jurisdictions
and include estimates. Changes in tax laws or estimates could
adversely impact our future profitability and cash flows.
We file
U.S., Canadian and U.K. tax returns at the federal and local taxing
jurisdictional levels. Developing our provision for income taxes and
analyzing our potential tax exposure items requires significant judgment and
assumptions as well as a thorough knowledge of the tax laws in various
jurisdictions. We are subject to audit by various taxing authorities and we may
be assessed additional taxes during an audit. We regularly assess the
likely outcomes of these audits, including any appeals, in order to determine
the appropriateness of our tax provision. However, there can be no assurance
that the actual outcomes of these audits or appeals will approximate our
estimates and could have a material impact on our net earnings or financial
condition. In addition, our effective tax rate in the future could be adversely
affected by changes in the mix of earnings in countries with differing statutory
tax rates, changes in the valuation of deferred tax assets and liabilities,
changes in tax laws and the discovery of new information in the course of our
tax return preparation process. In particular, the carrying value of deferred
tax assets, which are predominantly in the United States, is dependent on our
ability to generate future taxable income in the United States. In addition,
recently proposed significant changes to the U.S. tax laws could, if enacted,
adversely impact our future profitability and cash flows.
Increases
in costs of our defined benefit plans may reduce our profitability and cash
flows.
The
Company has a defined benefit pension plan for certain of its U.K. employees.
This plan was closed to new participants in 1992 and future benefits ceased to
accrue for the remaining active employee participants in the plan beginning in
December 2008. We may experience significant increases in costs as a
result of economic factors, which are beyond our control. Changes in
returns on investments and discount rates used to calculate pension expense and
the funded or underfunded balance in the plan may have an unfavorable impact on
our costs and increase future funding contributions.
Risks
Related to Our Common Stock
Our
common stock price may be volatile.
Our
common stock price may fluctuate in response to a number of events, including,
but not limited to:
|
·
|
our
quarterly and annual operating
results;
|
|
·
|
weather
conditions that impact our highway and consumer deicing product sales or
SOP production levels;
|
|
·
|
future
announcements concerning our
business;
|
|
·
|
changes
in financial estimates and recommendations by securities
analysts;
|
|
·
|
changes
and developments affecting internal controls over financial
reporting;
|
|
·
|
actions
of competitors;
|
|
·
|
market
and industry perception of our success, or lack thereof, in pursuing our
growth strategy;
|
|
·
|
changes
in government and environmental
regulation;
|
|
·
|
changes
and developments affecting the salt or potash fertilizer
industries;
|
|
·
|
general
market, economic and political conditions;
and
|
|
·
|
natural
disasters, terrorist attacks and acts of
war.
|
We
may be restricted from paying cash dividends on our common stock in the
future.
We
currently declare and pay regular quarterly cash dividends on our common stock.
Any payment of cash dividends will depend upon our financial condition,
earnings, legal requirements, restrictions in our debt agreements and other
factors deemed relevant by our board of directors. The terms of our senior
secured credit facilities limit annual dividends to $55 million plus 50% of the
preceding year net income, as defined, and may restrict us from paying cash
dividends on our common stock if our total leverage ratio exceeds 4.75x (actual
ratio of 1.6x as of December 31, 2009) or if a default or event of default has
occurred and is continuing under the facilities. The terms of our indenture may
also restrict us from paying cash dividends on our common stock. The payment of
a cash dividend on our common stock is considered a restricted payment under our
indenture and we are restricted from paying any cash dividend in excess of $60
million on our common stock unless we satisfy minimum requirements with respect
to our cumulative consolidated net income (plus any additional cash proceeds
received upon the issuance of our common stock). We cannot assure you that the
agreements governing our current and future indebtedness, including our senior
secured credit facilities, will permit us to pay dividends on our common
stock.
Shares
eligible for future sale may adversely affect our common stock
price.
Sales of
substantial amounts of our common stock in the public market, or the perception
that these sales may occur, could cause the market price of our common stock to
decline. This could also impair our ability to raise additional capital through
the sale of our equity securities. We are authorized to issue up to 200,000,000
shares of common stock, of which 32,643,181 shares of common stock were
outstanding and 825,574 shares of common stock were issuable upon the exercise
of outstanding stock options, issuance of earned deferred stock units, and
vesting of restricted stock units as of December 31, 2009. We cannot predict the
size of future issuances of our common stock or the effect, if any, that future
sales and issuances of shares of our common stock would have on the market price
of our common stock.
|
ITEM
1B.
|
UNRESOLVED
STAFF
COMMENTS
|
None.
|
ITEM
2.
|
PROPERTIES
|
Information
regarding our plant and properties is included in Item 1, “Business,” of this
report.
|
ITEM
3.
|
LEGAL
PROCEEDINGS
|
The
Company from time to time is involved in various routine legal proceedings.
These primarily involve commercial claims, product liability claims, personal
injury claims and workers’ compensation claims. We cannot predict the outcome of
these lawsuits, legal proceedings and claims with certainty. Nevertheless, we
believe that the outcome of these proceedings, even if determined adversely,
would not have a material adverse effect on our business, financial condition,
results of operations and cash flows. In addition, The Mosaic Company, a former
owner of the Company, has agreed to indemnify us against certain legal
matters.
We have
become aware of an aboriginal land claim filed by The Chippewas of Nawash and
The Chippewas of Saugeen (the “Chippewas”) in the Ontario Superior Court against
The Attorney General of Canada and Her Majesty The Queen In Right of Ontario.
The Chippewas claim that a large part of the land under Lake Huron was never
conveyed by treaty and therefore belongs to the Chippewas. The land claimed
includes land under which our Goderich mine operates and has mining rights
granted to it by the government of Ontario. We are not a party to this court
action. Similar claims are pending with respect to other parts of the Great
Lakes by other aboriginal claimants. We have been informed by the Ministry of
the Attorney General of Ontario that “Canada takes the position that the common
law does not recognize aboriginal title to the Great Lakes and its connecting
waterways.” We do not believe that this action will result in a material adverse
financial effect on the Company.
|
ITEM
4.
|
SUBMISSION OF MATTERS TO A VOTE OF SECURITY
HOLDERS
|
None.
Executive
Officers of the Registrant
The
following table sets forth the name, age and position of each person who is an
executive officer as of December 31, 2009.
|
Name
|
Age
|
Position
|
|||
|
Angelo
C. Brisimitzakis
|
51 |
President,
Chief Executive Officer and Director
|
|||
|
Ronald
Bryan
|
57 |
Vice
President and General Manager of Great Salt Lake Minerals and Compass
Minerals U.K.
|
|||
|
Gerald
Bucan
|
46 |
Vice
President and General Manager, Consumer and Industrial
|
|||
|
Keith
E. Clark
|
54 |
Vice
President and General Manager, North American Highway
|
|||
|
David
J. Goadby
|
55 |
Vice
President of Strategic Development
|
|||
|
Rodney
L. Underdown
|
43 |
Vice
President, Chief Financial Officer, Treasurer and
Secretary
|
|||
Angelo C. Brisimitzakis joined
CMP as President and Chief Executive Officer in May 2006. Prior to
joining CMP, Dr. Brisimitzakis was employed by Great Lakes Chemical Corporation
from 1998 to 2005 where he most recently served as Executive Vice President and
General Manager of flame retardants and performance products following his
position of Vice President, Global Supply Chain. Prior to that Dr.
Brisimitzakis served 14 years with General Electric Corporation where he held
leadership positions in sales, technology, business development, supply chain
and business management functions.
Ronald Bryan has served as
Vice President and General Manager of Salt Union Ltd., our U.K. subsidiary,
since October of 2006 and Vice President and General Manager of CMP’s sulfate of
potash business unit since January 2005. Mr. Bryan joined CMP in June 2003 as
Vice President — Sales and Marketing, Highway Deicing. Prior to his career at
CMP, Mr. Bryan was employed by Borden Chemical and Plastics, where he most
recently served as Senior Vice President — Commercial.
Gerald Bucan joined CMP as
Vice President and General Manager, Consumer and Industrial in November
2007. Prior to joining CMP, Mr. Bucan held positions of Vice
President and General Manager of the Deli division of ConAgra Foods’
Refrigerated Meats operating company in 2006, and Corporate Vice President of
Program Management for Federated Group, Inc. from 2003 through
2005.
Keith E. Clark has served as
the Vice President and General Manager, North American Highway for CMP since
January 2008. Prior to this position, he served as General Manager,
Consumer and Industrial for CMP since August 2004. He served as the Vice
President and General Manager of CMG’s consumer and industrial business unit
since August 1997, when North American Salt Company, a subsidiary of CMP, was
under the management of Harris Chemical Group.
David J. Goadby was named Vice
President – Strategic Development for CMP in October 2006. Prior to
this position, he served as Vice President of CMP since August 2004, Vice
President of CMG since February 2002 and as the Managing Director of Salt Union
Ltd., our U.K. subsidiary, since April 1994, under the management of Harris
Chemical Group.
Rodney L. Underdown was
appointed Chief Financial Officer of CMP in December 2002, has served as a Vice
President of CMP since May 2002. Mr. Underdown served as the Chief Financial
Officer of CMG since February 2002 and Vice President, Finance of CMG since
November 2001. Mr. Underdown was appointed CMP’s Secretary in August 2005 and
Treasurer in May 2006. Prior to that, Mr. Underdown was a Vice
President of Finance for the Salt Division of CMG’s former parent company from
June 1998.
|
PART
II
|
|
ITEM
5.
|
MARKET FOR THE REGISTRANT’S COMMON EQUITY, RELATED
STOCKHOLDER MATTERS AND ISSUER PURCHASES OF EQUITY
SECURITIES
|
PRICE
RANGE OF COMMON STOCK
Our
common stock, $0.01 par value, trades on the New York Stock Exchange under the
symbol “CMP”. The following table sets forth the high and low closing prices per
share for the four quarters ended December 31, 2009 and 2008:
|
First
|
Second
|
Third
|
Fourth
|
|||||||||||||
|
2009
|
||||||||||||||||
|
Low
|
$ | 46.51 | $ | 47.62 | $ | 46.89 | $ | 59.25 | ||||||||
|
High
|
64.30 | 58.74 | 61.62 | 69.87 | ||||||||||||
|
2008
|
||||||||||||||||
|
Low
|
$ | 37.11 | $ | 62.22 | $ | 47.06 | $ | 39.89 | ||||||||
|
High
|
62.60 | 85.61 | 80.60 | 59.96 | ||||||||||||
HOLDERS
On
February 17, 2010, the number of holders of record of our common stock was
34.
DIVIDEND
POLICY
We intend
to pay quarterly cash dividends on our common stock. The declaration and payment
of future dividends to holders of our common stock will be at the discretion of
our board of directors and will depend upon many factors, including our
financial condition, earnings, legal requirements, restrictions in our debt
agreements and other factors our board of directors deems
relevant. See Item 1A. “Risk Factors – We may be restricted from
paying cash dividends on our common stock in the future.”
The
Company paid quarterly dividends totaling $1.42 and $1.34 per share in 2009 and
2008, respectively. On February 5, 2010, our board of directors declared a
quarterly cash dividend of $0.39 per share on our outstanding common stock, an
increase of 10% from the quarterly cash dividends paid in 2009 of $0.355 per
share. The dividend will be paid on March 15, 2010 to stockholders of record as
of the close of business on March 1, 2010.
|
ITEM
6.
|
SELECTED FINANCIAL
DATA
|
The
information included in the following table should be read in conjunction with
Management’s Discussion and Analysis of Financial Condition and Results of
Operations and the consolidated financial statements and accompanying notes
thereto included elsewhere in this annual report.
|
For
the Year Ended December 31,
|
||||||||||||||||||||
|
(Dollars
in millions, except share data)
|
2009
|
2008
|
2007
|
2006
|
2005
|
|||||||||||||||
|
Statement
of Operations Data(1):
|
||||||||||||||||||||
|
Sales
|
$ | 963.1 | $ | 1,167.7 | $ | 857.3 | $ | 660.7 | $ | 742.3 | ||||||||||
|
Shipping and handling cost
|
249.3 | 341.1 | 252.9 | 194.6 | 219.5 | |||||||||||||||
|
Product cost (2)
|
316.0 | 429.0 | 352.4 | 252.5 | 283.5 | |||||||||||||||
|
Depreciation, depletion and amortization (3)
|
43.7 | 41.4 | 40.0 | 40.5 | 43.6 | |||||||||||||||
|
Selling, general and administrative expenses
|
83.9 | 82.0 | 67.7 | 53.7 | 56.4 | |||||||||||||||
|
Operating earnings
|
270.2 | 274.2 | 144.3 | 119.4 | 142.9 | |||||||||||||||
|
Interest expense
|
25.8 | 41.6 | 54.6 | 53.7 | 61.6 | |||||||||||||||
|
Net earnings from continuing operations (4)
|
163.9 | 159.5 | 80.0 | 55.0 | 26.8 | |||||||||||||||
|
Net earnings from discontinued operations (1)
|
- | - | - | - | 4.1 | |||||||||||||||
|
Net earnings available for common stock (5)
|
160.5 | 156.1 | 78.6 | 54.4 | 30.9 | |||||||||||||||
|
Share
Data:
|
||||||||||||||||||||
|
Weighted-average common shares outstanding (in thousands)(5):
|
||||||||||||||||||||
|
Basic
|
32,574 | 32,407 | 32,248 | 32,003 | 31,472 | |||||||||||||||
|
Diluted
|
32,596 | 32,477 | 32,369 | 32,249 | 32,034 | |||||||||||||||
|
Net earnings from continuing operations per share:
|
||||||||||||||||||||
|
Basic
|
$ | 4.93 | $ | 4.82 | $ | 2.44 | $ | 1.70 | $ | 0.85 | ||||||||||
|
Diluted
|
4.92 | 4.81 | 2.43 | 1.69 | 0.84 | |||||||||||||||
|
Cash dividends declared per share
|
1.42 | 1.34 | 1.28 | 1.22 | 1.10 | |||||||||||||||
|
Balance
Sheet Data (at year end):
|
||||||||||||||||||||
|
Total cash and cash equivalents
|
$ | 13.5 | $ | 34.6 | $ | 12.1 | $ | 7.4 | $ | 47.1 | ||||||||||
|
Total assets
|
1,003.8 | 822.6 | 820.0 | 715.5 | 750.3 | |||||||||||||||
|
Total debt
|
490.7 | 495.7 | 606.8 | 585.5 | 615.9 | |||||||||||||||
|
Other
Financial Data:
|
||||||||||||||||||||
|
Ratio of earnings to fixed charges
(6)
|
9.08 | x | 5.88 | x | 2.32 | x | 2.18 | x | 1.66 | x | ||||||||||
|
(1)
|
On
December 30, 2005, we sold our Weston Point, England evaporated salt
business. The results of those operations are classified as
discontinued operations for 2005. The 2005 earnings from discontinued
operations include a gain of $3.7 million ($4.6 million before tax) on the
sale of those operations.
|
|
(2)
|
“Product
cost” is presented exclusive of depreciation, depletion and
amortization.
|
|
(3)
|
“Depreciation,
depletion and amortization,” for purposes of this table, excludes
amortization of deferred financing costs but includes expense related to
discontinued operations of $3.6 million for
2005.
|
|
(4)
|
Net
earnings from continuing operations for 2005 includes $32.2 million of
pre-tax expenses related to the early retirement of debt and income tax
expense of $4.1 million resulting from the decision to repatriate $70
million of qualified foreign earnings pursuant to the American Jobs
Creation Act.
|
|
(5)
|
Weighted
average common shares outstanding have been recast to include common
shares outstanding based upon the two-class method of calculating earnings
per share. Accordingly, net earnings were allocated to
participating securities of 704,000, 712,000, 564,000, 343,000 and 16,000
for 2009, 2008, 2007, 2006 and 2005, respectively. Participating
securities include options and RSUs that receive non-forfeitable
dividends.
|
|
(6)
|
For the purposes of computing the
ratio of earnings to fixed charges, earnings consist of earnings from
continuing operations before income taxes and fixed charges. Fixed charges
consist of interest expense excluding amounts allocated to discontinued
operations, including the amortization of deferred debt issuance costs and
the interest component of our operating
rents.
|
|
ITEM
7.
|
MANAGEMENT’S DISCUSSION AND ANALYSIS OF FINANCIAL CONDITION AND
RESULTS OF OPERATIONS
|
The
statements in this discussion regarding the industry outlook, our expectations
for the future performance of our business, and the other non-historical
statements in this discussion are forward-looking statements. These
forward-looking statements are subject to numerous risks and uncertainties,
including, but not limited to, the risks and uncertainties described in Item 1A,
“Risk Factors.” You should read the following discussion together with Item 1A,
“Risk Factors” and the consolidated financial statements and notes thereto
included elsewhere in this annual report on Form 10-K.
COMPANY
OVERVIEW
Based in
the Kansas City metropolitan area, Compass Minerals is a leading producer of
minerals, including salt, sulfate of potash specialty fertilizer and magnesium
chloride. We operate 11 production and packaging facilities,
including the largest rock salt mine in the world in Goderich, Ontario and the
largest salt mine in the United Kingdom in Winsford, Cheshire. Our products
include salt and sulfate of potash, and we operate a records management
business. Salt consists of sodium chloride and magnesium chloride,
which is used for highway deicing, dust control, consumer deicing, water
conditioning, consumer and industrial food preparation, and agricultural and
industrial applications. In addition, we are North America’s leading
producer of sulfate of potash (“SOP”), which is used in the production of
specialty fertilizers for high-value crops and turf. We also provide
records management services to businesses throughout the U.K.
Salt is
indispensable and enormously versatile with more than 14,000 uses. In addition,
there is an absence of cost-effective alternatives. As a result, our cash flows
from salt are not materially impacted by economic cycles. We are among the
lowest cost salt producers in our markets because our salt deposits are high
grade and among the most extensive in the world, and because we use effective
mining techniques and efficient production processes. Because
the highway deicing business accounts for nearly half of our annual sales, our
business is seasonal and results will vary depending on the severity of the
winter weather in our markets.
The
severity of the winter seasons has varied considerably over the last three
years. During 2007, the winter weather in our markets was normal
followed by very severe winter weather in 2008 and milder than normal winter
weather in 2009. Not only does the weather affect our highway and
consumer and industrial deicing salt sales volumes and resulting gross profit,
but it also impacts our inventory levels, which influence production volume, the
resulting cost per ton, and ultimately our profit margins.
Our SOP
plant is the largest SOP production facility in North America and one of only
three natural solar SOP plants in the world. Our domestic sales of
SOP are concentrated in the western and southeastern portions of the United
States where the crops and soil conditions favor the use of potassium nutrients
with no chlorides present, such as SOP. Consequently, weather
patterns and field conditions in these locations can impact the amount of
specialty fertilizer sales volumes. Additionally, the demand for and
market price of SOP is affected by the broader potash market, which is
influenced by many factors such as world grain and food supply, changes in
consumer diets, general levels of economic activity and government food,
agriculture and energy policies around the world. Economic factors
may impact the amount or type of crop grown in certain locations, or the type of
fertilizer product used. High-value or chloride-sensitive crop yields
and/or quality tend to decline when alternative fertilizers are used. Beginning
late in 2007 and throughout much of 2008, the demand for potassium nutrients for
crops exceeded the available supply, which contributed to a substantial increase
in the market price for potash, including SOP. Demand for these
products waned in the fourth quarter of 2008 and remained suppressed through
2009, as the broad agricultural industry dealt with a global economic slowdown,
reduced credit availability and the reluctance of fertilizer customers to
purchase potash at historically high prices. Potassium chloride (“KCl”) market
pricing thus declined throughout 2009 from prices experienced at the end of
2008, although pricing remained well above historical pricing
levels. These same factors have similarly influenced SOP market
pricing, which has historically been sold at prices above KCl market pricing,
and the resulting average price of our SOP has fluctuated dramatically each
quarter in 2008 and 2009. We still expect SOP pricing to retain a
premium to KCl.
We
contract bulk shipping vessels, barge, trucking and rail services to move
product from our production facilities to the distribution outlets and
customers. Our North American salt mines and SOP production facility
are near either water or rail transport systems, which reduces our shipping and
handling costs, although shipping and handling costs still account for a
relatively large portion of the total delivered cost of our
products. The tightening of available transportation services
together with higher fuel costs led to an increase in our shipping and handling
costs on a per ton basis through 2008. However, declining oil-based
fuel costs beginning late in 2008 and continuing through much of 2009 has
contributed to lower shipping and handling costs on a per ton basis in 2009 when
compared to 2008.
Manpower
costs, energy costs, packaging, and certain raw material costs, particularly
KCl, a deicing and water conditioning agent and feed-stock, which can be used to
make a portion of our sulfate of potash fertilizer product, are also
significant. The Company’s production workforce is typically
represented by labor unions with multi-year collective bargaining
agreements. Our energy costs result from the consumption of
electricity with relatively stable, rate-regulated pricing, and natural gas,
which can have significant pricing volatility. We manage the pricing volatility
of our natural gas purchases with natural gas forward swap contracts up to 36
months in advance of purchases, helping to reduce the impact of short-term spot
market price volatility. We have historically purchased KCl under
long-term supply contracts with annual changes in price based on previous year
changes in the market price for KCl. The market price for KCl has
increased significantly in recent years, causing continued price increases under
our supply contracts, though still below current market due to the annual price
adjustment mechanism in these
contracts. We
cannot predict future changes in market prices for KCl, however our per ton
costs to purchase KCl were moderately higher in 2009. We will, in all
likelihood, significantly reduce or cease future KCl purchases under these
supply contracts due to several factors including the expected future contract
price of KCl, existing inventory levels, as well as the additional solar pond
based production capacity gained from the Company’s SOP production capacity
expansion project.
We focus
on building intrinsic value by improving our earnings before interest, income
taxes, depreciation and amortization, or “EBITDA,” adjusting for a normalized
winter weather season and by improving our financing cost
structure. We can employ our operating cash flow and other sources of
liquidity to pay dividends, re-invest in our business, pay down debt and make
acquisitions. In the fourth quarter of 2007, we refinanced our 12¾%
Senior Discount Notes with incremental borrowing under our Credit
Agreement. We also made early principal payments on our Term Loan
during 2007, redeemed $90.0 million of our 12% Senior Subordinated Discount
Notes in 2008 and refinanced approximately $90 million of our 12% Senior
Subordinated Notes with 8% senior notes in 2009 to strengthen our financial
condition. In 2007 we acquired London-based Interactive Records
Management Limited (“IRM”) to further develop our records management business
and completed the replacement of an underground mill in our Goderich mine with a
larger capacity mill. In 2008, we completed the first phase of an
expansion project at our Goderich rock salt mine, which increased our annual
capacity by 750,000 tons, beginning in 2009. The second phase of this
expansion project, scheduled to partially come on-line during 2010 with full
availability based upon our assessment of market need, is expected to ultimately
increase that mine’s annual capacity to 9.0 million tons. Also, in
2007, we began the initial phase of a multi-phased plan to strengthen our solar
pond-based SOP production through upgrades to our processing plant and expansion
of our solar evaporation ponds. These improvements are expected to
increase our solar pond-based SOP production capacity progressively through
2011, and achieve approximately 100,000 additional tons annually from solar
evaporation ponds by 2011.
RESULTS
OF OPERATIONS
The
following table presents consolidated financial information with respect to
sales from our salt and specialty fertilizer segments for the years ended
December 31, 2009, 2008 and 2007. The results of operations of the
consolidated records management business, including sales of $10.5 million for
2009, $11.5 million for 2008 and $10.5 million for 2007, are not material to our
consolidated financial results and are not included in the following
table. The following discussion should be read in conjunction with
the information contained in our consolidated financial statements and the notes
thereto included in this annual report on Form 10-K.
|
Year
Ended December 31,
|
||||||||||||
|
2009
|
2008
|
2007
|
||||||||||
|
Salt
Sales (in millions)
|
||||||||||||
|
Salt sales
|
$ | 825.8 | $ | 923.3 | $ | 710.7 | ||||||
|
Less: salt shipping and handling
|
239.6 | 318.3 | 232.9 | |||||||||
|
Salt product sales
|
$ | 586.2 | $ | 605.0 | $ | 477.8 | ||||||
|
Salt
Sales Volumes (thousands of tons)
|
||||||||||||
|
Highway deicing
|
9,608 | 12,237 | 10,373 | |||||||||
|
Consumer and industrial
|
2,463 | 2,852 | 2,412 | |||||||||
|
Total tons sold
|
12,071 | 15,089 | 12,785 | |||||||||
|
Average
Salt Sales Price (per ton)
|
||||||||||||
|
Highway deicing
|
$ | 46.64 | $ | 43.57 | $ | 38.97 | ||||||
|
Consumer and industrial
|
153.33 | 136.82 | 127.04 | |||||||||
|
Combined
|
68.41 | 61.19 | 55.59 | |||||||||
|
Specialty
fertilizer ("SOP") sales (in millions)
|
||||||||||||
|
SOP sales
|
$ | 126.8 | $ | 232.9 | $ | 136.1 | ||||||
|
Less: SOP shipping and handling
|
9.7 | 22.8 | 20.0 | |||||||||
|
SOP product sales
|
$ | 117.1 | $ | 210.1 | $ | 116.1 | ||||||
|
SOP
Sales Volumes (thousands of tons)
|
153 | 391 | 423 | |||||||||
|
SOP
Average Price (per ton)
|
$ | 828 | $ | 596 | $ | 322 | ||||||
Year
Ended December 31, 2009 Compared to the Year Ended December 31,
2008
Sales
Sales for
the year ended December 31, 2009 of $963.1 million decreased $204.6 million, or
18% compared to $1,167.7 million for the year ended December 31,
2008. Sales primarily include revenues from the sale of our products,
which, in most instances, includes delivery to our customers, and revenues from
our records management business. Product sales include sales less shipping and
handling costs incurred to deliver salt and specialty fertilizer products to our
customers. Shipping and handling fees were $249.3 million during the
year ended December 31, 2009, a decrease of $91.8 million, or 27% compared to
$341.1 million for the year ended December 31, 2008. Shipping and handling costs
decreased due, in part, to lower sales volumes, which declined 21% for 2009 when
compared to 2008. In addition, the lower price of fuel and
transportation services have decreased our average per unit cost of shipping and
handling products to our customers by approximately 7% when compared to the unit
costs in 2008.
Product
sales for salt and specialty fertilizer for the year ended December 31, 2009 of
$703.3 million decreased $111.8 million, or 14% compared to $815.1 million for
2008. Salt product sales for the year ended December 31, 2009 of
$586.2 million decreased $18.8 million, or 3% compared to $605.0 million in 2008
while specialty fertilizer product sales of $117.1 million decreased $93.0
million, or 44% compared to $210.1 million in 2008.
The $18.8
million decrease in salt product sales was due primarily to sales volume
decreases offset by price improvements. Overall, salt segment sales
volumes in 2009 declined 3.0 million tons from 2008 levels, which decreased
sales by approximately $116 million. The milder than normal winter
weather in our North American markets during 2009 compared to the more severe
winter weather in our North American markets during 2008 led to lower sales
volumes for highway, consumer and industrial deicing products. In addition,
lower sales volumes related to consumer and industrial products due primarily to
the Company’s focus on maximizing the value of its production, has led the
Company to relinquish sales volume to some of its customers that generate lower
sales per ton. Lower rock salt sales volumes of non-seasonal
chlor-alkali products due to weakness in the broader economy, also contributed
to the sales decline. In the U.K., we experienced more severe than
normal winter weather, which resulted in higher U.K. sales volumes for 2009 when
compared to 2008. Overall, higher realized salt prices contributed approximately
$118 million to product sales. In addition, the strength of the U.S.
dollar in 2009 when compared to the prior year exchange rate for the Canadian
dollar and British pound sterling, unfavorably impacted product sales by
approximately $21 million.
The $93.0
million decrease in specialty fertilizer product sales in 2009 compared to 2008
resulted from lower sales volumes due to the ongoing effects of the uncertain
economy on the agricultural industry, reduced credit availability and the
reluctance of fertilizer customers to purchase potash at historically high
prices. The lower sales volumes contributed approximately $118
million to the decline in product sales. This decline was partially
offset by price improvements in 2009, which yielded approximately $25 million in
additional product sales, although the average selling price in the last half of
2009 declined when compared to the same period in 2008 as a result of the recent
declines in market pricing for KCl and SOP fertilizers, which partially offset
price improvements in the first half of 2009.
Gross Profit
Gross
profit for the year ended December 31, 2009 of $354.1 million decreased $2.1
million, or less than 1% compared to $356.2 million for 2008. As a
percent of sales, gross margin was 37% in 2009 compared to 31% in
2008. The gross margin for the SOP segment contributed approximately
$42 million to the decline due primarily to lower sales volumes offset by higher
average prices for 2009. The gross margin for the salt segment
partially offset the decline in SOP gross margin by contributing an increase of
approximately $40 million due to price improvements combined with slightly lower
average per unit shipping and handling costs, which were partially offset by
lower sales volumes.
Selling,
General and Administrative Expenses
Selling,
general and administrative expenses for the year ended December 31, 2009 of
$83.9 million increased $1.9 million, or 2% compared to $82.0 million in 2008,
and increased from 7% to 9% as a percentage of sales. The increase in expense is
primarily due to higher costs for professional services and investments in
personnel to support ongoing growth and productivity
initiatives. These increases were partially offset by lower variable
incentive compensation.
Interest Expense
Interest
expense for the year ended December 31, 2009 of $25.8 million decreased $15.8
million compared to $41.6 million for 2008. This decrease is
primarily due to the early extinguishment of $90 million of the Company’s 12%
Senior Subordinated Discount Notes during 2008, lower market interest rates on
our unhedged floating-rate debt and the refinancing of approximately $90 million
of the Company’s 12% Senior Subordinated Discount Notes with 8% Senior Notes in
June 2009.
Other,
Net
Other
expense, net of $7.3 million for the year ended December 31, 2009 increased $1.7
million when compared to 2008. Net foreign exchange losses were
approximately $4.3 million higher in 2009 when compared to 2008. This
increase was partially offset by a decline in charges, which totaled $5.0
million and $6.5 million in 2009 and 2008, respectively, related to the
redemption or refinancing of the 12% Senior Subordinated Discount
Notes. The 2009 charge includes call premiums and tender
and other
fees of $4.1 million and the write-off of deferred financing costs of $0.9
million related to the refinancing of the Company’s 12% Senior Subordinated
Notes with 8% Senior Notes. The 2008 charge includes call premiums of
$5.4 million and the write-off of $1.1 million in unamortized deferred finance
costs related to the early extinguishment of $90 million of the Company’s 12%
Senior Subordinated Discount Notes as discussed in Note 8 to the Consolidated
Financial Statements. The increase in 2009 was also partially offset by a net
increase in income attributable to interest income on cash and cash equivalents
and changes in the non-qualified savings plans.
Income
Tax Expense
Income
tax expense for the year ended December 31, 2009 of $73.2 million increased $5.7
million compared to $67.5 million in 2008. The 2009 income tax
expense increased due primarily to higher pre-tax income in 2009 when compared
to 2008. Our income tax provision differs from the U.S. statutory federal income
tax rate primarily due to U.S. statutory depletion, state income taxes (net of
federal benefit), foreign income, mining and withholding taxes, net of U.S.
deductions, changes in the expected utilization of previously reserved net
operating loss carry-forwards and interest expense recognition differences for
tax and financial reporting purposes.
Year
Ended December 31, 2008 Compared to the Year Ended December 31,
2007
Sales
Sales for
the year ended December 31, 2008 of $1,167.7 million increased $310.4 million,
or 36% compared to $857.3 million for the year ended December 31,
2007. Sales include revenues from the sales of our products, or
“product sales,” revenues from our records management business, and shipping and
handling fees incurred to deliver salt and specialty fertilizer products to the
customer. Shipping and handling fees were $341.1 million during the
year ended December 31, 2008, an increase of $88.2 million, or 35% compared to
$252.9 million for the year ended December 31, 2007. Shipping and handling costs
increased primarily as result of higher sales volumes of salt products during
2008 when compared to 2007, and the impact of higher per unit transportation
costs, principally higher fuel surcharges.
Product
sales for salt and specialty fertilizer products for the year ended December 31,
2008 of $815.1 million increased $221.2 million, or 37% compared to $593.9
million for 2007. Salt product sales for the year ended December 31,
2008 of $605.0 million increased $127.2 million, or 27% compared to $477.8
million for the same period in 2007 while specialty fertilizer product sales of
$210.1 million increased $94.0 million, or 81% compared to $116.1 million in
2007.
The
$127.2 million increase in salt product sales was due primarily to sales volume
increases and price improvements. The severe winter weather in our
North American markets during 2008 compared to the more normal winter weather of
2007 has led to higher 2008 sales volumes for highway deicing and consumer and
industrial products, which was supplemented by higher sales volumes of
non-seasonal consumer and industrial products. Salt sales volumes in
2008 grew by 2.3 million tons or 18% over 2007 levels, which, when combined with
the improved customer and product mix, increased sales by approximately $93
million. Price improvements, net of higher shipping and handling,
contributed approximately $39 million in additional product sales and were
partially offset by the strengthening of the U.S. dollar during the latter half
of 2008. In the U.K., the 2007-2008 winter weather season was the
second consecutive milder winter weather season. However, we
experienced a more severe than normal amount of winter weather precipitation in
the U.K. in the fourth quarter of 2008, which resulted in higher U.K. sales
volumes for 2008 when compared to 2007.
The $94.0
million increase in specialty fertilizer product sales in 2008 compared to 2007
resulted from improvements in price reflecting the strong demand and limited
supply of potash products generally, both domestically and
abroad. Price improvements in 2008 yielded approximately $105 million
of the increase in product sales. This increase was partially offset
by lower sales volumes in the fourth quarter reflecting the ongoing effects of
the uncertain economy on the agricultural industry. We continue to
believe the market for fertilizer products has responded to economic factors,
which have increased worldwide demand for crop nutrients, including the need for
improved yields in locations with growing populations and less arable land per
capita, and alternative crop uses. Conditions such as these have
affected the agricultural markets and the demand for all types of potash
fertilizer products, including SOP.
Gross Profit
Gross
profit for the year ended December 31, 2008 of $356.2 million increased $144.2
million, or 68% compared to $212.0 million for 2007. As a percent of
sales, gross margin was 31% in 2008 compared to 25% in 2007. These
improvements primarily reflect the higher average salt and SOP product sales
prices totaling approximately $144 million, and increased salt sales volumes
together with improved product and customer mix as discussed above totaling
approximately $44 million. These gross profit improvements were
partially offset by higher per unit costs at our production facilities,
primarily our solar evaporation production facility in Ogden,
Utah. Much of the higher per unit costs incurred at our Ogden
facility were a result of higher raw materials, royalties and maintenance
costs.
Selling,
General and Administrative Expenses
Selling,
general and administrative expenses for the year ended December 31, 2008 of
$82.0 million increased $14.3 million, or 21% compared to $67.7 million for the
same period in 2007, although as a percentage of sales selling, general and
administrative declined 1% to 7%. The increase in expense for 2008 is
primarily due to higher employee compensation and benefits primarily due to
variable compensation expense resulting from improved financial performance and
investments in
personnel
to support ongoing growth and productivity initiatives. We also
incurred higher costs for consumer and industrial promotional activities,
principally in support of new product development.
Interest Expense
Interest
expense for the year ended December 31, 2008 of $41.6 million decreased $13.0
million compared to $54.6 million for the same period in 2007. This
decrease is primarily due to the refinancing of our 12¾% senior discount notes
in the fourth quarter of 2007 with a lower-rate incremental term loan under our
senior secured credit agreement, the early extinguishment of $90 million of our
12% Senior Subordinated Discount Notes in 2008 and lower interest rates on our
floating-rate debt.
Other,
Net
Other
expense, net of $5.6 million for the year ended December 31, 2008 includes $6.5
million related to the early extinguishment of $90 million of the Company’s 12%
Senior Subordinated Discount Notes, including call premiums of $5.4 million and
the write-off of $1.1 million in unamortized deferred finance costs as discussed
in Note 8 to the Consolidated Financial Statements. These costs were
partially offset by interest income on cash and cash equivalents. For
2007, other expense, net includes $11.0 million of expense for the tender
premium and write off of previously deferred financing fees associated with the
retirement of our 12¾% senior discount notes partially offset by interest
income.
Income
Tax Expense
Income
tax expense for the year ended December 31, 2008 of $67.5 million increased
$67.4 million compared to $0.1 million for the same period in
2007. As discussed in Note 6 to the Consolidated Financial
Statements, the Company’s 2007 tax provision includes tax benefits totaling
approximately $18.1 million related to items unique to 2007. In 2007,
the Company entered into a program with a taxing authority to begin the process
of resolving an uncertain tax position. Communications with the
taxing authority has caused the Company to change its measurement of uncertain
tax positions resulting in the reversal of tax reserves. The Company
also released reserves following the closure of certain tax examination
years. The Company’s 2007 provision also includes benefits totaling
$1.0 million to reduce net deferred tax liabilities for the effects of income
tax rate reductions in certain jurisdictions.
In
addition to the impact of the items discussed above, the 2008 income tax expense
increased due primarily to higher pre-tax income in 2008 when compared to 2007.
Our income tax provision differs from the U.S. statutory federal income tax rate
primarily due to U.S. statutory depletion, state income taxes (net of federal
benefit), foreign income, mining and withholding taxes, net of U.S. deductions,
changes in the expected utilization of previously reserved net operating loss
carry-forwards and interest expense recognition differences for tax and
financial reporting purposes.
Liquidity
and Capital Resources
Overview
Over the
last three years, the Company has undergone significant changes in order to
strengthen its financial position. We have replaced an existing
underground rock salt mill in our Goderich, Ontario mine with a greater capacity
mill, completed the first in a phased expansion program at the Goderich mine,
which increased our annual available salt production capacity to 7.25 million
tons at the mine at the end of 2008, and expanded our magnesium chloride
production facility in Ogden, Utah. The second phase of the Goderich
mine expansion project, scheduled to come on-line during 2010 with full
availability, dependent upon our estimate of market needs, is expected to
ultimately increase that mine’s annual capacity to 9.0 million
tons. The second phase expansion project is expected to cost
approximately $70 million and will include the purchase and installation of
additional hoisting equipment, which will enable us to bring more mined,
underground rock salt to the surface. In late 2007, we began the initial phase
of a plan to strengthen our SOP production through upgrades to our processing
plant and expansion of our solar evaporation ponds. The initial phase
includes modification and yield improvements to our existing solar evaporation
ponds and increases in the processing capacity of our plant. These
improvements are expected to increase our solar pond-based SOP production
capacity progressively through 2011, and achieve approximately 100,000
additional tons annually from solar evaporation ponds by 2011 at a total cost of
approximately $40 million. Management expects to fund these and other
capital projects with cash generated from operations, future borrowing or
through leasing arrangements.
As
discussed in Note 2 to the Consolidated Financial Statements, during 2007 we
acquired 100% of London-based Interactive Records Management Limited for $7.6
million to further expand our U.K. records management business.
As
discussed in Note 8 to the Consolidated Financial Statements, in 2005 we entered
into a senior secured credit agreement providing for term loan and revolving
credit facility borrowings. During 2007 we amended this agreement to
provide additional borrowings under an incremental term loan. Using
this facility, we have been able to refinance higher-rate debt. In
the fourth quarter of 2007, we completed a tender offer and redeemed our 12¾%
Senior Discount Notes, which were to become fully-accreted in December 2007,
with subsequent accrued interest to be paid in cash. Our 12% Senior
Subordinated Discounts Notes became fully-accreted in May 2008 at an aggregate
principal balance of $179.6 million with subsequent accrued interest paid in
cash. In 2008, we redeemed $90 million of our 12% Senior Subordinated
Discount Notes with cash generated from operations. In 2009, we
refinanced the remaining approximately $90 million in outstanding 12% Senior
Subordinated Discount Notes with 8% Senior Notes.
Historically,
our cash flows from operating activities have generally been relatively
predictable. We have also been able to manage our cash flows
generated and used across the Company to permanently reinvest earnings in our
foreign jurisdictions or
efficiently
repatriate those funds to the U.S. We have used cash generated from
operations to meet our working capital needs, fund capital expenditures, pay
dividends and repay our debt.
Principally
due to the nature of our deicing business, our cash flows from operations are
seasonal, with the majority of our cash flows from operations generated during
the first half of the calendar year. When we have not been able to
meet our short-term liquidity or capital needs with cash from operations,
whether as a result of the seasonality of our business or other causes, we have
met those needs with borrowings under our $125 million revolving credit facility
(“Revolving Credit Facility”). As our Revolving Credit Facility matures in
December 2010, we are currently reviewing our borrowing options including, but
not limited to, amending and extending the current Revolving Credit Facility or
replacing the entire Credit Agreement. If we amend the Revolving
Credit Facility or replace the Credit Facility, we expect to obtain commercially
reasonable market terms. We expect to meet the ongoing requirements for debt
service, any declared dividends and capital expenditures from these sources.
This, to a certain extent, is subject to general economic, financial,
competitive, legislative, regulatory and other factors that are beyond our
control.
For
the year ended December 31, 2009
Cash
generated by operating activities during the year ended December 31, 2009 was
$118.9 million, a decrease of $135.2 million over the year ended December 31,
2008. Receivable balances and current liabilities decreased $73.8
million, net during 2009 primarily reflecting the impact of winter weather
variability on our operations. In 2009, we used $146.9 million of
cash flows to invest in inventories. We elected to purchase KCl under
our supply agreement and produce SOP in excess of the current, depressed demand
to replenish previously depleted inventories, leverage our low-cost production
methods and gain flexibility to service any possible surge during a potential
rebound in demand. These potash inventory strategies have resulted in
a $57 million decline in cash flows from operations when compared to the prior
year. Our use of cash flows for inventories was also due to the replenishment of
depleted inventories during 2009 due to strong salt sales in the fourth quarter
of 2008 as well as higher additional 2009 salt volumes needed to serve increased
winter deicing bid volumes. Cash payments for income taxes increased
by approximately $26.1 million when compared to 2008, due to estimated tax
payments related to higher pre-tax income in 2009. Cash interest
declined from $31.9 million in 2008 to $ 27.1 million in 2009 due to the
refinancing of our 12¾% senior discount notes in the fourth quarter of 2007 with
a lower-rate incremental term loan under our senior secured credit agreement,
the early extinguishment of $90 million of our 12% Senior Subordinated Discount
Notes in 2008 and lower interest rates on our unhedged floating-rate
debt.
Net cash
used in investing activities during 2009 totaled $98.9 million including $94.1
million of capital expenditures. Our capital expenditures include
$38.0 million for our Goderich mine expansion projects, to increase that mine’s
annual production capacity, and activities to support the SOP evaporation plant
expansion projects at the Great Salt Lake. The remaining capital
expenditures were primarily for routine replacements. In addition, the Company
acquired the assets of a salt packaging and depot handling facility in Minnesota
for $3.6 million in the second quarter of 2009.
Cash
flows used in financing activities of $53.3 million during 2009 reflect payments
of $8.6 million on our Revolving Credit Facility to reduce our outstanding debt
and $47.2 million for dividends to stockholders. We also paid $4.1
million in call premiums and tender and other fees related to the refinancing of
our 12% Senior Subordinated Discount Notes with 8% Senior Notes.
For
the year ended December 31, 2008
Cash
generated by operating activities during the year ended December 31, 2008
reached a historical high of $254.1 million, an increase of $135.6 million over
the year ended December 31, 2007. Receivable balances and current
liabilities increased while inventory levels decreased due to higher fourth
quarter sales, reflecting the seasonality and the impact of winter weather
variability on our operations. Cash payments for income taxes
increased by approximately $8.8 million when compared to 2007, due to estimated
tax payments related to higher pre-tax income in 2008.
Net cash
used in investing activities during 2008 totaled $66.7 million including $67.8
million of capital expenditures. Our capital expenditures include
$5.0 million at our Goderich mine for expansion projects to increase that mine’s
annual production capacity. Expenditures in 2008 also include $3.7
million for engineering and permitting activities to support the SOP evaporation
plant expansion project at the Great Salt Lake. The remaining capital
expenditures were primarily for routine replacements.
As
discussed in Note 13 to the Consolidated Financial Statements, in January 2007
we acquired all of the outstanding common stock of IRM for approximately $7.6
million in cash plus approximately $0.2 million subsequently paid in contingent
consideration in 2008.
Cash
flows used in financing activities of $162.3 million during 2008 reflect
payments totaling $95.4 million to redeem our 12% Senior Subordinated Discount
Notes, consisting of principal payments totaling $90.0 million and call premiums
and related fees of $5.4 million. We also made payments totaling $4.2
million on our two term loans, and paid an additional $23.3 million under our
revolving credit agreement. Also during 2008, we paid dividends
to our stockholders totaling $44.3 million.
For
the year ended December 31, 2007
Cash
generated by operating activities during the year ended December 31, 2007
reached $118.5 million, an increase of $22.9 million over the year ended
December 31, 2006. Relatively strong fourth quarter sales in 2007
resulted in a higher level of working capital employed when compared to 2006.
Receivable balances and liability accruals increased with the higher fourth
quarter sales activities while inventory levels decreased, reflecting the
seasonality and the impact of winter weather variability on
our
operations. Cash payments for income taxes decreased by approximately
$11.6 million when compared to 2006, due to the 2007 deductibility of
accumulated accreted interest on our refinanced Senior Discount Notes, as
discussed below.
Net cash
used in investing activities during 2007 totaled $55.9 million including $48.0
million of capital expenditures and $7.6 million for the acquisition of a
records management business. Our capital expenditures include $9.5
million at our Goderich mine for expenditures on the first phase of an expansion
project to increase that mine’s annual production capacity by 750,000 tons and
to complete the replacement of an upgraded underground salt
mill. Expenditures in 2007 also include $1.6 million for engineering
and permitting activities to support the SOP evaporation plant expansion project
at the Great Salt Lake. The remaining capital expenditures were
primarily for routine replacements.
As
discussed in Note 2 to the Consolidated Financial Statements, in January 2007 we
acquired all of the outstanding common stock of IRM for approximately $7.6
million in cash. The agreement includes a contingent purchase price
adjustment of up to approximately $2.0 million of additional consideration over
two years depending on the level of revenues, as defined, generated by the
business. As of December 31, 2007, $0.2 million of consideration was
accrued for payment in 2008 related to this contingent obligation.
Cash
flows used in financing activities during 2007 reflect payments totaling $130.9
million to redeem our 12¾% senior discount notes, consisting of principal
payments totaling $121.5 million (accreted value) and tender premium and related
fees of $9.4 million. To facilitate this redemption, we amended our
senior secured credit agreement and borrowed $127.0 million on an incremental
term loan, incurring related fees of $1.6 million. We also made
payments totaling $32.4 million on our two term loans, including approximately
$29.3 million of payments made in advance of scheduled maturities, and borrowed
an additional $18.6 million under our revolving credit agreement to meet our
short-term cash requirements. Also during 2007, we paid
dividends to our stockholders totaling $42.0 million.
Capital
Resources
We
believe our primary sources of liquidity will continue to be cash flow from
operations and borrowings under our Revolving Credit Facility or its equivalent,
which may be amended or renegotiated before its December 2010
expiration. We believe that our current banking syndicate is secure
and believe we will have access to our entire Revolving Credit Facility until it
is either amended or expires in December 2010. We expect that ongoing
requirements for debt service and capital expenditures will primarily be funded
from these sources.
Our debt
service obligations could, under certain circumstances, materially affect our
financial condition and prevent us from fulfilling our debt obligations. See
Item 1A, “Our indebtedness could adversely affect our financial condition and
impair our ability to operate our business. Furthermore, CMI is a
holding company with no operations of its own and is dependent on our
subsidiaries for cash flows.” In June of 2009, we issued senior notes
with an aggregate face amount of $100 million due in 2019, which bear interest
at a rate of 8% per year payable semi-annually in June and December. The 8%
Senior Notes were issued at a discount at 97.497% of their face value and the
carrying value of the debt will accrete to their face value over the notes’
term, resulting in an effective interest rate of approximately 8.4%. With the
proceeds of the 8% Senior Notes, the Company redeemed $89.6 million of its 12%
Senior Subordinated Discount Notes due 2013. In connection with the
debt refinancing, the Company paid approximately $4.1 million in call premiums
and tender and other fees, and paid $2.4 million of fees that were capitalized
as deferred financing costs. As discussed in Note 8 to the
Consolidated Financial Statements, at December 31, 2009, we had $490.7 million
of outstanding indebtedness consisting of $97.6 million 8% Senior Notes ($100
million at maturity) due 2019 and $393.1 million of borrowings outstanding under
our Senior Secured Credit Agreement. Borrowings under the Senior
Secured Credit Agreement include $269.0 million of Term Loan borrowings, $124.1
million of Incremental Term Loan borrowings and no outstanding borrowings under
the Revolving Credit Facility. Letters of credit totaling $9.9 million reduced
available borrowing capacity to $115.1 million. In 2010, we may
borrow amounts under the Revolving Credit Facility to fund our working capital
requirements and capital expenditures, and for other general corporate
purposes.
In the
fourth quarter of 2009, Canadian tax authorities issued a tax reassessment for
years 2002-2004, which are under audit, challenging tax positions claimed by one
of the Company’s Canadian subsidiaries. We have disputed this
reassessment and plan to continue to work through the appropriate authorities in
Canada to resolve the dispute. However, there is a reasonable
possibility that the ultimate resolution of this dispute and any related
disputes for other open tax years will be materially higher or lower than the
amounts reserved.
In
connection with the above dispute, customary local regulations have required us
to post security of $36 million in the form of a $27 million performance bond
and $9 million of cash (both submitted in early 2010), which when combined,
represent the total amount in dispute, plus interest through the end of
2009. Should open tax years subsequent to 2004 be audited and
reassessed in a manner consistent with the 2002-2004 tax years disputed
reassessment, we would likely be required by those same local regulations to
post additional security in the form of cash, letters of credit, performance
bonds, asset liens or other arrangements agreeable with the tax
authorities.
We have
various federal, state and foreign net operating loss (“NOL”) carry-forwards
that may be used to offset a portion of future taxable income to reduce our cash
income taxes that would otherwise be payable. However, ownership
changes, as defined in Internal Revenue Code Section 382, limit the amount of
U.S. NOL carry-forwards that we can utilize annually to offset future taxable
income and resulting tax liabilities. We cannot assure you that we
will be able to use all of our NOL carry-forwards to offset future taxable
income, or that the NOL carryforwards will not become subject to additional
limitations due to future ownership changes.
As of
December 31, 2009, we had U.S. and Canadian federal NOL carry-forwards of
approximately $22.0 million, which expire at various dates through
2028. We also have tax-affected state and Canadian provincial NOL
carry-forwards of
approximately
$1.1 million, which will expire in various years through 2028. We
have reserved approximately $1.6 million with a valuation allowance for the
federal and state loss carry-forwards that we do not believe we will be able to
utilize prior to expiration. Additionally, in connection with our
2007 acquisition of IRM, we acquired approximately $4.0 million of foreign NOL
carry-forwards that we do not believe we will be able to
utilize. Accordingly, we also established a $1.1 million valuation
allowance against the deferred tax assets related to these NOL
carry-forwards. Also, previously we established a $1.0 million
valuation allowance for foreign interest deductions that we do not believe we
will be able to utilize.
We have a
defined benefit pension plan for certain of our current and former U.K.
employees. Beginning December 1, 2008, future benefits ceased to accrue for the
remaining active employee participants in the plan concurrent with the
establishment of a defined contribution plan for these employees. Generally, our
cash funding policy is to make the minimum annual contributions required by
applicable regulations. Since the plan’s accumulated benefit
obligations are in excess of the fair value of the plan’s assets (by
approximately $15.0 million as of December 31, 2009), we may be required to use
cash from operations above our historical levels to further fund the plan in the
future.
Off-Balance
Sheet Arrangements
At
December 31, 2009, we had no off-balance sheet arrangements that have or are
likely to have a material current or future effect on our financial
statements.
Our
contractual cash obligations and commitments as of December 31, 2009 are as
follows (in millions):
Payments
Due by Period
|
Contractual
Cash Obligations
|
Total
|
2010
|
2011
|
2012
|
2013
|
2014
|
Thereafter
|
|||||||||||||||||||||
|
Long-term
Debt
|
$ | 493.1 | $ | 4.1 | $ | 4.1 | $ | 384.9 | $ | - | $ | - | $ | 100.0 | ||||||||||||||
|
Interest
(a)
|
97.7 | 15.5 | 15.5 | 15.4 | 8.0 | 8.0 | 35.3 | |||||||||||||||||||||
|
Operating
Leases (b)
|
55.9 | 10.1 | 7.5 | 6.1 | 4.4 | 3.4 | 24.4 | |||||||||||||||||||||
|
Unconditional
Purchase Obligations (c)
|
11.9 | 10.8 | 0.3 | 0.3 | 0.3 | 0.2 | - | |||||||||||||||||||||
|
Estimated
Future Pension Benefit
Obligations (d)
|
70.6 | 2.5 | 2.6 | 2.7 | 2.8 | 2.9 | 57.1 | |||||||||||||||||||||
|
Total
Contractual Cash Obligations
|
$ | 729.2 | $ | 43.0 | $ | 30.0 | $ | 409.4 | $ | 15.5 | $ | 14.5 | $ | 216.8 | ||||||||||||||
|
Other
Commitments
|
Total
|
2010
|
2011
|
2012
|
2013
|
2014
|
Thereafter
|
|||||||||||||||||||||
|
Letters
of Credit
|
$ | 9.9 | $ | 9.9 | $ | - | $ | - | $ | - | $ | - | $ | - | ||||||||||||||
|
Performance
Bonds (e)
|
71.1 | 71.1 | - | - | - | - | - | |||||||||||||||||||||
|
Total
Other Commitments
|
$ | 81.0 | $ | 81.0 | $ | - | $ | - | $ | - | $ | - | $ | - | ||||||||||||||
|
(a)
|
Based
on maintaining existing debt balances to maturity. Interest on
the Credit Agreement varies with LIBOR. The December 31, 2009 blended rate
of 3.2%, including the applicable spread, was used for this
calculation.
|
|
(b)
|
We
lease property and equipment under non-cancelable operating leases for
varying periods.
|
|
(c)
|
We
have long-term contracts to purchase certain amounts of electricity, and a
minimum tonnage of salt under a purchase contract with a supplier. The
price of the salt is dependent on the product purchased and has been
estimated based on an average of the prices in effect for the various
products at December 31, 2009.
|
|
(d)
|
Note
7 to our consolidated financial statements provides additional
information.
|
|
(e)
|
Note
10 to our consolidated financial statements provides additional
information under Sales Contracts. This amount does not include
a $27 million performance bond entered into in 2010, related to a disputed
tax reassessment.
|
Our
ability to make scheduled payments of principal, to pay the interest on, or to
refinance our indebtedness, or to fund planned capital expenditures will depend
on our ability to generate cash in the future. This, to a certain extent, is
subject to general economic, financial, competitive, legislative, regulatory and
other factors that are beyond our control. Based on our current level
of operations, we believe that cash flow from operations and available cash,
together with available borrowings under our Revolving Credit Facility including
any amended, renegotiated or replacement facility, will be adequate to meet our
liquidity needs over the next 12 months.
As a
holding company, CMI’s investments in its operating subsidiaries constitute
substantially all of its assets. Consequently, our subsidiaries conduct all of
our consolidated operations and own substantially all of our operating assets.
The principal source of the cash needed to pay our obligations is the cash
generated from our subsidiaries’ operations and their borrowings. Our
subsidiaries are not obligated to make funds available to
CMI. Furthermore, we must remain in compliance with the terms of our
senior secured credit facilities, including the total leverage ratio and
interest coverage ratio, in order to make payments on our 8% Senior Notes or pay
dividends to our stockholders. We must also comply with the terms of
our indenture, which limits
the
amount of dividends we can pay to our stockholders. Although we are
in compliance with our debt covenants as of December 31, 2009, we cannot assure
you that we will remain in compliance with these ratios nor can we assure you
that the agreements governing the current and future indebtedness of our
subsidiaries will permit our subsidiaries to provide us with sufficient
dividends, distributions or loans to fund scheduled interest payments on the 8%
Senior Notes, when due. If we consummate an acquisition, our debt service
requirements could increase. Furthermore, we may need to refinance all or a
portion of our indebtedness on or before maturity, however we cannot assure you
that we will be able to refinance any of our indebtedness on commercially
reasonable terms or at all.
Sensitivity
Analysis Related to EBITDA and Adjusted EBITDA
Management
uses a variety of measures to evaluate the performance of CMP. While
the consolidated financial statements, taken as a whole, provide an
understanding of our overall results of operations, financial condition and cash
flows, we analyze components of the consolidated financial statements to
identify certain trends and evaluate specific performance areas. In
addition to using U.S. generally accepted accounting principles (“GAAP”)
financial measures, such as gross profit, net earnings and cash flows generated
by operating activities, management uses EBITDA and EBITDA adjusted for items
which management believes are not indicative of the Company’s ongoing operating
performance (“Adjusted EBITDA”), both non-GAAP financial measures to evaluate
the operating performance of our core business operations because our resource
allocation, financing methods and cost of capital, and income tax positions are
managed at a corporate level, apart from the activities of the operating
segments, and the operating facilities are located in different taxing
jurisdictions, which can cause considerable variation in net
income. We also use EBITDA and Adjusted EBITDA to assess our
operating performance and return on capital against other companies, and to
evaluate expected returns on potential acquisitions or other capital
projects. EBITDA and Adjusted EBITDA are not calculated under GAAP
and should not be considered in isolation or as a substitute for net income,
cash flows or other financial data prepared in accordance with GAAP or as a
measure of our overall profitability or liquidity. EBITDA and
Adjusted EBITDA exclude interest expense, income taxes and depreciation and
amortization, each of which are an essential element of our cost structure and
cannot be eliminated. Furthermore, Adjusted EBITDA excludes other
cash and non-cash items including costs to redeem our senior subordinated
discount notes, refinancing costs and other (income) expense. Our
borrowings are a significant component of our capital structure and interest
expense is a continuing cost of debt. We are also required to pay
income taxes, a required and on-going consequence of our
operations. We have a significant investment in capital assets
and depreciation and amortization reflect the utilization of those assets in
order to generate revenues. Consequently, any measure that excludes
these elements has material limitations. While EBITDA and Adjusted
EBITDA are frequently used as measures of operating performance, these terms are
not necessarily comparable to similarly titled measures of other companies due
to the potential inconsistencies in the method of calculation. The
calculation of EBITDA and Adjusted EBITDA as used by management is set forth in
the table below (in millions).
|
For
the Year Ended December 31,
|
||||||||||||
|
2009
|
2008
|
2007
|
||||||||||
|
Net
earnings
|
$ | 163.9 | $ | 159.5 | $ | 80.0 | ||||||
|
Interest
expense
|
25.8 | 41.6 | 54.6 | |||||||||
|
Income
tax expense
|
73.2 | 67.5 | 0.1 | |||||||||
|
Depreciation,
depletion and amortization
|
43.7 | 41.4 | 40.0 | |||||||||
|
EBITDA
|
$ | 306.6 | $ | 310.0 | $ | 174.7 | ||||||
|
Other
non-operating expenses:
|
||||||||||||
|
Tender
and call premiums and fees paid to redeem debt
|
4.1 | 5.4 | 9.4 | |||||||||
|
Write-off
of unamortized deferred financing fees
|
0.9 | 1.1 | 1.6 | |||||||||
|
Other
(income) expense, net
|
2.3 | (0.9 | ) | (1.4 | ) | |||||||
|
Adjusted
EBITDA
|
$ | 313.9 | $ | 315.6 | $ | 184.3 | ||||||
During
2009, we refinanced our 12% Senior Subordinated Discount Notes with 8% Senior
Notes. During 2008, we redeemed $90 million of our 12% Senior
Subordinated Discount Notes. During 2007, we completed a tender offer
and redeemed our 12¾% senior discount notes. We expensed $0.9 million
in 2009, $1.1 million in 2008 and $1.6 million in 2007 of deferred financing
costs and expensed $4.1 million in 2009, $5.4 million in 2008 and $9.4 million
in 2007 of call or tender premiums and related fees. EBITDA also
includes other non-operating income, primarily foreign exchange gains (losses)
resulting from the translation of intercompany obligations, interest income and
investment income (loss) relating to our nonqualified retirement plan totaling
$(2.3) million, $0.9 million and $1.4 million for 2009, 2008 and 2007,
respectively.
Management’s
Discussion of Critical Accounting Policies and Estimates
The
preparation of the consolidated financial statements in conformity with U.S.
GAAP requires management to make estimates and assumptions that affect the
reported amounts of assets and liabilities as of the reporting date and the
reported
amounts
of revenue and expenses during the reporting period. Actual results
could vary from these estimates. We have identified the critical accounting
policies and estimates that are most important to the portrayal of our financial
condition and results of operations. The policies set forth below require
management’s most subjective or complex judgments, often as a result of the need
to make estimates about the effect of matters that are inherently
uncertain.
Mineral Interests - As of
December 31, 2009, we maintained $139.8 million of net mineral properties as a
part of property, plant and equipment. Mineral interests include
probable mineral reserves. We lease mineral reserves at several of our
extraction facilities. These leases have varying terms and many provide for a
royalty payment to the lessor based on a specific amount per ton of mineral
extracted or as a percentage of revenue.
Mineral
interests are primarily amortized on a units-of-production method based on
third-party estimates of recoverable reserves. Our rights to extract minerals
are generally contractually limited by time or lease boundaries. If we are not
able to continue to extend lease agreements, as we have in the past, at
commercially reasonable terms, without incurring substantial costs or incurring
material modifications to the existing lease terms and conditions, the assigned
lives may be less than those projected by management, or if the actual size,
quality or recoverability of the minerals is less than the estimated probable
reserves, then the rate of amortization could be increased or the value of the
reserves could be reduced by a material amount.
Income Taxes – Developing our
provision for income taxes and analyzing our potential tax exposure items
requires significant judgment and assumptions as well as a thorough knowledge of
the tax laws in various jurisdictions. These estimates and judgments
occur in the calculation of certain tax liabilities and in the assessment of the
likelihood that we will be able to realize our deferred tax assets, which arise
from temporary differences between the tax and financial statement recognition
of revenue and expense, carry-forwards and other items. Based on all
available evidence, both positive and negative, the weight of that evidence and
the extent such evidence can be objectively verified, we determine whether it is
more likely than not that all, or a portion of, the deferred tax assets will be
realized.
In
evaluating our ability to realize our deferred tax assets, we consider the
sources and timing of taxable income, our ability to carry back tax attributes
to prior periods, qualifying tax planning, and estimates of future taxable
income exclusive of reversing temporary differences. In determining future
taxable income, our assumptions include the amount of pre-tax operating income
according to different federal, international and state taxing jurisdictions,
the origination of future temporary differences, and the implementation of
feasible and prudent tax planning. These assumptions require significant
judgment about material estimates, assumptions and uncertainties in connection
with the forecasts of future taxable income, the merits in tax law and
assessments regarding previous taxing authorities’ proceedings or written
rulings, and, while they are consistent with the plans and estimates we use to
manage the underlying businesses, differences in our actual operating results or
changes in our tax planning, tax credits or our assessment of the tax merits of
our positions could affect our future assessments.
As of
December 31, 2009 we had $8.3 million of deferred tax assets relating to U.S.
and foreign NOL carry-forwards and $10.0 million of alternative minimum tax
credit carry-forwards that can be used to reduce our future tax
liabilities. However, after our analysis of the potential realization
of our deferred tax assets at December 31, 2009, we concluded that a valuation
allowance of $1.6 million was required related to our U.S. and foreign NOL
carry-forwards because management believes they will not be
realized. In the future, if we determine, based on the existence of
sufficient evidence, that more or less of our deferred tax assets are
more-likely-than-not to be realized, an adjustment to the valuation allowance
will be made in the period such a determination is made. The actual amount of
the deferred tax assets realized could ultimately be materially different from
those recorded, as impacted by changes in income tax laws and actual operating
results that differ from forecasted amounts.
In
addition, the calculation of our tax liabilities involves uncertainties in the
application of complex tax regulations in multiple jurisdictions. We recognize
potential liabilities in accordance with applicable U.S. GAAP for anticipated
tax issues in the U.S. and other tax jurisdictions based on our estimate of
whether, and the extent to which, additional taxes will be due. If payment of
these amounts ultimately proves to be unnecessary, the reversal of the
liabilities would result in tax benefits being recognized in the period when we
determine the liabilities are no longer necessary. If our estimate of tax
liabilities proves to be less than the ultimate assessment, a further charge to
expense would result.
Taxes on Foreign Earnings -
Our effective tax rate reflects the impact of undistributed foreign
earnings for which no U.S. taxes have been provided because such earnings are
planned to be reinvested indefinitely outside the U.S. Most of the
amounts held outside the U.S. could be repatriated to the U.S., but would be
subject to U.S. federal income taxes and foreign withholding taxes, less
applicable foreign tax credits or deductions.
U.K. Pension Plan - We have a
defined benefit pension plan covering some of our current and former employees
in the United Kingdom. The U.K. plan was closed to new participants in 1992. As
we elected to freeze the plan, we ceased to accrue future benefits under the
plan beginning December 1, 2008. We select our actuarial assumptions for our
pension plan after consultation with our actuaries and consideration of market
conditions. These assumptions include the discount rate and the expected
long-term rates of return on plan assets, which are used in the calculation of
the actuarial valuation of our defined benefit pension plans. If actual
conditions or results vary from those projected by management, adjustments may
be required in future periods to meet minimum pension funding, or to increase
pension expense or our pension liability. An adverse change of 25
basis points in our discount rate and return on plan assets assumptions,
collectively, would cause an increase in our projected benefit obligation as of
December 31, 2009 of $2.5 million and net periodic pension cost for 2010 of
approximately $0.2 million, respectively.
We set
our discount rate for the U.K. plan based on a forward yield curve for a
portfolio of high credit quality bonds with expected cash flows and an average
duration closely matching the expected benefit payments under our plan. The
assumption for the return on plan assets is determined based on expected returns
applicable to each type of investment within the portfolio expected to be
maintained over approximately the next 20 years. Our funding policy
has been to make the minimum annual contributions required by applicable
regulations although special payments have been made during some years when
changes in the business, which could reasonably impact the plan’s available
assets or when special early-retirement payments or other inducements are made
to pensioners. Contributions totaled $0.7 million, $2.3 million and $1.4 million
during the years ended December 31, 2009, 2008 and 2007,
respectively. If supplemental benefits were approved and granted
under the provisions of the Plan or if periodic statutory valuations cause a
change in funding requirements, our contributions could increase to fund all or
a portion of those benefits. See Note 7 to the consolidated financial
statements for additional discussion of our pension plan.
Other Significant Accounting
Policies - Other significant accounting policies not involving the same
level of measurement uncertainties as those discussed above are nevertheless
important to an understanding of our financial statements. Policies related to
revenue recognition, allowance for doubtful accounts, valuation of equity
compensation instruments, derivative instruments and environmental accruals
require difficult judgments on complex matters. Certain of these matters are
among topics frequently discussed by accounting standards setters and
regulators.
Effects
of Currency Fluctuations and Inflation
In
addition to the United States, we conduct operations in Canada and the United
Kingdom. Therefore, our results of operations are subject to both currency
transaction risk and currency translation risk. We incur currency transaction
risk whenever we or one of our subsidiaries enter into either a purchase or
sales transaction using a currency other than the local currency of the
transacting entity. With respect to currency translation risk, our financial
condition and results of operations are measured and recorded in the relevant
local currency and then translated into U.S. dollars for inclusion in our
historical consolidated financial statements. Exchange rates between these
currencies and the U.S. dollar have fluctuated significantly from time to time
and may do so in the future. The majority of our revenues and costs are
denominated in U.S. dollars, with pounds sterling and Canadian dollars also
being significant. We generated 28% of our 2009 sales in foreign currencies, and
we incurred 30% of our 2009 total operating expenses in foreign currencies.
Additionally, we have $236.2 million of net assets denominated in foreign
currencies. The U.S. dollar weakened against these currencies from 2006 through
the first half of 2008, which has had a positive impact on our total assets,
sales and operating earnings. During the second half of 2008, the U.S. dollar
strengthened, which negatively impacted total assets, sales and operating
earnings reported in U.S. dollars during that period. During 2009,
the U.S. dollar weakened against these same currencies, which also had a
positive impact on our reported assets, sales and operating
earnings. Significant changes in the value of the Canadian dollar or
pound sterling relative to the U.S. dollar could have a material adverse effect
on our financial condition and our ability to meet interest and principal
payments on U.S. dollar denominated debt, including borrowings under our senior
secured credit facilities.
Although
inflation has not had a significant impact on the Company’s operations, our
efforts to recover cost increases due to inflation may be hampered as a result
of the competitive industries in which we operate.
Seasonality
We
experience a substantial amount of seasonality in our sales, primarily with
respect to our deicing products. Consequently, sales and operating
income are generally higher in the first and fourth quarters and lower during
the second and third quarters of each year. In particular, sales of highway and
consumer deicing salt and magnesium chloride products vary based on the severity
of the winter conditions in areas where the product is used. Following industry
practice in North America, we stockpile sufficient quantities of deicing salt in
the second, third and fourth quarters to meet the estimated requirements for the
winter season.
Recent
Accounting Pronouncements
In June,
2009, the FASB issued the “FASB Accounting Standards Codification and Hierarchy
of Generally Accepted Accounting Principles, a replacement of FASB Statement No.
162” to establish the FASB Accounting Standards Codification (“Codification”) as
the single source for authoritative nongovernmental U.S. GAAP. The Securities
and Exchange Commission (“SEC”) rules and interpretive releases are also
considered sources of authoritative GAAP. This guidance supersedes
all prior accounting and reporting standards issued by entities other than the
SEC. The Codification was effective for the Company in the third
quarter of 2009 and did not have a material impact on its consolidated financial
statements.
|
ITEM
7A.
|
QUANTITATIVE AND QUALITATIVE DISCLOSURES ABOUT MARKET
RISK
|
Our
business is subject to various types of market risks that include, but are not
limited to, interest rate risk, foreign currency translation risk and commodity
pricing risk. Management may take actions to mitigate our exposure to these
types of risks including entering into forward purchase contracts and other
financial instruments. However, there can be no assurance that our
hedging
activities will eliminate or substantially reduce these risks. We do not enter
into any financial instrument arrangements for speculative
purposes.
Interest
Rate Risk
As of
December 31, 2009 we had $393.1 million of debt outstanding under our Term
Loans, bearing interest at variable rates. As described in Note 9 to
the consolidated financial statements, we are a party to interest rate swap
agreements to hedge the variability in interest rates relative to $150 million
notional amount of our Term Loans and Incremental Term Loan, declining by $50
million in March 2010, $50 million in December 2010 with the remaining $50
million maturing in March 2011. Accordingly, our earnings and cash
flows will be affected by changes in interest rates to the extent the principal
balance is unhedged. Assuming no change in the amount of Term Loan or
Revolver outstanding, a one hundred basis point increase in the average interest
rate under these borrowings would increase the interest expense related to the
unhedged portion of our variable rate debt by approximately $2.4 million based
upon our debt outstanding as of December 31, 2009. Actual results may
vary due to changes in the amount of variable rate debt
outstanding.
As of
December 31, 2009, a majority of the investments in the U.K. pension plan are in
debt securities. Changes in interest rates could impact the value of
the investments in the pension plan.
Foreign
Currency Risk
In
addition to the United States, we conduct our business in Canada and the United
Kingdom. Our operations are, therefore, subject to volatility because of
currency fluctuations, inflation changes and changes in political and economic
conditions in these countries. Sales and expenses are frequently denominated in
local currencies and results of operations may be affected adversely as currency
fluctuations affect our product prices and operating costs or those of our
competitors. We may engage in hedging operations, including forward foreign
currency exchange contracts, to reduce the exposure of our cash flows to
fluctuations in foreign currency exchange rates. We will not engage in hedging
for speculative investment purposes. Our historical results do not reflect any
foreign currency exchange hedging activity. There can be no assurance that any
hedging operations will eliminate or substantially reduce risks associated with
fluctuating currencies. See Item 1A, “Risk Factors — Economic and other risks
associated with international sales and operations could adversely affect our
business, including economic loss and a negative impact on
earnings.”
Considering
our foreign earnings, a hypothetical 10% unfavorable change in the exchange
rates compared to the U.S. dollar would have an estimated $3.2 million impact on
operating earnings for the year ended December 31, 2009. Actual changes in
market prices or rates will differ from hypothetical changes.
Commodity
Pricing Risk: Commodity Derivative Instruments and Hedging
Activities
We have a
hedging policy to mitigate the impact of fluctuations in the price of natural
gas. The notional amounts of volumes hedged are determined based on a
combination of factors including estimated natural gas usage, current market
prices and historical market prices. We enter into contractual natural gas price
swaps, which effectively fix the purchase price of our natural gas requirements
up to 36 months in advance of the physical purchase of the natural gas, and we
hedge up to approximately 90% of our expected natural gas
usage. Because of the varying locations of our production facilities,
we also enter into basis swap agreements to eliminate any further price
variation due to local market differences. We have determined that
these financial instruments qualify as cash flow hedges under U.S. GAAP. As of
December 31, 2009, the amount of natural gas hedged with derivative contracts
totaled 5.2 million mmbtus, of which 2.7 million expire within one year and 2.5
million expire in years two and three.
Excluding
natural gas hedged with derivative instruments, a hypothetical 10% adverse
change in our natural gas prices during the year ended December 31, 2009 would
have increased our cost of sales by approximately $0.2 million. Actual results
will vary due to actual changes in market prices and consumption.
We are
subject to increases and decreases in the cost of transporting our products due
to variations in our contracted carriers’ cost of fuel, which is typically
diesel fuel. We may engage in hedging operations, including forward contracts,
to reduce our exposure to changes in our transportation cost due to changes in
the cost of fuel in the future. Due to the difficulty in meeting all of the
requirements for hedge accounting under current U.S. GAAP, any such cash flow
hedges of transportation costs would likely be accounted for by marking the
hedges to market at each reporting period. We will not engage in
hedging for speculative investment purposes. Our historical results do not
reflect any direct fuel hedging activity. There can be no assurance that any
hedging operations will eliminate or substantially reduce the risks associated
with changes in our transportation costs.
|
ITEM
8.
|
FINANCIAL STATEMENTS AND SUPPLEMENTARY
DATA
|
|
Description
|
Page
|
|||
| 39 | ||||
| 41 | ||||
| 42 | ||||
| 43 | ||||
| 44 | ||||
| 45 | ||||
Report
of Independent Registered Public Accounting Firm
The Board
of Directors and Stockholders of Compass Minerals International,
Inc.
We have
audited the accompanying consolidated balance sheets of Compass Minerals
International, Inc. as of December 31, 2009 and 2008 and the related
consolidated statements of operations, stockholders’ equity (deficit), and cash
flows for each of the three years in the period ended December 31,
2009. Our audits also included the financial statement schedule
listed at Item 15(a)(2). These financial statements and schedule are
the responsibility of the Company's management. Our responsibility is
to express an opinion on these financial statements and schedule based on our
audits.
We
conducted our audits in accordance with the standards of the Public Company
Accounting Oversight Board (United States). Those standards require that we plan
and perform the audit to obtain reasonable assurance about whether the financial
statements are free of material misstatement. An audit includes examining, on a
test basis, evidence supporting the amounts and disclosures in the financial
statements. An audit also includes assessing the accounting principles used and
significant estimates made by management, as well as evaluating the overall
financial statement presentation. We believe that our audits provide
a reasonable basis for our opinion.
In our
opinion, the financial statements referred to above present fairly, in all
material respects, the consolidated financial position of Compass Minerals
International, Inc. at December 31, 2009 and 2008, and the consolidated results
of its operations and its cash flows for each of the three years in the period
ended December 31, 2009, in conformity with U.S. generally accepted accounting
principles. Also, in our opinion, the related financial statement
schedule, when considered in relation to the basic financial statements taken as
a whole, presents fairly in all material respects the information set forth
therein.
We also
have audited, in accordance with the standards of the Public Company Accounting
Oversight Board (United States), Compass Minerals International, Inc.’s internal
control over financial reporting as of December 31, 2009, based on criteria
established in Internal Control-Integrated Framework issued by the Committee of
Sponsoring Organizations of the Treadway Commission and our report dated
February 22, 2010 expressed an unqualified opinion thereon.
/s/ Ernst & Young
LLP
Kansas
City, Missouri
February
22, 2010
Report
of Independent Registered Public Accounting
Firm
The Board
of Directors and Stockholders of Compass Minerals International,
Inc.
We have
audited Compass Minerals International, Inc’s. internal control over financial
reporting as of December 31, 2009, based on criteria established in Internal
Control—Integrated Framework issued by the Committee of Sponsoring Organizations
of the Treadway Commission (the COSO criteria). Compass Minerals International,
Inc.’s management is responsible for maintaining effective internal control over
financial reporting and for its assessment of the effectiveness of internal
control over financial reporting included in the accompanying Management’s
Report on Internal Control over Financial Reporting. Our responsibility is to
express an opinion on the company’s internal control over financial reporting
based on our audit.
We
conducted our audit in accordance with the standards of the Public Company
Accounting Oversight Board (United States). Those standards require that we plan
and perform the audit to obtain reasonable assurance about whether effective
internal control over financial reporting was maintained in all material
respects. Our audit included obtaining an understanding of internal control over
financial reporting, assessing the risk that a material weakness exists, testing
and evaluating the design and operating effectiveness of internal control based
on the assessed risk, and performing such other procedures as we considered
necessary in the circumstances. We believe that our audit provides a reasonable
basis for our opinion.
A
company’s internal control over financial reporting is a process designed to
provide reasonable assurance regarding the reliability of financial reporting
and the preparation of financial statements for external purposes in accordance
with generally accepted accounting principles. A company’s internal control over
financial reporting includes those policies and procedures that (1) pertain to
the maintenance of records that, in reasonable detail, accurately and fairly
reflect the transactions and dispositions of the assets of the company; (2)
provide reasonable assurance that transactions are recorded as necessary to
permit preparation of financial statements in accordance with generally accepted
accounting principles, and that receipts and expenditures of the company are
being made only in accordance with authorizations of management and directors of
the company; and (3) provide reasonable assurance regarding prevention or timely
detection of unauthorized acquisition, use, or disposition of the company’s
assets that could have a material effect on the financial
statements.
Because
of its inherent limitations, internal control over financial reporting may not
prevent or detect misstatements. Also, projections of any evaluation
of effectiveness to future periods are subject to the risk that controls may
become inadequate because of changes in conditions, or that the degree of
compliance with the policies or procedures may deteriorate.
In our
opinion, Compass Minerals International, Inc. maintained, in all material
respects, effective internal control over financial reporting as of December 31,
2009, based on the
COSO criteria.
We also
have audited, in accordance with the standards of the Public Company Accounting
Oversight Board (United States), the consolidated balance sheets of Compass
Minerals International, Inc. as of December 31, 2009 and 2008, and the related
consolidated statements of operations, stockholders’ equity (deficit), and cash
flows for each of the three years in the period ended December 31, 2009 of
Compass Minerals International, Inc. and our report dated February 22, 2010
expressed an unqualified opinion thereon.
/s/ Ernst & Young
LLP
Kansas
City, Missouri
February
22, 2010
|
Consolidated
Balance Sheets
|
||||||||
|
December
31,
|
||||||||
|
(In
millions, except share data)
|
2009
|
2008
|
||||||
|
ASSETS
|
||||||||
|
Current
assets:
|
||||||||
|
Cash
and cash equivalents
|
$ | 13.5 | $ | 34.6 | ||||
|
Receivables,
less allowance for doubtful accounts of $2.5 in 2009 and
2008
|
167.5 | 210.4 | ||||||
|
Inventories
|
273.2 | 123.3 | ||||||
|
Deferred
income taxes, net
|
17.7 | 12.5 | ||||||
|
Other
|
11.5 | 9.7 | ||||||
|
Total
current assets
|
483.4 | 390.5 | ||||||
|
Property,
plant and equipment, net
|
463.8 | 383.1 | ||||||
|
Intangible
assets, net
|
19.7 | 20.4 | ||||||
|
Other
|
36.9 | 28.6 | ||||||
|
Total
assets
|
$ | 1,003.8 | $ | 822.6 | ||||
|
LIABILITIES
AND STOCKHOLDERS' EQUITY
|
||||||||
|
Current
liabilities:
|
||||||||
|
Current
portion of long-term debt
|
$ | 4.1 | $ | 4.1 | ||||
|
Accounts
payable
|
95.7 | 98.9 | ||||||
|
Accrued
expenses
|
46.7 | 57.5 | ||||||
|
Accrued
salaries and wages
|
15.2 | 23.1 | ||||||
|
Income
taxes payable
|
21.9 | 29.8 | ||||||
|
Accrued
interest
|
1.0 | 2.1 | ||||||
|
Total
current liabilities
|
184.6 | 215.5 | ||||||
|
Long-term
debt, net of current portion
|
486.6 | 491.6 | ||||||
|
Deferred
income taxes, net
|
55.0 | 21.6 | ||||||
|
Other
noncurrent liabilities
|
54.5 | 29.4 | ||||||
|
Commitments
and contingencies (Note 10)
|
||||||||
|
Stockholders'
equity:
|
||||||||
|
Common
Stock:
|
||||||||
|
$0.01
par value, authorized shares - 200,000,000; issued shares -
35,367,264
|
0.4 | 0.4 | ||||||
|
Additional
paid-in capital
|
11.7 | 2.2 | ||||||
| Treasury stock, at cost - 2,724,083 shares at December 31, 2009 and 2,929,654 shares at December 31, 2008 | (5.2 | ) | (5.6 | ) | ||||
|
Retained
earnings
|
185.0 | 68.3 | ||||||
|
Accumulated
other comprehensive income (loss)
|
31.2 | (0.8 | ) | |||||
|
Total
stockholders' equity
|
223.1 | 64.5 | ||||||
|
Total
liabilities and stockholders' equity
|
$ | 1,003.8 | $ | 822.6 | ||||
|
The
accompanying notes are an integral part of the consolidated financial
statements.
|
|
Consolidated
Statements of Operations
|
||||||||||||
|
For
the Year Ended December 31,
|
||||||||||||
|
(In
millions, except share data)
|
2009
|
2008
|
2007
|
|||||||||
|
Sales
|
$ | 963.1 | $ | 1,167.7 | $ | 857.3 | ||||||
|
Shipping
and handling cost
|
249.3 | 341.1 | 252.9 | |||||||||
|
Product
cost
|
359.7 | 470.4 | 392.4 | |||||||||
|
Gross profit
|
354.1 | 356.2 | 212.0 | |||||||||
|
Selling,
general and administrative expenses
|
83.9 | 82.0 | 67.7 | |||||||||
|
Operating earnings
|
270.2 | 274.2 | 144.3 | |||||||||
|
Other
expense:
|
||||||||||||
|
Interest expense
|
25.8 | 41.6 | 54.6 | |||||||||
|
Other, net
|
7.3 | 5.6 | 9.6 | |||||||||
|
Earnings before income taxes
|
237.1 | 227.0 | 80.1 | |||||||||
|
Income
tax expense
|
73.2 | 67.5 | 0.1 | |||||||||
|
Net earnings
|
$ | 163.9 | $ | 159.5 | $ | 80.0 | ||||||
|
Basic
net earnings per common share
|
$ | 4.93 | $ | 4.82 | $ | 2.44 | ||||||
|
Diluted
net earnings per common share
|
$ | 4.92 | $ | 4.81 | $ | 2.43 | ||||||
|
Weighted-average
common shares outstanding (in thousands):
|
||||||||||||
|
Basic
|
32,574 | 32,407 | 32,248 | |||||||||
|
Diluted
|
32,596 | 32,477 | 32,369 | |||||||||
|
Cash
dividends per share
|
$ | 1.42 | $ | 1.34 | $ | 1.28 | ||||||
|
The
accompanying notes are an integral part of the consolidated financial
statements.
|
||||||||||||
|
Consolidated Statements of Stockholders' Equity
(Deficit)
|
||||||||||||||||||||||||
|
Retained
|
Accumulated
|
|||||||||||||||||||||||
|
Additional
|
Earnings
|
Other
|
||||||||||||||||||||||
|
Common
|
Paid
In
|
Treasury
|
(Accumulated
|
Comprehensive
|
||||||||||||||||||||
|
(In
millions)
|
Stock
|
Capital
|
Stock
|
Deficit)
|
Income
(Loss)
|
Total
|
||||||||||||||||||
|
Balance,
December 31, 2006
|
$ | 0.4 | $ | 0.3 | $ | (6.2 | ) | $ | (95.4 | ) | $ | 35.8 | $ | (65.1 | ) | |||||||||
|
Comprehensive
income:
|
||||||||||||||||||||||||
|
Net
earnings
|
80.0 | 80.0 | ||||||||||||||||||||||
|
Change
in unrealized pension costs, net of tax of ($1.8)
|
4.4 | 4.4 | ||||||||||||||||||||||
|
Unrealized
loss on cash flow hedges, net of tax of $0.1
|
(0.2 | ) | (0.2 | ) | ||||||||||||||||||||
|
Cumulative
translation adjustment
|
13.5 | 13.5 | ||||||||||||||||||||||
|
Comprehensive
income
|
97.7 | |||||||||||||||||||||||
|
Dividends
on common stock
|
(2.9 | ) | (39.1 | ) | (42.0 | ) | ||||||||||||||||||
|
Income
tax benefits from equity awards
|
1.8 | 1.8 | ||||||||||||||||||||||
|
Stock
options exercised
|
(0.1 | ) | 0.5 | 0.4 | ||||||||||||||||||||
|
Stock-based
compensation
|
2.6 | 2.6 | ||||||||||||||||||||||
|
Balance,
December 31, 2007
|
0.4 | 1.7 | (5.7 | ) | (54.5 | ) | 53.5 | (4.6 | ) | |||||||||||||||
|
Comprehensive
income:
|
||||||||||||||||||||||||
|
Net
earnings
|
159.5 | 159.5 | ||||||||||||||||||||||
|
Change
in unrealized pension costs, net of tax of ($0.6)
|
1.5 | 1.5 | ||||||||||||||||||||||
|
Unrealized
loss on cash flow hedges, net of tax of $4.4
|
(7.1 | ) | (7.1 | ) | ||||||||||||||||||||
|
Cumulative
translation adjustment
|
(48.7 | ) | (48.7 | ) | ||||||||||||||||||||
|
Comprehensive
income
|
105.2 | |||||||||||||||||||||||
|
Dividends
on common stock
|
(7.6 | ) | (36.7 | ) | (44.3 | ) | ||||||||||||||||||
|
Income
tax benefits from equity awards
|
3.1 | 3.1 | ||||||||||||||||||||||
|
Stock
options exercised
|
1.7 | 0.1 | 1.8 | |||||||||||||||||||||
|
Stock-based
compensation
|
3.3 | 3.3 | ||||||||||||||||||||||
|
Balance,
December 31, 2008
|
0.4 | 2.2 | (5.6 | ) | 68.3 | (0.8 | ) | 64.5 | ||||||||||||||||
|
Comprehensive
income:
|
||||||||||||||||||||||||
|
Net
earnings
|
163.9 | 163.9 | ||||||||||||||||||||||
|
Change
in unrealized pension costs, net of tax of $4.5
|
(11.6 | ) | (11.6 | ) | ||||||||||||||||||||
|
Unrealized
loss on cash flow hedges, net of tax of $(3.5)
|
5.7 | 5.7 | ||||||||||||||||||||||
|
Cumulative
translation adjustment
|
37.9 | 37.9 | ||||||||||||||||||||||
|
Comprehensive
income
|
195.9 | |||||||||||||||||||||||
|
Dividends
on common stock
|
(47.2 | ) | (47.2 | ) | ||||||||||||||||||||
|
Shares
issued for restricted stock units, net of shares
withheld
for employee taxes
|
(1.1 | ) | (1.1 | ) | ||||||||||||||||||||
|
Income
tax benefits from equity awards
|
3.2 | 3.2 | ||||||||||||||||||||||
|
Stock
options exercised
|
2.9 | 0.4 | 3.3 | |||||||||||||||||||||
|
Stock-based
compensation
|
4.5 | 4.5 | ||||||||||||||||||||||
|
Balance,
December 31, 2009
|
$ | 0.4 | $ | 11.7 | $ | (5.2 | ) | $ | 185.0 | $ | 31.2 | $ | 223.1 | |||||||||||
|
The
accompanying notes are an integral part of the consolidated financial
statements.
|
||||||||||||||||||||||||
|
Consolidated
Statements of Cash Flows
|
||||||||||||
|
For
the Year Ended December 31,
|
||||||||||||
|
(In
millions)
|
2009
|
2008
|
2007
|
|||||||||
|
Cash
flows from operating activities:
|
||||||||||||
|
Net earnings
|
$ | 163.9 | $ | 159.5 | $ | 80.0 | ||||||
|
Adjustments to reconcile net earnings to net cash flows provided by
operating activities:
|
||||||||||||
|
Depreciation, depletion and amortization
|
43.7 | 41.4 | 40.0 | |||||||||
|
Finance fee amortization
|
1.2 | 1.2 | 1.3 | |||||||||
|
Loss on early extinguishment of long-term debt
|
5.0 | 6.5 | 11.0 | |||||||||
|
Stock-based compensation
|
4.5 | 3.3 | 2.6 | |||||||||
|
Accreted interest
|
- | 8.5 | 30.4 | |||||||||
|
Deferred income taxes
|
25.6 | 16.2 | (0.3 | ) | ||||||||
|
Other, net
|
1.6 | (0.4 | ) | 1.2 | ||||||||
|
Changes in operating assets and liabilities:
|
||||||||||||
|
Receivables
|
44.0 | (11.5 | ) | (89.2 | ) | |||||||
|
Inventories
|
(146.9 | ) | (5.7 | ) | 22.7 | |||||||
|
Other assets
|
1.0 | (2.8 | ) | 0.4 | ||||||||
|
Accounts payable, income taxes payable and accrued
expenses
|
(30.1 | ) | 48.1 | 37.4 | ||||||||
|
Other liabilities
|
5.4 | (10.2 | ) | (19.0 | ) | |||||||
|
Net
cash provided by operating activities
|
118.9 | 254.1 | 118.5 | |||||||||
|
Cash
flows from investing activities:
|
||||||||||||
|
Capital expenditures
|
(94.1 | ) | (67.8 | ) | (48.0 | ) | ||||||
|
Acquisition of a business
|
(3.6 | ) | - | (7.6 | ) | |||||||
|
Other, net
|
(1.2 | ) | 1.1 | (0.3 | ) | |||||||
|
Net
cash used in investing activities
|
(98.9 | ) | (66.7 | ) | (55.9 | ) | ||||||
|
Cash
flows from financing activities:
|
||||||||||||
|
Proceeds from the issuance of long-term debt
|
97.5 | - | 127.0 | |||||||||
|
Principal payments on long-term debt
|
(93.9 | ) | (94.2 | ) | (153.9 | ) | ||||||
|
Revolver activity, net
|
(8.6 | ) | (23.3 | ) | 18.6 | |||||||
|
Tender and call premiums and fees paid to redeem debt
|
(4.1 | ) | (5.4 | ) | (9.4 | ) | ||||||
|
Dividends paid
|
(47.2 | ) | (44.3 | ) | (42.0 | ) | ||||||
|
Proceeds received from stock option exercises
|
3.3 | 1.8 | 0.4 | |||||||||
|
Excess tax benefits from stock option exercises
|
3.2 | 3.1 | 1.8 | |||||||||
|
Deferred financing costs
|
(2.4 | ) | - | (1.6 | ) | |||||||
|
Other
|
(1.1 | ) | - | - | ||||||||
|
Net
cash used in financing activities
|
(53.3 | ) | (162.3 | ) | (59.1 | ) | ||||||
|
Effect
of exchange rate changes on cash and cash equivalents
|
12.2 | (2.6 | ) | 1.2 | ||||||||
|
Net
change in cash and cash equivalents
|
(21.1 | ) | 22.5 | 4.7 | ||||||||
|
Cash
and cash equivalents, beginning of the year
|
34.6 | 12.1 | 7.4 | |||||||||
|
Cash
and cash equivalents, end of year
|
$ | 13.5 | $ | 34.6 | $ | 12.1 | ||||||
|
Supplemental
cash flow information:
|
||||||||||||
|
Interest paid
|
$ | 27.1 | $ | 31.9 | $ | 28.0 | ||||||
|
Income taxes paid, net of refunds
|
52.6 | 26.5 | 17.7 | |||||||||
|
The
accompanying notes are an integral part of the consolidated financial
statements.
|
||||||||||||
Notes to Consolidated Financial Statements
|
1.
|
ORGANIZATION
AND FORMATION
|
Compass
Minerals International, Inc., through its subsidiaries (“CMP”, “Compass
Minerals”, or the “Company”), is a producer and marketer of inorganic mineral
products with manufacturing sites in North America and the United Kingdom. Its
principal products are salt, consisting of sodium chloride and magnesium
chloride, and sulfate of potash (“SOP”), a specialty fertilizer. The
Company provides highway deicing products to customers in North America and the
United Kingdom, and specialty fertilizer to growers worldwide. The
Company also produces and markets consumer deicing and water conditioning
products, ingredients used in consumer and commercial foods, and other
mineral-based products for consumer, agricultural and industrial
applications. Compass Minerals also provides records management
services to businesses located in the U.K.
Compass
Minerals International, Inc. is a holding company with no operations other than
those of its wholly-owned subsidiaries. Until December 2007, CMP
owned 100% of Compass Minerals Group, Inc. (“CMG”), a holding company through
which CMP owned its operating subsidiaries. Through December 2007,
CMG was also the party to the Company’s senior secured credit
agreement. In December 2007, CMG was merged with and into Compass
Minerals International, Inc.
|
2.
|
SUMMARY
OF SIGNIFICANT ACCOUNTING POLICIES
|
a.
Management Estimates:
The
preparation of financial statements in conformity with U.S. generally accepted
accounting principles (“GAAP”) as included in the Accounting Standards
Codification requires management to make estimates and assumptions that affect
the amounts reported in the consolidated financial statements and accompanying
notes. Actual results could differ from those estimates.
b. Basis of
Consolidation:
The
Company’s consolidated financial statements include the accounts of Compass
Minerals International, Inc. and its wholly-owned domestic and foreign
subsidiaries. All significant intercompany balances and transactions
have been eliminated in consolidation.
c.
Reclassifications:
The
Company has made reclassifications of prior year balances in accounts payable
and accrued expenses in its Consolidated Balance Sheets to more accurately
reflect the nature of certain liabilities. In addition, the Company
has disaggregated certain prior year amounts in its Consolidated Statement of
Stockholders’ Equity to conform to current year presentation.
d.
Foreign Currency Translation
Assets
and liabilities are translated into U.S. dollars at end of period exchange
rates. Revenues and expenses are translated using the monthly average rates of
exchange during the year. Adjustments resulting from the translation of
foreign-currency financial statements into the reporting currency, U.S. dollars,
are included in accumulated other comprehensive income (loss). Aggregate
exchange gains (losses) from transactions denominated in a currency other than
the functional currency, which are included in other expense for the years ended
December 31, 2009, 2008 and 2007, were $(3.8) million, $0.5 million and $0.1
million, respectively.
e.
Revenue Recognition:
The Company recognizes
revenue at the time of shipment to the customer, which coincides with the
transfer of title and risk of ownership to the customer. Sales represent
billings to customers net of sales taxes charged for the sale of the product.
Sales include amounts charged to customers for shipping and handling costs,
which are expensed when the related product is sold.
f.
Cash and Cash Equivalents:
The
Company considers all investments with original maturities of three months or
less to be cash equivalents. The Company maintains the majority of its cash in
bank deposit accounts with several commercial banks with high credit ratings in
the U.S., Canada and Europe. Typically, the Company has bank deposits in excess
of federally insured limits. Currently, the Company does not believe
it is exposed to significant credit risk on its cash and cash
equivalents.
g.
Accounts Receivable and Allowance for Doubtful Accounts:
Receivables
consist almost entirely of trade accounts receivable. Trade accounts receivable
are recorded at the invoiced amount and do not bear interest. The allowance for
doubtful accounts is our best estimate of the amount of probable credit losses
in our existing accounts receivable. The Company determines the allowance based
on historical write-off experience by business line. The Company reviews its
past due account balances for collectibility and adjusts its allowance for
doubtful accounts accordingly. Account balances are charged off against the
allowance when the Company believes it is probable that the receivable will not
be recovered.
h.
Inventories:
Inventories
are stated at the lower of cost or market. Finished goods and raw material and
supply costs are valued using the average cost method. Raw materials and
supplies primarily consist of raw materials purchased to aid in the production
of our mineral products, maintenance materials and packaging materials. Finished
goods are comprised of salt, potassium chloride, magnesium chloride and
specialty fertilizer products readily available for sale. All costs associated
with the production of finished goods at our producing locations are captured as
inventory costs. Additionally, since our products are often stored at
third-party warehousing locations, the Company includes in the cost of inventory
the freight and handling costs necessary to move the product to storage until
the product is sold to a customer.
i. Property, Plant and
Equipment:
Property,
plant and equipment is stated at cost and includes capitalized interest. The
costs of replacements or renewals, which improve or extend the life of existing
property are capitalized. Maintenance and repairs are expensed as
incurred. Upon retirement or disposition of an asset, any resulting
gain or loss is included in operations.
Property,
plant and equipment also includes mineral interests. The Company
leases probable mineral reserves at several of its extraction
facilities. These leases have varying terms, and many provide for a
royalty payment to the lessor based on a specific amount per ton of mineral
extracted or as a percentage of revenue. The Company’s rights to
extract minerals are contractually limited by time. However, the Company
believes it will be able to continue to extend lease agreements as it has in the
past, at commercially reasonable terms, without incurring substantial costs or
material modifications to the existing lease terms and conditions, and
therefore, management believes that assigned lives are
appropriate. The Company’s leased mineral interests are primarily
amortized on a units-of-production basis over the respective estimated lives of
mineral deposits not to exceed 99 years. The weighted average
amortization period for these probable mineral reserves is 87 years as of
December 31, 2009. The Company also owns other mineral
properties. The weighted average life for these probable owned
mineral reserves is 47 years as of December 31, 2009.
Buildings
and structures are depreciated on a straight line basis over lives generally
ranging from 10 to 30 years. Portable buildings generally have
shorter lives than permanent structures. Leasehold and building
improvements typically have shorter estimated lives of 5 to 40 years or lower
based on the life of the lease to which the improvement relates.
The
Company’s other fixed assets are amortized on a straight-line basis over their
respective lives. The following table summarizes the estimated useful
lives of our property, plant and equipment:
|
Years
|
|
|
Land
improvements
|
10
to 25
|
|
Buildings
and structures
|
10
to 30
|
|
Leasehold
and building improvements
|
5
to 40
|
|
Machinery
and equipment – vehicles
|
3
to 10
|
|
Machinery
and equipment – other mining and production
|
3
to 20
|
|
Office
furniture and equipment
|
3
to 10
|
|
Mineral
interests
|
20
to 99
|
The
Company recognizes and measures obligations related to the retirement of
tangible long-lived assets in accordance with applicable U.S. GAAP however,
retirement obligations are not material to the Company’s financial position,
results of operations or cash flows.
To review
for possible impairments, the Company uses methodology prescribed in U.S. GAAP.
The Company reviews long-lived assets and the related mineral reserves for
impairment whenever events or changes in circumstances indicate the carrying
amounts of such assets may not be recoverable. If an indication of a potential
impairment exists, recoverability of the respective assets is determined by
comparing the forecasted undiscounted net cash flows of the operation to which
the assets relate, to the carrying amount, including associated intangible
assets, of such operation. If the operation is determined to be unable to
recover the carrying amount of its assets, then intangible assets are written
down first, followed by the other long-lived assets of the operation, to fair
value. Fair value is determined based on discounted cash flows or appraised
values, depending upon the nature of the assets.
j.
Intangible Assets:
The
Company follows the accounting rules for intangible assets as set forth in U.S.
GAAP. Under these rules, intangible assets deemed to have finite lives are
amortized over their estimated useful lives which, for CMP, range from 3 to 25
years. The Company reviews its intangible assets for impairment when
an event or change in circumstances indicates the carrying amounts of such
assets may not be recoverable.
k.
Other Noncurrent Assets:
Other
noncurrent assets include deferred financing costs of $7.4 million and $7.2
million as of December 31, 2009 and 2008 net of accumulated amortization of $3.1
million and $3.4 million as of December 31, 2009 and 2008, respectively. In
connection with the partial redemption of its 12% Senior Subordinated Discount
Notes due 2013, the Company wrote off $1.1 million of its
net
unamortized deferred financing fees, which have been included in Other, net in
the Consolidated Statements of Operations for 2008. In connection
with the refinancing of the 12% Senior Subordinated Discount Notes with 8%
senior notes, the Company wrote off $0.9 million of the Company’s unamortized
deferred financing costs related to the 12% Senior Subordinated Discount Notes,
which have been included in Other, net in the Consolidated Statements of
Operations for 2009 and capitalized approximately $2.4 million in deferred
financing costs related to the 8% Senior Notes. Deferred financing costs are
being amortized to interest expense over the terms of the debt to which the
costs relate.
Certain
inventories of spare parts and related inventory of approximately $9.5 million
and $7.3 million at December 31, 2009 and 2008, respectively, which will be
utilized with respect to long-lived assets, have been classified in the
Consolidated Balance Sheets as other noncurrent assets.
The
Company sponsors a non-qualified defined contribution plan for certain of its
executive officers and key employees as described in Note 7. As of
December 31, 2009 and 2008, investments in marketable securities representing
amounts deferred by employees, Company contributions and unrealized gains or
losses totaling $5.5 million and $3.7 million, respectively, were included in
other noncurrent assets on the Consolidated Balance Sheets. The
marketable securities are classified as trading securities and accordingly,
gains and losses are recorded as a component of other (income) expense, net in
the Consolidated Statements of Operations.
l.
Income Taxes:
The Company accounts
for income taxes using the liability method in accordance with the provisions of
U.S. GAAP. Under the liability method, deferred taxes are determined based on
the differences between the financial statement and the tax basis of assets and
liabilities using enacted tax rates in effect in the years in which the
differences are expected to reverse. The Company’s foreign subsidiaries file
separate company returns in their respective jurisdictions.
The
Company recognizes potential liabilities in accordance with applicable U.S. GAAP
for anticipated tax issues in the U.S. and other tax jurisdictions based on its
estimate of whether, and the extent to which, additional taxes will be due. If
payment of these amounts ultimately proves to be unnecessary, the reversal of
the liabilities would result in tax benefits being recognized in the period when
the Company determines the liabilities are no longer necessary. If the Company’s
estimate of tax liabilities proves to be less than the ultimate assessment, a
further charge to expense would result. Any penalties and interest that are
accrued on the Company’s uncertain tax positions are included as a component of
income tax expense.
In
evaluating the Company’s ability to realize deferred tax assets, the Company
considers the sources and timing of taxable income, including the reversal of
existing temporary differences, the ability to carryback tax attributes to prior
periods, qualifying tax-planning strategies, and estimates of future taxable
income exclusive of reversing temporary differences. In determining future
taxable income, the Company’s assumptions include the amount of pre-tax
operating income according to different state, federal and international taxing
jurisdictions, the origination of future temporary differences, and the
implementation of feasible and prudent tax-planning strategies.
If the
Company determines that a portion of its deferred tax assets will not be
realized, a valuation allowance is recorded in the period that such
determination is made. In the future, if the Company determines, based on the
existence of sufficient evidence, that more or less of the deferred tax assets
are more-likely-than-not to be realized, an adjustment to the valuation
allowance will be made in the period such a determination is made.
m.
Environmental Costs:
Environmental costs,
other than those of a capital nature, are accrued at the time the exposure
becomes known and costs can be reasonably estimated. Costs are accrued based
upon management’s estimates of all direct costs. The Company’s environmental
accrual was $1.8 million as of December 31, 2009 and 2008.
n.
Equity Compensation Plans:
The
Company has equity compensation plans under the oversight of the board of
directors of CMP, whereby stock options and restricted stock units are available
for grant to employees of, consultants to, or directors of CMP. See Note 11 for
additional discussion.
o.
Earnings per Share:
As
required, the Company has adopted guidance related to determining whether
instruments granted in share-based payment transactions are participating
securities prior to vesting, and therefore need to be included in the
computation of earnings per share under the two-class method. The
two-class method requires allocating the Company’s net earnings to both common
shares and participating securities based upon their rights to receive
dividends. Basic earnings per share is computed by dividing net
earnings available to common shareholders by the weighted-average number of
outstanding common shares during the period. Diluted earnings per
share reflects the potential dilution that could occur under the more dilutive
of either the treasury stock method or the two class method for calculating the
weighed-average number of outstanding common shares. The treasury
stock method is calculated assuming unrecognized compensation expense, income
tax benefits and proceeds from the potential exercise of employee stock options
are used to repurchase common stock. In addition, the guidance
requires retrospective presentation of prior periods. Prior to its
adoption, the Company had included participating securities in both its basic
and diluted weighted shares outstanding and calculated diluted earnings per
share using the treasury stock method. The adoption of this guidance
had no material impact on the Company’s Consolidated Financial
Statements.
p.
Derivatives:
The
Company is exposed to the impact of fluctuations in the purchase price of
natural gas consumed in operations. The Company hedges portions of its risk of
changes in natural gas prices through the use of derivative agreements. The
Company also uses interest rate swap agreements to hedge the variability of a
portion of its future interest payments on its variable rate debt. The Company
accounts for derivative financial instruments in accordance with applicable U.S.
GAAP, which requires companies to record derivative financial instruments as
assets or liabilities measured at fair value. Accounting for the changes in the
fair value of a derivative depends on its designation and
effectiveness. Derivatives qualify for treatment as hedges when there
is a high correlation between the change in fair value of the derivative
instrument and the related change in value of the underlying hedged item. For
qualifying hedges, the effective portion of the change in fair value is
recognized through earnings when the underlying transaction being hedged affects
earnings, allowing a derivative’s gains and losses to offset related results
from the hedged item on the income statement. For derivative instruments that
are not accounted for as hedges, or for the ineffective portions of qualifying
hedges, the change in fair value is recorded through earnings in the period of
change. Companies must formally document, designate, and assess the
effectiveness of transactions that receive hedge accounting treatment initially
and on an on-going basis. The Company does not engage in trading activities with
its financial instruments.
q.
Business Acquisitions:
In
January 2007, through DeepStore, the Company acquired all of the outstanding
common stock of London-based Interactive Records Management Limited (IRM) for
approximately $7.6 million in cash with a contingent purchase price adjustment
providing up to approximately $2.0 million of additional consideration over two
years. The Company accrued $0.2 million in 2007, which was
subsequently paid in 2008 related to the contingency agreement. The
net assets acquired consist of assets valued at $9.4 million and assumed
liabilities of $1.6 million.
r.
Concentration of Credit Risk:
The
Company sells its salt and magnesium chloride products to various governmental
agencies, manufacturers, distributors and retailers primarily in the Midwestern
United States, and throughout Canada and the United Kingdom. The
Company’s specialty fertilizer products are sold across North America and
internationally. No single customer or group of affiliated customers accounted
for more than 10% of the Company’s sales in any year during the three year
period ended December 31, 2009, or more than 10% of accounts receivable at
December 31, 2009 or 2008.
s.
Recent Accounting Pronouncements:
In June,
2009, the FASB issued the “FASB Accounting Standards Codification and Hierarchy
of Generally Accepted Accounting Principles, a replacement of FASB Statement No.
162” to establish the FASB Accounting Standards Codification (“Codification”) as
the single source for authoritative nongovernmental U.S. GAAP. The
Securities and Exchange Commission (“SEC”) rules and interpretive releases are
also considered sources of authoritative GAAP. This guidance
supersedes all prior accounting and reporting standards issued by entities other
than the SEC. The Codification was effective for the Company in the
third quarter of 2009 and did not have a material impact on its consolidated
financial statements.
|
3.
|
INVENTORIES
|
Inventories
consist of the following at December 31 (in millions):
|
2009
|
2008
|
|||||||
|
Finished
goods
|
$ | 213.8 | $ | 94.1 | ||||
|
Raw
materials and supplies
|
59.4 | 29.2 | ||||||
|
Total
inventories
|
$ | 273.2 | $ | 123.3 | ||||
|
4.
|
PROPERTY
PLANT AND EQUIPMENT
|
Property,
plant and equipment consists of the following at December 31 (in
millions):
|
2009
|
2008
|
|||||||
|
Land,
buildings and structures and leasehold improvements
|
$ | 213.8 | $ | 190.2 | ||||
|
Machinery
and equipment
|
441.5 | 381.6 | ||||||
|
Office
furniture and equipment
|
20.6 | 17.7 | ||||||
|
Mineral
interests
|
174.5 | 164.3 | ||||||
|
Construction
in progress
|
68.8 | 36.5 | ||||||
| 919.2 | 790.3 | |||||||
|
Less
accumulated depreciation and depletion
|
(455.4 | ) | (407.2 | ) | ||||
|
Property,
plant and equipment, net
|
$ | 463.8 | $ | 383.1 | ||||
|
5.
|
INTANGIBLE
ASSETS
|
Intangible
assets consist primarily of purchased rights to produce SOP and customer
relationships acquired in connection with the 2007 purchase of
IRM. The SOP production rights and customer relationships are being
amortized over 25 years and 7 years, respectively. The weighted
average amortization period for all intangibles is approximately 23
years. None of the intangible assets has a residual
value. Aggregate amortization expense was $1.2 million during 2009
and $1.3 million in 2008 and $1.1 million in 2007 and is projected to be
approximately $1.2 million per year over the next five years. The
intangible asset value and accumulated amortization as of December 31, 2009 are
as follows (in millions):
|
SOP
Production
Rights
|
Customer
Relationships
|
Total
|
||||||||||
|
Intangible
assets
|
$ | 24.3 | $ | 2.3 | $ | 26.6 | ||||||
|
Accumulated
amortization
|
(5.9 | ) | (1.0 | ) | (6.9 | ) | ||||||
|
Intangible
assets, net
|
$ | 18.4 | $ | 1.3 | $ | 19.7 | ||||||
As of
December 31, 2008, intangible assets included SOP production rights and a
related customer list valued at $24.3 million and $1.8 million, respectively,
with accumulated amortization of $5.0 million and $0.7 million,
respectively.
|
6.
|
INCOME
TAXES
|
The
Company files U.S., Canadian and U.K. tax returns at the federal and local
taxing jurisdictional levels. The Company’s U.S. federal tax returns
for tax years 2006 forward remain open and subject to
examination. Generally, the Company’s state, local and foreign tax
returns for years as early as 2002 forward remain open and subject to
examination, depending on the jurisdiction.
The
following table summarizes the Company’s income tax provision (benefit) related
to earnings for the years ended December 31 (in millions):
|
2009
|
2008
|
2007
|
||||||||||
|
Current:
|
||||||||||||
|
Federal
|
$ | 22.1 | $ | 25.3 | $ | (6.5 | ) | |||||
|
State
|
5.6 | 5.8 | - | |||||||||
|
Foreign
|
19.9 | 20.2 | 6.9 | |||||||||
|
Total
current
|
47.6 | 51.3 | 0.4 | |||||||||
|
Deferred:
|
||||||||||||
|
Federal
|
23.2 | 10.1 | 5.3 | |||||||||
|
State
|
5.8 | 2.6 | 1.0 | |||||||||
|
Foreign
|
(3.4 | ) | 3.5 | (6.6 | ) | |||||||
|
Total
deferred
|
25.6 | 16.2 | (0.3 | ) | ||||||||
|
Total
provision for income taxes
|
$ | 73.2 | $ | 67.5 | $ | 0.1 | ||||||
The
Company’s 2007 tax provision includes tax benefits totaling approximately $18.1
million related to items unique to 2007. In 2007, the Company entered
into a program with a taxing authority to begin the process of resolving an
uncertain tax position. Communications with the taxing authority
caused the Company to change its assessment of the measurement of uncertain tax
positions resulting in the reversal of tax reserves. The Company also
released reserves following the closure of certain tax examination
years. The Company’s 2007 provision also includes benefits totaling
$1.0 million to reduce net deferred tax liabilities for the effects of income
tax rate reductions in certain jurisdictions.
The
following table summarizes components of earnings before taxes and shows the tax
effects of significant adjustments from the expected tax expense computed at the
federal statutory rate for the years ended December 31 (in millions):
|
2009
|
2008
|
2007
|
||||||||||
|
Domestic
income
|
$ | 197.0 | $ | 169.5 | $ | 50.8 | ||||||
|
Foreign
income
|
40.1 | 57.5 | 29.3 | |||||||||
|
Earnings
before income taxes
|
237.1 | 227.0 | 80.1 | |||||||||
|
Computed
tax at the U.S. federal statutory rate of 35%
|
83.0 | 79.4 | 28.0 | |||||||||
|
Foreign
income, mining, and withholding taxes, net of U.S. federal
deduction
|
1.0 | 1.5 | 3.5 | |||||||||
|
Percentage
depletion in excess of basis
|
(8.1 | ) | (12.5 | ) | (7.2 | ) | ||||||
|
Release
of previously established foreign tax reserves
|
- | - | (13.0 | ) | ||||||||
|
Domestic
tax reserves, net of reversals
|
(2.1 | ) | (2.4 | ) | (4.9 | ) | ||||||
|
State
income taxes, net of federal income tax benefit
|
7.7 | 6.2 | 0.5 | |||||||||
|
Change
in valuation allowance on deferred tax assets
|
0.3 | 0.4 | 0.2 | |||||||||
|
Interest
expense recognition differences
|
(6.1 | ) | (6.3 | ) | (4.5 | ) | ||||||
|
Other
|
(2.5 | ) | 1.2 | (2.5 | ) | |||||||
|
Provision
for income taxes
|
$ | 73.2 | $ | 67.5 | $ | 0.1 | ||||||
|
Effective
tax rate
|
31 | % | 30 | % | 0 | % | ||||||
Under
U.S. GAAP, deferred tax assets and liabilities are recognized for the estimated
future tax effects, based on enacted tax law, of temporary differences between
the values of assets and liabilities recorded for financial reporting and tax
purposes, and of net operating losses and other carry-forwards. The significant
components of the Company’s deferred tax assets and liabilities were as follows
at December 31 (in millions):
|
2009
|
2008
|
|||||||
|
Current
deferred tax assets:
|
||||||||
|
Alternative minimum tax credit carryforwards
|
$ | 6.3 | $ | 2.4 | ||||
|
Accrued expenses
|
3.2 | 1.7 | ||||||
|
Other, net
|
8.2 | 8.4 | ||||||
|
Current
deferred tax assets
|
$ | 17.7 | $ | 12.5 | ||||
|
Non-current
deferred taxes:
|
||||||||
|
Property, plant and equipment
|
$ | 72.8 | $ | 66.6 | ||||
|
Total
noncurrent deferred tax liabilities
|
72.8 | 66.6 | ||||||
|
Deferred
tax assets:
|
||||||||
|
Net operating loss carryforwards
|
8.3 | 11.0 | ||||||
|
Alternative minimum tax credit carryforwards
|
3.7 | 16.9 | ||||||
|
Interest on discount notes
|
- | 13.5 | ||||||
|
Other, net
|
9.5 | 7.3 | ||||||
|
Subtotal
|
21.5 | 48.7 | ||||||
|
Valuation allowance
|
(3.7 | ) | (3.7 | ) | ||||
|
Total
non-current deferred tax assets
|
17.8 | 45.0 | ||||||
|
Net
non-current deferred tax liabilities
|
$ | 55.0 | $ | 21.6 | ||||
At
December 31, 2009, the Company had U.S. and Canadian federal net operating loss
(“NOL”) carry-forwards of approximately $22.0 million, which expire at various
dates through 2028. Ownership changes, as defined in Internal Revenue Code
Section 382, limit the amount of U.S. NOLs that can be utilized annually to
offset future taxable income and reduce the tax liability. The
Company has previously incurred three ownership changes, which has placed annual
limitations on the amount of utilization of each U.S. NOL. The Company also has
tax-affected state and Canadian provincial NOL carry-forwards of approximately
$1.1 million, which will expire in various years through 2028, and, in
connection with its 2007 acquisition of IRM, the Company acquired approximately
$4.0 million of foreign NOL carryforwards with no expiration
date. The Company also has a U.S. federal alternative minimum tax
credit carry-forward at December 31, 2009 of approximately $10.0 million. This
credit carry-forward may be carried forward indefinitely to offset any excess of
regular tax liability over alternative minimum tax liability.
The
Company has recorded a valuation allowance for a portion of its deferred tax
asset relating to net operating loss carryforwards that it does not believe
will, more likely than not, be realized. As of December 31, 2009 and 2008, the
Company’s
valuation
allowance was $3.7 million. In the future, if the Company determines, based on
existence of sufficient evidence, that it should realize more or less of its
deferred tax assets, an adjustment to the valuation allowance will be made in
the period such a determination is made.
The
calculation of the Company’s tax liabilities involves dealing with uncertainties
in the application of complex tax regulations in multiple jurisdictions. The
Company recognizes potential liabilities for unrecognized tax benefits in the
U.S. and other tax jurisdictions in accordance with applicable U.S. GAAP, which
requires uncertain tax positions to be recognized only if they are more likely
than not to be upheld based on their technical merits. The
measurement of the uncertain tax position is based on the largest benefit amount
that is more likely than not (determined on a cumulative probability basis) to
be realized upon settlement of the matter. If payment of these amounts
ultimately proves to be unnecessary, the reversal of the liabilities would
result in tax benefits being recognized in the period when the Company
determines the liabilities are no longer necessary. If the Company’s estimate of
tax liabilities proves to be less than the ultimate assessment, a further charge
to expense may result.
The
Company’s uncertain tax positions primarily relate to transactions and
deductions involving U.S. and Canadian operations. If favorably resolved, these
unrecognized tax benefits would decrease the Company’s effective tax
rate. Management believes that it is reasonably possible that
unrecognized tax benefits will decrease by approximately $6 million in the next
twelve months largely as a result of resolution with various taxing
authorities. The following table shows a reconciliation of the
beginning and ending amount of unrecognized tax benefits (in
millions):
|
2009
|
2008
|
|||||||
|
Unrecognized
tax benefits:
|
||||||||
|
Balance at January 1
|
$ | 18.1 | $ | 25.7 | ||||
|
Additions resulting from current year tax positions
|
2.2 | 0.7 | ||||||
|
Additions relating to tax positions taken in prior years
|
3.1 | 2.4 | ||||||
|
Reductions due to cash payments
|
- | (2.2 | ) | |||||
|
Reductions relating to tax positions taken in prior years
|
(0.1 | ) | (4.1 | ) | ||||
|
Reductions due to expiration of tax years
|
- | (4.4 | ) | |||||
|
Balance
at December 31
|
$ | 23.3 | $ | 18.1 | ||||
The
Company accrues interest and penalties related to its uncertain tax positions
within its tax provision. During the years ended December 31,
2009, 2008 and 2007, the Company accrued interest and penalties, net of
reversals, of $1.2 million, $1.0 million and $(4.8) million,
respectively. As of December 31, 2009 and 2008, accrued interest and
penalties included in the Consolidated Balance Sheets totaled $5.9 million and
$4.0 million, respectively.
The
Company does not provide U.S. federal income taxes on undistributed earnings of
foreign companies that are not currently taxable in the United
States. No undistributed earnings of foreign companies were subject
to U.S. income tax in the years ended December 31, 2009, 2008 and
2007. Total undistributed earnings on which no U.S. federal income
tax has been provided were $174.7 million at December 31, 2009. If
these earnings are distributed, foreign tax credits may become available under
current law to reduce or possibly eliminate the resulting U.S. income tax
liability.
In the
fourth quarter of 2009, Canadian tax authorities issued a tax reassessment for
years 2002-2004, which are under audit, challenging tax positions claimed by one
of the Company’s Canadian subsidiaries. The Company has disputed this
reassessment and plans to continue to work through the appropriate authorities
in Canada to resolve the dispute. However, there is a reasonable
possibility that the ultimate resolution of this dispute and any related
disputes for other open tax years will be materially higher or lower than the
amounts reserved.
In
connection with the above dispute, customary local regulations have required us
to post security of $36 million in the form of a $27 million performance bond
and $9 million of cash (both submitted in early 2010), which when combined,
represent the total amount in dispute, plus interest through the end of
2009. Should open tax years subsequent to 2004 be audited and
reassessed in a manner consistent with the 2002-2004 tax years disputed
reassessment, the Company would likely be required by those same local
regulations to post additional security in the form of cash, letters of credit,
performance bonds, asset liens or other arrangements agreeable with the tax
authorities.
|
7.
|
PENSION
PLANS AND OTHER BENEFITS
|
The
Company has a defined benefit pension plan for certain of its U.K. employees.
Benefits of this plan are based on a combination of years of service and
compensation levels. This plan was closed to new participants in
1992. Beginning December 1, 2008, future benefits ceased to accrue for the
remaining active employee participants in the plan concurrent with the
establishment of a defined contribution plan for these
employees. Through May 31, 2007, the Company also had a defined
benefit pension plan available to a limited number of its U.S.
employees. The U.S. plan was not material in relation to the U.K.
plan. Effective May 31, 2007, the Company terminated the U.S. plan
and by December 31, 2007 this U.S. plan was substantially settled.
The
Company’s U.K. investment strategy is to maximize return on investments while
minimizing risk. This is accomplished by investing in high-grade equity and debt
securities. The Company’s portfolio guidelines recommend that equity
securities comprise approximately 75% of the total portfolio, and that
approximately 25% be invested in debt securities. Investment
strategies and portfolio allocations are based on the plan’s benefit obligations
and funded or underfunded status, expected returns and the Company’s portfolio
guidelines and are monitored on a regular basis. In early September
2008, the Company elected to move the plan’s investments into debt securities
while it evaluated the investment climate. The Company expects to
return to a greater percentage of equity securities in the future as, in
management’s judgment, conditions warrant. The weighted-average asset
allocations by asset category are as follows (in millions):
|
Plan
Assets at December 31,
|
||||||||
|
Asset
Category
|
2009
|
2008
|
||||||
|
Cash
and cash equivalents
|
23 | % | - | |||||
|
Equity
Securities
|
- | - | ||||||
|
Debt
Securities
|
77 | 100 | % | |||||
|
Total
|
100 | % | 100 | % | ||||
The fair
value of our pension plan assets at December 31, 2009 by asset category are as
follows:
|
Market
Value at
December
31, 2009
|
Level
One
|
Level
Two
|
Level
Three
|
|||||||||||||
|
Asset
category:
|
||||||||||||||||
|
Cash
and cash equivalents(a)
|
$ | 12.8 | $ | 12.8 | $ | - | $ | - | ||||||||
|
Debt
securities(b)
|
||||||||||||||||
|
U.K.
Treasuries
|
24.1 | 24.1 | - | - | ||||||||||||
|
Corporate
bonds
|
18.7 | 18.7 | - | - | ||||||||||||
|
Total
Pension Assets
|
$ | 55.6 | $ | 55.6 | $ | - | $ | - | ||||||||
|
(a)
|
The
fair value of cash and cash equivalents is its carrying
value.
|
|
(b)
|
This
category includes investments in investment-grade fixed-income instruments
and funds linked to U.K. treasury notes. The funds are valued
using the bid values to value each fund. The Company does not
believe there is any concentration risk within this asset
category.
|
As of
December 31, 2009 and 2008, amounts recognized in accumulated other
comprehensive income, net of tax, consisted of actuarial net losses of $15.3
million and $3.7 million, respectively.
The
assumptions used in determining pension information for the plans for the years
ended December 31 were as follows:
|
2009
|
2008
|
2007
|
||||||||||
|
Discount
rate
|
5.70 | % | 5.80 | % | 5.80 | % | ||||||
|
Expected
return on plan assets
|
6.55 | 6.00 | 7.00 | |||||||||
|
Rate
of compensation increase
|
N/A | N/A | 3.30 | |||||||||
The
overall expected long-term rate of return on plan assets is a weighted-average
expectation based on the targeted and expected portfolio composition. The
Company considers historical performance and current benchmarks to arrive at
expected long-term rates of return in each asset category. The
Company determines its discount rate based on a forward yield curve for a
portfolio of high credit quality bonds with expected cash flows and an average
duration closely matching the expected benefit payments under our
plan.
The
Company’s funding policy is to make the minimum annual contributions required by
applicable regulations or agreements with the plan
administrator. Management expects total contributions during 2010
will be approximately $0.7 million. In addition, the Company may
periodically make contributions to the plan based upon the underfunded status of
the plan or other transactions, which warrant incremental contributions, in the
judgment of management.
The U.K.
pension plan includes a provision whereby supplemental benefits may be available
to participants under certain circumstances after case review and approval by
the plan trustees. Because instances of this type of benefit have
historically been infrequent, the development of the projected benefit
obligation and net periodic pension cost has not provided for any future
supplemental benefits. If additional benefits are approved by the
trustees, it is likely that an additional contribution would be required and the
amount of incremental benefits would be expensed by the Company.
The
following benefit payments, which reflect expected future service, as
appropriate, are expected to be paid (in millions):
|
Calendar
Year
|
Future
Expected
Benefit
Payments
|
|||
|
2010
|
$ | 2.5 | ||
|
2011
|
2.6 | |||
|
2012
|
2.7 | |||
|
2013
|
2.8 | |||
|
2014
|
2.9 | |||
|
2015
– 2019
|
13.3 | |||
The
following table sets forth pension obligations and plan assets for the Company’s
defined benefit plans, based on a December 31 measurement date in 2009 and 2008,
as of December 31 (in millions):
|
2009
|
2008
|
|||||||
|
Change
in benefit obligation:
|
||||||||
|
Benefit obligation as of January 1
|
$ | 56.1 | $ | 80.5 | ||||
|
Service cost
|
- | 0.5 | ||||||
|
Interest cost
|
3.3 | 4.4 | ||||||
|
Actuarial (gain) or loss
|
9.6 | (5.4 | ) | |||||
|
Benefits paid
|
(4.9 | ) | (3.5 | ) | ||||
|
Currency fluctuation adjustment
|
6.5 | (20.6 | ) | |||||
|
Employee contributions
|
- | 0.2 | ||||||
|
Benefit
obligation as of December 31
|
70.6 | 56.1 | ||||||
|
Change in plan assets:
|
||||||||
|
Fair value as of January 1
|
53.9 | 75.0 | ||||||
|
Actual return
|
(1.9 | ) | (0.5 | ) | ||||
|
Company contributions
|
2.7 | 2.3 | ||||||
|
Currency fluctuation adjustment
|
5.8 | (19.6 | ) | |||||
|
Benefits paid
|
(4.9 | ) | (3.5 | ) | ||||
|
Employee contributions
|
- | 0.2 | ||||||
|
Fair
value of plan assets as of December 31
|
55.6 | 53.9 | ||||||
|
Underfunded
status of the plans
|
$ | (15.0 | ) | $ | (2.2 | ) | ||
The
underfunded status of the plan for the defined pension plan, which was recorded
in the Consolidated Balance Sheets included $0.8 million in accrued expenses and
$14.2 million in noncurrent liabilities in 2009 and $2.2 million in accrued
expenses in 2008. The accumulated benefit obligation for the defined benefit
pension plan was $70.6 million and $56.1 million as of December 31, 2009 and
2008, respectively. The accumulated benefit obligation is in excess of the
plan’s assets. The components of net pension expense were as follows
for the years ended December 31 (in millions):
|
2009
|
2008
|
2007
|
||||||||||
|
Service
cost for benefits earned during the year
|
$ | - | $ | 0.5 | $ | 0.8 | ||||||
|
Interest
cost on projected benefit obligation
|
3.3 | 4.4 | 4.3 | |||||||||
|
Termination
benefits
|
- | - | 0.6 | |||||||||
|
Expected
return on plan assets
|
(3.4 | ) | (4.8 | ) | (4.9 | ) | ||||||
|
Net
amortization
|
- | - | 0.5 | |||||||||
|
Other
|
- | - | 0.1 | |||||||||
|
Net
pension expense
|
$ | (0.1 | ) | $ | 0.1 | $ | 1.4 | |||||
The
Company has defined contribution and pre-tax savings plans (Savings Plans) for
certain of its employees. Under each of the Savings Plans, participants are
permitted to defer a portion of their compensation. Company contributions to the
Savings Plans are based on a percentage of employee contributions. Additionally,
certain of the Company’s Savings Plans have a profit sharing feature for
salaried and non-union hourly employees. The Company contribution to the
profit-sharing feature is based on the employee’s age and pay and the Company’s
financial performance. Expense attributable to all Savings Plans was
$6.2 million, $10.1 million and $5.9 million for the years ended December 31,
2009, 2008 and 2007, respectively.
The
Savings Plans include a non-qualified plan for certain of its executive officers
and key employees who are limited in their ability to participate in qualified
plans due to existing regulations. These employees are allowed to
defer a portion of their compensation, upon which they will be entitled to
receive Company matching contributions as if the limitations imposed by current
U.S. regulations for qualified plans were not in place. The Company’s
matching contributions are based on a
percentage
of their deferred salary, profit sharing contributions and any investment income
(loss) that would have been credited to their account had the contributions been
made according to employee-designated investment
specifications. Although not required to do so, the Company actually
invests amounts equal to the salary deferrals, the corresponding Company match
and profit sharing amounts according to the employee-designated investment
specifications. As of December 31, 2009 and 2008, investments in
marketable securities totaling $5.5 million and $3.7 million, respectively, were
included in other noncurrent assets with a corresponding deferred compensation
liability included in other noncurrent liabilities on the Consolidated Balance
Sheets. Compensation expense (reduction) recorded for this plan
totaled $1.6 million, $(1.3) million and $0.7 million for the years ended
December 31, 2009, 2008 and 2007, respectively, including amounts attributable
to investment income (loss) of $1.0 million, $(1.5) million and $0.3 million,
respectively, which is included in Other, net on the Consolidated Statements of
Operations.
|
8.
|
LONG
TERM DEBT
|
During
2005, the Company entered into a $475 million senior secured credit agreement
(“Credit Agreement”) with a syndicate of financial institutions, amending and
restating previously existing credit facilities. The Credit Agreement included a
$350 million term loan (“Term Loan”) and a $125 million revolving credit
facility (“Revolving Credit Facility” or “Revolver”). During 2007,
the Company amended the Credit Agreement and borrowed an additional $127.0
million under an incremental term loan (“Incremental Term Loan”).
The Term
Loan and Incremental Term Loan are due in quarterly installments of principal
and interest and mature in December 2012. The scheduled principal payments total
$4.1 million annually but the loans may be prepaid proportionately at any time
without penalty. The $125 million Revolving Credit Facility matures in December
2010 and may be amended or renegotiated before its expiration. Under the
Revolving Credit Facility, $40 million may be drawn in Canadian dollars and $10
million may be drawn in British pounds sterling. Additionally, the Revolver
includes a sub-limit for short-term letters of credit in an amount not to exceed
$50 million. As of December 31, 2009, there were no borrowings outstanding under
the Revolving Credit Facility, and after deducting outstanding letters of credit
totaling $9.9 million, the Company’s borrowing availability was $115.1
million. The Company incurs participation fees related to its
outstanding letters of credit and commitment fees on its available borrowing
capacity. The rates vary depending on the Company’s leverage
ratio. Bank fees are not material.
Interest
on the Credit Agreement is variable, based on either the Eurodollar Rate (LIBOR)
or a Base Rate (defined as the greater of a specified U.S. or Canadian prime
lending rate or the federal funds effective rate, increased by 0.5%) plus a
margin, which is dependent on upon the Company’s leverage ratio. As of December
31, 2009, the weighted average interest rate on all borrowings outstanding under
the Credit Agreement was 2.0%.
The
Company has interest rate swap agreements to effectively fix the interest rate
on a combined $150 million of its Term Loan and Incremental Term Loan at a
weighted average rate, including the applicable spread, of 6.4%. These swaps are
discussed further in Note 9.
In
October 2007, the Company used the proceeds of its Incremental Term Loan and
completed a tender offer to redeem $120.0 million face amount of its 12¾% Senior
Discount Notes due 2012 with an accreted value of $118.0 million for $126.9
million, including a consent payment. In December 2007, the Company
called the remaining $3.5 million of these notes for $3.7
million. The $9.4 million premium paid for these redemptions and the
write-off of $1.6 million of remaining unamortized deferred financing fees is
included in Other, net in the Consolidated Statements of Operations for
2007.
The
Company’s senior subordinated discount notes due 2013 (“Subordinated Discount
Notes”) accreted non-cash interest at an annual rate of 12% through June 1,
2008, thereby increasing the aggregate principal balance of the notes to $179.6
million by June 1, 2008. In 2008, the Company called $90.0 million of
its Senior Subordinated Discount Notes due 2013. In connection with
the transactions, the Company recorded a loss on the extinguishment of debt of
$6.5 million, which included call premiums of $5.4 million and the write-off of
deferred financing fees of $1.1 million.
In June
of 2009, the Company issued senior notes (8% Senior Notes) with an aggregate
face amount of $100 million due in 2019, which bear interest at a rate of 8% per
year payable semi-annually in June and December. The 8% Senior Notes were issued
at a discount at 97.497% of their face value and the carrying value of the debt
will accrete to their face value over the notes’ term, resulting in an effective
interest rate of approximately 8.4%. With the proceeds of the 8% Senior Notes,
the Company redeemed the remaining $89.6 million of its 12% Senior Subordinated
Discount Notes due 2013. In connection with the debt refinancing, the
Company paid approximately $4.1 million in call premiums and tender and other
fees, and paid $2.4 million of fees that were capitalized as deferred financing
costs.
The
Credit Agreement and the indenture governing the 8% Senior Notes limit the
Company’s ability, among other things, to: incur additional indebtedness or
contingent obligations; pay dividends or make distributions to stockholders;
repurchase or redeem stock; make investments; grant liens; make capital
expenditures; enter into transactions with stockholders and affiliates; sell
assets; and acquire the assets of, or merge or consolidate with, other
companies. The Credit Agreement is secured by all existing and future
assets of the Company’s subsidiaries. Additionally, it requires the Company to
maintain certain financial ratios including a minimum interest coverage ratio
and a maximum total leverage ratio. As of December 31, 2009, the Company was in
compliance with each of its covenants.
The notes
in the table below are listed in order of subordination with all notes
subordinate to the Credit Agreement borrowings. Third-party long-term debt
consists of the following at December 31 (in millions):
|
2009
|
2008
|
|||||||
|
Revolving
Credit Facility due 2010
|
$ | - | $ | 8.7 | ||||
|
Term
Loan due 2012
|
269.0 | 271.8 | ||||||
|
Incremental
Term Loan due 2012
|
124.1 | 125.4 | ||||||
|
8%
Senior Notes due 2019
|
97.6 | - | ||||||
|
12%
Subordinated Discount Notes due 2013
|
- | 89.8 | ||||||
| 490.7 | 495.7 | |||||||
|
Less
current portion
|
(4.1 | ) | (4.1 | ) | ||||
|
Long-term
debt
|
$ | 486.6 | $ | 491.6 | ||||
Future
maturities of long-term debt for the years ending December 31, are as follows
(in millions):
|
Debt
|
||||
|
Maturity
|
||||
|
2010
|
$ | 4.1 | ||
|
2011
|
4.1 | |||
|
2012
|
384.9 | |||
|
2013
|
- | |||
|
2014
|
- | |||
|
Thereafter
|
100.0 | |||
|
Total
|
$ | 493.1 | ||
|
9.
|
DERIVATIVES
AND FAIR VALUES OF FINANCIAL
INSTRUMENTS
|
The
Company is subject to various types of market risks including interest rate
risk, foreign currency exchange rate transaction and translation risk and
commodity pricing risk. Management may take actions to mitigate the
exposure to these types of risks including entering into forward purchase
contracts and other financial instruments. Currently, the Company
manages a portion of its interest rate risk and commodity pricing risk by using
derivative instruments. The Company does not seek to engage in
trading activities or take speculative positions with any financial instrument
arrangements. The Company has entered into natural gas derivative instruments
and interest rate swap agreements with counterparties it views as
creditworthy. However, management does attempt to mitigate its
counterparty credit risk exposures by entering into master netting agreements
with these counterparties.
As
required, the Company adopted new guidance related to disclosures about
derivative instruments and hedging activities effective with the first quarter
of 2009. This guidance requires holders of derivative instruments to
provide qualitative disclosures about objectives and strategies for using
derivatives, quantitative disclosures about fair value amounts of gains and
losses from derivative instruments, and disclosures about credit-risk-related
contingent features in derivative agreements.
Cash
Flow Hedges
As of
December 31, 2009, the Company has entered into natural gas derivative
instruments and interest rate swap agreements. The Company records derivative
financial instruments as either assets or liabilities at fair value in the
statement of financial position. Derivatives qualify for treatment as
hedges when there is a high correlation between the change in fair value of the
derivative instrument and the related change in value of the underlying hedged
item. Furthermore, the Company must designate the hedging instruments based upon
the exposure being hedged as a fair value hedge, a cash flow hedge or a net
investment in foreign operations hedge. All derivative instruments
held by the Company as of December 31, 2009 and 2008 qualified as cash flow
hedges. For these qualifying hedges, the effective portion of the change in fair
value is recognized through earnings when the underlying transaction being
hedged affects earnings, allowing a derivative’s gains and losses to offset
related results from the hedged item on the income statement. For derivative
instruments that are not accounted for as hedges, or for the ineffective
portions of qualifying hedges, the change in fair value is recorded through
earnings in the period of change. The Company formally documents, designates,
and assesses the effectiveness of transactions that receive hedge accounting
initially and on an on-going basis. Any ineffectiveness related to these hedges
was not material for any of the periods presented.
Natural
gas is used at several of the Company’s production facilities and a change in
natural gas prices impacts the Company’s operating margin. As of
December 31, 2009, the Company had entered into natural gas derivative
instruments to hedge a portion of its natural gas purchase requirements through
September 2012. The Company’s objective is to reduce the earnings and
cash flow impacts of changes in market prices of natural gas by fixing the
purchase price of up to 90% of its
forecasted
natural gas usage. The Company may hedge portions of its natural gas
usage up to 36 months in advance of the forecasted purchase. As of December 31,
2009 and 2008, the Company had agreements in place to hedge forecasted natural
gas purchases of 5.2 and 4.7 million mmbtus, respectively.
As of
December 31, 2009, the Company had $393.1 million of borrowings under its senior
secured credit agreement (“Credit Agreement”), which are subject to a floating
rate. The Company has $150 million of interest rate swap agreements
in place to hedge the variability of future interest payments. The
notional amount of the swaps decreases by $50 million in March 2010, $50 million
in December 2010 with the final $50 million reduction occurring in March
2011. As of December 31, 2009, the interest rate swap agreements
effectively fix the weighted average LIBOR-based portion of its interest rate on
a portion of its debt at 4.8%, thereby reducing the impact of interest rate
changes on future interest cash flows and expense.
As of
December 31, 2009, the Company expects to reclassify from accumulated other
comprehensive income to earnings during the next twelve months approximately
$1.3 million and $4.7 million of net losses on derivative instruments related to
its natural gas and interest rate hedges, respectively.
The
following table presents the fair value of the Company’s hedged items as of
December 31, 2009 (in thousands):
|
Asset
Derivatives
|
Liability
Derivatives
|
|||||||||
|
Derivatives
designated as hedging instruments:
|
Balance
Sheet Location
|
December
31, 2009
|
Balance
Sheet Location
|
December
31, 2009
|
||||||
|
Interest
rate contracts
|
Other
current assets
|
$ | - |
Accrued
expenses
|
$ | 5.0 | ||||
|
Commodity
contracts
|
Other
current assets
|
1.0 |
Accrued
expenses
|
2.2 | ||||||
|
Commodity
contracts
|
Other
assets
|
- |
Other
noncurrent liabilities
|
1.3 | ||||||
|
Total
derviatives designated as hedging instruments
|
$ | 1.0 | $ | 8.5 | ||||||
(a) The Company has interest rate swap agreements with three counterparties, one of which holds approximately 70% of the interest rate swaps outstanding. In addition, the Company has commodity hedge agreements with three counterparties. All of the amounts recorded as liabilities for the Company’s commodity contracts are payable to one counterparty. The amount recorded as an asset is due from two counterparties.
The
following table presents activity related to the Company’s other comprehensive
income (“OCI”) for the twelve months ended December 31, 2009 (in
thousands):
|
Twelve
Months Ended December 31, 2009
|
|||||||||
|
Derivatives
in Cash Flow Hedging Relationships
|
Location
of Gain (Loss) Reclassified from Accumulated OCI Into Income (Effective
Portion)
|
Amount
of (Gain) Loss Recognized in OCI on Derivative (Effective
Portion)
|
Amount
of Gain (Loss) Reclassified from Accumulated OCI Into Income (Effective
Portion)
|
||||||
|
Interest
rate contracts
|
Interest
expense
|
$ | 2.4 | $ | (6.3 | ) | |||
|
Commodity
contracts
|
Product
cost
|
4.8 | (10.1 | ) | |||||
|
Total
|
$ | 7.2 | $ | (16.4 | ) | ||||
Risks not Hedged
In
addition to the United States, the Company conducts its business in Canada and
the United Kingdom. The Company’s operations may, therefore, be subject to
volatility because of currency fluctuations, inflation changes and changes in
political and economic conditions in these countries. Sales and expenses are
frequently denominated in local currencies and the results of operations may be
affected adversely as currency fluctuations affect the Company’s product prices
and operating costs. The Company’s historical results do not reflect any
material foreign currency exchange
hedging activity. However, the Company may engage in
hedging activities in the future to reduce the exposure of its net cash flows to
fluctuations in foreign currency exchange rates.
The
Company is subject to increases and decreases in the cost of transporting its
products, due in part, to variations in contracted carriers’ cost of fuel, which
is typically diesel fuel. The Company’s historical results do not include
hedging activity related to fuel costs. However, the Company may engage in
hedging activities in the future, including forward contracts, to reduce its
exposure to changes in transportation costs due to changes in the cost of
fuel.
|
10.
|
COMMITMENTS
AND CONTINGENCIES
|
Contingent
Obligations:
The
Company is involved in legal and administrative proceedings and claims of
various types from normal Company activities.
The
Company is aware of an aboriginal land claim filed by The Chippewas of Nawash
and The Chippewas of Saugeen (the “Chippewas”) in the Ontario Superior Court
against The Attorney General of Canada and Her Majesty The Queen In Right of
Ontario. The Chippewas claim that a large part of the land under Lake Huron was
never conveyed by treaty and therefore belongs to the Chippewas. The land
claimed includes land under which the Company’s Goderich mine operates and has
mining rights granted to it by the government of Ontario. The Company is not a
party to this court action.
Similar
claims are pending with respect to other parts of the Great Lakes by other
aboriginal claimants. The Company has been informed by the Ministry of the
Attorney General of Ontario that “Canada takes the position that the common law
does not recognize aboriginal title to the Great Lakes and its connecting
waterways.”
The
Wisconsin Department of Agriculture, Trade and Consumer Protection (“DATCP”) has
information indicating that agricultural chemicals are present in the ground
water in the vicinity of the Kenosha, Wisconsin plant. DATCP directed us to
conduct an investigation into the possible presence of agricultural chemicals in
soil and ground water at the Kenosha plant. The Company has conducted ongoing
investigations of the soils and ground water at the Kenosha site and continue to
provide the findings to DATCP. DATCP, in conjunction with the Wisconsin
Department of Natural Resources (“DNR”), will determine whether any further
investigation or remediation is necessary, or whether no further action is
required. All investigations to date, and any potential future
remediation work, are being conducted under the Wisconsin Agricultural Chemical
Cleanup Program, which would provide for reimbursement of some of the costs.
None of the identified contaminants have been used in association with Compass
Minerals site operations. The Company would also expect to seek participation
by, or cost reimbursement from, other parties responsible for the presence of
any agricultural chemicals found in soils at this site if it does not receive a
liability exemption and is required to conduct further investigation or remedial
actions.
The
Company does not believe that these actions will have a material adverse
financial effect on the Company. Furthermore, while any litigation contains an
element of uncertainty, management presently believes that the outcome of each
such proceeding or claim, which is pending or known to be threatened, or all of
them combined, will not have a material adverse effect on the Company’s results
of operations, cash flows or financial position.
Approximately
30% of our U.S. workforce and approximately 50% of our global workforce is
represented by labor unions. Of our ten material collective bargaining
agreements, four will expire in 2010 (representing approximately 17% of its
total workforce), three will expire in 2011, two will expire in 2012 and one
will expire in 2013. Additionally, approximately 9% of our workforce is employed
in Europe where trade union membership is common. The Company considers its
labor relations to be generally good.
Commitments:
Leases: The Company leases
certain property and equipment under non-cancelable operating leases for varying
periods. In addition, the Company has entered into a master lease agreement with
a bank to provide financing for equipment up to a total of $20
million. The agreement expires in 2010 but may be extended, in full
or in part. Leases under this agreement have 5-year lease
terms. The aggregate future minimum annual rentals under lease
arrangements as of December 31, 2009 are as follows (in millions):
|
Operating
|
||||
|
Leases
|
||||
|
2010
|
$ | 10.1 | ||
|
2011
|
7.5 | |||
|
2012
|
6.1 | |||
|
2013
|
4.4 | |||
|
2014
|
3.4 | |||
|
Thereafter
|
24.4 | |||
|
Total
|
$ | 55.9 | ||
Rental
expense, net of sublease income, was $13.4 million for the year ended December
31, 2009 and $11.8 million for 2008 and $10.0 million for 2007,
respectively.
Royalties: The Company has
various private, state and Canadian provincial leases associated with the salt
and specialty potash businesses, most of which are renewable by the
Company. Many of these leases provide for a royalty payment to the
lessor based on a specific amount per ton of mineral extracted or as a
percentage of revenue. Royalty expense related to these leases was
$8.6 million, $11.3 million and $7.5 million for the years ended December 31,
2009, 2008 and 2007, respectively.
Sales Contracts: The Company
has various salt and other deicing-product sales contracts that include
performance provisions governing delivery and product quality. These sales
contracts either require the Company to maintain performance bonds for
stipulated amounts or contain contractual penalty provisions in the event of
non-performance. For the three years
ended
December 31, 2009, the Company has had no material penalties related to these
sales contracts. At December 31, 2009, the Company had approximately
$71.1 million of outstanding performance bonds.
Purchase Commitments: In
connection with the operations of the Company’s facilities, the Company
purchases electricity, other raw materials and services from third parties under
contracts, extending, in some cases, for multiple years. Purchases under these
contracts are generally based on prevailing market prices. The Company has a
purchase contract for a minimum amount of salt with a supplier, which can be
canceled with one year’s notice. The purchase commitment for this
contract is approximately $10.6 million for 2010. In addition,
the Company’s future minimum long-term purchase commitments are approximately
$0.3 million annually through 2014.
|
11.
|
STOCKHOLDERS’
EQUITY AND EQUITY INSTRUMENTS
|
The
Company paid dividends of $1.42 per share in 2009 and currently intends to
continue paying quarterly cash dividends. The declaration and payment of future
dividends to holders of the Company’s common stock will be at the discretion of
its board of directors and will depend upon many factors, including the
Company’s financial condition, earnings, legal requirements, restrictions in its
debt agreements (see Note 8) and other factors its board of directors deems
relevant.
Under the
Compass Minerals International, Inc. Directors' Deferred Compensation Plan as
amended, adopted effective October 1, 2004, non-employee directors may defer all
or a portion of the fees payable for their service, which deferred fees are
converted into units equivalent to the value of the Company's common
stock. Additionally, as dividends are declared on the Company’s common
stock, these units are entitled to accrete dividends in the form of additional
units based on the stock price on the dividend payment
date. Accumulated deferred units are distributed in the form of
Company common stock following resignation from the Board. During the
years ended December 31, 2009, 2008 and 2007, members of the board were credited
with 11,744, 12,965 and 16,573 deferred stock units,
respectively. During those same years, 10,135, 631 and 4,076 shares
of common stock respectively, were issued from treasury shares to retiring
directors.
Equity
Compensation Awards
Through
December 31, 2004, non-qualified stock options were granted under the Company’s
2001 stock option plan. These options were issued to eligible persons
as determined by the Company’s board of directors and included employees and
directors. These options vest ratably, in tranches over three to four years,
depending on the individual option agreement. Options granted to
members of the board of directors vested at the time of grant. These
options expire on the thirtieth day immediately following the eighth anniversary
of issuance. No further option grants can be made under this
plan.
In 2005,
the Company adopted a new equity compensation plan (“2005 Plan”) for executive
officers, other key employees and directors allowing grants of equity
instruments, including restricted stock units (“RSUs”) and stock options, with
respect to 3,240,000 shares of CMP common stock. The right to make
awards expires in 2015. The grants occur following formal approval by the board
of directors or on the date of hire if granted to a new employee, with the
amount and terms communicated to employees shortly thereafter. The
Company does not back-date awards. The exercise price of options is
equal to the closing stock price on the day of grant.
The
grants of RSUs vest after three years of service entitling the holders to one
share of common stock for each vested RSU. The unvested RSUs do not have voting
rights but are entitled to receive non-forfeitable dividends or other
distributions that may be declared on the Company’s common stock equal to, and
at the same time as, the per share dividend declared.
Stock
options granted under the 2005 Plan generally vest ratably, in tranches, over a
four-year service period. Unexercised options expire after seven
years. Upon vesting, each option can be exercised to purchase one
share of the Company’s common stock. While the option holders are not entitled
to vote, each option holder of options granted prior to 2009 is entitled to
receive non-forfeitable dividends or other distributions declared on the
Company’s common stock equal to, and at the same time as, the per share dividend
declared to holders of the Company’s common stock.
The
following is a summary of CMP’s stock option and RSU activity and related
information for the following periods:
|
Number
|
Weighted-average
|
Number
|
Weighted-average
|
|||||||||||||
|
of
options
|
exercise
price
|
of
RSUs
|
fair
value
|
|||||||||||||
|
Outstanding
at December 31, 2006
|
746,182 | $ | 15.91 | 72,900 | $ | 25.60 | ||||||||||
|
Granted
|
146,475 | 33.58 | 48,625 | 33.58 | ||||||||||||
|
Exercised (a)
|
(240,616 | ) | 1.65 | - | - | |||||||||||
|
Cancelled/Expired
|
- | - | - | - | ||||||||||||
|
Outstanding
at December 31, 2007
|
652,041 | 25.15 | 121,525 | 28.80 | ||||||||||||
|
Granted
|
105,550 | 55.65 | 33,400 | 55.67 | ||||||||||||
|
Exercised (a)
|
(83,119 | ) | 20.38 | - | - | |||||||||||
|
Released from restriction (a)
|
- | - | (14,000 | ) | 23.47 | |||||||||||
|
Cancelled/Expired
|
(5,722 | ) | 4.07 | (232 | ) | 45.78 | ||||||||||
|
Outstanding
at December 31, 2008
|
668,750 | 30.66 | 140,693 | 35.68 | ||||||||||||
|
Granted
|
133,726 | 58.99 | 43,611 | 58.99 | ||||||||||||
|
Exercised (a)
|
(156,974 | ) | 20.71 | - | - | |||||||||||
|
Released from restriction (a)
|
- | - | (58,900 | ) | 26.11 | |||||||||||
|
Cancelled/Expired
|
(1,575 | ) | 57.30 | (506 | ) | 57.34 | ||||||||||
|
Outstanding
at December 31, 2009
|
643,927 | $ | 38.90 | 124,898 | $ | 48.24 | ||||||||||
(a) Common stock issued for exercised options and RSUs released from restriction were issued from treasury stock.
The
Company expenses the fair value of its options over the vesting period using the
straight line method. To estimate the fair value of options on the
day of grant, the Company uses the Black-Scholes option valuation
model. Award recipients are grouped according to expected exercise
behavior. Unless better information is available to estimate the expected term
of the options, the estimate is based on historical exercise experience. The
risk-free rate, using U.S. Treasury yield curves in effect at the time of grant,
is selected based on the expected term of each group. CMP’s historical stock
price is used to estimate expected volatility. The weighted average
assumptions and fair values for options granted for each of the years ended
December 31 is included in the following table.
|
2009
|
2008
|
2007
|
||||||||||
|
Fair
value of options granted
|
$ | 19.23 | $ | 16.54 | $ | 10.72 | ||||||
|
Expected
term (years)
|
5.4 | 5.2 | 5.3 | |||||||||
|
Expected
volatility
|
43.3 | % | 27.9 | % | 24.3 | % | ||||||
|
Dividend
yield(a)
|
2.6 | % | 0.0 | % | 0.0 | % | ||||||
|
Risk-free
interest rates
|
2.1 | % | 2.4 | % | 4.5 | % | ||||||
(a)
The assumed yield reflects the non-forfeiting dividend feature for awards under
the 2005 Plan prior to 2009.
The
following table summarizes information about options outstanding and exercisable
at December 31, 2009. As of December 31, 2008, there were 668,750
options outstanding of which 320,115 were exercisable.
|
Options
Outstanding
|
Options
Exercisable
|
|||||||||||||||||||||||||
|
Weighted
average
|
Weighted average |
|
Weighted
average
|
Weighted
average
|
||||||||||||||||||||||
|
remaining
|
exercise price |
remaining
|
exercise
price
|
|||||||||||||||||||||||
|
Range
of
|
Options
|
contractual
life
|
of
options
|
Options
|
contractual
life
|
of
exercisable
|
||||||||||||||||||||
|
exercise
prices
|
outstanding
|
(years)
|
outstanding
|
exercisable
|
(years)
|
options
|
||||||||||||||||||||
| $1.40 - $16.47 | 1,015 | 0.2 | $ | 1.40 | 1,015 | 0.2 | $ | 1.40 | ||||||||||||||||||
| $16.48 - $28.31 | 269,142 | 3.1 | 25.39 | 209,442 | 3.1 | 25.18 | ||||||||||||||||||||
| $28.32 - $36.00 | 137,300 | 4.2 | 33.59 | 64,212 | 4.2 | 33.60 | ||||||||||||||||||||
| $36.01 - $55.12 | 99,355 | 5.2 | 55.08 | 24,247 | 5.2 | 55.08 | ||||||||||||||||||||
| $55.13 - $78.53 | 137,115 | 6.2 | 59.31 | 1,069 | 5.6 | 69.23 | ||||||||||||||||||||
|
Totals
|
643,927 | 4.3 | $ | 38.90 | 299,985 | 3.5 | $ | 29.48 | ||||||||||||||||||
During
the years ended December 31, 2009, 2008 and 2007, the Company recorded
compensation expense of $3.8 million, $3.0 million and $2.0 million,
respectively, related to its stock-based compensation awards that are expected
to vest. No amounts have been capitalized. As of December
31, 2009, unrecorded compensation cost related to non-vested awards of $6.0
million is expected to be recognized from 2010 through 2013, with a weighted
average period of 1.1 years.
The
intrinsic value of stock options exercised during the twelve months ended
December 31, 2009 totaled approximately $6.0 million. As of December
31, 2009, the intrinsic value of options outstanding aggregated approximately
$18.2 million, of which 299,985 options with an intrinsic value of $11.3 million
were exercisable. The number of shares held in treasury is sufficient
to cover all outstanding equity awards as of December 31,
2009.
Accumulated
Other Comprehensive Income
The
components of accumulated other comprehensive income, net of related taxes, are
summarized as follows (in millions):
|
December
31,
|
2009
|
2008
|
2007
|
|||||||||
|
Unrealized
net pension costs
|
$ | (15.3 | ) | $ | (3.7 | ) | $ | (5.2 | ) | |||
|
Unrealized
loss on cash flow hedges
|
(4.6 | ) | (10.3 | ) | (3.2 | ) | ||||||
|
Cumulative
foreign currency translation adjustments
|
51.1 | 13.2 | 61.9 | |||||||||
|
Accumulated
other comprehensive income (loss)
|
$ | 31.2 | $ | (0.8 | ) | $ | 53.5 | |||||
See Note
9 for a discussion of the Company’s cash flow hedges and Note 7 for a discussion
of the Company’s defined benefit pension plans.
|
12.
|
FAIR
VALUE MEASUREMENTS
|
As
required, the Company’s financial instruments are measured and reported at their
estimated fair value. Fair value is the price that would be
received to sell an asset or paid to transfer a liability in an orderly
transaction. When available, the Company uses quoted prices in active
markets to determine the fair values for its financial instruments (level one
inputs), or absent quoted market prices, observable market-corroborated inputs
over the term of the financial instruments (level two inputs). The Company does
not have any unobservable inputs that are not corroborated by market inputs
(level three inputs).
The
Company holds marketable securities associated with its non-qualified savings
plan, which are valued based on readily available quoted market
prices. The Company utilizes derivative instruments to manage its
risk of changes in natural gas prices and interest rates. The fair
values of the derivative instruments are determined using observable yield
curves or other market-corroborated data matching the terms of the derivatives
(level two inputs). The estimated fair values for each type of
instrument are presented below (in millions).
|
December
31, 2009
|
Level
One
|
Level
Two
|
Level
Three
|
|||||||||||||
|
Assets:
|
||||||||||||||||
|
Marketable
securities
|
$ | 5.5 | $ | 5.5 | $ | - | $ | - | ||||||||
|
Derivatives
– natural gas instruments
|
1.0 | - | 1.0 | - | ||||||||||||
|
Total
Assets
|
$ | 6.5 | $ | 5.5 | $ | 1.0 | $ | - | ||||||||
|
Liabilities:
|
||||||||||||||||
|
Liabilities
related to non-qualified savings plan
|
$ | (5.5 | ) | $ | (5.5 | ) | $ | - | $ | - | ||||||
|
Derivatives
– natural gas instruments
|
(3.5 | ) | - | (3.5 | ) | - | ||||||||||
|
Derivatives
– interest rate swaps
|
(5.0 | ) | - | (5.0 | ) | - | ||||||||||
|
Total
Liabilities
|
$ | (14.0 | ) | $ | (5.5 | ) | $ | (8.5 | ) | $ | - | |||||
|
December
31, 2008
|
Level
One
|
Level
Two
|
Level
Three
|
|||||||||||||
|
Assets:
|
||||||||||||||||
|
Marketable
securities
|
$ | 3.7 | $ | 3.7 | $ | - | $ | - | ||||||||
|
Total
Assets
|
$ | 3.7 | $ | 3.7 | $ | - | $ | - | ||||||||
|
Liabilities:
|
||||||||||||||||
|
Liabilities
related to non-qualified savings plan
|
$ | (3.7 | ) | $ | (3.7 | ) | $ | - | $ | - | ||||||
|
Derivatives
– natural gas instruments
|
(7.8 | ) | - | (7.8 | ) | - | ||||||||||
|
Derivatives
– interest rate swaps
|
(8.9 | ) | - | (8.9 | ) | - | ||||||||||
|
Total
Liabilities
|
$ | (20.4 | ) | $ | (3.7 | ) | $ | (16.7 | ) | $ | - | |||||
Cash and
cash equivalents, accounts receivable (net of reserve for bad debts) and
payables are carried at cost, which approximates fair value due to their liquid
and short-term nature. The Company’s investments related to its nonqualified
retirement plan of $5.5 million and $3.7 million as of December 31, 2009 and
December 31, 2008, respectively, are stated at fair value based on quoted market
prices. As of December 31, 2009, the estimated fair value of the
fixed-rate 8% Senior Notes, based on available trading information, totaled
$103.0 million compared with the aggregate principal amount at maturity of
$100 million. The fair value at December 31, 2009 of amounts outstanding under
the Credit Agreement, based upon available bid information received from the
Company’s lender, totaled approximately $386.2 million compared with the
aggregate principal amount at maturity of $393.1 million. The fair
values of the Company’s interest rate swap and natural gas contracts are based
on forward yield curves and rates for notional amounts maturing in each
respective time-frame.
|
13.
|
OPERATING
SEGMENTS
|
The
Company’s reportable segments are strategic business units that offer different
products and services. They are managed separately because each business
requires different technology and marketing strategies. The Company has two
reportable segments: salt and specialty fertilizer. The salt segment produces
salt and magnesium chloride for use in road deicing and dust control, food
processing, water softeners, pool salt and agricultural and industrial
applications. The Company also purchases potassium chloride to sell
as a finished product. Sulfate of potash crop nutrients and
industrial grade SOP are produced and marketed through the specialty fertilizer
segment.
The
accounting policies of the segments are the same as those described in the
summary of significant accounting policies. All intersegment sales prices are
market-based. The Company evaluates performance based on operating earnings of
the respective segments.
As
discussed in Note 2, in January 2007, DeepStore acquired all of the outstanding
common stock of London-based Interactive Records Management Limited (IRM) for
approximately $7.6 million in cash. DeepStore’s assets and results of
operations appear in “Corporate and Other” in the tables below.
Segment
information as of and for the years ended December 31, is as follows (in
millions):
|
Specialty
|
Corporate
|
|||||||||||||||
|
2009
|
Salt
|
Fertilizer
|
&
Other (a)
|
Total
|
||||||||||||
|
Sales
to external customers
|
$ | 825.8 | $ | 126.8 | $ | 10.5 | $ | 963.1 | ||||||||
|
Intersegment
sales
|
0.7 | 13.9 | (14.6 | ) | - | |||||||||||
|
Shipping
and handling cost
|
239.6 | 9.7 | - | 249.3 | ||||||||||||
|
Operating
earnings (loss)
|
232.4 | 76.0 | (38.2 | ) | 270.2 | |||||||||||
|
Depreciation,
depletion and amortization
|
29.5 | 9.2 | 5.0 | 43.7 | ||||||||||||
|
Total
assets
|
705.8 | 233.7 | 64.3 | 1,003.8 | ||||||||||||
|
Capital
expenditures
|
63.6 | 27.4 | 3.1 | 94.1 | ||||||||||||
|
Specialty
|
Corporate
|
|||||||||||||||
|
2008
|
Salt
|
Fertilizer
|
&
Other (a)
|
Total
|
||||||||||||
|
Sales
to external customers
|
$ | 923.3 | $ | 232.9 | $ | 11.5 | $ | 1,167.7 | ||||||||
|
Intersegment
sales
|
0.4 | 22.4 | (22.8 | ) | - | |||||||||||
|
Shipping
and handling cost
|
318.3 | 22.8 | - | 341.1 | ||||||||||||
|
Operating
earnings (loss)
|
191.7 | 117.7 | (35.2 | ) | 274.2 | |||||||||||
|
Depreciation,
depletion and amortization
|
28.9 | 10.2 | 2.3 | 41.4 | ||||||||||||
|
Total
assets
|
592.5 | 183.0 | 47.1 | 822.6 | ||||||||||||
|
Capital
expenditures
|
43.7 | 19.4 | 4.7 | 67.8 | ||||||||||||
|
Specialty
|
Corporate
|
|||||||||||||||
|
2007
|
Salt
|
Fertilizer
|
&
Other (a)
|
Total
|
||||||||||||
|
Sales
to external customers
|
$ | 710.7 | $ | 136.1 | $ | 10.5 | $ | 857.3 | ||||||||
|
Intersegment
sales
|
0.4 | 15.4 | (15.8 | ) | - | |||||||||||
|
Shipping
and handling cost
|
232.9 | 20.0 | - | 252.9 | ||||||||||||
|
Operating
earnings (loss)
|
138.7 | 35.6 | (30.0 | ) | 144.3 | |||||||||||
|
Depreciation,
depletion and amortization
|
29.6 | 9.5 | 0.9 | 40.0 | ||||||||||||
|
Total
assets
|
600.5 | 152.2 | 67.3 | 820.0 | ||||||||||||
|
Capital
expenditures
|
33.7 | 9.9 | 4.4 | 48.0 | ||||||||||||
(a) Other includes corporate entities, DeepStore and eliminations. Corporate assets include deferred tax assets, deferred financing fees, investments related to the non-qualified retirement plan and other assets not allocated to the operating segments.
Financial
information relating to the Company’s operations by geographic area for the
years ended December 31 is as follows (in millions):
|
Sales
|
2009
|
2008
|
2007
|
|||||||||
|
United
States
|
$ | 697.3 | $ | 844.5 | $ | 616.7 | ||||||
|
Canada
|
199.3 | 245.5 | 193.4 | |||||||||
|
United
Kingdom
|
62.0 | 56.0 | 42.4 | |||||||||
|
Other
|
4.5 | 21.7 | 4.8 | |||||||||
|
Total sales
|
$ | 963.1 | $ | 1,167.7 | $ | 857.3 | ||||||
Financial
information relating to the Company’s long-lived assets, including deferred
financing costs and other long-lived assets but excluding the investments
related to the nonqualified retirement plan, by geographic area as of December
31 (in millions):
|
Long-Lived
Assets
|
2009
|
2008
|
||||
|
United
States
|
$ |
280.5
|
$ |
250.9
|
||
|
Canada
|
177.7
|
128.2
|
||||
|
United
Kingdom
|
57.3
|
49.3
|
||||
|
Total long-lived assets
|
$ |
515.5
|
$ |
428.4
|
|
14.
|
EARNINGS
PER SHARE
|
The FASB
issued new guidance related to determining whether instruments granted in
share-based payment transactions are participating securities prior to vesting,
and therefore need to be included in the computation of earnings per share under
the two-class method. The two class method requires allocating the
Company’s net earnings to both common shares and participating
securities. In addition, the guidance requires retrospective
presentation of prior periods.
Prior to
its adoption, the Company had included participating securities in both its
basic and diluted weighted shares outstanding. The impact of the
adoption of this new guidance decreased the numerator and the denominator in the
basic and diluted earnings per share calculation for all prior periods however,
there was no impact on previously reported basic or diluted earnings per
share.
The
following table sets forth the computation of basic and diluted earnings per
common share (in millions, except for share and per share data):
|
Year
ended December 31,
|
2009
|
2008
|
2007
|
|||||||||
|
Numerator:
|
||||||||||||
|
Net
earnings
|
$ | 163.9 | $ | 159.5 | $ | 80.0 | ||||||
|
Less:
Net earnings allocated to participating securities (a)
|
(3.4 | ) | (3.4 | ) | (1.4 | ) | ||||||
|
Net
earnings available to common shareholders
|
$ | 160.5 | $ | 156.1 | $ | 78.6 | ||||||
|
Denominator
(in thousands):
|
||||||||||||
|
Weighted
average common shares outstanding, shares for basic earnings per
share(b)
|
32,574 | 32,407 | 32,248 | |||||||||
|
Weighted
average stock options outstanding
|
22 | 70 | 121 | |||||||||
|
Shares
for diluted earnings per share
|
32,596 | 32,477 | 32,369 | |||||||||
|
Net
earnings per common share, basic
|
$ | 4.93 | $ | 4.82 | $ | 2.44 | ||||||
|
Net
earnings per common share, diluted
|
$ | 4.92 | $ | 4.81 | $ | 2.43 | ||||||
|
(a)
|
Participating
securities include options and RSUs that receive non-forfeitable
dividends. Net earnings were allocated to participating securities of
704,000, 712,000 and 564,000 for 2009, 2008 and 2007,
respectively.
|
|
(b)
|
For
the calculation of diluted earnings per share, the Company uses the more
dilutive of either the treasury stock method or the two-class method, to
determine the weighted average number of outstanding common
shares. In addition, the Company had 761,000, 663,000 and
509,000 weighted options outstanding for 2009, 2008 and 2007,
respectively, which were anti-dilutive and therefore not included in the
diluted earnings per share
calculation.
|
|
15.
|
QUARTERLY
RESULTS (Unaudited) (In millions, except share and per share
data)
|
|
Quarter
|
First
|
Second
|
Third
|
Fourth
|
||||||||||||
|
2009
|
||||||||||||||||
|
Sales
|
$ | 309.1 | $ | 159.5 | $ | 182.3 | $ | 312.2 | ||||||||
|
Gross
profit
|
115.3 | 55.0 | 66.6 | 117.2 | ||||||||||||
|
Net
earnings
|
61.6 | 14.1 | 25.7 | 62.5 | ||||||||||||
|
Net
earnings per share, basic
|
$ | 1.85 | $ | 0.42 | $ | 0.77 | $ | 1.88 | ||||||||
|
Net
earnings per share, diluted
|
1.85 | 0.42 | 0.77 | 1.88 | ||||||||||||
|
Basic
weighted-average shares outstanding (in thousands)
|
32,493 | 32,585 | 32,593 | 32,623 | ||||||||||||
|
Diluted
weighted-average shares outstanding (in thousands)
|
32,538 | 32,601 | 32,609 | 32,633 | ||||||||||||
|
2008
|
||||||||||||||||
|
Sales
|
$ | 380.0 | $ | 162.0 | $ | 237.4 | $ | 388.3 | ||||||||
|
Gross
profit
|
97.0 | 37.1 | 76.8 | 145.3 | ||||||||||||
|
Net
earnings
|
49.1 | 1.6 | 28.7 | 80.1 | ||||||||||||
|
Net
earnings per share, basic
|
$ | 1.49 | $ | 0.05 | $ | 0.87 | $ | 2.42 | ||||||||
|
Net
earnings per share, diluted
|
1.48 | 0.05 | 0.87 | 2.41 | ||||||||||||
|
Basic
weighted-average shares outstanding (in thousands)
|
32,366 | 32,405 | 32,425 | 32,431 | ||||||||||||
|
Diluted
weighted-average shares outstanding (in thousands)
|
32,442 | 32,480 | 32,439 | 32,491 | ||||||||||||
|
16.
|
SUBSEQUENT
EVENTS
|
The
Company has evaluated all subsequent events from December 31, 2009 through the
date these financial statements were filed with the SEC on February 22,
2010.
Dividend
declared:
On
February 5, 2010, our board of directors declared a quarterly cash dividend
of $0.39 per share on our outstanding common stock, an increase of 10% from the
quarterly cash dividends paid in 2009 of $0.355 per share. The
dividend will be paid on March 15, 2010 to stockholders of record as of the
close of business on March 1, 2010.
|
ITEM
9.
|
CHANGES IN AND DISAGREEMENTS WITH ACCOUNTANTS ON
ACCOUNTING AND FINANCIAL DISCLOSURE
|
None.
|
ITEM
9A.
|
CONTROLS AND
PROCEDURES
|
Disclosure
Controls and Procedures
The
Company maintains disclosure controls and procedures that are designed to ensure
that information required to be disclosed in the Company’s reports under the
Securities Exchange Act of 1934, as amended (the “Exchange Act”), is recorded,
processed, summarized and reported within the time periods specified in the
SEC’s rules and forms and that such information is accumulated and communicated
to management, including the Company’s Chief Executive Officer (CEO) and Chief
Financial Officer (CFO), as appropriate, to allow timely decisions regarding
required disclosure. In designing and evaluating the disclosure controls and
procedures, management recognizes that any controls and procedures, no matter
how well designed and operated, can provide only reasonable assurance of
achieving the desired control objectives and management necessarily was required
to apply its judgment in evaluating the cost-benefit relationship of possible
controls and procedures.
As of the
end of the period covered by this report, an evaluation of the effectiveness of
the design and operation of the Company’s disclosure controls and procedures (as
defined in Rule 13a-15(e) under the Exchange Act) was performed under the
supervision and with the participation of the Company’s management, including
the CEO and CFO. Based on that evaluation, the Company’s CEO and CFO concluded
that the Company’s disclosure controls and procedures were effective as of
December 31, 2009 to ensure that information required to be disclosed in the
reports it files and submits under the Securities Exchange Act of 1934 is
recorded, processed, summarized and reported within the time periods specified
in the SEC’s rules and forms.
Management’s Report on Internal Control Over
Financial Reporting
Management
of the Company is responsible for establishing and maintaining adequate internal
control over financial reporting, as defined in Rule 13a-15(f) under the
Exchange Act. The Company’s internal control over financial reporting is a
process designed to provide reasonable assurance regarding the reliability of
financial reporting and the preparation of financial statements for external
purposes in accordance with generally accepted accounting principles. Because of
its inherent limitations, internal control over financial reporting may not
prevent or detect misstatements. Also, projections of any evaluation of
effectiveness to future periods are subject to the risk that controls may become
inadequate because of changes in conditions, or that the degree of compliance
with the policies or procedures may deteriorate.
Management
conducts an evaluation and assesses the effectiveness of the Company’s internal
control over financial reporting as of the reporting date. In making its
assessment of internal control over financial reporting, management uses the
criteria set forth by the Committee of Sponsoring Organizations of the Treadway
Commission (COSO) in Internal
Control-Integrated Framework.
A
material weakness is a control deficiency, or combination of control
deficiencies, that result in more than a remote likelihood that a material
misstatement of the annual or interim financial statements will not be prevented
or detected. As of December 31, 2009, management conducted an evaluation and
assessed the effectiveness of the Company’s internal control over financial
reporting. Based on its evaluation, management concluded that the Company’s
internal control over financial reporting was effective as of December 31,
2009. Ernst & Young LLP, our independent registered
public accounting firm, has audited the consolidated financial statements of the
Company for the year ended December 31, 2009, and has also issued an audit
report dated February 22, 2010, on the effectiveness of the Company’s
internal control over financial reporting as of December 31, 2009, which is
included in this Annual Report on Form 10-K.
Changes in Internal Control Over
Financial Reporting
There
have been no changes in the Company’s internal control over financial reporting
during the most recently completed fiscal quarter that have materially affected,
or are reasonably likely to materially affect, the Company’s internal control
over financial reporting.
|
ITEM
9B.
|
OTHER
INFORMATION
|
None.
|
PART
III
|
|
ITEM
10.
|
DIRECTORS, EXECUTIVE OFFICERS AND CORPORATE
GOVERNANCE
|
Information
regarding executive officers is included in Part I to this Form 10-K under the
caption “Executive Officers of Registrant”.
The
information required by Item 10 of Form 10-K is incorporated herein by reference
to sections (a) “Proposal 1 – Election of Directors”, (b) “Information Regarding
Board of Directors and Committees” and (c) “Corporate Governance Guidelines” of
the definitive proxy statement filed pursuant to Regulation 14A for the 2010
annual meeting of stockholders (“2010 Proxy
Statement”). Additionally, “Section 16(a) Beneficial Ownership
Reporting Compliance” is also incorporated herein by reference to the 2010 Proxy
Statement.
Code
of Ethics
The
Company has adopted a code of ethics for its executive and senior financial
officers, violations of which are required to be reported to the CEO and the
audit committee. The code of ethics is posted on the Company’s website at
www.compassminerals.com.
|
ITEM
11.
|
EXECUTIVE
COMPENSATION
|
The
information required by Item 11 of Form 10-K is incorporated herein by reference
to the executive compensation tables in the “Compensation Discussion and
Analysis” included in the 2010 Proxy Statement.
|
ITEM
12.
|
SECURITY OWNERSHIP AND CERTAIN BENEFICIAL OWNERS AND
MANAGEMENT AND RELATED STOCKHOLDER
MATTERS
|
The
information required by Item 12 of Form 10-K is incorporated herein by reference
to “Security Ownership of Certain Beneficial Owners and Management” and
“Equity Compensation Plan Information” included in the 2010 Proxy
Statement.
|
ITEM
13.
|
CERTAIN RELATIONSHIPS AND RELATED TRANSACTIONS,
AND DIRECTOR INDEPENDENCE
|
Information
required by Item 13 of Form 10-K is incorporated herein by reference to the
disclosure under “Review and Approval of Transactions with Related Persons" and
“Information Regarding Board of Directors and Committees” included in the
2010 Proxy Statement.
|
ITEM
14.
|
PRINCIPAL ACCOUNTING FEES AND
SERVICES
|
The
information required by Item 14 of Form 10-K is incorporated herein by reference
to “Proposal 2 – Ratification of Appointment of Independent Auditors” included
in the 2010 Proxy Statement.
|
PART
IV
|
ITEM
15. EXHIBITS, FINANCIAL STATEMENT
SCHEDULES
(a)(1)
Financial statements and supplementary data required by this Item 15 are set
forth below:
|
Description
|
Page
|
|||
| 65 | ||||
| 39 | ||||
| 41 | ||||
| 42 | ||||
| 43 | ||||
| 44 | ||||
| 45 | ||||
| 67 | ||||
(a)(2)
Financial Statement Schedule:
______________________________________________________________________________________________________
Schedule
II — Valuation Reserves
Compass
Minerals International, Inc.
December
31, 2009, 2008 and 2007
|
Description
(in
millions)
|
Balance
at
the
Beginning
of
the Year
|
Additions
Charged
to
Expense
|
Deductions
(1)
(3)
|
Acquisition
or Disposition(2)
|
Balance
at
the
End of
the
Year
|
|||||||||||||||
|
Deducted
from Receivables — Allowance for
Doubtful
Accounts
|
||||||||||||||||||||
|
2009
|
$ | 2.5 | $ | 0.8 | $ | (0.8 | ) | $ | — | $ | 2.5 | |||||||||
|
2008
|
1.8 | 1.2 | (0.5 | ) | — | 2.5 | ||||||||||||||
|
2007
|
1.6 | 0.7 | (0.5 | ) | — | 1.8 | ||||||||||||||
|
Deducted
from Deferred Income Taxes — Valuation
Allowance
|
||||||||||||||||||||
|
2009
|
$ | 3.7 | $ | 0.3 | $ | (0.3 | ) | $ | — | $ | 3.7 | |||||||||
|
2008
|
4.6 | 1.2 | (2.0 | ) | (0.1 | ) | 3.7 | |||||||||||||
|
2007
|
2.9 | 0.2 | — | 1.5 | 4.6 | |||||||||||||||
|
(1)
|
Deduction
for purposes for which reserve was
created.
|
|
(2)
|
Increase
in the allowance for doubtful accounts balance results from the
acquisition of a business.
|
|
(3)
|
Deductions
from the deferred income tax valuation allowance in 2009 and 2008 include
a foreign currency adjustment of $(0.3) million and $0.4 million,
respectively.
|
____________________________________________________________________________________________________________________________________________
EXHIBIT
INDEX
|
Exhibit
No.
|
Description of Exhibit
|
||
| 2.1 |
Agreement
and Plan of Merger, dated October 13, 2001, among IMC Global Inc., Compass
Minerals International, Inc. (formerly known as Salt Holdings
Corporation), YBR Holdings LLC and YBR Acquisition Corp (incorporated
herein by reference to Exhibit 2.1 to Compass Minerals’ Registration
Statement on Form S-4, File No. 333-104603).
|
||
| 2.2 |
Amendment
No. 1 to Agreement and Plan of Merger, dated November 28, 2001, among IMC
Global Inc., Compass Minerals International, Inc. (formerly known as Salt
Holdings Corporation), YBR Holdings LLC and YBR Acquisition Corp
(incorporated herein by reference to Exhibit 2.2 to Compass Minerals
Registration Statement on Form S-4, File No.
333-104603).
|
||
| 3.1 |
Amended
and Restated Certificate of Incorporation of Compass Minerals
International, Inc. (incorporated herein by reference to Exhibit 3.1 to
Compass Minerals International, Inc.’s Registration Statement on Form S-4,
File No. 333-111953).
|
||
| 3.2 |
Amended
and Restated By-laws of Compass Minerals International, Inc. (incorporated
herein by reference to Exhibit 3.2 to Compass Minerals International,
Inc.’s Current Report on Form 8-K dated February 12,
2009).
|
||
| 4.1 |
Rights
Plan, dated as of December 11, 2003, between Compass Minerals
International, Inc. and American Stock Transfer & Trust Company, as
rights agent (incorporated herein by reference to Exhibit 10.19 to Compass
Minerals International, Inc.’s Registration Statement on Form S-4, File
No. 333-111953).
|
||
| 4.2 |
Letter
agreement appointing Computershare Trust Company, N.A. as successor Rights
Agent under the Rights Agreement dated December 11, 2003 (incorporated
herein by reference to Exhibit 10.15 to Compass Minerals International,
Inc.’s Annual Report for the year ended December 31,
2007).
|
||
| 4.3 |
Amendment
Number Two to Rights Plan dated December 11, 2003 among Compass Minerals
International, Inc. and U.M.B. Bank, n.a., as successor rights agent
(incorporated herein by reference to Exhibit 10.1 to Compass Minerals
International, Inc.’s Current Report on Form 8-K dated January 8,
2007).
|
||
| 4.4 |
Registration
Rights Agreement, dated as of June 5, 2009, by and among Compass Minerals
International, Inc., the Guarantors named therein, and Credit Suisse
Securities (USA) LLC, J.P. Morgan Securities Inc., and Goldman, Sachs
& Co., as representatives of the Initial Purchasers (incorporated
herein by reference to Exhibit 4.3 to Compass Minerals International,
Inc.’s Current Report on Form 8-K dated June 8, 2009).
|
||
| 4.5 |
Indenture,
dated as of June 5, 2009, by and among Compass Minerals International,
Inc., the Guarantors named therein, and U.S. National Bank Association, as
trustee, relating to the 8% Senior Notes due 2019 (incorporated herein by
reference to Exhibit 4.1 to Compass Minerals International, Inc.’s Current
Report on Form 8-K dated June 8, 2009).
|
||
| 4.6 |
Form
of 8% Senior Notes due 2019 (included as Exhibit A to Exhibit
4.5).
|
||
| 10.1 |
Salt
mining lease, dated November 9, 2001, between the Province of Ontario, as
lessor, and Sifto Canada Inc. as lessee (incorporated herein by reference
to Exhibit 10.1 to Compass Minerals’ Registration Statement on Form S-4,
File No. 333-104603).
|
||
| 10.2 |
Salt
and Surface Agreement, dated June 21, 1961, by and between John Taylor
Caffery, as agent for Marcie Caffery Gillis, Marcel A. Gillis, Bethia
Caffery McCay, Percey McCay, Mary Louise Caffery Ellis, Emma Caffery
Jackson, Edward Jackson, Liddell Caffery, Marion Caffery Campbell, Martha
Gillis Restarick, Katherine Baker Senter, Caroline Baker, Bethia McCay
Brown, Donelson Caffery McCay, Lucius Howard McCurdy Jr., John Andersen
McCurdy, Edward Rader Jackson III, individually and as trustee for
Donelson Caffery Jackson, and the J.M. Burguieres Company, LTD., and Carey
Salt Company as amended by Act of Amendment to Salt Lease, dated May 30,
1973, as further amended by Agreement, dated November 21, 1990, and as
further amended by Amendment to Salt and Surface lease, dated July 1, 1997
(incorporated herein by reference to Exhibit 10.2 to Compass Minerals’
Registration Statement on Form S-4, File No.
333-104603).
|
||
| 10.3 |
Royalty
Agreement, dated September 1, 1962, between Great Salt Lake Minerals
Corporation (formerly known as IMC Kalium Ogden Corp.) and the Utah State
Land Board (incorporated herein by reference to Exhibit 10.3 to Compass
Minerals’ Registration Statement on Form S-4, File No.
333-104603).
|
||
| 10.4 |
Amended
and Restated Credit Agreement, dated December 22, 2005, among Compass
Minerals International, Inc. (formerly known as Salt Holdings
Corporation), Compass Minerals Group, Inc., as U.S. borrower, Sifto Canada
Corp., as Canadian borrower, Salt Union Limited, as U.K. borrower,
JPMorgan Chase Bank N.A., as administrative agent, J.P. Morgan Securities
Inc., as co-lead arranger and joint bookrunner, Goldman Sachs Credit
Partners L.P., as co-lead arranger and joint bookrunner, Calyon New York
Branch, as syndication agent, Bank of America, N.A., as co-documentation
agent, and The Bank of Nova Scotia, as co-documentation agent
(incorporated herein by reference to Exhibit 10.10 to Compass Minerals
International, Inc.’s Annual Report on Form 10-K for the year ended
December 31, 2005).
|
||
| 10.5 |
Amended
and Restated U.S. Collateral and Guaranty Agreement, dated December 22,
2005, among Compass Minerals International, Inc. (formerly known as Salt
Holdings Corporation), Compass Minerals Group, Inc., Compass Resources,
Inc., Great Salt Lake Holdings, LLC, Carey Salt Company, Great Salt Lake
Minerals Corporation, GSL Corporation, NAMSCO Inc., North American Salt
Company and JPMorgan Chase Bank, N.A., as collateral agent (incorporated
herein by reference to Exhibit 10.11 to Compass Minerals International,
Inc.’s Annual Report on Form 10-K for the year ended December 31,
2005).
|
||
| 10.6 |
Amended
and Restated U.S. Collateral Assignment, dated December 22, 2005, among
Compass Minerals International, Inc., Compass Minerals Group, Inc. and
JPMorgan Chase Bank N.A (incorporated herein by reference to Exhibit 10.12
to Compass Minerals International, Inc.’s Annual Report on Form 10-K for
the year ended December 31, 2005).
|
||
| 10.7 |
Amended
and Restated Foreign Guaranty, dated December 22, 2005, among Sifto Canada
Corp., Salt Union Limited, Compass Minerals (Europe) Limited, Compass
Minerals (UK) Limited, DeepStore Limited (formerly known as London Salt
Limited), Compass Minerals (No. 1) Limited (formerly known as Direct Salt
Supplies Limited), J.T. Lunt & Co. (Nantwich) Limited, NASC Nova
Scotia Company, Compass Minerals Canada Inc., Compass Canada Limited
Partnership, Compass Minerals Nova Scotia Company, Compass Resources
Canada Company and JPMorgan Chase Bank, N.A., as collateral agent
(incorporated herein by reference to Exhibit 10.13 to Compass Minerals
International, Inc.’s Annual Report on Form 10-K for the year ended
December 31, 2005).
|
||
| 10.8 |
Incremental
Term Loan Amendment to the Amended and Restated Credit Agreement, dated
December 22, 2005 among Compass Minerals International, Inc., Compass
Minerals Group, Inc., as U.S. Borrower, Sifto Canada Corp., as
Canadian borrower, Salt Union Limited, as U.K. borrower, JPMorgan Chase
Bank N.A. as administrative agent, J.P. Morgan Securities Inc., as co-lead
arranger and joint bookrunner, Goldman Sachs Credit Partners L.P., as
co-lead arranger and joint bookrunner, Calyon New York Branch, as
syndication agent, Bank of America, N.A., as co-documentation agent, and
The Bank of Nova Scotia, as co-documentation agent (incorporated herein by
reference to Exhibit 10.1 of Compass Minerals International, Inc.’s
Current Report on Form 8-K dated October 19, 2007).
|
||
| 10.9 |
Second
Amendment to the Amended and Restated Credit Agreement, dated as December
22, 2005, among Compass Minerals International, Inc., Compass Minerals
Group, Inc., Sifto Canada Corp., Salt Union Limited, the lenders from time
to time party thereto, JPMorgan Chase Bank, N.A., as administrative agent,
JPMorgan Chase Bank, N.A., Toronto Branch, as Canadian agent, J.P. Morgan
Europe Limited, as U.K.. agent, Calyon New York Branch, as syndication
agent, and Bank of America, N.A. and the Bank of Nova Scotia, as
co-documentation agents (incorporated herein by reference to Exhibit 10.11
to Compass Minerals International, Inc’s Annual Report on Form 10-K for
the year ended December 31, 2007).
|
||
| 10.10 |
Certificate
of Designation for the Series A Junior Participating Preferred Stock, par
value $0.01 per share (included as Exhibit A to Exhibit
4.1).
|
||
| 10.11 |
Compass
Minerals International, Inc. Directors’ Deferred Compensation Plan,
Amended and Restated Effective as of January 1, 2005 (incorporated herein
by reference to Exhibit 10.26 to Compass Minerals International, Inc.’s
Annual Report on Form 10-K for the year ended December 31,
2006).
|
| 10.12 |
First
Amendment to the Compass Minerals International, Inc. Directors’ Deferred
Compensation Plan effective January 1, 2007 (incorporated herein by
reference to Exhibit 10.28 to Compass Minerals International, Inc.’s
Annual Report on Form 10-K for the year ended December 31,
2006).
|
||
| 10.13 |
Second
Amendment to the Compass Minerals International, Inc. Directors’ Deferred
Compensation Plan (incorporated herein by reference to Exhibit 10.4 to
Compass Minerals International, Inc.’s Quarterly Report on Form 10-Q for
the quarter ended March 31, 2009).
|
||
| 10.14 | * |
Summary
of Non-Employee Director Compensation Program.
|
|
| 10.15 |
Compass
Minerals International, Inc. Form of 2009 Independent Directors’ Deferred
Stock Award Agreement effective as of January 1, 2009 (incorporated herein
by reference to Exhibit 10.2 to Compass Minerals International, Inc.’s
Quarterly Report on Form 10-Q for the quarter ended March 31,
2009).
|
||
| 10.16 |
Amended
and Restated 2001 Stock Option Plan of Compass Minerals International,
Inc., as adopted by the Board of Directors of Compass Minerals
International, Inc. on December 11, 2003 (incorporated herein by reference
to Exhibit 10.12 to Compass Minerals International, Inc.’s Registration
Statement on Form S-4, File No. 333-111953).
|
||
| 10.17 |
Compass
Minerals International, Inc. 2005 Incentive Award Plan as approved by
stockholders on August 4, 2005 (incorporated herein by reference to
Exhibit 10.15 to Compass Minerals International, Inc.’s Annual Report on
Form 10-K for the year ended December 31, 2005).
|
||
| 10.18 |
First
Amendment to the Compass Minerals International, Inc. 2005 Incentive Award
Plan (incorporated herein by reference to Exhibit 10.5 to Compass Minerals
International, Inc.’s Quarterly Report on Form 10-Q for the quarter ended
March 31, 2007).
|
||
| 10.19 |
Second
Amendment to the Compass Minerals International, Inc. 2005 Incentive Award
Plan (incorporated herein by reference to Exhibit 10.6 to Compass Minerals
International, Inc.’s Quarterly Report on Form 10-Q for the quarter ended
March 31, 2009).
|
||
| 10.20 |
Form
of Non-qualified Stock Option Award Agreement (incorporated herein by
reference to Compass Minerals International, Inc.’s Current Report on Form
8-K dated January 23, 2006).
|
||
| 10.21 |
Form
of Restricted Stock Unit Award Agreement (incorporated herein by reference
to Exhibit 10.1 to Compass Minerals International, Inc.’s Quarterly Report
on Form 10-Q for the quarter ended June 30, 2007).
|
||
| 10.22 |
Amendment
to Form of Restricted Stock Unit Award Agreement (incorporated herein by
reference to Exhibit 10.25 to Compass Minerals International, Inc.’s
Annual Report on Form 10-K for the year ended December 31,
2008).
|
||
| 10.23 |
Form
of Dividend Equivalents Agreement (incorporated herein by reference to
Compass Minerals International, Inc.’s Quarterly Report on Form 10-Q for
the quarter ended June 30, 2008).
|
||
| 10.24 |
Compass
Minerals International, Inc. Restoration Plan (incorporated herein by
reference to Exhibit 10.2 to Compass Minerals International, Inc.’s
Quarterly Report on Form 10-Q for the quarter ended June 30,
2007).
|
||
| 10.25 |
First
Amendment to the Compass Minerals International, Inc. Restoration Plan
dated as of December 5, 2007 (incorporated herein by reference to Exhibit
10.27 to Compass Minerals International, Inc.’s Annual Report for the year
ended December 31, 2007).
|
||
| 10.26 |
Second
Amendment to the Compass Minerals International, Inc. Restoration Plan
(incorporated herein by reference to Exhibit 10.5 to Compass Minerals
International, Inc.’s Quarterly Report on Form 10-Q for the quarter ended
March 31, 2009.)
|
||
| 10.27 |
Form
of Change in Control Severance Agreement (incorporated herein by reference
to Exhibit 10.28 to Compass Minerals International, Inc.’s Annual Report
on Form 10-K for the year ended December 31, 2007).
|
||
| 10.28 |
Amendment
to Form of Change in Control Severance Agreements (incorporated herein by
reference to Exhibit 10.3 to Compass Minerals International, Inc.’s
Quarterly Report on Form 10-Q for the quarter ended March 31,
2009).
|
| 10.29 |
Form
of Restrictive Covenant Agreement (incorporated herein by reference to
Exhibit 10.4 to Compass Minerals International, Inc.’s Current Report on
Form 8-K filed dated January 23, 2006).
|
||
| 10.30 | * |
Listing
of certain executive officers as parties to the Change in Control
Severance Agreement and Restrictive Covenant Agreement as listed in
Exhibits 10.27, 10.28 and 10.29 herein.
|
|
| 10.31 |
Employment
Agreement dated May 11, 2006 between Compass Minerals International, Inc.
and Angelo C. Brisimitzakis (incorporated herein by reference to Exhibit
10.1 to Compass Minerals International, Inc.’s Current Report on Form 8-K
dated May 11, 2006).
|
||
| 10.32 |
409A
Amendment to Existing Employment Agreement dated December 19, 2008 between
Compass Minerals International, Inc. and Angelo C. Brisimitzakis
(incorporated herein by reference to Exhibit 10.25 to Compass Minerals
International, Inc.’s Annual Report on Form 10-K for the year ended
December 31, 2008).
|
||
| 10.33 |
Change
in Control Severance Agreement dated May 11, 2006 between Compass Minerals
International, Inc. and Angelo C. Brisimitzakis (incorporated herein by
reference to Exhibit 10.2 to Compass Minerals International, Inc.’s
Current Report on Form 8-K dated May 11, 2006).
|
||
| 10.34 |
409A
Amendment to Existing Change in Control Severance Agreement dated December
19, 2008 between Compass Minerals International, Inc. and Angelo C.
Brisimitzakis (incorporated herein by reference to Exhibit 10.25 to
Compass Minerals International, Inc.’s Annual Report on Form 10-K for the
year ended December 31, 2008).
|
||
| 10.35 |
Restrictive
Covenant Agreement dated May 11, 2006 between Compass Minerals
International, Inc. and Angelo C. Brisimitzakis (incorporated herein by
reference to Exhibit 10.3 to Compass Minerals International, Inc.’s
Current Report on Form 8-K dated May 11, 2006).
|
||
| 10.36 |
Employment
Service Agreement, dated October 27, 2006 between Compass Minerals
International, Inc. and David J. Goadby (incorporated herein by reference
to Exhibit 10.1 to Compass Minerals International, Inc.’s Current Report
on Form 8-K dated October 27, 2006).
|
||
| 10.37 |
Summary
of Executive Compensation and Annual Incentive Plan Award Targets
(incorporated herein by reference to Exhibit 10.7 to Compass Minerals
International, Inc.’s Quarterly Report on Form 10-Q for the quarter ended
March 31, 2009).
|
||
| 10.38 |
Annual
Incentive Plan Summary (incorporated by reference to Exhibit 10.2 to
Compass Minerals International, Inc.’s Quarterly Report on Form 10-Q for
the quarter ended March 31, 2008).
|
||
| 10.39 |
Form
of Indemnification Agreement for Directors of Compass Minerals
International, Inc. (incorporated by reference to Exhibit 10.1 to Compass
Minerals International, Inc.’s current Report on Form 8-K dated March 26,
2009).
|
||
| 12.1 | * |
Statement
of Computation of Ratio of Earnings to Fixed Charges.
|
|
| 21.1 | * |
Subsidiaries
of the Registrant.
|
|
| 23.1 | * |
Consent
of Ernst & Young LLP.
|
|
| 31.1 | * |
Section
302 Certifications of Angelo C. Brisimitzakis, President and Chief
Executive Officer.
|
|
| 31.2 | * |
Section
302 Certifications of Rodney L. Underdown, Vice President and Chief
Financial Officer.
|
|
| 32 | * |
Certification
Pursuant to 18 U.S.C.§1350 of Angelo C. Brisimitzakis, President and Chief
Executive Officer and Rodney L. Underdown, Vice President and Chief
Financial Officer.
|
____________
* Filed
herewith.
|
SIGNATURES
|
Pursuant
to the requirements of Section 13 or 15(d) of the Securities Exchange Act of
1934, the Registrant has duly caused this report to be signed on its behalf by
the undersigned, thereunto duly authorized.
COMPASS
MINERALS INTERNATIONAL, INC.
/s/
Angelo C.
Brisimitzakis
Angelo
C. Brisimitzakis
President and Chief
Executive Officer
Date:
February 22, 2010
/s/
Rodney L.
Underdown
Rodney L.
Underdown
Vice President and Chief
Financial Officer
Date:
February 22, 2010
Pursuant
to the requirements of the Securities Exchange Act of 1934, this report has been
signed below by the following persons on behalf of the Registrant and in the
capacities indicated on February 22, 2010.
|
Signature
|
Capacity
|
|
/s/
Angelo C.
Brisimitzakis
Angelo
C. Brisimitzakis
|
President,
Chief Executive Officer
and
Director (Principal Executive Officer)
|
|
/s/
Rodney L.
Underdown
Rodney
L. Underdown
|
Vice
President and Chief Financial Officer
(Principal
Financial and Accounting Officer)
|
|
/s/
Bradley J.
Bell
Bradley
J. Bell
|
Director
|
|
/s/
David J.
D’Antoni
David
J. D’Antoni
|
Director
|
|
/s/
Richard S.
Grant
Richard
S. Grant
|
Director
|
|
/s/
Perry W.
Premdas
Perry
W. Premdas
|
Director
|
|
/s/
Allan R.
Rothwell
Allan
R. Rothwell
|
Director
|
|
/s/
Timothy R.
Snider
Timothy
R. Snider
|
Director
|
|
/s/
Paul S.
Williams
Paul
S. Williams
|
Director
|
72