Attached files
| file | filename |
|---|---|
| 8-K - FORM 8-K - ONCOR ELECTRIC DELIVERY CO LLC | d71147e8vk.htm |
Exhibit 99.1






| 2009 Fourth Quarter And Year End Investor Call February 19, 2010 |

| Forward Looking Statements This presentation contains forward-looking statements, which are subject to various risks and uncertainties. Discussion of risks and uncertainties that could cause actual results to differ materially from management's current projections, forecasts, estimates and expectations is contained in filings made by Oncor Electric Delivery Company LLC (Oncor) with the Securities and Exchange Commission (SEC). Specifically, Oncor makes reference to the section entitled "Risk Factors" in its annual and quarterly reports. In addition to the risks and uncertainties set forth in Oncor's SEC filings, the forward-looking statements in this release could be affected by, among other things: prevailing governmental policies and regulatory actions; legal and administrative proceedings and settlements; weather conditions and other natural phenomena, and acts of sabotage, wars or terrorist activities; economic conditions, including the current recessionary environment; unanticipated population growth or decline, or changes in market demand and demographic patterns; changes in business strategy, development plans or vendor relationships; unanticipated changes in interest rates or rates of inflation; unanticipated changes in operating expenses, liquidity needs and capital expenditures; the credit quality and/or inability of various counterparties to meet their financial obligations to Oncor, including failure of counterparties to perform under agreements; general industry trends; hazards customary to the industry and the possibility that Oncor may not have adequate insurance to cover losses resulting from such hazards; changes in technology used by and services offered by Oncor; significant changes in Oncor's relationship with its employees; changes in assumptions used to estimate costs of providing employee benefits, including pension and other post-retirement employee benefits, and future funding requirements related thereto; significant changes in critical accounting policies material to Oncor; commercial bank and financial market conditions, access to capital, the cost of such capital, and the results of financing and refinancing efforts, including availability of funds in the capital markets and the potential impact of continued disruptions in US credit markets; financial restrictions under Oncor's revolving credit facility and indentures governing its debt instruments; Oncor's ability to generate sufficient cash flow to make interest payments on its debt instruments; actions by credit rating agencies; and Oncor's ability to effectively execute its operational strategy. Any forward-looking statement speaks only as of the date on which it is made, and Oncor undertakes no obligation to update any forward-looking statement to reflect events or circumstances after the date on which it is made or to reflect the occurrence of unanticipated events. Regulation G This presentation includes certain non-GAAP financial measures. A reconciliation of these measures to the most directly comparable GAAP measures is included in this presentation, which is located on Oncor's website, www.oncor.com, under the 'News' tab in the Investor Information section, and also filed with the SEC. |

| Today's Agenda Business and Operational Highlights Bob Shapard Chairman and CEO Financial Overview David Davis Chief Financial Officer Q&A |

| 2009 Highlights Rate case completed and new rates put in place Advanced Metering met many major milestones: Ramped up AMS deployment, with ~660K installed at the end of 2009 Began collection of AMS surcharge Now supports home area network, time of use rates, prepaid rates, and remote connections/disconnects Work on the CREZ projects began: 9 of 14 CCNs filed to date with two CCNs approved $114M in capital expenditures for the year-ended December 31, 2009 Continued focus on ring-fencing and PUCT commitments |

| Operational Excellence Efficient maintenance, operation and outage response Grid operations enhanced through advanced technologies Congestion relief via investment in transmission infrastructure Community/ Customer Focus Environmental Stewardship Several customer focused education programs ongoing "Ask Oncor" meetings to be held across service territory over the next 18 months Enabling delivery of renewable energy Empowering consumers ability to manage energy consumption Facilitate import of cleaner and more efficient power through FACTS technologies Aggressively pursue PHEV initiative in Texas Investment Complete the CREZ investment on schedule working with all major stakeholders Investments in transmission technology including system protection and monitoring Complete deployment of advanced meters and other smart grid initiatives Oncor's Initiatives |

| CREZ CCN Filing Date Anticipated Award DEFAULT LINES Bowman - Jacksboro 5/29/2009 9/29/2009 Jacksboro - Willow Creek - Parker 6/30/2009 12/28/2009 PRIORITY LINES Central B - Central A - Tonkawa 9/16/2009 3/15/2010 Tonkawa - Sweetwater East - Central Bluff 9/16/2009 3/15/2010 Oklaunion - Bowman 9/16/2009 3/15/2010 Brown - Newton 10/07/2009 4/05/2010 Newton - Killeen 10/07/2009 4/05/2010 Central Bluff - Bluff Creek 10/28/2009 4/26/2010 Bluff Creek - Brown 10/28/2009 4/26/2010 SUBSEQUENT LINES Oklaunion - Krum West tbd West B - Moss tbd Willow Creek - Hicks tbd Clear Crossing - Willow Creek tbd Krum West - Anna tbd Completed 6 CREZ projects and commenced construction on 7 of the 51 major projects |

| 15 minute usage data viewable on a day after basis Interactive signaling between REP and Consumer (HAN) Direct Load Control signals Communication of pricing signals "Smart Meter Texas Portal" |

| Oncor uniquely positioned to tie all the pieces together... Support for 18,000 MW of wind power by the end of 2013 3.4 million smart meters by the end of 2012 CREZ Build out 40 million cars in DFW, San Antonio, Houston and Austin areas |

| Challenging Weather and Conditions Produce Oncor's Worst Winter Storm Challenging Weather in Challenging Conditions Produce the Largest Customer Outages for a Winter Storm |

| Economic Indicators - Texas vs. US Least Affected States (Peak to Trough Employment Loss) Texas is One of the Biggest Power Markets In The World Electricity consumption 08; Million MWh US China Japan Russia India Germany Canada France Brazil South Korea UK Texas Italy Spain Metric % Decline Jobs (000s) Duration of Decline (quarters) Peak Unempl Rate 1 North Dakota -0.7 -2.5 5 4.9 2 District of Columbia -1.0 -7.3 4 10.5 3 Alaska -1.1 -3.6 3 8.6 4 Louisiana -2.0 -39.3 5 7.7 5 Montana -2.2 -9.9 8 6.7 6 South Dakota -2.5 -10.5 4 5.8 7 Nebraska -2.6 -24.9 8 5.9 8 Texas -2.9 -311.9 4 8.2 9 Kansas -3.2 -44.7 8 7.8 10 Maryland -3.2 -83.6 8 7.2 Metric Unit Texas US 1 Consumer Confidence Index Percent 71.7 52.9 2 Unemployment Rate Percent 8.3 9.7 3 Consumer Price Index Percent 196.9 216.3 4 Industrial Production Index Percent 112.3 99.4 5 Mortgage Foreclosures Thousands 12.1 306.6 6 Job Losses Thousands 276 4,000 Texas is the 12th largest market in the world, 30% larger than California (the 2nd largest state market in the US) Texas Economic Overview Economic Outlook "Texas has been somewhat insulated from the worst of the recession...along with its lack of a major housing bubble." Global Insight Texas economy continues to fare better than those of many other states. But Texas is feeling the effects of the worldwide recession." Texas Comptroller's Economic Outlook "Economic conditions...continued to firm up over the past six weeks. While conditions appeared to be recovering in many sectors and outlooks were becoming more positive, most contacts only expected a slow and modest improvement in the near term." Jan 2010 Beige Book, Federal Reserve Texas unemployment rate has been at or below the national rate for 35 consecutive months. Texas Comptroller's Economic Outlook "Texas foreclosures is 1 in 785 mortgages compared to Nevada (1 in 95), Florida (1 in 187) and California (1 in 187)." Texas Comptroller's Economic Outlook Source: "Texas Ahead", Texas Comptroller Source: Global Insight Source: EIA |

| Today's Agenda Business and Operational Highlights Bob Shapard Chairman and CEO Financial Overview David Davis Chief Financial Officer Q&A |

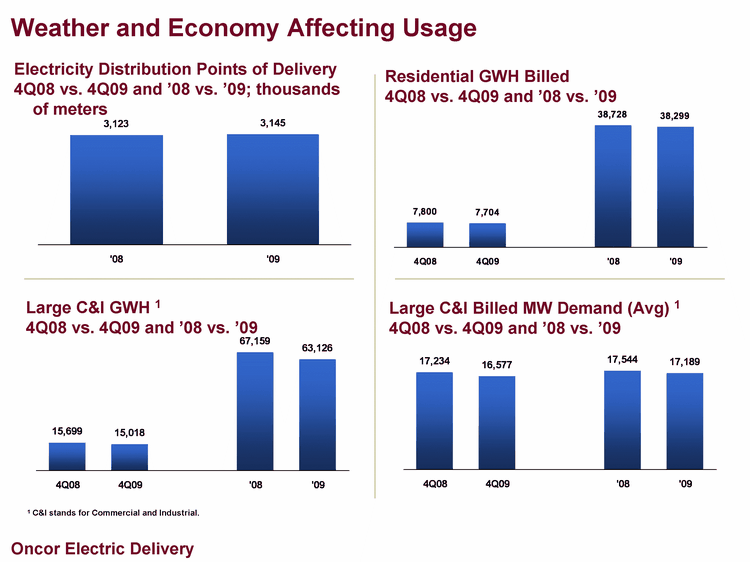
| Weather and Economy Affecting Usage Residential GWH Billed 4Q08 vs. 4Q09 and '08 vs. '09 Large C&I GWH 1 4Q08 vs. 4Q09 and '08 vs. '09 Electricity Distribution Points of Delivery 4Q08 vs. 4Q09 and '08 vs. '09; thousands of meters Large C&I Billed MW Demand (Avg) 1 4Q08 vs. 4Q09 and '08 vs. '09 1 C&I stands for Commercial and Industrial. 4Q08 4Q09 '08 '09 15699 15018 67159 63126 4Q08 4Q09 '08 '09 7800 7704 38728 38299 4Q08 4Q09 '08 '09 17234 16577 17544 17189 '08 '09 3123 3145 |

| Summary of Financial Results1 Adjusted Net Income 4Q08 vs. 4Q09 and '08 vs. '09; $ millions 4Q08 4Q09 '08 '09 60 36 350 306 Operating Revenues 4Q08 vs. 4Q09 and '08 vs. '09; $ millions 4Q08 4Q09 '08 '09 580 619 2440 2543 PP&E, net '08 vs. '09; $ millions '08 '09 8606 9174 Operating Cash Flow 2 4Q08 vs. 4Q09 and '08 vs. '09; $ millions 4Q08 4Q09 '08 '09 219 279 734 853 1 Excludes impacts from transition bond debt, a one-time write-off of regulatory assets and fair value accounting adjustments associated with the October 2007 merger. 2 Cash provided by operating activities, as adjusted by footnote 1. |

| Credit Metrics Remained Strong EBITDA 4Q08 vs. 4Q09 and '08 vs. '09; $ millions EBITDA/Cash Interest TME 12/31/08 vs. TME 12/31/09; Ratio TME 12/31/08 TME 12/31/09 4.5 4.2 Debt/EBITDA TME 12/31/08 vs. TME 12/31/09; Ratio TME 12/31/08 TME 12/31/09 3.8 4 Excludes impacts from transition bond debt, a one-time write-off of regulatory assets and fair value accounting adjustments associated with the October 2007 merger. 4Q08 4Q09 '08 '09 273 279 1219 1237 |

| Oncor's Financial Condition is Strong Revolver Capacity Borrowings Lehman Unfunded Commitment Effective Remaining Capacity Cash Total Available Liquidity 1384 1262 1262 2000 616 122 1262 27 1289 $2.0 billion Secured Revolving Credit Facility Balances at December 31, 2009; $ millions 2,000 616 122 1,262 27 1,289 Rating Outlook Moody's Baa1 Stable Standard & Poor's BBB+ Stable Fitch Ratings BBB Stable 2010 2011 2012 2013 2014 2015 2016 2017 2018 Maturity 700 650 500 550 Solid Credit Ratings at Oncor No Maturities in Near Term Excludes transition bond debt Oncor's $2.0 billion Credit Facility matures in 2013 |

| Oncor Is Administering The Largest Capital Program In Its History '09 '10E Maintenance/Other 207 210 Grid Expansion 337 268 CREZ 114 216 Serve New 174 162 Automated Meters 166 156 Actual and Forecasted Capital Expenditures '08-'10E, $ millions Advanced Meter System IT / Maintenance / General Plant Distribution Investment 998 Transmission Grid Expansion CREZ 1,012 |

| Appendix - Regulation G Reconciliations |

| Measure Definition Operating Cash Flow (GAAP) Cash provided by operating activities. Debt (non-GAAP) Total debt less transition bonds. Total Debt (GAAP) Long-term debt (including current portion) plus bank loans and commercial paper. Adjusted Net Income Net income less effects of purchase accounting (including goodwill adjustments), write offs of regulatory assets and Transition Bond Company. EBITDA (non-GAAP) Income from continuing operations before interest expense and related charges, and provisions in lieu of income tax plus depreciation and amortization and special items. EBITDA is a measure used by Oncor to assess performance. Debt/EBITDA (non-GAAP) Total debt less transition bonds divided by EBITDA. Transition, or securitization, bonds are serviced by a regulatory transition charge on wires rates and are therefore excluded from debt in credit reviews. Debt / EBITDA is a measure used by Oncor to assess credit quality. EBITDA/Interest (non-GAAP) EBITDA divided by cash interest expense is a measure used by Oncor to assess credit quality. Financial Definitions |

| 4Q08 4Q09 08 09 Net Income - Oncor (796) 48 (487) 320 Less: Net Income - BondCo - - - - Less: Effects of fair value accounting (after-tax) 856 (6) 837 (24) Less: Write-Off of Regulatory Assets - 0 - 16 Less: Adjustment of Goodwill Liability - (6) - (6) Adjusted Net Income, excluding BondCo 60 36 350 306 Table 1: Oncor Net Income Reconciliation Quarter and Year Ended December 31, 2008 and 2009 $ millions Excludes impacts from transition bond debt and purchase accounting related adjustments associated with the October 2007 merger, including subsequent goodwill impairment. |

| Table 2: Oncor Operating Revenues Reconciliation Quarter and Year Ended December 31, 2008 and 2009 $ millions 4Q08 4Q09 08 09 Operating Revenues - Oncor 612 653 2,580 2,690 Less: Operating Revenues - BondCo (32) (34) (140) (147) Operating Revenues, excluding BondCo 580 619 2,440 2,543 Excludes impacts from transition bond debt. |

| Table 3: Oncor Operating Cash Flow Reconciliation Quarter and Year Ended December 31, 2008 and 2009 $ millions 4Q08 4Q09 08 09 Operating Cash Flow - Oncor 238 296 828 950 Less: Operating Cash Flow - BondCo (19) (17) (94) (97) Operating Cash Flow, excluding BondCo 219 279 734 853 Excludes impacts from transition bond debt. |

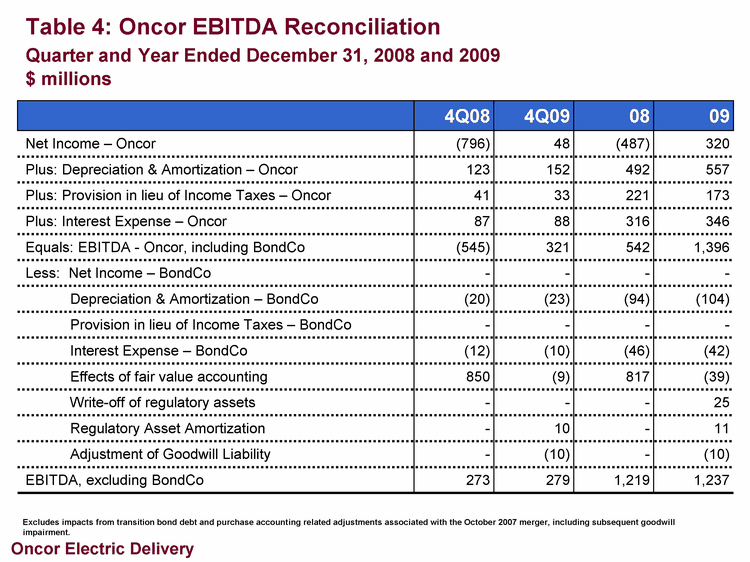
| Table 4: Oncor EBITDA Reconciliation Quarter and Year Ended December 31, 2008 and 2009 $ millions 4Q08 4Q09 08 09 Net Income - Oncor (796) 48 (487) 320 Plus: Depreciation & Amortization - Oncor 123 152 492 557 Plus: Provision in lieu of Income Taxes - Oncor 41 33 221 173 Plus: Interest Expense - Oncor 87 88 316 346 Equals: EBITDA - Oncor, including BondCo (545) 321 542 1,396 Less: Net Income - BondCo - - - - Depreciation & Amortization - BondCo (20) (23) (94) (104) Provision in lieu of Income Taxes - BondCo - - - - Interest Expense - BondCo (12) (10) (46) (42) Effects of fair value accounting 850 (9) 817 (39) Write-off of regulatory assets - - - 25 Regulatory Asset Amortization - 10 - 11 Adjustment of Goodwill Liability - (10) - (10) EBITDA, excluding BondCo 273 279 1,219 1,237 Excludes impacts from transition bond debt and purchase accounting related adjustments associated with the October 2007 merger, including subsequent goodwill impairment. |

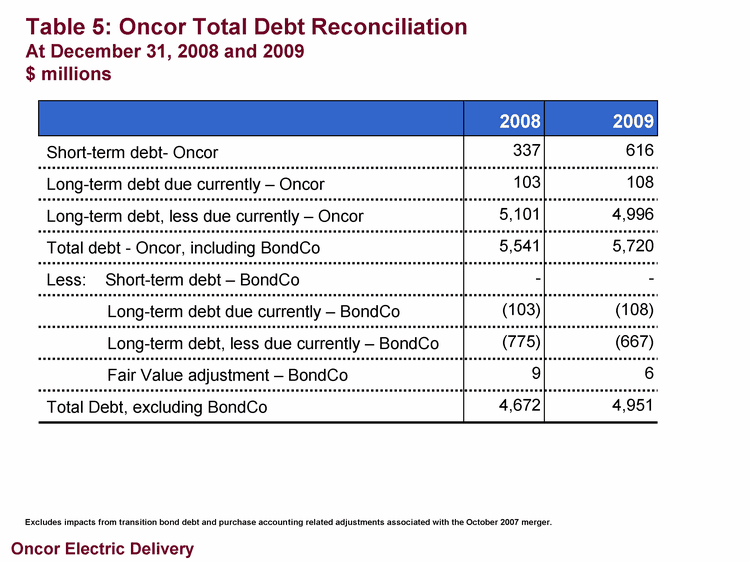
| Table 5: Oncor Total Debt Reconciliation At December 31, 2008 and 2009 $ millions 2008 2009 Short-term debt- Oncor 337 616 Long-term debt due currently - Oncor 103 108 Long-term debt, less due currently - Oncor 5,101 4,996 Total debt - Oncor, including BondCo 5,541 5,720 Less: Short-term debt - BondCo - - Long-term debt due currently - BondCo (103) (108) Long-term debt, less due currently - BondCo (775) (667) Fair Value adjustment - BondCo 9 6 Total Debt, excluding BondCo 4,672 4,951 Excludes impacts from transition bond debt and purchase accounting related adjustments associated with the October 2007 merger. |

| Table 6: Oncor Interest And Debt Coverages Twelve Months Ended December 31, 2008 and 2009 $ millions 08 09 Ref Source Interest expense and related charges - Oncor 316 346 Amortization of debt fair value discount - Oncor (3) (3) Amortization of debt discount - Oncor (5) (7) AFUDC - Oncor 6 2 Cash interest expense - Oncor 314 338 Less: Interest expense - BondCo (46) (42) Cash interest expense, excluding BondCo 268 296 A EBITDA, excluding BondCo 1,219 1,237 B Table 4 Total Debt, excluding BondCo 4,672 4,951 C Table 5 EBITDA/Interest - ratio (B / A) 4.5x 4.2x Debt/EBITDA - ratio (C / B) 3.8x 4.0x Excludes impacts from transition bond debt and purchase accounting related adjustments associated with the October 2007 merger. |
