Attached files
UNITED STATES
SECURITIES AND EXCHANGE COMMISSION
WASHINGTON, D.C. 20549
FORM 10-K
ANNUAL REPORT PURSUANT TO SECTION 13 OR 15(d) OF
THE SECURITIES EXCHANGE ACT OF 1934
Year ended December 31, 2009

8540 Gander Creek Drive
Miamisburg, Ohio 45342
877.855.7243
| Commission File Number |
Registrant | IRS Employer Identification Number |
State of Incorporation | |||
| 001-32956 | NEWPAGE HOLDING CORPORATION | 05-0616158 | Delaware | |||
| 333-125952 | NEWPAGE CORPORATION | 05-0616156 | Delaware |
Securities Registered Pursuant to Section 12(b) of the Act: None
Securities Registered Pursuant to Section 12(g) of the Act: None
Indicate by check mark if the registrant is a well-known seasoned issuer, as defined in Rule 405 of the Securities Act.
| NewPage Holding Corporation |
Yes | ¨ | No | x | ||||
| NewPage Corporation |
Yes | ¨ | No | x |
Indicate by check mark if the registrant is not required to file reports pursuant to Section 13 or Section 15(d) of the Act.
| NewPage Holding Corporation |
Yes | ¨ | No | x | ||||
| NewPage Corporation |
Yes | ¨ | No | x |
Indicate by check mark whether the registrant (1) has filed all reports required to be filed by Section 13 or 15(d) of the Securities Exchange Act of 1934 during the preceding 12 months (or for such shorter period that the registrant was required to file such reports), and (2) has been subject to such filing requirements for the past 90 days.
| NewPage Holding Corporation |
Yes | x | No | ¨ | ||||
| NewPage Corporation |
Yes | x | No | ¨ |
Indicate by check mark whether the registrant has submitted electronically and posted on its corporate Web site, if any, every Interactive Data File required to be submitted and posted pursuant to Rule 405 of Regulation S-T (§232.405 of this chapter) during the preceding 12 months (or for such shorter period that the registrant was required to submit and post such files).
| NewPage Holding Corporation |
Yes | ¨ | No | ¨ | ||||
| NewPage Corporation |
Yes | ¨ | No | ¨ |
Indicate by check mark if disclosure of delinquent filers pursuant to Item 405 of Regulation S-K is not contained herein, and will not be contained, to the best of the registrant’s knowledge, in definitive proxy or information statements incorporated by reference in Part III of this Form 10-K or any amendment to this Form 10-K.
| NewPage Holding Corporation x |
NewPage Corporation x |
Indicate by check mark whether the registrant is a large accelerated filer, an accelerated filer, a non-accelerated filer, or a smaller reporting company. See the definitions of “large accelerated filer,” “accelerated filer” and “smaller reporting company” in Rule 12b-2 of the Exchange Act.
| NewPage Holding Corporation |
Large accelerated filer ¨ | Accelerated filer ¨ | ||||
| Non-accelerated filer x | Smaller reporting company ¨ | |||||
| NewPage Corporation |
Large accelerated filer ¨ | Accelerated filer ¨ | ||||
| Non-accelerated filer x | Smaller reporting company ¨ | |||||
Indicate by check mark whether the registrant is a shell company (as defined in Rule 12b-2 of the Exchange Act).
| NewPage Holding Corporation |
Yes | ¨ | No | x | ||||
| NewPage Corporation |
Yes | ¨ | No | x |
The aggregate market value of NewPage Holding Corporation and NewPage Corporation common stock held by non-affiliates were each $0 as of June 30, 2009.
The number of shares of each Registrant’s Common Stock, par value $0.01 per share, as of February 12, 2010:
| NewPage Holding Corporation |
10 | |||
| NewPage Corporation |
100 |
This Form 10-K is a combined annual report being filed separately by two registrants: NewPage Holding Corporation and NewPage Corporation. NewPage Corporation meets the conditions set forth in general instruction I(1)(a) and (b) of Form 10-K and is therefore filing this form with the reduced disclosure format.
DOCUMENTS INCORPORATED BY REFERENCE—None
References to “NewPage Holding” refer to NewPage Holding Corporation, a Delaware corporation; references to “NewPage” refer to NewPage Corporation, a Delaware corporation and a wholly-owned subsidiary of NewPage Holding. References to “NewPage Group” refer to NewPage Group Inc., a Delaware corporation and the direct parent of NewPage Holding. Unless the context provides otherwise, references to “we,” “us” and “our” refer to NewPage Holding and its subsidiaries. All assets, liabilities, income, expenses and cash flows presented for all periods represent those of NewPage Holding’s wholly-owned subsidiary, NewPage, except for activity related to NewPage Holding’s debt and equity and income tax effects. Unless otherwise noted, the information provided pertains to both NewPage Holding and NewPage. References to “SENA” are to Stora Enso North America Inc., which we acquired from Stora Enso Oyj (“SEO”) on December 21, 2007 (the “Acquisition”). Following the Acquisition, SENA changed its name to NewPage Consolidated Papers Inc., or NPCP. References to both SENA and NPCP are to the acquired business.
FORWARD-LOOKING STATEMENTS
This annual report contains “forward-looking statements” within the meaning of the Securities Exchange Act of 1934, the Private Securities Litigation Reform Act of 1995 and other related laws. All statements other than statements of historical fact are “forward-looking statements” for purposes of federal and state securities laws. Forward-looking statements may include the words “may,” “plans,” “estimates,” “anticipates,” “believes,” “expects,” “intends” and similar expressions. Although we believe that these forward-looking statements are based on reasonable assumptions, they are subject to numerous factors, risks and uncertainties that could cause actual outcomes and results to be materially different from those projected or assumed in our forward-looking statements. These factors, risks and uncertainties include, among others, the following:
| • | our substantial level of indebtedness |
| • | changes in the supply of, demand for, or prices of our products |
| • | general economic and business conditions in the United States and Canada and elsewhere |
| • | the ability of our customers to continue as a going concern, including our ability to collect accounts receivable according to customary business terms |
| • | the activities of competitors, including those that may be engaged in unfair trade practices |
| • | changes in significant operating expenses, including raw material and energy costs |
| • | changes in currency exchange rates |
| • | changes in the availability of capital |
| • | changes in the regulatory environment, including requirements for enhanced environmental compliance |
| • | the other factors described herein under “Risk Factors” |
Given these risks and uncertainties, we caution you not to place undue reliance on forward-looking statements. We undertake no obligation to update or revise any forward-looking statements, either to reflect new developments or for any other reason, except as required by law.
1
INDUSTRY DATA
Information in this annual report concerning the paper and forest products industry and our relative position in the industry is based on independent industry analyses, management estimates and competitor announcements.
PART I
| ITEM 1. | BUSINESS |
General
We believe that we are the largest coated paper manufacturer in North America, based on production capacity. Coated paper is used primarily in media and marketing applications, such as high-end advertising brochures, direct mail advertising, coated labels, magazines, magazine covers and inserts, catalogs and textbooks. For the year ended December 31, 2009, we had net sales of $3.1 billion.
We operate 20 paper machines at ten paper mills located in Kentucky, Maine, Maryland, Michigan, Minnesota, Wisconsin and Nova Scotia, Canada. These mills, along with our distribution centers, are strategically located near major print markets, such as New York, Chicago, Minneapolis and Atlanta. As of December 31, 2009, our mills have total annual production capacity of approximately 4.4 million short tons of paper, including approximately 3.2 million short tons of coated paper, approximately 1 million short tons of uncoated paper and approximately 200,000 short tons of specialty paper.
We have long-standing relationships with many leading publishers, commercial printers, retailers and paper merchants. Our key customers include Condé Nast Publications, The McGraw-Hill Companies, Meredith Corporation, News America Group, Pearson Education, Rodale Inc. and Time Inc. in publishing; Quad/Graphics, R.R. Donnelley & Sons Company and World Color Press Inc. in commercial printing; Sears Holdings Corporation and Williams-Sonoma, Inc. in retailing; and paper merchants Lindenmeyr, a division of Central National-Gottesman Inc., Unisource Worldwide, Inc. and xpedx, a division of International Paper Company. Key customers for specialty paper products include Avery Dennison Corporation and Vacumet Corp.
On December 21, 2007, NewPage acquired all of the issued and outstanding common stock of SENA from SEO. We acquired SENA in order to create a single business platform and to enable us to remain competitive in the marketplace, serve our customers more efficiently and achieve synergies from the Acquisition. The Acquisition more than doubled our production capacity and broadened our product line. In connection with the Acquisition, SEO acquired approximately 20% of the equity in NewPage Group.
2
Organization
The following chart shows our organizational structure and ownership as of February 12, 2010. Except as indicated below, each entity in the chart owns 100% of the equity interests of the entity appearing immediately below it.
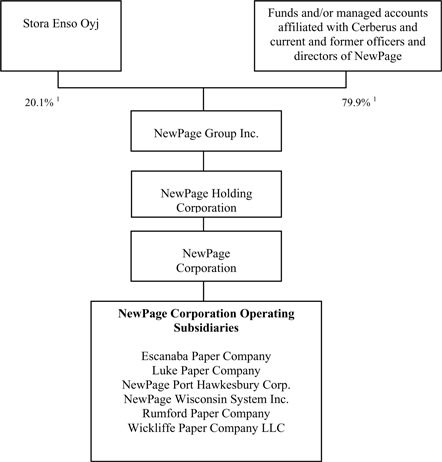
| (1) | Excludes common stock that may be issued upon exercise of options outstanding or that may be granted under the NewPage Group Equity Incentive Plan. |
Industry Overview
The North American paper industry is cyclical and prices for paper, like other cyclical products, are largely affected by the relation of demand to available supply. Demand and supply factors affecting our principal paper products, as well as historical price trends, are discussed below.
3
North American coated paper demand is primarily driven by advertising and print media usage. In particular, the demand for certain grades of coated paper is affected by spending on catalog and promotional materials by retailers and spending on magazine advertising, which affects the number of printed pages in magazines. Advertising spending and magazine and catalog circulation tend to rise when GDP in the United States is robust and typically decline in a sluggish economy. During 2009, North American coated paper demand declined significantly from the prior year reflecting decreased advertising spending and magazine and catalog circulation largely attributable to general economic factors and inventory reductions by customers. North American customers purchased approximately 9 million short tons of coated paper in 2009 compared with approximately 12 million short tons of coated paper in 2008.
In North America, coated paper supply is determined by both local production and imports, principally from Europe and Asia. Imports have become a structural part of the North American coated paper marketplace. The volume of coated paper imports from Europe and Asia is a function of worldwide supply and demand for coated paper, the exchange rate of the U.S. dollar relative to other currencies, especially the Euro, market prices in North America and other markets and the cost of ocean-going freight. Since January 2008, mills and machines in North America with gross coated paper capacity of approximately 2 million tons have been shuttered or switched to other grades. In addition, the industry has also taken significant levels of market-related downtime and temporary shutdowns.
Products
Our portfolio of core paper products includes coated freesheet, coated groundwood, supercalendered, newsprint and specialty papers. Specialty papers are primarily used in labels and packaging. We offer the broadest coated paper product selection of any North American paper manufacturer. We also sell uncoated paper and market pulp. Our brands are some of the most recognized brands in the industry. Substantially all of our 2009 sales were within North America and approximately 91% were within the United States. Our principal product is coated paper, which represented approximately 80% of our net sales for the year ended December 31, 2009.
Coated Paper
We believe that we are the largest coated paper manufacturer in North America based on production capacity. As of December 31, 2009, our mills have total annual production capacity of approximately 3.2 million short tons of coated paper. Coated paper is used primarily in media and marketing applications, including corporate annual reports, high-end advertising brochures, magazines, catalogs and direct mail advertising. Coated paper has a higher level of smoothness than uncoated paper. Increased smoothness is typically achieved by applying a clay-based coating on the surface of the paper and processing that paper under heat and pressure. As a result, coated paper achieves higher reprographic quality and printability.
Coated paper consists of both coated freesheet and coated groundwood, which generally differ in price and quality. The chemically-treated pulp used in freesheet applications produces brighter and smoother paper than the mechanical pulp used in groundwood papers. Coated freesheet papers comprised 58% of the coated paper we produced in 2009. We produce coated freesheet papers in No. 1, No. 2 and No. 3 grades for higher-end uses such as corporate annual reports and high-end advertising, as well as coated one-side paper (C1S), which is used primarily for label and specialty applications.
Coated groundwood papers, which represented 42% of the coated paper we produced in 2009, are typically lighter and less expensive than our coated freesheet products. We produce coated groundwood papers in No. 3, No. 4 and No. 5 grades for use in applications requiring lighter paper stock such as magazines, catalogs and inserts.
4
Each of the paper grades that we manufacture are produced in a variety of weights, sizes and finishes. The coating process changes the gloss, ink absorption qualities, texture and opacity of the paper to meet each customer’s performance requirements. Most of the coated paper that we manufacture is shipped in rolls, with the rest cut into sheets.
Supercalendered Paper
Supercalendered paper is uncoated paper with pigment filler passed through a supercalendering process in which alternating steel and cotton-covered rolls “iron” the paper, giving it a gloss and smoothness similar to coated paper. Our supercalendered paper is primarily used for magazines, catalogs, advertisements, inserts and flyers. We produce supercalendered paper primarily in SC-A and SC-A+ grades.
Newsprint Paper
Newsprint paper is uncoated groundwood paper used primarily for printing daily newspapers and other publications. We are a niche supplier of newsprint paper serving the North American and select international markets in the publishing and printing industry for major end-uses such as inserts and fliers for retail customers.
Specialty Paper
Specialty paper consists of both coated and uncoated paper designed and produced to meet the specific packaging, printing and labeling needs of customers with diverse and specialized paper needs. Specialty papers consist of two primary product lines: technical papers and packaging papers.
Technical papers consist of face papers, thermal transfer, direct thermal base papers and release liners for use in self-adhesive labels. Packaging papers are designed to protect, transport and identify a wide range of products.
Flexible packaging papers are often used as part of a multilayer package construction, in combination with film, foil, extruded coatings, board and other materials. For example, flexible packaging papers are used in pouch, lidding, bag, product packaging and spiral can applications.
Other Products
We also produce uncoated paper and market pulp to enhance our manufacturing efficiency by filling unused capacity, such as when we have excess capacity on a paper machine but not on a coater. Uncoated paper typically is used for business forms and stationery, general printing paper and photocopy paper. We primarily sell uncoated paper to paper merchants, business forms manufacturers and converters.
5
Manufacturing
We operate 20 paper machines at ten paper mills located in Kentucky, Maine, Maryland, Michigan, Minnesota, Wisconsin and Nova Scotia, Canada. All of these paper mills are at least partially-integrated mills, meaning that they produce paper, pulp and energy. Most of the energy produced at these mills is for internal use. As of December 31, 2009, our mills have total annual production capacity of approximately 4.4 million short tons of paper, including approximately 3.2 million short tons of coated paper, approximately 1 million short tons of uncoated paper and approximately 200,000 short tons of specialty paper. With the exception of our Port Hawkesbury, Nova Scotia, mill, substantially all of our long-lived assets are located within the United States. The following table lists the paper products produced at each of our mills, as well as each mill’s approximate annual paper capacity, as of December 31, 2009:
| Mill Location |
Products |
Paper Capacity | ||
| Biron, Wisconsin | Coated paper | 400,000 | ||
| Duluth, Minnesota | Supercalendered paper | 260,000 | ||
| Escanaba, Michigan | Coated and uncoated paper | 845,000 | ||
| Luke, Maryland | Coated and specialty paper | 530,000 | ||
| Port Hawkesbury, Nova Scotia | Supercalendered paper and newsprint | 590,000 | ||
| Rumford, Maine | Coated and specialty paper | 570,000 | ||
| Stevens Point, Wisconsin | Specialty paper | 170,000 | ||
| Whiting, Wisconsin | Coated paper | 260,000 | ||
| Wickliffe, Kentucky | Coated, specialty and uncoated paper | 255,000 | ||
| Wisconsin Rapids, Wisconsin | Coated paper | 520,000 |
During 2008, we shut down six of our less efficient, higher cash cost paper machines. We have reallocated production of paper grades across our remaining combined machine base, resulting in the operation of machines in narrower ranges of paper grades around their peak production. In addition, we completed the shutdown of our Chillicothe, Ohio converting facility in February 2009 and transferred production to our remaining two converting facilities. As a result of the restructuring activities undertaken, we reduced our overall workforce by approximately 11% from December 31, 2007 to December 31, 2009.
Through reallocation of production among our combined mills, we are producing products in closer proximity to our customers to reduce freight costs. In addition, we continue to implement best practices across our combined mill system and focus on increasing our overall profitability, rather than independently at each individual mill.
Paper machines are large, complex systems that operate more efficiently when operated continuously. Paper machine production and yield decline when a machine is stopped for any reason. Therefore, we organize our manufacturing processes so that our paper machines and most of our paper coaters run almost continuously throughout the year. Some of our paper machines also offer the flexibility to change the type of paper produced on the machine, which allows easier matching of production schedules and seasonal and geographic demand swings.
The first step in the production of paper is to produce pulp from wood. Pulp for groundwood and supercalendered paper is produced using a mechanical or thermo-mechanical process. Pulp for freesheet paper is produced by placing wood chips that are mixed with various chemicals into digester “cooking” vessels. The pulp is then washed and bleached. To turn the pulp into paper, it is processed through a paper machine. Hardwood and softwood pulp is blended based on the desired paper characteristics.
6
To produce coated paper, uncoated paper is put through a coating process. Our mills have both on-machine coaters, which are integrated with the paper machines, and separate off-machine coaters. On-machine coaters generally are considered to be more efficient, while off-machine coaters generally are considered to have more flexibility. After the coating process is complete, the coated paper is slit and wound into rolls to be sold to customers. We also have converting facilities at which we convert some of these rolls into sheets.
Paper production is energy intensive. During 2009, we produced approximately 45% of our energy requirements by means of biomass-related fuels, which included black liquor, wood waste and bark. The energy we purchased from outside suppliers consisted of a portion of our electricity, natural gas, fuel oil, steam, petroleum coke, tire-derived fuel and coal. The majority of our coal needs are purchased under long-term supply contracts, while the other purchased fuels are priced based on current market rates. We periodically enter into fixed priced contracts or financial hedges for a portion of our estimated future natural gas requirements.
Our wholly-owned subsidiary, Consolidated Water Power Company, or CWPCo, provides energy to our mills in central Wisconsin. CWPCo has 33.3 megawatts of generating capacity on 39 generators located in five hydroelectric plants on the Wisconsin River. CWPCo is a regulated public utility and also provides electricity to a small number of residential, light commercial and light industrial customers.
We also are the general partner and have a 40% investment in Rumford Cogeneration Company L.P., a joint venture created to generate power for us at our Rumford, Maine, mill and for public sale. During 2009, we purchased the partnership interest of one limited partner. We also entered into an agreement in 2009 to purchase the remaining partnership interests for $6 million by December 31, 2010.
Raw Materials and Suppliers
Pulp and wood fiber are the primary raw materials used in making paper. Pulp is the generic term that describes the cellulose fiber derived from wood. These fibers may be separated by mechanical, thermo-mechanical or chemical processes. The processes we use at our mills to produce pulp for freesheet paper involve removing the lignin, which bind the wood fibers, to leave cellulose fibers. We use most of our pulp production internally to reduce the amount of pulp purchased from third parties. We sell our excess hardwood pulp, which we refer to as market pulp, to third parties in the United States and internationally.
The primary sources of wood fiber are timber and its byproducts, such as wood chips. We are a party to various fiber supply agreements to supply our mills with hardwood, softwood, aspen pulpwood and wood chips. These agreements require the counterparty to sell to the mills, and require the mills to purchase, a designated minimum number of tons of pulpwood and wood chips during the specified terms of the arrangement, which have various expiration dates from December 31, 2010 to December 31, 2053. The aggregate annual purchase requirement under these agreements is approximately 3 million tons in 2010, approximately 2 million tons per year from 2011 to 2015, approximately 1 million tons per year from 2016 to 2020 and approximately 300,000 tons per year from 2021 to 2026. In 2020, all of the agreements terminate with the exception of an agreement with respect to our Rumford, Maine, mill, which terminates in 2053. For all of the pulpwood agreements, we may purchase a substantial portion of any additional pulpwood harvested by the counterparty during each year. The prices to be paid under these agreements are determined by formulas based upon market prices in the relevant regions and are subject to periodic adjustments based on procedures stipulated in each agreement. The amount of timber we receive under these agreements has varied, and is expected to continue to vary, according to the price and supply of wood fiber for sale on the open market and the harvest levels the timberland owners deem appropriate in the management of the timberlands.
7
Our Port Hawkesbury, Nova Scotia mill manages approximately 1,500,000 acres of land licensed from the Province of Nova Scotia and 59,000 acres of land we own in Nova Scotia. All wood harvested from the licensed lands must be used in our Port Hawkesbury mill unless otherwise agreed to by the Province of Nova Scotia. The license is for a 50 year period, renewable every 10 years, and currently expires in July 2051. The license may be terminated by the Province of Nova Scotia if the Port Hawkesbury mill is not operational for a continuous period of two years.
We seek to fulfill substantially all of our wood needs with timber that is harvested by professional loggers trained in certification programs that are designed to promote sustainable forestry. We do not accept wood from old growth forests, forests of exceptional conservation value or rainforests. We do not accept illegally harvested or stolen wood. We have formally notified our outside wood chip suppliers that we expect their wood supply will be produced by trained loggers in compliance with sustainable forestry principles. Our goal is to ensure that sustainable forestry-trained loggers are used to supply essentially all of the wood to our mills. We oppose and, through our participation in the American Forest and Paper Association, World Resources Institute and other organizations, are working to stop illegal logging in the United States and worldwide.
Chemicals used in the production of paper include latex and starch, which are used to affix coatings to paper; calcium carbonate, which brightens paper; titanium, which makes paper opaque; and other chemicals used to bleach or color paper. We purchase these chemicals from various suppliers. We believe that the loss of any one or any related group of chemical suppliers would not have a material adverse effect on our business, financial condition or results of operations.
Customers
We have long-standing relationships with many leading publishers, commercial printers, retailers and paper merchants. Our ten largest customers accounted for approximately half of our net sales for 2009. Our key customers include Condé Nast Publications, The McGraw-Hill Companies, Meredith Corporation, News America Group, Pearson Education, Rodale Inc. and Time Inc. in publishing; Quad/Graphics, R.R. Donnelley & Sons Company and World Color Press Inc. in commercial printing; Sears Holdings Corporation and Williams-Sonoma, Inc. in retailing; and paper merchants Lindenmeyr, a division of Central National-Gottesman Inc., Unisource Worldwide, Inc. and xpedx, a division of International Paper Company. Key customers for specialty paper products include Avery Dennison Corporation and Vacumet Corp.
During 2009, xpedx accounted for 19% of net sales. No other customer accounted for more than 10% of our 2009 net sales.
Sales, Marketing and Distribution
We sell our paper products primarily in the United States and Canada, using three sales channels:
| • | direct sales, which consist of sales made directly to end-use customers, primarily large companies such as publishers, printers and retailers |
| • | merchant sales, which consist of sales made to paper merchants and brokers, who in turn sell to end-use customers |
| • | specialty sales, which consist of sales made to packaging and label manufacturers |
Across the three channels of our sales network, sales professionals are compensated with a salary and bonus plan based on account profitability and individual assignments. As part of our customer service, we seek to provide value-added services to customers. For example, within the merchant channel, we work closely with customers to meet specifications and to utilize joint marketing efforts when appropriate.
8
We also emphasize technical support as part of our commitment to customers. We seek to enhance efficiency for customers by enabling them to interact with us online, including through order access, planning, customer data exchange and consumption estimation tools.
The locations of our paper mills and distribution centers also provide certain logistical advantages as a result of their close proximity to several major print markets, including New York, Chicago, Minneapolis and Atlanta, which affords us the ability to more quickly and cost-effectively deliver our products to those markets. We have two major distribution facilities located in Bedford, Pennsylvania and Sauk Village, Illinois. In total, we own one warehouse and lease space in approximately 50 warehouses. Paper merchants also provide warehouse and distribution systems to service the needs of commercial print customers. We use third parties to ship our products by truck and rail. In addition, we utilize integrated tracking systems that track all of our products through the distribution process. Customers can access order tracking information over the internet. Most of our products are delivered directly to printers or converters, regardless of sales channel.
Competition
The North American paper industry is highly competitive. We compete based on a number of factors, including price, product availability, quality, breadth of product offerings, customer service and distribution capabilities. When a coated paper manufacturer announces a price increase, it generally takes effect over time. Whether a price increase is successful depends on supply, demand and other competitive factors in the marketplace.
Our primary competitors for coated paper are AbitibiBowater Inc., Appleton Coated LLC, Sappi Limited, UPM-Kymmene Corporation and Verso Paper, Inc. Our primary competitors for supercalendered paper are AbitibiBowater Inc., Catalyst Paper Corporation and Irving Paper Ltd. Our primary competitors for newsprint are AbitibiBowater Inc. and Catalyst Paper Corporation.
The competition in the specialty paper category is diverse and highly fragmented, varying by product end use. Our primary competitors for specialty paper products are Boise Cascade LLC, Dunn Paper Inc., Fraser Papers Inc., International Paper Company, UPM-Kymmene Corporation and Wausau Paper Corp.
Some of our competitors have greater financial and other resources than we do or may be better positioned than we are to compete for certain opportunities. We also believe that our competitors in China and Indonesia have been selling their products in our markets at less than fair value and have been subsidized by their governments. In September 2009, NewPage, along with two other U.S. paper producers and the United Steelworkers, filed antidumping and countervailing duty petitions with the U.S. Department of Commerce and the U.S. International Trade Commission alleging that manufacturers of certain coated paper in China and Indonesia are dumping their products in the United States and that these manufacturers have been subsidized by their governments in violation of U.S. trade laws. The petitions also allege that the U.S. industry producing comparable coated paper is being injured as a result of unfairly traded imports from these countries. The U.S. International Trade Commission, by unanimous vote on November 6, 2009, determined that there is reasonable indication that the U.S. industry is being materially injured by unfairly traded Chinese and Indonesian imports. As a result, the U.S. Department of Commerce has commenced a full investigation of coated paper imports from China and Indonesia. We expect that the Department of Commerce will issue its preliminary determinations by the end of April 2010. We expect that final determinations in the cases will be completed by the end of 2010.
9
Information Technology Systems
We use integrated information technology systems that help us manage our product pricing, customer order processing, customer billing, raw material purchasing, inventory management, production controls and shipping management, as well as our human resources management and financial management. Our information technology systems utilize principally third-party software. As part of the reorganization plan associated with the Acquisition, we migrated the acquired mills to our existing information technology system and integrated NPCP’s order management, purchasing, inventory and finance information systems with our existing systems and completed this action during the third quarter of 2009.
Intellectual Property
In general, paper production does not rely on proprietary processes or formulas, except in highly specialized or custom grades. We hold foreign and domestic patents as a result of our research and product development efforts and also have the right to use certain other patents and inventions in connection with our business. We also own registered trademarks for some of our products. Although, in the aggregate, our patents and trademarks are important to our business, financial condition and results of operations, we believe that the loss of any one or any related group of intellectual property rights would not have a material adverse effect on our business, financial condition or results of operations.
Employees
As of December 31, 2009, we had approximately 7,500 employees. Approximately 70% of our employees were represented by labor unions, principally by the United Steelworkers, the International Brotherhood of Electrical Workers, the Communications, Energy and Paperworkers Union of Canada, the International Association of Machinists and Aerospace Workers, the United Association of Journeymen and Apprentices of the Plumbing and Pipefitting Industry of the United States and Canada, the Teamsters, Chauffeurs, Warehousemen and Helpers, and the Office & Professional Employees’ International Union.
We have 17 collective bargaining agreements expiring at various times through December 1, 2012. Approximately 925 employees at the Escanaba, Michigan, mill are covered under three contracts that expired in June and July of 2008 and are currently under renegotiation. In addition, three contracts covering an aggregate of approximately 550 employees at our Port Hawkesbury, Nova Scotia, mill expired on May 31, 2009. The unions at this mill engage in pattern bargaining, which means that they negotiate a new contract with one industry participant before negotiating with others. The unions currently are negotiating with another paper company and have not yet initiated negotiations with us.
We have not experienced any significant work stoppages or employee-related problems that had a material effect on our operations over the last five years. We consider our employee relations to be good. Our Port Hawkesbury, Nova Scotia, mill was closed from December 2005 until October 2006, before our ownership of the mill, due to a labor dispute.
Environmental and Other Governmental Regulations
Our operations are subject to federal, state, provincial and local environmental laws and regulations in the United States and Canada, such as the Federal Water Pollution Control Act of 1972, the Federal Clean Air Act, the Federal Resource Conservation and Recovery Act, and the Comprehensive Environmental Response, Compensation and Liability Act of 1980, as amended, or CERCLA. Among the activities subject to environmental regulation are the emissions of air pollutants; discharges of wastewater and stormwater; generation, use, storage, treatment and disposal of, or exposure to, materials and waste; remediation of soil, surface water and ground water contamination; and liability for damages to natural resources. In addition, we are required to obtain and maintain environmental permits and approvals in connection with our operations. Many environmental laws and regulations provide for substantial fines or penalties and criminal sanctions for failure to comply with orders and directives requiring that certain measures or actions be taken to address environmental issues.
10
Certain of these environmental laws, such as CERCLA and analogous state and foreign laws, provide for strict liability, and under certain circumstances joint and several liability, for investigation and remediation of releases of hazardous substances into the environment, including soil and groundwater. These laws may apply to properties presently or formerly owned or operated by or presently or formerly under the charge, management or control of an entity or its predecessors, as well as to conditions at properties at which wastes attributable to an entity or its predecessors were disposed. Under these environmental laws, a current or previous owner or operator of real property or a party formerly or previously in charge, management or control of real property, and parties that generate or transport hazardous substances that are disposed of at real property, may be held liable for the cost to investigate or clean up that real property and for related damages to natural resources.
We handle and dispose of wastes arising from our mill operations, including by the operation of a number of landfills. We may be subject to liability, including liability for investigation and cleanup costs, if contamination is discovered at one of these mills, landfills, or at another location where we have disposed of, or arranged for the disposal of, waste. While we believe, based upon current information, that we are in substantial compliance with applicable environmental laws and regulations, we could be subject to potentially significant fines or penalties for failing to comply with environmental laws and regulations. MeadWestvaco and SEO have separately agreed to indemnify us for certain environmental liabilities related to the properties acquired from them, subject to certain limitations. We agreed to indemnify the purchaser of our carbonless paper business for certain environmental liabilities, subject to certain limitations.
Compliance with environmental laws and regulations is a significant factor in our business. We did not incur any capital expenditures in 2009 to maintain compliance with applicable environmental laws and regulations and to meet new regulatory requirements. We do not expect to incur any environmental capital expenditures in 2010. Environmental compliance may require significant capital or operating expenditures over time as environmental laws or regulations, or interpretation thereof, change or the nature of our operations require us to make significant additional expenditures.
Our operations also are subject to a variety of worker safety laws in the United States and Canada. The Occupational Safety and Health Act, U.S. Department of Labor Occupational Safety and Health Administration regulations and analogous state and provincial laws and regulations mandate general requirements for safe workplaces for all employees. We believe that we are operating in material compliance with applicable employee health and safety laws.
Available Information
Our annual report on Form 10-K, quarterly reports on Form 10-Q, current reports on Form 8-K and amendments to those reports are available without charge on our website, www.newpagecorp.com, as soon as is reasonably practicable after they are filed electronically with the SEC. We will also provide a free copy of any of our filed documents upon written request to: General Counsel, NewPage Corporation, 8540 Gander Creek Drive, Miamisburg, Ohio 45342.
The public may read and copy any materials we file with the SEC at the SEC’s Public Reference Room at 100 F Street NE, Washington, DC 20549. The public may obtain information on the operation of the Public Reference Room by calling the SEC at 1-800-SEC-0330. The SEC maintains an internet site that contains reports, proxy and information statements, and other information regarding issuers that file electronically with the SEC (http://www.sec.gov).
11
| ITEM 1A. | RISK FACTORS |
The risks discussed below, any of which could materially affect our business, financial condition or results of operations, are not the only risks facing us. Additional risks and uncertainties not currently known to us or that we currently deem to be immaterial may also materially and adversely affect our business, financial condition or results of operations.
Our substantial level of indebtedness could adversely affect our business, financial condition or results of operations.
We have substantial indebtedness. As of December 31, 2009, we had $3,338 million of total indebtedness, of which $52 million consisted of borrowings under our revolving credit facility (excluding letters of credit), and we had up to $354 million available for borrowing under our revolving credit facility (after deducting for $94 million in outstanding letters of credit and not taking into account any borrowing base limitations). Total indebtedness for NewPage was $3,131 million at December 31, 2009. We may incur additional indebtedness subject to restrictions in our existing debt instruments. If additional debt is added to our and our subsidiaries’ current debt levels, the related risks that we now face could intensify.
Our substantial indebtedness could have important consequences, including the following:
| • | it may be more difficult for us to satisfy our obligations with respect to our outstanding indebtedness |
| • | our ability to obtain additional financing for working capital, debt service requirements, general corporate or other purposes may be impaired |
| • | we must use a substantial portion of our cash flow to pay interest and principal on our indebtedness, which reduces the funds available to us for other purposes |
| • | we are more vulnerable to economic downturns and adverse industry conditions |
| • | our ability to capitalize on business opportunities and to react to competitive pressures and changes in our industry as compared to our competitors may be compromised due to our high level of indebtedness |
| • | our ability to refinance our indebtedness may be limited |
In addition, we cannot assure you that we will be able to refinance any of our debt on commercially reasonable terms or at all. If we were unable to make payments on or refinance our debt or obtain new financing under these circumstances, we would have to consider other options, such as:
| • | sales of assets |
| • | reduction or delay of capital expenditures |
| • | sales of equity |
| • | negotiations with our lenders to restructure the applicable debt |
| • | cash equity contributions from our controlling equity owner or others |
| • | commencement of voluntary bankruptcy proceedings |
12
Our debt instruments may restrict, or market or business conditions may limit, our ability to use some of our options.
A portion of our debt bears interest at variable rates. If market interest rates increase, it could adversely affect our cash flow, compliance with our debt covenants or the amount of our cash interest payments.
As of December 31, 2009, we had $484 million of indebtedness consisting of borrowings that bear interest at variable rates, representing 14% of our total indebtedness. Variable-rate indebtedness at NewPage was $277 million at December 31, 2009, representing 9% of its total indebtedness. If market interest rates increase, variable-rate debt will create higher debt service requirements, which would adversely affect our cash flow and compliance with our debt covenants. As of December 31, 2009, weighted average interest rates were 5.0% on borrowings under the revolving credit facility, 6.5% on the NewPage floating rate senior secured notes due 2012 and 7.6% on the NewPage Holding floating rate senior unsecured PIK Notes due 2013 (the “NewPage Holding PIK Notes”). Each one-eighth percentage-point change in LIBOR would result in a $0.3 million change in annual interest expense on the floating rate notes, a $0.3 million change in annual interest expense on the NewPage Holding PIK Notes and, assuming the entire revolving credit facility were drawn, a $0.6 million change in interest expense on the revolving credit facility, in each case, without taking into account any interest rate derivative agreements. While we may from time-to-time enter into agreements limiting our exposure to higher market interest rates, these agreements may not offer complete protection from this risk.
Servicing our indebtedness will require a significant amount of cash. Our ability to generate sufficient cash depends on numerous factors beyond our control, and we may be unable to generate sufficient cash flow to service our debt obligations.
Our ability to make payments on and to refinance our indebtedness will depend on our ability to generate cash in the future. This, to a certain extent, is subject to general economic, political, financial, competitive, legislative, regulatory and other factors that are beyond our control.
During 2009, we expended approximately $305 million to service our indebtedness as compared to approximately $267 million during 2008. For the year ended December 31, 2009, our interest expense was $438 million (including a loss on extinguishment of debt of $85 million and a reclassification adjustment of $48 million of unrealized losses on our interest rate swaps from accumulated other comprehensive income (loss)), compared to $298 million for the year ended December 31, 2008. Interest expense for NewPage was $418 million for the year ended December 31, 2009 compared to $277 million for the year ended December 31, 2008. We cannot assure you that our business will generate sufficient cash flow from operations or that future borrowings will be available to us under the revolving credit facility in an amount sufficient to enable us to pay our indebtedness or to fund our other liquidity needs. If our cash flows and capital resources are insufficient to allow us to make scheduled payments on our indebtedness or to fund our other liquidity needs, we may need to reduce or delay capital expenditures, sell assets, seek additional capital or restructure or refinance all or a portion of our indebtedness on or before maturity. We cannot assure you that we will be able to refinance any of our indebtedness, or that we will be able to refinance on commercially reasonable terms or that these measures would satisfy our scheduled debt service obligations. If we are unable to generate sufficient cash flow or refinance our debt on favorable terms it could have a material adverse effect on our financial condition, the value of the outstanding debt and our ability to make any required cash payments under our indebtedness.
13
Our debt instruments impose significant operating and financial restrictions on us.
The indentures and other agreements governing our debt instruments impose significant operating and financial restrictions on us. These restrictions limit our ability to, among other things:
| • | incur additional indebtedness or guarantee obligations |
| • | repay indebtedness prior to stated maturities |
| • | pay dividends or make certain other restricted payments |
| • | make investments or acquisitions |
| • | create liens or other encumbrances |
| • | transfer or sell certain assets or merge or consolidate with another entity |
| • | engage in transactions with affiliates |
| • | engage in certain business activities |
In addition to the covenants listed above, our revolving credit facility requires the maintenance of at least $50 million of borrowing availability under the revolving credit facility through the date of the delivery of the compliance certificate with respect to the fiscal quarter ending March 31, 2011 and limits our ability to make capital expenditures. Subsequent to March 31, 2011, we would have to comply with various other specified financial ratios and tests, including minimum interest and fixed charge coverage ratios and total and senior leverage ratios to the extent that NewPage’s unused borrowing availability under the revolving credit facility is below $50 million for 10 consecutive business days or $25 million for three consecutive business days.
Our ability to comply with these covenants may be affected by events beyond our control, and an adverse development affecting our business could require us to seek waivers or amendments of covenants, alternative or additional sources of financing or reductions in expenditures. We cannot assure you that such waivers, amendments or alternative or additional financings could be obtained on acceptable terms or at all.
A breach of any of the covenants or restrictions contained in any of our existing or future financing agreements, including our inability to comply with the required financial covenants in our revolving credit facility, could result in an event of default under those agreements. Such a default could allow the lenders under our financing agreements, if the agreements so provide, to discontinue lending, to accelerate the related debt as well as any other debt to which a cross acceleration or cross default provision applies, and to declare all borrowings outstanding thereunder to be due and payable. In addition, the lenders could terminate any commitments they had made to supply us with further funds. If the lenders require immediate repayments, we will not be able to repay them, or the other holders of our debt, in full.
We cannot assure you that we will be in compliance with these covenants in the periods required or that we will be able to refinance the revolving credit facility in the event it cannot comply with the applicable covenants.
Lenders under our revolving credit facility may not fund their commitments.
Under the credit agreement governing our revolving credit facility, if a lender’s commitment is not honored, that portion of the lender’s commitment under the revolving credit facility will be unavailable to the extent that the lender’s commitment is not replaced by a new commitment from an alternate lender.
14
Lenders under our revolving credit facility are well-diversified, totaling eleven lenders at December 31, 2009. We currently anticipate that these lenders will participate in future requests for funding. However, there can be no assurance that further deterioration in the credit markets and overall economy will not affect the ability of our lenders to meet their funding commitments. Additionally, our lenders have the ability to transfer their commitments to other institutions, and the risk that committed funds may not be available under distressed market conditions could be exacerbated to the extent that consolidation of the commitments under our facilities or among its lenders were to occur.
Our controlling equity holder may take actions that conflict with interests of the debtholders.
A substantial portion of the voting power of our equity is held indirectly by affiliates of Cerberus. Accordingly, Cerberus indirectly controls the power to elect our directors and officers, to appoint new management and to approve all actions requiring the approval of the holders of our equity (subject to certain specified consent rights of SEO under the security holders agreement between NewPage Group and SEO), including adopting amendments to our constituent documents and approving mergers, acquisitions or sales of all or substantially all of our assets. The directors have the authority, subject to the terms of our debt, to issue additional indebtedness or equity, implement equity repurchase programs, declare dividends and make other such decisions about our equity.
In addition, the interests of our controlling equity holder could conflict with those of our debtholders if, for example, we encounter financial difficulties or are unable to pay our debts as they mature. Our controlling equity holder also may have an interest in pursuing acquisitions, divestitures, financings or other transactions that, in its judgment, could enhance its equity investment, even though these transactions might involve risks to our debtholders.
Demand for coated paper has declined due to recent general economic events. Further declines in demand could have a material adverse effect on our business, financial condition and results of operations.
Deteriorating general economic conditions have had an adverse effect on the demand for our products since the second half of 2008. North American coated paper demand is primarily driven by advertising and print media usage. In particular, the demand for certain grades of coated paper is affected by spending on catalog and promotional materials by retailers and spending on magazine advertising, which affects the number of printed pages in magazines. Since the second half of 2008, advertising and print media usage has declined. As a result of lower demand in the current economic environment, sales prices began to decline during the fourth quarter of 2008 and throughout much of 2009, until stabilizing during the fourth quarter of 2009. Further declines in the general economic environment could have a material adverse effect on our business, financial condition and results of operations.
We have limited ability to pass through increases in our costs. Increases in our costs or decreases in our paper prices could adversely affect our business, financial condition and results of operations.
Our earnings are sensitive to changes in the prices of our paper products. Fluctuations in paper prices, and coated paper prices in particular, historically have had a direct effect on our net income (loss) and EBITDA for several reasons:
| • | Market prices for paper products are a function of supply and demand, factors over which we have limited influence. We therefore have limited ability to control the pricing of our products. Market prices of grade No. 3 coated paper, 60 lb. weight, which is an industry benchmark for coated freesheet paper pricing, have fluctuated since 2000 from a high of $1,100 per ton to a low of $705 per ton. Market prices of grade No. 4 coated paper, 50 lb. weight, which is an industry benchmark for coated groundwood paper pricing, and grade SC-A, 35 lb. weight, which is an industry benchmark for supercalendered paper pricing, have generally followed similar trends. Because market conditions determine the price for our paper products, the price for our products could fall below our production costs. |
15
| • | Market prices for paper products typically are not directly affected by raw material costs or other costs of sales, and consequently we have limited ability to pass through increases in our costs to our customers absent increases in the market price. Thus, even though our costs may increase, our customers may not accept price increases for our products, or the prices for our products may decline. |
| • | Paper manufacturing is highly capital-intensive and a large portion of our and our competitors’ operating costs are fixed. Additionally, paper machines are large, complex systems that operate more efficiently when operated continuously. Consequently, we typically continue to run our machines whenever marginal sales exceed the marginal costs. |
Our ability to achieve acceptable margins is, therefore, principally dependent on managing our cost structure and managing changes in raw materials prices, which represent a large component of our operating costs and fluctuate based upon factors beyond our control. If the prices of our products decline, or if our raw material costs increase, or both, it could have a material adverse effect on our business, financial condition and results of operations. For a further discussion of the variability of our paper prices and our costs and expenses, see “Management’s Discussion and Analysis of Financial Condition and Results of Operations—Selected Factors That Affect Our Operating Results.”
During 2009 the U.S. Internal Revenue Code allowed a refundable excise tax credit for alternative fuel mixtures produced for sale or for use as a fuel in a trade or business for which we recognized income of $304 million in 2009. Weighted-average coated paper prices decreased to $911 per ton in 2009 compared to $983 per ton in 2008. We believe that generally the industry passed on most of the benefits of the alternative fuel mixture credit to customers in the form of lower prices. At this time, we view any extension of this credit, or the introduction of any similar program in the foreseeable future, as unlikely. If, as a result of expiration of this credit, the prices of our products do not increase, it could have a material adverse effect on our business, financial condition and results of operations.
Most of the raw material, labor and other cost of sales at our Port Hawkesbury, Nova Scotia, mill are denominated in Canadian dollars. North American sales prices for the products produced at Port Hawkesbury are determined primarily by the U.S. dollar price per ton charged by U.S. producers. If the U.S. dollar were to weaken significantly against the Canadian dollar, it would impair the ability of the Port Hawkesbury mill to compete profitably.
The markets in which we operate are highly competitive and imports could materially adversely affect our business, financial condition and results of operations.
Our business is highly competitive. Competition is based largely on price. We compete with numerous North American paper manufacturers. We also face competition from foreign producers, some of which we believe are lower cost producers than us. Foreign overcapacity could result in an increase in the supply of paper products available in the North American market. Certain Asian producers, in particular, have significantly increased imports to the U.S. in recent years, and we believe that producers in China and Indonesia have been selling in our markets at less than fair value and have been subsidized by their governments.
16
Our non-U.S. competitors may develop a competitive advantage over us and other U.S. producers if the U.S. dollar strengthens in comparison to the home currency of those competitors, if the home currency of those competitors (particularly in China) is maintained by their governments at a low value compared to the U.S. dollar, if those competitors receive governmental subsidies or incentives or if ocean shipping rates decrease. If the U.S. dollar strengthens, if foreign currencies are maintained at low values, if shipping rates decrease, if foreign producers receive governmental subsidies or incentives or if overseas supply exceeds demand, imports may increase, which, in turn, would cause the supply of paper products available in the North American market to increase. An increased supply of paper could cause us to lower our prices or lose sales to competitors, either of which could have a material adverse effect on our business, financial condition and results of operations.
In addition, the following factors will affect our ability to compete:
| • | product availability |
| • | the quality of our products |
| • | our breadth of product offerings |
| • | our ability to maintain plant efficiencies and high operating rates and thus lower our average manufacturing costs per ton |
| • | our ability to provide customer service that meets customer requirements and our ability to distribute our products on time |
| • | costs to comply with environmental laws and regulations |
| • | our ability to produce products that meet customer requirements for the use of sustainable forestry principles, recycled content and environmentally friendly energy sources |
| • | the availability or cost of chemicals, wood, energy and other raw materials and labor |
Furthermore, some of our competitors have greater financial and other resources than we do or may be better positioned than we are to compete for certain opportunities.
If we are unable to obtain raw materials, including petroleum-based chemicals, at favorable prices, or at all, it could adversely affect our business, financial condition and results of operations.
We have no significant timber holdings and purchase wood, chemicals and other raw materials from third parties. We may experience shortages of raw materials or be forced to seek alternative sources of supply. If we are forced to seek alternative sources of supply, we may not be able to do so on terms as favorable as our current terms or at all. The prices for many chemicals, especially petroleum-based chemicals, have had significant fluctuations over the past several years. Chemical prices have historically been and are expected to continue to be volatile. In addition, chemical suppliers that use petroleum-based products in the manufacture of their chemicals may, due to a supply shortage, ration the amount of chemicals available to us or we may not be able to obtain the chemicals we need at favorable prices, if at all. Chemical suppliers also may be adversely affected by, among other things, hurricanes and other natural disasters. Certain specialty chemicals that we purchase are available only from a small number of suppliers. We may experience additional cost pressures if merger and acquisition activity occurs among our major chemical suppliers. If any of our major chemical suppliers were to cease operations or cease doing business with us, we may be unable to obtain these chemicals at favorable prices, if at all.
In addition, wood prices are dictated largely by demand. The primary source for wood fiber is timber. Environmental litigation and regulatory developments have caused, and may cause in the future, significant reductions in the amount of timber available for commercial harvest in Canada and the United States. In addition, future domestic or foreign legislation, litigation advanced by aboriginal groups, litigation concerning the use of timberlands, the protection of threatened or endangered species, the promotion of forest biodiversity and the response to and prevention of catastrophic wildfires and campaigns or other measures by environmental activists could also affect timber supplies. Availability of harvested timber may further be limited by factors such as fire and fire prevention, insect infestation, disease, ice and wind storms, drought, floods and other natural and man-made causes, thereby reducing supply and increasing prices. We buy wood chips from lumber producers as a byproduct of their lumber production. Declines in their business conditions could affect the availability and price of wood chips.
17
Any disruption in the supply of chemicals, wood or other inputs could affect our ability to meet customer demand in a timely manner and could harm our reputation. As we have limited ability to pass through increases in our costs to our customers absent increases in market prices for our products, material increases in the cost of our raw materials could have a material adverse effect on our business, financial condition and results of operations.
We are involved in continuous manufacturing processes with a high degree of fixed costs. Any interruption in the operations of our manufacturing facilities may affect our operating performance.
We seek to run our paper machines and pulp mills on a nearly continuous basis for maximum efficiency. Any unplanned plant downtime at any of our paper mills results in unabsorbed fixed costs that negatively affect our results of operations. Due to the extreme operating conditions inherent in some of our manufacturing processes, we may incur unplanned business interruptions from time to time and, as a result, we may not generate sufficient cash flow to satisfy our operational needs. In addition, many of the geographic areas where our production is located and where we conduct our business may be affected by natural disasters, including snow storms, tornadoes, forest fires and flooding. These natural disasters could disrupt the operation of our mills, which could have a material adverse effect on our business, financial condition and results of operations. Furthermore, during periods of weak demand for paper products or periods of rising costs, we may need to schedule market-related downtime, which could have a material adverse effect on our financial condition and results of operations. We took 515,000 tons of market-related downtime of coated paper during 2009 in response to lower customer demand and in an effort to manage our inventory levels of finished goods to match customer requirements.
Our operations require substantial ongoing capital expenditures, and we may not have adequate capital resources to fund all of our required capital expenditures.
Our business is capital intensive, and we incur capital expenditures on an ongoing basis to maintain our equipment and comply with environmental laws and regulations, as well as to enhance the efficiency of our operations. We expect to spend approximately $75 million in 2010 on capital expenditures. In addition, our revolving credit facility limits our ability to make capital expenditures. We anticipate that cash generated from operations will be sufficient to fund our operating needs and capital expenditures for the foreseeable future and that the revolving credit facility limitation will not impair our ability to make necessary investments in capital expenditures. However, if we require additional funds to fund our capital expenditures, we may not be able to obtain them on favorable terms, or at all. If we cannot maintain or upgrade our facilities and equipment as we require or to ensure environmental compliance, it could have a material adverse effect on our business, financial condition and results of operations.
18
Rising energy or chemical prices or supply shortages could adversely affect our business, financial condition and results of operations.
Although a significant portion of our energy requirements is satisfied by steam produced as a byproduct of our manufacturing process, we purchase natural gas, coal and electricity to run our mills. We experienced a decrease in our transportation, chemical and other raw material costs in 2009, as compared to 2008, primarily as a result of lower crude oil prices. Overall, we expect crude oil and energy costs to remain volatile for the foreseeable future. In addition, energy suppliers and chemical suppliers that use petroleum-based products in the manufacture of their chemicals may, due to supply shortages, ration the amount of energy or chemicals available to us and we may not be able to obtain the energy or chemicals we need to operate our business at acceptable prices or at all. Any significant energy or chemical shortage or significant increase in our energy or chemical costs in circumstances where we cannot raise the price of our products due to market conditions could have a material adverse effect on our business, financial condition and results of operations. See “Management’s Discussion and Analysis of Financial Condition and Results of Operations—Selected Factors That Affect Our Operating Results—Cost of Sales.” Furthermore, we are required to post letters of credit or other financial assurance obligations with certain of our energy and other suppliers, which could limit our financial flexibility. Additionally, we have experienced some fuel surcharges (primarily diesel fuel) by suppliers, distributors and freight carriers. If suppliers, distributors or freight carriers impose or increase fuel surcharges, and we are not able to pass these costs through to our customers, they could have a material adverse effect on our business, financial condition and results of operations.
In addition, an outbreak or escalation of hostilities between the United States and any foreign power and, in particular, events in the Middle East, or weather events such as hurricanes, could result in a real or perceived shortage of oil or natural gas, which could result in an increase in energy or chemical prices.
We depend on a small number of customers for a significant portion of our business.
Our largest customer, xpedx, a division of International Paper Company, accounted for 19% of 2009 net sales. Our ten largest customers (including xpedx) accounted for approximately 50% of 2009 net sales. The loss of, or significant reduction in orders from, any of these customers or other customers could have a material adverse effect on our business, financial condition and results of operations, as could significant customer disputes regarding shipments, price, quality or other matters.
Furthermore, we extend trade credit to certain of our customers to facilitate the purchase of our products and rely on their creditworthiness and ability to obtain credit from lenders. Accordingly, a bankruptcy or a significant deterioration in the financial condition of any of our significant customers could have a material adverse effect on our business, financial condition and results of operations, due to a reduction in purchases, a longer collection cycle or an inability to collect accounts receivable.
Litigation could be costly and harmful to our business.
We may be involved in various claims and legal actions that arise in the ordinary course of business, including claims and legal actions related to environmental laws and regulations. Any of these claims or legal actions could materially adversely affect our business, results of operations and financial condition.
See “Legal Proceedings” for further information concerning pending legal proceedings.
Rising postal costs could weaken demand for our paper products.
A significant portion of paper is used in periodicals, catalogs, fliers and other promotional materials. Many of these materials are distributed through the mail. Future increases in the cost of postage could reduce the frequency of mailings, reduce the number of pages in advertising materials or cause advertisers to use alternate methods to distribute their advertising materials. Any of the foregoing could decrease the demand for our products, which could materially adversely affect our business, financial condition and results of operations.
19
Developments in alternative media could adversely affect the demand for our products.
Trends in advertising, electronic data transmission and storage and the internet could have adverse effects on traditional print media, including our products and those of our customers, but neither the timing nor the extent of those trends can be predicted with certainty. Our magazine and catalog publishing customers may increasingly use, and compete with businesses that use, other forms of media and advertising and electronic data transmission and storage, particularly the internet, instead of paper made by us. As the use of these alternatives grows, demand for our paper products could decline. In addition, electronic formats for textbooks could cause demand to decline for paper textbooks.
The failure of our information technology and other business support systems could have a material adverse effect on our business, financial condition and results of operations.
Our ability to effectively monitor and control our operations depends to a large extent on the proper functioning of our information technology and other business support systems. If our information technology and other business support systems were to fail it could have a material adverse effect on our business, financial condition and results of operations.
A large percentage of our employees are unionized. Wage increases or work stoppages by our unionized employees may have a material adverse effect on our business, financial condition and results of operations.
As of December 31, 2009, we had approximately 7,500 employees. Approximately 70% of our employees were represented by labor unions. We have 17 collective bargaining agreements expiring at various times through December 1, 2012. Approximately 925 employees at the Escanaba, Michigan, mill are covered under three contracts that expired in June and July of 2008 and are currently under renegotiation. In addition, three contracts covering an aggregate of approximately 550 employees at our Port Hawkesbury, Nova Scotia, mill expired on May 31, 2009. The unions at this mill engage in pattern bargaining, which means that they negotiate a new contract with one industry participant before negotiating with others. The unions currently are negotiating with another paper company and have not yet begun negotiations with us. Our Port Hawkesbury, Nova Scotia, mill was closed from December 2005 until October 2006, before our ownership of the mill, due to a labor dispute.
We may become subject to material cost increases or additional work rules imposed by agreements with labor unions. This could increase expenses in absolute terms and as a percentage of net sales. In addition, work stoppages or other labor disturbances may occur in the future. Any of these factors could negatively affect our business, financial condition and results of operations.
We depend on third parties for certain transportation services.
We rely primarily on third parties for transportation of our products to our customers and transportation of our raw materials to us, in particular, by train and truck. If any of our third-party transportation providers fail to deliver our products in a timely manner, we may be unable to sell them at full value. Similarly, if any of our transportation providers fail to deliver raw materials to us in a timely manner, we may be unable to manufacture our products on a timely basis. Shipments of products and raw materials may be delayed due to weather conditions, labor strikes or other events. Any failure of a third-party transportation provider to deliver raw materials or products in a timely manner could harm our reputation, negatively affect our customer relationships and have a material adverse effect on our business, financial condition and results of operations. In addition, our ability to deliver our products on a timely basis could be adversely affected by the lack of adequate availability of transportation services, especially rail capacity, whether because of work stoppages or otherwise. Additionally, we have experienced some fuel surcharges (primarily diesel fuel) by suppliers, distributors and freight carriers. If suppliers, distributors or freight carriers impose or increase fuel surcharges, and we are not able to pass these costs through to our customers, they could have a material adverse effect on our business, financial condition and results of operations.
20
We are subject to various regulations that could impose substantial costs upon us and may adversely affect our operating performance.
Our operations are subject to a wide range of federal, state, provincial and local general and industry specific environmental, health and safety laws and regulations, including those relating to air emissions, wastewater discharges, solid and hazardous waste management and disposal and site remediation. Compliance with these laws and regulations is a significant factor in our business and we may be subject to increased scrutiny and enforcement actions by regulators as a result of changes in federal or state administrations. We have made, and will continue to make, significant expenditures to comply with these requirements. Significant expenditures also could be required for compliance with any future laws or regulations relating to greenhouse gas or other emissions. In addition, we handle and dispose of wastes arising from our mill operations and operate a number of landfills to handle that waste. While we believe, based upon current information, that we are currently in substantial compliance with all applicable environmental laws and regulations, we could be subject to potentially significant fines, penalties or criminal sanctions for failure to comply, including with respect to the matters discussed in “Litigation could be costly and harmful to our business.” Moreover, under certain environmental laws, a current or previous owner or operator of real property, and parties that generate or transport hazardous substances that are disposed of at real property, may be held liable for the cost to investigate or clean up that real property and for related damages to natural resources. We may be subject to liability, including liability for investigation and cleanup costs, if contamination is discovered at one of our paper mills or other locations where we have disposed of, or arranged for the disposal of, wastes. MeadWestvaco and SEO have separately agreed to indemnify us, subject to certain limitations, for certain environmental liabilities. There can be no assurance that MeadWestvaco or SEO will perform under any of their respective environmental indemnity obligations or that the indemnity will adequately cover us in the event of any environmental liabilities, which could have a material adverse effect on our financial condition and results of operations. Furthermore, we agreed to indemnify the purchaser of our carbonless paper business for certain environmental liabilities, subject to certain limitations. We also could be subject to claims brought pursuant to applicable laws, rules or regulations for property damage or personal injury resulting from the environmental impact of our operations, including due to human exposure to hazardous substances. Increasingly stringent environmental requirements, more aggressive enforcement actions or policies, the discovery of unknown conditions or the bringing of future claims may cause our expenditures for environmental matters to increase, and we may incur material costs associated with these matters.
Some of our operations are subject to Canadian government regulation and we are subject to foreign currency risk.
Our business includes a mill in Port Hawkesbury, Nova Scotia, and management of woodlands in Canada. Our operations in Canada are subject to Canadian laws and regulations, as well as foreign currency risk. The value of the Canadian dollar versus the U.S. dollar has fluctuated dramatically over the last two years. A significantly weaker U.S. dollar makes imports to the United States of paper products made in our Port Hawkesbury, Nova Scotia, mill unprofitable. We cannot assure you we will be able to manage our Canadian operations profitably.
21
We have a history of net losses and we may not generate net income in the future.
We incurred a net loss in each of the five years ended December 31, 2009. As of December 31, 2009, our accumulated deficit was $606 million and NewPage’s accumulated deficit was $522 million. In addition, SENA incurred a net loss in each of the years ended December 31, 2005 and 2006 and the nine months ended September 30, 2007. If we are unable to generate net income in satisfactory amounts or at all, this may adversely affect our business.
| ITEM 1B. | UNRESOLVED STAFF COMMENTS |
Not applicable.
| ITEM 2. | PROPERTIES |
Our corporate headquarters is located in Miamisburg, Ohio. We own the mills where we produce our paper products and own the converting facilities where we convert rolls of paper to sheets. We believe that we have sufficient capacity at our manufacturing facilities to meet our production needs for the foreseeable future. In addition, we lease space or have third-party arrangements to utilize space in approximately 50 warehouse facilities. All of our owned facilities (except those owned by CWPCo) are pledged as collateral under our various debt agreements. The following table lists the purpose of each of our significant facilities, as well as whether the facility is owned or leased:
| Location |
Purpose |
Owned or Leased/Expiration | ||
| Miamisburg, Ohio | Corporate headquarters | Leased/2017 | ||
| Biron, Wisconsin | Paper mill | Owned | ||
| Duluth, Minnesota | Paper mill | Owned | ||
| Escanaba, Michigan | Paper mill | Owned | ||
| Luke, Maryland | Paper mill | Owned | ||
| Luke, Maryland | Warehouse and converting | Owned | ||
| Port Hawkesbury, Nova Scotia | Paper mill | Owned | ||
| Rumford, Maine | Paper mill | Owned | ||
| Stevens Point, Wisconsin | Paper mill | Owned | ||
| Whiting, Wisconsin | Paper mill | Owned | ||
| Wickliffe, Kentucky | Paper mill | Owned | ||
| Wisconsin Rapids, Wisconsin | Paper mill, warehouse and converting | Owned |
| ITEM 3. | LEGAL PROCEEDINGS |
In April 2008, NewPage Wisconsin System Inc. (formerly Stora Enso North America Corp. and the successor by merger to Consolidated Papers, Inc.), along with several other defendants, was named as a defendant in Appleton Papers, Inc., et al. v. George A. Whiting Paper Co., et al (08-CV-00016-WCG) in the United States District Court for the Eastern District of Wisconsin, Green Bay Division. The plaintiffs sought to allocate among the defendants the cleanup costs and natural resource damages associated with the remediation of PCB contamination in the Lower Fox River and to require the defendants and the other responsible parties to pay for the upcoming remedial work and natural resource damages. The matter was dismissed in December 2009 following a motion for summary judgment by the defendants.
In September 2009, NewPage, along with two other U.S. paper producers and the United Steelworkers, filed antidumping and countervailing duty petitions with the U.S. Department of Commerce and the U.S. International Trade Commission alleging that manufacturers of certain coated paper in China and Indonesia are dumping their products in the United States and that these manufacturers have been subsidized by their governments in violation of U.S. trade laws. The petitions also allege that the U.S. industry producing comparable coated paper is being injured as a result of unfairly traded imports from these countries.
22
The U.S. International Trade Commission, by unanimous vote on November 6, 2009, determined that there is reasonable indication that the U.S. industry is being materially injured by unfairly traded Chinese and Indonesian imports. As a result, the U.S. Department of Commerce has commenced a full investigation of coated paper imports from China and Indonesia. We expect that the Department of Commerce will announce its preliminary countervailing duty determinations on March 2, 2010, and its preliminary dumping determinations by the end of April 2010. We expect that final determinations in the cases will be completed by the end of 2010.
If the Department of Commerce determines that dumping or subsidies are present and the International Trade Commission determines that the industry has been injured as a result, the Department of Commerce will impose duties on the covered products imported from these countries in order to offset the effects of the dumping and subsidies. No assurance can be given that these determinations will be made, that duties will be imposed or as to the amount of any duties that may be imposed.
We are involved in various other litigation and administrative proceedings that arise in the ordinary course of business. Although the ultimate outcome of these matters cannot be predicted with certainty, we do not believe that the currently expected outcome of any matter, lawsuit or claim that is pending or threatened, or all of them combined, will have a material adverse effect on our financial condition, results of operations or liquidity.
| ITEM 4. | SUBMISSION OF MATTERS TO A VOTE OF SECURITY HOLDERS |
None.
PART II
| ITEM 5. | MARKET FOR REGISTRANT’S COMMON EQUITY, RELATED STOCKHOLDER MATTERS AND ISSUER PURCHASES OF EQUITY SECURITIES |
As of February 12, 2010, NewPage Group was the sole holder of record of the shares of NewPage Holding’s common stock and NewPage Holding was the sole holder of record of the shares of NewPage’s common stock. There is no established public trading market for the common stock of NewPage Holding or NewPage. We have never paid or declared a cash dividend on the common stock of NewPage Holding or NewPage. Our debt agreements restrict our ability and the ability of our subsidiaries to pay dividends.
23
| ITEM 6. | SELECTED FINANCIAL DATA |
The following table sets forth summary financial data of NewPage Holding and its predecessor for each of the five fiscal years in the period ended December 31, 2009.
| Successor | Predecessor | |||||||||||||||||||||||
| (in millions) |
Year Ended Dec. 31, 2009 |
Year Ended Dec. 31, 2008 |
Year Ended Dec. 31, 2007 (a) |
Year Ended Dec. 31, 2006 |
Eight Months Ended Dec. 31, 2005 (b) |
Four Months Ended Apr. 30, 2005 |
||||||||||||||||||
| Net sales |
$ | 3,106 | $ | 4,356 | $ | 2,168 | $ | 2,038 | $ | 1,281 | $ | 582 | ||||||||||||
| Income (loss) from continuing operations |
(318 | ) | (139 | ) | (21 | ) | (36 | ) | (72 | ) | (3 | ) | ||||||||||||
| Net income (loss) attributable to the company |
(323 | ) | (142 | ) | (22 | ) | (52 | ) | (67 | ) | (8 | ) | ||||||||||||
| Working capital |
$ | 458 | $ | 391 | $ | 477 | $ | 276 | $ | 369 | ||||||||||||||
| Total assets |
4,006 | 4,246 | 4,885 | 1,985 | 2,304 | |||||||||||||||||||
| Long-term debt |
3,231 | 3,082 | 3,070 | 1,429 | 1,677 | |||||||||||||||||||
| Other long-term obligations |
493 | 622 | 626 | 64 | 62 | |||||||||||||||||||
| (a) | NewPage acquired SENA as of December 21, 2007. The statement of operations data includes the results of this acquisition from the date of acquisition. |
| (b) | NewPage acquired the printing and writing papers business of MeadWestvaco Corporation effective as of April 30, 2005. The statement of operations data includes the results of this acquisition from the date of acquisition. |
| ITEM 7. | MANAGEMENT’S DISCUSSION AND ANALYSIS OF FINANCIAL CONDITION AND RESULTS OF OPERATIONS |
You should read the following discussion together with our historical financial statements, including the related notes appearing elsewhere in this Form 10-K. Statements in the discussion and analysis regarding our expectations about the performance of our business and any forward-looking statements are subject to numerous risks and uncertainties, including, but not limited to, the risks and uncertainties described in “Forward-Looking Statements” and “Risk Factors.” Our actual results may differ materially from those contained in or implied by any forward-looking statements.
Overview
Company Background
We believe that we are the largest coated paper manufacturer in North America based on production capacity. Coated paper is used primarily in media and marketing applications, such as high-end advertising brochures, direct mail advertising, coated labels, magazines, magazine covers and inserts, catalogs and textbooks. We operate 20 paper machines at ten paper mills located in Kentucky, Maine, Maryland, Michigan, Minnesota, Wisconsin and Nova Scotia, Canada.
24
Trends in our Business
North American coated paper demand is primarily driven by advertising and print media usage. In particular, the demand for certain grades of coated paper is affected by spending on catalog and promotional materials by retailers and spending on magazine advertising, which affects the number of printed pages in magazines. During 2009, North American coated paper demand declined significantly compared to 2008, as a result of decreased advertising spending and magazine and catalog circulation largely attributable to general economic factors and inventory reductions by customers. During the second half of 2009, North American coated paper demand showed some quarterly improvement as the result of seasonal demand, but was significantly below prior year comparable periods. In response to this reduction in coated paper demand, we took 515,000 tons of market-related downtime during 2009, including 104,000 tons during the fourth quarter to reduce our inventory levels of finished goods to match customer requirements. We will consider the need for additional market-related downtime from time to time based on market conditions.
The available supply of coated paper in North America also declined during 2009 compared to 2008. The North American coated paper supply has been affected by North American capacity closures and market-related downtime in response to the lower demand. We believe imports continue to affect the North American market, placing downward pressure on North American coated paper prices as a result of low transportation costs and foreign overcapacity. Certain Asian producers, in particular, have significantly increased imports to the U.S. in recent years.
In September 2009, NewPage along with two other U.S. paper producers and the United Steelworkers, filed antidumping and countervailing duty petitions with the U.S. Department of Commerce and the U.S. International Trade Commission alleging that manufacturers of certain coated paper in China and Indonesia are dumping their products in the United States and that these manufacturers have been subsidized by their governments in violation of U.S. trade laws. The petitions also allege that the U.S. industry producing comparable coated paper is being injured as a result of unfairly traded imports from these countries. The U.S. International Trade Commission, by unanimous vote on November 6, 2009, determined that there is reasonable indication that the U.S. coated paper industry is being materially injured by unfairly traded Chinese and Indonesian imports. As a result, the U.S. Department of Commerce has commenced a full investigation of coated paper imports from China and Indonesia. We expect that the Department of Commerce will issue its preliminary determinations by the end of April 2010. We expect final determinations in the cases by the end of 2010. For further information concerning these proceedings, see “Legal Proceedings.”
During 2009, we experienced a decrease in our transportation, chemical and other raw material costs compared to 2008, primarily as a result of lower crude oil prices. We expect crude oil and chemical costs to remain volatile for the foreseeable future, although at lower levels compared to the peak levels reached in 2008.
North American prices for coated paper products historically have been determined by North American supply and demand, rather than directly by raw material costs or other costs of sales. In the short term, therefore, we have limited ability to increase prices in response to increases in our costs if demand relative to supply does not remain strong. We believe that pricing has stabilized during the fourth quarter of 2009 after declining throughout the first three quarters of 2009. We believe the decline resulted primarily from the benefits of the alternative fuel mixture credit being passed on to customers, the negative effects of imports of coated paper from China and Indonesia, which we believe are being sold in our markets at artificially low prices, lower demand for catalog and promotional materials by retailers and lower spending on magazine advertising as a result of general economic factors. At this time, we view any extension of the alternative fuel mixture credit, or the introduction of any similar program in the foreseeable future, as unlikely. As a result of the current economic environment and not taking into consideration any effects of the anti-dumping and countervailing duty investigations on imports of certain coated paper from China and Indonesia, we anticipate continued pressure on paper prices for the near term.
25
Debt Refinancing and Amendments
In September 2009, we amended the senior secured credit facilities to suspend the requirements to comply with certain covenants and to increase our operating and financial flexibility. The revolving credit facility also was amended to require the maintenance of at least $50 million of borrowing availability under the revolving credit facility through the date of the delivery of the compliance certificate with respect to the fiscal quarter ending March 31, 2011 and to limit our ability to make capital expenditures.
On September 30, 2009, the term loan was repaid in full with $1,598 million of proceeds from an offering of 11.375% senior secured notes (the “First-Lien Notes”) and $5 million of borrowings under our revolving credit facility to increase our operating and financial flexibility.
On September 29, 2009, NP Investor LLC (“NPI”), an affiliate of Cerberus Capital Management, L.P., the indirect controlling stockholder of NewPage, completed a cash tender offer pursuant to which it purchased $23 million in aggregate principal amount of our 10% second-lien senior secured notes and $2 million in aggregate principal amount of our floating rate second-lien senior secured notes. We have been advised that NPI currently intends to hold the notes purchased for investment purposes.
The SENA Acquisition and Restructuring
On December 21, 2007, NewPage acquired all of the issued and outstanding common stock of SENA from Stora Enso Oyj (“SEO”) (the “Acquisition”). We acquired SENA in order to create a single business platform and to enable us to remain competitive in the marketplace, serve our customers more efficiently and achieve synergies from the Acquisition. The Acquisition more than doubled our production capacity and broadened our product line. In connection with the Acquisition, SEO acquired approximately 20% of the equity in NewPage Group.
During 2008, we initiated actions to integrate the existing NewPage operations and the former SENA facilities and services that included the shutdown in 2008 of six of our less efficient, higher cash cost paper machines and the shutdown of our Chillicothe, Ohio converting facility in 2009, as well as selected headcount reductions, all of which have been substantially completed.
During the first quarter ended March 31, 2009, we recorded an adjustment of $1 million in selling, general and administrative expenses for the reversal of employee-related costs included as an assumed liability in the purchase price allocation as a result of a change in estimate. During 2008, we incurred charges of $34 million, including $22 million in accelerated depreciation and $5 million in inventory write-offs recorded in cost of sales and $7 million of employee-related costs, of which $5 million is recorded in cost of sales and $2 million is recorded in selling, general and administrative expenses. In addition, during 2008 we recorded liabilities of $39 million in the purchase price allocation for employee-related costs of former SENA employees and $22 million for closure costs of acquired plants.
We completed our integration activities during the third quarter of 2009, at which time we had achieved approximately $200 million of annual synergies. Additional synergies may be realized in the future from anticipated economies of scale when our paper machines return to running at historical operating patterns with a beneficial grade mix.
Sale of Hydroelectric Generating Facilities
In March 2009, NewPage Wisconsin System Inc., our indirect wholly-owned subsidiary, completed the sale of a hydroelectric generating facility located in Niagara, Wisconsin to Northbrook Wisconsin, LLC for a net cash sales price of $22 million. Included in cost of sales for the year ended December 31, 2009 is a loss on the sale of $3 million.
26
Selected Factors That Affect Our Operating Results
Net Sales
Our net sales are a function of the amount of paper that we sell and the price at which we sell it. Demand for printing paper is cyclical, which results in changes in both volume and price. Paper prices historically have been a function of macroeconomic factors, such as the strength of the United States economy and import levels, that are largely out of our control. Price has historically been more variable than volume and can change substantially over relatively short time periods. Coated freesheet paper is typically purchased by customers on an as-needed basis, and generally is not bought under contracts that provide for fixed prices or minimum volume commitments. Coated groundwood and supercalendered paper are typically sold to customers under contracts that provide for fixed prices and minimum volume commitments. We use substantially all of our pulp production internally and sell some excess production to external customers.
Our earnings are sensitive to price changes for our principal products, with price changes in coated paper having the greatest effect. Fluctuations in paper prices historically have had a direct effect on our results for several reasons:
| • | Market prices for paper products are a function of supply and demand, factors over which we have limited influence. |
| • | Market prices for paper products typically are not directly affected by raw material costs or other costs of sales, and consequently there is limited ability to pass through increases in costs to customers absent increases in the market price. |
| • | The manufacturing of paper is highly capital-intensive and a large portion of operating costs is fixed. Additionally, paper machines are large, complex systems that operate more efficiently when operated continuously. Consequently, we typically continue to run our machines whenever marginal sales exceed the marginal costs. |
See “Overview—Trends in our Business” for a discussion of factors that have historically affected pricing and are expected to continue to affect our pricing.
Cost of Sales
The principal components of our cost of sales are chemicals, fiber, energy, labor, maintenance and depreciation and amortization. Costs for commodities, including chemicals, wood and energy, are the most variable component of cost of sales because the prices of many of the commodities that we use can fluctuate substantially, sometimes within a relatively short period of time.
Fiber. Our costs to purchase wood are affected directly by market costs of wood in our regional markets and indirectly by the effect of higher fuel costs on logging and transportation of timber to our facilities. While we have fiber supply agreements in place that ensure a portion of our wood requirements, purchases under these agreements are typically at market rates. For the year ended December 31, 2009, we produced approximately 94% of our pulp requirements, which excludes our sales of market pulp, with the remainder supplied through open market purchases and supply agreements. The price of market pulp has fluctuated significantly. Pulp prices fluctuate due to changes in worldwide consumption of pulp, pulp capacity additions, expansions or curtailments affecting the supply of pulp, changes in inventory levels by pulp consumers, which affect short-term demand, and pulp producer cost changes related to wood availability and environmental issues.
27
Chemicals. Certain chemicals used in the papermaking process are petroleum-based and fluctuate with the price of crude oil. The price for latex, the largest component of our chemical costs, has historically been volatile. The price of latex increased significantly during 2008 as compared to 2007, and has significantly declined during 2009. We expect the price of latex to remain volatile.
Energy. We produce a large portion of our energy requirements from burning wood waste and other byproducts of the paper manufacturing process. For the year ended December 31, 2009, we generated approximately 45% of our energy requirements from biomass-related fuels. The remaining energy we purchase from third party suppliers consists of electricity and fuels, primarily natural gas, fuel oil and coal. We expect crude oil and energy costs to remain volatile for the foreseeable future. As prices fluctuate, we have the ability to switch between certain energy sources, within constraints, in order to minimize costs.
Our indirect wholly-owned subsidiary, CWPCo, provides electricity to our mills in central Wisconsin. CWPCo has 33.3 megawatts of generating capacity on 39 generators located in five hydroelectric plants on the Wisconsin River. CWPCo is a regulated public utility and also provides electricity to a small number of residential, light commercial and light industrial customers.
Labor costs. Labor costs include wages, salary and benefit expenses attributable to mill personnel. Mill employees at a non-managerial level are generally compensated on an hourly basis in accordance with the terms of applicable union contracts and management employees are compensated on a salaried basis. Wages, salary and benefit expenses included in cost of sales do not vary significantly over the short term. We have not experienced significant labor shortages.
Maintenance. Maintenance expense includes day-to-day maintenance, equipment repairs and larger maintenance projects, such as paper machine shutdowns for annual maintenance. Day-to-day maintenance expenses have not varied significantly from year to year. Larger maintenance projects and equipment expenses can produce year-to-year fluctuations in our maintenance expenses. In conjunction with our annual maintenance shutdowns, we incur incremental costs that are primarily comprised of unabsorbed fixed costs from lower production volumes and other incremental costs for purchased materials and energy that would otherwise be produced as part of normal operations of our mills.
Depreciation and amortization. Depreciation and amortization expense for assets associated with our mill and converting operations is included in cost of sales.
Foreign currency. We are exposed to changes in foreign currency exchange rates because most of the raw material, labor and other cost of sales at our Port Hawkesbury, Nova Scotia, mill are denominated in Canadian dollars, while North American sales prices for the products produced at the Port Hawkesbury mill are in U.S. dollars (to the extent shipped into the United States) or determined primarily by the U.S. dollar price per ton charged by U.S. producers. A stronger Canadian dollar relative to the U.S. dollar increases our costs of sales. If the U.S. dollar were to weaken significantly against the Canadian dollar, it would impair the ability of the Port Hawkesbury mill to profitably compete in the U.S. market.
28
Selling, General and Administrative (SG&A) Expenses
The principal components of our SG&A expenses are wages, salaries and benefits for our sales and corporate administrative personnel, travel and entertainment expenses, advertising expenses, information technology expenses and research and development expenses. Our SG&A expenses have not historically fluctuated significantly from year to year. As a result of the Acquisition, we lowered benefits costs by freezing defined benefit pension plans and reducing retiree medical benefits for salaried employees. In addition, we eliminated duplicative sales, marketing and customer service personnel and centralized our corporate administration, management, finance and human resource functions. In November 2009, we amended a postretirement benefit plan to phase out company-provided post-age 65 medical benefits for certain retirees by 2012.
Interest
Our interest expense increased as a result of the refinancing of our term loan with the First-Lien Notes in September 2009. Furthermore, included in interest expense in 2009 is a charge of $85 million on the extinguishment of debt in September 2009 and $48 million of unrealized losses on our interest rate swaps reclassified from accumulated other comprehensive income (loss) as a result of the retirement of the term loan in September 2009. For a description of the 2009 debt refinancing, see “Overview—Debt Refinancing and Amendments.” For future periods, we expect an increase in interest expense over prior periods because the First-Lien Notes have a higher interest rate than the term loan that was repaid. Because of the debt refinancing in September 2009, we no longer have sufficient variable-rate debt exposure for our outstanding interest rate swaps to qualify for hedge accounting treatment and will record the changes in fair value as an adjustment to interest expense.
Effects of Inflation/Deflation
While inflationary increases in certain costs, such as energy, wood and chemical costs, have had a significant effect on our operating results over the past three years, changes in general inflation have had a minimal effect on our operating results in each of the last three years. We have benefited from deflationary effects from the decline in oil prices. Sales prices and volumes have historically been more strongly influenced by supply and demand factors in specific markets than by inflationary or deflationary factors. Certain of our costs, including the prices of energy, wood and chemicals that we purchase, can fluctuate substantially, sometimes within a relatively short period of time, and can have a significant effect on our business, financial condition and results of operations. Energy, wood and chemical costs increased during 2007 and 2008 and decreased during the year ended December 31, 2009. These costs are expected to remain volatile in to 2010, but at a lower level than the peaks reached in 2008.
Seasonality
We are exposed to fluctuations in quarterly sales volumes and expenses due to seasonal factors common in the paper industry. Typically, the first two quarters are our slowest quarters due to lower demand for coated paper during this period. Our third quarter is typically our strongest sales quarter, reflecting an increase in sales volume as printers prepare for year-end holiday catalogs and advertising. Our accounts receivable and payable generally peak in the third quarter, while inventory generally peaks in the second quarter in anticipation of the third quarter season. Announced price increases and the general economic environment can affect historical seasonal patterns.
Critical Accounting Estimates
Our principal accounting policies are described in the Summary of Significant Accounting Policies in the notes to consolidated financial statements filed with the accompanying consolidated financial statements. The preparation of consolidated financial statements in accordance with accounting principles generally accepted in the United States (“U.S. GAAP”) requires management to make estimates and assumptions that affect the reported amounts of some assets and liabilities and, in some instances, the reported amounts of revenues and expenses during the reporting period. Actual results could differ from these estimates. Management believes the accounting estimates discussed below represent those accounting estimates requiring the exercise of judgment where a different set of judgments could result in the greatest changes to reported results.
29
Income taxes. We recognize deferred tax assets and liabilities based on the estimated future tax effects of differences between the financial statement and tax bases of assets and liabilities given the enacted tax laws. Furthermore, we evaluate uncertainty in our tax positions and only recognize benefits when we believe our tax position is more likely than not to be sustained upon audit. The amount we recognize is measured as the largest amount of benefit that is greater than 50 percent likely of being realized upon ultimate settlement.
We have tax filing requirements in many states and are subject to audit in these states, as well as at the federal level in both the U.S. and Canada. Tax audits by their nature are often complex and can require several years to resolve. In the preparation of our consolidated financial statements, management exercises judgments in estimating the potential exposure of unresolved tax matters. While actual results could vary, in management’s judgment we have adequately accrued the ultimate outcome of these unresolved tax matters.
We evaluate the need for a valuation allowance for deferred tax assets by assessing whether it is more likely than not that we will realize our deferred tax assets in the future. The assessment of whether or not a valuation allowance is necessary often requires significant judgment, including forecasts of future taxable income and the evaluation of tax planning initiatives. Adjustments to the valuation allowance are made to earnings in the period when the assessment is made.
Pension and other postretirement benefits. We provide retirement benefits for certain employees through employer- and employee-funded defined benefit plans. Benefits earned are a function of years worked and average final earnings during an employee’s pension-eligible service. Certain of the pension benefits are provided in accordance with collective bargaining agreements.
Assumptions used in the determination of defined benefit pension expense and other postretirement benefit expense, including the discount rate, the long-term expected rate of return on plan assets and increases in future medical costs, are evaluated by management, reviewed with the plans’ actuaries at least annually and updated as appropriate. Actual asset returns and medical costs that are more favorable than assumptions can have the effect of lowering future expense and cash contributions, and conversely, actual results that are less favorable than assumptions could increase future expense and cash contributions. In accordance with U.S. GAAP, actual results that differ from assumptions are accumulated and amortized over future periods and, therefore, affect expense in future periods. Unrecognized prior service cost and actuarial gains and losses in the defined benefit pension and other postretirement benefit plans subject to amortization are amortized over the average remaining service of the participants.
Assumptions used in determining defined benefit pension and other postretirement benefit expense are important in determining the costs of our plans. The expected long-term rates of return on plan assets were derived based on the capital market assumptions for each designated asset class under the respective trust’s investment policy. The capital market assumptions reflect a combination of historical performance analysis and the forward-looking return expectations of the financial markets. A 0.5 percentage-point decrease in the weighted-average long-term expected rate of return on plan assets would increase 2010 net pension expense by approximately $6 million, while a 0.5 percentage-point increase in the weighted-average long-term expected rate of return on plan assets would decrease 2010 net pension expense by approximately $6 million.
30
The assumed discount rates used in determining the benefit obligations were determined by reference to the yield on zero-coupon corporate bonds rated Aa or AA maturing in conjunction with the expected timing and amount of future benefit payments. A 0.5 percentage-point decrease in the weighted-average discount rates would increase 2010 net pension expense by approximately $7 million, while a 0.5 percentage-point increase in the weighted-average discount rates would decrease 2010 net pension expense by approximately $7 million. The effect on other postretirement benefit expense would be negligible from such changes in the weighted-average discount rates. With respect to benefit obligations, a 0.5 percentage-point decrease in the weighted-average discount rates would increase pension benefit obligations by approximately $91 million and would increase other postretirement benefit obligations by approximately $5 million, while a 0.5 percentage-point increase in the weighted-average discount rates would decrease pension benefit obligations by approximately $82 million and would decrease other postretirement benefit obligations by approximately $5 million.
Equity compensation. We use the Black-Scholes option pricing model to determine the fair value of stock options. The determination of the fair value of stock-based payment awards on the date of grant using an option-pricing model is affected by the stock price as well as assumptions regarding a number of other variables. These variables include the stock price, expected stock price volatility over the term of the awards and projected employee stock option exercise behaviors (term of option).
We estimate the value of the underlying stock by examining the value of comparable market values for others in our industry and making adjustments for our capital structure and by utilizing discounted cash flows analysis. We estimate the volatility of our common stock by considering volatility of appropriate peer companies and adjusting for factors unique to our stock, including the effect of debt leverage. We estimate the expected term of options granted by incorporating the contractual term of the options and employees’ expected exercise behaviors.
Derivative financial instruments. We periodically use derivative financial instruments as part of our overall strategy to manage exposure to market risks associated with interest rate, foreign currency exchange rate and natural gas price fluctuations. We measure the fair values of our interest rate swaps using observable interest rate yield curves for comparable assets and liabilities at commonly quoted intervals. We measure the fair values of our foreign currency forward contracts based on current quoted market prices for similar contracts. We measure the fair values of our natural gas contracts based on natural gas futures contracts priced on the New York Mercantile Exchange. We recognize the unwind value of derivative financial instruments as the fair value. This means that the fair value for purchased contracts is based on the amount we could receive from the counterparty to settle the contract. Fair value at any point in time is based upon periodic confirmation of values received from the counterparty. We regularly monitor the credit-worthiness of the counterparties to these agreements to manage the risk of non-performance.
Environmental and legal liabilities. We record accruals for estimated environmental liabilities when remedial efforts are probable and the costs can be reasonably estimated. These estimates reflect assumptions and judgments as to the probable nature, magnitude and timing of required investigation, remediation and monitoring activities as well as availability of insurance coverage and contribution by other potentially responsible parties. Due to the numerous uncertainties and variables associated with these assumptions and judgments, and changes in governmental regulations and environmental technologies, accruals are subject to substantial uncertainties and actual costs could be materially greater or less than the estimated amounts. We record accruals for other legal contingencies, which are also subject to numerous uncertainties and variables associated with assumptions and judgments, when the contingency is probable of occurring and reasonably estimable.
31
Restructuring and other charges. We periodically record charges for the reduction of our workforce, the closure of manufacturing facilities and other actions related to business improvement and productivity initiatives. These events require estimates of liabilities for employee separation payments and related benefits, demolition, facility closures and other costs, as well as an estimate of the value that could be received from disposal of affected assets. These assumptions could differ from actual costs incurred or value received.
Results of Operations
The following table sets forth our historical results of operations for the years ended December 31, 2009, 2008 and 2007. All assets, liabilities, income, expenses and cash flows presented for all periods represent those of NewPage Holding’s wholly-owned subsidiary, NewPage, except for NewPage Holding’s debt and equity activity and income tax effects. Unless otherwise noted, the information provided pertains to both NewPage Holding and NewPage.
| Years ended December 31, | ||||||||||||||||||
| 2009 | 2008 | 2007 | ||||||||||||||||
| (in millions) |
$ | % | $ | % | $ | % | ||||||||||||
| Net sales |
3,106 | 100.0 | 4,356 | 100.0 | 2,168 | 100.0 | ||||||||||||
| Cost of sales |
3,171 | 102.1 | 3,979 | 91.4 | 1,895 | 87.4 | ||||||||||||
| Selling, general and administrative expense |
180 | 5.8 | 217 | 5.0 | 127 | 5.9 | ||||||||||||
| Interest expense |
438 | 14.1 | 298 | 6.8 | 175 | 8.1 | ||||||||||||
| Other (income) expense |
(306 | ) | (9.9 | ) | (3 | ) | (0.1 | ) | (2 | ) | (0.2 | ) | ||||||
| Income (loss) before income taxes |
(377 | ) | (12.1 | ) | (135 | ) | (3.1 | ) | (27 | ) | (1.2 | ) | ||||||
| Income tax (benefit) |
(59 | ) | (1.9 | ) | 4 | 0.1 | (6 | ) | (0.3 | ) | ||||||||
| Net income (loss) |
(318 | ) | (10.2 | ) | (139 | ) | (3.2 | ) | (21 | ) | (0.9 | ) | ||||||
| Net income (loss)—noncontrolling interests |
5 | 0.2 | 3 | 0.1 | 1 | 0.1 | ||||||||||||
| Net income (loss) attributable to the company |
(323 | ) | (10.4 | ) | (142 | ) | (3.3 | ) | (22 | ) | (1.0 | ) | ||||||
| Supplemental Information |
||||||||||||||||||
| Earnings before interest, taxes, depreciation and amortization (EBITDA) |
333 | 477 | 281 | |||||||||||||||
2009 Compared to 2008
Net sales for 2009 were $3,106 million compared to $4,356 million for 2008, a decrease of $1,250 million, or 29%. The decrease in net sales reflects lower sales volume of coated paper ($874 million), lower coated paper prices ($194 million) and lower revenues from other papers caused by lower paper prices and lower volumes in 2009 compared to 2008. Weighted-average coated paper prices decreased to $911 per ton in 2009 compared to $983 per ton in 2008. However, we believe that pricing stabilized during the fourth quarter of 2009. We believe that the benefits of the alternative fuel mixture credit were passed on to customers in the form of lower sales prices. In addition to the effects of the alternative fuel mixture credit, we believe some of the decline in pricing in 2009 resulted from the negative effects of imports of coated paper from China and Indonesia. Coated paper sales volume decreased to 2,675,000 tons in 2009 compared to 3,564,000 tons in 2008. Our volume for coated and other paper was lower primarily because of lower demand for catalog and promotional materials by retailers and lower spending on magazine advertising during 2009, as a result of general economic factors and the effect of a greater share of imports from China and Indonesia. As a result of these factors, we took 515,000 tons of market-related downtime during 2009, including 104,000 tons during the fourth quarter to reduce our inventory levels of finished goods to match customer requirements. During 2008, we took 91,000 tons of market-related downtime.
32
Cost of sales for 2009 was $3,171 million compared to $3,979 million for 2008, a decrease of $808 million, or 20%. The decrease was primarily a result of lower coated paper sales volume ($650 million). Gross margin for 2009 decreased to (2.1)% compared to 8.6% for 2008, primarily as a result of significantly lower sales volume, lower sales prices and the effects of taking market-related downtime, partially offset by productivity improvement initiatives and lower input costs resulting primarily from lower crude oil prices. Included in cost of sales for 2008 was $22 million for accelerated depreciation, $5 million for inventory write-offs and $5 million of employee-related costs associated with our restructuring plans.
Maintenance expense at our mills totaled $291 million in 2009 compared to $346 million in 2008. The decrease in maintenance expense was driven primarily as a result of the shutdown of paper machines in 2008 as part of our restructuring activities and from actions taken to reduce the costs of maintenance activities.
Selling, general and administrative expenses decreased to $180 million for 2009 from $217 million for 2008, primarily as a result of lower costs related to the integration of the two businesses, stock compensation and restructuring charges. As a percentage of net sales, selling, general and administrative expenses increased to 5.8% in 2009 from 5.0% in 2008.
Interest expense for 2009 was $438 million compared to $298 million for 2008. Interest expense for 2009 for NewPage was $418 million compared to $277 million for 2008. Included in interest expense for 2009 is a loss of $85 million on the extinguishment of debt and $48 million of unrealized losses on our interest rate swaps reclassified from accumulated other comprehensive income (loss) as a result of the retirement of the term loan in September 2009. For future periods, we expect an increase in interest expense over prior periods because the First-Lien Notes have a higher interest rate than the term loan that was repaid. Because of the debt refinancing in September 2009, we no longer have sufficient variable-rate debt exposure for our outstanding interest rate swaps to qualify for hedge accounting treatment and record the changes in fair value as an adjustment to interest expense.
Other (income) expense was $(306) million for 2009 and $(3) million for 2008. The amount recognized in 2009 was primarily the result of $304 million of income recognized for alternative fuel mixture tax credits. At this time, we view any extension of this credit, or the introduction of any similar program in the foreseeable future, as unlikely.
Income tax expense (benefit) for 2009 and 2008 was $(59) million and $4 million. Income tax expense (benefit) for NewPage for 2009 and 2008 was $(54) million and zero. We have recorded a valuation allowance against our net deferred income tax benefits as it is unlikely that we will realize those benefits. For purposes of allocating the income tax benefit to income (loss) before taxes, amounts of other comprehensive income result in income tax expense recorded in other comprehensive income and the offsetting amount as an allocation to tax benefit from operations. For 2009, we have allocated $45 million of tax expense to other comprehensive income (loss) and the corresponding offset as an allocation to tax benefit from operations. For 2009, for NewPage, we have allocated $41 million of tax expense to other comprehensive income (loss) and the corresponding offset as an allocation to tax benefit from operations. The amounts for 2009 include the reclassification to income tax (benefit) of all amounts previously allocated to accumulated other comprehensive income (loss) related to the interest rate swap cash flow hedges. Also included in 2009 is a tax benefit of $12 million, reflecting the decreases to our state deferred tax liabilities as a result of changes in the company’s distribution channels that have occurred as part of our integration with NPCP.
Net income (loss) attributable to NewPage Holding was $(323) million in 2009 compared to $(142) million in 2008. Net income (loss) attributable to NewPage was $(308) million in 2009 compared to $(117) million in 2008. The decreases were primarily a result of significantly lower sales volumes and pricing, partially offset by the alternative fuel mixture tax credits and productivity improvements.
33
EBITDA was $333 million and $477 million for 2009 and 2008. See “Reconciliation of Net Income (Loss) Attributable to the Company to EBITDA” for further information on the use of EBITDA as a measurement tool.
2008 Compared to 2007
Net sales for 2008 were $4,356 million compared to $2,168 million for 2007. The increase was primarily a result of the Acquisition, which had net sales of $2,491 million in 2007 (prior to the Acquisition). In addition, net sales were affected by lower sales volume of coated paper on a combined basis ($700 million) in 2008, partially offset by higher average coated paper prices ($297 million). Average coated paper prices increased to $983 per ton in 2008 from $886 per ton in 2007. Coated paper sales volume increased to 3,564,000 tons in 2008 from 2,261,000 tons in 2007. The volume increase was primarily from the acquired operations and was partially offset by a decline in coated paper demand resulting primarily from lower demand for catalog and promotional materials by retailers and lower spending on magazine advertising. We took 91,000 tons of market-related downtime for coated paper during 2008. During 2007, we took 27,000 tons of market-related downtime for coated paper.
Cost of sales for 2008 was $3,979 million compared to $1,895 million for 2007. The increase was primarily a result of the Acquisition, which had cost of sales of $2,445 million in 2007 (prior to the Acquisition). In addition, we had higher costs of production in 2008, primarily as a result of inflation in wood, energy, chemicals and transportation costs ($266 million). The increase was partially offset by the effect on cost of sales of lower coated paper sales volume on a combined basis ($564 million). Depreciation and amortization expense related to the fixed assets acquired in the Acquisition was $75 million lower in 2008 than in 2007 as a result of the purchase price allocation. As a result of the foregoing, gross margin for 2008 decreased to 8.6% compared to 12.6% for 2007. Included in cost of sales for 2008 was $22 million for accelerated depreciation, $5 million for inventory write-offs and $5 million of employee-related costs associated with our restructuring plans.
Maintenance expense at our mills totaled $346 million in 2008 compared to $169 million in 2007. The increase in maintenance expense was driven primarily as a result of the Acquisition. In addition, in conjunction with our annual maintenance shutdowns, we had incremental costs of approximately $30 million in 2008 and 2007 that were primarily comprised of unabsorbed fixed costs from lower production volumes and other incremental costs for purchased materials and energy that would otherwise be produced as part of normal operations of our mills.
Selling, general and administrative expenses were $217 million for 2008 compared to $127 million for 2007. The increase in 2008 was primarily as a result of the Acquisition, which had $87 million of selling, general and administrative expenses in 2007 (prior to the Acquisition), higher stock compensation expense of $4 million related to the stock option plan approved in December 2007 and $2 million of restructuring charges. During 2007, NewPage Holding expensed $3 million of costs relating to its withdrawn 2006 initial public offering of its common stock. As a percentage of net sales, selling, general and administrative expenses decreased to 5.0% in 2008 from 5.9% in 2007. Selling, general and administrative expenses for NewPage were $217 million in 2008 compared to $124 million in 2007, driven by the effects of the Acquisition.
Interest expense for 2008 was $298 million compared to $175 million for 2007. Interest expense for 2008 for NewPage was $277 million compared to $154 million for 2007. The increase was primarily a result of higher average outstanding debt balances resulting from the financing for the Acquisition, partially offset by lower interest rates.
34
Income tax expense (benefit) was $4 million in 2008 and $(6) million in 2007. Income tax expense (benefit) for NewPage was zero in 2008 and $4 million in 2007. For the years ended December 31, 2008 and 2007, we recorded a valuation allowance against our net deferred income tax benefit for federal income taxes and for certain states as it was more likely than not that we would not realize those benefits as a result of our history of losses.
Net income (loss) attributable to NewPage Holding was $(142) million in 2008 compared $(22) million in 2007. Net income (loss) attributable to NewPage was $(117) million in 2008 compared to $(8) million in 2007. The change was primarily driven by the Acquisition and the effects of lower customer demand and inflation in input costs, partially offset by higher sales prices.
EBITDA was $477 million and $281 million for 2008 and 2007. See “Reconciliation of Net Income (Loss) Attributable to the Company to EBITDA” for further information on the use of EBITDA as a measurement tool.
Reconciliation of Net Income (Loss) Attributable to the Company to EBITDA
EBITDA is defined as net income (loss) attributable to the company before interest expense, income taxes, depreciation and amortization. EBITDA is not a measure of our performance under U.S. GAAP, is not intended to represent net income (loss) attributable to the company, and should not be used as an alternative to net income (loss) attributable to the company as an indicator of performance. EBITDA is shown because it is a primary component of certain covenants under our revolving credit facility and is a basis upon which our management assesses performance. In addition, our management believes EBITDA is useful to investors because it and similar measures are frequently used by securities analysts, investors and other interested parties in the evaluation of companies with substantial financial leverage. The use of EBITDA instead of net income (loss) attributable to the company has limitations as an analytical tool, and you should not consider it in isolation, or as a substitute for analysis of our results as reported under U.S. GAAP. Some of these limitations are:
| • | EBITDA does not reflect our current cash expenditure requirements, or future requirements, for capital expenditures or contractual commitments |
| • | EBITDA does not reflect changes in, or cash requirements for, our working capital needs |
| • | EBITDA does not reflect the significant interest expense, or the cash requirements necessary to service interest or principal payments, on our debt |
| • | although depreciation and amortization are non-cash charges, the assets being depreciated and amortized often will have to be replaced in the future, and EBITDA does not reflect any cash requirements for such replacements |
| • | our measure of EBITDA is not necessarily comparable to other similarly titled captions of other companies due to potential inconsistencies in the methods of calculation |
Because of these limitations, EBITDA should not be considered as discretionary cash available to us to reinvest in the growth of our business.
35
The following table presents a reconciliation of net income (loss) attributable to the company to EBITDA for the years ended December 31, 2009, 2008 and 2007:
| (in millions) |
2009 | 2008 | 2007 | |||||||||
| Net income (loss) attributable to the company |
$ | (323 | ) | $ | (142 | ) | $ | (22 | ) | |||
| Interest expense |
438 | 298 | 175 | |||||||||
| Income tax (benefit) |
(59 | ) | 4 | (6 | ) | |||||||
| Depreciation and amortization |
277 | 317 | 134 | |||||||||
| EBITDA |
$ | 333 | $ | 477 | $ | 281 | ||||||
Recently Issued Accounting Standards
Variable interest entity
In June 2009, the Financial Accounting Standards Board issued new guidance on the accounting for a variable interest entity (“VIE”). This guidance requires a qualitative approach to identifying a controlling financial interest in a VIE, and requires ongoing assessment of whether an entity is a VIE and whether an interest in a VIE makes the holder the primary beneficiary of the VIE. This guidance is effective for us as of January 1, 2010. We are currently evaluating the potential effect of the adoption of this guidance on our consolidated financial position, results of operations and cash flows.
Liquidity and Capital Resources
In September 2009, NewPage and NewPage Holding amended the senior secured credit facilities to obtain more favorable financial covenants. We paid consent fees totaling $15 million in order to amend the senior secured credit facilities and agreed to higher interest rates, as well as certain other changes to the facilities.
Later in September 2009, NewPage issued $1,700 million of First-Lien Notes for proceeds of $1,598 million (the “Notes Offering”). The net proceeds of the Notes Offering, together with approximately $5 million of borrowings under our revolving credit facility, were used to repay all amounts outstanding under our term loan and to pay fees and expenses of the Notes Offering.
We also amended the revolving credit facility and repaid the outstanding term loan to increase our operating and financial flexibility.
Available Liquidity
As of December 31, 2009, our principal sources of liquidity include cash generated from operating activities and availability under our revolving credit facility. The amount of borrowings and letters of credit available to NewPage pursuant to the revolving credit facility is limited to the lesser of $500 million or an amount determined pursuant to a borrowing base ($415 million as of December 31, 2009).
In September 2009, as part of the amendment of the revolving credit facility, we agreed to maintain a minimum of $50 million of availability through March 2011 and to limit capital expenditures. After that date, to the extent that NewPage’s unused borrowing availability under the revolving credit facility is below $50 million for 10 consecutive business days or $25 million for three consecutive days), NewPage is required to comply with specified financial ratios and tests, including a minimum interest and fixed charge coverage ratios and maximum senior and total leverage ratios.
36
As of December 31, 2009, we had $219 million available for borrowing in excess of the foregoing $50 million required minimum, after reduction for $94 million in letters of credit and $52 million in outstanding borrowings under the revolving credit facility. We have not experienced, and do not currently anticipate that we will experience, any limitations in our ability to access funds available under our revolving credit facility. In an effort to manage credit risk exposures under our debt and derivative instruments, we regularly monitor the credit-worthiness of the counterparties to these agreements. We believe our cash flow from operations, available borrowings under our revolving credit facility and cash and cash equivalents will be adequate to meet our liquidity needs for the next twelve months. However, given the uncertainty of the current economic environment, we cannot assure you that our business will generate sufficient cash flows from operations or that future borrowings will be available to us under our revolving credit facility in an amount sufficient to enable us to fund our liquidity needs. See “Risk Factors” for a discussion of various risks and uncertainties which could affect our ability to generate sufficient cash flows to meet our liquidity needs.
Aggregate indebtedness as of December 31, 2009 totaled $3,338 million, which includes $3,131 million at NewPage. We expect an increase in interest expense over prior periods because the First-Lien Notes have a higher interest rate than the term loan that was repaid. Beginning in 2012, our debt service requirements will substantially increase as a result of scheduled payments of our indebtedness. We anticipate that we will seek to refinance our indebtedness prior to that time or retire portions of indebtedness with issuances of equity securities, proceeds from the sale of assets or cash generated from operations. Our ability to operate our business, service our debt requirements and reduce our total debt will depend upon our future operating performance, which will be affected by prevailing economic conditions and financial, business and other factors, many of which are beyond our control, as well as the availability of revolving credit borrowings and other borrowings to refinance our existing indebtedness.
Cash Flows
Cash provided by operating activities was $44 million during 2009 compared to $60 million during 2008, primarily the result of the decline in sales demand and lower pricing, largely offset by $289 million of cash received from the alternative fuel mixture credits. Investing activities in 2009 include spending of $75 million for capital expenditures and the receipt of $28 million of proceeds from the sales of assets. Financing activities in 2009 included the issuance of $1,700 million of First-Lien Notes (proceeds of $1,598 million) used to repay the term loan and to pay fees and expenses related to the Notes Offering. We had net borrowings of $52 million under the revolving credit facility as of December 31, 2009, that were used to pay fees and expenses related to the amendments of our senior secured credit facilities, to repay a portion of the term loan and for working capital purposes.
Cash provided by operating activities was $60 million during 2008 compared to $277 million during 2007. The decrease was primarily the result of a decline in sales demand and a resulting investment in inventory and payments for severance and closure costs, as well as costs for integration of the NPCP business into the existing NewPage operations. In response to these challenges, we accelerated and completed the shutdown of operations at our Kimberly and Niagara, Wisconsin mills in the third quarter of 2008. In addition, we took coated paper market-related downtime at other locations. Investing activities in 2008 included $165 million for capital expenditures. Financing activities in 2008 included a $7 million loan to our parent company, an $8 million distribution from Rumford Cogeneration Company L.P. to the limited partners and $16 million in scheduled payments on our long-term debt. Cash and cash equivalents decreased by $140 million during 2008 to $3 million at December 31, 2008.
37
Capital Expenditures
In order to preserve liquidity in 2009, we significantly reduced our capital expenditures. Capital expenditures for the year ended December 31, 2009 were $75 million compared to $165 million for the year ended December 31, 2008. In 2010, we expect to incur approximately $75 million in capital expenditures. We expect to fund our capital expenditures from cash flows from operations and our revolving credit facility. Our revolving credit facility limits the amount of capital expenditures we can incur. We do not believe that this limit or our lower level of expected capital expenditures will negatively affect our ability to meet the requirements of our customers.
Compliance with environmental laws and regulations is a significant factor in our business. During 2009, we did not incur any capital expenditures associated with maintaining compliance with applicable environmental laws and regulations or to meet new regulatory requirements. Furthermore, we do not expect to incur any environmental capital expenditures in 2010. Environmental compliance may require increased capital and operating expenditures over time as environmental laws or regulations, or interpretations thereof, change or the nature of our operations require us to make significant additional expenditures.
Financial Discussion
In 2009, we continued to achieve cost savings from operating efficiencies, synergies and other restructuring activities that resulted from the acquisition of SENA. In an effort to manage costs and cash flows in 2009, we implemented a wage freeze in 2009 for all salaried exempt and non-exempt employees, reduced 2008 bonuses paid in 2009, suspended the matching contribution for our salaried 401(k) plan effective June 1, 2009 and significantly reduced our capital expenditures from $165 million in 2008 to $75 million in 2009. In November 2009, we amended a postretirement benefit plan to phase out company-provided post-age 65 medical benefits for certain retirees by 2012. We recorded an adjustment to reduce the benefit liability by $57 million in the fourth quarter of 2009 with an offset to other comprehensive income (loss). This adjustment is the net result of the reduction in benefits from the plan amendment, partially offset by changes in actuarial assumptions as of the November 2009 re-measurement date. This amendment is expected to result in a reduction in other postretirement benefit costs of approximately $15 million per year.
We have various investments held by our defined-benefit pension plan trusts. The returns on these assets have generally matched the broader market. We are monitoring the effects of the market decline in 2008 on our minimum pension funding requirements and pension expense for future periods. We do not anticipate material increases in our minimum funding requirements during 2010.
The U.S. Internal Revenue Code allowed a refundable excise tax credit for alternative fuel mixtures produced for sale or for use as a fuel in a trade or business. The credit was equal to fifty cents per gallon of alternative fuel contained in the mixture and expired on December 31, 2009. We have received payments of $289 million through December 31, 2009. Income recognized for the credit is included in net income (loss) attributable to the company. We recognized $304 million of income in other (income) expense for the year ended December 31, 2009 for alternative fuel mixtures used through December 31, 2009. At this time, we view any extension of this credit, or the introduction of any similar program in the foreseeable future, as unlikely. We believe that the benefits of the alternative fuel mixture credit were passed on to customers in the form of lower sales prices in 2009.
38
In January 2010, the compensation committee approved and adopted the NewPage Corporation 2010 Executive Long-Term Incentive Plan (“LTIP”). The LTIP and the individual award agreements under the LTIP provide for a service award and a performance award to various executives. The service award is payable if the participant remains as an employee of NewPage or its affiliates through December 31, 2012. The performance award is payable if the participant remains as an employee of NewPage or its affiliates through December 31, 2012, and if we achieve annual performance goals established each year by the compensation committee during the three years ended December 31, 2012. The participant will receive a pro rata share of the total award if, prior to December 31, 2012, the participant’s employment is terminated by us without cause or by the participant for good reason, each as defined in the LTIP. The participant will receive the entire award if, prior to December 31, 2012, a change in control occurs, as defined by the LTIP. We expect that the LTIP will result in an annual decrease in income before taxes of approximately $7 million beginning in 2010.
Off-balance sheet arrangements
We do not have any off-balance sheet arrangements.
Contractual Commitments
The following table reflects our contractual commitments associated with our debt and other obligations as of December 31, 2009:
| (in millions) |
Total | 2010 | 2011-12 | 2013-14 | There- After | ||||||||||
| Contractual Obligations |
|||||||||||||||
| Long-term debt (1) |
$ | 3,351 | $ | — | $ | 1,083 | $ | 2,268 | $ | — | |||||
| Interest expense (2) |
1,388 | 323 | 589 | 476 | — | ||||||||||
| Operating leases |
26 | 8 | 11 | 4 | 3 | ||||||||||
| Fiber supply agreements (3) |
498 | 147 | 98 | 80 | 173 | ||||||||||
| Other purchase obligations |
456 | 130 | 114 | 93 | 119 | ||||||||||
| Pension/postretirement plans |
442 | 27 | 71 | 61 | 283 | ||||||||||
| Other long-term obligations |
76 | — | 30 | 7 | 39 | ||||||||||
| Total |
$ | 6,237 | $ | 635 | $ | 1,996 | $ | 2,989 | $ | 617 | |||||
| Other Commercial Commitments |
|||||||||||||||
| Standby letters of credit (4) |
$ | 94 | $ | 94 | $ | — | $ | — | $ | — | |||||
| Total |
$ | 94 | $ | 94 | $ | — | $ | — | $ | — | |||||
| (1) | Amounts shown represent scheduled maturities and do not take into account any acceleration of indebtedness resulting from mandatory payments required for events such as asset sales or under the excess cash flows provisions of our financing instruments. The amounts for NewPage are $3,143, zero, $1,083, $2,060 and zero for total, 2010, 2011-12, 2013-14 and thereafter, respectively. |
| (2) | Amounts include contractual interest payments using the interest rates as of December 31, 2009 applicable to our variable-rate debt and stated fixed interest rate for fixed-rate debt. The amounts for NewPage are $1,319, $323, $589, $407 and zero for total, 2010, 2011-12, 2013-14 and thereafter, respectively. |
| (3) | The contractual commitments consist of the minimum required expenditures to be made pursuant to the fiber supply agreements. |
| (4) | We are required to post letters of credit or other financial assurance obligations with certain of our energy and other suppliers. |
| ITEM 7A. | QUANTITATIVE AND QUALITATIVE DISCLOSURES ABOUT MARKET RISK |
Interest Rate Risk
As of December 31, 2009 and 2008, $484 million and $1,999 million of our debt consisted of borrowings with variable interest rates. If market interest rates increase, variable-rate debt will create higher debt service requirements, which could adversely affect our cash flow or compliance with our debt covenants.
39
The potential annual increase in interest expense resulting from a 100 basis point increase in quoted interest rates on our debt balances outstanding at December 31, 2009 and 2008 would be $5 million and $20 million, without taking into account any interest rate derivative agreements.
As of December 31, 2009, we had outstanding interest rate swaps totaling $900 million for which we receive amounts based on LIBOR and pay amounts at a weighted-average fixed rate of 3.8%. These swaps expire from June 30, 2010 through December 2012. In September 2009, we entered into a $200 million interest rate swap with an offsetting exposure for a portion of our interest rate swaps. This swap expires in December 2012 and we receive amounts at a weighted-average fixed rate of 2.7% and pay amounts based on LIBOR. Because of the debt refinancing in September 2009, we no longer have sufficient variable-rate debt exposure for our outstanding interest rate swaps to qualify for hedge accounting treatment and record the changes in fair value as an adjustment to interest expense.
A 100 basis point change in quoted interest rates on our interest rate derivative agreements outstanding at December 31, 2009 would have the following effects, assuming that the decrease in LIBOR interest rates is limited to an interest rate of zero percent:
| Effect of change in interest rates | |||||||
| (in millions) |
Increase | Decrease | |||||
| Increase (decrease) in fair value of the interest rate swap liability with offset recorded as an increase (decrease) in interest expense |
$ | (7 | ) | $ | 6 | ||
| Increase (decrease) in cash interest payments for the next twelve months |
(5 | ) | 3 | ||||
Foreign Currency Risk
Our Canadian subsidiary makes a portion of its purchases and sales in U.S. dollars. As a result, it is subject to transaction exposures that arise from foreign exchange movements between the date that the foreign currency transaction is recorded and the date it is consummated. Foreign currency exchange contracts may be used periodically to manage the variability in cash flows and revenues from the forecasted payment or receipt of currencies other than our functional currency, the U.S. dollar. As of December 31, 2009 and 2008, we had no foreign currency forward contracts outstanding.
40
| ITEM 8. | FINANCIAL STATEMENTS AND SUPPLEMENTARY DATA |
41
REPORT OF INDEPENDENT REGISTERED PUBLIC ACCOUNTING FIRM
To the Stockholder and Board of Directors of NewPage Holding Corporation:
In our opinion, the accompanying consolidated balance sheets and the related consolidated statements of operations, equity (deficit) and cash flows present fairly, in all material respects, the financial position of NewPage Holding Corporation and its subsidiaries at December 31, 2009 and 2008, and the results of their operations and their cash flows for each of the three years in the period ended December 31, 2009 in conformity with accounting principles generally accepted in the United States of America. These financial statements are the responsibility of the Company’s management. Our responsibility is to express an opinion on these financial statements based on our audits. We conducted our audits of these statements in accordance with the standards of the Public Company Accounting Oversight Board (United States). Those standards require that we plan and perform the audit to obtain reasonable assurance about whether the financial statements are free of material misstatement. An audit includes examining, on a test basis, evidence supporting the amounts and disclosures in the financial statements, assessing the accounting principles used and significant estimates made by management, and evaluating the overall financial statement presentation. We believe that our audits provide a reasonable basis for our opinion.
As discussed in Note A to the consolidated financial statements, the Company changed the manner in which it accounts for noncontrolling interests effective January 1, 2009.
| /s/ PricewaterhouseCoopers LLP |
| PricewaterhouseCoopers LLP |
| Dayton, Ohio |
| February 18, 2010 |
42
REPORT OF INDEPENDENT REGISTERED PUBLIC ACCOUNTING FIRM
To the Stockholder and Board of Directors of NewPage Corporation:
In our opinion, the accompanying consolidated balance sheets and the related consolidated statements of operations, equity and cash flows present fairly, in all material respects, the financial position of NewPage Corporation and its subsidiaries at December 31, 2009 and 2008, and the results of their operations and their cash flows for each of the three years in the period ended December 31, 2009 in conformity with accounting principles generally accepted in the United States of America. These financial statements are the responsibility of the Company’s management. Our responsibility is to express an opinion on these financial statements based on our audits. We conducted our audits of these statements in accordance with the standards of the Public Company Accounting Oversight Board (United States). Those standards require that we plan and perform the audit to obtain reasonable assurance about whether the financial statements are free of material misstatement. An audit includes examining, on a test basis, evidence supporting the amounts and disclosures in the financial statements, assessing the accounting principles used and significant estimates made by management, and evaluating the overall financial statement presentation. We believe that our audits provide a reasonable basis for our opinion.
As discussed in Note A to the consolidated financial statements, the Company changed the manner in which it accounts for noncontrolling interests effective January 1, 2009.
| /s/ PricewaterhouseCoopers LLP |
| PricewaterhouseCoopers LLP |
| Dayton, Ohio |
| February 18, 2010 |
43
NEWPAGE HOLDING CORPORATION AND SUBSIDIARIES
CONSOLIDATED BALANCE SHEETS
DECEMBER 31, 2009 and 2008
Dollars in millions, except per share amounts
| 2009 | 2008 | |||||||
| ASSETS |
||||||||
| Cash and cash equivalents |
$ | 5 | $ | 3 | ||||
| Accounts receivable, net of allowance for doubtful accounts of $2 and $3 |
296 | 278 | ||||||
| Inventories (Note C) |
602 | 628 | ||||||
| Other current assets |
23 | 22 | ||||||
| Total current assets |
926 | 931 | ||||||
| Property, plant and equipment, net (Note D) |
2,965 | 3,205 | ||||||
| Other assets |
115 | 110 | ||||||
| TOTAL ASSETS |
$ | 4,006 | $ | 4,246 | ||||
| LIABILITIES AND EQUITY (DEFICIT) |
||||||||
| Accounts payable (Note F) |
$ | 230 | $ | 254 | ||||
| Other current liabilities (Note F) |
238 | 270 | ||||||
| Current maturities of long-term debt (Note G) |
— | 16 | ||||||
| Total current liabilities |
468 | 540 | ||||||
| Long-term debt (Note G) |
3,231 | 3,082 | ||||||
| Other long-term obligations |
493 | 622 | ||||||
| Commitments and contingencies (Note M) |
||||||||
| EQUITY (DEFICIT) |
||||||||
| Common stock, 10 shares authorized, issued and outstanding, $0.01 per share par value |
— | — | ||||||
| Additional paid-in capital |
685 | 661 | ||||||
| Accumulated deficit |
(606 | ) | (283 | ) | ||||
| Accumulated other comprehensive income (loss) |
(265 | ) | (402 | ) | ||||
| Stockholder’s equity (deficit) |
(186 | ) | (24 | ) | ||||
| Noncontrolling interests |
— | 26 | ||||||
| Total equity (deficit) |
(186 | ) | 2 | |||||
| TOTAL LIABILITIES AND EQUITY (DEFICIT) |
$ | 4,006 | $ | 4,246 | ||||
See notes to consolidated financial statements.
44
NEWPAGE HOLDING CORPORATION AND SUBSIDIARIES
CONSOLIDATED STATEMENTS OF OPERATIONS
YEARS ENDED DECEMBER 31, 2009, 2008 AND 2007
Dollars in millions
| 2009 | 2008 | 2007 | ||||||||||
| Net sales |
$ | 3,106 | $ | 4,356 | $ | 2,168 | ||||||
| Cost of sales |
3,171 | 3,979 | 1,895 | |||||||||
| Selling, general and administrative expenses |
180 | 217 | 127 | |||||||||
| Interest expense (including loss on extinguishment of debt of $85 in 2009 and non-cash interest expense of $96, $47 and $47) (Note G) |
438 | 298 | 175 | |||||||||
| Other (income) expense, net (Note K) |
(306 | ) | (3 | ) | (2 | ) | ||||||
| Income (loss) before income taxes |
(377 | ) | (135 | ) | (27 | ) | ||||||
| Income tax (benefit) |
(59 | ) | 4 | (6 | ) | |||||||
| Net income (loss) |
(318 | ) | (139 | ) | (21 | ) | ||||||
| Net income (loss)—noncontrolling interests |
5 | 3 | 1 | |||||||||
| Net income (loss) attributable to the company |
$ | (323 | ) | $ | (142 | ) | $ | (22 | ) | |||
See notes to consolidated financial statements.
45
NEWPAGE HOLDING CORPORATION AND SUBSIDIARIES
CONSOLIDATED STATEMENTS OF EQUITY (DEFICIT)
YEAR ENDED DECEMBER 31, 2009
Dollars in millions
| Equity attributable to the company | |||||||||||||||||||||||||||||
|
Common Stock |
Additional Paid-in Capital |
Accumulated Deficit |
Accumulated Other Comprehensive Income (Loss) |
Total attributable to the company |
Noncontrolling Interests |
Total | |||||||||||||||||||||||
| Shares | Amount | ||||||||||||||||||||||||||||
| Balance at December 31, 2008 |
10 | $ | — | $ | 661 | $ | (283 | ) | $ | (402 | ) | $ | (24 | ) | $ | 26 | $ | 2 | |||||||||||
| Comprehensive income (loss): |
|||||||||||||||||||||||||||||
| Net income (loss) |
(323 | ) | (323 | ) | 5 | (318 | ) | ||||||||||||||||||||||
| Defined-benefit postretirement plans: |
|||||||||||||||||||||||||||||
| Change in net actuarial gains (losses), net of tax of $12 |
20 | 20 | 20 | ||||||||||||||||||||||||||
| Change in net prior service cost credit, net of tax of $32 |
50 | 50 | 50 | ||||||||||||||||||||||||||
| Cash-flow hedges: |
|||||||||||||||||||||||||||||
| Change in unrealized gains (losses), net of tax benefit of $9 |
(14 | ) | (14 | ) | (14 | ) | |||||||||||||||||||||||
| Reclassification adjustment to net income (loss), net of tax of $10 |
68 | 68 | 68 | ||||||||||||||||||||||||||
| Foreign currency translation adjustment |
13 | 13 | 13 | ||||||||||||||||||||||||||
| Comprehensive income (loss) |
$ | (186 | ) | $ | 5 | $ | (181 | ) | |||||||||||||||||||||
| Distributions from Rumford Cogeneration to limited partners |
(7 | ) | (7 | ) | |||||||||||||||||||||||||
| Purchase of limited partner interests in Rumford Cogeneration (Note A) |
17 | 17 | (24 | ) | (7 | ) | |||||||||||||||||||||||
| Equity awards (Note I) |
10 | 10 | 10 | ||||||||||||||||||||||||||
| Loans to NewPage Group (Note I) |
(3 | ) | (3 | ) | (3 | ) | |||||||||||||||||||||||
| Balance at December 31, 2009 |
10 | $ | — | $ | 685 | $ | (606 | ) | $ | (265 | ) | $ | (186 | ) | $ | — | $ | (186 | ) | ||||||||||
See notes to consolidated financial statements.
46
NEWPAGE HOLDING CORPORATION AND SUBSIDIARIES
CONSOLIDATED STATEMENTS OF EQUITY (DEFICIT)
YEAR ENDED DECEMBER 31, 2008
Dollars in millions
| Equity attributable to the company | |||||||||||||||||||||||||||||
|
Common Stock |
Additional Paid-in Capital |
Accumulated Deficit |
Accumulated Other Comprehensive Income (Loss) |
Total attributable to the company |
Noncontrolling Interests |
Total | |||||||||||||||||||||||
| Shares | Amount | ||||||||||||||||||||||||||||
| Balance at December 31, 2007 |
10 | $ | — | $ | 632 | $ | (141 | ) | $ | 23 | $ | 514 | $ | 31 | $ | 545 | |||||||||||||
| Comprehensive income (loss): |
|||||||||||||||||||||||||||||
| Net income (loss) |
(142 | ) | (142 | ) | 3 | (139 | ) | ||||||||||||||||||||||
| Unrecognized loss on defined benefit plans |
(360 | ) | (360 | ) | (360 | ) | |||||||||||||||||||||||
| Cash-flow hedges: |
|||||||||||||||||||||||||||||
| Change in unrealized gains (losses) |
(62 | ) | (62 | ) | (62 | ) | |||||||||||||||||||||||
| Reclassification adjustment to net income (loss) |
6 | 6 | 6 | ||||||||||||||||||||||||||
| Foreign currency translation adjustment |
(9 | ) | (9 | ) | (9 | ) | |||||||||||||||||||||||
| Comprehensive income (loss) |
$ | (567 | ) | $ | 3 | $ | (564 | ) | |||||||||||||||||||||
| Adjustment to fair value of equity issued by NewPage Group in connection with the Acquisition |
18 | 18 | 18 | ||||||||||||||||||||||||||
| Distributions from Rumford Cogeneration to limited partners |
(8 | ) | (8 | ) | |||||||||||||||||||||||||
| Equity awards (Note I) |
18 | 18 | 18 | ||||||||||||||||||||||||||
| Loans to NewPage Group (Note I) |
(7 | ) | (7 | ) | (7 | ) | |||||||||||||||||||||||
| Balance at December 31, 2008 |
10 | $ | — | $ | 661 | $ | (283 | ) | $ | (402 | ) | $ | (24 | ) | $ | 26 | $ | 2 | |||||||||||
See notes to consolidated financial statements.
47
NEWPAGE HOLDING CORPORATION AND SUBSIDIARIES
CONSOLIDATED STATEMENTS OF EQUITY
YEAR ENDED DECEMBER 31, 2007
Dollars in millions
| Equity attributable to the company | |||||||||||||||||||||||||||||
|
Common Stock |
Additional Paid-in Capital |
Accumulated Deficit |
Accumulated Other Comprehensive Income (Loss) |
Total attributable to the company |
Noncontrolling Interests |
Total | |||||||||||||||||||||||
| Shares | Amount | ||||||||||||||||||||||||||||
| Balance at December 31, 2006 |
10 | $ | — | $ | 293 | $ | (119 | ) | $ | 20 | $ | 194 | $ | 38 | $ | 232 | |||||||||||||
| Comprehensive income (loss): |
|||||||||||||||||||||||||||||
| Net income (loss) |
(22 | ) | (22 | ) | 1 | (21 | ) | ||||||||||||||||||||||
| Net actuarial gains on defined benefit plans, net of tax of $10 |
9 | 9 | 9 | ||||||||||||||||||||||||||
| Cash-flow hedges: |
|||||||||||||||||||||||||||||
| Change in unrealized gains (losses), net of tax benefit of $2 |
(3 | ) | (3 | ) | (3 | ) | |||||||||||||||||||||||
| Reclassification adjustment to net income (loss), net of tax benefit of $2 |
(3 | ) | (3 | ) | (3 | ) | |||||||||||||||||||||||
| Comprehensive income (loss) |
$ | (19 | ) | $ | 1 | $ | (18 | ) | |||||||||||||||||||||
| Additional capital contributed by NewPage Group in connection with the Acquisition |
329 | 329 | 329 | ||||||||||||||||||||||||||
| Distributions from Rumford Cogeneration to limited partners |
(8 | ) | (8 | ) | |||||||||||||||||||||||||
| Equity awards (Note I) |
14 | 14 | 14 | ||||||||||||||||||||||||||
| Loan to Maple Timber (Note I) |
(4 | ) | (4 | ) | (4 | ) | |||||||||||||||||||||||
| Balance at December 31, 2007 |
10 | $ | — | $ | 632 | $ | (141 | ) | $ | 23 | $ | 514 | $ | 31 | $ | 545 | |||||||||||||
See notes to consolidated financial statements.
48
NEWPAGE HOLDING CORPORATION AND SUBSIDIARIES
CONSOLIDATED STATEMENTS OF CASH FLOWS
YEARS ENDED DECEMBER 31, 2009, 2008 AND 2007
Dollars in millions
| 2009 | 2008 | 2007 | ||||||||||
| CASH FLOWS FROM OPERATING ACTIVITIES |
||||||||||||
| Net income (loss) |
$ | (318 | ) | $ | (139 | ) | $ | (21 | ) | |||
| Adjustments to reconcile net income (loss) to net cash provided by (used for) operating activities: |
||||||||||||
| Depreciation and amortization |
277 | 317 | 134 | |||||||||
| Non-cash interest expense |
96 | 47 | 47 | |||||||||
| Loss on extinguishment of debt (Note G) |
72 | — | — | |||||||||
| Loss on disposal of assets |
13 | 11 | 3 | |||||||||
| Deferred income taxes |
(61 | ) | 8 | (6 | ) | |||||||
| Write-off of costs of withdrawn 2006 initial public offering |
— | — | 3 | |||||||||
| LIFO effect |
— | 30 | 1 | |||||||||
| Non-cash U.S. pension (income) expense |
50 | (3 | ) | 2 | ||||||||
| Equity award expense (Note I) |
10 | 18 | 14 | |||||||||
| Change in operating assets and liabilities: |
||||||||||||
| Accounts receivable |
(12 | ) | 73 | 2 | ||||||||
| Inventories |
39 | (116 | ) | 56 | ||||||||
| Other operating assets |
3 | (7 | ) | (3 | ) | |||||||
| Accounts payable |
(31 | ) | (76 | ) | 4 | |||||||
| Accrued expenses and other obligations |
(94 | ) | (103 | ) | 41 | |||||||
| Net cash provided by (used for) operating activities |
44 | 60 | 277 | |||||||||
| CASH FLOWS FROM INVESTING ACTIVITIES |
||||||||||||
| Cash paid for acquisition |
— | (8 | ) | (1,486 | ) | |||||||
| Capital expenditures |
(75 | ) | (165 | ) | (102 | ) | ||||||
| Proceeds from sales of assets |
28 | 6 | — | |||||||||
| Net cash provided by (used for) investing activities |
(47 | ) | (167 | ) | (1,588 | ) | ||||||
| CASH FLOWS FROM FINANCING ACTIVITIES |
||||||||||||
| Proceeds from issuance of long-term debt |
1,598 | — | 2,008 | |||||||||
| Payment of financing costs |
(54 | ) | — | (62 | ) | |||||||
| Distributions from Rumford Cogeneration to limited partners |
(7 | ) | (8 | ) | (8 | ) | ||||||
| Purchase of interest of limited partner in Rumford Cogeneration |
(1 | ) | — | — | ||||||||
| Loans to parent companies (Note I) |
(3 | ) | (7 | ) | (4 | ) | ||||||
| Repayments of long-term debt |
(1,584 | ) | (16 | ) | (524 | ) | ||||||
| Borrowings on revolving credit facility |
1,205 | 153 | — | |||||||||
| Payments on revolving credit facility |
(1,153 | ) | (153 | ) | — | |||||||
| Net cash provided by (used for) financing activities |
1 | (31 | ) | 1,410 | ||||||||
| Effect of exchange rate changes on cash and cash equivalents |
4 | (2 | ) | — | ||||||||
| Net increase (decrease) in cash and cash equivalents |
2 | (140 | ) | 99 | ||||||||
| Cash and cash equivalents at beginning of year |
3 | 143 | 44 | |||||||||
| Cash and cash equivalents at end of year |
$ | 5 | $ | 3 | $ | 143 | ||||||
| SUPPLEMENTAL INFORMATION |
||||||||||||
| Cash paid for interest |
$ | 281 | $ | 251 | $ | 128 | ||||||
| Non-cash transaction— |
$ | — | $ | — | $ | 347 | ||||||
See notes to consolidated financial statements.
49
NEWPAGE CORPORATION AND SUBSIDIARIES
CONSOLIDATED BALANCE SHEETS
DECEMBER 31, 2009 and 2008
Dollars in millions, except per share amounts
| 2009 | 2008 | |||||||
| ASSETS |
||||||||
| Cash and cash equivalents |
$ | 5 | $ | 3 | ||||
| Accounts receivable, net of allowance for doubtful accounts of $2 and $3 |
296 | 278 | ||||||
| Inventories (Note C) |
602 | 628 | ||||||
| Other current assets |
23 | 22 | ||||||
| Total current assets |
926 | 931 | ||||||
| Property, plant and equipment, net (Note D) |
2,965 | 3,205 | ||||||
| Other assets |
114 | 109 | ||||||
| TOTAL ASSETS |
$ | 4,005 | $ | 4,245 | ||||
| LIABILITIES AND EQUITY |
||||||||
| Accounts payable (Note F) |
$ | 230 | $ | 254 | ||||
| Other current liabilities (Note F) |
238 | 270 | ||||||
| Current maturities of long-term debt (Note G) |
— | 16 | ||||||
| Total current liabilities |
468 | 540 | ||||||
| Long-term debt (Note G) |
3,030 | 2,900 | ||||||
| Other long-term obligations |
493 | 622 | ||||||
| Commitments and contingencies (Note M) |
||||||||
| EQUITY |
||||||||
| Common stock, 100 shares authorized, issued and outstanding, $0.01 per share par value |
— | — | ||||||
| Additional paid-in capital |
791 | 767 | ||||||
| Accumulated deficit |
(522 | ) | (214 | ) | ||||
| Accumulated other comprehensive income (loss) |
(255 | ) | (396 | ) | ||||
| Stockholder’s equity |
14 | 157 | ||||||
| Noncontrolling interests |
— | 26 | ||||||
| Total equity |
14 | 183 | ||||||
| TOTAL LIABILITIES AND EQUITY |
$ | 4,005 | $ | 4,245 | ||||
See notes to consolidated financial statements.
50
NEWPAGE CORPORATION AND SUBSIDIARIES
CONSOLIDATED STATEMENTS OF OPERATIONS
YEARS ENDED DECEMBER 31, 2009, 2008 AND 2007
Dollars in millions
| 2009 | 2008 | 2007 | ||||||||||
| Net sales |
$ | 3,106 | $ | 4,356 | $ | 2,168 | ||||||
| Cost of sales |
3,171 | 3,979 | 1,895 | |||||||||
| Selling, general and administrative expenses |
180 | 217 | 124 | |||||||||
| Interest expense (including loss on extinguishment of debt of $85 in 2009 and non-cash interest expense of $76, $26 and $26) (Note G) |
418 | 277 | 154 | |||||||||
| Other (income) expense, net (Note K) |
(306 | ) | (3 | ) | (2 | ) | ||||||
| Income (loss) before income taxes |
(357 | ) | (114 | ) | (3 | ) | ||||||
| Income tax (benefit) |
(54 | ) | — | 4 | ||||||||
| Net income (loss) |
(303 | ) | (114 | ) | (7 | ) | ||||||
| Net income (loss)—noncontrolling interests |
5 | 3 | 1 | |||||||||
| Net income (loss) attributable to the company |
$ | (308 | ) | $ | (117 | ) | $ | (8 | ) | |||
See notes to consolidated financial statements.
51
NEWPAGE CORPORATION AND SUBSIDIARIES
CONSOLIDATED STATEMENTS OF EQUITY
YEAR ENDED DECEMBER 31, 2009
Dollars in millions
| Equity attributable to the company | |||||||||||||||||||||||||||||
|
Common Stock |
Additional Paid-in Capital |
Accumulated Deficit |
Accumulated Other Comprehensive Income (Loss) |
Total attributable to the company |
Noncontrolling Interests |
Total | |||||||||||||||||||||||
| Shares | Amount | ||||||||||||||||||||||||||||
| Balance at December 31, 2008 |
100 | $ | — | $ | 767 | $ | (214 | ) | $ | (396 | ) | $ | 157 | $ | 26 | $ | 183 | ||||||||||||
| Comprehensive income (loss): |
|||||||||||||||||||||||||||||
| Net income (loss) |
(308 | ) | (308 | ) | 5 | (303 | ) | ||||||||||||||||||||||
| Defined-benefit postretirement plans: |
|||||||||||||||||||||||||||||
| Change in net actuarial gains (losses), net of tax of $12 |
20 | 20 | 20 | ||||||||||||||||||||||||||
| Change in net prior service cost credit, net of tax of $32 |
50 | 50 | 50 | ||||||||||||||||||||||||||
| Cash-flow hedges: |
|||||||||||||||||||||||||||||
| Change in unrealized gains (losses), net of tax benefit of $9 |
(14 | ) | (14 | ) | (14 | ) | |||||||||||||||||||||||
| Reclassification adjustment to net income (loss), net of tax of $6 |
72 | 72 | 72 | ||||||||||||||||||||||||||
| Foreign currency translation adjustment |
13 | 13 | 13 | ||||||||||||||||||||||||||
| Comprehensive income (loss) |
$ | (167 | ) | $ | 5 | $ | (162 | ) | |||||||||||||||||||||
| Distributions from Rumford Cogeneration to limited partners |
(7 | ) | (7 | ) | |||||||||||||||||||||||||
| Purchase of limited partner interests in Rumford Cogeneration (Note A) |
17 | 17 | (24 | ) | (7 | ) | |||||||||||||||||||||||
| Equity awards (Note I) |
10 | 10 | 10 | ||||||||||||||||||||||||||
| Loans to parent companies (Note I) |
(3 | ) | (3 | ) | (3 | ) | |||||||||||||||||||||||
| Balance at December 31, 2009 |
100 | $ | — | $ | 791 | $ | (522 | ) | $ | (255 | ) | $ | 14 | $ | — | $ | 14 | ||||||||||||
See notes to consolidated financial statements.
52
NEWPAGE CORPORATION AND SUBSIDIARIES
CONSOLIDATED STATEMENTS OF EQUITY
YEAR ENDED DECEMBER 31, 2008
Dollars in millions
| Equity attributable to the company | |||||||||||||||||||||||||||||
|
Common Stock |
Additional Paid-in Capital |
Accumulated Deficit |
Accumulated Other Comprehensive Income (Loss) |
Total attributable to the company |
Noncontrolling Interests |
Total | |||||||||||||||||||||||
| Shares | Amount | ||||||||||||||||||||||||||||
| Balance at December 31, 2007 |
100 | $ | — | $ | 729 | $ | (97 | ) | $ | 23 | $ | 655 | $ | 31 | $ | 686 | |||||||||||||
| Comprehensive income (loss): |
|||||||||||||||||||||||||||||
| Net income (loss) |
(117 | ) | (117 | ) | 3 | (114 | ) | ||||||||||||||||||||||
| Unrecognized loss on defined benefit plans, net of tax benefit of $10 |
(350 | ) | (350 | ) | (350 | ) | |||||||||||||||||||||||
| Cash-flow hedges: |
|||||||||||||||||||||||||||||
| Change in unrealized gains (losses), net of tax of $2 |
(64 | ) | (64 | ) | (64 | ) | |||||||||||||||||||||||
| Reclassification adjustment to net income (loss), net of tax of $2 |
4 | 4 | 4 | ||||||||||||||||||||||||||
| Foreign currency translation adjustment |
(9 | ) | (9 | ) | (9 | ) | |||||||||||||||||||||||
| Comprehensive income (loss) |
$ | (536 | ) | $ | 3 | $ | (533 | ) | |||||||||||||||||||||
| Restoration of tax valuation allowance on NewPage Holding as a result of changes in deferred income tax position related to the Acquisition |
9 | 9 | 9 | ||||||||||||||||||||||||||
| Adjustment to fair value of equity issued by NewPage Group in connection with the Acquisition |
18 | 18 | 18 | ||||||||||||||||||||||||||
| Distributions from Rumford Cogeneration to limited partners |
(8 | ) | (8 | ) | |||||||||||||||||||||||||
| Equity awards (Note I) |
18 | 18 | 18 | ||||||||||||||||||||||||||
| Loans to parent companies (Note I) |
(7 | ) | (7 | ) | (7 | ) | |||||||||||||||||||||||
| Balance at December 31, 2008 |
100 | $ | — | $ | 767 | $ | (214 | ) | $ | (396 | ) | $ | 157 | $ | 26 | $ | 183 | ||||||||||||
See notes to consolidated financial statements.
53
NEWPAGE CORPORATION AND SUBSIDIARIES
CONSOLIDATED STATEMENTS OF EQUITY
YEAR ENDED DECEMBER 31, 2007
Dollars in millions
| Equity attributable to the company | |||||||||||||||||||||||||||||
|
Common Stock |
Additional Paid-in Capital |
Accumulated Deficit |
Accumulated Other Comprehensive Income (Loss) |
Total attributable to the company |
Noncontrolling Interests |
Total | |||||||||||||||||||||||
| Shares | Amount | ||||||||||||||||||||||||||||
| Balance at December 31, 2006 |
100 | $ | — | $ | 400 | $ | (89 | ) | $ | 20 | $ | 331 | $ | 38 | $ | 369 | |||||||||||||
| Comprehensive income (loss): |
|||||||||||||||||||||||||||||
| Net income (loss) |
(8 | ) | (8 | ) | 1 | (7 | ) | ||||||||||||||||||||||
| Net actuarial gains on defined benefit plans, net of tax of $10 |
9 | 9 | 9 | ||||||||||||||||||||||||||
| Cash-flow hedges: |
|||||||||||||||||||||||||||||
| Change in unrealized gains (losses), net of tax benefit of $2 |
(3 | ) | (3 | ) | (3 | ) | |||||||||||||||||||||||
| Reclassification adjustment to net income (loss), net of tax benefit of $2 |
(3 | ) | (3 | ) | (3 | ) | |||||||||||||||||||||||
| Comprehensive income (loss) |
$ | (5 | ) | $ | 1 | $ | (4 | ) | |||||||||||||||||||||
| Additional capital contributed by NewPage Group in connection with the Acquisition |
329 | 329 | 329 | ||||||||||||||||||||||||||
| Pushdown from NewPage Holding for reversal of tax valuation allowance attributed to the Acquisition |
(9 | ) | (9 | ) | (9 | ) | |||||||||||||||||||||||
| Distributions from Rumford Cogeneration to limited partners |
(8 | ) | (8 | ) | |||||||||||||||||||||||||
| Equity awards (Note I) |
14 | 14 | 14 | ||||||||||||||||||||||||||
| Loans to parent companies (Note I) |
(5 | ) | (5 | ) | (5 | ) | |||||||||||||||||||||||
| Balance at December 31, 2007 |
100 | $ | — | $ | 729 | $ | (97 | ) | $ | 23 | $ | 655 | $ | 31 | $ | 686 | |||||||||||||
See notes to consolidated financial statements.
54
NEWPAGE CORPORATION AND SUBSIDIARIES
CONSOLIDATED STATEMENTS OF CASH FLOWS
YEARS ENDED DECEMBER 31, 2009, 2008 AND 2007
Dollars in millions
| 2009 | 2008 | 2007 | ||||||||||
| CASH FLOWS FROM OPERATING ACTIVITIES |
||||||||||||
| Net income (loss) |
$ | (303 | ) | $ | (114 | ) | $ | (7 | ) | |||
| Adjustments to reconcile net income (loss) to net cash provided by (used for) operating activities: |
||||||||||||
| Depreciation and amortization |
277 | 317 | 134 | |||||||||
| Non-cash interest expense |
76 | 26 | 26 | |||||||||
| Loss on extinguishment of debt (Note G) |
72 | — | — | |||||||||
| Loss on disposal of assets |
13 | 11 | 3 | |||||||||
| Deferred income taxes |
(57 | ) | 4 | 4 | ||||||||
| LIFO effect |
— | 30 | 1 | |||||||||
| Non-cash U.S. pension (income) expense |
50 | (3 | ) | 2 | ||||||||
| Equity award expense (Note I) |
10 | 18 | 14 | |||||||||
| Change in operating assets and liabilities: |
||||||||||||
| Accounts receivable |
(12 | ) | 73 | 2 | ||||||||
| Inventories |
39 | (116 | ) | 56 | ||||||||
| Other operating assets |
3 | (7 | ) | (3 | ) | |||||||
| Accounts payable |
(31 | ) | (76 | ) | 4 | |||||||
| Accrued expenses and other obligations |
(93 | ) | (103 | ) | 42 | |||||||
| Net cash provided by (used for) operating activities |
44 | 60 | 278 | |||||||||
| CASH FLOWS FROM INVESTING ACTIVITIES |
||||||||||||
| Cash paid for acquisition |
— | (8 | ) | (1,486 | ) | |||||||
| Capital expenditures |
(75 | ) | (165 | ) | (102 | ) | ||||||
| Proceeds from sales of assets |
28 | 6 | — | |||||||||
| Net cash provided by (used for) investing activities |
(47 | ) | (167 | ) | (1,588 | ) | ||||||
| CASH FLOWS FROM FINANCING ACTIVITIES |
||||||||||||
| Proceeds from issuance of long-term debt |
1,598 | — | 2,008 | |||||||||
| Payment of financing costs |
(54 | ) | — | (62 | ) | |||||||
| Distributions from Rumford Cogeneration to limited partners |
(7 | ) | (8 | ) | (8 | ) | ||||||
| Purchase of interest of limited partner in Rumford Cogeneration |
(1 | ) | — | — | ||||||||
| Loans to parent companies (Note I) |
(3 | ) | (7 | ) | (5 | ) | ||||||
| Repayments of long-term debt |
(1,584 | ) | (16 | ) | (524 | ) | ||||||
| Borrowings on revolving credit facility |
1,205 | 153 | — | |||||||||
| Payments on revolving credit facility |
(1,153 | ) | (153 | ) | — | |||||||
| Net cash provided by (used for) financing activities |
1 | (31 | ) | 1,409 | ||||||||
| Effect of exchange rate changes on cash and cash equivalents |
4 | (2 | ) | — | ||||||||
| Net increase (decrease) in cash and cash equivalents |
2 | (140 | ) | 99 | ||||||||
| Cash and cash equivalents at beginning of year |
3 | 143 | 44 | |||||||||
| Cash and cash equivalents at end of year |
$ | 5 | $ | 3 | $ | 143 | ||||||
| SUPPLEMENTAL INFORMATION |
||||||||||||
| Cash paid for interest |
$ | 281 | $ | 251 | $ | 128 | ||||||
| Non-cash transaction— |
$ | — | $ | — | $ | 347 | ||||||
See notes to consolidated financial statements.
55
NEWPAGE HOLDING CORPORATION AND SUBSIDIARIES
NEWPAGE CORPORATION AND SUBSIDIARIES
NOTES TO CONSOLIDATED FINANCIAL STATEMENTS
YEARS ENDED DECEMBER 31, 2009, 2008 AND 2007
Dollars in millions, except per share amounts
| A. | BASIS OF PRESENTATION |
NewPage Holding Corporation (“NewPage Holding”) is a holding company that owns all of the outstanding capital stock of NewPage Corporation. NewPage Corporation and its subsidiaries are engaged in manufacturing, marketing and distributing printing papers used primarily for commercial printing, magazines, catalogs, textbooks and labels. Our products include coated, uncoated, supercalendered, newsprint and specialty papers and market pulp. Our products are manufactured at multiple mills in the United States and one mill in Canada and are supported by multiple distribution and converting locations. We operate within one operating segment. The consolidated financial statements include the accounts of NewPage Holding and all entities it controls. All intercompany transactions and balances have been eliminated.
Unless the context provides otherwise, the terms “we,” “our” and “us” refer to NewPage Holding and its consolidated subsidiaries, including NewPage Corporation, a separate public-reporting company. Unless otherwise noted, “NewPage” refers to NewPage Corporation and its consolidated subsidiaries. Other than NewPage Holding’s debt and equity activity and income tax effects, all other assets, liabilities, income, expenses, and cash flows presented for all periods represent those of its wholly-owned subsidiary, NewPage. Unless otherwise noted, the information provided pertains to both NewPage Holding and NewPage.
In December 2007, the Financial Accounting Standards Board issued guidance that establishes accounting and reporting standards for ownership interests in subsidiaries held by parties other than the parent. The guidance also establishes reporting requirements that provide disclosures to identify and distinguish between the interests of the parent and the interests of the noncontrolling owners. We adopted the accounting treatment effective January 1, 2009 and retroactively adjusted amounts related to the minority interests in the consolidated financial statements to equity and removed the amount of minority interest in the consolidated statements of operations from other (income) expense. Revisions were made to prior period financial statements to present them on a comparable basis.
In December 2009 we purchased the interest of one limited partner in Rumford Cogeneration Company L.P. (“Rumford Cogeneration”), a limited partnership for which we are the general partner. In addition, we entered into an agreement to purchase all our remaining co-investors’ interests for $6. Payment for these interests is due by December 31, 2010. As a result, we have reflected the purchase price as a liability as of December 31, 2009 and recorded the excess of the limited partner’s share of noncontrolling interests over the purchase price as an increase in additional paid-in capital.
On December 21, 2007, NewPage acquired all of the issued and outstanding common stock of Stora Enso North America Inc. (“SENA”) from Stora Enso Oyj (“SEO”) (the “Acquisition”). We acquired SENA in order to create a single business platform and to enable us to remain competitive in the marketplace, serve our customers more efficiently and achieve synergies from the Acquisition. The Acquisition more than doubled our production capacity and broadened our product line. Following the Acquisition, SENA changed its name to NewPage Consolidated Papers Inc. (“NPCP”). References to both SENA and NPCP are to the acquired business. During 2008, we initiated actions to integrate NewPage operations and the former SENA facilities and services. See Note L for further information.
56
The results of operations for the year ended December 31, 2007 include the results for NPCP from the date of Acquisition. Unaudited pro forma consolidated financial information for the year ended December 31, 2007, as if the Acquisition had been completed at the beginning of the year, includes pro forma net sales of $4,659 and pro forma net income (loss) of $(108) for NewPage Holding and pro forma net sales of $4,659 and pro forma net income (loss) of $(94) for NewPage. This selected unaudited pro forma consolidated financial data is included only for the purpose of illustration and does not necessarily indicate what the operating results would have been if the Acquisition had been completed on that date. Moreover, this information does not necessarily indicate what our future operating results will be. This information includes actual data in 2007 for the period subsequent to the date of the Acquisition. For the period prior to the Acquisition, the unaudited pro forma information includes certain expenses of SENA that are no longer incurred after the date of the Acquisition.
We have evaluated subsequent events through the time of filing this Annual Report on Form 10-K on February 18, 2010.
| B. | SUMMARY OF SIGNIFICANT ACCOUNTING POLICIES |
Estimates and assumptions
The preparation of these consolidated financial statements required management to make estimates and assumptions that affect the reported amounts of some assets and liabilities and, in some instances, the reported amounts of revenues and expenses during the reporting period. Actual results could differ from these estimates.
Cash equivalents
Highly liquid securities with an original maturity of three months or less are considered to be cash equivalents.
Foreign currency translation
The statements of operations of our Canadian entity, whose functional currency is the Canadian dollar, are translated into U.S. dollars using the average exchange rates for the period and the balance sheets are translated using the exchange rates at the reporting date. Exchange rate differences arising from the translation of the net investments in foreign entities are recorded as a component of accumulated other comprehensive income (loss).
Concentration of credit risk
We are potentially subject to concentrations of credit risk related to our accounts receivable. The majority of accounts receivable are with paper merchants, printers and publishers. We limit our credit risk by performing ongoing credit evaluations and, when deemed necessary, by requiring accelerated payment terms, letters of credit, guarantees or collateral. For each of the years ended December 31, 2009, 2008 and 2007, sales to our largest customer were 19%, 21% and 25% of net sales. Accounts receivable at December 31, 2009, relating to our largest customer was 17% of accounts receivable, net. Accounts receivable at December 31, 2008, relating to our two largest customers were 17% and 11% of accounts receivable, net. Our ten largest customers accounted for approximately 51%, 52% and 57% of our net sales for the years ended December 31, 2009, 2008 and 2007.
57
Inventories
Inventories are valued at the lower of cost or market. Cost is determined using the last-in, first-out (“LIFO”) method for substantially all raw materials and finished goods for U.S.-based operations. Cost of all other inventories, mainly stores and supplies inventories and Canadian inventories, is determined by the average cost and first-in, first-out methods.
Property, plant and equipment
Owned assets are recorded at cost. Costs of renewals and betterments of properties are capitalized. Costs of maintenance and repairs are charged to expense using the direct-expensing method, whereby costs are recorded in the statement of operations in the same period that they are incurred. The cost of plant and equipment is depreciated utilizing the straight-line method over the estimated useful lives of the assets, which range from 20 to 40 years for buildings and 5 to 30 years for machinery and equipment.
Impairment of long-lived assets
We periodically evaluate whether current events or circumstances indicate that the carrying value of our long-lived assets to be held and used may not be recoverable. If these circumstances are determined to exist, an estimate of undiscounted future cash flows produced by the long-lived asset, or the appropriate grouping of assets, is compared to the carrying value to determine whether an impairment exists. We report an asset to be disposed of at the lower of its carrying value or its estimated net realizable value.
Derivative financial instruments
We periodically use derivative financial instruments as part of our overall strategy to manage exposure to market risks associated with foreign currency exchange rate and natural gas price fluctuations. We do not hold or issue derivative financial instruments for trading purposes. We regularly monitor the credit-worthiness of the counterparties to our derivative instruments in order to manage our credit risk exposures under these agreements. Our risk of loss in the event of nonperformance by any counterparty under derivative financial instrument agreements is not considered significant by management. These derivative instruments are measured at fair value and are classified as other assets or other long-term obligations on our balance sheets depending on the fair value of the instrument. If the derivative is designated as a fair-value hedge, the changes in the fair value of the derivative and of the hedged item attributable to the hedged risk are recognized in earnings. If the derivative is designated as a cash-flow hedge, the effective portion of the change in the fair value of the derivative is recorded in accumulated other comprehensive income (loss) and is recognized in the consolidated statements of operations when the hedged item affects earnings. Ineffective portions of changes in the fair value of cash-flow hedges and financial instruments not designated as hedges are recognized in earnings. Prior to the debt refinancing in September 2009, we utilized interest rate swaps to manage our exposure to market risks from interest rate fluctuations. After the debt refinancing, we no longer have sufficient variable-rate debt exposure for our outstanding interest rate swaps to qualify for hedge accounting treatment and record the fair value of the interest rate swaps as other current liabilities with changes in fair value recognized as an adjustment to interest expense.
Fair value of financial instruments
The fair value of long-term debt is based upon quoted market prices for the same or similar issues or on the current interest rates available to us for debt of similar terms and maturities. We measure the fair values of our interest rate swaps using observable interest-rate yield curves for comparable assets and liabilities at commonly quoted intervals. We measure the fair values of our foreign currency forward contracts based on current quoted market prices for similar contracts. We measure the fair values of our natural gas contracts based on natural gas futures contracts priced on the New York Mercantile Exchange (“NYMEX”).
58
Environmental
Environmental expenditures that increase useful lives of assets are capitalized, while other environmental expenditures are expensed. Liabilities are recorded when remedial efforts are probable and the costs can be reasonably estimated.
Landfills and other asset retirement obligations
We evaluate obligations associated with the retirement of tangible long-lived assets, primarily costs related to the closure and post-closure monitoring of our owned landfills, and record a liability when incurred. Subsequent to initial measurement, we recognize changes in the amount of the liability resulting from the passage of time and revisions to either the timing or amount of estimated cash flows.
Pension and other postretirement benefits
We maintain various defined benefit pension and other postretirement benefit plans in the United States and Canada. The plans are generally funded through payments to pension funds/trusts or directly by the company and/or employees.
Defined benefit pension and other postretirement benefit expense is recorded on a full accrual basis, as opposed to a cash-paid basis, and is reflected in the consolidated statements of operations over the expected working lives of the employees provided with such benefits. The economic and demographic assumptions used in calculating defined benefit pension and other postretirement benefit expense are reviewed and updated periodically to the extent that local market economic conditions and demographics change.
Revenue recognition
We recognize revenue at the point when title and the risk of ownership passes to the customer. Substantially all of our revenues are generated through product sales, and shipping terms generally indicate when title and the risk of ownership have passed. Revenue is recognized at the time of shipment for sales where shipping terms transfer title and risk of loss at the shipping point. For sales where shipping terms transfer title and risk of loss at the destination point, revenue is recognized when the goods are received by the customer. For sales made under consignment programs, revenue is recognized in accordance with the terms of the contract. We provide allowances for estimated returns and other customer credits, such as discounts and volume rebates, when the revenue is recognized based on historical experience. Sales of byproducts produced during the manufacturing process are recognized as a reduction of cost of sales. We do not recognize sales taxes collected from customers as revenue; rather we record these taxes on a net basis in our statement of operations.
International sales
We had net sales to customers outside of the United States of $273, $318 and $217 for the years ended December 31, 2009, 2008 and 2007. We have no material long-lived assets outside of the United States.
59
Income taxes
Deferred income taxes are recorded for temporary differences between financial statement carrying amounts and the tax bases of assets and liabilities. Deferred tax assets and liabilities reflect the enacted tax rates in effect for the years the differences are expected to reverse. We evaluate the need for a deferred tax asset valuation allowance by assessing whether it is more likely than not that we will realize the deferred tax assets in the future. We recognize all income tax-related interest expense and statutory penalties imposed by taxing authorities as income tax expense.
Equity compensation
We use the graded vesting attribution method for recognizing stock compensation cost whereby the cost for a stock award is determined on a straight-line basis over the service period for each separate vesting portion of the award as if the award was multiple awards.
| C. | INVENTORIES |
Inventories as of December 31, 2009 and 2008, consist of:
| 2009 | 2008 | |||||
| Finished and in-process goods |
$ | 376 | $ | 385 | ||
| Raw materials |
86 | 110 | ||||
| Stores and supplies |
140 | 133 | ||||
| $ | 602 | $ | 628 | |||
Approximately 72% and 76% of inventories at December 31, 2009 and 2008 are valued using the LIFO method. If inventories had been valued at current costs, they would have been valued at $607 and $630 at December 31, 2009 and 2008. During the year ended December 31, 2009, inventory quantities were reduced. These reductions resulted in a liquidation of LIFO inventory quantities carried at higher costs, the effect of which increased cost of goods sold and net loss by approximately $11 during 2009.
| D. | PROPERTY, PLANT AND EQUIPMENT |
Property, plant and equipment as of December 31, 2009 and 2008, consist of:
| 2009 | 2008 | |||||||
| Land and land improvements |
$ | 108 | $ | 110 | ||||
| Buildings |
360 | 361 | ||||||
| Machinery and other |
3,365 | 3,297 | ||||||
| Construction in progress |
37 | 78 | ||||||
| 3,870 | 3,846 | |||||||
| Less: accumulated depreciation and amortization |
(905 | ) | (641 | ) | ||||
| $ | 2,965 | $ | 3,205 | |||||
See Note N for information related to the capital lease.
60
| E. | FINANCIAL INSTRUMENTS |
Derivative Financial Instruments
Interest Rates
Prior to the debt refinancing in September 2009, we utilized interest-rate swap agreements to manage a portion of our interest-rate risk on our variable-rate debt instruments. During the third quarter ended September 30, 2009, we reclassified $48 of unrealized losses from accumulated other comprehensive income (loss) to interest expense as the hedged forecasted cash flows were no longer probable of occurring as a result of the refinancing. After the debt refinancing, we no longer have sufficient variable-rate debt exposure for our outstanding interest rate swaps to qualify for hedge accounting treatment and record the changes in fair value as adjustments to interest expense. We recognized in interest expense a loss of $1 for the year ended December 31, 2009, for interest rate swaps that did not qualify for hedge accounting.
As of December 31, 2009, we had outstanding interest rate swaps totaling $900 for which we receive amounts based on LIBOR and pay amounts at a weighted-average fixed rate of 3.8%. These swaps expire from June 30, 2010 through December 2012. In September 2009, we entered into a $200 interest rate swap with an offsetting exposure for a portion of our interest rate swaps. This swap expires in December 2012 and we receive amounts at a weighted-average fixed rate of 2.7% and pay amounts based on LIBOR. We measure the fair values of our interest rate swaps using observable interest-rate yield curves for comparable assets and liabilities at commonly quoted intervals. We received (paid) cash on our interest rate swap agreements of $(40), $(6) and $5 for the years ended December 31, 2009, 2008 and 2007.
Foreign Currency
Our Canadian subsidiary makes a portion of its purchases and sales in U.S. dollars. As a result, it is subject to transaction exposures that arise from foreign exchange movements between the date that the foreign currency transaction is recorded and the date it is consummated. Foreign currency exchange contracts may be used periodically to manage the variability in cash flows and revenues from the forecasted payment or receipt of currencies other than our functional currency, the U.S. dollar. As of December 31, 2009 and 2008, we had no foreign currency forward contracts outstanding. We measure the fair values of our foreign currency forward contracts based on current quoted market prices for similar contracts.
Natural Gas
In order to hedge the future cost of natural gas consumed at our mills, we engage in financial hedging of future gas purchase prices, designated as cash flow hedges. We hedge with financial instruments that are priced based on NYMEX natural gas futures contracts. We do not hedge basis (the effect of varying delivery points or locations) or transportation costs (the cost to transport the gas from the delivery point to a company location) under these transactions. As of December 31, 2009, we were party to natural gas futures contracts for notional amounts aggregating 2,130,000 MMBTUs, which expire through October 2011. We measure the fair values of our natural gas contracts based on natural gas futures contracts priced on the NYMEX.
61
Assets and Liabilities Measured at Fair Value on a Recurring Basis
As of December 31, 2009 and 2008, the fair values and carrying amounts of our financial assets and liabilities measured on a recurring basis are as follows:
| Dec. 31, 2009 |
Dec. 31, 2008 |
|||||||
| Significant other observable inputs (Level 2) |
||||||||
| Qualifying as hedges: |
||||||||
| Other long-term liabilities: |
||||||||
| Interest rate swap agreements |
$ | — | $ | (58 | ) | |||
| Natural gas contracts |
(2 | ) | (2 | ) | ||||
| Not qualifying as hedges: |
||||||||
| Other current liabilities: |
||||||||
| Interest rate swap agreements |
$ | (35 | ) | $ | — | |||
| Interest rate swap agreements |
4 | — | ||||||
The amount of gain (loss) on cash flow hedges recognized in accumulated other comprehensive income (loss) (“AOCI”) and the amount reclassified to income (loss) during the year ended December 31, 2009 are as follows:
| Derivative Type |
Amount of gain (loss) recognized in OCI |
Location of gain (loss) reclassified from AOCI to income (loss) |
Amount of gain (loss) reclassified from AOCI to income (loss) |
|||||||
| Interest rate swap agreements |
$ | (18 | ) | Interest expense | $ | (73 | ) | |||
| Natural gas contracts |
(5 | ) | Cost of sales | (5 | ) | |||||
Assets and Liabilities Not Carried at Fair Value
The fair value of long-term debt is based upon quoted market prices for the same or similar issues or on the current interest rates available to us for debt of similar terms and maturities. At December 31, 2009 and 2008, the carrying amounts of all other assets and liabilities that qualify as financial instruments approximated their fair value. Details of our long-term debt are as follows:
| December 31, 2009 | December 31, 2008 | |||||||||||||||
| Fair Value |
Carrying Amount |
Fair Value |
Carrying Amount |
|||||||||||||
| Long-term debt: |
||||||||||||||||
| NewPage Holding |
$ | (2,686 | ) | $ | (3,083 | ) | $ | (1,343 | ) | $ | (2,951 | ) | ||||
| NewPage |
(2,624 | ) | (2,882 | ) | (1,305 | ) | (2,769 | ) | ||||||||
See Note J for fair value information of pension and other postretirement plan assets.
62
| F. | OTHER CURRENT LIABILITIES |
Accounts payable as of December 31, 2009 and 2008 includes $13 and $28 of outstanding checks in excess of cash.
Other current liabilities as of December 31, 2009 and 2008 consist of:
| 2009 | 2008 | |||||
| Payroll and employee benefit costs |
$ | 98 | $ | 97 | ||
| Restructuring |
7 | 33 | ||||
| Interest |
22 | 25 | ||||
| Interest rate swaps |
31 | — | ||||
| Customer rebates |
16 | 28 | ||||
| Other |
64 | 87 | ||||
| $ | 238 | $ | 270 | |||
| G. | LONG-TERM DEBT |
The balances of long-term debt as of December 31, 2009 and 2008 are as follows:
| 2009 | 2008 | |||||
| NewPage: |
||||||
| Revolving credit facility |
$ | 52 | $ | — | ||
| 11.375% first-lien senior secured notes (face amount $1,700) |
1,601 | — | ||||
| Term loan (face amount zero and $1,584) |
— | 1,541 | ||||
| Floating rate second-lien senior secured notes (LIBOR plus 6.25%) |
225 | 225 | ||||
| 10% second-lien senior secured notes (face amount $806) |
805 | 804 | ||||
| 12% senior subordinated notes (face amount $200) |
199 | 199 | ||||
| Capital lease |
148 | 147 | ||||
| Total long-term debt, including current portion |
3,030 | 2,916 | ||||
| Current portion of long-term debt |
— | 16 | ||||
| Subtotal |
3,030 | 2,900 | ||||
| NewPage Holding— |
||||||
| Senior unsecured NewPage Holding PIK Notes (face amount $207 and $190; LIBOR plus 7.00%) |
201 | 182 | ||||
| Long-term debt |
$ | 3,231 | $ | 3,082 | ||
In September 2009, NewPage and NewPage Holding amended the senior secured credit facilities to obtain more favorable financial covenants. We paid consent fees totaling $15 in order to amend the senior secured credit facilities and agreed to higher interest rates, as well as changes to other provisions in the agreements.
Later in September 2009, NewPage issued $1,700 of 11.375% senior secured notes for proceeds of $1,598 (the “Notes Offering”). The net proceeds of the Notes Offering, together with approximately $5 of borrowings under our revolving credit facility, were used to repay all amounts outstanding under our term loan and to pay fees and expenses of the Notes Offering.
Included in interest expense for the year ended December 31, 2009 is a loss of $85 from the extinguishment of debt, including the write-off of $13 of consent fees, and a reclassification adjustment of $48 of unrealized losses from accumulated other comprehensive income (loss) as the hedged forecasted cash flows were no longer probable of occurring as a result of the refinancing. Included in interest expense for the year ended December 31, 2007, is $17 for the write-off of financing costs related to extinguished debt and unused bridge financing commitment fees related to the Acquisition.
63
Substantially all of our assets are pledged as collateral under our various debt agreements. These debt agreements contain various customary affirmative and negative covenants (subject to customary exceptions and certain existing obligations and liabilities), including, but not limited to, restrictions on NewPage’s ability and the ability of NewPage’s subsidiaries to (i) dispose of assets, (ii) incur additional indebtedness and guarantee obligations, (iii) repay other indebtedness, (iv) pay certain restricted payments and dividends, (v) create liens on assets or prohibit the creation of liens on assets, (vi) make investments, loans or advances, (vii) restrict distributions to NewPage from its subsidiaries, (viii) make certain acquisitions, (ix) engage in mergers or consolidations, (x) enter into sale and leaseback transactions, (xi) engage in certain transactions with subsidiaries that are not guarantors of the senior secured credit facilities or with affiliates or (xii) amend the terms of the notes and otherwise restrict corporate activities. Our debt agreements also contain customary provisions for events of default. We were in compliance with all covenants as of December 31, 2009.
Principal payments on long-term debt for the next five years are payable as follows: zero in 2010 and 2011, $1,083 in 2012, $408 in 2013 and $1,860 in 2014. For NewPage, principal payments on long-term debt for the next five years are payable as follows: zero in 2010 and 2011, $1,083 in 2012, $200 in 2013 and $1,860 in 2014.
See Note N for additional information on the capital lease.
Revolving Credit Facility
We have a revolving credit facility of $500, of which there were $52 and zero of borrowings outstanding under the revolving credit facility as of December 31, 2009 and 2008. The revolving credit facility matures upon the first to occur of (i) December 21, 2012 and (ii) the date that is 181 days prior to the scheduled maturity date of the senior secured notes, senior subordinated notes, the NewPage Holding PIK notes, and any refinancing thereof. Subject to customary conditions, including the absence of defaults under the revolving credit facility, amounts available under the revolving credit facility may be borrowed, repaid and re-borrowed, including in the form of letters of credit and swing line loans, until the maturity date thereof. The revolving credit facility may be utilized to fund working capital, to fund permitted acquisitions and capital expenditures, and for other general corporate purposes. The availability under the revolving credit facility is reduced by NewPage’s outstanding letters of credit, which totaled $94 and $87 at December 31, 2009 and 2008. The amount of loans and letters of credit available to NewPage pursuant to the revolving credit facility is limited to the lesser of $500 or an amount determined pursuant to a borrowing base. As of December 31, 2009, we had $219 available for borrowing in excess of the $50 minimum required balance on the revolving credit facility, after reduction for $94 in letters of credit and $52 in outstanding borrowings under the revolving credit facility. The revolving credit facility was amended in September 2009 to provide that amounts outstanding bear interest, at the option of NewPage, at a rate per annum equal to either (i) the base rate plus 2.50%, or (ii) LIBOR plus 3.50%. The interest rate spreads are subject to reduction upon meeting certain leverage thresholds or upon the occurrence of an initial public offering. Certain customary fees are payable to the lenders and the agents, including a commitment fee based upon non-use of available funds and letter of credit fees and issuer fronting fees. The weighted-average interest rate on the outstanding balance at December 31, 2009 was 5.0%.
The revolving credit facility is jointly and severally guaranteed by NewPage Holding and each of NewPage’s guarantor subsidiaries. Subject to certain customary exceptions, NewPage and each of its guarantors granted to the lenders under the revolving credit facility a first priority security interest in and lien on NewPage’s and NewPage’s guarantor subsidiaries’ present and future cash, deposit accounts, accounts receivable, inventory and intercompany debt owed to NewPage, NewPage Holding and NewPage’s guarantor subsidiaries.
64
The revolving credit facility was amended in September 2009 to require the maintenance of at least $50 of borrowing availability under the revolving credit facility through the date of the delivery of the compliance certificate with respect to the fiscal quarter ending March 31, 2011 and limit our ability to make capital expenditures. After that date, to the extent that NewPage’s unused borrowing availability under the revolving credit facility is below $50 for 10 consecutive business days or $25 for three consecutive days, NewPage is required to comply with specified financial ratios and tests, including a minimum interest and fixed charge coverage ratios and maximum senior and total leverage ratios. We cannot assure you that our business will generate sufficient cash flow from operations or that future borrowings will be available to us under the revolving credit facility in an amount sufficient to enable us to pay our indebtedness or to fund our other liquidity needs. If our cash flows and capital resources are insufficient to allow us to make scheduled payments on our indebtedness or to fund our other liquidity needs, we may need to reduce or delay capital expenditures, sell assets, seek additional capital or restructure or refinance all or a portion of our indebtedness on or before maturity.
11.375% Senior Secured Notes
In September 2009 NewPage issued $1,700 face value of 11.375% senior secured notes (the “First-Lien Notes”) (with an effective interest rate of 13.7%). Interest on the First-Lien Notes is payable semi-annually in arrears on December 31 and June 30 and is computed on the basis of a 360-day year comprised of twelve 30-day months.
The First-Lien Notes are secured on a first-priority basis by substantially all of the assets of NewPage and the guarantor subsidiaries (other than the cash, deposit accounts, accounts receivables, inventory, the capital stock of NewPage’s subsidiaries and intercompany debt). The First-Lien Notes are secured on a second priority basis by the cash, deposit accounts, accounts receivables and inventory of NewPage and the guarantor subsidiaries and secured equally and ratably with all existing and future first-priority obligations (other than capital stock of NewPage’s subsidiaries and intercompany debt of NewPage and the guarantor subsidiaries). The First-Lien Notes are effectively subordinated to any permitted liens other than liens securing second-priority obligations, to the extent of the value of the assets of NewPage and the guarantor subsidiaries subject to those permitted liens and are senior in right of payment to NewPage’s existing and future subordinated indebtedness, including NewPage’s 10% second-lien senior secured notes due 2012, floating rate second-lien senior secured notes due 2012, and 12% senior subordinated notes due 2013. The First-Lien Notes are jointly and severally unconditionally guaranteed by most of NewPage’s subsidiaries.
The First-Lien Notes mature on the earlier of (i) December 31, 2014 or (ii) the date that is 31 days prior to the maturity date of the second-lien notes, the senior subordinated notes, the NewPage Holding PIK notes or any refinancing thereof. At any time after March 30, 2012, NewPage may redeem some or all of the First-Lien Notes at specified redemption prices. In addition, at any time prior to March 31, 2012, NewPage may, on one or more occasions, redeem some or all of the First-Lien Notes at a redemption price equal to 100% plus a “make-whole” premium. At any time before March 31, 2012, NewPage may, on one or more occasions, redeem up to 35% of the First-Lien Notes with the net cash proceeds of one or more qualified public equity offerings at 111.375% of the principal amount of the First-Lien Notes. At any time prior to March 31, 2012, but not more than once in any twelve-month period, NewPage may redeem up to 10% of the original aggregate principal amount of the First-Lien Notes at a redemption price of 103%, subject to certain rights of holders of the First-Lien Notes. Upon a change of control of NewPage, each holder of First-Lien Notes may require NewPage to repurchase all or any part of that holder’s First-Lien Notes for a payment equal to 101% of the aggregate principal amount of the First-Lien Notes.
65
Floating Rate and 10% Senior Secured Notes
The senior secured notes consist of $806 face value of 10% senior secured notes and $225 of floating rate senior secured notes (collectively, the “Second-Lien Notes”) issued by NewPage. The Second-Lien Notes mature on May 1, 2012. Interest on the 10% senior secured notes is payable semi-annually in arrears on May 1 and November 1. Interest on the 10% senior secured notes is computed on the basis of a 360-day year comprised of twelve 30-day months. Interest on the floating rate senior secured notes accrues at a rate per annum, reset quarterly, equal to LIBOR plus 6.25% (6.5% and 9.4% at December 31, 2009 and 2008). NewPage pays interest on the floating rate senior secured notes quarterly, in arrears, on every February 1, May 1, August 1 and November 1.
The Second-Lien Notes are secured on a second-priority basis by liens on all of the assets of NewPage and the guarantors other than the collateral securing the revolving credit facility and the stock of NewPage’s subsidiaries; are subordinated, to the extent of the value of the assets securing that indebtedness, to the revolving credit facility and the First-Lien Notes; are senior in right of payment to NewPage’s existing and future subordinated indebtedness, including the senior subordinated notes; and are jointly and severally unconditionally guaranteed by most of NewPage’s subsidiaries.
Prior to May 1, 2010, NewPage may redeem all or a part of the 10% senior secured notes at a redemption price of 106%. Prior to May 1, 2010, NewPage may redeem all or a part of the floating rate senior secured notes at a redemption price of 103%. After May 1, 2010, the redemption prices for the Second-Lien Notes decline each year to an ultimate redemption price of 100% after May 1, 2011. If a change of control occurs, each holder of the Second-Lien Notes has the right to require NewPage to repurchase all or any part of that holder’s Second-Lien Notes at 101% of the face value.
12% Senior Subordinated Notes
The senior subordinated notes, issued by NewPage, consist of $200 face value senior subordinated notes that mature on May 1, 2013. The senior subordinated notes are general unsecured obligations and are subordinated in right of payment to all NewPage’s existing and future senior debt, including the senior secured notes and borrowings under the revolving credit facility. Interest on the senior subordinated notes accrues at the rate of 12.0% per annum and is payable semi-annually in arrears on May 1 and November 1. The senior subordinated notes are jointly and severally guaranteed by most of NewPage’s subsidiaries.
Prior to May 1, 2010, NewPage may redeem all or a part of the senior subordinated notes at a redemption price of 106%. After May 1, 2010, the redemption prices for the senior subordinated notes decline each year to an ultimate redemption price of 100% after May 1, 2011. If a change of control occurs, each holder of the senior subordinated notes has the right to require NewPage to repurchase all or any part of that holder’s senior subordinated notes at 101% of the face value.
NewPage Holding Senior Unsecured PIK Notes
The NewPage Holding PIK Notes mature on November 1, 2013. Interest accrues at a rate per annum, reset semi-annually, equal to LIBOR plus 7.00% (7.6% and 10.3% at December 31, 2009 and 2008) and is payable by the issuance of additional NewPage Holding PIK Notes until maturity. The NewPage Holding PIK Notes are unsecured and are not guaranteed.
66
NewPage Holding may redeem all or part of the NewPage Holding PIK Notes at a redemption price of 100%. Upon a change of control, as defined in the NewPage Holding PIK Notes indenture, and certain asset sales, holders of the NewPage Holding PIK Notes will have the right to require NewPage Holding to repurchase all or part of the holder’s NewPage Holding PIK Notes.
| H. | INCOME TAXES |
The principal current and noncurrent deferred tax assets and liabilities as of December 31, 2009 and 2008 are as follows:
| NewPage Holding |
NewPage | |||||||||||||||
| 2009 | 2008 | 2009 | 2008 | |||||||||||||
| Deferred tax assets: |
||||||||||||||||
| Net operating loss carryforwards |
$ | 1,062 | $ | 903 | $ | 1,061 | $ | 903 | ||||||||
| Compensation-related costs |
300 | 296 | 300 | 296 | ||||||||||||
| Intangible assets |
55 | 60 | 55 | 60 | ||||||||||||
| Tax credits |
63 | 64 | 63 | 64 | ||||||||||||
| Other accruals and reserves |
58 | 94 | 26 | 68 | ||||||||||||
| Total deferred tax assets |
1,538 | 1,417 | 1,505 | 1,391 | ||||||||||||
| Valuation allowance |
(793 | ) | (649 | ) | (760 | ) | (623 | ) | ||||||||
| Net deferred tax assets |
745 | 768 | 745 | 768 | ||||||||||||
| Deferred tax liabilities: |
||||||||||||||||
| Property, plant and equipment |
(741 | ) | (761 | ) | (741 | ) | (761 | ) | ||||||||
| Inventory |
(2 | ) | (18 | ) | (2 | ) | (18 | ) | ||||||||
| Other |
(1 | ) | (2 | ) | (1 | ) | (2 | ) | ||||||||
| Total deferred tax liabilities |
(744 | ) | (781 | ) | (744 | ) | (781 | ) | ||||||||
| Net deferred tax asset (liability) |
$ | 1 | $ | (13 | ) | $ | 1 | $ | (13 | ) | ||||||
| Included in the balance sheet: |
||||||||||||||||
| Other current assets—deferred tax asset |
$ | 4 | $ | — | $ | 4 | $ | — | ||||||||
| Other current liabilities—deferred tax liability |
— | (7 | ) | — | (7 | ) | ||||||||||
| Other long-term obligations—deferred tax liability |
(3 | ) | (6 | ) | (3 | ) | (6 | ) | ||||||||
| Net deferred tax asset (liability) |
$ | 1 | $ | (13 | ) | $ | 1 | $ | (13 | ) | ||||||
We have not recognized certain tax benefits because of the uncertainty of realizing the entire value of the tax position taken on our income tax returns upon review by the taxing authorities. These uncertain tax benefits will be included as an adjustment to income tax expense upon the expiration of the statutes of limitations or upon resolution with the taxing authorities. We expect the amount of unrecognized tax benefits to decrease by $8 within the next 12 months.
A reconciliation of the beginning and ending amount of unrecognized tax benefits is as follows:
| Balance at December 31, 2007 |
$ | 63 | ||
| Additions related to the Acquisition |
58 | |||
| Balance at December 31, 2008 |
121 | |||
| Net increases to prior year positions |
1 | |||
| Reversals—expiration of statutes of limitations |
(13 | ) | ||
| Balance at December 31, 2009 |
$ | 109 | ||
67
The significant components of the income tax provision (benefit) are as follows:
| Year Ended December 31, | ||||||||||||
| 2009 | 2008 | 2007 | ||||||||||
| NewPage Holding: |
||||||||||||
| Deferred income tax expense (benefit): |
||||||||||||
| U.S. federal |
$ | (135 | ) | $ | (58 | ) | $ | 1 | ||||
| State and local |
(23 | ) | (34 | ) | (4 | ) | ||||||
| Total deferred income tax expense (benefit) |
(158 | ) | (92 | ) | (3 | ) | ||||||
| Valuation allowance |
144 | 96 | 3 | |||||||||
| (14 | ) | 4 | — | |||||||||
| Allocation to other comprehensive income (loss) |
45 | — | 6 | |||||||||
| Income tax (benefit) |
$ | (59 | ) | $ | 4 | $ | (6 | ) | ||||
| Year Ended December 31, | ||||||||||||
| 2009 | 2008 | 2007 | ||||||||||
| NewPage: |
||||||||||||
| Deferred income tax expense (benefit): |
||||||||||||
| U.S. federal |
$ | (127 | ) | $ | (60 | ) | $ | 10 | ||||
| State and local |
(23 | ) | (33 | ) | (4 | ) | ||||||
| Total deferred income tax expense (benefit) |
(150 | ) | (93 | ) | 6 | |||||||
| Valuation allowance |
137 | 87 | 4 | |||||||||
| (13 | ) | (6 | ) | 10 | ||||||||
| Allocation to other comprehensive income (loss) |
41 | (6 | ) | 6 | ||||||||
| Income tax (benefit) |
$ | (54 | ) | $ | — | $ | 4 | |||||
The following tables summarizes the major differences between the actual income tax provision (benefit) attributable to continuing operations and taxes computed at the U.S. federal statutory rate:
| Year Ended December 31, | ||||||||||||
| 2009 | 2008 | 2007 | ||||||||||
| NewPage Holding: |
||||||||||||
| Income tax benefit computed at the U.S. federal statutory rate of 35% |
$ | (133 | ) | $ | (48 | ) | $ | (10 | ) | |||
| State and local income taxes, net of federal benefit |
(23 | ) | (34 | ) | (4 | ) | ||||||
| Permanent differences |
— | — | 6 | |||||||||
| Tax credits |
— | (8 | ) | (1 | ) | |||||||
| Valuation allowance |
144 | 96 | 3 | |||||||||
| Allocation from other comprehensive income (loss) |
(45 | ) | — | (6 | ) | |||||||
| Other |
(2 | ) | (2 | ) | 6 | |||||||
| Income tax (benefit) |
$ | (59 | ) | $ | 4 | $ | (6 | ) | ||||
| Effective tax rate |
15.4 | % | (3.2 | )% | 19.1 | % | ||||||
68
| Year Ended December 31, | ||||||||||||
| 2009 | 2008 | 2007 | ||||||||||
| NewPage: |
||||||||||||
| Income tax benefit computed at the U.S. federal statutory rate of 35% |
$ | (126 | ) | $ | (41 | ) | $ | (1 | ) | |||
| State and local income taxes, net of federal benefit |
(23 | ) | (33 | ) | (4 | ) | ||||||
| Permanent differences |
— | — | 6 | |||||||||
| Tax credits |
— | (8 | ) | (1 | ) | |||||||
| Valuation allowance |
137 | 87 | 4 | |||||||||
| Allocation from other comprehensive income (loss) |
(41 | ) | 6 | (6 | ) | |||||||
| Other |
(1 | ) | (11 | ) | 6 | |||||||
| Income tax (benefit) |
$ | (54 | ) | $ | — | $ | 4 | |||||
| Effective tax rate |
15.1 | % | (0.2 | )% | (101.4 | )% | ||||||
We file income tax returns in the United States for federal and various state jurisdictions and in Canada. As of December 31, 2009, periods beginning in 2006 are still open for examination by various taxing authorities; however, taxing authorities have the ability to adjust net operating loss carryforwards from years prior to 2006.
The federal net operating loss carryforward at December 31, 2009 was $2,044 and expires between 2021 and 2029. The Canadian federal net operating loss carryforward available to reduce Canadian federal taxable income at December 31, 2009 was C$1,105 and expires between 2025 and 2027. We have recorded a valuation allowance against our net deferred income tax benefits as it is unlikely that we will realize those benefits. For purposes of allocating the income tax benefit to income (loss) before taxes, amounts of other comprehensive income result in income tax expense recorded in other comprehensive income and the offsetting amount as an allocation to tax benefit from operations. For the year ended December 31, 2009, we have allocated $45 of tax expense to other comprehensive income (loss) and the corresponding offset as an allocation to income tax (benefit) from operations. For the year ended December 31, 2009, for NewPage, we have allocated $41 of tax expense to other comprehensive income (loss) and the corresponding offset as an allocation to income tax (benefit) from operations. The amounts for year ended December 31, 2009, reflect the reclassification to income tax (benefit) of all amounts previously allocated to other comprehensive income (loss) related to the interest rate swap cash flow hedges. Also included in the year ended December 31, 2009 is a tax benefit of $12, reflecting the decreases to our state deferred tax liabilities resulting from changes in the company’s distribution channels that have occurred as part of our integration with NPCP. Deferred taxes are not provided on translation gains and losses because we expect earnings of our Canadian subsidiary to be permanently reinvested.
A reconciliation of the valuation allowance on deferred tax assets is as follows:
| NewPage Holding |
NewPage | |||||
| Balance at December 31, 2007 |
$ | 391 | $ | 391 | ||
| Acquisition-related adjustments |
162 | 145 | ||||
| Current year activity |
96 | 87 | ||||
| Balance at December 31, 2008 |
649 | 623 | ||||
| Current year activity |
144 | 137 | ||||
| Balance at December 31, 2009 |
$ | 793 | $ | 760 | ||
During 2008, we recognized an increase in deferred income tax assets of $281, primarily related to the completion of our analysis of the SENA opening balance sheet to recognize the difference between the book and tax bases for the investment in our Canadian subsidiary and the completion of the related corporate reorganization that generated a worthless stock deduction for tax purposes related to the investment in our Canadian subsidiary. These changes also resulted in an increase in the amount of unrecognized tax benefits of $58.
69
The tax effect of these adjustments changed our net deferred income tax position from a net deferred income tax liability position to a net deferred income tax asset position. As a result, in 2008 we restored the $39 valuation allowance on NewPage Holding’s deferred income taxes that was originally reversed at December 21, 2007. We also recorded a valuation allowance against our net deferred income tax benefit for federal income taxes and for certain state income taxes as it was more likely than not that we would not realize those benefits as a result of our history of losses. Because of the change to a net deferred income tax asset position, we also reversed the tax benefit recorded in 2007 for NewPage Holding and recognized income tax expense of $4 in 2008, as well as the reversal of the allocation to other comprehensive income (loss) for income tax expense of $6 for NewPage.
| I. | EQUITY |
As of December 31, 2009, NewPage Group was the sole holder of record of the shares of NewPage Holding common stock and NewPage Holding was the sole holder of record of the shares of NewPage common stock. There is no established public trading market for our common stock and we have never paid or declared a cash dividend on the common stock. Our debt agreements restrict our ability and the ability of our subsidiaries to pay dividends. On December 21, 2007, Escanaba Timber LLC, our former parent, contributed all of its outstanding common stock of NewPage Holding to NewPage Group in exchange for NewPage Group common stock.
In conjunction with the Acquisition, we recorded an equity contribution of $347 from NewPage Group, which consists of the fair value for the NewPage Group PIK Notes of $206 and the fair value of the 19.9% ownership of NewPage Group’s common stock issued to SEO of $141.
Equity Compensation
Maple Timber Management Interests
Certain members of management were granted Common Percentage Interests (“Management Interests”) in Maple Timber, our former indirect parent. In connection with an equity reorganization, all unvested Management Interests became vested as of December 21, 2007, the Management Interests were exchanged for NewPage Group common stock. We have recognized expense related to the Management Interests of $13, included in selling, general and administrative expenses, for the year ended December 31, 2007. The 2007 expense includes $4 for the repurchase of unvested equity interests granted to former executive officers and $8 for the vesting of the unvested Management Interests.
Under repurchase agreements entered into with each of the executive officers, NewPage’s indirect parent company agreed to repurchase each executive officer’s Common Percentage Interests. NewPage loaned $1, $6 and $4 to its indirect parent company to enable it to satisfy its repurchase obligations in 2009, 2008 and 2007. These loans were recorded as a reduction in stockholder’s equity as repayment is not assured.
Furthermore, certain other members of management were issued options to purchase Common Percentage Interests that only vest upon the occurrence of a change of control or an initial public offering. In connection with the equity reorganization these options were converted to options to purchase NewPage Group common stock.
70
NewPage Group Equity Incentive Plan
In 2007, the board of directors of NewPage Group adopted the NewPage Group Equity Incentive Plan and authorized 9.9 million shares for issuance under the plan. Grants under the incentive plan may include stock options, stock appreciation rights, restricted stock, performance awards (including cash performance awards) and other equity-based awards. Grants of stock options and other stock-based compensation awards are approved by the compensation committee of NewPage Group’s board of directors.
Stock options are the only form of compensation granted under the incentive plan as of December 31, 2009. Stock options expire not later than ten years from the date of grant. Effective as of December 21, 2007, options on 6,282,315 shares were awarded under the plan. Half of the options will vest in three equal annual installments through December 31, 2010. The other 50% of the options will vest in three equal annual installments based on meeting performance targets at the sole discretion of the compensation committee, during 2008, 2009 and 2010. To the extent performance targets are not met in a given year, they can still be met on a cumulative basis in a subsequent period during the three-year vesting period. All options will vest only to the extent the employee remains employed by us on each vesting date. However, a portion of the options will automatically vest upon a change of control or an initial public offering. Because the performance targets are determined annually, the performance-based options will not be considered granted until the performance criteria are approved by the compensation committee. Thus, while the performance-based options have already been awarded, for accounting purposes they will not be considered granted until the performance criteria are approved by the compensation committee in a future period. Awards made in 2008 and 2009 have similar terms.
The performance criteria for the 2008 tranche of the performance-based options were approved in March 2008 and those options were considered granted at that time. Expense for these grants was recognized during the first three quarters of 2008. During the fourth quarter of 2008, the previously recognized expense of $7 associated with these grants was reversed when it became improbable that performance targets would be met for 2008. In March 2009, an additional portion of the performance-based options, with an aggregate fair value of $3 at the grant date, was considered granted for accounting purposes. Expense of $1 for the 2009 grants was recognized during the first two quarters of 2009 and reversed during the third quarter of 2009 when it became improbable that performance targets would be met for 2009.
In February 2010, the compensation committee amended the outstanding stock options to change the exercise price to $2.00 per share and vest the unearned performance-based options for 2008 and 2009. The effects of the modifications will be recognized beginning in 2010.
The following table summarizes activity in the plan:
| Shares of NewPage Group issuable under stock options, in thousands |
Options | Weighted- average exercise price | ||||
| Outstanding at December 31, 2008 |
4,022 | $ | 20.46 | |||
| Granted |
1,128 | 21.23 | ||||
| Forfeited |
(80 | ) | 22.05 | |||
| Outstanding at December 31, 2009 |
5,070 | 20.47 | ||||
| Exercisable at December 31, 2009 |
1,833 | 21.22 | ||||
The outstanding options and the exercisable options at December 31, 2009, each have a weighted-average remaining contractual life of 8.1 years. As of December 31, 2009, unrecognized compensation cost for outstanding options totaled $15, including $10 for unearned performance-based stock options for which vesting is improbable as of December 31, 2009. Stock compensation expense is expected to be $4 and $1 in 2010 and 2011 for unvested options outstanding as of December 31, 2009.
71
We utilize a Black-Scholes pricing model to determine the fair value of options granted. The determination of the fair value of stock-based payment awards on the date of grant using an option-pricing model is affected by the stock price as well as assumptions regarding a number of other variables. These variables include expected stock price volatility over the term of the awards and projected employee stock option exercise behaviors (term of option). We estimate the expected term of options granted by incorporating the contractual term of the options and employees’ expected exercise behaviors. We estimate the volatility of NewPage Group’s common stock by considering volatility of appropriate peer companies and adjusting for factors unique to our stock, including the effect of debt leverage.
Assumptions used to determine the fair value of option grants are as follows:
| Year ended December 31, | ||||||||||||
| 2009 | 2008 | 2007 | ||||||||||
| Weighted-average fair value of options granted |
$ | 3.06 | $ | 12.33 | $ | 12.28 | ||||||
| Weighted average assumptions used for grants: |
||||||||||||
| Expected volatility |
90 | % | 60 | % | 60 | % | ||||||
| Risk-free interest rate |
2.0 | % | 3.2 | % | 3.7 | % | ||||||
| Expected life of option (in years) |
5 | 5 | 6 | |||||||||
We have recognized expense for options of $10, $18 and $1, included in selling, general and administrative expenses, for the years ended December 31, 2009, 2008 and 2007.
| J. | RETIREMENT AND OTHER POSTRETIREMENT BENEFITS |
We provide retirement benefits for certain employees. In the U.S., pension benefits are provided through employer-funded qualified and non-qualified (unfunded) defined benefit plans and are a function of either years worked multiplied by a flat monetary benefit, or years worked multiplied by the highest five year’s average earnings out of the last ten years of an employee’s pension-eligible service. Effective January 1, 2009, benefits for U.S. salaried employees are determined under a cash balance plan and existing accumulated benefits have been frozen. In Canada, pension benefits are provided through employer- and employee-funded defined benefit plans and benefits are a function of years worked and average final earnings during an employee’s pension-eligible service. Certain of the pension benefits are provided in accordance with collective bargaining agreements. Where pre-funding is required, independent actuaries determine the employer contributions necessary to meet the future obligations of the plans and such plan assets are held in trust for the plans. Benefits under our Canadian supplemental pension plan are unfunded but are secured through a letter of credit arrangement (see Note M).
We also provide other retirement and post-employment benefits for certain employees, which may include healthcare benefits for certain retirees prior to their reaching age 65, healthcare benefits for certain retirees on and after their reaching age 65, long-term disability benefits, continued group life insurance and extended health and dental benefits. These benefits are provided through various employer- and/or employee-funded postretirement benefit plans. We generally fund the employer portion of these other postretirement benefits on a pay-as-you-go basis. For certain U.S. postretirement healthcare plans, the employer contributions toward the annual healthcare premium equivalent for retirees are limited to a specific monetary value or percentage, in which instance the remainder of the premium equivalent is the responsibility of the retiree. Certain of the other postretirement benefits are provided in accordance with collective bargaining agreements. In November 2009, we amended a postretirement benefit plan to phase-out Company-provided post-age 65 medical benefits for certain retirees by 2012. We recorded an adjustment to reduce the benefit liability of $57 in the fourth quarter of 2009 with an offset to other comprehensive income (loss). This adjustment is the net result of the reduction in benefits from the plan amendment, partially offset by changes in actuarial assumptions as of the November 2009 re-measurement date.
72
We also sponsor defined contribution plans for certain U.S. employees. Employees may elect to contribute a percentage of their salary on a pre-tax basis, subject to regulatory limitations, into an account with an independent trustee which can then be invested in a variety of investment options at the employee’s discretion. We may also contribute to the employee’s account depending upon the requirements of the plan. For certain employees these employer contributions may be in the form of a specified percentage of each employee’s total compensation or in the form of discretionary profit-sharing that may vary depending on the achievement of certain objectives. Effective June 1, 2009, we have indefinitely suspended the employer matching contribution for our salaried 401(k) plan. Certain of the U.S. defined contribution benefits are provided in accordance with collective bargaining agreements. During the years ended December 31, 2009, 2008 and 2007, we incurred expenses of $11, $21 and $16 for employer contributions to these defined contribution plans.
The following tables set forth the changes in the benefit obligation relating to defined benefit pension and other postretirement benefits and fair value of plan assets during the year and also the funded status of our defined benefit pension and other postretirement benefit plans showing the amounts recognized in our consolidated balance sheets as of December 31, 2009 and 2008. The U.S. defined benefit pension obligations include unfunded liabilities of $13 and $13 as of December 31, 2009 and 2008, associated with a non-qualified defined benefit pension plan in the United States.
73
| Pension Plans | ||||||||||||||||
| U.S. Plans | Canadian Plans | |||||||||||||||
| 2009 | 2008 | 2009 | 2008 | |||||||||||||
| Benefit obligation at beginning of period |
$ | 1,053 | $ | 1,007 | $ | 234 | $ | 333 | ||||||||
| Acquisition (adjustment) |
— | (29 | ) | — | — | |||||||||||
| Service cost |
23 | 17 | 2 | 3 | ||||||||||||
| Interest cost |
63 | 61 | 19 | 17 | ||||||||||||
| Plan participant contributions |
— | — | 2 | 2 | ||||||||||||
| Benefits paid |
(62 | ) | (65 | ) | (18 | ) | (19 | ) | ||||||||
| Plan amendments |
6 | 3 | — | — | ||||||||||||
| Termination benefits |
— | 1 | — | — | ||||||||||||
| Foreign currency exchange rate changes |
— | — | 42 | (55 | ) | |||||||||||
| Actuarial (gains) losses |
44 | 58 | 47 | (47 | ) | |||||||||||
| Benefit obligation at end of period |
1,127 | 1,053 | 328 | 234 | ||||||||||||
| Fair value of plan assets at beginning of period |
798 | 1,084 | 197 | 296 | ||||||||||||
| Actual return (loss) on plan assets |
162 | (222 | ) | 36 | (43 | ) | ||||||||||
| Plan participant contributions |
— | — | 2 | 2 | ||||||||||||
| Employer contributions |
1 | 1 | 17 | 9 | ||||||||||||
| Benefits paid |
(62 | ) | (65 | ) | (18 | ) | (19 | ) | ||||||||
| Foreign currency exchange rate changes |
— | — | 35 | (48 | ) | |||||||||||
| Fair value of plan assets at end of period |
899 | 798 | 269 | 197 | ||||||||||||
| Funded status at end of period |
$ | (228 | ) | $ | (255 | ) | $ | (59 | ) | $ | (37 | ) | ||||
| Included in the balance sheet: |
||||||||||||||||
| Other current liabilities |
$ | (1 | ) | $ | (1 | ) | $ | — | $ | — | ||||||
| Other long-term obligations |
(227 | ) | (254 | ) | (59 | ) | (37 | ) | ||||||||
| Total net asset (liability) |
$ | (228 | ) | $ | (255 | ) | $ | (59 | ) | $ | (37 | ) | ||||
| Weighted-average assumptions: |
||||||||||||||||
| Discount rate |
5.8 | % | 6.2 | % | 6.1 | % | 7.5 | % | ||||||||
| Rate of compensation increase for compensation-based plans |
4.0 | % | 4.0 | % | 3.0 | % | 3.0 | % | ||||||||
74
| Other Postretirement Plans | ||||||||||||||||
| U.S. Plans | Canadian Plans | |||||||||||||||
| 2009 | 2008 | 2009 | 2008 | |||||||||||||
| Benefit obligation at beginning of period |
$ | 220 | $ | 272 | $ | 16 | $ | 27 | ||||||||
| Acquisition (adjustment) |
— | (26 | ) | — | — | |||||||||||
| Service cost |
2 | 2 | 1 | 1 | ||||||||||||
| Interest cost |
11 | 14 | 1 | 1 | ||||||||||||
| Benefits paid |
(26 | ) | (30 | ) | (2 | ) | (2 | ) | ||||||||
| Plan amendments |
(88 | ) | (10 | ) | (3 | ) | — | |||||||||
| Foreign currency exchange rate changes |
— | — | 3 | (4 | ) | |||||||||||
| Actuarial (gains) losses |
18 | (2 | ) | 2 | (7 | ) | ||||||||||
| Benefit obligation at end of period |
137 | 220 | 18 | 16 | ||||||||||||
| Fair value of plan assets at beginning of period |
— | 10 | — | — | ||||||||||||
| Employer contributions |
26 | 20 | 2 | 2 | ||||||||||||
| Benefits paid |
(26 | ) | (30 | ) | (2 | ) | (2 | ) | ||||||||
| Fair value of plan assets at end of period |
— | — | — | — | ||||||||||||
| Funded status at end of period |
$ | (137 | ) | $ | (220 | ) | $ | (18 | ) | $ | (16 | ) | ||||
| Included in the balance sheet: |
||||||||||||||||
| Other current liabilities |
$ | (24 | ) | $ | (27 | ) | $ | (2 | ) | $ | (1 | ) | ||||
| Other long-term obligations |
(113 | ) | (193 | ) | (16 | ) | (15 | ) | ||||||||
| Total net asset (liability) |
$ | (137 | ) | $ | (220 | ) | $ | (18 | ) | $ | (16 | ) | ||||
| Weighted-average assumptions— |
||||||||||||||||
| Discount rate |
5.0 | % | 6.2 | % | 5.2 | % | 7.3 | % | ||||||||
The assumed discount rates used in determining the benefit obligations were determined by reference to the yield on zero-coupon corporate bonds rated Aa or AA maturing in conjunction with the expected timing and amount of future benefit payments.
The amounts in accumulated other comprehensive income (loss) before tax that have not been recognized as components of net periodic defined benefit pension and other postretirement benefit cost as of December 31, 2009 and 2008 are as follows:
| 2009 | |||||||||||||||||||
| Pension Plans |
Other Post- retirement Plans |
||||||||||||||||||
| U.S. | Canada | U.S. | Canada | Total | |||||||||||||||
| Unrecognized net actuarial gains (losses) |
$ | (241 | ) | $ | (51 | ) | $ | (14 | ) | $ | 5 | $ | (301 | ) | |||||
| Net prior service (cost) credit |
(9 | ) | — | 94 | 3 | 88 | |||||||||||||
| Total accumulated other comprehensive income (loss) |
$ | (250 | ) | $ | (51 | ) | $ | 80 | $ | 8 | $ | (213 | ) | ||||||
75
| 2008 | ||||||||||||||||||
| Pension Plans |
Other Post- retirement Plans |
|||||||||||||||||
| U.S. | Canada | U.S. | Canada | Total | ||||||||||||||
| Unrecognized net actuarial gains (losses) |
$ | (323 | ) | $ | (20 | ) | $ | 4 | $ | 6 | $ | (333 | ) | |||||
| Net prior service (cost) credit |
(3 | ) | — | 9 | — | 6 | ||||||||||||
| Total accumulated other comprehensive income (loss) |
$ | (326 | ) | $ | (20 | ) | $ | 13 | $ | 6 | $ | (327 | ) | |||||
The components of other changes in plan assets and benefit obligations recognized in other comprehensive income (loss) are as follows:
| 2009 | ||||||||||||||||||||
| Pension Plans |
Other Post- retirement Plans |
|||||||||||||||||||
| U.S. | Canada | U.S. | Canada | Total | ||||||||||||||||
| Net actuarial gains (losses) |
$ | 60 | $ | (26 | ) | $ | (18 | ) | $ | (2 | ) | $ | 14 | |||||||
| Amortization of net actuarial gains (losses) |
22 | — | — | — | 22 | |||||||||||||||
| Net prior service (cost) credit |
(6 | ) | — | 88 | 3 | 85 | ||||||||||||||
| Amortization of net prior service credit |
— | — | (3 | ) | — | (3 | ) | |||||||||||||
| Foreign currency exchange rate changes |
— | (5 | ) | — | 1 | (4 | ) | |||||||||||||
| Total recognized in other comprehensive income (loss) |
$ | 76 | $ | (31 | ) | $ | 67 | $ | 2 | $ | 114 | |||||||||
| 2008 | ||||||||||||||||||||
| Pension Plans |
Other Post- retirement Plans |
|||||||||||||||||||
| U.S. | Canada | U.S. | Canada | Total | ||||||||||||||||
| Net actuarial gains (losses) |
$ | (362 | ) | $ | (15 | ) | $ | 2 | $ | 7 | $ | (368 | ) | |||||||
| Net prior service (cost) credit |
(3 | ) | — | 10 | — | 7 | ||||||||||||||
| Amortization of net prior service credit |
— | — | (1 | ) | — | (1 | ) | |||||||||||||
| Foreign currency exchange rate changes |
— | 3 | — | (1 | ) | 2 | ||||||||||||||
| Total recognized in other comprehensive income (loss) |
$ | (365 | ) | $ | (12 | ) | $ | 11 | $ | 6 | $ | (360 | ) | |||||||
76
| 2007 | ||||||||||||||||
| Pension Plans |
Other Post- retirement Plans |
|||||||||||||||
| U.S. | Canada | U.S. | Canada | Total | ||||||||||||
| Total recognized in other comprehensive income (loss)—Net actuarial gains (losses) |
$ | 25 | $ | (8 | ) | $ | 2 | $ | — | $ | 19 | |||||
The estimated net actuarial loss and prior service cost for the U.S. defined benefit pension plans that will be amortized from accumulated other comprehensive income (loss) into net periodic benefit cost over the next year are $12 and $1. The estimated net actuarial loss for the Canadian defined benefit pension plans that will be amortized from accumulated other comprehensive income (loss) into net periodic benefit cost over the next year is $2. The estimated net actuarial loss and prior service cost (credit) for U.S. other postretirement benefit plans that will be amortized from accumulated other comprehensive income (loss) into net periodic benefit cost over the next year is less than $1 and $(12). The estimated net actuarial (gain) and prior service cost (credit) for Canadian other postretirement benefit plans that will be amortized from accumulated other comprehensive income (loss) into net periodic benefit cost over the next year are each less than $(1).
Total accumulated benefit obligation (“ABO”) as of December 31, 2009 and 2008 was $1,127 and $1,053 for all U.S. defined benefit pension plans and $314 and $227 for all Canadian defined benefit pension plans.
The following shows the ABO, the projected benefit obligation (“PBO”) and the fair value of plan assets as of December 31, 2009 and 2008 for defined benefit pension plans where the ABO exceeds the fair value of plan assets and where the PBO exceeds the fair value of plan assets:
| 2009 | 2008 | |||||||||||
| U.S. | Canada | U.S. | Canada | |||||||||
| ABO |
$ | 1,127 | $ | 314 | $ | 1,053 | $ | 227 | ||||
| PBO |
1,127 | 328 | 1,053 | 234 | ||||||||
| Fair value of assets |
899 | 269 | 798 | 197 | ||||||||
Plan Assets
The Investment Policy Committee (“IPC”), in consultation with our actuarial consultants, investment managers and investment consultant, has developed a diversified investment management program for the pension trusts that efficiently maximizes return and minimizes risk over the longer term, based on risk return and correlation assumptions established by the investment consultant. Funds are allocated among the trusts’ investment managers within asset allocation target ranges. The IPC believes that a strategic long-term asset allocation plan implemented in a consistent and disciplined manner will be the major determinate of investment performance. We believe the trusts have adequate liquidity to meet current and short-term obligations. Additionally, the strategy attempts to match long-term obligations with a long duration bond strategy within the fixed income allocation. The IPC reviews the investment policy statements at least once per year. In addition, the portfolios are reviewed at least quarterly to determine their deviation from target weightings and are rebalanced as necessary.
77
The long-term strategic allocation target ranges for investments for the U.S. and Canadian pension plans are as follows:
| U.S. | Canada | |||
| Cash and cash equivalents |
0% to 5% | 0% to 10% | ||
| Equity securities |
30% to 75% | 50% to 70% | ||
| Debt securities |
20% to 40% | 33% to 45% | ||
| Real estate |
0% to 10% | N/A | ||
| Other, including alternative investments |
0% to 10% | N/A |
The expected role of equity investments is to invest in well-diversified portfolios of domestic and international securities. The expected role of debt investments is to invest in well-diversified portfolios of debt instruments such that the average weighted duration does not exceed the duration of the Barclays Capital Aggregate Bond Index by more than approximately two years.
The expected long-term rates of return on plan assets were derived based on the capital market assumptions for each designated asset class under the respective trust’s investment policy. The capital market assumptions reflect a combination of historical performance analysis and the forward-looking return expectations of the financial markets.
The returns on these assets have generally matched the broader market. We are monitoring the effects of the market declines on our minimum pension funding requirements and pension expense for future periods. We do not anticipate material increases in our minimum funding requirements during 2010.
The fair values of plan assets at December 31, 2009, by asset category are as follows:
U.S. Pension Plans
| Total | Quoted Prices in Active Markets for Identical Assets (Level 1) |
Significant Observable Inputs (Level 2) |
Significant Unobservable Inputs (Level 3) | |||||||||
| Equity securities: |
||||||||||||
| Common stock1 |
$ | 37 | $ | 37 | $ | — | $ | — | ||||
| Fixed income securities: |
||||||||||||
| Government securities2 |
98 | — | 97 | 1 | ||||||||
| Corporate debt3 |
46 | — | 46 | — | ||||||||
| Other types of investments: |
||||||||||||
| Common/collective trusts4 |
553 | 266 | 287 | — | ||||||||
| Registered investment companies (“RICs”)4 |
112 | 87 | — | 25 | ||||||||
| Partnership/joint venture interests5 |
11 | — | — | 11 | ||||||||
| Hedge funds6 |
28 | — | — | 28 | ||||||||
| Interest-bearing cash |
13 | 13 | — | — | ||||||||
| Other assets |
1 | — | 1 | — | ||||||||
| Total |
$ | 899 | $ | 403 | $ | 431 | $ | 65 | ||||
78
Canadian Pension Plans
| Total | Quoted Prices in Active Markets for Identical Assets (Level 1) |
Significant Observable Inputs (Level 2) |
Significant Unobservable Inputs (Level 3) | |||||||||
| Other types of investments: |
||||||||||||
| Common/collective trusts4 |
$ | 268 | $ | — | $ | 268 | $ | — | ||||
| Interest-bearing cash |
1 | 1 | — | — | ||||||||
| Total |
$ | 269 | $ | 1 | $ | 268 | $ | — | ||||
| 1 | Common stocks are valued based on quoted market prices at the closing price as reported on the active market on which the individual securities are traded. |
| 2 | Government securities are valued based on yields currently available on comparable securities of issuers with similar credit ratings. When quoted prices are not available for identical or similar securities, the security is valued under a discounted cash flows approach that maximizes observable inputs, such as current yields of similar instruments, but includes adjustments for certain risks that may not be observable, such as credit and liquidity risks. |
| 3 | Corporate debt is valued primarily based on observable market quotations for similar bonds at the closing price reported on the active market on which the individual securities are traded. When such quoted prices are not available, the bonds are valued using a discounted cash flows approach using current yields on similar instruments of issuers with similar credit ratings. |
| 4 | Common/collective trusts and registered investment companies are valued using a Net Asset Value (“NAV”) provided by the manager of each fund. The NAV is based on the underlying net assets owned by the fund, divided by the number of shares or units outstanding. The fair value of the underlying securities within the fund, which are generally traded on an active market, are valued at the closing price reported on the active market on which those individual securities are traded. For investments not traded on an active market, or for which a quoted price is not publicly available, a variety of unobservable valuation methodologies, including discounted cash flow, market multiple and cost valuation approaches, are employed by the fund manager to value investments. |
| 5 | Partnership/joint ventures are valued based on the fair value of the underlying securities within the fund, which include investments both traded on an active market and not traded on an active market. For those investments that are traded on an active market, the values are based on the closing price reported on the active market on which those individual securities are traded. For investments not traded on an active market, or for which a quoted price is not publicly available, a variety of unobservable valuation methodologies, including discounted cash flow, market multiple and cost valuation approaches, are employed by the fund manager to value investments. |
| 6 | Hedge funds are private investment vehicles valued using a NAV provided by the manager of each fund. See note 4 for NAV pricing methodology. |
79
The following is a reconciliation of the beginning and ending balances of the fair value measurements using significant unobservable inputs for Level 3 assets for the U.S. pension plans:
| Total | Common/ collective trusts and RICs |
Partnership/ joint venture interests |
Hedge funds |
Government securities | ||||||||||||
| Balance at December 31, 2008 |
$ | 52 | $ | 23 | $ | 11 | $ | 18 | $ | — | ||||||
| Realized gains (losses) |
— | — | — | — | — | |||||||||||
| Unrealized gains (losses) |
11 | 2 | (1 | ) | 10 | — | ||||||||||
| Purchases (sales) |
1 | — | 1 | — | — | |||||||||||
| Transfers in (out) of Level 3 |
1 | — | — | — | 1 | |||||||||||
| Balance at December 31, 2009 |
$ | 65 | $ | 25 | $ | 11 | $ | 28 | $ | 1 | ||||||
A summary of the components of net periodic costs for the years ended December 31, 2009, 2008 and 2007, is as follows:
Pension Plans
| U.S. Plans | Canadian Plans | |||||||||||||||||||||||
| Year Ended December 31, | Year Ended December 31, | |||||||||||||||||||||||
| 2009 | 2008 | 2007 | 2009 | 2008 | 2007 | |||||||||||||||||||
| Service cost |
$ | 23 | $ | 17 | $ | 8 | $ | 2 | $ | 3 | $ | — | ||||||||||||
| Interest cost |
63 | 61 | 13 | 19 | 17 | 1 | ||||||||||||||||||
| Termination benefits |
— | 1 | 1 | — | — | — | ||||||||||||||||||
| Amortization of net loss |
22 | — | — | — | — | — | ||||||||||||||||||
| Expected return on plan assets |
(58 | ) | (82 | ) | (20 | ) | (15 | ) | (19 | ) | (1 | ) | ||||||||||||
| Net periodic cost (income) |
$ | 50 | $ | (3 | ) | $ | 2 | $ | 6 | $ | 1 | $ | — | |||||||||||
| Weighted-average assumptions: |
||||||||||||||||||||||||
| Discount rate |
6.2 | % | 6.4 | % | 6.3 | % | 7.5 | % | 5.5 | % | 5.7 | % | ||||||||||||
| Long-term expected rate of return on plan assets |
7.5 | % | 7.9 | % | 7.9 | % | 7.0 | % | 7.0 | % | 7.0 | % | ||||||||||||
| Rate of compensation increase for compensation-based plans |
4.0 | % | 4.5 | % | 4.5 | % | 3.0 | % | 3.0 | % | 2.5 | % | ||||||||||||
Other Postretirement Plans
| U.S. Plans | Canadian Plans | |||||||||||||||||||||||
| Year Ended December 31, | Year Ended December 31, | |||||||||||||||||||||||
| 2009 | 2008 | 2007 | 2009 | 2008 | 2007 | |||||||||||||||||||
| Service cost |
$ | 2 | $ | 2 | $ | 1 | $ | 1 | $ | 1 | $ | — | ||||||||||||
| Interest cost |
11 | 14 | 2 | 1 | 1 | — | ||||||||||||||||||
| Expected return on plan assets |
— | (1 | ) | — | — | — | — | |||||||||||||||||
| Amortization of net prior service cost (credit) |
(3 | ) | (1 | ) | — | — | — | — | ||||||||||||||||
| Net periodic cost |
$ | 10 | $ | 14 | $ | 3 | $ | 2 | $ | 2 | $ | — | ||||||||||||
| Weighted-average assumptions: |
||||||||||||||||||||||||
| Discount rate |
6.2 | % | 6.1 | % | 6.1 | % | 7.3 | % | 5.0 | % | 5.2 | % | ||||||||||||
| Weighted-average healthcare cost trend rate |
9.5 | % | 10.0 | % | 8.4 | % | 9.0 | % | 9.5 | % | 13.0 | % | ||||||||||||
| Long-term expected rate of return on plan assets |
— | 4.5 | % | 4.5 | % | — | — | — | ||||||||||||||||
80
The annual rate of increase in healthcare costs in the U.S. is assumed to decline ratably each year until reaching 5.0% in 2017. The annual rate of increase in healthcare costs in Canada is assumed to decline ratably each year until reaching 5.0% in 2015.
A one-percentage-point change in assumed retiree healthcare costs trend rates would have the following effects at December 31, 2009:
| Increase | Decrease | |||||||||||||
| U.S. | Canada | U.S. | Canada | |||||||||||
| Effect on total service and interest cost components |
$ | — | $ | — | $ | — | $ | — | ||||||
| Effect on accumulated postretirement benefit obligation |
1 | 1 | (1 | ) | (1 | ) | ||||||||
Estimated future benefit payments for the plans for each of the next five years and for the five years thereafter are expected to be paid as follows:
| Pension Plans |
Other Postretirement Plans | |||||||||||
| U.S. | Canada | U.S. | Canada | |||||||||
| 2010 |
$ | 62 | $ | 21 | $ | 24 | $ | 2 | ||||
| 2011 |
65 | 22 | 20 | 2 | ||||||||
| 2012 |
68 | 22 | 15 | 2 | ||||||||
| 2013 |
71 | 22 | 13 | 2 | ||||||||
| 2014 |
74 | 23 | 12 | 1 | ||||||||
| 2015 through 2019 |
425 | 117 | 50 | 6 | ||||||||
Expected employer contributions to be paid during the next year are as follows:
| Pension Plans |
Other Postretirement Plans | |||||||||||
| U.S. | Canada | U.S. | Canada | |||||||||
| Expected payments during 2010 |
$ | 1 | $ | 15 | $ | 24 | $ | 2 | ||||
As a result of the restructuring actions described in Note L, during 2008 we recognized a special termination charge of $1 in cost of sales for employees affected by the shutdown of the No. 11 paper machine in Rumford, Maine. During 2008, we recorded adjustments to the purchase price allocation for decisions made to reduce benefits for salaried employees to reflect a $29 reduction in benefit obligations under the NPCP pension plans and a $25 reduction in benefit obligations under a NPCP postretirement plan.
| K. | OTHER (INCOME) EXPENSE |
The U.S. Internal Revenue Code allowed a refundable excise tax credit for alternative fuel mixtures produced for sale or for use as a fuel in a trade or business. The credit was equal to fifty cents per gallon of alternative fuel contained in the mixture and is a refundable credit. We currently intend to include the income from the credit as part of taxable income when we file our income tax return. We recognize income for the credits at the time the alternative fuel mixtures are used in our operations and when all income recognition criteria have been met. The amounts of credits eligible for recognition, but not received at the end of the period are included in accounts receivable, net. We recognized $304 of income in other (income) expense for the year ended December 31, 2009, for alternative fuel mixtures used through that date and have received payments of $289 through December 31, 2009. The credit expired on December 31, 2009, and we view any extension of this credit, or the introduction of any similar program in the foreseeable future, as unlikely.
81
| L. | RESTRUCTURING |
SENA Acquisition
During 2008, we announced actions being taken to integrate NewPage operations and the former SENA facilities and services. These actions were intended to expand our business platform, serve our customers more efficiently and deliver on the projected synergies of the acquisition.
The restructuring actions taken were as follows:
| • | Permanently closed six paper machines in 2008, including the mills in Kimberly and Niagara, Wisconsin; approximately 980 employees were affected by the shutdown |
| • | Permanently closed the Chillicothe, Ohio, converting facility in February 2009; approximately 160 employees were affected by the shutdown |
| • | Reduce personnel in other areas, including sales, finance and other support functions; approximately 200 employees were affected by this action |
During the first quarter ended March 31, 2009, we recorded an adjustment of $1 in selling, general and administrative expenses for the reversal of employee-related costs included as an assumed liability in the purchase price allocation as a result of a change in estimate. During 2008, as a result of these actions, we incurred charges of $34, including $22 in accelerated depreciation and $5 in inventory write-offs recorded in cost of sales and $7 of employee-related costs, of which $5 is recorded in cost of sales and $2 is recorded in selling, general and administrative expenses. In addition, during 2008 we recorded liabilities of $39 for employee-related costs of former SENA employees and $22 for closure costs of acquired plants in the purchase price allocation. Most of the affected employees had separated from the company by December 31, 2008 with the remainder separating in 2009 and early 2010. We expect all remaining closure-related activities to be substantially completed in 2010.
The activity in the accrued restructuring liability related to these actions for the years ended December 31, 2009 and 2008 was as follows:
| Closure Costs |
Employee Costs |
|||||||
| Balance accrued at December 31, 2007 |
$ | — | $ | 4 | ||||
| Additions to reserve recorded in the purchase price allocation |
22 | 39 | ||||||
| Current charges |
— | 7 | ||||||
| Payments |
(8 | ) | (31 | ) | ||||
| Balance accrued at December 31, 2008 |
14 | 19 | ||||||
| Adjustments |
— | (1 | ) | |||||
| Payments |
(10 | ) | (15 | ) | ||||
| Balance accrued at December 31, 2009 |
$ | 4 | $ | 3 | ||||
82
| M. | COMMITMENTS AND CONTINGENCIES |
Contingencies
Claims have been made against us for the costs of environmental remediation measures taken or to be taken. Reserves for these liabilities have been established and no insurance recoveries have been anticipated in the determination of the reserves. We are involved in various other litigation and administrative proceedings arising in the normal course of business. Although the ultimate outcome of these matters cannot be predicted with certainty, we do not believe that the currently expected outcome of any matter, lawsuit or claim that is pending or threatened, or all of them combined, will have a material adverse effect on our financial condition, results of operations or liquidity.
Commitments
We are party to fiber supply agreements that entitle us to purchase minimum volumes of wood at market prices for periods through 2026, with renewal periods at our option. We are required to purchase minimum levels and have optional volumes that we can purchase under some of the agreements. The agreements include a limitation of damages under which our maximum potential damages for default are based on a price per ton of wood not delivered, and excuse performance if the failure is the result of a force majeure event that would have prevented either party from performing its obligations. The aggregate maximum amount of potential damages declines from approximately $20 per year in 2010 and totals an aggregate of $172 for all periods. These contracts are assignable by either party with mutual consent.
We have provided letters of credit to various environmental agencies as a means of providing financial assurance with regard to environmental liabilities. We also provided a letter of credit for securing a supplemental pension obligation and letters of credit or other financial assurance obligations to fulfill supplier financial assurance requirements. As of December 31, 2009, we had $94 in outstanding letters of credit. Payment would only be required under these letters of credit if we defaulted on commitments made under these arrangements.
We are a party to a service agreement that provides information technology services through December 31, 2017, necessary to support our operations, at specified monthly base prices. The base price for services under this agreement is approximately $20 annually and can be terminated with early termination payments that decline over time.
In 2006, we were awarded financial assistance in the amount of Canadian $65 from the Province of Nova Scotia in settlement of its commitment to provide licensed land to the Port Hawkesbury mill. The amount will be paid out over seven years (C$10 in each of the first six years, and C$5 in the seventh year) and is recorded in other (income) expense. Payout is to be made upon completion of each cumulative 12 month period of operation of the paper machines. If there is no production for 24 continuous months, all current and future payments will be forfeited.
| N. | LEASE OBLIGATIONS |
We lease certain buildings, transportation equipment and office equipment under operating leases with terms of one to 10 years. Rental expense for the years ended December 31, 2009, 2008 and 2007 was $25, $23 and $15.
83
We are a party to a capital lease for a paper machine for which Chrysler Capital, an affiliate of Cerberus, is an equity investor. The lease has a basic lease term which expires in 2014. At the end of the basic lease term, we have the option to purchase the machine or the lessor can require us to renew the lease through 2025. The lease contains purchase options at amounts approximating fair market value in 2010 and at lease termination. The leased asset is included in property, plant and equipment.
Future minimum non-cancelable operating lease payments and capital lease payments and the related present value of the capital lease payments at December 31, 2009 are as follows:
| Operating Leases |
Capital Lease |
||||||
| 2010 |
$ | 8 | $ | 7 | |||
| 2011 |
6 | 7 | |||||
| 2012 |
5 | 7 | |||||
| 2013 |
3 | 8 | |||||
| 2014 |
1 | 164 | |||||
| Thereafter |
3 | — | |||||
| Total minimum lease payments |
$ | 26 | 193 | ||||
| Portion representing interest |
(45 | ) | |||||
| Present value of net minimum lease payments |
$ | 148 | |||||
| O. | RELATED PARTY TRANSACTIONS |
Cerberus retains consultants that specialize in operations management and support and who provide Cerberus with consulting advice concerning portfolio companies in which funds and accounts managed by Cerberus or its affiliates have invested. From time to time, Cerberus makes the services of these consultants available to Cerberus portfolio companies. We believe that the terms of these consulting arrangements are materially consistent with those terms that would have been obtained in an arrangement with an unaffiliated third party. We have commercial arrangements with other entities that are owned or controlled by Cerberus. Commercial Finance LLC, an affiliate of Cerberus, is a lender under our revolving credit facility. We believe that these transactions are on arms’-length terms and are not material to our results of operations or financial position.
Subsequent to the Acquisition, we are a party to various purchase agreements with SEO. We also sell power generated at Consolidated Water Power Company, a wholly-owned subsidiary, to a subsidiary of SEO. We believe that these transactions are on arms’-length terms and are not material to our results of operations or financial position.
84
| P. | ACCUMULATED OTHER COMPREHENSIVE INCOME (LOSS) |
Total comprehensive income (loss) is comprised of net income (loss), net unrealized gain (loss) on cash flow hedges, foreign currency translation adjustments and changes in net actuarial gain (loss) and net prior service cost (credit) on our defined benefit plans. The components of accumulated other comprehensive income (loss) as of December 31, 2009 and 2008 are as follows:
| 2009 | 2008 | |||||||
| NewPage: |
||||||||
| Unrealized gain (loss) on cash flow hedges, net of tax expense (benefit) of zero and $3 |
$ | (2 | ) | $ | (60 | ) | ||
| Foreign currency translation adjustment |
4 | (9 | ) | |||||
| Unrecognized gain (loss) on defined benefit plans, including tax expense of $44 and zero |
(257 | ) | (327 | ) | ||||
| $ | (255 | ) | $ | (396 | ) | |||
| NewPage Holding: |
||||||||
| Unrealized gain (loss) on cash flow hedge, net of tax expense (benefit) of zero and $(1) |
$ | (2 | ) | $ | (56 | ) | ||
| Foreign currency translation adjustment |
4 | (9 | ) | |||||
| Unrecognized gain (loss) on defined benefit plans, including tax expense of $54 and $10 |
(267 | ) | (337 | ) | ||||
| $ | (265 | ) | $ | (402 | ) | |||
| Q. | DISPOSITIONS |
Sale of Hydroelectric Facilities
In March 2009, NewPage Wisconsin System Inc., our indirect wholly-owned subsidiary, completed the sale of a hydroelectric generating facility located in Niagara, Wisconsin to Northbrook Wisconsin, LLC for a net cash sales price of $22. Included in cost of sales for the year ended December 31, 2009 is a loss on the sale of $3.
| R. | INITIAL PUBLIC OFFERING OF NEWPAGE GROUP |
On May 5, 2008, NewPage Group filed a registration statement on Form S-1 with the Securities and Exchange Commission relating to an initial public offering of its common stock. There can be no assurance that our parent will complete the offering or what the terms of the offering will be.
| S. | RECENTLY ISSUED ACCOUNTING STANDARDS |
Variable interest entity
In June 2009, the Financial Accounting Standards Board issued new guidance on the accounting for a variable interest entity (“VIE”). This guidance requires a qualitative approach to identifying a controlling financial interest in a VIE, and requires ongoing assessment of whether an entity is a VIE and whether an interest in a VIE makes the holder the primary beneficiary of the VIE. This guidance is effective for us as of January 1, 2010. We are currently evaluating the potential effect of the adoption of this guidance on our consolidated financial position, results of operations and cash flows.
85
| T. | SUPPLEMENTAL CONSOLIDATING INFORMATION |
NewPage has issued $1,700 face amount of 11.375% senior secured notes due May 2014, $225 face amount of floating rate senior secured notes due May 2012, $806 face amount of 10% senior secured notes due May 2012 and $200 face amount of 12% senior subordinated notes due May 2013 (the “Notes”). The Notes are jointly and severally guaranteed on a full and unconditional basis by NewPage’s 100%-owned subsidiaries, except Consolidated Water Power Company, our non-guarantor subsidiary.
The following condensed consolidating financial statements have been prepared from financial information on the same basis of accounting as the consolidated financial statements. Investments in our subsidiaries are accounted for under the equity method.
86
NEWPAGE CORPORATION
SUPPLEMENTAL CONDENSED CONSOLIDATING BALANCE SHEET
DECEMBER 31, 2009
| NewPage Corporation |
Guarantor Subsidiaries |
Non- Guarantor Subsidiaries |
Consolidation/ Eliminations |
Consolidated | ||||||||||||
| ASSETS |
||||||||||||||||
| Cash and cash equivalents |
$ | 1 | $ | — | $ | 4 | $ | — | $ | 5 | ||||||
| Accounts receivable |
230 | 65 | 1 | — | 296 | |||||||||||
| Inventories |
293 | 309 | — | — | 602 | |||||||||||
| Other current assets |
15 | 7 | 1 | — | 23 | |||||||||||
| Total current assets |
539 | 381 | 6 | — | 926 | |||||||||||
| Intercompany receivables |
1,262 | 274 | 85 | (1,621 | ) | — | ||||||||||
| Property, plant and equipment, net |
41 | 2,867 | 57 | — | 2,965 | |||||||||||
| Investment in subsidiaries |
1,783 | 66 | — | (1,849 | ) | — | ||||||||||
| Other assets |
110 | 3 | 1 | — | 114 | |||||||||||
| TOTAL ASSETS |
$ | 3,735 | $ | 3,591 | $ | 149 | $ | (3,470 | ) | $ | 4,005 | |||||
| LIABILITIES AND EQUITY |
||||||||||||||||
| Accounts payable |
$ | 54 | $ | 176 | $ | — | $ | — | $ | 230 | ||||||
| Other current liabilities |
117 | 116 | 5 | — | 238 | |||||||||||
| Total current liabilities |
171 | 292 | 5 | — | 468 | |||||||||||
| Intercompany payables |
274 | 1,279 | 68 | (1,621 | ) | — | ||||||||||
| Long-term debt |
2,882 | 148 | — | — | 3,030 | |||||||||||
| Other long-term liabilities |
394 | 89 | 10 | — | 493 | |||||||||||
| Equity |
14 | 1,783 | 66 | (1,849 | ) | 14 | ||||||||||
| TOTAL LIABILITIES AND EQUITY |
$ | 3,735 | $ | 3,591 | $ | 149 | $ | (3,470 | ) | $ | 4,005 | |||||
87
NEWPAGE CORPORATION
SUPPLEMENTAL CONDENSED CONSOLIDATING BALANCE SHEET
DECEMBER 31, 2008
| NewPage Corporation |
Guarantor Subsidiaries |
Non- Guarantor Subsidiary |
Consolidation/ Eliminations |
Consolidated | ||||||||||||
| ASSETS |
||||||||||||||||
| Cash and cash equivalents |
$ | 1 | $ | — | $ | 2 | $ | — | $ | 3 | ||||||
| Accounts receivable |
242 | 35 | 1 | — | 278 | |||||||||||
| Inventories |
249 | 379 | — | — | 628 | |||||||||||
| Other current assets |
11 | 10 | 1 | — | 22 | |||||||||||
| Total current assets |
503 | 424 | 4 | — | 931 | |||||||||||
| Intercompany receivables |
1,194 | 168 | 20 | (1,382 | ) | — | ||||||||||
| Property, plant and equipment, net |
16 | 3,122 | 40 | 27 | 3,205 | |||||||||||
| Investment in subsidiaries |
2,051 | 47 | — | (2,098 | ) | — | ||||||||||
| Other assets |
97 | 12 | 1 | (1 | ) | 109 | ||||||||||
| TOTAL ASSETS |
$ | 3,861 | $ | 3,773 | $ | 65 | $ | (3,454 | ) | $ | 4,245 | |||||
| LIABILITIES AND EQUITY |
||||||||||||||||
| Accounts payable |
$ | 51 | $ | 201 | $ | 1 | $ | 1 | $ | 254 | ||||||
| Other current liabilities |
99 | 164 | 7 | — | 270 | |||||||||||
| Current maturities of long-term debt |
16 | — | — | — | 16 | |||||||||||
| Total current liabilities |
166 | 365 | 8 | 1 | 540 | |||||||||||
| Intercompany payables |
244 | 1,139 | — | (1,383 | ) | — | ||||||||||
| Long-term debt |
2,753 | 147 | — | — | 2,900 | |||||||||||
| Other long-term liabilities |
541 | 71 | 10 | — | 622 | |||||||||||
| Equity |
157 | 2,051 | 47 | (2,072 | ) | 183 | ||||||||||
| TOTAL LIABILITIES AND EQUITY |
$ | 3,861 | $ | 3,773 | $ | 65 | $ | (3,454 | ) | $ | 4,245 | |||||
88
NEWPAGE CORPORATION
SUPPLEMENTAL CONSOLIDATING STATEMENTS OF OPERATIONS
YEAR ENDED DECEMBER 31, 2009
| NewPage Corporation |
Guarantor Subsidiaries |
Non- Guarantor Subsidiaries |
Consolidation/ Eliminations |
Consolidated | |||||||||||||||
| Net sales |
$ | 2,547 | $ | 2,710 | $ | 84 | $ | (2,235 | ) | $ | 3,106 | ||||||||
| Cost of sales |
2,417 | 2,911 | 83 | (2,240 | ) | 3,171 | |||||||||||||
| Selling, general and administrative expenses |
169 | 11 | — | — | 180 | ||||||||||||||
| Equity in (earnings) loss of subsidiaries |
183 | (1 | ) | — | (182 | ) | — | ||||||||||||
| Interest expense |
410 | 8 | — | — | 418 | ||||||||||||||
| Other (income) expense, net |
(302 | ) | (4 | ) | — | — | (306 | ) | |||||||||||
| Income (loss) before income taxes |
(330 | ) | (215 | ) | 1 | 187 | (357 | ) | |||||||||||
| Income tax (benefit) |
(22 | ) | (32 | ) | — | — | (54 | ) | |||||||||||
| Net income (loss) |
(308 | ) | (183 | ) | 1 | 187 | (303 | ) | |||||||||||
| Net income (loss)—noncontrolling interests |
— | — | — | 5 | 5 | ||||||||||||||
| Net income (loss) attributable to the company |
$ | (308 | ) | $ | (183 | ) | $ | 1 | $ | 182 | $ | (308 | ) | ||||||
YEAR ENDED DECEMBER 31, 2008
| NewPage Corporation |
Guarantor Subsidiaries |
Non- Guarantor Subsidiary |
Consolidation/ Eliminations |
Consolidated | |||||||||||||||
| Net sales |
$ | 2,144 | $ | 3,978 | $ | 89 | $ | (1,855 | ) | $ | 4,356 | ||||||||
| Cost of sales |
1,905 | 3,843 | 89 | (1,858 | ) | 3,979 | |||||||||||||
| Selling, general and administrative expenses |
148 | 69 | — | — | 217 | ||||||||||||||
| Equity in (earnings) loss of subsidiaries |
(67 | ) | — | — | 67 | — | |||||||||||||
| Interest expense |
268 | 9 | — | — | 277 | ||||||||||||||
| Other (income) expense, net |
5 | (8 | ) | — | — | (3 | ) | ||||||||||||
| Income (loss) before income taxes |
(115 | ) | 65 | — | (64 | ) | (114 | ) | |||||||||||
| Income tax (benefit) |
2 | (2 | ) | — | — | — | |||||||||||||
| Net income (loss) |
(117 | ) | 67 | — | (64 | ) | (114 | ) | |||||||||||
| Net income (loss)—noncontrolling interests |
— | — | — | 3 | 3 | ||||||||||||||
| Net income (loss) attributable to the company |
$ | (117 | ) | $ | 67 | $ | — | $ | (67 | ) | $ | (117 | ) | ||||||
YEAR ENDED DECEMBER 31, 2007
| NewPage Corporation |
Guarantor Subsidiaries |
Non- Guarantor Subsidiary |
Consolidation/ Eliminations |
Consolidated | ||||||||||||||
| Net sales |
$ | 2,106 | $ | 1,822 | $ | 2 | $ | (1,762 | ) | $ | 2,168 | |||||||
| Cost of sales |
1,869 | 1,787 | 2 | (1,763 | ) | 1,895 | ||||||||||||
| Selling, general and administrative expenses |
120 | 4 | — | — | 124 | |||||||||||||
| Equity in (earnings) of subsidiaries |
(19 | ) | — | — | 19 | — | ||||||||||||
| Interest expense |
154 | — | — | — | 154 | |||||||||||||
| Other (income) expense, net |
(3 | ) | 1 | — | — | (2 | ) | |||||||||||
| Income (loss) before income taxes |
(15 | ) | 30 | — | (18 | ) | (3 | ) | ||||||||||
| Income tax (benefit) |
(7 | ) | 11 | — | — | 4 | ||||||||||||
| Net income (loss) |
(8 | ) | 19 | — | (18 | ) | (7 | ) | ||||||||||
| Net income (loss)—noncontrolling interests |
— | — | — | 1 | 1 | |||||||||||||
| Net income (loss) attributable to the company |
$ | (8 | ) | $ | 19 | $ | — | $ | (19 | ) | $ | (8 | ) | |||||
89
NEWPAGE CORPORATION
SUPPLEMENTAL CONDENSED CONSOLIDATING STATEMENT OF CASH FLOWS
YEAR ENDED DECEMBER 31, 2009
| NewPage Corporation |
Guarantor Subsidiaries |
Non- Guarantor Subsidiaries |
Consolidation/ Eliminations |
Consolidated | |||||||||||||||
| CASH FLOWS FROM OPERATING ACTIVITIES |
|||||||||||||||||||
| Net cash provided by (used for) operating activities |
$ | (1 | ) | $ | 36 | $ | 2 | $ | 7 | $ | 44 | ||||||||
| CASH FLOWS FROM INVESTING ACTIVITIES |
|||||||||||||||||||
| Capital expenditures |
(8 | ) | (67 | ) | — | — | (75 | ) | |||||||||||
| Proceeds from sales of assets |
— | 28 | — | — | 28 | ||||||||||||||
| Net cash provided by (used for) investing activities |
(8 | ) | (39 | ) | — | — | (47 | ) | |||||||||||
| CASH FLOWS FROM FINANCING ACTIVITIES |
|||||||||||||||||||
| Proceeds from issuance of long-term debt |
1,598 | — | — | — | 1,598 | ||||||||||||||
| Payment of financing costs |
(54 | ) | — | — | — | (54 | ) | ||||||||||||
| Distributions from Rumford Cogeneration to limited partners |
— | — | — | (7 | ) | (7 | ) | ||||||||||||
| Purchase of interest of limited partner in Rumford Cogeneration |
— | (1 | ) | — | — | (1 | ) | ||||||||||||
| Loans to parent companies |
(3 | ) | — | — | — | (3 | ) | ||||||||||||
| Repayments of long-term debt |
(1,584 | ) | — | — | — | (1,584 | ) | ||||||||||||
| Borrowings on revolving credit facility |
1,205 | — | — | — | 1,205 | ||||||||||||||
| Payments on revolving credit facility |
(1,153 | ) | — | — | — | (1,153 | ) | ||||||||||||
| Net cash provided by (used for) financing activities |
9 | (1 | ) | — | (7 | ) | 1 | ||||||||||||
| Effect of exchange rate changes on cash and cash equivalents |
— | 4 | — | — | 4 | ||||||||||||||
| Net increase (decrease) in cash and cash equivalents |
— | — | 2 | — | 2 | ||||||||||||||
| Cash and cash equivalents at beginning of year |
1 | — | 2 | — | 3 | ||||||||||||||
| Cash and cash equivalents at end of year |
$ | 1 | $ | — | $ | 4 | $ | — | $ | 5 | |||||||||
90
NEWPAGE CORPORATION
SUPPLEMENTAL CONDENSED CONSOLIDATING STATEMENT OF CASH FLOWS
YEAR ENDED DECEMBER 31, 2008
| NewPage Corporation |
Guarantor Subsidiaries |
Non- Guarantor Subsidiary |
Consolidation/ Eliminations |
Consolidated | ||||||||||||||||
| CASH FLOWS FROM OPERATING ACTIVITIES |
||||||||||||||||||||
| Net cash provided by (used for) operating activities |
$ | (45 | ) | $ | 103 | $ | (5 | ) | $ | 7 | $ | 60 | ||||||||
| CASH FLOWS FROM INVESTING ACTIVITIES |
||||||||||||||||||||
| Cash paid for acquisition |
(8 | ) | — | — | — | (8 | ) | |||||||||||||
| Capital expenditures |
(11 | ) | (154 | ) | — | — | (165 | ) | ||||||||||||
| Proceeds from sales of assets |
— | 4 | 2 | — | 6 | |||||||||||||||
| Net cash provided by (used for) investing activities |
(19 | ) | (150 | ) | 2 | — | (167 | ) | ||||||||||||
| CASH FLOWS FROM FINANCING ACTIVITIES |
||||||||||||||||||||
| Distributions from Rumford Cogeneration to limited partners |
— | — | — | (8 | ) | (8 | ) | |||||||||||||
| Loans to parent companies |
(7 | ) | — | — | — | (7 | ) | |||||||||||||
| Repayments of long-term debt |
(16 | ) | — | — | — | (16 | ) | |||||||||||||
| Borrowings on revolving credit facility |
153 | — | — | — | 153 | |||||||||||||||
| Payments on revolving credit facility |
(153 | ) | — | — | — | (153 | ) | |||||||||||||
| Net cash provided by (used for) financing activities |
(23 | ) | — | — | (8 | ) | (31 | ) | ||||||||||||
| Effect of exchange rate changes on cash and cash equivalents |
— | (2 | ) | — | — | (2 | ) | |||||||||||||
| Net increase (decrease) in cash and cash equivalents |
(87 | ) | (49 | ) | (3 | ) | (1 | ) | (140 | ) | ||||||||||
| Cash and cash equivalents at beginning of year |
88 | 49 | 5 | 1 | 143 | |||||||||||||||
| Cash and cash equivalents at end of year |
$ | 1 | $ | — | $ | 2 | $ | — | $ | 3 | ||||||||||
91
NEWPAGE CORPORATION
SUPPLEMENTAL CONDENSED CONSOLIDATING STATEMENT OF CASH FLOWS
YEAR ENDED DECEMBER 31, 2007
| NewPage Corporation |
Guarantor Subsidiaries |
Non- Guarantor Subsidiary |
Consolidation/ Eliminations |
Consolidated | |||||||||||||||
| CASH FLOWS FROM OPERATING ACTIVITIES |
|||||||||||||||||||
| Net cash provided by (used for) operating activities |
$ | 196 | $ | 84 | $ | — | $ | (2 | ) | $ | 278 | ||||||||
| CASH FLOWS FROM INVESTING ACTIVITIES |
|||||||||||||||||||
| Cash paid for acquisition |
(1,552 | ) | 61 | 5 | — | (1,486 | ) | ||||||||||||
| Capital expenditures |
(6 | ) | (96 | ) | — | — | (102 | ) | |||||||||||
| Net cash provided by (used for) investing activities |
(1,558 | ) | (35 | ) | 5 | — | (1,588 | ) | |||||||||||
| CASH FLOWS FROM FINANCING ACTIVITIES |
|||||||||||||||||||
| Proceeds from issuance of long-term debt |
2,008 | — | — | — | 2,008 | ||||||||||||||
| Payment of financing costs |
(62 | ) | — | — | — | (62 | ) | ||||||||||||
| Distributions from Rumford Cogeneration to limited partners |
— | — | — | (8 | ) | (8 | ) | ||||||||||||
| Loans to parent companies |
(5 | ) | — | — | — | (5 | ) | ||||||||||||
| Repayments of long-term debt |
(524 | ) | — | — | — | (524 | ) | ||||||||||||
| Net cash provided by (used for) financing activities |
1,417 | — | — | (8 | ) | 1,409 | |||||||||||||
| Net increase (decrease) in cash and cash equivalents |
55 | 49 | 5 | (10 | ) | 99 | |||||||||||||
| Cash and cash equivalents at beginning of year |
33 | — | — | 11 | 44 | ||||||||||||||
| Cash and cash equivalents at end of year |
$ | 88 | $ | 49 | $ | 5 | $ | 1 | $ | 143 | |||||||||
92
| U. | CONDENSED PARENT-ONLY FINANCIAL STATEMENTS |
NewPage Holding has no independent assets or operations other than its investment in NewPage. The ability to repay the NewPage Holding PIK Notes will be dependent on the ability of NewPage to distribute funds to NewPage Holding or of NewPage Holding to raise sufficient funds from issuing debt or capital stock. Currently, NewPage’s existing indebtedness prevents it from making distributions to NewPage Holding.
The following condensed parent-only financial statements of NewPage Holding reflect majority-owned subsidiaries using the equity basis of accounting.
93
NEWPAGE HOLDING CORPORATION—PARENT ONLY
CONDENSED BALANCE SHEETS
DECEMBER 31, 2009 and 2008
Dollars in millions, except per share amounts
| 2009 | 2008 | |||||||
| ASSETS |
||||||||
| Investment in NewPage |
$ | 14 | $ | 157 | ||||
| Other assets |
1 | 1 | ||||||
| TOTAL ASSETS |
$ | 15 | $ | 158 | ||||
| LIABILITIES AND STOCKHOLDER’S EQUITY (DEFICIT) |
||||||||
| Long-term debt—NewPage Holding PIK Notes |
$ | 201 | $ | 182 | ||||
| STOCKHOLDER’S EQUITY (DEFICIT) |
||||||||
| Common stock—10 shares authorized, issued and outstanding, $0.01 per share par value |
— | — | ||||||
| Additional paid-in capital |
685 | 661 | ||||||
| Accumulated deficit |
(606 | ) | (283 | ) | ||||
| Accumulated other comprehensive income (loss) |
(265 | ) | (402 | ) | ||||
| Total stockholder’s equity (deficit) |
(186 | ) | (24 | ) | ||||
| TOTAL LIABILITIES AND STOCKHOLDER’S EQUITY (DEFICIT) |
$ | 15 | $ | 158 | ||||
NEWPAGE HOLDING CORPORATION—PARENT ONLY
CONDENSED STATEMENTS OF OPERATIONS
YEARS ENDED DECEMBER 31, 2009, 2008 AND 2007
Dollars in millions
| 2009 | 2008 | 2007 | ||||||||||
| Selling, general and administrative expenses |
$ | — | $ | — | $ | 3 | ||||||
| Interest expense—non-cash |
20 | 21 | 21 | |||||||||
| Equity in (earnings) loss of NewPage |
308 | 117 | 8 | |||||||||
| Income (loss) before income taxes |
(328 | ) | (138 | ) | (32 | ) | ||||||
| Income tax expense (benefit) |
(5 | ) | 4 | (10 | ) | |||||||
| Net income (loss) |
$ | (323 | ) | $ | (142 | ) | $ | (22 | ) | |||
94
NEWPAGE HOLDING CORPORATION—PARENT ONLY
CONDENSED STATEMENTS OF CASH FLOWS
YEARS ENDED DECEMBER 31, 2009, 2008 AND 2007
Dollars in millions
| 2009 | 2008 | 2007 | ||||||||||
| CASH FLOWS FROM OPERATING ACTIVITIES |
||||||||||||
| Net income (loss) |
$ | (323 | ) | $ | (142 | ) | $ | (22 | ) | |||
| Adjustments to reconcile net income (loss) to net cash provided by (used for) operating activities: |
||||||||||||
| Non-cash interest expense |
20 | 21 | 21 | |||||||||
| Equity in (earnings) loss in NewPage |
308 | 117 | 8 | |||||||||
| Deferred income taxes |
(5 | ) | 4 | (10 | ) | |||||||
| Write-off of costs of withdrawn 2006 initial public offering |
— | — | 3 | |||||||||
| Change in accounts payable |
— | — | (1 | ) | ||||||||
| Net cash provided by (used for) operating activities |
— | — | (1 | ) | ||||||||
| CASH FLOWS FROM FINANCING ACTIVITIES |
||||||||||||
| Loan from NewPage |
— | — | 1 | |||||||||
| Net cash provided by financing activities |
— | — | 1 | |||||||||
| Net increase in cash and cash equivalents and cash and cash equivalents at end of year |
$ | — | $ | — | $ | — | ||||||
| SUPPLEMENTAL INFORMATION |
||||||||||||
| Non-cash transaction— |
||||||||||||
| Issuance of securities by NewPage Group as acquisition consideration |
$ | — | $ | — | $ | 347 | ||||||
* * * * *
95
| ITEM 9. | CHANGES IN AND DISAGREEMENTS WITH ACCOUNTANTS ON ACCOUNTING AND FINANCIAL DISCLOSURE |
None.
| ITEM 9AT. | CONTROLS AND PROCEDURES |
Evaluation of NewPage Holding’s and NewPage’s disclosure controls and procedures
We maintain a system of internal accounting controls designed to provide reasonable assurance that transactions are properly recorded and summarized so that reliable financial records and reports can be prepared and assets safeguarded. In addition, a system of disclosure controls is maintained to ensure that information required to be disclosed is recorded, processed, summarized and reported in a timely manner to management responsible for the preparation and reporting of our financial information.
As of the end of the period covered by this Annual Report on Form 10-K, we evaluated the effectiveness of our “disclosure controls and procedures.” This evaluation was conducted under the supervision and with the participation of management, including our chief executive officer (“CEO”) and chief financial officer (“CFO”). Based on the evaluation of disclosure controls and procedures, our CEO and CFO have concluded that the disclosure controls and procedures were effective, as of December 31, 2009, to ensure that information required to be disclosed in the reports that we file or submit under the Securities Exchange Act of 1934 have been accumulated and communicated to management, including our CEO and CFO, and other persons responsible for preparing these reports to allow timely decisions regarding required disclosure and that it is recorded, processed, summarized and reported within the time periods specified in the SEC’s rules and forms.
Management’s report on internal control over financial reporting
Management is responsible for establishing and maintaining adequate internal control over financial reporting for each of NewPage Holding and NewPage. In order to evaluate the effectiveness of internal control over financial reporting, management has conducted an assessment, including testing, using the criteria established in Internal Control – Integrated Framework issued by the Committee of Sponsoring Organizations of the Treadway Commission (“COSO”). NewPage Holding’s and NewPage’s internal control over financial reporting is a process designed to provide reasonable assurance regarding the reliability of our financial reporting and the preparation of financial statements for external purposes in accordance with generally accepted accounting principles.
Because of its inherent limitations, internal control over financial reporting may not prevent or detect misstatements. Also, projections of any evaluation of effectiveness to future periods are subject to the risk that controls may become inadequate because of changes in conditions, or that the degree of compliance with the policies or procedures may deteriorate.
The audit committee of each of NewPage Holding’s and NewPage’s board of directors is composed solely of directors who are independent in accordance with the requirements of the New York Stock Exchange listing standards and the Exchange Act. The audit committee of each of NewPage Holding and NewPage meets with the independent auditors, management and internal auditors periodically to discuss internal control over financial reporting and auditing and financial reporting matters. The committee reviews with the independent auditors the scope and results of the audit effort. The committee also meets periodically with the independent auditors and the chief internal auditor without management present to ensure that the independent auditors and the chief internal auditor have free access to the committee.
96
Based on our assessment, under the criteria established in Internal Control – Integrated Framework, issued by the COSO, management has concluded that NewPage Holding and NewPage maintained effective internal control over financial reporting as of December 31, 2009.
This annual report does not include an attestation report of our independent registered public accounting firm over management’s assessment regarding internal control over financial controls due to a transition period established by rules of the SEC for non-accelerated filers.
| ITEM 9B. | OTHER INFORMATION |
On February 12, 2010, the compensation committee amended the outstanding stock options of our directors, executive officers and other senior management team to change the exercise price to $2.00 per share and vest the unearned performance-based options for 2008 and 2009. The effects of the modifications will be recognized beginning in 2010.
PART III
| ITEM 10. | DIRECTORS, EXECUTIVE OFFICERS AND CORPORATE GOVERNANCE |
The following are the names, ages and a brief account of the business experience for at least the last five years of the directors and executive officers of NewPage Holding and NewPage as of February 12, 2010.
| Name |
Age |
Position | ||
| Mark A. Suwyn |
67 | Chairman of the Board | ||
| Tom Curley |
54 | Director, President and Chief Executive Officer | ||
| Robert M. Armstrong |
70 | Director | ||
| Charles E. Long |
69 | Director | ||
| James R. Renna |
39 | Director | ||
| John W. Sheridan |
55 | Director | ||
| Lenard B. Tessler |
57 | Director | ||
| Alexander M. Wolf |
35 | Director | ||
| George J. Zahringer, III |
56 | Director | ||
| Daniel A. Clark |
51 | Senior Vice President, Business Excellence and Chief Information Officer | ||
| Douglas K. Cooper |
62 | Vice President, General Counsel and Secretary | ||
| Michael T. Edicola |
52 | Vice President, Human Resources | ||
| George F. Martin |
52 | Senior Vice President, Operations | ||
97
| Name |
Age |
Position | ||
| Michael L. Marziale |
52 | Senior Vice President, Marketing, Strategy and General Management | ||
| Barry R. Nelson |
45 | Senior Vice President, Sales | ||
| David J. Prystash |
48 | Senior Vice President and Chief Financial Officer | ||
Mark A. Suwyn has been the chairman of the board of directors of NewPage and NewPage Holding since May 2005 and has been the chairman of the board of directors of NewPage Group since October 2007. Mr. Suwyn was the interim chief executive officer from January 2010 to February 2010, was the chief executive officer of NewPage from April 2006 to March 2009 and acted in that capacity on an interim basis from March 2006 to April 2006. From November 2004 to May 2005, Mr. Suwyn served as a consultant for Cerberus Capital Management through Marsuw, LLP, a company for which he was the founder and president. Mr. Suwyn was chairman and chief executive officer of Louisiana-Pacific Corporation from 1996 until October 2004. Mr. Suwyn serves as a board member of Ballard Power Systems Inc. and BlueLinx Holdings, Inc.
Tom Curley has been a member of the board of directors of NewPage, NewPage Holding and NewPage Group since February 2010. Mr. Curley has been president and chief executive officer since February 2010. From January 2002 to March 2009, Mr. Curley served as president of the Rolls-Royce Energy business, which provides gas compression and power generation equipment and services to the oil and gas industry. Prior to joining Rolls-Royce, Mr. Curley worked for Cooper Cameron Corporation, Caterpillar Inc. and spent 15 years with General Electric Company.
Robert M. Armstrong has been a member of the board of directors of NewPage and NewPage Holding since April 2006 and a member of the board of directors of NewPage Group since October 2007. Mr. Armstrong serves on the board and audit committee of the Quantitative Group of Mutual Funds. Mr. Armstrong has been a private consultant since 1998.
Charles E. Long has been a member of the board of directors of NewPage and NewPage Holding since March 2008 and a member of the board of directors of NewPage Group since December 2007. Mr. Long is a former vice chairman of Citicorp and its principal subsidiary, Citibank. Mr. Long held various positions during his career with Citicorp, which began in 1972 and from which he retired in 1998. Mr. Long is also a director of The Drummond Company.
James R. Renna has been a member of the board of directors of NewPage, NewPage Holding and NewPage Group since April 2008. Mr. Renna has been a financial executive with Cerberus Operations Inc. since May 2006. Prior to that he was a corporate vice president of MCI Communications from December 2002 to March 2006.
John W. Sheridan has been a member of the board of directors of NewPage and NewPage Holding since August 2005 and a member of the board of directors of NewPage Group since October 2007. In February 2006, Mr. Sheridan was appointed president and chief executive officer of Ballard Power Systems, Inc., a fuel cell manufacturer, after serving as interim chief executive officer since October 2005. Mr. Sheridan has served on the board of Ballard Power Systems, Inc. since May 2001, serving as chairman of the board from June 2004 until February 2006.
Lenard B. Tessler has been a member of the board of directors of NewPage and NewPage Holding since May 2005 and a member of the board of directors of NewPage Group since October 2007. Mr. Tessler has been a managing director of Cerberus Capital Management, L.P. since May 2001 to the present. Mr. Tessler serves as a member of the board of directors of LNR Property Corp.
98
Alexander M. Wolf has been a member of the board of directors of NewPage and NewPage Holding since May 2005 and a member of the board of directors of NewPage Group since October 2007. Mr. Wolf has been a managing director of Cerberus Capital Management, L.P. since March 2006, a senior vice president from April 2004 through February 2006 and a vice president from December 2001 through March 2004.
George J. Zahringer, III has been a member of the board of directors of NewPage and NewPage Holding since May 2007 and a member of the board of directors of NewPage Group since October 2007. Since June 2008, Mr. Zahringer has been a managing director and client advisor at Deutsche Bank Securities Inc. Prior to that, Mr. Zahringer was a senior managing director of Bear Stearns & Co., Inc. and served in its Private Client Services Division since 1979. Mr. Zahringer serves as a member of the board of directors of Freedom Group, Inc.
Daniel A. Clark has been senior vice president, business excellence and chief information officer since December 2007. Prior to that, Mr. Clark was chief information officer and vice president of order management since May 2005. Prior to that, Mr. Clark was employed by MeadWestvaco’s Papers Group as vice president of order management from January 2002 to May 2005.
Douglas K. Cooper has been vice president, general counsel and secretary since November 2005. Prior to that, Mr. Cooper was counsel with Arent Fox PLLC, a law firm, from September 2004 through October 2005.
Michael T. Edicola has been vice president, human resources since November 2007. Prior to that, Mr. Edicola served as vice president, human resources for Baxter International Corporation from July 2004 through December 2006.
George F. Martin has been senior vice president, operations since December 2007. Prior to that Mr. Martin was vice president, operations since April 2006. Prior to that, Mr. Martin served as vice president, coated operations from May 2005 to March 2006. From February 2003 through April 2005, Mr. Martin was vice president of operations at the Escanaba mill of MeadWestvaco’s Papers Group.
Michael L. Marziale has been senior vice president, marketing strategy and general management since December 2007. Prior to that, Mr. Marziale was vice president of business development and chief technology officer from August 2006 to December 2007. Mr. Marziale was vice president and general manager, carbonless systems and chief technology officer from May 2005 through July 2006. Prior to that, he was general manager, carbonless systems of MeadWestvaco’s Papers Group since September 2002.
Barry R. Nelson has been senior vice president, sales since January 2008. Prior to that, Mr. Nelson was vice president, printing sales since May 2005. Prior to that, Mr. Nelson was vice president, printing sales of MeadWestvaco’s Papers Group from August 2002 to May 2005.
David J. Prystash has been senior vice president and chief financial officer since September 2008. Prior to that, Mr. Prystash was controller, global product development at Ford Motor Company from January 2005 to September 2008. From April 2006 until September 2008, he was a member of our board of directors.
Committees of the Board of Directors
The boards of directors of NewPage Holding and NewPage have established joint audit, compensation and compliance committees.
99
Our audit committee consists of Robert M. Armstrong, Charles E. Long and John W. Sheridan. As of December 31, 2009, all of the audit committee members were independent directors. Mr. Sheridan serves as the chairman of the audit committee. Duties of the audit committee include:
| • | appointing or replacing independent accountants |
| • | meeting with our independent accountants to discuss the planned scope of their examinations, the adequacy of our internal controls and our financial reporting |
| • | reviewing the results of the annual examination of our consolidated financial statements and periodic internal audit examinations |
| • | reviewing and approving the services and fees of our independent accountants |
| • | monitoring and reviewing our compliance with applicable legal requirements |
| • | performing any other duties or functions deemed appropriate by our board of directors |
Our board of directors has designated Mr. Armstrong as our audit committee financial expert.
Our compensation committee consists of Charles E. Long and Alexander M. Wolf. Mr. Wolf serves as the chairman of the compensation committee. Duties of the compensation committee include administration of our stock option plans and approval of compensation arrangements for our executive officers.
Our compliance committee consists of James R. Renna, Mark A. Suwyn and George J. Zahringer, III. Mr. Zahringer serves as the chairman of the compliance committee. Duties of the compliance committee include the oversight of our policies, programs and procedures to ensure compliance with relevant laws.
Code of Ethics
We have adopted a code of ethics for all associates, including our chief executive officer, chief financial officer, controller and treasurer, addressing business ethics and conflicts of interest. A copy of the code of ethics has been posted on our website at www.newpagecorp.com.
| ITEM 11. | EXECUTIVE COMPENSATION |
Compensation Discussion and Analysis
General Philosophy
The compensation committee has responsibility for establishing, monitoring and implementing our compensation philosophy. We compensate our executive officers named in the Summary Compensation Table, who we refer to as our “Executives,” through a combination of base salary, bonus plan awards, long-term incentive awards, equity ownership, stock options and various other benefits, all designed to be competitive with comparable employers and to align each Executive’s compensation with the long-term interests of our stockholders. Base salary and bonus plan awards are determined and paid annually and are designed to reward current performance. Through various vesting and lock-up restrictions, long-term incentive awards, equity ownership and stock options are designed to reward longer-term performance. We may also use discretionary executive bonus awards for special situations. Our process for setting annual Executive compensation consists of the compensation committee establishing overall compensation targets for each Executive and allocating that compensation between base salary and annual bonus compensation. Other Executive bonus compensation is designed as “at-risk” pay to be earned based on the achievement of company-wide performance objectives, personal performance objectives, the Executive’s demonstrated adherence to our core values and other factors deemed relevant by the compensation committee. The same compensation policies apply to all Executives. Differences in the level of compensation result from the Executive’s position in the company, individual performance and external market considerations relevant to the position.
100
Targeted Overall Annual Cash Compensation
Under our compensation structure, the mix of base salary and annual bonus compensation for each Executive varies depending upon his position with the company. The targeted allocation between base salary and bonus award at target levels is as follows:
| Base Salary |
Target Bonus Award |
|||||
| President and Chief Executive Officer |
50 | % | 50 | % | ||
| Other Executives |
55-70 | % | 30-45 | % |
In allocating annual cash compensation between these elements, we believe that a significant portion of the compensation of our Executives—the level of management having the greatest ability to influence our performance—should be performance-based and therefore “at risk.” In making this allocation, we relied in part upon the advice of Frederick W. Cook & Co., which we refer to as “Cook,” and its survey findings and analysis, which validate this approach. We do not utilize Cook for services other than setting compensation for our Executives and senior leadership team.
Compensation-Setting Process
The compensation committee approves all compensation and awards to Executives, as well as other members of our senior leadership team, and has retained Cook as its compensation advisor. Generally, the compensation committee reviews data from Cook regarding compensation for our chief executive officer and considers prior year performance, then-current compensation and, following discussions with the chief executive officer, establishes his compensation levels. For the remaining Executives, our chief executive officer makes recommendations to the compensation committee based on individual performance during the prior year and competitive data from surveys, available public information and Cook. The other Executives do not play a role in setting their own compensation except to discuss their individual performance with the chief executive officer.
Each year Cook prepares a study for the compensation committee that compares the compensation of individual Executives to the compensation for similar positions at the following peer group companies, or Peer Group, which are in the forest products industry and have market capitalizations comparable to what we believe our market capitalization would have been as a public company at the beginning of that year, as presented in proxy statements of those companies filed during the prior year: Bemis Company, Inc., Crown Holdings Inc., Domtar Inc., Graphic Packaging Corporation, Greif Inc., MeadWestvaco Corporation, Packaging Corporation of America, Pactiv Corporation, Rock-Tenn Company, Sealed Air Corporation, Sonoco Products Company, Temple-Inland Inc. and Verso Paper, Inc. For 2009, the Cook study also compared the compensation of individual Executives to 2008 national survey data gathered by two independent compensation consultants; Hewitt and Towers Perrin. The Hewitt and Towers Perrin surveys each covered in excess of one hundred companies participating across all industries. The compensation committee did not review the individual surveys used by Cook to prepare its study nor did it know the names of the companies included in the surveys. The Cook study was used by the chief executive officer and the compensation committee to help determine appropriate compensation levels for all Executives for 2009. The compensation committee reviews total, short-term and long-term compensation annually with a view to aligning it with the 50th percentile of the selected Peer Group.
101
For purposes of setting 2009 base salary, each Executive was reviewed against his contribution to key 2008 initiatives involving our business as well as overall company performance. Key initiatives during 2009 for all Executives included the following:
| • | completing the integration of two similar-sized organizations in a manner that did not disrupt operations or customers, while also taking actions to realize the synergies from the combination |
| • | accelerating and achieving productivity initiatives and associated cost savings |
| • | reviewing and adjusting market channels to reflect our broader product line and market presence |
| • | responding to the major downturn in demand for our products caused by the recession without a significant adverse impact on EBITDA |
The performance of each Executive was also reviewed for performance against company values including safety, integrity, results, teamwork, communication, judgment and change. A summary of key individual achievements of the Executives in 2009 is presented below.
MARK A. SUWYN During the first quarter of 2009, in his role as our chairman and chief executive officer, Mr. Suwyn led the assessment with the compensation committee of each other Executive’s individual performance against company opportunities, our overall performance, and the specific responsibilities of the Executive’s position. As our executive chairman during the balance of 2009, Mr. Suwyn performed several key roles for the company. His primary role was to ensure a smooth transition of responsibilities to Mr. Willett in his new position as chief executive officer. Mr. Suwyn also played the lead role in filing key trade cases seeking dumping and countervailing duties against certain coated paper products in sheet form exported to the U.S. from China and Indonesia. He actively represented the company with the American Forest & Paper Association, the industry trade association involved in coordinating our industry’s responses to evolving environmental regulation and other key matters impacting our industry. Finally, he led our board of directors in its deliberations and decisions.
DAVID J. PRYSTASH Mr. Prystash provided key leadership in improving our operating effectiveness and capital structure in 2009. Mr. Prystash made significant enhancements in the timing and efficiency of our internal financial reporting. Mr. Prystash also improved our working capital position by reducing inventory levels and improving the credit and collection processes. New processes were implemented around capacity scheduling and cost reductions. Addressing our capital structure, Mr. Prystash successfully obtained amendments from our senior lenders and subsequently led the issuance of $1.7 billion of new first-lien debt in September 2009 that was used to refinance our term loan and thereby eliminate restrictive financial maintenance covenants. Mr. Prystash also initiated and led the application to the Internal Revenue Service for the alternative fuel mixture tax credit, which generated income of $304 million in 2009.
GEORGE F. MARTIN Mr. Martin was responsible for all paper mill operations, purchasing, engineering and environment, health and safety activities. During the year, he assumed additional responsibilities for order management functions. He also provides leadership to our continuing productivity and cost reduction initiatives in close concert with the Lean Six Sigma team. As a cornerstone of this effort, he led a major strategic initiative in sourcing of materials, resulting in significant benefits to the company. Our paper mills performed efficiently despite a dynamic market and significant product line changes. Furthermore, Mr. Martin initiated measures to add talented personnel in key positions in his organization.
102
MICHAEL L. MARZIALE Mr. Marziale led the commercial group that planned and led our specific product, brand and channel strategies. This included close cooperation with our operations, research and development and sales organizations to design and implement, on a tight timeline, specific plans tailored to our equipment and the needs of our customers. Several new grades were introduced into alternative markets to offset the drop in coated paper demand. He provided leadership to the general management team by guiding paper machine uptime and downtime decisions, product pricing and general market strategies to deal with the sudden and prolonged downturn in demand. He worked closely with the legal team to launch the trade cases seeking dumping and countervailing duties against certain coated paper products in sheet form exported to the U.S. from China and Indonesia. Mr. Marziale was also responsible for leading our strategic initiatives and research and development areas.
DANIEL A. CLARK Mr. Clark provided the leadership for executing the business integration activities of the former SENA facilities with our existing business. This integration was extremely complex and critical to our continued success, adding eight mills to our existing mill system, rationalizing supply chains and customer channels, consolidating positions and rationalizing overlapping brands and products. Mr. Clark developed and managed a very aggressive plan that resulted in significant integration synergies. During the year, he assumed additional responsibilities for our Lean Six Sigma functions. Mr. Clark led the implementation of our Lean Six Sigma efforts that have removed significant costs from our operations and launched effective programs throughout the company.
RICHARD D. WILLETT, JR. Mr. Willett led several initiatives to deal with the sudden and prolonged downturn in industry demand. He initiated a joint effort with the U.S. Postal Service and key printers and catalog companies to reduce postal rates and encourage additional catalog shipments. He instituted detailed processes that allowed us to respond quickly to volatile markets through a combination of market-related downtime, mill closures and growth into non-traditional markets. Mr. Willett also coordinated efforts to successfully restructure our senior secured term loan to remove restrictive covenants that allowed us to significantly reduce inventory levels in the fourth quarter of 2009. In addition, Mr. Willett continued to lead the implementation of our Lean Six Sigma effort that helped reduce costs by over $100 million during the year. Finally, he initiated and guided efforts to enhance the experience our customers have when dealing with us.
Base Salaries
We have established an annual base salary for each Executive that is designed to be competitive by position relative to the marketplace. Base salary compensates each Executive for the primary responsibilities of his position. Base salary is set at levels that we believe enable us to attract and retain talent. Pursuant to each Executive’s employment agreement, his base salary may be increased periodically but may not be decreased. The compensation committee reviews each element of compensation separately but also reviews the effect of any change in base salary on the target percentages relative to total annual compensation. Base salary differences among individual Executives reflect their differing roles in the company and the market pay for those roles.
Our senior management recommended to the compensation committee that no annual salary increases be granted to the Executives or other members of the senior leadership team for 2009. This recommendation was not based on individual performance, but as a result of company performance against targets and the desire to conserve cash and manage costs during the worst market downturn seen in many decades. The compensation committee concurred with management’s recommendation.
Mr. Willett’s base salary was reviewed and increased when he was promoted to chief executive officer and was elected to serve on the board in March 2009. His base salary was determined by the compensation committee based principally on the competitive marketplace for similar positions in Peer Group companies and the challenges of his new position.
103
Annual Bonus Compensation
Annual bonus compensation for each Executive is established by the compensation committee in its sole discretion. Our practice is to pay cash bonus awards based upon the achievement of our annual financial performance goals, our strategic performance initiatives and individual performance objectives. Each Executive’s employment agreement designates an individual bonus target for that Executive, expressed as a percentage of base salary. The compensation committee reviews these bonus targets annually, and may increase a bonus target in its discretion as part of its overall evaluation of compensation. Pursuant to each Executive’s employment agreement, his bonus target may be increased periodically but may not be decreased.
The company’s bonus program consists of a profit sharing plan and a performance excellence plan. This approach is intended to afford broad participation in rewards through the profit sharing plan based on achievement of our financial performance goals, while making additional bonus compensation available through the performance excellence plan to a more limited group of senior managers who can help determine and are responsible for implementing our overall business strategy.
The profit sharing plan includes all of the Executives and all other exempt salaried employees. Each year the compensation committee establishes minimum, target and maximum percentages of salary to be awarded if the compensation committee determines that our financial performance objectives for the year are met, along with any other criteria established at the discretion of the compensation committee. These financial performance objectives consisted of EBITDA and Debt Reduction for 2009. We define “EBITDA” for these purposes as net earnings plus interest, taxes, depreciation and amortization, as adjusted for non-cash items and other items that are allowed at the discretion of the compensation committee. We define “Debt Reduction” as the change in our total indebtedness minus available cash balances. The compensation committee selected these objectives as guidelines because they are the primary financial metrics by which our Executives are evaluated by our principal stockholder. For 2009, EBITDA and Debt Reduction were each weighted at 50%. The weightings were based on their relative importance to our company.
Each objective for 2009 is measured separately against a threshold, target and maximum goal as follows:
| (in millions) |
Threshold | Target | Maximum | ||||||
| EBITDA |
$ | 600 | $ | 650 | $ | 700 | |||
| Debt Reduction |
250 | 300 | 350 | ||||||
The actual results are used by the compensation committee as a general guideline to determine the funding for the plan. If the compensation committee determines that the threshold goals are met or exceeded, funding will generally range from 50% to 150% of target for each objective, depending on results achieved. Generally, no funding will occur for any objective as to which the threshold goal has not been met. After consideration of these factors, the compensation committee, in its discretion, determines the funding level to be used for the year. All participants receive the same percentage of their base salary in any distribution under the plan. Applying these guidelines, the compensation committee evaluated our overall 2009 performance and did not award a bonus under the profit sharing plan based on the company’s overall financial performance against targets.
Each of the Executives and a select group of our salaried employees participated in the performance excellence plan in 2009. The compensation committee first determines the aggregate amount available under the plan. The committee then considers the recommendations of senior management and selects from the group of eligible participants those individuals who will receive a bonus. Finally, the committee considers the recommendations of senior management and determines the amount of the bonus award for each of the individuals selected.
104
The targeted annual bonus pool under this plan is based on the aggregate targets for the plan participants as a group, determined by reference to the participants’ base compensation. One half of the annual bonus pool is funded without regard to the financial performance objectives. The other half of the funding is determined by the compensation committee in its discretion based on the achievement of the same financial objectives as under the profit sharing plan and giving consideration to the same weighting and the same threshold, target and maximum levels as in that plan. Plan funding for 2009 was determined by the compensation committee in its discretion and set at a 70% funding level.
The compensation committee in its discretion, after consulting with the chief executive officer, selects Executives who will receive bonus awards and individual bonus awards for those Executives selected, based on the Executive’s individual performance goals and his adherence to our core values described above. There is no minimum or maximum limit on any individual award. The bonus award for each Executive was determined by the compensation committee in its discretion, after consulting with the chief executive officer, based on the Executive’s performance against his individual performance goals and his adherence to our core values that support those goals, and is shown in the Summary Compensation Table.
For 2010, the compensation committee established financial performance objectives consisting of a combination of EBITDA (50%) and Debt Reduction (50%). Due to a weak economy and economic outlook, we believe that it will be a challenge to achieve the target financial goals in 2010 for funding of both the profit sharing and performance excellence plans at their target funding levels. The maximum financial goals were designed to be difficult to achieve, and we believe that they will be.
Long-Term Incentive Plan
On January 15, 2010, the compensation committee approved and adopted a long-term incentive plan, or LTIP. The purpose of the LTIP is to help attract and retain individuals of outstanding ability to serve in key executive positions with the company and its subsidiaries. The plan is designed to help motivate participants to maintain a long-term outlook by providing cash incentives through the granting of awards that vest over multiple years. The LTIP and the individual award agreements under the LTIP provide for a service award and a performance award. The service award is time-based and payable if the participant remains as an employee through December 31, 2012. The performance award is payable if the participant remains as an employee through December 31, 2012, and if the company achieves annual performance goals established each year by the compensation committee during the three years ending December 31, 2012. The participant will receive a pro rata share of the total award if, prior to December 31, 2012, the participant’s employment is terminated by us without cause or by the participant for good reason, each as defined in the LTIP. The participant will receive the entire award if, prior to December 31, 2012, a change in control occurs, as defined in the LTIP.
Equity Ownership
We believe that it is a customary and competitive practice to include an equity-based element of compensation in the overall compensation package extended to executives in similarly-situated companies.
Equity ownership is intended to motivate Executives to make stronger business decisions, improve financial performance, focus on both short-term and long-term objectives and encourage behaviors that protect and enhance the corporate interest. The amount of each individual stock option award is determined by the compensation committee based on a number of factors, including the expected contribution of each Executive to the future success of our company, the other compensation, including options, being earned and held by that Executive and the amount of NewPage Group common stock owned by that Executive.
105
In February 2010, the compensation committee amended the outstanding stock options to change the exercise price to $2.00 per share and vest the unearned performance-based options for 2008 and 2009. These actions were taken in order to ensure that the equity-based compensation remained a vital component of the overall compensation package of the Executives and other participants. Prior to the modification, the options were significantly out-of-the-money and had substantially lost their ability to retain and influence the long-term performance of the participants due to the underlying value of the equity. The effects of the modifications will be recognized beginning in 2010.
Upon Mr. Willett’s resignation as chief executive officer on January 18, 2010, all of his outstanding options became vested and exercisable in accordance with his stock option award agreement.
Further information on equity ownership can be found in “Equity Awards.”
Severance and Change in Control Benefits
We may terminate an Executive’s employment without “cause” at any time, and an Executive may resign for “good reason,” each as defined in the Executive’s employment agreement. We believe that in these situations we should provide reasonable severance benefits to assist the Executive with this transition, recognizing that it may take time for an Executive to find comparable employment elsewhere.
Additionally, the employment agreements with Mr. Clark, Mr. Marziale and Mr. Martin provide for additional termination benefits in the event of termination by us without cause or by the Executive for good reason within 12 months following the acquisition by NewPage Holding or its subsidiaries of the stock or assets of a business enterprise of at least substantially the same revenue and total assets as NewPage Holding on a consolidated basis. This approach also helps align the interests of these Executives with the interests of our stockholders by providing additional compensation for completing a transaction that may be in the best interests of our stockholders but might otherwise be detrimental to those Executives.
The amount and type of severance benefits available to our Executives is described in “Termination Benefits.” The Executive employment agreements were modified effective January 1, 2009 to comply with the requirements of Section 409A of the Internal Revenue Code.
Mr. Willett’s severance in 2010 was determined by the compensation committee based on his four years of service with us and the treatment of other similarly situated executives, as well as by reference to the separation benefits in his prior employment agreement, which expired April 17, 2009, and was not renewed. See “Termination Benefits—Severance Benefits for Former Chief Executive Officer.”
Other Benefits
Our Executives participate in a tax-qualified defined contribution plan, which includes individual and employer matching contributions, as well as various health and welfare benefit plans, all on the same basis as other salaried employees. We suspended the employer matching contribution to this plan, effective June 1, 2009, for all salaried exempt employees, including our Executives. Our objective with these other benefits is to offer all salaried employees, including our Executives, a benefits package that is competitive within our industry and labor markets.
106
Compensation Committee Report
The compensation committee has reviewed and discussed with management the Compensation Discussion and Analysis included in this annual report. Based on that review and discussion, the compensation committee recommended to the Board of Directors that the Compensation Discussion and Analysis be included in this annual report.
| COMPENSATION COMMITTEE |
| Alexander M. Wolf |
| Charles E. Long |
107
Compensation Summary
The following table sets forth information concerning the compensation for our former chief executive officers, our chief financial officer, and our other three most highly compensated executive officers at the end of 2009.
SUMMARY COMPENSATION TABLE
| Name and Principal Position |
Year | Salary(1) | Bonus(2) | Stock Awards(3) |
Option Awards(4) |
Non-Equity Incentive Plan Compensation |
All Other Compensation(5) |
Total | |||||||||||||||
| Mark A. Suwyn |
2009 | $ | 775,000 | $ | — | $ | — | $ | 1,226,646 | $ | 200,000 | $ | 47,438 | $ | 2,249,084 | ||||||||
| 2008 | 775,000 | — | — | 2,674,974 | — | 81,397 | 3,531,371 | ||||||||||||||||
| 2007 | 772,916 | — | 3,480,532 | 82,352 | 600,000 | 82,504 | 5,018,304 | ||||||||||||||||
| David J. Prystash |
2009 | 415,000 | 85,000 | — | 3,211,270 | 450,000 | 19,626 | 4,180,896 | |||||||||||||||
| 2008 | 114,754 | 85,000 | — | 870,227 | — | 60,666 | 1,130,647 | ||||||||||||||||
| George F. Martin |
2009 | 296,000 | — | — | 337,627 | 300,000 | 15,219 | 948,846 | |||||||||||||||
| 2008 | 296,000 | — | — | 736,271 | — | 28,440 | 1,060,711 | ||||||||||||||||
| 2007 | 272,253 | — | 812,792 | 22,667 | 300,000 | 32,142 | 1,439,854 | ||||||||||||||||
| Michael L. Marziale |
2009 | 288,000 | — | — | 337,627 | 280,000 | 4,800 | 910,427 | |||||||||||||||
| 2008 | 288,000 | — | — | 736,271 | — | 38,663 | 1,062,934 | ||||||||||||||||
| 2007 | 241,618 | 50,000 | 812,792 | 22,667 | 400,000 | 52,512 | 1,579,589 | ||||||||||||||||
| Daniel A. Clark |
2009 | 254,000 | — | — | 337,627 | 240,000 | 13,590 | 845,217 | |||||||||||||||
| Richard D. Willett, Jr. |
2009 | 617,614 | — | — | 2,932,092 | 1,000,000 | 25,662 | 4,575,368 | |||||||||||||||
| 2008 | 500,000 | — | — | 6,394,078 | — | 23,857 | 6,917,935 | ||||||||||||||||
| 2007 | 463,750 | — | 1,886,926 | 196,849 | 800,000 | 40,061 | 3,387,586 | ||||||||||||||||
| (1) | Represents base salary actually earned during the year. |
| (2) | For Mr. Prystash, the amount for 2009 represents a bonus paid to compensate him for a retention bonus from his former employer that was forfeited when he accepted employment with us and the amount for 2008 represents a bonus paid upon his commencing employment as senior vice president and chief financial officer. For Mr. Marziale, the amount for 2007 represents a bonus paid for his efforts in connection with the acquisition of SENA and other strategic initiatives. |
| (3) | Represents the amount of equity compensation expensed during the year in accordance with generally accepted accounting principles. See “Equity Awards” for more information. |
| (4) | Represents the amount of equity compensation expensed during the year in accordance with generally accepted accounting principles, based on the fair values of stock options granted under the NewPage Group equity incentive plan. See the notes to the financial statements for the assumptions used in the valuation of the options. See “Equity Awards” for more information. The amounts shown are based on the fair value at the date the award is granted using the Black-Scholes option pricing model. This fair value is calculated based on assumptions at the time of the grant and does not represent the ultimate value to be realized by the Executive, if any. NO EXECUTIVE RECEIVED ANY VALUE FROM THE EXERCISE OF OPTIONS DURING THE PERIODS SHOWN. WE BELIEVE IT WAS UNLIKELY THAT THESE STOCK OPTIONS WOULD HAVE BEEN EXERCISED AT THE EXERCISE PRICE IN EFFECT AT DECEMBER 31, 2009. See Item 9B. |
108
| (5) | See the following table, which provides further details about All Other Compensation. |
| (6) | Effective March 19, 2009, Mr. Willett replaced Mr. Suwyn as our chief executive officer. Effective January 18, 2010, Mr. Willett resigned as our president and chief executive officer and Mr. Suwyn was appointed to serve as our chief executive officer in addition to his duties as chairman until February 8, 2010, when Mr. Curley was appointed as president and chief executive officer. |
ALL OTHER COMPENSATION
| Name |
Year | Company Contributions to Retirement Savings Plan |
Relocation (1) | Other (2) | Total All Other Compensation | |||||||||
| Mark A. Suwyn |
2009 | $ | 9,429 | $ | — | $ | 38,009 | $ | 47,438 | |||||
| 2008 | 15,757 | — | 65,640 | 81,397 | ||||||||||
| 2007 | 11,250 | — | 71,254 | 82,504 | ||||||||||
| David J. Prystash |
2009 | 6,917 | — | 12,709 | 19,626 | |||||||||
| 2008 | 6,916 | — | 53,750 | 60,666 | ||||||||||
| George F. Martin |
2009 | 4,933 | — | 10,286 | 15,219 | |||||||||
| 2008 | 24,150 | — | 4,290 | 28,440 | ||||||||||
| 2007 | 28,125 | — | 4,017 | 32,142 | ||||||||||
| Michael L. Marziale |
2009 | 4,800 | — | — | 4,800 | |||||||||
| 2008 | 24,150 | 10,743 | 3,770 | 38,663 | ||||||||||
| 2007 | 26,070 | 25,030 | 1,412 | 52,512 | ||||||||||
| Daniel A. Clark |
2009 | 4,233 | — | 9,357 | 13,590 | |||||||||
| Richard D. Willett, Jr. |
2009 | 9,538 | — | 16,124 | 25,662 | |||||||||
| 2008 | 15,757 | — | 8,100 | 23,857 | ||||||||||
| 2007 | 11,250 | 16,873 | 11,938 | 40,061 | ||||||||||
| (1) | Relocation expense includes tax gross-ups of $900 for Mr. Marziale in 2008 and $7,472 and $7,150 for Mr. Marziale and Mr. Willett in 2007. |
| (2) | “Other” for Mr. Suwyn in 2009 consists of (i) $24,705 paid to him in reimbursement of personal travel expenses to and from our Dayton headquarters and temporary living expenses in Dayton, as negotiated in conjunction with Mr. Suwyn’s acceptance of employment as our chief executive officer and (ii) $13,304 for financial planning. “Other” for Mr. Prystash and Mr. Willett in 2009 consists of amounts paid to them in reimbursement of personal travel expenses to and from our Dayton headquarters and temporary living expenses in Dayton and for financial planning. “Other” for Mr. Clark and Mr. Martin in 2009 consists of amounts paid for financial planning. |
Employment Agreements
The compensation committee approved an employment agreement for Mr. Suwyn, effective January 18, 2010, that provides for continuation of Mr. Suwyn’s current annual base salary of $775,000 through December 31, 2010, and an annual base salary of $500,000 for 2011 and future years, subject to adjustment by the board at its discretion. The employment agreement also continues Mr. Suwyn’s bonus eligibility under our performance excellence plan and our profit sharing plan for performance in 2010, after which he will no longer be eligible for a bonus under those plans.
109
Each of Messrs. Clark, Martin, Marziale and Prystash is party to an employment agreement under which each is entitled to a minimum annual base salary and each is assigned a minimum bonus target, expressed as a percentage of base salary. For 2009, bonus targets for Messrs. Clark, Martin, Marziale and Prystash were 45%, 65%, 65% and 75%, respectively. See “Termination Benefits” for information concerning the severance benefits payable under our Executive employment agreements and other terms applicable in connection with the termination of an Executive’s employment with us.
Equity Awards
GRANTS OF PLAN-BASED AWARDS
| Name |
Grant Date |
Estimated Future Payments Under Non-Equity Incentive Plan Awards (1) |
Estimated Future Payments Under Equity Incentive Plan Awards |
All Other Option Awards: Number of Securities Underlying Options (#) |
Exercise or Base Price of Option Awards ($/sh) |
Grant Date Fair Value of Option Awards (2) | ||||||||||||||||||||||
| Threshold ($) |
Target ($) |
Maximum ($) |
Threshold (#) |
Target (#) |
Maximum (#) |
|||||||||||||||||||||||
| Mark A. Suwyn |
$ | 27,125 | (3) | $ | 54,250 | (3) | $ | 81,375 | (3) | |||||||||||||||||||
| — | 720,750 | (4) | None | (5) | ||||||||||||||||||||||||
| 03/02/2009 | — | 121,382 | 121,382 | — | $ | 21.22 | $ | 362,624 | ||||||||||||||||||||
| David J. Prystash |
14,525 | (3) | 29,050 | (3) | 43,575 | (3) | ||||||||||||||||||||||
| — | 282,200 | (4) | None | (5) | ||||||||||||||||||||||||
| 02/23/2009 | 23,130 | 21.22 | 80,303 | |||||||||||||||||||||||||
| 03/02/2009 | — | 141,043 | 141,043 | — | 21.22 | 446,434 | ||||||||||||||||||||||
| George F. Martin |
12,600 | (3) | 25,200 | (3) | 37,800 | (3) | ||||||||||||||||||||||
| — | 208,800 | (4) | None | (5) | ||||||||||||||||||||||||
| 03/02/2009 | — | 33,410 | 33,410 | — | 21.22 | 99,811 | ||||||||||||||||||||||
| Michael L. Marziale |
10,080 | (3) | 20,160 | (3) | 30,240 | (3) | ||||||||||||||||||||||
| — | 167,040 | (4) | None | (5) | ||||||||||||||||||||||||
| 03/02/2009 | — | 33,410 | 33,410 | — | 21.22 | 99,811 | ||||||||||||||||||||||
| Daniel A. Clark |
8,890 | (3) | 17,780 | (3) | 26,670 | (3) | ||||||||||||||||||||||
| — | 96,520 | (4) | None | (5) | ||||||||||||||||||||||||
| 03/02/2009 | — | 33,410 | 33,410 | — | 21.22 | 99,811 | ||||||||||||||||||||||
| Richard D. Willett, Jr. |
22,750 | (3) | 45,500 | (3) | 68,250 | (3) | ||||||||||||||||||||||
| — | 604,500 | (4) | None | (5) | ||||||||||||||||||||||||
| 03/02/2009 | — | 290,143 | 290,143 | — | 21.22 | 866,790 | ||||||||||||||||||||||
| (1) | The amounts shown represent the estimated possible payment at the time of grant. |
| (2) | The “grant date fair value” of the options was determined in accordance with generally accepted accounting principles and will be recognized over the three-year vesting period. See the notes to the financial statements for information on the material terms of the awards and the assumptions used in determining the grant date fair value. |
| (3) | Amounts represent the estimated range of payout under the profit sharing plan. See “Compensation Discussion and Analysis—Annual Bonus Compensation” for more information about the plan. |
| (4) | Amounts represent the estimated range of payout under the performance excellence plan. See “Compensation Discussion and Analysis—Annual Bonus Compensation” for more information about the plan. |
| (5) | There is no limit on the maximum amount that could be awarded to any one Executive, subject to the aggregate amount approved under the plan for all participants. See “Compensation Discussion and Analysis—Annual Bonus Compensation” for more information about the plan. |
110
OUTSTANDING EQUITY AWARDS AT FISCAL YEAR-END
| Name |
Number of Securities Underlying Unexercised Options (#) Exercisable (1) |
Number of Securities Underlying Unexercised Options (#) Unexercisable (1) |
Equity Incentive Plan Awards: Number of Securities Underlying Unexercised Unearned Options (#) |
Option Exercise Price ($) |
Option Exercise Date | ||||||
| Mark A. Suwyn |
242,764 | 121,382 | 242,764 | $ | 21.22 | 12/21/2017 | |||||
| David J. Prystash |
133,333 | 266,667 | 133,333 | 21.22 | 09/22/2018 | ||||||
| 7,710 | 15,419 | 7,710 | 21.22 | 02/23/2019 | |||||||
| George F. Martin |
66,819 | 33,410 | 66,819 | 21.22 | 12/21/2017 | ||||||
| Michael L. Marziale |
66,819 | 33,410 | 66,819 | 21.22 | 12/21/2017 | ||||||
| Daniel A. Clark |
66,819 | 33,410 | 66,819 | 21.22 | 12/21/2017 | ||||||
| Richard D. Willett, Jr. |
580,287 | 290,143 | 580,287 | 21.22 | 12/21/2017 | ||||||
| (1) | Represents options to acquire common stock that vest in three equal annual installments beginning on December 21, 2008, except that Mr. Prystash’s options vest in three equal annual installments beginning on December 31, 2009. |
NewPage Group Equity Incentive Plan
On December 21, 2007, each Executive then employed by us was granted non-qualified options to purchase NewPage Group common stock under the NewPage Group equity incentive plan. Vesting of one-half of these stock options is time-based in three equal annual installments commencing December 31, 2008. The other half of the stock options have performance-based vesting and will vest in three equal annual installments commencing December 31, 2008, but only if annual EBITDA and Debt Reduction performance targets, as established by the compensation committee, are met. However, upon a change of control or if we complete an initial public offering, a portion of the stock options will vest upon the change of control or the completion of the initial public offering, as applicable. Finally, the stock options will vest on each vesting date only if the Executive remains employed by us on that vesting date. Because the performance targets are determined annually by the compensation committee, we have only considered the performance-based stock options as granted when the compensation committee sets the performance targets for the applicable year.
Upon Mr. Prystash’s commencement of employment, he was granted non-qualified options to purchase NewPage Group common stock under the equity incentive plan upon the same terms as the other Executives, except that the vesting of the options is over three equal annual installments commencing December 31, 2009. Following his commencement of employment, Mr. Prystash’s stock options received as a director on December 21, 2007 expired. In February 2009, the compensation committee granted Mr. Prystash non-qualified options with similar terms to replace those that expired.
In February 2010, the compensation committee amended the outstanding stock options to change the exercise price to $2.00 per share and vest the unearned performance-based options for 2008 and 2009.
Upon Mr. Willett’s termination of employment, all of his outstanding options became vested and exercisable in accordance with his stock option award agreement.
111
Each Executive is subject to a five-year lock-up agreement with NewPage Group with respect to his vested options and the underlying shares of NewPage Group common stock, subject to certain limited exceptions.
Termination Benefits
Severance Benefits
Severance benefits are specified in each Executive’s employment agreement.
For Executives other than Mr. Suwyn, if we terminate their employment without “cause” or if the Executive resigns for “good reason,” the Executive will continue to receive base salary and benefits to the date of termination and will receive the following additional benefits after executing, and not revoking, a general release:
| • | For Mr. Prystash, a cash amount equal to two times his base salary. For Messrs. Clark, Martin and Marziale, a cash amount equal to (a) twice their base salary less the initial purchase price of their NewPage Group common stock, or (b) three times their base salary less the initial purchase price of their common stock if the termination of employment occurs within 12 months after an acquisition by NewPage Holding or its subsidiaries of the stock or assets of a business enterprise of at least substantially the same revenue and total assets as NewPage Holding on a consolidated basis. In addition, for Messrs. Clark, Martin and Marziale, if at the time of termination the fair market value of their NewPage Group common stock is less than the purchase price they paid for that common stock, they will also receive a payment equal to that difference. |
| • | The pro rata portion of his annual bonus award for the year of termination. This would be paid at the time of termination based on (a) the bonus award from the prior year if the date of termination is prior to June 1, or (b) what his bonus award would have been had he not been terminated if the date of termination is on or after June 1. |
| • | Continuation of health and welfare benefits for 24 months after the termination date |
| • | Payment for unused accrued vacation time for the year in which termination occurs |
| • | Outplacement services for 12 months |
As defined in the employment agreements, “cause” includes commission of a felony, willful and fraudulent conduct, dishonesty resulting in personal gain, and other serious misconduct, and “good reason” includes reduction of base salary or bonus target, required relocation farther than 50 miles and other significant adverse employer actions.
If an Executive’s termination is caused by death or disability, the Executive or his estate will receive the pro rata portion of his annual bonus award and payment of unused accrued vacation time. If an Executive termination is initiated by us for cause or by the Executive without good reason, the Executive will not be entitled to any severance payments other than salary and benefits accrued through the termination date.
Mr. Suwyn’s employment agreement provides for a severance payment of $2,000,000 upon his death while serving as our chairman or chief executive officer or upon termination of his position as our chairman and as our chief executive officer (regardless of whether he remains as a director), unless the termination is for cause, after executing and not revoking a general release.
Mr. Willett ceased serving as an executive officer in January 2010. A summary of his compensation and severance arrangement is included under “Severance Benefits for Former Chief Executive Officer.”
112
Non-Competition and Non-Solicitation Provisions
Each Executive is subject to certain non-competition and non-solicitation restrictions following termination of employment for any reason. For Messrs. Suwyn and Prystash these restrictions run for two years and for the remaining Executives these restrictions run for one year following termination.
Equity Ownership Implications upon Termination
If Mr. Suwyn’s employment as our chairman is terminated by us without cause or if he resigns as our chairman for good reason (each as defined in his employment agreement and summarized above), NewPage Group or NewPage Investments LLC must, upon request, purchase his common stock for fair market value, subject to certain exceptions. If Mr. Suwyn dies, if his employment as our chairman is terminated by us with cause or as a result of disability, or if he resigns as our chairman without good reason, NewPage Group or NewPage Investments LLC may, but are not required to, repurchase his NewPage Group common stock at fair market value unless we have then completed an initial public offering.
If Messrs. Clark’s, Martin’s or Marziale’s employment is terminated by us without cause or if any of them resigns for good reason (each as defined in his employment agreement and summarized above), NewPage Group or NewPage Investments LLC must, upon request, purchase his common stock for fair market value, subject to certain exceptions. If Messrs. Clark, Martin or Marziale dies, his employment is terminated by us for cause or as a result of disability or if any of them resigns without good reason, NewPage Group or NewPage Investments LLC may, but are not required to, repurchase his NewPage Group common stock at fair market value unless we have then completed an initial public offering.
113
Termination Benefits Summary
Below is the summary of the estimated termination benefits that would have been paid to each current Executive as of December 31, 2009 in the various circumstances listed:
TERMINATION BENEFITS
| Name |
Termination With Cause (1) |
Termination Without Cause (2) |
Death or Disability (3) |
Significant Acquisition(4) | ||||||||
| Mark A. Suwyn |
||||||||||||
| Cash severance (5) |
$ | 59,615 | $ | 2,059,615 | $ | 2,059,615 | $ | 2,059,615 | ||||
| Health and welfare benefits |
— | — | — | — | ||||||||
| Purchase of stock |
2,762,627 | 2,762,627 | 2,762,627 | 2,762,627 | ||||||||
| Total |
$ | 2,822,242 | $ | 4,822,242 | $ | 4,822,242 | $ | 4,822,242 | ||||
| David J. Prystash |
||||||||||||
| Cash severance (5) |
$ | 31,923 | $ | 1,311,923 | $ | 481,923 | $ | 1,311,923 | ||||
| Health and welfare benefits |
— | 26,036 | — | 26,036 | ||||||||
| Outplacement benefits |
— | 10,500 | — | 10,500 | ||||||||
| Total |
$ | 31,923 | $ | 1,348,459 | $ | 481,923 | $ | 1,348,459 | ||||
| George F. Martin |
||||||||||||
| Cash severance (5) |
$ | 41,538 | $ | 933,787 | $ | 341,538 | $ | 1,293,787 | ||||
| Health and welfare benefits |
— | 17,420 | — | 17,420 | ||||||||
| Outplacement benefits |
— | 10,500 | — | 10,500 | ||||||||
| Purchase of stock |
645,138 | 645,138 | 645,138 | 645,138 | ||||||||
| Total |
$ | 686,676 | $ | 1,606,845 | $ | 986,676 | $ | 1,966,845 | ||||
| Michael L. Marziale |
||||||||||||
| Cash severance (5) |
$ | 33,231 | $ | 761,479 | $ | 313,231 | $ | 1,049,479 | ||||
| Health and welfare benefits |
— | 18,158 | — | 18,158 | ||||||||
| Outplacement benefits |
— | 10,500 | — | 10,500 | ||||||||
| Purchase of stock |
645,138 | 645,138 | 645,138 | 645,138 | ||||||||
| Total |
$ | 678,369 | $ | 1,435,275 | $ | 958,369 | $ | 1,723,275 | ||||
| Daniel A. Clark |
||||||||||||
| Cash severance (5) |
$ | 29,308 | $ | 649,556 | $ | 269,308 | $ | 903,556 | ||||
| Health and welfare benefits |
— | 25,108 | — | 25,108 | ||||||||
| Outplacement benefits |
— | 10,500 | — | 10,500 | ||||||||
| Purchase of stock |
645,138 | 645,138 | 645,138 | 645,138 | ||||||||
| Total |
$ | 674,446 | $ | 1,330,302 | $ | 914,446 | $ | 1,584,302 | ||||
| (1) | Includes termination by us for cause and resignation by the Executive without good reason. For purposes of this column, we have assumed that NewPage Group would elect to repurchase the common stock, which is valued at fair value at December 31, 2009. |
| (2) | Includes termination by us without cause and resignation by the Executive with good reason. For purposes of this column, we have assumed that the Executive would elect to require NewPage Group to repurchase the common stock, which is valued at fair value at December 31, 2009. |
| (3) | For purposes of this column, we have assumed that NewPage Group would elect to repurchase the common stock, which is valued at fair value at December 31, 2009. |
| (4) | Includes termination by us without cause and resignation by the Executive with good reason, in each case within 12 months following the acquisition by NewPage Holding or its subsidiaries of the stock or assets of a business enterprise of at least substantially the same revenue and total assets as NewPage Holding on a consolidated basis. For purposes of this column, we have assumed that the Executive would elect to require NewPage Group to repurchase the common stock, which is valued at fair value at December 31, 2009. |
| (5) | Cash severance includes payment for unused accrued vacation time and the annual bonus award for the year of termination. For purposes of this table, we have assumed that each Executive would receive a full year of his annual vacation pay. We have assumed for purposes of this table that Mr. Suwyn’s employment agreement was in effect as of December 31, 2009. |
114
Severance Benefits for Former Chief Executive Officer
Mr. Willett’s employment with us terminated on January 18, 2010. Under Mr. Willett’s separation agreement, he received a severance payment equal to $1,300,000, payment for his annual bonus payment of $1,000,000 under the performance excellence plan for performance in 2009, payment for accrued but unused vacation in 2010 equal to $2,500, continued health and welfare benefits through January 18, 2012 (comprised of medical, dental, life insurance and accidental death and dismemberment insurance benefits) with a total aggregate cost to us of approximately $26,525, financial advisory services with a total cost to us of approximately $9,285 and outplacement services with a cost to us of approximately $30,000. Mr. Willett will also remain eligible for a prorated bonus payment for performance in 2010. Under his separation agreement, NewPage Group agreed not to acquire Mr. Willett’s NewPage Group common stock. Mr. Willett remains subject to certain non-competition and non-solicitation restrictions through January 18, 2012. Mr. Willett’s separation benefits were determined by the compensation committee based on his four years of service with us and the treatment of other similarly situated executives, as well as by reference to the separation benefits in his prior employment agreement, which expired April 17, 2009 and was not renewed.
Compensation of Directors
Our directors who are not employees of NewPage Holding, NewPage, Cerberus or a Cerberus affiliate receive an annual retainer of $50,000 plus $1,250 for attending each board or committee meeting and $10,000 per year for serving as a member and $20,000 per year for serving as a chairman of a committee. In addition, on December 21, 2007, these directors and Mr. Williams each received an award of non-qualified options to purchase 46,259 shares of NewPage Group common stock on the same terms as the Executives. Mr. Long received an award of non-qualified options to purchase 46,259 shares during 2008 on the same terms as the Executives. See “Equity Awards—NewPage Group Equity Incentive Plan.” Except as set forth in the table below, no director received compensation for their services as our director.
2009 DIRECTOR COMPENSATION
| Name |
Fees Earned or Paid in Cash |
Option Awards (1) |
All Other Compensation |
Total | ||||||||||
| Robert M. Armstrong |
$ | 72,500 | $ | 77,915 | $ | — | $ | 150,415 | ||||||
| Charles E. Long |
90,000 | 29,616 | — | 119,616 | ||||||||||
| John W. Sheridan |
92,500 | 77,915 | — | 170,415 | ||||||||||
| Michael S. Williams(2) |
46,250 | (179,416 | ) | — | (133,166 | ) | ||||||||
| George J. Zahringer, III |
90,000 | 77,915 | — | 167,915 | ||||||||||
| (1) | Of the 46,259 option granted to each director listed above, options to purchase 23,130 shares, 7,710 shares and 7,710 shares were deemed granted for accounting purposes pursuant to generally accepted accounting principles in 2007, 2008 and 2009. Because the performance targets are determined annually by the compensation committee, we have only considered the performance-based stock options as granted when the compensation committee sets the performance targets for the applicable year. As of December 31, 2009, outstanding options of 15,420 shares were exercisable by each of the directors, other than Mr. Williams. |
| (2) | Mr. Williams resigned as a director in August 2009 and his options subsequently expired. |
Compensation Committee Interlocks and Insider Participation
As of December 31, 2009, our compensation committee consisted of Charles E. Long and Alexander M. Wolf. None of our executive officers has a relationship that would constitute an interlocking relationship with executive officers or directors of another entity or insider participation in compensation decisions.
115
| ITEM 12. | SECURITY OWNERSHIP OF CERTAIN BENEFICIAL OWNERS AND MANAGEMENT AND RELATED STOCKHOLDER MATTERS |
NewPage is a wholly-owned subsidiary of NewPage Holding, which is a wholly-owned subsidiary of NewPage Group.
The following table sets forth information with respect to the beneficial ownership of NewPage Group as of February 12, 2010 by:
| • | each person who is known by us to beneficially own 5% or more of the NewPage Group common stock; |
| • | each member of the board of directors of NewPage Group, NewPage Holding and NewPage; |
| • | each of the Executives; and |
| • | all directors of NewPage Group, NewPage Holding and NewPage and executive officers of NewPage and NewPage Holding as a group. |
Beneficial ownership is determined in accordance with the rules of the SEC and includes stock options that could be exercised within 60 days. To our knowledge, each of the holders listed below has sole voting and investment power as to the NewPage Group common stock owned unless otherwise noted.
| Shares of NewPage Group Beneficially Owned | ||||
| Number | % | |||
| Stephen Feinberg (1)(2) |
42,861,029 | 76.6 | ||
| Stora Enso Oyj (3) |
11,251,326 | 20.1 | ||
| Daniel A. Clark |
223,787 | * | ||
| George F. Martin |
223,787 | * | ||
| Michael L. Marziale |
223,787 | * | ||
| David J. Prystash |
141,043 | * | ||
| Mark A. Suwyn |
914,936 | 1.6 | ||
| Richard D. Willett, Jr. |
786,565 | 1.4 | ||
| Robert M. Armstrong |
15,420 | * | ||
| Tom Curley |
— | — | ||
| Charles E. Long |
15,420 | * | ||
| James R. Renna |
— | — | ||
| John W. Sheridan |
15,420 | * | ||
| Lenard B. Tessler |
— | — | ||
| Alexander M. Wolf |
— | — | ||
| George J. Zahringer, III |
15,420 | * | ||
| Directors and executive officers as a group (16 persons) |
1,979,420 | 3.5 | ||
| * | Denotes beneficial ownership of less than 1%. |
| (1) | One or more affiliates of Cerberus own 76.6% of the common stock of NewPage Group. Stephen Feinberg exercises sole voting and investment authority over all of NewPage Group common stock owned by the affiliates of Cerberus. Thus, pursuant to Rule 13d-3 under the Exchange Act, Stephen Feinberg is deemed to beneficially own 76.6% of the common stock of NewPage Group. |
| (2) | The address for Mr. Feinberg is c/o Cerberus Capital Management, L.P., 299 Park Avenue, New York, New York 10171. |
| (3) | The address for SEO is Kanavaranta 1 Fl-00160, Helsinki, Finland. |
116
| ITEM 13. | CERTAIN RELATIONSHIPS AND RELATED TRANSACTIONS, AND DIRECTOR INDEPENDENCE |
Policies and Procedures
We and our audit committee have adopted written procedures regarding related party transactions. Pursuant to those procedures, any related party transaction that would be required to be reported in accordance with the rules of the SEC in this annual report, and any material amendment to such a related party transaction, must first be presented to and approved by our chief executive officer, our chief financial officer and our general counsel and then by the audit committee before we make a binding commitment to the related party. For each related party transaction presented for approval, we will consider all relevant factors, including whether the proposed transaction would be entered into in the ordinary course of our business on customary business terms, whether any related party has been or will be involved in the negotiation or administration of the proposed transaction on our behalf, and whether the proposed transaction appears to have been negotiated on an arms’-length basis without interference or influence on us by any related party. We may condition our approval on any restrictions we deem appropriate, including receiving assurances from any related party that he or she will refrain from participating in the negotiation of the proposed transaction on our behalf and in the ongoing management of the business relationship on our behalf should the proposed transaction be approved. If after a transaction has been completed we discover that it is a related party transaction, we will promptly advise management and our audit committee. In that case, we may honor the contractual commitment if entered into in good faith by an authorized representative of ours, but we may impose appropriate restrictions on the continued maintenance of the business relationship similar to those described above. If our chief executive officer, chief financial officer, general counsel or any member of our audit committee has a direct or indirect interest in a proposed transaction, that individual must disclose his interest in the proposed transaction and refrain from participating in the approval process.
Related Party Transactions
Consulting Arrangements with Rapid Change Technologies
M. Daniel Suwyn, the son of Mark A. Suwyn, our chairman, is the principal owner of Rapid Change Technologies. We paid Rapid Change Technologies $747,000 for consulting and training services in 2009. Rapid Change Technologies developed a training program and a process to improve communication skills, consensus building and problem-solving abilities. Rapid Change Technologies also facilitated the training of our employees on improving communication skills, resolving conflict and developing a process to improve productivity/operations through greater collaboration between hourly employees and supervisors/management. The terms of this arrangement were determined on an arms’-length basis, and we believe that they are comparable to terms that would have been obtained from an unaffiliated third party.
Cerberus Arrangements
Cerberus retains consultants that specialize in operations management and support and who provide Cerberus with consulting advice concerning portfolio companies in which funds and accounts managed by Cerberus or its affiliates have invested. From time to time, Cerberus makes the services of these consultants available to Cerberus portfolio companies. We reimbursed Cerberus $1,019,000 for these services in 2009. These services were provided at rates not greater than the fees that Cerberus paid to the applicable consultant, together with reimbursement of out-of-pocket expenses incurred by the consultant in providing those services. We believe that the terms of these consulting arrangements are comparable to terms that would have been obtained from an unaffiliated third party. Depending upon the nature of the assignment, consultants retained by us also provided services for Cerberus and other entities affiliated with Cerberus, including other Cerberus portfolio companies, at the same time as they performed consulting services to us, but the consultants’ duty of loyalty in their performance of their consulting services for us was solely to us. Any future consulting services of Cerberus consultants will be subject to the review and approval procedures described above.
117
Affiliates of Cerberus
During 2009, we maintained commercial arrangements with entities that are or at the time were owned or controlled by Cerberus. These include the following:
| • | Commercial Finance LLC, an affiliate of GMAC LLC, is one of the lenders under our revolving credit facility that we entered into on December 21, 2007. They have committed $70 million, of which a portion is currently used to support letters of credit. We paid a total of $1,229,000 in consent fees, commitment fees and interest to Commercial Finance LLC in 2009. As of December 31, 2009, there was $52 million outstanding under the revolving credit facility, of which Commercial Finance LLC’s share was $7 million. |
These transactions were entered into in the ordinary course of our business. We believe that these transactions were negotiated on an arms’-length basis, on substantially the same terms that could have been obtained from an unrelated party, and are not material to our results of operations or financial position.
In connection with a tender offer by NPI for our second-lien notes, NPI and NewPage entered into a dealer managers agreement, dated July 15, 2009, with Citigroup Global Markets Inc., Banc of America Securities LLC, Credit Suisse Securities (USA) LLC, Goldman, Sachs & Co. and Barclays Capital Inc. (the “Dealer Managers”). Pursuant to the dealer managers agreement, NewPage agreed to indemnify the Dealer Managers for liabilities arising out of material misstatements or omissions in the tender offer documents, breaches of representations and warranties by NPI or NewPage, and all other losses as a result of the dealer managers acting as a dealer manager or providing financial advisory services in connection with the tender offer.
SEO Arrangements
Corenso Arrangements. Prior to the closing of the Acquisition, Stora Enso North America Corp., now called NewPage Wisconsin System Inc. (“NewPage Wisconsin”) and Corenso North America Corp., a wholly-owned subsidiary of SEO that was not part of the Acquisition, which we refer to as “Corenso,” entered into the arrangements described below. Corenso manufactures core boards, cores and tubes for use by manufacturers of paper and board, textile yarn, plastic film, flexible packaging and metal foil.
| • | NewPage Wisconsin and Corenso entered into real estate lease agreements with respect to the portion of the Wisconsin Rapids mill currently used in Corenso’s operations and NewPage Wisconsin is providing steam, process water and process water effluent treatment to Corenso operations at the leased facility |
| • | NewPage Wisconsin and Corenso entered into a supply agreement pursuant to which Corenso will continue to supply cores to NewPage Wisconsin on mutually agreed terms |
NewPage Group PIK Notes. In connection with the Acquisition, NewPage Group issued $200 million in aggregate principal amount of NewPage Group PIK Notes to SEO. The NewPage Group PIK Notes mature on December 21, 2015. Interest on the NewPage Group PIK Notes accrues at a rate per annum, reset semi-annually, equal to LIBOR plus 7.0%. Interest on the NewPage Group PIK Notes compounds semi-annually in arrears on May 1 and November 1 of each year and is payable by the issuance of additional NewPage Group PIK Notes. The NewPage Group PIK Notes have customary redemption provisions, including upon a change in control, and customary events of default.
118
Loans to NewPage Group
In connection with the separation from NewPage of Jason W. Bixby, our former senior vice president and chief financial officer, we loaned $1.5 million to NewPage Group in February 2009 to enable NewPage Group to satisfy its repurchase obligations.
Director Independence
Although each of NewPage Holding and NewPage do not currently have securities listed on a national securities exchange or on an inter-dealer quotation system, we have selected the definition promulgated by the New York Stock Exchange, or NYSE, to determine which of NewPage Holding’s and NewPage’s directors qualifies as independent. Using the independence tests promulgated by the NYSE, the boards of directors of NewPage Holding and NewPage have determined that Messrs. Armstrong, Long, Sheridan and Zahringer are independent directors. In making its determination regarding Mr. Sheridan, the board of directors considered that our chairman, Mr. Suwyn, currently serves as a member of the board of directors of a company in which Mr. Sheridan currently serves as an executive officer. Examining all of the relevant facts and circumstances, the board of directors of each of NewPage Holding and NewPage determined that this relationship did not and would not impair Mr. Sheridan’s independence.
Under the NYSE rules, NewPage Holding and NewPage are each considered a “controlled company” because more than 50% of their respective voting power is held by a single person. Accordingly, even if NewPage Holding and NewPage were a listed company, they would not be required by NYSE rules to maintain a majority of independent directors on their respective board of directors, nor would they be required to maintain a compensation committee or a nominating committee comprised entirely of independent directors. As a result, NewPage Holding and NewPage do not maintain a nominating committee and their joint compensation committee includes one independent director, Mr. Long.
| ITEM 14. | PRINCIPAL ACCOUNTING FEES AND SERVICES |
Fees
The audit committee of NewPage Holding and NewPage has selected PricewaterhouseCoopers LLP as independent auditor of NewPage Holding and NewPage. The following table presents fees for professional services rendered by PricewaterhouseCoopers LLP to NewPage Holding and NewPage for the years ended December 31, 2009 and 2008.
| (in thousands) |
2009 | 2008 | ||||
| Audit fees |
$ | 1,400 | $ | 1,734 | ||
| Audit-related fees |
393 | 571 | ||||
| Tax fees |
1,328 | 85 | ||||
| All other fees |
— | — | ||||
| Total |
$ | 3,121 | $ | 2,390 | ||
Audit fees consist of fees billed or agreed to be billed for services related to the audit of NewPage Holding’s and NewPage’s consolidated annual financial statements and reviews of the interim consolidated financial statements and services that are normally provided by PricewaterhouseCoopers LLP in connection with regulatory filings.
119
“Audit-related fees” consist of fees billed for assurance and related services that are reasonably related to the performance of the audit and not reported under “Audit fees,” including audits of NewPage subsidiaries that have separate reporting requirements. In 2009, this category includes services in respect of the debt refinancing in September 2009. In 2008, this category includes services in respect of the debt issued in conjunction with the Acquisition.
“Tax fees” consist of fees billed for tax compliance services for our Canadian subsidiary and, in 2009, fees for the evaluation of alternative fuel mixtures excise tax credits.
Policy on Pre-Approval of Services of the Independent Auditor
The policy of the audit committee of NewPage and NewPage Holding is to pre-approve all audit and non-audit services provided by the independent auditors. These services may include audit services, audit-related services, tax services and other permitted non-audit services. Pre-approval is generally provided for up to one year and any pre-approval is detailed as to the particular service or category of services. Any general, pre-approved category of service with fees in excess of $100,000 or other permitted non-audit services requires specific approval of the audit committee or its designee. The audit committee has delegated pre-approval authority to the chairman of the audit committee when expedition of services is necessary, with follow-up with the audit committee at its next meeting. The audit committee pre-approved all of the services for us performed by the independent auditor in 2009.
Part IV
| ITEM 15. | EXHIBITS, FINANCIAL STATEMENT SCHEDULES |
(a)(1) Financial Statements
The following consolidated financial statements of NewPage Holding and NewPage and its subsidiaries are incorporated by reference as part of this Report at Item 8 hereof.
Reports of Independent Registered Public Accounting Firm
| NewPage Holding |
| Consolidated Balance Sheets as of December 31, 2009 and 2008 Consolidated Statements of Operations for the years ended December 31, 2009, 2008 and 2007 Consolidated Statements of Equity (Deficit) for the years ended December 31, 2009, 2008 and 2007 Consolidated Statements of Cash Flows for the years ended December 31, 2009, 2008 and 2007 |
| NewPage Consolidated Balance Sheets as of December 31, 2009 and 2008 Consolidated Statements of Operations for the years ended December 31, 2009, 2008 and 2007 Consolidated Statements of Equity for the years ended December 31, 2009, 2008 and 2007 Consolidated Statements of Cash Flows for the years ended December 31, 2009, 2008 and 2007 |
| NewPage Holding and NewPage Notes to Consolidated Financial Statements |
120
(a)(2) Financial Statement Schedules
The information required to be submitted in the Financial Statement Schedules for NewPage Holding and NewPage and consolidated subsidiaries has either been shown in the financial statements or notes, or is not applicable or required under Regulation S-X; therefore, those schedules have been omitted.
(a)(3) Exhibits
| Exhibit Number |
Description | |
| 3.1 | Amended and Restated Certificate of Incorporation of NewPage Holding Corporation (incorporated by reference from Exhibit 3.1 to the Annual Report on Form 10-K for the year ended December 31, 2007) | |
| 3.2 | Amended and Restated Bylaws of NewPage Holding Corporation (incorporated by reference from Exhibit 3.2 to the Quarterly Report on Form 10-Q for the quarter ended September 30, 2006) | |
| 3.3 | Certificate of Incorporation of NewPage Corporation (incorporated by reference from Exhibit 3.1 to the Registration Statement on Form S-4 (Reg. No. 333-125952) of NewPage Corporation, filed on June 20, 2005) | |
| 3.4 | Amended and Restated Bylaws of NewPage Corporation (incorporated by reference from Exhibit 3.2 to the Quarterly Report on Form 10-Q of NewPage Corporation for the quarter ended June 30, 2006) | |
| 4.1 | Indenture for the Floating Rate Senior PIK Notes due 2013 dated as of May 2, 2005 by and among NewPage Holding Corporation and HSBC Bank USA, National Association, as Trustee (incorporated by reference from Exhibit 4.1 to the Registration Statement on Form S-4 (Reg. No. 333-129343) of NewPage Holding Corporation, filed on October 31, 2005) | |
| 4.2 | Form of Floating Rate Senior PIK Notes due 2013 (included in Exhibit 4.1) | |
| 4.3 | Intercreditor Agreement, dated as of May 2, 2005 among NewPage Corporation, NewPage Holding Corporation, certain subsidiaries of NewPage Corporation, JPMorgan Chase Bank, N.A., as revolving loan collateral agent and The Bank of New York, as collateral trustee (incorporated by reference from Exhibit 4.9 to the Registration Statement on Form S-4 (Reg. No. 333-125952) of NewPage Corporation, filed on June 20, 2005) | |
| 4.4 | Indenture for the Floating Rate Senior Secured Notes due 2012 dated as of May 2, 2005 by and among NewPage Corporation, the guarantors named herein and HSBC Bank USA, National Association, as Trustee (incorporated by reference from Exhibit 4.1 to the Registration Statement on Form S-4 (Reg. No. 333-125952) of NewPage Corporation, filed on June 20, 2005), as supplemented dated December 21, 2007 (incorporated by reference from Exhibit 10.7 to the Form 8-K filed on December 28, 2007) | |
| 4.5 | Indenture for the 10% Senior Secured Notes due 2012 dated as of May 2, 2005 among NewPage Corporation, as Issuer, the guarantors named herein, HSBC Bank USA, National Association, as Trustee (incorporated by reference from Exhibit 4.2 to the Registration Statement on Form S-4 (Reg. No. 333-125952) of NewPage Corporation, filed on June 20, 2005), as supplemented dated December 21, 2007 (incorporated by reference from Exhibit 10.5 to the Form 8-K filed on December 28, 2007) | |
121
| 4.6 |
Indenture for the 12% Senior Subordinated Notes due 2013 dated as of May 2, 2005 among NewPage Corporation, the guarantors named herein and HSBC Bank USA, National Association, as Trustee (incorporated by reference from Exhibit 4.3 to the Registration Statement on Form S-4 (Reg. No. 333-125952) of NewPage Corporation, filed on June 20, 2005), as supplemented dated December 21, 2007 (incorporated by reference from Exhibit 10.8 to the Form 8-K filed on December 28, 2007) | |
| 4.7 |
Form of Floating Rate Senior Secured Notes due 2012 (included in Exhibit 4.4) | |
| 4.8 |
Form of 10% Senior Secured Notes due 2012 (included in Exhibit 4.5) | |
| 4.9 |
Form of 12% Senior Subordinated Notes due 2013 (included in Exhibit 4.6) | |
| 4.10 |
Form of Guarantee for each of the Floating Rate Senior Notes due 2012, the 10% Senior Secured Notes due 2012, and the 12% Senior Subordinated Notes due 2013 (included in Exhibit 4.6) | |
| 4.11 |
Collateral Trust Agreement dated as of May 2, 2005 among NewPage Corporation, the Pledgors from time to time party thereto, Goldman Sachs Credit Partners L.P., HSBC Bank USA, National Association, and The Bank of New York (incorporated by reference from Exhibit 4.10 to the Registration Statement on Form S-4 (Reg. No. 333-125952) of NewPage Corporation, filed on June 20, 2005) | |
| 4.12 |
Priority Lien Debt Pledge and Security Agreement, dated December 21, 2007, among NewPage Corporation and certain of its affiliates and The Bank of New York (incorporated by reference from Exhibit 10.3 to the Form 8-K of NewPage Corporation filed on December 28, 2007) | |
| 4.13 |
Indenture for the 11.375% Senior Secured Notes due 2014 dated as of September 30. 2009 among NewPage Corporation, the Guarantors and The Bank of New York Mellon, as Trustee (incorporated by reference from Exhibit 4.1 to the Form 8-K filed on October 5, 2009) | |
| 4.14 |
Form of 11.375% Senior Secured Notes due 2014 (included in Exhibit 4.13) | |
| 10.1 |
Equity and Asset Purchase Agreement, dated as of January 14, 2005, among MeadWestvaco Corporation and Maple Acquisition LLC (n/k/a Escanaba Timber LLC) (incorporated by reference from Exhibit 10.1 to the Registration Statement on Form S-4 (Reg. No. 333-129343) of NewPage Holding Corporation, filed on October 31, 2005) as amended by the First Amendment, dated as of April 22, 2005 (incorporated by reference from Exhibit 10.2 to the Registration Statement on Form S-4 (Reg. No. 333-129343) of NewPage Holding Corporation, filed on October 31, 2005) and the Second Amendment, dated as of April 30, 2005 (incorporated by reference from Exhibit 10.3 to the Registration Statement on Form S-4 (Reg. No. 333-129343) of NewPage Holding Corporation, filed on October 31, 2005) | |
122
| 10.2+ |
Employment Letter Agreement dated May 2, 2005, by and between NewPage Corporation and Daniel A. Clark (incorporated by reference from Exhibit 10.12 to the Registration Statement on Form S-4 (Reg. No. 333-129343) of NewPage Holding Corporation, filed on October 31, 2005), as amended by Amendment No. 1 dated as of January 28, 2007 (incorporated by reference from Exhibit 10.12 to the Annual Report on Form 10-K for the year ended December 31, 2006), Amendment No. 2 dated as of December 21, 2007 (incorporated by reference from Exhibit 10.9 to the Form 8-K filed on December 28, 2007) and Amendment No. 3 dated as of January 1, 2009 (incorporated by reference from Exhibit 10.2 to the Annual Report on Form 10-K for the year ended December 31, 2008) | |
| 10.3+ |
Employment Letter Agreement dated October 6, 2005, by and between NewPage Corporation and Douglas K. Cooper (incorporated by reference from Exhibit 10.20 to the Registration Statement on Form S-4 (Reg. No. 333-129343) of NewPage Holding Corporation, filed on October 31, 2005), as amended by Amendment No. 1 dated as of January 28, 2007 (incorporated by reference from Exhibit 10.20 to the Annual Report on Form 10-K for the year ended December 31, 2006), Amendment No. 2 dated as of December 21, 2007 (incorporated by reference from Exhibit 10.10 to the Form 8-K filed on December 28, 2007) and Amendment No. 3 dated as of January 1, 2009 (incorporated by reference from Exhibit 10.3 to the Annual Report on Form 10-K for the year ended December 31, 2008) | |
| 10.4 |
Asset Purchase Agreement dated January 6, 2006, among Brascan Power Inc., Rumford Falls Power Company and Rumford Paper Company (incorporated by reference from Exhibit 10.25 to the Amendment No. 2 to the Registration Statement on Form S-4 (Reg. No. 333-129343) of NewPage Holding Corporation, filed on January 18, 2006), as amended by Amendment No. 1 to the Asset Purchase Agreement dated as of June 7, 2006 (incorporated by reference from Exhibit 10.37 to the Amendment No. 2 to the Registration Statement on Form S-1 (Reg. No. 333-133367) of NewPage Holding Corporation, filed on June 14, 2006) | |
| 10.5 |
Asset Purchase Agreement among NewPage Corporation, Chillicothe Paper Inc. and P. H. Glatfelter Company dated February 21, 2006 (incorporated by reference from Exhibit 10.26 to the Amendment No. 3 to the Registration Statement on Form S-4 (Reg. No. 333-129343) of NewPage Holding Corporation, filed on April 17, 2006) | |
| 10.6+ |
Employment Letter Agreement dated May 2, 2005, by and between NewPage Corporation and George F. Martin (incorporated by reference from Exhibit 10.31 to the Amendment No. 3 to the Registration Statement on Form S-4 (Reg. No. 333-129343) of NewPage Holding Corporation, filed on April 17, 2006), as amended by Amendment No. 1 dated as of January 28, 2007 (incorporated by reference from Exhibit 10.31 to the Annual Report on Form 10-K for the year ended December 31, 2006), Amendment No. 2 dated as of December 21, 2007 (incorporated by reference from Exhibit 10.11 to the Form 8-K filed on December 28, 2007) and Amendment No. 3 dated as of January 1, 2009 (incorporated by reference from Exhibit 10.6 to the Annual Report on Form 10-K for the year ended December 31, 2008) | |
| 10.7+ |
Employment Agreement dated as of January 18, 2010, by and between NewPage Corporation and Mark A. Suwyn | |
123
| 10.8+ |
Employment Agreement dated as of April 17, 2006 by and between NewPage Corporation and Richard D. Willett, Jr. (incorporated by reference from Exhibit 10.34 to the Amendment No. 3 to the Registration Statement on Form S-4 (Reg. No. 333-129343) of NewPage Holding Corporation, filed on April 17, 2006) as amended by Amendment No. 1 dated as of January 1, 2009 (incorporated by reference from Exhibit 10.8 to the Annual Report on Form 10-K for the year ended December 31, 2008) | |
| 10.9 |
Form of Indemnification Agreement (incorporated by reference from Exhibit 10.35 to the Amendment No. 4 to the Registration Statement on Form S-1 (Reg. No. 333-133367) of NewPage Holding Corporation, filed on July 12, 2006) | |
| 10.10 |
Form of Independent Director Agreement (incorporated by reference from Exhibit 10.36 to the Amendment No. 4 to the Registration Statement on Form S-1 (Reg. No. 333- 133367) of NewPage Holding Corporation, filed on July 12, 2006) | |
| 10.11+ |
Form of NewPage Holding Corporation 2006 Incentive Plan (incorporated by reference from Exhibit 10.38 to the Amendment No. 2 to the Registration Statement on Form S-1 (Reg. No. 333-133367) of NewPage Holding Corporation, filed on June 14, 2006) | |
| 10.12+ |
Form of Management Lock-up Agreement (incorporated by reference from Exhibit 10.39 to the Amendment No. 4 to the Registration Statement on Form S-1 (Reg. No. 333- 133367) of NewPage Holding Corporation, filed on July 12, 2006) | |
| 10.13+ |
Employment Agreement dated as of May 2, 2005 by and between NewPage Corporation and Michael L. Marziale, as amended by letter agreement dated as of June 30, 2006, and by Amendment No. 2 dated as of January 28, 2007 (incorporated by reference from Exhibit 10.40 to the Annual Report on Form 10-K for the year ended December 31, 2006), Amendment No. 3 dated as of December 21, 2007 (incorporated by reference from Exhibit 10.12 to the Form 8-K filed on December 28, 2007) and Amendment No. 4 dated as of January 1, 2009 (incorporated by reference from Exhibit 10.13 to the Annual Report on Form 10-K for the year ended December 31, 2008) | |
| 10.14 |
Revolving Credit and Guaranty Agreement, dated December 21, 2007, among NewPage Corporation, NewPage Holding Corporation, certain subsidiaries of NewPage Corporation, lenders party thereto, Goldman Sachs Credit Partners L.P., as Administrative Agent, JPMorgan Chase Bank, N.A., as Collateral Agent, and the other parties thereto (incorporated by reference from Exhibit 10.2 to the Form 8-K filed on December 28, 2007), as amended by the First Amendment, dated as of September 11, 2009 (incorporated by reference from Exhibit 10.2 to the Form 8-K filed on September 11, 2009) and the Second Amendment, dated as of January 28, 2010 (incorporated by reference from Exhibit 10.1 to the Form 8-K filed on February 3, 2010) | |
| 10.15 |
Priority Lien Debt Pledge and Security Agreement, dated December 21, 2007, among NewPage Corporation and certain of its affiliates and The Bank of New York (incorporated by reference from Exhibit 10.3 to the Form 8-K filed on December 28, 2007) | |
| 10.16 |
Revolving Credit Pledge and Security Agreement, dated December 21, 2007, among NewPage Corporation and certain of its affiliates and JPMorgan Chase Bank, N.A. (incorporated by reference from Exhibit 10.4 to the Form 8-K filed on December 28, 2007) | |
124
| 10.17 |
Stock Purchase Agreement by and among Stora Enso Oyj, Stora Enso North America, Inc. and NewPage Holding Corporation, dated as of September 20, 2007 (incorporated by reference from Exhibit 10.1 to the Quarterly Report on Form 10-Q for the quarter ended September 30, 2007), as amended by the First Amendment, dated as of December 21, 2007 (incorporated by reference from Exhibit 10.15 to the Form 8-K filed on December 28, 2007) | |
| 10.18+ |
Employment Agreement dated as of November 1, 2007 by and between NewPage Corporation and Michael T. Edicola (incorporated by reference from Exhibit 10.27 to the Annual Report on Form 10-K for the year ended December 31, 2007), as amended by Amendment No. 1 dated as of January 1, 2009 (incorporated by reference from Exhibit 10.20 to the Annual Report on Form 10-K for the year ended December 31, 2008) | |
| 10.19+ |
Employment Agreement dated as of September 8, 2008 by and between NewPage Corporation and David J. Prystash (incorporated by reference from Exhibit 10.2 to the Quarterly Report on Form 10-Q for the quarter ended September 30, 2008), as amended by Amendment No. 1 dated as of January 1, 2009 (incorporated by reference from Exhibit 10.21 to the Annual Report on Form 10-K for the year ended December 31, 2008) and the Employment Letter dated as of April 20, 2009 (incorporated by reference from Exhibit 10.1 to the Quarterly Report on Form 10-Q for the quarter ended June 30, 2009) | |
| 10.20+ |
Separation Agreement dated January 18, 2010, by and between NewPage Corporation, NewPage Group Inc. and Richard D. Willett, Jr. | |
| 10.21+ |
2010 Executive Long-Term Incentive Plan, adopted January 15, 2010, and form of Award Agreement used in connection with that Plan | |
| 10.22+ |
Employment Agreement dated as of February 10, 2010, by and between NewPage Corporation and E. Thomas Curley | |
| 21.1 |
Subsidiaries of the registrant | |
| 24.1 |
Power of Attorney—Robert M. Armstrong | |
| 24.2 |
Power of Attorney—Charles E. Long | |
| 24.3 |
Power of Attorney—James R. Renna | |
| 24.4 |
Power of Attorney—John W. Sheridan | |
| 24.5 |
Power of Attorney—Mark A. Suwyn | |
| 24.6 |
Power of Attorney—Lenard B. Tessler | |
| 24.7 |
Power of Attorney—Alexander M. Wolf | |
| 24.8 |
Power of Attorney—George J. Zahringer, III | |
| 31.1 |
Certification of Chief Executive Officer pursuant to Rules 13a-14 and 15d-14, as adopted pursuant to Section 302 of the Sarbanes-Oxley Act of 2002 | |
125
| 31.2 | Certification of Chief Financial Officer pursuant to Rules 13a-14 and 15d-14, as adopted pursuant to Section 302 of the Sarbanes-Oxley Act of 2002 | |
| 32.1 | Certification of Chief Executive Officer pursuant to 18 U.S.C. Section 1350, as adopted pursuant to Section 906 of the Sarbanes-Oxley Act of 2002 | |
| 32.2 | Certification of Chief Financial Officer pursuant to 18 U.S.C. Section 1350, as adopted pursuant to Section 906 of the Sarbanes-Oxley Act of 2002 | |
| + | Management contract or compensatory plan or arrangement. |
126
SIGNATURES
Pursuant to the requirements of Section 13 or 15(d) of the Securities Exchange Act of 1934, the registrant has duly caused this Report to be signed on its behalf by the undersigned, thereunto duly authorized.
| NEWPAGE HOLDING CORPORATION | NEWPAGE CORPORATION | |||||||
| By: | /s/ Tom Curley |
By: | /s/ Tom Curley | |||||
| Tom Curley | Tom Curley | |||||||
| Chief Executive Officer | Chief Executive Officer | |||||||
| Date: February 18, 2010 | Date: February 18, 2010 | |||||||
Pursuant to the requirements of the Securities Exchange Act of 1934, this report has been signed below by the following persons on behalf of the registrant and in the capacities and on the dates indicated.
| NEWPAGE HOLDING CORPORATION | NEWPAGE CORPORATION | |||||||
| /s/ Tom Curley |
/s/ Tom Curley | |||||||
| Tom Curley | Tom Curley | |||||||
| President, Chief Executive Officer and Director |
President, Chief Executive Officer and Director | |||||||
| (Principal Executive Officer) | (Principal Executive Officer) | |||||||
| Date: February 18, 2010 | Date: February 18, 2010 | |||||||
| /s/ David J. Prystash |
/s/ David J. Prystash | |||||||
| David J. Prystash | David J. Prystash | |||||||
| Senior Vice President, Chief Financial Officer and Assistant Secretary |
Senior Vice President, Chief Financial Officer and Assistant Secretary | |||||||
| (Principal Financial Officer) | (Principal Financial Officer) | |||||||
| Date: February 18, 2010 | Date: February 18, 2010 | |||||||
| /s/ Curtis H. Short |
/s/ Curtis H. Short | |||||||
| Curtis H. Short | Curtis H. Short | |||||||
| Controller and Chief Accounting Officer | Controller and Chief Accounting Officer | |||||||
| (Principal Accounting Officer) | (Principal Accounting Officer) | |||||||
| Date: February 18, 2010 | Date: February 18, 2010 | |||||||
| * |
* | |||||||
| Robert M. Armstrong | Robert M. Armstrong | |||||||
| Director | Director | |||||||
| Date: February 18, 2010 | Date: February 18, 2010 | |||||||
| * |
* | |||||||
| Charles E. Long | Charles E. Long | |||||||
| Director | Director | |||||||
| Date: February 18, 2010 | Date: February 18, 2010 | |||||||
127
| * |
* | |||||||
| James R. Renna | James R. Renna | |||||||
| Director | Director | |||||||
| Date: February 18, 2010 | Date: February 18, 2010 | |||||||
| * |
* | |||||||
| John W. Sheridan | John W. Sheridan | |||||||
| Director | Director | |||||||
| Date: February 18, 2010 | Date: February 18, 2010 | |||||||
| * |
* | |||||||
| Mark A. Suwyn | Mark A. Suwyn | |||||||
| Director | Director | |||||||
| Date: February 18, 2010 | Date: February 18, 2010 | |||||||
| * |
* | |||||||
| Lenard B. Tessler | Lenard B. Tessler | |||||||
| Director | Director | |||||||
| Date: February 18, 2010 | Date: February 18, 2010 | |||||||
| * |
* | |||||||
| Alexander M. Wolf | Alexander M. Wolf | |||||||
| Director | Director | |||||||
| Date: February 18, 2010 | Date: February 18, 2010 | |||||||
| * |
* | |||||||
| George J. Zahringer, III | George J. Zahringer, III | |||||||
| Director | Director | |||||||
| Date: February 18, 2010 | Date: February 18, 2010 | |||||||
| * By: | /s/ Douglas K. Cooper |
|||||||
| Douglas K. Cooper | ||||||||
| Attorney-in-fact | ||||||||
Supplemental Information to Be Furnished With Reports Filed Pursuant to Section 15(d) of the Act by Registrants Which Have Not Registered Securities Pursuant to Section 12 of the Act
No annual report or proxy material will be provided to our security holder.
128