Attached files
`
|
UNITED STATES |
|
SECURITIES AND EXCHANGE COMMISSION |
|
Washington, D.C. 20549 |
|
______________________________________________________________________ |
|
FORM 10-K |
|
ANNUAL REPORT |
(Mark One)
x ANNUAL REPORT PURSUANT TO SECTION 13 OR 15(d) OF THE SECURITIES EXCHANGE ACT OF 1934
For the fiscal year ended December
31, 2009
OR
|
o |
TRANSITION REPORT PURSUANT TO SECTION 13 OR 15(d) OF THE SECURITIES EXCHANGE ACT OF 1934 |
|
|
For the transition period from __________ to ___________ |
Commission file number 1-13144
|
ITT EDUCATIONAL SERVICES, INC. |
|
(Exact name of registrant as specified in its charter) |
|
Delaware |
36-2061311 |
|
(State or other jurisdiction of |
(I.R.S. Employer Identification No.) |
|
incorporation or organization) |
|
13000 North Meridian Street
Carmel, Indiana |
46032-1404
(Zip Code) |
|
(Address of principal executive offices) |
|
Registrant's telephone number, including area code (317) 706-9200 |
|
Securities registered pursuant to Section 12(b) of the Act: |
|
Title of each class |
Name of each exchange on which registered |
|
COMMON STOCK, $.01 PAR VALUE |
NEW YORK STOCK EXCHANGE, INC. |
|
Securities registered pursuant to Section 12(g) of the Act: | |
|
NONE | |
Indicate by check mark if the registrant is a well-known seasoned issuer, as defined in Rule 405 of the Securities Act.
|
Yes x |
No ¨ |
Indicate by check mark if the registrant is not required to file reports pursuant to Section 13 or Section 15(d) of the Act.
|
Yes ¨ |
No x |
Indicate by check mark whether the registrant (1) has filed all reports required to be filed by Section 13 or 15(d) of the Securities Exchange Act of 1934 during the preceding 12 months (or for such shorter period that the registrant was required to file such reports), and (2) has been subject to such filing requirements for the past 90 days.
|
Yes x |
No ¨ |
Indicate by check mark whether the registrant has submitted electronically and posted on its corporate Web site, if any, every Interactive Data File required to be submitted and posted pursuant to Rule 405 of Regulation S-T (§232.405 of this chapter) during the preceding 12 months (or for such shorter period that the registrant was required
to submit and post such files).
|
Yes ¨ |
No ¨ |
Indicate by check mark if disclosure of delinquent filers pursuant to Item 405 of Regulation S-K is not contained herein, and will not be contained, to the best of registrant's knowledge, in definitive proxy or information statements incorporated by reference in Part III of this Form 10-K or any amendment to this Form 10-K.x
Indicate by check mark whether the registrant is a large accelerated filer, an accelerated filer, a non-accelerated filer, or a smaller reporting company. See the definitions of “large accelerated filer,” “accelerated filer” and “smaller reporting company” in Rule 12b-2 of the Exchange Act.
|
Large accelerated filer x |
Accelerated filer ¨ |
|
Non-accelerated filer ¨ (Do not check if
a smaller reporting company) |
Smaller reporting company ¨ |
Indicate by check mark whether the registrant is a shell company (as defined in Rule 12b-2 of the Exchange Act).
|
Yes ¨ |
No x |
$3,787,938,473
Aggregate market value of the voting stock held by nonaffiliates of the registrant based on the last sale price for such stock at June 30, 2009 (assuming solely for the purposes of this calculation that all Directors and executive officers of the registrant are “affiliates”).
35,456,204
Number of shares of Common Stock, $.01 par value, outstanding at January 29, 2010.
DOCUMENTS INCORPORATED BY REFERENCE
Portions of the following documents have been incorporated by reference into this Annual Report on Form 10-K:
|
IDENTITY OF DOCUMENT |
PARTS OF FORM 10-K INTO WHICH DOCUMENT IS INCORPORATED | |
|
Definitive Proxy Statement for the Annual Meeting of Shareholders to be held May 4, 2010 |
PART III | |
ITT EDUCATIONAL SERVICES, INC.
Carmel, Indiana
Annual Report to Securities and Exchange Commission
December 31, 2009
Table of Contents
|
| ||
|
Item 1. |
| |
|
Item 1A. |
| |
|
Item 1B. |
| |
|
Item 2. |
| |
|
Item 3. |
| |
|
Item 4. |
| |
|
| ||
|
Item 5. |
| |
|
Item 6. |
| |
|
Item 7. |
| |
|
Item 7A. |
| |
|
Item 8. |
| |
|
Item 9. |
| |
|
Item 9A. |
| |
|
Item 9B. |
| |
|
| ||
|
Item 10. |
| |
|
Item 11. |
| |
|
Item 12. |
| |
|
Item 13. |
| |
|
Item 14. |
| |
|
| ||
|
Item 15. |
|
-i-
Item 1. Business.
Forward-Looking Statements: All statements, trend analyses and other information contained in this report that are not historical facts are forward-looking statements within the meaning of the safe harbor provision of the Private Securities Litigation Reform Act of 1995
and as defined in Section 27A of the Securities Act of 1933 (the “Securities Act”) and Section 21E of the Securities Exchange Act of 1934 (the “Exchange Act”). Forward-looking statements are made based on our management’s current expectations and beliefs concerning future developments and their potential effects on us. You can identify those statements by the use of words such as “could,” “should,” “would,” “may,” “will,”
“project,” “believe,” “anticipate,” “expect,” “plan,” “estimate,” “forecast,” “potential,” “intend,” “continue,” and “contemplate,” as well as similar words and expressions. Forward-looking statements involve risks and uncertainties and do not guarantee future performance. We cannot assure you that future developments affecting us will be those anticipated by our management. Among
the factors that could cause actual results to differ materially are the following:
|
· |
business conditions and growth in the postsecondary education industry and in the general economy; |
|
· |
changes in federal and state governmental regulations with respect to education and accreditation standards, or the interpretation or enforcement of those regulations, including, but not limited to, the level of government funding for, and our eligibility to participate in, student financial aid programs utilized by our students; |
|
· |
our failure to comply with the extensive education laws and regulations and accreditation standards that we are subject to; |
|
· |
effects of any change in our ownership resulting in a change in control, including, but not limited to, the consequences of such changes on the accreditation and federal and state regulation of our campuses; |
|
· |
our ability to implement our growth strategies; |
|
· |
our failure to maintain or renew required regulatory authorizations or accreditations of our campuses; |
|
· |
receptivity of students and employers to our existing program offerings and new curricula; |
|
· |
loss of access by our students to lenders for student loans; |
|
· |
our ability to collect internal student financing from our students; |
|
· |
our exposure under our guarantees related to private education loan programs; and |
|
· |
our ability to successfully defend litigation and other claims brought against us. |
Readers are also directed to other risks and uncertainties discussed in “Risk Factors” and elsewhere in this Annual Report and those detailed from time to time in other documents we file with the U.S. Securities and Exchange Commission (“SEC”). We undertake no obligation to update or revise
any forward-looking information, whether as a result of new information, future developments or otherwise.
You should keep in mind the following points as you read this report:
|
· |
References in this document to “we,” “us,” “our” and “ITT/ESI” refer to ITT Educational Services, Inc. and its subsidiaries. |
|
· |
The terms “ITT Technical Institute” or “Daniel Webster College” (in singular or plural form) refer to an individual school or campus owned and operated by ITT/ESI, including its learning sites, if any. The terms “institution” or “campus group” (in singular or plural form) mean a main campus
and its additional locations, branch campuses and/or learning sites, if any. |
Background
We are a Delaware corporation incorporated in 1946. Our principal executive offices are located at 13000 North Meridian Street, Carmel, Indiana 46032-1404, and our telephone number is (317) 706-9200. From 1966 until our initial public offering on December 27, 1994, we
were wholly owned by ITT Corporation, an Indiana corporation, formerly a Delaware corporation and formerly known as ITT Industries, Inc. (“Old ITT”). On September 29, 1995, ITT Corporation, a Nevada corporation (“ITT”), succeeded to the interests of Old ITT in the beneficial ownership of 83.3% of our common stock. Public offerings of our common stock by ITT in June 1998 and February 1999 and our repurchase of 1,500,000 shares of our common stock from ITT in February
1999 completely eliminated ITT’s beneficial ownership of any of our common stock.
-1-
Overview
We are a leading for-profit provider of postsecondary degree programs in the United States based on revenue and student enrollment. As of December 31, 2009, we were offering master, bachelor and associate degree programs to approximately 80,000 students. As of December
31, 2009, we had 125 locations (including 121 campuses and four learning sites) in 38 states. All of our institutions are authorized by the applicable education authorities of the states in which they operate, and are accredited by an accrediting commission recognized by the U.S. Department of Education (“ED”). We design our education programs, after consultation with employers and other constituents, to help graduates prepare for careers in various fields involving their areas
of study. We have provided career-oriented education programs since 1969 under the “ITT Technical Institute” name and since June 2009 under the “Daniel Webster College” name.
In 2009, we began operations at ten new ITT Technical Institute campuses and converted five learning sites into five ITT Technical Institute campuses. In 2010, we plan to begin operations at eight to ten new ITT Technical Institute and/or Daniel Webster College (“DWC”)
locations. In 2009, we continued our efforts to diversify our program offerings by developing programs at different levels in technology and non-technology fields of study that we intend to offer at our campuses and deliver entirely in residence, entirely online over the Internet or partially in residence and partially online.
On June 10, 2009, we acquired substantially all of the assets and assumed certain liabilities of DWC for approximately $20.8 million in cash, net of cash acquired. DWC’s campus is located in Nashua, New Hampshire. DWC currently offers programs of study
at the master, bachelor and associate degree levels both in residence and through distance education.
Business Strategy
Our strategy is to pursue multiple opportunities for growth. We are implementing a growth strategy designed to increase revenue and operating efficiencies by:
|
· |
increasing the number and types of program offerings that are delivered in residence and/or online; |
|
· |
increasing student enrollment at existing campuses; |
|
· |
operating new campuses across the United States; and |
|
· |
adding learning sites to existing campuses. |
The principal elements of this strategy include the following:
Enhance Results at the Campus Level.
Increase Enrollments at Existing Campuses. We intend to increase recruiting efforts that are primarily aimed at enrolling more working adults at our existing campuses, and make our programs more
convenient for students. In addition, we believe that current demographic and employment trends will allow us to enroll a greater number of recent high school graduates.
Increase the Number of Programs Offered at Existing Campuses. We intend to continue increasing the number of programs that we offer at our existing
campuses. Our objective is to offer multiple programs at each campus. Our existing campuses provide significant potential for the introduction of our current programs at a broader number of campuses. We believe that introducing our current programs at additional existing campuses will attract more students. In 2009, we added a total of 377 programs among 106 campuses, and in 2010 we intend to add more of our current programs among approximately 95 locations. We currently
offer one or more of our online programs to students who are located in 48 states and the District of Columbia. We intend to expand the number of our online programs offered in 2010.
Develop Additional Programs. In 2009, we continued our efforts to diversify our program offerings by developing new programs in both technology
and non-technology fields of study that are delivered entirely in residence, entirely online or partially in residence and partially online. In 2010, we plan to continue developing additional programs in technology and non-technology fields of study that are delivered entirely in residence, entirely online or partially in residence and partially online. The new programs are expected to involve a variety of disciplines and be at the associate, bachelor and master degree levels. We believe
that offering new programs can attract a broader base of students, motivate current students to extend their studies and help us improve the utilization of our facilities.
-2-
Extend Total Program Duration. In 2009, we increased the number of our campuses that offer bachelor degree programs from 87 to 102. In
2010, we intend to increase the number of our campuses that offer bachelor degree programs. The average combined total program time that students are enrolled in one or more of our programs has increased over time as a result of:
|
· |
a portion of the graduates of our associate degree programs enrolling in bachelor degree programs at our campuses; and |
|
· |
a portion of our new students beginning their studies in bachelor degree programs, instead of first completing associate degree programs. |
We believe that the average combined total program time of our students may increase further as we:
|
· |
increase the number of our campuses offering bachelor degree programs; |
|
· |
add additional bachelor degree programs at our campuses; and |
|
· |
expand our online curricula offerings to include additional master degree programs. |
Improve Student Outcomes. We strive to improve the graduation and graduate employment rates of our undergraduate students by providing academic
and career services and dedicating administrative resources to these services.
Geographically Expand Our Campuses and Learning Sites. We plan to add new campuses and learning sites of existing campuses at locations throughout the United States. Using our proprietary methodology, we
determine locations for new campuses and learning sites based on a number of factors, including demographics and population and employment growth. The following table sets forth the number of new campuses and new learning sites that began operations in the years indicated:
|
2009 |
2008 |
2007 | |||
|
New campuses |
10 |
8 |
10 | ||
|
Converted learning sites to campuses |
5 |
-- |
-- | ||
|
New learning sites |
-- |
-- |
-- | ||
|
15 |
8 |
10 |
We plan to begin operations at eight to ten new locations in 2010.
Increase Margins By Leveraging Fixed Costs at Campus and Headquarters Levels. Our efforts to optimize campus capacity and class size have allowed us to increase student enrollment without incurring a proportionate
increase in fixed costs at our campuses. In addition, we have realized substantial operating efficiencies by centralizing management functions and implementing operational uniformity among our campuses. We will continue to seek to improve margins by increasing enrollments and revenue without incurring a proportionate increase in fixed costs, and by reducing our variable costs.
Programs of Study
As of December 31, 2009, the ITT Technical Institutes were offering 35 degree programs in various fields of study across the following schools of study:
|
· |
information technology (“IT”); |
|
· |
electronics technology; |
|
· |
drafting and design; |
|
· |
business; |
|
· |
criminal justice; and |
|
· |
health sciences. |
-3-
We design our programs to help graduates prepare for careers in various fields involving their education by offering students a broad-based foundation in a variety of skills used in those fields. The following table sets forth examples of various fields involving the subject matter
of programs within a particular school of study in which graduates have obtained entry-level positions:
|
School of Study |
Fields | |
|
Business |
accounting | |
|
business administration | ||
|
financial services | ||
|
marketing and advertising | ||
|
manufacturing | ||
|
Drafting and Design |
computer-aided drafting | |
|
electrical and electronics drafting | ||
|
mechanical drafting | ||
|
architectural and construction drafting | ||
|
civil drafting | ||
|
interior design | ||
|
landscape architecture | ||
|
multimedia communications | ||
|
Electronics Technology |
electronics product design and fabrication | |
|
communications | ||
|
computer technology | ||
|
industrial electronics | ||
|
instrumentation | ||
|
telecommunications | ||
|
Criminal Justice |
corrections | |
|
security and policing | ||
|
investigations | ||
|
cyber security | ||
|
IT |
network administration | |
|
technical support | ||
|
network technology | ||
|
systems technology | ||
|
Health Sciences |
nursing | |
|
health information technology |
At the vast majority of our campuses, we generally organize the academic schedule for programs of study on the basis of four 12-week academic quarters in a calendar year, with new students beginning at the start of each academic quarter. At these campuses, students taking a
full-time course load can complete our associate degree programs in eight academic quarters, bachelor degree programs in 15 academic quarters and a master degree program in seven academic quarters. We typically offer classes in most residence programs in:
|
· |
3.5- to 5.5-hour sessions three days a week, Monday through Saturday, with all program courses taught entirely or partially in residence; or |
|
· |
sessions that are scheduled two to three days a week, Monday through Saturday, with certain program courses taught entirely or partially online over the Internet most academic quarters. |
Depending on student enrollment, class sessions at the vast majority of our campuses are generally available in the morning, afternoon and evening. The courses that are taught online over the Internet are delivered through an asynchronous learning network and have a prescribed schedule for completion of the coursework. At
the vast majority of our campuses, the class schedule for our residence courses and the coursework completion schedule for our online courses generally provide students with the flexibility to maintain employment concurrently with their studies. Based on student surveys, we believe that a substantial majority of our students work at least part-time during their programs of study.
-4-
Most of our programs of study blend traditional academic content with applied learning concepts and have the objective of helping graduates prepare for a changing economic and/or technological environment. A significant portion of most programs offered at our campuses involves practical study
in a lab environment.
The learning objectives of most courses in each program of study are substantially the same among the vast majority of our campuses to provide greater uniformity and to better enable students to transfer, if necessary, to other campuses offering the same programs with less disruption to their
education. We regularly review each curriculum to respond to changes in technology and industry needs. Each of the ITT Technical Institutes establishes an advisory committee for each field of study taught at that campus, which is comprised of representatives of local employers and other constituents. These advisory committees assist the ITT Technical Institutes in assessing curricula, equipment and laboratory design, and updating the curricula. In addition to courses
directly related to a student's program of study, our programs also include general education courses in the humanities, composition, mathematics, the sciences and the social sciences.
Tuition for a student entering an undergraduate residence program at an ITT Technical Institute in December 2009 for 36 quarter credit hours (the minimum course load for a full-time student for an academic year at traditional two- and four-year colleges) is $17,400 for all ITT Technical Institute
undergraduate residence programs, except as adjusted in some states to reflect applicable taxes and fees. Tuition for a student entering an undergraduate residence program at DWC in September 2009 for 24 semester credit hours (the minimum course load for a full-time student for an academic year at traditional two- and four-year colleges) is $27,940 for all DWC undergraduate residence programs. The tuition amounts discussed above do not reflect institutional scholarships and grants which
reduce the amount of tuition that students pay to attend our institutions. We typically adjust the tuition for our programs of study at least annually. The majority of students attending residence programs at our campuses lived in that campus’ metropolitan area prior to enrollment. The only student housing that we provide is at the Nashua, New Hampshire campus of Daniel Webster College.
Student Recruitment
We strive to attract students with the motivation and ability to complete the career-oriented educational programs offered by our campuses. To generate interest among potential students, we engage in a broad range of activities to inform potential students and their parents about
our campuses and the programs they offer. These activities include television, Internet and other media advertising, direct mailings and high school presentations. We employ approximately 1,700 full- and part-time recruiting representatives to assist in local recruiting efforts.
Local recruiting representatives of a campus pursue expressions of interest from potential students for our residence programs of study by contacting prospective students and arranging for interviews at the campus or any learning site of that campus. Occasionally, we also pursue
expressions of interest from students for our residence programs of study by contacting them and arranging for their attendance at a seminar providing information about the campus and its programs. We pursue expressions of interest from potential students for our online programs of study by providing program and resource information on our websites and through telephone calls, electronic mail and postal delivery.
Student recruitment activities are subject to substantial regulation at both the state and federal level and by our accrediting commissions. Most states have bonding and licensing requirements that apply to many of our representatives and other employees involved in student recruitment. Our
National Director of Recruitment and Regional Directors of Recruitment oversee the implementation of recruitment policies and procedures. In addition, our compliance department reviews student recruiting practices at each of our campuses on at least an annual basis.
Student Admission and Retention
We require all applicants for admission to any of our campus’ programs of study to have a high school diploma or a recognized equivalent. Depending on the program of study and the campus, applicants may also be required to:
|
· |
pass an admission examination; |
|
· |
possess a designated number of credit hours or degree with a specified overall cumulative grade point average from an accredited postsecondary educational institution; |
|
· |
complete the Scholastic Assessment Test or American College Testing examination; |
|
· |
tour the campus; and |
|
· |
submit a letter of recommendation and an essay. |
-5-
The following table sets forth our student demographics as of December 31, 2009:
|
Approximate Percent of Student Census | |||||||
|
Student Demographics |
December 31, 2009 |
December 31, 2008 | |||||
|
Age |
|||||||
|
19 or less |
8% |
13% | |||||
|
20 through 24 |
34% |
37% | |||||
|
25 through 30 |
28% |
26% | |||||
|
31 or over |
30% |
24% | |||||
|
Gender |
|||||||
|
Male |
75% |
76% | |||||
|
Female |
25% |
24% | |||||
|
Race |
|||||||
|
Caucasian |
49% |
51% | |||||
|
Other (1) |
51% |
49% | |||||
(1) Based on applicable federal classifications.
The faculty and staff at each of our campuses strive to help students overcome obstacles to the completion of their programs of study. As is the case in other postsecondary institutions, however, students often fail to complete their programs for a variety of personal, financial
or academic reasons. Student withdrawals prior to program completion not only affect the students, they also have a negative regulatory, financial and marketing effect on the campus. To minimize student withdrawals, each of our campuses devotes staff resources to assist and advise students regarding academic and financial matters. We encourage academic advising and tutoring in the case of students experiencing academic difficulties. We also offer assistance and advice
to students in our residence programs who are looking for part-time employment and housing.
Graduate Employment
We believe that the success of our graduates who begin their careers in fields involving their programs of study is critical to the ability of our campuses to continue to recruit students. We try to obtain data on the number of students employed following graduation. The
reliability of such data depends largely on information that students and employers report to us. Based on this information, we believe that approximately 77% of the Employable Graduates (as defined below) from programs of study at the ITT Technical Institutes during 2008 either obtained employment by April 30, 2009, or were already employed, in positions that required the direct or indirect use of skills taught in their programs of study. “Employable Graduates” are defined in
accordance with the graduate employment metrics that we are required to report by one of the accrediting commissions that accredits our institutions and include all of the graduates from the ITT Technical Institutes, except for those graduates who:
|
· |
have been admitted into other programs of study at postsecondary educational institutions that are scheduled to begin within one academic year following their graduation; |
|
· |
possessed visas that did not permit them to work in the United States following their graduation; |
|
· |
were personally suffering from a health condition that prevented them from working; |
|
· |
were actively engaged in U.S. military service; or |
|
· |
moved out of the Continental United States with a spouse or parent who was actively engaged in U.S. military service. |
-6-
Each of our campuses employs personnel to offer its students and graduates career services. These persons assist in job searches, solicit employment opportunities from employers and provide information on job search techniques, where to access employer information, writing resumes
and how to prepare for, appear at and conduct oneself during job interviews.
Based on information from graduates and employers who responded to our inquiries, the reported annualized salaries initially following graduation averaged approximately $32,800 for the Employable Graduates of programs of study at the ITT Technical Institutes who graduated in 2008 and obtained
employment by April 30, 2009, or were already employed, in positions that required the direct or indirect use of skills taught in their programs of study. The average annual salary initially following graduation for our Employable Graduates may vary significantly among the ITT Technical Institutes depending on local employment conditions and each Employable Graduate’s particular program of study, background, prior work experience and willingness to relocate. Initial employers of Employable
Graduates from programs of study at the ITT Technical Institutes include small, medium and large companies and governmental agencies.
Faculty
We hire faculty members in accordance with criteria established by us, the accrediting commissions that accredit our campuses and the state education authorities that regulate our campuses. We hire faculty with related work experience and/or academic credentials to teach most technical
subjects. Faculty members at each campus typically include the chairperson for each school or program of study and various categories of instructors, including full-time and adjunct.
Administration and Employees
Each of our campuses is managed by a person who has overall responsibility for the operation of the campus. The administrative staff of each campus also includes managers in the major functional areas of that campus, including recruitment, finance, registration, academics and career
services, among others. As of December 31, 2009, we had approximately 5,500 full-time and 4,300 part-time employees. None of our employees are represented by labor unions.
Our headquarters provides centralized services to all of our campuses in the following areas:
|
· accounting |
· legal |
|
· marketing
· public relations |
· regulatory
· legislative affairs |
|
· curricula development
· management information systems |
· real estate
· human resources |
|
· purchasing |
· compliance/internal audit |
In addition, national managers of each of the following major campus functions reside at our headquarters and develop policies and procedures to guide these functions at our campuses:
|
· recruiting |
· career services |
|
· financial aid
· academic affairs |
· learning resources
· registration |
Managers located at our headquarters monitor the operating results of each of our campuses and regularly conduct on-site reviews.
-7-
Competition
The postsecondary education market in the United States is highly fragmented and competitive, with no single private or public institution enjoying a significant market share. Our campuses compete for students with associate, bachelor and graduate degree-granting institutions, which
include public and nonprofit private colleges and for-profit institutions, as well as with alternatives to higher education such as military service or immediate employment. We believe competition among educational institutions is based on:
|
· |
the quality and reliability of the institution’s programs and student services; |
|
· |
the reputation of the institution and its programs and student services; |
|
· |
the type and cost of the institution’s programs; |
|
· |
the employability of the institution’s graduates; |
|
· |
the ability to provide easy and convenient access to the institution’s programs and courses; |
|
· |
the quality and experience of the institution’s faculty; and |
|
· |
the time required to complete the institution’s programs. |
Certain public and private colleges may offer programs similar to those offered by our campuses at a lower tuition cost due in part to government subsidies, foundation grants, tax deductible contributions, tax-exempt status or other financial resources not available to for-profit institutions. Other for-profit institutions offer
programs that compete with those offered by our campuses. Certain of our competitors in both the public and private sectors have greater financial and other resources than we do.
Federal and Other Financial Aid Programs
In 2009, approximately 70% of our revenue determined on a cash accounting basis under the “90/10 Rule” calculation was from the federal student financial aid programs under Title IV (the “Title IV Programs”) of the Higher Education Act of 1965, as amended (the “HEA”). See
“Risk Factors—Risks Related to Our Highly Regulated Industry – One or more of our campuses may lose its eligibility to participate in Title IV Programs, if the percentage of its revenue derived from those programs is too high” for a description of the 90/10 Rule. Our campuses’ students also rely on unaffiliated private loan programs, internal student financing
offered by us, family contributions, personal savings, employment, state financial aid programs, veterans’ and military benefits, scholarships and other resources to pay their educational expenses. The primary Title IV Programs from which the students at our campuses receive grants, loans and other aid to fund the cost of their education include:
|
· |
the Federal Family Education Loan (the “FFEL”) program, which represented, in aggregate, approximately 66% of our cash receipts in 2009; |
|
· |
the William D. Ford Federal Direct Loan (the “FDL”) program, which represented, in aggregate, approximately 1% of our cash receipts in 2009; and |
|
· |
the Federal Pell Grant (the “Pell”) program, which represented, in aggregate, approximately 18% of our cash receipts in 2009. |
Other sources of financial aid used by our students to help pay the cost of their education include:
|
· |
unaffiliated private loan programs, which represented, in aggregate, approximately 5% of our cash receipts in 2009; |
|
· |
employment, personal savings and family contributions, which represented, in aggregate, approximately 5% of our cash receipts in 2009; and |
|
· |
state financial aid programs, veterans’ and military benefits and other resources, which represented, in aggregate, approximately 5% of our cash receipts in 2009. |
-8-
The increased internal student financing and scholarships that we have provided over the past two years has and could continue to negatively impact our cash flows from operations, expose us to greater credit risk, and increase our bad debt expense and days sales outstanding.
On January 20, 2010, we entered into a guarantee agreement and related documents in connection with a new private education loan program for our students, the PEAKS Private Student Loan Program (the “PEAKS Program”). Under the PEAKS Program, an unaffiliated lender will make private education loans to eligible students
and, subsequently, sell those loans to a trust. The trust has issued senior debt in the aggregate principal amount of $300 million (“Senior Debt”) to investors. The assets of the trust (which include, among other assets, the student loans held by the trust) will serve as collateral for, and are intended to be the principal source of, the repayment of the Senior Debt. The Senior Debt bears interest at a variable rate based on the London Interbank Offered Rate (the “LIBOR”)
plus a margin and matures in January 2020.
In connection with the PEAKS Program, we will transfer to the trust a portion of the amount of each private student loan disbursed to us, in exchange for a subordinated note issued by the trust to us. The subordinated note does not bear interest, and principal is due following the repayment of the Senior Debt, the payment of fees
and expenses of the trust and the reimbursement of the amount of any payments made by us under the guarantee agreement. The trust will utilize the proceeds from the issuance of the Senior Debt and the subordinated note to purchase the student loans from the lender.
Under the guarantee agreement, we guarantee payment of principal, interest and certain call premiums on the Senior Debt, and administrative fees and expenses of the trust. The guarantee agreement contains, among other things, representations and warranties and events of default customary for guarantees. In addition,
under the PEAKS Program, some or all of the holders of the Senior Debt could require us to purchase their Senior Debt in certain limited circumstances that pertain to our continued eligibility to participate in the Title IV Programs. We believe that the likelihood of those limited circumstances occurring is remote. Our guarantee and purchase obligations under the PEAKS Program remain in effect until the Senior Debt and the trust’s fees and expenses are paid in full. At such
time, we will be entitled to repayment of the amount of any payments made under our guarantee and payment of the subordinated note, in each case only to the extent of available funds remaining in the trust. The maximum future payments that we could be required to make under the guarantee agreement are affected by various factors and, as a result, we are not able to estimate the undiscounted maximum potential future payments that we could be required to make under the PEAKS Program.
In February 2009, we entered into an agreement with an unaffiliated third party whereby private education loans are provided to our students to help the students pay the portion of the cost of their education that is not covered by student financial aid from federal, state and other sources (the “Private Student Loan Program”). The
Private Student Loan Program covers the three year period of 2009, 2010 and 2011. In connection with the Private Student Loan Program, we entered into a risk sharing agreement (the “2009 RSA”) under which we have guaranteed the repayment of any private education loans that are charged off above a certain percentage of the private education loans made under the Private Student Loan Program, based on the annual dollar volume. As of December 31, 2009, approximately $56 million of
private education loans had been made under the Private Student Loan Program. Our obligations under the 2009 RSA will remain in effect until all private education loans made under the Private Student Loan Program are paid in full or charged off. The standard repayment term for a private education loan made under the Private Student Loan Program is ten years, with repayment generally beginning six months after a student graduates or three months after a student withdraws or is terminated
from his or her program of study. We did not record a liability for our guarantee obligations under the 2009 RSA as of December 31, 2009, because we do not anticipate that the amount of private education loans charged off will exceed the percentage that would require us to make a payment under our guarantee.
Pursuant to the 2009 RSA, we are required to maintain collateral for our guarantee obligation in an amount equal to a percentage of the total private education loans disbursed to our students under the Private Student Loan Program. As of December 31, 2009, the total collateral maintained in a restricted bank account was not material. This
amount is included in Other assets on our Consolidated Balance Sheet as of December 31, 2009. The 2009 RSA also requires that we comply with certain covenants, including that we maintain certain financial ratios which are measured on a quarterly basis. We were in compliance with these covenants as of December 31, 2009.
We also are a party to a separate risk sharing agreement with a different lender for certain private education loans that were made to our students in 2007 and early 2008 (the “2007 RSA”). We guaranteed the repayment of any private education loans that the lender charges off above a certain percentage of the total dollar
volume of private education loans made under this agreement. We will have the right to pursue repayment from the borrowers for any private education loans under the 2007 RSA that are charged off and we pay to the lender pursuant to our guarantee obligation. The 2007 RSA was terminated effective February 22, 2008, such that no private education loans have been or will be made under the 2007 RSA after that date. Our obligations under the 2007 RSA will remain in effect until all
private education loans made under the agreement are paid in full or charged off.
-9-
The maximum future payments that we could be required to make pursuant to our guarantee obligation under the 2007 RSA are affected by various factors and, as a result, we are not able to estimate the undiscounted maximum potential future payments that we could be required to make under the 2007 RSA. Our recorded liability related
to the 2007 RSA as of December 31, 2009 was not material.
Highly Regulated Industry
We are subject to extensive regulation by the ED, the state education and professional licensing authorities (collectively, the “SAs”) and the accrediting commissions that accredit our campuses (the “ACs”). The statutes, regulations and standards applied by the ED,
SAs and ACs are periodically revised and the interpretations of existing requirements are periodically modified. We cannot predict with certainty how all of the statutes, regulations and standards applied by the ED, SAs and ACs will be interpreted and implemented.
At the federal level, the HEA and the regulations promulgated under the HEA by the ED set forth numerous, complex standards that institutions must satisfy in order to participate in Title IV Programs. To participate in Title IV Programs, an institution must:
|
· |
receive and maintain authorization by the appropriate SAs; |
|
· |
be accredited by an accrediting commission recognized by the ED; and |
|
· |
be certified as an eligible institution by the ED. |
The purposes of these standards are to:
|
· |
limit institutional dependence on Title IV Program funds; |
|
· |
prevent institutions with unacceptable student loan default rates from participating in Title IV Programs; and |
|
· |
in general, require institutions to satisfy certain criteria related to educational value, administrative capability and financial responsibility. |
Most of the ED’s requirements are applied on an institutional basis, with an institution defined by the ED as a main campus and its additional locations, if any. Twenty-nine of the 120 ITT Technical Institute campuses are main campuses and the remaining 91 of the ITT Technical Institute campuses are additional locations. Each
of the four learning sites of the ITT Technical Institutes is also an additional location under the ED’s regulations. DWC is a main campus under the ED’s regulations. The HEA requires each institution to periodically renew its certification by the ED to continue its participation in Title IV Programs. As of December 31, 2009, all 121 of our campuses and all four learning sites participated in Title IV Programs.
As of December 31, 2009, we operated one or more campuses in 38 states and our campuses recruited students in the remaining 12 states and the District of Columbia. Each of our campuses must be authorized by the applicable SAs to operate. The state laws and regulations
that we must comply with in order to obtain authorization from the SAs are numerous and complex. As of December 31, 2009, each of our campuses had received authorization from one or more SAs. In addition, some states require a campus to be in operation for a period of up to two years before that campus can be authorized to grant degrees. Campuses that confer bachelor or master degrees must, in most cases, meet additional regulatory standards. Raising the curricula of
our existing campuses to the bachelor and/or master degree level requires the approval of the applicable SAs and the ACs. State education laws and regulations affect our operations and may limit our ability to introduce degree programs or obtain authorization to operate in some states. If any one of our campuses lost its state authorization, the campus would be unable to offer postsecondary education and we would be forced to close the campus. Closing multiple campuses for any reason could
have a material adverse effect on our financial condition, results of operations and cash flows.
State authorization and accreditation by an accrediting commission recognized by the ED are required for an institution to become and remain eligible to participate in Title IV Programs. In addition, some states require institutions operating in the state to be accredited as a condition
of state authorization. All of the ITT Technical Institutes are accredited by the Accrediting Council for Independent Colleges and Schools (the “ACICS”). DWC is accredited by the Commission on Institutions of Higher Education of the New England Association of Schools and Colleges (the “NEASC”). Both the ACICS and the NEASC are accrediting commissions recognized by the ED. The HEA specifies a series of criteria that each recognized accrediting
commission must use in reviewing institutions. For example, accrediting commissions must assess the length of each academic program offered by an institution in relation to the objectives of the degrees or diplomas offered. Further, accrediting commissions must evaluate each institution's success with respect to student achievement.
-10-
During 2009, the ACICS evaluated 44 of the ITT Technical Institutes for initial grants of accreditation or the renewal of their current grants of accreditation. As of December 31, 2009, of those 44 ITT Technical Institutes, the ACICS had granted initial accreditation to ten ITT
Technical Institutes and reaccredited 34 ITT Technical Institutes. None of the ITT Technical Institutes are on probation with the ACICS, but five ITT Technical Institutes are subject to an outcomes review with respect to graduate placement and three ITT Technical Institutes are subject to an outcomes review with respect to student retention by the ACICS. Under the ACICS standards, an ITT Technical Institute that is subject to a financial or outcomes review must periodically report its results in those
areas to the ACICS and obtain permission from the ACICS prior to applying to add a new program of study or establish a branch campus or learning site. We do not believe that these limitations will have a material adverse effect on our expansion plans.
At the time we acquired DWC, it was subject to a notice of concern from the NEASC with respect to DWC’s financial condition. During 2009, the NEASC evaluated DWC in connection with its financial condition and its change of ownership and control resulting from our acquisition
of the college. In 2010, we will provide the NEASC with audited financial statements of DWC to establish DWC’s compliance with the NEASC standard for accreditation on financial resources.
The statutes, regulations and standards applied by the ED, SAs and ACs cover the vast majority of our operations, including our:
|
· |
academic affairs; |
|
· |
educational programs; |
|
· |
facilities; |
|
· |
academic and administrative staff; |
|
· |
administrative procedures; |
|
· |
marketing; |
|
· |
student recruitment; |
|
· |
compensation practices; and |
|
· |
financial operations and financial condition. |
These requirements also affect our ability to:
|
· |
add new campuses and learning sites; |
|
· |
add new, or revise or expand our existing, educational programs; and |
|
· |
change our corporate structure and ownership. |
Each of the campuses and learning sites that we added from 2007 through 2009 constitutes an additional location under the ED’s regulations, except for the DWC campus, which constitutes a main campus under the ED’s regulations. The HEA requires a for-profit institution to operate
for two years before it can qualify to participate in Title IV Programs. If an institution that is certified to participate in Title IV Programs establishes an additional location and receives all of the necessary SA and AC approvals for that location, that additional location can participate in Title IV Programs immediately upon being reported to the ED, unless the institution will offer at least 50% of an entire educational program at that location and any one of the following restrictions applies,
in which case the ED must approve the additional location before it can participate in Title IV Programs:
|
· |
the institution is provisionally certified to participate in Title IV Programs; |
|
· |
the institution receives Title IV Program funds under the ED’s reimbursement or cash monitoring payment method; |
|
· |
the institution acquired the assets of another institution that provided educational programs at that location during the preceding year and participated in Title IV Programs during that year; |
|
· |
the institution would be subject to loss of eligibility to participate in Title IV Programs, because the additional location lost its eligibility to participate in Title IV Programs as a result of high student loan cohort default rates under the FFEL and/or the FDL programs; or |
|
· |
the ED previously notified the institution that it must apply for approval to establish an additional location. |
-11-
The HEA and applicable regulations permit students to use Title IV Program funds only to pay the cost associated with enrollment in an eligible program offered by an institution participating in Title IV Programs. Generally, an institution that is eligible to participate in Title
IV Programs may add a new educational program without the ED’s approval, if that new program: (a) leads to an associate level or higher degree and the institution already offers programs at that level; or (b) prepares students for gainful employment in the same or a related occupation as an educational program that has previously been designated as an eligible program at the institution and meets minimum length requirements. Otherwise, the institution must obtain the ED’s approval before
it may disburse Title IV Program funds to students enrolled in the new program. If an institution erroneously determines that a new educational program is eligible for Title IV Program funding, the institution would likely be liable for repayment of the Title IV Program funds provided to students in that educational program. Based on our understanding of how the ED’s current regulations in this area will be applied, we do not believe that these limitations will have a material adverse
effect on our expansion plans.
The accreditation standards of our ACs generally permit an institution’s main campus to establish branch campuses, and both the institution’s main campus and branch campuses to establish learning sites or instructional locations. Our campuses that are treated as branch
campuses under the accreditation standards of our ACs are treated as additional locations of the main campus under the ED’s regulations. Any locations of one of our main or branch campuses that are located away from the main or branch campus are treated as learning sites of that main or branch campus under the ACICS accreditation standards and instructional locations of that main or branch campus under the NEASC accreditation standards, but the ED’s regulations treat each learning site
and instructional location as an additional location of the main campus.
The laws and regulations in most of the states in which our campuses are located treat each of our campuses as a separate, unaffiliated institution and do not distinguish between main campuses and additional locations or branch campuses, although many states recognize other locations within
the state where educational activities are conducted and/or student services are provided as learning sites, teaching sites, satellite campuses or otherwise. In some states, the requirements to obtain state authorization limit our ability to establish new campuses, add learning sites or instructional locations, offer new programs, recruit and offer online programs.
The HEA and its implementing regulations require each institution to periodically reapply to the ED for continued certification to participate in Title IV Programs. The ED recertifies each institution deemed to be in compliance with the HEA and the ED’s regulations for a period
of six years or less. Before that period ends, the institution must apply again for recertification. The current ED certifications of our institutions range from three years to six years and expire over the period from June 30, 2011 to September 30, 2015.
The ED may place an institution on provisional certification for a period of three years or less, if it finds that the institution does not fully satisfy all the eligibility and certification standards. If an institution successfully participates in Title IV Programs during its
period of provisional certification but fails to satisfy the full certification criteria, the ED may renew the institution’s provisional certification. The ED may revoke an institution’s provisional certification without advance notice, if the ED determines that the institution is not fulfilling all material requirements. If the ED revokes an institution’s provisional certification, the institution may not apply for reinstatement of its eligibility to participate in Title
IV Programs for at least 18 months. If the ED does not recertify the institution following the expiration of its provisional certification, the institution loses eligibility to participate in Title IV Programs until the institution reapplies to participate and the ED certifies the institution to participate. The ED may also more closely review an institution that is provisionally certified, if it applies for approval to operate a new location or offer a new program of study that requires
approval, or makes some other significant change affecting its eligibility. Provisional certification does not otherwise limit an institution’s access to Title IV Program funds. None of our ITT Technical Institute campus groups are provisionally certified to participate in Title IV Programs. DWC, however, is provisionally certified to participate in Title IV Programs, due to:
|
· |
DWC’s failure to satisfy the ED’s financial responsibility requirements prior to its acquisition by us; and |
|
· |
DWC’s change in ownership as a result of its acquisition by us. |
The internal audit function of our compliance department reviews our campuses’ compliance with Title IV Program requirements and conducts an annual compliance review of each of our campuses. The review addresses numerous compliance areas, including:
-12-
|
· |
student tuition refunds and return of Title IV Program funds; |
|
· |
student academic progress; |
|
· |
student admission; |
|
· |
graduate employment; |
|
· |
student attendance; |
|
· |
student financial aid applications; and |
|
· |
student financial aid awards and disbursements. |
Each of our campuses’ administration of Title IV Program funds must also be audited annually by an independent accounting firm, and the resulting audit report must be submitted to the ED for review.
Due to the highly regulated nature of the postsecondary education industry, we are subject to audits, reviews, inquiries, complaints, investigations, claims of non-compliance or lawsuits by federal and state governmental agencies, guaranty agencies, the ACs, present and former students and employees, shareholders and other third parties,
which may allege violations of statutes, regulations or accreditation standards or common law causes of action (collectively, “Claims”). If the results of any Claims are unfavorable to us, we may be required to pay money damages or be subject to fines, penalties, injunctions, operational limitations, loss of eligibility to participate in federal or state financial aid programs, debarments, additional oversight and reporting, other civil and criminal penalties or other censure that could
have a material adverse effect on our financial condition, results of operations and cash flows. Even if we satisfactorily resolve the issues raised by a Claim, we may have to expend significant financial and management resources, which could have a material adverse effect on our financial condition, results of operations and cash flows. Adverse publicity regarding a Claim could also negatively affect our business.
See "Risk Factors – Risks Related to Our Highly Regulated Industry" for a discussion of particular risks associated with our highly regulated industry.
Shareholder Information
We make the following materials available free of charge through our website at www.ittesi.com as soon as reasonably practicable after such materials are electronically filed with or furnished to the SEC under the Exchange Act:
|
· |
our annual reports on Form 10-K and all amendments thereto; |
|
· |
our quarterly reports on Form 10-Q and all amendments thereto; |
|
· |
our current reports on Form 8-K and all amendments thereto; and |
|
· |
various other filings that we make with the SEC. |
We also make the following materials available free of charge through our website at www.ittesi.com:
|
· |
our Corporate Governance Guidelines; |
|
· |
the charter for each of the Academic, Audit, Compensation, and Nominating and Corporate Governance Committees of our Board of Directors; and |
|
· |
our Code of Business Conduct and Ethics (“Code”). |
We will provide a copy of the following materials without charge to anyone who makes a written request to our Investor Relations Department at ITT Educational Services, Inc., 13000 North Meridian Street, Carmel, Indiana 46032-1404 or by e-mail through our website at www.ittesi.com:
-13-
|
· |
our annual report on Form 10-K for the year ended December 31, 2009, excluding certain of its exhibits; |
|
· |
our Corporate Governance Guidelines; |
|
· |
the charter for each of the Academic, Audit, Compensation, and Nominating and Corporate Governance Committees of our Board of Directors; and |
|
· |
the Code. |
We also intend to promptly disclose on our website at www.ittesi.com any amendments that we make to, or waivers for our Directors or executive officers that we grant from, the Code.
Item 1A. Risk Factors.
In addition to the other information contained in this report, you should consider carefully the following risk factors in evaluating us and our business before making an investment decision with respect to any shares of our common stock. This report contains certain statements that constitute “forward-looking
statements” within the meaning of Section 27A of the Securities Act and Section 21E of the Exchange Act. These forward-looking statements are based on the beliefs of, as well as assumptions made by and information currently available to, our management. All statements which are not statements of historical fact are intended to be forward-looking statements. The forward-looking statements contained in this report reflect our or our management’s current views and are subject to
certain risks, uncertainties and assumptions, including, but not limited to, those set forth in the following Risk Factors. Should one or more of those risks or uncertainties materialize or should underlying assumptions prove incorrect, our actual results, performance or achievements in 2010 and beyond could differ materially from those expressed in, or implied by, those forward-looking statements.
Risks Related to Our Highly Regulated Industry
Failure of our campuses to comply with the extensive regulatory requirements for school operations could result in financial penalties, restrictions on our operations, loss of federal and state financial aid funding for our
students or loss of our authorization to operate our campuses. To participate in Title IV Programs, an institution must receive and maintain authorization by the appropriate SAs, be accredited by an AC recognized by the ED and be certified as an eligible institution by the ED. As a result, our campuses are subject to extensive regulation by the ED, SAs and ACs, which cover the vast majority of our operations. The
ED, SAs and ACs periodically revise their requirements and modify their interpretations of existing requirements. We cannot predict with certainty how all of the requirements applied by these agencies will be interpreted or implemented or whether all of our campuses will be able to comply with all of the requirements in the future.
If our campuses failed to comply with any of these regulatory requirements, these agencies could:
|
· |
impose monetary fines or penalties on our campuses; |
|
· |
terminate or limit our campuses’ operations or ability to grant degrees; |
|
· |
restrict or revoke our campuses’ accreditation; |
|
· |
limit, terminate or suspend our campuses’ eligibility to participate in Title IV Programs or state financial aid programs; |
|
· |
require our campuses to repay funds received under Title IV Programs or state financial aid programs; |
|
· |
require us to post a letter of credit with the ED; |
|
· |
subject our campuses to heightened cash monitoring by the ED; |
|
· |
transfer our campuses from the ED’s advance system of receiving Title IV Program funds to its reimbursement system, under which a school must disburse its own funds to students and document the students’ eligibility for Title IV Program funds before receiving such funds from the ED; and |
|
· |
subject us or our campuses to other civil or criminal penalties. |
Each of these sanctions could adversely affect our financial condition, results of operations and cash flows and impose significant operating restrictions on us. If any of our campuses lost its state authorization, the campus would be unable to offer postsecondary education and we would be forced to close the campus. If
any of our campuses lost its accreditation, it would lose its eligibility to participate in Title IV Programs and, in some states, its ability to operate. If we could not arrange for alternative financing sources for the students attending a campus that lost its eligibility to participate in Title IV Programs, we could be forced to close that campus. Closing multiple campuses could have a material adverse effect on our financial condition, results of operations and cash flows. See
“Business – Highly Regulated Industry.”
The following are some of the specific risk factors related to our highly regulated industry:
-14-
Action by the U.S. Congress to revise the laws governing the federal student financial aid programs or reduce funding for those programs could reduce our student population and increase our costs of operation. Political
and budgetary concerns significantly affect Title IV Programs. The U.S. Congress enacted the HEA to be reauthorized on a periodic basis, which most recently occurred in August 2008. The 2008 reauthorization of the HEA, called the Higher Education Opportunity Act (“HEOA”), made significant changes to the requirements governing the Title IV Programs, including changes that, among other things:
|
· |
regulated non-federal, private education loans; |
|
· |
regulated the relationship between institutions and lenders that make education loans; |
|
· |
increased the annual maximum amount and availability of Pell grants; |
|
· |
increased the amount of financial aid available to active military personnel and family members; |
|
· |
revised the calculation of the student default rate on FFEL and FDL program loans attributed to an institution and the threshold rate at which sanctions will be imposed against an institution; |
|
· |
adjusted the types of revenue that an institution is deemed to have derived from Title IV Programs and the sanctions imposed on an institution that derives too much revenue from Title IV Programs; |
|
· |
increased the type and amount of information that an institution must disclose to current and prospective students and the public; and |
|
· |
increased the types of policies and practices that an institution must adopt and follow. |
Some of the changes to the requirements governing the Title IV Programs have and will increase our administrative burden, but we do not believe that the increased burden will have a material adverse effect on our operations. Many of the provisions of HEOA were effective upon enactment, even though, for the most part, the ED’s
final regulations related to those provisions have not yet become effective. If our efforts to comply with the provisions of HEOA are inconsistent with how the ED interprets the HEOA or implements its final regulations under the HEOA, or with other regulations, we may be found to be in noncompliance with those provisions and the ED could impose monetary penalties, place limitations on our operations, and/or condition or terminate our eligibility to participate in Title IV Programs.
In addition, the U.S. Congress can change the laws affecting Title IV Programs in the annual federal appropriations bills and other laws it enacts between the HEA reauthorizations. At this time, we cannot predict all of the changes that the U.S. Congress will ultimately make. Since a significant percentage of our revenue
is indirectly derived from Title IV Programs, any action by the U.S. Congress that significantly reduces Title IV Program funding or the ability of our campuses or students to participate in Title IV Programs could have a material adverse effect on our financial condition, results of operations and cash flows.
If one or more of our campuses lost its eligibility to participate in Title IV Programs, or if the U.S. Congress significantly reduced the amount of available Title IV Program funding, we would try to arrange or provide alternative sources of financial aid for the students at the affected campuses. We cannot assure you that one
or more private organizations would be willing to provide loans to students attending those campuses or that the interest rate and other terms of those loans would be as favorable as for Title IV Program loans. In addition, the private organizations could provide a discounted disbursement amount to us on the student loans and/or require us to guarantee all or part of this assistance on terms that are less favorable to us than our current disbursement arrangements and guarantee obligations, and we might
incur other additional costs. If we provided more direct financial assistance to our students, we would incur additional costs and assume increased credit risks.
Legislative action may also increase our administrative costs and burden and require us to modify our practices in order for our campuses to comply fully with the legislative requirements, which could have a material adverse effect on our financial condition and results of operations.
The current negotiated rulemaking by the ED could lead to significant revisions to the Title IV Program regulations that could increase our costs of operation. In
the fall of 2009, the ED initiated the process of negotiated rulemaking to make changes to certain provisions of the ED regulations governing the Title IV Programs. Negotiated rulemaking is a process whereby the ED consults with members of the higher education community to discuss issues and attempt to agree on regulatory revisions to address those issues before the ED formally proposes any regulations. Following the conclusion of the current negotiated rulemaking, the ED is expected to
issue proposed regulations for public comment. The ED is expected to publish new final regulations by November 1, 2010, in which case those regulations would take effect on July 1, 2011. As part of the negotiated rulemaking discussions, the ED has circulated a set of 14 draft regulations that, if promulgated as initially drafted, would make significant changes to certain of the current regulatory requirements, including:
-15-
|
· |
the potential elimination or curtailment of the “Safe Harbors” (defined below) for compensation of certain persons involved in student recruiting and other activities; |
|
· |
potential new requirements for an institution to demonstrate that its graduates obtain gainful employment, as measured against certain metrics, such as the median graduate’s student loan debt or the average starting salaries of workers whose highest level of education is a high school diploma; |
|
· |
the potential expansion of statements or omissions that constitute misrepresentation, the population protected by the regulation and the required disclosures to consumers; and |
|
· |
potential new requirements for an institution to take steps to determine if diplomas from certain high schools or other secondary schools are acceptable for purposes of the Title IV Programs. |
At this time, we cannot be certain that the ED will issue final regulations on each of these subjects, what requirements may be included in those final regulations or how any new requirements may affect the ability of our campus groups to remain eligible to participate in the Title IV Programs and comply with Title IV Program standards. In
addition, any future regulatory changes may increase our administrative costs and burden and require us to modify our practices in order for our campuses to comply fully with the new requirements, which could have a material adverse effect on our financial condition, results of operations and cash flows.
One or more of our campuses may lose its eligibility to participate in Title IV Programs, if its federal student loan cohort default rates are too high. Under
the HEA, an institution may lose its eligibility to participate in some or all Title IV Programs, if the rates at which the institution’s students default on their federal student loans exceed specified percentages. The ED calculates these rates for each institution on an annual basis, based on the number of students who have defaulted, not the dollar amount of such defaults. Each institution participating in the FFEL and/or the FDL programs receives a FFEL/FDL cohort default rate for each federal
fiscal year based on defaulted FFEL and FDL program loans. A federal fiscal year is October 1 through September 30. Currently, the ED calculates an institution’s annual cohort default rate as the rate at which borrowers scheduled to begin repayment on their loans in one federal fiscal year default on those loans by the end of the next federal fiscal year. Beginning with the calculation of institutions’ cohort default rates for the 2009 federal fiscal year, which are
expected to be calculated and published by the ED in 2012, the period for which students’ defaults will be included in an institution’s cohort default rate will be extended by one year, so that the formula will be the rate at which borrowers scheduled to begin repayment on their loans in one federal fiscal year default on those loans by the end of the second succeeding federal fiscal year. We believe that institutions’ FFEL/FDL cohort default rates will increase as a result of the
change in the formula, but we are unable to estimate with any degree of certainty the extent of the expected increase in the FFEL/FDL cohort default rates of our campus groups for future federal fiscal years when the new extended period to measure student defaults becomes effective, or whether any such increase will affect any of our campus groups’ participation in Title IV Programs.
Currently, an institution whose FFEL/FDL cohort default rate is:
|
· |
25% or greater for three consecutive federal fiscal years loses eligibility to participate in the FFEL, FDL and Pell programs for the remainder of the federal fiscal year in which the ED determines that the institution has lost its eligibility and for the two subsequent federal fiscal years; or |
|
· |
greater than 40% for one federal fiscal year loses eligibility to participate in the FFEL and FDL programs for the remainder of the federal fiscal year in which the ED determines that the institution has lost its eligibility and for the two subsequent federal fiscal years. |
Beginning with cohort default rates for federal fiscal year 2009 (which are expected to be published by the ED in 2012), the cohort default rate for three consecutive federal fiscal years that triggers loss of eligibility to participate in FFEL, FDL and Pell programs increases from 25% to 30%. An institution can appeal its loss
of eligibility due to high FFEL/FDL cohort default rates. During the pendency of any such appeal, the institution remains eligible to participate in the FFEL, FDL and Pell programs. If an institution continues its participation in the FFEL and/or FDL programs during the pendency of any such appeal and the appeal is unsuccessful, the institution must pay the ED the amount of interest, special allowance, reinsurance and any related payments paid by the ED (or which the ED is obligated to pay)
with respect to the FFEL and FDL program loans made to the institution’s students or their parents that would not have been made if the institution had not continued its participation (the “Direct Costs”). If a substantial number of our campus groups were subject to losing their eligibility to participate in the FFEL, FDL and Pell programs because of their FFEL/FDL cohort default rates, the potential amount of the Direct Costs for which we would be liable if our appeals were unsuccessful would
prevent us from continuing some or all of the affected campus groups’ participation in the FFEL and/or FDL programs during the pendency of those appeals, which could have a material adverse effect on our financial condition, results of operations and cash flows.
-16-
The following table sets forth the range of our campus groups’ FFEL/FDL cohort default rates for the federal fiscal years indicated:
|
Federal Fiscal Year |
FFEL/FDL Cohort
Default Rate Range | |||
|
2008 (a) |
3.6% to 15.5% | |||
|
2007 (b) |
2.7% to 15.2% | |||
|
2006 |
1.7% to 12.9% | |||
|
2005 |
1.3% to 12.6% | |||
|
(a) |
The most recent year for which the ED has issued FFEL/FDL preliminary cohort default rates. |
|
(b) |
The most recent year for which the ED has published FFEL/FDL official cohort default rates. |
If an institution’s FFEL/FDL official cohort default rate is 25% or greater in any of the three most recent federal fiscal years, the ED may place that institution on provisional certification status. The ED may more closely review an institution that is provisionally certified, if it applies for approval to open a new location
or offer a new program of study that requires approval, or makes some other significant change affecting its eligibility. Provisional certification does not otherwise limit an institution’s participation in Title IV Programs. See “Business – Highly Regulated Industry.”
Current and future economic conditions in the United States could also adversely affect our cohort default rates. Increases in interest rates, declines in individuals’ incomes, and job losses for our students and graduates or their parents have contributed to, and could continue to contribute to, higher default rates on student
loans.
The servicing and collection efforts of student loan lenders and guaranty agencies help to control our FFEL/FDL cohort default rates. We are not affiliated with any student loan lenders or guaranty agencies. We supplement their efforts by attempting to contact students to advise them of their responsibilities and any
deferment or forbearance for which they may qualify.
If any of our campus groups lost its eligibility to participate in FFEL, FDL and Pell programs and we could not arrange for alternative financing sources for the students attending the campuses in that campus group, we would probably have to close those campuses, which could have a material adverse effect on our financial condition, results
of operations and cash flows.
We may be required to post a letter of credit or accept other limitations in order to continue our campuses’ participation in Title IV Programs,
state authorization and accreditation, if we or our campuses do not meet the financial standards of the ED, SAs or ACs. The ED, SAs and ACs prescribe specific financial standards that an institution must satisfy to participate in Title IV Programs, operate in a state and be accredited. The ED evaluates institutions for compliance with its standards each year, based
on the institution’s annual audited financial statements, as well as following any change of control of the institution and when the institution is reviewed for recertification by the ED. The most significant financial responsibility measurement is the institution’s composite score, which is calculated by the ED based on three ratios:
|
· |
the equity ratio, which measures the institution’s capital resources, ability to borrow and financial viability; |
|
· |
the primary reserve ratio, which measures the institution’s ability to support current operations from expendable resources; and |
|
· |
the net income ratio, which measures the institution’s ability to operate at a profit. |
The ED assigns a strength factor to the results of each of these ratios on a scale from negative 1.0 to positive 3.0, with negative 1.0 reflecting financial weakness and positive 3.0 reflecting financial strength. The ED then assigns a weighting percentage to each ratio and adds the weighted scores for the three ratios together to produce a composite score for the institution. The composite score
must be at least 1.5 for the institution to be deemed financially responsible by the ED without the need for further oversight. Our campus groups’ composite score, based on our fiscal year consolidated financial statements at the parent company level, was 2.3 in 2009 and 2.5 in 2008. Our composite score in 2009 was lower than in 2008 primarily due to a lower equity ratio. In 2009, we repurchased approximately 3.5 million shares of our common stock for approximately $348.1
million compared to approximately 1.0 million shares of our common stock for approximately $87.8 million in 2008. Share repurchases have the accounting effect of reducing our shareholders’ equity, which results in a lower equity ratio. Therefore, the higher amount of share repurchases in 2009 contributed to the lower equity ratio in that year compared to 2008.
In evaluating an institution’s compliance with the financial responsibility standards, the ED may examine the financial statements of the individual institution, the institution’s parent company, or any party related to the institution. Historically, the ED has evaluated the financial
condition of our campuses on a consolidated basis based on our financial statements at the parent company level. If the ED determines that an institution does not satisfy the ED's financial responsibility standards, the institution may establish its financial responsibility on one of several alternative bases, including posting a letter of credit in an amount equal to a specified percentage of the total Title IV Program funds received by the institution during the institution's most recently completed
fiscal year and, in some cases, agreeing to receive Title IV Program funds under an arrangement other than the ED's standard advance funding arrangement while being provisionally certified and to be subject to certain additional reporting requirements. The requirement to post a letter of credit or other sanctions by the ED could increase our cost of regulatory compliance and adversely affect our results of operations and cash flows.
-17-
One or more of our campuses may have to post a letter of credit or be subject to other sanctions if it does not correctly calculate and return within the required time frame Title IV Program funds
for, or refund monies paid by or on behalf of, students who withdraw before completing their program of study. The HEA and its implementing regulations impose limits on the amount of Title IV Program funds withdrawing students can use to pay their education costs (the “Return Policy”). The Return Policy permits a student to use only a pro rata portion of the Title IV Program funds that the student would otherwise be eligible to use, if
the student withdraws during the first 60% of any period of enrollment. For the vast majority of our campuses, a period of enrollment is generally an academic quarter. The institution must calculate and return to the appropriate lenders or the ED any Title IV Program funds that the institution receives on behalf of a withdrawing student in excess of the amount the student can use for such period of enrollment. The institution must return those unearned funds in a timely manner which is generally within
45 days of the date the institution determined that the student had withdrawn. If the unearned funds are not properly calculated and timely returned, we may have to post a letter of credit in favor of the ED or be otherwise sanctioned by the ED. An institution is required to post a letter of credit with the ED in an amount equal to 25% of the total dollar amount of unearned Title IV Program funds that the institution was required to return with respect to withdrawn students during its most
recently completed fiscal year, if the institution is found in an audit or program review to have untimely returned unearned Title IV Program funds with respect to 5% or more of the students in the audit or program review sample of withdrawn students, in either of its two most recently completed fiscal years. No audit or review has found that any of our campuses was violating the ED’s standard on the timely return of unearned Title IV Program funds. The requirement to post a letter
of credit or other sanctions by the ED could increase our cost of regulatory compliance and adversely affect our results of operations.
The standards of most of the SAs and the ACs limit a student’s obligation to an institution for tuition and fees, if a student withdraws from the institution (the “Refund Policies”). The specific standards vary among the SAs. Depending on when during an academic quarter a student withdraws and the applicable
Refund Policies, in many instances the student remains obligated to the campus for some or all of the student’s education costs that were paid by the Title IV Program funds returned under the Return Policy. In these instances, many withdrawing students are unable to pay all of their education costs, unless the students have access to other sources of financial aid. Qualified students may be able to obtain private education loans that can help replace any Title IV Program funds that
are returned if any of those students withdraw, but it is unlikely that all of our affected students would be able to qualify for these types of loans. If these types of loans were unavailable, we could be unable to collect a significant portion of many withdrawing students’ education costs that would have been paid by the Title IV Program funds that were returned, which, in the aggregate, could have a material adverse effect on our results of operations and cash flows.
One or more of our campuses may lose its eligibility to participate in Title IV Programs, if the percentage of its revenue derived from those programs is too high. Under
a provision of the HEA commonly referred to as the “90/10 Rule,” a for-profit institution may be sanctioned if, on a cash accounting basis, the institution derives more than 90% of its applicable revenue in a fiscal year from Title IV Programs. If an institution exceeds the 90% threshold for any single fiscal year, the ED would place that institution on provisional certification status for the institution’s following two fiscal years, unless the institution’s participation in
Title IV Programs ends sooner. In addition, if an institution exceeds the 90% threshold for two consecutive fiscal years, it would be ineligible to participate in Title IV Programs as of the first day of the following fiscal year and would be unable to apply to regain its eligibility until the end of the second subsequent fiscal year. Furthermore, if one of our institutions exceeded the 90% threshold for two consecutive fiscal years and became ineligible to participate in Title IV Programs but continued to disburse
Title IV Program funds, the ED would require the institution to repay, with limited exceptions, all Title IV Program funds disbursed by the institution after the effective date of the loss of eligibility.
For our 2009 fiscal year, none of our campus groups derived more than 74% of its applicable revenue on a cash accounting basis from Title IV Programs under the 90/10 Rule calculation. Recent changes in federal law that increased Title IV Program grant and loan limits (and any additional increases in the future) may result in an
increase in the percentage of revenue that we indirectly derive from Title IV Programs, which could make it more difficult for us to satisfy the 90/10 Rule. Any such effects, however, may be mitigated by other provisions of the HEOA that allow institutions, when calculating their compliance with this revenue test, to include more revenue derived from non-Title IV Programs and, for the period ending in July 2011, to exclude from their revenue derived from Title IV Programs certain additional federal
student loan amounts that became available to students starting in July 2008.
We regularly monitor compliance with the 90/10 Rule to minimize the risk that any of our campus groups would derive more than the maximum allowable percentage of its applicable revenue from Title IV Programs for any fiscal year. If a campus group appeared likely to approach the maximum percentage threshold, we would consider making
changes in student financing to comply with the 90/10 Rule, but we cannot assure you that we would be able to do this in a timely manner or at all. If any of our campus groups lost its eligibility to participate in Title IV Programs and we could not arrange for alternative financing sources for the students attending the campuses in that campus group, we would probably have to close those campuses, which could have a material adverse effect on our financial condition, results of operations and cash flows.
-18-
Failure by one or more of our campus groups to satisfy the ED’s administrative capability requirements could result in financial penalties, limitations on the campus group’s participation in Title IV Programs,
or loss of the campus group’s eligibility to participate in Title IV Programs. To participate in Title IV Programs, an institution must satisfy criteria of administrative capability prescribed by the ED. These criteria include requirements that the institution:
|
· |
demonstrate a reasonable relationship between the length of its programs and the entry-level job requirements of the relevant fields of employment; |
|
· |
comply with all of the applicable Title IV Program regulations prescribed by the ED; |
|
· |
have capable and sufficient personnel to administer the institution’s participation in Title IV Programs; |
|
· |
define and measure the satisfactory academic progress of its students within parameters specified by the ED; |
|
· |
provide adequate financial aid counseling to its students who receive Title IV Program funds; and |
|
· |
timely submit all required reports and financial statements to the ED. |
If the ED determines that an institution is not capable of adequately administering its participation in any of the Title IV Programs, the ED could:
|
· |
impose monetary fines or penalties on the institution; |
|
· |
require the institution to repay funds received under Title IV Programs; |
|
· |
transfer the institution from the advance method of payment of Title IV Program funds to heightened cash monitoring status or the reimbursement system of payment; or |
|
· |
limit or terminate the institution’s eligibility to participate in Title IV Programs. |
Each of these sanctions could adversely affect our financial condition, results of operations and cash flows and impose significant operating restrictions on us. In addition, an institution is currently deemed by the ED to lack administrative capability if its FFEL/FDL cohort default rate equals or exceeds 25% for any of the three
most recent federal fiscal years for which such rates have been published. On and after 2014, an institution is deemed by the ED to lack administrative capability if its FFEL/FDL cohort default rate equals or exceeds 30% for at least two of the three most recent federal fiscal years for which such rates have been published. If an institution’s administrative capability is impaired solely because its FFEL/FDL cohort default rates equal or exceed the applicable percentage, the institution
can continue to participate in Title IV Programs, but the ED may place the institution on provisional certification.
We are subject to sanctions if we pay impermissible commissions, bonuses or other incentive payments to individuals involved in certain recruiting, admission or financial aid activities. An
institution participating in Title IV Programs may not provide any commission, bonus or other incentive payment based directly or indirectly on success in securing enrollments or financial aid to any person or entity engaged in any student recruitment or admission activity or in making decisions regarding the awarding of Title IV Program funds. The ED’s regulations set forth 12 types of activities and payment arrangements that an institution may carry out without violating this HEA provision
(the “Safe Harbors”). One of the Safe Harbors permits the payment of fixed compensation, such as a fixed annual salary or hourly wage, so long as the fixed compensation is not adjusted up or down more than twice during any 12-month period, and any adjustment to the fixed compensation is not based solely on the number of students recruited, admitted, enrolled or awarded financial aid. We believe that we have compensated the applicable employees in accordance with this Safe Harbor
and other Safe Harbors, but the law and regulations governing this requirement do not establish clear criteria for compliance in all circumstances, and the ED has stated that it will no longer entertain a request by an institution for the ED to review and assess its individual compensation plan. In addition, in late 2009, the ED initiated a round of negotiated rulemaking which, among other things, is likely to result in the modification or elimination of some or all of the Safe Harbors effective no
earlier than July 1, 2011. If the ED determined that an institution’s compensation practices violated these standards, the ED could subject the institution to monetary fines or penalties or other sanctions. Any substantial fine or penalty or other sanction could have a material adverse effect on our financial condition, results of operations and cash flows.
We cannot operate new campuses, add learning sites or offer new programs, if they are not timely authorized by our regulators, and we may have to repay Title IV Program funds disbursed to students enrolled at any of those locations or in any of those programs, if we do not
obtain prior authorization. Our expansion plans assume that we will be able to continue to obtain the necessary authorization from the ED, ACs and SAs to establish new campuses, add learning sites to our existing campuses and expand the program offerings at our existing campuses in a timely manner. If we are unable to obtain the authorizations from the ED, ACs or SAs for any new campuses, learning sites or program offerings where such authorizations are required, or to obtain such
authorizations in a timely manner, our ability to operate the new campuses, add the learning sites or offer the new programs as planned would be impaired, which could have a material adverse effect on our expansion plans.
-19-
The process of obtaining any required SA and ACs authorizations can also delay our operating new campuses, adding learning sites or offering new programs. In certain circumstances, the state laws and regulations in effect in the states where we are located or anticipate establishing
a new location or the ACs standards may limit our ability to establish new campuses and learning sites and expand the programs offered at a campus, which could have a material adverse effect on our expansion plans.
In addition, an institution that is eligible to participate in Title IV Programs may add a new location or program without the ED's approval only if certain requirements are met. Otherwise, the institution must obtain the ED's approval before it may disburse Title IV Program funds
to students in the new location or program. If we were to erroneously determine that a new location or program is eligible for Title IV Program funding, we would likely be liable for repayment of the Title IV Program funds provided to students in that location or program. See "Business – Highly Regulated Industry."
If regulators do not timely approve a change in control of us or any of our campuses, the ability of the affected campuses to participate in Title IV Programs or operate may be impaired. The
ED, the ACs and most of the SAs have requirements pertaining to the change in ownership and/or control (collectively "change in control") of institutions, but these requirements do not uniformly define what constitutes a change in control and are subject to varying interpretations as to whether a particular transaction constitutes a change in control. If we or any of our campuses experience a change in control under the standards of the ED, either of the ACs or any of the SAs, we or the affected campuses must
seek the approval of the relevant regulatory agencies. Transactions or events that constitute a change in control for one or more of our regulatory agencies include:
|
· |
the acquisition of a school from another entity; |
|
· |
significant acquisitions or dispositions of our common stock; and |
|
· |
significant changes to the composition of our, or any campus, Board of Directors. |
Some of these transactions or events may be beyond our control. Our failure to obtain, or a delay in obtaining, a required approval of any change in control from the ED, either of the ACs or any of the SAs in states in which our campuses are located could impair our ability or the ability of the affected campuses to participate
in Title IV Programs. Our failure to obtain, or a delay in obtaining, a required approval of any change in control from the SA in any state in which we do not have a campus but in which we recruit students could require us to suspend our recruitment of students in that state until we receive the required approval. A material adverse effect on our financial condition, results of operations and cash flows would result if we had a change in control and a material number of our campuses:
|
· |
failed to timely obtain the approvals of the SAs required prior to or following a change in control; |
|
· |
failed to timely regain accreditation by the ACs or have their accreditation temporarily continued or reinstated by the ACs; |
|
· |
failed to timely regain eligibility to participate in Title IV Programs from the ED or receive temporary certification to continue to participate in Title IV Programs pending further review by the ED; or |
|
· |
were subjected by the ED to restrictions that severely limited for a substantial period of time the number of new additional locations and/or new programs of study that are eligible to participate in Title IV Programs. |
In addition, the fact that a change in control would require approval of the relevant regulatory agencies could have the effect of making it more difficult for a third party to acquire, or discouraging a third party from attempting to acquire, control of us.
Government and regulatory agencies and third parties may bring claims or actions against us based on alleged violations of the extensive regulatory requirements applicable to our campuses, which could require
us to pay monetary damages, receive other sanctions and expend significant resources to defend those claims or actions. Due to the highly regulated nature of the postsecondary education industry, we are subject to claims of non-compliance with regulatory standards and other actions brought by our regulatory agencies, students, shareholders and other parties. If the results of any of those claims are unfavorable to us, we may be required
to pay money damages or be subject to fines, penalties, injunctions, operational limitations, loss of eligibility to participate in federal or state financial aid programs, debarments, additional oversight and reporting, or other civil and criminal sanctions. Those sanctions could have a material adverse effect on our financial condition, results of operations and cash flows. Even if we satisfactorily resolve the issues raised by those types of claims, we may have to divert significant financial
and management resources from our ongoing business operations to address and defend those claims, which could have a material adverse effect on our financial condition, results of operations and cash flows. Adverse publicity regarding any of those claims could also negatively affect our business and the market price of our common stock. See “Business – Highly Regulated Industry.”
-20-
Investigations, claims and actions against companies in our industry could adversely affect our business and stock price. The operations of a number
of companies in the postsecondary education industry have been subject to intense regulatory scrutiny. In some cases, allegations of wrongdoing have resulted in reviews or investigations by the U.S. Department of Justice (the “DOJ”), SEC, ED, SAs or other state agencies. These allegations, reviews, investigations and enforcement actions and the accompanying adverse publicity could have a negative impact on our industry as a whole and on the market price of our common stock.
Budget constraints in states that provide state financial aid to our students could reduce the amount of such financial aid that is available to our students, which could reduce our student population. Some
states may provide financial aid to our students, such as California, Florida, Pennsylvania and New York. From time to time, states face budget constraints that cause them to reduce state appropriations in a number of areas. Some of those states have decided or may decide in the future to reduce the amount of state financial aid that they provide to students, but we cannot predict how significant any of those reductions may be or how long they could last. If the level of state
funding for our students decreased and our students were not able to secure alternative sources of funding, our student population could decrease, which could have a material adverse effect on our results of operations.
If the graduates of some of our programs are unable to obtain licensure in their chosen professional fields of study, the enrollment in and the revenue derived from those programs could decrease and claims could be made against
us that could be costly to defend. Future graduates of certain of our programs of study will seek professional licensure in their chosen field following graduation. Their success in obtaining licensure depends on several factors, including:
|
· |
the merits of the individual student; and |
|
· |
whether the campus and the program were authorized by the appropriate SAs and/or approved by an accrediting commission and/or professional association. |
Certain SAs have refused to license students who graduate from programs that do not meet specific types of accreditation, residency or other state requirements. In the event that one or more SAs refuses to recognize our graduates for professional licensure in the future based on factors relating to our campuses or their programs, student enrollment
in those programs would be negatively impacted which could have an adverse effect on our results of operations. In addition, we could be exposed to claims that would force us to incur legal and other expenses that could have a material adverse effect on our results of operations.
Risks Related to Our Business
If we fail to effectively identify, establish and operate new campuses and learning sites, our growth may be slowed. As part of our business strategy,
we anticipate operating new campuses and adding learning sites to existing campuses at locations throughout the United States. Establishing new campuses and learning sites poses challenges and requires us to make investments in management and capital expenditures, incur marketing and advertising expenses and devote other resources that are different, and in some cases greater, than those required with respect to the operation of existing campuses. To operate a new campus or add a learning
site, we would be required to obtain the appropriate authorizations from the applicable SAs and ACs, which may be conditioned or delayed in a manner that could significantly affect our growth plans. In addition, to be eligible to participate in Title IV Programs, a new campus or learning site must be certified by the ED, either before or after it starts disbursing Title IV Program funds to its students. We cannot be sure that we will be able to identify suitable expansion opportunities to
help maintain or accelerate our current growth rate or that we will be able to successfully integrate or profitably operate any new campuses or learning sites. Any failure by us to effectively identify, establish and manage the operations of newly established campuses or learning sites could slow our growth, make any newly established campuses or learning sites more costly to operate than we had planned and have a material adverse effect on our expansion plans and results of operations. See
“Business – Business Strategy – Geographically Expand Our Campuses and Learning Sites.”
-21-
Our success depends, in part, on our ability to effectively identify, develop, obtain approval to offer and teach new programs at different levels in a cost-effective and timely manner. Part
of our business strategy also includes increasing the number and level of programs offered at our campuses. Developing and offering new programs pose challenges and require us to make investments in research and development, management and capital expenditures, to incur marketing and advertising expenses and to devote other resources that are in addition to, and in some cases greater than, those associated with our current program offerings. In order to offer new programs at different levels
at our campuses, we may be required to obtain the appropriate authorizations from the ED, SAs, ACs and, in certain circumstances, specialized programmatic accrediting commissions, which may be conditioned or delayed in a manner that could affect the programs offered at our campuses. We cannot be sure that we will be able to identify new programs to help maintain or accelerate our current growth rate, that we will be able to obtain the requisite authorizations to offer new programs at different levels
at our campuses or that students will enroll in any new programs that we offer at our campuses. Any failure by us to effectively identify, develop, obtain authorization to offer and teach new programs at our campuses could have a material adverse effect on our expansion plans and results of operations. See “Business – Business Strategy – Enhance Results at
the Campus Level.”
Our success depends, in part, on our ability to keep pace with changing market needs and technology. Increasingly, prospective employers of our graduates demand that their entry-level employees possess appropriate
technical skills and also appropriate soft skills, such as communication, critical thinking and teamwork skills. The skills that employees need may evolve rapidly in a changing economic and technological environment. Accordingly, it is important for our programs to evolve in response to those economic and technological changes. The expansion of our existing programs and the development of new programs may not be accepted by prospective students or the employers of our graduates. Even
if we are able to develop acceptable new programs, we may not be able to begin offering those new programs as quickly as required by the employers we serve or as quickly as our competitors offer similar programs. If we are unable to adequately respond to changes in market requirements due to regulatory or financial constraints, technological changes or other factors, our ability to attract and retain students could be impaired and the rates at which our graduates obtain jobs involving their fields
of study could suffer.
Our financial performance depends, in part, on our ability to continue to develop awareness and acceptance of our programs among working adults and recent high school graduates. The awareness of our
programs among working adults and recent high school graduates is important to the success of our campuses. If we were unable to successfully market or advertise our programs, our ability to attract and enroll prospective students in our programs would be adversely affected and, consequently, our ability to increase revenue or maintain profitability would be impaired. The following are some of the factors that could prevent us from successfully marketing or advertising our programs:
|
· |
student dissatisfaction with our programs and services; |
|
· |
employer dissatisfaction with our programs and services; |
|
· |
high costs of certain types of advertising media; |
|
· |
adverse publicity regarding us, our competitors or proprietary education generally; |
|
· |
our failure to maintain or expand our brands or other factors related to our marketing or advertising practices; and |
|
· |
diminished access to students during their attendance in high schools. |
If the lenders who provide private education loans to our students were to end or reduce their programs and we were unable to timely identify alternative lenders for our students, our students’ ability to finance their education could be adversely affected, our receivables
could increase and our student population could decrease. In 2009, we derived approximately 5% of our cash receipts from unaffiliated, private education loan programs that were made available to eligible students at our campuses to help fund a portion of the students’ cost of education. The vast majority of these private education loan programs were offered by two lenders. Adverse market conditions for consumer loans and student loans, including lenders’ difficulties
in reselling or syndicating student loan portfolios, have resulted and could continue to result in providers of private education loans reducing the availability of, or increasing the costs associated with, providing those loans to students. In particular, private education loans to students with low credit scores have become increasingly difficult to obtain. Prospective and current students may find that these increased financing costs make borrowing too expensive and cause them to abandon
or delay their education. If any of these scenarios were to occur, our students’ ability to finance their education could be adversely affected and our student population could decrease, which could have a material adverse effect on our results of operations and cash flows.
We continue to seek arrangements with other unaffiliated lenders for them to provide private loans to our qualified students. The loan underwriting standards can vary significantly among lenders, which could adversely affect the ability of some of our students to obtain private education loans. If those lenders ended
their private education loan programs or reduced the volume of loans made under the programs and we were unable to timely identify other lenders to make private education loans to our students and their parents on similar terms, our students’ ability to finance their education could be adversely affected, our receivables could increase and our student population could decrease, which could have a material adverse effect on our financial condition, results of operations and cash flows.
-22-
If we experience losses in excess of the amounts that we have reserved with respect to the significant amount of internal student financing that we have provided to our students, it could have a material adverse effect on our financial condition, results of operations and
cash flows. We offer a variety of payment plans to help students pay the portion of their cost of education that is not covered by financial aid or other funds. These balances are unsecured and not typically guaranteed. These balances have increased as a result of the number of our students who do not qualify for private education loans from third parties due to their prior credit history and the limited funding available under private education loan programs for which those students could qualify. These
balances could become more significant in the future. Increases in internal student financing adversely affect our cash flows and expose us to greater credit risk. Although we have reserved for estimated losses related to unpaid student balances, losses in excess of the amount we have reserved for bad debts could have a material adverse effect on our financial condition and results of operations.
High interest rates and tightening of the credit markets could adversely affect our ability to attract and retain students and could increase our risk exposure. Since much of the financing our students receive is tied to floating interest rates, higher
interest rates cause a corresponding increase in the cost to our existing and prospective students of financing their education, which could result in a reduction in the number of students attending our campuses and in our revenue. Higher interest rates could also contribute to higher default rates with respect to our students’ repayment of Title IV Program and private education loans. High default rates may, in turn, adversely impact our eligibility to participate in Title IV Programs,
trigger our guarantee obligations with respect to private education loan programs and/or negatively affect the willingness of private lenders to make private education loan programs available to our students, which could result in a reduction in the number of students attending our campuses and could have a material adverse effect on our financial condition, results of operations and cash flows.
In addition, tighter credit markets have caused lenders to alter the terms of private education loans that they offer in ways that are not beneficial to our student and parent borrowers, such as:
|
· |
changing the terms and pricing of their private education loans in ways that are less favorable to borrowers; |
|
· |
reducing or eliminating borrower benefits on private education loans; and |
|
· |
becoming more selective in originating private education loans, which could adversely impact the ability of borrowers with little or poor credit history to borrow the necessary funds to pay their cost of education. |
As a result of those adverse effects on our students’ ability to finance their cost of education, our receivables could increase and/or our student population could decrease, which could have a material adverse effect on our financial condition, results of operations and cash flows. Further, a tighter credit market could cause
other lenders to seek contractual terms from us related to private education loans that increase our exposure to credit risk.
If the charge-off rate on private education loans under programs where we have a guarantee obligation is higher than we anticipate, or if the charge offs occur earlier in the life of those loans, our guarantee obligations related to those loans may have a material adverse
effect on us. We have entered into risk sharing and guarantee agreements (collectively, “RSAs”) with unaffiliated entities related to private education loans that have been or will be provided to our students to help pay the students’ cost of education that student financial aid from federal, state and other sources does not cover. Under two of the RSAs, we guarantee the repayment of any private education loans that are charged off above a certain percentage of the
private education loans made under that RSA or related program, based on dollar volume. Under the third RSA, we guarantee the payment of principal, interest and certain call premiums on $300 million principal amount of senior debt obligations of, and administrative fees and expenses of, an unaffiliated trust that holds the private education loans made under the PEAKS Program. Our obligations under each of the RSAs will remain in effect until all private education loans made under that RSA or related
program or the senior debt obligation, as applicable, are paid in full or charged off. The maximum potential future payments that we could be required to make pursuant to our guarantee obligations under the RSAs are affected by various factors. See Notes 13 and 14 of the Notes to Consolidated Financial Statements.
As a result, we are not able to estimate the maximum potential future payments that we could be required to make under the RSAs. Based on the prior repayment history of our students with respect to private education loans, we do not believe that our guarantee obligations under the RSAs will have a material adverse effect on us. If,
however, the charge-off rate on the loans that are subject to the RSAs is higher than we anticipate, or if the charge offs occur earlier in the life of those loans, we could be required to pay material amounts under our guarantee obligations, which could have a material adverse effect on our financial condition, results of operations and cash flows.
Our loss of key personnel could harm our business. Our success to date has depended, and will continue to depend, largely on the skills, efforts and motivation of our executive officers. Our
success also depends in large part on our ability to attract and retain highly qualified faculty, school administrators and corporate management. We face competition in the attraction and retention of personnel who possess the skill sets that we seek. In addition, key personnel may leave us and subsequently compete against us. Furthermore, we do not currently carry “key man” life insurance. The loss of the services of any of our key personnel, or our failure
to attract and retain other qualified and experienced personnel on acceptable terms, could impair our ability to successfully manage our business.
-23-
In order to support revenue growth, we need to hire, retain, develop and train employees who are responsible for student recruiting, financial aid, registration, teaching and career services. Our ability to develop a strong team of employees with these responsibilities may be affected
by a number of factors, including:
|
· |
our ability to timely and effectively train and motivate our employees in order for them to become productive; |
|
· |
restrictions imposed by regulatory bodies on the method of compensating employees with certain of these responsibilities; |
|
· |
our ability to attract enough prospective students to our program offerings; and |
|
· |
our ability to effectively manage a multi-institutional and multi-location educational organization. |
If we are unable to hire, retain, develop and train employees who are responsible for student recruiting, financial aid, registration, teaching and career services, our operations would be adversely affected.
Competition could decrease our market share, cause us to reduce tuition or force us to increase spending. The postsecondary education market in the
United States is highly fragmented and competitive, with no single private or public institution enjoying a significant market share. Our campuses compete for students with degree- and nondegree-granting institutions, which include public and private nonprofit colleges and for-profit institutions, as well as with alternatives to higher education, such as military service or immediate employment. We believe competition among educational institutions is based on the:
|
· |
quality and reliability of the institution’s programs and student services; |
|
· |
reputation of the institution and its programs and student services; |
|
· |
type and cost of the institution’s programs; |
|
· |
employability of the institution’s graduates; |
|
· |
ability to provide easy and convenient access to the institution’s programs and courses; |
|
· |
value derived by students from the institution’s programs; |
|
· |
quality and experience of the institution’s faculty; and |
|
· |
time required to complete the institution’s programs. |
Certain public and private colleges offer programs similar to those offered by our campuses at a lower tuition cost due in part to government subsidies, foundation grants, tax deductible contributions or other financial resources not available to for-profit institutions. Other for-profit institutions offer programs that compete with those
of our campuses. Certain of our competitors in both the public and private sectors have greater financial and other resources than we do. All of these factors could affect the success of our marketing efforts and enable our competitors to recruit prospective students more effectively.
We may be required to reduce tuition or increase spending in response to competition in order to retain or attract students or pursue new market opportunities. As a result, our financial condition, results of operations and cash flows may be negatively affected. We cannot
be sure that we will be able to compete successfully against current or future competitors or that competitive pressures faced by us will not adversely affect our business, financial condition, results of operations or cash flows.
Our quarterly results of operations are likely to fluctuate based on our seasonal student enrollment patterns. In reviewing our results of operations, you should
not focus on quarter-to-quarter comparisons. Our results in any quarter may not indicate the results we may achieve in any subsequent quarter or for the full year. Our quarterly results of operations have tended to fluctuate as a result of seasonal variations in our business, principally due to changes in our total student population. Our student population varies as a result of new student enrollments, graduations and student attrition. Historically, our revenue in
our third and fourth fiscal quarters has generally benefited from increased student matriculations. The number of new students entering our campuses is typically higher in September. Our campuses’ academic schedule generally does not affect our incurrence of most of our costs, however, and our costs do not fluctuate significantly on a quarterly basis. We believe that quarterly fluctuations in results of operations should continue as a result of seasonal enrollment patterns. These
patterns may change, however, as a result of increased enrollment of adult students. See “Management’s Discussion and Analysis of Financial Condition and Results of Operations – Variations in Quarterly Results of Operations.”
We may be unable to successfully complete or integrate future school acquisitions. We may consider selective acquisitions of other schools in the future. We may not be able to complete any acquisitions
on favorable terms or, even if we do, we may not be able to successfully integrate the acquired businesses into our business. Integration challenges include, among others:
-24-
|
· |
regulatory approvals; |
|
· |
significant capital expenditures; |
|
· |
assumption of known and unknown liabilities; |
|
· |
our ability to control costs; and |
|
· |
our ability to integrate new personnel. |
The successful integration of future acquisitions may also require substantial attention from our senior management and the senior management of the acquired business, which could decrease the time that they devote to the day-to-day management of our business. If we do not successfully address risks and challenges associated with acquisitions,
including integration, future acquisitions could harm, rather than enhance, our operating performance.
In addition, if we consummate an acquisition, our capitalization and results of operations may change significantly. A future acquisition could result in:
|
· |
the incurrence of debt and contingent liabilities; |
|
· |
an increase in interest expense, amortization expenses, goodwill and other intangible assets; |
|
· |
charges relating to integration costs; and |
|
· |
an increase in the number of shares outstanding. |
These results could have a material adverse effect on our results of operations or financial condition or result in dilution to current stockholders.
Terrorist attacks and other acts of violence or war could have an adverse effect on our operations. Terrorist attacks and other acts of violence or
war could disrupt our operations. Attacks or armed conflicts that directly impact our physical facilities or ability to recruit and retain students and employees could adversely affect our ability to deliver our programs of study to our students and, thereby, impair our ability to achieve our financial and operational goals. Furthermore, violent acts and threats of future attacks could adversely affect the U.S. and world economies. Finally, future terrorist acts could cause the
United States to enter into a wider armed conflict that could further impact our operations and result in prospective students, as well as our current students and employees, entering military service. These factors could cause significant declines in the number of students who attend our campuses and have a material adverse effect on our results of operations.
Natural disasters and other acts of God could have an adverse effect on our operations. Hurricanes, earthquakes, floods, tornados and other natural disasters and acts of God could disrupt our operations. Natural
disasters and other acts of God that directly impact our physical facilities or ability to recruit and retain students and employees could adversely affect our ability to deliver our programs of study to our students and, thereby, impair our ability to achieve our financial and operational goals. Furthermore, natural disasters could adversely affect the economy and demographics of the affected region, which could cause significant declines in the number of students who attend our campuses in that region
and have a material adverse effect on our results of operations.
Anti-takeover provisions in our charter documents and under Delaware law could make an acquisition of us more difficult. Certain provisions of Delaware
law, our Restated Certificate of Incorporation and our By-Laws could have the effect of making it more difficult for a third party to acquire, or discouraging a third party from attempting to acquire, control of us. Those provisions could:
|
· |
limit the price that certain investors might be willing to pay in the future for shares of our common stock; |
|
· |
discourage or prevent certain types of transactions involving an actual or threatened change in control of us (including unsolicited takeover attempts), even though such a transaction may offer our stockholders the opportunity to sell their stock at a price above the prevailing market price; |
|
· |
make it more difficult for stockholders to take certain corporate actions; and |
|
· |
have the effect of delaying or preventing a change in control of us. |
-25-
Certain of those provisions authorize us to:
|
· |
issue “blank check” preferred stock; |
|
· |
divide our Board of Directors into three classes expiring in rotation; |
|
· |
require advance notice for stockholder proposals and nominations; |
|
· |
prohibit stockholders from calling a special meeting; and |
|
· |
prohibit stockholder action by written consent. |
If we are unable to conclude successfully litigation against us, our business, financial condition and results of operations could be adversely affected. In
the ordinary conduct of our business, we are subject to various lawsuits, investigations and claims, covering a wide range of matters, including, but not limited to, claims involving students or graduates and routine employment matters. It is possible that we may be required to pay substantial damages or settlement costs in excess of our insurance coverage to resolve those matters, which could have a material adverse effect on our financial condition or results of operation. See “Legal Proceedings.”
The personal information that we collect may be vulnerable to breach, theft or loss that could adversely affect our reputation and operations. Possession and use of personal information in our operations subjects us to risks and costs that could harm our
business. Our campuses collect, use and retain large amounts of personal information regarding our students and their families, including social security numbers, tax return information, personal and family financial data and credit card numbers. We also collect and maintain personal information of our employees in the ordinary course of our business. In addition, we collect personal information about prospective students, including email addresses and telephone numbers, and we
use this information in our recruiting operations. Some of this personal information is held and managed by certain of our vendors. Although we use security and business controls to limit access and use of personal information, a third party may be able to circumvent those security and business controls, which could result in a breach of student or employee privacy. In addition, errors in the storage, use or transmission of personal information could result in a breach of student or employee privacy. Possession
and use of personal information in our operations also subjects us to legislative and regulatory burdens that could require notification of data breaches and restrict our use of personal information. We cannot assure you that a breach, loss or theft of personal information will not occur. A major breach, theft or loss of personal information regarding our students and their families or our employees that is held by us or our vendors could subject us to costly claims or litigation, have a
material adverse effect on our reputation and results of operations and result in further regulation and oversight by federal and state authorities and increased costs of compliance. Potential new federal or state laws and regulations also may increase our costs of compliance or limit our ability to use personal information to recruit students.
Capacity constraints, security breaches or system interruptions to our computer networks could disrupt our operations, damage our reputation, limit our ability to attract and retain students and require us to expend significant resources. The performance
and reliability of our computer systems are critical to our information management, reputation and ability to attract and retain students. Any system error or failure, or a sudden and significant increase in traffic, could disrupt the provision of education to students attending our campuses. We cannot assure you that we will be able to expand the infrastructure of our computer systems on a timely basis sufficient to meet demand. Our computer systems and operations could be vulnerable
to interruption or malfunction due to events beyond our control, including natural disasters and telecommunications failures. Any interruption to our computer systems could have a material adverse effect on our operations and ability to attract and retain students. These factors could affect the number of students who attend our campuses and have a material adverse effect on our results of operations.
Our computer systems may be vulnerable to unauthorized access, computer hackers, computer viruses and other security problems. A user who circumvents security measures could misappropriate proprietary information or cause interruptions or malfunctions in operations. As a result, we may be required to expend significant resources
to protect against the threat of those security breaches or to alleviate problems caused by those breaches. These factors could affect the number of students who attend our campuses and have a material adverse effect on our results of operations.
We rely on exclusive proprietary rights and intellectual property that may not be adequately protected under current laws, and we may encounter disputes from time to time relating to our use of intellectual property of third
parties. Our success depends in part on our ability to protect our proprietary rights. We rely on a combination of copyrights, trademarks, service marks, trade secrets, domain names and agreements to protect our proprietary rights. We rely on service mark and trademark protection in the United States to protect our rights to distinctive marks associated with our services. We rely on agreements under which
we obtain rights to use the “ITT” and related marks and course content developed by our faculty, our other employees and third party content experts. We cannot assure you that those measures will be adequate, that we have secured, or will be able to secure, appropriate protections for all of our proprietary rights, or that third parties will not infringe upon or violate our proprietary rights. Despite our efforts to protect those rights, unauthorized third parties may attempt
to duplicate or copy the proprietary aspects of our names, curricula and other content. Our management's attention may be diverted by those attempts and we may need to use funds in litigation to protect our proprietary rights against any infringement or violation.
-26-
We may encounter disputes from time to time over rights and obligations concerning intellectual property, and we may not prevail in those disputes. In certain instances, we may not have obtained sufficient rights in the content of a course or a program of study. Third parties may raise a claim
against us alleging an infringement or violation of the intellectual property of that third party. Some third party intellectual property rights, such as certain patent rights, may be extremely broad, and it may not be possible for us to conduct our operations in such a way as to avoid infringing upon those intellectual property rights. Any such intellectual property claim could subject us to costly litigation, regardless of whether the claim has merit. Our insurance coverage may not cover potential claims of
this type adequately or at all, and we may be required to alter the content of our courses or programs of study, or pay significant monetary damages, any of which could have a material adverse effect on our results of operations.
Risk Related to Our Common Stock
The trading price of our common stock may fluctuate substantially in the future. The trading price of our common stock may fluctuate substantially as a result of a number of factors, some of which are not within our control. Those factors include, among
others:
|
· |
our ability to meet or exceed our own forecasts or expectations of analysts or investors; |
|
· |
quarterly variations in our operating results; |
|
· |
changes in ED and state laws and regulations and accreditation standards, or changes in the way that laws, regulations and accreditation standards are interpreted and applied; |
|
· |
the initiation, pendency or outcome of litigation, regulatory reviews and investigations, and any adverse publicity related thereto; |
|
· |
changes in our own forecasts or earnings estimates by analysts; |
|
· |
price and volume fluctuations in the overall stock market, which have affected the market prices of many companies in the for-profit, postsecondary education industry in recent periods; |
|
· |
the availability of financing for our students; |
|
· |
the loss of key personnel; and |
|
· |
general economic conditions. |
Those factors could adversely affect the trading price of our common stock and could prevent an investor from selling shares of our common stock at or above the price at which those shares were purchased.
Item 1B. Unresolved Staff Comments.
Not applicable.
Item 2. Properties.
As of December 31, 2009, we:
|
· |
leased 115 facilities used by our campuses and learning sites; |
|
· |
owned 42 facilities used by our campuses; and |
|
· |
leased seven facilities that are intended to be used by new campuses in 2010. |
-27-
Thirteen of the owned facilities and five of the leased facilities are used by DWC. Our facilities are located in 38 states. None of the facilities owned by us is subject to a mortgage or other indebtedness.
We generally locate our campuses in suburban areas near major population centers. We generally house our campus facilities in modern, air conditioned buildings, which include classrooms, laboratories, student break areas and administrative offices. Our campuses have accessible parking facilities
and are generally near a major highway. The facilities at our locations range in size from approximately 10,000 to 58,000 square feet of office space. The initial lease terms of our leased facilities range from three to 15 years. The average remaining lease term of our leased facilities is approximately four years. If desirable or necessary, a campus may be relocated to a new facility reasonably near the existing facility at the end of the lease term.
We own our headquarters building in Carmel, Indiana, which represents approximately 43,000 square feet of office space.
Item 3. Legal Proceedings.
We are subject to various claims and contingencies in the ordinary course of our business, including those related to litigation, business transactions, employee-related matters and taxes, among others. We cannot assure you of the ultimate outcome of any litigation involving us. Any litigation alleging violations of education or
consumer protection laws and/or regulations, misrepresentation, fraud or deceptive practices may also subject our affected campuses to additional regulatory scrutiny.
No matters were submitted to a vote of the holders of our common stock during the fourth quarter of 2009.
|
|
of Equity Securities. |
Our common stock is listed on the NYSE under the “ESI” trading symbol. The prices set forth below are the high and low sale prices of our common stock during the periods indicated, as reported in the NYSE's consolidated transaction reporting system.
|
2009 |
2008 |
|||||||||||||||
|
Fiscal Quarter Ended |
High |
Low |
High |
Low |
||||||||||||
|
March 31 |
$ | 133.75 | $ | 88.30 | $ | 93.25 | $ | 42.24 | ||||||||
|
June 30 |
$ | 116.99 | $ | 89.00 | $ | 90.71 | $ | 45.72 | ||||||||
|
September 30 |
$ | 116.00 | $ | 86.47 | $ | 106.75 | $ | 74.57 | ||||||||
|
December 31 |
$ | 114.56 | $ | 85.00 | $ | 96.56 | $ | 62.77 | ||||||||
There were 91 holders of record of our common stock on February 15, 2010.
-28-
We did not pay a cash dividend in 2009 or 2008. We do not anticipate paying any cash dividends on our common stock in the foreseeable future. The declaration and payment of dividends on our common stock are subject to the discretion of our Board of Directors and compliance
with applicable law. In addition, our credit agreement prohibits the payment of cash dividends on our common stock. Our decision to pay dividends in the future will depend on general business conditions, the effect of such payment on our financial condition, the restrictions under our credit agreement and other factors our Board of Directors may in the future consider to be relevant.
We did not sell any of our securities during the three months ended December 31, 2009 that were not registered under the Securities Act. In January 2010, we credited 623 treasury shares of our common stock to the deferred share accounts of each of four non-employee directors
under the ESI Non-Employee Directors Deferred Compensation Plan (the "Directors Deferred Compensation Plan") in payment of their annual retainer for 2010. These shares of our common stock will be issued upon the termination of the non-employee director’s service as a non-employee director for any reason, including retirement or death. In January 2010, we also issued 311 treasury shares of our common stock to one non-employee director under the Directors Deferred Compensation Plan in
payment of his annual retainer for 2010. The transactions described in this paragraph are exempt from the registration requirements of the Securities Act pursuant to Section 4(2) thereof.
The following table sets forth information regarding purchases made by us of shares of our common stock on a monthly basis during the fourth quarter of 2009:
|
Issuer Purchases of Equity Securities | ||||||||||||||||
|
Period |
Total Number of Shares Purchased |
Average Price Paid per Share |
Total Number of Shares Purchased as Part of Publicly Announced Plans
or Programs (1) |
Maximum Number of Shares that May Yet Be Purchased Under the Plans or
Programs (1) | ||||||||||||
|
October 1, 2009 through October 31, 2009 |
264,000 | $ | 93.00 | 264,000 | 1,730,225 | |||||||||||
|
November 1, 2009 through November 30, 2009 |
1,236,000 | 92.83 | 1,236,000 | 494,225 | ||||||||||||
|
December 1, 2009 through December 31, 2009 |
16 | (2) | 90.94 | -- | 494,225 | |||||||||||
|
Total |
1,500,016 | (2) | $ | 92.86 | 1,500,000 | |||||||||||
_____________
|
(1) |
Our Board of Directors has authorized us to repurchase the following number of shares of our common stock pursuant to our repurchase program (the "Repurchase Program"): |
|
Number of Shares |
Board Authorization Date | |
|
2,000,000 |
April 1999 | |
|
2,000,000 |
April 2000 | |
|
5,000,000 |
October 2002 | |
|
5,000,000 |
April 2006 | |
|
5,000,000 |
April 2007 | |
|
5,000,000 |
January 2010 |
-29-
The number of shares that remained available for repurchase under the Repurchase Program were 494,225 as of December 31, 2009. In January 2010, our Board of Directors authorized us to repurchase an additional 5,000,000 shares of our common stock pursuant to the Repurchase Program. The terms of the Repurchase Program provide that
we may repurchase shares of our common stock, from time to time depending on market conditions and other considerations, in the open market or through privately negotiated transactions in accordance with Rule 10b-18 of the Exchange Act. Unless earlier terminated by our Board of Directors, the Repurchase Program will expire when we repurchase all shares authorized for repurchase thereunder.
|
(2) |
Represents shares of our common stock that were tendered to us by employees to satisfy the income tax obligations associated with the vesting of certain equity awards granted to those employees. |
The performance graph set forth below compares the cumulative total shareholder return on our common stock with the S&P 500 Index and a Peer Issuer Group Index for the period from December 31, 2004 through December 31, 2009. The peer issuer group consists of the following companies selected on the basis of the similar nature
of their business: American Public Education, Inc., Apollo Group, Inc., Bridgepoint Education, Inc. (“BPI”), Capella Education Company, Career Education Corp., Corinthian Colleges, Inc., DeVry, Inc., Education Management Corporation (“EDMC”), Grand Canyon Education, Inc., Lincoln Educational Services Corporation, Strayer Education, Inc. and Universal Technical Institute, Inc. (the “Peer Issuer Group”). We believe that, including us, the Peer Issuer Group represents
a significant portion of the market value of publicly traded companies whose primary business is postsecondary education. The Peer Issuer Group includes all of the peer issuers in the former peer issuer group, except for BPI and EDMC. BPI and EDMC each became a publicly traded company in 2009.
Cumulative Total Return
(Based on $100 invested on December 31, 2004 and assumes
the reinvestment of all dividends)
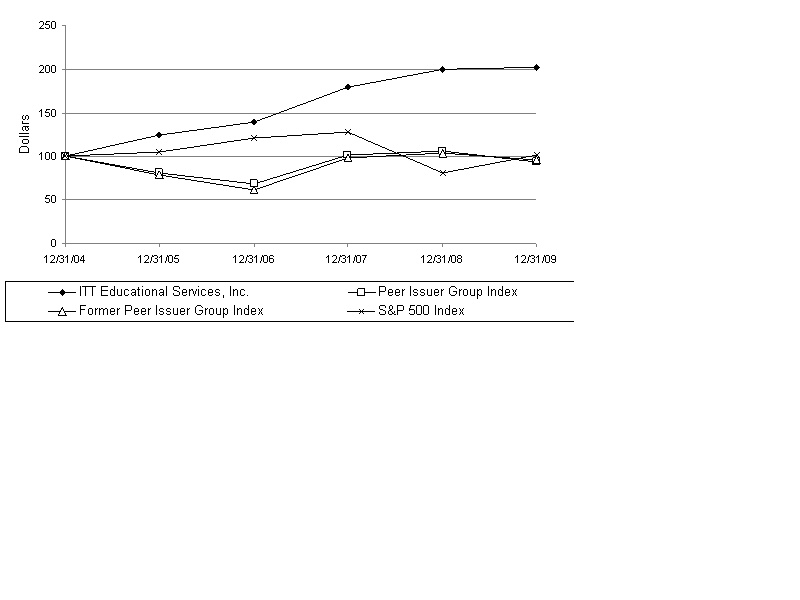
-30-
|
12/31/04 |
12/31/05 |
12/31/06 |
12/31/07 |
12/31/08 |
12/31/09 | ||||||
|
ITT Educational Services, Inc. |
100.00 |
124.31 |
139.58 |
179.33 |
199.75 |
201.81 | |||||
|
Peer Issuer Group Index |
100.00 |
80.67 |
68.38 |
101.06 |
105.98 |
93.57 | |||||
|
Former Peer Issuer Group Index |
100.00 |
78.60 |
62.09 |
98.17 |
103.59 |
96.36 | |||||
|
S&P 500 Index |
100.00 |
104.91 |
121.48 |
128.16 |
80.74 |
102.11 |
The preceding stock price performance graph and related information shall not be deemed “soliciting material” or to be “filed” with the SEC, nor shall such information be incorporated by reference into any future filing under the Securities Act or the Exchange Act, except to the extent that we specifically incorporate
it by reference into such filing.
-31-
Item 6. Selected Financial Data.
The following selected financial data are qualified by reference to and should be read with our Consolidated Financial Statements and Notes to Consolidated Financial Statements and other financial data included elsewhere in this report.
|
Year Ended December 31, | |||||||||||||||||||||||||||||
|
2009 (a) |
2008 (a) |
2007 (a) |
2006 (a) |
2005 |
| ||||||||||||||||||||||||
|
(Dollars in thousands, except per share data) | |||||||||||||||||||||||||||||
|
Statement of Income Data (b): |
|||||||||||||||||||||||||||||
|
Revenue |
$ | 1,319,194 | $ | 1,015,333 | $ | 869,508 | $ | 757,764 | $ | 688,003 | |||||||||||||||||||
|
Cost of educational services |
449,835 | 383,769 | 358,601 | 356,851 | 328,343 | ||||||||||||||||||||||||
|
Student services and administrative expenses |
380,567 | 306,099 | 267,815 | 223,958 | 195,780 | ||||||||||||||||||||||||
|
Special legal and other investigation costs (c) |
-- | -- | -- | (430 | ) | 1,219 | |||||||||||||||||||||||
|
Total costs and expenses |
830,402 | 689,868 | 626,416 | 580,379 | 525,342 | ||||||||||||||||||||||||
|
Operating income |
488,792 | 325,465 | 243,092 | 177,385 | 162,661 | ||||||||||||||||||||||||
|
Interest income, net |
2,565 | 1,894 | 2,455 | 8,104 | 8,853 | ||||||||||||||||||||||||
|
Income before provision for income taxes |
491,357 | 327,359 | 245,547 | 185,489 | 171,514 | ||||||||||||||||||||||||
|
Provision for income taxes |
191,094 | 125,854 | 93,308 | 69,530 | 63,490 | ||||||||||||||||||||||||
|
Net income |
$ | 300,263 | $ | 201,505 | $ | 152,239 | $ | 115,959 | $ | 108,024 | |||||||||||||||||||
|
Earnings per share: (d) |
|||||||||||||||||||||||||||||
|
Basic |
$ | 8.01 | $ | 5.18 | $ | 3.78 | $ | 2.71 | $ | 2.34 | |||||||||||||||||||
|
Diluted |
$ | 7.91 | $ | 5.13 | $ | 3.72 | $ | 2.66 | $ | 2.29 | |||||||||||||||||||
|
Other Operating Data (e): |
|||||||||||||||||||||||||||||
|
Capital expenditures, net |
$ | 23,992 | $ | 17,543 | $ | 15,514 | $ | 23,717 | $ | 21,334 | |||||||||||||||||||
|
Facility expenditures and land purchases |
$ | 4,236 | $ | 18,093 | $ | 12,589 | $ | 18,929 | $ | 25,145 | |||||||||||||||||||
|
Number of students at end of period |
80,766 | 61,983 | 53,027 | 46,896 | 42,985 | ||||||||||||||||||||||||
|
Number of campuses at end of period |
121 | 105 | 97 | 87 | 81 | ||||||||||||||||||||||||
|
Number of learning sites at end of period |
4 | 9 | 9 | 9 | 4 | ||||||||||||||||||||||||
|
As of December 31, | |||||||||||||||||||||||||||||
| 2009 | 2008 | 2007 | 2006 | 2005 | |||||||||||||||||||||||||
|
(Dollars in thousands) | |||||||||||||||||||||||||||||
|
Balance Sheet Data (b): |
|||||||||||||||||||||||||||||
|
Cash and cash equivalents, restricted cash |
|||||||||||||||||||||||||||||
|
and investments |
$ | 274,086 | $ | 375,928 | $ | 317,202 | $ | 357,439 | $ | 411,925 | |||||||||||||||||||
|
Total current assets |
$ | 390,962 | $ | 431,045 | $ | 349,823 | $ | 380,952 | $ | 437,008 | |||||||||||||||||||
|
Property and equipment, less accumulated |
|||||||||||||||||||||||||||||
|
depreciation |
$ | 195,449 | $ | 166,671 | $ | 153,265 | $ | 148,411 | $ | 127,406 | |||||||||||||||||||
|
Total assets (f) |
$ | 616,705 | $ | 608,348 | $ | 520,386 | $ | 538,692 | $ | 575,001 | |||||||||||||||||||
|
Total current liabilities |
$ | 284,792 | $ | 264,553 | $ | 291,924 | $ | 284,505 | $ | 251,139 | |||||||||||||||||||
|
Total long-term debt |
$ | 150,000 | $ | 150,000 | $ | 150,000 | $ | 150,000 | -- | ||||||||||||||||||||
|
Total liabilities (f) |
$ | 460,120 | $ | 434,504 | $ | 462,368 | $ | 447,934 | $ | 277,037 | |||||||||||||||||||
|
Shareholders' equity (f) |
$ | 156,585 | $ | 173,844 | $ | 58,018 | $ | 90,758 | $ | 297,964 | |||||||||||||||||||
_____________________________
|
(a) |
Effective January 1, 2006, we adopted the Financial Accounting Standards Board ("FASB") Accounting Standards Codification (“ASC” or “Codification”) 718, “Compensation – Stock Compensation” (“ASC 718”), which requires us to expense the fair value of stock-based compensation awards. Prior to
2006, we accounted for stock-based compensation in accordance with Accounting Principles Board (“APB”) Opinion No. 25, “Accounting for Stock Issued to Employees” (“APB Opinion No. 25”) and related interpretations. If the stock-based compensation expense in the years ended December 31, 2009, 2008, 2007 and 2006 had been determined in accordance with APB Opinion No. 25, we would have reported the following increases in certain selected financial data with respect to
these years: |
-32-
|
Year Ended December 31, |
||||||||||||||||
|
2009 |
2008 |
2007 |
2006 |
|||||||||||||
|
Income before income taxes |
$ | 13,074 | $ | 7,235 | $ | 5,100 | $ | 3,067 | ||||||||
|
Income taxes |
$ | 5,034 | $ | 2,785 | $ | 1,963 | $ | 1,181 | ||||||||
|
Net income |
$ | 8,040 | $ | 4,450 | $ | 3,137 | $ | 1,886 | ||||||||
|
Earnings per share: |
||||||||||||||||
|
Basic |
$ | 0.21 | $ | 0.11 | $ | 0.07 | $ | 0.04 | ||||||||
|
Diluted |
$ | 0.21 | $ | 0.11 | $ | 0.07 | $ | 0.04 | ||||||||
See Notes 1 and 3 of the Notes to Consolidated Financial Statements for a discussion of our stock-based compensation.
|
(b) |
In the fourth quarter of 2009, we changed our accounting for direct costs that relate to the enrollment of new students (“Direct Marketing Costs”) to expense those costs in the period incurred. Previously, we capitalized Direct Marketing Costs and amortized those costs over the period during which the associated revenue was recognized. See
Note 1 of the Notes to Consolidated Financial Statements for a discussion of the change in accounting principle. |
As required by the accounting guidance for voluntary changes in accounting principles, our financial results presented for the periods shown above have been adjusted to apply the new accounting principle retrospectively. The following tables set forth the effect that the adoption of this new accounting principle for Direct Marketing Costs
had on our financial statements for the periods indicated:
|
Effect of change in accounting principle |
Year Ended December 31, |
|||||||||||||||||||
|
Statement of Income Data: |
2009 |
2008 |
2007 |
2006 |
2005 |
|||||||||||||||
|
Revenue |
$ | -- | $ | -- | $ | -- | $ | -- | $ | -- | ||||||||||
|
Cost of educational services |
-- | -- | -- | -- | -- | |||||||||||||||
|
Student services and administrative expenses |
4,878 | 2,406 | (1,061 | ) | 4,138 | 2,777 | ||||||||||||||
|
Total costs and expenses |
4,878 | 2,406 | (1,061 | ) | 4,138 | 2,777 | ||||||||||||||
|
Operating Income |
(4,878 | ) | (2,406 | ) | 1,061 | (4,138 | ) | (2,777 | ) | |||||||||||
|
Interest income, net |
-- | -- | -- | -- | -- | |||||||||||||||
|
Income before provision for income taxes |
(4,878 | ) | (2,406 | ) | 1,061 | (4,138 | ) | (2,777 | ) | |||||||||||
|
Provision for income taxes |
(1,904 | ) | (939 | ) | 414 | (1,581 | ) | (1,089 | ) | |||||||||||
|
Net income |
$ | (2,974 | ) | $ | (1,467 | ) | $ | 647 | $ | (2,557 | ) | $ | (1,688 | ) | ||||||
|
Earnings per share: |
||||||||||||||||||||
|
Basic |
$ | (0.08 | ) | $ | (0.04 | ) | $ | 0.01 | $ | (0.06 | ) | $ | (0.04 | ) | ||||||
|
Diluted |
$ | (0.08 | ) | $ | (0.04 | ) | $ | 0.01 | $ | (0.06 | ) | $ | (0.04 | ) | ||||||
|
Effect of change in accounting principle |
As of December 31, |
|||||||||||||||||||
|
Balance Sheet Data: |
2009 | 2008 | 2007 | 2006 | 2005 | |||||||||||||||
|
Cash and cash equivalents, restricted cash and investments |
$ | -- | $ | -- | $ | -- | $ | -- | $ | -- | ||||||||||
|
Total current assets |
-- | -- | -- | -- | -- | |||||||||||||||
|
Property and equipment, less accumulated depreciation |
-- | -- | -- | -- | -- | |||||||||||||||
|
Total assets |
(21,434 | ) | (15,511 | ) | (20,567 | ) | (21,628 | ) | (17,490 | ) | ||||||||||
|
Total current liabilities |
-- | -- | -- | -- | -- | |||||||||||||||
|
Total long-term debt |
-- | -- | -- | -- | -- | |||||||||||||||
|
Total liabilities |
(4,453 | ) | (1,504 | ) | (8,027 | ) | (8,441 | ) | (6,860 | ) | ||||||||||
|
Shareholders’ equity |
(16,981 | ) | (14,007 | ) | (12,540 | ) | (13,187 | ) | (10,630 | ) | ||||||||||
-33-
|
(c) |
Legal and other investigation costs associated with the DOJ investigation of us, the inquiry initiated by the SEC into the allegations investigated by the DOJ, and the securities class action, shareholder derivative and books and records inspection lawsuits filed against us, certain of our current and former executive officers and Directors. |
|
(d) |
Earnings per share for all periods have been calculated in conformity with ASC 260, “Earnings Per Share”. Earnings per share data are based on historical net income and the weighted average number of shares of our common stock outstanding during each period. The number of shares used to calculate basic earnings per share
differs from the number of shares used to calculate diluted earnings per share. The number of shares used to calculate basic earnings per share was the weighted average number of common shares outstanding. The number of shares used to calculate diluted earnings per share was the weighted average number of common shares outstanding, plus the average number of shares that could be issued under our stock-based compensation plans and less the number of shares assumed to be purchased with any
proceeds received from the exercise of awards under those plans. |
|
(e) |
We did not pay any cash dividends in any of the periods presented. |
|
(f) |
As of December 31, 2006, we adopted new accounting guidance which required that the funded status of a defined benefit postretirement plan be recognized on a company’s balance sheet, and that any changes in the funded status of that type of plan be recognized through comprehensive income. The adoption of this guidance affects the comparability
of total assets, total liabilities and shareholders’ equity as of December 31, 2009, 2008, 2007 and 2006 to the amounts under the same captions as of the same date in 2005. See Note 11 of the Notes to Consolidated Financial Statements for a discussion of our pension plans. The adoption of ASC 718, as discussed in footnote (a) above, also affects the comparability of shareholders’ equity as of December 31, 2009, 2008, 2007 and 2006 to the amounts under the same caption as of the same date
in 2005. |
The following discussion should be read with the Selected Financial Data and the Consolidated Financial Statements and Notes to Consolidated Financial Statements included elsewhere in this report.
This management’s discussion and analysis of financial condition and results of operations is based on our consolidated financial statements, which have been prepared in conformity with generally accepted accounting principles in the United States. The preparation of these financial
statements requires us to make estimates and judgments that affect the reported amount of assets, liabilities, revenue, expenses and contingent assets and liabilities. Actual results may differ from those estimates and judgments under different assumptions or conditions.
In this management’s discussion and analysis of financial condition and results of operations, when we discuss factors that contributed to a change in our financial condition or results of operations, we disclose the primary factors that materially contributed to that change.
General
As of December 31, 2009, we had 125 locations (including 121 campuses and four learning sites) in 38 states, which were providing postsecondary education to approximately 80,000 students. In the fourth quarter of 2009, we converted five learning sites to campuses in response to
the growth of those learning sites. In 2009, we derived approximately 98% of our revenue from tuition and approximately 2% from the sale of tool kits and fees, charged to and paid by, or on behalf of, our students. Most students at our institutions pay a substantial portion of their tuition and other education-related expenses with funds received under various government-sponsored student financial aid programs, especially Title IV Programs.
Our revenue varies based primarily on the following factors:
-34-
|
· |
the aggregate student population, which is influenced by the number of students attending our institutions at the beginning of a fiscal period and student retention rates; |
|
· |
the amount of tuition charged to our students; |
|
· |
the levels of availability and utilization of institutional scholarships, grants and awards; and |
|
· |
alternative disbursement arrangements under private education loan programs. |
New students generally enter our institutions at the beginning of an academic term that typically begins for most programs of study in early March, mid-June, early September and late November or early December. Our establishment of new locations and the introduction of additional
program offerings at our existing locations have been significant factors in increasing the aggregate student population in recent years.
In order to participate in Title IV Programs, a new campus or learning site must be authorized by the state in which it will operate, accredited by an accrediting commission recognized by the ED, and certified by the ED to participate in Title IV Programs. The ED’s certification
process cannot commence until the location receives its state authorization and accreditation. In the last few years, we have experienced minimal delay in obtaining ED certification of our new campuses and learning sites.
We generally earn tuition revenue on a straight-line basis over the length of each of four, 12-week academic quarters in each fiscal year. State regulations, accrediting commission criteria and our policies generally require us to refund a portion of the tuition and fee payments
received from a student who withdraws from one of our institutions during an academic term. We recognize immediately the amount of tuition and fees, if any, that we may retain after payment of any refund.
We incur expenses throughout a fiscal period in connection with the operation of our institutions. The cost of educational services includes salaries of faculty and institution administrators, cost of course materials, occupancy costs, depreciation and amortization of equipment costs, facilities
and leasehold improvements, and other miscellaneous costs incurred by our institutions.
Student services and administrative expenses include marketing expenses, an expense for uncollectible accounts and administrative expenses incurred at our corporate headquarters. Marketing expenses include salaries and employee benefits for recruiting representatives and advertising
expenses.
In 2009, we continued to add program offerings among existing campuses and learning sites and began operations at new locations. We also continued our efforts to diversify our program offerings by developing residence and online programs at different degree levels in both technology and non-technology
fields of study.
The following table sets forth select operating and growth statistics for the periods indicated:
|
Year Ended December 31, |
||||||
|
2009 |
2008 |
2007 | ||||
|
Additional program offerings |
377 |
190 |
246 | |||
|
Number of campuses and learning sites with additional program offerings |
106 |
71 |
85 | |||
|
Began operations at: |
||||||
|
New campuses |
10 (1) |
8 |
10 | |||
|
Converted learning sites to campuses |
5 |
-- |
-- | |||
|
Campuses offering bachelor degree programs |
102 |
87 |
73 | |||
(1) Excludes DWC
-35-
In 2010, we intend to add more of our current program offerings among approximately 95 locations. We also plan to continue developing additional residence and online programs at different degree levels in technology and non-technology fields of study to be offered at our institutions. The
new degree programs are expected to involve a variety of disciplines and be at the associate, bachelor and master degree levels. We intend to develop both a residence and online version of many of the new programs. In 2010, we intend to increase the number of our campuses that offer bachelor degree programs. We plan to begin operations at eight to ten new locations in 2010. Our new campuses generally incur a loss up to 24 months after the first class start date.
Critical Accounting Policies and Estimates
We believe the following critical accounting policies affect our more significant estimates and judgments used in the preparation of our consolidated financial statements. These policies should be read in conjunction with Note 1 of the Notes to Consolidated Financial Statements.
Change in Accounting for Direct Marketing Costs. In the fourth quarter of 2009, we changed our accounting for Direct Marketing Costs to expense those costs in the period incurred. Previously, we capitalized Direct Marketing Costs and amortized
those costs over the period during which the associated revenue was recognized. We evaluated both principles of accounting and determined that expensing Direct Marketing Costs in the period incurred is a preferable accounting principle under generally accepted accounting principles in the United States of America (“GAAP”), primarily because it will improve the comparability of our financial statements to those of other publicly-traded companies in our industry, who generally expense such
costs as incurred, and will improve the overall transparency of our financial results.
As required by the accounting guidance for voluntary changes in accounting principles, our comparative consolidated financial statements presented for prior years have been adjusted to apply our new accounting principle for Direct Marketing Costs retrospectively. The following table sets forth the effect that the adoption of this new accounting
principle for Direct Marketing Costs had on our results of operations in the periods indicated:
|
Year Ended December 31, |
||||||||||||
|
2009 |
2008 |
2007 |
||||||||||
|
Revenue |
$ | -- | $ | -- | $ | -- | ||||||
|
Cost of educational services |
-- | -- | -- | |||||||||
|
Student services and administrative expenses |
4,878 | 2,406 | (1,061 | ) | ||||||||
|
Total costs and expenses |
4,878 | 2,406 | (1,061 | ) | ||||||||
|
Operating income |
(4,878 | ) | (2,406 | ) | 1,061 | |||||||
|
Interest income |
-- | -- | -- | |||||||||
|
Interest (expense) |
-- | -- | -- | |||||||||
|
Income before provision for income taxes |
(4,878 | ) | (2,406 | ) | 1,061 | |||||||
|
Provision for income taxes |
(1,904 | ) | (939 | ) | 414 | |||||||
|
Net income |
$ | (2,974 | ) | $ | (1,467 | ) | $ | 647 | ||||
|
Earnings per share: |
||||||||||||
|
Basic |
$ | (0.08 | ) | $ | (0.04 | ) | $ | 0.01 | ||||
|
Diluted |
$ | (0.08 | ) | $ | (0.04 | ) | $ | 0.01 | ||||
The adoption of the new accounting principle for Direct Marketing Costs reduced our shareholders’ equity by $17.0 million as of December 31, 2009 and $14.0 million as of December 31, 2008. Our total cash flows from operating activities, investing activities and financing activities in 2009, 2008 and 2007 were not affected
as a result of this change in accounting principle.
The financial information discussed in this management’s discussion and analysis of financial condition and results of operations related to 2008 and 2007 are as adjusted to reflect the effect of our change in accounting principle for Direct Marketing Costs. See Note 1 of the Notes to Consolidated Financial Statements for
a more detailed discussion of our change in accounting principle for Direct Marketing Costs.
-36-
Recognition of Revenue. Tuition revenue is recorded on a straight-line basis over the length of the applicable course. If a student withdraws from an institution, the standards of most SAs that
regulate our institutions, the ACs and our own internal policy limit a student’s obligation for tuition and fees to the institution depending on when a student withdraws during an academic term. The terms of the Refund Policies vary by state, and the limitations imposed by the Refund Policies are generally based on the portion of the academic term that has elapsed at the time the student withdraws. Generally, the greater the portion of the academic term that has elapsed at the time
the student withdraws, the greater the student’s obligation is to the institution for the tuition and fees related to that academic term. We record revenue net of any refunds that result from any applicable Refund Policy. On an individual student basis, tuition earned in excess of cash received is recorded as accounts receivable, and cash received in excess of tuition earned is recorded as deferred revenue.
Tuition revenue includes textbooks students use in their programs of study. We record the cost of these textbooks in prepaid expenses and other current assets and amortize the cost on a straight-line basis over the applicable course length. Laptop computer and tool kit sales, and the related cost of each, are recognized
when the student receives the laptop computer or tool kit. Academic fees (which are charged only one time to students on their first day of class attendance) are recognized as revenue on a straight-line basis over the average program length. If a student withdraws from an institution, all unrecognized revenue relating to his or her fees, net of any refunds that result from any applicable Refund Policy, is recognized upon the student’s departure. An administrative fee is
charged to a student and recognized as revenue when the student withdraws or graduates from a program of study at an institution.
The following table sets forth the composition of our revenue in the periods indicated:
|
Year Ended December 31, | |||||||
|
2009 |
2008 |
2007 |
|||||
|
Tuition |
98% |
98% |
97% |
||||
|
Other |
2% |
2% |
3% |
||||
Other revenue included laptop computer and tool kit sales and student fees. The amount of tuition earned depends on:
|
· |
the cost per credit hour of the courses in our programs; |
|
· |
the length of a student’s enrollment; |
|
· |
the number of courses a student takes during each period of enrollment; and |
|
· |
the total number of students enrolled in our programs. |
Each of these factors is known at the time our tuition revenue is calculated.
Equity-Based Compensation. In accordance with ASC 718, the value of our equity instruments exchanged for employee and director services is measured at the date of grant, based on the calculated fair value of the grant, and is recognized as an expense over
the period of time that the grantee must provide services to us before the stock-based compensation is fully vested. The vesting period is generally the period set forth in the agreement granting the stock-based compensation. Under the terms of our stock-based compensation plans, some grants immediately vest in full when the grantee’s employment or service terminates, or when he or she is eligible to retire. As a result, in certain circumstances, the period of time that
the grantee must provide services to us in order for that stock-based compensation to fully vest may be less than the vesting period set forth in the agreement granting the stock-based compensation. In these instances, compensation expense will be recognized over this shorter period. We recognize stock-based compensation expense on a straight-line basis over the service period applicable to the grantee.
We use a binomial option pricing model to determine the fair value of stock options granted, and we use the market price of our common stock to determine the fair value of restricted stock and restricted stock units (“RSUs”) granted. Various assumptions are used in the binomial option pricing model to determine the
fair value of the stock options. These assumptions are discussed in Note 3 of the Notes to Consolidated Financial Statements.
-37-
The following table sets forth the stock-based compensation expense and related income tax benefit recognized in our Consolidated Statements of Income in the periods indicated:
| Year Ended December 31, | ||||||||||||||
|
2009 |
2008 |
|
2007 | |||||||||||
| (Dollars in thousands) | ||||||||||||||
|
Stock-based compensation expense |
$ | 13,074 | $ | 7,235 | $ | 5,100 | ||||||||
|
Income tax (benefit) |
$ | (5,034 | ) | $ | (2,785 | ) | $ | (1,963 | ) | |||||
| $ | 8,040 | $ | 4,450 | $ | 3,137 | |||||||||
Stock-based compensation expense in 2008 and 2007 was lower than in 2009 primarily due to the acceleration of the grant and vesting of equity awards in 2005 that normally would have been granted in 2006 (and would have vested over three years). This resulted in a reduction to compensation cost upon the adoption of ASC 718 in 2006.
As of December 31, 2009, we estimated that pre-tax compensation expense for unvested stock-based compensation grants in the amount of approximately $14.4 million, net of estimated forfeitures, will be recognized in future periods. We expect to recognize this expense over the remaining service period applicable to the grantees which,
on a weighted average basis, is approximately two years.
See also Notes 1 and 3 of the Notes to Consolidated Financial Statements for a discussion of stock-based compensation and ASC 718.
Income Taxes. We follow ASC 740, “Income Taxes,” which prescribes a single, comprehensive model for how a company should recognize, measure, present and disclose in its financial statements
uncertain tax positions that the company has taken or expects to take on a tax return. This guidance requires us to evaluate whether it is more likely than not, based on the technical merits of a tax position, that the benefits resulting from the position will be realized by us.
Accounts Receivable and Allowance for Doubtful Accounts. We extend unsecured credit to our students for tuition and fees and we record a receivable for the tuition and fees earned in excess of the payment
received from or on behalf of a student. The individual student balances of these receivables are insignificant. We record an allowance for doubtful accounts with respect to accounts receivable based on the students’ credit profiles and our historical collection experience related to amounts owed by our students with similar credit profiles. If our collection trends were to differ significantly from our historical collection experience, we would make a corresponding adjustment
to our allowance for doubtful accounts.
When a student is no longer enrolled in a program of study at one of our campuses, we increase the allowance for doubtful accounts related to the former student’s receivable balance to reflect the amount we estimate will not be collected. The amount that we estimate will not
be collected is based on a review of the historical collection experience for each campus, adjusted as needed to reflect other facts and circumstances. We review the collection activity after a student withdraws or graduates from a campus and will write off the accounts receivable if we conclude that collection of the balance is not probable.
Fair Value. ASC 820, “Fair Value Measurements and Disclosures” (“ASC 820”), defines fair value for financial reporting as the price that would be received upon the sale of an
asset or paid upon the transfer of a liability in an orderly transaction between market participants at the measurement date. The fair value measurement of our financial assets utilized assumptions categorized as observable inputs under ASC 820. Observable inputs are assumptions based on independent market data sources.
-38-
The following table sets forth information regarding the fair value measurement of our financial assets as of December 31, 2009:
|
Fair Value Measurements at Reporting Date Using |
||||||||||||||||
|
(Level 1) |
(Level 2) |
(Level 3) |
||||||||||||||
|
Description |
As of 12/31/2009 |
Quoted Prices in Active Markets for Identical Assets |
Significant Other Observable Inputs |
Significant Unobservable Inputs |
||||||||||||
|
(In thousands) |
||||||||||||||||
|
Cash Equivalents |
$ | 124,347 | $ | 124,347 | $ | -- | $ | -- | ||||||||
|
Restricted Cash |
1,751 | 1,751 | -- | -- | ||||||||||||
|
Short-Term Investments |
143,407 | 81,591 | 61,816 | -- | ||||||||||||
| $ | 269,505 | $ | 207,689 | $ | 61,816 | $ | -- | |||||||||
We used quoted prices in active markets for identical assets as of the measurement date to value our financial assets that were categorized as Level 1. For assets that were categorized as Level 2, we used:
|
· |
quoted prices for similar assets in active markets; |
|
· |
quoted prices for identical or similar assets in markets that were not active or in which little public information had been released; |
|
· |
inputs other than quoted prices that were observable for the assets; or |
|
· |
inputs that were principally derived from or corroborated by observable market data by correlation or other means. |
Property and Equipment. We include all property and equipment in the financial statements at cost and make provisions for depreciation of property and equipment using the straight-line method. The following
table sets forth the general ranges of the estimated useful lives of our property and equipment:
| Estimated Useful Life | ||
|
Furniture and equipment |
3 to 10 years | |
|
Leasehold , building and land improvements |
3 to 14 years | |
|
Buildings |
20 to 40 years | |
|
Software |
3 to 8 years |
Changes in circumstances, such as changes in our curricula and technological advances, may result in the actual useful lives of our property and equipment differing from our estimates. We regularly review and evaluate the estimated useful lives of our property and equipment. Although we believe that our assumptions and
estimates are reasonable, deviations from our assumptions and estimates could produce a materially different result.
We regularly review our long-lived assets for impairment whenever events or changes in circumstances indicate that the carrying amounts of those assets may not be recoverable. If the carrying value of the asset exceeds its fair market value, we recognize an impairment loss equal
to the difference. We base our impairment analyses of long-lived assets on our current business strategy, expected growth rates and estimates of future economic and regulatory conditions.
-39-
Contingent Liabilities. We are subject to various claims and contingencies in the ordinary course of our business, including those related to litigation, business transactions, employee-related matters
and taxes, among others. When we are aware of a claim or potential claim, we assess the likelihood of any loss or exposure. If it is probable that a loss will result and the amount of the loss can be reasonably estimated, we record a liability for the loss. The liability recorded includes probable and estimable legal costs associated with the claim or potential claim. If the loss is not probable or the amount of the loss cannot be reasonably estimated, we disclose the claim if
the likelihood of a potential loss is reasonably possible and the amount involved is material. Although we believe our estimates are reasonable, deviations from our estimates could produce a materially different result.
Guarantees. In accordance with ASC 460, “Guarantees,” we recognize a liability for the fair value of a guarantee obligation upon its issuance. We evaluate the fair value of our
guarantee obligations periodically and adjust the liability as warranted. The fair market value of our guarantees related to certain private student loan programs were estimated based on historical charge off experience with respect to private loans made to our students and the present value of the expected cash flows, taking into consideration current economic conditions, that may result from the settlement of the guarantee obligations in the future. Although we believe our estimates are
reasonable, deviations from our estimates could produce a materially different result.
Employee Pension Benefits. Effective December 31, 2008, we adopted the measurement date provisions of ASC 715, “Compensation – Retirement Benefits” (“ASC 715”), which require a company to measure the funded status of a defined
benefit postretirement plan as of the date of the company’s year end balance sheet. We utilized the pension measurements as of September 30, 2007 to determine the amount of the net periodic benefit cost allocated to the three month period ended December 31, 2007 for the transition to a calendar year end measurement date. We recognized a benefit of $0.3 million, net of income tax, in our retained earnings as of December 31, 2008 as a result of our adoption of these measurement date
provisions.
See also Note 11 of the Notes to Consolidated Financial Statements for a more detailed discussion of our pension plans and assumptions.
New Accounting Guidance
In December 2008, the FASB issued guidance to enhance disclosures about plan assets in an employer’s defined benefit pension or other postretirement plan. This guidance was included in the Codification under ASC 715. These disclosures are intended to provide users of financial statements with a greater understanding of how investment
allocation decisions are made, the major categories of plan assets, the inputs and valuation techniques used to measure the fair value of plan assets and significant concentrations of risk within plan assets. This provision of ASC 715 became effective for our plan asset disclosures beginning with our fiscal year ended December 31, 2009 and the disclosures are included in Note 11 of the Notes to Consolidated Financial Statements.
In June 2009, the FASB established the Codification as the source of authoritative accounting principles recognized by the FASB to be applied by nongovernmental entities in the preparation of financial statements in accordance with GAAP. This guidance was included in the Codification under ASC 105, “Generally Accepted Accounting
Principles.” All prior accounting standard documents were superseded by the Codification and any accounting literature not included in the Codification is no longer authoritative. Rules and interpretive releases of the SEC issued under the authority of federal securities laws will continue to be sources of authoritative GAAP for SEC registrants. The Codification became effective for us beginning with our third fiscal quarter of 2009. Therefore, all references made by us
to GAAP use the new Codification numbering system. The Codification does not change or alter existing GAAP and, therefore, it did not have any impact on our consolidated financial statements.
The following new accounting guidance became effective for us beginning with our second fiscal quarter of 2009:
|
|
· |
General standards of accounting for and disclosure of events that occur after the balance sheet date but before financial statements are issued were included in the Codification under ASC 855, “Subsequent Events.” We performed an evaluation of subsequent events through February 18, 2010, and we issued our consolidated financial statements on February 19, 2010. |
|
|
· |
Disclosures about fair value of financial instruments for interim reporting periods were included in the Codification under ASC 825, “Financial Instruments.” The required disclosures were included in our interim financial reports. |
|
|
· |
Additional guidance for estimating fair value when the volume and level of activity for the asset or liability have significantly decreased was included in the Codification under ASC 820. The adoption of this guidance did not have a material impact on our consolidated financial statements. |
|
|
· |
Other-than-temporary impairment guidance for debt securities to make the guidance more operational and improve the presentation and disclosure of other-than-temporary impairments on debt and equity securities in the financial statements was included in the Codification under ASC 320, “Investments – Debt and Equity Securities.” The adoption of this guidance did not have a material impact on our consolidated
financial statements. |
-40-
The following new accounting guidance became effective for us beginning with our first fiscal quarter of 2009:
|
|
· |
Accounting for financial guarantee insurance contracts, including the recognition and measurement of premium revenue and claim liabilities, was included in the Codification under ASC 944, “Financial Services – Insurance.” The adoption of this guidance did not have a material impact on our consolidated financial statements. |
|
|
· |
Expanded disclosure requirements for derivative instruments and hedging activities were included in the Codification under ASC 815, “Derivatives and Hedging.” The adoption of this guidance did not have a material impact on our consolidated financial statements. |
|
|
· |
Accounting and reporting standards for the noncontrolling interest of a subsidiary and for the deconsolidation of a subsidiary were included in the Codification under ASC 810, “Consolidation” (“ASC 810”). The adoption of this guidance did not have a material impact on our consolidated financial statements. |
|
|
· |
Principles and requirements for how a company recognizes and measures assets, liabilities and noncontrolling interests acquired or assumed in a business combination were included in the Codification under ASC 805, “Business Combinations.” See Note 2 of the Notes to Consolidated Financial Statements for the application of this guidance. |
|
|
· |
Reporting requirements for transactions between participants in a collaborative arrangement and between participants in the arrangement and third parties and the definition of collaborative arrangements were included in the Codification under ASC 808, “Collaborative Arrangements.” The adoption of this guidance did not have a material impact on our consolidated financial statements. |
|
|
· |
The delay of the effective date of the fair value standards for nonfinancial assets and nonfinancial liabilities to fiscal years beginning after November 15, 2008, except for items that are recognized or disclosed at fair value in the financial statements on a recurring basis, was included in the Codification under ASC 820. The adoption of this guidance did not have a material impact on our consolidated financial statements. |
In January 2010, the FASB issued Accounting Standards Update No. 2010-06, which will be included in the Codification under ASC 820 and requires the disclosure of transfers between the observable input categories and activity in the unobservable input category for fair value measurements. The guidance also requires disclosures about
the inputs and valuation techniques used to measure fair value. This guidance became effective for our interim and annual reporting periods beginning January 1, 2010. The adoption of this guidance will not have a material impact on our consolidated financial statements.
In June 2009, the FASB set forth certain requirements to improve the financial reporting by enterprises involved with variable interest entities and to provide more relevant and reliable information to users of financial statements. This guidance was included in the Codification under ASC 810 and became effective for our interim
and annual reporting periods beginning January 1, 2010. The adoption of this guidance will not have a material impact on our consolidated financial statements.
Also in June 2009, the FASB issued guidance to improve transparency about transfers of financial assets and a transferor’s continuing involvement, if any, with transferred financial assets. It also clarified the requirement for isolation and limitations on portions of financial assets that are eligible for sale accounting, eliminated
exceptions for qualifying special-purpose entities from the consolidation guidance and eliminated the exception that permitted sale accounting for certain mortgage securitizations when a transferor has not surrendered control over the financial assets. This guidance was included in the Codification under ASC 860, “Transfers and Servicing” and became effective for our interim and annual reporting periods beginning January 1, 2010. The adoption of this guidance will not have a
material impact on our consolidated financial statements.
Variations in Quarterly Results of Operations
Our quarterly results of operations have tended to fluctuate within a fiscal year due to the timing of student matriculations. Each of our four fiscal quarters has 12 weeks of earned tuition revenue. Revenue in our third and fourth fiscal quarters generally benefits from
increased student matriculations. The number of new students entering our institutions tends to be higher in September, which is the time that the public has traditionally associated with the start of a new school year. The academic schedule generally does not affect our incurrence of most of our costs, however, and costs do not fluctuate significantly on a quarterly basis.
-41-
The following table sets forth our revenue for the periods indicated:
|
Quarterly Revenue |
||||||||||||||||||||||||
|
(Dollars in thousands) |
||||||||||||||||||||||||
|
2009 |
2008 |
2007 |
||||||||||||||||||||||
|
Three Months Ended |
Amount |
Percent |
Amount |
Percent |
Amount |
Percent |
||||||||||||||||||
|
March 31 |
$ | 288,033 | 21.8% | $ | 234,850 | 23.1% | $ | 204,170 | 23.5% | |||||||||||||||
|
June 30 |
317,140 | 24.0% | 246,411 | 24.3% | 216,982 | 25.0% | ||||||||||||||||||
|
September 30 |
339,643 | 25.8% | 254,273 | 25.0% | 217,932 | 25.0% | ||||||||||||||||||
|
December 31 |
374,378 | 28.4% | 279,799 | 27.6% | 230,424 | 26.5% | ||||||||||||||||||
|
Total for Year |
$ | 1,319,194 | 100.0% | $ | 1,015,333 | 100.0% | $ | 869,508 | 100.0% | |||||||||||||||
Results of Operations
The following table sets forth the percentage relationship of certain statement of income data to revenue for the periods indicated:
|
|
Year Ended December 31, | |||||
|
2009 |
2008 |
2007 |
||||
|
Revenue |
100.0% |
100.0% |
100.0% |
|||
|
Cost of educational services |
34.1% |
37.8% |
41.3% |
|||
|
Student services and administrative expenses |
28.8% |
30.1% |
30.8% |
|||
|
Operating income |
37.1% |
32.1% |
27.9% |
|||
|
Interest income, net |
0.2% |
0.2% |
0.3% |
|||
|
Income before income taxes |
37.3% |
32.3% |
28.2% |
|||
The following table sets forth our total student enrollment as of the dates indicated:
|
Total Student |
Increase Over | |||
|
As of December 31, |
Enrollment |
Prior Year | ||
|
2009 |
80,766 |
30.3% | ||
|
2008 |
61,983 |
16.9% | ||
|
2007 |
53,027 |
13.1% |
Total student enrollment includes all new and continuing students. A continuing student is any student who, in the academic term being measured, is enrolled in a program of study at one of our campuses and was enrolled in the same program at any of our campuses at the end of the immediately preceding academic term. A
new student is any student who, in the academic term being measured, enrolls in and begins attending any program of study at one of our campuses:
|
· |
for the first time at that campus; |
|
· |
after graduating in a prior academic term from a different program of study at that campus; or |
|
· |
after having withdrawn or been terminated from a program of study at that campus. |
-42-
The following table sets forth our new student enrollment in the periods indicated:
|
2009 |
2008 |
2007 | ||||||||||
|
New Student Enrollment |
New |
Increase |
New |
Increase |
New |
Increase | ||||||
|
in the Three |
Student |
Over |
Student |
Over |
Student |
Over | ||||||
|
Months Ended: |
Enrollment (1) |
Prior Year (1) |
Enrollment |
Prior Year |
Enrollment |
Prior Year | ||||||
|
March 31 |
18,935 |
36.8% |
13,844 |
8.7% |
12,738 |
13.1% | ||||||
|
June 30 |
19,692 |
33.5% |
14,751 |
22.5% |
12,043 |
3.2% | ||||||
|
September 30 |
27,738 |
27.2% |
21,807 |
19.4% |
18,270 |
8.8% | ||||||
|
December 31 |
19,563 |
31.2% |
14,911 |
29.2% |
11,542 |
13.1% | ||||||
|
Total for the year |
85,928 |
31.6% |
65,313 |
19.6% |
54,593 |
9.3% | ||||||
_____________________________
|
|
(1) |
New students enrolled at DWC have been included beginning with the September 30, 2009 period. |
We believe that economic downturns in the United States, in particular those that result in higher unemployment rates among unskilled workers, have historically been associated with increased student enrollment at postsecondary educational institutions. Based on this, we believe that the current economic recession in the United
States which has given rise to higher unemployment among unskilled workers has contributed to the year-over-year increases in our new and total student enrollment in each of the past few fiscal quarters. These increases have had a material favorable effect on our results of operations, cash flows and financial condition. There are a number of other factors, however, that affect student enrollment, and we cannot assure you that this trend will continue or we will continue to experience similar
financial and operating results. In addition, tighter credit markets in the United States have contributed to reduced availability of private education loans from third-party lenders to our students and, as a result, have led to an increase in the amount of internal student financing that we have provided to our students. See “—Financial Condition, Liquidity and Capital Resources—Student
Financing Update” below.
At the vast majority of our campuses, we generally organize the academic schedule for programs of study offered on the basis of four 12-week academic quarters in a calendar year. The academic quarters typically begin in early March, mid-June, early September and late November or
early December. To measure the persistence of our students, the number of continuing students in any academic term is divided by the total student enrollment in the immediately preceding academic term.
The following table sets forth the rates of our students’ persistence as of the dates indicated:
|
Student Persistence as of(1): | ||||||||
|
Year |
March 31 |
June 30 |
September 30 |
December 31 | ||||
|
2009 |
75.3% |
75.3% |
73.6% |
77.3% | ||||
|
2008 |
76.1% |
73.9% |
72.5% |
76.5% | ||||
|
2007 |
78.0% |
74.7% |
72.4% |
77.3% | ||||
_____________________________
|
|
(1) |
Students enrolled at DWC have been included beginning with the rate as of September 30, 2009. The impact on our students’ persistence as a result of the inclusion of DWC students in the calculation was not material. |
The decrease in our students’ persistence as of March 31, 2008 compared to the same point in 2007 was primarily due to a change in our 2008 academic calendar, which eliminated a break in classes in the first quarter of 2008 compared to the first quarter of 2007. We believe that
this change in the academic calendar resulted in approximately 500 additional student withdrawals occurring in the first quarter of 2008 than would have occurred if we had not changed the academic calendar. The decrease in our students’ persistence as of June 30, 2008, December 31, 2008 and March 31, 2009 compared to the corresponding date in the prior year was primarily due to the higher number of students who graduated during each of the more recent three-month periods compared to the corresponding
period in the prior year.
-43-
Year Ended December 31, 2009 Compared with Year Ended December 31, 2008. Revenue increased $303.9 million, or 29.9%, to $1,319.2 million in the year ended December 31, 2009 compared to $1,015.3 million in the year ended December 31, 2008. The
primary factors that contributed to this increase included, in order of significance:
|
· |
an average 27.1% increase in total student enrollment in each academic quarter beginning in 2009 compared to 2008; |
|
· |
a 5.0% increase in tuition rates in each of March 2009 and March 2008; and |
|
· |
a 16.9% increase in total student enrollment at December 31, 2008 compared to December 31, 2007. |
The primary factors that contributed to the increase in student enrollment included, in order of significance:
|
· |
student enrollment growth in programs of study and at locations that were in operation prior to 2008; |
|
· |
new programs of study offered at our campuses; and |
|
· |
operating new campuses. |
Cost of educational services increased $66.1 million, or 17.2%, to $449.8 million in the year ended December 31, 2009 compared to $383.8 million in the year ended December 31, 2008. The primary factors that contributed to this increase included, in order of significance:
|
· |
the costs required to service the increased total student enrollment; and |
|
· |
increased costs associated with operating new campuses. |
The increase in cost of educational services was partially offset by, in order of significance:
|
· |
greater leverage of our fixed costs in the operation of our campuses; and |
|
· |
decreased costs associated with decreased sales of laptop computers. |
Cost of educational services as a percentage of revenue decreased 370 basis points to 34.1% in the year ended December 31, 2009 compared to 37.8% in the year ended December 31, 2008. The primary factor that contributed to this decrease was greater leverage of our fixed costs in the operation of our campuses, including lower occupancy
costs as a percentage of revenue. The decrease in cost of educational services as a percentage of revenue was partially offset by the costs associated with operating new campuses.
Student services and administrative expenses increased $74.5 million, or 24.3%, to $380.6 million in the year ended December 31, 2009 compared to $306.1 million in the year ended December 31, 2008. The principal causes of this increase included, in order of significance:
|
· |
an increase in bad debt expense associated with increases in the amount of internal student financing; and |
|
· |
an increase in compensation and benefit costs associated with a greater number of employees. |
Student services and administrative expenses decreased to 28.8% of revenue in the year ended December 31, 2009 compared to 30.1% of revenue in the year ended December 31, 2008. The primary causes of this decrease were our ability to leverage our centralized services over a larger
base of operations and media advertising costs increasing at a lower rate than the increase in revenue. The decrease in student services and administrative expenses as a percentage of revenue was partially offset by an increase in bad debt expense. Bad debt expense as a percentage of revenue increased to 6.2% in the year ended December 31, 2009 compared to 4.3% in the year ended December 31, 2008, primarily as a result of increases in the amount of internal student financing that we provided to our students. We
believe that our bad debt expense as a percentage of revenue will be in the range of 4% to 6% in the fiscal year ending December 31, 2010, primarily due to the PEAKS Program which we believe will result in a reduction of the amount of internal student financing that we provide to our students.
-44-
Operating income increased $163.3 million, or 50.2%, to $488.8 million in the year ended December 31, 2009 compared to $325.5 million in the year ended December 31, 2008 as a result of the impact of the factors discussed above in connection with revenue, cost of educational services and student
services and administrative expenses. Our operating margin increased to 37.1% in the year ended December 31, 2009 compared to 32.1% in the year ended December 31, 2008, as a result of the impact of the factors discussed above.
Interest income decreased $3.2 million, or 49.4%, to $3.3 million in the year ended December 31, 2009 compared to $6.5 million in the year ended December 31, 2008, primarily due to a decrease in investment returns in the overall market. Interest expense decreased $3.9 million, or
84.3%, to $0.7 million in the year ended December 31, 2009 compared to $4.6 million in the year ended December 31, 2008, due to a decrease in the effective interest rate on our revolving credit facilities.
Our combined federal and state effective income tax rate was 38.9% in the year ended December 31, 2009 compared to 38.4% in the year ended December 31, 2008. The primary factor that contributed to the increase of 50 basis points in the effective income tax rate was the lower amount
of tax exempt investment income in 2009 compared to 2008.
Year Ended December 31, 2008 Compared with Year Ended December 31, 2007. Revenue increased $145.8 million, or 16.8%, to $1,015.3 million in the year ended December 31, 2008 compared to $869.5 million in the year ended December 31, 2007. The primary
factors that contributed to this increase included, in order of significance:
|
· |
an average 12.5% increase in total student enrollment in each academic quarter beginning in 2008 compared to 2007; and |
|
· |
a 5.0% increase in tuition rates in each of March 2008 and March 2007. |
The primary factors that contributed to the increase in student enrollment included, in order of significance:
|
· |
student enrollment growth in programs of study and at locations that were in operation prior to 2007; |
|
· |
new programs of study offered by our campuses; and |
|
· |
operating new campuses. |
Cost of educational services increased $25.2 million, or 7.0%, to $383.8 million in the year ended December 31, 2008 compared to $358.6 million in the year ended December 31, 2007. The primary factors that contributed to this increase included, in order of significance:
|
· |
the costs required to service the increased total student enrollment; and |
|
· |
increased costs associated with operating new campuses. |
The increase in cost of educational services was partially offset by, in order of significance:
|
· |
greater efficiencies in the operation of our campuses; |
|
· |
lower amortization expense due to certain assets becoming fully amortized in 2007; and |
|
· |
decreased costs associated with decreased sales of laptop computers. |
Cost of educational services as a percentage of revenue decreased 350 basis points to 37.8 % in the year ended December 31, 2008 compared to 41.3% in the year ended December 31, 2007. The primary factors that contributed to this decrease included, in order of significance:
|
· |
greater efficiencies in the operation of our campuses; |
|
· |
benefit costs increasing at a lower rate than the increase in revenue; and |
|
· |
decreased costs associated with decreased sales of laptop computers. |
-45-
The decrease in cost of educational services as a percentage of revenue was partially offset by the costs associated with operating new campuses.
Student services and administrative expenses increased $38.3 million, or 14.3%, to $306.1 million in the year ended December 31, 2008 compared to $267.8 million in the year ended December 31, 2007. The principal causes of this increase included, order of significance:
|
· |
an increase in bad debt expense associated with increases in the amount of internal student financing; |
|
· |
an increase in compensation and benefit costs associated with a greater number of employees; and |
|
· |
an increase in media advertising expenditures. |
Student services and administrative expenses decreased to 30.1% of revenue in the year ended December 31, 2008 compared to 30.8% of revenue in the year ended December 31, 2007. The primary factors that contributed to this decrease were media advertising costs and benefits costs,
which increased at a lower rate than the increase in revenue. The decrease in student services and administrative expenses as a percentage of revenue was partially offset by an increase in bad debt expense. Bad debt expense as a percentage of revenue increased to 4.3% in the year ended December 31, 2008 compared to 2.1% in the year ended December 31, 2007. The primary factor that contributed to this increase was an increase in the amount of internal student financing that we provided to our students.
Operating income increased $82.4 million, or 33.9%, to $325.5 million in the year ended December 31, 2008 compared to $243.1 million in the year ended December 31, 2007, as a result of the impact of the factors discussed above in connection with revenue, cost of educational services, and student
services and administrative expenses. Our operating margin increased to 32.1% in the year ended December 31, 2008 compared to 27.9% in the year ended December 31, 2007, as a result of the impact of the factors discussed above.
Interest income decreased $4.2 million, or 39.5%, to $6.5 million in the year ended December 31, 2008 compared to $10.7 million in the year ended December 31, 2007, due to a decrease in investment returns in the overall market, a more conservative investment strategy and lower average investment
balances. Interest expense decreased $3.7 million, or 44.4%, to $4.6 million in the year ended December 31, 2008 compared to $8.3 million in the year ended December 31, 2007, due to a decrease in the effective interest rate on our revolving credit facilities.
Our combined federal and state effective income tax rate was 38.4% in the year ended December 31, 2008 compared to 38.0% in the year ended December 31, 2007.
Financial Condition, Liquidity and Capital Resources
Cash and cash equivalents were $128.8 million as of December 31, 2009 compared to $226.3 million as of December 31, 2008. We also had short-term investments of $143.4 million as of December 31, 2009 compared to $138.7 million as of December 31, 2008. In total, our cash
and cash equivalents and short-term investments were $272.2 million as of December 31, 2009 compared to $365.0 million as of December 31, 2008. The $92.8 million decrease in cash and cash equivalents and short-term investments as of December 31, 2009 compared to December 31, 2008 was primarily due to repurchases of our common stock and the acquisition of DWC. The decrease in cash and cash equivalents and short-term investments was partially offset by increases in cash generated from operations.
We are required to recognize the funded status of our defined benefit postretirement plans on our balance sheet. We recorded an asset of $3.4 million for the ESI Pension Plan, a non-contributory defined benefit pension plan commonly referred to as a cash balance plan, and a liability
of $0.3 million for the ESI Excess Pension Plan, a nonqualified, unfunded retirement plan, on our Consolidated Balance Sheet as of December 31, 2009. In order to determine those amounts, we performed an actuarial valuation of the ESI Pension Plan and ESI Excess Pension Plan (the "Pension Plans"), and reviewed and updated our key assumptions as part of each valuation, including the discount rate and expected long-term rate of return on the investments.
Effective March 31, 2006, the benefit accruals under the Pension Plans were frozen, such that no further benefits accrue under those plans after March 31, 2006. Participants in the Pension Plans, however, continue to be credited with vesting service and interest according to the
terms of the Pension Plans. Total pension cost in the year ended December 31, 2009 was $1.7 million, compared to a pension benefit of $0.6 million in the year ended December 31, 2008 and a pension benefit of $1.1 million in the year ended December 31, 2007. In 2010, we do not expect that our pension expense will be material.
-46-
In 2009, we contributed $0.5 million to the ESI Excess Pension Plan and made no contributions to the ESI Pension Plan. We contributed $1.3 million to the ESI Excess Pension Plan and made no contributions to the ESI Pension Plan in 2008. We do not expect to make any contributions
to either of the Pension Plans in 2010.
See Note 11 of the Notes to Consolidated Financial Statements for a more detailed discussion of the Pension Plans.
Capital Resources. Our cash flows are highly dependent upon the receipt of Title IV Program funds. The primary Title IV Programs from which the
students at our campuses receive grants, loans and other aid to fund the cost of their education include:
|
· |
the FFEL program, which represented, in aggregate, approximately 66% of our cash receipts in 2009 and 66% of our cash receipts in 2008; |
|
· |
the FDL program, which represented, in aggregate, approximately 1% of our cash receipts in 2009 and 0% of our cash receipts in 2008; and |
|
· |
the Pell program, which represented, in aggregate, approximately 18% of our cash receipts in 2009 and 15% of our cash receipts in 2008. |
We also receive funds on behalf of our students from unaffiliated private education loan programs, which represented, in aggregate, approximately 5% of our cash receipts in 2009 and 9% of our cash receipts in 2008.
Under a provision of the HEA commonly referred to as the 90/10 Rule, a for-profit institution, such as each of our campus groups, must not derive more than 90% of its applicable revenue in a fiscal year, on a cash accounting basis, from Title IV Programs. If an institution exceeds
the 90% threshold for any single fiscal year, that institution would be placed on provisional certification status for the institution’s following two fiscal years. In addition, if an institution exceeds the 90% threshold for two consecutive fiscal years, it would be ineligible to participate in Title IV Programs as of the first day of the following fiscal year and would be unable to apply to regain its eligibility until the end of the second subsequent fiscal year. When calculating
its compliance with the 90/10 Rule, an institution is permitted, for the period ending in July 2011, to exclude from its revenue derived from Title IV Programs certain additional federal student loan amounts that became available to students starting in July 2008. In our 2009 and 2008 fiscal years, none of our campus groups derived more than approximately 75% of its revenue from Title IV Programs under the 90/10 Rule calculation. In the aggregate, we derived approximately 70% of our revenue
in 2009 and 72% of our revenue in 2008 from Title IV Programs under the 90/10 Rule calculation.
Federal regulations affect the timing of our receipt and disbursements of Title IV Program funds. These regulations require institutions to disburse all Title IV Program funds by payment period. For most of our campuses, the payment period is an academic term. Our
campuses generally disburse the first installment of an FFEL or FDL program loan to a first-year undergraduate student who was a first-time borrower 30 days after the student begins his or her program of study. We disburse Title IV Program funds to other students ten days before the start of each academic term.
Operations. Cash from operating activities increased $128.3 million to $301.3 million in the year ended December 31, 2009 compared to $173.0 million in the year ended December 31, 2008, primarily due to
higher student enrollments and additional financial aid available to students. The increase was partially offset by a decrease in funds received from private education loans made to our students by third-party lenders and higher income tax payments primarily resulting from higher operating income.
Accounts receivable less allowance for doubtful accounts was $85.4 million as of December 31, 2009 compared to $29.8 million as of December 31, 2008. Days sales outstanding increased 11.2 days to 21.0 days at December 31, 2009 compared to 9.8 days at December 31, 2008. Both
increases were primarily due to increases in internal student financing resulting from the reduction in the availability of third-party private education loans for our students. Although we entered into an agreement in February 2009 with an unaffiliated third-party whereby private education loans are provided to our students to help pay the students’ cost of education that student financial aid from federal, state and other sources do not cover (the “Private Student Loan Program”),
our higher student enrollment and student retention caused the demand for those private education loans to surpass the total loan amount available under the Private Student Loan Program during 2009. We believe that our days sales outstanding at the end of 2010 will be in the range of 10 to 15 days, primarily due to the PEAKS Program which we believe will result in a reduction of the amount of internal student financing that we provide to our students.
In the year ended December 31, 2008, cash from operating activities decreased $5.3 million to $173.0 million compared to $178.3 million in the year ended December 31, 2007, primarily due to a decrease in funds received from private education loans made to our students by third-party lenders
and higher income tax payments. The decrease in cash from operating activities was partially offset by increases in operating income and certain Title IV Program loan funds.
-47-
Investing. In the year ended December 31, 2009, we spent $4.2 million:
|
· |
to renovate, expand or construct buildings at 19 of our locations totaling $3.5 million; and |
|
· |
to purchase a parcel of land for $0.7 million to expand a facility. |
In the year ended December 31, 2008, we spent $18.1 million:
|
· |
to renovate, expand or construct buildings at 19 of our locations totaling $9.8 million; |
|
· |
to purchase two facilities for $6.8 million; and |
|
· |
to purchase one parcel of land for $1.5 million on which we built a facility. |
In the year ended December 31, 2007, we spent $12.6 million:
|
· |
to renovate, expand or construct buildings at 15 of our locations totaling $7.0 million; |
|
· |
to purchase two facilities for $4.1 million; and |
|
· |
to purchase one parcel of land for $1.5 million on which we built a facility. |
Capital expenditures, excluding facility and land purchases and facility construction, totaled $24.0 million in 2009, $17.5 million in 2008 and $15.5 million in 2007. These expenditures consisted primarily of classroom and laboratory equipment (such as computers and electronic equipment),
classroom and office furniture, software and leasehold improvements. We also spent $20.8 million in 2009 to acquire substantially all of the assets and assume certain liabilities of DWC. These assets included the land, buildings, furniture, equipment and other operating assets of DWC.
We plan to continue to upgrade and expand current facilities and equipment during 2010. Cash generated from operations is expected to be sufficient to fund our capital expenditure requirements.
Financing. We were a party to an Amended and Restated Credit Agreement dated December 17, 2007 and amended as of March 19, 2009 (the “Prior Credit Agreement”) with a single lender to borrow up to $160.0 million under two revolving credit facilities:
one in the maximum principal amount of $50.0 million; and the other in the maximum principal amount of $110.0 million. The borrowings under each credit facility could have been secured or unsecured at our election, provided that we had not defaulted under the Prior Credit Agreement.
Borrowings under the Prior Credit Agreement bore interest at the LIBOR, plus an applicable margin based on our indebtedness to net worth ratio, adjusted quarterly. We paid a commitment fee of 0.15% per annum of the average daily unused amount of the credit facilities. As of December 31, 2009, the borrowings under the
Prior Credit Agreement were $150.0 million, all of which were secured, and bore interest at a rate of 0.37% per annum. Approximately $158.0 million of our investments and cash equivalents held in a pledged account served as collateral for the secured borrowings as of December 31, 2009.
We entered into a Second Amended and Restated Credit Agreement dated as of January 11, 2010 and amended as of February 3, 2010 with two unaffiliated lenders (the “Restated Credit Agreement”) which amends and restates in its entirety the Prior Credit Agreement. The Restated Credit Agreement provides for two lines of
credit, one in the maximum principal amount of $100.0 million, and the other in the maximum principal amount of $50.0 million. Both lines of credit mature on May 1, 2012. The $150.0 million of borrowings outstanding under the Prior Credit Agreement continued as borrowings under the Restated Credit Agreement. Borrowings under the Restated Credit Agreement will be used to allow us to continue repurchasing shares of our common stock while maintaining compliance with certain financial
ratios required by the ED, SAs and the ACs.
Borrowings under the Restated Credit Agreement will bear interest, at our option, at LIBOR plus an applicable margin or at an alternative base rate, as defined under the Restated Credit Agreement. We pay a facility fee under the Restated Credit Agreement equal to 0.30% per annum on the daily amount of the commitment of each lender
(whether used or unused).
The borrowings under each line of credit may be secured or unsecured at our election except if an event that would be a default under the Restated Credit Agreement has occurred and is continuing, we may not elect to borrow on an unsecured basis. Cash equivalents and investments held in a pledged account serve as the collateral
for any secured borrowings under the Restated Credit Agreement. Secured borrowings may not exceed 95% of the fair market value of the collateral.
-48-
The Restated Credit Agreement contains, among other things, covenants, representations and warranties and events of default customary for credit facilities. Our material subsidiaries also guarantee the obligations under the Restated Credit Agreement. The availability of borrowings under the Restated Credit Agreement
is subject to our ability at the time of borrowing to satisfy certain specified conditions. We are required to maintain:
|
· |
a certain maximum leverage ratio at the end of each of our fiscal quarters; |
|
· |
a monthly minimum ratio of cash and investments to indebtedness; and |
|
· |
a minimum ED financial responsibility composite ratio as of the end of each fiscal year. |
We were in compliance with those requirements as of December 31, 2009.
Our Board of Directors has authorized us to repurchase shares of our common stock in the open market or through privately negotiated transactions in accordance with Rule 10b-18 of the Exchange Act. Pursuant to the Board’s stock repurchase authorization, we plan to repurchase
additional shares of our common stock from time to time in the future depending on market conditions and other considerations.
The following table sets forth our share repurchase activity during 2009, 2008 and 2007:
|
Year Ended December 31, |
|||||||||||||
|
2009 |
2008 |
2007 |
| ||||||||||
|
Repurchase authorization at beginning of period |
3,972,100 | 5,021,800 | 2,681,100 | ||||||||||
|
Additional repurchase authorization |
-- | -- | 5,000,000 | ||||||||||
|
Number of shares repurchased |
(3,477,875 | ) | (1,049,700 | ) | (2,659,300 | ) | |||||||
|
Repurchase authorization at end of period |
494,225 | 3,972,100 | 5,021,800 | ||||||||||
|
Total cost of shares repurchased (in millions) |
$ | 348.1 | $ | 87.8 | $ | 265.0 | |||||||
|
Average cost per share |
$ | 100.10 | $ | 83.62 | $ | 99.65 | |||||||
In January 2010, our Board of Directors authorized us to repurchase an additional 5.0 million shares of our common stock pursuant to our existing repurchase authorization. From February 3, 2010 through February 17, 2010, we repurchased 562,500 outstanding shares of our common stock pursuant to our existing repurchase authorization
at a total cost of $54.0 million or at an average cost per share of $95.94.
Proceeds from the exercise of stock options were $8.8 million in the year ended December 31, 2009 compared to $3.2 million in the year ended December 31, 2008 and $31.0 million in the year ended December 31, 2007. Excess tax benefits from the exercise of stock options were $5.3
million in the year ended December 31, 2009 compared to $1.2 million in the year ended December 31, 2008 and $37.5 million in the year ended December 31, 2007.
We believe that cash generated from operations and our investments will be adequate to satisfy our working capital, loan repayment and capital expenditure requirements for the foreseeable future. We also believe that any reduction in cash and cash equivalents or investments that
may result from their use to provide student financing, repay loans, repurchase shares of our common stock, purchase facilities or construct facilities will not have a material adverse effect on our expansion plans, planned capital expenditures, ability to meet any applicable regulatory financial responsibility standards or ability to conduct normal operations.
-49-
Student Financing Update. In 2008, primarily as a result of tighter credit markets, we began providing increased internal financing to our
students who failed to qualify for private education loans made by third-party lenders. This led to increases in our bad debt expense as a percentage of revenue and days sales outstanding, and a decrease in our cash flows from operating activities, in 2009 and 2008 as compared to 2007.
In February 2009, we entered into the Private Student Loan Program whereby private education loans are made to our eligible students, up to a specified amount. The Private Student Loan Program covers the three year period of 2009, 2010 and 2011. In connection with the Private Student Loan Program, we entered into the
2009 RSA. See Note 13 of the Notes to Consolidated Financial Statements and “—Off-Balance Sheet Arrangements” below for further discussion of the 2009 RSA.
On January 20, 2010, we entered into a guarantee agreement and related documents in connection with a new private education loan program for our students, the PEAKS Program. See Note 14 of the Notes to Consolidated Financial Statements and “—Off-Balance Sheet
Arrangements” below for further discussion of the PEAKS Program.
We have provided, and intend to continue providing, internal student financing to our students who fail to qualify for private education loans made by third-party lenders in 2010. The amount of internal student financing that we may need to provide our students in the fiscal year ending December 31, 2010 will depend on various
factors, including:
|
|
· |
the increased amounts of grants, loans and other federal financial aid that are available to our students under the Title IV Programs under the Ensuring Continued Access to Student Loans Act of 2008 and the American Recovery and Reinvestment Act of 2009; |
|
|
· |
the amount utilized by eligible students under the Private Student Loan Program and the PEAKS Program; and |
|
· |
the underwriting standards used by the lenders that offer other private education loans to our students. |
As a result, we believe that days sales outstanding at the end of 2010 will be in the range of 10 to 15 days and bad debt expense as a percentage of revenue in 2010 will be in the range of 4% to 6%.
In our experience so far in 2010, lenders have continued to make Title IV Program loans to our students. We have, however, fully prepared our campuses in the event that our students need to access the FDL programs for Title IV Program loans in the future.
Contractual Obligations
The following table sets forth the specified contractual obligations as of December 31, 2009:
|
Payments Due by Period |
||||||||||||||||||||
|
Less than |
1-3 | 3-5 |
More than |
|||||||||||||||||
|
Contractual Obligations |
Total |
1 Year |
Years |
Years |
5 Years |
|||||||||||||||
|
(In thousands) |
||||||||||||||||||||
|
Operating lease obligations |
$ | 185,835 | $ | 41,344 | $ | 73,607 | $ | 50,998 | $ | 19,886 | ||||||||||
|
Long-term debt, including
scheduled interest payments |
$ | 153,581 | $ | 1,538 | $ | 152,043 | $ | -- | $ | -- | ||||||||||
|
Total |
$ | 339,416 | $ | 42,882 | $ | 225,650 | $ | 50,998 | $ | 19,886 | ||||||||||
-50-
The long-term debt represents our revolving credit facilities and assumes that the $150.0 million outstanding balance under the Prior Credit Agreement as of December 31, 2009 will be outstanding at all times under the Restated Credit Agreement through the date of maturity. The amounts
shown include the principal payments that will be due upon maturity as well as interest payments and facility fees. Interest payments have been calculated based on their scheduled payment dates using the interest rate that would have been charged on our borrowings under the Restated Credit Agreement as of December 31, 2009.
Off-Balance Sheet Arrangements
As of December 31, 2009, we leased our non-owned facilities under operating lease agreements. A majority of the operating leases contain renewal options that can be exercised after the initial lease term. Renewal options are generally for periods of one to five years. All operating leases will expire over
the next 14 years and management believes that:
|
· |
those leases will be renewed or replaced by other leases in the normal course of business; |
|
· |
we may purchase the facilities represented by those leases; or |
|
· |
we may purchase or build other replacement facilities. |
There are no material restrictions imposed by the lease agreements, and we have not entered into any significant guarantees related to the leases. We are required to make additional payments under the terms of certain operating leases for taxes, insurance and other operating expenses incurred during the operating lease period.
As part of our normal course of operations, one of our insurers issues surety bonds for us that are required by various education authorities that regulate us. We are obligated to reimburse our insurer for any of those surety bonds that are paid by the insurer. As of December 31, 2009, the total face amount of those
surety bonds was approximately $20.1 million.
On January 20, 2010, we entered into a guarantee agreement and related documents in connection with the PEAKS Program. Under the PEAKS Program, an unaffiliated lender will make private education loans to our eligible students and, subsequently, sell those loans to a trust. The trust has issued Senior Debt in the aggregate
principal amount of $300.0 million to investors. The assets of the trust (which include, among other assets, the student loans held by the trust) will serve as collateral for, and are intended to be the principal source of, the repayment of the Senior Debt. The Senior Debt bears interest at a variable rate based on the LIBOR plus a margin and matures in January 2020.
In connection with the PEAKS Program, we will transfer to the trust a portion of the amount of each private student loan disbursed to us, in exchange for a subordinated note issued by the trust to us. The subordinated note does not bear interest, and principal is due following the repayment of the Senior Debt, the payment of fees
and expenses of the trust and the reimbursement of the amount of any payments made by us under the guarantee agreement. The trust will utilize the proceeds from the issuance of the Senior Debt and the subordinated note to purchase the student loans from the lender.
Under the guarantee agreement, we guarantee payment of principal, interest and certain call premiums on the Senior Debt, and administrative fees and expenses of the trust. The guarantee agreement contains, among other things, representations and warranties and events of default customary for guarantees. In addition,
under the PEAKS Program, some or all of the holders of the Senior Debt could require us to purchase their Senior Debt in certain limited circumstances that pertain to our continued eligibility to participate in the Title IV Programs. We believe that the likelihood of those limited circumstances occurring is remote. Our guarantee and purchase obligations under the PEAKS Program remain in effect until the Senior Debt and the trust’s fees and expenses are paid in full. At such
time, we will be entitled to repayment of the amount of any payments made under our guarantee and payment of the subordinated note, in each case only to the extent of available funds remaining in the trust.
See Note 14 of the Notes to Consolidated Financial Statements for further discussion of the PEAKS Program.
In February 2009, we entered into the Private Student Loan Program. In connection with the Private Student Loan Program, we entered into the 2009 RSA under which we have guaranteed the repayment of any private education loans that are charged off above a certain percentage of the private education loans made under the Private Student
Loan Program, based on the annual dollar volume. As of December 31, 2009, approximately $56.0 million of private education loans had been made under the Private Student Loan Program. Our obligations under the 2009 RSA will remain in effect until all private education loans made under the Private Student Loan Program are paid in full or charged off. The standard repayment term for a private education loan made under the Private Student Loan Program is ten years, with repayment
generally beginning six months after a student graduates or three months after a student withdraws or is terminated from his or her program of study. We did not record a liability for our guarantee obligations under the 2009 RSA as of December 31, 2009, because we do not anticipate that the amount of private education loans charged off will exceed the percentage that would require us to make a payment under our guarantee.
-51-
Pursuant to the 2009 RSA, we are required to maintain collateral for our guarantee obligation in an amount equal to a percentage of the total private education loans disbursed to our students under the Private Student Loan Program. As of December 31, 2009, the total collateral maintained in a restricted bank account was not material. The
2009 RSA also requires that we comply with certain covenants, including that we maintain certain financial ratios which are measured on a quarterly basis. We were in compliance with these covenants as of December 31, 2009.
In addition, beginning in the second fiscal quarter of 2009 we made advances to the unaffiliated third party that is holding the private education loans made to our students under the Private Student Loan Program. We made the advances, which bear interest, so that the third party could use those funds to provide additional funding
for the private education loans, instead of retaining the funds ourselves and providing internal student financing, which is non-interest bearing. The outstanding principal balance due to us from this third party as of December 31, 2009 was $12.9 million. The advances bear interest at a rate based on the prime rate plus an applicable margin. Substantially all of the assets of the third party serve as collateral for the advances. The advances are subject to customary
terms and conditions and may be repaid at any time without penalty prior to their 2024 maturity date.
We also are a party to the 2007 RSA with a different lender for certain private education loans that were made to our students in 2007 and early 2008. We guaranteed the repayment of any private education loans that the lender charges off above a certain percentage of the total dollar volume of private education loans made under
this agreement. We will have the right to pursue repayment from the borrowers for those charged off private education loans under the 2007 RSA that we pay to the lender pursuant to our guarantee obligation. The 2007 RSA was terminated effective February 22, 2008, such that no private education loans have been or will be made under the 2007 RSA after that date. Our obligations under the 2007 RSA will remain in effect until all private education loans under the agreement are paid in full or
charged off by the lender. Our recorded liability related to the 2007 RSA as of December 31, 2009 was not material.
Based on the prior repayment history of our students with respect to private education loans, we do not believe that our guarantee obligations under either RSA or the PEAKS Program will have a material adverse effect on our financial condition, results of operations or cash flows. See Note 13 of the Notes to Consolidated Financial
Statements for further discussion of the RSAs.
In the normal course of our business, we are subject to fluctuations in interest rates that could impact the return on our investments and the cost of our financing activities. Our primary interest rate risk exposure results from changes in short-term interest rates and the LIBOR.
Our investments consist primarily of government and government agency obligations and marketable debt securities. We estimate that the market risk associated with these investments can best be measured by a potential decrease in the fair value of these investments from a hypothetical 10% increase in interest rates. If
such a hypothetical increase in rates were to occur, the reduction in the market value of our portfolio of marketable securities would not be material.
Changes in the LIBOR would affect the borrowing costs associated with our revolving credit facilities. We estimate that the market risk can best be measured by a hypothetical 100 basis point increase in the LIBOR. If such a hypothetical increase in the LIBOR were to occur, the effect on results from operations and cash
flow would not have been material for the year ended December 31, 2009.
The information required by this Item appears on pages F-1 through F-31 of this Annual Report.
Not applicable.
-52-
Item 9A. Controls and Procedures.
Disclosure Controls and Procedures
We are responsible for establishing and maintaining disclosure controls and procedures (“DCP”) that are designed to ensure that information required to be disclosed by us in the reports filed or submitted by us under the Exchange Act is: (a) recorded, processed, summarized and reported within the time periods specified in the
SEC’s rules and forms; and (b) accumulated and communicated to our management, including our principal executive and principal financial officers, to allow timely decisions regarding required disclosures. In designing and evaluating our DCP, we recognize that any controls and procedures, no matter how well designed and implemented, can provide only reasonable assurance of achieving the desired control objectives, and that our management’s duties require it to make its best judgment regarding
the design of our DCP. As of December 31, 2009, we conducted an evaluation, under the supervision (and with the participation) of our management, including our Chief Executive Officer and Chief Financial Officer, of the effectiveness of the design and operation of our DCP pursuant to Rule 13a-15 of the Exchange Act. Based on that evaluation, our Chief Executive Officer and Chief Financial Officer concluded that our DCP were effective as of December 31, 2009.
Internal Control Over Financial Reporting
Management’s Annual Report on Internal Control over Financial Reporting. Our management’s report on internal control over financial reporting appears on page F-1 of this Annual Report and is incorporated herein by reference.
The effectiveness of our internal control over our financial reporting, as defined in Rules 13a-15(f) and 15d-15(f) of the Exchange Act (“ICFR”), as of December 31, 2009 has been audited by PricewaterhouseCoopers LLP, our independent registered public accounting firm, as stated in its report dated February 18, 2010, which appears
on page F-2 of this Annual Report and is incorporated herein by reference.
Changes in Internal Control over Financial Reporting. There were no changes in our ICFR that occurred during our most recently completed fiscal quarter that have materially affected, or are reasonably likely to materially affect, our ICFR.
Item 9B. Other Information.
Not applicable.
The information required by this Item concerning our audit committee members and financial expert, code of ethics and disclosure of delinquent Section 16 filers is incorporated herein by reference to our definitive Proxy Statement for our 2010 Annual Meeting of Shareholders, which will be filed with the SEC pursuant to Regulation 14A within
120 days after the end of our last fiscal year.
The following is the current biographical information with respect to our directors, our nominees for director and our executive officers. Unless otherwise specified, the occupation of each individual has been the same for the past five years.
Kevin M. Modany, age 43, has served as our Chairman since February 2008 and as our Chief Executive Officer since April 2007. He also served as our President from April 2005 through March 2009. From April 2005 through March 2007, Mr. Modany also served as our Chief Operating Officer. From January 2003 through
May 2005, he served as our Chief Financial Officer. From July 2002 through April 2005, Mr. Modany served as a Senior Vice President of ours. Mr. Modany has been a Director of ours since July 2006.
John F. Cozzi, age 48, has served as a managing director of AEA Investors LP, a private equity firm, since January 2004. Mr. Cozzi has been a Director of ours since October 2003.
John E. Dean, age 59, is an attorney who has specialized in higher education law since April 1985. Mr. Dean has been a partner at the Law Offices of John E. Dean since June 2005. He was a partner of the Dean Blakey law firm from June 2002 through May 2005. Mr. Dean has also served as a principal of Washington
Partners, LLC, a public affairs firm, since June 2002. Mr. Dean has been a Director of ours since December 1994.
James D. Fowler, Jr., age 65, served as senior vice president and director, human resources of ITT Industries, Inc., an industrial, commercial machinery and equipment company now known as ITT Corporation, from November 2000 until his retirement in October 2002. Mr. Fowler has been a Director of ours since April 1994.
-53-
Joanna T. Lau, age 51, has served as chairperson and chief executive officer of Lau Acquisition Corporation (doing business as LAU Technologies), a management consulting and investment firm, since March 1990. She is also a director of DSW Inc. During the past five years, Ms. Lau was also a director of TD Banknorth, Inc. Ms.
Lau has been a Director of ours since October 2003.
Samuel L. Odle, age 60, has served as president and chief executive officer of Methodist Hospital (“MH”) and Indiana University Hospital (“IUH”) and executive vice president of Clarian Health Partners (“Clarian”), an Indianapolis-based private, non-profit healthcare organization comprised of MH, IUH and
Riley Hospital for Children, since July 2004. Mr. Odle served as chief administrative officer of MH and senior vice president of Clarian from January 1997 through June 2004. Mr. Odle has been a Director of ours since January 2006.
Lloyd G. Waterhouse, age 58, served as chief executive officer and president of Harcourt Education, a global education company serving students and teachers, adult learners and readers, from September 2006 until his retirement in January 2008. Mr. Waterhouse served as an independent director and consultant from August 2004 through
September 2006. From April 2001 through July 2004, he served as chief executive officer and chairman of Reynolds and Reynolds Co., a leading provider of integrated solutions to automotive retailers. Mr. Waterhouse is also a director of Atlantic Mutual Insurance Companies. During the past five years, he was also a director of Digimarc Corporation and i2 Technologies, Inc. Mr. Waterhouse has been a director of ours since April 2009.
Vin Weber, age 57, has been a partner at Clark & Weinstock Inc. (“C&W”), a management and public policy consulting firm, since 1994 and the chief executive officer of C&W since 2007. He is also a director of Lenox Group, Inc. Mr. Weber has been a Director of ours since December 1994.
John A. Yena, age 69, has served as chairman of the board of Johnson & Wales University (“J&W”), a postsecondary educational institution, since June 2004. Mr. Yena served as president and chief executive officer of J&W from June 1989 through May 2004. He is also a director of Bancorp Rhode Island,
Inc. Mr. Yena has been a Director of ours since May 2006.
Clark D. Elwood, age 49, has served as an Executive Vice President and our Chief Administrative Officer since April 2009. He served as a Senior Vice President of ours from December 1996 through March 2009. Mr. Elwood has served as our Secretary since October 1992 and as our General Counsel since May 1991.
Eugene W. Feichtner, age 54, has served as an Executive Vice President and as President, ITT Technical Institute Division since April 2009. He served as our Senior Vice President, Operations from March 2004 through March 2009.
Daniel M. Fitzpatrick, age 50, has served as our Executive Vice President, Chief Financial Officer since April 2009. He served as our Senior Vice President, Chief Financial Officer from June 2005 through March 2009. From July 1998 through May 2005, he served as senior vice president and controller of Education Management
Corporation, a provider of postsecondary education.
June M. McCormack, age 61, has served as an Executive Vice President since April 2009 and as our President, Online Division since May 2008. Ms. McCormack served as executive vice president, servicing, information technology and sales marketing of SLM Corporation (“SLM”) from October 2005 through December 2007 and as
executive vice president, servicing and sales marketing of SLM from June 2004 through September 2005.
Glenn E. Tanner, age 62, has served as our Executive Vice President, Chief Marketing Officer since April 2009. He served as our Senior Vice President, Marketing from April 2007 through March 2009. From October 2002 through March 2007, Mr. Tanner served as our Vice President, Marketing.
Martin Van Buren, age 42, has served as our Executive Vice President, Chief Information Officer since April 2009. He served as our Senior Vice President, Chief Information Officer from April 2008 through March 2009. From January 2004 through March 2008, he served as our Vice President, Information Technology.
-54-
Item 11. Executive Compensation.
The information required by this Item concerning remuneration of our executive officers and directors, material transactions involving such executive officers and directors and Compensation Committee interlocks, as well as the Compensation Committee Report, are incorporated herein by reference
to our definitive Proxy Statement for our 2010 Annual Meeting of Shareholders which will be filed with the SEC pursuant to Regulation 14A within 120 days after the end of our last fiscal year.
|
Item 12. |
The information required by this Item concerning the stock ownership of management, five percent beneficial owners and securities authorized for issuance under equity compensation plans is incorporated herein by reference to our definitive Proxy Statement for our 2010 Annual Meeting of Shareholders
which will be filed with the SEC pursuant to Regulation 14A within 120 days after the end of our last fiscal year.
The information required by this Item concerning certain relationships and related person transactions, and director independence is incorporated herein by reference to our definitive Proxy Statement for our 2010 Annual Meeting of Shareholders which will be filed with the SEC pursuant to Regulation
14A within 120 days after the end of our last fiscal year.
Item 14. Principal Accountant Fees and Services.
The information required by this Item concerning the fees and services of our independent registered public accounting firm and our Audit Committee actions with respect thereto is incorporated herein by reference to our definitive Proxy Statement for our 2010 Annual Meeting of Shareholders
which will be filed with the SEC pursuant to Regulation 14A within 120 days after the end of our last fiscal year.
-55-
|
1. |
Financial Statements: |
| Page No. In This Filing | |||
|
Management’s Report on Internal Control Over Financial Reporting |
F-1 | ||
|
Report of Independent Registered Public Accounting Firm |
F-2 | ||
|
Consolidated Balance Sheets as of December 31, 2009 and 2008 |
F-3 | ||
|
Consolidated Statements of Income for the years ended December 31, 2009, 2008 and 2007 |
F-4 | ||
|
Consolidated Statements of Cash Flows for the years ended December 31, 2009, 2008 and 2007 |
F-5 | ||
|
Consolidated Statements of Shareholders’ Equity for the years ended December 31, 2009, 2008 and 2007 |
F-6 | ||
|
Notes to Consolidated Financial Statements |
F-7 | ||
2. Financial Statement Schedules:
Schedule II – Valuation and Qualifying Accounts of the Company for the years ended December 31, 2009, 2008 and 2007 appear on page F-29 of this Annual Report.
|
|
3. |
Quarterly Financial Results for 2009 and 2008 (unaudited) appear on pages F-30 through F-31 of this Annual Report. |
4. Exhibits:
A list of exhibits required to be filed as part of this report is set forth in the Index to Exhibits appearing on pages S-2 through S-4 of this Annual Report, which immediately precedes such exhibits, and is incorporated herein by reference.
-56-
Management’s Report on Internal Control Over Financial Reporting
We are responsible for establishing and maintaining adequate internal control over our financial reporting, as defined in Rules 13a-15(f) and 15d-15(f) of the Exchange Act (“ICFR”). Our ICFR is a process designed to provide reasonable assurance regarding the reliability of financial reporting and the preparation of
financial statements for external purposes in accordance with generally accepted accounting principles and includes those policies and procedures that:
|
· |
pertain to the maintenance of our records that in reasonable detail accurately and fairly reflect our transactions and asset dispositions; |
|
· |
provide reasonable assurance that our transactions are recorded as necessary to permit the preparation of our financial statements in accordance with generally accepted accounting principles; |
|
· |
provide reasonable assurance that our receipts and expenditures are being made only in accordance with authorizations of our management and Board of Directors (as appropriate); and |
|
· |
provide reasonable assurance regarding the prevention or timely detection of any unauthorized acquisition, use or disposition of our assets that could have a material effect on our financial statements. |
Reasonable assurance, as defined in Section 13(b)(7) of the Exchange Act, is the level of detail and degree of assurance that would satisfy prudent officials in the conduct of their own affairs in devising and maintaining a system of internal accounting controls.
Due to its inherent limitations, internal control over financial reporting may not prevent or detect misstatements. In addition, projections of any evaluation of effectiveness to future periods are subject to the risk that controls may become inadequate because of changes in conditions, or that the degree of compliance with the
policies or procedures may deteriorate.
Under the supervision and with the participation of our management, including our principal executive officer and principal financial officer, we assessed the effectiveness of our ICFR as of December 31, 2009. Our assessment included extensive documenting, evaluating and testing of the design and operating effectiveness of our
ICFR. In making this assessment, our management used the criteria for Internal Control-Integrated Framework set forth by The Committee of Sponsoring Organizations of the Treadway Commission. These criteria are in the areas of control environment, risk assessment, control activities, information and communication, and monitoring. Based on our assessment using these criteria, our management concluded that we maintained effective
ICFR as of December 31, 2009.
The effectiveness of our ICFR as of December 31, 2009 has been audited by PricewaterhouseCoopers LLP, our independent registered public accounting firm, as stated in its accompanying report.
F-1
Report of Independent Registered Public Accounting Firm
To the Board of Directors and Shareholders of
ITT Educational Services, Inc.:
In our opinion, the consolidated financial statements listed in the index appearing under Item 15.1 present fairly, in all material respects, the financial position of ITT Educational Services, Inc. and its subsidiaries (the “Company”) at December 31, 2009 and 2008, and the results of their operations and their
cash flows for each of the three years in the period ended December 31, 2009 in conformity with accounting principles generally accepted in the United States of America. In addition, in our opinion, the financial statement schedule listed in the index appearing under Item 15.2 presents fairly, in all material respects, the information set forth therein when read in conjunction with the related consolidated financial statements. Also in our opinion, the Company maintained, in all material
respects, effective internal control over financial reporting as of December 31, 2009, based on criteria established in Internal Control – Integrated Framework issued by the Committee of Sponsoring Organizations of the Treadway Commission (COSO). The Company’s management is responsible for these financial statements and financial statement schedule, for maintaining effective internal control over financial reporting and for its assessment
of the effectiveness of internal control over financial reporting, included in Management’s Report on Internal Control Over Financial Reporting appearing on page F-1. Our responsibility is to express opinions on these financial statements, on the financial statement schedule, and on the Company’s internal control over financial reporting based on our integrated audits. We conducted our audits in accordance with the standards of the Public Company Accounting Oversight Board (United
States). Those standards require that we plan and perform the audits to obtain reasonable assurance about whether the financial statements are free of material misstatement and whether effective internal control over financial reporting was maintained in all material respects. Our audits of the financial statements included examining, on a test basis, evidence supporting the amounts and disclosures in the financial statements, assessing the accounting principles used and significant estimates
made by management, and evaluating the overall financial statement presentation. Our audit of internal control over financial reporting included obtaining an understanding of internal control over financial reporting, assessing the risk that a material weakness exists, and testing and evaluating the design and operating effectiveness of internal control based on the assessed risk. Our audits also included performing such other procedures as we considered necessary in the circumstances. We
believe that our audits provide a reasonable basis for our opinions.
As described in Notes 1 and 11 to the consolidated financial statements, the Company changed the manner in which it accounts for direct marketing costs in 2009 and employee pension benefits in 2008.
A company’s internal control over financial reporting is a process designed to provide reasonable assurance regarding the reliability of financial reporting and the preparation of financial statements for external purposes in accordance with generally accepted accounting principles. A company’s internal control over
financial reporting includes those policies and procedures that (i) pertain to the maintenance of records that, in reasonable detail, accurately and fairly reflect the transactions and dispositions of the assets of the company; (ii) provide reasonable assurance that transactions are recorded as necessary to permit preparation of financial statements in accordance with generally accepted accounting principles, and that receipts and expenditures of the company are being made only in accordance with authorizations
of management and directors of the company; and (iii) provide reasonable assurance regarding prevention or timely detection of unauthorized acquisition, use, or disposition of the company’s assets that could have a material effect on the financial statements.
Because of its inherent limitations, internal control over financial reporting may not prevent or detect misstatements. Also, projections of any evaluation of effectiveness to future periods are subject to the risk that controls may become inadequate because of changes in conditions, or that the degree of compliance with the policies
or procedures may deteriorate.
/s/ PricewaterhouseCoopers LLP
Indianapolis, Indiana
February 18, 2010
F-2
|
ITT EDUCATIONAL SERVICES, INC. | ||||||||
|
CONSOLIDATED BALANCE SHEETS | ||||||||
|
(Dollars in thousands, except per share data) | ||||||||
| As of December 31, | ||||||||
|
2009 |
2008 |
| ||||||
|
Assets |
||||||||
|
Current assets: |
||||||||
|
Cash and cash equivalents |
$ | 128,788 | $ | 226,255 | ||||
|
Short-term investments |
143,407 | 138,709 | ||||||
|
Restricted cash |
1,891 | 10,405 | ||||||
|
Accounts receivable, less allowance for doubtful accounts of $25,227 and $16,064 |
85,426 | 29,779 | ||||||
|
Deferred income taxes |
13,799 | 12,104 | ||||||
|
Prepaid expenses and other current assets |
17,651 | 13,793 | ||||||
|
Total current assets |
390,962 | 431,045 | ||||||
|
Property and equipment, net |
195,449 | 166,671 | ||||||
|
Deferred income taxes (a) |
6,416 | 7,462 | ||||||
|
Other assets |
23,878 | 3,170 | ||||||
|
Total assets (a) |
$ | 616,705 | $ | 608,348 | ||||
|
Liabilities and Shareholders’ Equity |
||||||||
|
Current liabilities: |
||||||||
|
Accounts payable |
$ | 61,275 | $ | 54,815 | ||||
|
Accrued compensation and benefits |
26,323 | 21,133 | ||||||
|
Accrued income taxes |
10,218 | 14,976 | ||||||
|
Other accrued liabilities |
15,043 | 11,423 | ||||||
|
Deferred revenue |
171,933 | 162,206 | ||||||
|
Total current liabilities |
284,792 | 264,553 | ||||||
|
Long-term debt |
150,000 | 150,000 | ||||||
|
Other liabilities |
25,328 | 19,951 | ||||||
|
Total liabilities (a) |
460,120 | 434,504 | ||||||
|
Commitments and contingent liabilities (Note 12) |
-- | -- | ||||||
|
Shareholders' equity: |
||||||||
|
Preferred stock, $.01 par value, 5,000,000 shares authorized, none issued |
-- | -- | ||||||
|
Common stock, $.01 par value, 300,000,000 shares authorized, 54,068,904 |
||||||||
|
issued |
541 | 541 | ||||||
|
Capital surplus |
154,495 | 135,655 | ||||||
|
Retained earnings (a) |
1,006,903 | 718,100 | ||||||
|
Accumulated other comprehensive (loss) |
(10,093 | ) | (13,384 | ) | ||||
|
Treasury stock, 18,622,809 and 15,352,376 shares, at cost |
(995,261 | ) | (667,068 | ) | ||||
|
Total shareholders’ equity (a) |
156,585 | 173,844 | ||||||
|
Total liabilities and shareholders’ equity (a) |
$ | 616,705 | $ | 608,348 | ||||
| _______________ | ||||||||
| (a) The amounts as of December 31, 2008 have been retrospectively adjusted for the change in accounting for direct costs related to the enrollment of new students. See Note 1 for additional details. | ||||||||
|
The accompanying notes are an integral part of the consolidated financial statements. | ||||||||
F-3
|
ITT EDUCATIONAL SERVICES, INC. | |||||||||||||||||
|
CONSOLIDATED STATEMENTS OF INCOME | |||||||||||||||||
|
(Amounts in thousands, except per share data) | |||||||||||||||||
| Year Ended December 31, | |||||||||||||||||
|
2009 |
2008 |
|
2007 |
| |||||||||||||
|
Revenue |
$ | 1,319,194 | $ | 1,015,333 | $ | 869,508 | |||||||||||
|
Costs and expenses: |
|||||||||||||||||
|
Cost of educational services |
449,835 | 383,769 | 358,601 | ||||||||||||||
|
Student services and administrative expenses (a) |
380,567 | 306,099 | 267,815 | ||||||||||||||
|
Total costs and expenses (a) |
830,402 | 689,868 | 626,416 | ||||||||||||||
|
Operating income (a) |
488,792 | 325,465 | 243,092 | ||||||||||||||
|
Interest income |
3,291 | 6,505 | 10,747 | ||||||||||||||
|
Interest (expense) |
(726 | ) | (4,611 | ) | (8,292 | ) | |||||||||||
|
Income before provision for income taxes (a) |
491,357 | 327,359 | 245,547 | ||||||||||||||
|
Provision for income taxes (a) |
191,094 | 125,854 | 93,308 | ||||||||||||||
|
Net income (a) |
$ | 300,263 | $ | 201,505 | $ | 152,239 | |||||||||||
|
Earnings per share (a): |
|||||||||||||||||
|
Basic |
$ | 8.01 | $ | 5.18 | $ | 3.78 | |||||||||||
|
Diluted |
$ | 7.91 | $ | 5.13 | $ | 3.72 | |||||||||||
|
Weighted average shares outstanding: |
|||||||||||||||||
|
Basic |
37,490 | 38,881 | 40,268 | ||||||||||||||
|
Diluted |
37,942 | 39,243 | 40,883 | ||||||||||||||
| (a) The fiscal years ended 2008 and 2007 have been retrospectively adjusted for the change in accounting for direct costs related to the enrollment of new students. See Note 1 for additional details. | |||||||||||||||||
|
The accompanying notes are an integral part of the consolidated financial statements. | |||||||||||||||||
F-4
|
ITT EDUCATIONAL SERVICES, INC. | |||||||||||||||
|
CONSOLIDATED STATEMENTS OF CASH FLOWS | |||||||||||||||
|
(Dollars in thousands) | |||||||||||||||
| Year Ended December 31, | |||||||||||||||
|
2009 |
2008 |
2007 |
| ||||||||||||
|
Cash flows from operating activities: |
|||||||||||||||
|
Net income (a) |
$ | 300,263 | $ | 201,505 | $ | 152,239 | |||||||||
|
Adjustments to reconcile net income to net cash flows |
|||||||||||||||
|
from operating activities: |
|||||||||||||||
|
Depreciation and amortization |
24,908 | 22,230 | 23,249 | ||||||||||||
|
Provision for doubtful accounts |
81,983 | 43,286 | 18,599 | ||||||||||||
|
Deferred income taxes (a) |
(3,066 | ) | (9,389 | ) | (6,323 | ) | |||||||||
|
Excess tax benefit from stock option exercises |
(5,289 | ) | (1,158 | ) | (37,480 | ) | |||||||||
|
Stock-based compensation expense |
13,074 | 7,235 | 5,100 | ||||||||||||
|
Other |
(1,163 | ) | 1,554 | -- | |||||||||||
|
Changes in operating assets and liabilities, net of acquisition: |
|||||||||||||||
|
Restricted cash |
5,775 | (4,350 | ) | (6,087 | ) | ||||||||||
|
Accounts receivable |
(136,837 | ) | (57,933 | ) | (24,364 | ) | |||||||||
|
Accounts payable |
4,911 | 9,695 | (2,828 | ) | |||||||||||
|
Accrued income taxes |
1,010 | 10,163 | 37,969 | ||||||||||||
|
Other operating assets and liabilities |
5,334 | 1,042 | 7,252 | ||||||||||||
|
Deferred revenue |
10,355 | (50,921 | ) | 10,965 | |||||||||||
|
Net cash flows from operating activities |
301,258 | 172,959 | 178,291 | ||||||||||||
|
Cash flows from investing activities: |
|||||||||||||||
|
Facility expenditures and land purchases |
(4,236 | ) | (18,093 | ) | (12,589 | ) | |||||||||
|
Capital expenditures, net |
(23,992 | ) | (17,543 | ) | (15,514 | ) | |||||||||
|
Acquisition of college, net of cash acquired |
(20,792 | ) | -- | -- | |||||||||||
|
Proceeds from sales and maturities of investments |
242,327 | 1,085,559 | 1,963,447 | ||||||||||||
|
Purchase of investments |
(244,787 | ) | (920,480 | ) | (2,071,800 | ) | |||||||||
|
Issuance of note receivable |
(18,225 | ) | -- | -- | |||||||||||
|
Proceeds from repayments of note receivable |
5,374 | -- | -- | ||||||||||||
|
Net cash flows from investing activities |
(64,331 | ) | 129,443 | (136,456 | ) | ||||||||||
|
Cash flows from financing activities: |
|||||||||||||||
|
Excess tax benefit from stock option exercises |
5,289 | 1,158 | 37,480 | ||||||||||||
|
Proceeds from exercise of stock options |
8,800 | 3,241 | 31,002 | ||||||||||||
|
Repurchase of common stock and shares tendered for taxes |
(348,483 | ) | (87,774 | ) | (264,994 | ) | |||||||||
|
Net cash flows from financing activities |
(334,394 | ) | (83,375 | ) | (196,512 | ) | |||||||||
|
Net change in cash and cash equivalents |
(97,467 | ) | 219,027 | (154,677 | ) | ||||||||||
|
Cash and cash equivalents at beginning of period |
226,255 | 7,228 | 161,905 | ||||||||||||
|
Cash and cash equivalents at end of period |
$ | 128,788 | $ | 226,255 | $ | 7,228 | |||||||||
|
Supplemental disclosures of cash flow information: |
|||||||||||||||
|
Cash paid during the period for: |
|||||||||||||||
|
Income taxes (net of refunds) |
$ | 190,718 | $ | 123,223 | $ | 59,624 | |||||||||
|
Interest |
$ | 824 | $ | 5,036 | $ | 7,854 | |||||||||
|
Non-cash financing activities: |
|||||||||||||||
|
Issuance of treasury stock for Directors compensation |
$ | 30 | $ | 60 | $ | 60 | |||||||||
| (a) The fiscal years ended 2008 and 2007 have been retrospectively adjusted for the change in accounting for direct costs related to the enrollment of new students. See Note 1 for additional details. | |||||||||||||||
|
The accompanying notes are an integral part of the consolidated financial statements. | |||||||||||||||
F-5
|
ITT EDUCATIONAL SERVICES, INC. |
||||||||||||||||||||||||||||||||
|
CONSOLIDATED STATEMENTS OF SHAREHOLDERS' EQUITY |
||||||||||||||||||||||||||||||||
|
(Dollars and shares in thousands) |
||||||||||||||||||||||||||||||||
|
Accumulated |
||||||||||||||||||||||||||||||||
|
Other |
||||||||||||||||||||||||||||||||
|
Common Stock |
Capital |
Retained |
Comprehensive |
Common Stock in Treasury |
||||||||||||||||||||||||||||
|
Shares |
Amount |
Surplus |
Earnings |
Income (Loss) |
Shares |
Amount |
Total |
|||||||||||||||||||||||||
|
Balance as of December 31, 2006 |
54,069 | $ | 541 | $ | 83,329 | $ | 471,848 | ($6,533 | ) | (13,029 | ) | ($445,240 | ) | $ | 103,945 | |||||||||||||||||
|
Effect of change in accounting for direct marketing |
(13,187 | ) | (13,187 | ) | ||||||||||||||||||||||||||||
|
Effect of adoption of accounting for uncertain tax positions |
2,169 | 2,169 | ||||||||||||||||||||||||||||||
|
Balance as of January 1, 2007 |
54,069 | 541 | 83,329 | 460,830 | (6,533 | ) | (13,029 | ) | (445,240 | ) | 92,927 | |||||||||||||||||||||
|
Net Income |
152,239 | 152,239 | ||||||||||||||||||||||||||||||
|
Other comprehensive income: |
||||||||||||||||||||||||||||||||
|
Amortization of pension loss, net of $227 of income tax |
351 | 351 | ||||||||||||||||||||||||||||||
|
Net actuarial pension gain, net of $1,784 of income tax |
2,765 | 2,765 | ||||||||||||||||||||||||||||||
|
Comprehensive income |
155,355 | |||||||||||||||||||||||||||||||
|
Exercise of stock options |
(77 | ) | (94,246 | ) | 1,314 | 125,325 | 31,002 | |||||||||||||||||||||||||
|
Tax benefit from exercise of stock options |
38,588 | 38,588 | ||||||||||||||||||||||||||||||
|
Stock-based compensation |
5,100 | 5,100 | ||||||||||||||||||||||||||||||
|
Common shares repurchased |
(2,659 | ) | (264,994 | ) | (264,994 | ) | ||||||||||||||||||||||||||
|
Issuance of shares for Directors' compensation |
1 | 60 | 60 | |||||||||||||||||||||||||||||
|
Restricted stock cancellations and shares tendered for taxes |
77 | (2 | ) | (97 | ) | (20 | ) | |||||||||||||||||||||||||
|
Balance as of December 31, 2007 |
54,069 | 541 | 127,017 | 518,823 | (3,417 | ) | (14,375 | ) | (584,946 | ) | 58,018 | |||||||||||||||||||||
|
Net income |
201,505 | 201,505 | ||||||||||||||||||||||||||||||
|
Other comprehensive income: |
||||||||||||||||||||||||||||||||
|
Amortization of prior service cost, net of $10 of income tax |
17 | 17 | ||||||||||||||||||||||||||||||
|
Net actuarial pension loss, net of $7,237 of income tax |
(11,212 | ) | (11,212 | ) | ||||||||||||||||||||||||||||
|
Pension settlement loss, net of $599 of income tax |
928 | 928 | ||||||||||||||||||||||||||||||
|
Unrealized gain |
428 | 428 | ||||||||||||||||||||||||||||||
|
Comprehensive income |
191,666 | |||||||||||||||||||||||||||||||
|
Prior service costs, net of $83 of income tax |
(128 | ) | (128 | ) | ||||||||||||||||||||||||||||
|
Adoption of change in pension measurement date, net of $210 of income tax |
325 | 325 | ||||||||||||||||||||||||||||||
|
Exercise of stock options |
(2,528 | ) | 75 | 5,769 | 3,241 | |||||||||||||||||||||||||||
|
Tax benefit from exercise of stock options |
1,201 | 1,201 | ||||||||||||||||||||||||||||||
|
Stock-based compensation |
7,235 | 7,235 | ||||||||||||||||||||||||||||||
|
Common shares repurchased |
(1,050 | ) | (87,774 | ) | (87,774 | ) | ||||||||||||||||||||||||||
|
Issuance of shares for Directors' compensation |
(25 | ) | 1 | 85 | 60 | |||||||||||||||||||||||||||
|
Restricted stock cancellations |
202 | (3 | ) | (202 | ) | -- | ||||||||||||||||||||||||||
|
Balance as of December 31, 2008 |
54,069 | 541 | 135,655 | 718,100 | (13,384 | ) | (15,352 | ) | (667,068 | ) | 173,844 | |||||||||||||||||||||
|
Net income |
300,263 | 300,263 | ||||||||||||||||||||||||||||||
|
Other comprehensive income: |
||||||||||||||||||||||||||||||||
|
Amortization of prior service cost, net of $11 of income tax |
17 | 17 | ||||||||||||||||||||||||||||||
|
Net actuarial pension loss, net of $2,386 of income tax |
3,697 | 3,697 | ||||||||||||||||||||||||||||||
|
Pension settlement loss, net of $18 of income tax |
28 | 28 | ||||||||||||||||||||||||||||||
|
Unrealized (loss) |
(451 | ) | (451 | ) | ||||||||||||||||||||||||||||
|
Comprehensive income |
303,554 | |||||||||||||||||||||||||||||||
|
Exercise of stock options and equity awards |
(11,462 | ) | 210 | 20,262 | 8,800 | |||||||||||||||||||||||||||
|
Tax benefit from exercise of stock options and equity award vesting |
5,766 | 5,766 | ||||||||||||||||||||||||||||||
|
Stock-based compensation |
13,074 | 13,074 | ||||||||||||||||||||||||||||||
|
Common shares repurchased |
(3,478 | ) | (348,123 | ) | (348,123 | ) | ||||||||||||||||||||||||||
|
Issuance of shares for Directors' compensation |
2 | 1 | 28 | 30 | ||||||||||||||||||||||||||||
|
Shares tendered for taxes |
(4 | ) | (360 | ) | (360 | ) | ||||||||||||||||||||||||||
|
Balance of December 31, 2009 |
54,069 | $ | 541 | $ | 154,495 | $ | 1,006,903 | ($10,093 | ) | (18,623 | ) | ($995,261 | ) | $ | 156,585 | |||||||||||||||||
|
The accompanying notes are an integral part of the consolidated financial statements. |
||||||||||||||||||||||||||||||||
F-6
ITT EDUCATIONAL SERVICES, INC.
NOTES TO CONSOLIDATED FINANCIAL STATEMENTS
(Dollars in thousands, except per share data and unless otherwise stated)
1. Business and Significant Accounting Policies
Business. We are a leading for-profit provider of postsecondary education in the United States based on revenue and student enrollment. As of
December 31, 2009, we were offering master, bachelor and associate degree programs to approximately 80,000 students and had 125 locations (including 121 campuses and four learning sites) in 38 states. All of our locations are authorized by the applicable education authorities of the states in which they operate and are accredited by an accrediting commission recognized by the United States Department of Education (“ED”). We have provided career-oriented education programs since
1969 under the “ITT Technical Institute” name and since June 2009 under the “Daniel Webster College” (“DWC”) name. Our corporate headquarters are located in Carmel, Indiana.
Basis of Presentation. The consolidated financial statements include our wholly-owned subsidiaries’ accounts and have been prepared in accordance
with generally accepted accounting principles in the United States of America (“GAAP”) and pursuant to the rules and regulations of the U.S. Securities and Exchange Commission (“SEC”). All significant intercompany balances and transactions are eliminated upon consolidation. Arrangements where we may have a variable interest in another party are evaluated in accordance with the provisions of Financial Accounting Standards Board (“FASB”) Accounting Standards
Codification TM (“ASC” or “Codification”) 810, “Consolidation” (“ASC 810”), to determine whether we would be required to include the financial results of the other party in our consolidated financial statements. As of December 31, 2009, we were not required to include the financial results of any variable interest entity in our consolidated financial statements. Certain
reclassifications have been made in the consolidated financial statements of prior years to conform to the current year presentation. These reclassifications have no impact on previously reported net income, total shareholders’ equity or cash flows.
Use of Estimates. The preparation of these consolidated financial statements, in accordance with GAAP, includes estimates and assumptions that are determined
by our management. Actual results could differ materially from the estimates. Significant accounting estimates and assumptions are used for, but not limited to:
|
· |
the allowance for doubtful accounts; |
|
· |
useful lives of tangible and intangible assets; |
|
· |
self insurance; |
|
· |
pension liabilities; |
|
· |
stock-based compensation; |
|
· |
unrecognized tax benefits; and |
|
· |
litigation exposures. |
Change in Accounting for Direct Marketing Costs. In the fourth quarter of 2009, we changed our accounting for direct costs that relate to the enrollment of new students (“Direct Marketing Costs”) to expense those costs in the period incurred. Previously,
we capitalized Direct Marketing Costs and amortized those costs over the period during which the associated revenue was recognized. We evaluated both principles of accounting and determined that expensing Direct Marketing Costs in the period incurred is a preferable accounting principle under GAAP, primarily because it will improve the comparability of our financial statements to those of other publicly-traded companies in our industry, who generally expense such costs as incurred, and will improve
the overall transparency of our financial results.
As required under the guidance for voluntary changes in accounting principles, our comparative consolidated financial statements presented for prior years have been adjusted to apply our new accounting principle for Direct Marketing Costs retrospectively. The following tables set forth the effect that the change in accounting for
Direct Marketing Costs had on our 2009 financial results, including the associated effect on our deferred income taxes:
F-7
|
Consolidated Statement of Income |
Year Ended December 31, 2009 |
|||||||||||
|
As Computed Under Old Method |
As Reported Under New Method |
Effect of Change |
||||||||||
|
Revenue |
$ | 1,319,194 | $ | 1,319,194 | $ | -- | ||||||
|
Cost of educational services |
449,835 | 449,835 | -- | |||||||||
|
Student services and administrative expenses |
375,689 | 380,567 | 4,878 | |||||||||
|
Total costs and expenses |
825,524 | 830,402 | 4,878 | |||||||||
|
Operating income |
493,670 | 488,792 | (4,878 | ) | ||||||||
|
Interest income |
3,291 | 3,291 | -- | |||||||||
|
Interest (expense) |
(726 | ) | (726 | ) | -- | |||||||
|
Income before provision for income taxes |
496,235 | 491,357 | (4,878 | ) | ||||||||
|
Provision for income taxes |
192,998 | 191,094 | (1,904 | ) | ||||||||
|
Net income |
$ | 303,237 | $ | 300,263 | $ | (2,974 | ) | |||||
|
Earnings per share: |
||||||||||||
|
Basic |
$ | 8.09 | $ | 8.01 | $ | (0.08 | ) | |||||
|
Diluted |
$ | 7.99 | $ | 7.91 | $ | (0.08 | ) | |||||
|
Consolidated Balance Sheet |
As of December 31, 2009 |
|||||||||||
|
(Selected line items) |
||||||||||||
|
As Computed Under Old Method |
As Reported Under New Method |
Effect of Change |
||||||||||
|
Total current assets |
390,962 | 390,962 | -- | |||||||||
|
Property and equipment, net |
195,449 | 195,449 | -- | |||||||||
|
Direct marketing costs, net |
27,850 | -- | (27,850 | ) | ||||||||
|
Deferred income taxes |
-- | 6,416 | 6,416 | |||||||||
|
Other assets |
23,878 | 23,878 | -- | |||||||||
|
Total assets |
$ | 638,139 | $ | 616,705 | $ | (21,434 | ) | |||||
|
Total current liabilities |
284,792 | 284,792 | -- | |||||||||
|
Long-term debt |
150,000 | 150,000 | -- | |||||||||
|
Deferred income taxes |
4,453 | -- | (4,453 | ) | ||||||||
|
Other liabilities |
25,328 | 25,328 | -- | |||||||||
|
Total liabilities |
464,573 | 460,120 | (4,453 | ) | ||||||||
|
Preferred stock |
-- | -- | -- | |||||||||
|
Common stock |
541 | 541 | -- | |||||||||
|
Capital surplus |
154,495 | 154,495 | -- | |||||||||
|
Retained earnings |
1,023,884 | 1,006,903 | (16,981 | ) | ||||||||
|
Accumulated other comprehensive (loss) |
(10,093 | ) | (10,093 | ) | -- | |||||||
|
Treasury stock, at cost |
(995,261 | ) | (995,261 | ) | -- | |||||||
|
Total shareholders' equity |
173,566 | 156,585 | (16,981 | ) | ||||||||
|
Total liabilities and shareholders' equity |
$ | 638,139 | $ | 616,705 | $ | (21,434 | ) | |||||
F-8
|
Consolidated Statement of Cash Flow |
Year Ended December 31, 2009 |
|||||||||||
|
(Selected line items) |
||||||||||||
|
As Computed Under Old Method |
As Reported Under New Method |
Effect of Change |
||||||||||
|
Net income |
$ | 303,237 | $ | 300,263 | $ | (2,974 | ) | |||||
|
Adjustments to reconcile net income to net cash |
||||||||||||
|
flows from operating activities: |
||||||||||||
|
Depreciation and amortization |
24,908 | 24,908 | -- | |||||||||
|
Provision for doubtful accounts |
81,983 | 81,983 | -- | |||||||||
|
Deferred income taxes |
(1,162 | ) | (3,066 | ) | (1,904 | ) | ||||||
|
Excess tax benefit from stock option exercises |
(5,289 | ) | (5,289 | ) | -- | |||||||
|
Stock-based compensation expense |
13,074 | 13,074 | -- | |||||||||
|
Other |
(1,163 | ) | (1,163 | ) | -- | |||||||
|
Changes in operating assets and liabilities, net of acquisition: |
||||||||||||
|
Direct marketing costs, net |
(4,878 | ) | -- | 4,878 | ||||||||
|
Other operating assets and liabilities |
(109,452 | ) | (109,452 | ) | -- | |||||||
|
Net cash flows from operating activities |
301,258 | 301,258 | -- | |||||||||
|
Net cash flows from investing activities |
(64,331 | ) | (64,331 | ) | -- | |||||||
|
Net cash flows from financing activities |
(334,394 | ) | (334,394 | ) | -- | |||||||
|
Net change in cash and cash equivalents |
(97,467 | ) | (97,467 | ) | -- | |||||||
|
Cash and cash equivalents at beginning of period |
226,255 | 226,255 | -- | |||||||||
|
Cash and cash equivalents at end of period |
$ | 128,788 | $ | 128,788 | $ | -- | ||||||
The following tables set forth the effect that the change in accounting for Direct Marketing Costs had on our prior period financial results, including the associated effect on our deferred income taxes, for the periods indicated:
|
Consolidated Statement of Income |
Year Ended December 31, 2008 |
|||||||||||
|
As Originally Reported |
As Adjusted |
Effect of Change |
||||||||||
|
Revenue |
$ | 1,015,333 | $ | 1,015,333 | $ | -- | ||||||
|
Cost of educational services |
383,769 | 383,769 | -- | |||||||||
|
Student services and administrative expenses |
303,693 | 306,099 | 2,406 | |||||||||
|
Total costs and expenses |
687,462 | 689,868 | 2,406 | |||||||||
|
Operating income |
327,871 | 325,465 | (2,406 | ) | ||||||||
|
Interest income |
6,505 | 6,505 | -- | |||||||||
|
Interest (expense) |
(4,611 | ) | (4,611 | ) | -- | |||||||
|
Income before provision for income taxes |
329,765 | 327,359 | (2,406 | ) | ||||||||
|
Provision for income taxes |
126,793 | 125,854 | (939 | ) | ||||||||
|
Net income |
$ | 202,972 | $ | 201,505 | $ | (1,467 | ) | |||||
|
Earnings per share: |
||||||||||||
|
Basic |
$ | 5.22 | $ | 5.18 | $ | (0.04 | ) | |||||
|
Diluted |
$ | 5.17 | $ | 5.13 | $ | (0.04 | ) | |||||
F-9
|
Consolidated Statement of Income |
Year Ended December 31, 2007 |
|||||||||||
|
As Originally Reported |
As Adjusted |
Effect of Change |
||||||||||
|
Revenue |
$ | 869,508 | $ | 869,508 | $ | -- | ||||||
|
Cost of educational services |
358,601 | 358,601 | -- | |||||||||
|
Student services and administrative expenses |
268,876 | 267,815 | (1,061 | ) | ||||||||
|
Total costs and expenses |
627,477 | 626,416 | (1,061 | ) | ||||||||
|
Operating income |
242,031 | 243,092 | 1,061 | |||||||||
|
Interest income |
10,747 | 10,747 | -- | |||||||||
|
Interest (expense) |
(8,292 | ) | (8,292 | ) | -- | |||||||
|
Income before provision for income taxes |
244,486 | 245,547 | 1,061 | |||||||||
|
Provision for income taxes |
92,894 | 93,308 | 414 | |||||||||
|
Net income |
$ | 151,592 | $ | 152,239 | $ | 647 | ||||||
|
Earnings per share: |
||||||||||||
|
Basic |
$ | 3.77 | $ | 3.78 | $ | 0.01 | ||||||
|
Diluted |
$ | 3.71 | $ | 3.72 | $ | 0.01 | ||||||
|
Consolidated Balance Sheet |
As of December 31, 2008 |
|||||||||||
|
(Selected line items) |
||||||||||||
|
As Originally Reported |
As Adjusted |
Effect of Change |
||||||||||
|
Total current assets |
431,045 | 431,045 | -- | |||||||||
|
Property and equipment, net |
166,671 | 166,671 | -- | |||||||||
|
Direct marketing costs, net |
22,973 | -- | (22,973 | ) | ||||||||
|
Deferred income taxes |
-- | 7,462 | 7,462 | |||||||||
|
Other assets |
3,170 | 3,170 | -- | |||||||||
|
Total assets |
$ | 623,859 | $ | 608,348 | $ | (15,511 | ) | |||||
|
Total current liabilities |
264,553 | 264,553 | -- | |||||||||
|
Long-term debt |
150,000 | 150,000 | -- | |||||||||
|
Deferred income taxes |
1,504 | -- | (1,504 | ) | ||||||||
|
Other liabilities |
19,951 | 19,951 | -- | |||||||||
|
Total liabilities |
436,008 | 434,504 | (1,504 | ) | ||||||||
|
Preferred stock |
-- | -- | -- | |||||||||
|
Common stock |
541 | 541 | -- | |||||||||
|
Capital surplus |
135,655 | 135,655 | -- | |||||||||
|
Retained earnings |
732,107 | 718,100 | (14,007 | ) | ||||||||
|
Accumulated other comprehensive (loss) |
(13,384 | ) | (13,384 | ) | -- | |||||||
|
Treasury stock, at cost |
(667,068 | ) | (667,068 | ) | -- | |||||||
|
Total shareholders' equity |
187,851 | 173,844 | (14,007 | ) | ||||||||
|
Total liabilities and shareholders' equity |
$ | 623,859 | $ | 608,348 | $ | (15,511 | ) | |||||
As a result of the accounting change, retained earnings as of January 1, 2008 decreased from $531,363 as originally reported, to $518,823 under the new accounting method of expensing Direct Marketing Costs as incurred.
F-10
|
Consolidated Statement of Cash Flow |
Year Ended December 31, 2008 |
|||||||||||
|
(Selected line items) |
||||||||||||
|
As Originally Reported |
As Adjusted |
Effect of Change |
||||||||||
|
Net income |
$ | 202,972 | $ | 201,505 | $ | (1,467 | ) | |||||
|
Adjustments to reconcile net income to net cash |
||||||||||||
|
flows from operating activities: |
||||||||||||
|
Depreciation and amortization |
22,230 | 22,230 | -- | |||||||||
|
Provision for doubtful accounts |
43,286 | 43,286 | -- | |||||||||
|
Deferred income taxes |
(8,450 | ) | (9,389 | ) | (939 | ) | ||||||
|
Excess tax benefit from stock option exercises |
(1,158 | ) | (1,158 | ) | -- | |||||||
|
Stock-based compensation expense |
7,235 | 7,235 | -- | |||||||||
|
Other |
1,554 | 1,554 | -- | |||||||||
|
Changes in operating assets and liabilities: |
||||||||||||
|
Direct marketing costs, net |
(2,406 | ) | -- | 2,406 | ||||||||
|
Other operating assets and liabilities |
(92,304 | ) | (92,304 | ) | -- | |||||||
|
Net cash flows from operating activities |
172,959 | 172,959 | -- | |||||||||
|
Net cash flows from investing activities |
129,443 | 129,443 | -- | |||||||||
|
Net cash flows from financing activities |
(83,375 | ) | (83,375 | ) | -- | |||||||
|
Net change in cash and cash equivalents |
219,027 | 219,027 | -- | |||||||||
|
Cash and cash equivalents at beginning of period |
7,228 | 7,228 | -- | |||||||||
|
Cash and cash equivalents at end of period |
$ | 226,255 | $ | 226,255 | $ | -- | ||||||
|
Consolidated Statement of Cash Flow |
Year Ended December 31, 2007 |
|||||||||||
|
(Selected line items) |
||||||||||||
|
As Originally Reported |
As Adjusted |
Effect of Change |
||||||||||
|
Net income |
$ | 151,592 | $ | 152,239 | $ | 647 | ||||||
|
Adjustments to reconcile net income to net cash |
||||||||||||
|
flows from operating activities: |
||||||||||||
|
Depreciation and amortization |
23,249 | 23,249 | -- | |||||||||
|
Provision for doubtful accounts |
18,599 | 18,599 | -- | |||||||||
|
Deferred income taxes |
(6,737 | ) | (6,323 | ) | 414 | |||||||
|
Excess tax benefit from stock option exercises |
(37,480 | ) | (37,480 | ) | -- | |||||||
|
Stock-based compensation expense |
5,100 | 5,100 | -- | |||||||||
|
Changes in operating assets and liabilities: |
||||||||||||
|
Direct marketing costs, net |
1,061 | -- | (1,061 | ) | ||||||||
|
Other operating assets and liabilities |
22,907 | 22,907 | -- | |||||||||
|
Net cash flows from operating activities |
178,291 | 178,291 | -- | |||||||||
|
Net cash flows from investing activities |
(136,456 | ) | (136,456 | ) | -- | |||||||
|
Net cash flows from financing activities |
(196,512 | ) | (196,512 | ) | -- | |||||||
|
Net change in cash and cash equivalents |
(154,677 | ) | (154,677 | ) | -- | |||||||
|
Cash and cash equivalents at beginning of period |
161,905 | 161,905 | -- | |||||||||
|
Cash and cash equivalents at end of period |
$ | 7,228 | $ | 7,228 | $ | -- | ||||||
Cash Equivalents. Highly liquid investments purchased with an original maturity of three months or less are considered cash equivalents.
Restricted Cash. The funds from the federal student financial aid programs under Title IV (“Title IV Programs”) of the Higher Education
Act of 1965, as amended (“HEA”), and certain other monies transferred to us by electronic funds transfer are subject to holding restrictions, generally from three to seven days, before they can be drawn into our cash account. The funds subject to these holding periods are identified as restricted cash until they are applied to the students' accounts. In addition, the state education regulations in one state require us to maintain an escrow account as a condition to operating
our campus in that state. We also maintain an escrow account for a guarantee obligation to an unaffiliated third party under a private education loan program for our students. The funds in both of these escrow accounts are considered restricted cash and classified as other assets. The aggregate balance in these escrow accounts as of December 31, 2009 and December 31, 2008 was not material.
F-11
Investments. We classify our investments in marketable securities as available-for-sale or held-to-maturity depending on our investment intentions with regard to those securities on the date of acquisition. Investments
are classified as either current or non-current based on the maturity date of each security. Variable rate demand notes classified as available-for-sale, however, are included in current assets despite the long-term contractual maturity if we have the ability to liquidate these investments within one year.
The cost of securities sold is based on the specific identification method.
Accounts Receivable and Allowance for Doubtful Accounts. We extend unsecured credit to our students for tuition and fees and we record a receivable for the tuition and fees earned in excess of the payment received from or on behalf of a student. The
individual student balances of these receivables are insignificant. We record an allowance for doubtful accounts with respect to accounts receivable based on the students’ credit profiles and our historical collection experience related to amounts owed by our students with similar credit profiles. If our collection trends were to differ significantly from our historical collection experience, we would make a corresponding adjustment to our allowance for doubtful accounts.
When a student is no longer enrolled in a program of study at one of our campuses, we increase the allowance for doubtful accounts related to the former student’s receivable balance to reflect the amount we estimate will not be collected. The amount that we estimate will not be collected is based on a review of the historical
collection experience for each campus, adjusted as needed to reflect other facts and circumstances. We review the collection activity after a student withdraws or graduates from a campus and will write off the accounts receivable if we conclude that collection of the balance is not probable.
Property and Equipment. Property and equipment is recorded in our consolidated financial statements at cost, less accumulated depreciation and amortization. Maintenance
and repairs are expensed as incurred. Expenditures that extend the useful lives of our assets are capitalized.
Developed or purchased software is capitalized in accordance with ASC 350, “Intangibles – Goodwill and Other.” Facility construction costs are capitalized as incurred, with depreciation commencing when the facility is placed in service. We capitalize
interest on our real estate construction projects in accordance with ASC 835, “Interest.”
Provisions for depreciation and amortization of property and equipment have generally been made using the straight-line method over the following ranges of useful lives:
|
Type of Property and Equipment |
Estimated Useful Life | |
|
Furniture and equipment |
3 to 10 years | |
|
Leasehold, building and land improvements |
3 to 14 years | |
|
Buildings |
20 to 40 years | |
|
Software |
3 to 8 years |
We amortize leasehold improvements using the straight-line method over the shorter of the life of the improvement or the term of the underlying lease. Land is not depreciated.
We regularly review our long-lived assets for impairment whenever events or changes in circumstances indicate that their carrying amounts may not be recoverable. If we determine that the carrying amount of a long-lived asset exceeds the total amount of the estimated undiscounted
future cash flows from that asset, we would determine the fair value of that asset using a discounted cash flows model. If the amount of discounted cash flows is less than the net book value of the long-lived asset, we recognize an impairment loss in the amount of the difference. We base our impairment analyses of long-lived assets on our current business strategy, expected growth rates and estimates of future economic and regulatory conditions.
Insurance Liabilities. We record liabilities and related expenses for medical, workers compensation and other insurance in accordance with the contractual terms of the insurance policies. We record
the total liabilities that are estimable and probable as of the reporting date for our insurance liabilities that we self-insure. The accounting for our self-insured arrangements involves estimates and judgments to determine the liability to be recorded for reported claims and claims incurred but not reported. We consider our historical experience in determining the appropriate insurance reserves to record. If our current insurance claim trends were to differ significantly from
our historic claim experience, however, we would make a corresponding adjustment to our insurance reserves.
F-12
Contingent Liabilities. We are subject to various claims and contingencies in the ordinary course of our business, including those related to litigation, business transactions, employee-related matters and
taxes, among others. When we are aware of a claim or potential claim, we assess the likelihood of any loss or exposure. If it is probable that a loss will result and the amount of the loss can be reasonably estimated, we record a liability for the loss. The liability recorded includes probable and estimable legal costs associated with the claim or potential claim. If the loss is not probable or the amount of the loss cannot be reasonably estimated, we disclose the claim if the
likelihood of a potential loss is reasonably possible and the amount involved is material.
Guarantees. In accordance with ASC 460, “Guarantees,” we recognize a liability for the fair value of a guarantee obligation upon its issuance. We evaluate the fair value of our guarantee
obligations periodically and adjust the liability as warranted. The fair market value of our guarantees related to certain private student loan programs were estimated based on historical charge off experience with respect to private loans made to our students and the present value of the expected cash flows, taking into consideration current economic conditions, that may result from the settlement of the guarantee obligations in the future.
Treasury Stock. Repurchases of outstanding shares of our common stock are recorded at cost. Treasury stock issued in fulfillment of stock-based
compensation awards or other obligations is accounted for under the last in, first out method. We record “losses” from the sale of treasury stock that exceed previous net “gains” from the sale of treasury stock as a charge to retained earnings.
Fair Value and Credit Risk of Financial Instruments. In February 2008, the FASB delayed the effective date of fair value disclosures for nonfinancial assets and nonfinancial liabilities to fiscal years
beginning after November 15, 2008, except for items that are recognized or disclosed at fair value in the financial statements on a recurring basis. This guidance was included in the Codification under ASC 820, “Fair Value Measurements and Disclosures” (“ASC 820”). This provision of ASC 820 was effective for us beginning on January 1, 2009. The adoption of this guidance did not have a material impact on our consolidated financial statements, because we do not have any nonfinancial
assets or nonfinancial liabilities recognized or disclosed at fair value.
ASC 820 defines fair value for financial reporting as the price that would be received upon the sale of an asset or paid upon the transfer of a liability in an orderly transaction between market participants at the measurement date. The fair value measurement of our financial assets utilized assumptions categorized as observable
inputs under ASC 820. Observable inputs are assumptions based on independent market data sources.
In April 2009, the FASB provided additional guidance for estimating fair value when the volume and level of activity for the asset or liability have significantly decreased. This guidance was included in the Codification under ASC 820. This guidance became effective for us beginning with our disclosures for our second fiscal quarter
of 2009. The adoption of this guidance did not have a material impact on our consolidated financial statements.
The following table sets forth information regarding the fair value measurement of our financial assets as of December 31, 2009:
|
Fair Value Measurements at Reporting Date Using |
||||||||||||||||
|
(Level 1) |
(Level 2) |
(Level 3) |
||||||||||||||
|
Description |
As of 12/31/2009 |
Quoted Prices in Active Markets for Identical Assets |
Significant Other Observable Inputs |
Significant Unobservable Inputs |
||||||||||||
|
Cash equivalents |
$ | 124,347 | $ | 124,347 | $ | -- | $ | -- | ||||||||
|
Restricted cash |
1,751 | 1,751 | -- | -- | ||||||||||||
|
Short-term investments |
143,407 | 81,591 | 61,816 | -- | ||||||||||||
| $ | 269,505 | $ | 207,689 | $ | 61,816 | $ | -- | |||||||||
We used quoted prices in active markets for identical assets as of the measurement date to value our financial assets that were categorized as Level 1. For assets that were categorized in Level 2, we used:
|
· |
quoted prices for similar assets in active markets; |
|
· |
quoted prices for identical or similar assets in markets that were not active or in which little public information had been released; |
|
· |
inputs other than quoted prices that were observable for the assets; or |
|
· |
inputs that were principally derived from or corroborated by observable market data by correlation or other means. |
The carrying amounts for cash and cash equivalents, restricted cash, accounts receivable, accounts payable, other accrued liabilities and deferred revenue approximate fair value because of the immediate or short-term maturity of these financial instruments. Investments classified
as available-for-sale are recorded at their market value.
F-13
The fair value of a note receivable included in other assets on our Consolidated Balance Sheet as of December 31, 2009 is estimated by discounting the future cash flows using current rates for similar arrangements. As of December 31, 2009 each of the carrying value and the estimated
fair value of the note receivable was $12,851.
The fair value of our long-term debt is estimated by discounting the future cash flows using current rates for similar loans with similar characteristics and remaining maturities. As of December 31, 2009, the carrying value of our long-term debt was $150,000 and the estimated fair value
was approximately $150,000.
Financial instruments that potentially subject us to credit risk consist primarily of accounts receivable, interest-bearing investments and a note receivable. There is no concentration of credit risk of our accounts receivable, as the total is comprised of a large number of individual
balances owed by students whose credit profiles vary and who are located throughout the United States. Our interest-bearing investments generally consist of high-quality securities issued by various entities and major financial institutions. Substantially all of the assets of the party to whom we issued a note serve as collateral for the repayment of the note.
Recognition of Revenue. Tuition revenue is recorded on a straight-line basis over the length of the applicable course. If a student withdraws
from an institution, the standards of most state education authorities that regulate our institutions, the accrediting commissions that accredit our institutions and our own internal policy limit a student’s obligation for tuition and fees to the institution depending on when a student withdraws during an academic term (“Refund Policies”). The terms of the Refund Policies vary by state, and the limitations imposed by the Refund Policies are generally based on the portion of the academic
term that has elapsed at the time the student withdraws. Generally, the greater the portion of the academic term that has elapsed at the time the student withdraws, the greater the student’s obligation is to the institution for the tuition and fees related to that academic term. We record revenue net of any refunds that result from any applicable Refund Policy. On an individual student basis, tuition earned in excess of cash received is recorded as accounts receivable, and
cash received in excess of tuition earned is recorded as deferred revenue.
Tuition revenue includes textbooks students use in their programs of study. We record the cost of these textbooks in prepaid expenses and other current assets and amortize the cost of textbooks on a straight-line basis over the applicable course length. Laptop computer
and tool kit sales, and the related cost of each, are recognized when the student receives the laptop computer or tool kit. Academic fees (which are charged only one time to students on their first day of class attendance) are recognized as revenue on a straight-line basis over the average program length. If a student withdraws from an institution, all unrecognized revenue relating to his or her fees, net of any refunds that result from any applicable Refund Policy, is recognized upon the
student’s departure. An administrative fee is charged to a student and recognized as revenue when the student withdraws or graduates from a program of study at an institution.
We report 12 weeks of tuition revenue in each of our four fiscal quarters. We standardized the number of weeks of revenue reported in each fiscal quarter, because the timing of student breaks in a calendar quarter can fluctuate from quarter to quarter each year. The total number of weeks
of school during each year is 48.
Advertising Costs. We expense all advertising costs as incurred.
Equity-Based Compensation. Stock-based compensation cost for our equity instruments exchanged for employee and director services is measured at the date of grant, based on the calculated fair value
of the grant and is recognized as an expense on a straight-line basis over the period of time that the grantee must provide services to us before the stock-based compensation is fully vested. The vesting period is generally the period set forth in the agreement granting the stock-based compensation. Under the terms of our stock-based compensation plans, some grants immediately vest in full when the grantee’s employment or service terminates, or when he or she is eligible to retire. As
a result, in certain circumstances, the period of time that the grantee must provide services to us in order for that stock-based compensation to fully vest may be less than the vesting period set forth in the agreement granting the stock-based compensation. In these instances, compensation expense will be recognized over this shorter period.
We use a binomial option pricing model to determine the fair value of stock options granted and we use the market price of our common stock to determine the fair value of restricted stock and restricted stock units (“RSUs”) granted. The binomial option pricing model takes into account the variables defined below:
|
· |
“Volatility” is a statistical measure of the extent to which the stock price is expected to fluctuate during a period and combines our historical stock price volatility and the implied volatility as measured by actively traded stock options. |
|
· |
“Expected life” is the weighted average period that those stock options are expected to remain outstanding, based on the historical patterns of our stock option exercises, as adjusted to reflect the current position-level demographics of the stock option grantees. |
|
· |
“Risk-free interest rate” is based on interest rates for terms that are similar to the expected life of the stock options. |
|
· |
“Dividend yield” is based on our historical and expected future dividend payment practices. |
F-14
We generally issue shares of our common stock from treasury shares upon the exercise of stock options or vesting of RSUs. As of December 31, 2009, 18,622,809 shares of our common stock were held in treasury. Our Board of Directors has authorized us to repurchase outstanding shares of our common stock, but we are unable
to determine at this point how many shares we will repurchase over the next 12 months. See Note 4 for additional disclosures regarding our stock repurchases.
Operating Leases. We lease our non-owned facilities under operating lease agreements. Common provisions within our operating lease agreements include:
|
· |
renewal options, which can be exercised after the initial lease term; |
|
· |
rent escalation clauses; |
|
· |
tenant improvement allowances; and |
|
· |
rent holidays. |
We record the rent expense associated with each operating lease agreement evenly over the term of the lease. The difference between the amount of rent expense recorded and the amount of rent actually paid is recorded as accrued rent, which is included in other liabilities, on our Consolidated Balance Sheets.
Income Taxes. We account for income taxes using the asset and liability method, which requires the recognition of deferred tax assets and liabilities for expected future tax consequences of temporary differences
that currently exist between the tax bases and financial reporting bases of our assets and liabilities.
We follow the guidance under ASC 740, “Income Taxes,” which prescribes a single, comprehensive model for how a company should recognize, measure, present and disclose in its financial statements uncertain tax positions that the company has taken or expects to take on its tax returns. This guidance requires us to evaluate
whether it is more likely than not, based on the technical merits of a tax position, that the benefits resulting from the position will be realized by us.
We record interest and penalties related to unrecognized tax benefits in income tax expense.
Earnings Per Common Share. Earnings per common share for all periods have been calculated in conformity with ASC 260, “Earnings Per Share.” This data
is based on historical net income and the weighted average number of shares of our common stock outstanding during each period as set forth in the following table:
|
Year Ended December 31, | ||||||
|
2009 |
2008 |
2007 |
||||
|
(In thousands) | ||||||
|
Shares: |
||||||
|
Weighted average number of shares |
||||||
|
of common stock outstanding |
37,490 |
38,881 |
40,268 |
|||
|
Shares assumed issued (less shares |
||||||
|
assumed purchased for treasury) for |
||||||
|
stock-based compensation |
452 |
362 |
615 |
|||
|
Outstanding shares for diluted |
||||||
|
earnings per share calculation |
37,942 |
39,243 |
40,883 |
|||
A total of 272,279 shares for fiscal year 2009, 396,226 shares for fiscal year 2008 and 14,146 shares for fiscal year 2007 have been excluded from the calculation of our diluted earnings per common share because the effect was anti-dilutive.
New Accounting Guidance.
In December 2008, the FASB issued guidance which required enhanced disclosures about plan assets in an employer’s defined benefit pension or other postretirement plan. This guidance was included in the Codification under ASC 715, “Compensation – Retirement Benefits” (“ASC 715”). These disclosures
are intended to provide users of financial statements with a greater understanding of how investment allocation decisions are made, the major categories of plan assets, the inputs and valuation techniques used to measure the fair value of plan assets and significant concentrations of risk within plan assets. This provision of ASC 715 became effective for our plan asset disclosures for our fiscal year ended December 31, 2009 and is included in Note 11.
In June 2009, the FASB established the Codification as the source of authoritative accounting principles recognized by the FASB to be applied by nongovernmental entities in the preparation of financial statements in accordance with GAAP. This guidance was included in the Codification under ASC 105, “Generally Accepted Accounting
Principles.” All prior accounting standard documents were superseded by the Codification and any accounting literature not included in the Codification is no longer authoritative. Rules and interpretive releases of the SEC issued under the authority of federal securities laws will continue to be sources of authoritative GAAP for SEC registrants. The Codification became effective for us beginning with our third fiscal quarter of 2009. Therefore, all references made by us
to GAAP in our notes to consolidated financial statements use the new Codification numbering system. The Codification does not change or alter existing GAAP and, therefore, did not have any impact on our consolidated financial statements.
F-15
In May 2009, the FASB established general standards of accounting for and disclosure of events that occur after the balance sheet date but before financial statements are issued. This guidance was included in the Codification under ASC 855, “Subsequent Events,” and became effective for us beginning with our second fiscal
quarter of 2009. We performed an evaluation of subsequent events through February 18, 2010, and we issued our consolidated financial statements on February 19, 2010.
See Note 1 – Fair Value and Credit Risk of Financial Instruments and Note 7 for a discussion of additional new accounting guidance that became effective for us beginning with our second fiscal quarter of 2009.
The following new accounting guidance became effective for us beginning with our first fiscal quarter of 2009:
|
|
· |
Accounting for financial guarantee insurance contracts, including the recognition and measurement of premium revenue and claim liabilities, was included in the Codification under ASC 944, “Financial Services – Insurance.” The adoption of this guidance did not have a material impact on our consolidated financial statements. |
|
|
· |
Expanded disclosure requirements for derivative instruments and hedging activities were included in the Codification under ASC 815, “Derivatives and Hedging.” The adoption of this guidance did not have a material impact on our consolidated financial statements. |
|
|
· |
Accounting and reporting standards for the noncontrolling interest of a subsidiary and for the deconsolidation of a subsidiary were included in the Codification under ASC 810. The adoption of this guidance did not have a material impact on our consolidated financial statements. |
|
|
· |
Principles and requirements for how a company recognizes and measures assets, liabilities and noncontrolling interests acquired or assumed in a business combination were included in the Codification under ASC 805, “Business Considerations” (“ASC 805”). See Note 2 for the application of this guidance. |
|
|
· |
Reporting requirements for transactions between participants in a collaborative arrangement and between participants in the arrangement and third parties and the definition of collaborative arrangements were included in the Codification under ASC 808, “Collaborative Arrangements.” The adoption of this guidance did not have a material impact on our consolidated financial statements. |
See Note 1 – Fair Value and Credit Risk of Financial Instruments for a discussion of additional new accounting guidance that became effective for us beginning with our first fiscal quarter of 2009.
In January 2010, the FASB issued Accounting Standards Update No. 2010-06, which will be included in the Codification under ASC 820 and requires the disclosure of transfers between the observable input categories and activity in the unobservable input category for fair value measurements. The guidance also requires disclosures about
the inputs and valuation techniques used to measure fair value. This guidance became effective for our interim and annual reporting periods beginning January 1, 2010. The adoption of this guidance will not have a material impact on our consolidated financial statements.
In June 2009, the FASB set forth certain requirements to improve the financial reporting by enterprises involved with variable interest entities and to provide more relevant and reliable information to users of financial statements. This guidance was included in the Codification under ASC 810 and became effective for our interim
and annual reporting periods beginning January 1, 2010. The adoption of this guidance will not have a material impact on our consolidated financial statements.
Also in June 2009, the FASB provided guidance to improve transparency about transfers of financial assets and a transferor’s continuing involvement, if any, with transferred financial assets. It also clarified the requirement for isolation and limitations on portions of financial assets that are eligible for sale accounting,
eliminated exceptions for qualifying special-purpose entities from the consolidation guidance and eliminated the exception that permitted sale accounting for certain mortgage securitizations when a transferor has not surrendered control over the financial assets. This guidance was included in the Codification under ASC 860, “Transfers and Servicing” and became effective for our interim and annual reporting periods beginning January 1, 2010. The adoption of this guidance will
not have a material impact on our consolidated financial statements.
|
2. |
Acquisition |
On June 10, 2009, we acquired substantially all of the assets and assumed certain liabilities of DWC for approximately $20,800 in cash, net of cash acquired. Approximately $20,600 of the amount we paid was used to satisfy certain liabilities of DWC that we did not assume in the acquisition. DWC’s campus is located
in Nashua, New Hampshire. DWC is authorized by the New Hampshire Postsecondary Education Commission and is accredited by the Commission on Institutions of Higher Education of the New England Association of Schools and Colleges. DWC offers programs of study at the master, bachelor and associate degree levels both in residence and through distance education.
F-16
Our consolidated financial statements include the results of operations of DWC from the acquisition date. The revenue and expenses of DWC included in our Consolidated Statements of Income for the year ended December 31, 2009 were not material. Our revenue, net income and earnings per share would not have been materially
affected if the revenue and expenses of DWC were presented for the years ended December 31, 2009 and 2008 as if the transaction had occurred at the beginning of each of those reporting periods.
The acquisition of DWC has been accounted for in accordance with ASC 805 which requires the use of the acquisition method of accounting for all business combinations. The purchase price was allocated to identifiable net assets, with the excess of the estimated fair value of
the net assets acquired over the consideration paid recognized as a gain. The gain was not material and was recorded in “Student services and administrative expenses” in our Consolidated Statements of Income for the year ended December 31, 2009.
The following table sets forth the fair values allocated to the major classes of assets acquired and liabilities assumed in the DWC acquisition as of the acquisition date:
|
Assets Acquired |
Liabilities Assumed |
|||||||
|
Cash and other current assets |
$ | 1,011 | ||||||
|
Land, buildings, furniture and equipment |
25,445 | |||||||
|
Intangibles |
870 | |||||||
|
Accounts payable and other liabilities |
$ | 5,621 | ||||||
| $ | 27,326 | $ | 5,621 | |||||
3. Equity Compensation Plans
We have adopted the following equity compensation plans, referred to collectively as the “Plans”:
|
· |
2006 ITT Educational Services, Inc. Equity Compensation Plan – Awards may be granted to our employees and directors under the 2006 ITT Educational Services, Inc. Equity Compensation Plan (“2006 Equity Compensation Plan”) in the form of stock options (incentive and nonqualified),
stock appreciation rights (“SARs”), restricted stock, RSUs, performance shares, performance units and other stock-based awards as defined in the plan. The maximum number of shares of our common stock that may be issued pursuant to awards under this plan is 4,000,000. Each share underlying stock options and SARs granted and not forfeited or terminated, reduces the number of shares available for future awards by one share. The delivery of a share in connection with a
“full-value award” (i.e., an award of restricted stock, RSUs, performance shares, performance units or any other stock-based award with value denominated in shares) reduces the number of shares remaining for other awards by three shares. As of December 31, 2009, restricted stock, RSUs and nonqualified stock options have been awarded under this plan. |
|
· |
1999 Outside Directors Stock Option Plan – A maximum of 500,000 shares of our common stock were available to be issued upon the exercise of nonqualified stock options granted to non-employee directors under the 1999 Outside Directors Stock Option Plan (“1999 Directors Stock Plan”). |
|
· |
1997 ITT Educational Services, Inc. Incentive Stock Plan – A maximum of 8,100,000 shares of our common stock were available to be issued upon the exercise of stock options and pursuant to other forms of awards under the 1997 ITT Educational
Services, Inc. Incentive Stock Plan (“1997 Stock Plan”), but no more than 20% of the total number of shares on a cumulative basis could have been used for restricted stock or performance share awards. A maximum of 1.5% of our outstanding shares of common stock could have been issued annually, with any unissued shares available to be issued in later years. |
No additional awards have been or will be granted after May 9, 2006 under the 1999 Directors Stock Plan or the 1997 Stock Plan.
The stock-based compensation expense and related income tax benefit recognized in our Consolidated Statements of Income in the periods indicated were as follows:
|
Year Ended December 31, |
||||||||||||
|
2009 |
2008 |
2007 |
||||||||||
|
Stock-based compensation expense |
$ | 13,074 | $ | 7,235 | $ | 5,100 | ||||||
|
Income tax (benefit) |
$ | (5,034 | ) | $ | (2,785 | ) | $ | (1,963 | ) | |||
F-17
We did not capitalize any stock-based compensation cost in the years ended December 31, 2009, 2008 and 2007.
As of December 31, 2009, we estimated that pre-tax compensation expense for unvested stock-based compensation grants in the amount of approximately $14,350, net of estimated forfeitures, will be recognized in future periods. This expense will be recognized over the remaining service period applicable to the grantees which, on a
weighted-average basis, is approximately 1.8 years.
Stock Options. Under the Plans, the stock option exercise price may not be less than 100% of the fair market value of our common stock on the date of grant. The
maximum term of any stock option granted under the 2006 Equity Compensation Plan may not exceed seven years from the date of grant, and those stock options will be exercisable at such times and under conditions as determined by the Compensation Committee of our Board of Directors, subject to the limitations contained in the plan.
Under the 1999 Directors Stock Plan, the stock options granted typically vested and became exercisable on the first anniversary of the grant. The maximum term of any stock option granted under the 1999 Directors Stock Plan was: (a) 10 years from the date of grant for any stock options granted prior
to January 25, 2005; and (b) seven years from the date of grant for any stock options granted on or after January 25, 2005.
Under the 1997 Stock Plan, the stock options granted typically vest and become exercisable in three equal annual installments commencing with the first anniversary of the date of grant. The maximum term of any stock option granted under the 1997 Stock Plan was 10 years and two days
from the date of grant.
The stock options granted, forfeited, exercised and expired in the period indicated were as follows:
|
Year Ended December 31, 2009 | |||||||||||||||
|
Weighted |
Weighted |
||||||||||||||
|
Average |
Aggregate |
Average |
Aggregate | ||||||||||||
|
# of |
Exercise |
Exercise |
Remaining |
Intrinsic | |||||||||||
|
Shares |
Price |
Price |
Contractual Term |
Value (1) | |||||||||||
|
Outstanding at beginning of period |
1,561,517 | $ | 54.89 | $ | 85,710 | ||||||||||
|
Granted |
258,000 | $ | 121.56 | 31,362 | |||||||||||
|
Forfeited |
(3,667 | ) | $ | 48.60 | (178 | ) | |||||||||
|
Exercised |
(210,044 | ) | 41.89 | (8,800 | ) | ||||||||||
|
Expired |
-- | -- | -- | ||||||||||||
|
Outstanding at end of period |
1,605,806 | $ | 67.31 | $ | 108,094 |
4.5 years |
$45,999 | ||||||||
|
Exercisable at end of period |
1,153,025 | $ | 52.20 | $ | 60,185 |
3.5 years |
$50,459 | ||||||||
_____________________________
|
|
(1) |
The aggregate intrinsic value of the stock options was calculated by multiplying the number of shares subject to the options outstanding or exercisable, as applicable, by the closing market price of our common stock on December 31, 2009, and subtracting the applicable aggregate exercise price. |
The following table sets forth information regarding the stock options granted and exercised in the periods indicated:
|
Year Ended December 31, |
||||||||||||
|
2009 |
2008 |
2007 |
||||||||||
|
Shares subject to stock options granted |
258,000 | 177,543 | 245,362 | |||||||||
|
Weighted average grant date fair value |
$ | 54.05 | $ | 36.83 | $ | 30.05 | ||||||
|
Shares subject to stock options exercised |
210,044 | 75,435 | 1,313,746 | |||||||||
|
Intrinsic value of stock options exercised |
$ | 14,626 | $ | 3,165 | $ | 100,544 | ||||||
|
Proceeds received from stock options exercised |
$ | 8,800 | $ | 3,241 | $ | 31,002 | ||||||
|
Tax benefits realized from stock options exercised |
$ | 5,475 | $ | 1,201 | $ | 38,588 | ||||||
The intrinsic value of a stock option is the difference between the fair market value of the stock and the option exercise price. The fair value of each stock option grant was estimated on the date of grant using the following assumptions:
|
Year Ended December 31, | |||||
|
2009 |
2008 |
2007 | |||
|
Risk-free interest rates |
1.6 % |
2.7% |
4.5% - 4.8% | ||
|
Expected lives (in years) |
4.5 |
4.0 |
4.7 | ||
|
Volatility |
54 % |
53% |
35% | ||
|
Dividend yield |
None |
None |
None | ||
F-18
Restricted Stock and RSUs. Under the 1997 Stock Plan, restricted shares awarded were subject to a restriction period set by the Compensation Committee of our Board of Directors, during which time the shares
may not be sold, transferred, assigned or pledged. For restricted stock awards issued under the 1997 Stock Plan, the restriction period ends on the third anniversary of the date of grant. Under the 2006 Equity Compensation Plan, restricted shares and RSUs awarded are subject to a restriction period of at least: (a) three years in the case of a time-based period of restriction; and (b) one year in the case of a performance-based period of restriction. All restricted shares and RSUs awarded
under the 2006 Equity Compensation Plan as of December 31, 2009 have a time-based restriction period that ends on the third anniversary of the date of grant, except for one grant of 18,249 RSUs made in 2007 which has a time-based restriction period that ends on the fifth anniversary of the date of grant.
The following table sets forth the number of shares of restricted stock and RSUs that were granted, forfeited and vested in the period indicated:
|
Year Ended December 31, 2009 |
||||||||||||||||
|
# of Shares of Restricted Stock |
Weighted Average Grant Date Fair Value |
# of RSUs |
Weighted Average Grant Date Fair Value |
|||||||||||||
|
Unvested at beginning of period |
19,440 | $ | 61.05 | 95,079 | $ | 82.95 | ||||||||||
|
Granted |
-- | -- | 37,362 | $ | 116.30 | |||||||||||
|
Forfeited |
-- | -- | (6,847 | ) | $ | 93.28 | ||||||||||
|
Vested |
(19,440 | ) | $ | 61.05 | (44 | ) | $ | 68.28 | ||||||||
|
Unvested at end of period |
-- | $ | -- | 125,550 | $ | 92.31 | ||||||||||
The total fair market value of the restricted stock and RSUs vested during the year ended December 31, 2009 was $1,942.
4. Stock Repurchases
As of December 31, 2009, 494,225 shares remained available for repurchase under the share repurchase program (the “Repurchase Program”) authorized by our Board of Directors. The terms of the Repurchase Program provide that we may repurchase shares of our common stock, from time to time depending on market conditions
and other considerations, in the open market or through privately negotiated transactions in accordance with Rule 10b-18 of the Securities Exchange Act of 1934, as amended (the “Exchange Act”). Unless earlier terminated by our Board of Directors, the Repurchase Program will expire when we repurchase all shares authorized for repurchase thereunder.
The following table sets forth information regarding the shares of our common stock that we repurchased in the periods indicated:
|
Year Ended December 31, |
||||||||
|
2009 |
2008 |
|||||||
|
Number of shares |
3,477,875 | 1,049,700 | ||||||
|
Total cost |
$ | 348,123 | $ | 87,774 | ||||
|
Average price per share |
$ | 100.10 | $ | 83.62 | ||||
In January 2010, our Board of Directors authorized us to repurchase an additional 5,000,000 shares of our common stock pursuant to our existing repurchase authorization. From February 3, 2010 through February 17, 2010, we repurchased 562,500 outstanding shares of our common stock
pursuant to our existing repurchase authorization at a total cost of $53,964 or at an average cost per share of $95.94.
5. Debt
We were a party to an Amended and Restated Credit Agreement dated December 17, 2007 and amended as of March 19, 2009 (the “Prior Credit Agreement”) with a single lender to borrow up to $160,000 under two revolving credit facilities: one in the maximum principal amount of $50,000; and the other in the maximum principal amount of
$110,000. The borrowings under each credit facility could have been secured or unsecured at our election, provided that we had not defaulted under the Prior Credit Agreement.
Borrowings under the Prior Credit Agreement bore interest at the London Interbank Offered Rate (the “LIBOR”), plus an applicable margin based on our indebtedness to net worth ratio, adjusted quarterly. We paid a commitment fee of 0.15% per annum of the average daily
unused amount of the credit facilities. As of December 31, 2009, the borrowings under the Prior Credit Agreement were $150,000, all of which were secured, and bore interest at a rate of 0.37% per annum. Approximately $157,950 of our investments and cash equivalents held in a pledged account served as collateral for the secured borrowings as of December 31, 2009.
We entered into a Second Amended and Restated Credit Agreement dated as of January 11, 2010 and amended as of February 3, 2010 with two unaffiliated lenders (the “Restated Credit Agreement”) which amends and restates in its entirety the Prior Credit Agreement. The Restated Credit Agreement provides for two lines of
credit, one in the maximum principal amount of $100,000, and the other in the maximum principal amount of $50,000. Both lines of credit mature on May 1, 2012. The $150,000 of borrowings outstanding under the Prior Credit Agreement continued as borrowings under the Restated Credit Agreement. Borrowings under the Restated Credit Agreement will be used to allow us to continue repurchasing shares of our common stock while maintaining compliance with certain financial ratios required
by various education authorities that regulate us.
F-19
Borrowings under the Restated Credit Agreement will bear interest, at our option, at LIBOR plus an applicable margin or at an alternative base rate, as defined under the Restated Credit Agreement. We pay a facility fee under the Restated Credit Agreement equal to 0.30% per annum on the daily amount of the commitment of each lender
(whether used or unused).
The borrowings under each line of credit may be secured or unsecured at our election except if an event that would be a default under the Restated Credit Agreement has occurred and is continuing, we may not elect to borrow on an unsecured basis. Cash equivalents and investments held in a pledged account serve as the collateral
for any secured borrowings under the Restated Credit Agreement. Secured borrowings may not exceed 95% of the fair market value of the collateral.
The Restated Credit Agreement contains, among other things, covenants, representations and warranties and events of default customary for credit facilities. Our material subsidiaries also guarantee the obligations under the Restated Credit Agreement. The availability
of borrowings under the Restated Credit Agreement is subject to our ability at the time of borrowing to satisfy certain specified conditions. We are required to maintain a certain maximum leverage ratio at the end of each of our fiscal quarters, a monthly minimum ratio of cash and investments to indebtedness and a minimum ED financial responsibility composite ratio as of the end of each fiscal year. We were in compliance with those requirements as of December 31, 2009.
We recognized interest expense on our borrowings of $717 in the year ended December 31, 2009, $4,559 in the year ended December 31, 2008 and $8,208 in the year ended December 31, 2007.
|
6. |
Financial Aid Programs |
We participate in various Title IV Programs of the HEA. In 2009, approximately 70% of our revenue determined on a cash accounting basis under the calculation of the provision of the HEA commonly referred to as the “90/10 Rule” was from funds distributed under these programs.
We administer the Title IV Programs in separate accounts as required by government regulation. We are required to administer the funds in accordance with the requirements of the HEA and the ED’s regulations and must use due diligence in approving and disbursing funds and servicing loans.
In the event we do not comply with federal requirements, or if student loan default rates rise to a level considered excessive by the federal government, we could lose our eligibility to participate in Title IV Programs or could be required to repay funds determined to have been improperly disbursed. Our management believes that we are in substantial compliance with the federal requirements.
7. Investments
In April 2009, the FASB amended the other-than-temporary impairment guidance for debt securities to make the guidance more operational and to improve the presentation and disclosure of other-than-temporary impairments on debt and equity securities in the financial statements. This
guidance was included in the Codification under ASC 320, “Investments – Debt and Equity Securities,” and became effective for us beginning with our disclosures for the second fiscal quarter of 2009. The adoption of this guidance did not have a material impact on our consolidated financial statements, because we did not hold any investments that were considered other-than-temporarily impaired.
The following table sets forth how our investments were classified on our Consolidated Balance Sheets as of the dates indicated:
|
As of December 31, |
||||||||||||||||||||||||
|
2009 |
2008 |
|||||||||||||||||||||||
|
Available-
For-Sale |
Held-to-Maturity |
Total |
Available-
For-Sale |
Held-to-Maturity |
Total |
|||||||||||||||||||
|
Short-term investments |
$ | 143,407 | $ | -- | $ | 143,407 | $ | 138,709 | $ | -- | $ | 138,709 | ||||||||||||
F-20
The following table sets forth the aggregate fair value, amortized cost basis and the net unrealized gains and losses included in accumulated other comprehensive income (loss) of our available-for-sale investments as of the dates indicated:
|
As of: |
||||||||||||||||||||||||
|
December 31, 2009 |
December 31, 2008 |
|||||||||||||||||||||||
|
Aggregate Fair Value |
Amortized Cost |
Net Unrealized Gains (Losses) |
Aggregate Fair Value |
Amortized Cost |
Net Unrealized Gains |
|||||||||||||||||||
|
Available-for-Sale Investments: |
||||||||||||||||||||||||
|
Variable rate demand notes |
$ | -- | $ | -- | $ | -- | $ | 30,500 | $ | 30,500 | $ | -- | ||||||||||||
|
Government obligations |
81,591 | 81,634 | (43 | ) | 53,056 | 52,910 | 146 | |||||||||||||||||
|
Government agency obligations |
27,932 | 27,969 | (37 | ) | 29,641 | 29,476 | 165 | |||||||||||||||||
|
Corporate obligations |
28,747 | 28,690 | 57 | 25,512 | 25,395 | 117 | ||||||||||||||||||
| $ | 138,270 | $ | 138,293 | $ | (23 | ) | $ | 138,709 | $ | 138,281 | $ | 428 | ||||||||||||
We also held a certificate of deposit with a total principal value of $5,137 as of December 31, 2009. This investment is included in short-term investments on our Consolidated Balance Sheet.
The following table sets forth the unrealized gains and losses on available-for-sale investments that were included in other comprehensive income (loss) in the periods indicated:
|
Year Ended December 31, |
||||||||||||
|
2009 |
2008 |
2007 |
||||||||||
|
Unrealized gains |
$ | -- | $ | 428 | $ | -- | ||||||
|
Unrealized losses |
$ | (451 | ) | -- | -- | |||||||
No unrealized gains or losses were reclassified out of our accumulated other comprehensive income (loss) during our fiscal years ended December 31, 2008 and 2007. We recognized $177 of investment gains in our Consolidated Statement of Income for the year ended December 31, 2009.
The following table sets forth the components of investment income included in interest income in our Consolidated Statements of Income in the periods indicated:
|
Year Ended December 31, |
||||||||||||
|
2009 |
2008 |
2007 |
||||||||||
|
Realized gains on the sale of investments |
$ | 177 | $ | -- | $ | -- | ||||||
|
Interest income |
3,114 | 6,498 | 10,566 | |||||||||
| $ | 3,291 | $ | 6,498 | $ | 10,566 | |||||||
The following table sets forth the contractual maturities of our debt securities classified as available-for-sale as of December 31, 2009:
|
Contractual Maturity |
Available-for-Sale |
|||
|
Due within five years |
$ | 138,270 | ||
|
Due after five years through ten years |
-- | |||
|
Due after ten years |
-- | |||
| $ | 138,270 | |||
8. Property and Equipment
The following table sets forth our property and equipment, net, as of the dates indicated:
|
As of December 31, |
||||||||
|
2009 |
2008 |
|||||||
|
Furniture and equipment |
$ | 139,982 | $ | 118,840 | ||||
|
Buildings and building improvements |
122,270 | 102,584 | ||||||
|
Land and land improvements |
39,613 | 34,809 | ||||||
|
Leasehold improvements |
14,000 | 10,467 | ||||||
|
Software |
8,620 | 8,459 | ||||||
|
Construction in progress |
1,987 | 2,570 | ||||||
| 326,472 | 277,729 | |||||||
|
Less: Accumulated depreciation and amortization |
(131,023 | ) | (111,058 | ) | ||||
|
Property and equipment, net |
$ | 195,449 | $ | 166,671 | ||||
F-21
Software includes purchased and internally developed software.
The following table sets forth the depreciation and amortization expense in the periods indicated:
|
Year Ended December 31, |
||||||||||||
|
2009 |
2008 |
2007 |
||||||||||
|
Depreciation and amortization expense |
$ | 24,895 | $ | 22,230 | $ | 23,249 | ||||||
|
9. |
Note Receivable |
Beginning in the second quarter of 2009, we made advances to an unaffiliated third party, whose purpose is to purchase private education loans and sell participation interests in those loans. The third party used the advances from us to provide partial funding for private education loans made to our students. The outstanding
principal balance due to us from this third party as of December 31, 2009 was $12,851. The advances bear interest at a rate based on the prime rate plus an applicable margin. Substantially all of the assets of the third party serve as collateral for the advances. The advances are subject to customary terms and conditions and may be repaid at any time without penalty prior to their 2024 maturity date.
As a result of those advances, we held a variable interest in this third party, but we are not considered the primary beneficiary for purposes of including the financial results of this third party in our consolidated financial statements. If we had been required to include the financial results of this third party in our consolidated
financial statements for the year ended December 31, 2009, it would not have had a material effect.
10. Income Taxes
The following table sets forth the components of the provision for income taxes in the periods indicated:
|
Year Ended December 31, |
||||||||||||
|
2009 |
2008 |
2007 |
||||||||||
|
Current income tax expense: |
||||||||||||
|
U.S. federal |
$ | 165,806 | $ | 116,016 | $ | 85,282 | ||||||
|
State and local |
28,354 | 19,227 | 14,349 | |||||||||
|
Total |
$ | 194,160 | $ | 135,243 | $ | 99,631 | ||||||
|
Deferred income tax expense (benefit): |
||||||||||||
|
U.S. federal |
(2,579 | ) | (7,898 | ) | (5,321 | ) | ||||||
|
State and local |
(487 | ) | (1,491 | ) | (1,002 | ) | ||||||
|
Total |
(3,066 | ) | (9,389 | ) | (6,323 | ) | ||||||
|
Total provision for income taxes |
$ | 191,094 | $ | 125,854 | $ | 93,308 | ||||||
The following table sets forth the components of our deferred income tax assets (liabilities) as of the dates indicated:
|
As of December 31, |
||||||||
|
2009 |
2008 |
|||||||
|
Capitalized software |
$ | (109 | ) | $ | (717 | ) | ||
|
Deferral of book costs |
(2,259 | ) | (1,744 | ) | ||||
|
Property and equipment |
(5,257 | ) | (663 | ) | ||||
|
Pension |
(1,187 | ) | -- | |||||
|
Other |
(1,838 | ) | (1,455 | ) | ||||
|
Gross deferred tax liabilities |
$ | (10,650 | ) | $ | (4,579 | ) | ||
|
Deferred revenue |
3,426 | 2,592 | ||||||
|
Accounts receivable |
9,846 | 6,270 | ||||||
|
Legal accrual |
1,486 | 1,118 | ||||||
|
Compensation and benefits |
1,904 | 4,030 | ||||||
|
Stock-based compensation |
10,129 | 5,531 | ||||||
|
Operating leases |
1,952 | 1,725 | ||||||
|
Pension |
-- | 760 | ||||||
|
Other |
2,122 | 2,119 | ||||||
|
Gross deferred tax assets |
$ | 30,865 | $ | 24,145 | ||||
|
Net deferred income tax asset |
$ | 20,215 | $ | 19,566 | ||||
F-22
The difference between the U.S. federal statutory income tax rate and our effective income tax rate as a percentage of income in the periods indicated is reconciled in the following table:
|
Year Ended December 31, | ||||||
|
2009 |
2008 |
2007 |
||||
|
U.S. federal statutory income tax rate |
35.0% |
35.0% |
35.0% |
|||
|
State income taxes, net of federal benefit |
3.6% |
3.6% |
3.5% |
|||
|
Other |
0.3% |
(0.2%) |
(0.5%) |
|||
|
Effective income tax rate |
38.9% |
38.4% |
38.0% |
|||
The following table sets forth the activity with respect to our unrecognized tax benefits in the period indicated:
|
Year Ended December 31, | ||||||||||||||
|
2009 |
2008 |
|
2007 |
| ||||||||||
|
Balance as of January 1 |
$ | 10,889 | $ | 8,564 | $ | 6,820 | ||||||||
| Increases (decreases) from: | ||||||||||||||
|
Tax positions taken during a prior period |
-- | -- | -- | |||||||||||
|
Tax positions taken during the current period |
3,053 | 2,851 | 3,050 | |||||||||||
|
Settlements with taxing authorities |
(505 | ) | -- | (1,084 | ) | |||||||||
|
Lapse of statute of limitations |
(163 | ) | (526 | ) | (222 | ) | ||||||||
|
Balance as of December 31 |
$ | 13,274 | $ | 10,889 | $ | 8,564 | ||||||||
The amount of unrecognized tax benefits that, if recognized, would have affected our effective tax rate as of December 31, 2009 was $10,227. We do not expect the amount of our unrecognized tax benefits to significantly increase or decrease during the next 12 months. The amount of interest and penalties related to unrecognized
tax benefits accrued on our Consolidated Balance Sheets was $961 as of December 31, 2009 and $821 as of December 31, 2008. In each of the years ended December 31, 2009, 2008 and 2007, the amount of interest expense and penalties related to our unrecognized tax benefits that we recognized in our Consolidated Statement of Income was not material.
We file income tax returns in the United States (federal) and in various state and local jurisdictions. As of December 31, 2009, we were no longer subject to federal, state or local income tax examinations for tax years prior to 2006, except in 12 states where we are still subject to income tax examinations for tax years 2001 through
2005.
11. Employee Benefit Plans
Employee Pension Benefits. Our ESI Pension Plan, a non-contributory defined benefit pension plan, commonly referred to as a cash balance plan, covers
substantially all of our employees who began their employment with us prior to June 2, 2003. This plan provides benefits based on an employee’s annual earnings times an established percentage of pay determined by the employee’s age and years of benefit service. Effective June 2, 2003, we closed participation in the ESI Pension Plan to all new employees. Employees who begin their employment with us on or after June 2, 2003 do not participate in the ESI Pension Plan.
Our ESI Excess Pension Plan, a nonqualified, unfunded retirement plan, covers a select group of our management. The purpose of the ESI Excess Pension Plan is to restore benefits earned, but not available, to eligible employees under the ESI Pension Plan due to federal statutory limitations
on the amount of benefits that can be paid and compensation that may be recognized under a tax-qualified retirement plan.
The benefit accruals under the ESI Pension Plan and the ESI Excess Pension Plan for all participants in those plans were frozen effective March 31, 2006, such that no further benefits accrue under those plans after March 31, 2006. Participants in those plans, however, continue to
be credited with vesting service and interest according to the terms of the ESI Pension Plan and the ESI Excess Pension Plan.
Effective January 1, 2008, we changed the term of the required vesting service under the ESI Pension Plan from five years to three years. This change resulted in the recognition of $128, net of tax, of prior service costs in accumulated other comprehensive income on our Consolidated Balance Sheet as of December 31, 2008.
Effective December 31, 2008, we adopted the measurement date provisions of ASC 715, which require a company to measure the funded status of a defined benefit postretirement plan as of the date of the company’s year end balance sheet. We utilized the pension measurements as
of September 30, 2007 to determine the amount of the net periodic benefit cost allocated to the three month period ended December 31, 2007 for the transition to a calendar year-end measurement date. We recognized a benefit of $325, net of income tax, in our retained earnings as of December 31, 2008, as a result of our adoption of the measurement date provisions.
The information presented below is based on an actuarial valuation date as of December 31 for 2009 and 2008.
F-23
The following table sets forth the change in projected benefit obligation for the periods indicated:
|
Year Ended December 31, |
||||||||
|
2009 |
2008 |
|||||||
|
Projected benefit obligation at beginning of year |
$ | 51,308 | $ | 54,276 | ||||
|
Service cost |
-- | -- | ||||||
|
Actuarial loss (gain) |
2,975 | (2,133 | ) | |||||
|
Interest cost |
3,104 | 3,859 | ||||||
|
Benefits paid |
(3,533 | ) | (4,905 | ) | ||||
|
Plan amendments |
-- | 211 | ||||||
|
Projected benefit obligation at end of year |
$ | 53,854 | $ | 51,308 | ||||
|
Fair value of plan assets at end of year |
56,966 | 49,458 | ||||||
|
Funded (unfunded) status at end of year |
$ | 3,112 | $ | (1,850 | ) | |||
Our accumulated benefit obligation was $53,854 at December 31, 2009 and $51,308 at December 31, 2008.
The following table sets forth the funded status of our defined benefit plans that was recognized on our Consolidated Balance Sheets as of the dates indicated:
|
As of December 31, |
|||||||||
|
2009 |
2008 | ||||||||
|
Non-current assets |
$ | 3,384 | $ | -- | |||||
|
Current (liabilities) |
-- | (257 | ) | ||||||
|
Non-current (liabilities) |
(272 | ) | (1,593 | ) | |||||
|
Total |
$ | 3,112 | $ | (1,850 | ) | ||||
The weighted-average assumptions used to determine benefit obligations as of December 31, 2009 and 2008 are as follows:
|
2009 |
2008 | ||
|
Discount rate |
5.50% |
6.25% | |
|
Rate of compensation increase |
N/A |
N/A |
The following table sets forth the change in plan assets for the periods indicated:
|
Year Ended December 31, |
||||||||
|
2009 |
2008 |
|||||||
|
Fair value of plan assets at beginning of year |
$ | 49,458 | $ | 67,159 | ||||
|
Actual return on plan assets |
10,513 | (14,047 | ) | |||||
|
Employer contributions |
528 | 1,251 | ||||||
|
Benefits paid |
(3,533 | ) | (4,905 | ) | ||||
|
Fair value of plan assets at end of year |
$ | 56,966 | $ | 49,458 | ||||
The following table sets forth the fair value of total plan assets by major asset category as of the date indicated:
|
Fair Value Measurements as of December 31, 2009 |
||||||||||||||||
|
Asset Category |
Total |
(Level 1) Quoted Prices in Active Markets for Identical Assets |
(Level 2) Significant Other Observable Inputs |
(Level 3) Significant Unobservable Inputs |
||||||||||||
|
Cash and cash equivalents |
$ | 361 | $ | 361 | $ | -- | $ | -- | ||||||||
|
Fixed income securities (a) |
22,483 | 22,483 | -- | -- | ||||||||||||
|
Equity securities: |
||||||||||||||||
|
Domestic large cap |
23,519 | 23,519 | -- | -- | ||||||||||||
|
Mid cap value/growth (a) |
6,337 | 6,337 | -- | -- | ||||||||||||
|
Small cap value/growth (a) |
3,450 | 3,450 | -- | -- | ||||||||||||
|
Foreign equities |
73 | 73 | -- | -- | ||||||||||||
|
Preferred stock |
743 | 743 | -- | -- | ||||||||||||
|
Total |
$ | 56,966 | $ | 56,966 | $ | -- | $ | -- | ||||||||
_____________________________
(a) Mutual funds.
F-24
We used quoted prices in active markets for identical assets as of December 31, 2009 to value our plan assets that were categorized as Level 1.
The following table sets forth the amounts in accumulated other comprehensive income (loss) on our Consolidated Balance Sheets that have not been recognized as components of net periodic benefit cost as of the dates indicated:
|
As of December 31, |
||||||||
|
2009 |
2008 |
|||||||
|
Net actuarial (loss) |
$ | (16,413 | ) | $ | (22,543 | ) | ||
|
Prior service cost |
(156 | ) | (184 | ) | ||||
|
Income tax benefit |
6,499 | 8,915 | ||||||
|
Total accumulated other comprehensive (loss) |
$ | (10,070 | ) | $ | (13,812 | ) | ||
The following table sets forth the components of net periodic pension cost (benefit) in the periods indicated:
|
Year Ended December 31, |
||||||||||||
|
2009 |
2008 |
2007 |
||||||||||
|
Interest cost |
$ | 3,103 | $ | 3,088 | $ | 3,080 | ||||||
|
Expected return on assets |
(3,819 | ) | (5,228 | ) | (4,793 | ) | ||||||
|
Recognized net actuarial loss |
2,364 | -- | 578 | |||||||||
|
Amortization of prior service cost |
28 | 27 | -- | |||||||||
|
Net periodic benefit cost (benefit) |
$ | 1,676 | $ | (2,113 | ) | $ | (1,135 | ) | ||||
|
Settlement loss |
46 | 1,527 | -- | |||||||||
|
Total net periodic pension cost (benefit) |
$ | 1,722 | $ | (586 | ) | $ | (1,135 | ) | ||||
The benefit accruals under the ESI Pension Plan and ESI Excess Pension Plan were frozen effective March 31, 2006. As a result, no service cost has been included in the net periodic pension cost or benefit.
The following table sets forth the amounts related to changes in plan assets and projected benefit obligations that were recognized in other comprehensive (income) loss in the periods indicated:
|
Year Ended December 31, |
||||||||||||
|
2009 |
2008 |
2007 |
||||||||||
|
Net actuarial (gain) loss |
$ | (3,765 | ) | $ | 16,922 | $ | (4,549 | ) | ||||
|
Amortization of net actuarial loss |
(2,364 | ) | -- | (578 | ) | |||||||
|
Prior service cost |
-- | 184 | -- | |||||||||
|
Amortization of prior service cost |
(27 | ) | -- | -- | ||||||||
|
Other comprehensive (income) loss |
$ | (6,156 | ) | $ | 17,106 | $ | (5,127 | ) | ||||
|
Total recognized in net periodic pension cost (benefit) and other comprehensive loss (income) |
$ | (4,434 | ) | $ | 16,520 | $ | (6,262 | ) | ||||
The amortization of any prior service cost is determined using a straight-line amortization of the cost over the average remaining service period for employees expected to receive benefits under the pension plans. The estimated net actuarial loss and prior service cost that is expected to be amortized from accumulated other comprehensive income and
recognized in net periodic pension cost for the year ended December 31, 2010 is $1,534.
The weighted-average assumptions used to determine net periodic pension cost in the years ended December 31, 2009 and 2008 and September 30, 2007 are as follows:
|
2009 |
2008 |
2007 | |||
|
Discount rate |
6.25% |
6.00% |
5.75% | ||
|
Expected long-term return on plan assets |
8.00% |
8.00% |
8.00% | ||
|
Rate of compensation increase |
N/A |
N/A |
N/A |
The following table sets forth the benefit payments that we expect to pay from the pension plans in the periods indicated:
|
Year |
Amount |
|||
|
Fiscal 2010 |
$ | 3,007 | ||
|
Fiscal 2011 |
$ | 4,355 | ||
|
Fiscal 2012 |
$ | 4,967 | ||
|
Fiscal 2013 |
$ | 3,730 | ||
|
Fiscal 2014 |
$ | 3,398 | ||
|
Fiscal 2015 – 2019 |
$ | 17,293 | ||
F-25
We invest plan assets based on a total return on investment approach, pursuant to which the plan assets include a diversified blend of equity and fixed income investments toward a goal of maximizing the long-term rate of return without assuming an unreasonable level of investment risk. We
determine the level of risk based on an analysis of plan liabilities, the extent to which the value of the plan assets satisfies the plan liabilities and our financial condition. Our investment policy includes target allocations ranging from 30% to 70% for equity investments, 20% to 60% for fixed income investments and 0% to 50% for cash equivalents. The equity portion of the plan assets represents growth and value stocks of small, medium and large companies. We measure and monitor
the investment risk of the plan assets both on a quarterly basis and annually when we assess plan liabilities.
We use a building block approach to estimate the long-term rate of return on plan assets. This approach is based on the capital market principle that the greater the volatility, the greater the return over the long term. An analysis of the historical performance of equity
and fixed income investments, together with current market factors such as the inflation and interest rates, are used to help us make the assumptions necessary to estimate a long-term rate of return on plan assets. Once this estimate is made, we review the portfolio of plan assets and make adjustments thereto that we believe are necessary to reflect a diversified blend of equity and fixed income investments that is capable of achieving the estimated long-term rate of return without assuming an unreasonable
level of investment risk. We also compare the portfolio of plan assets to those of other pension plans to help us assess the suitability and appropriateness of the plan investments.
We determine our discount rate by performing a yield curve analysis based on a portfolio of high-quality fixed income investments with various maturities. Our expected future benefit payments are discounted to their present value at the appropriate yield curve rate to generate the
overall discount rate for pension obligations.
In 2009, we made no contribution to the ESI Pension Plan and contributed $528 to the ESI Excess Pension Plan. We do not expect to make any contribution to the ESI Pension Plan or ESI Excess Pension Plan in 2010.
Retirement Savings Plan. Our ESI 401(k) Plan, a defined contribution plan, covers substantially all of our employees. All of our contributions under the ESI 401(k) Plan are in the form of cash to plan investment
options directed by the participant.
Our ESI Excess Savings Plan, a nonqualified, unfunded deferred compensation plan, covers a select group of our management. The plan provided for salary deferral of contributions that the participants were unable to make under the ESI 401(k) Plan and our contributions that could
not be paid under the ESI 401(k) Plan due to federal statutory limits on the amount that an employee could contribute under a defined contribution plan. Effective for plan years beginning on and after January 1, 2008, we froze the ESI Excess Savings Plan, such that employees may no longer make salary deferrals and we will no longer make contributions under the ESI Excess Savings Plan. Amounts previously credited to an employee under the ESI Excess Savings Plan will, however, continue to
accrue interest in accordance with the terms of the ESI Excess Savings Plan until those amounts are distributed pursuant to the plan’s terms.
The costs of providing the benefits under the ESI 401(k) Plan and ESI Excess Savings Plan (including certain administrative costs of the plans) were:
|
· |
$4,430 in the year ended December 31, 2009; |
|
· |
$3,043 in the year ended December 31, 2008; and |
|
· |
$3,583 in the year ended December 31, 2007. |
12. Commitments and Contingencies
As part of our normal operations, one of our insurers issues surety bonds for us that are required by various education authorities that regulate us. We are obligated to reimburse our insurer for any of those surety bonds that are paid by the insurer. As of December 31,
2009, the total face amount of those surety bonds was approximately $20,125.
We are also subject to various claims and contingencies in the ordinary course of our business, including those related to litigation, business transactions, employee-related matters and taxes, among others. We cannot assure you of the ultimate outcome of any litigation involving us. Any litigation alleging violations of education
or consumer protection laws and/or regulations, misrepresentation, fraud or deceptive practices may also subject our affected campuses to additional regulatory scrutiny.
Lease Commitments. We lease our non-owned facilities under operating lease agreements. A majority of the operating leases contain renewal options that can be exercised after the initial lease term. Renewal
options are generally for periods of one to five years. All operating leases will expire over the next 14 years and we expect that:
|
· |
those leases will be renewed or replaced by other leases in the normal course of business; |
|
· |
we may purchase the facilities represented by those leases; or |
|
· |
we may purchase or build other replacement facilities. |
F-26
There are no material restrictions imposed by the lease agreements, and we have not entered into any significant guarantees related to the leases. We are required to make additional payments under the operating lease terms for taxes, insurance and other operating expenses incurred during the operating lease period.
Rent expense under our operating leases was:
|
· |
$37,987 in the year ended December 31, 2009; |
|
· |
$32,574 in the year ended December 31, 2008; and |
|
· |
$29,114 in the year ended December 31, 2007. |
Future minimum rental payments required under our operating leases that have initial or remaining non-cancelable lease terms in excess of one year as of December 31, 2009 are as follows:
|
2010 |
$ | 41,344 | ||
|
2011 |
38,303 | |||
|
2012 |
35,304 | |||
|
2013 |
29,466 | |||
|
2014 |
21,532 | |||
|
2015 and thereafter |
19,886 | |||
| $ | 185,835 |
Future minimum rental payments related to equipment leases are not significant.
13. Guarantees
In February 2009, we entered into an agreement with an unaffiliated third party whereby private education loans are provided to our students to help pay the students’ cost of education that student financial aid from federal, state and other sources do not cover (the “Private Student Loan Program”). In connection
with the Private Student Loan Program, we entered into a risk sharing agreement (“2009 RSA”) under which we have guaranteed the repayment of any private education loans that are charged off above a certain percentage of the private education loans made under the Private Student Loan Program, based on the annual dollar volume. As of December 31, 2009, approximately $56,000 of private education loans had been made under the Private Student Loan Program. Our obligations under the
2009 RSA will remain in effect until all private education loans made under the Private Student Loan Program are paid in full or charged off. The standard repayment term for a private education loan made under the Private Student Loan Program is ten years, with repayment generally beginning six months after a student graduates or three months after a student withdraws or is terminated from his or her program of study. We did not record a liability for our guarantee obligations under the
2009 RSA as of December 31, 2009, because we do not anticipate that the amount of private education loans charged off will exceed the percentage that would require us to make a payment under our guarantee.
Pursuant to the 2009 RSA, we are required to maintain collateral for our guarantee obligation in an amount equal to a percentage of the total private education loans disbursed to our students under the Private Student Loan Program. As of December 31, 2009, the total collateral maintained in a restricted bank account was not material. This
amount is included in Other assets on our Consolidated Balance Sheet as of December 31, 2009. The 2009 RSA also requires that we comply with certain covenants, including that we maintain certain financial ratios which are measured on a quarterly basis. We were in compliance with these covenants as of December 31, 2009.
We also are a party to a separate risk sharing agreement (the “2007 RSA”) with a different lender for certain private education loans that were made to our students in 2007 and early 2008. We guaranteed the repayment of any private education loans that the lender charges off above a certain percentage of the total dollar
volume of private education loans made under this agreement. We will have the right to pursue repayment from the borrowers for those charged off private education loans under the 2007 RSA that we pay to the lender pursuant to our guarantee obligation. The 2007 RSA was terminated effective February 22, 2008, such that no private education loans have been or will be made under the 2007 RSA after that date. Our obligations under the 2007 RSA will remain in effect until all private education
loans under the agreement are paid in full or charged off by the lender.
The maximum future payments that we could be required to make pursuant to our guarantee obligation under the 2007 RSA are affected by:
|
|
· |
the amount of the private educations loans made under the 2007 RSA; |
|
|
· |
the fact that those loans consist of a large number of loans of individually immaterial amounts; |
|
|
· |
the interest and fees associated with those loans; |
|
|
· |
the repayment performance of those loans; and |
|
|
· |
when during the life of the loans they are charged off. |
F-27
As a result, we are not able to estimate the undiscounted maximum potential future payments that we could be required to make under the 2007 RSA. Our recorded liability related to the 2007 RSA as of December 31, 2009 was not material.
14. Subsequent Event
On January 20, 2010, we entered into a guarantee agreement and related documents in connection with a new private education loan program for our students, the PEAKS Private Student Loan Program (the “PEAKS Program”). Under the PEAKS Program, an unaffiliated lender will make private education loans to eligible students
and, subsequently, sell those loans to a trust. The trust has issued senior debt in the aggregate principal amount of $300,000 (the “Senior Debt”) to investors. The assets (which include, among other assets, the student loans held by the trust) will serve as collateral for, and are intended to be the principal source of, the repayment of the Senior Debt. The Senior Debt bears interest at a variable rate based on the LIBOR plus an applicable margin and matures in January
2020.
In connection with the PEAKS Program, we will transfer to the trust a portion of the amount of each private student loan disbursed to us, in exchange for a subordinated note issued by the trust to us. The subordinated note does not bear interest, and principal is due following the repayment of the Senior Debt, the payment of fees
and expenses of the trust and the reimbursement of the amount of any payments made by us under the guarantee agreement. The trust will utilize the proceeds from the issuance of the Senior Debt and the subordinated note to purchase the student loans from the lender.
Under the guarantee agreement, we guarantee payment of principal, interest and certain call premiums on the Senior Debt, and administrative fees and expenses of the trust. The guarantee agreement contains, among other things, representations and warranties and events of default customary for guarantees. In addition,
under the PEAKS Program, some or all of the holders of the Senior Debt could require us to purchase their Senior Debt in certain limited circumstances that pertain to our continued eligibility to participate in Title IV Programs. We believe that the likelihood of those limited circumstances occurring is remote. Our guarantee and purchase obligations under the PEAKS Program remain in effect until the Senior Debt and the trust’s fees and expenses are paid in full. At such
time, we will be entitled to repayment of the amount of any payments made under our guarantee and payment of the subordinated note, in each case only to the extent of available funds remaining in the trust.
The maximum future payments that we could be required to make under the guarantee agreement include:
|
· |
up to $300,000 in principal of Senior Debt; |
|
· |
accrued interest on the Senior Debt; |
|
· |
certain call premiums associated with the Senior Debt; and |
|
· |
the fees and expenses of the trust. |
We are not able to estimate the undiscounted maximum potential amount of future payments that we could be required to make under the guarantee agreement, because those payments will be affected by:
|
· |
the amount of the private education loans made under the PEAKS Program; |
|
· |
the fact that those loans will consist of a large number of loans of individually immaterial amounts; |
|
· |
the repayment performance of those loans, the proceeds from which will be used to repay the Senior Debt and to pay the fees and expenses of the trust; |
|
· |
the fact that the interest rate on the Senior Debt is a variable rate based on the LIBOR plus a margin; |
|
· |
whether certain call premiums will be payable in connection with the Senior Debt; and |
|
· |
the amount of fees and expenses of the trust. |
F-28
SCHEDULE II
|
ITT EDUCATIONAL SERVICES, INC. |
||||||||||||||||
|
VALUATION AND QUALIFYING ACCOUNTS |
||||||||||||||||
|
FOR THE THREE YEARS ENDED DECEMBER 31, 2009 |
||||||||||||||||
|
(Amounts in thousands) |
||||||||||||||||
|
Balance at |
Charged |
Balance |
||||||||||||||
|
Beginning |
to |
at End of |
||||||||||||||
|
Description |
of Period |
Expenses |
Write-offs |
Period |
||||||||||||
|
Allowance for Doubtful Accounts: |
||||||||||||||||
|
Year Ended December 31, 2009 |
$ | 16,064 | $ | 81,983 | $ | (72,820 | ) | $ | 25,227 | |||||||
|
Year Ended December 31, 2008 |
$ | 5,378 | $ | 43,286 | $ | (32,600 | ) | $ | 16,064 | |||||||
|
Year Ended December 31, 2007 |
$ | 2,181 | $ | 18,599 | $ | (15,402 | ) | $ | 5,378 | |||||||
F-29
|
ITT EDUCATIONAL SERVICES, INC. |
||||||||||||||||||||||
|
QUARTERLY FINANCIAL RESULTS |
||||||||||||||||||||||
|
FOR 2009 AND 2008 |
||||||||||||||||||||||
|
(Amounts in thousands, except per share data) |
||||||||||||||||||||||
|
(Unaudited) |
||||||||||||||||||||||
|
Three Months Ended |
||||||||||||||||||||||
|
March 31 |
June 30 |
Sept. 30 |
Dec. 31 |
Year |
||||||||||||||||||
|
2009 (a) |
||||||||||||||||||||||
|
Revenue |
$ | 288,033 | $ | 317,140 | $ | 339,643 | $ | 374,378 | $ | 1,319,194 | ||||||||||||
|
Cost of educational services |
101,087 | 110,792 | 116,730 | 121,226 | 449,835 | |||||||||||||||||
|
Student services and administrative expenses |
88,459 | 90,413 | 101,421 | 100,274 | 380,567 | |||||||||||||||||
|
Operating income |
98,487 | 115,935 | 121,492 | 152,878 | 488,792 | |||||||||||||||||
|
Interest income |
1,233 | 878 | 716 | 464 | 3,291 | |||||||||||||||||
|
Interest (expense) |
(194 | ) | (208 | ) | (191 | ) | (133 | ) | (726 | ) | ||||||||||||
|
Income before provision for income taxes |
99,526 | 116,605 | 122,017 | 153,209 | 491,357 | |||||||||||||||||
|
Provision for income taxes |
38,608 | 45,509 | 47,409 | 59,568 | 191,094 | |||||||||||||||||
|
Net income |
$ | 60,918 | $ | 71,096 | $ | 74,608 | $ | 93,641 | $ | 300,263 | ||||||||||||
|
Earnings per share: |
||||||||||||||||||||||
|
Basic |
$ | 1.58 | $ | 1.87 | $ | 2.00 | $ | 2.59 | $ | 8.01 | ||||||||||||
|
Diluted |
$ | 1.56 | $ | 1.85 | $ | 1.98 | $ | 2.56 | $ | 7.91 | ||||||||||||
|
2008 (a) |
||||||||||||||||||||||
|
Revenue |
$ | 234,850 | $ | 246,411 | $ | 254,273 | $ | 279,799 | $ | 1,015,333 | ||||||||||||
|
Cost of educational services |
92,025 | 95,183 | 95,011 | 101,550 | 383,769 | |||||||||||||||||
|
Student services and administrative expenses |
74,862 | 75,570 | 79,231 | 76,436 | 306,099 | |||||||||||||||||
|
Operating income |
67,963 | 75,658 | 80,031 | 101,813 | 325,465 | |||||||||||||||||
|
Interest income |
2,033 | 1,177 | 1,565 | 1,730 | 6,505 | |||||||||||||||||
|
Interest (expense) |
(1,519 | ) | (1,057 | ) | (1,012 | ) | (1,023 | ) | (4,611 | ) | ||||||||||||
|
Income before provision for income taxes |
68,477 | 75,778 | 80,584 | 102,520 | 327,359 | |||||||||||||||||
|
Provision for income taxes |
26,294 | 29,050 | 30,844 | 39,666 | 125,854 | |||||||||||||||||
|
Net income |
$ | 42,183 | $ | 46,728 | $ | 49,740 | $ | 62,854 | $ | 201,505 | ||||||||||||
|
Earnings per share: |
||||||||||||||||||||||
|
Basic |
$ | 1.08 | $ | 1.20 | $ | 1.28 | $ | 1.62 | $ | 5.18 | ||||||||||||
|
Diluted |
$ | 1.07 | $ | 1.19 | $ | 1.27 | $ | 1.61 | $ | 5.13 | ||||||||||||
|
|
(a) |
In the fourth quarter of 2009, we changed our accounting for direct costs that relate to the enrollment of new students (“Direct Marketing Costs”) to expense those costs in the period incurred. Previously, we capitalized Direct Marketing Costs and amortized those costs over the period during which the associated revenue was recognized. |
F-30
As required by the accounting guidance for voluntary changes in accounting principles, our financial results presented for the periods shown above have been adjusted to apply the new accounting principle for Direct Marketing Costs retrospectively. The following tables set forth the effect that the adoption of this new accounting
principle for Direct Marketing Costs had on our financial results for the periods indicated:
|
Effect of change in accounting principle |
Three Months Ended |
|
||||||||||||||||||
|
2009 |
March 31 |
June 30 |
September 30 |
December 31 |
Year |
| ||||||||||||||
|
Revenue |
$ | -- | $ | -- | $ | -- | $ | -- | $ | -- | ||||||||||
|
Cost of educational services |
-- | -- | -- | -- | -- | |||||||||||||||
|
Student services and administrative expenses |
1,658 | 1,357 | 1,234 | 629 | 4,878 | |||||||||||||||
|
Total costs and expenses |
1,658 | 1,357 | 1,234 | 629 | 4,878 | |||||||||||||||
|
Operating income |
(1,658 | ) | (1,357 | ) | (1,234 | ) | (629 | ) | (4,878 | ) | ||||||||||
|
Interest income |
-- | -- | -- | -- | -- | |||||||||||||||
|
Interest (expense) |
-- | -- | -- | -- | -- | |||||||||||||||
|
Income before provision for income taxes |
(1,658 | ) | (1,357 | ) | (1,234 | ) | (629 | ) | (4,878 | ) | ||||||||||
|
Provision for income taxes |
(647 | ) | (530 | ) | (482 | ) | (245 | ) | (1,904 | ) | ||||||||||
|
Net income |
$ | (1,011 | ) | $ | (827 | ) | $ | (752 | ) | $ | (384 | ) | $ | (2,974 | ) | |||||
|
Earnings per share: |
||||||||||||||||||||
|
Basic |
$ | (0.03 | ) | $ | (0.02 | ) | $ | (0.02 | ) | $ | (0.01 | ) | $ | (0.08 | ) | |||||
|
Diluted |
$ | (0.03 | ) | $ | (0.02 | ) | $ | (0.02 | ) | $ | (0.01 | ) | $ | (0.08 | ) | |||||
|
Effect of change in accounting principle |
Three Months Ended | |||||||||||||||||||
|
2008 |
March 31 |
June 30 |
September 30 |
December 31 |
Year |
| ||||||||||||||
|
Revenue |
$ | -- | $ | -- | $ | -- | $ | -- | $ | -- | ||||||||||
|
Cost of educational services |
-- | -- | -- | -- | -- | |||||||||||||||
|
Student services and administrative expenses |
736 | 660 | 731 | 279 | 2,406 | |||||||||||||||
|
Total costs and expenses |
736 | 660 | 731 | 279 | 2,406 | |||||||||||||||
|
Operating income |
(736 | ) | (660 | ) | (731 | ) | (279 | ) | (2,406 | ) | ||||||||||
|
Interest income |
-- | -- | -- | -- | -- | |||||||||||||||
|
Interest (expense) |
-- | -- | -- | -- | -- | |||||||||||||||
|
Income before provision for income taxes |
(736 | ) | (660 | ) | (731 | ) | (279 | ) | (2,406 | ) | ||||||||||
|
Provision for income taxes |
(287 | ) | (257 | ) | (285 | ) | (110 | ) | (939 | ) | ||||||||||
|
Net income |
$ | (449 | ) | $ | (403 | ) | $ | (446 | ) | $ | (169 | ) | $ | (1,467 | ) | |||||
|
Earnings per share: |
||||||||||||||||||||
|
Basic |
$ | (0.01 | ) | $ | (0.01 | ) | $ | (0.01 | ) | $ | (0.01 | ) | $ | (0.04 | ) | |||||
|
Diluted |
$ | (0.01 | ) | $ | (0.01 | ) | $ | (0.01 | ) | $ | -- | $ | (0.04 | ) | ||||||
F-31
SIGNATURES
Pursuant to the requirements of Section 13 or 15(d) of the Securities Exchange Act of 1934, the registrant has duly caused this report to be signed on its behalf by the undersigned, thereunto duly authorized.
ITT Educational Services, Inc.
By: /s/ Kevin M. Modany
Dated: February 19, 2010 Kevin M. Modany
Chairman and Chief Executive Officer
Chairman and Chief Executive Officer
Pursuant to the requirements of the Securities Exchange Act of 1934, this report has been signed below by the following persons on behalf of the registrant and in the capacities and on the dates indicated.
|
Signature |
Title |
Date | ||
|
/s/ Kevin M. Modany |
Chairman, Chief Executive Officer and Director (Principal Executive Officer) |
February 19, 2010 | ||
|
Kevin M. Modany | ||||
|
/s/ Daniel M. Fitzpatrick |
Executive Vice President and Chief Financial Officer (Principal Financial Officer and Principal Accounting Officer) |
February 19, 2010 | ||
|
Daniel M. Fitzpatrick | ||||
|
/s/ John F. Cozzi |
Director |
February 19, 2010 | ||
|
John F. Cozzi | ||||
|
/s/ John E. Dean |
Director |
February 19, 2010 | ||
|
John E. Dean | ||||
|
/s/ James D. Fowler, Jr. |
Director |
February 19, 2010 | ||
|
James D. Fowler, Jr. | ||||
|
/s/ Joanna T. Lau |
Director |
February 19, 2010 | ||
|
Joanna T. Lau | ||||
|
/s/ Samuel L. Odle |
Director |
February 19, 2010 | ||
|
Samuel L. Odle | ||||
|
/s/ Lloyd G. Waterhouse |
Director |
February 19, 2010 | ||
|
Lloyd G. Waterhouse | ||||
|
/s/ Vin Weber |
Director |
February 19, 2010 | ||
|
Vin Weber | ||||
|
/s/ John A. Yena |
Director |
February 19, 2010 | ||
|
John A. Yena |
S - 1
INDEX TO EXHIBITS
|
Incorporated by Reference From |
||||||||||
|
Exhibit No. |
Description |
Form |
Exhibit |
Filing Date |
Filed Herewith | |||||
|
3.1 |
Restated Certificate of Incorporation, as Amended to Date |
10-Q |
3.1 |
7/29/05 |
||||||
|
3.2 |
Restated By-Laws, as Amended to Date |
8-K |
3.2 |
1/22/09 |
||||||
|
10.1 |
* |
1997 ITT Educational Services, Inc. Incentive Stock Plan |
10-Q |
10.8 |
8/8/97 |
|||||
|
10.2 |
Trade Name and Service Mark License Agreement between ITT/ESI and ITT Sheraton Corporation |
10-Q |
10.11 |
7/27/98 |
||||||
|
10.3 |
* |
Restated ESI 401(k) Plan |
10-Q |
10.14 |
7/24/08 |
|||||
|
10.4 |
* |
ESI Excess Savings Plan – 2008 Restatement |
10-K |
10.15 |
2/21/08 |
|||||
|
10.5 |
* |
First Amendment of ESI 401(k) Plan |
10-K |
10.16 |
2/18/09 |
|||||
|
10.6 |
* |
Second Amendment of ESI 401(k) Plan |
X | |||||||
|
10.7 |
First Amendment to Trade Name and Service Mark License Agreement between ITT/ESI and ITT Sheraton Corporation |
10-K |
10.18 |
2/19/99 |
||||||
|
10.8 |
* |
ESI Excess Pension Plan – 2008 Restatement |
10-K |
10.19 |
2/21/08 |
|||||
|
10.9 |
* |
1999 Outside Directors Stock Option Plan |
S-8 |
4.3 |
8/10/99 |
|||||
|
10.10 |
* |
ESI Non-Employee Directors Deferred Compensation Plan – 2008 Restatement |
10-K |
10.21 |
2/21/08 |
|||||
|
10.11 |
* |
ESI Executive Deferred Bonus Compensation Plan – 2008 Restatement |
10-K |
10.22 |
2/21/08 |
|||||
|
10.12 |
* |
First Amendment to ESI Excess Pension Plan – 2008 Restatement |
10-Q |
10.23 |
7/24/08 |
|||||
|
10.13 |
Second Amendment to Trade Name and Service Mark License Agreement between ITT/ESI and ITT Manufacturing Enterprises, Inc. (assignee of ITT Sheraton Corporation) |
10-Q |
10.24 |
10/31/00 |
||||||
|
10.14 |
* |
ITT Educational Services, Inc. Senior Executive Severance Plan |
10-Q |
10.26 |
10/25/07 |
|||||
|
10.15 |
* |
Restated ESI Pension Plan |
10-K |
10.30 |
2/18/09 |
|||||
|
10.16 |
* |
First Amendment of ESI Pension Plan |
10-K |
10.31 |
2/18/09 |
|||||
|
10.17 |
* |
Second Amendment of ESI Pension Plan |
X | |||||||
|
10.18 |
* |
First Amendment to the 1999 Outside Directors Stock Option Plan |
10-Q |
10.37 |
7/17/03 |
|||||
S - 2
|
10.19 |
* |
First Amendment to the 1997 ITT Educational Services, Inc. Incentive Stock Plan |
10-Q |
10.38 |
7/17/03 |
|||||
|
10.20 |
* |
Second Amendment to the 1999 Outside Directors Stock Option Plan |
10-Q |
10.42 |
4/27/04 |
|||||
|
10.21 |
* |
1999 Outside Directors Stock Option Plan-Form of Non-Qualified Stock Option Agreement |
10-Q |
10.44 |
10/22/04 |
|||||
|
10.22 |
* |
1997 ITT Educational Services, Inc. Incentive Stock Plan-Form of Nonqualified Stock Option Award Agreement |
10-Q |
10.45 |
10/22/04 |
|||||
|
10.23 |
* |
Third Amendment to the 1999 Outside Directors Stock Option Plan |
8-K |
10.47 |
1/28/05 |
|||||
|
10.24 |
* |
Summary of Certain Director and Executive Compensation |
X | |||||||
|
10.25 |
* |
1997 ITT Educational Services, Inc. Incentive Stock Plan – Form of Nonqualified Stock Option Award Agreement for November 2, 2005 Award to Executives |
8-K |
10.52 |
11/1/05 |
|||||
|
10.26 |
* |
Form of Nonqualified Stock Option Award Agreement under the 2006 ITT Educational Services, Inc. Equity Compensation Plan |
10-Q |
10.53 |
5/1/06 |
|||||
|
10.27 |
* |
Form of Restricted Stock Award Agreement under the 2006 ITT Educational Services, Inc. Equity Compensation Plan |
10-Q |
10.54 |
10/26/06 |
|||||
|
10.28 |
* |
2006 ITT Educational Services, Inc. Equity Compensation Plan |
8-K |
10.55 |
5/10/06 |
|||||
|
10.29 |
* |
First Amendment to 2006 ITT Educational Services, Inc. Equity Compensation Plan |
10-Q |
10.57 |
10/26/06 |
|||||
|
10.30 |
* |
Second Amendment to 1997 ITT Educational Services, Inc. Incentive Stock Plan |
10-Q |
10.58 |
10/26/06 |
|||||
|
10.31 |
* |
Form of Restricted Stock Unit Award Agreement under the 2006 ITT Educational Services, Inc. Equity Compensation Plan |
10-Q |
10.59 |
7/26/07 |
|||||
|
10.32 |
* |
Second Amendment to 2006 ITT Educational Services, Inc. Equity Compensation Plan |
10-Q |
10.61 |
7/26/07 |
|||||
|
10.33 |
Amended and Restated Credit Agreement, dated as of December 17, 2007, between ITT Educational Services, Inc. and JPMorgan Chase Bank, N.A. |
8-K |
10.62 |
12/20/07 |
S - 3
|
10.34 |
First Amendment to Credit Agreement, dated as of March 19, 2009, between ITT Educational Services, Inc. and JPMorgan Chase Bank, N.A. |
10-Q |
10.63 |
4/23/09 |
||||||
|
10.35 |
Second Amended and Restated Credit Agreement, dated as of January 11, 2010 among ITT Educational Services, Inc., JPMorgan Chase Bank, N.A. and Bank of America, N.A. |
8-K |
10.64 |
1/12/10 |
||||||
|
10.36 |
First Amendment to Second Amended and Restated Credit Agreement, dated as of February 3, 2010, among ITT Educational Services, Inc., JPMorgan Chase Bank, N.A. and Bank of America, N.A. |
X | ||||||||
|
18 |
Preferability Letter dated as of February 18, 2010, from PricewaterhouseCoopers LLP regarding change in accounting principle |
X | ||||||||
|
21 |
Subsidiaries |
X | ||||||||
|
23 |
Consent of Independent Registered Public Accounting Firm |
X | ||||||||
|
31.1 |
Chief Executive Officer’s Certification Pursuant to Rule 13a-14(a)/15d-14(a) of the Securities Exchange Act of 1934 |
X | ||||||||
|
31.2 |
Chief Financial Officer’s Certification Pursuant to Rule 13a-14(a)/15d-14(a) of the Securities Exchange Act of 1934 |
X | ||||||||
|
32.1 |
Chief Executive Officer’s Certification Pursuant to 18 U.S.C. Section 1350 |
X | ||||||||
|
32.2 |
Chief Financial Officer’s Certification Pursuant to 18 U.S.C. Section 1350 |
X |
|
* |
The indicated exhibit is a management contract, compensatory plan or arrangement required to be filed by Item 601 of Regulation S-K. |
S - 4