Attached files
| file | filename |
|---|---|
| EX-32 - UIL EXHIBIT 32 - CERTIFICATION - UIL HOLDINGS CORP | uil_exh32.htm |
| EX-23 - UIL EXHIBIT 23 - PWC CONSENT - UIL HOLDINGS CORP | uil_exh23.htm |
| EX-4.3 - UIL EXHIBIT 4.3 - UIL NOTE PURCHASE AGREEMENT - UIL HOLDINGS CORP | uil_exh4-3.htm |
| EX-31.2 - UIL EXHIBIT 31.2 - CERTIFICATION - UIL HOLDINGS CORP | uil_exh31-2.htm |
| EX-31.1 - UIL EXHIBIT 31.1 - CERTIFICATION - UIL HOLDINGS CORP | uil_exh31-1.htm |
UNITED
STATES
SECURITIES
AND EXCHANGE COMMISSION
Washington,
D.C. 20549
FORM
10-K
|
[X]
|
ANNUAL
REPORT PURSUANT TO SECTION 13 OR 15(d) OF THE SECURITIES EXCHANGE ACT OF
1934
|
|
|
FOR
THE FISCAL YEAR ENDED DECEMBER 31,
2009
|
OR
|
[ ]
|
TRANSITION
REPORT PURSUANT TO SECTION 13 OR 15(d) OF THE SECURITIES EXCHANGE ACT OF
1934
|
For the transition period from
to
Commission
File Number 1-15052

(Exact
name of registrant as specified in its charter)
|
Connecticut
|
06-1541045
|
|
|
(State
or other jurisdiction of incorporation or organization)
|
(I.R.S.
Employer Identification No.)
|
|
|
157
Church Street, New Haven, Connecticut
|
06506
|
|
|
(Address
of principal executive offices)
|
(Zip
Code)
|
Registrant’s
telephone number, including area code: 203-499-2000
______________________________________________________
Securities
registered pursuant to Section 12(b) of the Act:
|
Title of each
class
|
Name of each exchange
on which registered
|
|
Common
Stock, no par value
|
New
York Stock Exchange
|
Securities
registered pursuant to Section 12(g) of the
Act: None
Indicate
by check mark if the registrant is a well-known seasoned issuer, as defined in
Rule 405 of the Securities Act. Yes [X
] No [ ]
Indicate
by check mark if the registrant is not required to file reports pursuant to
Section 13 or 15(d) of the
Act. Yes [ ] No [X]
Indicate
by check mark whether the registrant (1) has filed all reports required to be
filed by Section 13 or 15(d) of the Securities Exchange Act of 1934 during the
preceding 12 months (or for such shorter period that the registrant was required
to file such reports), and (2) has been subject to such filing requirements for
the past 90
days. Yes [X] No [ ]
Indicate
by check mark whether the registrant has submitted electronically and posted on
its corporate Web site, if any, every Interactive Data File required to be
submitted and posted pursuant to Rule 405 of Regulations S-T (§232.405 of this
chapter) during the preceding 12 months (or for shorter period that the
registrant was required to submit and post such files).
Yes [ ] No [ ]
Indicate
by check mark if disclosure of delinquent filers pursuant to Item 405 of
Regulation S-K is not contained herein, and will not be contained, to the best
of registrant’s knowledge, in definitive proxy or information statements
incorporated by reference in Part III of this Form 10-K or any amendment to this
Form 10-K. [ ]
Indicate
by check mark whether the registrant is a large accelerated filer, an
accelerated filer, or a non-accelerated filer. See definition of
“accelerated filer and large accelerated filer” in Rule 12b-2 of the Exchange
Act. (Check one):
|
Large
accelerated filer [X]
|
Accelerated
filer [ ]
|
Non-accelerated
filer [ ] Smaller
reporting company [ ]
|
Indicate
by check mark whether the registrant is a shell company (as defined in Rule
12b-2 of the
Act). Yes [ ] No [X]
The
aggregate market value of the registrant’s voting stock held by non-affiliates
on June 30, 2009 was $659,462,217 computed on the basis of the price at which
the said stock was last sold reported in the listing of composite transactions
for New York Stock Exchange listed securities, published in The Wall Street Journal on
July 1, 2009.
The
number of shares outstanding of the registrant’s only class of common stock, as
of February 12, 2010 was 29,929,591.
DOCUMENTS
INCORPORATED BY REFERENCE
Document Part of this Form 10-K into
which document is incorporated
Definitive
Proxy Statement for Annual Meeting of the Shareowners to be held on May 11,
2010III
UIL
HOLDINGS CORPORATION
FORM
10-K
December 31,
2009
| Page | ||
|
Glossary
|
3
|
|
|
Part
I
|
6
|
|
|
Item
1.
|
Business
|
6
|
|
General
|
6
|
|
|
Utility
Business
|
6
|
|
|
Franchises
|
7
|
|
|
Regulation
|
7
|
|
|
Rates
|
7
|
|
|
Power Supply
Arrangements
|
9
|
|
|
Arrangements with Other
Industry Participants
|
9
|
|
|
ISO-NE and
RTO-NE
|
9
|
|
|
Middletown/Norwalk Transmission
Project
|
10
|
|
|
Hydro-Quebec
|
10
|
|
|
Environmental
Regulation
|
10
|
|
|
Non-Utility
Activities
|
11
|
|
|
Financing
|
11
|
|
|
Employees
|
12
|
|
|
Item
1A.
|
Risk
Factors
|
12
|
|
Item
1B.
|
Unresolved
Staff Comments
|
14
|
|
Item
2.
|
Properties
|
14
|
|
Transmission and Distribution
Plant
|
14
|
|
|
Administrative and Service
Facilities
|
15
|
|
|
Item
3.
|
Legal
Proceedings
|
15
|
|
Item
4.
|
Submission
of Matters to a Vote of Security Holders
|
15
|
|
Executive
Officers
|
15
|
|
|
Part
II
|
17
|
|
|
Item
5.
|
Market
for UIL Holdings’ Common Equity, Related Stockholder Matters and Issuer
Purchases of Equity Securities
|
17
|
|
Item
6.
|
Selected
Financial Data
|
19
|
|
Item
7.
|
Management’s
Discussion and Analysis of Financial Condition and Results of
Operations
|
20
|
|
Overview and
Strategy
|
20
|
|
|
The United Illuminating
Company
|
20
|
|
|
United Capital Investments,
Inc.
|
21
|
|
|
Major Influences on Financial
Condition
|
21
|
|
|
UIL Holdings
Corporation
|
21
|
|
|
The United Illuminating
Company
|
21
|
|
|
Xcelecom, Inc.
|
28
|
|
|
Liquidity and Capital
Resources
|
28
|
|
|
Financial
Covenants
|
30
|
|
|
2010 Capital Resource
Projections
|
31
|
|
|
Contractual and Contingent
Obligations
|
32
|
|
|
Critical Accounting
Policies
|
33
|
|
|
Off-Balance Sheet
Arrangements
|
35
|
|
|
New Accounting
Standards
|
35
|
|
|
Results of
Operations
|
35
|
|
|
Item
7A.
|
Quantitative
and Qualitative Disclosures About Market Risk
|
41
|
|
Item
8.
|
Financial
Statements and Supplementary Data
|
44
|
|
Consolidated Financial
Statements
|
44
|
- 1 -
TABLE
OF CONTENTS (continued)
|
Part
II (continued)
|
||
|
Consolidated Statement of
Income (Loss) for the Years Ended December 31, 2009, 2008
and
2007
|
44
|
|
|
Consolidated Statement of
Comprehensive Income (Loss) for the Years Ended
December 31, 2009,
2008 and 2007
|
44
|
|
|
Consolidated Statement of Cash
Flows for the Years Ended December 31, 2009, 2008
and
2007
|
45
|
|
|
Consolidated Balance Sheet as
of December 31, 2009 and 2008
|
46
|
|
|
Consolidated Statement of
Changes in Shareholders’ Equity for the Years Ended December 31,
2009, 2008 and 2007
|
48
|
|
|
Notes to Consolidated Financial
Statements
|
49
|
|
|
Statement of Accounting
Policies
|
49
|
|
|
Capitalization
|
56
|
|
|
Regulatory
Proceedings
|
59
|
|
|
Short-Term Credit
Arrangements
|
68
|
|
|
Income Taxes
|
69
|
|
|
Supplementary
Information
|
72
|
|
|
Pension and Other
Benefits
|
73
|
|
|
Related Party
Transactions
|
78
|
|
|
Lease
Obligations
|
79
|
|
|
Commitments and
Contingencies
|
79
|
|
|
Connecticut Yankee Atomic Power
Company
|
79
|
|
|
Hydro-Quebec
|
81
|
|
|
Environmental
Concerns
|
81
|
|
|
Middletown/Norwalk Transmission
Project (the Project)
|
83
|
|
|
Property Tax
Assessment
|
83
|
|
|
Cross-Sound Cable Company,
LLC
|
83
|
|
|
Fair Value of Financial
Instruments
|
84
|
|
|
Quarterly Financial Data
(Unaudited)
|
90
|
|
|
Segment
Information
|
91
|
|
|
Discontinued
Operations
|
93
|
|
|
Report
of Independent Registered Public Accounting Firm
|
94
|
|
|
Item
9.
|
Changes
in and Disagreements with Accountants on Accounting and Financial
Disclosure
|
95
|
|
Item
9A.
|
Controls
and Procedures
|
95
|
|
Item
9B.
|
Other
Information
|
96
|
|
Part
III
|
96
|
|
|
Item
10.
|
Directors,
Executive Officers and Corporate Governance
|
96
|
|
Item
11.
|
Executive
Compensation
|
96
|
|
Item
12.
|
Security
Ownership of Certain Beneficial Owners and Management and Related
Stockholder Matters
|
96
|
|
Item
13.
|
Certain
Relationships and Related Transactions and Director
Independence
|
96
|
|
Item
14.
|
Principal
Accounting Fees and Services
|
97
|
|
Part
IV
|
97
|
|
|
Item
15.
|
Exhibits,
Financial Statement Schedules
|
97
|
|
Signatures
|
102
|
|
- 2 -
GLOSSARY
OF TERMS AND ABBREVIATIONS
AFUDC (Allowance
for Funds Used During Construction) – The cost of utility equity and debt funds
used to finance construction projects that is capitalized as part of
construction cost.
ASC (Accounting Standards
Codification) – The single source of authoritative United States generally
accepted accounting principles.
BFMCC (Bypassable
Federally Mandated Congestion Charges) – A federally mandated charge, as defined
by Connecticut electric industry restructuring legislation, related to the
generation of electricity.
C&LM
(assessment/charge) (Conservation and Load Management) –
Statutory assessment on electric utility retail customer bills placed in a State
of Connecticut fund used to support energy conservation and load management
programs.
CTA (Competitive
Transition Assessment) – The component of electric utility retail customer bills
assessed to allow utilities in the State of Connecticut to recover allowable
Stranded Costs, as determined by the DPUC.
CDEP
– Connecticut Department of Environmental Protection.
CfD – Contract for
Differences
Distribution
Division - The United Illuminating Company’s (UI’s) operating division
that provides distribution services to the its retail electric customers and
manages all components related to such service, including the C&LM, CTA, GSC
and REI. The Distribution Division does not include UI’s transmission
operations.
DOE
– United States Department of Energy.
DPUC (Connecticut
Department of Public Utility Control) – State agency that regulates certain
ratemaking, services, accounting, plant and operations of Connecticut
utilities.
EIA
- Energy Independence Act adopted by the State of Connecticut in
2005.
EPA
– United States Environmental Protection Agency.
EPS
– Earnings Per Share.
ESOP
– Employee Stock Ownership Plan.
FASB (Financial
Accounting Standards Board) – A rulemaking organization that establishes
financial accounting and reporting standards.
FERC (Federal
Energy Regulatory Commission) – Federal agency that regulates interstate
transmission and wholesale sales of electricity and related
matters.
FMCC
(Federally Mandated Congestion Charges) – A federally mandated charge, as
defined by Connecticut electric industry restructuring legislation, related to
the supply of electricity or the reliability of supply in the electricity
market.
GAAP
– Generally accepted accounting principles in the United States of
America.
GSC (Generation
services charge) – The rate, as determined by the DPUC, charged to electric
utility retail customers for the generation service and ancillary products
purchased at wholesale and delivered by UI as part of fully bundled
services.
- 3 -
ISO–NE (ISO-New
England Inc.) – An independent system operator contracted by NEPOOL to operate
the regional bulk power system (generation and ancillary products, and
transmission) in New England.
ITC
– Investment tax credit.
kV (kilovolt)
– 1,000 volts. A volt is a unit of electromotive force.
kW (kilowatt)
– 1,000 watts.
kWh (kilowatt-hour)
– The basic unit of electric energy equal to one kilowatt of power supplied to
or taken from an electric circuit steadily for one hour.
KSOP
– 401(k)/Employee Stock Ownership Plan.
LIBOR
–London Interbank Offered Rate.
MVA
(megavoltampere) – 1,000 kilovoltamperes.
MW (megawatt)
– 1,000 kilowatts.
NBFMCC (Non-Bypassable
Federally Mandated Congestion Charges) – A federally mandated charge, as defined
by Connecticut electric utility restructuring legislation, related to the
delivery of electricity.
NEPOOL (New
England Power Pool) – Entity operating in accordance with the New England Power
Pool Agreement, as amended and as approved by the FERC, to provide economic,
reliable operation of the bulk power system in the New England
region.
O&M (Operation and Maintenance) -
Costs incurred in running daily business activities and maintaining
infrastructure.
OPEB (Other Postretirement
Benefits) – Benefits (other than pension) consisting principally of health care
and life insurance provided to retired employees and their
dependents.
PCB
(Polychlorinated Biphenyl) – Additive to oil used in certain electrical
equipment up to the late-1970s; now classified as a hazardous
chemical.
PTF
– Pool Transmission Facilities.
RCRA
– The federal Resource Conservation and Recovery Act.
REI (Renewable
Energy Investment) – Statutory assessment on electric utility retail customer
bills placed in a State of Connecticut fund to support renewable energy
projects.
RMR
– (Reliability-Must-Run) – Resources scheduled to operate out-of-merit order and
identified by ISO-NE as necessary to preserve the reliability of a Reliability
Region. RMR resources provide local voltage or VAR support or meet local
regulation or operating-reserve requirements.
RTO-NE
(Regional Transmission Organization New England) – Organization jointly proposed
by ISO-NE and the New England transmission owners to strengthen the independent
oversight of the region’s bulk power system and wholesale electricity
marketplace. The RTO commenced operation effective February 1,
2005.
SBC
(Systems Benefits Charge) – The component of electric utility retail customer
bills, in the State of Connecticut, representing public policy costs such as
generation decommissioning and displaced worker protection costs, as determined
by the DPUC.
- 4 -
SEC
- United States Securities and Exchange Commission.
Stranded
Costs – Costs that are recoverable from retail customers, as determined
by the DPUC, including above-market long-term purchased power obligations,
regulatory assets, and above-market investments in power plants.
Transmission
Division – UI’s
operating division that provides transmission services and manages all related
transmission operations.
TSO
(Transitional Standard Offer) – UI’s obligation under Connecticut electric
industry restructuring legislation, to offer a regulated “transitional standard
offer” retail service from January 1, 2004 through December 31, 2006 to each
customer who did not choose an alternate electricity supplier.
VEBA
(Voluntary Employee Benefit Association Trust) – Trust accounts for health and
welfare plans for future payments to employees, retirees or their
beneficiaries.
Watt
– A unit of electrical power equal to one joule per second.
Part
I
Item
1. Business.
GENERAL
The
primary business of UIL Holdings Corporation (UIL Holdings) is ownership of its
operating regulated utility. The utility business consists of the
electric transmission and distribution operations of The United Illuminating
Company (UI). UI is also a 50-50 joint venturer, together with NRG
Energy, Inc., in GenConn Energy LLC (GenConn), a project selected by the
Connecticut Department of Public Utility Control (“DPUC”) to build new peaking
generation plants to help address the state’s growing need for more power
generation during the heaviest load periods. UIL Holdings also has
non-utility activities which recently included the operations of Xcelecom, Inc.
(Xcelecom) until the substantial completion of the sale of that business
effective December 31, 2006. UIL Holdings is headquartered in New
Haven, Connecticut, where its senior management maintains offices and is
responsible for overall planning, operating and financial
functions.
UIL
Holdings files electronically with the United States Securities and Exchange
Commission (SEC): required reports on Form 8-K, Form 10-Q and Form 10-K;
proxy materials; ownership reports for insiders as required by Section 16 of the
Securities and Exchange Act of 1934; and registration statements on Forms S-3
and S-8, as necessary. The public may read and copy any materials UIL
Holdings has filed with the SEC at the SEC’s Public Reference Room at 100 F
Street, N.E., Washington, DC 20549. The public may also obtain
information on the operation of the Public Reference Room by calling the SEC at
1-800-SEC-0330. The SEC maintains an Internet site (www.sec.gov) that contains reports, proxy and information
statements, and other information regarding issuers that file electronically
with the SEC. Copies of UIL Holdings’ annual report on Form 10-K,
quarterly reports on Form 10-Q, current reports on Form 8-K and any amendments
to these reports filed with the SEC may be requested, viewed, or downloaded
on-line, free of charge, at (www.uil.com).
UIL
Holdings makes available on its website (www.uil.com) the charters of its Audit Committee,
Corporate Governance and Nominating Committee, Compensation and Executive
Development Committee and Finance Committee, as well as its corporate
governance guidelines, code of business conduct for its employees, code of
ethics for financial officers, and code of business conduct for the Board of
Directors.
Due to
the requirements of Accounting Standards Codification (ASC) 280 “Segment
Reporting”, UIL Holdings has divided its regulated business into distribution
and transmission operating segments for financial reporting
purposes. See Part II, Item 8, “Financial Statements and
Supplementary Data – Notes to Consolidated Financial Statements – Note (M),
Segment Information,” of this Form 10-K, which is hereby incorporated by
reference.
UTILITY
BUSINESS
UI is a
regulated operating electric public utility established in 1899. It
is engaged principally in the purchase, transmission, distribution and sale of
electricity for residential, commercial and industrial purposes in a service
area of about 335 square miles in the southwestern part of the State of
Connecticut. The population of this area is approximately 736,000,
which represents approximately 21% of the population of the
State. The service area, largely urban and suburban, includes the
principal cities of Bridgeport (population approximately 137,000) and New Haven
(population approximately 124,000) and their surrounding
areas. Situated in the service area are retail trade and service
centers, as well as large and small industries producing a wide variety of
products, including helicopters and other transportation equipment, electrical
equipment, chemicals and pharmaceuticals. As of December 31, 2009, UI
had approximately 325,000 customers. Of UI’s 2009 retail electric
revenues, approximately 59.5% were derived from residential sales, 34.3% from
commercial sales, 5.0% from industrial sales and 1.2% from street lighting and
other sales. UI’s retail electric revenues vary by season, with the
highest revenues typically in the third quarter of the year reflecting seasonal
rates, hotter weather and air conditioning use. For additional
information regarding UI’s revenues refer to Part II, Item 6, “Selected
Financial Data,” of this Form 10-K which is hereby incorporated by
reference.
Franchises
UI has
valid franchises to engage in the purchase, transmission, distribution and sale
of electricity in its service area, the right to erect and maintain certain
facilities over, on and under public highways and grounds, and the power of
eminent domain. These franchises are subject to alteration, amendment
or revocation by the Connecticut legislature, and revocation by the DPUC under
circumstances specified by statute, and subject to certain approvals, permits
and consents of public authorities and others prescribed by
statute.
Regulation
UI is
subject to regulation by several regulatory bodies, including the
DPUC. The DPUC has jurisdiction with respect to, among other things,
retail electric service rates, accounting procedures, certain dispositions of
property and plant, construction of certain electric facilities, mergers and
consolidations, the issuance of securities, the condition of plant and equipment
and the manner of operation in relation to safety, adequacy and suitability to
provide service to customers, including efficiency.
The
location and construction of certain electric facilities, including electric
transmission lines and bulk substations, are subject to regulation by the
Connecticut Siting Council with respect to environmental compatibility and
public need.
UI is a
“public utility” within the meaning of Part II of the Federal Power Act
(FPA). Under the FPA, the Federal Energy Regulatory Commission (FERC)
governs the rates, terms and conditions of transmission of electric energy in
interstate commerce (including transmission service provided by UI),
interconnection service in interstate commerce (which applies to independent
power generators, for example), and the rates, terms and conditions of wholesale
sales of electric energy in interstate commerce (which includes cost-based rates
and market-based rates and regional capacity and electric energy markets
administered by an independent entity, ISO-New England, Inc.
(ISO-NE). FERC approves UI’s transmission revenue requirements, which
are collected through UI’s retail transmission rates. The FERC also
has authority to ensure the reliability of the high voltage electric
transmission system, monitor and investigate wholesale electric energy markets
and entities that have been authorized to sell wholesale power at market-based
rates, impose civil and criminal penalties for violations of the FPA (including
market manipulation) and require public utilities subject to its jurisdiction to
comply with a variety of accounting, reporting and record-keeping
requirements. See Part I, Item 1, “Business” - “Arrangements with
Other Industry Participants.”
UI is
also required to comply with reliability standards issued by the North American
Electric Reliability Corporation (NERC), a not-for-profit corporation whose
mission is to improve the reliability and security of the bulk power
system. NERC reliability standards may be enforced by NERC, FERC
(which oversees NERC), and by a regional reliability organization as approved by
FERC.
Connecticut
Yankee Atomic Power Company, in which UI has a 9.5% common stock ownership
interest, is subject to the jurisdiction of the United States Nuclear Regulatory
Commission and the FERC. The Connecticut Yankee nuclear unit was
retired in 1996 and has been decommissioned. See Part II, Item 8,
“Financial Statements and Supplementary Data – Notes to Consolidated Financial
Statements – Note (J), Commitments and Contingencies – Connecticut Yankee Atomic
Power Company,” of this Form 10-K, which is hereby incorporated by
reference.
Rates
UI’s
retail electric service rates are subject to regulation by the
DPUC. UI’s present general retail rate structure consists of various
rate and service classifications covering residential, commercial, industrial
and street lighting services.
Utilities
are entitled by Connecticut law to charge rates that are sufficient to allow
them an opportunity to cover their reasonable operating and capital costs, to
attract needed capital and maintain their financial integrity, while also
protecting relevant public interests.
The
revenue components of UI’s retail charges to customers, effective as of January
1, 2010, reflect a total average price of 19.9490¢ per kilowatt-hour
(kWh) and consist of the following:
|
Unbundled
Revenue Component
|
Description
|
Authorized
Return on Equity
|
Average
Price Per kWh
|
|
Distribution
|
The
process of delivering electricity through local lines to the customer’s
home or business.
|
8.75%(1)
|
5.0848¢
|
|
Transmission
|
The
process of delivering electricity over high voltage lines to local
distribution lines.
|
12.3-12.5%(2)
|
1.6716¢
|
|
Competitive
Transition Assessment (CTA) (3)
|
Component
of retail customer bills determined by the DPUC to recover Stranded
Costs.
|
8.75%(3)
|
1.5065¢
|
|
Generation
Services Charge (GSC) (4)
|
The
average rate charged, as determined by the DPUC, to retail customers for
the generation services purchased at wholesale by UI for standard service
and last resort service.
|
None
|
11.0388¢
|
|
Systems
Benefits Charge (SBC) (5)
|
Charges
representing public policy costs, such as generation decommissioning and
displaced worker protection costs, as determined by the
DPUC.
|
None
|
0.3375¢
|
|
Conservation
& Load Management (C&LM) (6)
|
Statutory
assessment used to support energy conservation and load management
programs.
|
None
|
0.3000¢
|
|
Non-Bypassable
Federally Mandated Congestion Charges (NBFMCC) (7)
|
Federally
mandated charge, as defined by Connecticut electric industry restructuring
legislation, related to the reliability of supply delivered by the
electric system.
|
None
|
(0.0903)¢
|
|
Renewable
Energy Investment (REI) (8)
|
Statutory
assessment used to support renewable energy projects.
|
None
|
0.1000¢
|
|
(1)
|
DPUC
authorized return on equity. Earnings above 8.75% will be
shared 50% to customers and 50% to
shareowners.
|
|
(2)
|
Weighted
average estimate based upon FERC authorized
rates.
|
|
(3)
|
UI
earns the authorized distribution return on equity on CTA rate
base. UI defers or accrues additional amortization to achieve
the authorized return on equity on unamortized CTA rate
base.
|
|
(4)
|
This
rate includes $0.002 per kWh for retail access and load settlement
costs. GSC has no impact on results of operations, because
revenue collected equals expense incurred (which is referred to as a
“pass-through” in this filing on Form
10-K).
|
|
(5)
|
SBC
has no impact on results of operations, because SBC billing is a
“pass-through” with the exception of carrying charges which are applied to
deferred balances, if any.
|
|
(6)
|
UI
has the opportunity to earn a nominal “incentive” for managing the
C&LM programs. Except for the incentive, C&LM has no
impact on results of operations, because C&LM billing is a
“pass-through.”
|
|
(7)
|
NBFMCC
rate includes funding of customer initiatives such as distributed
generation resulting from the Energy Independence Act. Part of
the funding is an incentive to UI helping to bring those customer
initiatives on-line. Except for the incentive, NBFMCC has no
impact on results of operations, because NBFMCC billing is a
“pass-through.” The 2010 NBFMCC rate is a credit on customers’
bills reflecting the refund of prior years’
over-collections.
|
|
(8)
|
REI
has no impact on results of operations, because REI billing is a
“pass-through.”
|
For
further information refer to Part II, Item 8, “Financial Statements and
Supplementary Data – Notes to Consolidated Financial Statements – Note (C),
Regulatory Proceedings,” of this Form 10-K, which information is hereby
incorporated by reference.
Power
Supply Arrangements
UI’s
retail electricity customers are able to choose their electricity
supplier. Since January 1, 2007, UI has been required to offer
standard service to those of its customers who do not choose a retail electric
supplier and have a maximum demand of less than 500 kilowatts. In
addition, UI is required to offer supplier of last resort service to customers
who are not eligible for standard service and who do not choose to purchase
electric generation service from a retail electric supplier licensed in
Connecticut.
UI must
procure its standard service power pursuant to a procurement plan approved by
the DPUC. The procurement plan must provide for a portfolio of
service agreements procured in an overlapping pattern over fixed time periods (a
“laddering” approach). In June 2006, the DPUC approved a procurement
plan for UI. As required by Connecticut statute, a third party
consultant retained by the DPUC works closely with UI in the procurement process
and to provide a joint recommendation to the DPUC as to selected
bids.
UI has
wholesale power supply agreements in place for the supply of all of UI’s
standard service customers for all of 2010, 80% for 2011 and 20% for
2012. Supplier of last resort service is procured on a quarterly
basis. UI determined that its contracts for standard service and
supplier of last resort service are derivatives under Accounting Standards
Codification (ASC) 815 “Derivatives and Hedging” and elected the “normal
purchase, normal sale” exception under ASC 815 “Derivatives and
Hedging”. As such, UI regularly assesses the accounting treatment for
its power supply contracts. These wholesale power supply agreements
contain default provisions that include required performance assurance,
including certain collateral obligations, in the event that UI’s credit rating
on senior debt was to fall below investment grade. In October 2009,
Moody’s Investor Services (Moody’s) released its updated credit opinion for UI
and maintained its Baa2 rating with a stable outlook. In
December 2009, Standard & Poors’ Investor Services (S&P) reinitiated
coverage on UI and rated it BBB with a stable outlook. UI’s credit
rating would have to decline two ratings to fall below investment grade at
either rating service. If this were to occur, monthly amounts due and
payable to the power suppliers would be accelerated to semi-monthly payments and
UI would have to deliver collateral security in an amount equal to the
receivables due to the sellers for the thirty day period immediately preceding
the default notice. If such a situation was in effect as of
December 31, 2009, UI would have had to post approximately $26 million
in collateral.
As a
result of an April 2008 DPUC decision, UI is permitted to seek long-term
contracts for up to 20% of standard service requirements, the goal of which is
to obtain long-term energy supply contracts and Connecticut Class I Renewable
Energy Certificates for UI’s standard service customers that will result in
economic benefit to ratepayers, both in terms of risk and cost
mitigation. UI is exploring long-term contract
alternatives.
Arrangements
with Other Industry Participants
ISO-NE
and RTO-NE
ISO New
England, Inc. (ISO-NE), an independent, not-for-profit corporation, was approved
by the FERC as the regional transmission organization for New England (RTO-NE)
on February 1, 2005. ISO-NE is responsible for the reliable operation
of the region’s bulk electric power system and fair administration of the
region’s wholesale electricity marketplace. ISO-NE is also
responsible for the management of the comprehensive bulk electric power system
and transmission system planning processes that address the region's long-term
electricity needs.
Transmission
Return on Equity (ROE)
In March
2008, the FERC issued an order on rehearing (Rehearing Order) establishing
allowable ROEs for transmission projects of transmission owners in New England,
including UI. In the Rehearing Order, the FERC established the
base-level ROE of 11.14% beginning in November 2006. The Rehearing
Order also confirmed a 50 basis point ROE adder on Pool Transmission Facilities
(PTF) for participation in the RTO-NE and a 100 basis point ROE incentive for
projects included in the ISO-NE Regional System Plan that were
completed and on line as of December 31, 2008. The Middletown/Norwalk
Transmission Project received this 100 basis point ROE
adder. For projects placed in service after December 31,
2008, incentives may be requested from the FERC, through a specific showing
justifying the incentive, on a project specific basis.
In May
2008, several public entities, including the DPUC, filed a petition with the
United States Court of Appeals for the District of Columbia Circuit (U.S. Court
of Appeals) challenging the Rehearing Order. On January 29, 2010, the
U.S. Court of Appeals issued a decision upholding the FERC order.
UI’s
overall transmission ROE is determined by the mix of UI’s transmission rate base
between new and existing transmission assets, and whether such assets are PTF or
non-PTF. UI’s transmission assets are primarily PTF. For
2009, UI’s overall allowed weighted-average ROE for its transmission business
was 12.52%.
Middletown/Norwalk
Transmission Project
In
December 2008, the 345-kilovolt (kV) transmission line from Middletown,
Connecticut, to Norwalk, Connecticut (the Project) was completed and the
transmission assets were placed in service. As a result, UI’s
transmission rate base increased by approximately $300 million, an increase of
more than 200% relative to UI’s net transmission assets existing prior to the
Project receiving approval from the Connecticut Siting Council
(CSC).
In a May
2007 Order, FERC approved rate incentives for the Project. The
Project was allowed to include Construction Work In Progress (CWIP) expenditures
in rate base. For project costs incurred before August 8, 2005,
the FERC allowed UI to include 50% of CWIP expenditures in rate base, and for
project costs incurred after August 8, 2005, the FERC allowed UI to
include 100% of CWIP expenditures in rate base. The FERC also
accepted a 50 basis point adder which will be applied only to costs associated
with advanced transmission technologies.
Certain
parties requested rehearing of the FERC May 2007 order, but in January 2009, the
FERC denied those requests. Also, in January 2009, the DPUC and
the Attorney General of Connecticut filed a petition with the U.S. Court of
Appeals seeking judicial review of the FERC’s May 2007 and January 2009
orders. UI is unable to predict the outcome of these appeals at this
time.
UI and
CL&P filed a transmission cost allocation application relating to the
Project with ISO-NE in April 2008. ISO-NE will determine which costs
of the Project, if any, will be included in the New England regional
transmission rate. UI will seek to recover any non-pool supported costs of the
Project, or Localized Costs, in transmission revenues from customers throughout
the State of Connecticut.
Hydro-Quebec
UI is a
participant in the Hydro-Quebec transmission tie facility linking New England
and Quebec, Canada. UI has a 5.45% participating share in this
facility, which has a maximum 2,000 megawatt-equivalent generation capacity
value.
Environmental
Regulation
The
National Environmental Policy Act (the Act) requires that detailed statements of
the environmental effect of UI’s facilities be prepared in connection with the
issuance of various federal permits and licenses. Federal agencies
are required by that Act to make an independent environmental evaluation of the
facilities as part of their actions during proceedings with respect to these
permits and licenses. In Connecticut, the Connecticut Siting Council
serves as the designated authority to ensure UI’s facilities are in compliance
with the Act, except as otherwise specified in certain permits, such as those
required by the Army Corps of Engineers.
Under the
federal Toxic Substances Control Act (TSCA), the United States Environmental
Protection Agency (EPA) has issued regulations that control the use and disposal
of Polychlorinated Biphenyls (PCBs). PCBs had been widely used as
insulating fluids in many electric utility transformers and capacitors
manufactured before TSCA prohibited any further manufacture of such PCB
equipment. Fluids with a concentration of PCBs higher than 500 parts
per million and materials (such as electrical capacitors) that contain such
fluids must be disposed of through burning in high temperature incinerators
approved by the EPA. Presently, no equipment having fluids with
levels of PCBs higher than 500 parts per million are known by UI to remain in
service in its system.
Under the
federal Resource Conservation and Recovery Act (RCRA), the generation,
transportation, treatment, storage and disposal of hazardous wastes are subject
to regulations adopted by the EPA. Connecticut has adopted state
regulations that parallel RCRA regulations but are more stringent in some
respects. UI has complied with the notification and application
requirements of present regulations, and the procedures by which UI handles,
stores, treats and disposes of hazardous waste products comply with these
regulations.
RCRA also
regulates underground tanks storing petroleum products or hazardous substances,
and Connecticut has adopted state regulations governing underground tanks
storing petroleum and petroleum products that, in some respects, are more
stringent than the federal requirements. UI currently owns eight
underground storage tanks, used primarily for gasoline and fuel oil, which are
subject to these regulations. A testing program has been implemented
to detect leakage from any of these tanks, and substantial costs may be incurred
for future actions taken to prevent tanks from leaking, to remedy any
contamination of groundwater, and to modify, remove and/or replace older tanks
in compliance with federal and state regulations.
In
accordance with applicable regulations, UI has disposed of residues from
operations at landfills. In recent years it has been determined that
such disposal practices, under certain circumstances, can cause groundwater
contamination. Although UI has no current knowledge of the existence
of any such contamination, UI or regulatory agencies may determine that remedial
actions must be taken in relation to past disposal practices.
In
complying with existing environmental statutes and regulations and further
developments in these and other areas of environmental concern, including
legislation and studies in the fields of water and air quality, hazardous waste
handling and disposal, toxic substances, electric and magnetic fields, and
global climate change, UI may incur substantial capital expenditures for
equipment modifications and additions, monitoring equipment and recording
devices, and it may incur additional operating expenses. Litigation
expenditures may also increase as a result of ongoing scientific investigations,
speculation and debate concerning the possibility of harmful health effects of
electric and magnetic fields. The total amount of these expenditures
is not now determinable.
If any of
the aforementioned events occurs, UI may experience substantial costs prior to
seeking regulatory recovery. Additional discussion regarding
environmental issues may be found in Part II, Item 8 of this Form 10-K under the
caption, “Financial Statements and Supplementary Data” – Notes to Consolidated
Financial Statements – Note (J), Commitments and Contingencies – Environmental
Concerns,” which information is hereby incorporated by reference.
NON-UTILITY
ACTIVITIES
UIL
Holdings’ non-utility activities primarily consist of United Capital
Investments, Inc. (UCI) which holds a passive, minority equity position in The
Ironwood Mezzanine Fund, an investment fund. Ironwood is a regional
Small Business Investment Company (SBIC) fund committed to investing a portion
of its capital in women-owned and minority-owned businesses and businesses
located in low and moderate income areas. The carrying value of UCI’s
investment in The Ironwood Mezzanine Fund as of December 31, 2009 was $0.8
million. UCI also
has a lease agreement that conveys the right to a third party to a specific area
located in New Haven, Connecticut. UCI’s investment represents the
net present value of future cash flows related to a portion of the
area. In 1999, UCI paid $1.5 million for the net future lease
payments and is amortizing the amount over the life of the
lease. UCI’s investment in the lease at December 31, 2009 was $1.2
million.
FINANCING
Information
regarding UIL Holdings’ capital requirements and resources and its financings
and financial commitments may be found in Part II, Item 7 of this Form 10-K
under the caption, “Management’s Discussion and Analysis of Financial Condition
and Results of Operations – Liquidity and Capital Resources,” which information
is hereby incorporated by reference.
EMPLOYEES
As of
December 31, 2009, UIL Holdings and its subsidiaries had a total of 1,066
employees, of which 480 were members of Local 470-1, Utility Workers Union of
America, AFL-CIO. UI and Union Local 470-1 are parties to a six-year
collective bargaining agreement which expires on May 15, 2011.
Item
1A. Risk Factors.
The
financial condition and results of operations of UIL Holdings are subject to
various risks, uncertainties and other factors, some of which are described
below. Additional risks, uncertainties and other factors not
presently known or currently deemed not to be material may also affect UIL
Holdings’ financial condition and results of operations.
Legislation
and regulation can significantly affect UI’s structure, operations and financial
results.
UI is an
electric transmission and distribution utility whose structure and operations
are significantly affected by legislation and regulation. UI’s rates
and authorized returns on equity are regulated by the FERC and the
DPUC. Legislation and regulatory decisions implementing legislation
establish a framework for UI’s operations. Such legislation and
regulatory decisions may result in the establishment of revenue requirements
that are insufficient for UI to maintain customer services at current levels
while still earning its allowed return. Legislation and regulatory
decisions could negatively impact UI’s ability to reach earnings targets and to
access debt and equity financing at reasonable cost. For a further
discussion of legislative and regulatory actions, refer to Part II, Item 7,
“Management’s Discussion and Analysis of Financial Condition and Results of
Operations – Major Influences on Financial Condition – The United Illuminating
Company – Legislation & Regulation,” of this Form 10-K.
UIL
Holdings’ ability to maintain future cash dividends at the level currently paid
to shareowners is dependent upon the ability of its subsidiaries, primarily UI,
to pay dividends to UIL.
UIL
Holdings is dependent on dividends from its subsidiaries and from external
financings to provide the cash in excess of the amount currently on hand that is
necessary for debt service, to pay administrative costs, and to pay common stock
dividends to UIL Holdings’ shareholders. As UIL Holdings’ sources of
cash are limited to dividends from its subsidiaries and external borrowings, the
ability to maintain future cash dividends at the level currently paid to
shareowners will be primarily dependent upon sustained earnings from current
operations of UI.
Volatility
in the capital markets could negatively impact UIL Holdings’ ability to access
capital in the debt and equity markets, thus impacting its ability to meet its
financing requirements and fund its capital program.
All of
UIL Holdings’ and UI’s financing and capital requirements that exceed available
cash will be provided by external financing. Although there is no
commitment to provide such financing from any source of funds, other than the
short-term credit facilities currently available to UI and UIL Holdings, future
external financing needs are expected to be satisfied by the issuance of
additional short-term and long-term debt and equity securities. The
continued availability of these methods of financing will be dependent on many
factors, including conditions in the securities and credit markets and economic
conditions generally, as well as the debt ratings, current debt levels and
future income and cash flow of UIL Holdings and UI. See Part II, Item
8, “Financial Statements and Supplementary Data – Notes to Consolidated
Financial Statements – Note (B), Capitalization and Note (D), Short Term Credit
Arrangements” of this Form 10-K for a discussion of UIL Holdings’ financing
arrangements.
Increases
in interest rates could have an adverse impact on the financial condition and
results of operations of UIL Holdings and UI.
Credit
market trends impact the cost of UIL Holdings’ and UI’s
borrowings. Increases in interest rates could result in increased
cost of capital in the refinancing of fixed rate debt at maturity and in the
remarketing of multi-annual tax-exempt bonds. As a result of the
remarketing of tax exempt bonds in February 2009, described in Part II, Item 7A,
“Quantitative and Qualitative Disclosures About Market Risk” of this Form 10-K,
interest rates are higher than the interest rates on the bonds prior to the
remarketing. In addition, UIL Holdings and UI have short-term
revolving credit agreements that permit borrowings at fluctuating interest rates
determined by reference to Citibank’s New York base rate
and the
Federal Funds Rate (as defined in the agreements), and also permit borrowings
for fixed periods up to six months as specified by UIL Holdings and UI at fixed
interest rates (London Interbank Offered Rate or LIBOR) determined by the
Eurodollar Interbank Market in London. Changes in LIBOR
or the prime or Federal Funds lending markets will have an impact on interest
expense. For further discussion of UIL Holdings’ cost of capital and
interest rate risk, see Part II, Item 7, “Management’s Discussion and Analysis
of Financial Condition and Results of Operations – Liquidity and Capital
Resources,” and Item 7A, “Quantitative and Qualitative Disclosures About
Market Risk,” of this Form 10-K. For further discussion of
UI and UIL Holdings’ revolving credit facilities, see Part II, Item 7,
“Management’s Discussion and Analysis of Financial Condition and Results of
Operations – Liquidity and Capital Resources,” and Part II, Item 8, “Financial
Statements and Supplementary Data – Notes to Consolidated Financial Statements –
Note (D) Short-Term Credit Arrangements.”
UIL
Holdings and its subsidiaries may incur substantial capital expenditures and
operating expenses in complying with environmental regulations, which could have
an adverse impact on the results of operations and financial condition of UIL
Holdings.
In
complying with existing environmental statutes and regulations and further
developments in areas of environmental concern, UIL Holdings and its
subsidiaries may incur substantial capital expenditures for equipment
modifications and additions, monitoring equipment and recording devices, and it
may incur additional operating expenses. Environmental damage claims
may also arise from the operations of UIL Holdings’ subsidiaries. For
further discussion of significant environmental issues known to UIL Holdings at
this time, see Part II, Item 8, “Financial Statements and Supplementary Data –
Notes to Consolidated Financial Statements – Note (J), Commitments and
Contingencies – Environmental Concerns,” of this Form 10-K.
In
addition, governmental policy makers, industry representatives and scientists
continue to discuss global climate change and potential legislation to reduce
greenhouse gases. Due to the high level of uncertainty regarding the
character and timing of any legislation or regulations that may be adopted,
management is unable to evaluate the potential economic impact of any such
measures at this time. Additional regulation in this area could
result in UI and GenConn incurring additional capital spending and higher
operating expenses.
The
recent economic downturn has reduced and could further reduce the demand for
electricity and impair the financial soundness of customers, which could
adversely affect our results of operation. The economic downturn
could also impair the financial soundness of UI’s vendors and service
providers.
The
slowing of the Connecticut and national economies has reduced, and could in the
future further reduce, the demand for electricity. In Connecticut,
the economic slow-down has included a sustained decline in the housing market
and rising unemployment. Although it remains below the national
average unemployment rate of 10.0%, Connecticut’s seasonally-adjusted
unemployment rate had risen to 8.9% in December
2009. Furthermore, as a result of the continued economic downturn
affecting the economies of the state of Connecticut, the United States and other
parts of the world, UI’s vendors and service providers could experience serious
cash flow problems. As a result UI’s vendors and service providers
may be unable to perform under existing contracts or may significantly increase
their prices or reduce their output or performance on future
contracts.
The
loss of key personnel or the inability to hire and retain qualified employees
could have an adverse effect on the operations of UI.
A
significant portion of UI’s workforce, including many workers with specialized
skills maintaining and servicing the electrical infrastructure, may retire over
the next five years. The inability to replace these employees could
negatively impact UI’s ability to maintain system reliability at its current
levels. For further discussion refer to Part II, Item 7,
“Management’s Discussion and Analysis of Financial Condition and Results of
Operations – Major Influences on Financial Condition,” of this Form
10-K.
The
inability of management to maintain good relations and effectively negotiate
future collective bargaining agreements with the bargaining unit could have a
material adverse impact on UI’s financial condition and results of
operations.
Significant
portions of the workforce at UI are covered by collective bargaining agreements
that expire in May 2011. The inability of management to maintain good relations
and effectively negotiate future collective bargaining agreements with the
bargaining unit could have a material adverse impact on UI’s financial condition
and results of operations, as a result of increased expenses related to wages
and benefits, poor working performance or organized work stoppages.
The
inability of GenConn to complete its two peaking generation projects, the
inability to meet the contractual commercial operation dates, and the potential
for unrecovered costs could adversely impact UIL Holdings’ financial condition
and results of operations.
Borrowings
by UI under an equity bridge loan (EBL) will be lent to GenConn and be converted
into an equity investment upon the attainment of commercial operation by GenConn
for its two peaking generation facilities. The inability of GenConn
to complete construction of and attain commercial operation for its two peaking
generation facilities, or a significant delay in obtaining commercial operation
by the contractual dates, or the inability to recover the related operating
costs after commercial operation has been obtained, could adversely impact UIL
Holdings’ financial condition and results of operations.
Grid
disturbances, disruption in our networks, severe weather, security cyber
attacks, or acts of war or terrorism could negatively impact UIL Holdings’
operating systems.
A
disruption or black-out caused by an event that impacts the regional grid or
UI’s local system, such as, but not limited to a severe storm, transmission
facility outage, security breach, cyber attack, or terrorist action, could
negatively impact the operation and sustainability of our
systems. Any such disruption or attack could result in a significant
decrease in revenues and significant additional costs to repair assets, which
could have a material adverse impact on our financial
condition
and results of operations. Severe weather, such as ice and snow
storms, hurricanes and other natural disasters, may cause outages and
substantial property damage which may require us to incur additional costs that
are generally not insured.
UIL
Holdings may be required to make payments under its indemnification agreements
with the buyers of former Xcelecom companies, which could adversely impact UIL
Holdings’ financial condition and results of operations.
UIL
Holdings is obligated to indemnify the buyers of Xcelecom’s former companies for
breaches of representations, warranties and covenants made in the transaction
documents with those buyers, and for certain actions by, and obligations of, the
companies. A requirement that UIL Holdings pay an indemnity claim
could negatively impact UIL Holdings’ cash flow.
Item
1B. Unresolved Staff Comments.
None
Item
2. Properties.
Transmission
and Distribution Plant
The
transmission lines of UI consist of approximately 101 circuit miles of overhead
lines and approximately 28 circuit miles of underground lines, all operated at
345-kV or 115-kV and located within or immediately adjacent to the territory
served by UI. These transmission lines are part of the New England
transmission grid. A major portion of UI’s transmission lines is
constructed on railroad rights-of-way pursuant to two Transmission Line
Agreements. One of the agreements expires in May 2030 and will be
automatically extended for up to two successive renewal periods of 15 years
each, unless UI provides timely written notice of its election to reject the
automatic extension. The other agreement will expire in May
2040.
UI owns
and operates 26 bulk electric supply substations with a capacity of 1,827
megavoltampere (MVA), and 21 distribution substations with a capacity of 107
MVA. UI has 3,166 pole-line miles of overhead distribution lines and
132 conduit-bank distribution miles.
See Part
II, Item 7, “Management’s Discussion and Analysis of Financial Condition and
Results of Operations - Liquidity and Capital Resources,” of this Form 10-K
concerning the estimated cost of additions to UI’s transmission and distribution
facilities, which information is hereby incorporated by reference.
Administrative
and Service Facilities
The
corporate headquarters of both UIL Holdings and UI are located in New Haven,
Connecticut. Additionally, UI occupies several facilities within its
service territory for administrative and operational purposes.
Item
3. Legal Proceedings.
The
general contractor and two subcontractors responsible for civil construction
work in connection with the installation of UI’s portion of the
Middletown/Norwalk Transmission Project’s underground electric cable system have
filed a lawsuit seeking payment for change order requests for approximately
$34.5 million plus interest and costs. UI has evaluated the change
order requests and lawsuits and, in doing so, has retained the services of an
independent third party to review the requests and supporting
information. UI intends to defend the litigation
vigorously. To the extent that any of the change order requests are
valid, UI would seek recovery through its transmission revenue
requirement.
Item
4. Submission of Matters to a Vote of Security Holders.
There
were no matters submitted to a vote of security holders, through the
solicitation of proxies or otherwise, during the fourth quarter of the fiscal
year ended December 31, 2009.
EXECUTIVE
OFFICERS
The names
and ages of all executive officers of UIL Holdings, including
certain officers of its subsidiary UI, and the period during which he or
she has held the corporate office indicated, are as follows:
|
Name
|
Age*
|
Position
(1)
|
Effective
Date
|
|
James
P. Torgerson
|
57
|
President
and Chief Executive Officer
|
(2)
|
|
Anthony
J. Vallillo
|
60
|
President
and Chief Operating Officer UI
|
January
1, 2001
|
|
Richard
J. Nicholas
|
54
|
Executive
Vice President and Chief Financial Officer
|
March
1, 2005
|
|
Linda
L. Randell
|
59
|
Senior
Vice President, General Counsel and Corporate Secretary
|
(3)
|
|
Steven
P. Favuzza
|
56
|
Vice
President and Controller
|
July
23, 2007
|
|
Richard
J. Reed
|
59
|
Vice
President - Engineering and Project Excellence UI
|
(4)
|
|
John
J. Prete
|
52
|
Vice
President - Transmission Business UI
|
October
1, 2007
|
|
Anthony
Marone III
|
46
|
Vice
President - Client & External Relations UI
|
(5)
|
*Age as
of December 31, 2009
(1) Messrs.
Vallillo, Reed, Prete and Marone hold corporate offices of UI but have also been
designated as executive officers of UIL Holdings by the board of directors of
UIL Holdings in light of the policy-making role each fulfills for UIL
Holdings.
(2) As
previously disclosed in UIL Holdings’ filing on Form 8-K dated January 10, 2006,
James P. Torgerson was appointed President of UIL Holdings, effective January
23, 2006. As previously disclosed in UIL Holdings’ filing on Form 8-K
dated July 3, 2006, Mr. Torgerson was appointed Chief Executive Officer of UIL
Holdings, effective July 1, 2006.
(3) As
previously disclosed in UIL Holdings’ filing on Form 8-K dated March 5, 2007,
Linda L. Randell was appointed Senior Vice President and General Counsel of UIL
Holdings commencing March 26, 2007. As previously disclosed in UIL
Holdings’ filing on Form 8-K dated July 24, 2007, Ms. Randell was appointed
Corporate Secretary, effective July 23, 2007.
(4)
Richard J. Reed was appointed Vice President – Electric System of UI on
January 1, 2001. Mr. Reed’s job title was changed to Vice
President – Engineering and Project Excellence of UI, effective January 1,
2010.
(5)
Anthony Marone III was appointed Vice President – Client Services of UI on
October 1, 2007. Mr. Marone’s job title was changed to Vice President
– Client & External Relations of UI effective July 1, 2009.
There is
no family relationship between any director, executive officer, or person
nominated or chosen to become a director or executive officer of UIL
Holdings. All of the above executive officers and persons chosen to
become executive officers have entered into employment
agreements. There is no arrangement or understanding between any
executive officer of UIL Holdings and any other person pursuant to which such
officer was selected as an officer.
A brief
account of the business experience during the past five years of each executive
officer of UIL Holdings is as follows:
James P.
Torgerson. Mr. Torgerson served as President and Chief
Executive Officer of the Midwest Independent Transmission System Operator, Inc.,
prior to January 23, 2006. Mr. Torgerson was appointed President of
UIL Holdings on January 23, 2006, Chief Executive Officer of UI on April
24, 2006 and Chief Executive Officer of UIL Holdings on July 1,
2006.
Richard J.
Nicholas. Mr. Nicholas served as Vice President, Finance and
Chief Financial Officer of UI from November 2002 until March
2005. Mr. Nicholas was appointed Executive Vice President and Chief
Financial Officer of UIL Holdings and UI on March 1, 2005.
Linda L.
Randell. Ms. Randell served as a Partner of Wiggin and Dana
LLP from 1980 to March 26, 2007. Ms. Randell was appointed Senior
Vice President and General Counsel of UIL Holdings and UI on March 26, 2007 and
was appointed Corporate Secretary of UIL Holdings and UI on July 23,
2007.
Anthony J.
Vallillo. Mr. Vallillo has served as President and Chief
Operating Officer of UI since January 2001.
Richard J.
Reed. Mr. Reed served as Vice President – Electric System of
UI from January 2001 until December 2009. Mr. Reed’s job title was
changed to Vice President – Engineering and Project Excellence of UI on January
1, 2010.
Steven P.
Favuzza. Mr. Favuzza served as Director – Financial Compliance
of UI from January 2003 to February 2005. Mr. Favuzza served as
Assistant Vice President – Corporate Planning of UI and of UIL Holdings from
March 2005 to July 2007. Mr. Favuzza was appointed Vice President and
Controller of UI and of UIL Holdings on July 23, 2007.
John J. Prete. Mr.
Prete served as Project Director for the Middletown/Norwalk Transmission Project
from January 2003 to April 2006. Mr. Prete served as Associate
Vice President – Transmission Business of UI from April 2006 to October
2007. Mr. Prete was appointed Vice President of UI on October 1,
2007.
Anthony Marone
III. Mr. Marone served as Senior Director – Client Services of
UI from January 2003 to February 2005. Mr. Marone served as Associate
Vice President – Client Services of UI from February 2005 to October
2007. Mr. Marone served as Vice President – Client Services of UI
from October 2007 to July 2009. Mr. Marone’s job title was changed to
Vice President – Client and External Relations of UI on July 1,
2009. Mr. Marone is also the President of GenConn Energy LLC
(GenConn), a 50-50 joint venture of UI and NRG. See Part II, Item 8,
“Financial Statements and Supplementary Data – Notes to Consolidated Financial
Statements – Note (H), Related Party Transactions,” of this Form 10-K, which is
hereby incorporated by reference.
Part
II
Item
5. Market for UIL Holdings’ Common Equity, Related Stockholder
Matters and Issuer Purchases of Equity Securities.
UIL
Holdings’ common stock is traded on the New York Stock Exchange, where the high
and low closing sale prices during 2009 and 2008 were as follows:
|
2009 Sale
Price
|
2008 Sale
Price
|
|||
|
High
|
Low
|
High
|
Low
|
|
|
First
Quarter
|
$30.93
|
$17.15
|
$35.17
|
$27.66
|
|
Second
Quarter
|
$24.20
|
$20.69
|
$31.65
|
$28.37
|
|
Third
Quarter
|
$27.22
|
$21.92
|
$34.78
|
$27.84
|
|
Fourth
Quarter
|
$28.63
|
$25.57
|
$34.76
|
$26.80
|
Quarterly
dividends on the common stock have been paid since 1900. The
quarterly cash dividends declared in 2009 and 2008 were at a rate of $0.432 per
share.
UIL
Holdings expects to continue its policy of paying regular cash dividends,
although there is no assurance as to the amount of future dividends which
depends on future earnings, capital requirements, and financial
condition.
Further
information regarding payment of dividends is provided in Part II, Item 7,
“Management’s Discussion and Analysis of Financial Condition and Results of
Operations – Liquidity and Capital Resources,” of this Form 10-K.
As of
December 31, 2009, there were 7,899 common stock shareowners of
record.
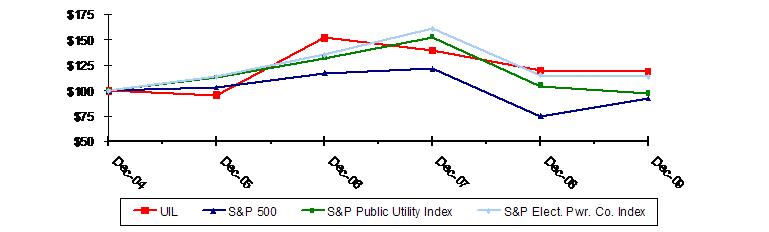
The line
graph appearing below compares the yearly change in UIL Holdings’ cumulative
total shareowner return on its common stock with the cumulative total return on
the S&P Composite-500 Stock Index, the S&P Public Utility Index and the
S&P Electric Power Companies Index for the period of five fiscal years
commencing 2005 and ending 2009.
|
Dec-04
|
Dec-05
|
Dec-06
|
Dec-07
|
Dec-08
|
Dec-09
|
|
|
UIL
|
$100
|
$95
|
$152
|
$139
|
$120
|
$119
|
|
S&P
500
|
$100
|
$103
|
$117
|
$121
|
$74
|
$92
|
|
S&P
Public Utility Index
|
$100
|
$113
|
$132
|
$153
|
$105
|
$97
|
|
S&P
Elect. Pwr. Co. Index
|
$100
|
$114
|
$135
|
$161
|
$115
|
$114
|
|
*
|
Assumes
that the value of the investment in UIL Holdings’ common stock and each
index was $100 on December 31, 2004 and that all dividends were
reinvested. For purposes of this graph, the yearly change in
cumulative shareowner return is measured by dividing (i) the sum of (A)
the cumulative amount of dividends for
the
|
|
|
year,
assuming dividend reinvestment, and (B) the difference in the fair market
value at the end and the beginning of the year, by (ii) the fair market
value at the beginning of the year. The changes displayed are
not necessarily indicative of future returns measured by this or any other
method.
|
|
Equity
Compensation Plan Information
|
|||
|
Plan
Category
|
Number
of Securities to Be Issued Upon Exercise of Outstanding Options, Warrants
and Rights
(a)
|
Weighted
Average Exercise Price of Outstanding Options, Warrants and
Rights
(b)
|
Number
of Securities Remaining Available for Future Issuance Under Equity
Compensation Plans [Excluding Securities Reflected in Column
(a)]
(c)
|
|
Equity
Compensation Plans Approved by Security Holders
|
807,665
(1)
|
$30.32
(2)
|
648,194
|
|
Equity
Compensation Plans Not Approved by Security Holders
|
None
|
-
|
-
|
|
Total
|
807,665
(1)
|
$30.32
(2)
|
648,194
|
|
(1)
|
Includes
168,501 shares to be issued upon exercise of outstanding options, which
include reload rights, 470,765 performance shares to be issued upon
satisfaction of applicable performance and service requirements, and
168,399 shares of restricted stock subject to applicable service
requirements.
|
|
(2)
|
Weighted
average exercise price is applicable to outstanding options
only.
|
UIL
Holdings repurchased 20,316 shares of common stock in open market transactions
to satisfy matching contributions for participants’ contributions into UIL
Holdings 401(k) in the form of UIL Holdings stock as follows:
|
Period
|
Total
Number of Shares Purchased*
|
Average
Price Paid Per Share
|
Total
Number of Shares Purchased as Part of Publicly Announced
Plans
|
Maximum
Number of Shares That May Yet Be Purchased Under the
Plans
|
|
October
|
7,163
|
$26.14
|
None
|
None
|
|
November
|
6,262
|
$27.08
|
None
|
None
|
|
December
|
6,891
|
$28.33
|
None
|
None
|
|
Total
|
20,316
|
$27.17
|
None
|
None
|
*
All shares were purchased in open market transactions. The effects of
these transactions did not change the number of outstanding shares of UIL
Holdings’ common stock.
|
2009
|
2008
|
2007
|
2006
|
2005
|
||||||||||||||||
|
Financial
Results of Operation ($000's)
|
||||||||||||||||||||
|
Sales
of electricity
|
||||||||||||||||||||
|
Utility
|
||||||||||||||||||||
|
Retail
|
||||||||||||||||||||
|
Residential
|
$ | 473,813 | $ | 495,440 | $ | 483,847 | $ | 356,652 | $ | 357,351 | ||||||||||
|
Commercial
|
273,759 | 302,765 | 350,158 | 316,866 | 312,239 | |||||||||||||||
|
Industrial
|
39,524 | 47,918 | 56,257 | 86,055 | 87,558 | |||||||||||||||
|
Other
|
9,569 | 9,403 | 10,188 | 10,810 | 10,397 | |||||||||||||||
|
Total
Retail
|
796,665 | 855,526 | 900,450 | 770,383 | 767,545 | |||||||||||||||
|
Wholesale
|
235 | 42,291 | 36,637 | 29,355 | 35,782 | |||||||||||||||
|
Other
operating revenues
|
98,781 | 50,123 | 43,917 | 46,194 | 9,068 | |||||||||||||||
|
Non-utility
businesses
|
869 | 780 | 995 | 789 | 828 | |||||||||||||||
|
Total
operating revenues
|
$ | 896,550 | $ | 948,720 | $ | 981,999 | $ | 846,721 | $ | 813,223 | ||||||||||
|
Operating
income from Continuing Operations
|
$ | 122,418 | $ | 114,127 | $ | 90,165 | $ | 79,156 | $ | 80,132 | ||||||||||
|
Income
from Continuing Operations, net of tax
|
$ | 54,459 | $ | 48,385 | $ | 46,693 | $ | 58,716 | $ | 33,476 | ||||||||||
|
Discontinued
Operations, net of tax (Note N) (2)
|
(142 | ) | (237 | ) | (1,996 | ) | (123,880 | ) | (2,222 | ) | ||||||||||
|
Net
Income (Loss)
|
$ | 54,317 | $ | 48,148 | $ | 44,697 | $ | (65,164 | ) | $ | 31,254 | |||||||||
|
Financial
Condition ($000's)
|
||||||||||||||||||||
|
Property,
Plant and Equipment in service - net
|
$ | 1,028,860 | $ | 986,777 | $ | 600,305 | $ | 547,741 | $ | 517,251 | ||||||||||
|
Deferred
charges and regulatory assets
|
882,662 | 779,587 | 687,672 | 722,644 | 721,127 | |||||||||||||||
|
Assets
of discontinued operations
|
3,728 | 5,437 | 4,490 | 9,935 | 221,899 | |||||||||||||||
|
Total
Assets (1)
|
2,221,760 | 2,083,186 | 1,775,834 | 1,631,493 | 1,799,055 | |||||||||||||||
|
Current
portion of long-term debt
|
58,256 | 55,286 | 104,286 | 78,286 | 4,286 | |||||||||||||||
|
Net
long-term debt excluding current portion
|
673,549 | 549,031 | 479,317 | 408,603 | 486,889 | |||||||||||||||
|
Net
common stock equity
|
574,176 | 474,579 | 464,291 | 460,581 | 544,578 | |||||||||||||||
|
Common
Stock Data
|
||||||||||||||||||||
|
Average
number of shares outstanding - basic (000's)
|
28,027 | 25,114 | 24,986 | 24,441 | 24,245 | |||||||||||||||
|
Number
of shares outstanding at year-end (000's)
|
29,977 | 25,174 | 25,032 | 24,856 | 24,320 | |||||||||||||||
|
Earnings
per share - basic:
|
||||||||||||||||||||
|
Continuing
Operations
|
$ | 1.94 | $ | 1.93 | $ | 1.87 | $ | 2.41 | $ | 1.38 | ||||||||||
|
Discontinued
Operations (Note N) (2)
|
- | (0.01 | ) | (0.08 | ) | (5.07 | ) | (0.09 | ) | |||||||||||
|
Net
Earnings (Loss)
|
$ | 1.94 | $ | 1.92 | $ | 1.79 | $ | (2.66 | ) | $ | 1.29 | |||||||||
|
Earnings
per share - diluted
|
||||||||||||||||||||
|
Continuing
Operations
|
$ | 1.93 | $ | 1.90 | $ | 1.85 | $ | 2.37 | $ | 1.37 | ||||||||||
|
Discontinued
Operations (Note N) (2)
|
- | (0.01 | ) | (0.08 | ) | (5.00 | ) | (0.09 | ) | |||||||||||
|
Net
Earnings (Loss)
|
$ | 1.93 | $ | 1.89 | $ | 1.77 | $ | (2.63 | ) | $ | 1.28 | |||||||||
|
Book
value per share
|
$ | 19.15 | $ | 18.85 | $ | 18.55 | $ | 18.53 | $ | 22.39 | ||||||||||
|
Dividends
declared per share
|
$ | 1.728 | $ | 1.728 | $ | 1.728 | $ | 1.728 | $ | 1.728 | ||||||||||
|
Market
Price:
|
||||||||||||||||||||
|
High
|
$ | 30.93 | $ | 35.17 | $ | 40.40 | $ | 43.15 | $ | 33.66 | ||||||||||
|
Low
|
$ | 17.15 | $ | 26.80 | $ | 27.24 | $ | 26.45 | $ | 27.57 | ||||||||||
|
Year-end
|
$ | 28.08 | $ | 30.03 | $ | 36.95 | $ | 42.19 | $ | 27.59 | ||||||||||
|
Other
Financial and Statistical Data (Utility only)
|
||||||||||||||||||||
|
Sales
by class (millions of kWh's)
|
||||||||||||||||||||
|
Residential
|
2,187 | 2,273 | 2,346 | 2,360 | 2,458 | |||||||||||||||
|
Commercial
|
2,669 | 2,724 | 2,743 | 2,676 | 2,702 | |||||||||||||||
|
Industrial
|
593 | 690 | 785 | 840 | 902 | |||||||||||||||
|
Other
|
44 | 42 | 43 | 43 | 44 | |||||||||||||||
|
Total
|
5,493 | 5,729 | 5,917 | 5,919 | 6,106 | |||||||||||||||
|
Number
of retail customers by class (average)
|
||||||||||||||||||||
|
Residential
|
292,067 | 291,906 | 291,247 | 289,913 | 289,122 | |||||||||||||||
|
Commercial
|
30,386 | 30,200 | 29,526 | 29,067 | 28,934 | |||||||||||||||
|
Industrial
|
1,136 | 1,150 | 1,180 | 1,278 | 1,356 | |||||||||||||||
|
Other
|
1,277 | 1,220 | 1,222 | 1,242 | 1,260 | |||||||||||||||
|
Total
|
324,866 | 324,476 | 323,175 | 321,500 | 320,672 | |||||||||||||||
|
(1)
Reflects reclassification of accrued asset removal costs from accumulated
depreciation to regulatory liabilities for all years
presented.
|
||||||||||||||||||||
|
(2)
Note refers to the Notes to the Consolidated Financial Statements included
in Item 8. "Financial Statements and Supplementary Data."
|
||||||||||||||||||||
Item 7. Management’s Discussion and Analysis of Financial Condition and Results of Operations.
Certain
statements contained herein, regarding matters that are not historical facts,
are forward-looking statements (as defined in the Private Securities Litigation
Reform Act of 1995). These include statements regarding management’s
intentions, plans, beliefs, expectations or forecasts for the
future. Such forward-looking statements are based on UIL Holdings’
expectations and involve risks and uncertainties; consequently, actual results
may differ materially from those expressed or implied in the
statements. Such risks and uncertainties include, but are not limited
to, general economic conditions, conditions in the debt and equity markets,
legislative and regulatory changes, changes in demand for electricity and other
products and services, unanticipated weather conditions, changes in accounting
principles, policies or guidelines, and other economic, competitive,
governmental, and technological factors affecting the operations, markets,
products and services of UIL Holdings’ subsidiaries. The foregoing
and other factors are discussed and should be reviewed in this Annual Report on
Form 10-K and other subsequent periodic filings with the Securities and Exchange
Commission. Forward-looking statements included herein speak only as
of the date hereof and UIL Holdings undertakes no obligation to revise or update
such statements to reflect events or circumstances after the date hereof or to
reflect the occurrence of unanticipated events or circumstances.
OVERVIEW
AND STRATEGY
The
primary business of UIL Holdings Corporation (UIL Holdings) is ownership of its
operating regulated utility. The utility business consists of the
electric transmission and distribution operations of The United Illuminating
Company (UI). UI is also a 50-50 joint venturer, together with NRG
Energy, Inc. (NRG), in GenConn Energy LLC (GenConn), a project selected to build
new peaking generation plants chosen by the Connecticut Department of Public
Utility Control (“DPUC”) to help address the state’s growing need for more power
generation during the heaviest load periods. UIL Holdings also has
non-utility activities which recently included the operations of Xcelecom, Inc.
(Xcelecom) until the substantial completion of the sale of that business
effective December 31, 2006. UIL Holdings is headquartered in New
Haven, Connecticut, where its senior management maintains offices and is
responsible for overall planning, operating and financial
functions.
UIL
Holdings’ current overall corporate strategy is to create shareowner value by
investing in the utility business to grow earnings and cash flow in the
following major areas of business focus:
|
·
|
Transmission
– invest in transmission infrastructure opportunities both within and
outside of UI’s service territory, pursuing financial incentives offered
by the FERC, as available
|
|
·
|
Generation
– invest in the GenConn peaking generation
project, and pursue other potential opportunities in generation
consistent with state statute and regulatory
policies
|
|
·
|
Distribution
– invest in the distribution infrastructure in accordance with UI’s
ten-year plan to maintain system reliability and meet customer
requirements
|
|
·
|
Conservation
and Load Management (C&LM) – execute state authorized C&LM
programs and regional demand response
initiatives
|
The
United Illuminating Company
UI, the
utility operating unit of UIL Holdings, is an electric transmission and
distribution utility, the primary objective of which is to provide high-quality
customer service, including the safe, reliable, cost-effective delivery of
electricity to its customers in the 17 municipalities in Southwest Connecticut
in which it operates. To provide reliable service, UI will prudently
invest in, and maintain, its transmission and distribution
infrastructure. The transmission business explores future
transmission opportunities, pursues FERC incentives, acts to influence the ISO
planning process as appropriate, and develops additional transmission
infrastructure projects. As part of this effort, UI and The
Connecticut Light and Power Company (CL&P) (which provides electric
transmission and distribution service in other Connecticut municipalities)
worked together and, in December 2008, completed a major transmission upgrade,
the Middletown/Norwalk Project, in southwest Connecticut. UI has
Connecticut Siting Council (CSC) approval for complete replacement and
construction of the Grand Avenue switching station in New Haven,
Connecticut. GenConn, a 50-50 joint-venture of UI and
NRG is currently constructing two peaking generation projects
approved by the DPUC to help address Connecticut’s growing need for more power
generation during the heaviest load
periods. GenConn’s
Devon
plant is scheduled to be in commercial operation by June 2010, and its
Middletown plant is scheduled to be in commercial operation by
June 2011. See “Major Influences on Financial Condition – The
United Illuminating Company – Generation” for further discussion.
UI plans
to manage operating and maintenance costs to have a reasonable opportunity to
achieve its authorized return on equity, while producing earnings and cash flow,
consistent with maintaining reliable service to customers. Earnings
from UI’s Competitive Transition Assessment (CTA) component are expected to
decline over time due to the planned amortization of, and resulting reduction
in, UI’s stranded cost rate base. The decline in CTA revenues is
expected to be offset by higher transmission revenues, resulting from planned
transmission infrastructure investments, investments in the distribution rate
base, and the completion of the GenConn peaking generation
facilities.
United
Capital Investments, Inc.
UCI is a
limited partner in an investment fund, The Ironwood Mezzanine Fund, with equity
participation of approximately 4% and recently held a passive, minority position
in Zero Stage Capital which was a venture capital fund that invested in emerging
growth companies. The Ironwood Mezzanine Fund is a Small Business
Investment Company that focuses on mezzanine financing and invests a portion of
its capital in women-owned and minority-owned small businesses and businesses
located in low and moderate income areas. As a mezzanine fund, it
provides growth and acquisition capital to privately held businesses committed
to sustainable long-term growth. UCI received a final distribution
for Zero Stage Capital during 2008. UCI also has a lease agreement
that conveys the right to a third party to a specific area located in New Haven,
Connecticut. The net carrying value of UCI’s investments as of
December 31, 2009, was $2.0 million.
MAJOR
INFLUENCES ON FINANCIAL CONDITION
UIL
Holdings Corporation
UIL
Holdings’ financial condition and financing capability will be dependent on many
factors, including the level of income and cash flow of UIL Holdings’
subsidiaries, conditions in the securities markets, economic conditions,
interest rates, legislative and regulatory developments, and its ability to
retain key personnel.
The loss
of key personnel or the inability to hire and retain qualified employees could
have an adverse effect on the business, financial condition and results of
operations for UIL Holdings and The United Illuminating Company
(UI). These operations depend on the continued efforts of their
respective current and future executive officers, senior management and
management personnel. UIL Holdings cannot guarantee that any member
of management at the corporate or subsidiary level will continue to serve in any
capacity for any particular period of time. In an effort to enhance
UIL Holdings’ ability to attract and retain qualified personnel, UIL Holdings
continually evaluates the overall compensation packages offered to employees at
all levels of the organization.
The
United Illuminating Company
UI is an
electric transmission and distribution utility whose structure and operations
are significantly affected by legislation and regulation. UI’s rates
and authorized return on equity are regulated by the Federal Energy Regulation
Commission (FERC) and the DPUC. Legislation and regulatory decisions
implementing legislation establish a framework for UI’s
operations. Other factors affecting UI’s financial results are
operational matters, such as the ability to manage expenses, uncollectibles and
capital expenditures, in addition to sales volume and major weather
disturbances. Sales volume is not expected to have an impact on
distribution earnings during the two-year decoupling pilot established in the
2008 Rate Case final decision. The extent to which sales volume will
have an impact on UI’s financial results beyond such period will depend upon the
nature and extent of decoupling implemented by the DPUC. UI expects to continue
to make capital investments in its distribution and transmission
infrastructure.
Generation
GenConn
is a 50-50 joint venture of UI and NRG. In 2008, the DPUC selected
two projects proposed by GenConn to help address Connecticut’s growing need for
more power generation during the heaviest load periods.
Two
peaking generation projects, each with a nominal capacity of 200 megawatts (MW),
are being constructed at NRG’s existing Connecticut plant locations in Devon and
Middletown. GenConn’s Devon plant is scheduled to be in commercial
operation by June 2010, and its Middletown plant is scheduled to be in
commercial operation by June 2011. GenConn recovers its costs
under a contract for differences (CfD) agreement which is cost of service
based. GenConn has signed CfDs for both projects with
CL&P. The cost of the contracts will be paid by customers and
will be subject to a cost-sharing agreement whereby approximately 20% of the
cost is borne by UI customers and approximately 80% by CL&P
customers.
Given the
anticipated commercial operation date for the Devon plant of June 2010, GenConn
filed its required rate case request with the DPUC in December 2009 seeking
approval of 2010 revenue requirements.
As a
result of changed market conditions and updated cost information, GenConn
project costs have increased over the proposal it had originally submitted to
the DPUC. The increase was driven primarily by increased financing
costs and the cost to build interconnection facilities at the Middletown
site. The DPUC has ruled that prudently incurred financing costs,
interconnection costs and taxes will be recoverable and, therefore, GenConn
expects to recover such costs. The CfDs will provide for a true-up of
revenue from the ISO New England (ISO-NE) markets in which GenConn participates
to DPUC approved revenue requirements.
Contracts for
Differences
In
accordance with FASB ASC 820 “Fair Value Measurements and Disclosures” (ASC
820), UIL Holdings applies fair value measurements to certain assets and
liabilities, a portion of which fall into Level 3 of the fair value hierarchy
defined by ASC 820 as pricing inputs that include significant inputs that are
generally less observable from objective sources. As of December 31,
2009, the assets and liabilities, other than pension and other post-retirement
assets, that are accounted for at fair value on a recurring basis as Level 3
instruments are contracts for differences, which represent 78.4% of the total
amount of assets, and 100% of the total amount of liabilities accounted for at
fair value on a recurring basis. The determination of fair value of
the contracts for differences is based on a probability-based expected cash flow
analysis that is discounted at risk-free interest rates and an adjustment for
non-performance risk using credit default swap rates. Certain
management assumptions were made in this valuation process, including
development of pricing that extended over the term of the
contracts. In addition, UIL performs an assessment of risks related
to obtaining regulatory, legal and siting approvals, as well as obtaining
financing resources and ultimately attaining commercial
operation. The DPUC has determined that costs associated with
these contracts for differences are fully recoverable. As a result,
there is no impact on UIL Holdings’ net income as any unrealized gains/(losses)
resulting from quarterly mark-to-market adjustments are offset by the
establishment of regulatory assets/(liabilities) that have been recognized for
the purpose of such recovery.
On
February 7, 2010, an explosion occurred at the construction site of the nearly
completed 620-megawatt plant being built by Kleen Energy Systems, LLC (“Kleen”),
one of the four capacity resources selected by the DPUC to create new or
incremental capacity resources as noted above. As noted above,
CL&P has executed CfDs with two of the selected projects, including the
Kleen project. The CfD with Kleen is subject to the sharing agreement
between UI and CL&P whereby UI pays 20% of the costs and obtains 20% of the
benefits of the contract. The extent of damage and any resulting
delay in the attainment of commercial operation is not now determinable,
therefore, UI cannot presently assess the potential financial
impact. Based on information known to date, it appears to be
reasonably likely that there will be a delay in Kleen's attainment of commercial
operation, which could have a material impact in 2010 on the fair value of the
related regulatory asset and derivative liability that existed on the
Consolidated Balance Sheet as of December 31, 2009 which was based on a
probability-based expected cash flow analysis that was discounted at the
December 31, 2009 risk-free interest rate, and an adjustment for non-performance
risk using credit default swap rates. This event will not have an
impact on UIL Holdings’ Consolidated Statement of Income.
Legislation
& Regulation
Background
From time
to time, state legislation impacts the operation of the electric utility
industry in Connecticut. The electric industry in Connecticut was
significantly restructured commencing in 1998. Legislation enacted
since then (as described below) continues to address various energy
issues. There was no significant legislation passed in 2008 or 2009
concerning the utility industry.
Electric
Restructuring As a result of Public Act 98-28, Public Act
03-135, as amended in part by Public Act 03-221, Public Act 05-1 (June Special
Session), and Public Act 07-242 (collectively, the Restructuring
Legislation), UI’s distribution and transmission rates are “unbundled” on
customers’ bills, which also include separate charges for the Competitive
Transition Assessment (CTA), Generation Services Charge (GSC), a combined public
benefits charge that includes the
C&LM charge, Renewable Energy Investment (REI) charge, and Systems Benefits
Charge (SBC), and Federally Mandated Congestion Charges (FMCCs), each as defined
in the Restructuring Legislation.
Transitional Standard Offer
Incentive The 2003 legislation provided for the DPUC to
establish an incentive plan for the procurement of long-term contracts for
transitional standard offer service that compares UI’s actual average contract
price to a regional average price for electricity, making adjustments as deemed
appropriate by the DPUC. If UI’s price was lower than the average,
the legislation provided for the plan to allocate $0.00025/kilowatt-hour of
transitional standard offer service to the distribution company. The
DPUC issued a final decision in January 2009 that found UI was not eligible for
a procurement incentive for 2004. UI appealed the DPUC’s final
decision to the state superior court. By decision filed February 5,
2010, the superior court determined that the DPUC did not apply the proper
standard in determining whether UI qualified for the incentive and that the DPUC
made other errors, and remanded the case to the DPUC for further proceeding in
accordance with the court's decision.
Energy Independence
Act In July 2005, the Energy Independence Act (EIA) became law
in Connecticut. The EIA in large part provides for incentives to
promote the development of projects and resources that are intended to reduce
FMCCs, and provides that electric distribution companies will recover their
costs and investments resulting from the law through a number of mechanisms,
including the FMCC on customers’ bills.
2007 Energy
Act In July 2007, the 2007 Energy Act became law in
Connecticut. The 2007 Energy Act contains numerous provisions
primarily regarding the electric industry. The 2007 Energy Act
resulted in the DPUC’s selection of certain peaking generation projects
(including GenConn’s proposal to build capacity at NRG’s existing plants in
Middletown and Devon). Pursuant to the 2007 Energy Act, UI continues
to work with CL&P and the Connecticut Energy Advisory Board (CEAB) in the
development of an energy assessment and resource plan that is submitted by the
CEAB to the DPUC.
2005 Transportation
Act In July 2005, the 2005 Transportation Act, became law in
Connecticut. Section 28 of this legislation, provides that the state
shall bear no part of the cost to readjust, relocate or remove an electric
transmission line buried within a public highway right-of-way where such action
is required by a state highway project, but also provides that the state shall
consider such costs in selecting a final project design in order to minimize the
overall cost incurred by the state and the electric distribution
company. As a result, the electric distribution company’s costs of
readjustment, relocation or removal will be included in tariffs, for collection
from customers.
Transmission Adjustment
Clause The DPUC has approved a transmission adjustment clause
(TAC) for UI, implementing the provisions of Section 30 of the 2005
Transportation Act, to establish a “transmission tracker” mechanism by which the
DPUC adjusts an electric distribution company’s retail transmission rate
periodically to “track” and recover the transmission costs, rates, tariffs and
charges approved by the FERC. UI makes a semi-annual filing with the
DPUC, setting forth its actual transmission revenues, projected transmission
revenue requirement, and the required TAC charge or credit so that any under- or
over-collections of transmission revenues from prior periods are reconciled
along with the expected revenue requirements for the next six months from
filing. The DPUC holds an administrative proceeding to approve the
TAC charge or credit and holds a hearing to determine the accuracy of customer
billings under the TAC. The TAC tariff and this semi-annual change of
the TAC charge or credit mitigates the lag between changes in UI’s FERC-approved
transmission revenue requirements and its retail transmission rate and
facilitates the timely matching of transmission revenues and transmission
revenue requirements.
Energy Policy
Act In August 2005, the Energy Policy Act of 2005 (Energy
Policy Act) became federal law. Title XII of the Energy Policy Act
included provisions that impact UIL Holdings, such as the repeal of the Public
Utility Holding Company Act (PUHCA) of 1935 and the enactment of PUHCA 2005, and
numerous provisions that may affect UI, some of which include (1) reducing
depreciable lives for newly constructed electric transmission lines, (2)
establishing an electric reliability organization responsible for reliability
standards, subject to FERC jurisdiction, approval and enforcement, (3)
authorizing limited FERC backstop siting authority for interstate transmission
projects in federally
designated
transmission corridors, (4) requiring the FERC to issue a rule that provides
transmission rate incentives to promote capital investment and provides for
recovery of all prudent costs of complying with mandatory reliability standards
and costs related to transmission infrastructure development, (5) prohibiting
energy market manipulation and vesting the FERC with enhanced authority to
impose penalties for violations of the FPA, and (6) revising the regulation of
Cogeneration and Qualifying Facilities under the Public Utility Regulatory
Policies Act of 1978 (PURPA).
Rates
In
rulings throughout 2009, the DPUC issued its final decision regarding UI’s
application requesting an increase in distribution rates (the “2009 Decisions”),
the results of which included a $6.8 million increase in revenue requirements
for 2009, compared to 2008. Because a larger, previously approved
increase in revenue requirements for 2009 had gone into effect
January 1, 2009, UI returned approximately $0.97 million to ratepayers
through a one-time adjustment in April 2009.
The 2009
Decisions provided for an allowed distribution return on equity of 8.75%, a
decrease from the previously approved 9.75%, and a capital structure of 50%
equity and 50% debt, compared to the previously approved 48% equity and 52%
debt. The 2009 Decisions continued the prior earnings sharing
mechanism structure, applying to the new 8.75% allowed return, whereby 50% of
any earnings over the allowed twelve month level is returned to customers and
50% is retained by UI. Given the effective date of the 2009
Decisions, UI’s weighted average allowed distribution return on equity for 2009
was 8.84%. Additionally, the 2009 Decisions provided for full revenue
decoupling of distribution revenues from sales, recovery of updated pension and
postretirement expense for 2010, a partial reconciliation for the cost of debt
and an additional increase in distribution revenue requirements of $19.4 million
for 2010.
The 2009
Decisions also provided for the establishment of a regulatory asset to address
the portion of the actual increase in pension and postretirement expense for
2009 and 2010 that was not included in rates. For 2009, a $10.2
million regulatory asset was approved and established, for which full recovery
in 2010 rates was subsequently approved by the DPUC; accordingly, it will be
removed from rates effective February 4, 2011. The DPUC
also approved the 2010 cash recovery of $11.4 million for estimated 2010 pension
and postretirement expense not previously included in rates.
In
December 2009, UI received a letter ruling approving rates effective January 1,
2010 incorporating the above mentioned distribution rate changes along with
previously approved changes to the GSC, Non-Bypassable Federally Mandated
Congestion Charges (NBFMCC), transmission and system benefits charge resulting
in no change in the total rate for a residential Rate R customer with standard
service generation. Additionally, last resort service GSC rates for
the January 1, 2010 through March 31, 2010 time period were
approved.
Transmission Return on
Equity
DPUC
decisions do not affect the revenue requirements determination for transmission,
including the applicable return on equity, which are within the jurisdiction of
the FERC. For 2009, UI’s overall allowed weighted-average ROE for its
transmission business was 12.52%. See Part II, Item 8, “Financial
Statements and Supplementary Data – Notes to Consolidated Financial Statements –
Note (C), Regulatory Proceedings – Regional Transmission Organization for New
England,” of this Form 10-K for further information.
Other
Regulation
UI
generally has several regulatory proceedings open and pending at the DPUC at any
given time. Examples of such proceedings include an annual DPUC
review and reconciliation of UI’s CTA and SBC revenues and expenses, dockets to
consider specific restructuring or electricity market issues, consideration of
specific rate or customer issues, and review of conservation
programs.
UI files
semi-annual true-ups with the DPUC regarding Bypassable Federally Mandated
Congestion Charges (BFMCC) and NBFMCC. These customer charges relate
to “congestion costs” associated with not having adequate transmission
infrastructure to move energy from the generating sources to the consumer and
costs associated with maintaining the reliability of electric
service. These costs change from time to time and the semi-annual
true-ups provide a mechanism for the electric distribution companies to adjust
the charges to customers accordingly.
During
2007, UI submitted a filing to the FERC requesting inclusion of 100% of
Construction Work in Progress (CWIP) in transmission rate base and a 50 basis
point ROE adder for use of advanced transmission technologies in the
Middletown/Norwalk transmission project. In May 2007, the FERC ruled
that for project costs incurred after August 8, 2005, UI could include
100% of CWIP expenditures in rate base. Certain parties requested
rehearing of the FERC’s May 2007 order, but in January 2009, the FERC denied
those requests. Also in January 2009 the DPUC and the Attorney
General of Connecticut filed a petition with the United States Court of Appeals
for the District of Columbia Circuit seeking judicial review of the FERC’s
May 2007 and January 2009 orders. The Company is unable to
predict the outcome of these appeals at this time.
In its
January 2009 decision, the DPUC determined that UI did not earn the Transitional
Standard Offer (TSO) procurement incentive for 2004 of approximately $0.8
million, after tax. The determination was a result of a change in the
DPUC’s methodology from its initial determination in 2005 that UI had earned the
incentive. The DPUC issued a final decision in January 2009 that found UI was
not eligible for a procurement incentive for 2004. UI appealed the
DPUC’s final decision to the state superior court. By decision filed
February 5, 2010, the superior court determined that the DPUC did not apply the
proper standard in determining whether UI qualified for the incentive and that
the DPUC made other errors, and remanded the case to the DPUC for further
proceeding in accordance with the court's decision.
Operations
In
implementing the Restructuring Legislation, UI established a Distribution
Division and other “unbundled” components for accounting purposes, to reflect
the various unbundled components on customer bills. Initially, the
Distribution Division included both transmission and
distribution. For regulatory and accounting purposes, UI has now
separated transmission and distribution into separate
divisions. Changes to income and expense items related to
transmission and distribution have a direct impact on net income and earnings
per share, while changes to items in “other unbundled utility components” do not
have such an impact. The other components are the CTA, the SBC, the
GSC, the C&LM charge, and REI charge. The CTA earns an authorized
8.75% return on the equity portion of rate base. Returns are achieved
either by accruing additional amortization expenses, or by deferring such
expenses, as required to achieve the authorized return. Amortization
expense within CTA impacts earnings indirectly through changes to the rate
base. The SBC, GSC, C&LM and REI are essentially pass-through
components (revenues are matched to recover costs). Except for the
procurement fee in the GSC previously discussed in the “Legislative &
Regulation – Background” section and the incentives earned with GSC and C&LM
as well as any SBC carrying charges applied to deferred charges as discussed in
the “Rates” section, expenses are either accrued or deferred such that there is
no net income associated with these four unbundled components.
The
primary operational factors affecting UI’s financial results are the ability to
control expenses and capital expenditures. Retail electric sales
volume can be significantly affected by economic conditions, customer
conservation efforts, and weather. Sales volume is not expected to
have an impact on distribution earnings during the two-year decoupling pilot
established in the 2008 Rate Case final decision. The extent to which
sales volume will have an impact on UI’s financial results beyond such period
will depend upon the nature and extent of decoupling implemented by the
DPUC. The level of economic growth can be impacted by job growth or
workforce reductions, plant relocations into or out of UI service territory, and
expansions or contractions of facilities within UI’s service territory, all of
which can affect demand for electricity. The weather can also have an
impact on expenses, dependent on the level of work required as a result of
storms or other extreme conditions. UI’s major expense components are
(1) purchased power, (2) amortization of stranded costs, (3) wages and benefits,
(4) depreciation, and (5) regional network service (RNS) transmission
costs.
In 2008,
UI completed the purchase of a parcel of land that is centrally located within
its service territory. This land, on 34 acres in the Town of Orange,
adjacent to I-95, will serve as the home of UI’s consolidated operations
center. In close proximity to this property, UI entered into a
long-term lease of a parcel of land that will serve as the future home of the
Company’s corporate offices. The two parcels will help UI to realize
its plan to consolidate operations and office personnel in close proximity to
each other. UI expects the result to be increased operational
efficiencies and improved customer service.
Power Supply
Arrangements
UI’s
retail electricity customers are able to choose their electricity
supplier. Since January 1, 2007, UI has been required to offer
standard service to those of its customers who do not choose a retail electric
supplier and have a maximum demand of less than 500 kilowatts. In
addition, UI is required to offer supplier of last resort service to customers
who are not eligible for standard service and who do not choose to purchase
electric generation service from a retail electric supplier licensed in
Connecticut.
UI must
procure its standard service power pursuant to a procurement plan approved by
the DPUC. The procurement plan must provide for a portfolio of
service agreements procured in an overlapping pattern over fixed time periods (a
“laddering” approach). In June 2006, the DPUC approved a procurement
plan for UI. As required by Connecticut statute, a third party
consultant retained by the DPUC works closely with UI in the procurement process
and to provide a joint recommendation to the DPUC as to selected
bids.
UI has
wholesale power supply agreements in place for the supply of all of UI’s
standard service customers for all of 2010, 80% for 2011 and 20% for
2012. Supplier of last resort service is procured on a quarterly
basis. UI determined that its contracts for standard service and
supplier of last resort service are derivatives under Accounting Standards
Codification (ASC) 815 “Derivatives and Hedging” and elected the “normal
purchase, normal sale” exception under ASC 815 “Derivatives and
Hedging”. As such, UI regularly assesses the accounting treatment for
its power supply contracts. These wholesale power supply agreements
contain default provisions that include required performance assurance,
including certain collateral obligations, in the event that UI’s credit rating
on senior debt was to fall below investment grade. In October 2009,
Moody’s Investor Services (Moody’s) released its updated credit opinion for UI
and maintained its Baa2 rating with a stable outlook. In
December 2009, Standard & Poors’ Investor Services (S&P) reinitiated
coverage on UI and rated it BBB with a stable outlook. UI’s credit
rating would have to decline two ratings to fall below investment grade at
either rating service. If this were to occur, monthly amounts due and
payable to the power suppliers would be accelerated to semi-monthly payments and
UI would have to deliver collateral security in an amount equal to the
receivables due to the sellers for the thirty day period immediately preceding
the default notice. If such a situation was in effect as of
December 31, 2009, UI would have had to post approximately $26 million
in collateral.
As a
result of an April 2008 DPUC decision, UI is permitted to seek long-term
contracts for up to 20% of standard service requirements, the goal of which is
to obtain long-term energy supply contracts and Connecticut Class I Renewable
Energy Certificates for UI’s standard service customers that will result in
economic benefit to ratepayers, both in terms of risk and cost
mitigation. UI is exploring long-term contract
alternatives.
Competitive Transition
Assessment
UI’s CTA
collection recovers costs that have been reasonably incurred, or will be
incurred, to meet its public service obligations and that will likely not
otherwise be recoverable in a competitive market. These “stranded
costs” include above-market long-term purchased power contract obligations,
regulatory asset recovery and above-market investments in power
plants. A significant amount of UI’s earnings is generated by the
authorized return on the equity portion of unamortized stranded costs in the CTA
rate base. UI’s after-tax earnings attributable to CTA for the years
ended December 31, 2009, 2008 and 2007 were $7.1 million, $9.1 million and $10.5
million, respectively. A significant portion of UI’s cash flow from operations
is also generated from those earnings and from the recovery of the CTA rate base
and other stranded costs. Cash flow from operations related to CTA
amounted to $40 million, $38 million and $35 million for the years ended
December 31, 2009, 2008 and 2007, respectively. The CTA rate base has
declined from year to year for a number of reasons,
including: amortization of stranded costs, the sale of UI’s nuclear
units, and adjustments made through the annual DPUC review
process. The original rate base component of stranded costs, as of
January 1, 2000, was $433 million. It has since declined to
$145.2 million at year-end 2009. In the future, UI’s CTA earnings
will decrease while, based on UI’s current projections, cash flow will remain
fairly constant until stranded costs are fully amortized. Total CTA
cost recovery is currently projected to be completed in 2015, with stranded cost
amortizations expected to end in 2013. The date by which stranded
costs are fully amortized depends primarily upon the DPUC’s future decisions,
which could affect future rates of stranded cost amortization.
Capital
Projects
In order
to maintain and improve its electricity delivery system and to provide quality
customer service, UI is required to spend a significant amount each year on
capital projects in the Distribution and Transmission Divisions. A
large portion of the funds required for capital projects is provided by
operating activities, and the remainder must be financed
externally.
In
December 2008, the 345-kilovolt (kV) transmission line from Middletown,
Connecticut, to Norwalk, Connecticut (the Project) was completed and the
transmission assets were placed in service. As a result, UI’s
transmission rate base increased by approximately $300 million, an increase of
more than 200% relative to UI’s net transmission assets existing prior to the
Project receiving approval from the Connecticut Siting Council
(CSC).
In a May
2007 Order, the FERC approved rate incentives for the Project. The
Project was allowed to include Construction Work In Progress (CWIP) expenditures
in rate base. For project costs incurred before August 8, 2005,
the FERC allowed UI to include 50% of CWIP expenditures in rate base, and for
project costs incurred after August 8, 2005, the FERC allowed UI to
include 100% of CWIP expenditures in rate base. The FERC also
accepted a 50 basis point adder which will be applied only to costs associated
with advanced transmission technologies.
Certain
parties requested rehearing of the FERC May 2007 order, but in January 2009, the
FERC denied those requests. Also, in January 2009, the DPUC and
the Attorney General of Connecticut filed a petition with the U.S. Court of
Appeals seeking judicial review of the FERC’s May 2007 and January 2009
orders. UI is unable to predict the outcome of these appeals at this
time.
UI and
CL&P filed a transmission cost allocation application relating to the
Project with ISO-NE in April 2008. ISO-NE will determine which costs
of the Project, if any, will be included in the New England regional
transmission rate. UI will seek to recover any non-pool supported costs of the
Project, or Localized Costs, in transmission revenues from customers throughout
the State of Connecticut.
Regional
Transmission Organization for New England
Transmission
Return on Equity (ROE)
In March
2008, the FERC issued an order on rehearing (Rehearing Order) establishing
allowable ROEs for transmission projects of transmission owners in New England,
including UI. In the Rehearing Order, the FERC established the
base-level ROE of 11.14% beginning in November 2006. The Rehearing
Order also confirmed a 50 basis point ROE adder on Pool Transmission Facilities
(PTF) for participation in the RTO-NE and a 100 basis point ROE incentive for
projects included in the ISO-NE Regional System Plan that were
completed and on line as of December 31, 2008. The Middletown/Norwalk
Transmission Project received this 100 basis point ROE
adder. For projects placed in service after December 31,
2008, incentives may be requested from the FERC, through a specific showing
justifying the incentive, on a project specific basis.
In May
2008, several public entities, including the DPUC, filed a petition with the
United States Court of Appeals for the District of Columbia Circuit (U.S. Court
of Appeals) challenging the Rehearing Order. On January 29, 2010, the
U.S. Court of Appeals issued a decision upholding the FERC order.
UI’s
overall transmission ROE is determined by the mix of UI’s transmission rate base
between new and existing transmission assets, and whether such assets are PTF or
non-PTF. UI’s transmission assets are primarily PTF. For
2009, UI overall allowed weighted-average ROE for its transmission business was
12.52%.
Risk Management and
Insurance
UI’s
primary risk management and insurance exposures include bodily injury, property
damage, fiduciary responsibility, and injured workers’
compensation. UI is insured for general liability, automobile
liability, property loss, fiduciary liability and workers’ compensation
liability. UI’s general liability and automobile liability programs
provide insurance coverage for third party liability claims for bodily injury
(including “pain and suffering”) and property damage, subject
to a
deductible. Losses are accrued based upon UI’s estimates of the
liability for claims incurred and an estimate of claims incurred but not
reported. UI reviews the general liability reserves quarterly to
ensure the adequacy of those reserves. The reserve is based on
historical claims, business events, industry averages and actuarial
studies. Insurance liabilities are difficult to assess and estimate
due to unknown factors such as claims incurred but not reported and awards
greater than expected; therefore, reserve adjustments may become necessary as
cases unfold. UI insures its property subject to deductibles
depending on the type of property. UI’s fiduciary liability program
and workers’ compensation program provide insurance coverage, also subject to
deductibles.
Xcelecom,
Inc.
UIL
Holdings’ exposure regarding Xcelecom is now primarily related to the collection
of promissory note, notes from, and the indemnification obligations to, the
buyers of the former Xcelecom companies.
LIQUIDITY
AND CAPITAL RESOURCES
UIL
Holdings generates its capital resources primarily through
operations. At December 31, 2009, UIL Holdings had $15.3 million
of unrestricted cash and temporary cash investments. This represents
an increase of $7.5 million from the corresponding balance at December 31,
2008. The components of this increase, which are detailed in the
Consolidated Statement of Cash Flows, are summarized as follows:
|
(In
Millions)
|
||||
|
Unrestricted
cash and temporary cash investments, December 31, 2008
|
$ | 7.7 | ||
|
Net
cash provided by operating activities
|
172.1 | |||
|
Net
cash provided by (used in) investing activities:
|
||||
|
Related
party note receivable
|
(72.2 | ) | ||
|
Cash
invested in plant - including AFUDC debt
|
(123.6 | ) | ||
|
Restricted
cash (1)
|
7.3 | |||
|
Investment
in CT Yankee
|
1.0 | |||
|
Other
|
0.1 | |||
| (187.4 | ) | |||
|
Net
cash provided by (used in) financing activities:
|
||||
|
Issuances
of common stock
|
92.2 | |||
|
Issuances/payments
of long-term debt, net
|
127.5 | |||
|
Payments
on short-term notes payable, net
|
(148.0 | ) | ||
|
Dividend
payments
|
(47.7 | ) | ||
|
Other
financing activities
|
(1.2 | ) | ||
| 22.8 | ||||
|
Net
change in cash
|
7.5 | |||
|
Unrestricted
cash and temporary cash investments, December 31, 2009
|
$ | 15.3 | ||
(1)
As of December 31, 2009, UIL Holdings had $3.7 million in restricted cash which
primarily relates to certain retention amounts concerning the Middletown/Norwalk
Transmission Project which have been withheld by UI and will remain in place
until the verification of fulfillment of contractor obligations.
The
unrestricted cash position of UIL Holdings increased by $7.5 million from
December 31, 2008 to December 31, 2009, as cash provided by operating
and financing activities exceeded cash used in investing
activities. Cash used in investing activities during 2009 consisted
primarily of capital expenditures of $123.6 million for distribution and
transmission infrastructure as well as an additional $72.2 million in funds
loaned to GenConn. Cash provided by financing activities during 2009
included $92.2 million from issuances of common stock and $127.5 million from
net issuances of long-term debt, partially offset by net payments on short-term
notes payable of $148.0 million and the quarterly dividend payments on UIL
Holdings’ common stock totaling $47.7 million.
UIL
Holdings accesses capital through both long-term and short-term financing
arrangements. Total current and long-term debt outstanding as of
December 31, 2009 was $731.8 million, as compared to $604.3 million at year-end
December 31, 2008. In December 2009, UI issued $50 million
of debt to repay maturing debt.
UIL
Holdings and UI have a revolving credit agreement with a group of banks that
extends to December 22, 2011. The borrowing limit under the
facility for UI is $175 million, with $50 million of the limit available for UIL
Holdings. The facility permits borrowings at fluctuating interest
rates determined by reference to Citibank’s New York base rate and the Federal
Funds Rate (as defined in the facility), and also permits borrowings for fixed
periods up to six months as specified by UI and UIL Holdings at fixed interest
rates (London Interbank Offered Rate or LIBOR determined by the Eurodollar
Interbank Market in London. The facility also permits the issuance of
letters of credit up to $50 million. As of December 31, 2009, UI had
no outstanding borrowings under the facility and UIL Holdings had a standby
letter of credit outstanding in the amount of $1 million. The
UIL Holdings standby letter of credit reduces the amount of credit available for
UI. Available credit, under this facility, at December 31, 2009
for UI was $174 million, of which $49 million is available for UIL
Holdings.
In
November 2008, UI entered into a revolving credit agreement with Union Bank,
N.A., formerly Union Bank of California, N.A., with a borrowing limit of $25
million. UI terminated that credit agreement on April 27,
2009.
During
late 2008, conditions in the capital markets resulted in reductions in asset
values of funded pension and postretirement plans. In particular, the
projected benefit obligation for the qualified pension plan now exceeds the fair
market value of the plan assets by $140 million. Although asset
values recovered somewhat in 2009, these reductions, if not offset by additional
gains in future years, will result in higher pension and postretirement expenses
in future years along with additional cash contributions. Asset
values as of December 31, 2009 and December 31, 2008 were approximately $231.3
million and $211.7 million, respectively. While there was no minimum
required pension contribution for the 2009 plan year, UI expects to make a
contribution of approximately $9 million in 2010, subject to current proposals
that are pending before the United States Congress.
All
capital requirements that exceed available cash will be funded through external
financings. Although there is no commitment to provide such financing
from any source of funds, other than the short-term credit facility discussed
above, future external financing needs are expected to be satisfied by the
issuance of additional short-term and long-term debt and equity. In
addition to debt financing, in May 2009, UIL Holdings accessed the external
equity markets to raise capital. A public offering of 4,600,000
shares of common stock at $21.00 per share resulted in net proceeds of $91.4
million, after expenses and underwriting discounts. The continued
availability of these methods of financing will be dependent on many factors,
including conditions in the securities markets, economic conditions, and UIL
Holdings’ future income and cash flow. See Part II, Item 8,
“Financial Statements and Supplementary Data - Notes to Consolidated Financial
Statements – Note (B), Capitalization and Note (D), Short-Term Credit
Arrangements” of this Form 10-K for a discussion of UIL Holdings’ financing
arrangements.
GenConn
has approval from the DPUC to build 200 MW of nominal capacity at NRG’s existing
plant in Devon, CT (the “Devon Project”) and 200 MW of nominal capacity at NRG’s
existing plant in Middletown, CT (the “Middletown Project”). GenConn
expects to finance 50% of its capital requirements with the proceeds of the
Project Financing it obtained on April 27, 2009. UI and NRG will each
make an equity investment in GenConn on a 50%/50% basis to meet the remaining
50% of GenConn’s capital requirements. Such equity investments are
expected to occur within the first six months of 2010 in the amount of
approximately $53 million for the Devon Project and within the first six months
of 2011 in the amount of approximately $60 million for the Middletown
Project. UI expects to use the proceeds of the EBL it obtained on
April 27, 2009 for its portion of those requirements and to replace the EBL with
cash on hand and with funds raised in the capital markets. See
Part II, Item 8, “Financial Statements and Supplementary Data - Notes
to Consolidated Financial Statements – Note (B), Capitalization” of this
Form 10-K for further discussion of the EBL.
UI’s
wholesale power supply agreements contain default provisions that include
required performance assurance, including certain collateral obligations in the
event that UI’s credit rating on senior debt was to fall below investment
grade. In October 2009, Moody’s released its updated credit opinion
for UI and maintained its Baa2 rating with a stable outlook. In
December 2009, S&P reinitiated coverage on UI and rated it BBB with a stable
outlook. UI’s credit rating would have to decline two ratings to fall
below investment grade at either rating service. If this were to
occur, monthly
amounts
due and payable to the power suppliers would be accelerated to semi-monthly
payments and UI would have to deliver collateral security in an amount equal to
the receivables due to the sellers for the thirty day period immediately
preceding the default notice. If such a situation was in effect as of
December 31, 2009, UI would have had to post approximately $26 million
in collateral.
Financial
Covenants
UIL
Holdings and UI are required to comply with certain covenants in connection with
their respective loan agreements. The covenants are normal and
customary in bank and loan agreements. The summary below describes
only the financial covenants in the agreements.
Long-Term
Debt
UIL
Holdings
Under the
Note Purchase Agreement in connection with the (1) 7.23% Senior Notes, Series A,
due February 15, 2011, in the original principal amount of $30 million, and
(2) 7.38% Senior Notes, Series B, due February 15, 2011, in the principal
amount of $45 million, issued by UIL Holdings, UIL Holdings is required to (i)
maintain a ratio of consolidated debt to consolidated capital of not greater
than 65% (debt ratio); (ii) maintain a ratio of consolidated earnings available
for interest charges to consolidated interest charges for any period of four
consecutive fiscal quarters of at least 2.00 to 1.00 (interest coverage ratio);
and (iii) maintain consolidated net worth of at least $345 million plus 25% of
consolidated net income on a cumulative basis for each fiscal quarter after
December 31, 2000 for which consolidated net income is positive. As
of December 31, 2009, UIL Holdings’ debt ratio was 56%; its interest
coverage ratio was 3.16 to 1.00; and it had consolidated net worth that exceeded
the amount required by the covenant by $111.9 million. The Note
Purchase Agreement describes typical events of default, including the situation
in which UIL Holdings, UI, or the direct parent of the non-utility subsidiaries
defaults on indebtedness in the aggregate principal amount of at least $10
million due to (i) a default in payment or payments due on the indebtedness, or
(ii) default in the performance of or compliance with any term or condition of
the indebtedness, which could result in the requirement that such indebtedness
be repaid, or (iii) the occurrence of any event or condition that could require
the purchase or repayment of the indebtedness prior to maturity.
There are
no repayment triggers based on changes in UIL Holdings’ Issuer Rating, assigned
by Moody’s, or corporate credit rating, assigned by S&P, in connection with
the agreement described above.
UI
Under (1)
the Note Purchase Agreement in connection with the (a) 6.06% Senior Notes,
Series A, due September 5, 2017, in the principal amount of $40 million,
(b) 6.06% Senior Notes, Series B, due December 6, 2017, in the principal
amount of $30 million, (c) 6.26% Senior Notes, Series C, due September 5,
2022, in the principal amount of $44 million, (d) 6.26% Senior Notes, Series D,
due December 6, 2022, in the principal amount of $33 million, (e) 6.51%
Senior Notes, Series E, due September 5, 2037, in the principal amount of
$16 million, and (f) 6.51% Senior Notes, Series F, due December 6, 2037, in the
principal amount of $12 million, (2) the Note Purchase Agreement in connection
with the (a) 6.46% Senior Notes, Series A, due November 3, 2018, in the
principal amount of $50 million, (b) 6.51% Senior Notes, Series B, due
December 1, 2018, in the principal amount of $50 million, and (c) 6.61%
Senior Notes, Series C, due December 1, 2020, in the principal amount of $50
million, (3) the Note Purchase Agreement in connection with the 5.61% Senior
Notes, due March 10, 2025, in the principal amount of $50 million, and (4) the
Equity Bridge Loan, UI is required to maintain a ratio of consolidated debt to
consolidated capital of not greater than 65% (debt ratio). As of
December 31, 2009, UI’s debt ratio was 53%. The Note Purchase
Agreements and the Equity Bridge Loan describe typical events of default,
including the situation in which UI defaults on indebtedness in the aggregate
principal amount of at least $10 million due to (i) a default in payment or
payments due on the indebtedness, or (ii) default in the performance of or
compliance with any term or condition of the indebtedness, which could result in
the requirement that such indebtedness be repaid, or (iii) the occurrence of any
event or condition that could require the purchase or repayment of the
indebtedness prior to maturity.
There are
no dividend restrictions or repayment triggers based on changes in UI’s Issuer
Rating, assigned by Moody’s, or corporate credit rating, assigned by S&P, in
connection with the above agreements.
Short-term
Debt
UIL
Holdings / UI
UIL
Holdings and UI are parties to a revolving credit agreement with a group of
banks that extends to December 22, 2011 (the “Credit Agreement”). The
borrowing limit under the Credit Agreement for UI is $175 million with $50
million of the limit available for UIL Holdings. Under the Credit
Agreement, UIL Holdings and UI are each required to maintain a ratio of
consolidated debt to consolidated capital of not greater than 65% (debt
ratio). As of December 31, 2009, UIL Holdings’ debt ratio was
56% and UI’s debt ratio was 53%.
The
Credit Agreement describes typical events of default, including the situation in
which UIL Holdings or UI fails to pay when due any interest or principal due on
indebtedness in the principal amount of at least $10 million or any interest or
premium thereon in the aggregate amount of at least $10 million; or any other
default or other event shall occur related to such indebtedness if the effect of
such default or event is to accelerate, or to permit the acceleration of, the
maturity of such indebtedness, or any such indebtedness shall be declared due
and payable, or required to be prepaid, prior to the stated
maturity. Notwithstanding anything to the contrary in the foregoing,
a default by UIL Holdings generally does not create a cross-default in respect
of outstanding indebtedness of UI (except in the case of a default arising from
a Change of Control of UIL Holdings, as defined in the Credit
Agreement).
There are
no dividend restrictions or repayment triggers based on changes in UIL Holdings’
Issuer Rating or UI’s Issuer Rating or Senior Unsecured debt rating, assigned by
Moody’s, in connection with the Credit Agreement.
2010
Capital Resource Projections
For
financial planning purposes, the amount of UIL Holdings’ quarterly per share
cash dividend in 2010 is currently projected to be equal to the cash dividend of
$0.432 per share paid in each quarter of 2009. UIL Holdings will
continue to be dependent on dividends from its subsidiaries and from external
borrowings to provide the cash in excess of the amount currently on hand that is
necessary for debt service, to pay administrative costs, and to pay common stock
dividends to UIL Holdings’ shareowners. As UIL Holdings’ sources of
cash are limited to cash on hand, dividends from its subsidiaries and external
capital raising activities, the ability to maintain future cash dividends at the
level currently paid to shareowners will be dependent primarily upon sustained
earnings from current operations of UI.
In order
to achieve long-term growth in earnings, UI will need to increase its rate base
through distribution and transmission reliability and capacity enhancement
capital investments program. UI’s earnings will gradually decline
over time, if additions to the rate base and returns on equity investments are
lower than the annual amount of depreciation and amortization. See
the “Major Influences on Financial Condition” section of this Item 7. for more
information.
The
following table represents UIL Holdings’ projected sources and uses of capital
for 2010:
|
(In
Millions)
|
||||
|
Cash
balance (unrestricted), December 31, 2009
|
$ | 15 | ||
|
Cash
to be provided by (used in) operating activities
|
162 | |||
|
Cash
to be provided by (used in) investing activities
|
||||
|
Investment
in GenConn Energy LLC
|
(16 | ) | ||
|
Other
investing activities
|
3 | |||
|
Capital expenditures
|
(242 | ) | ||
|
Net
cash projected to be used in Investing activities
|
(255 | ) | ||
|
Cash
to be provided by (used in) financing activities:
|
||||
|
Payment
of common stock dividend
|
(52 | ) | ||
|
Issuances
(payments) of long-term debt, net
|
75 | |||
|
Payment
of long term debt maturities
|
(4 | ) | ||
|
Net
cash projected to be used in financing activities
|
19 | |||
|
Projected
short term borrowing (unrestricted), December 31,
2010
|
$ | (59 | ) | |
Any
additional cash requirements are expected to be funded by short-term
debt.
UI
UI is
expected to continue to generate strong cash flow from operating activities in
2010, currently projected to be approximately $163 million. UI is
expected to provide dividends to UIL Holdings in 2010. To maintain
its capital structure at the allowed level of equity of 50%, such dividends are
currently projected to be approximately $52 million. Funds from
operations, equity infusions from UIL Holdings and short-term and long-term
borrowings will be used to finance capital expenditures and other investing
activities.
UI's
projected capital expenditures for 2010 are $242 million as shown
below:
|
(In
Millions)
|
||||
|
Distribution
|
||||
|
Capacity
& Reliability
|
$ | 25 | ||
|
Infrastructure
Replacement
|
45 | |||
|
System
& Business Operations
|
19 | |||
|
Other
Core, Support Functions
|
69 | |||
|
Distribution
Subtotal
|
158 | |||
|
Transmission
|
||||
|
Capacity
& Reliability
|
19 | |||
|
Infrastructure
Replacement
|
43 | |||
|
System
& Business Operations
|
22 | |||
|
Transmission
Subtotal
|
84 | |||
|
Total
Projected UI Capital Expenditures
|
$ | 242 | ||
Contractual
and Contingent Obligations
|
The
following are contractual and contingent obligations of UIL Holdings and
its subsidiaries as of December 31, 2009.
|
||||||||||||||||||||||||||||
|
(In
Millions)
|
||||||||||||||||||||||||||||
|
2010
|
2011
|
2012
|
2013
|
2014
|
Thereafter
|
Total
|
||||||||||||||||||||||
|
Debt
Maturities:
|
||||||||||||||||||||||||||||
|
UIL
Holdings
|
$ | 4.3 | $ | 49.3 | $ | - | $ | - | $ | - | $ | - | $ | 53.6 | ||||||||||||||
|
UI
|
54.0 | 53.8 | - | - | - | 570.5 | 678.3 | |||||||||||||||||||||
|
Total
|
$ | 58.3 | $ | 103.1 | $ | - | $ | - | $ | - | $ | 570.5 | $ | 731.9 | ||||||||||||||
|
Contractual
Obligations:
|
||||||||||||||||||||||||||||
|
UIL
Holdings
|
||||||||||||||||||||||||||||
|
Interest
on Long-Term Debt (1)
|
$ | 3.7 | $ | 0.5 | $ | - | $ | - | $ | - | $ | - | $ | 4.2 | ||||||||||||||
| - | - | - | - | |||||||||||||||||||||||||
|
UI
|
||||||||||||||||||||||||||||
|
Lease
Payments
|
14.0 | 14.1 | 8.2 | 1.9 | 1.6 | 37.4 | 77.2 | |||||||||||||||||||||
|
Interest
on Long-Term Debt (1)
|
33.2 | 33.2 | 33.2 | 33.2 | 33.2 | 294.8 | 460.8 | |||||||||||||||||||||
|
Purchase
Commitments (2)
|
12.0 | - | - | - | - | - | 12.0 | |||||||||||||||||||||
|
Total
|
$ | 59.2 | $ | 47.3 | $ | 41.4 | $ | 35.1 | $ | 34.8 | $ | 332.2 | $ | 550.0 | ||||||||||||||
|
As
of December 31, 2009
|
||||||||||||
|
(In
Millions)
|
||||||||||||
|
Guarantees:
|
||||||||||||
|
UI
- Hydro-Quebec (3)
|
$ | 1.7 | ||||||||||
|
UCI
- Hydro-Quebec (4)
|
$ | 0.9 | ||||||||||
|
(1)
|
Amounts
represent interest payments on long-term debt outstanding at December 31,
2009. Interest payments will change if additional long-term
debt is issued, or if current long-term debt is refinanced at different
rates, in the future.
|
|
(2)
|
Amounts
represent contractual obligations for material and services on order but
not yet delivered at
December 31, 2009.
|
|
(3)
|
UI
furnished a guarantee for its participating share of the debt financing
for one phase of the Hydro-Quebec transmission tie facility linking New
England and Quebec, Canada. See Part II, Item 8,
“Financial Statements and Supplementary Data – Notes to Consolidated
Financial Statements – Note (J), Commitments and Contingencies –
Hydro-Quebec,” of this Form 10-K for further
information.
|
|
(4)
|
This
amount represents UCI’s and UIL Holdings’ collective guarantee to
Hydro-Quebec in support of Hydro-Quebec’s guarantees to third parties in
connection with the construction of the Cross-Sound Cable
project. See Part II, Item 8, “Financial Statements
and Supplementary Data – Notes to Consolidated Financial Statements – Note
(J), Commitments and Contingencies – Cross-Sound Cable Company, LLC,” of
this Form 10-K for further
information.
|
CRITICAL
ACCOUNTING POLICIES
UIL
Holdings’ Consolidated Financial Statements are prepared based on certain
critical accounting policies that require management to make judgments and
estimates that are subject to varying degrees of
uncertainty. Investors need to be aware of these policies and how
they impact UIL Holdings’ financial reporting to gain a more complete
understanding of UIL Holdings’ Consolidated Financial Statements as a whole, as
well as management’s related discussion and analysis presented
herein. While UIL Holdings believes that these accounting policies
are grounded on sound measurement criteria, actual future events can and often
do result in outcomes that can be materially different from these estimates or
forecasts.
Accounting
for Regulated Public Utilities
Generally
accepted accounting principles in the United States of America (GAAP) for
regulated entities allow UI to give accounting recognition to the actions of
regulatory authorities in accordance with the provisions of the Accounting
Standards Codification (ASC) 980 “Regulated Operations”. In
accordance with ASC 980, UI has deferred recognition of costs (a regulatory
asset) or has recognized obligations (a regulatory liability) if it is probable
that such costs will be recovered or obligations relieved in the future through
the ratemaking process. In addition to the Regulatory Assets and
Liabilities identified on the Consolidated Balance Sheet, and in Part II, Item
8, “Financial Statements and Supplementary Data – Notes to Consolidated
Financial Statements - Note (A) - Regulatory Accounting,” there are other
regulatory assets and liabilities included in the Consolidated Balance Sheet
such as certain deferred tax assets and liabilities. UI also has
obligations under power contracts, the recovery of which is subject to
regulation. If UI, or a portion of its assets or operations, were to
cease meeting the criteria for application of these accounting rules, accounting
standards for businesses in general would become applicable and immediate
recognition of any previously deferred costs would be required in the year in
which such criteria are no longer met (if such deferred costs are not
recoverable in the portion of the business that continues to meet the criteria
for application of ASC 980).
Accounting
for Pensions and Other Postretirement Benefits
UIL
Holdings accounts for its pension and postretirement benefit plans in accordance
with ASC 715 “Compensation - Retirement Benefits”. In applying these
accounting practices, assumptions are made regarding the valuation of benefit
obligations and the performance of plan assets. Delayed recognition
of differences between actual results and those assumed allows for a smoother
recognition of changes in benefit obligations and plan performance over the
working lives of the employees who benefit under the plans. The
primary assumptions are as follows:
|
·
|
Discount
rate – this rate is used to determine the current value of future
benefits. This rate is adjusted based on movement of long-term
interest rates.
|
|
·
|
Expected
return on plan assets – the expected return is based upon a combination of
historical performance and anticipated future returns for a portfolio
reflecting the mix of equity, debt and other investments included in plan
assets.
|
|
·
|
Average
wage increase – projected annual pay increases, which are used to
determine the wage base used to project employees’ pension benefits at
retirement.
|
|
·
|
Health
care cost trend rate – projections of expected increases in health care
costs.
|
These
assumptions are the responsibility of management, in consultation with its
outside actuarial and investment advisors. A variance in the discount
rate, expected return on assets or average wage increase could have a
significant impact on pension costs, assets and obligations recorded under ASC
715. In addition to a change in the discount rate and the expected
return on assets, a variance in the health care cost trend assumption could have
a significant impact on postretirement medical expense recorded under ASC
715.
As of
December 31, 2009, UIL Holdings changed its discount rate assumption that
was used to calculate the 2009 liability as follows: qualified
pension from 6.2% to 5.85%, the non-qualified pension from 6.10% to 5.65%, and
other postretirement benefit from 6.10% to 5.80%, to reflect the decrease in
interest rates for a portfolio of long-term
fixed-income
securities, which approximate the required payment of estimated liabilities for
each plan. UIL Holdings’ expected return on plan assets was 8.50%,
based on projections of future expected performance developed in conjunction
with UIL Holdings’ actuaries and investment advisors.
The
assumptions listed above will be revised over time as economic and market
conditions change. Changes in those assumptions could have a material
impact on qualified pension and postretirement expenses. For example,
if there had been a 0.25% change in the discount rate assumed at 6.2%, for the
qualified pension plan and non-qualified plan, respectively, the 2009 pension
expense would have increased or decreased inversely by $1.2 million for the
qualified plan and an immaterial amount for the non-qualified
plan. If there had been a 1% change in the expected return on assets,
the 2009 pension expense would have increased or decreased inversely by $2.3
million for both the qualified pension plan and non-qualified
plan. If there had been a 0.25% change in the discount rate
assumed, the 2009 OPEB plan expenses would have increased or decreased inversely
by $0.2 million; if there had been a 1% change in the expected return on assets,
the 2009 OPEB plan expenses would have increased or decreased inversely by $0.2
million.
The
projected, long-term average wage increases were 3.8% in 2009. The
health care cost trend rate assumption for all retirees was set at 10.0% in
2009, with such rate decreasing by 0.5% per year to 5.0% in 2019.
UIL
Holdings’ 2009 pension and postretirement benefits expenses were $16.7 million
and $5.6 million, respectively, net of amounts deferred as a regulatory
asset.
The
assumptions are used to predict the net periodic expense on a forward-looking
basis. To the extent actual investment earnings, actual wage
increases and other items differ from the assumptions, a gain or loss is
created, and subsequently amortized into expense.
UI will
reflect all unrecognized prior service costs and credits and unrecognized
actuarial gains and losses as regulatory assets as it is probable that such
items are recoverable through the ratemaking process in future
periods.
Unbilled
Revenue
UI
utilizes a customer accounting software package integrated with the network
meter reading system to estimate unbilled revenue (installation
method). The installation method allows for the calculation of
unbilled revenue on a customer-by-customer basis, utilizing actual daily meter
readings at the end of each month to calculate consumption and pricing for each
customer. A significant portion of utility retail kilowatt-hour
consumption is read through the network meter reading system. For
those customers still requiring manual meter readings, consumption is estimated
based upon historical usage and actual pricing for each customer.
Accounting
for Contingencies
ASC 450
“Contingencies” applies to an existing condition, situation or set of
circumstances involving uncertainty as to possible loss that will ultimately be
resolved when one or more future events occur or fail to occur. In
accordance with ASC 450, UIL Holdings accrues estimated losses related to each
contingency as to which a loss is probable and can be reasonably estimated and
no liability is accrued for any contingency as to which a loss is not probable
or cannot be reasonably estimated. With respect to amounts accrued
for contingencies related to UI, if it is probable that such estimated costs
would be recovered through the ratemaking process, recognition of such costs is
deferred in accordance with the provisions of ASC 980 (see “Accounting for
Regulated Public Entities – ASC 980” of this item). Refer to
Part II, Item 8, “Financial Statements and Supplementary Data – Notes to
Consolidated Financial Statements – Note (J), Commitments and Contingencies” of
this Form 10-K for a detailed discussion of UIL Holdings’ current known material
contingencies.
OFF-BALANCE
SHEET ARRANGEMENTS
UIL
Holdings and its subsidiaries occasionally enter into guarantee contracts in the
ordinary course of business. At the time a guarantee is provided, an
analysis is performed to assess the expected financial impact, if any, based on
the likelihood of certain events occurring that would require UIL Holdings to
perform under such guarantee. Subsequent analysis is performed on a
periodic basis to assess the impact of any changes in events or
circumstances. If such an analysis results in an amount that is
inconsequential, no liability is recorded on the balance sheet related to the
guarantee.
As of
December 31, 2009, UIL Holdings had certain guarantee contracts outstanding for
which no liability has been recorded in the Consolidated Financial
Statements. Refer to Part II, Item 8, “Financial Statements and
Supplementary Data – Notes to Consolidated Financial Statements – Note (J),
Commitments and Contingencies,” of this Form 10-K for further discussion of such
guarantees.
NEW
ACCOUNTING STANDARDS
UIL
Holdings reviews new accounting standards to determine the expected financial
impact, if any, that the adoption of each such standard will have. As
of the filing of this Annual Report on Form 10-K, there were no new accounting
standards issued that were projected to have a material impact on UIL Holdings’
consolidated financial position, results of operations or
liquidity. Refer to Part II, Item 8, “Financial Statements and
Supplementary Data – Notes to Consolidated Financial Statements – Note (A),
Statement of Accounting Policies – New Accounting Standards,” for further
discussion regarding new accounting standards.
RESULTS
OF OPERATIONS
Use
of Non-GAAP Measures
Within
the “Results of Operations” section of this Form 10-K, tabular presentations
showing a comparison of UIL Holdings’ net income and earnings per share (EPS)
for 2009 and 2008, as well as 2008 and 2007, are provided. UIL
Holdings believes this information is useful in understanding the fluctuations
in earnings per share between the current and prior year periods. The
amounts presented show the earnings per share from continuing operations for
each of UIL Holdings’ lines of business, calculated by dividing the income from
continuing operations of each line of business by the average number of shares
of UIL Holdings’ common stock outstanding for the periods
presented. The earnings per share tables presented in “The United
Illuminating Company Results of Operations” for all periods presented are
calculated on the same basis and reconcile to the amounts presented in the table
under the heading “UIL Holdings Corporation Results of
Operations.” The total earnings per share from continuing operations
and discontinued operations in the table presented under the heading “UIL
Holdings Corporation Results of Operations” are presented on a GAAP
basis.
Results
of Operations: 2009 vs. 2008
UIL Holdings
Corporation
UIL
Holdings’ total earnings were $54.3 million, or $1.94 per share, an increase of
$6.2 million, or $0.02 per share, compared to 2008. These
results include immaterial losses from discontinued operations in both
years. The dilutive effect of the May 2009 issuance of an additional
4,600,000 shares of common stock in 2009 was $0.21 per share.
The table
below presents a comparison of UIL Holdings’ net income and EPS for 2009 and
2008.
|
Year
Ended December 31,
|
2009
More (Less) than 2008
|
|||||||||||||||
|
2009
|
2008
|
Amount
|
Percent
|
|||||||||||||
|
Net
Income (Loss) (In Millions except percent and per share
amounts)
|
||||||||||||||||
|
UI
|
$ | 57.0 | $ | 51.1 | $ | 5.9 | 11 | % | ||||||||
|
Non-Utility
|
(2.6 | ) | (2.7 | ) | 0.1 | 4 | % | |||||||||
|
Total
Income from Continuing Operations
|
54.4 | 48.4 | 6.0 | 12 | % | |||||||||||
|
Discontinued
Operations
|
(0.1 | ) | (0.3 | ) | 0.2 | 67 | % | |||||||||
|
Total
Net Income
|
$ | 54.3 | $ | 48.1 | $ | 6.2 | 13 | % | ||||||||
|
EPS
|
||||||||||||||||
|
UI
|
$ | 2.03 | $ | 2.03 | $ | - | - | % | ||||||||
|
Non-Utility
|
(0.09 | ) | (0.10 | ) | 0.01 | 10 | % | |||||||||
|
Total
EPS from Continuing Operations - Basic
|
1.94 | 1.93 | 0.01 | 1 | % | |||||||||||
|
Discontinued
Operations
|
- | (0.01 | ) | 0.01 | 100 | % | ||||||||||
|
Total
EPS - Basic
|
$ | 1.94 | $ | 1.92 | $ | 0.02 | 1 | % | ||||||||
|
Total
EPS - Diluted (Note 1)
|
$ | 1.93 | $ | 1.89 | $ | 0.04 | 2 | % | ||||||||
Note
1: Reflecting the effect of dilutive stock options, performance shares and
restricted stock.
The United Illuminating
Company
|
Year
Ended December 31,
|
2009
More (Less) than 2008
|
|||||||||||||||
|
2009
|
2008
|
Amount
|
Percent
|
|||||||||||||
|
EPS
|
||||||||||||||||
|
Total
UI - basic
|
$ | 2.03 | $ | 2.03 | $ | - | - | % | ||||||||
|
Total
UI - diluted (Note 1)
|
$ | 2.02 | $ | 2.00 | $ | 0.02 | 1 | % | ||||||||
|
Retail
Sales*
|
$ | 5,493 | $ | 5,729 | $ | (236 | ) | (4 | )% | |||||||
|
Weather
Impact* (Note 2)
|
100 | (19 | ) | 119 | 2 | % | ||||||||||
|
Retail
Sales – Normalized*
|
$ | 5,593 | $ | 5,710 | $ | (117 | ) | (2 | )% | |||||||
* Millions of kilowatt-hours
Note
1: Reflecting the effect of dilutive stock options, performance shares and
restricted stock.
Note
2: Percentage change reflects impact to total retail sales.
The
following details variances which have the most significant impact on net income
in the periods presented. Distribution includes all utility revenue
and expenses except for transmission.
Distribution
The table
below provides the distribution net income favorable/(unfavorable) variances for
2009 compared to 2008.
|
Year
Ended
|
||||
|
December
31, 2009
|
||||
|
vs.
2008
|
||||
|
Favorable/(Unfavorable)
|
(In
Millions)
|
|||
|
Operating
revenues
|
||||
|
Decoupling
adjustment
|
$ | 3.2 | ||
|
Regulatory
true-up items
|
6.3 | |||
|
Distribution
rates & pricing
|
4.1 | |||
|
Sales
volume
|
(5.9 | ) | ||
|
Operation
and maintenance (O&M) expense
|
||||
|
Customer
service - allocated
|
0.3 | |||
|
Uncollectibles
|
4.1 | |||
|
Outside
services and other expense
|
1.6 | |||
|
Pension
& postretirement
|
(7.0 | ) | ||
|
Other,
net
|
(2.4 | ) | ||
| $ | 4.3 | |||
The decoupling adjustment reflects an accrual to true-up actual revenues to DPUC allowed revenue requirements in accordance with the decoupling mechanism as approved in the February 2009 final decision in UI’s 2008 distribution rate case. The relatively mild weather contributed to a reduction of kilowatt-hour (kWh) usage below amounts assumed in rates, resulting in a favorable adjustment. The favorable variance in regulatory true-up items was primarily due to the absence in 2009 of unfavorable adjustments recorded in 2008 to certain regulatory liabilities. The favorable variance in distribution rates and pricing was primarily due to increased rates as approved in the rate case final decision. The unfavorable variance in sales volume was due to the reduction in kWh usage resulting from the milder weather and a reduction in customer demand.
The
allocation of customer service expense to transmission provided a favorable
variance due to the timing of the FERC order, which was granted in May
2008. The favorable variance in uncollectibles was primarily due to
decreased customer account write-offs. The rate case final decision
also authorized the allocation of a portion of the uncollectible
expense
to GSC which contributed $1.8 million to the favorable uncollectibles
variance. The favorable variance in outside services and other
expense was primarily related to cost control measures taken by the
Company. The unfavorable variance in pension and postretirement was
primarily due to the negative impact of the financial markets on the value of
pension and postretirement assets. The rate case final decision
provided for the future recovery of the increase in pension and postretirement
expense for 2009 as a regulatory asset and the unfavorable variance noted above
is net of those amounts recorded as a regulatory asset.
Transmission
The
transmission business earnings continued to experience underlying growth in net
income of $1.6 million in 2009 compared to 2008 from higher rate base and equity
capitalization with approximately the same allowed return compared to
2008. As previously noted, UI completed the Middletown-to-Norwalk
transmission project, which went into service in December 2008.
Total
UI
The
following details income statement variances on a line-by-line
basis:
Overall,
UI’s operating revenue decreased by $52.2 million, from $947.9 million for 2008
to $895.7 million for 2009. Retail revenue decreased $58.9 million
due mainly to unfavorable sales volume and the impact of customers switching to
alternate suppliers to supply the generation portion of their customer bill,
which has no impact on net income, partially offset by increases in UI’s
distribution rates. Wholesale revenue decreased by $42.1 million
primarily due to
the
expiration of the Bridgeport RESCO generating plant long-term purchased power
contract in December 2008. Other revenues increased $48.7 million,
due to higher transmission revenue and the distribution revenue decoupling
adjustment approved by the DPUC in the first quarter of 2009.
Purchased
power expense decreased by $90.9 million, from $424.2 million for 2008 to $333.3
million in 2009. Retail fuel expense decreased by $63.6 million
during 2009, primarily due to the impact of customers switching to alternate
suppliers to supply the generation portion of their customer bill, partially
offset by higher costs to procure power. UI receives electricity to
satisfy its standard service and supplier of last resort requirements through
fixed-price purchased power agreements. These costs are recovered
through the GSC and Bypassable Federally Mandated Congestion Charges (BFMCC)
portion of UI’s unbundled retail customer rates. UI’s wholesale
energy expense for 2009 decreased by $27.3 million, primarily due to the
expiration of the Bridgeport RESCO generating plant contract.
UI’s
O&M expenses increased by $13.3 million, from $211.6 million in 2008, to
$224.9 million in 2009. The increase was primarily attributable to an
increase in pension and postretirement expense of $11.7 million, partially
offset by lower uncollectible accounts of $6.8 million and a decrease in outside
services and other expense of $2.7 million. The remaining variance
was primarily due to increases in GSC related to the load response program which
are recovered.
UI’s
transmission wholesale expenses increased by $10.6 million, from $46.4 million
in 2008 to $57.0 million in 2009. The increase was primarily
attributable to higher regional transmission expenses of which UI pays a portion
based upon its relative load.
UI’s
depreciation and amortization decreased by $3.0 million, from $101.0 million for
2008 to $98.0 million in 2009, consisting of a $20.7 million decrease due to the
expiration of the Bridgeport RESCO generating plant contract which was recovered
through the CTA, partially offset by increased distribution and transmission
plant and equipment depreciation and CTA amortization.
UI’s
taxes other than income taxes increased $9.9 million, from $50.2 million in 2008
to $60.1 million in 2009. The increase was primarily attributable to
increases in property taxes due to increases in plant and equipment, as well as
gross earnings tax, the latter of which is due to increased transmission
revenues.
UI’s
other income and deductions increased by $2.9 million, from $2.7 million in 2008
to $5.6 million in 2009. The increase was primarily attributable to
mark-to-market adjustments to non-qualified pension investments.
UI’s
interest expense increased by $6.3 million, from $30.0 million in 2008 to $36.3
million in 2009. The increase was primarily attributable to increased
long-term and short-term borrowings.
Non-Utility
UIL
Holdings retains certain costs, primarily interest expense on holding company
debt, at the holding company, or “corporate” level which are not allocated to
the various non-utility subsidiaries as well as the results of the former
Xcelecom entities which were not divested. UIL Corporate incurred net
after-tax costs of $2.5 million, or $0.09 per share, in 2009 compared to net
after-tax costs of $2.7 million, or $0.10 per share, in 2008.
Discontinued
Operations
The
divested Xcelecom businesses incurred net after-tax costs of $0.1 million, with
a minimal per share impact, in 2009 compared to net after-tax costs of $0.3
million, or $0.01 per share, in 2008.
Results
of Operations: 2008 vs. 2007
UIL Holdings
Corporation
UIL
Holdings’ total earnings were $48.1 million, or $1.92 per share, an increase of
$3.4 million, or $0.13 per share, compared to 2007. These
results include losses from discontinued operations of $0.3 million, or $0.01 or
share, for 2008, a $1.7 million reduction in losses, or $0.07 per share,
compared to 2007.
The table
below presents a comparison of UIL Holdings’ net income and EPS for 2008 and
2007.
|
Year
Ended December 31,
|
2008
More (Less) than 2007
|
|||||||||||||||
|
2008
|
2007
|
Amount
|
Percent
|
|||||||||||||
|
Net
Income (Loss) (In Millions except percent and per share
amounts)
|
||||||||||||||||
|
UI
|
$ | 51.1 | $ | 47.9 | $ | 3.2 | 7 | % | ||||||||
|
Non-Utility
|
(2.7 | ) | (1.2 | ) | (1.5 | ) | (125 | )% | ||||||||
|
Total
Income from Continuing Operations
|
48.4 | 46.7 | 1.7 | 4 | % | |||||||||||
|
Discontinued
Operations
|
(0.3 | ) | (2.0 | ) | 1.7 | 85 | % | |||||||||
|
Total
Net Income
|
$ | 48.1 | $ | 44.7 | $ | 3.4 | 8 | % | ||||||||
|
EPS
|
||||||||||||||||
|
UI
|
$ | 2.03 | $ | 1.92 | $ | 0.11 | 6 | % | ||||||||
|
Non-Utility
|
(0.10 | ) | (0.05 | ) | (0.05 | ) | (98 | )% | ||||||||
|
Total
EPS from Continuing Operations - Basic
|
1.93 | 1.87 | 0.06 | 3 | % | |||||||||||
|
Discontinued
Operations
|
(0.01 | ) | (0.08 | ) | 0.07 | 88 | % | |||||||||
|
Total
EPS - Basic
|
$ | 1.92 | $ | 1.79 | $ | 0.13 | 8 | % | ||||||||
|
Total
EPS - Diluted (Note 1)
|
$ | 1.89 | $ | 1.77 | $ | 0.12 | 7 | % | ||||||||
Note 1: Reflecting the effect of dilutive stock options, performance shares and restricted stock.
The United Illuminating
Company
|
Year
Ended December 31,
|
2008
More (Less) than 2007
|
|||||||||||||||
|
2008
|
2007
|
Amount
|
Percent
|
|||||||||||||
|
EPS
|
||||||||||||||||
|
UI
|
$ | 2.03 | $ | 1.92 | $ | 0.11 | 6 | % | ||||||||
|
Non-recurring
earnings from Private Letter Ruling
|
- | - | - | - | % | |||||||||||
|
Total
UI - basic
|
$ | 2.03 | $ | 1.92 | $ | 0.11 | 6 | % | ||||||||
|
Total
UI - diluted (Note 1)
|
$ | 2.00 | $ | 1.90 | $ | 0.10 | 5 | % | ||||||||
|
Retail
Sales*
|
5,729 | 5,917 | (188 | ) | (3 | )% | ||||||||||
|
Weather
Impact* (Note 2)
|
(19 | ) | 12 | (31 | ) | (1 | )% | |||||||||
|
Retail
Sales – Normalized*
|
5,710 | 5,929 | (219 | ) | (4 | )% | ||||||||||
* Millions of kilowatt-hours
Note
1: Reflecting the effect of dilutive stock options, performance shares and
restricted stock.
Note
2: Percentage change reflects impact to total retail sales.
The
following details variances which have the most significant impact on net income
in the periods presented. Distribution includes all utility revenue
and expenses except for transmission.
Distribution
The table
below provides the distribution net income favorable/(unfavorable) variances for
2008 compared to 2007.
|
Year
Ended
|
||||
|
December
31, 2008
|
||||
|
vs.
2007
|
||||
|
Favorable/(Unfavorable)
|
(In
Millions)
|
|||
|
Operating
revenues
|
||||
|
Regulatory
true-up items
|
$ | (3.8 | ) | |
|
Distribution
rates & pricing
|
9.7 | |||
|
Sales
volume
|
(4.4 | ) | ||
|
O&M
expense
|
||||
|
Customer
service - allocated
|
4.2 | |||
|
Outside
services and other expense
|
(5.0 | ) | ||
|
Pension
& postretirement
|
1.9 | |||
|
Depreciation
and amortization
|
(1.9 | ) | ||
|
Other
income and (deductions)
|
(4.3 | ) | ||
|
Interest
expense
|
(1.8 | ) | ||
|
Other,
net
|
(2.4 | ) | ||
| $ | (7.8 | ) | ||
The unfavorable variance in regulatory true-up items was primarily due to adjustments recorded in 2008 to certain regulatory liabilities. The favorable variance in distribution rates and pricing was primarily due to previously approved increases in UI’s distribution rate components. The unfavorable variance in sales volume was primarily due to the reduction in kWh usage resulting from a reduction in customer demand.
The
allocation of customer service expense to transmission in accordance with a May
2008 FERC order was favorable due to the allocation not being effective until
May 2008. The unfavorable variance in outside services and other
expense was primarily due to increased compensation expense. The
favorable variance in pension and postretirement was primarily due to the
positive impact of the financial markets on the value of pension and
postretirement assets.
See the
“Total UI” section below for explanations of the variances in depreciation and
amortization, other income and (deductions), and interest expense.
Transmission
The
transmission business earnings continued to experience underlying growth in net
income of $11.0 million in 2008 compared to 2007 from higher rate base and
allowed return with approximately the same equity capitalization compared to
2007. As previously reported, UI completed the Middletown-to-Norwalk
transmission project, which went into service ahead of schedule, in December
2008.
Total
UI
Overall,
UI’s operating revenue decreased by $33.1 million, from $981.0 million in 2007,
to $947.9 million in 2008. Retail revenue decreased $44.9 million due
primarily to the impact of customers switching to alternate suppliers for
services, which has no impact on net income, and to decreases in distribution
sales volume, partially offset by previously approved increases in UI’s
distribution rate components. Other revenues increased $6.2 million,
largely due to higher transmission revenue, partially offset by the net activity
of the GSC “working capital allowance”.
Purchased
power expense decreased by $92.3 million, from $516.5 million in 2007, to $424.2
million in 2008. Retail purchased power expense decreased $97.8
million in 2008, primarily due to the impact of customers switching to alternate
suppliers for generation services, partially offset by higher costs to procure
power. UI receives electricity to
satisfy
its standard service and supplier of last resort requirements through
fixed-price purchased power agreements. These costs are fully
recovered through the GSC and BFMCC portions of UI’s unbundled retail customer
rates. UI’s wholesale energy expense increased $5.5 million during
2008, primarily due to higher pricing for generation at the Bridgeport RESCO
generating plant.
UI’s
O&M expenses increased by $5.6 million, from $206.0 million in 2007, to
$211.6 million in 2008. The increase was primarily attributable to
increased compensation expense of $4.0 million.
UI’s
transmission wholesale expenses increased by $13.6 million, from $32.8 million
in 2007, to $46.4 million in 2008. The increase was primarily
attributable to higher regional transmission expenses of which UI pays a portion
based upon its relative load.
UI’s
depreciation and amortization increased by $10.8 million, from $90.2 million in
2007, to $101.0 million in 2008. The increase was primarily
attributable to increased distribution plant and equipment depreciation and CTA
amortization. UI accrues or defers additional amortization to achieve
the authorized return on equity on unamortized CTA rate base.
UI’s
taxes other than income taxes increased $5.6 million, from $44.6 million in
2007, to $50.2 million in 2008. The increase was primarily
attributable to increases in property taxes due to increases in plant and
equipment, as well as gross earnings taxes, the latter of which is due to
increased transmission revenues.
UI’s
other income and deductions decreased by $6.7 million, from $9.4 million in
2007, to $2.7 million in 2008. The decrease was primarily
attributable to mark-to-market adjustments to non-qualified pension investments
and the ISO-NE demand response program ending during the first nine months of
2008.
UI’s
interest expense increased by $7.8 million, from $22.2 million in 2007 to $30.0
million in 2008. The increase was primarily attributable to increased
long-term and short-term borrowings.
Non-Utility
UIL
Holdings retains certain costs at the holding company, or “corporate” level
which are not allocated to the various non-utility subsidiaries as well as the
results of the former Xcelecom entities which were not divested. UIL
Corporate incurred net after-tax costs of $2.7 million, or $0.10 per share, in
2008 compared to net after-tax costs of $1.2 million, or $0.05 per share, in
2007. The larger loss in 2008 was primarily due to increased interest
expense due to increased short-term borrowings.
Discontinued
Operations
The
divested Xcelecom businesses incurred net after-tax costs of $0.3 million, or
$0.01 per share, in 2008 compared to net after-tax costs of $2.0 million, or
$0.08 per share, in 2007. The decrease was primarily due to the
absence in 2008 of a net loss from adjustments made in 2007 to the results from
earlier sales of former subsidiaries.
Item 7A. Quantitative and Qualitative
Disclosures About Market Risk.
UIL
Holdings and UI have market risk associated with (1) the refinancing of fixed
rate debt at maturity, (2) the remarketing of multi-annual tax-exempt bonds, (3)
the periodic reset by auction (every 35 days) of the interest rate on $64.5
million principal amount of tax exempt bonds (Auction Rate Bonds), (4) the
issuance of new debt (the Financings), (5) interest rate risk associated with
short-term financings, and (6) equity issuances. The tax-exempt bonds
are also referred to as pollution control revenue refunding bonds or pollution
control refunding revenue bonds.
The
weighted average remaining fixed rate period of outstanding long-term debt
obligations of UIL Holdings and UI as of December 31, 2009 is 8.54 years, at an
average interest rate of 6.37%.
The
interest rate risk of financings, including the reset at auction of the interest
rate on $64.5 million principal amount of Auction Rate Bonds, is $2,500 of
increased interest expense for every $1.0 million of debt with every 0.25%
increase in interest rates.
GenConn
is a 50-50 joint venture of UI and NRG. In 2008, the DPUC selected
two projects proposed by GenConn to help address Connecticut’s growing need for
more power generation during the heaviest load periods. Two peaking
generation projects, each with a nominal capacity of 200 megawatts (MW), are to
be built at NRG’s existing Connecticut plants in Devon and
Middletown. GenConn expects to finance 50% of its capital
requirements with the proceeds of the Project Financing it obtained on April 27,
2009. The interest rate on the project financing is a variable rate,
of which 55% of the financing has been hedged. GenConn has interest
exposure on the remaining 45%, which should be recoverable by GenConn in
rates. UI and NRG will each make an equity investment in GenConn on a
50%/50% basis to meet the remaining 50% of GenConn’s capital
requirements. Such equity investments are expected to occur within
the first six months of 2010 in the amount of approximately $53 million for the
Devon Project and within the first six months of 2011 in the amount of
approximately $60 million for the Middletown Project. UI expects to
use the proceeds of the EBL it obtained on April 27, 2009 for its portion of
those requirements and to replace the EBL with cash on hand and with funds
raised in the capital markets. The EBL has a variable interest rate
and UI has interest risk associated with this, which should be recovered by
GenConn in rates. See Part II, Item 8, “Financial
Statements and Supplementary Data - Notes to Consolidated Financial Statements –
Note (B), Capitalization” of this Form 10-K for further discussion of the
EBL.
The table
below provides information about long-tem debt of UIL Holdings and UI that
exposes UIL Holdings to interest rate risk. The table presents
principal cash flows and related weighted average interest rates by expected
maturity dates and by fixed interest rate expiration dates.
|
2010
|
2011
|
2012
|
2013
|
2014
|
Thereafter
|
Total
|
Fair
Value
|
|||||||||||||||||||||||||
|
Expected
Maturity Date
|
||||||||||||||||||||||||||||||||
|
(In
Thousands)
|
||||||||||||||||||||||||||||||||
|
UIL
Holdings
|
(1 | ) | ||||||||||||||||||||||||||||||
|
Long-Term
Debt (1)
|
$ | 4,286 | $ | 49,286 | $ | - | $ | - | $ | - | $ | - | $ | 53,572 | $ | 55,179 | ||||||||||||||||
|
Average
interest rate
|
7.23 | % | 7.37 | % | 7.36 | % | ||||||||||||||||||||||||||
|
(1)
|
Includes
annual principal payments of $4.3 million related to the 7.23% Senior
Notes and a $45.0 million principal payment due in 2011 related to the
7.38% Senior Notes. UIL Holdings currently has no plan to refinance either
debt.
|
|
2010
|
2011
|
2012
|
2013
|
2014
|
Thereafter
|
Total
|
Fair
Value
|
|||||||||||||||||||||||||
|
Expected
Maturity Date
|
||||||||||||||||||||||||||||||||
|
(In
Thousands)
|
||||||||||||||||||||||||||||||||
|
UI
|
(1 | ) | (2 | ) | (3 | ) | ||||||||||||||||||||||||||
|
Long-Term
Debt
|
$ | 81,470 | $ | 53,803 | $ | 103,500 | $ | - | $ | - | $ | 439,460 | $ | 678,233 | $ | 704,217 | ||||||||||||||||
|
Average
interest rate
|
3.45 | % | 3.35 | % | 6.96 | % | 5.41 | % | 5.25 | % | ||||||||||||||||||||||
|
(1)
|
Includes
pollution control revenue refunding bonds of $27.5 million with a fixed
interest rate of 3.65% ending on February 1,
2010.
|
|
(2)
|
Includes
pollution control revenue refunding bonds of $71 million, $7.5 million and
$25 million with fixed interest rates of 7.13%, 5.75% and 6.88%,
respectively, ending on February 1,
2012.
|
|
(3)
|
Includes
$70 million of 6.06% Senior Notes due 2017, $77 million of 6.26% Senior
Notes due 2022, $28 million of 6.51% Senior Notes due 2037, $50 million of
6.46% Senior Notes due 2018, $50 million of 6.51% Senior Notes due 2018,
$50 million of 6.61% Senior Notes due 2020, $50 million of 5.61% Senior
Notes due 2025 and $64.5 million Auction Rate
Bonds.
|
There has
been considerable dislocation in the auction rate bond market, and there have
been failed auctions, resulting from insufficient clearing bids. The
auctions for the Auction Rate Bonds have failed, beginning with the March 2008
auction. When there are insufficient clearing bids as a result of an auction,
the interest rates are set at a rate equal to the one-month London Interbank
Offered Rate (LIBOR) times a multiple of 125% to 225%, based on the credit
rating on the Auction Rate Bonds assigned by Moody’s or S&P. The
principal and interest payments on $64.5 million principal amount of Auction
Rate Bonds are insured by Ambac Assurance Corporation (Ambac). These
bonds are currently rated by Moody’s. The credit rating from Moody’s
on these bonds is based on the higher of Ambac’s credit rating or UI’s
underlying credit rating. On July 29, 2009, Ambac was downgraded by
Moody’s to Caa2 from Ba3. Accordingly, the credit rating from Moody’s
on these bonds is now based on the current underlying credit rating of UI of
Baa2. In the event of subsequent failed auctions of the Auction Rate
Bonds, the interest rate on the bonds will continue to be reset as described
above. The interest rate on these bonds was 0.463% at December 28,
2009 which was equal to two times LIBOR.
On
February 18, 2009, the DPUC approved an application filed by UI to afford UI
additional flexibility to market outstanding tax-exempt bonds in the municipal
bond market. Specifically, UI requested approval to refund, with the
proceeds of the issuance of new bonds, without insurance, $25.0 million, $27.5
million and $64.5 million principal amount of tax-exempt bonds
outstanding. In December 2008, UI purchased $25.0 million principal
amount of tax-exempt bonds which were refunded with the proceeds from the
issuance, without insurance, of $25.0 million tax-exempt bonds in March
2009. On January 28, 2010, $27.5 million principal amount of
tax-exempt bonds were issued without insurance, the proceeds of which were used
to refund $27.5 million principal amount of insured bonds on
February 1, 2010. UI plans to refund $64.5 million
principal amount of Auction Rate Bonds at such time and on such terms as
municipal bond market conditions allow.
UIL
Holdings’ and UI’s short-term borrowing costs fluctuate with the upward and
downward movements of LIBOR, Citibank’s New York base rate and the Federal Funds
Rate (as defined in UIL Holdings’ and UI’s short-term credit facility and the
EBL, respectively). Rates associated with the money market loan
arrangement that UI has with JPMorgan Chase Bank fluctuate based on rates in the
money market. Such rates are influenced by financial market
conditions and the actions of the Federal Reserve.
In
addition, UI requires that its energy suppliers provide performance security to
guarantee performance under contracts for standard service and supplier of last
resort service. Specifically, UI requires wholesale suppliers to
provide both parent guarantees and letters of credit. This
performance assurance is intended to allow UI to recover for its customers the
cost of replacement power, as well as administrative and legal costs, associated
with a supplier default.
During
late 2008, conditions in the capital markets resulted in reductions in asset
values of funded pension and postretirement plans. In particular, the
projected benefit obligation for the qualified pension plan now exceeds the fair
market value of the plan assets by $140 million. Although asset
values recovered somewhat in 2009, these reductions, if not offset by additional
gains in future years, will result in higher pension and postretirement expenses
in future years along with additional cash contributions. Asset
values as of December 31, 2009 and December 31, 2008 were approximately $231.3
million and $211.7 million, respectively. While there was no minimum
required pension contribution for the 2009 plan year, UI expects to make a
contribution of approximately $9 million in 2010, subject to current proposals
that are pending before the United States Congress.
|
Item
8. Financial Statements and Supplementary Data.
|
||||||||||||
|
UIL
HOLDINGS CORPORATION
|
||||||||||||
|
CONSOLIDATED
STATEMENT OF INCOME (LOSS)
|
||||||||||||
|
For
the Years Ended December 31, 2009, 2008 and 2007
|
||||||||||||
|
(In
Thousands except per share amounts)
|
||||||||||||
|
2009
|
2008
|
2007
|
||||||||||
|
Operating
Revenues (Note F)
|
||||||||||||
|
Utility
|
$ | 895,681 | $ | 947,940 | $ | 981,004 | ||||||
|
Non-utility
|
869 | 780 | 995 | |||||||||
|
Total
Operating Revenues
|
896,550 | 948,720 | 981,999 | |||||||||
|
Operating
Expenses
|
||||||||||||
|
Operation
|
||||||||||||
|
Purchased
power (Note F)
|
333,339 | 424,245 | 516,487 | |||||||||
|
Operation
and maintenance
|
225,603 | 212,621 | 207,585 | |||||||||
|
Transmission
wholesale
|
57,012 | 46,368 | 32,763 | |||||||||
|
Depreciation
and amortization (Note F)
|
98,116 | 101,129 | 90,370 | |||||||||
|
Taxes
- other than income taxes (Note F)
|
60,062 | 50,230 | 44,629 | |||||||||
|
Total
Operating Expenses
|
774,132 | 834,593 | 891,834 | |||||||||
|
Operating
Income
|
122,418 | 114,127 | 90,165 | |||||||||
|
Other
Income and (Deductions), net (Note F), (Note H)
|
5,586 | 3,339 | 12,896 | |||||||||
|
Interest
Charges, net
|
||||||||||||
|
Interest
on long-term debt
|
37,297 | 29,564 | 23,382 | |||||||||
|
Other
interest, net (Note F)
|
1,286 | 2,858 | 1,502 | |||||||||
| 38,583 | 32,422 | 24,884 | ||||||||||
|
Amortization
of debt expense and redemption premiums
|
1,817 | 1,730 | 1,662 | |||||||||
|
Total
Interest Charges, net
|
40,400 | 34,152 | 26,546 | |||||||||
|
Income
Before Income Taxes, Equity Earnings and
|
||||||||||||
|
Discontinued
Operations
|
87,604 | 83,314 | 76,515 | |||||||||
|
Income
Taxes (Note E)
|
33,204 | 34,724 | 30,512 | |||||||||
|
Income
Before Equity Earnings and Discontinued Operations
|
54,400 | 48,590 | 46,003 | |||||||||
|
Income
(Loss) from Equity Investments
|
59 | (205 | ) | 690 | ||||||||
|
Income
from Continuing Operations
|
54,459 | 48,385 | 46,693 | |||||||||
|
Discontinued
Operations, Net of Tax (Note N)
|
(142 | ) | (237 | ) | (1,996 | ) | ||||||
|
Net
Income
|
$ | 54,317 | $ | 48,148 | $ | 44,697 | ||||||
|
Average
Number of Common Shares Outstanding - Basic
|
28,027 | 25,114 | 24,986 | |||||||||
|
Average
Number of Common Shares Outstanding - Diluted
|
28,273 | 25,477 | 25,299 | |||||||||
|
Earnings
Per Share of Common Stock - Basic:
|
||||||||||||
|
Continuing
Operations
|
$ | 1.94 | $ | 1.93 | $ | 1.87 | ||||||
|
Discontinued
Operations
|
- | (0.01 | ) | (0.08 | ) | |||||||
|
Net
Earnings
|
$ | 1.94 | $ | 1.92 | $ | 1.79 | ||||||
|
Earnings
Per Share of Common Stock - Diluted:
|
||||||||||||
|
Continuing
Operations
|
$ | 1.93 | $ | 1.90 | $ | 1.85 | ||||||
|
Discontinued
Operations
|
- | (0.01 | ) | (0.08 | ) | |||||||
|
Net
Earnings
|
$ | 1.93 | $ | 1.89 | $ | 1.77 | ||||||
|
Cash
Dividends Declared per share of Common Stock
|
$ | 1.728 | $ | 1.728 | $ | 1.728 | ||||||
|
UIL
HOLDINGS CORPORATION
|
||||||||||||
|
CONSOLIDATED
STATEMENT OF COMPREHENSIVE INCOME (LOSS)
|
||||||||||||
|
For
the Years Ended December 31, 2009, 2008 and 2007
|
||||||||||||
|
(Thousands
of Dollars)
|
||||||||||||
| 2009 | 2008 | 2007 | ||||||||||
|
Net
Income
|
$ | 54,317 | $ | 48,148 | $ | 44,697 | ||||||
|
Other
comprehensive income (loss), net of tax:
|
||||||||||||
|
Interest
rate cap mark-to-market
|
- | 28 | 29 | |||||||||
|
Other
Comprehensive Income
|
- | 28 | 29 | |||||||||
|
Comprehensive
Income
|
$ | 54,317 | $ | 48,176 | $ | 44,726 | ||||||
|
The
accompanying Notes to the Consolidated Financial
|
||||||||||||
|
Statements
are an integral part of the financial statements.
|
||||||||||||
|
CONSOLIDATED
STATEMENT OF CASH FLOWS
|
||||||||||||
|
For
the Years Ended December 31, 2009, 2008 and 2007
|
||||||||||||
|
(Thousands
of Dollars)
|
||||||||||||
|
2009
|
2008
|
2007
|
||||||||||
|
Cash
Flows From Operating Activities
|
||||||||||||
|
Net
income
|
$ | 54,317 | $ | 48,148 | $ | 44,697 | ||||||
|
Adjustments
to reconcile net income
|
||||||||||||
|
to
net cash provided by operating activities:
|
||||||||||||
|
Loss
on settlements of divested businesses
|
- | - | 1,650 | |||||||||
|
Depreciation
and amortization
|
99,933 | 82,186 | 71,007 | |||||||||
|
Deferred
income taxes
|
(6,541 | ) | (7,331 | ) | (4,250 | ) | ||||||
|
Stock-based
compensation expense (Note A)
|
3,570 | 3,771 | 2,896 | |||||||||
|
Pension
expense
|
22,313 | 10,617 | 12,922 | |||||||||
|
Allowance
for funds used during construction (AFUDC) - equity
|
(650 | ) | (2,420 | ) | (2,167 | ) | ||||||
|
Deferred
Transmission (income) expense
|
(6,114 | ) | (5,327 | ) | (1,581 | ) | ||||||
|
Decoupling
(income) expense
|
(5,286 | ) | - | - | ||||||||
|
Other
non-cash items, net
|
(1,856 | ) | 714 | (1,475 | ) | |||||||
|
Changes
in:
|
||||||||||||
|
Utility
accounts receivable, net
|
2,808 | 5,478 | (10,082 | ) | ||||||||
|
Unbilled
revenues and other accounts receivable
|
1,969 | (8,598 | ) | (8,016 | ) | |||||||
|
Materials
and supplies
|
(682 | ) | (620 | ) | (1,509 | ) | ||||||
|
Prepayments
|
1,550 | (2,066 | ) | 1,758 | ||||||||
|
Accounts
payable
|
(3,683 | ) | (6,379 | ) | (3,110 | ) | ||||||
|
Interest
accrued
|
1,728 | 860 | 2,140 | |||||||||
|
Taxes
accrued
|
(77 | ) | 18,910 | 11,613 | ||||||||
|
Accrued
pension
|
(286 | ) | (288 | ) | (4,350 | ) | ||||||
|
Accrued
liabilities
|
5,908 | 4,059 | (9,830 | ) | ||||||||
|
Other
assets
|
794 | 140 | 2,961 | |||||||||
|
Other
liabilities
|
2,392 | (119 | ) | (2,633 | ) | |||||||
|
Total
Adjustments
|
117,790 | 93,587 | 57,944 | |||||||||
|
Net
Cash provided by Operating Activities
|
172,107 | 141,735 | 102,641 | |||||||||
|
Cash
Flows from Investing Activities
|
||||||||||||
|
Proceeds
from sale of Steel Point
|
- | - | 4,600 | |||||||||
|
Proceeds
from settlements of divested businesses
|
- | - | 10,277 | |||||||||
|
Related
party note receivable (Note H)
|
(72,230 | ) | (35,543 | ) | - | |||||||
|
Plant
expenditures including AFUDC debt
|
(123,574 | ) | (215,728 | ) | (246,224 | ) | ||||||
|
Investment
in CT Yankee
|
985 | 568 | - | |||||||||
|
Changes
in restricted cash
|
7,379 | (10,871 | ) | 162 | ||||||||
|
Other
|
58 | 173 | - | |||||||||
|
Net
Cash (used in) Investing Activities
|
(187,382 | ) | (261,401 | ) | (231,185 | ) | ||||||
|
Cash
Flows from Financing Activities
|
||||||||||||
|
Issuances
of common stock
|
92,225 | 2,652 | 1,324 | |||||||||
|
Issuances
of long-term debt
|
182,773 | 150,000 | 175,000 | |||||||||
|
Payments
on long-term debt
|
(55,286 | ) | (129,286 | ) | (78,286 | ) | ||||||
|
Line
of credit borrowings (repayments)
|
(148,000 | ) | 133,000 | 15,000 | ||||||||
|
Payment
of common stock dividend
|
(47,678 | ) | (43,463 | ) | (32,457 | ) | ||||||
|
Other
|
(1,220 | ) | (277 | ) | (631 | ) | ||||||
|
Net
Cash provided by Financing Activities
|
22,814 | 112,626 | 79,950 | |||||||||
|
Unrestricted
Cash and Temporary Cash Investments:
|
||||||||||||
|
Net
change for the period
|
7,539 | (7,040 | ) | (48,594 | ) | |||||||
|
Balance
at beginning of period
|
7,730 | 14,770 | 63,364 | |||||||||
|
Balance
at end of period
|
15,269 | 7,730 | 14,770 | |||||||||
|
Cash
paid during the period for:
|
||||||||||||
|
Interest
(net of amount capitalized)
|
$ | 34,977 | $ | 30,290 | $ | 21,177 | ||||||
|
Income
taxes
|
$ | 44,009 | $ | 46,074 | $ | 34,427 | ||||||
|
Non-cash
investing activity:
|
||||||||||||
|
Plant
expenditures included in ending accounts payable
|
$ | 30,054 | $ | 27,676 | $ | 30,992 | ||||||
|
The
accompanying Notes to the Consolidated Financial
|
||||||||||||
|
Statements
are an integral part of the financial statements.
|
||||||||||||
|
ASSETS
|
||||||||
|
(In
Thousands)
|
||||||||
|
2009
|
2008
|
|||||||
|
Current
Assets
|
||||||||
|
Unrestricted
cash and temporary cash investments
|
$ | 15,269 | $ | 7,730 | ||||
|
Restricted
cash
|
3,695 | 11,074 | ||||||
|
Utility
accounts receivable less allowance of $4,500 and $4,500,
respectively
|
81,861 | 85,377 | ||||||
|
Other
accounts receivable
|
8,501 | 8,477 | ||||||
|
Current
portion of related party note receivable (Note H)
|
- | 35,543 | ||||||
|
Unbilled
revenues
|
48,375 | 50,123 | ||||||
|
Current
regulatory assets
|
58,476 | 38,441 | ||||||
|
Materials
and supplies, at average cost
|
4,553 | 3,871 | ||||||
|
Deferred
income taxes
|
4,410 | 6,863 | ||||||
|
Prepayments
|
3,862 | 3,670 | ||||||
|
Other
current assets
|
662 | 1,017 | ||||||
|
Current
assets of discontinued operations held for sale
|
3,728 | 5,437 | ||||||
|
Total
Current Assets
|
233,392 | 257,623 | ||||||
|
Other
investments
|
10,659 | 10,307 | ||||||
|
Property,
Plant and Equipment at original cost
|
||||||||
|
In
service
|
1,408,811 | 1,330,901 | ||||||
|
Less,
accumulated depreciation
|
379,951 | 344,124 | ||||||
| 1,028,860 | 986,777 | |||||||
|
Construction
work in progress
|
124,141 | 86,811 | ||||||
|
Net
Property, Plant and Equipment
|
1,153,001 | 1,073,588 | ||||||
|
Regulatory Assets (future amounts due
from customers through the ratemaking process)
|
676,992 | 723,079 | ||||||
|
Deferred
Charges and Other Assets
|
||||||||
|
Unamortized
debt issuance expenses
|
6,613 | 6,644 | ||||||
|
Related
party note receivable (Note H)
|
107,773 | - | ||||||
|
Other
long-term receivable
|
2,186 | 2,710 | ||||||
|
Contracts
for differences (Note K)
|
30,694 | 8,649 | ||||||
|
Other
|
450 | 586 | ||||||
|
Total
Deferred Charges and Other Assets
|
147,716 | 18,589 | ||||||
|
Total
Assets
|
$ | 2,221,760 | $ | 2,083,186 | ||||
|
The
accompanying Notes to the Consolidated Financial
|
||||||||
|
Statements
are an integral part of the financial statements.
|
||||||||
|
UIL
HOLDINGS CORPORATION
|
||||||||
|
CONSOLIDATED
BALANCE SHEET
|
||||||||
|
December
31, 2009 and 2008
|
||||||||
|
LIABILITIES
AND CAPITALIZATION
|
||||||||
|
(In
Thousands)
|
||||||||
|
2009
|
2008
|
|||||||
|
Current
Liabilities
|
||||||||
|
Line
of credit borrowings
|
$ | - | $ | 148,000 | ||||
|
Current
portion of long-term debt
|
58,256 | 55,286 | ||||||
|
Accounts
payable
|
90,470 | 91,891 | ||||||
|
Dividends
payable
|
12,930 | 10,904 | ||||||
|
Accrued
liabilities
|
37,162 | 30,043 | ||||||
|
Current
regulatory liabilities
|
23,144 | 18,709 | ||||||
|
Interest
accrued
|
8,774 | 7,046 | ||||||
|
Taxes
accrued
|
4,718 | 4,792 | ||||||
|
Current
liabilities of discontinued operations held for sale
|
4,578 | 5,467 | ||||||
|
Total
Current Liabilities
|
240,032 | 372,138 | ||||||
|
Noncurrent
Liabilities
|
||||||||
|
Pension
accrued
|
140,454 | 136,383 | ||||||
|
Connecticut
Yankee contract obligation
|
20,694 | 22,721 | ||||||
|
Other
post-retirement benefits accrued
|
47,302 | 48,671 | ||||||
|
Contracts
for differences (Note K)
|
162,093 | 92,142 | ||||||
|
Other
|
6,965 | 4,375 | ||||||
|
Total
Noncurrent Liabilities
|
377,508 | 304,292 | ||||||
|
Deferred Income Taxes (future tax
liabilities owed to taxing authorities)
|
273,558 | 298,824 | ||||||
|
Regulatory Liabilities (future amounts
owed to customers through the ratemaking process)
|
82,937 | 84,322 | ||||||
|
Commitments
and Contingencies (Note J)
|
||||||||
|
Capitalization
(Note B)
|
||||||||
|
Long-term
debt
|
673,549 | 549,031 | ||||||
|
Common
Stock Equity
|
||||||||
|
Common
stock
|
422,008 | 328,824 | ||||||
|
Paid-in
capital
|
14,859 | 13,771 | ||||||
|
Unearned
employee stock ownership plan equity
|
- | (712 | ) | |||||
|
Retained
earnings
|
137,309 | 132,696 | ||||||
|
Net
Common Stock Equity
|
574,176 | 474,579 | ||||||
|
Total
Capitalization
|
1,247,725 | 1,023,610 | ||||||
|
Total
Liabilities and Capitalization
|
$ | 2,221,760 | $ | 2,083,186 | ||||
|
The
accompanying Notes to the Consolidated Financial
|
||||||||
|
Statements
are an integral part of the financial statements.
|
||||||||
|
Consolidated
Statement of Changes in Shareholders' Equity
|
||||||||||||||||||||||||||||
|
December
31, 2009, 2008 and 2007
|
||||||||||||||||||||||||||||
|
(Thousands
of Dollars)
|
||||||||||||||||||||||||||||
|
Accumulated
|
||||||||||||||||||||||||||||
|
Unearned
|
Other
|
|||||||||||||||||||||||||||
|
Common
Stock
|
Paid-in
|
ESOP
|
Comprehensive
|
Retained
|
||||||||||||||||||||||||
|
Shares (a)
|
Amount
|
Capital
|
Equity
|
Income
(Loss)
|
Earnings
|
Total
|
||||||||||||||||||||||
|
Balance
as of December 31, 2006
|
24,856,042 | $ | 321,213 | $ | 15,363 | $ | (2,612 | ) | $ | (57 | ) | $ | 126,674 | $ | 460,581 | |||||||||||||
|
Net
income for 2007
|
44,697 | 44,697 | ||||||||||||||||||||||||||
|
Cash
dividends on common stock - $1.728 per share
|
(43,290 | ) | (43,290 | ) | ||||||||||||||||||||||||
|
Issuance
of 101,757 shares common stock - no par value
|
129,666 | 4,105 | (5 | ) | 4,100 | |||||||||||||||||||||||
|
Stock
based compensation
|
(3,181 | ) | (3,181 | ) | ||||||||||||||||||||||||
|
Interest
rate cap mark-to-market (net of deferred tax benefit of
$20)
|
29 | 29 | ||||||||||||||||||||||||||
|
Allocation
of benefits - ESOP
|
46,567 | 405 | 950 | 1,355 | ||||||||||||||||||||||||
|
Balance
as of December 31, 2007
|
25,032,275 | $ | 325,318 | $ | 12,582 | $ | (1,662 | ) | $ | (28 | ) | $ | 128,081 | $ | 464,291 | |||||||||||||
|
Net
income for 2008
|
48,148 | 48,148 | ||||||||||||||||||||||||||
|
Cash
dividends on common stock - $1.728 per share
|
(43,533 | ) | (43,533 | ) | ||||||||||||||||||||||||
|
Issuance
of 114,022 shares common stock - no par value
|
95,432 | 3,506 | 9 | 3,515 | ||||||||||||||||||||||||
|
Stock
based compensation
|
836 | 836 | ||||||||||||||||||||||||||
|
Interest
rate cap mark-to-market (net of deferred tax benefit of
$19)
|
28 | 28 | ||||||||||||||||||||||||||
|
Allocation
of benefits - ESOP
|
46,567 | 344 | 950 | 1,294 | ||||||||||||||||||||||||
|
Balance
as of December 31, 2008
|
25,174,274 | $ | 328,824 | $ | 13,771 | $ | (712 | ) | - | $ | 132,696 | $ | 474,579 | |||||||||||||||
|
Net
income for 2009
|
54,317 | 54,317 | ||||||||||||||||||||||||||
|
Cash
dividends on common stock - $1.728 per share
|
(49,704 | ) | (49,704 | ) | ||||||||||||||||||||||||
|
Issuance
of 4,655,565 shares common stock - no par value
|
4,767,306 | 93,184 | 93,184 | |||||||||||||||||||||||||
|
Stock
based compensation
|
996 | 996 | ||||||||||||||||||||||||||
|
Allocation
of benefits - ESOP
|
34,926 | 92 | 712 | 804 | ||||||||||||||||||||||||
|
Balance
as of December 31, 2009
|
29,976,506 | $ | 422,008 | $ | 14,859 | - | - | $ | 137,309 | $ | 574,176 | |||||||||||||||||
|
(a)
There were 75,000,000 shares authorized in both 2009 and
2008
|
||||||||||||||||||||||||||||
|
The
accompanying Notes to Consolidated Financial
|
||||||||||||||||||||||||||||
|
Statements
are an integral part of the financial statements.
|
||||||||||||||||||||||||||||
(A) STATEMENT
OF ACCOUNTING POLICIES
UIL
Holdings Corporation (UIL Holdings) primarily operates its regulated utility
business. The utility business consists of the electric transmission
and distribution operations of The United Illuminating Company
(UI). UI is also a 50-50 joint venturer, together with NRG Energy,
Inc., in GenConn Energy LLC (GenConn), a project selected to build new peaking
generation plants chosen by the Connecticut Department of Public Utility Control
(“DPUC”) to help address the state’s growing need for more power generation
during the heaviest load periods. UIL Holdings is headquartered in
New Haven, Connecticut, where its senior management maintains offices and is
responsible for overall planning, operating and financial
functions.
Accounting
Records
The
accounting records of UIL Holdings are maintained in conformity with generally
accepted accounting principles in the United States of America
(GAAP).
The
accounting records for UI are also maintained in accordance with the uniform
systems of accounts prescribed by the Federal Energy Regulatory Commission
(FERC) and the DPUC.
Basis
of Presentation
The
Consolidated Financial Statements include the accounts of UIL Holdings and its
subsidiaries. Intercompany accounts and transactions have been
eliminated in consolidation.
The
preparation of financial statements in conformity with GAAP requires management
to use estimates and assumptions that affect (1) the reported amounts of assets
and liabilities and disclosure of contingent assets and liabilities at the date
of the financial statements and (2) the reported amounts of revenues and
expenses during the reporting period. Actual results could differ
from those estimates.
Certain
immaterial amounts reported in the Consolidated Balance Sheet and Consolidated
Statement of Cash Flows in previous periods have been reclassified to conform to
the current presentation.
In
accordance with the Financial Accounting Standards Board’s (FASB) issuance of
the Accounting Standards Codification (ASC) in July 2009, all prior references
to authoritative accounting guidance have been revised to conform to the
ASC.
UIL
Holdings has evaluated subsequent events through the issue date of its annual
financial statements, February 17, 2010.
Regulatory
Accounting
Generally
accepted accounting principles for regulated entities in the United States of
America allow UI to give accounting recognition to the actions of regulatory
authorities in accordance with the provisions of Accounting Standards
Codification (ASC) 980 “Regulated Operations”. In accordance with ASC
980, UI has deferred recognition of costs (a regulatory asset) or has recognized
obligations (a regulatory liability) if it is probable that such costs will be
recovered or obligations relieved in the future through the ratemaking
process. UI is allowed to recover all such deferred costs through its
regulated rates. See Note (C), “Regulatory Proceedings,” for a
discussion of the recovery of UI’s stranded costs associated with the portion of
its assets and operations relating to the generation business divested in
accordance with the Connecticut electric industry restructuring legislation of
1998 and subsequent years, as well as a discussion of the regulatory decisions
that provide for such recovery.
- 49 -
UIL
HOLDINGS CORPORATION
NOTES TO CONSOLIDATED FINANCIAL
STATEMENTS - (continued)
In
addition to the Regulatory Assets and Liabilities identified on the Consolidated
Balance Sheet and described below, there are other regulatory assets and
liabilities such as certain deferred tax liabilities. UI also has
obligations under long-term power contracts, the recovery of which is subject to
regulation. If UI, or a portion of its assets or operations, were to
cease meeting the criteria for application of these accounting rules, accounting
standards for businesses in general would become applicable and immediate
recognition of any previously deferred costs would be required in the year in
which such criteria are no longer met (if such deferred costs are not
recoverable in the portion of the business that continues to meet the criteria
for application of ASC 980). UI expects to continue to meet the
criteria for application of ASC 980 for the foreseeable future. If a
change in accounting were to occur, it could have a material adverse effect on
UI’s earnings and retained earnings in that year and could also have a material
adverse effect on UI’s ongoing financial condition.
UIL
Holdings’ regulatory assets and liabilities as of December 31, 2009 and 2008
included the following:
|
Remaining
|
December
31,
|
December
31,
|
|||||||
|
Period
|
2009
|
2008
|
|||||||
|
(In
Thousands)
|
|||||||||
|
Regulatory
Assets:
|
|||||||||
|
Nuclear
plant investments – above market
|
(a)
|
$ | 313,833 | $ | 334,279 | ||||
|
Income
taxes due principally to book-tax differences
|
(b)
|
36,635 | 52,859 | ||||||
|
Connecticut
Yankee
|
6
years
|
20,695 | 22,721 | ||||||
|
Unamortized
redemption costs
|
12
to 24 years
|
14,510 | 15,312 | ||||||
|
Stranded
cost recovery
|
(a)
|
7,874 | 34,337 | ||||||
|
Pension
and other post-retirement benefit plans
|
(c)
|
169,234 | 199,197 | ||||||
|
Contracts
for differences
|
(d)
|
137,730 | 88,309 | ||||||
|
Deferred
pension and post-retirement expense
|
(f)
|
10,232 | - | ||||||
|
Distribution
retail revenue decoupling
|
(g)
|
5,286 | - | ||||||
|
Other
|
(b)
|
19,439 | 14,506 | ||||||
|
Total
regulatory assets
|
735,468 | 761,520 | |||||||
|
Less
current portion of regulatory assets
|
58,476 | 38,441 | |||||||
|
Regulatory
Assets, Net
|
$ | 676,992 | $ | 723,079 | |||||
|
Regulatory
Liabilities:
|
|||||||||
|
Accumulated
deferred investment tax credits
|
33
years
|
$ | 5,051 | $ | 5,197 | ||||
|
Deferred
gain on sale of property
|
(a)
|
37,798 | 37,798 | ||||||
|
Middletown/Norwalk
local transmission network service collections
|
41
years
|
23,695 | 24,261 | ||||||
|
Excess
generation service charge
|
(e)
|
19,506 | 13,855 | ||||||
|
Asset
removal costs
|
(b)
|
1,993 | 2,258 | ||||||
|
Other
|
(b)
|
18,038 | 19,662 | ||||||
|
Total
regulatory liabilities
|
106,081 | 103,031 | |||||||
|
Less
current portion of regulatory liabilities
|
23,144 | 18,709 | |||||||
|
Regulatory
Liabilities, Net
|
$ | 82,937 | $ | 84,322 | |||||
|
(a)
Asset/Liability relates to the Competitive Transition Assessment
(CTA). Total CTA costs recovery is currently projected to be
completed in 2015, with stranded cost amortization expected to end in
2013.
|
|||||||||
|
(b)
Amortization period and/or balance varies depending on the nature, cost of
removal and/or remaining life of the underlying
assets/liabilities.
|
|||||||||
|
(c)
Asset life is dependent upon timing of final pension plan distribution;
balance is recalculated each year in accordance with ASC 715
"Compensation-Retirement Benefits" (Note G).
|
|||||||||
|
(d)
Asset life is equal to delivery term of related contracts (which vary from
approximately 9 - 16 years); balance fluctuates based upon quarterly
market analysis performed on the related derivatives (Note
K).
|
|||||||||
|
(e)
Working capital allowance for generation service charge; will fluctuate
based upon cash inflows and outflows in a given period.
|
|||||||||
|
(f) Regulatory
asset established for $10.2 million of 2009 pension and OPEB expense which
will be recovered in 2010.
|
|||||||||
|
(g) Regulatory
asset or liability relating to revenue decoupling; effective January 1,
2010, the Company is collecting a portion of the 2009 decoupling which
will be trued up in February 2010; timing of recovery of 2010 decoupling
is to be addressed by DPUC in future proceedings.
|
|||||||||
- 50 -
UIL
HOLDINGS CORPORATION
NOTES TO CONSOLIDATED FINANCIAL
STATEMENTS - (continued)
Property,
Plant and Equipment
The cost
of additions to property, plant and equipment and the cost of renewals and
betterments are capitalized. Cost consists of labor, materials,
services and certain indirect construction costs, including an allowance for
funds used during construction. The costs of current repairs, major
maintenance projects and minor replacements are charged to appropriate operating
expense accounts as incurred. The original cost of utility property,
plant and equipment retired or otherwise disposed of and the cost of removal,
less salvage, are charged to the accumulated provision for
depreciation.
UI
accrues for estimated costs of removal for certain of its
plant-in-service. Such removal costs are included in the approved
rates used to depreciate these assets. At the end of the service life
of the applicable assets, the accumulated depreciation in excess of the
historical cost of the asset provides for the estimated cost of
removal. In accordance with ASC 410 “Asset Retirement and
Environmental Obligations”, UI’s accrued costs of removal have been recorded as
a regulatory liability. Accrued costs of removal as of December 31,
2009 and 2008 were $2.0 million and $2.3 million, respectively.
UIL
Holdings’ property, plant and equipment as of December 31, 2009 and 2008
were comprised as follows:
|
2009
|
2008
|
|||||||
|
(In
Thousands)
|
||||||||
|
Utility:
|
||||||||
|
Transmission
plant
|
$ | 493,095 | $ | 479,858 | ||||
|
Distribution
plant
|
699,866 | 661,937 | ||||||
|
General
plant
|
90,710 | 82,062 | ||||||
|
Software
|
91,289 | 81,037 | ||||||
|
Land
|
31,514 | 23,670 | ||||||
|
Other
plant
|
255 | 255 | ||||||
|
Subtotal
|
1,406,729 | 1,328,819 | ||||||
|
Non-utility
business units
|
2,082 | 2,082 | ||||||
|
Total
property, plant & equipment
|
1,408,811 | 1,330,901 | ||||||
|
Less
accumulated depreciation
|
||||||||
|
Utility
|
377,869 | 342,150 | ||||||
|
Non-utility
business units
|
2,082 | 1,974 | ||||||
|
Subtotal
accumulated depreciation
|
379,951 | 344,124 | ||||||
| 1,028,860 | 986,777 | |||||||
|
Construction
work in progress
|
124,141 | 86,811 | ||||||
|
Net
property, plant & equipment
|
$ | 1,153,001 | $ | 1,073,588 | ||||
Allowance
for Funds Used During Construction (AFUDC)
In
accordance with the uniform systems of accounts, the Company capitalizes AFUDC,
which represents the approximate cost of debt and equity capital devoted to
plant under construction. The portion of the allowance applicable to
borrowed funds and the allowance applicable to equity funds are presented as
other income in the Consolidated Statement of Income. Although the
allowance does not represent current cash income, it has historically been
recoverable under the ratemaking process over the service lives of the related
properties. Weighted-average AFUDC rates in effect for 2009, 2008 and
2007 were 2.44%, 6.89% and 6.78%, respectively. The decrease in the
2009 rate was primarily due to a decrease in the balance of plant under
construction from 2008 to 2009 as well as a decrease in the average short-term
interest rate.
Depreciation
Provisions
for depreciation on utility plant for book purposes are computed on a
straight-line basis, using estimated service lives. For utility plant
other than software, service lives are determined by independent engineers and
subject to review and approval by the DPUC. Software service life is
based upon management’s estimate of useful life. The
- 51 -
UIL
HOLDINGS CORPORATION
NOTES TO CONSOLIDATED FINANCIAL
STATEMENTS - (continued)
aggregate
annual provisions for depreciation for the years 2009, 2008 and 2007 were
approximately 3.7%, 3.5%, and 4.0%, respectively, of the original cost of
depreciable property.
Income
Taxes
In
accordance with ASC 740 “Income Taxes”, UIL Holdings has provided deferred taxes
for all temporary book-tax differences using the liability
method. The liability method requires that deferred tax balances be
adjusted to reflect enacted future tax rates that are anticipated to be in
effect when the temporary differences reverse. In accordance with
generally accepted accounting principles for regulated industries, UI has
established a regulatory asset for the net revenue requirements to be recovered
from customers for the related future tax expense associated with certain of
these temporary differences. For ratemaking purposes, UI normalizes
all investment tax credits (ITCs) related to recoverable plant
investments.
Under ASC
740, UIL Holdings may recognize the tax benefit of an uncertain tax position
only if management believes it is more likely than not that the tax position
will be sustained on examination by the taxing authority based upon the
technical merits of the position. The tax benefits recognized in the
financial statements from such a position should be measured based upon the
largest benefit that has a greater than fifty percent likelihood of being
realized upon ultimate settlement. UIL Holdings adopted the provisions of ASC
740 on January 1, 2007 and did not recognize any additional liability for
unrecognized tax benefits, or accrue any interest or penalties associated with
uncertain tax benefits, as of January 1, 2007. During 2007, 2008, and
2009, UIL Holdings did not recognize any increase in unrecognized tax benefits
as a result of positions taken during any such period or any prior
period. As a result, as of December 31, 2009, UIL Holdings did not
have any unrecognized tax benefits. The Company is not aware of any
event that could occur in the next twelve months that would cause the amount of
unrecognized tax benefits to increase significantly.
UIL
Holdings’ policy is to recognize interest accrued, and penalties associated
with, uncertain tax positions as a component of operating
expense. During 2009, 2008, and 2007, no interest or penalties
associated with uncertain tax positions were recognized, and as of each of
December 31, 2009 and 2008, no interest or penalties are reflected in the
Consolidated Balance Sheet.
Revenues
Regulated
utility revenues for UI are based on authorized rates applied to each customer’s
use of electricity. These retail rates are approved by the DPUC and
can be changed only through formal proceedings. Transmission revenues
are federally regulated by the FERC.
UI
utilizes a customer accounting software package integrated with the network
meter reading system to estimate unbilled revenue (installation
method). The installation method allows for the calculation of
unbilled revenue on a customer-by-customer basis, utilizing actual daily meter
readings at the end of each month to calculate consumption and pricing for each
customer. A significant portion of utility retail kilowatt-hour
consumption is read through the network meter reading system. For
those customers still requiring manual meter readings, consumption is estimated
based upon historical usage and actual pricing for each customer.
Comprehensive
Income
Comprehensive
income was equal to net income for the year ended December 31,
2009. Comprehensive income for the two years ended December 31, 2008
and 2007 was equal to net income, less an immaterial amount, after-tax,
resulting from an interest rate cap mark-to-market adjustment related to $64.5
million principal amount of Pollution Control Refunding Revenue
Bonds.
Cash
and Temporary Cash Investments
For cash
flow purposes, UIL Holdings considers all highly liquid debt instruments with a
maturity of three months or less at the date of purchase to be cash and
temporary cash investments.
- 52 -
UIL
HOLDINGS CORPORATION
NOTES TO CONSOLIDATED FINANCIAL
STATEMENTS - (continued)
Restricted
Cash
UI’s
restricted cash at December 31, 2009 and 2008 totaled $3.7 million and $11.1
million, respectively, which primarily relates to certain retention amounts
concerning the Middletown/Norwalk Transmission Project (the “Project”) which
have been withheld by UI and will remain in place until the verification of
fulfillment of contractor obligations.
Equity
Investments
UI’s
investment in the Connecticut Yankee Atomic Power Company (Connecticut Yankee),
a retired nuclear generating company in which UI has a 9.5% stock interest, is
accounted for on an equity basis. This net investment amounted to
$0.3 million and $1.2 million at December 31, 2009 and 2008,
respectively. UI received a dividend from Connecticut Yankee in April
2009 and a stock redemption of $0.6 million in October 2009. The
Connecticut Yankee nuclear unit was retired in 1996 and has been
decommissioned. See Note (J), “Commitments and Contingencies -
Connecticut Yankee Atomic Power Company.”
In
February 2008, UI and an NRG affiliate formed GenConn Energy LLC (GenConn), a
50-50 joint venture, for the purpose of constructing peaking generation in
Connecticut. UI’s investment in GenConn is being accounted for as an
equity investment, the carrying value of which is immaterial as of December 31,
2009. Upon attainment of commercial operation, which is scheduled for
June 2010 and June 2011 for the Devon and Middletown plants, respectively,
amounts loaned by UI to GenConn will be converted to equity.
Pension
and Other Postretirement Benefits
UIL
Holdings accounts for pension plan costs and other postretirement benefits,
consisting principally of health and life insurance, in accordance with the
provisions of ASC 715 “Compensation - Retirement Benefits”. See –
Note (G), Pension and Other Benefits.
Impairment
of Long-Lived Assets and Investments
ASC 360
“Property, Plant, and Equipment” requires the recognition of impairment losses
on long-lived assets when the book value of an asset exceeds the sum of the
expected future undiscounted cash flows that result from the use of the asset
and its eventual disposition. If impairment arises, then the amount
of any impairment is measured based on discounted cash flows or estimated fair
value.
ASC 360
also requires that rate-regulated companies recognize an impairment loss when a
regulator excludes all or part of a cost from rates, even if the regulator
allows the company to earn a return on the remaining costs
allowed. Under this standard, the probability of recovery and the
recognition of regulatory assets under the criteria of ASC 980 must be
assessed on an ongoing basis. As described in ASC 980 earlier in this
section, determination that certain regulatory assets no longer qualify for
accounting as such could have a material impact on the financial condition of
both UI and UIL Holdings. At December 31, 2009, UI, as a
rate-regulated entity, did not have any assets that were impaired under this
standard.
Discontinued
Operations / Assets Held for Sale
Under ASC
360, a long-lived asset or group of assets (disposal group) is classified as
discontinued operations when (1) the company commits to a plan to sell the
long-lived asset (disposal group) within a 12-month period, (2) there will be no
significant continuing involvement following the sale, and (3) certain other
criteria set forth in the statement are satisfied. In such a
case:
|
·
|
The
long-lived asset (disposal group) will be measured at the lower of its
carrying value or fair value, less costs to sell, and will be classified
as held for sale on the Consolidated Balance
Sheet.
|
|
·
|
The
long-lived asset (disposal group) will not be depreciated (amortized)
while it is classified as held for
sale.
|
|
·
|
The
related operations of the long-lived asset (disposal group) will be
reported as discontinued operations in the Consolidated Statement of
Income, with all comparable periods
restated.
|
|
·
|
The
operations and cash flows of the disposal group are expected to be
eliminated from ongoing
operations.
|
- 53 -
UIL
HOLDINGS CORPORATION
NOTES TO CONSOLIDATED FINANCIAL
STATEMENTS - (continued)
In April
2006, UIL Holdings classified its wholly-owned subsidiary, Xcelecom as held for
sale. Major classes of assets and liabilities of the discontinued
operations of Xcelecom consist of: current assets of $3.7 million, consisting
primarily of receivables; and current liabilities of $4.6 million, consisting
mainly of accrued insurance payables.
Earnings
per Share
The
following table presents a reconciliation of the basic and diluted earnings per
share calculations for the years 2009, 2008 and 2007:
|
Income
Applicable to
|
Average
Number of
|
Earnings
|
||||||||||
|
Common
Stock
|
Shares
Outstanding
|
per
Share
|
||||||||||
|
(In
Thousands, except per share amounts)
|
||||||||||||
|
2009
|
||||||||||||
|
Income
from Continuing Operations
|
$ | 54,459 | 28,027 | $ | 1.94 | |||||||
|
Discontinued
Operations, Net of Tax
|
(142 | ) | 28,027 | - | ||||||||
|
Net
Income
|
54,317 | 28,027 | 1.94 | |||||||||
|
Effect
of Dilutive Securities (1)
|
- | 246 | (0.01 | ) | ||||||||
|
Diluted
Earnings
|
$ | 54,317 | 28,273 | $ | 1.93 | |||||||
|
2008
|
||||||||||||
|
Income
from Continuing Operations
|
$ | 48,385 | 25,114 | $ | 1.93 | |||||||
|
Discontinued
Operations, Net of Tax
|
(237 | ) | 25,114 | (0.01 | ) | |||||||
|
Net
Income
|
48,148 | 25,114 | 1.92 | |||||||||
|
Effect
of Dilutive Securities (1)
|
- | 363 | (0.03 | ) | ||||||||
|
Diluted
Earnings
|
$ | 48,148 | 25,477 | $ | 1.89 | |||||||
|
2007
|
||||||||||||
|
Income
from Continuing Operations
|
$ | 46,693 | 24,986 | $ | 1.87 | |||||||
|
Discontinued
Operations, Net of Tax
|
(1,996 | ) | 24,986 | (0.08 | ) | |||||||
|
Net
Income
|
44,697 | 24,986 | 1.79 | |||||||||
|
Effect
of Dilutive Securities (1)
|
- | 313 | (0.02 | ) | ||||||||
|
Diluted
Earnings
|
$ | 44,697 | 25,299 | $ | 1.77 | |||||||
|
(1)
|
Reflecting
the effect of dilutive stock options, performance shares and restricted
stock. Dilutive securities diluted earnings from continuing
operations by $0.01, $0.03 and $0.02 per share in 2009, 2008 and 2007,
respectively. Dilutive securities did not dilute the loss from
discontinued operations in 2009, 2008 or
2007.
|
Options
to purchase 140,152 and 316,035 shares of common stock were outstanding during
2009 and 2008, respectively, but were not included in the computation of diluted
earnings per share because the options’ exercise prices were greater than the
average market price of the common shares during such
period. Outstanding options to purchase shares of common stock
outstanding were included in the computation of diluted earnings per share for
the year ended December 31, 2007.
Stock-Based
Compensation
Under the
UIL Holdings 1999 Amended and Restated Stock Plan (Plan), UIL Holdings
implemented a performance-based long-term incentive arrangement pursuant to
which certain members of management have the opportunity to earn a
pre-determined number of performance shares, the number of which is predicated
upon the achievement of various pre-defined performance
measures. These performance shares vest at the end of the three-year
cycle with the actual issuance of UIL Holdings’ common stock in respect of such
shares following the end of each three-year cycle. A new three-year
cycle begins in January of each year.
- 54 -
UIL
HOLDINGS CORPORATION
NOTES TO CONSOLIDATED FINANCIAL
STATEMENTS - (continued)
UIL
Holdings records compensation expense for these performance shares ratably over
the three-year period (except in the case of retirement-eligible employees, for
whom compensation expense is immediately recognized in accordance with ASC 718
“Compensation – Stock Compensation”) based on the value of the expected payout
at the end of each year relative to the performance measures
achieved. An additional $0.6 million of compensation expense was
recorded in the first quarter of 2009 with respect to retirement-eligible
employees based on the application of ASC 718 retirement-eligible
provisions.
A target
amount of 104,320 performance shares was granted in March 2009; the average of
the high and low market price on the date of grant was $22.34 per
share. In March 2009, upon the vesting of performance shares
previously granted, 28,188 shares were issued to members of management and
receipt of 18,873 shares was deferred as stock units. The number of
shares that ultimately will be issued is subject to the personal income tax
elections of the applicable employees.
In March
2009, UIL Holdings granted a total of 3,333 shares of restricted stock to its
President and Chief Executive Officer (CEO), James P. Torgerson, under the Plan
and in accordance with his employment agreement; the average of the high and low
market price on the date of grant was $22.34 per share. Compensation
expense for this restricted stock is recorded ratably over the five-year vesting
period for such restricted stock.
In March
2009, UIL Holdings granted a total of 44,020 shares of restricted stock to
non-executive directors under the Plan; the average of the high and low market
price on the date of grant was $22.34 per share. Compensation expense
for this restricted stock is recorded ratably over the three-year vesting period
for such restricted stock (except in the case of retirement-eligible directors,
for whom compensation expense is immediately recognized in accordance with ASC
718 Compensation-Stock Compensation) based on the value of the expected payout
at the end of each year. In March 2009, 20,000 shares of
previously-granted restricted stock grants to directors vested, of which 8,000
shares were issued to directors who had not elected to have their vested shares
deferred as stock units.
Compensation
expense of $1.3 million, $1.1 million and $0.8 million, was recognized for the
years ended December 31, 2009, 2008 and 2007, respectively, related to
the aforementioned restricted stock.
As of
December 31, 2009 and 2008, UIL Holdings had 168,399 and 133,738 shares and
deferrals of restricted stock with a weighted average grant price of $28.88
per share and $31.35 per share, respectively. In 2009 and 2008,
12,692 shares and 14,692 shares, respectively, of restricted stock previously
granted to executives and directors vested.
New
Accounting Standards
ASC 105
“Generally Accepted Accounting Principles” establishes the ASC as the source of
authoritative accounting principles recognized by the FASB to be applied by
nongovernmental entities in the preparation of financial statements in
conformity with generally accepted accounting principles. ASC 105 is
effective for financial statements issued for interim and annual periods ending
after September 15, 2009 and has impacted financial statement disclosures
referencing authoritative accounting guidance. Such references are in accordance
with the new codification. There was no impact on UIL Holdings’
consolidated financial statements.
ASC 810
“Consolidation” requires, for fiscal years, and interim periods within those
fiscal years, beginning on or after December 15, 2008, noncontrolling interest
or “minority interest” to be clearly identified in the equity section of the
Consolidated Balance Sheet, and income attributable to the noncontrolling
interest to be presented separately on the face of the Consolidated Statement of
Income (Loss). These requirements did not have an impact on UIL
Holdings’ Consolidated Balance Sheet, Consolidated Statement of Income or
Consolidated Statement of Cash Flows. ASC 810 “Consolidation” also
requires an enterprise to perform an analysis to determine whether the
enterprise’s variable interest or interests give it a controlling financial
interest in a variable interest entity. These requirements are
effective as of the beginning of the first annual reporting period that begins
after November 15, 2009, for interim periods within that first annual
reporting period, and for interim and annual periods thereafter. This
guidance is not expected to have a material impact on UIL Holdings’ Consolidated
Balance Sheet, Consolidated Statement of Income or Consolidated Statement of
Cash Flows.
- 55 -
UIL
HOLDINGS CORPORATION
NOTES TO CONSOLIDATED FINANCIAL
STATEMENTS - (continued)
ASC 860
“Transfers and Servicing” must be applied as of the beginning of the first
annual reporting period that begins after November 15, 2009, for interim periods
within that first annual reporting period, and for interim and annual periods
thereafter. This statement is not expected to have an impact on UIL
Holdings’ Consolidated Balance Sheet, Consolidated Statement of Income or
Consolidated Statement of Cash Flows.
For
interim or annual financial periods ending after June 15, 2009, ASC 855
“Subsequent Events” requires an entity to disclose the date through which
subsequent events have been evaluated, as well as whether that date is the date
the financial statements were issued or the date the financial statements were
available to be issued. This requirement resulted in additional
disclosure in the Notes to Consolidated Financial Statements but did not have an
impact on UIL Holdings’ Consolidated Balance Sheet, Consolidated Statement of
Income or Consolidated Statement of Cash Flows.
ASC 805
“Business Combinations” requires, for fiscal years beginning on or after
December 15, 2008, an acquirer to recognize the assets acquired, the
liabilities assumed, and any noncontrolling interest in the acquired entity to
be measured at fair value at the acquisition date. In addition,
acquisition-related costs must be expensed in the periods in which the costs are
incurred and the services received. ASC 805 defines the
acquirer as the entity that obtains control of one or more businesses in the
business combination and establishes the acquisition date as the date that the
acquirer achieves control. These requirements did not have an impact
on UIL Holdings’ Consolidated Balance Sheet, Consolidated Statement of Income or
Consolidated Statement of Cash Flows.
ASC 815
“Derivatives and Hedging” requires, for fiscal years beginning after
November 15, 2008, enhanced disclosures about an entity’s derivative
and hedging activities. These requirements resulted in additional
disclosure in the Notes to Consolidated Financial Statements but did not impact
UIL Holdings’ Consolidated Balance Sheet, Consolidated Statement of Income or
Consolidated Statement of Cash Flows. See Note (C), “Regulatory
Proceedings – Contracts for Differences”, for additional disclosures related to
ASC 815.
ASC 715
“Compensation-Retirement Benefits” requires enhanced disclosures about
postretirement benefit plan assets and is effective for fiscal years ending
after December 31, 2009. This requirement impacts disclosures
only and will not have an impact on UIL Holdings’ Consolidated Balance Sheet,
Consolidated Statement of Income or Consolidated Statement of Cash
Flows.
B) CAPITALIZATION
Common
Stock
On May
20, 2009, UIL Holdings priced a public offering of 4,000,000 shares of common
stock at $21.00 per share. On May 29, 2009, the underwriters of this
public offering of common stock exercised their over-allotment option to
purchase an additional 600,000 common shares on the same terms. Net
proceeds of the offering, including the over-allotment option, were $91.4
million, after expenses and underwriting discounts, and were accounted for as an
addition to common stock on the consolidated balance sheet. The
Company used these proceeds to pay down short-term debt and for general
corporate purposes.
UIL
Holdings had 29,929,591 shares of its common stock, no par value, outstanding at
December 31, 2009 and 25,274,026 shares of its common stock, no par value,
outstanding at December 31, 2008. Included in such shares were
79,121 shares and 64,445 shares of restricted stock as of December 31, 2009 and
2008, respectively, that are not recognized as outstanding for purposes of
calculating basic earnings per share due to such shares not yet being
vested. The shares outstanding as of December 31, 2008 also included
34,926 shares that were unallocated shares held by UI’s 401(k)/Employee Stock
Ownership Plan (KSOP) which were also not recognized as outstanding for purposes
of calculating basic earnings per share. UI loaned $11.5 million to
the KSOP to purchase shares in open market transactions. The shares
were allocated to employees’ KSOP accounts as the loan was repaid and
compensation expense was recorded upon allocation based on the fair market value
of the stock. The loan was repaid by the KSOP over a 12-year period
ending October 1, 2009, using employer contributions and dividends
paid on the unallocated shares of the stock held by the
KSOP. Dividends on allocated shares were charged to retained
earnings.
- 56 -
UIL
HOLDINGS CORPORATION
NOTES TO CONSOLIDATED FINANCIAL
STATEMENTS - (continued)
In
addition to the outstanding shares, as of December 31, 2009, 126,036 shares of
restricted stock and performance shares, the receipt of which was deferred by
the recipients, have vested and are recognized as outstanding for purposes of
calculating basic earnings per share.
|
Stock
option transactions for 2009, 2008 and 2007 are as
follows:
|
||||||||||||
|
Average
|
||||||||||||
|
Number
|
Option
Price
|
Exercise
|
||||||||||
|
of
Options
|
per
Share
|
Price
|
||||||||||
|
Balance
- December 31, 2006
|
458,346 | $ | 21.68-$34.52 | $ | 31.40 | |||||||
|
Granted
|
- | N/A | N/A | |||||||||
|
Forfeited
|
- | N/A | N/A | |||||||||
|
Exercised
|
(1,098 | ) | $ | 24.20-$28.12 | $ | 27.51 | ||||||
|
Balance
– December 31, 2007
|
457,248 | $ | 21.68-$34.52 | $ | 31.40 | |||||||
|
Granted
|
- | N/A | N/A | |||||||||
|
Forfeited
|
(7,500 | ) | N/A | N/A | ||||||||
|
Exercised
|
(46,276 | ) | $ | 21.68-$27.11 | $ | 25.19 | ||||||
|
Balance
– December 31, 2008
|
403,472 | $ | 21.68-$34.52 | $ | 32.07 | |||||||
|
Granted
|
- | N/A | N/A | |||||||||
|
Forfeited
|
(234,971 | ) | N/A | N/A | ||||||||
|
Exercised
|
- | N/A | N/A | |||||||||
|
Balance
– December 31, 2009
|
168,501 | $ | 21.68-$34.51 | $ | 30.32 | |||||||
|
Exercisable
at December 31, 2007
|
454,470 | $ | 21.68-$34.52 | $ | 31.41 | |||||||
|
Exercisable
at December 31, 2008
|
403,472 | $ | 21.68-$34.52 | $ | 32.07 | |||||||
|
Exercisable
at December 31, 2009
|
168,501 | (1) | $ | 21.68-$34.51 | $ | 30.32 | ||||||
|
(1) The
intrinsic value of exercisable stock options at December 31, 2009 was $0.1
million.
|
As of
December 31, 2009, 2008 and 2007, the weighted-average remaining
contractual lives for those options outstanding were 2.0 years, 2.5 years, and
3.2 years, respectively.
As of
December 31, 2009, total stock option compensation costs were zero, performance
share costs were $2.8 million, and restricted stock costs related to non-vested
awards not yet recognized were $1.5 million. The weighted-average
period over which the stock option compensation costs, performance-share cost
and restricted stock cost will be recognized is zero months, 10 months and 12
months, respectively.
Cash
received from options exercised under all share-based payment arrangements for
the years ended December 31, 2009, 2008 and 2007, was zero, $1.2
million and an immaterial amount, respectively. The actual tax
benefit realized for the tax deductions from the exercises totaled zero, $0.2
million and an immaterial amount, respectively.
The
shares issued to non-employee directors are drawn from the Non-Employee Director
Common Stock and Deferred Compensation Plan or the 2008 Stock and Incentive
Compensation Plan. Employee performance shares and options had
previously been drawn from the 1999 Amended and Restated UIL Holdings
Corporation Stock Plan and were drawn from the 2008 Stock and Incentive
Compensation Plan beginning in 2009.
- 57 -
UIL
HOLDINGS CORPORATION
NOTES TO CONSOLIDATED FINANCIAL
STATEMENTS - (continued)
|
Long-Term
Debt
|
||||||||
|
December
31,
|
||||||||
|
2009
|
2008
|
|||||||
|
(In
Thousands)
|
||||||||
|
Pollution
Control Revenue Refunding Bonds:
|
||||||||
|
5.75%,
1996 Series, due June 1, 2026 (1)
|
$ | 7,500 | $ | 7,500 | ||||
|
3.65%,
1997 Series, due July 1, 2027 (2)
|
27,500 | 27,500 | ||||||
|
7.13%,
1997 Series, due July 1, 2027 (3)
|
71,000 | 71,000 | ||||||
|
6.88%,
1999 Series, due December 1, 2029 (4)
|
25,000 | - | ||||||
|
Auction
Rate, 2003 Series, due October 1, 2033 (5)
|
64,460 | 64,460 | ||||||
|
Notes:
|
||||||||
|
4.89%
Senior Notes, Series B, due December 12, 2009
|
- | 51,000 | ||||||
|
7.23%
Senior Notes, Series A, due February 15, 2011
|
8,572 | 12,857 | ||||||
|
7.38% Senior
Notes, Series B, due February 15, 2011
|
45,000 | 45,000 | ||||||
|
6.06%
Senior Notes, Series A, due September 5, 2017
|
40,000 | 40,000 | ||||||
|
6.06%
Senior Notes, Series B, due December 6, 2017
|
30,000 | 30,000 | ||||||
|
6.46%
Senior Notes, Series A, due November 3, 2018
|
50,000 | 50,000 | ||||||
|
6.51%
Senior Notes, Series B, due December 1, 2018
|
50,000 | 50,000 | ||||||
|
6.61%
Senior Notes, Series C, due December 1, 2020
|
50,000 | 50,000 | ||||||
|
6.26%
Senior Notes, Series C, due September 5, 2022
|
44,000 | 44,000 | ||||||
|
6.26%
Senior Notes, Series D, due December 6, 2022
|
33,000 | 33,000 | ||||||
|
5.61%
Senior Notes, due March 10, 2025
|
50,000 | - | ||||||
|
6.51%
Senior Notes, Series E, due September 5, 2037
|
16,000 | 16,000 | ||||||
|
6.51%
Senior Notes, Series F, due December 6, 2037
|
12,000 | 12,000 | ||||||
|
Equity
Bridge Loan
|
107,773 | - | ||||||
|
Long-Term
Debt
|
$ | 731,805 | $ | 604,317 | ||||
|
Less: Current
portion of long-term debt
|
58,256 | 55,286 | ||||||
|
Net
Long-Term Debt
|
$ | 673,549 | $ | 549,031 | ||||
|
(1)
|
The
interest rate on these Bonds was fixed at 3.00% on February 1, 2004
for a five-year period ending February 1, 2009. On
February 2, 2009, these Bonds were remarketed, and the interest rate was
set at 5.75% for a three-year period ending
February 1, 2012.
|
|
(2)
|
The
interest rate on these Bonds was fixed at 3.65% on February 1, 2005
for a five-year period ending February 1, 2010. On
February 1, 2010, the Bonds were refunded with the proceeds from the
issuance of $27.5 million of tax-exempt bonds on January 28, 2010 at an
interest rate of 4.5% for a five-year, 5-month period ending
July 1, 2015.
|
|
(3)
|
The
interest rate on these Bonds was fixed at 3.50% on February 2, 2004
for a five-year period ending February 1, 2009. On
February 2, 2009, these Bonds were remarketed, and the interest rate was
set at 7.125% for a three-year period ending
February 1, 2012.
|
|
(4)
|
The
interest rate on these Bonds was fixed at 3.25% on February 5, 2003
for a four-year, 10-month period ending
December 3, 2007. On December 3, 2007, the interest
rate was reset from 3.25% to 3.90% for a one-year period ending December
1, 2008. On December 1, 2008, UI purchased the
Bonds. See the discussion below for additional information on
the Bonds.
|
|
(5)
|
The
interest rate on these Bonds is reset through an auction held every 35
days. On December 28, 2009, the interest rate on the Bonds
was 0.463%.
|
The fair
value of UIL Holdings’ long-term debt was $759.4 million and $588.8 million as
of December 31, 2009 and 2008, respectively, which was estimated by UIL
Holdings’ investment bankers based on market conditions. The expenses
to issue long-term debt are deferred and amortized over the life of the
respective debt issue or the fixed interest-rate period in the case of Pollution
Control Revenue Refunding Bonds.
- 58 -
UIL
HOLDINGS CORPORATION
NOTES TO CONSOLIDATED FINANCIAL
STATEMENTS - (continued)
Information
regarding maturities and mandatory redemptions/repayments are set forth
below:
|
2010
|
2011
|
2012
|
2013
|
2014 &
thereafter
|
|
|
(In
Thousands)
|
|||||
|
Maturities
|
$58,256
|
$103,089
|
$-
|
$-
|
$570,460
|
UI
remarketed $78.5 million of tax-exempt bonds in February 2009, $7.5 million of
which were remarketed at a fixed interest rate of 5.75% for three-years and $71
million of which were remarketed for a fixed interest rate of 7.13% for three
years. In March 2009, $25 million of tax-exempt bonds were refunded
with proceeds from the issuance of $25 million of tax-exempt bonds at a fixed
interest rate of 6.88% for three years. In December 2009, UI
issued $50 million of debt with a maturity date of March 10, 2025 at a fixed
interest rate of 5.61%. On February 1, 2010, $27.5 million of
tax-exempt bonds were refunded with the proceeds from the issuance of $27.5
million of tax-exempt bonds on January 28, 2010, at a fixed interest rate
of 4.5% for five years and five months.
On April
27, 2009, UI closed on a bank financing in the amount of $121.5 million with a
syndicate of banks (the Equity Bridge Loan or EBL), the proceeds of which will
be used by UI to fund its commitments as a 50% owner of GenConn. UI
expects that GenConn will direct approximately $57 million of such amount to
GenConn Devon LLC (GenConn Devon) and approximately $64.5 million to GenConn
Middletown LLC (GenConn Middletown), each of which is a wholly owned subsidiary
of GenConn, for use in the construction of peaking generation facilities by
those entities. UI will draw on this facility as needed to fund its
commitments to GenConn as construction progresses. UI does not have
any further funding commitments to GenConn at this time and does not guarantee
any of GenConn’s obligations. Borrowings under this facility as of
December 31, 2009 were $107.8 million.
GenConn
obtained project financing on April 27, 2009 in a separate transaction that
makes $243 million available to GenConn for construction and related activities,
and $48 million available under a working capital facility (collectively, the
Project Financing). UI expects that those funds, together with the
funds committed by UI and GenConn’s other 50% owner, NRG Energy, will be
sufficient to allow GenConn to complete the construction of its planned peaking
generation facilities.
The EBL
must be repaid upon the earlier of its maturity date or the attainment of
commercial operation, which is expected to be June 2010 for GenConn Devon and
June 2011 for GenConn Middletown. The initial maturity date of the
loan is April 27, 2010, and may be extended to June 1, 2011, so long as on the
date of extension project construction is continuing and the Project Financing
is not due and payable.
As a
result of GenConn obtaining the Project Financing, UIL Holdings’ obligations
were terminated under guarantee agreements it had made with an affiliate of
General Electric Company (GE) in connection with the purchase of GE turbines by
GenConn Devon and GenConn Middletown.
(C) REGULATORY
PROCEEDINGS
Connecticut
Department of Public Utility Control (DPUC)
Rates
In
rulings throughout 2009, the DPUC issued its final decision regarding UI’s
application requesting an increase in distribution rates (the “2009 Decisions”),
the results of which included a $6.8 million increase in revenue requirements
for 2009, compared to 2008. Because a larger, previously approved
increase in revenue requirements for 2009 had gone into effect
January 1, 2009, UI returned approximately $0.97 million to ratepayers
through a one-time adjustment in April 2009.
- 59 -
UIL
HOLDINGS CORPORATION
NOTES TO CONSOLIDATED FINANCIAL
STATEMENTS - (continued)
The 2009
Decisions provided for an allowed distribution return on equity of 8.75%, a
decrease from the previously approved 9.75%, and a capital structure of 50%
equity and 50% debt, compared to the previously approved 48% equity and 52%
debt. The 2009 Decisions continued the prior earnings sharing
mechanism structure, applying to the new 8.75% allowed return, whereby 50% of
any earnings over the allowed twelve month level is returned to customers and
50% is retained by UI. Given the effective date of the 2009
Decisions, UI’s weighted average allowed distribution return on equity for 2009
was 8.84%. Additionally, the 2009 Decisions provided for full revenue
decoupling of distribution revenues from sales, recovery of updated pension and
postretirement expense for 2010, a partial reconciliation for the as-issued cost
of new debt, and an additional increase in distribution revenue requirements of
$19.4 million for 2010.
The 2009
Decisions also provided for the establishment of a regulatory asset to address
the portion of the actual increase in pension and postretirement expense for
2009 and 2010 that was not included in rates. For 2009, a $10.2
million regulatory asset was approved and established, for which full recovery
in 2010 rates was subsequently approved by the DPUC; accordingly, it will be
removed from rates effective February 4, 2011. The DPUC
also approved the 2010 cash recovery of $11.4 million for UI’s current estimate
of 2010 pension and postretirement expense not previously included in
rates.
In
December 2009, UI received a letter ruling approving rates effective January 1,
2010 incorporating the above mentioned distribution rate changes along with
previously approved changes to the Generation Services Charges (GSC),
Non-Bypassable Federally Mandated Congestion Charges (NBFMCC), transmission and
system benefits charge resulting in no change in the total rate for a
residential Rate R customer with standard service
generation. Additionally, last resort service GSC rates for the
January 1, 2010 through March 31, 2010 time period were
approved.
Approval of the Issuance of
Debt
On
February 18, 2009, the DPUC approved an application filed by UI to afford UI
additional flexibility to market outstanding tax-exempt bonds in the municipal
bond market. Specifically, UI requested approval to refund with the
proceeds of the issuance of new bonds, without insurance, $25.0 million, $27.5
million and $64.5 million principal amount of tax-exempt bonds
outstanding. In December 2008, UI purchased $25.0 million principal
amount of tax-exempt bonds, which were refunded with the proceeds from the
issuance, without insurance, of $25.0 million tax-exempt bonds in March
2009. On January 28, 2010, $27.5 million principal amount of a
tax-exempt bonds were issued without insurance, the proceeds of which were used
to refund $27.5 million principal amount of insured bonds on February 1,
2010. UI plans to refund $64.5 million principal amount of Auction
Rate Bonds at such time and on such terms as municipal bond market conditions
allow. For further information, refer to Part I, Item 7A,
“Quantitative and Qualitative Disclosures About Market Risk.”
Generation
GenConn
is a 50-50 joint venture of UI and NRG. In 2008, the DPUC selected
two projects proposed by GenConn to help address Connecticut’s growing need for
more power generation during the heaviest load periods.
Two
peaking generation projects, each with a nominal capacity of 200 megawatts (MW),
are being constructed at NRG’s existing Connecticut plant locations in Devon and
Middletown. GenConn’s Devon plant is scheduled to be in commercial
operation by June 2010, and its Middletown plant is scheduled to be in
commercial operation by June 2011. As a regulated company,
GenConn recovers its costs under a contract for differences (CfD) agreement
which is cost of service based. GenConn has signed CfDs for both
projects with CL&P. The cost of the contracts will be paid by
customers and will be subject to a cost-sharing agreement whereby approximately
20% of the cost is borne by UI customers and approximately 80% by CL&P
customers.
Given the
anticipated commercial operation date for the Devon plant of June 2010, GenConn
filed its required rate case request with the DPUC in December 2009 seeking
approval of 2010 revenue requirements.
- 60 -
UIL
HOLDINGS CORPORATION
NOTES TO CONSOLIDATED FINANCIAL
STATEMENTS - (continued)
As a
result of changed market conditions and updated cost information, GenConn
project costs have increased over the proposal it had originally submitted to
the DPUC. The increase was driven primarily by increased financing
costs and the cost to build interconnection facilities at the Middletown
site. The DPUC has ruled that prudently incurred financing costs,
interconnection costs and taxes will be recoverable and, therefore, GenConn
expects to recover such costs. The CfDs will provide for a true-up of
revenue from the ISO New England (ISO-NE) markets in which GenConn participates
to DPUC approved revenue requirements.
Other
UI
generally has several regulatory proceedings open and pending at the DPUC at any
given time. Examples of such proceedings include an annual DPUC
review and reconciliation of UI’s Competitive Transition Assessment (CTA) and
Systems Benefits Charges (SBC) revenues and expenses, dockets to consider
specific restructuring or electricity market issues, consideration of specific
rate or customer issues, and review of conservation programs.
UI files
semi-annual true-ups with the DPUC regarding Bypassable Federally Mandated
Congestion Charges (BFMCC) and NBFMCC. These customer charges relate
to “congestion costs” associated with not having adequate transmission
infrastructure to move energy from the generating sources to the consumer and
costs associated with maintaining the reliability of electric service, such as
Reliability-Must-Run (RMR) contracts with generators. These costs
change from time to time and the semi-annual true-ups provide a mechanism for
the electric distribution companies to adjust the charges to customers that
allow the companies to recover the Federally Mandated Congestion Charges
(FMCC).
In June
2008, the State of Connecticut defeased outstanding rate reduction bonds which
were originally issued by the state in 2004 for the purpose of securitizing a
portion of customer revenues intended for the Conservation and Load Management
(C&LM) and REI funds. Prior to the defeasance, debt servicing for
these bonds was provided for through a reduction to the C&LM and REI charges
and a corresponding increase in the CTA charge on customers’
bills. The defeasance of these bonds restored approximately $6.5
million of annual revenues to UI which were specifically designated for the
C&LM and REI funds to be utilized for C&LM or REI
expenditures.
Pension
and Postretirement Expenses
In
response to the Internal Revenue Service (IRS) mandated change in mortality
tables utilized for certain Employee Retirement Income Security Act of 1974
(ERISA)-related liability calculations, effective January 1, 2007, the DPUC
allowed regulatory treatment for the change in pension and postretirement
expenses resulting from the use of the new mortality tables. In the
2009 Decision, the DPUC approved the recovery of these expenses over a four-year
period beginning in 2009. As of December 31, 2009, the remaining
regulatory asset was approximately $3.2 million.
The 2009
Decision also provides for the establishment of an annual regulatory asset to
address a portion of the actual increase in pension and postretirement expense
for each of 2009 and 2010. As of December 31, 2009, UI has recorded a
regulatory asset of approximately $10.2 million which will be recovered
fully in 2010. Additionally, $11.4 million will be included in rates
in 2010 for UI’s estimate of 2010 pension and postretirement
expense.
- 61 -
UIL
HOLDINGS CORPORATION
NOTES TO CONSOLIDATED FINANCIAL
STATEMENTS - (continued)
Legislation
& Regulation
Background
From time
to time, state legislation impacts the operation of the electric utility
industry in Connecticut. The electric industry in Connecticut was
significantly restructured commencing in 1998. Legislation enacted
since then (as described below) continues to address various energy
issues. There was no significant legislation passed in 2008 and 2009
concerning the utility industry.
Electric
Restructuring As a result of Public Act 98-28, Public Act
03-135, as amended in part by Public Act 03-221, Public Act 05-1 (June Special
Session), and Public Act 07-242 (collectively, the Restructuring
Legislation), UI’s distribution and transmission rates are “unbundled” on
customers’ bills, which also include separate charges for the Competitive
Transition Assessment (CTA), Generation Services Charge (GSC), a combined public
benefits charge that includes the
C&LM charge, Renewable Energy Investment (REI) charge, and Systems Benefits
Charge (SBC), and Federally Mandated Congestion Charges (FMCCs), each as defined
in the Restructuring Legislation.
Transitional Standard Offer
Incentive The 2003 legislation provided for the DPUC to
establish an incentive plan for the procurement of long-term contracts for
transitional standard offer service that compares UI’s actual average contract
price to a regional average price for electricity, making adjustments as deemed
appropriate by the DPUC. If UI’s price was lower than the average,
the legislation provided for the plan to allocate $0.00025/kilowatt-hour of
transitional standard offer service to the distribution company. The
DPUC issued a final decision in January 2009 that found UI was not eligible for
a procurement incentive for 2004. UI appealed the DPUC’s final
decision to the state superior court. By decision filed February 5,
2010, the superior court determined that the DPUC did not apply the proper
standard in determining whether UI qualified for the incentive and that the DPUC
made other errors, and remanded the case to the DPUC for further proceeding in
accordance with the court's decision.
Energy Independence
Act In July 2005, the Energy Independence Act (EIA) became law
in Connecticut. The EIA in large part provides for incentives to
promote the development of projects and resources that are intended to reduce
FMCCs and provides that electric distribution companies will recover their costs
and investments resulting from the law through a number of mechanisms, including
the FMCC on customers’ bills.
2007 Energy
Act In July 2007, the 2007 Energy Act became law in
Connecticut. The 2007 Energy Act contains numerous provisions
primarily regarding the electric industry. The 2007 Energy Act
resulted in the DPUC’s selection of certain peaking generation projects
(including GenConn’s proposal to build capacity at NRG’s existing plants in
Middletown and Devon). Pursuant to the 2007 Energy Act, UI continues
to work with CL&P and the Connecticut Energy Advisory Board (CEAB) in the
development of an energy assessment and resource plan that is submitted by the
CEAB to the DPUC.
2005 Transportation
Act In July 2005, the 2005 Transportation Act, became law in
Connecticut. Section 28 of this legislation, provides that the state
shall bear no part of the cost to readjust, relocate or remove an electric
transmission line buried within a public highway right-of-way where such action
is required by a state highway project, but also provides that the state shall
consider such costs in selecting a final project design in order to minimize the
overall cost incurred by the state and the electric distribution
company. As a result, the electric distribution company’s costs of
readjustment, relocation or removal will be included in tariffs, for collection
from customers.
Transmission Adjustment
Clause The DPUC has approved a transmission adjustment clause
(TAC) for UI, implementing the provisions of Section 30 of the 2005
Transportation Act, to establish a “transmission tracker” mechanism by which the
DPUC adjusts an electric distribution company’s retail transmission rate
periodically to “track” and recover the transmission costs, rates, tariffs and
charges approved by the FERC. UI makes a semi-annual filing with the
DPUC, setting forth its actual transmission revenues, projected transmission
revenue requirement, and the required TAC charge or credit so that any under- or
over-collections of transmission revenues from prior periods are reconciled
along with the expected revenue requirements for the next six months from
filing. The DPUC holds an administrative
- 62 -
UIL
HOLDINGS CORPORATION
NOTES TO CONSOLIDATED FINANCIAL
STATEMENTS - (continued)
proceeding
to approve the TAC charge or credit and holds a hearing to determine the
accuracy of customer billings under the TAC. The TAC tariff and this
semi-annual change of the TAC charge or credit mitigates the lag between changes
in UI’s FERC-approved transmission revenue requirements and its retail
transmission rate and facilitates the timely matching of transmission revenues
and transmission revenue requirements.
Energy Policy
Act In August 2005, the Energy Policy Act of 2005 (Energy
Policy Act) became federal law. Title XII of the Energy Policy Act
included provisions that impact UIL Holdings, such as the repeal of the Public
Utility Holding Company Act (PUHCA) of 1935 and the enactment of PUHCA 2005, and
numerous provisions that may affect UI, some of which include (1) reducing
depreciable lives for newly constructed electric transmission lines, (2)
establishing an electric reliability organization responsible for reliability
standards, subject to FERC jurisdiction, approval and enforcement, (3)
authorizing limited FERC backstop siting authority for interstate transmission
projects in federally designated transmission corridors, (4) requiring the FERC
to issue a rule that provides transmission rate incentives to promote capital
investment and provides for recovery of all prudent costs of complying with
mandatory reliability standards and costs related to transmission infrastructure
development, (5) prohibiting energy market manipulation and vesting the FERC
with enhanced authority to impose penalties for violations of the FPA; and (6)
revising the regulation of Cogeneration and Qualifying Facilities under the
Public Utility Regulatory Policies Act of 1978 (PURPA).
Power Supply
Arrangements
UI’s
retail electricity customers are able to choose their electricity
supplier. Since January 1, 2007, UI has been required to offer
standard service to those of its customers who do not choose a retail electric
supplier and have a maximum demand of less than 500 kilowatts. In
addition, UI is required to offer supplier of last resort service to customers
who are not eligible for standard service and who do not choose to purchase
electric generation service from a retail electric supplier licensed in
Connecticut.
UI must
procure its standard service power pursuant to a procurement plan approved by
the DPUC. The procurement plan must provide for a portfolio of
service agreements procured in an overlapping pattern over fixed time periods (a
“laddering” approach). In June 2006, the DPUC approved a procurement
plan for UI. As required by Connecticut statute, a third party
consultant retained by the DPUC works closely with UI in the procurement process
and to provide a joint recommendation to the DPUC as to selected
bids.
UI has
wholesale power supply agreements in place for the supply of all of UI’s
standard service customers for all of 2010, 80% for 2011 and 20% for
2012. Supplier of last resort service is procured on a quarterly
basis. UI determined that its contracts for standard service and
supplier of last resort service are derivatives under Accounting Standards
Codification (ASC) 815 “Derivatives and Hedging” and elected the “normal
purchase, normal sale” exception under ASC 815 “Derivatives and
Hedging”. As such, UI regularly assesses the accounting treatment for
its power supply contracts. These wholesale power supply agreements
contain default provisions that include required performance assurance,
including certain collateral obligations, in the event that UI’s credit rating
on senior debt was to fall below investment grade. In October 2009,
Moody’s Investor Services (Moody’s) released its updated credit opinion for UI
and maintained its Baa2 rating with a stable outlook. In
December 2009, Standard & Poors’ Investor Services (S&P) reinitiated
coverage on UI and rated it BBB with a stable outlook. UI’s credit
rating would have to decline two ratings to fall below investment grade at
either rating service. If this were to occur, monthly amounts due and
payable to the power suppliers would be accelerated to semi-monthly payments and
UI would have to deliver collateral security in an amount equal to the
receivables due to the sellers for the thirty day period immediately preceding
the default notice. If such a situation was in effect as of
December 31, 2009, UI would have had to post approximately $26 million
in collateral.
As a
result of an April 2008 DPUC decision, UI is permitted to seek long-term
contracts for up to 20% of standard service requirements, the goal of which is
to obtain long-term energy supply contracts and Connecticut Class I Renewable
Energy Certificates for UI’s standard service customers that will result in
economic benefit to ratepayers, both in terms of risk and cost
mitigation. UI is exploring long-term contract
alternatives.
- 63 -
UIL
HOLDINGS CORPORATION
NOTES TO CONSOLIDATED FINANCIAL
STATEMENTS - (continued)
Contracts
for Differences
Pursuant
to Connecticut’s 2005 Energy Independence Act (EIA), the DPUC initiated a
process to solicit bids to create new or incremental capacity resources in order
to reduce federally mandated congestion charges, and selected four new capacity
resources. To facilitate the transactions between selected capacity
resources and Connecticut electric customers, and provide the commitment
necessary for owners of these resources to obtain necessary financing, the DPUC
required that UI and CL&P execute long-term contracts with the selected
resources. In August 2007, the DPUC approved four CfDs, each of
which specifies a capacity quantity and a monthly settlement that reflects the
difference between a forward market price and the contract price. As
directed by the DPUC, UI executed two of the contracts and CL&P executed the
other two contracts. In addition, UI has executed a sharing agreement
with CL&P whereby UI pays 20% of the costs and obtains 20% of the benefits
of the contracts.
The DPUC
has determined that costs associated with these CfDs will be recoverable by UI
and CL&P, and in accordance with ASC 980 Regulated Operations, UI has
deferred recognition of costs (a regulatory asset) or has recognized obligations
(a regulatory liability). The above contracts are derivatives and
they, along with the contracts for standard service and supplier of last resort
service discussed in the Power Supply Arrangement discussion above, are the
Company’s only derivative instruments. The CfDs are marked-to-market
in accordance with ASC 815. For those CfDs signed by CL&P, UI
records its approximate 20% portion of CL&P’s derivative, pursuant to the
sharing agreement noted above. As of December 31, 2009, UI
has recorded a gross derivative asset of $30.7 million ($6.3 million related to
its portion of CL&P’s derivative assets), a regulatory asset of $137.7
million, a gross derivative liability of $162.1 million ($131.6 million related
to its portion of CL&P’s derivative liabilities) and a regulatory liability
of $6.3 million in the accompanying Consolidated Balance Sheet. See
Note (K) “Fair Value of Financial Instruments” for additional CfD
information.
The
unrealized gains and losses from mark-to-market adjustments to derivatives
recorded in regulatory assets or regulatory liabilities for the years ended
December 31, 2009 and 2008 were as follows:
|
Year
Ended
|
||||||||
|
December
31,
|
||||||||
|
2009
|
2008
|
|||||||
|
(In
Thousands)
|
||||||||
|
Regulatory
Assets - Contracts for Differences
|
$ | 49,421 | $ | 47,428 | ||||
|
Regulatory
Liabilities - Contracts for Differences
|
$ | (1,515 | ) | $ | (1,919 | ) | ||
- 64 -
UIL
HOLDINGS CORPORATION
NOTES TO CONSOLIDATED FINANCIAL
STATEMENTS - (continued)
The fair
value of the gross derivative assets and liabilities as of December 31, 2009 and
2008 were as follows:
|
December
31, 2009
|
||||||||
|
(In
Thousands)
|
||||||||
|
Deferred
Charges
|
Noncurrent
|
|||||||
|
and
Other Assets
|
Liabilities
|
|||||||
|
Contracts
for differences, gross
|
$ | 30,694 | $ | 162,093 | ||||
|
December
31, 2008
|
||||||||
|
(In
Thousands)
|
||||||||
|
Deferred
Charges
|
Noncurrent
|
|||||||
|
and
Other Assets
|
Liabilities
|
|||||||
|
Contracts
for differences, gross
|
$ | 8,649 | $ | 92,142 | ||||
On
February 7, 2010, an explosion occurred at the construction site of the nearly
completed 620-megawatt plant being built by Kleen Energy Systems, LLC (“Kleen”),
one of the four capacity resources selected by the DPUC to create new or
incremental capacity resources as noted above. As noted above,
CL&P has executed CfDs with two of the selected projects, including the
Kleen project. The CfD with Kleen is subject to the sharing agreement
between UI and CL&P whereby UI pays 20% of the costs and obtains 20% of the
benefits of the contract. The extent of damage and any resulting
delay in the attainment of commercial operation is not now determinable,
therefore, UI cannot presently assess the potential financial
impact. Based on information known to date, it appears to be
reasonably likely that there will be a delay in Kleen's attainment of commercial
operation, which could have a material impact in 2010 on the fair value of the
related regulatory asset and derivative liability that existed on the
Consolidated Balance Sheet as of December 31, 2009 which was based on a
probability-based expected cash flow analysis that was discounted at the
December 31, 2009 risk-free interest rate, and an adjustment for non-performance
risk using credit default swap rates. This event will not have an
impact on UIL Holdings’ Consolidated Statement of Income.
Pursuant
to Connecticut’s 2007 Act Concerning Electricity and Energy Efficiency, the DPUC
initiated a process to create new peaking generation resources to address the
state’s shortage of fast-start peaking generation that is needed to provide
energy reserves. As with the CfDs entered into pursuant to the EIA, the DPUC
required that UI and CL&P execute long-term contracts with the selected
peaking resources to facilitate the transactions and provide the commitment
necessary for the owners of the peaking resources to obtain financing. During
2008, CL&P executed three peaking generation CfDs, one with GenConn relating
to its Devon facility, one with GenConn relating to its Middletown facility and
the other with PSEG Power Connecticut LLC (“PSEG”), to which the sharing
agreement between UI and CL&P described above also applies. These
contracts are not considered to be derivatives under ASC 815 and therefore will
be accounted for on an accrual basis.
New
Renewable Source Generation
Under
Connecticut law, electric distribution companies are required to enter into
contracts to purchase in the future the output of new renewable source
generation totaling at least 150 MW, at prices and upon terms approved by the
DPUC in accordance with statutory requirements. In 2007, one contract
was approved by the DPUC. UI was not a party to that contract but, as
directed by the DPUC, UI has executed a sharing agreement with CL&P whereby
UI pays approximately 20% of the costs and obtains approximately 20% of the
benefits of the contract. This contract will be accounted for on an
accrual basis. In January 2008, the DPUC issued a decision approving
seven projects; UI is a party to contracts relating to two of these
projects. UI signed a contract to purchase, over a fifteen year time
period, 100% of the delivered
- 65 -
UIL
HOLDINGS CORPORATION
NOTES TO CONSOLIDATED FINANCIAL
STATEMENTS - (continued)
products
generated by the Stamford Hospital Fuel Cell Combined Heat and Power Project
which has a 4.8 MW capacity. This contract will be accounted for as
an operating lease. UI also signed a contract to purchase, over a
fifteen year time period, 84.5% of the delivered products generated by the South
Norwalk Bio-Fuel Project which has a 30 MW capacity and which will be accounted
for on an accrual basis. In April 2009, the DPUC approved five
additional fuel cell projects to which accrual accounting will be applied and
for which contracts were executed by CL&P in July 2009. All of
these contracts will be subject to the cost sharing agreement with
CL&P. UI’s costs associated with all such contracts are
recoverable, whether UI is a direct party or pursuant to the sharing
agreement.
Bridgeport
RESCO Generating Facility
Effective
January 2003, UI began selling its energy entitlement from its long-term
purchase power contract with the Bridgeport RESCO generating facility into the
New England wholesale market at market prices. To the extent that UI
received revenue from these sales that exceeded the amount it paid to Bridgeport
RESCO for this energy on a cumulative basis, the difference is used to adjust
the above-market portion of purchase power expense recovered through UI’s
CTA. This methodology was approved by the DPUC, with all relevant
data and calculations subject to review in the annual CTA reconciliation
docket. In June 2008, the Federal Energy Regulatory Commission (FERC)
issued a decision resulting in UI having no future obligation beyond 2008 to
purchase the output of the Bridgeport RESCO Generating Facility. This contract,
which terminated on December 31, 2008, was a derivative under ASC 815
“Derivatives and Hedging” and it had qualified for the “normal purchase, normal
sale” exception under such guidance.
Federal
Energy Regulatory Commission
UI
recovers its transmission revenue requirements on a prospective basis, subject
to reconciliation with actual revenue requirements. In May 2007, the
FERC issued an order which approved UI’s request for the inclusion of 100% of
CWIP in rate base for the 345-kilovolt (kV) transmission line from Middletown,
Connecticut, to Norwalk, Connecticut and approved a 50 basis point adder which
will be applied only to costs of the Project associated with advanced
transmission technologies. For project costs incurred before August
8, 2005, the FERC allowed UI to include 50% of CWIP expenditures in rate base,
and for project costs incurred after August 8, 2005, the FERC allowed UI to
include 100% of CWIP expenditures in rate base. Approximately 60% of
the project costs are associated with the advanced transmission technologies for
which the 50 basis point adder was approved by the FERC. Certain
parties had requested rehearing of the FERC’s May 2007 order, but in January
2009, the FERC denied those requests. Also in January 2009, the DPUC
and the Attorney General of Connecticut filed a petition with the United States
Court of Appeals for the District of Columbia Circuit seeking judicial review of
the FERC’s May 2007 and January 2009 orders. The Company is
unable to predict the outcome of these appeals at this time.
UI is
required to file information regarding Regional Network Service transmission on
an annual basis with the FERC.
ISO-NE
and RTO-NE
ISO New
England, Inc. (ISO-NE), an independent, not-for-profit corporation,
was approved by the FERC as the regional transmission organization for New
England (RTO-NE) on February 1, 2005. ISO-NE is responsible for the
reliable operation of the region’s bulk electric power system and fair
administration of the region’s wholesale electricity
marketplace. ISO-NE also is responsible for the management of the
comprehensive bulk electric power system and wholesale markets’ planning
processes that address the region's electricity needs.
Transmission
Return on Equity (ROE)
In March
2008, the FERC issued an order on rehearing (Rehearing Order) establishing
allowable ROEs for transmission projects of transmission owners in New England,
including UI. In the Rehearing Order, the FERC established the
base-level ROE of 11.14% beginning in November 2006. The Rehearing
Order also confirmed a 50 basis point ROE adder on Pool Transmission Facilities
(PTF) for participation in the RTO-NE and a 100 basis point ROE incentive for
projects
- 66 -
UIL
HOLDINGS CORPORATION
NOTES TO CONSOLIDATED FINANCIAL
STATEMENTS - (continued)
included
in the ISO-NE Regional System Plan that were completed and on line as
of December 31, 2008. The Middletown/Norwalk Transmission Project
received this 100 basis point ROE adder. For projects
placed in service after December 31, 2008, incentives may be requested from the
FERC, through a specific showing justifying the incentive, on a project specific
basis.
In May
2008, several public entities, including the DPUC, filed a petition with the
United States Court of Appeals for the District of Columbia Circuit (U.S. Court
of Appeals) challenging the Rehearing Order. On January 29, 2010, the
U.S. Court of Appeals issued a decision upholding the FERC order.
UI’s
overall transmission ROE is determined by the mix of UI’s transmission rate base
between new and existing transmission assets, and whether such assets are PTF or
non-PTF. UI’s transmission assets are primarily PTF. For
2009, UI’s overall allowed weighted-average ROE for its transmission business
was 12.52%.
Middletown/Norwalk
Transmission Project
In
December 2008, the 345-kilovolt (kV) transmission line from Middletown,
Connecticut, to Norwalk, Connecticut (the Project) was completed and the
transmission assets were placed in service. As a result, UI’s
transmission rate base increased by approximately $300 million, an increase of
more than 200% relative to UI’s net transmission assets existing prior to the
Project receiving approval from the Connecticut Siting Council
(CSC).
In a May
2007 Order, the FERC approved rate incentives for the Project. The
Project was allowed to include Construction Work In Progress (CWIP) expenditures
in rate base. For project costs incurred before August 8, 2005,
the FERC allowed UI to include 50% of CWIP expenditures in rate base, and for
project costs incurred after August 8, 2005, the FERC allowed UI to
include 100% of CWIP expenditures in rate base. The FERC also
accepted a 50 basis point adder which will be applied only to costs associated
with advanced transmission technologies.
Certain
parties requested rehearing of the FERC May 2007 order, but in January 2009, the
FERC denied those requests. Also, in January 2009, the DPUC and
the Attorney General of Connecticut filed a petition with the U.S. Court of
Appeals seeking judicial review of the FERC’s May 2007 and January 2009
orders. UI is unable to predict the outcome of these appeals at this
time.
UI and
CL&P filed a transmission cost allocation application relating to the
Project with ISO-NE in April 2008. ISO-NE will determine which costs
of the Project, if any, will be included in the New England regional
transmission rate. UI will seek to recover any non-pool supported costs of the
Project, or Localized Costs, in transmission revenues from customers throughout
the State of Connecticut.
Other
Transmission
In June
2008, Northeast Utilities (NU) filed amendments to its local transmission
service tariff at the FERC. The revisions charge UI customers a
prorated portion of NU’s Localized Costs for non-pool supported
PTF. These Localized Costs are, in turn, included in UI’s local
transmission tariff and, therefore, recovered through rates. UI made
a similar FERC filing effective in 2009, enabling UI to prorate a portion of its
Localized Costs to CL&P customers.
Transmission
Adjustment Clause
UI makes
a semi-annual transmission adjustment clause (TAC) filing with the DPUC setting
forth its actual transmission revenues, projected transmission revenue
requirement, and the required TAC charge or credit so that any under- or
over-collections of transmission revenues from prior periods are reconciled
along with the expected revenue requirements for the next six months from
filing. The DPUC holds an administrative proceeding to approve the
TAC charge or credit and holds a hearing to determine the accuracy of customer
billings under the TAC. The TAC tariff and this semi-annual change of
the TAC charge or credit facilitates the timely matching of transmission
revenues and transmission revenue requirements.
- 67 -
UIL
HOLDINGS CORPORATION
NOTES TO CONSOLIDATED FINANCIAL
STATEMENTS - (continued)
(D) SHORT-TERM
CREDIT ARRANGEMENTS
UIL
Holdings has a money market loan arrangement with JPMorgan Chase
Bank. This is an uncommitted short-term borrowing arrangement under
which JPMorgan Chase Bank may make loans to UIL Holdings for fixed periods,
depending on UIL Holdings’ credit rating, the Bank’s credit requirements, and
conditions in the financial markets. JPMorgan Securities, Inc. acts
as an agent and sells the loans to investors. As of December 31,
2009, UIL Holdings had no short-term borrowings outstanding under this
arrangement.
UIL
Holdings and UI have a revolving credit agreement with a group of banks that
extends to December 22, 2011. The borrowing limit under the
facility for UI is $175 million, with $50 million of the limit available for UIL
Holdings. The facility permits borrowings at fluctuating interest
rates determined by reference to Citibank’s New York base rate and the Federal
Funds Rate (as defined in the facility), and also permits borrowings for fixed
periods up to six months as specified by UI and UIL Holdings at fixed interest
rates (London Interbank Offered Rate or LIBOR) determined by the Eurodollar
Interbank Market in London. The facility also permits the issuance of
letters of credit up to $50 million.
As of
December 31, 2009, UI had no short-term borrowings outstanding under the
facility. UIL Holdings had a standby letter of credit outstanding in
the amount of $1 million that expired on January 31, 2009, but was and
will continue to be automatically extended for one year from the expiration date
(or any future expiration date), unless the issuer bank elects not to
extend. Available credit under this facility at December 31, 2009 for
UI and UIL Holdings in the aggregate was $174 million. UIL Holdings
records borrowings under this facility as short-term debt, but the agreement has
longer term commitments from banks allowing the Company to borrow and reborrow
funds, at its option, to December 22, 2011, thus affording it
flexibility in managing its working capital requirements.
Information
with respect to short-term borrowings of UIL Holdings and UI is set forth
below:
|
2009
|
2008
|
2007
|
||||||||||
|
($
In Thousands)
|
||||||||||||
|
UIL
Holdings
|
||||||||||||
|
Maximum
aggregate principal amount of short-term borrowing outstanding at any
month-end
|
$ | 6,900 | $ | 5,000 | $ | - | ||||||
|
Average
aggregate short-term borrowings outstanding during the
year*
|
$ | 2,298 | $ | 751 | $ | - | ||||||
|
Weighted
average interest rate*
|
3.26 | % | 3.73 | % | N/A | |||||||
|
Principal
amounts outstanding at year-end
|
$ | - | $ | - | $ | - | ||||||
|
Annualized
interest rate on principal amounts outstanding at year-end
|
N/A | N/A | N/A | |||||||||
|
Fees*
|
$ | 58 | $ | 112 | $ | 90 | ||||||
|
UI
|
||||||||||||
|
Maximum
aggregate principal amount of short-term borrowing outstanding at any
month-end
|
$ | 174,000 | $ | 148,000 | $ | 70,000 | ||||||
|
Average
aggregate short-term borrowings outstanding during the
year*
|
$ | 65,526 | $ | 84,361 | $ | 24,085 | ||||||
|
Weighted
average interest rate*
|
0.88 | % | 3.05 | % | 5.76 | % | ||||||
|
Principal
amounts outstanding at year-end
|
$ | - | $ | 148,000 | $ | 15,000 | ||||||
|
Annualized
interest rate on principal amounts outstanding at year-end
|
0.00 | % | 1.49 | % | 5.35 | % | ||||||
|
Fees*
|
$ | 513 | $ | 224 | $ | 206 | ||||||
|
|
*Average
short-term borrowings represent the sum of daily borrowings outstanding,
weighted for the number of days outstanding and divided by the number of
days in the period. The weighted average interest rate is
determined by dividing interest expense by the amount of average
borrowings. Fees are excluded from the calculation of the
weighted average interest rate.
|
- 68 -
UIL
HOLDINGS CORPORATION
NOTES TO CONSOLIDATED FINANCIAL
STATEMENTS - (continued)
|
(E)
INCOME TAXES
|
||||||||||||
|
2009
|
2008
|
2007
|
||||||||||
|
(In
Thousands)
|
||||||||||||
|
Income
tax expense for continuing operations consists of:
|
||||||||||||
|
Income
tax provisions:
|
||||||||||||
|
Current
|
||||||||||||
|
Federal
|
$ | 36,183 | $ | 38,106 | $ | 34,626 | ||||||
| State | 4,521 | 4,310 | 2,123 | |||||||||
|
Total
current
|
40,704 | 42,416 | 36,749 | |||||||||
|
Deferred
|
||||||||||||
|
Federal
|
(2,490 | ) | (3,822 | ) | (3,853 | ) | ||||||
|
State
|
(4,864 | ) | (3,724 | ) | (2,238 | ) | ||||||
| Total deferred | (7,354 | ) | (7,546 | ) | (6,091 | ) | ||||||
|
Investment
tax credits
|
(146 | ) | (146 | ) | (146 | ) | ||||||
|
Total
income tax expense for continuing operations
|
$ | 33,204 | $ | 34,724 | $ | 30,512 | ||||||
|
Income
tax components charged as follows:
|
||||||||||||
|
Operating
tax expense
|
$ | 37,167 | $ | 40,835 | $ | 32,748 | ||||||
|
Nonoperating
tax benefit
|
(3,867 | ) | (6,087 | ) | (2,443 | ) | ||||||
|
Equity
investment tax benefit
|
(96 | ) | (24 | ) | 207 | |||||||
|
Total
income tax expense
|
$ | 33,204 | $ | 34,724 | $ | 30,512 | ||||||
|
The
following table details the components
|
||||||||||||
|
of
the deferred income tax provision:
|
||||||||||||
|
Accelerated
depreciation
|
$ | 10,289 | $ | 6,066 | $ | 878 | ||||||
|
Bond
redemption costs
|
(340 | ) | (340 | ) | (340 | ) | ||||||
|
Incentive
compensation plans
|
(634 | ) | 170 | 495 | ||||||||
|
Seabrook
lease buyout
|
(1,367 | ) | (1,350 | ) | (1,350 | ) | ||||||
|
Post
Retirement Benefits
|
(2,870 | ) | (1,938 | ) | 202 | |||||||
|
Regulatory
deferrals
|
(5,278 | ) | (7,958 | ) | (4,396 | ) | ||||||
|
Pension
benefits
|
(5,941 | ) | (1,944 | ) | (1,563 | ) | ||||||
|
Other
- net
|
(1,213 | ) | (252 | ) | (17 | ) | ||||||
|
Deferred
income tax provision - net
|
$ | (7,354 | ) | $ | (7,546 | ) | $ | (6,091 | ) | |||
- 69 -
UIL
HOLDINGS CORPORATION
NOTES TO CONSOLIDATED FINANCIAL
STATEMENTS - (continued)
Total
income taxes differ from the amounts computed by applying the federal statutory
tax rate to income before taxes. The reasons for the differences are
as follows:
|
2009
|
2008
|
2007
|
||||||||||
|
(In
Thousands)
|
||||||||||||
|
Computed
tax at federal statutory rate
|
$ | 30,682 | $ | 29,088 | $ | 27,022 | ||||||
|
Increases
(reductions) resulting from:
|
||||||||||||
|
ITC
taken into income
|
(147 | ) | (147 | ) | (147 | ) | ||||||
|
Allowance
for equity funds used during construction
|
(227 | ) | (847 | ) | (759 | ) | ||||||
|
Amortization
of nuclear plant regulatory assets
|
3,696 | 3,687 | 3,687 | |||||||||
|
Book
depreciation more or (less) than non-normalized tax
depreciation
|
313 | (118 | ) | 265 | ||||||||
|
State
income taxes, net of federal income tax benefits
|
(223 | ) | 380 | (75 | ) | |||||||
|
Allowance
for borrowed funds used during construction on Rate Base
CWIP
|
- | 2,120 | 871 | |||||||||
|
Mark-to-market
adjustments to non-qualified pension investments
|
(391 | ) | 699 | (133 | ) | |||||||
|
Other
items, net
|
(499 | ) | (138 | ) | (219 | ) | ||||||
|
Total
income tax expense
|
$ | 33,204 | $ | 34,724 | $ | 30,512 | ||||||
|
Book
income from continuing operations before income taxes
|
$ | 87,663 | $ | 83,109 | $ | 77,205 | ||||||
|
Effective
income tax rates
|
37.9 | % | 41.8 | % | 39.5 | % | ||||||
In 2007
and 2008, the combined statutory federal and state income tax rate for UIL
Holdings was 39.9%. Legislation enacted in Connecticut in 2009 imposed a 10%
surcharge on the corporation business tax for the years 2009, 2010, and
2011. This surcharge increased the statutory rate of Connecticut
corporation business tax for 2009 from 7.5% to 8.3% and increased the combined
statutory federal and state income tax rate for UIL Holdings for 2009 to
40.4%. Legislation also enacted in 2009 increased the cap on the
combined reporting preference tax. This increase was effective for
2009 and future years. These legislative tax changes had a minimal impact on UIL
Holdings consolidated financial statements in 2009.
The
effective book income tax rate for the year ended December 31, 2009 was 37.9%,
as compared to 41.8% for the year ended December 31, 2008. The
decrease in the 2009 effective book income tax rate is due primarily to higher
state income tax credits recorded in 2009 as compared to 2008 as well as
positive mark-to-market adjustments to non-qualified pension investments in 2009
as compared to 2008.
UIL
Holdings and its subsidiaries are subject to the United States federal income
tax statutes administered by the Internal Revenue Service (IRS). UIL
Holdings and its subsidiaries are also subject to the income tax statutes of the
State of Connecticut and those of other states in which UIL Holdings’
subsidiaries have operated and transacted business in the past. As of
December 31, 2009, the tax years 2006, 2007, and 2008 remain open and subject to
audit for state income tax purposes. As of December 31, 2009, the tax
year 2008 is open and subject to audit for federal income tax purposes. During
2009, the IRS closed examinations of the tax years 2004, 2005, 2006, and
2007. The IRS examination of the tax years 2004, 2005, and 2006
resulted in an immaterial assessment to the Company. The examination
of the tax year 2007 resulted in no additional assessment or refund to the
Company.
At
December 31, 2009, UIL Holdings had non-current deferred tax liabilities
for taxable temporary differences of $372.2 million and non-current deferred tax
assets for deductible temporary differences of $98.6 million, resulting in a net
non-current deferred tax liability of $273.6 million. UIL Holdings
had current deferred tax assets of $4.4 million at December 31,
2009. UIL Holdings did not have any current deferred tax liabilities
at December 31, 2009.
- 70 -
UIL
HOLDINGS CORPORATION
NOTES TO CONSOLIDATED FINANCIAL
STATEMENTS - (continued)
The
following table summarizes UIL Holdings’ deferred tax assets and liabilities for
the years ended December 31, 2009 and 2008:
|
2009
|
2008
|
|||||||
|
(In
Thousands)
|
||||||||
|
Deferred
income tax assets:
|
||||||||
|
Regulatory
asset related to pension and other post-retirement
benefits
|
$ | 66,158 | $ | 77,782 | ||||
|
Post-retirement
benefits
|
9,835 | 6,965 | ||||||
|
SFAS
No. 109 gross-up effect on deferred taxes
|
6,559 | 6,018 | ||||||
|
Connecticut
Yankee equity investment
|
3,146 | 3,051 | ||||||
|
Long-term
incentive plan
|
2,703 | 2,438 | ||||||
|
Vacation
accrual
|
2,573 | 2,181 | ||||||
|
Supplemental
pensions
|
2,068 | 1,956 | ||||||
|
Incentive
compensation plans
|
2,542 | 1,908 | ||||||
|
Uncollectibles
|
1,865 | 1,865 | ||||||
|
Deferred
compensation plan
|
2,315 | 1,834 | ||||||
|
Stock
compensation plans
|
1,615 | 1,238 | ||||||
|
Gains
on sale of property
|
662 | 662 | ||||||
|
Interest
during construction
|
484 | 488 | ||||||
|
Post-employment
benefits
|
462 | 428 | ||||||
|
Other
|
25 | 4,529 | ||||||
| $ | 103,012 | 113,343 | ||||||
|
Deferred
income tax liabilities:
|
||||||||
|
Plant
basis differences
|
$ | 134,192 | $ | 149,875 | ||||
|
Accelerated
depreciation timing differences
|
131,610 | 121,321 | ||||||
|
Regulatory
asset related to pension and other post-retirement
benefits
|
66,158 | 77,782 | ||||||
|
Seabrook
lease buyout
|
19,184 | 20,552 | ||||||
|
Regulatory
deferrals
|
5,462 | 13,973 | ||||||
|
Pension
|
7,851 | 13,680 | ||||||
|
Other
|
7,703 | 8,121 | ||||||
| $ | 372,160 | 405,304 | ||||||
ASC 740
requires that all current deferred tax assets and liabilities within each
particular tax jurisdiction be offset and presented as a single amount in the
Consolidated Balance Sheet. A similar procedure is followed for all
non-current deferred tax assets and liabilities. Amounts in different
tax jurisdictions cannot be offset against each other. The amount of
deferred income taxes as of December 31, 2009 and 2008 included on the following
lines of the Consolidated Balance Sheet is as follows:
|
2009
|
2008
|
|||||||
|
(In
Thousands)
|
||||||||
|
Assets:
|
||||||||
|
Deferred
and refundable income taxes
|
$ | 4,410 | $ | 6,863 | ||||
|
Liabilities:
|
||||||||
|
Deferred
income taxes
|
273,558 | 298,824 | ||||||
|
Deferred
income taxes – net
|
$ | 269,148 | $ | 291,961 | ||||
- 71 -
UIL
HOLDINGS CORPORATION
NOTES TO CONSOLIDATED FINANCIAL
STATEMENTS - (continued)
|
(F) SUPPLEMENTARY
INFORMATION
|
||||||||||||
|
2009
|
2008
|
2007
|
||||||||||
|
(In
Thousands)
|
||||||||||||
|
Operating Revenues
|
||||||||||||
|
Utility:
|
||||||||||||
|
Retail
|
$ | 796,665 | $ | 855,526 | $ | 900,450 | ||||||
|
Wholesale
|
235 | 42,291 | 36,637 | |||||||||
|
Other
|
98,781 | 50,123 | 43,917 | |||||||||
|
Non-utility
revenues:
|
||||||||||||
|
Other
|
869 | 780 | 995 | |||||||||
|
Total
Operating Revenues
|
$ | 896,550 | $ | 948,720 | $ | 981,999 | ||||||
|
Purchased Power
|
||||||||||||
|
Purchased
power expense
|
$ | 333,339 | $ | 444,918 | $ | 537,488 | ||||||
|
Purchased
power above market fuel expense credit
|
- | (20,673 | ) | (21,001 | ) | |||||||
|
Total
Purchased Power Expense
|
$ | 333,339 | $ | 424,245 | $ | 516,487 | ||||||
|
Depreciation and
Amortization
|
||||||||||||
|
Utility
property, plant, and equipment depreciation
|
$ | 49,480 | $ | 39,081 | $ | 35,757 | ||||||
|
Non-utility
property, plant, and equipment depreciation
|
108 | 123 | 180 | |||||||||
|
Total
Depreciation
|
$ | 49,588 | $ | 39,204 | $ | 35,937 | ||||||
|
Amortization
of nuclear plant regulatory assets
|
46,907 | 40,869 | 33,009 | |||||||||
|
Amortization
of purchase power contracts
|
- | 20,673 | 21,001 | |||||||||
|
Subtotal
CTA Amortization
|
46,907 | 61,542 | 54,010 | |||||||||
|
Amortization
of intangibles
|
42 | 36 | 32 | |||||||||
|
Amortization
of other regulatory assets
|
1,579 | 347 | 391 | |||||||||
|
Total
Amortization
|
48,528 | 61,925 | 54,433 | |||||||||
|
Total
Depreciation and Amortization
|
$ | 98,116 | $ | 101,129 | $ | 90,370 | ||||||
|
Taxes - Other than Income
Taxes
|
||||||||||||
|
Operating:
|
||||||||||||
|
Connecticut
gross earnings
|
$ | 38,161 | $ | 34,291 | $ | 29,322 | ||||||
|
Local
real estate and personal property
|
16,471 | 10,799 | 10,231 | |||||||||
|
Payroll
taxes
|
5,430 | 5,140 | 5,076 | |||||||||
|
Total
Taxes - Other than Income Taxes
|
$ | 60,062 | $ | 50,230 | $ | 44,629 | ||||||
|
Other Income and (Deductions),
net
|
||||||||||||
|
Interest
income
|
$ | 3,231 | $ | 2,090 | $ | 4,720 | ||||||
|
Allowance
for funds used during construction
|
1,955 | 4,005 | 3,882 | |||||||||
|
Seabrook
reserve reduction
|
- | - | 1,440 | |||||||||
|
Conservation
& Load Management incentive
|
765 | 597 | 2,857 | |||||||||
|
Energy
generation and load curtailment incentives
|
369 | 770 | - | |||||||||
|
ISO
load response, net
|
1,913 | 2,769 | 2,724 | |||||||||
|
Miscellaneous
other income and (deductions) - net
|
(2,647 | ) | (6,892 | ) | (2,727 | ) | ||||||
|
Total
Other Income and (Deductions), net
|
$ | 5,586 | $ | 3,339 | $ | 12,896 | ||||||
|
Other Interest, net
|
||||||||||||
|
Notes
Payable
|
$ | 644 | $ | 2,611 | $ | 1,386 | ||||||
|
Other
|
642 | 247 | 116 | |||||||||
|
Total
Other Interest, net
|
$ | 1,286 | $ | 2,858 | $ | 1,502 | ||||||
- 72 -
UIL
HOLDINGS CORPORATION
NOTES TO CONSOLIDATED FINANCIAL
STATEMENTS - (continued)
(G) PENSION
AND OTHER BENEFITS
The
United Illuminating Company Pension Plan (the Pension Plan) covers the majority
of employees of UIL Holdings and UI. UI also has a non-qualified
supplemental pension plan for certain employees and a non-qualified retiree-only
pension plan for certain early retirement benefits. The net pension
expense for these plans for 2009, 2008 and 2007 was $16.7 million, $5.1 million,
and $8.3 million, respectively.
Disclosures
pertaining to the Pension Plan are in accordance with ASC 715
Compensation-Retirement Benefits. UI has an investment policy
addressing the oversight and management of pension assets and procedures for
monitoring and control. UI has engaged Frank Russell Trust Company as
the trustee and investment manager to assist in areas of asset allocation and
rebalancing, portfolio strategy implementation, and performance monitoring and
evaluation.
The goals
of the asset investment strategy are to:
|
·
|
Achieve
long-term capital growth while maintaining sufficient liquidity to provide
for current benefit payments and Pension Plan operating
expenses.
|
|
·
|
Provide
a total return that, over the long term, provides sufficient assets to
fund Pension Plan liabilities subject to an appropriate level of risk,
contributions and pension expense.
|
|
·
|
Optimize
the return on assets, over the long term, by investing primarily in a
diversified portfolio of equities and additional asset classes with
differing rates of return, volatility and
correlation.
|
|
·
|
Diversify
investments within asset classes to maximize preservation of principal and
minimize over-exposure to any one investment, thereby minimizing the
impact of losses in single
investments.
|
The
Pension Plan seeks to maintain compliance with the Employee Retirement Income
Security Act of 1974 (ERISA) as amended, and any applicable regulations and
laws.
The
Finance Committee of the Board of Directors (Finance Committee) oversees the
investment of Pension Plan assets in conjunction with management and has
conducted a review of the investment strategies and policies of the Pension
Plan. This review included an analysis of the strategic asset
allocation, including the relationship of Pension Plan assets to Pension Plan
liabilities, and portfolio structure. The Finance Committee has left
the target asset allocation for 2010 unchanged from 2008 for both the pension
and other postretirement employee benefit funds. In the event that
the relationship of Pension assets to Pension Plan liabilities changes, the
Finance Committee will consider changes to the investment
allocations. The other postretirement employee benefit fund assets
are invested in a balanced mutual fund and, accordingly, the asset allocation
mix of the balanced mutual fund may differ from the target asset allocation mix
from time to time. A breakdown of the 2010 target asset allocation,
as well as the actual asset allocation as of December 31, 2009 and 2008 is
detailed below:
|
Percentage
of Plan Assets at Year-End
|
|||||||
|
Target
|
Pension
Benefits
|
Other
Postretirement Benefits
|
|||||
|
Allocation
|
2009
|
2008
|
2009
|
2008
|
|||
|
Equity
securities
|
65%
|
62%
|
59%
|
72%
|
67%
|
||
|
Debt
securities
|
25%
|
36%
|
36%
|
25%
|
31%
|
||
|
Other
|
10%
|
2%
|
5%
|
3%
|
2%
|
||
The above
allocations may be revised by the Finance Committee.
- 73 -
UIL
HOLDINGS CORPORATION
NOTES TO CONSOLIDATED FINANCIAL
STATEMENTS - (continued)
Funding
policy for the Pension Plan is to make annual contributions that satisfy the
minimum funding requirements of ERISA but that do not exceed the maximum
deductible limits of the Internal Revenue Code. These amounts are
determined
each year as a result of an actuarial valuation of the Pension
Plan. During late 2008, conditions in the capital markets resulted in
reductions in asset values of funded pension and postretirement
plans. In particular, the projected benefit obligation for the
qualified pension plan now exceeds the fair market value of plan assets by $140
million. Although asset values recovered somewhat in 2009, these
reductions, if not offset by additional gains in future years, will result in
higher pension and postretirement expenses in future years along with additional
cash contributions. Asset values as of December 31, 2009 and December
31, 2008 were approximately $231.3 million and $211.7 million,
respectively. While there was no minimum required pension
contribution for the 2009 plan year, UI currently expects to make a contribution
of approximately $9 million in 2010 and $26 million in 2011, subject to
proposals that are pending before the United States Congress and true-ups of
actuarial data.
UI has
established a supplemental retirement benefit trust and through this trust
purchased life insurance policies on certain officers of UI to fund the future
liability under the non-qualified supplemental plan. The cash
surrender value of these policies is included in “Other investments” on the
Consolidated Balance Sheet.
There is
potential variability to the pension expense calculation. Changes in
certain of the underlying assumptions could have a material impact on pension
and postretirement expenses. For example, if there had been a 0.25%
change in the discount rate assumed at 6.2%, for the qualified pension plan and
non-qualified plan, respectively, the 2009 pension expense would have increased
or decreased inversely by $1.2 million for the qualified plan and an immaterial
amount for the non-qualified plan. If there had been a 1% change in
the expected return on assets, the 2009 pension expense would have increased or
decreased inversely by $2.3 million for the qualified pension plan and would not
have changed for the non-qualified plan.
In
addition to providing pension benefits, UI also provides Other Postretirement
Benefits (OPEB), consisting principally of health care and life insurance
benefits, for retired employees and their dependents. UI does not
provide prescription drug benefits for Medicare-eligible employees in its
postretirement health care plans. Non-union employees who are 55
years of age and whose sum of age and years of service at time of retirement is
equal to or greater than 65 are eligible for benefits partially subsidized by
UI. The amount of benefits subsidized by UI is determined by age and
years of service at retirement. For funding purposes, UI established
a 401(h) account in connection with the Pension Plan and Serial Voluntary
Employee Benefit Association Trust (VEBA) accounts for the years 2007 through
2020 to fund OPEB for UI’s non-union employees who retire on or after
January 1, 1994. These VEBA accounts were approved by the IRS
and UI contributed $4.5 million to fund the Serial VEBA accounts in
2007. UI does not expect to make a contribution in 2010 to fund OPEB
for non-union employees.
Union
employees whose sum of age and years of service at the time of retirement is
equal to or greater than 85 (or who are 62 with at least 20 years of service)
are eligible for benefits partially subsidized by UI. The amount of
benefits subsidized by UI is determined by age and years of service at
retirement. For funding purposes, UI established a VEBA to fund OPEB
for UI’s union employees. The funding strategy for the VEBA is to
select funds that most clearly mirror the pension allocation
strategy. Approximately 39% of UI’s employees are represented by
Local 470-1, Utility Workers Union of America, AFL-CIO, for collective
bargaining purposes. Plan assets for the union VEBA consist primarily
of equity and fixed-income securities. UI does not expect to make a
contribution in 2010 to fund OPEB for union employees.
There is
potential variability to the OPEB plan expense calculation. Changes
in certain of the underlying assumptions could have a material impact on OPEB
expenses. If there had been a 0.25% change in the discount rate
assumed, the 2009 OPEB plan expenses would have increased or decreased inversely
by $0.2 million; if there had been a 1% change in the expected return on assets,
the 2009 OPEB plan expenses would have increased or decreased inversely by $0.2
million.
- 74 -
UIL
HOLDINGS CORPORATION
NOTES TO CONSOLIDATED FINANCIAL
STATEMENTS - (continued)
To
develop the expected long-term rate of return on assets assumption, UI
considered the current level of expected returns on risk-free investments
(primarily government bonds), the historical level of the risk premium
associated with the other asset classes in which the portfolio is invested, and
the expectations for future returns of each asset class. The expected return for
each asset class was then weighted based on the target asset allocation to
develop the expected long-term rate of return on assets assumption for the
portfolio. This resulted in the selection of the 8.5% return on plan
assets for 2009.
The
projected, long-term average wage increase is 3.8% in 2009 based upon salary
data. For 2009 and 2008, UI utilized the Citigroup Discount Curve to
determine discount rates of 5.85% and 6.20%, respectively, for the pension plan,
5.65% and 6.10%, respectively, for the non-qualified plan, and 5.80% and 6.10%,
respectively, for the OPEB plan. The Citigroup Discount Curve is a
spot rate curve developed based upon a bond portfolio. The discount
rate is determined by combining this curve and the expected payout of Plan
liabilities. Management further considers rates of high-quality
corporate bonds of appropriate maturities as published by nationally recognized
rating agencies consistent with the duration of the Company’s
plans. The health care cost trend rate assumption for all retirees is
set at 10.0% in 2009 with such rate decreasing gradually to 5.0% in
2019.
In
accordance with ASC 715, UI utilizes an alternative method to amortize prior
service costs and unrecognized gains and losses. UI amortizes prior
service costs for both the Pension Plan and OPEB plan on a straight-line basis
over the average remaining service period of participants expected to receive
benefits. UI utilizes an alternative method to amortize unrecognized
actuarial gains and losses related to the Pension and OPEB plan over the lesser
of the average remaining service period or 10 years. For ASC 715
purposes, UI does not recognize gain or loss until there is a variance in an
amount equal to at least 5% of the greater of the projected benefit obligation
or the market-related value of assets. There is no such allowance for
a variance in capturing the amortization of OPEB unrecognized gains and
losses.
Since
2005, new employees do not participate in the Pension Plan or receive retiree
medical plan benefits. These employees participate in a different
retirement plan, which is a “defined contribution plan,” consisting of the
current provisions of UI’s 401(k)/Employee Stock Ownership Plan (KSOP) plus the
following benefits:
|
·
|
An
additional cash contribution of 4.0% of total annual compensation (as
defined in the KSOP Plan) to a separate account in the KSOP of new
hires.
|
|
·
|
An
additional cash contribution of $1,000 per year (pro rata per pay period)
into a separate Retiree Medical Fund within the KSOP account for new
hires.
|
|
·
|
New
employees do not need to contribute to the KSOP to receive these
additional cash contribution amounts; they only need to enroll in the KSOP
Plan.
|
|
·
|
Both
additional cash contributions to the KSOP vest 100% after five years of
service.
|
ASC
715 requires an employer that sponsors one or more defined benefit pension or
other postretirement plans to recognize an asset or liability for the overfunded
or underfunded status of the plan. For a pension plan, the asset or
liability is the difference between the fair value of the plan’s assets and the
projected benefit obligation. For any other postretirement benefit
plan, the asset or liability is the difference between the fair value of the
plan’s assets and the accumulated postretirement benefit
obligation. UI will reflect all unrecognized prior service costs and
credits and unrecognized actuarial gains and losses as regulatory assets rather
than in accumulated other comprehensive income, as management believes it is
probable that such items are recoverable through the ratemaking process in
future periods. As of December 31, 2009 and 2008, UI has recorded a
regulatory asset of $169.2 million and $199.2 million,
respectively.
- 75 -
IL
HOLDINGS CORPORATION
NOTES TO CONSOLIDATED FINANCIAL
STATEMENTS - (continued)
The
following table represents the change in benefit obligation, change in plan
assets and the respective funded status of UI’s pension and postretirement plans
as of December 31, 2009 and 2008. Plan assets and obligations
have been measured as of December 31, 2009 and 2008.
|
Other
Post-Retirement
|
||||||||||||||||
|
Pension
Benefits
|
Benefits
|
|||||||||||||||
|
2009
|
2008
|
2009
|
2008
|
|||||||||||||
|
Change
in Benefit Obligation:
|
(In
Thousands)
|
|||||||||||||||
|
Benefit
obligation at beginning of year
|
$ | 348,058 | $ | 340,965 | $ | 69,505 | $ | 67,368 | ||||||||
|
Service
cost
|
6,133 | 6,870 | 1,334 | 1,395 | ||||||||||||
|
Interest
cost
|
20,928 | 20,973 | 4,137 | 4,208 | ||||||||||||
|
Participant
contributions
|
- | - | 1,033 | 1,171 | ||||||||||||
|
Amendments
|
- | - | - | |||||||||||||
|
Actuarial
(gain) loss
|
18,261 | (955 | ) | (2,085 | ) | 124 | ||||||||||
|
Additional
amount recognized due to settlement
|
- | - | - | |||||||||||||
|
Benefits
paid (including expenses)
|
(21,578 | ) | (19,794 | ) | (4,509 | ) | (4,760 | ) | ||||||||
|
Adjustment
for transition
|
- | - | - | |||||||||||||
|
Benefit
obligation at end of year
|
$ | 371,802 | $ | 348,059 | $ | 69,415 | $ | 69,506 | ||||||||
|
Change
in Plan Assets:
|
||||||||||||||||
|
Fair
value of plan assets at beginning of year
|
$ | 211,675 | $ | 313,469 | $ | 20,861 | $ | 31,293 | ||||||||
|
Actual
return on plan assets
|
40,964 | (82,287 | ) | 4,224 | (7,478 | ) | ||||||||||
|
Employer
contributions
|
247 | 288 | 585 | 635 | ||||||||||||
|
Participant
contributions
|
- | - | 1,033 | 1,171 | ||||||||||||
|
Benefits
paid (including expenses)
|
(21,578 | ) | (19,794 | ) | (4,509 | ) | (4,760 | ) | ||||||||
|
Settlements,
curtailments and other
|
- | - | - | |||||||||||||
|
Fair
value of plan assets at end of year
|
$ | 231,308 | $ | 211,676 | $ | 22,194 | $ | 20,861 | ||||||||
|
Funded
Status at December 31:
|
||||||||||||||||
|
Projected
benefits (less than) greater than plan assets
|
$ | 140,494 | $ | 136,383 | $ | 47,221 | $ | 48,645 | ||||||||
|
Amounts
Recognized in the Statement of Financial Position consist
of:
|
||||||||||||||||
|
Current
liabilities
|
$ | 511 | $ | 252 | $ | 199 | $ | 209 | ||||||||
|
Non-current
liabilities
|
$ | 139,983 | $ | 136,131 | $ | 47,022 | $ | 48,436 | ||||||||
|
Amounts
Recognized as a Regulatory Asset consist of:
|
||||||||||||||||
|
Transition
obligation (asset)
|
$ | - | $ | - | $ | 2,470 | $ | 3,528 | ||||||||
|
Prior
service cost
|
2,778 | 3,475 | $ | (228 | ) | (328 | ) | |||||||||
|
Net
gain (loss)
|
141,518 | 161,533 | 19,501 | 26,857 | ||||||||||||
|
Total
recognized as a regulatory asset
|
$ | 144,296 | $ | 165,008 | $ | 21,743 | $ | 30,057 | ||||||||
|
Information
on Pension Plans with an Accumulated Benefit Obligation in excess of Plan
Assets:
|
||||||||||||||||
|
Projected
benefit obligation
|
$ | 7,105 | $ | 6,169 | N/A | N/A | ||||||||||
|
Accumulated
benefit obligation
|
$ | 6,526 | $ | 5,900 | N/A | N/A | ||||||||||
|
Fair
value of plan assets
|
$ | - | $ | - | N/A | N/A | ||||||||||
|
The
accumulated benefit obligation for all Pension Plans was $324,345 and
$308,388 at December 31, 2009 and 2008, respectively.
|
||||||||||||||||
|
The
following weighted average actuarial assumptions were used in calculating
the benefit obligations at December 31:
|
||||||||||||||||
|
Discount
rate (Qualified Plan)
|
5.85 | % | 6.20 | % | N/A | N/A | ||||||||||
|
Discount
rate (Non-Qualified Plan)
|
5.65 | % | 6.10 | % | N/A | N/A | ||||||||||
|
Discount
rate (Other Post-Retirement Benefits)
|
N/A | N/A | 5.80 | % | 6.10 | % | ||||||||||
|
Average
wage increase
|
3.80 | % | 3.80 | % | N/A | N/A | ||||||||||
|
Health
care trend rate (current year)
|
N/A | N/A | 9.50 | % | 10.00 | % | ||||||||||
|
Health
care trend rate (2019 forward)
|
N/A | N/A | 5.00 | % | 5.00 | % | ||||||||||
- 76 -
UIL
HOLDINGS CORPORATION
NOTES TO CONSOLIDATED FINANCIAL
STATEMENTS - (continued)
|
For
the Year Ended December 31,
|
||||||||||||||||||||||||
|
Pension
Benefits
|
Other
Post-Retirement Benefits
|
|||||||||||||||||||||||
|
2009
|
2008
|
2007
|
2009
|
2008
|
2007
|
|||||||||||||||||||
|
(In
Thousands)
|
||||||||||||||||||||||||
|
Components
of net periodic benefit cost:
|
||||||||||||||||||||||||
|
Service
cost
|
$ | 6,133 | $ | 6,870 | $ | 7,323 | $ | 1,334 | $ | 1,395 | $ | 1,301 | ||||||||||||
|
Interest
cost
|
20,928 | 20,972 | 20,037 | 4,138 | 4,208 | 3,517 | ||||||||||||||||||
|
Expected
return on plan assets
|
(17,113 | ) | (25,729 | ) | (26,024 | ) | (1,640 | ) | (2,530 | ) | (2,386 | ) | ||||||||||||
|
Amortization
of:
|
- | |||||||||||||||||||||||
|
Prior
service costs
|
697 | 750 | 884 | (101 | ) | (102 | ) | (124 | ) | |||||||||||||||
|
Transition
obligation (asset)
|
- | - | - | 1,058 | 1,058 | 1,058 | ||||||||||||||||||
|
Actuarial
(gain) loss
|
14,425 | 4,195 | 6,308 | 2,686 | 1,858 | 1,644 | ||||||||||||||||||
|
Additional
amount recognized due to settlement (1)
|
- | - | 1,189 | - | - | - | ||||||||||||||||||
|
Net
periodic benefit cost (2) (3)
|
$ | 25,070 | $ | 7,058 | $ | 9,717 | $ | 7,475 | $ | 5,887 | $ | 5,010 | ||||||||||||
|
Other
Changes in Plan Assets and Benefit Obligations Recognized as a Regulatory
Asset:
|
||||||||||||||||||||||||
|
Prior
service costs
|
$ | - | $ | - | $ | - | $ | - | $ | - | $ | - | ||||||||||||
|
Net
(gain) loss
|
(5,590 | ) | 107,063 | (15,453 | ) | (4,670 | ) | 10,132 | 3,792 | |||||||||||||||
|
Amortization
of:
|
||||||||||||||||||||||||
|
Prior
service costs
|
(697 | ) | (751 | ) | (884 | ) | 101 | 102 | 124 | |||||||||||||||
|
Transition
obligation (asset)
|
- | - | (1,058 | ) | (1,058 | ) | (1,058 | ) | ||||||||||||||||
|
Actuarial
(gain) loss
|
(14,425 | ) | (4,195 | ) | (6,308 | ) | (2,686 | ) | (1,858 | ) | (1,644 | ) | ||||||||||||
|
Settlements,
curtailments and other (1)
|
- | - | (1,189 | ) | - | - | - | |||||||||||||||||
|
Total
recognized as regulatory asset
|
$ | (20,712 | ) | $ | 102,117 | $ | (23,834 | ) | $ | (8,313 | ) | $ | 7,318 | $ | 1,214 | |||||||||
|
Total
recognized in net periodic benefit costs
|
||||||||||||||||||||||||
|
and
regulatory asset
|
$ | 4,358 | $ | 109,175 | $ | (14,117 | ) | $ | (838 | ) | $ | 13,205 | $ | 6,224 | ||||||||||
|
Estimated
Amortizations from Regulatory Assets into Net Periodic Benefit Cost for
the period January 1, 2010 - December 31, 2010:
|
||||||||||||||||||||||||
|
Amortization
of transition obligation
|
$ | - | $ | - | $ | - | $ | 1,059 | $ | 1,058 | $ | 1,058 | ||||||||||||
|
Amortization
of prior service cost
|
645 | 697 | 750 | (103 | ) | (98 | ) | (102 | ) | |||||||||||||||
|
Amortization
of net (gain) loss
|
12,309 | 14,425 | 4,195 | 1,950 | 2,686 | 1,860 | ||||||||||||||||||
|
Total
estimated amortizations
|
$ | 12,954 | $ | 15,122 | $ | 4,945 | $ | 2,906 | $ | 3,646 | $ | 2,816 | ||||||||||||
|
The
following actuarial weighted average assumptions were used in calculating
net periodic benefit cost:
|
||||||||||||||||||||||||
|
Discount
rate
|
6.20 | %* | 6.35 | %** | 5.75 | % | 6.10 | % | 6.40 | % | 5.75 | % | ||||||||||||
|
Average
wage increase
|
3.80 | % | 4.40 | % | 4.40 | % | N/A | N/A | N/A | |||||||||||||||
|
Return
on plan assets
|
8.50 | % | 8.50 | % | 8.50 | % | 8.50 | % | 8.50 | % | 8.00 | % | ||||||||||||
|
Health
care trend rate (current year)
|
N/A | N/A | N/A | 10.00 | % | 10.50 | % | 10.00 | % | |||||||||||||||
|
Health
care trend rate (2019 forward)
|
N/A | N/A | N/A | 5.00 | % | 5.00 | % | 5.50 | % | |||||||||||||||
|
N/A
– not applicable
|
||||||||||||||||||||||||
|
*6.10%
discount rate used at December 31,2009 for non-qualified
plan
|
||||||||||||||||||||||||
|
**6.00%
discount rate used at December 31,2008 for non-qualified
plan
|
||||||||||||||||||||||||
|
(1)
Reflects settlement charges resulting from a distribution to a former
employee upon retirement.
|
||||||||||||||||||||||||
|
(2)
For the year ended December 31, 2009, UI recorded $8.3 million of
pension expense and $1.9 million of OPEB expense as a regulatory
asset. These amounts were
|
||||||||||||||||||||||||
|
approved
by the DPUC to address the actual increase in pension
and postretirement expense for 2009 (see Note (C), Regulatory
Proceedings).
|
||||||||||||||||||||||||
|
(3)
For the year ended December 31, 2008, UI recorded $1.9 million of
pension expense and $0.4 million of OPEB expense as a regulatory asset.
These amounts reflect additional amounts
|
||||||||||||||||||||||||
|
recoverable
in rates due to changes in
the use of mortality tables imposed by the IRS (see Note (C), in
the use of mortality tables imposed by the IRS (see Note (C), Regulatory
Proceedings).
|
||||||||||||||||||||||||
- 77 -
UIL
HOLDINGS CORPORATION
NOTES TO CONSOLIDATED FINANCIAL
STATEMENTS - (continued)
A one
percentage point change in the assumed health care cost trend rate would have
the following effects:
|
1%
Increase
|
1%
Decrease
|
|||||||
|
(In
Thousands)
|
||||||||
|
Aggregate
service and interest cost components
|
$ | 853 | $ | (695 | ) | |||
|
Accumulated
post-retirement benefit obligation
|
$ | 9,288 | $ | (7,692 | ) | |||
Estimated
Future Benefit Payments
The
following benefit payments, which reflect expected future service, as
appropriate, are expected to be paid:
|
Other
Post-Retirement
|
||||||||
|
Year
|
Pension
Benefits
|
Benefits
|
||||||
|
(In
Thousands)
|
||||||||
|
2010
|
$ | 21,131 | $ | 3,392 | ||||
|
2011
|
$ | 26,576 | $ | 3,553 | ||||
|
2012
|
$ | 23,365 | $ | 3,672 | ||||
|
2013
|
$ | 23,728 | $ | 3,920 | ||||
|
2014
|
$ | 24,535 | $ | 4,132 | ||||
|
2015-2019
|
$ | 135,913 | $ | 24,020 | ||||
UI has a
401(k)/Employee Stock Ownership Plan (KSOP) in which substantially all of its
employees are eligible to participate. The KSOP enables employees to
defer receipt of a portion of their compensation, up to statutory limits, and to
invest such funds in a number of investment alternatives. Matching
contributions are made to the KSOP, in the form of UIL Holdings’ common stock,
based on each employee’s salary deferrals in the KSOP. For union
employees, the matching contribution to the KSOP is 100% of the first 3% of
employee compensation deferred and 50% of the next 2% deferred. The
maximum match is 4% of annual salary. For non-union employees, the
matching contribution to the KSOP is 100% of the first 2% of employee
compensation deferred. All matching contributions are made in the
form of UIL Holdings’ common stock. Matching contributions to the
KSOP during 2009, 2008 and 2007 were $2.5 million, $3.1 million and $2.8
million, respectively. UIL Holdings pays dividends on the shares of
stock in the KSOP to the participant and UIL Holdings receives a tax deduction
for the dividends paid.
(H) RELATED
PARTY TRANSACTIONS
Arnold L.
Chase, a Director of UIL Holdings since June 28, 1999, holds a beneficial
interest in the building located at 157 Church Street, New Haven, Connecticut,
where UI leases office space for its corporate headquarters. UI’s
lease payments for this office space for the years ended December 31, 2009, 2008
and 2007 totaled $11.0 million, $10.8 and $10.4 million,
respectively.
GenConn,
of which UI is a 50-50 joint-venturer, had signed a promissory note (the “Loan”)
with UI under which UI advanced up to an aggregate principal amount of $48.5
million to fund GenConn’s construction and other cash needs until permanent
financing was arranged. In connection with the EBL obtained by UI and
the Project Financing obtained by GenConn on April 27, 2009, all outstanding
balances on the Loan were replaced by a new promissory note, the balance of
which was $107.8 million as of December 31, 2009. See “Note (B) –
Capitalization – Long-Term Debt” for further discussion regarding the
EBL. Additionally, $2.0 million of interest income related to the
promissory note is included in other income and (deductions), net in the
accompanying consolidated statement of income, which is fully offset by the EBL
interest expense incurred.
- 78 -
UIL
HOLDINGS CORPORATION
NOTES TO CONSOLIDATED FINANCIAL
STATEMENTS - (continued)
UIL
Holdings executed guarantee agreements on behalf of each of GenConn Devon and
GenConn Middletown, under which UIL Holdings guaranteed that, in the event
GenConn Devon or GenConn Middletown, as the case may be, failed to perform or
observe the terms and provisions of its contract with GE Packaged Power, UIL
Holdings would take steps necessary to achieve performance or observance of such
contract. In connection with the EBL obtained by UI and the Project
Financing obtained by GenConn on April 27, 2009, UIL Holding’s obligations under
these guarantee agreements were terminated. See “Note (B) –
Capitalization – Long-Term Debt” for further discussion regarding the
EBL.
(I) LEASE
OBLIGATIONS
UIL
Holdings and its wholly-owned direct and indirect subsidiaries have lease
arrangements for data processing equipment, office equipment, office space and
land.
Operating
leases, which are charged to operating expense, consist principally of leases of
office space and facilities, land, railroad rights of way and a wide variety of
equipment. The most significant operating lease is that relating to
the corporate headquarters of UI and UIL Holdings. Most of the
operating leases for office space and facilities contain options to either (1)
purchase the leased space for a stipulated amount at the end of the initial
lease term, or (2) renew the lease at the end of the initial lease term, at the
then fair value, or stipulated amounts, as defined in the lease, for periods
ranging from one to fifteen years. The future minimum lease payments
under these operating leases are estimated to be as follows:
|
(In
Thousands)
|
||||||||
|
2010
|
13,993 | |||||||
|
2011
|
14,107 | |||||||
|
2012
|
8,187 | (1 | ) | |||||
|
2013
|
1,932 | |||||||
|
2014
|
1,584 | |||||||
|
2015
- after
|
37,372 | |||||||
|
Total
|
$ | 77,174 | ||||||
(1)
Corporate headquarter lease expires June 2012
Rental
payments charged to operating expenses in 2009, 2008 and 2007, including rental
payments for the corporate headquarters of UIL Holdings and UI, were as
follows:
|
Year
Ended December 31,
|
||||||||||||
|
2009
|
2008
|
2007
|
||||||||||
|
(In
Thousands)
|
||||||||||||
|
Rental
payments
|
$ | 13,588 | $ | 13,125 | $ | 11,977 | ||||||
|
Less:
Sublease rental payments received
|
1,125 | 1,126 | 1,119 | |||||||||
|
Rental
payments charged to operating expenses
|
$ | 12,462 | $ | 11,999 | $ | 10,858 | ||||||
(J) COMMITMENTS
AND CONTINGENCIES
Connecticut
Yankee Atomic Power Company
UI has a
9.5% stock ownership share in the Connecticut Yankee Atomic Power Company
(Connecticut Yankee), the carrying value of which was $0.3 million as of
December 31, 2009. In 1996, the Board of Directors of Connecticut
Yankee voted unanimously to retire the Connecticut Yankee nuclear plant (the
Connecticut Yankee Unit) from commercial operation. A settlement
agreement approved by the FERC that became effective in 2000 allows Connecticut
Yankee to collect, through the power contracts with the unit’s owners, the
FERC-approved decommissioning costs, other
- 79 -
UIL
HOLDINGS CORPORATION
NOTES TO CONSOLIDATED FINANCIAL
STATEMENTS - (continued)
costs
associated with the permanent shutdown of the Connecticut Yankee Unit, the
unrecovered investment in the Connecticut Yankee Unit, and a return on equity of
6%. The decommissioning project was completed in 2007. In
October 2007, the Connecticut Department of Environmental Protection (CDEP)
approved Connecticut Yankee’s application for a Stewardship Permit which states
that all corrective action measures required at the Connecticut Yankee site
pursuant to Connecticut law have been completed subject to post-remediation
groundwater monitoring. In November 2007, the Nuclear Regulatory
Commission (NRC) issued a license reduction for the Connecticut Yankee site
limiting it to the independent spent-fuel storage installation (ISFSI) (see DOE
Spent Fuel Litigation below).
Connecticut
Yankee updates the cost of its remaining decommissioning activity, which
consists primarily of ground water monitoring and nuclear fuel storage, at least
annually, and more often as needed, and provides UI with a projected recovery
schedule depicting annual costs expected to be billed to UI, including a return
on investment over the term of the projected recovery period. The
present value of these costs is calculated using UI’s weighted-average cost of
capital and, after consideration of recoverability, recorded as a Connecticut
Yankee Contract Obligation and a corresponding regulatory asset. At
December 31, 2009, UI has regulatory approval to recover in future rates
(through the CTA) its $20.7 million regulatory asset for Connecticut Yankee over
a term ending in 2015.
Stock
Redemption
In
September 2009, the Connecticut Yankee Board of Directors voted to redeem $6.0
million of Connecticut Yankee stock. In October 2009, UI received
$0.6 million in the redemption and its stock ownership share in Connecticut
Yankee remains at 9.5% since the redemption was proportional for all owners’
shares. The stock redemption continues a redemption program designed
to fund equity at levels necessary to meet expected on-going
requirements.
DOE Spent Fuel
Litigation
In the
Nuclear Waste Policy Act of 1982, Congress provided for the United States
Department of Energy (DOE) to dispose of spent nuclear fuel and other high-level
waste (hereinafter Nuclear Waste) from nuclear generating plants. In
1983, Connecticut Yankee and the DOE entered into a standard disposal contract
mandated by the Act which required the DOE to begin disposing of Connecticut
Yankee’s Nuclear Waste by the end of January 1998.
In 1998,
Connecticut Yankee filed claims in the United States Court of Federal Claims
seeking damages resulting from the breach of the 1983 contracts by the
DOE. In November 1998, the Court ruled that the DOE had breached the
contracts and was liable for damages, but left the amount of damages to be
determined after a trial on the evidence. In October 2006, the Court
issued judgment for Connecticut Yankee in the amount of $34.2 million for its
spent-fuel-related costs through 2001, ruling in favor of Connecticut Yankee on
substantially all of the major issues. UI’s 9.5% ownership share
would result in a payment of approximately $3.2 million which, if awarded, would
be refunded to customers. In August 2008, the United States Court of
Appeals for the Federal Circuit vacated the lower court's $34.2 million damage
award, and remanded the case for a re-calculation of damages. UI
cannot determine what damages the court will now award, but expects that when
the court applies the rates as ordered by this ruling, the damage award will be
comparable to the prior award.
In
December 2007, Connecticut Yankee filed a second set of complaints against the
government seeking unspecified damages incurred since January 1, 2002 for the
DOE’s failure to remove Connecticut Yankee’s spent fuel. In July
2009, Connecticut Yankee provided the government with a second set of damage
claims totaling approximately $135 million for damages incurred from January 1,
2002 through December 31, 2008. UI’s 9.5% ownership share would
result in a payment of approximately $12.8 million which, if awarded, would be
refunded to customers. As an interim measure until the DOE complies
with its contractual obligation to dispose of Connecticut Yankee’s spent fuel,
Connecticut Yankee constructed an ISFSI, utilizing dry-cask storage, on the site
of the Connecticut Yankee Unit and completed the transfer of its Nuclear Waste
to the ISFSI in 2005.
- 80 -
UIL
HOLDINGS CORPORATION
NOTES TO CONSOLIDATED FINANCIAL
STATEMENTS - (continued)
Hydro-Quebec
UI is a
participant in the Hydro-Quebec (HQ) transmission tie facility linking New
England and Quebec, Canada. UI has a 5.45% participating share in
this facility, which has a maximum 2000-megawatt equivalent generation capacity
value. In April 1991, UI furnished a guarantee in the amount of $11.7
million, for its participating share of the debt financing for one phase of this
facility. The amount of this guarantee, which expires in August 2015,
is reduced monthly, proportionate with principal paid on the underlying
debt. As of December 31, 2009, the amount of UI’s guarantee for this
debt totaled approximately $1.7 million.
Environmental
Concerns
In
complying with existing environmental statutes and regulations and further
developments in areas of environmental concern, including legislation and
studies in the fields of water quality, hazardous waste handling and disposal,
toxic substances, climate change and electric and magnetic fields, UIL Holdings
and its wholly-owned direct and indirect subsidiaries
may incur substantial capital expenditures for equipment modifications and
additions, monitoring equipment and recording devices, and it may
incur additional operating expenses. The total amount of these
expenditures is not now determinable. Environmental damage claims may
also arise from the operations of UIL Holdings’
subsidiaries. Significant environmental issues known to UIL Holdings
at this time are described below.
Middletown/Norwalk
Transmission Project
During
construction of the Middletown/Norwalk Transmission Project (the “Project”) in
Bridgeport, Connecticut, UI encountered soil contaminated with Polychlorinated
Biphenyls (PCBs). UI stopped construction at the location, which was
a road not owned by UI, and notified the CDEP. At the CDEP’s request,
UI determined the extent of the contamination on property within, and to some
extent beyond, the limits of the Project. UI filed a remediation action plan
(RAP) with the CDEP and the United States Environmental Protection Agency
(EPA). Remediation of the PCBs was completed in June 2008 at a cost
of $2.9 million. In accordance with a construction agreement between
UI, Connecticut Light & Power and the Connecticut Department of
Transportation (CDOT), CDOT will be reimbursing UI approximately $0.5 million of
these costs. The remaining $2.4 million was recovered through
transmission rates and is reflected as such in UIL Holdings’ Consolidated
Financial Statements.
Branford
Landfill
In August
2009, UI received a demand letter from EPA for approximately $0.6 million to
cover the cost of EPA’s remediation of the East Main Street Disposal Superfund
Site. UI has examined relevant documents in EPA’s possession and is
continuing discussions with EPA regarding its claim. UI cannot
presently assess the potential financial impact, if any, of the EPA claim,
beyond the amount identified in EPA’s demand letter to UI.
UI also
received a letter in September 2007 (also addressed to Raytheon Corporation
(Raytheon), successor to the building contractor for the New Haven Harbor
Station facility, United Engineers and Constructors) in which the current
property owner, Shoreline Trailer Court Mobile Homes, states its intent to file
suit against UI and Raytheon under federal law for compensation relating to its
remediation costs at the subject site which is adjacent to East Main Street
Disposal Superfund Site noted above. The owner claims to have
remediated the site at a cost of $0.8 million and seeks compensation for that
amount from UI and Raytheon. After a preliminary investigation of the
owner’s claims, UI informed the owner that it will not address the claims until
the owner provides information supporting the claims. UI has not
received a response and, therefore, cannot presently assess the potential
financial impact, if any, of this claim.
Site Decontamination,
Demolition and Remediation Costs
In June
2006, UI executed an agreement with the City of Bridgeport and its Redevelopment
Authority (the City) for the transfer of title of UI’s Steel Point property to
the City and settlement of all claims against the City with respect to
relocation of a substation and repair/replacement of a bulkhead, in exchange for
payment to UI of $14.9 million, which
- 81 -
UIL
HOLDINGS CORPORATION
NOTES TO CONSOLIDATED FINANCIAL
STATEMENTS - (continued)
represented
the commercial value of the property and cost to replace the
bulkhead. Pursuant to a Memorandum of Understanding (MOU) among UI,
the City of Bridgeport, and the City’s selected developer for the property, the
City must also provide to UI, free of charge, a substation site within a
reasonable proximity to the Steel Point property. In July 2006, the
DPUC approved the proposed transfer of property and all of the terms of the
MOU. The DPUC also accepted the proposed ratemaking treatment
submitted by UI with respect to the property, the substation, and the bulkhead,
which provides for UI to recover costs related to the Steel Point property
through the CTA, subject to DPUC approval in the annual CTA/SBC reconciliation
filing.
The City
and developer released UI from any further liability with respect to the Steel
Point property after title transferred, and the City and/or developer has
indemnified UI for environmental matters related to the Steel Point
property. The Steel Point property includes the land up to the
bulkhead. The sole exception to the indemnity regarding the Steel
Point property is for personal injury claims brought against UI by UI employees
or contractors hired by UI relating to incidents that occurred on the site
before title transferred to the City. UI is not aware of any such
claims. In addition, the MOU provides that there is no indemnity for liability
related to contaminated harbor sediments. UI would seek to recover
any uninsured costs related to such sediments that are UI’s responsibility, to
the extent incurred, through the CTA, in accordance with the ratemaking
treatment approved in the DPUC’s July 2006 decision.
A site on
the Mill River in New Haven was conveyed by UI in 2000 to an unaffiliated
entity, Quinnipiac Energy LLC (QE), reserving to UI permanent easements for the
operation of its transmission facilities on the site. At the time of
the sale, a fund of approximately $1.9 million, an amount equal to the
then-current estimate for remediation, was placed in escrow for purposes of
bringing soil and groundwater on the site into compliance with applicable
environmental laws. Approximately $0.1 million of the escrow fund
remains unexpended. QE has since sold the property to Evergreen
Power, LLC (Evergreen Power) and Asnat Realty LLC (Asnat). UI is
unaware of what agreement was reached between QE and Evergreen Power and Asnat
regarding future environmental liability or what remediation activity remains to
be undertaken at the site. UI could be required by applicable
environmental laws to finish remediating any subsurface contamination at the
site if it is determined that QE and/or Evergreen Power and Asnat have not
completed the appropriate environmental remediation at the
site. UI has not updated remediation estimates to date,
and does not have specific knowledge of any remediation work done, or remaining
to be done, to date on behalf of QE or any subsequent owner. In July
2008, Evergreen Power and Asnat submitted a claim to UI seeking compensation for
environmental remediation on the property, including the existing building which
remains on the site. UIL Holdings cannot presently assess the
potential financial impact, if any, of this claim. As such, as of
December 31, 2009, no liability related to this claim has been
recorded.
In April
1999, UI completed the sale of its Bridgeport Harbor Station and New Haven
Harbor Station generating plants in compliance with Connecticut’s electric
utility industry restructuring legislation. With respect to the
portion of the New Haven Harbor Station site that UI retained, UI has performed
an additional environmental analysis, indicating that approximately $3.2 million
in remediation expenses will be incurred. Actual remediation costs
may be higher or lower than what is currently estimated. The required
remediation is virtually all on transmission-related property and UI has accrued
these estimated expenses, which were recovered in transmission
rates.
In April
1999, UI also sold property to Bridgeport Energy LLC (BE). UIL
Holdings, through its subsidiary, United Bridgeport Energy, Inc. (UBE), held a
minority ownership interest in BE at that time and until the sale of that
interest to the majority owner in March 2006. In connection with the
sale of the property, UI entered into an environmental indemnity agreement with
BE to provide indemnification related to certain environmental conditions
specific to the site where BE’s generation facilities were
constructed. This environmental indemnification remains in place
following the sale of UBE’s interest in BE. Because of soil
management and other environmental remediation activities that were performed
during construction of the generation facilities, UI does not regard its
exposure under the environmental indemnity agreement as
material.
- 82 -
UIL
HOLDINGS CORPORATION
NOTES TO CONSOLIDATED FINANCIAL
STATEMENTS - (continued)
From 1961
to 1976, UI owned a parcel of property in Derby, Connecticut, on which it
operated an oil-fired electric generating unit. For several years,
CDEP has been monitoring and remediating a migration of fuel oil contamination
from a neighboring parcel of property into the adjacent Housatonic
River. Based on its own investigation to date, UI believes it has no
responsibility for this contamination. If regulatory agencies
determine that UI is responsible for the cost of these remediation activities,
UI may incur substantial costs, no estimate of which is currently
available.
Electric System Work
Center
UI’s
January 2004 purchase of its Electric System Work Center property, located in
Shelton, Connecticut, caused a review under the CDEP’s Transfer Act
Program. Under this review, the CDEP had an opportunity to examine
the then current environmental conditions at the site and direct remediation, or
further remediation, of any areas of concern. At the conclusion of
its review, the CDEP elected not to oversee any further site investigation or
remediation at the site and directed UI to undertake any necessary evaluation
and/or remediation (verification work) using an independent Licensed
Environmental Professional (LEP). UI hired an LEP and submitted a
schedule to the CDEP for the verification work. The schedule was
approved by the CDEP and implementation of the verification work is
on-going. The verification work is not expected to have a material
impact on the financial position or results of operations of UI.
Middletown/Norwalk
Transmission Project (the Project)
In 2008,
UI funded escrow accounts for certain retention amounts withheld by UI which
will remain in place until the completion of the verification of fulfillment of
contractor obligations. As of December 31, 2009, the balance of these
escrow accounts was $3.1 million.
The
general contractor and two subcontractors responsible for civil construction
work in connection with the installation of UI’s portion of the
Middletown/Norwalk Transmission Project’s underground electric cable system has
filed a lawsuit seeking payment for change order requests for approximately
$34.5 million plus interest and costs. UI has evaluated the change
order requests and lawsuits and, in doing so, has retained the services of an
independent third party to review the requests and supporting
information. UI intends to defend the litigation
vigorously. To the extent that any of the change order requests are
valid, UI would seek recovery through its transmission revenue
requirement.
Property
Tax Assessment
In the
first quarter of 2007, UI received notice from the City of Bridgeport
(Bridgeport) that the personal property tax assessment for October 1, 2006 had
been increased from the amount declared by UI of $55.7 million to
$69.7 million, based upon the assertion by Bridgeport that UI’s property
tax declaration was not timely filed. UI mailed the declarations
prior to the November 1, 2006 filing deadline, but the assessor asserts that the
declarations were received after November 1, 2006 and were thus not timely
filed. UI appealed the increased assessment to the Bridgeport Board
of Assessment Appeal which denied the appeal. UI believes that its
property tax declaration was filed on a timely basis under Connecticut law and
is contesting the increased assessment in the Superior Court of the State of
Connecticut. UI paid its property tax obligations to Bridgeport,
which included the increased assessment of $0.6 million, in order to avoid any
potential interest charges applicable to unpaid property tax
assessments. UI has amended its complaint with the Superior Court to
seek a refund of this $0.6 million payment and has recorded a receivable on UIL
Holdings’ Consolidated Balance Sheet.
Cross-Sound
Cable Company, LLC
UIL
Holdings and its subsidiary United Capital Investments, Inc. (UCI) continue to
provide two guarantees, in original amounts of $2.5 million and $1.3 million, in
support of guarantees by Hydro-Quebec (HQ), the former majority owner of
Cross-Sound Cable LLC (an entity in which UCI held a minority interest until the
sale of that interest in February 2006), to third parties in connection with the
construction of the project.
- 83 -
UIL
HOLDINGS CORPORATION
NOTES TO CONSOLIDATED FINANCIAL
STATEMENTS - (continued)
The $2.5
million guarantee supports an HQ guarantee to the Long Island Power Authority to
provide for damages in the event of a delay in the date of achieving commercial
operation of the Cross-Sound cable. UIL Holdings expects commercial
operating status to be maintained and, accordingly, it has not recorded a
liability related to this guarantee in its Consolidated Balance Sheet as of
December 31, 2009.
The $1.3
million guarantee supports an agreement under which Cross-Sound is providing
compensation to shell fishermen for their losses, including loss of income,
incurred as a result of the installation of the cable. The payments
to the fishermen are being made over a 10-year period, ending October 2013, and
the obligation under this guarantee reduces proportionately with each payment
made. As of December 31, 2009, the remaining amount of the guarantee was $0.9
million. UIL Holdings believes there is a low probability that it
would be required to fund this guarantee and, as such, has not recorded a
liability related to this guarantee in its Consolidated Balance Sheet as of
December 31, 2009.
(K)
FAIR VALUE OF FINANCIAL INSTRUMENTS
UIL
Holdings adopted the accounting and disclosure guidance set forth in ASC 820
“Fair Value Measurements and Disclosures” on January 1, 2008 as it relates
to certain assets and liabilities, specifically derivative assets and
liabilities related to contracts for differences, assets related to its deferred
compensation plan, supplemental retirement benefit trust life insurance
policies, and asset retirement obligations. See Note (C), “Regulatory
Proceedings” for additional disclosures related to ASC 820.
In 2009,
UIL Holdings also implemented the disclosure guidance, required annually for
fiscal years ending after December 15, 2009, about pension and other
post-retirement benefits as required by ASC 715 “Compensation-Retirement
Benefits”. Such disclosures are not required for earlier periods that
are presented for comparative purposes.
As
defined in ASC 820, fair value is the price that would be received to sell an
asset or paid to transfer a liability in an orderly transaction between market
participants at the measurement date. ASC 820 outlines three
valuation techniques, including: 1) the market approach, which utilizes prices
and other relevant information generated by market transactions; 2) the income
approach, which converts future amounts, including cash flows, to a discounted
present value; and 3) the cost approach, which is based on the amount that
currently would be required to replace the asset. Inputs into
these valuation techniques can be readily observable, market corroborated, or
generally unobservable. ASC 820 establishes a fair value hierarchy
that prioritizes the inputs used to measure fair value. The three
levels of the fair value hierarchy are as follows:
|
Level
1 -
|
Quoted
prices are available in active markets for identical assets and
liabilities as of the reporting date. Active markets are those
in which transactions for the asset or liability occur in sufficient
frequency and volume to provide pricing information on an ongoing
basis.
|
|
Level
2 -
|
Pricing
inputs are not quoted prices but are either directly or indirectly
observable as of the reporting date, including those financial instruments
that are valued using models or other valuation
methodologies. These models are primarily industry-standard
models that consider various assumptions, including quoted forward prices
for commodities, time value, volatility factors, and current market and
contractual prices for the underlying instruments, as well as other
relevant economic measures. Substantially all of these
assumptions are observable in the marketplace throughout the full term of
the instrument, which can be derived from observable data or are supported
by observable levels at which transactions are executed in the
marketplace.
|
|
Level
3 -
|
Pricing
inputs include significant inputs that are generally less observable from
objective sources. These inputs may be used with
internally-developed methodologies that result in management’s best
estimate of fair value. Level 3 instruments include those that
may be more structured or otherwise tailored to customers’
needs. At each balance sheet date, UIL Holdings performs an
analysis of all instruments subject to ASC 820 and includes in Level 3 all
of those whose fair value is based on significant unobservable
inputs.
|
- 84 -
UIL
HOLDINGS CORPORATION
NOTES TO CONSOLIDATED FINANCIAL
STATEMENTS - (continued)
UIL
Holdings utilizes an income approach valuation technique to value the majority
of its assets and liabilities measured and reported at fair value. As
required by ASC 820, financial assets and liabilities are classified in their
entirety, based on the lowest level of input that is significant to the fair
value measurement. UIL Holdings’ assessment of the significance of a
particular input to the fair value measurement requires judgment, and may affect
the valuation of the fair value of assets and liabilities and their placement
within the fair value hierarchy levels.
The
following tables set forth UIL Holdings’ financial assets and liabilities, other
than pension benefits and OPEB, that were accounted for at fair value on a
recurring basis as of December 31, 2009 and December 31,
2008.
|
December
31, 2009
|
||||||||||||||||
|
Level
1
|
Level
2
|
Level
3
|
Total
|
|||||||||||||
|
(In
Thousands)
|
||||||||||||||||
|
Assets:
|
||||||||||||||||
|
Contracts
for differences
|
$ | - | $ | - | $ | 30,694 | $ | 30,694 | ||||||||
|
Deferred
Compensation Plan
|
3,367 | - | - | 3,367 | ||||||||||||
|
Supplemental
retirement benefit trust life insurance policies (Note G)
|
5,071 | - | - | 5,071 | ||||||||||||
| $ | 8,438 | $ | - | $ | 30,694 | $ | 39,132 | |||||||||
|
Liabilities:
|
||||||||||||||||
|
Contracts
for differences
|
$ | - | $ | - | $ | 162,093 | $ | 162,093 | ||||||||
|
Net
fair value assets/(liabilities), December 31, 2009
|
$ | 8,438 | $ | - | $ | (131,399 | ) | $ | (122,961 | ) | ||||||
|
December
31, 2008
|
||||||||||||||||
|
Level
1
|
Level
2
|
Level
3
|
Total
|
|||||||||||||
|
(In
Thousands)
|
||||||||||||||||
|
Assets:
|
||||||||||||||||
|
Contracts
for differences
|
$ | - | $ | - | $ | 8,649 | $ | 8,649 | ||||||||
|
Deferred
Compensation Plan
|
3,164 | - | - | 3,164 | ||||||||||||
|
Supplemental
retirement benefit trust life insurance policies (Note G)
|
3,954 | - | - | 3,954 | ||||||||||||
| $ | 7,118 | $ | - | $ | 8,649 | $ | 15,767 | |||||||||
|
Liabilities:
|
||||||||||||||||
|
Contracts
for differences
|
$ | - | $ | - | $ | 92,142 | $ | 92,142 | ||||||||
|
Net
fair value assets/(liabilities), December 31, 2008
|
$ | 7,118 | $ | - | $ | (83,493 | ) | $ | (76,375 | ) | ||||||
The
determination of fair value of the contracts for differences was based on a
probability-based expected cash flow analysis that was discounted at the
December 31, 2009 or December 31, 2008 risk-free interest rates, as applicable,
and an adjustment for non-performance risk using credit default swap
rates. Certain management assumptions were required, including
development of pricing that extended over the term of the
contracts. In addition, UIL performed an assessment of risks related
to obtaining regulatory, legal and siting approvals, as well as obtaining
financing resources and ultimately attaining commercial
operation. The DPUC has determined that changes in fair value
associated with these contracts for differences are fully
recoverable. As a result, such changes have no impact on UIL
Holdings’ net income.
- 85 -
UIL
HOLDINGS CORPORATION
NOTES TO CONSOLIDATED FINANCIAL
STATEMENTS - (continued)
On
February 7, 2010, an explosion occurred at the construction site of the nearly
completed 620-megawatt plant being built by Kleen Energy Systems, LLC (“Kleen”),
one of the four capacity resources selected by the DPUC to create new or
incremental capacity resources as noted above. As noted above,
CL&P has executed CfDs with two of the selected projects, including the
Kleen project. The CfD with Kleen is subject to the sharing agreement
between UI and CL&P whereby UI pays 20% of the costs and obtains 20% of the
benefits of the contract. The extent of damage and any resulting
delay in the attainment of commercial operation is not now determinable,
therefore, UI cannot presently assess the potential financial
impact. Based on information known to date, it appears to be
reasonably likely that there will be a delay in Kleen's attainment of commercial
operation, which could have a material impact in 2010 on the fair value of the
related regulatory asset and derivative liability that existed on the
Consolidated Balance Sheet as of December 31, 2009 which was based on a
probability-based expected cash flow analysis that was discounted at the
December 31, 2009 risk-free interest rate, and an adjustment for non-performance
risk using credit default swap rates. This event will not have an
impact on UIL Holdings’ Consolidated Statement of Income.
Under the
UIL Deferred Compensation Plan (DCP), Named Executive Officers and certain other
executives may elect to defer certain elements of
compensation. Participants in the DCP are permitted to direct
investments of their elective deferral accounts into ‘deemed’ investments
consisting of non-publicly traded mutual funds available through variable
insurance products and Company common stock equivalents. These
investments, which are actively traded in sufficient frequency and volume to
provide pricing information on an ongoing basis, are marked-to-market in
accordance with ASC 815 based upon such pricing information.
- 86 -
UIL
HOLDINGS CORPORATION
NOTES TO CONSOLIDATED FINANCIAL
STATEMENTS - (continued)
The
following tables set forth a reconciliation of changes in the fair value of the
assets and liabilities above that are classified as Level 3 in the fair value
hierarchy for the twelve month periods ended December 31, 2009 and
2008. The increase in the net fair value of the net contracts for
differences during the twelve month period ended December 31, 2009 is
primarily due to an increase in the probability of one of the projects attaining
commercial operation.
|
Year
Ended
|
||||
|
December
31, 2009
|
||||
|
(In
Thousands)
|
||||
|
Net
contracts for differences assets/(liabilities), December 31,
2008
|
$ | (83,493 | ) | |
|
Unrealized
gains and (losses), net
|
(47,906 | ) | ||
|
Purchases,
issuances, and settlements
|
- | |||
|
Transfers
in and/or out of Level 3
|
- | |||
|
Net
contracts for differences assets/(liabilities), December 31,
2009
|
$ | (131,399 | ) | |
|
Change
in unrealized gains (losses), net relating to net contracts for
differences assets/(liabilities), still held as of December 31,
2009
|
$ | (47,906 | ) | |
|
Year
Ended
|
||||
|
December
31, 2008
|
||||
|
(In
Thousands)
|
||||
|
Net
contracts for differences assets/(liabilities), January 1,
2008
|
$ | (37,984 | ) | |
|
Unrealized
gains and (losses), net
|
(45,509 | ) | ||
|
Purchases,
issuances, and settlements
|
- | |||
|
Transfers
in and/or out of Level 3
|
- | |||
|
Net
contracts for differences assets/(liabilities), December 31,
2008
|
$ | (83,493 | ) | |
|
Change
in unrealized gains (losses), net relating to net contracts for
differences assets/(liabilities), still held as of December 31,
2008
|
$ | (45,509 | ) | |
- 87 -
UIL
HOLDINGS CORPORATION
NOTES TO CONSOLIDATED FINANCIAL
STATEMENTS - (continued)
The
following table sets forth a reconciliation of changes in the net regulatory
asset/(liability) balances that were established to recover any unrealized
gains/(losses) associated with the contracts for differences for the years ended
December 31, 2009 and 2008. The amounts offset the net contract for
differences liabilities detailed above.
|
Year
Ended
|
||||
|
December
31, 2009
|
||||
|
(In
Thousands)
|
||||
|
Net
regulatory assets/(liabilities), December 31, 2008
|
$ | 83,493 | ||
|
Unrealized
(gains) and losses, net
|
47,906 | |||
|
Net
regulatory assets/(liabilities), December 31, 2009
|
$ | 131,399 | ||
|
Year
Ended
|
||||
|
December
31, 2008
|
||||
|
(In
Thousands)
|
||||
|
Net
regulatory assets/(liabilities), January 1, 2008
|
$ | 37,984 | ||
|
Unrealized
(gains) and losses, net
|
45,509 | |||
|
Net
regulatory assets/(liabilities), December 31, 2008
|
$ | 83,493 | ||
The following tables set forth the fair values of UIL Holdings’ pension and OPEB assets that were accounted for at fair value on a recurring basis as of December 31, 2009.
|
December
31, 2009
|
||||||||||||||||
|
Level
1
|
Level
2
|
Level
3
|
Total
|
|||||||||||||
|
(In
Thousands)
|
||||||||||||||||
|
Pension
assets (Note G)
|
||||||||||||||||
|
Mutual
funds
|
$ | 227,832 | $ | - | $ | - | $ | 227,832 | ||||||||
|
Hedge
fund
|
- | - | 3,476 | 3,476 | ||||||||||||
| 227,832 | - | 3,476 | 231,308 | |||||||||||||
|
OPEB
assets (Note G)
|
||||||||||||||||
|
Mutual
funds
|
22,194 | - | - | 22,194 | ||||||||||||
| 22,194 | - | - | 22,194 | |||||||||||||
|
Fair
value of plan assets, December 31, 2009
|
$ | 250,026 | $ | - | $ | 3,476 | $ | 253,502 | ||||||||
The determination of fair value of the Level 1 pension and OPEB assets was based on quoted prices, as of December 31, 2009, in the active markets for the various funds within which the assets are held. The determination of fair value of the Level 3 pension assets was based on the Net Asset Value (NAV) provided by the managers of the underlying fund investments. The NAV provided by the managers typically reflect the fair value of each underlying fund investment, including unrealized gains and losses. Changes in the fair value of pension benefits and OPEB are accounted for in accordance with ASC 715 Compensation – Retirement Benefits as discussed in Note (G) Pension and Other Benefits.
- 88 -
UIL
HOLDINGS CORPORATION
NOTES TO CONSOLIDATED FINANCIAL
STATEMENTS - (continued)
The
following tables set forth a reconciliation of changes in the fair value of the
assets above that are classified as Level 3 in the fair value hierarchy for
the twelve month periods ended December 31, 2009.
|
Year
Ended
|
||||
|
December
31, 2009
|
||||
|
(In
Thousands)
|
||||
|
Pension
assets-Level 3, January 1, 2009
|
$ | 9,684 | ||
|
Unrealized
gains and (losses), net
|
(416 | ) | ||
|
Realized
gains and (losses), net
|
(1,380 | ) | ||
|
Purchases,
sales, issuances, and settlements
|
(4,412 | ) | ||
|
Transfers
in and/or out of Level 3
|
- | |||
|
Pension
assets-Level 3, December 31, 2009
|
$ | 3,476 | ||
|
Change
in unrealized gains (losses), net relating to pension assets still held as
of December 31, 2009
|
$ | (416 | ) | |
- 89 -
UIL
HOLDINGS CORPORATION
NOTES TO CONSOLIDATED FINANCIAL
STATEMENTS - (continued)
|
(L) QUARTERLY
FINANCIAL DATA (UNAUDITED)
|
||||||||||||||||
|
Selected
quarterly financial data for 2009 and 2008 are set forth
below:
|
||||||||||||||||
|
1st
|
2nd
|
3rd
|
4th
|
|||||||||||||
|
Quarter
|
Quarter
|
Quarter
|
Quarter
|
|||||||||||||
|
(In
Thousands, Except Per Share Amounts)
|
||||||||||||||||
|
2009
|
||||||||||||||||
|
Operating
Revenues
|
$ | 235,509 | $ | 200,365 | $ | 255,212 | $ | 205,464 | ||||||||
|
Operating
Income from Continuing Operations
|
28,565 | 30,989 | 42,163 | 20,701 | ||||||||||||
|
Continuing
Operations
|
12,089 | 13,800 | 21,770 | 6,800 | ||||||||||||
|
Discontinued
Operations (Note N)
|
(47 | ) | (31 | ) | (30 | ) | (34 | ) | ||||||||
|
Net
Earnings
|
$ | 12,042 | $ | 13,769 | $ | 21,740 | $ | 6,766 | ||||||||
|
Earnings
Per Share of Common Stock – Basic: (1)
|
||||||||||||||||
|
Continuing
Operations
|
$ | 0.48 | $ | 0.51 | $ | 0.73 | $ | 0.22 | ||||||||
|
Discontinued
Operations (Note N)
|
- | - | - | - | ||||||||||||
|
Net
Earnings (Loss)
|
$ | 0.48 | $ | 0.51 | $ | 0.73 | $ | 0.22 | ||||||||
|
Earnings
Per Share of Common Stock – Diluted: (2)
|
||||||||||||||||
|
Continuing
Operations
|
$ | 0.47 | $ | 0.51 | $ | 0.73 | $ | 0.22 | ||||||||
|
Discontinued
Operations (Note N)
|
- | - | - | - | ||||||||||||
|
Net
Earnings
|
$ | 0.47 | $ | 0.51 | $ | 0.73 | $ | 0.22 | ||||||||
|
2008
|
||||||||||||||||
|
Operating
Revenues
|
$ | 234,624 | $ | 216,130 | $ | 278,717 | $ | 219,249 | ||||||||
|
Operating
Income from Continuing Operations
|
18,666 | 25,720 | 43,897 | 25,844 | ||||||||||||
|
Continuing
Operations
|
6,644 | 11,288 | 21,631 | 8,822 | ||||||||||||
|
Discontinued
Operations (Note N)
|
(57 | ) | (17 | ) | (93 | ) | (70 | ) | ||||||||
|
Net
Earnings
|
$ | 6,587 | $ | 11,271 | $ | 21,538 | $ | 8,752 | ||||||||
|
Earnings
Per Share of Common Stock – Basic: (1)
|
||||||||||||||||
|
Continuing
Operations
|
$ | 0.26 | 0.45 | $ | 0.86 | $ | 0.36 | |||||||||
|
Discontinued
Operations (Note N)
|
- | $ | - | - | (0.01 | ) | ||||||||||
|
Net
Earnings
|
$ | 0.26 | $ | 0.45 | $ | 0.86 | $ | 0.35 | ||||||||
|
Earnings
Per Share of Common Stock – Diluted: (2)
|
||||||||||||||||
|
Continuing
Operations
|
$ | 0.26 | $ | 0.44 | $ | 0.85 | $ | 0.35 | ||||||||
|
Discontinued
Operations (Note N)
|
- | - | - | (0.01 | ) | |||||||||||
|
Net
Earnings
|
$ | 0.26 | $ | 0.44 | $ | 0.85 | $ | 0.34 | ||||||||
|
(1)
Based on weighted average number of shares outstanding each
quarter.
|
||||||||||||||||
|
(2)
Based on weighted average number of shares outstanding each
quarter. Reflecting the effect of dilutive stock options, performance
shares and restricted stock.
|
||||||||||||||||
- 90 -
UIL
HOLDINGS CORPORATION
NOTES TO CONSOLIDATED FINANCIAL
STATEMENTS - (continued)
(M) SEGMENT
INFORMATION
UIL
Holdings has two reporting segments related to UI: distribution of electricity
and transmission of electricity. Revenues from inter-segment
transactions are not material. All of UIL Holdings’ revenues are
derived in the United States. The following measures of segment
profit and loss are utilized by management to make decisions about allocating
resources to the segments and assessing performance. The following
table reconciles certain segment information with that provided in UIL Holdings’
Consolidated Financial Statements. In the table, distribution
includes all utility revenue and expenses except for transmission, which is
provided in a separate column. “Other” includes the information for
the remainder of UIL Holdings’ non-utility activities and unallocated corporate
costs, including minority interest investments and administrative
costs.
| (In Thousands) | ||||||||||||||||||||
|
December
31, 2009
|
||||||||||||||||||||
|
UI
|
||||||||||||||||||||
|
Distribution
|
Transmission
|
Total
UI
|
Other
(1)
|
Total
|
||||||||||||||||
|
Operating
Revenues
|
$ | 726,562 | $ | 169,119 | $ | 895,681 | $ | 869 | $ | 896,550 | ||||||||||
|
Purchased
power
|
333,339 | - | 333,339 | - | 333,339 | |||||||||||||||
|
Operation
and maintenance
|
195,894 | 29,027 | 224,921 | 682 | 225,603 | |||||||||||||||
|
Transmission
wholesale
|
- | 57,012 | 57,012 | - | 57,012 | |||||||||||||||
|
Depreciation
and amortization
|
85,617 | 12,349 | 97,966 | 150 | 98,116 | |||||||||||||||
|
Taxes
- other than income taxes
|
40,978 | 19,080 | 60,058 | 4 | 60,062 | |||||||||||||||
|
Operating
Income (Loss)
|
70,734 | 51,651 | 122,385 | 33 | 122,418 | |||||||||||||||
|
Other
Income and (Deductions), net
|
5,586 | (33 | ) | 5,553 | 33 | 5,586 | ||||||||||||||
|
Interest
Charges, net
|
24,592 | 11,699 | 36,291 | 4,109 | 40,400 | |||||||||||||||
|
Income
(Loss) From Continuing Operations Before Income
|
||||||||||||||||||||
|
Taxes
and Equity Earnings
|
51,728 | 39,919 | 91,647 | (4,043 | ) | 87,604 | ||||||||||||||
|
Income
Taxes (Benefits)
|
20,106 | 14,627 | 34,733 | (1,529 | ) | 33,204 | ||||||||||||||
|
Income
(Loss) From Continuing Operations Before Equity Earnings
|
31,622 | 25,292 | 56,914 | (2,514 | ) | 54,400 | ||||||||||||||
|
Income
(Losses) from Equity Investments
|
59 | - | 59 | - | 59 | |||||||||||||||
|
Income
(Loss) From Continuing Operations
|
31,681 | 25,292 | 56,973 | (2,514 | ) | 54,459 | ||||||||||||||
|
Discontinued
Operations, Net of Tax
|
- | - | - | (142 | ) | (142 | ) | |||||||||||||
|
Net
Income (Loss)
|
$ | 31,681 | $ | 25,292 | $ | 56,973 | $ | (2,656 | ) | $ | 54,317 | |||||||||
|
UI
(2)
|
||||||||||||||||||||
|
Distribution
|
Transmission
|
Total
UI
|
Other
(1) (3)
|
Total
|
||||||||||||||||
|
Total
Assets at December 31, 2009
|
$ | - | $ | - | $ | 2,203,062 | $ | 18,698 | $ | 2,221,760 | ||||||||||
|
(1)
Includes UIL Holdings Corporate and UIL Holdings' non-utility
businesses.
|
|||||||
|
(2)
Information for segmenting total assets between Distribution and
Transmission is not available. Total UI assets are
disclosed in the Total UI column. Net
plant in service is
|
|||||||
|
segregated
by segment and, as of December 31, 2009, was $691.1 million
and $461.8 million for Distribution and Transmission,
respectively.
|
|||||||
|
As
of December 31, 2008, net plant in service was $629.1
million and $444.3 million for Distribution and Transmission,
respectively
|
|||||||
|
(3)
Includes assets of discontinued operations held for sale.
|
|||||||
- 91 -
UIL
HOLDINGS CORPORATION
NOTES TO CONSOLIDATED FINANCIAL
STATEMENTS - (continued)
|
(M) SEGMENT
INFORMATION (Continued)
|
||||||||||||||||||||
|
(In
Thousands)
|
||||||||||||||||||||
|
December
31, 2008
|
||||||||||||||||||||
|
UI
|
||||||||||||||||||||
|
Distribution
|
Transmission
|
Total
UI
|
Other
(1)
|
Total
|
||||||||||||||||
|
Operating
Revenues
|
$ | 812,960 | $ | 134,980 | $ | 947,940 | $ | 780 | $ | 948,720 | ||||||||||
|
Fuel
and Energy
|
424,245 | - | 424,245 | - | 424,245 | |||||||||||||||
|
Operation
and maintenance
|
188,214 | 23,373 | 211,587 | 1,034 | 212,621 | |||||||||||||||
|
Transmission
wholesale
|
- | 46,368 | 46,368 | - | 46,368 | |||||||||||||||
|
Depreciation
and amortization
|
96,018 | 4,951 | 100,969 | 160 | 101,129 | |||||||||||||||
|
Taxes
- other than income taxes
|
37,792 | 12,444 | 50,236 | (6 | ) | 50,230 | ||||||||||||||
|
Operating
Income (Loss)
|
66,691 | 47,844 | 114,535 | (408 | ) | 114,127 | ||||||||||||||
|
Other
Income and (Deductions), net
|
1,463 | 1,201 | 2,664 | 675 | 3,339 | |||||||||||||||
|
Interest
Charges, net
|
19,956 | 10,000 | 29,956 | 4,196 | 34,152 | |||||||||||||||
|
Income
(Loss) From Continuing Operations Before Income
|
||||||||||||||||||||
|
Taxes
and Equity Earnings
|
48,198 | 39,045 | 87,243 | (3,929 | ) | 83,314 | ||||||||||||||
|
Income
Taxes (Benefits)
|
20,579 | 15,369 | 35,948 | (1,224 | ) | 34,724 | ||||||||||||||
|
Income
(Loss) From Continuing Operations Before Equity Earnings
|
27,619 | 23,676 | 51,295 | (2,705 | ) | 48,590 | ||||||||||||||
|
Income
(Losses) from Equity Investments
|
(205 | ) | - | (205 | ) | - | (205 | ) | ||||||||||||
|
Income
(Loss) From Continuing Operations
|
27,414 | 23,676 | 51,090 | (2,705 | ) | 48,385 | ||||||||||||||
|
Discontinued
Operations, Net of Tax
|
- | - | - | (237 | ) | (237 | ) | |||||||||||||
|
Net
Income (Loss)
|
$ | 27,414 | $ | 23,676 | $ | 51,090 | $ | (2,942 | ) | $ | 48,148 | |||||||||
|
UI
(2)
|
||||||||||||||||||||
|
Distribution
|
Transmission
|
Total
UI
|
Other
(1) (3)
|
Total
|
||||||||||||||||
|
Total
Assets
|
$ | - | $ | - | $ | 2,064,889 | $ | 18,297 | $ | 2,083,186 | ||||||||||
|
December
31, 2007
|
||||||||||||||||||||
|
UI
|
||||||||||||||||||||
|
Distribution
|
Transmission
|
Total
UI
|
Other
(1)
|
Total
|
||||||||||||||||
|
Operating
Revenues
|
$ | 893,731 | $ | 87,273 | $ | 981,004 | $ | 995 | $ | 981,999 | ||||||||||
|
Fuel
and Energy
|
516,487 | - | 516,487 | - | 516,487 | |||||||||||||||
|
Operation
and maintenance
|
187,171 | 18,861 | 206,032 | 1,553 | 207,585 | |||||||||||||||
|
Transmission
wholesale
|
- | 32,763 | 32,763 | - | 32,763 | |||||||||||||||
|
Depreciation
and amortization
|
85,269 | 4,889 | 90,158 | 212 | 90,370 | |||||||||||||||
|
Taxes
- other than income taxes
|
35,249 | 9,376 | 44,625 | 4 | 44,629 | |||||||||||||||
|
Operating
Income (Loss)
|
69,555 | 21,384 | 90,939 | (774 | ) | 90,165 | ||||||||||||||
|
Other
Income and (Deductions), net
|
7,893 | 1,528 | 9,421 | 3,475 | 12,896 | |||||||||||||||
|
Interest
Charges, net
|
17,628 | 4,599 | 22,227 | 4,319 | 26,546 | |||||||||||||||
|
Income
(Loss) From Continuing Operations Before Income
|
||||||||||||||||||||
|
Taxes
and Equity Earnings
|
59,820 | 18,313 | 78,133 | (1,618 | ) | 76,515 | ||||||||||||||
|
Income
Taxes (Benefits)
|
25,236 | 5,685 | 30,921 | (409 | ) | 30,512 | ||||||||||||||
|
Income
(Loss) From Continuing Operations Before Equity Earnings
|
34,584 | 12,628 | 47,212 | (1,209 | ) | 46,003 | ||||||||||||||
|
Income
(Losses) from Equity Investments
|
690 | - | 690 | - | 690 | |||||||||||||||
|
Income
(Loss) From Continuing Operations
|
35,274 | 12,628 | 47,902 | (1,209 | ) | 46,693 | ||||||||||||||
|
Discontinued
Operations, Net of Tax
|
- | - | - | (1,996 | ) | (1,996 | ) | |||||||||||||
|
Net
Income (Loss)
|
$ | 35,274 | $ | 12,628 | $ | 47,902 | $ | (3,205 | ) | $ | 44,697 | |||||||||
|
UI
(2)
|
||||||||||||||||||||
|
Distribution
|
Transmission
|
Total
UI
|
Other
(1) (3)
|
Total
|
||||||||||||||||
|
Total
Assets
|
$ | - | $ | - | $ | 1,717,316 | $ | 58,518 | $ | 1,775,834 | ||||||||||
|
(1)
Includes UIL Holdings Corporate and UIL Holdings' non-utility
businesses.
|
||||||||||||||||||||
|
(2)
Information for segmenting total assets between Distribution and
Transmission is not available. Total UI assets are disclosed in the
Total UI column.
|
||||||||||||||||||||
|
Net
plant in service is segregated by segment and, as of December 31, 2008,
was 629.1 million and $444.3 million for Distribution and Transmission,
respectively.
|
||||||||||||||||||||
|
As
of December 31, 2007, net plant in service was $527.7 million and $350.4
million for Distribution and Transmission, respectively.
|
||||||||||||||||||||
|
(3)
Includes assets of discontinued operations held for sale.
|
||||||||||||||||||||
- 92
-
UIL
HOLDINGS CORPORATION
NOTES TO CONSOLIDATED FINANCIAL
STATEMENTS - (continued)
(N)
DISCONTINUED OPERATIONS
UIL
Holdings substantially completed its sale of the business of its wholly-owned
subsidiary Xcelecom, effective December 31, 2006, and in accordance with the
provisions of ASC 360, the results of those Xcelecom businesses have been
reported as discontinued operations in the accompanying Consolidated Statement
of Income for the years ended December 31, 2009, 2008 and 2007, respectively,
and as discontinued operations held for sale in the Consolidated Balance Sheet
as of December 31, 2009 and 2008. Certain Xcelecom businesses that
did not meet the criteria of ASC 360 are reported in continuing
operations. A summary of the discontinued operations of Xcelecom
follows:
|
2009
|
2008
|
2007
|
||||||||||
|
(In
Thousands)
|
||||||||||||
|
Net
operating revenues
|
$ | - | $ | - | $ | - | ||||||
|
Operating
loss
|
$ | (250 | ) | $ | (677 | ) | $ | (1,923 | ) | |||
|
Loss
before income taxes
|
$ | (250 | ) | $ | (389 | ) | $ | (3,389 | ) | |||
|
Income
tax benefit
|
108 | 152 | 1,393 | |||||||||
|
Loss
from discontinued operations, net
|
||||||||||||
|
of
tax, excluding loss on sales of subsidiaries, net of tax
|
(142 | ) | (237 | ) | (1,996 | ) | ||||||
|
Loss
on sale of subsidiaries, net of tax
|
- | - | - | |||||||||
|
Net
loss from discontinued operations
|
$ | (142 | ) | $ | (237 | ) | $ | (1,996 | ) | |||
UIL
Holdings is contingently liable to sureties on performance and payment bonds
issued by those sureties, relating to construction projects entered into by
Xcelecom and its former subsidiaries in the normal course of
business. Surety bonds remain outstanding on certain projects being
completed by Xcelecom’s former companies. As of
December 31, 2009, sureties had issued bonds for the account of
Xcelecom in the aggregate amount of approximately $16.5 million. The
expected remaining cost to complete for the projects covered by such surety
bonds was approximately $0.1 million as of
December 31, 2009. Sureties have never been required to
make payments on Xcelecom’s behalf under the bonds, and UIL Holdings believes
that the buyers of Xcelecom’s former companies have every incentive to continue
to perform their obligations on the construction projects and have adequate
management and other resources to do so. Accordingly, UIL Holdings
concluded that it need not record a liability in connection with these
obligations in its Consolidated Balance Sheet as of
December 31, 2009.
UIL
Holdings has the right to certain claims related to the sales of the Xcelecom
businesses that are not included in the accompanying statement of financial
position as of December 31, 2009 due to uncertainty surrounding
realization of the claim.
The buyer
of the former Xcelecom companies comprising its systems integration business
signed a promissory note payable to Xcelecom or UIL Holdings in connection with
the sale of that business, which totals $1.5 million as of
December 31, 2009. In June 2009, UIL Holdings was notified
that the buyer was in default on its senior third party credit line, which
prohibits it from making any subordinated debt payments, including payments
under the promissory note. UIL Holdings and the buyer have agreed to
a replacement note which calls for principal payments beginning in July 2010
with full payment in September 2011. The buyer is paying interest on
a monthly basis.
Report
of Independent Registered Public Accounting Firm
To the Board of Directors
and Shareholders of UIL Holdings Corporation:
In our
opinion, the accompanying consolidated financial statements listed in the index
appearing under item 15(a) present fairly, in all material respects, the
financial position of UIL Holdings Corporation (the Company) at December
31, 2009 and December 31, 2008, and the results of their operations and their
cash flows for each of the three years in the period ended December 31,
2009 in conformity
with accounting principles generally accepted in the United States of
America. In addition, in our opinion, the financial statement
schedule listed in the index appearing under Item 15(a) presents fairly, in all
material respects, the information set forth therein when read in conjunction
with the related consolidated financial statements. Also in our
opinion, the Company maintained, in all material respects, effective internal
control over financial reporting as of December 31, 2009, based on criteria
established in Internal
Control - Integrated Framework issued by the Committee of Sponsoring
Organizations of the Treadway Commission (COSO). The Company's
management is responsible for these financial statements and financial statement
schedule, for maintaining effective internal control over financial reporting
and for its assessment of the effectiveness of internal control over financial
reporting, included in Management's Report on Internal Control Over Financial
Reporting appearing under Item 9A. Our responsibility is to express opinions on
these financial statements and on the Company's internal control over financial
reporting based on our integrated audits. We conducted our audits in
accordance with the standards of the Public Company Accounting Oversight Board
(United States). Those standards require that we plan and perform the
audits to obtain reasonable assurance about whether the financial statements are
free of material misstatement and whether effective internal control over
financial reporting was maintained in all material respects. Our
audits of the financial statements included examining, on a test basis, evidence
supporting the amounts and disclosures in the financial statements, assessing
the accounting principles used and significant estimates made by management, and
evaluating the overall financial statement presentation. Our audit of
internal control over financial reporting included obtaining an understanding of
internal control over financial reporting, assessing the risk that a material
weakness exists, and testing and evaluating the design and operating
effectiveness of internal control based on the assessed risk. Our
audits also included performing such other procedures as we considered necessary
in the circumstances. We believe that our audits provide a reasonable basis for
our opinions.
A
company’s internal control over financial reporting is a process designed to
provide reasonable assurance regarding the reliability of financial reporting
and the preparation of financial statements for external purposes in accordance
with generally accepted accounting principles. A company’s internal
control over financial reporting includes those policies and procedures that
(i) pertain to the maintenance of records that, in reasonable detail,
accurately and fairly reflect the transactions and dispositions of the assets of
the company; (ii) provide reasonable assurance that transactions are
recorded as necessary to permit preparation of financial statements in
accordance with generally accepted accounting principles, and that receipts and
expenditures of the company are being made only in accordance with
authorizations of management and directors of the company; and
(iii) provide reasonable assurance regarding prevention or timely detection
of unauthorized acquisition, use, or disposition of the company’s assets that
could have a material effect on the financial statements.
Because
of its inherent limitations, internal control over financial reporting may not
prevent or detect misstatements. Also, projections of any evaluation
of effectiveness to future periods are subject to the risk that controls may
become inadequate because of changes in conditions, or that the degree of
compliance with the policies or procedures may deteriorate.
/s/ PricewaterhouseCoopers LLP
February
17, 2010
Item 9. Changes
in and Disagreements with Accountants on Accounting and Financial
Disclosure.
None
Item 9A.
Controls and Procedures.
Conclusion
Regarding the Effectiveness of Disclosure Controls and Procedures
UIL
Holdings maintains disclosure controls and procedures that are designed to
ensure that information required to be disclosed in its periodic reports to the
SEC is recorded, processed, summarized and reported within the time periods
specified in the SEC’s rules and forms, and that such information is accumulated
and communicated to UIL Holdings’ management, including its Chief Executive
Officer and Chief Financial Officer, as appropriate, to allow timely decisions
regarding required disclosure based on the definition of “disclosure controls
and procedures” in Rule 13a-15(e) and Rule 15d-15(e) under the Securities
Exchange Act of 1934. Management designed its disclosure controls and
procedures to provide reasonable assurance of achieving the desired control
objectives.
UIL
Holdings carried out an evaluation, under the supervision and with the
participation of its management, including its Chief Executive Officer and its
Chief Financial Officer, of the effectiveness of the design and operation of UIL
Holdings’ disclosure controls and procedures as of December 31,
2009. As of December 31, 2009, UIL Holdings’ Chief Executive
Officer and its Chief Financial Officer concluded that its disclosure controls
and procedures were effective and provided reasonable assurance that the
disclosure controls and procedures accomplished their objectives.
Changes
in Internal Control Over Financial Reporting
There
have been no changes in UIL Holdings’ internal control over financial reporting
during the quarter ended December 31, 2009 that have materially affected,
or are reasonably likely to materially affect, UIL Holdings’ internal control
over financial reporting.
Report
of Management on Internal Control Over Financial Reporting
Management
of UIL Holdings is responsible for establishing and maintaining adequate
internal control over financial reporting as defined in Rules 13a-15(f) and
15d-15(f) under the Securities Exchange Act of 1934. UIL Holdings’
internal control over financial reporting is a process designed to provide
reasonable assurance regarding the reliability of financial reporting and the
preparation of financial statements for external purposes in accordance with
accounting principles generally accepted in the United States of
America. Internal control over financial reporting includes those
policies and procedures that (1) pertain to the maintenance of records that, in
reasonable detail, accurately and fairly reflect the transactions and
dispositions of the assets of UIL Holdings; (2) provide reasonable assurance
that transactions are recorded as necessary to permit preparation of financial
statements in accordance with accounting principles generally accepted in the
United States of America; (3) provide reasonable assurance that receipts and
expenditures of UIL Holdings are being made only in accordance with
authorization of management and directors of UIL Holdings; and (4) provide
reasonable assurance regarding prevention or timely detection of unauthorized
acquisition, use or disposition of assets that could have a material effect on
the consolidated financial statements.
Internal
control over financial reporting includes the controls themselves, monitoring
(including internal auditing practices) and actions taken to correct
deficiencies as identified.
Because
of its inherent limitations, internal control over financial reporting may not
prevent or detect misstatements. Further, one cannot assume that
existing internal control over financial reporting will be effective in future
periods due to changes in conditions, or deterioration in the degree of
compliance with existing policies or procedures.
Management
assessed the effectiveness of UIL Holdings’ internal control over financial
reporting as of December 31, 2009. Management based this
assessment on criteria for effective internal control over financial reporting
described in “Internal Control – Integrated Framework” issued by the Committee
of Sponsoring Organizations of the Treadway Commission. Based on this
assessment, management determined that, as of December 31, 2009, UIL
Holdings maintained effective internal control over financial
reporting.
The effectiveness of the Company's
internal control over financial reporting as of December 31, 2009, has been
audited by PricewaterhouseCoopers LLP, an independent registered public
accounting firm, as stated in their report which appears
herein.
Item 9B.
Other Information.
None
Part
III
Item
10. Directors, Executive Officers and Corporate
Governance.
The
information appearing under the captions “ELECTION OF DIRECTORS” and “SECTION
16(a) BENEFICIAL OWNERSHIP REPORTING COMPLIANCE” in UIL Holdings Corporation’s
(UIL Holdings’) definitive Proxy Statement for the Annual Meeting of the
Shareowners scheduled to be held on May 11, 2010, which Proxy Statement is
expected to be filed with the Securities and Exchange Commission on or about
March 31, 2010, is incorporated by reference in partial answer to this
item. See also “EXECUTIVE OFFICERS,” following Part I, Item 4
herein. The UIL Holdings Code of Ethics for the Chief Executive
Officer, Presidents, and Senior Financial Officers is available on UIL Holdings’
website (www.uil.com), and is
included as Exhibit 14 to this filing on Form 10-K.
Item
11. Executive Compensation.
The
information appearing under the captions “COMPENSATION DISCUSSION AND
ANALYSIS,” “SUMMARY COMPENSATION TABLE,” “GRANTS OF PLAN-BASED AWARDS,”
“OUTSTANDING EQUITY AWARDS AT FISCAL YEAR-END,” “OPTIONS EXERCISES AND STOCK
VESTED,” “QUALIFIED AND SUPPLEMENTAL EXECUTIVE DEFINED BENEFIT RETIREMENT
PLANS,” “NONQUALIFIED DEFERRED COMPENSATION,” “POSTRETIREMENT PAYMENTS AND
BENEFITS UPON TERMINATION OR CHANGE IN CONTROLS,” “DIRECTORS’ COMPENSATION,”
“COMPENSATION AND EXECUTIVE DEVELOPMENT COMMITTEE REPORT ON EXECUTIVE
COMPENSATION,” and “COMPENSATION COMMITTEE INTERLOCKS AND INSIDER
PARTICIPATION,” in UIL Holdings’ definitive Proxy Statement for the Annual
Meeting of the Shareowners scheduled to be held on May 11, 2010, which Proxy
Statement is expected to be filed with the Securities and Exchange Commission on
or about March 31, 2010, is incorporated by reference in answer to this
item.
Item
12. Security Ownership of Certain Beneficial Owners and Management
and Related Stockholder Matters.
The
information appearing under the captions “PRINCIPAL SHAREOWNERS” and “STOCK
OWNERSHIP OF DIRECTORS AND OFFICERS” in UIL Holdings’ definitive Proxy Statement
for the Annual Meeting of the Shareowners scheduled to be held on May 11, 2010,
which Proxy Statement is expected to be filed with the Securities and Exchange
Commission on or about March 31, 2010, is incorporated by reference in partial
answer to this item. The information appearing in Item 5, “Market for
UIL Holdings’ Common Equity, Related Stockholder Matters and Issuer Purchases of
Equity Securities – Equity Compensation Plan Information,” is incorporated by
reference in partial answer to this item.
Item
13. Certain Relationships and Related Transactions and Director
Independence.
The
information appearing under the captions “TRANSACTIONS WITH RELATED PERSONS,”
and “ELECTION OF DIRECTORS – DIRECTORS’ INDEPENDENCE” in UIL Holdings’
definitive Proxy Statement for the Annual Meeting of the Shareowners scheduled
to be held on May 11, 2010, which Proxy Statement is expected to be filed with
the Securities and Exchange Commission on or about March 31, 2010, is
incorporated by reference in answer to this item.
Item
14. Principal Accounting Fees and Services.
The
information appearing under the caption “BOARD OF DIRECTORS REPORT OF THE AUDIT
COMMITTEE” in UIL Holdings’ definitive Proxy Statement for the Annual Meeting of
the Shareowners scheduled to be held on May 11, 2009, which Proxy
Statement is expected to be filed with the Securities and Exchange Commission on
or about March 31, 2009, is incorporated by reference in answer to this
item.
Part
IV
Item
15. Exhibits, Financial Statement Schedules.
(a) The following documents are filed
as a part of this report:
Financial Statements (see Item
8):
Consolidated Statement of Income for
the years ended December 31, 2009, 2008 and 2007
Consolidated Statement of Comprehensive
Income for the years ended December 31, 2009, 2008 and 2007
Consolidated Statement of Cash Flows
for the years ended December 31, 2009, 2008 and 2007
Consolidated Balance Sheet,
December 31, 2009 and 2008
|
|
Consolidated
Statement of Changes in Shareholders’ Equity for the years ended
December 31, 2009, 2008 and
2007
|
Notes to Consolidated Financial
Statements
Report of independent registered public
accounting firm
Financial Statement Schedule (see
S-1)
|
|
Schedule
II - Valuation and Qualifying Accounts for the years ended
December 31, 2009, 2008 and
2007
|
(b) Exhibits:
Pursuant
to Rule 12b-32 under the Securities Exchange Act of 1934, certain of the
following listed exhibits, which are annexed as exhibits to previous statements
and reports filed by UIL Holdings Corporation (Commission File Number 1-15052)
(UIL) and/or The United Illuminating Company (Commission File Number 1-6788)
(UI), are hereby incorporated by reference as exhibits to this
report. Such statements and reports are identified by reference
numbers as follows:
|
(1)
|
Filed
with UI and UIL Quarterly Report (Form 10-Q) for fiscal quarter ended
September 30, 2000.
|
|
|
(2)
|
Filed
with UIL Quarterly Report (Form 10-Q) for fiscal quarter ended
June 30, 2002.
|
|
|
(3)
|
Filed
with UI Registration Statement No. 33-40169, effective August 12,
1991.
|
|
|
(4)
|
Filed
with UI Registration Statement No. 2-57275, effective October 19,
1976.
|
|
|
(5)
|
Filed
with UI Annual Report (Form 10-K) for fiscal year ended December 31,
1995.
|
|
|
(6)
|
Filed
with UI Annual Report (Form 10-K) for fiscal year ended December 31,
1996.
|
|
|
(7)
|
Filed
with UI Registration Statement No. 2-60849, effective July 24,
1978.
|
|
|
(8)
|
Filed
with UIL Quarterly Report (Form 10-Q) for fiscal quarter ended
September 30, 2002.
|
|
|
(9)
|
Filed
with UI Annual Report (Form 10-K) for fiscal year ended December 31,
2000.
|
|
|
(10)
|
Filed
with UIL Quarterly Report (Form 10-Q) for fiscal quarter ended March 31,
2003.
|
|
|
(11)
|
Filed
with UI Annual Report (Form 10-K) for fiscal year ended December 31,
2003.
|
|
|
(12)
|
Filed
with UIL Quarterly Report (Form 10-Q) for fiscal quarter ended March 31,
2004.
|
|
|
(13)
|
Filed
with UIL Current Report (Form 8-K) dated July 8, 2005.
|
|
|
(14)
|
Filed
with UIL Current Report (Form 8-K) dated January 10,
2006.
|
|
|
(15)
|
Filed
with UIL Current Report (Form 8-K) dated July 25, 2005.
|
|
|
(16)
|
Filed
with UIL Annual Report (Form 10-K) for fiscal year ended December 31,
2004.
|
|
|
(17)
|
Filed
with UIL Current Report (Form 8-K) dated September 26,
2005.
|
|
|
(18)
|
Filed
with UIL Current Report (Form 8-K) dated November 28,
2005.
|
|
|
(19)
|
Filed
with UIL Quarterly Report (Form 10-Q) for fiscal quarter ended March 31,
2006.
|
|
|
(20)
|
Filed
with UIL Quarterly Report (Form 10-Q) for fiscal quarter ended June 30,
2006.
|
|
|
(21)
|
Filed
with UIL Quarterly Report (Form 10-Q) for fiscal quarter ended September
30, 2006.
|
|
|
(22)
|
Filed
with UIL Annual Report (Form 10-K) for fiscal year ended December 31,
2006.
|
|
|
(23)
|
Filed
with UIL Quarterly Report (Form 10-Q) for fiscal quarter ended March 31,
2007.
|
|
|
(24)
|
Filed
with UIL Quarterly Report (Form 10-Q) for fiscal quarter ended June 30,
2007.
|
|
|
(25)
|
Filed
with UIL Annual Report (Form 10-K) for fiscal year ended December 31,
2007.
|
|
|
(26)
|
Filed
with UIL Quarterly Report (Form 10-Q) for fiscal quarter ended June 30,
2008.
|
|
|
(27)
|
Filed
with UIL Current Report (Form 8-K) dated August 1,
2008.
|
|
|
(28)
|
Filed
with UIL Quarterly Report (Form 10-Q) for fiscal quarter ended June 30,
2009.
|
|
Exhibit
Table
Item No.
|
Exhibit
No.
|
Reference
No.
|
Description
|
|
|
(2)
|
2.1
|
(19)
|
Restated
Purchase Agreement by and among TransEnergie HQ, Inc., TransEnergie U.S.
Ltd., United Capital Investments, Inc., Cross-Sound Cable Company, LLC,
BBI CSC LLC, Babcock & Brown Infrastructure Limited, Babcock &
Brown Investor Services Ltd., Hydro-Quebec, and United Resources, Inc.,
dated February 14, 2006.
|
|
|
(2)
|
2.1(a)
|
(19)
|
Amendment
No. 1 to Restated Purchase Agreement by and among TransEnergie HQ, Inc.,
TransEnergie U.S. Ltd., United Capital Investments, Inc., Cross-Sound
Cable Company, LLC, BBI CSC LLC, Babcock & Brown Infrastructure
Limited, Babcock & Brown Investor Services Ltd., Hydro-Quebec, and
United Resources, Inc., dated February 22, 2006.
|
|
|
(2)
|
2.1(b)
|
(19)
|
Amendment
No. 2 to Restated Purchase Agreement by and among TransEnergie HQ, Inc.,
TransEnergie U.S. Ltd., United Capital Investments, Inc., Cross-Sound
Cable Company, LLC, BBI CSC LLC, Babcock & Brown Infrastructure
Limited, Babcock & Brown Investor Services Ltd., Hydro-Quebec, and
United Resources, Inc., dated February 24, 2006.
|
|
|
(2)
|
2.2
|
(19)
|
Settlement
Agreement and Release by and among United Bridgeport Energy, Inc., Duke
Bridgeport Energy, LLC, UIL Holdings Corporation, Duke Capital, LLC,
Bridgeport Energy LLC, and NC Development and Design Company, LLC, dated
January 31, 2006.
|
|
|
(2)
|
2.3
|
(21)
|
Stock
Purchase Agreement by and among UIL Holdings Corporation, Xcelecom, Inc.
and NWN Corporation for all of the outstanding stock of 4Front Systems,
Inc., The Datastore, Incorporated, and Datanet Services, Inc., dated
August 29, 2006.
|
|
|
(2)
|
2.4
|
(22)
|
Securities
Purchase Agreement by and among UIL Holdings Corporation, Xcelecom, Inc.
and ODEC Holding Corporation for all of the outstanding stock of Orlando
Diefenderfer Electrical Contractors, Inc., dated October 30,
2006.
|
|
|
(2)
|
2.5
|
(22)
|
Securities
Purchase Agreement by and among UIL Holdings Corporation, Xcelecom, Inc.
and TEI Acquisition Corporation for all of the outstanding stock of
Terry’s Electric, Inc., dated November 30, 2006.
|
|
|
(2)
|
2.6
|
(22)
|
Securities
Purchase Agreement by and among UIL Holdings Corporation, Xcelecom, Inc.
and Allan Brite-Way Electrical Contractors, Inc., as a wholly owned
subsidiary of SAIDS LLC, and SAIDS LLC for all of the
outstanding stock of Allan Brite-Way Electrical Contractors,
Inc., dated December 29, 2006.
|
|
|
(2)
|
2.7
|
(22)
|
Securities
Purchase Agreement by and among UIL Holdings Corporation, Xcelecom, Inc.
and Phalcon LTD. for all of the outstanding stock and membership units of
McPhee Electric LTD, LLC, JBL Electric, Inc. and JE Richards, Inc., dated
December 29, 2006.
|
|
|
(3)
|
3.1
|
(24)
|
Certificate
of Incorporation of UIL Holdings Corporation, as amended through
May 11, 2007.
|
|
|
(3)
|
3.2
|
(28)
|
Bylaws
of UIL Holdings Corporation as amended through April 27,
2009.
|
|
|
(4)
|
4.1
|
(3)
|
Indenture,
dated as of August 1, 1991, from The United Illuminating Company to The
Bank of New York, Trustee.
|
|
|
(4)
|
4.2
|
(27)
|
Note
Purchase Agreement, dated July 29, 2008 for 6.46% Series A Senior Notes,
6.51% Series B Senior Notes, and 6.61% Series C Senior
Notes.
|
|
|
(4)
|
4.3
|
(27)
|
Note
Purchase Agreement, dated December 10, 2009 for 5.61% Senior
Notes.
|
|
|
(10)
|
10.1
|
(4)
|
Stockholder
Agreement, dated as of July 1, 1964, among the various stockholders of
Connecticut Yankee Atomic Power Company, including The United Illuminating
Company.
|
|
|
(10)
|
10.2a
|
(4)
|
Power
Contract, dated as of July 1, 1964, between Connecticut Yankee Atomic
Power Company and The United Illuminating Company.
|
|
|
Exhibit
Table
Item No.
|
Exhibit
No.
|
Reference
No.
|
Description
|
|
|
(10)
|
10.2b
|
(5)
|
Additional
Power Contract, dated as of April 30, 1984, between Connecticut Yankee
Atomic Power Company and The United Illuminating Company.
|
|
|
(10)
|
10.2c
|
(6)
|
1987
Supplementary Power Contract, dated as of April 1, 1987,
supplementing Exhibits 10.2a and 10.2b.
|
|
|
(10)
|
10.2d
|
(6)
|
1996
Amendatory Agreement, dated as of December 4, 1996, amending Exhibits
10.2b and 10.2c.
|
|
|
(10)
|
10.2e
|
(6)
|
First
Supplement to 1996 Amendatory Agreement, dated as of February 10,
1997, supplementing Exhibit 10.2d.
|
|
|
(10)
|
10.3
|
(4)
|
Capital
Funds Agreement, dated as of September 1, 1964, between Connecticut Yankee
Atomic Power Company and The United Illuminating Company.
|
|
|
(10)
|
10.4
|
(7)
|
Capital
Contributions Agreement, dated October 16, 1967, between The United
Illuminating Company and Connecticut Yankee Atomic Power
Company. (Exhibit
|
|
|
(10)
|
10.5
|
(11)
|
Amended
and restated Transmission Line Agreement, dated May 15, 2003, between the
State of Connecticut Department of Transportation and The United
Illuminating Company
|
|
|
(10)
|
10.6
|
(8)
|
Agreement
and Supplemental Agreement, effective June 9, 2002, between The
United Illuminating Company and Local 470-1, Utility Workers Union of
America, AFL-CIO.
|
|
|
(10)
|
10.7*
|
(13)
|
Employment
Agreement, dated as of July 8, 2005, between The United Illuminating
Company and Richard J. Nicholas.
|
|
|
(10)
|
10.7a*
|
(26)
|
First
Amendment, dated August 4, 2008, to Employment Agreement, dated as of July
8, 2005, between The United Illuminating Company and Richard J.
Nicholas.
|
|
|
(10)
|
10.8*
|
(13)
|
Performance
Share Agreement for TSR Performance Shares, dated July 8, 2005, between
UIL Holdings Corporation and Richard J. Nicholas.
|
|
|
(10)
|
10.9*
|
(17)
|
Stock
Option Agreement, dated September 26, 2005, between UIL Holdings
Corporation and Richard J. Nicholas.
|
|
|
(10)
|
10.10*
|
(14)
|
Employment
Agreement, dated as of January 10, 2006, between UIL Holdings Corporation
and James P. Torgerson.
|
|
|
(10)
|
10.10a*
|
(26)
|
First
Amendment, dated August 4, 2008, to Employment Agreement, dated as of
January 10, 2006, between UIL Holdings Corporation and James P.
Torgerson.
|
|
|
(10)
|
10.11*
|
(10)
|
UIL
Holdings Corporation 1999 Amended and Restated Stock Plan, as Amended and
Restated effective March 24, 2003.
|
|
|
(10)
|
10.12a*
|
(15)
|
First
Amendment to the UIL Holdings Corporation 1999 Amended and Restated Stock
Plan, dated July 26, 2005.
|
|
|
(10)
|
10.12b*
|
(23)
|
Second
Amendment to the UIL Holdings Corporation 1999 Amended and Restated Stock
Plan, dated March 27, 2007.
|
|
|
(10)
|
10.12c*
|
(24)
|
Third
Amendment to the UIL Holdings Corporation 1999 Amended and Restated Stock
Plan, dated December 23, 2007.
|
|
|
(10)
|
10.13*
|
(26)
|
Amended
and restated UIL Holdings Corporation Change In Control Severance Plan
dated August 4, 2008.
|
|
|
(10)
|
10.14*
|
(9)
|
Non-Employee
Directors’ Common Stock and Deferred Compensation Plan of UIL Holdings
Corporation, as amended through December 31, 2000.
|
|
|
(10)
|
10.15*
|
(1)
|
UIL
Holdings Corporation Non-Employee Directors Change in Control Severance
Plan.
|
|
|
(10)
|
10.16*
|
(20)
|
UIL
Holdings Corporation Deferred Compensation Plan, as originally adopted
effective January 27, 2003, reflecting amendments through March 24,
2003.
|
|
|
(10)
|
10.17a*
|
(18)
|
Second
Amendment to the UIL Holdings Corporation Deferred Compensation
Plan.
|
|
|
(10)
|
10.17b*
|
(23)
|
Third
Amendment to the UIL Holdings Corporation Deferred Compensation Plan,
dated March 27, 2007.
|
|
|
(10)
|
10.18*
|
(12)
|
UIL
Holdings Corporation Senior Executive Incentive Compensation
Program.
|
|
|
(10)
|
10.19*
|
(16)
|
UIL
Holdings Corporation Executive Incentive Compensation
Program
|
|
Exhibit
Table
Item No.
|
Exhibit
No.
|
Reference
No.
|
Description
|
|
| (10) | 10.19a* |
(16)
|
First Amendment to UIL Holdings Corporation Executive Incentive Compensation Program |
|
(10)
|
10.20*
|
(16)
|
Form
of Annual Performance Share Agreement under the UIL Holdings Corporation
1999 Amended and Restated Stock Plan
|
|
|
(10)
|
10.21*
|
(23)
|
Employment
Agreement, dated February 28, 2007, between UIL Holdings Corporation and
Linda L. Randell.
|
|
|
(10)
|
10.21a*
|
(26)
|
First
Amendment, dated August 4, 2008, to Employment Agreement, dated as of
February 28, 2007, between UIL Holdings Corporation and Linda L.
Randell.
|
|
|
(10)
|
10.22*
|
(25)
|
Employment
Agreement, dated January 26, 2004, between The United Illuminating Company
and Anthony J. Vallillo.
|
|
|
(10)
|
10.22a*
|
(25)
|
First
Amendment, dated, November 18, 2004 to Employment Agreement, dated as of
January 26, 2004, between The United Illuminating Company and Anthony J.
Vallillo.
|
|
|
(10)
|
10.22b*
|
(25)
|
Second
Amendment, dated, November 28, 2005 to Employment Agreement, dated as of
January 26, 2004, between The United Illuminating Company and Anthony J.
Vallillo.
|
|
|
(10)
|
10.22c*
|
(26)
|
Third
Amendment, dated August 4, 2008, to Employment Agreement, dated as of
January 26, 2004, between The United Illuminating Company and Anthony J.
Vallillo.
|
|
|
(10)
|
10.23*
|
(25)
|
Employment
Agreement, dated March 26, 2004, between The United Illuminating Company
and Richard J. Reed.
|
|
|
(10)
|
10.23a*
|
(25)
|
First
Amendment, dated, November 18, 2004 to Employment Agreement, dated as of
March 26, 2004, between The United Illuminating Company and Richard J.
Reed.
|
|
|
(10)
|
10.23b*
|
(26)
|
Second
Amendment, dated August 4, 2008, to Employment Agreement, dated as of
March 26, 2004, between The United Illuminating Company and Richard J.
Reed.
|
|
|
(10)
|
10.24*
|
(25)
|
Employment
Agreement, dated July 1, 2005, between The United Illuminating Company and
Steven P. Favuzza.
|
|
|
(10)
|
10.25*
|
(26)
|
UIL
Holdings Corporation 2008 Stock and Incentive Compensation Plan dated May
14, 2008
|
|
|
(10)
|
10.26*
|
(26)
|
The
United Illuminating Company Deferred Compensation Plan Grandfathered
Benefits Provisions dated August 4, 2008.
|
|
|
(10)
|
10.27*
|
(26)
|
The
United Illuminating Company Deferred Compensation Plan Non-Grandfathered
Benefits Provisions dated August 4, 2008.
|
|
|
(10)
|
10.28*
|
(26)
|
The
United Illuminating Company Supplemental Executive Retirement Plan
Grandfathered Benefits Provisions dated August 4, 2008.
|
|
|
(10)
|
10.29*
|
(26)
|
The
United Illuminating Company Supplemental Executive Retirement Plan
Non-Grandfathered Benefits Provisions dated August 4,
2008.
|
|
|
(14)
|
14
|
(21)
|
UIL
Holdings Corporation Code of Ethics for the Chief Executive Officer,
Presidents, and Senior Financial Officers. (Exhibit 14)
|
|
|
(23)
|
23
|
Consent
of Independent Registered Public Accounting Firm
|
||
|
(31)
|
31.1
|
Certification
of Periodic Financial Report.
|
||
|
(31)
|
31.2
|
Certification
of Periodic Financial Report.
|
||
|
(32)
|
32
|
Certification
of Periodic Financial Report.
|
______________________
* Management
contract or compensatory plan or arrangement.
|
**
|
UIL
Holdings agrees to furnish a supplementary copy of any omitted schedules
to this Agreement to the Securities and Exchange Commission upon
request.
|
The
foregoing list of exhibits does not include instruments defining the rights of
the holders of certain long-term debt of UIL Holdings Corporation and its
subsidiaries where the total amount of securities authorized to be issued under
the instrument does not exceed ten percent (10%) of the total assets of UIL
Holdings Corporation and its subsidiaries on a consolidated basis; and UIL
Holdings Corporation hereby agrees to furnish a copy of each such instrument to
the Securities and Exchange Commission on request.
SIGNATURES
Pursuant
to the requirements of Section 13 of the Securities Exchange Act of 1934, UIL
Holdings has duly caused this report to be signed on its behalf by the
undersigned, thereunto duly authorized.
|
UIL
HOLDINGS CORPORATION
|
|
Date: February 17,
2010
|
By
|
/s/ James P. Torgerson
|
|
|
James P.
Torgerson
|
|||
|
President and
Chief Executive Officer
|
Pursuant
to the requirements of the Securities Exchange Act of 1934, this report has been
signed below by the following persons on behalf of the registrant and in the
capacities and on the dates indicated.
|
Signature
|
Title
|
Date
|
|
|
/s/ James P. Torgerson
|
Director,
President and Chief Executive Officer
|
February
17, 2010
|
|
|
(James
P. Torgerson)
(Principal
Executive Officer)
|
|
||
|
/s/ Richard J. Nicholas
|
Executive
Vice President and Chief Financial Officer
|
February
17, 2010
|
|
|
(Richard
J. Nicholas)
|
|
||
|
(Principal
Financial Officer)
|
|||
|
/s/ Steven P. Favuzza
|
Vice
President and Controller
|
February
17, 2010
|
|
|
(Steven
P. Favuzza)
|
|
||
|
(Principal
Accounting Officer)
|
|||
|
/s/ F. Patrick McFadden,
Jr.
|
Director
and Chairman
|
February
17, 2010
|
|
|
(F.
Patrick McFadden, Jr.)
|
|||
|
/s/ Betsy Henley-Cohn
|
Director
|
February
17, 2010
|
|
|
(Betsy
Henley-Cohn)
|
|||
|
/s/ James A. Thomas
|
Director
|
February
17, 2010
|
|
|
(James
A. Thomas)
|
|||
|
/s/ John L. Lahey
|
Director
|
February
17, 2010
|
|
|
(John
L. Lahey)
|
|
Signature
|
Title
|
Date
|
|
|
/s/ Marc C. Breslawsky
|
Director
|
February
17, 2010
|
|
|
(Marc
C. Breslawsky)
|
|||
|
/s/ Thelma R. Albright
|
Director
|
February
17, 2010
|
|
|
(Thelma
R. Albright)
|
|||
|
/s/ Arnold L.
Chase
|
Director
|
February
17, 2010
|
|
|
(Arnold
L. Chase)
|
|||
|
/s/ Daniel J.
Miglio
|
Director
|
February
17, 2010
|
|
|
(Daniel
J. Miglio)
|
|||
|
/s/ William F. Murdy
|
Director
|
February
17, 2010
|
|
|
(William
F. Murdy)
|
|||
|
/s/ Donald R. Shassian
|
Director
|
February
17, 2010
|
|
|
(Donald
R. Shassian)
|
|||
|
UIL
Holdings Corporation
|
||||||||||||||||||||||
|
Schedule
II - Valuation and Qualifying Accounts
|
||||||||||||||||||||||
|
For
the Year Ended December 31, 2009, 2008 and 2007
|
||||||||||||||||||||||
|
(Thousands
of Dollars)
|
||||||||||||||||||||||
|
Col.
A.
|
Col.
B.
|
Col.
C
|
Col.
D.
|
Col.
E.
|
||||||||||||||||||
|
Additions
|
||||||||||||||||||||||
|
Balance
at
|
Charged
to
|
Charged
to
|
Balance
at
|
|||||||||||||||||||
|
Beginning
|
Costs
and
|
Other
|
End
|
|||||||||||||||||||
|
Classification
|
of
Period
|
Expenses
|
Accounts
|
Deductions
|
of
Period
|
|||||||||||||||||
|
RESERVE
DEDUCTION FROM
|
||||||||||||||||||||||
|
ASSETS
TO WHICH IT APPLIES:
|
||||||||||||||||||||||
|
Reserve
for uncollectible
|
||||||||||||||||||||||
|
accounts
(consolidated):
|
||||||||||||||||||||||
|
2009
|
$ | 4,500 | $ | 22,176 | $ | - | $ | 22,176 |
(A)
|
$ | 4,500 | |||||||||||
|
2008
|
$ | 3,900 | $ | 22,150 | $ | - | $ | 21,550 |
(A)
|
$ | 4,500 | |||||||||||
|
2007
|
$ | 2,600 | $ | 15,856 | $ | - | $ | 14,556 |
(A)
|
$ | 3,900 | |||||||||||
|
(A)
Accounts written off, net of recoveries
|
||||||||||||||||||||||
S-1