As filed with the Securities and Exchange Commission on
February 17, 2010
Registration No. 333-161329
UNITED STATES
SECURITIES AND EXCHANGE
COMMISSION
Washington, D.C.
20549
Amendment No. 3
to
Form S-1
REGISTRATION
STATEMENT
UNDER
THE SECURITIES ACT OF
1933
MIRION TECHNOLOGIES,
INC.
(Exact Name of Registrant as
Specified in Its Charter)
| |
|
|
|
|
|
Delaware
|
|
3829
|
|
20-3979555
|
|
(State or Other Jurisdiction
of
|
|
(Primary Standard
Industrial
|
|
(I.R.S. Employer
|
|
Incorporation or
Organization)
|
|
Classification Code
Number)
|
|
Identification
Number)
|
3000 Executive Parkway, Suite 222
San Ramon, CA 94583
(925) 543-0800
(Address, Including Zip Code,
and Telephone Number, Including Area Code, of Registrant’s
Principal Executive Offices)
Jack A. Pacheco
Vice President and Chief Financial Officer
Mirion Technologies, Inc.
3000 Executive Parkway, Suite 222
San Ramon, CA 94583
(925) 543-0800
(Name, Address, Including Zip
Code, and Telephone Number, Including Area Code, of Agent For
Service)
Copies to:
| |
|
|
|
Alan F. Denenberg, Esq.
|
|
Tad J. Freese, Esq.
|
|
Davis Polk & Wardwell LLP
|
|
Latham & Watkins LLP
|
|
1600 El Camino Real
|
|
140 Scott Drive
|
|
Menlo Park, CA 94025
|
|
Menlo Park, CA 94025
|
|
(650) 752-2000
|
|
(650) 328-4600
|
|
|
|
|
Approximate date of commencement of proposed sale to the
public: As soon as practicable after the
effective date of this Registration Statement.
If any of the securities being registered on this form are to be
offered on a delayed or continuous basis pursuant to
Rule 415 under the Securities Act of 1933, check the
following
box. o
If this form is filed to register additional securities for an
offering pursuant to Rule 462(b) under the Securities Act,
check the following box and list the Securities Act registration
statement number of the earlier effective registration statement
for the same
offering. o
If this form is a post-effective amendment filed pursuant to
Rule 462(c) under the Securities Act, check the following
box and list the Securities Act registration statement number of
the earlier effective registration statement for the same
offering. o
If this form is a post-effective amendment filed pursuant to
Rule 462(d) under the Securities Act, check the following
box and list the Securities Act registration statement number of
the earlier effective registration statement for the same
offering. o
Indicate by check mark whether the registrant is a large
accelerated filer, an accelerated filer, a non-accelerated
filer, or a smaller reporting company. See the definitions of
“large accelerated filer,” “accelerated
filer” and “smaller reporting company” in Rule
12b-2 of the
Exchange Act. (Check one):
|
|
|
|
| Large
accelerated
filer o
|
Accelerated
filer o
|
Non-accelerated
filer þ
|
Smaller reporting
company o
|
(Do not check if a smaller
reporting company)
The Registrant hereby amends this Registration Statement on
such date or dates as may be necessary to delay its effective
date until the Registrant shall file a further amendment which
specifically states that this Registration Statement shall
thereafter become effective in accordance with Section 8(a)
of the Securities Act of 1933 or until the Registration
Statement shall become effective on such date as the Commission,
acting pursuant to said Section 8(a), may determine.
The
information in this prospectus is not complete and may be
changed. We may not sell these securities until the registration
statement filed with the Securities and Exchange Commission is
effective. This prospectus is not an offer to sell these
securities and we are not soliciting offers to buy these
securities in any state where the offer or sale is not
permitted.
|
SUBJECT TO COMPLETION, DATED FEBRUARY 17, 2010
Shares
Mirion
Technologies, Inc.
Common
Stock
This is an initial
public offering of shares of common stock of Mirion
Technologies, Inc.
We are
selling shares
of common stock.
Prior to this
offering, there has been no public market for our common stock.
We expect the initial public offering price to be between
$ and
$ per share. We have applied to
list our common stock for quotation on the NASDAQ Global Market
under the symbol “MION.”
We have granted the
underwriters an option to purchase a maximum
of additional
shares of common stock. The underwriters can exercise this
option at any time within 30 days from the date of this
prospectus.
Investing in our
common stock involves risks. See “Risk Factors” on
page 10.
| |
|
|
|
|
|
|
|
|
|
|
|
Underwriting
|
|
|
|
|
|
Price to
|
|
Discounts and
|
|
Proceeds to
|
|
|
|
Public
|
|
Commissions
|
|
Us
|
|
|
|
Per Share
|
|
$
|
|
$
|
|
$
|
|
Total
|
|
$
|
|
$
|
|
$
|
Delivery of the
shares of common stock in book-entry form only will be made on
or
about ,
2010.
Neither the
Securities and Exchange Commission nor any state securities
commission has approved or disapproved of these securities or
determined if this prospectus is truthful or complete. Any
representation to the contrary is a criminal offense.
| |
|
|
|
|
|
Credit Suisse
|
|
BofA Merrill Lynch
|
|
J.P. Morgan
|
Baird
The date of this
prospectus
is ,
2010
| Protecting people, A global provider of radiation products and services to markets. the |
TABLE OF
CONTENTS
You should rely only on the information contained in this
prospectus and any free writing prospectus prepared by us.
Neither we nor the underwriters have authorized any other person
to provide you with different information. If anyone provides
you with different or inconsistent information, you should not
rely on it. We are not making an offer of these securities in
any jurisdiction where the offer is not permitted. You should
not assume that the information contained in this prospectus is
accurate as of any date other than the date on the front of this
prospectus.
“Mirion Technologies,” “Mirion,”
“GDS,” “Global Dosimetry Solutions,”
“HandFoot-Fibre,” “Imaging and Sensing
Technology,” “IST,” “MGP Instruments,”
“MGPI,” “SPIR Ident,” “Synodys,”
“TwoStep-Exit” and any corresponding logos, are our
common law and registered trademarks. Solely for convenience, we
refer to our trademarks in this prospectus without the
tm
and
®
symbols, but such references are not intended to indicate that
we will not assert our rights to our trademarks. Other service
marks, trademarks and trade names referred to in this prospectus
are the property of their owners.
References to “fiscal” before any year refer to our
fiscal year ending on June 30th of the year referenced.
Dealer
Prospectus Delivery Obligation
Until and
including ,
2010 (25 days after the date of this prospectus), all
dealers that effect transactions in these securities, whether or
not participating in this offering, may be required to deliver a
prospectus. This is in addition to the dealers’ obligation
to deliver a prospectus when acting as underwriter and with
respect to unsold allotments or subscriptions.
i
PROSPECTUS
SUMMARY
This summary highlights the more detailed information
contained elsewhere in this prospectus. This summary does not
contain all of the information that you should consider before
deciding to invest in our common stock. You should read the
entire prospectus, including the risk factors, the consolidated
financial statements and the related notes, and the other
documents to which this prospectus refers, carefully before
making an investment decision. In this prospectus,
“Mirion,” the “Company,” “we,”
“us” or “our” refer to Mirion Technologies,
Inc. and its subsidiaries, except where the context makes clear
that the reference is only to Mirion Technologies, Inc. and is
not inclusive of its subsidiaries.
Our
Company
We are a global provider of radiation detection, measurement,
analysis and monitoring products and services to the nuclear,
defense and medical end markets. Our customers rely on our
solutions to protect people, property and the environment from
nuclear and radiological hazards. Our products and services
include: dosimeters; contamination & clearance
monitors; detection & identification instruments;
radiation monitoring systems; electrical penetrations; reactor
instrumentation & control equipment and systems;
dosimetry services; imaging systems; and related accessories,
software and services. Many of our end markets are characterized
by the need to meet rigorous regulatory standards, design
qualifications and operating requirements. We believe these
industry dynamics create substantial barriers to entry, thereby
reinforcing our market position. We have leveraged the strength
of our nuclear platform to expand the commercial applications of
our technologies to defense and medical end markets. The
diversity of our end markets and the global nature of our
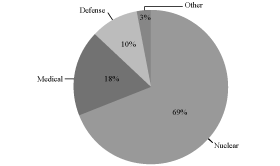
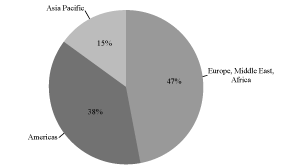
customer base are illustrated in the charts below:
| |
|
|
|
Fiscal 2009 Revenue by End Markets
|
|
Fiscal 2009 Revenue by Geography
|
|
|
|
|
|
|
|
|
|
|
Fiscal 2009 Revenue: $201.8 Million
|
For more than 50 years, we and our predecessor companies
have delivered products and services that help ensure the safe
and efficient operation of nuclear facilities. We believe the
breadth and proven performance of our solutions support our
longstanding strategic customer relationships across diverse end
markets. Our products and services have been sold directly and
indirectly to a variety of end-use customers including, but not
limited to, all of the U.S. nuclear power producers, 397 of
the global installed base of 436 active nuclear power reactors,
many of the leading reactor design firms, 17 of the 28 NATO
militaries, numerous international government and supranational
agencies, as well as medical service providers and industrial
companies worldwide.
Our broad product and services portfolio of radiation detection,
measurement, analysis and monitoring solutions is supported by
165 scientists, engineers and technicians, who represented
approximately 19% of our workforce as of December 31, 2009.
We possess numerous product qualifications, trade secrets and
patents that support our market position and our ability to
deliver next generation products and services. In addition, we
maintain design, manufacturing and sales capabilities across
seven countries, enabling us to capitalize on growth
opportunities, including the anticipated increase in demand for
nuclear power and ongoing spending for defense and homeland
security.
1
Our financial performance is driven by the replacement of
products and the recurring provision of services into our core
end markets, as well as the construction of new nuclear power
plants, or NPPs, globally. Many of our products are ordered well
in advance of the anticipated shipment date, providing
visibility into future revenue through our backlog and deferred
contract revenue, which totaled $247.1 million and
$66.8 million as of December 31, 2009. We generated
revenue of $201.8 million, Adjusted EBITDA of
$40.6 million and a net loss of $4.0 million for
fiscal 2009. See page 8 for a definition and
reconciliation of Adjusted EBITDA to cash provided by (used in)
operations.
Our
Market Opportunities
We sell our radiation detection, measurement, analysis and
monitoring products and services into the global nuclear,
defense and medical end markets. We believe that our end markets
are characterized by strong fundamentals that support a robust
revenue base and provide numerous growth opportunities.
Nuclear
The nuclear end market spans the entire nuclear fuel cycle,
including mining, enrichment, fuel manufacturing, nuclear power
generation, waste management and fuel reprocessing. Key nuclear
installations include mines, fuel fabrication facilities,
commercial nuclear power reactors, reprocessing facilities,
research facilities, military facilities and ships, weapons
facilities and waste storage facilities. We sell products and
services for use in each of these types of installations, with
commercial nuclear power reactors representing the majority of
our sales into the nuclear end market. As of December 31, 2009,
our products were installed at 91% of active nuclear power
reactors globally, including all of those in the United States.
We believe that the global installed base of nuclear reactors
presents opportunities for replacements and upgrades of our
products, as well as those of legacy suppliers, and for
participation in the “decommissioning” process.
We also expect the increase in nuclear reactor construction
worldwide to provide opportunities across our offerings.
Defense
Our global defense end market is driven by a combination of
military, civil defense and event-driven security spending which
in turn has been fueled by the unprecedented growth in global
security threats.
Medical
The use of radiodiagnostic and radiotherapeutic procedures is
expanding globally due to aging population demographics,
technological advancements and emerging middle classes in China
and India, creating a significant opportunity for us in the
medical end market.
Our
Competitive Strengths
Trusted radiation detection, measurement, analysis and
monitoring provider. The nuclear industry is
highly regulated and requires compliance with strict product
specifications. Our trusted, recognized brands supported by our
tradition of technical excellence, product reliability and
customer service have enabled us to develop strong market share
across our product and service offerings.
Broad and complementary product and service
portfolio. We offer radiation detection,
measurement, analysis and monitoring products and services to
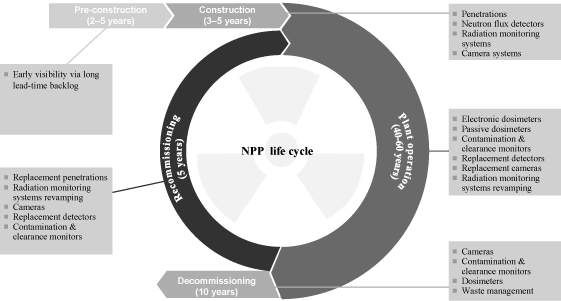
satisfy customer requirements throughout the NPP life cycle.
Large installed base drives recurring
revenue. Our large installed base at active
nuclear power reactors drives recurring revenue through
replacement and service cycles.
Technical complexity creates high barriers to
entry. We design products to meet demanding
customer specifications, qualifications and regulatory
requirements.
2
Global footprint designed to meet local customer
needs. Our global footprint, augmented by our
established network of suppliers and distributors, enables us to
be responsive to our customers and provide locally customized
solutions.
Seasoned management team complemented by highly skilled
engineers. We are led by an experienced
management team with a mix of private sector and government
experience across different industries and functions.
Our
Strategy
Our objective is to continue enhancing our position as a global
provider of radiation detection, measurement, analysis and
monitoring products and services for the nuclear, defense and
medical end markets. We intend to achieve this through the
following strategies:
|
|
|
| |
•
|
Exploit under-penetrated market opportunities.
|
| |
| |
•
|
Expand addressable market.
|
|
|
|
| |
•
|
Geographic expansion. We believe we can
increase our presence in the international market. For example,
we intend to leverage our relationships with leading reactor
design firms to capitalize on the opening of India’s
nuclear end market to U.S. firms due to a recent treaty
ratification.
|
| |
| |
•
|
Customer outsourcing. Some NPP operators have
recently outsourced their dosimetry services in order to reduce
costs. We have been able to benefit from economies of scale as
well as advantages in materials procurement and processing
technology to provide enhanced dosimetry services to many of
these NPPs at a lower cost.
|
| |
| |
•
|
Service privatization. In some regions outside
the United States, dosimetry services have historically been
provided by government agencies. However, privatization of
dosimetry services is accelerating in some regions, such as
Europe, as providers seek to reduce costs and benefit from
enhanced service offerings, providing an opportunity to leverage
our expertise and North American service experience.
|
| |
| |
•
|
New applications for existing technologies.
|
|
|
|
| |
•
|
Develop new products and services.
|
| |
| |
•
|
Continuously improve our cost structure and
productivity.
|
| |
| |
•
|
Pursue strategic acquisitions.
|
Our
Principal Investor
Upon completion of this offering, American Capital, Ltd.
(together with American Capital Equity I, LLC and American
Capital Equity II, LP, “ACAS”) will beneficially own
approximately % of our outstanding
common stock, or approximately % if
the underwriters exercise in full their over-allotment option to
purchase additional shares of common stock. We are party to a
number of agreements with ACAS and its affiliates. These
agreements are described in the sections of this prospectus
captioned, “Risk Factors—Risks Related to this
Offering and Our Common Stock,” “Use of
Proceeds,” “Certain Relationships and Related Party
Transactions” and “Principal Stockholders.”
ACAS is a publicly traded private equity firm and global asset
manager, with $12 billion in capital resources under
management as of September 30, 2009.
Risk
Factors
Our business is subject to many risks and uncertainties,
including those highlighted in the section of this prospectus
entitled “Risk Factors.” These risks could materially
and adversely affect our business, financial
3
condition and results of operation, which could cause the
trading price of our common stock to decline and could result in
a partial or total loss of your investment. Some of these risks
include:
|
|
|
| |
•
|
the long and unpredictable nature of our sales cycle;
|
| |
| |
•
|
fluctuations in our financial performance;
|
| |
| |
•
|
our short operating history as a consolidated entity;
|
| |
| |
•
|
material weaknesses in our internal controls over financial
reporting;
|
| |
| |
•
|
the highly competitive nature of our markets and the resources
of our competitors;
|
| |
| |
•
|
the uncertain fulfillment of our backlog;
|
| |
| |
•
|
the effect of the current global financial crisis and worldwide
economic conditions; and
|
| |
| |
•
|
changes in our customers’ budgets for radiation detection
products and services and the timing of their purchasing
decisions.
|
Company
Information
We incorporated in Delaware in October 2005 as Global Monitoring
Services, Inc., and combined our three predecessor companies
under Global Monitoring Services, Inc. in December 2005.
ACAS originally acquired our predecessor company Synodys SA
(Synodys) in June 2004, our predecessor company Imaging and
Sensing Technology Company (IST) in October 2004 and our
predecessor company Global Dosimetry Solutions, Inc. (GDS) in
October 2005. We changed our name in January 2006 to Mirion
Technologies, Inc. Our principal executive offices are located
at 3000 Executive Parkway, Suite 222, San Ramon,
California 94583 and our telephone number is
(925) 543-0800.
Our website is www.mirion.com. The information that appears on
our website is not part of, and is not incorporated into, this
prospectus.
4
The
Offering
|
|
|
|
Common stock offered by us |
|
shares |
|
Common stock to be outstanding after this offering |
|
shares |
|
Over-allotment option |
|
We have granted the underwriters a
30-day
option to purchase from us up to an
additional shares
of our common stock to cover over-allotments. |
|
Dividend policy |
|
We do not anticipate paying any dividends on our common stock in
the foreseeable future. See “Dividend Policy.” |
|
|
|
|
Risk factors |
|
Investing in our common stock involves a high degree of risk.
See “Risk Factors” beginning on page 10 of
this prospectus for a discussion of factors you should carefully
consider before investing in our common stock. |
|
|
|
|
Use of proceeds |
|
We estimate that the net proceeds from this offering, after
deducting underwriting discounts and estimated offering
expenses, will be approximately
$ million, assuming the
shares are offered at $ per share,
the midpoint of the price range set forth on the cover page of
this prospectus. We intend to use approximately
$96.2 million of the net proceeds from the shares that we
sell in this offering to repay borrowings from ACAS and its
affiliates. We intend to repay all other debt held by ACAS and
its affiliates (estimated to be approximately $87.9 million
as of February 28, 2010) with borrowings under our
anticipated new bank credit facilities that we expect to enter
into upon the consummation of this offering. We also intend to
use net proceeds from this offering to make a one-time payment
of $8.0 million to American Capital Financial Services,
Inc., or ACFS, a subsidiary of ACAS, to terminate an investment
banking services agreement between us and ACFS. See “Use of
Proceeds.” |
|
|
|
|
Proposed NASDAQ symbol |
|
MION |
The number of shares of common stock to be outstanding after
this offering is based on 1,250,786 preferred and common shares
outstanding as of December 31, 2009. Absent further
transactions, if this offering were to occur on
February 28, 2010, there would be 1,268,661 shares of
common stock (including preferred stock on an
as-converted
basis) outstanding. The increase in the number of shares is due
to the monthly accrual of dividends from the
A-1 and
A-2
convertible preferred stock which are paid in the form of
additional shares of convertible preferred stock. Shares
outstanding as of December 31, 2009 and February 28,
2010 exclude:
|
|
|
| |
•
|
113,288 shares of common stock subject to outstanding
options as of December 31, 2009 at a weighted average
exercise price of $122.77 per share;
|
|
|
|
| |
•
|
5,402 additional shares of common stock reserved for issuance
under our existing stock option plan, all of which are expected
to be granted to our employees, including our executive
officers, immediately following the pricing of this offering at
an exercise price equal to the initial public offering price;
|
|
|
|
| |
•
|
106,160 shares of common stock to be reserved for issuance
under our amended and restated stock plan to become effective in
connection with this offering; and
|
|
|
|
| |
•
|
402,428 shares of common stock subject to outstanding
warrants as of December 31, 2009 at a weighted average
exercise price of $0.00152 per share. These warrants only
become exercisable upon a sale, liquidation or dissolution of
the Company or approval by the Board of Directors. The Board of
Directors does not currently intend to approve the exercise of
such warrants.
|
Except as otherwise indicated, all information in this
prospectus assumes that:
|
|
|
| |
•
|
a -for- split
of our common stock will occur prior to the consummation of this
offering;
|
|
|
|
| |
•
|
all of the outstanding shares of our convertible preferred stock
will be converted into shares of our common stock;
|
| |
•
|
all of the outstanding shares of our Class A Voting Common
Stock and Class B Non-Voting Common Stock will be converted
into shares of our common stock on a one-to-one basis;
|
| |
•
|
we will file our amended and restated Certificate of
Incorporation prior to the consummation of this
offering; and
|
| |
•
|
the underwriters will not exercise their over-allotment option.
|
5
Summary
Consolidated Financial Data
The following table summarizes the consolidated financial data
for our business. You should read this summary consolidated
financial data in conjunction with the sections titled
“Selected Consolidated Financial Data” and
“Management’s Discussion and Analysis of Financial
Condition and Results of Operations” and our consolidated
financial statements and related notes, all included elsewhere
in this prospectus. The summary financial data in this section
is not intended to replace the consolidated financial statements
and related notes included in this prospectus. The summary
consolidated statements of operations data for each of the three
fiscal years ending June 30, 2007, 2008 and 2009 are
derived from our audited annual consolidated financial
statements and related notes included elsewhere in this
prospectus. The consolidated statements of operations data for
the six months ended December 31, 2008 and 2009 and the
consolidated balance sheet data as of December 31, 2009 are
derived from our unaudited consolidated financial statements
included elsewhere in this prospectus. Our historical results
are not necessarily indicative of the results that should be
expected in the future, and results for the six months ended
December 31, 2009 are not necessarily indicative of results
to be expected for the full year. The amounts below are in
thousands, except percentages, share and per share data.
| |
|
|
|
|
|
|
|
|
|
|
|
|
|
|
|
|
|
|
|
|
|
|
|
|
|
|
Six Months Ended
|
|
|
|
|
Year Ended June 30,
|
|
|
December 31,
|
|
|
|
|
2007
|
|
|
2008
|
|
|
2009
|
|
|
2008
|
|
|
2009
|
|
|
|
|
Consolidated Statement of
Operations Data:
|
|
|
|
|
|
|
|
|
|
|
|
|
|
|
|
|
|
|
|
|
|
Revenue
|
|
$
|
169,033
|
|
|
$
|
191,769
|
|
|
$
|
201,763
|
|
|
$
|
100,519
|
|
|
$
|
108,658
|
|
|
Cost of revenue
|
|
|
94,321
|
|
|
|
102,790
|
|
|
|
105,954
|
|
|
|
53,793
|
|
|
|
60,140
|
|
|
|
|
|
|
|
|
|
|
|
|
|
|
|
|
|
|
|
|
|
|
|
|
Gross profit
|
|
|
74,712
|
|
|
|
88,979
|
|
|
|
95,809
|
|
|
|
46,726
|
|
|
|
48,518
|
|
|
|
|
|
|
|
|
|
|
|
|
|
|
|
|
|
|
|
|
|
|
|
|
% of revenue
|
|
|
44.2
|
%
|
|
|
46.4
|
%
|
|
|
47.5
|
%
|
|
|
46.5
|
%
|
|
|
44.7
|
%
|
|
Operating expenses
|
|
|
|
|
|
|
|
|
|
|
|
|
|
|
|
|
|
|
|
|
|
Selling, general and administrative expenses
|
|
|
59,449
|
|
|
|
63,177
|
|
|
|
65,649
|
|
|
|
31,310
|
|
|
|
33,754
|
|
|
Research and development expenses
|
|
|
11,875
|
|
|
|
14,865
|
|
|
|
11,282
|
|
|
|
6,277
|
|
|
|
5,202
|
|
|
|
|
|
|
|
|
|
|
|
|
|
|
|
|
|
|
|
|
|
|
|
|
Total operating expenses
|
|
|
71,324
|
|
|
|
78,042
|
|
|
|
76,931
|
|
|
|
37,587
|
|
|
|
38,956
|
|
|
|
|
|
|
|
|
|
|
|
|
|
|
|
|
|
|
|
|
|
|
|
|
Income from operations
|
|
|
3,388
|
|
|
|
10,937
|
|
|
|
18,878
|
|
|
|
9,139
|
|
|
|
9,562
|
|
|
Interest expense, net
|
|
|
19,153
|
|
|
|
20,207
|
|
|
|
17,711
|
|
|
|
9,736
|
|
|
|
7,570
|
|
|
Other income, net
|
|
|
(1,001
|
)
|
|
|
(1,759
|
)
|
|
|
(490
|
)
|
|
|
71
|
|
|
|
(530
|
)
|
|
|
|
|
|
|
|
|
|
|
|
|
|
|
|
|
|
|
|
|
|
|
|
(Loss) Income before provision for income taxes
|
|
|
(14,764
|
)
|
|
|
(7,511
|
)
|
|
|
1,657
|
|
|
|
(668
|
)
|
|
|
2,522
|
|
|
Provision for income taxes
|
|
|
4,937
|
|
|
|
5,838
|
|
|
|
5,612
|
|
|
|
2,890
|
|
|
|
3,293
|
|
|
|
|
|
|
|
|
|
|
|
|
|
|
|
|
|
|
|
|
|
|
|
|
Net loss
|
|
$
|
(19,701
|
)
|
|
$
|
(13,349
|
)
|
|
$
|
(3,955
|
)
|
|
$
|
(3,558
|
)
|
|
$
|
(771
|
)
|
|
|
|
|
|
|
|
|
|
|
|
|
|
|
|
|
|
|
|
|
|
|
|
Paid-in-kind preferred dividends
|
|
|
(8,141
|
)
|
|
|
(8,993
|
)
|
|
|
(9,892
|
)
|
|
|
(4,864
|
)
|
|
|
(5,369
|
)
|
|
|
|
|
|
|
|
|
|
|
|
|
|
|
|
|
|
|
|
|
|
|
|
Net loss allocable to common stockholders
|
|
$
|
(27,842
|
)
|
|
$
|
(22,342
|
)
|
|
$
|
(13,847
|
)
|
|
$
|
(8,422
|
)
|
|
$
|
(6,140
|
)
|
|
|
|
|
|
|
|
|
|
|
|
|
|
|
|
|
|
|
|
|
|
|
|
Pro forma net income per common share — diluted(1)
|
|
|
|
|
|
|
|
|
|
$
|
|
|
|
|
|
|
|
$
|
|
|
|
|
|
|
|
|
|
|
|
|
|
|
|
|
|
|
|
|
|
|
|
|
|
Pro forma net income per common share — diluted as
adjusted(1)
|
|
|
|
|
|
|
|
|
|
$
|
|
|
|
|
|
|
|
$
|
|
|
|
|
|
|
|
|
|
|
|
|
|
|
|
|
|
|
|
|
|
|
|
|
| |
|
|
|
|
|
|
|
|
|
|
|
As of December 31, 2009
|
|
|
|
|
|
|
|
Pro Forma as
|
|
|
Consolidated Balance Sheet Data:
|
|
Actual
|
|
|
Adjusted(2)
|
|
|
|
|
Cash and cash equivalents(3)
|
|
$
|
6,934
|
|
|
|
|
|
|
Total assets
|
|
|
348,540
|
|
|
|
|
|
|
Notes payable to ACAS(4)
|
|
|
183,790
|
|
|
|
|
|
|
New indebtedness(5)
|
|
|
—
|
|
|
|
|
|
|
Total stockholder’s equity
|
|
|
7,680
|
|
|
|
|
|
6
| |
|
|
|
|
|
|
|
|
|
|
|
|
|
|
|
|
|
|
|
|
|
|
|
Year Ended June 30,
|
|
|
Six Months Ended December 31,
|
|
|
|
|
2007
|
|
|
2008
|
|
|
2009
|
|
|
2008
|
|
|
2009
|
|
|
|
|
Other Data:
|
|
|
|
|
|
|
|
|
|
|
|
|
|
|
|
|
|
|
|
|
|
Adjusted EBITDA(6)
|
|
$
|
29,254
|
|
|
$
|
34,218
|
|
|
$
|
40,625
|
|
|
$
|
18,719
|
|
|
$
|
18,512
|
|
|
Amortization of intangible assets
|
|
|
12,200
|
|
|
|
10,140
|
|
|
|
8,144
|
|
|
|
4,161
|
|
|
|
3,699
|
|
|
Capital expenditures
|
|
|
4,316
|
|
|
|
4,953
|
|
|
|
6,649
|
|
|
|
2,441
|
|
|
|
3,354
|
|
| |
|
|
|
|
|
|
|
|
|
|
|
|
|
|
|
|
|
|
|
As of June 30,
|
|
|
As of December 31,
|
|
|
|
|
2007
|
|
|
2008
|
|
|
2009
|
|
|
2009
|
|
|
|
|
Backlog(7)
|
|
$
|
143,887
|
|
|
$
|
177,956
|
|
|
$
|
183,960
|
|
|
$
|
247,083
|
|
|
Deferred contract revenue
|
|
|
44,640
|
|
|
|
53,539
|
|
|
|
62,031
|
|
|
|
66,747
|
|
|
|
|
|
(1)
|
|
Pro forma net income per common
share — diluted and diluted as adjusted for the year
ended June 30, 2009 and the six months ended
December 31, 2009 is calculated as follows:
|
| |
|
|
|
|
|
|
|
|
|
|
|
Year Ended
|
|
|
Six Months Ended
|
|
|
|
|
June 30,
|
|
|
December 31,
|
|
|
|
|
2009
|
|
|
2009
|
|
|
|
|
(unaudited)
|
|
|
|
|
Numerator:
|
|
|
|
|
|
|
|
|
|
Net loss allocable to common stockholders
|
|
$
|
(13,847
|
)
|
|
$
|
(6,140
|
)
|
|
Effect of preferred stock dividends(a)
|
|
|
9,892
|
|
|
|
5,369
|
|
|
Interest expense from paydown of ACAS debt using proceeds of
offering(b)
|
|
|
|
|
|
|
|
|
|
|
|
|
|
|
|
|
|
|
|
Pro forma net income allocable to common
stockholders — basic and diluted
|
|
$
|
|
|
|
$
|
|
|
|
Interest expense reduction from refinancing of ACAS debt(c)
|
|
|
|
|
|
|
|
|
|
|
|
|
|
|
|
|
|
|
|
Pro forma net income allocable to common
stockholders — basic and diluted — as
adjusted
|
|
$
|
|
|
|
$
|
|
|
|
|
|
|
|
|
|
|
|
|
| |
|
|
|
|
|
|
|
|
|
|
|
Year Ended
|
|
|
Six Months Ended
|
|
|
|
|
June 30, 2009
|
|
|
December 31, 2009
|
|
|
|
|
(unaudited)
|
|
|
|
|
Denominator:
|
|
|
|
|
|
|
|
|
|
Weighted average common shares outstanding from conversion of
common stock(d)
|
|
|
47,741
|
|
|
|
47,741
|
|
|
Weighted average common shares outstanding from conversion of
convertible preferred stock(e)
|
|
|
1,099,897
|
|
|
|
1,176,202
|
|
|
Common shares issued in offering(f)
|
|
|
|
|
|
|
|
|
|
|
|
|
|
|
|
|
|
|
|
Shares used in computing pro forma net income per common
share — basic(g)
|
|
|
|
|
|
|
|
|
|
Weighted average common share equivalents of stock options(h)
|
|
|
—
|
|
|
|
11,977
|
|
|
|
|
|
|
|
|
|
|
|
|
Shares used in computing pro forma net income per common
share — diluted(g)
|
|
|
|
|
|
|
|
|
|
|
|
|
|
|
|
|
|
|
|
|
|
|
(a)
|
|
The effect of preferred stock
dividends is added back as a reduction to net loss allocable to
common stockholders, assuming that all preferred stock has been
converted into common shares as of the beginning of the period
presented.
|
|
|
|
|
(b)
|
|
The pro forma reduction in interest
expense assumes the repayment of
$ of ACAS debt using the net
proceeds from this offering, giving effect to the elimination of
the related interest expense as of the beginning of the period
presented.
|
|
|
|
|
(c)
|
|
All ACAS debt not assumed to be
repaid from the net proceeds from this offering is assumed to be
refinanced with a loan from a third-party bank, at interest
rates averaging % lower than existing interest rates
with ACAS giving effect to the elimination of the related
interest expense as of the beginning of the period presented.
|
|
|
|
|
(d)
|
|
The weighted average common shares
outstanding from the conversion of common stock assumes the
conversion of all outstanding shares of Class A Voting
Common Stock and Class B Non-Voting Common Stock on a
one-to-one basis into 47,741 shares of common stock.
|
|
|
|
|
(e)
|
|
The weighted average common shares
outstanding from the conversion of preferred stock assumes the
conversion of all outstanding convertible preferred stock into
common stock, including the conversion into common stock of all
accrued and
|
7
|
|
|
|
|
|
unpaid
paid-in-kind
dividends on convertible preferred stock. The 1,099,897 weighted
average at June 30, 2009 is comprised of 864,307
A-1
preferred shares, which includes 185,503 accrued but unpaid
paid-in-kind
dividends, which are convertible at a rate of 1.1328 into
979,087 common shares and 116,522
A-2
preferred shares, which includes 46,522 accrued but unpaid
paid-in-kind
dividends, which are convertible at a rate of 1.0368 into
120,810 common shares. The 1,176,202 weighted average at
December 31, 2009 is comprised of 917,558
A-1
preferred shares, which includes 238,754 accrued but unpaid
paid-in-kind
dividends, which are convertible at a rate of 1.1328 into
1,039,409 common shares and 131,937
A-2
preferred shares, which includes 61,937 accrued but unpaid
paid-in-kind
dividends, which are convertible at a rate of 1.0368 into
136,793 common shares. The increase in number of preferred
shares between periods is due to the monthly accrual of
preferred dividends which are paid in the form of additional
shares of convertible preferred stock.
|
|
|
|
|
(f)
|
|
Includes all common shares issued
in connection with this offering. Because distributions to ACAS,
our primary stockholder, consisting of obligations under
existing debt arrangements of $
and amounts due of $8.0 million to terminate an existing
investment banking arrangement, exceed our earnings plus gross
proceeds from this offering of $ ,
all common shares are included in the calculation under existing
rules on pro forma calculations.
|
|
|
|
|
(g)
|
|
Excludes 402,428 shares of
common stock subject to outstanding warrants as of June 30,
2009 and December 31, 2009. These warrants only become
exercisable upon a sale, liquidation or dissolution of the
Company or approval by the Board of Directors. The Board of
Directors does not currently intend to approve the exercise of
such warrants.
|
|
|
|
|
(h)
|
|
Includes the impact of the weighted
average shares of common stock into which outstanding options
are convertible. The amount
excludes
and
shares of common stock because the effect would be anti-dilutive
as the strike price of the options exceeds the weighted average
fair value of our stock during the periods presented.
|
|
|
|
|
(2)
|
|
On a pro forma as adjusted basis to
give effect to (i) the sale
of shares
of our common stock to be sold by us through this offering at an
assumed initial public offering price of
$ per share (the midpoint of the
range set forth on the cover page of this prospectus),
(ii) the application of net proceeds from the shares sold
to repay $ million of our
indebtedness to ACAS and its affiliates and to make a one-time,
$8.0 million payment to ACFS and (iii) our intent to
repay all other debt held by ACAS and its affiliates with
borrowings under our anticipated new bank credit facilities that
we expect to enter into upon the consummation of this offering.
|
|
|
|
|
(3)
|
|
As of December 31, 2009, we
also had $6.9 million of restricted cash.
|
|
|
|
|
(4)
|
|
In addition, as of
December 31, 2009, we had $5.8 million of outstanding
debt held by third parties not affiliated with ACAS.
|
|
|
|
|
(5)
|
|
See “Description of Certain
Indebtedness” for information about our anticipated new
bank credit facilities that we expect to enter into upon the
consummation of this offering.
|
|
|
|
|
(6)
|
|
We include Adjusted EBITDA in this
prospectus because (i) it is a basis upon which our
management assesses our operating performance, (ii) it is a
factor in the evaluation of the performance of our management in
determining compensation and (iii) certain maintenance
covenants under our debt agreements are tied to ratios based
upon Adjusted EBITDA, as defined. Adjusted EBITDA, as defined in
our debt agreements, is calculated as net income (loss) plus
(a) without duplication and to the extent deducted in
determining net income for such period, the sum of
(i) interest expense, (ii) income tax expense,
(iii) all amounts attributable to depreciation and
amortization expense, (iv) any extraordinary cash charges
in an amount not to exceed $4,000,000, (v) any
extraordinary non-cash charges, (vi) any other non-cash
charges (but excluding any non-cash charge in respect of an item
that was included in net income in a prior period) and
(vii) any non-recurring fees, costs and expenses as
reflected in our financial statements and any non-recurring
fees, costs and expenses incurred in connection with this
offering minus (b) without duplication and to the
extent included in net income, (i) any cash payments made
in respect of non-cash charges described in clauses (a)(vi) or
(a)(vii) taken in a prior period and (ii) any extraordinary
gains and any non-cash items of income, all calculated on a
consolidated basis in accordance with U.S. GAAP. Adjusted
EBITDA is not a measure of financial performance calculated in
accordance with U.S. GAAP, and should be viewed as a supplement
to—not a substitute for—our results of operations
presented on the basis of U.S. GAAP. Adjusted EBITDA also does
not purport to represent cash flow provided by, or used in,
operating activities in accordance with U.S. GAAP. Our
statements of cash flows, included elsewhere in this prospectus,
present our cash flow activity in accordance with
U.S. GAAP. Furthermore, Adjusted EBITDA is not necessarily
comparable to similarly titled measures reported by other
companies.
|
8
The following is a reconciliation of cash (used in) provided by
operating activities to Adjusted EBITDA:
| |
|
|
|
|
|
|
|
|
|
|
|
|
|
|
|
|
|
|
|
|
|
|
|
|
|
|
Six Months
|
|
|
|
|
|
|
|
Ended
|
|
|
|
|
Year Ended June 30,
|
|
|
December 31,
|
|
|
|
|
2007
|
|
|
2008
|
|
|
2009
|
|
|
2008
|
|
|
2009
|
|
|
|
|
Cash (used in) provided by operating activities
|
|
$
|
(3,569
|
)
|
|
$
|
(6,712
|
)
|
|
$
|
10,031
|
|
|
$
|
(2,842
|
)
|
|
$
|
(4,835
|
)
|
|
Interest expense, net
|
|
|
19,153
|
|
|
|
20,207
|
|
|
|
17,711
|
|
|
|
9,736
|
|
|
|
7,570
|
|
|
Income tax expense
|
|
|
4,937
|
|
|
|
5,838
|
|
|
|
5,612
|
|
|
|
2,890
|
|
|
|
3,293
|
|
|
Fees paid to ACFS
|
|
|
1,625
|
|
|
|
1,625
|
|
|
|
1,739
|
|
|
|
893
|
|
|
|
813
|
|
|
Other nonrecurring charges(*)
|
|
|
6,645
|
|
|
|
5,458
|
|
|
|
5,867
|
|
|
|
1,778
|
|
|
|
631
|
|
|
Actuarial (gain) loss
|
|
|
282
|
|
|
|
226
|
|
|
|
(208
|
)
|
|
|
—
|
|
|
|
—
|
|
|
Paid-in-kind interest expense
|
|
|
(1,810
|
)
|
|
|
(1,904
|
)
|
|
|
(1,992
|
)
|
|
|
(993
|
)
|
|
|
(1,041
|
)
|
|
Loss on disposal of property, plant and equipment
|
|
|
(81
|
)
|
|
|
(502
|
)
|
|
|
(592
|
)
|
|
|
(302
|
)
|
|
|
(268
|
)
|
|
Amortization of loan fees, debt discount and preferred stock
discount
|
|
|
(568
|
)
|
|
|
(785
|
)
|
|
|
(522
|
)
|
|
|
(262
|
)
|
|
|
(236
|
)
|
|
Provision for doubtful accounts
|
|
|
(96
|
)
|
|
|
(30
|
)
|
|
|
(140
|
)
|
|
|
(69
|
)
|
|
|
(25
|
)
|
|
Provision for deferred income taxes
|
|
|
1,010
|
|
|
|
1,238
|
|
|
|
1,013
|
|
|
|
(763
|
)
|
|
|
916
|
|
|
Change in operating assets and liabilities
|
|
|
1,726
|
|
|
|
9,559
|
|
|
|
2,084
|
|
|
|
8,653
|
|
|
|
11,653
|
|
|
Currency effects
|
|
|
—
|
|
|
|
—
|
|
|
|
22
|
|
|
|
—
|
|
|
|
41
|
|
|
|
|
|
|
|
|
|
|
|
|
|
|
|
|
|
|
|
|
|
|
|
|
Adjusted EBITDA
|
|
$
|
29,254
|
|
|
$
|
34,218
|
|
|
$
|
40,625
|
|
|
$
|
18,719
|
|
|
$
|
18,512
|
|
|
|
|
|
|
|
|
|
|
|
|
|
|
|
|
|
|
|
|
|
|
|
|
|
|
|
(*)
|
|
Represents non-recurring expenses,
including severance expenses and costs associated with the
preparation for our initial public offering, as well as certain
professional and legal expenses.
|
|
|
|
|
(7)
|
|
Represents purchase orders or
contracts received by us that have not been shipped. Amounts
representing backlog are not recorded in our financial
statements.
|
9
RISK
FACTORS
Investing in our common stock involves a high degree of risk.
You should carefully consider the risks described below,
together with all of the other information contained in this
prospectus, before deciding whether to purchase our common
stock. If any of the following risks occurs, the trading price
of our common stock could decline and you could lose all or part
of your investment.
Risks
Related to Our Business
Our
sales cycle can be long and unpredictable, and we may be unable
to recognize revenue until many months or years after an order
is placed. As a result, our revenue can be difficult to predict
and may vary substantially from quarter to quarter, which may
cause our operating results to fluctuate.
Our sales efforts for many of our products involve substantial
discussion with customers regarding product customization and
deployment. This process can be extremely lengthy and time
consuming and typically involves a significant product
evaluation process. The typical sales cycle for products whose
procurement relates to the construction of new, or the
refurbishment of existing, NPPs ranges from 12 to 36 months
and has, in some cases, extended up to 60 months. In
addition, these customers generally make a significant
commitment of resources to test and evaluate our products prior
to purchase. As a result, our sales process is often subject to
delays associated with the lengthy approval processes that
typically accompany the design, testing and adoption of new,
technologically complex products. This results in our investing
significant resources prior to orders being placed for our
products, with no assurances that we will secure a sale.
In addition, a significant amount of time can pass before we
recognize the revenue associated with an order once it has been
placed. We may not recognize revenue for sales of certain of our
products until the customer certifies the successful
installation and operation of the product, which can be many
months or, particularly with regard to our Sensing Systems and
Radiation Monitoring Systems products, years following the
receipt of a customer order. Additionally, under prevailing
accounting guidance, we may be required to delay revenue
recognition on products delivered to our customers until we have
completed delivery of all products associated with our
arrangement with the customer. The installation of our systems
are also subject to construction or scheduled outage delays
unrelated to our products, which can further defer the
recognition of revenue.
Our long and uncertain sales cycle and the unpredictable period
of time between the placement of an order and our ability to
recognize the revenue associated with the order makes revenue
predictions difficult, particularly on a quarterly basis, and
can cause our operating results to fluctuate significantly.
Our
financial performance is unpredictable.
Our business depends on the demand for our radiation detection,
measurement, analysis and monitoring products and services in
the nuclear, defense and medical end markets. In the past, the
demand for our products in these markets has fluctuated due to a
variety of factors, many of which are beyond our control. This
has caused our financial performance to fluctuate. Among the
factors affecting our performance are:
|
|
|
| |
•
|
general economic conditions, both domestically and
internationally;
|
| |
| |
•
|
the timing, number and size of orders from, and shipments to,
our customers, as well as the relative mix of those orders;
|
| |
| |
•
|
the timing of revenue recognition, which often requires customer
acceptance of the delivered products;
|
| |
| |
•
|
delays, postponements or cancellations of construction or
decommissioning of NPPs caused by, for example, financing
difficulties or regulatory delays;
|
| |
| |
•
|
adverse economic, financial
and/or
political conditions in one or more of our target end markets;
|
| |
| |
•
|
variations in the volume of orders for a particular product or
product line in a particular quarter;
|
| |
| |
•
|
the size and timing of new contract awards;
|
| |
| |
•
|
the timing of the release of government funds for procurement of
our products;
|
10
|
|
|
| |
•
|
the degree to which new end markets emerge for our products;
|
| |
| |
•
|
the budget cycles of U.S. and foreign governments and
commercial enterprises that affect timing of order placement for
or delivery of our products; and
|
| |
| |
•
|
the tendency of commercial enterprises to fully utilize annual
capital budgets prior to expiration.
|
We
have a short operating history as a consolidated entity and have
incurred net losses since our inception.
We were formed in 2005 as a merger of several companies acquired
by ACAS but operated separately. Accordingly, we rely on the
employees, goodwill, brand strength, product history and
qualifications of our legacy acquired companies. In addition,
some of our senior executive officers have a limited history
with us and no prior experience in the industries in which we
compete. Furthermore, we have not achieved positive net income
and, as of December 31, 2009, had an accumulated deficit of
$103.3 million. We cannot assure you as to when we will
achieve positive net income or, if we do so, whether we will
continue to do so.
Our
independent registered public accounting firm reported to us
that, at each of June 30, 2008, June 30, 2009 and
September 30, 2009, we had material weaknesses in our
internal controls over financial reporting that, if not
remediated, could result in material misstatements in our
financial statements in future periods and impair our ability to
comply with the accounting and reporting requirements applicable
to public companies.
Our independent registered public accounting firm reported to us
that at each of June 30, 2008, June 30, 2009 and
September 30, 2009, we had material weaknesses in our
internal controls over financial reporting that have not been
remediated as of the time of this filing. Under standards
established by the Public Company Accounting Oversight Board, or
PCAOB, a “material weakness” is a deficiency, or a
combination of deficiencies, in internal control over financial
reporting, such that there is a reasonable possibility that a
material misstatement of the company’s annual or interim
financial statements will not be prevented or detected on a
timely basis. The material weaknesses identified were with
respect to our controls in our financial accounting and
reporting functions, which are necessary in order to produce
U.S. generally accepted accounting principles (U.S. GAAP)
compliant financial statements. These weaknesses related to a
lack of sufficient accounting personnel and depth of knowledge,
lack of formal policies and procedures to ensure that subsidiary
financial information reflect accounting under U.S. GAAP,
lack of account reconciliation procedures and untimely review
and approval procedures. A significant number of audit
adjustments were also required to appropriately reflect account
balances in accordance with U.S. GAAP. As a result of these
weaknesses, we were required to restate our consolidated
financial statements for fiscal 2007, 2008 and 2009 to properly
reflect a revenue restatement, the reclassification of
paid-in-kind dividends on our Convertible Participating
Preferred Stock as additional paid-in capital rather than
accrued liabilities and the impact of recording a number of
individually insignificant adjustments. We determined that
revenue was improperly recognized on certain multiple element
arrangements for which separation of elements was not
appropriate at the time of recognition. We determined that
paid-in-kind
dividends payable should not have been classified as liabilities
as they do not involve an obligation to make future sacrifices
of assets. As we prepare for the completion of this offering, we
are in the process of hiring additional finance personnel and
documenting and enhancing formalized information technology
policies and procedures, and the implementation of software
upgrades throughout our operations. However, these and other
remediation efforts may not enable us to remedy the material
weaknesses or avoid other material weaknesses in the future.
Because of these material weaknesses, there is heightened risk
that a material misstatement of our annual or quarterly
financial statements will not be prevented or detected. In the
event that we have not adequately remedied these material
weaknesses, and if we fail to maintain proper and effective
internal controls in future periods, it could adversely affect
our operating results, financial condition, ability to run our
business effectively and our ability to timely meet our
reporting requirements and could cause investors to lose
confidence in our financial reporting. In addition, these and
any other material weaknesses will need to be addressed as part
of the evaluation of our internal controls over financial
reporting pursuant to Section 404 of the Sarbanes-Oxley Act
of 2002 and may impair our ability to comply with
Section 404.
11
We
operate in highly competitive markets and in some cases compete
against larger companies with greater financial
resources.
The market for radiation detection, measurement, analysis and
monitoring products and services is fragmented, with a variety
of small and large competitors, where the degree of
fragmentation and the identities of our competitors vary among
our target end markets. Some of our competitors have greater
financial resources than do we, and they may be able to focus
those resources on developing products or services that are more
attractive to potential customers than those that we offer, or
on lobbying efforts to enhance their prospects of obtaining
government contracts. Some of our competitors, for example, are
substantially larger and better capitalized than we are and have
the ability to combine solutions into an integrated offering at
attractive prices. Our competitors may offer these solutions at
prices below cost in order to improve their competitive
positions. Any of these competitive factors could make it more
difficult for us to attract and retain customers, cause us to
lower our prices to compete, and reduce our market share and
revenue, any of which could have a material adverse effect on
our business, financial condition and results of operations.
Amounts
included in our order backlog may not result in actual revenue
or translate into profits.
Although the amount of our backlog is based on signed purchase
orders or other written contractual commitments, we cannot
guarantee that our order backlog will result in actual revenue
in the originally anticipated period or at all. In addition, the
mix of contracts included in our order backlog can greatly
affect our margins in future periods, which may not be
comparable to our historical product mix and operating results.
Our customers may experience project delays or cancel orders due
to factors beyond our control. If our order backlog fails to
result in revenue in a timely manner or at all, we could
experience a reduction in revenue and liquidity.
The
current global financial crisis and adverse worldwide economic
conditions may have significant effects on our business,
financial condition and results of operations.
The current global financial crisis—which has included,
among other things, significant reductions in available capital
and liquidity, substantial reductions and fluctuations in equity
and currency values, a reduction in global demand for energy and
a worldwide recession, the extent of which is likely to be
significant and prolonged—may have a material adverse
effect on our business. We have begun to experience some
weakening in demand for certain of our products and services,
particularly for our high-temperature cameras used as monitoring
tools in petrochemical facilities and cement kilns. Factors such
as lack of business investment, government spending, the
volatility and strength of the capital markets and inflation all
affect the business and economic environment and, ultimately,
our business, financial condition and results of operations.
Continued market disruptions and broader economic downturns may
affect our and our customers’ access to capital, lead to
lower demand for our products and services, increase our
exposure to losses from bad debts or result in our customers
ceasing operations, any of which could materially adversely
affect our business, financial condition and results of
operations.
The credit markets have been experiencing extreme volatility and
disruption for more than twelve months, and the volatility and
disruption have reached unprecedented levels. In many cases, the
markets have limited credit capacity for certain issuers, and
lenders have requested shorter terms. The market for new debt
financing is extremely limited and in some cases not available
at all. In addition, the markets have increased the uncertainty
that lenders will be able to comply with their previous
commitments. If current levels of market disruption and
volatility continue or worsen, we may not be able to refinance
our existing debt, or incur additional debt, which may require
us to seek alternative funding sources to meet our liquidity
needs or to fund planned expansion. Such alternative sources of
funding may not be available on acceptable terms or at all.
Furthermore, the tightening of credit in financial markets may
delay or prevent our customers from securing funding adequate to
operate their businesses and purchase our products and services
and could lead to an increase in our bad debt levels.
12
Unfavorable
currency exchange rate fluctuations could adversely affect our
profitability.
Our international sales and our operations in foreign countries
expose us to risks associated with fluctuating currency values
and exchange rates. Most of our sales, costs, assets and
liabilities are denominated in foreign currencies. For fiscal
2009, 49.9% and 3.9% of our sales were denominated in euros and
pounds sterling. Gains and losses on the conversion of accounts
receivable, accounts payable and other monetary assets and
liabilities to U.S. dollars may contribute to fluctuations
in our results of operations. In addition, increases in the
value of the U.S. dollar relative to the euro and the pound
sterling could have an adverse effect on our results of
operations. We do not currently purchase forward contracts to
hedge against the risks associated with fluctuations in exchange
rates.
We may
be less competitive if we fail to develop new or enhanced
products and introduce them in a timely manner.
The markets in which we compete are subject to technological
change, product obsolescence and evolving industry standards.
Our ability to successfully compete in these markets and to
continue to grow our business depends in significant part upon
our ability to develop, introduce and sell new and enhanced
products in a timely and cost-effective manner, and to
anticipate and respond to changing customer requirements. We
have experienced, and may in the future experience, delays in
the development and introduction of new products. These delays
could provide a competitor a first-to-market advantage and allow
a competitor to achieve greater market share. Defects or errors
found in our products after commencement of commercial shipment
could result in delays in market acceptance of these products.
Lack of market acceptance for our new products will jeopardize
our ability to recoup research and development expenditures,
hurt our reputation and harm our business, financial condition
and results of operations. Accordingly, we can not assure you
that our future product development efforts will be successful.
Our
existing and future customers may reduce or halt their spending
on radiation detection, measurement, analysis and monitoring
products and services.
A variety of factors may cause our existing or future customers
to reduce or halt their spending on radiation detection,
measurement, analysis and monitoring products and services.
These factors include:
|
|
|
| |
•
|
disruptions in the nuclear fuel cycle, such as insufficient
uranium supply or conversion;
|
| |
| |
•
|
unfavorable financial conditions and strategies of the builders,
owners and operators of nuclear reactors;
|
| |
| |
•
|
civic opposition to or changes in government policies regarding
nuclear operations;
|
| |
| |
•
|
a reduction in demand for nuclear generating capacity;
|
| |
| |
•
|
accidents, terrorism, natural disasters or other incidents
occurring at nuclear facilities; and
|
| |
| |
•
|
the decision by one or more of our customers to acquire one of
our competitors or otherwise administer the services we provide
internally.
|
Certain of these events could also adversely affect us to the
extent that they result in the suspension or reduction of
nuclear reactor construction, refurbishment or operation; the
reduction of supplies of nuclear raw materials; increased
regulation; increased operational costs for us or our customers;
or increased liability for actual or threatened property damage
or personal injury.
If we
are unable to obtain adequate supplies in a timely manner, our
results of operations would be adversely affected.
We are dependent upon certain sole or limited source suppliers
for critical raw materials or components of some of our
products. For example, we rely on the U.S. government for
the enriched uranium used in certain equipment employed in our
sensing systems. We also rely on limited source suppliers of
certain precious metals used in some of our reactor
instrumentation, scintillator materials used in our detection
& identification equipment and for analog sensor tubes used
in certain of our imaging products. Most of our suppliers are
not required to supply us with any minimum quantities, and we
cannot assure you that we will receive adequate quantities of
components on a timely basis in the future. For example, a sole
source supplier
13
has recently informed us that its supplier is discontinuing the
manufacture of a component that we use in certain of our
dosimetry badges used by our Dosimetry Services division to
provide dosimetry services to a majority of its dosimetry badge
wearers. The notification prompted us to secure a final
end-of-life order in an amount sufficient to meet our
anticipated production requirements for the affected type of
dosimetry badge at least through December 2013 and potentially
through December 2015, the exact duration depending on the
timing and degree to which our existing customers migrate to our
other dosimetry badges that are unaffected by this discontinued
component. We and our current suppliers already offer substitute
dosimetry badges that meet the requirements of our customers and
that do not require requalification, but these substitutes are
currently available at an increased cost to us. We are in
negotiations with our current suppliers for long-term supply
agreements for such substitute badges to procure more favorable
commercial terms but if we are unable to secure more favorable
commercial terms, then such substitute badges may only be
available at a higher cost to us, which could adversely affect
our margins if we are unable to increase prices accordingly. If
our sole source supplier fails to deliver the end-of-life order,
the end-of-life order is insufficient to meet our customer
requirements for such dosimeter badges or the inventory is
damaged or impaired while we are storing it, we may be required
to substitute higher-cost products to meet customer obligations,
at an increased cost to us. Our suppliers could have financial
or other problems that could cause a disruption in the supply of
components to us. In addition, were we to change suppliers of
components in some of our products, we may be required to seek
new qualifications for such products, which can be a
time-consuming and costly process. As a result of interruption
of supply, we may not be able to obtain the raw materials or
components that we need to fill customer orders. The inability
to fill these orders could cause delays, disruptions or
reductions in product shipments, require us to negotiate
alternate supply arrangements with replacement suppliers where
available or require product redesigns which could, in turn,
damage relationships with current or prospective customers,
increase costs or prices and have a material adverse effect on
our business, financial condition and results of operations.
We
rely on third-party manufacturers to produce non-core components
for certain of our products and services. If our manufacturers
are unable to meet our demand or requirements, our business
could be harmed.
We use third-party manufacturers to produce certain non-core
components for some of our products. From time to time demand
for our products has grown faster than the supply capabilities
of these vendors. In many cases, these manufacturers have no
obligation to supply products to us for any specific period, in
any specific quantity or at any specific price, except as set
forth in a particular purchase order. Our requirements represent
a small portion of the total production capacities for many of
our manufacturers, and our manufacturers may reallocate capacity
to other customers, even during periods of high demand for our
products or services. We have in the past experienced, and may
in the future experience, quality control issues and delivery
delays with our manufacturers due to factors such as high
industry demand or the inability of our manufacturers to
consistently meet our quality or delivery requirements. In
addition, third-party manufacturers may have financial
difficulties and face the risk of bankruptcy, especially in
light of the current worldwide economic downturn. If one of our
suppliers was to cancel or materially change a commitment with
us or fail to meet the quality or delivery requirements needed
to satisfy customer orders for our products, we could lose
time-sensitive customer orders, be unable to develop or sell our
products or services cost effectively or on a timely basis, if
at all, and have significantly decreased revenue, which would
harm our business, financial condition and results of
operations. We may qualify additional suppliers in the future
which would require time and resources. If we do not qualify
additional suppliers, we may be exposed to increased risk of
capacity shortages due to our dependence on our current
suppliers.
Some
of our suppliers and customers are also our
competitors.
Some of our competitors are also our suppliers and customers.
For example, Canberra, one of our chief competitors in the
nuclear and defense end markets, supplies us with some of the
detectors employed in the radiation monitoring systems that we
supply to the nuclear end market. At the same time, Areva, the
controlling shareholder of Canberra, is a customer for our
radiation monitoring systems for use in its EPR reactors and in
other fuel cycle industry applications. Similarly, Thermo Fisher
Scientific both supplies our
14
Dosimetry Services division with TLD crystals used in some of
our thermoluminescent dosimeters that we deploy as part of
providing dosimetry services to our customers, and sells
products competitive with those offered by our Health Physics
division. As with our other suppliers, our competitor suppliers
are not required to supply us with any minimum quantities, and
we cannot assure you that we will receive adequate quantities of
components on a timely basis in the future. The loss of orders
stemming from the actions of our supplier or customer
competitors could cause delays, disruptions or reductions in
product shipments or require product redesigns which could, in
turn, damage relationships with current or prospective
customers, increase costs or prices and have a material adverse
effect on our business, financial condition and results of
operations.
We
could lose money if we fail to accurately estimate our costs or
fail to execute within our cost estimates on fixed-price
contracts.
Many of our contracts are fixed-price contracts which do not
provide for price escalation in the event of unanticipated cost
overruns. Under these contracts, we perform our services and
provide our products at a fixed price. Fixed-price contracts
carry inherent risks, including risks of losses from
underestimating costs, operational difficulties and other
changes that may occur over the contract period. We have in the
past experienced unanticipated cost overruns on some of our
fixed-price contracts. If our cost estimates for a contract are
inaccurate, or if we do not execute the contract within our cost
estimates, we may incur losses or the contract may not be as
profitable as we expected. In addition, we are sometimes
required to incur costs in connection with modifications to a
contract that may not be approved by the customer as to scope or
price, or to incur unanticipated costs, including costs for
customer-caused delays, errors in specifications or designs or
contract termination, that we may not be able to recover. These,
in turn, could adversely affect our business, financial
condition and results of operations. The revenue, cost and gross
profit realized on such contracts can vary, sometimes
substantially, from the original projections due to changes in a
variety of factors, such as:
|
|
|
| |
•
|
failure to properly estimate, or changes in, the costs of
material, components or labor;
|
| |
| |
•
|
currency exchange rate fluctuations;
|
| |
| |
•
|
unanticipated technical problems with the products or services
being supplied by us, which may require that we spend our own
money to remedy the problem;
|
| |
| |
•
|
our suppliers’ or subcontractors’ failure to perform;
|
| |
| |
•
|
difficulties of our customers in obtaining required governmental
permits or approvals;
|
| |
| |
•
|
changes in local laws and regulations;
|
| |
| |
•
|
unanticipated delays in construction of new NPPs and
decommissioning of existing NPPs; and
|
| |
| |
•
|
limited history with new products and new customers.
|
Many
of our large contracts have penalties for late
completion.
In some cases, including many of our fixed-price contracts, we
have agreed to complete a project by a scheduled date. If we
fail to complete the project as scheduled, we may be held
responsible for costs associated with the delay, generally in
the form of liquidated damages, in some cases up to the full
value of the contract. We have in the past incurred penalties
associated with late completion on some of our contracts. In the
event that a project is delayed, the total costs of the project
could exceed our original estimates, and we could experience
reduced profits or a loss for that project.
Our
products and services involve the detection and monitoring of
radiation, and the failure of our products or services to
perform to specification could adversely affect our business,
financial condition or results of operations.
Our products and services involve the detection and monitoring
of radiation and are crucial components of the safety measures
employed with respect to ionizing radiation. The failure of our
products to perform to specification could result in personal
injury or death and property damage (including environmental
contamination). Legal and regulatory actions taken in response
to product failure could result in significant costs to us.
Additionally, the failure of our products to perform to
specification could adversely affect market
15
perception of the quality and effectiveness of our products and
services, which would harm our ability to attract new customers
and could cause our existing customers to cease doing business
with us.
While we have attempted to secure appropriate insurance coverage
at a reasonable cost, we do not insure against all risks and a
claim can exceed the limits of our policies. We cannot assure
you that our insurers will pay a particular claim, or that we
will be able to maintain coverage at reasonable rates in the
future, or at all. We may also be subject to significant
deductibles.
Our contracts with customers generally seek to limit our
liability in connection with product failure, but we cannot
assure you that these contractual limitations on liability will
be effective or sufficient in scope in all cases or that our
insurance will cover the liabilities we have assumed under these
contracts. The costs of defending against a claim arising out of
such failure, and any damages awarded as a result of such a
claim, could adversely affect our business, financial condition
and results of operations.
Certain of our products and technologies for the defense end
market may be eligible for designation or certification as
“qualified anti-terrorism technologies” under the
“SAFETY Act” provisions of The Homeland Security Act
of 2002 and its implementing regulations. Under the SAFETY Act,
the federal government provides for certain liability
limitations and a presumption that the “government
contractor” defense applies if the Department of Homeland
Security “designates” or “certifies”
technologies or products as “qualified anti-terrorism
technologies,” and if certain other conditions apply. We
may seek to qualify some or all of our products and technologies
under the SAFETY Act’s provisions in order to obtain such
liability protections, but there is no guarantee that the
Department of Homeland Security will designate or certify our
products and technologies as qualified anti-terrorism
technology. To date, we have not sought such designation or
certification, and our products have been sold without such
qualification, and we may continue to sell our products and
technologies without such qualification. To the extent we do so,
we will not be entitled to the benefit of the SAFETY Act’s
limitations on tort liability or to any U.S. government
indemnification.
We and
our customers operate in a politically sensitive environment,
and the public perception of nuclear power can affect our
customers and us.
We and our customers operate in a politically sensitive
environment. The risks associated with radioactive materials and
the public perception of those risks can affect our business.
Opposition by third parties can delay or prevent the
construction of new NPPs and can limit the operation of nuclear
reactors. Adverse public reaction to developments in the use of
nuclear power, including incidents involving the discharge of
radioactive materials, could directly affect our customers and
indirectly affect our business. In the past, adverse public
reaction, increased regulatory scrutiny and litigation have
contributed to extended construction periods for new nuclear
reactors, sometimes delaying construction schedules by decades
or more. For example, no new reactor has been ordered in the
United States since the 1970s and anti-nuclear groups in Germany
successfully lobbied for the adoption of the Nuclear Exit Law in
2002, which requires the shutdown of all German NPPs by 2021.
Adverse public reaction could also lead to increased regulation
or limitations on the activities of our customers, more onerous
operating requirements or other conditions that could have a
material adverse impact on our customers and our business.
Our
operations in foreign countries are subject to political,
economic and other risks, which could have a material adverse
effect on us.
Revenue outside of the United States and Canada accounted for
approximately 61.3%, 64.1% and 61.6% of our net sales in fiscal
2007, 2008 and 2009, and 60.3% and 62.7% of our net sales for
the six months ended December 31, 2008 and 2009. We
anticipate that international sales will continue to constitute
a material percentage of our total net sales in future periods.
As a result, our operations are subject to risks associated with
global operations and sales, including:
|
|
|
| |
•
|
foreign currency exchange fluctuations;
|
| |
| |
•
|
changes in regulatory requirements;
|
| |
| |
•
|
tariffs and other barriers;
|
| |
| |
•
|
timing and availability of export licenses;
|
16
|
|
|
| |
•
|
difficulties in accounts receivable collections;
|
| |
| |
•
|
difficulties in protecting our intellectual property;
|
| |
| |
•
|
difficulties in staffing and managing foreign operations;
|
| |
| |
•
|
difficulties in managing sales agents, distributors and other
third parties;
|
| |
| |
•
|
coordination regarding, and difficulties in obtaining,
governmental approvals for products that may require
certification;
|
| |
| |
•
|
rescission or termination of contracts by governmental parties
without penalty and regardless of the terms of the contract;
|
| |
| |
•
|
restrictions on transfers of funds and other assets of our
subsidiaries between jurisdictions;
|
| |
| |
•
|
the burden of complying with a wide variety of complex foreign
laws and treaties;
|
| |
| |
•
|
potentially adverse tax consequences; and
|
| |
| |
•
|
uncertainties relative to regional political and economic
circumstances.
|
We are also subject to risks associated with the imposition of
legislation and regulations relating to the import or export of
radiation detection and monitoring technology. For example,
certain export control approvals of our sales, including sales
to NPP operators located in Pakistan and India, were granted
because of the supervision of customer sites by the
International Atomic Energy Agency, or the IAEA. If the IAEA
ceases to supervise such sites, our ability to sell to certain
customers would be limited and our sales could be adversely
affected. Furthermore, the failure to comply with export control
regulations and to obtain required approvals could result in
loss of the ability to export products, fines and penalties.
We cannot predict whether quotas, duties, taxes or other charges
or restrictions upon the importation or exportation of our
products will be implemented by the United States or other
countries. Some of our customers’ purchase orders and
agreements are governed by foreign laws, which often differ
significantly from the laws of the United States. Therefore, we
may be limited in our ability to enforce our rights under such
agreements and to collect damages, if awarded. These factors may
have a material adverse effect on our business, financial
condition and results of operations.
Changes
in our effective tax rate or adverse outcomes resulting from
examination of our income tax returns could adversely affect our
results.
Our effective tax rate could be adversely affected by several
factors, many of which are outside of our control, including:
|
|
|
| |
•
|
earnings being lower than anticipated in countries where we are
taxed at lower rates as compared to the U.S. statutory tax
rate;
|
| |
| |
•
|
material differences between forecasted and actual tax rates as
a result of a shift in the mix of pre-tax profits and losses
from one tax jurisdiction to another, our ability to use tax
credits or effective tax rates by tax jurisdiction that differ
from our estimates;
|
| |
| |
•
|
changing tax laws or related interpretations, accounting
standards and regulations and interpretations in multiple tax
jurisdictions in which we operate, as well as the requirements
of certain tax rulings;
|
| |
| |
•
|
an increase in expenses not deductible for tax purposes,
including certain stock-based compensation expense and
impairment of goodwill;
|
| |
| |
•
|
the tax effects of purchase accounting for acquisitions and
restructuring charges that may cause fluctuations between
reporting periods;
|
| |
| |
•
|
changes related to our ability to ultimately realize future
benefits attributed to our deferred tax assets, including those
related to other-than-temporary impairments;
|
| |
| |
•
|
tax assessments resulting from income tax audits or any related
tax interest or penalties that would affect our income tax
expense for the period in which the settlements take
place; and
|
| |
| |
•
|
a change in our decision to indefinitely reinvest foreign
earnings.
|
17
In addition, we may be subject to examination of our income tax
returns by the Internal Revenue Service or other tax
authorities. If tax authorities challenge the relative mix of
our U.S. and international income, our future effective
income tax rates could be adversely affected. While we regularly
assess the likelihood of adverse outcomes from such examinations
and the adequacy of our provision for income taxes, we cannot
assure you that such provision is sufficient and that a
determination by a tax authority will not have an adverse effect
on our business, financial condition and results of operations.
Localization
requirements could adversely affect our business.
Many emerging markets, including China and South Korea, impose
localization requirements which favor locally based component
manufacturers in the construction of NPPs and which require some
degree of technology transfer to local manufacturers. Over time,
such localization requirements could limit our ability to sell
into such markets and could affect our ability to maintain our
trade secrets. In the past, international development agencies
have, as a condition of funding, imposed localization
requirements that require the transfer of technology to local
manufacturers, and this requirement has affected our ability to
monitor and maintain control over our intellectual property. We
may be subject to similar requirements as a condition of funding
in the future.
We
must comply with the U.S. Foreign Corrupt Practices Act, or
FCPA. Failure to comply with the FCPA could subject us to, among
other things, penalties and legal expenses that could harm our
reputation and have a material adverse effect on our business,
financial condition and results of operations.
We are required to comply with the United States Foreign Corrupt
Practices Act, which generally prohibits U.S. companies and
their intermediaries from engaging in bribery or making other
prohibited payments to foreign officials for the purpose of
obtaining or retaining business and/or other benefits. We
operate in a number of jurisdictions that pose a high risk of
potential FCPA violations, we have government customers and we
utilize a number of third-party sales representatives. Although
we have begun to inform our personnel and third-party sales
representatives regarding the requirements of the FCPA and have
developed and will continue to develop and implement systems for
formalizing contracting processes, performing diligence on
agents and improving our record-keeping and auditing practices,
we cannot assure you that our employees, third-party sales
representatives or other agents have not or will not engage in
conduct for which we might be held responsible under the FCPA.
If our employees, third-party sales representatives or other
agents are found to have engaged in such practices, we could
suffer severe penalties, including criminal and civil penalties,
disgorgement and other remedial measures (including further
changes or enhancements to our procedures, policies and
controls, as well as potential personnel changes and
disciplinary actions), any of which could have an adverse impact
on our business, financial condition, results of operations and
liquidity. Any investigation of any potential violations of the
FCPA or other anti-corruption laws by U.S. or foreign
authorities also could have an adverse impact on our business,
financial condition and results of operations.
Certain foreign companies, including some of our competitors,
are not subject to prohibitions as strict as those under the
FCPA or, even if subjected to strict prohibitions, such
prohibitions may be laxly enforced in practice. If our
competitors engage in corruption, extortion, bribery, pay-offs,
theft or other fraudulent practices, they may receive
preferential treatment from personnel of some companies, giving
our competitors an advantage in securing business, or from
government officials, who might give them priority in obtaining
new licenses, which would put us at a disadvantage.
We may
make acquisitions that involve numerous risks. If we are not
successful in integrating the technologies, operations and
personnel of acquired businesses or fail to realize the
anticipated benefits of an acquisition, our operations may be
adversely affected.
As part of our business and growth strategy, we may acquire or
make significant investments in businesses, products or
technologies that allow us to complement our existing product
offerings, expand our
18
market coverage, increase our engineering workforce or enhance
our technological capabilities. Any future acquisitions or
investments would expose us to many risks, including:
|
|
|
| |
•
|
problems integrating the new personnel or the purchased
operations, technologies or products;
|
| |
| |
•
|
difficulty securing adequate working capital;
|
| |
| |
•
|
unanticipated costs associated with the acquisition;
|
| |
| |
•
|
negative effects on our ability to generate excess free cash
flow;
|
| |
| |
•
|
negative effects on profitability;
|
| |
| |
•
|
adverse effects on existing business relationships with
suppliers and customers;
|
| |
| |
•
|
risks associated with entering markets in which we have no or
limited prior experience;
|
| |
| |
•
|
loss of key employees of the acquired business;
|
| |
| |
•
|
litigation arising from the operations before they were acquired
by us; and
|
| |
| |
•
|
difficulty completing financial statements and audits.
|
Our inability to overcome problems encountered in connection
with any acquisition could divert the attention of management,
utilize scarce corporate resources and otherwise harm our
business. In addition, we are unable to predict whether or when
any prospective acquisition candidate will become available or
the likelihood that any acquisition will be completed. Even if
we do find suitable acquisition opportunities, we may not be
able to consummate the acquisitions on commercially acceptable
terms or realize the anticipated benefits of any acquisitions we
do undertake.
A
failure to expand our manufacturing capacity and scale our
capabilities to manufacture new products could constrain our
ability to grow our business.
We have needed to increase our manufacturing capacity,
particularly in our locations in Lamanon, France and Hamburg,
Germany to support the fulfillment of certain large contracts
and to put us in position to accommodate growth in our business.
Accordingly, we have initiated an expansion of our manufacturing
facilities in Lamanon and renovated and reorganized our
facilities in Hamburg. The future growth of our business depends
on our ability to successfully expand our manufacturing
capacity. Expansion of our manufacturing capacity may require us
to obtain regulatory approvals or additional financing. Delay in
the expansion of our manufacturing capacity could constrain our
ability to grow our business, which would adversely affect our
business, financial condition and results of operations.
Similarly, we could have substantial difficulty in dealing with
rapid growth in markets for new products that we may introduce.
If demand for our new products increases rapidly, we will need
to expand internal production capacity or implement additional
outsourcing. Success in developing, manufacturing and supporting
products manufactured in small volumes does not guarantee
comparable success in operations conducted on a larger scale.
Manufacturing yields and product quality may decline as
production volumes increase. If we are unable to deliver
products quickly and cost effectively and in the requisite
volumes, our customers may decline to purchase our new products
or may purchase substitute products offered by our competitors.
The costs associated with implementing new manufacturing
technologies, methods, and processes, including the purchase of
new equipment, and any resulting delays, inefficiencies and loss
of sales, could harm our results of operations.
We
rely on third-party sales representatives to assist in selling
our products and services, and the failure of these
representatives to perform as expected could reduce our future
sales.
We typically derive 25% to 30% of our revenue from sales to our
customers through third-party sales representatives. We have
established relationships with some of our third-party sales
representatives recently, and we are unable to predict the
extent to which our third-party sales representatives will be
successful in marketing and selling our products and services.
Moreover, many of our third-party sales representatives also
market and sell competing products and services, which may
affect the extent to which our third-party sales
19
representatives promote our products and services. Even where
our relationships are formalized in contracts, our third-party
sales representatives often have the right to terminate their
relationships with us at any time. Our future performance will
also depend, in part, on our ability to attract additional
third-party sales representatives who will be able to market and
support our products and services effectively, especially in
markets in which we have not previously sold our products and
services. If we cannot retain our current third-party sales
representatives or recruit additional or replacement third-party
sales representatives, our business, financial condition and
results of operations could be harmed.
The
elimination or any modification of the Price-Anderson Act’s
indemnification authority could have adverse consequences for
our business.
In the United States, the Atomic Energy Act of 1954, as amended,
or the AEA, comprehensively regulates the manufacture, use and
storage of radioactive materials. Section 170 of the AEA,
which is known as the Price-Anderson Act, supports the nuclear
services industry by offering broad indemnification to
commercial NPP operators and Department of Energy, or DOE,
contractors for liabilities arising out of nuclear incidents at
power plants licensed by the Nuclear Regulatory Commission, or
NRC, and at DOE nuclear facilities. The indemnification
authority of the NRC and DOE under the Price-Anderson Act was
extended through 2025 by the Energy Policy Act of 2005. Some of
our customers are covered by the indemnification provisions of
the Price-Anderson Act. In addition, other jurisdictions have
similar indemnification authority. If the indemnification
authority in the United States or other countries is eliminated
or adversely modified in the future, our business could be
adversely affected if the owners and operators of NPPs cancel or
delay plans to build new plants or curtail the operations of
existing plants.
Our
ability to provide bid bonds, performance bonds or letters of
credit is limited and could negatively affect our ability to bid
on or enter into significant contracts.
We are sometimes required to provide bid or performance bonds or
letters of credit to guarantee performance under contracts
across our various divisions. Our ability to obtain such bonds
and letters of credit depends upon several factors, including
our capitalization, working capital, past performance,
management expertise and reputation and external factors beyond
our control, including the overall capacity of the surety
market. Surety companies consider those factors in relation to
the amount of our tangible net worth and other underwriting
standards that may change from time to time. Events that affect
surety markets generally may result in bonding becoming more
difficult to obtain in the future, or being available only at a
significantly higher cost. Our inability to obtain adequate
bonding and, as a result, to bid for, or enter into, significant
contracts, could adversely affect our future financial condition
and results of operations.
As a
U.S. government contractor, we are subject to a number of
procurement rules and regulations.
U.S. government contractors and subcontractors must comply
with specific procurement regulations and other requirements and
are subject to routine audits and investigations by
U.S. government agencies. If we fail to comply with these
rules and regulations, we could be subject to reductions in the
value of our government contracts, contract modification or
termination, the assessment of penalties and fines,
and/or
suspension or debarment from government contracting or
subcontracting for a period of time or permanently.
Furthermore, we have bid, and may in the future submit bids, for
U.S. government contracts that require our employees to
maintain various levels of security clearances and require us or
our subsidiaries to maintain certain facility security
clearances in compliance with Department of Defense and other
government requirements. Obtaining and maintaining security
clearances for employees involves a lengthy process, and it can
be difficult to identify, recruit and retain employees who
already hold security clearances. If our employees are unable to
obtain or retain security clearances, or if our employees who
hold security clearances stop working for us, we may face delays
in fulfilling contracts, or be unable to fulfill or secure new
contracts, with any customer involved in classified work. Any
breach of security for which we are responsible could seriously
harm our business, damage our reputation and make us ineligible
to work on any classified programs.
20
The classified work that we currently perform at one of our
facilities subjects us to the industrial security regulations of
the Department of Defense and other federal agencies that are
designed to safeguard against unauthorized access by foreigners
and others to classified and other sensitive information. We may
be subject to penalties for violations of these regulations. If
we were to come under foreign ownership, control, or influence,
the U.S. government could terminate our contracts with it
or decide not to renew them and such a situation could also
impair our ability to obtain new contracts and subcontracts. The
government may also change its procurement practices or adopt
new contracting rules and regulations that could be costly to
satisfy or that could impair our ability to obtain new contracts.
We are
subject to a variety of federal, state, local and foreign laws
and regulatory regimes. Failure to comply with laws and
regulations could subject us to, among other things, penalties
and legal expenses which could have an adverse effect on our
business.
Our business is subject to regulation by various federal, state,
local and foreign governmental agencies. In the U.S., such
regulation includes the radioactive material and exposure
regulatory activities of the NRC, the anti-trust regulatory
activities of the Federal Trade Commission and Department of
Justice, the import/export regulatory activities of the
Department of Commerce, the Department of State and the
Department of Treasury, the regulatory activities of the
Occupational Safety and Health Administration, the environmental
regulatory activities of the Environmental Protection Agency,
the labor regulatory activities of the Equal Employment
Opportunity Commission and tax and other regulations by a
variety of regulatory authorities in each of the areas in which
we conduct business. We are also subject to regulation in other
countries where we conduct business. In certain jurisdictions,
such regulatory requirements may be more stringent than in the
United States. We are also subject to a variety of
U.S. federal and state employment and labor laws and
regulations, including the Americans with Disabilities Act, the
Federal Fair Labor Standards Act, the Worker Adjustment and
Restructuring Notification Act, which requires employers to give
affected employees at least 60 days’ notice of a plant
closing or mass layoff, and other regulations related to working
conditions,
wage-hour
pay, overtime pay, employee benefits, anti-discrimination and
termination of employment. We are also subject to the employment
and labor laws and regulations of the foreign jurisdictions,
including France and Germany, where the majority of our
employees are located.
Noncompliance with applicable regulations or requirements could
subject us to investigations, sanctions, enforcement actions,
disgorgement of profits, fines, damages, civil and criminal
penalties, injunctions or debarment from government contracting
or subcontracting. In addition, from time to time we have
received, and may in the future receive, correspondence from
former employees terminated by us who threaten to bring claims
against us alleging that we have violated one or more labor or
employment regulations. An adverse outcome in any such
litigation could require us to pay damages.
Governmental enforcement actions could harm our business,
financial condition and results of operations. If any
governmental sanctions are imposed, or if we do not prevail in
any civil or criminal litigation, our business, financial
condition and results of operations could be materially
adversely affected. In addition, responding to any action could
be costly and result in a significant diversion of
management’s attention and resources.
Certain
of our products require the use of radioactive sources or
incorporate radioactive materials, which subjects us and/or our
customers to regulation, related costs and delays and potential
liabilities for injuries or violations of environmental, health
and safety laws.
Certain products in our Health Physics, Radiation Monitoring
Systems and Sensing Systems divisions require the use of
radioactive sources. For certain of our products, these
radioactive sources are often obtained by our customers directly
from third-party providers, and for others, we directly
incorporate these radioactive sources into our products. Certain
of our reactor instrumentation and control equipment and systems
in our Sensing Systems division incorporate radioactive
materials. In all such cases, the use of such radioactive
sources or radioactive materials is subject to the licensing
requirements of the applicable jurisdiction. Our failure or any
customer’s failure to obtain the necessary license for
radioactive sources or materials required by or incorporated
into our products could result in the cancellation or delay of
purchases by our customers.
21
We are subject to federal, state and local regulations governing
storage, handling and disposal of these radioactive materials
and waste products. Outside of the United States, we are also
subject to radiation regulations that vary from country to
country. The improper storage, use and disposal of such
materials by us
and/or our
customers could result in direct or secondary liability,
including penalties and fines, to us in the event of
environmental contamination or physical injury. Although we
believe that our safety procedures for storing, handling and
disposing of these hazardous materials comply in all material
respects with the standards prescribed by law and regulation, we
cannot eliminate the risk of accidental contamination or injury
from those hazardous materials nor can we control the practices
of our customers. The sale and use of our products with
radioactive sources or materials could also lead to the filing
of claims if someone were to allege injury from the use of one
of our products or allege that one of our products was
defective. Such a claim could result in substantial damages, be
costly and time-consuming to defend and adversely affect the
marketability of our products and our reputation.
We and
our customers operate in highly regulated industries that
require us and them to obtain, and to comply with, federal,
state, local and foreign government permits and
approvals.
We and our customers operate in a highly regulated environment.
Many of our products and services must comply with various
domestic and international standards that are used by regulatory
and accreditation bodies for approving such services and
products. Many of our products, particularly those offered by
our Radiation Monitoring Systems and Sensing Systems divisions,
are subject to an array of product testing under extreme
temperature, pressure, radiation and seismic conditions, known
collectively as a qualification, for any given nuclear reactor
design. The qualification is typically owned by the party who
pays for the testing and so, in certain cases, we license such
qualifications from a third party. In addition, many of our
products and services, particularly those offered by our
Dosimetry Services division, must be certified by the National
Voluntary Laboratory Accreditation Program in the United States
and by other governmental agencies in international markets. The
termination of any such accreditation or our failure to obtain
and maintain required qualification or accreditation for our
products and services may adversely affect our revenue and
results of operations.
Changes in these standards and accreditation requirements may
also result in our having to incur substantial costs to adapt
our products. Such adaptations may introduce quality assurance
issues during transition as new features and products may not
perform as expected. Additionally, changes affecting radiation
protection practices, including new understandings of the
hazards of radiation exposure and corresponding changes in
regulations, may impact how our services are used by our
customers and may, in some circumstances, cause us to alter our
products and services.
In addition, our customers are required to obtain, and to comply
with, federal, state, local and foreign government licenses,
permits and approvals with respect to either their facilities or
possession and use of radioactive sources or other radioactive
materials. Any of these licenses, permits or approvals may be
subject to denial, revocation or modification under various
circumstances. Failure to obtain or comply with the conditions
of licenses, permits or approvals may adversely affect our
customers’ operations by suspending their activities or
delaying or preventing the receipt of radioactive sources or
other radioactive materials, and may subject them to penalties
and other sanctions. Although existing licenses, permits or
approvals are routinely renewed by various regulators, renewal
could be denied or jeopardized by various factors, including:
|
|
|
| |
•
|
failure to provide adequate financial assurance in the event of
decommissioning or closure;
|
| |
| |
•
|
failure to comply with environmental and safety laws and
regulations or permit conditions;
|
| |
| |
•
|
local community, political or other opposition;
|
| |
| |
•
|
executive action; and
|
| |
| |
•
|
legislative action.
|
Furthermore, if new environmental legislation or regulations are
enacted or existing laws or regulations are amended or are
interpreted or enforced differently, our customers may be
required to obtain additional operating licenses, permits or
approvals. Regulatory issues experienced by our customers may
lead to delay or
22
cancellation of their orders for our products and services or
the discontinuance of future orders. We cannot assure you that
we or our customers will be able to meet all potential
regulatory challenges.
We
could incur substantial costs as a result of violations of or
liabilities under environmental laws.
Our operations and properties are subject to a variety of
federal, state, local and foreign environmental laws and
regulations governing, among other things, air emissions,
wastewater discharges, management and disposal of hazardous and
non-hazardous materials and waste and remediation of releases of
hazardous materials. Our failure to obtain any necessary permits
or to comply with present and future laws, regulations or
permits, or the identification of contamination at our or our
predecessors’ former or current facilities or at
third-party waste disposal sites, could cause us to incur
substantial costs, including
clean-up
costs, fines and penalties, investments to upgrade our
facilities or curtailment of operations. The future
identification of presently unidentified environmental
conditions, more vigorous enforcement by regulatory agencies,
enactment of more stringent laws, regulations or permit
requirements or other unanticipated events may arise in the
future and give rise to material environmental liabilities and
related costs which could have a material adverse effect on our
business, financial condition and results of operations.
A European Union, or EU, directive relating to the restriction
of hazardous substances in electrical and electronic equipment,
or RoHS directive, and an EU directive relating to waste
electrical and electronic equipment, or WEEE directive, have
been and are being implemented in EU member states. Among other
things, the RoHS directive restricts the use of certain
hazardous substances in the manufacture of electrical and
electronic equipment and the WEEE directive requires producers
of electrical goods to be responsible for the collection,
recycling, treatment and disposal of these goods. In addition,
laws similar to the RoHS and WEEE directives were passed in
China in 2006 and South Korea in 2007. Governments in other
countries and states, including the United States, are
considering implementing similar laws or regulations.
In addition, a regulation regarding the registration,
authorization and restriction of chemical substances in
industrial products, or REACH, became effective in the EU in
2007. REACH and other regulations require us or our suppliers to
substitute certain chemicals contained in our products with
substances the EU considers less dangerous. We have assessed the
impact that REACH is expected to have on us and have determined
the impact at this time to be immaterial to our business and
operations, but we cannot assure you that it or similar
regulations will not materially affect us in the future.
The costs associated with complying with future laws and
regulations could include costs associated with modifying or
requalifying our products, recycling and other waste processing
costs, legal and regulatory costs and insurance costs. We have
recorded in the past and may be required to record in the future
additional expenses for costs associated with compliance with
regulations. The costs of complying with future environmental
and worker health and safety laws and regulations could have a
material adverse effect on our business, financial condition and
results of operations.
Our
future success is dependent on our ability to retain key
personnel, including our executive officers, and attract
qualified personnel. If we lose the services of these
individuals or are unable to attract new talent, our business
will be adversely affected.
Our future operating results depend in significant part upon the
continued contributions of our key technical and senior
management personnel, many of whom would be difficult to
replace. We are particularly dependent on the continued service
of Thomas D. Logan, our President, Chief Executive Officer and
Chairman of the Board, W. Antony Besso, our Regional Vice
President, EMEA, and President, Health Physics Division,
Iain F. Wilson, our Regional Vice President, Asia, and
President, Sensing Systems Division, and Jean-Louis Gouronc, our
President, Radiation Monitoring Systems.
Our future operating results also depend in significant part
upon our ability to attract, train and retain qualified
management, manufacturing and quality assurance, engineering,
marketing, sales and support personnel. In particular, engineers
skilled in the analog technologies used in certain of our
products are in high demand and competition to attract such
personnel is intense. In addition, the expected increase in
construction of new NPPs may exacerbate the shortage of
radiation engineers and other qualified personnel. We are
continually recruiting such personnel; however, we cannot assure
you that we will be successful in attracting,
23
training or retaining such personnel now or in the future. There
may be only a limited number of persons with the requisite
skills to serve in these positions, and it may be increasingly
difficult for us to hire such persons over time. The high demand
for such personnel may increase the costs to us to recruit and
retain employees.
The loss of any key employee, the failure of any key employee to
perform in his or her current position, our inability to
attract, train and retain skilled employees as needed or the
inability of our officers and key employees to expand, train and
manage our employee base could materially and adversely affect
our business, financial condition and results of operations.
Our
ability to compete successfully and achieve future growth will
depend on our ability to protect our intellectual property and
to operate without infringing the intellectual property of
others.
Our business is largely dependent upon our design, engineering,
manufacturing and testing know-how. We attempt to protect our
intellectual property rights through trade secret laws,
non-disclosure agreements, confidentiality procedures and
employee disclosure and invention assignment agreements. To a
lesser extent, we may also seek to protect our intellectual
property through patents, trademarks and copyrights. We rely
upon unpatented proprietary radiation detection expertise,
continuing technological innovation and other trade secrets to
develop and maintain our competitive position, some of which is
licensed from third parties. Confidentiality agreements with our
employees and third parties are often limited in duration and
could be breached, and therefore they may not provide meaningful
protection for our trade secrets or proprietary radiation
detection expertise. Adequate remedies may not be available in
the event of an unauthorized use or disclosure of our trade
secrets. Others may obtain knowledge of our trade secrets
through independent development or other access by legal means.
It is possible that our efforts to protect our intellectual
property rights may not:
|
|
|
| |
•
|
prevent our competitors from independently developing similar
products, duplicating our products or designing around the
patents owned by us;
|
| |
| |
•
|
prevent third-party patents from having an adverse effect on our
ability to do business;
|
| |
| |
•
|
provide adequate protection for our intellectual property rights;
|
| |
| |
•
|
prevent disputes with third parties regarding ownership of, or
exclusive rights to, our intellectual property;
|
| |
| |
•
|
prevent disclosure of our trade secrets and know-how to third
parties or into the public domain;
|
| |
| |
•
|
prevent the challenge, invalidation or circumvention of our
existing patents;
|
| |
| |
•
|
result in patents that lead to commercially viable products or
provide competitive advantages for our products; and
|
| |
| |
•
|
result in issued patents and registered trademarks from any of
our pending applications.
|
The laws of foreign countries also may not adequately protect
our intellectual property rights. Many U.S. companies have
encountered substantial infringement problems in foreign
countries. Because we conduct a substantial portion of our
operations and a majority of our sales have been outside of the
United States, we have significant exposure to foreign
intellectual property risks.
Others have in the past attempted, and may in the future
attempt, to copy or otherwise obtain and use our intellectual
property without our consent. Monitoring the unauthorized use of
our intellectual property is difficult. There is a risk that our
customers or their end users’ customers may attempt to copy
or otherwise obtain and use our intellectual property without
our consent. It may be necessary, from time to time, to initiate
litigation against one or more third parties, including our
customers or companies with whom we have manufacturing
relationships, to preserve our intellectual property rights or
to challenge the validity and scope of proprietary rights
asserted by others, and we could face counterclaims. Legal
disputes with our customers or companies with whom we have
manufacturing relationships could substantially harm our
relationships and sales. Litigation is expensive and time
consuming, and an adverse outcome could subject us to
significant liability for damages or invalidate our proprietary
rights.
24
From time to time, third parties may claim that we have
infringed upon, misappropriated or misused other parties’
proprietary rights, and we may already be infringing without
knowing it. Any of these events or claims could result in
litigation. Such litigation, whether as plaintiff or defendant,
could result in significant expense to us and divert the efforts
of our technical and management personnel, whether or not such
litigation is ultimately determined in our favor. In the event
of an adverse result in such litigation, we could be required to
pay substantial damages, cease the manufacture, use and sale of
certain products, expend significant resources to develop or
acquire non-infringing technology, discontinue the use of
certain processes, obtain licenses to use the infringed
technology, or indemnify our customers. Product development or
license negotiating would likely result in significant expense
to us and divert the efforts of our technical and management
personnel. We cannot assure you that we would be successful in
such development or acquisition or that such licenses would be
available on reasonable terms, or at all.
Our
obligations to indemnify our customers for the infringement by
our products of the intellectual property rights of others could
require us to pay substantial damages.
We currently have in effect a number of agreements in which we
have agreed to defend, indemnify and hold harmless our customers
and suppliers from damages and costs that may arise from the
infringement by our products of third-party patents, trademarks
or other proprietary rights. We may periodically have to respond
to claims and initiate or participate in litigation in
connection with these indemnification obligations, which may
result in our paying substantial damages. Our insurance does not
cover intellectual property infringement.
Some
of our workforce is represented by labor unions in the United
States and by works councils and trade unions in the EU, which
may lead to work stoppages that could adversely affect our
business.
As of December 31, 2009, approximately 34, or 12%, of our
U.S. employees were unionized, and the majority of our EU
employees are members of, or are represented by, works councils
or trade unions. Since 1988, we have experienced only two work
stoppages, at our facility in Lamanon, France. We may experience
work stoppages or other labor problems in the future, which
could adversely affect our business. We cannot predict how
stable our relationships will be or whether we will be able to
satisfy union or works council requirements without impacting
our operating results and financial condition. Union and works
council rules may limit our flexibility to respond to changing
market conditions and the application of these rules could harm
our business. The unions and works councils may also limit our
flexibility in dealing with our workforce. Work stoppages and
instability in our relationships could negatively impact the
timely production of our products, which could strain
relationships with customers and cause a loss of revenue that
would adversely affect our results of operations.
Our
operations could be subject to natural disasters and other
business disruptions, which could materially adversely affect
our business and increase our expenses.
Our operations could be subject to natural disasters and other
business disruptions, which could harm our future revenue and
financial condition and increase our costs and expenses. For
example, our corporate headquarters in San Ramon,
California and the center of operations of our Dosimetry
Services division in Irvine, California are located near major
earthquake fault lines. In the event of a major earthquake or
other natural or manmade disaster, we could experience business
interruptions, destruction of or damage to facilities
and/or loss
of life, any of which could have a material adverse effect on
our business and increase our expenses.
Risks
Related to this Offering and Our Common Stock
If we
cannot generate sufficient operating cash flow and obtain
external financing, we may be unable to make all of our planned
capital expenditures and other expenses.
Our ability to fund anticipated capital expenditures and other
expenses depends on generating sufficient cash flow from
operations and the availability of external financing. Since our
inception in 2005, ACAS and its affiliates have provided us with
the capital and debt financing that we have used to fund our
growth and operations. Although ACAS will continue to be a
controlling stockholder in our company upon completion of
25
this offering, ACAS is under no obligation to continue making
capital investments in us or to provide debt financing to us.
Our debt service obligations and our capital expenditures,
together with on-going operating expenses, will be a substantial
drain on our cash flow and may decrease our cash balances. The
timing and amount of our capital requirements cannot be
precisely determined at this moment and will depend on a number
of factors, including demand for our products, product mix,
changes in industry conditions and market competition. We intend
to regularly assess markets for external financing
opportunities, including debt and equity. Such financing may not
be available when needed or, if available, may not be available
on satisfactory terms, particularly in light of the limited
financing available as a result of the current global financial
crisis. Any equity financing would cause further dilution to our
stockholders. See “Dilution.” Our inability to obtain
needed financing or to generate sufficient cash from operations
may require us to abandon projects or curtail capital
expenditures, and we could be materially adversely affected. If
we are not able to independently generate excess free cash flow
and obtain third party debt or equity financing, our ability to
grow our business may be materially adversely affected.
Upon
completion of this offering, ACAS will continue to have an
effective veto over matters determined by our Board of Directors
and will be in a position to determine the outcome of all
matters submitted to a stockholder vote as long as it continues
to hold a majority of our outstanding common stock, which will
limit your ability to influence corporate actions and may
adversely affect the market price of our common
stock.
Upon completion of this offering, ACAS and its affiliates will
collectively hold approximately %
of our outstanding common stock, or
approximately % if the underwriters
exercise in full their over-allotment option to purchase
additional shares of common stock. As a result, ACAS will
continue to determine the outcome of votes on all matters
requiring approval by our stockholders, including the election
of directors, the adoption of amendments to our Certificate of
Incorporation and Bylaws and approval of significant corporate
transactions, as long as it continues to hold a majority of our
outstanding common stock. In addition, a provision of the Bylaws
that we will adopt upon the consummation of this offering will
provide that at least one of the directors designated by ACAS
must be part of the majority in any action taken by our Board of
Directors so long as ACAS and its affiliated funds hold at least
50.1% of our outstanding common stock, other than on matters in
which ACAS has a conflict of interest (as it would if it
appointed a majority of our directors). Our Bylaws will also
provide that ACAS will have the right to designate three of our
seven directors so long as ACAS and its affiliated funds hold at
least 50.1% of our outstanding common stock, two directors so
long as they hold at least 25% but less than 50.1% and one
director so long as they hold at least 10% but less than 25%.
ACAS will also be able to take actions that have the effect of
delaying or preventing a change in control of us or discouraging
others from making tender offers for our shares, which could
prevent stockholders from receiving a premium for their shares.
These actions may be taken even if other stockholders oppose
them. In addition, this significant concentration of stock
ownership may adversely affect the trading price for our common
stock because investors often perceive disadvantages in owning
stock in companies with controlling stockholders. This
concentration of control could be disadvantageous to other
stockholders with interests different from those of our
principal stockholder and the trading price of our common stock
could be adversely affected. See “Principal
Stockholders” for a more detailed description of the
ownership of our common stock.
Conflicts
of interest may arise because some of our directors are
principals of ACAS.
Three persons designated by ACAS will serve on our Board of
Directors upon the consummation of this offering. ACAS and its
affiliates may invest in entities that directly or indirectly
compete with us, or companies in which they currently invest may
begin competing with us. As a result of these relationships,
when conflicts between the interests of ACAS and the interests
of our other stockholders arise, these directors may not be
disinterested.
Although our directors and officers will have a duty of loyalty
to us under Delaware law and the Certificate of Incorporation
that we will adopt prior to the consummation of this offering,
transactions that we enter into in which a director or officer
has a conflict of interest are generally permissible so long as
the material facts relating to the director’s or
officer’s relationship or interest as to the transaction
are disclosed to
26
our Board of Directors and a majority of our disinterested
directors, or a committee consisting solely of disinterested
directors, approves the transaction.
ACAS
and its affiliates do not have any duty to refrain from engaging
directly or indirectly in the same or similar business
activities or lines of business that we do.
Under the Certificate of Incorporation that we will adopt upon
the consummation of this offering, none of ACAS or its
affiliates and investment funds, or any other ACAS entity, nor
any director, officer, stockholder, member, manager
and/or
employee of an ACAS entity, has any duty to refrain from
engaging directly or indirectly in the same or similar business
activities or lines of business that we do. In the event that
any ACAS entity acquires knowledge of a potential transaction or
matter which may be a corporate opportunity for both itself and
us, the ACAS entity will not have any duty to communicate or
offer the corporate opportunity to us and may pursue or acquire
the corporate opportunity for itself or offer the opportunity to
another person. In addition, none of ACAS’s designees on
our Board of Directors will be required to offer to us any
transaction opportunity of which he or she becomes aware and
could take any such opportunity for him or herself or offer it
to other companies (including ACAS and its other portfolio
companies) in which they have an investment, unless such
opportunity is expressly offered to him or her solely in his or
her capacity as a director of us.
As a
“controlled company,” as defined in the NASDAQ
Marketplace Rules, we qualify for, and rely on, exemptions from
certain corporate governance requirements.
ACAS owns, and will continue to own immediately after the
completion of this offering, common stock representing more than
a majority of the voting power in the election of our directors.
As a result, we are considered a “controlled company”
within the meaning of the corporate governance standards of the
NASDAQ Marketplace Rules. Under these rules, a “controlled
company” may elect not to comply with certain corporate
governance requirements, including the requirement that a
majority of its board of directors consist of independent
directors, the requirement that it have a nominating/corporate
governance committee that is composed entirely of independent
directors for the purposes of director nominations and the
requirement that it have a compensation committee that is
composed entirely of independent directors for the purposes of
approving executive compensation. We have elected to be treated
as a controlled company and will rely on these exemptions. As a
result, we do not have a majority of independent directors and
our compensation and nominating and corporate governance
committees do not consist entirely of independent directors.
Furthermore, until one year following this offering, as
permitted by applicable rules, we do not anticipate having an
audit committee consisting solely of independent directors.
Accordingly, you do not have the same protection afforded to
stockholders of companies that are subject to all of the NASDAQ
Marketplace corporate governance requirements.
The
price of our common stock may be volatile and subject to wide
fluctuations.
The market price of our common stock may be subject to wide
fluctuations due to a number of factors. We may experience
significant period-to-period fluctuations in our backlog,
revenue and operating results in the future and any such
variations may cause our stock price to fluctuate. It is likely
that in some future period our operating results will be below
the expectations of securities analysts or investors. If this
occurs, our stock price could drop significantly. A number of
factors, in addition to those cited in other risk factors
applicable to our business, may contribute to fluctuations in
our backlog, revenue and operating results, including:
|
|
|
| |
•
|
the timing and volume of orders from our customers;
|
| |
| |
•
|
the rate of acceptance of our products by our customers;
|
| |
| |
•
|
the rate of adoption of our products in the end markets we
target;
|
| |
| |
•
|
delays or cancellations in the construction of new NPPs by our
customers;
|
| |
| |
•
|
cancellations or deferrals of customer orders in anticipation of
new products or product enhancements from us or our competitors
or other providers;
|
27
|
|
|
| |
•
|
changes in product mix; and
|
| |
| |
•
|
the rate at which new markets emerge for products we are
currently developing.
|
Broad market and industry factors may also adversely affect the
market price of our common stock, regardless of our actual
operating performance. Market and industry factors that could
cause fluctuations in our stock price may include, among other
things:
|
|
|
| |
•
|
incidents affecting the nuclear industry;
|
| |
| |
•
|
regulatory changes or legal developments affecting the nuclear
industry;
|
| |
| |
•
|
changes in financial estimates by us or by any securities
analysts who might cover our stock, or our failure to meet the
estimates made by securities analysts;
|
| |
| |
•
|
changes in the market valuations of other companies operating in
our industry;
|
| |
| |
•
|
announcements by us or our competitors of significant
acquisitions, strategic partnerships or divestitures;
|
| |
| |
•
|
additions or departures of key personnel; and
|
| |
| |
•
|
a general downturn in the stock market.
|
The market price of our common stock also might decline in
reaction to events that affect other companies in our industry,
even if these events do not directly affect us. The initial
public offering price of our common stock will be determined
through negotiations between the representatives of the
underwriters, ACAS and us and may not be representative of the
price that will prevail in the open market. You might be unable
to resell your shares at or above the offering price. In the
past, companies that have experienced volatility in the market
price of their stock have been the subjects of securities class
action litigation. If we were to become the subject of
securities class action litigation, it could result in
substantial costs and a diversion of management’s attention
and resources.
We
have and will continue to incur increased costs as a result of
becoming a reporting company.
We have and will continue to face increased legal, accounting,
administrative and other costs as a result of becoming a
reporting company that we did not incur as a private company.
The Sarbanes-Oxley Act of 2002, as well as rules subsequently
implemented by the Securities and Exchange Commission, or the
SEC, and the Public Company Accounting Oversight Board, have
required changes in the corporate governance practices of public
companies. We expect these rules and regulations to increase our
legal and financial compliance costs and to make legal,
accounting and administrative activities more time consuming and
costly. For example, upon the consummation of this offering we
will add independent directors, create additional committees of
our Board of Directors and adopt policies regarding internal
controls and disclosure controls and procedures. We also expect
to incur substantially higher costs to obtain directors and
officers’ insurance. In addition, as we gain experience
with the costs associated with being a reporting company, we may
identify and incur additional overhead costs.
Our
internal control over financial reporting does not currently
meet the standards required by Section 404 of the
Sarbanes-Oxley Act, and failure to achieve and maintain
effective internal control over financial reporting in
accordance with Section 404 of the Sarbanes-Oxley Act could
have a material adverse effect on us.
Our internal control over financial reporting does not currently
meet the standards required by Section 404 of the
Sarbanes-Oxley Act, standards that we will be required to meet
in the course of preparing our fiscal 2011 financial statements.
We currently have material weaknesses in our internal controls
and do not currently have comprehensive documentation of our
internal controls, nor do we document or test our compliance
with these controls on a periodic basis in accordance with
Section 404 of the Sarbanes-Oxley Act. Furthermore, we have
not tested our internal controls in accordance with
Section 404 and, due to our lack of documentation, such a
test would not be possible to perform at this time.
We are in the early stages of addressing our internal control
procedures to satisfy the requirements of Section 404,
which requires an annual management assessment of the
effectiveness of our internal control over financial reporting.
If, as a public company, we are not able to implement the
requirements of Section 404 in a
28
timely manner or with adequate compliance, our independent
registered public accounting firm may not be able to attest to
the effectiveness of our internal control over financial
reporting. If we are unable to maintain adequate internal
control over financial reporting, we may be unable to report our
financial information on a timely basis, may suffer adverse
regulatory consequences or violations of applicable stock
exchange listing rules and may breach the covenants under our
credit facilities. There could also be a negative reaction in
the financial markets due to a loss of investor confidence in us
and the reliability of our financial statements.
Future
sales of shares could depress our stock price.
If our existing stockholders sell substantial amounts of our
common stock in the public market following this offering, the
market price of our common stock could decline. Based on shares
outstanding as of December 31, 2009, upon completion of
this offering we will have outstanding
approximately shares
of common stock. Of these shares, only
the shares
of common stock sold in this offering will be freely tradable,
without restriction, in the public market. After the
lock-up
agreements pertaining to this offering expire, our existing
stockholders will be able to sell their shares in the public
market, subject to legal restrictions on transfer. Upon the
consummation of this offering, we will enter into a registration
rights agreement that provides for registration rights with
respect to
the shares
of our common stock that will be held by ACAS and its
affiliates, Thomas D. Logan, W. Antony Besso and certain other
stockholders following this offering. Registration of the sale
of the common stock would permit their sale into the market
immediately. If for any reason ACAS sells a large number of
shares, the market price of our common stock could decline, as
these sales may, among other things, be viewed by the public as
an indication of an upcoming or recently occurring shortfall in
the financial performance of our company. Moreover, the
perception in the public market that these investors might sell
our common stock could depress the market price of the common
stock. See “Shares Eligible for Future Sale” for more
detailed information. Additionally, we may sell or issue
additional shares of common stock in subsequent public offerings
or in connection with acquisitions, or we may in the future
consent to or otherwise trigger the exercisability of
outstanding warrants to purchase 402,428 shares of our
common stock, which will result in additional dilution and may
adversely affect market prices for our common stock.
If
securities or industry analysts do not publish research or
reports about our business, if they adversely change their
recommendations regarding our stock or if our results of
operations do not meet their expectations, our stock price and
trading volume could decline.
The trading market for our common stock will be influenced by
the research and reports that industry or securities analysts
publish about us or our business. If one or more of these
analysts cease coverage of our company or fail to publish
reports on us regularly, we could lose visibility in the
financial markets, which in turn could cause our stock price or
trading volume to decline. In addition, it is likely that in
some future period our operating results will be below the
expectations of securities analysts or investors. If one or more
of the analysts who cover us downgrade our stock, or if our
results of operations do not meet their expectations, our stock
price could decline.
Some
provisions of our Certificate of Incorporation and Bylaws may
deter third parties from acquiring us and diminish the value of
our common stock.
The Certificate of Incorporation and Bylaws that we will adopt
upon the consummation of this offering will provide for, among
other things:
|
|
|
| |
•
|
restrictions on the ability of our stockholders to fill a
vacancy on our Board of Directors;
|
| |
| |
•
|
our ability to issue preferred stock with terms that our Board
of Directors may determine, without stockholder approval;
|
| |
| |
•
|
the absence of cumulative voting in the election of directors;
|
| |
| |
•
|
advance notice requirements for stockholder proposals and
nominations;
|
| |
| |
•
|
our Board of Directors to be divided into three classes, with
each class serving staggered terms; and
|
29
|
|
|
| |
•
|
the requirement that at least one of the directors designated by
ACAS must be part of the majority in any action taken by our
Board of Directors so long as ACAS and its affiliated funds hold
at least 50.1% of our outstanding common stock, other than on
matters in which ACAS has a conflict of interest (as it would if
it appointed a majority of our directors).
|
These provisions may discourage, delay or prevent a transaction
involving a change in control of our company that is in the best
interest of our minority stockholders. Even in the absence of a
takeover attempt, the existence of these provisions may
adversely affect the prevailing market price of our common stock
if they are viewed as discouraging future takeover attempts.
We do
not anticipate paying any cash dividends for the foreseeable
future.
We currently intend to retain our future earnings, if any, for
the foreseeable future, to repay indebtedness and to fund the
development and growth of our business. We do not intend to pay
any dividends to holders of our common stock and the agreements
governing our debt significantly restrict our ability to pay
dividends. As a result, capital appreciation in the price of our
common stock, if any, will be your only source of gain on an
investment in our common stock. See “Dividend Policy.”
New
investors in our common stock will experience immediate and
substantial book value dilution after this
offering.
The initial public offering price of our common stock will be
substantially higher than the pro forma net tangible book value
per share of the outstanding common stock immediately after this
offering. Based on an assumed initial public offering price of
$ per share (the midpoint of the
price range set forth on the cover of this prospectus) and our
net tangible book value as of December 31, 2009, if you
purchase our common stock in this offering, you will suffer
immediate dilution in net tangible book value per share of
approximately $ per share. See
“Dilution.”
30
FORWARD-LOOKING
STATEMENTS
This prospectus contains forward-looking statements that are
subject to risks and uncertainties. All statements other than
statements of historical fact included in this prospectus are
forward-looking statements. Forward-looking statements give our
current expectations and projections relating to our financial
condition, results of operations, plans, objectives, future
performance and business. You can identify forward-looking
statements by the fact that they do not relate strictly to
historical or current facts. These statements may include words
such as “anticipate,” “estimate,”
“expect,” “project,” “plan,”
“intend,” “believe,” “may,”
“should,” “can have,” “likely” and
other words and terms of similar meaning in connection with any
discussion of the timing or nature of future operating or
financial performance or other events.
The forward-looking statements contained in this prospectus are
based on assumptions that we have made in light of our industry
experience and on our perceptions of historical trends, current
conditions, expected future developments and other factors we
believe are appropriate under the circumstances. As you read and
consider this prospectus, you should understand that these
statements are not guarantees of performance or results. They
involve assumptions as well as risks and uncertainties, some of
which are beyond our control. Although we believe that these
forward-looking statements are based on reasonable assumptions,
you should be aware that many factors could affect our actual
financial results and cause them to differ materially from those
anticipated in the forward-looking statements. We believe these
factors include, but are not limited to, those described under
“Risk Factors” and “Management’s Discussion
and Analysis of Financial Condition and Results of
Operations.” Should one or more of these risks or
uncertainties materialize, or should any of these assumptions
prove incorrect, our actual results may vary in material
respects from those projected in these forward-looking
statements.
Any forward-looking statement made by us in this prospectus
speaks only as of the date on which we make it. Factors or
events that could cause our actual results to differ may emerge
from time to time, and it is not possible for us to predict all
of them. We undertake no obligation to publicly update any
forward-looking statement, whether as a result of new
information, future developments or otherwise, except as may be
required by law.
31
USE OF
PROCEEDS
We estimate that the net proceeds from this offering, after
deducting underwriting discounts and estimated offering expenses
will be approximately
$ million, assuming the
shares are offered at $ per share
(the midpoint of the price range set forth on the cover page of
this prospectus). We intend to use
$ million of the net proceeds
from this offering to repay certain borrowings from ACAS and its
affiliates. We also intend to use net proceeds from this
offering to make a one-time payment of $8.0 million to
ACFS, a subsidiary of ACAS, to terminate an investment banking
services agreement between us and ACFS. See “Certain
Relationships and Related Party Transactions.” A $1.00
increase (decrease) in the assumed initial public offering price
of $ per share would increase
(decrease) the net proceeds to us from this offering by
$ million, assuming the
number of shares offered by us, as set forth on the cover page
of this prospectus, remains the same and after deducting
underwriting discounts and commissions and estimated expenses
payable by us.
We intend to repay with a portion of the proceeds of this
offering the following outstanding debt of our subsidiaries that
is held by our principal stockholder, ACAS, or its affiliates.
For purposes of this section, EURIBOR means the Euro Interbank
Offered Rate and LIBOR means the London Interbank Offered Rate.
| |
|
|
|
|
|
|
|
|
|
|
|
|
|
|
|
|
|
|
|
|
|
|
|
|
|
|
|
|
|
|
|
|
|
|
|
Pro Forma
|
|
|
|
|
|
|
|
|
|
|
Interest Rate
|
|
|
Principal Balance at
|
|
|
Principal Balance at
|
|
|
|
|
|
|
|
Contractual
|
|
|
at December 31,
|
|
|
December 31,
|
|
|
February 28,
|
|
|
|
|
Due
|
|
|
Interest Rate
|
|
|
2009
|
|
|
2009(1)
|
|
|
2010(1)
|
|
|
|
|
|
|
|
|
|
|
|
|
|
(In thousands)
|
|
|
(In thousands)
|
|
|
Revolving Credit Facilities:
|
|
|
|
|
|
|
|
|
|
|
|
|
|
|
|
|
|
|
|
|
|
$20.25 million
|
|
|
July 2011
|
|
|
|
LIBOR + 4.5%
|
|
|
|
4.73%
|
|
|
$
|
20,250
|
|
|
$
|
20,250
|
|
|
$14.0 million
|
|
|
July 2011
|
|
|
|
LIBOR + 5%
|
|
|
|
5.23%
|
|
|
|
13,997
|
|
|
|
13,997
|
|
|
$8.2 million
|
|
|
July 2011
|
|
|
|
EURIBOR + 2%
|
|
|
|
2.47%
|
|
|
|
7,130
|
|
|
|
7,130
|
|
|
|
|
|
|
|
|
|
|
|
|
|
|
|
|
|
|
|
|
|
|
|
|
|
|
|
|
|
|
|
|
|
|
|
|
|
|
$
|
41,377
|
|
|
$
|
41,377
|
|
|
|
|
|
|
|
|
|
|
|
|
|
|
|
|
|
|
|
|
|
|
|
|
Senior Term Notes:
|
|
|
|
|
|
|
|
|
|
|
|
|
|
|
|
|
|
|
|
|
|
$24.9 million Senior Term B
|
|
|
July 2011
|
|
|
|
EURIBOR + 3%
|
|
|
|
3.47%
|
|
|
$
|
24,944
|
|
|
$
|
24,944
|
|
|
$4 million Senior Term C
|
|
|
Oct 2011
|
|
|
|
LIBOR + 9%
|
|
|
|
9.23%
|
|
|
|
4,000
|
|
|
|
4,000
|
|
|
$27 million Senior Term D
|
|
|
Oct 2011
|
|
|
|
LIBOR + 6.5%
|
|
|
|
6.73%
|
|
|
|
25,920
|
|
|
|
25,853
|
|
|
|
|
|
|
|
|
|
|
|
|
|
|
|
|
|
|
|
|
|
|
|
|
|
|
|
|
|
|
|
|
|
|
|
|
|
|
$
|
54,864
|
|
|
$
|
54,797
|
|
|
|
|
|
|
|
|
|
|
|
|
|
|
|
|
|
|
|
|
|
|
|
|
|
|
|
(1)
|
|
Interest is paid by us to the
lender monthly in arrears, and accordingly, the balance at each
month’s end reflects only the principal balance of the
related obligation. Any decrease in the principal balance
between periods is due to scheduled principal repayments
expected to be made by us.
|
We intend to repay all other debt held by ACAS and its
affiliates (estimated on a pro forma basis to be $87.9 million
as of February 28, 2010) with borrowings under our anticipated
new bank credit facilities that we expect to enter into upon the
consummation of this offering.
32
DIVIDEND
POLICY
We have never declared or paid any cash dividends on our common
stock. We currently intend to retain our future earnings, if
any, for the foreseeable future, to repay indebtedness and to
fund the development and growth of our business. We do not
intend to pay dividends to holders of our common stock and the
agreements governing our anticipated new bank credit facilities
significantly restrict our ability to pay cash dividends.
33
CAPITALIZATION
The following table sets forth our consolidated capitalization
as of December 31, 2009:
|
|
|
| |
•
|
on an actual basis; and
|
|
|
|
| |
•
|
on a pro forma as adjusted basis to give effect to the
conversion of our Series A Convertible Participating Preferred
Stock into 1,203,045 shares of common stock pursuant to the
conversion terms in our Certificate of Incorporation, the
conversion of 2,091 shares of Class A Voting Common Stock and
45,650 shares of Class B Non-Voting Common Stock into 47,741
shares of our common stock on a one-to-one basis, the sale
of shares
of our common stock in this offering by us at an assumed initial
public offering price of $ per
share (the midpoint of the range set forth on the cover page of
this prospectus), the application of approximately
$104.2 million of the net proceeds as described in
“Use of Proceeds” to effect the repayment of
approximately $ million of
our indebtedness to ACAS and its affiliates and to make a
one-time, $8.0 million payment to ACFS, after deducting the
underwriting discounts and estimated offering expenses of
$ , and our intent to repay
all other debt held by ACAS and its affiliates (estimated on a
pro forma basis to be
$ million as of
February 28, 2010) with borrowings under our
anticipated new bank credit facilities that we expect to enter
into upon the consummation of this offering.
|
You should read this table along with “Use of
Proceeds,” “Management’s Discussion and Analysis
of Financial Condition and Results of Operations” and our
consolidated financial statements and the related notes
appearing elsewhere in this prospectus.
| |
|
|
|
|
|
|
|
|
|
|
|
|
|
|
|
As of December 31, 2009
|
|
|
|
|
|
|
|
|
|
|
Pro Forma
|
|
|
|
|
Actual
|
|
|
Pro Forma(1)
|
|
|
as Adjusted(1)
|
|
|
|
|
(in thousands, except share data)
|
|
|
|
|
Total debt, including current portion:
|
|
|
|
|
|
|
|
|
|
|
|
|
|
Notes payable to ACAS
|
|
$
|
183,790
|
|
|
|
|
|
|
|
|
|
|
Notes payable to third parties
|
|
|
5,799
|
|
|
|
|
|
|
|
|
|
|
|
|
|
|
|
|
|
|
|
|
|
|
|
|
New indebtedness
|
|
|
|
|
|
|
|
|
|
|
|
|
|
Revolving credit facility
|
|
|
—
|
|
|
|
|
|
|
|
|
|
|
Term loan facility
|
|
|
—
|
|
|
|
|
|
|
|
|
|
|
|
|
|
|
|
|
|
|
|
|
|
|
|
|
Stockholders’ equity:
|
|
|
|
|
|
|
|
|
|
|
|
|
|
Series A-1
Convertible Participating Preferred Stock, $0.001 par
value; 1,200,000 shares authorized, actual;
678,804 shares issued and outstanding, actual; none
authorized, pro forma as adjusted; none issued and outstanding,
pro forma as adjusted
|
|
|
1
|
|
|
|
—
|
|
|
|
|
|
|
Series A-2
Convertible Participating Preferred Stock, $0.001 par
value; 300,000 shares authorized, actual;
70,000 shares issued and outstanding, actual; none
authorized, pro forma as adjusted; none issued and outstanding,
pro forma as adjusted
|
|
|
—
|
|
|
|
—
|
|
|
|
|
|
|
Class A Voting Common Stock, $0.001 par value;
2,500,000 shares authorized, actual; 2,091 shares
issued and outstanding, actual; none authorized, pro forma as
adjusted; none issued and outstanding, pro forma as adjusted
|
|
|
—
|
|
|
|
—
|
|
|
|
|
|
|
Class B Non-Voting Common Stock, $0.001 par value;
700,000 shares authorized, actual; 45,650 shares
issued and outstanding, actual; none authorized, pro forma as
adjusted; none issued and outstanding, pro forma as adjusted
|
|
|
—
|
|
|
|
—
|
|
|
|
|
|
34
| |
|
|
|
|
|
|
|
|
|
|
|
|
|
|
|
As of December 31, 2009
|
|
|
|
|
|
|
|
|
|
|
Pro Forma
|
|
|
|
|
Actual
|
|
|
Pro Forma(1)
|
|
|
as Adjusted(1)
|
|
|
|
|
(in thousands, except share data)
|
|
|
|
|
Common stock, $0.001 par value; none authorized, actual;
none issued and outstanding,
actual; shares
authorized, pro forma as
adjusted; shares
issued and outstanding, pro forma as adjusted
|
|
|
—
|
|
|
|
|
|
|
|
|
|
|
Additional paid-in capital
|
|
|
99,016
|
|
|
|
|
|
|
|
|
|
|
Accumulated deficit
|
|
|
(103,332
|
)
|
|
|
|
|
|
|
|
|
|
Accumulated other comprehensive income
|
|
|
11,995
|
|
|
|
|
|
|
|
|
|
|
|
|
|
|
|
|
|
|
|
|
|
|
|
|
Total stockholders’ equity
|
|
|
7,680
|
|
|
|
|
|
|
|
|
|
|
|
|
|
|
|
|
|
|
|
|
|
|
|
|
Total capitalization
|
|
$
|
197,269
|
|
|
$
|
|
|
|
|
|
|
|
|
|
|
|
|
|
|
|
|
|
|
|
|
|
|
|
|
(1)
|
|
Assuming the number of shares sold
by us in this offering remains the same as set forth on the
cover page, a $1.00 increase or decrease in the assumed initial
public offering price would increase or decrease, as applicable,
our total cash, total stockholders’ equity and total
capitalization by approximately
$ million.
|
The table above excludes, as of December 31, 2009:
|
|
|
| |
•
|
113,288 shares of common stock subject to outstanding
options at a weighted average exercise price of $122.77 per
share;
|
|
|
|
| |
•
|
5,402 additional shares of common stock reserved for issuance
under our existing stock option plan, all of which are expected
to be granted to our employees, including our executive
officers, immediately following the pricing of this offering at
an exercise price equal to the initial public offering price;
|
|
|
|
| |
•
|
106,160 additional shares of common stock to be reserved for
issuance under our amended and restated stock option plan to
become effective in connection with this offering; and
|
|
|
|
| |
•
|
402,428 shares of common stock subject to outstanding
warrants as of December 31, 2009 at a weighted average
exercise price of $0.00152 per share. These warrants only become
exercisable upon a sale, liquidation or dissolution of the
Company or approval by the Board of Directors. The Board of
Directors does not currently intend to approve the exercise of
such warrants.
|
35
DILUTION
If you invest in our common stock, your interest will be diluted
to the extent of the difference between the public offering
price per share of our common stock and the pro forma net
tangible book value per share of common stock initially upon
completion of this offering.
Net tangible book value per share represents the amount of our
total tangible assets less total liabilities, divided by the
number of shares of common stock outstanding. After giving
effect to the sale of shares of common stock offered in this
offering and after deducting the underwriting discounts and
estimated offering expenses, our pro forma net tangible book
value as of December 31, 2009 would have equaled
$ per share of common stock. This
represents an immediate increase in net tangible book value of
$ per share to our existing
stockholders and an immediate dilution in net tangible book
value of $ per share to new
stockholders of common stock in this offering. If the initial
public offering price is higher or lower, the dilution to new
stockholders will be greater or less. The following table
summarizes this per share dilution:
| |
|
|
|
|
|
|
|
|
|
Assumed initial public offering price per share
|
|
|
|
|
|
$
|
|
|
|
Net tangible book value per share as of December 31, 2009
|
|
$
|
|
|
|
|
|
|
|
Increase per share attributable to this offering
|
|
|
|
|
|
|
|
|
|
|
|
|
|
|
|
|
|
|
|
Pro forma net tangible book value per share after this offering
|
|
|
|
|
|
|
|
|
|
|
|
|
|
|
|
|
|
|
|
Dilution in pro forma net tangible book value per share to new
stockholders
|
|
|
|
|
|
$
|
|
|
|
|
|
|
|
|
|
|
|
|
A $1.00 increase or decrease in the assumed initial public
offering price of $ per share
would increase or decrease, as applicable, our pro forma net
tangible book value by
$ million, the pro forma net
tangible book value per share by $
per share, and the dilution in pro forma net tangible book value
per share to new stockholders by $
per share.
If the underwriters exercise their over-allotment in full, pro
forma net tangible book value per share after this offering will
be $ , and dilution in pro forma
net tangible book value per share to new stockholders will be
$ .
The following table summarizes on a pro forma basis, as of
December 31, 2009, the differences between our existing
stockholders and new stockholders with respect to the number of
shares of common stock issued by us, the total consideration
paid and the average price per share paid:
| |
|
|
|
|
|
|
|
|
|
|
|
|
|
|
|
|
|
|
|
|
|
|
|
Shares Purchased
|
|
Total Consideration
|
|
Average Price
|
|
|
|
Number
|
|
Percent
|
|
Amount
|
|
Percent
|
|
Per Share
|
|
|
|
(in thousands)
|
|
|
|
(in thousands)
|
|
|
|
|
|
|
|
Existing stockholders
|
|
|
|
|
|
|
|
|
|
|
|
|
|
|
|
|
|
|
|
|
|
New stockholders
|
|
|
|
|
|
|
|
|
|
|
|
|
|
|
|
|
|
|
|
|
A $1.00 increase or decrease in the assumed initial public
offering price of $ per share
would increase or decrease, as applicable, total consideration
paid by new stockholders and total consideration paid by all
stockholders by $ million.
If the underwriters exercise their over-allotment option in
full, the following will occur: (1) the number of shares of
common stock held by existing stockholders will represent
approximately % of the total number
of shares of common stock outstanding after this offering; and
(2) the number of shares of common stock held by new public
stockholders will be increased
to ,
or approximately % of the total
number of shares of common stock outstanding after this offering.
The number of shares of common stock to be outstanding after
this offering is based on 1,250,786 shares outstanding as
of December 31, 2009 and excludes:
|
|
|
| |
•
|
113,288 shares of common stock subject to outstanding
options as of December 31, 2009 at a weighted average
exercise price of $122.77 per share;
|
36
|
|
|
| |
•
|
5,402 additional shares of common stock reserved for issuance
under our existing stock option plan, all of which are expected
to be granted to our employees, including our executive
officers, immediately following the pricing of this offering at
an exercise price equal to the initial public offering price;
|
| |
| |
•
|
106,160 additional shares of common stock to be reserved for
issuance under our amended and restated stock option plan to
become effective in connection with this offering; and
|
| |
| |
•
|
402,428 shares of common stock subject to outstanding warrants
as of December 31, 2009 at a weighted average exercise
price of $0.00152 per share. These warrants only become
exercisable upon a sale, liquidation or dissolution of the
Company or approval by the Board of Directors. The Board of
Directors does not currently intend to approve the exercise of
such warrants.
|
To the extent that options or warrants are exercised, there may
be further dilution to new stockholders.
37
SELECTED
CONSOLIDATED FINANCIAL DATA
You should read the following selected consolidated historical
financial data below in conjunction with “Management’s
Discussion and Analysis of Financial Condition and Results of
Operations” and the consolidated financial statements,
related notes and other financial information included elsewhere
in this prospectus. The selected financial data in this section
is not intended to replace the consolidated financial statements
and related notes included elsewhere in this prospectus.
The selected consolidated statements of operations data for each
of the three fiscal years ending June 30, 2007, 2008 and
2009 and the consolidated balance sheet data as of June 30,
2008 and 2009 are derived from our audited annual consolidated
financial statements and related notes included elsewhere in
this prospectus. The consolidated statements of operations data
for the fiscal year ended June 30, 2006 and the
consolidated balance sheet data as of June 30, 2007 are
derived from our audited consolidated financial statements not
included in this prospectus. The consolidated statements of
operations data for the fiscal year ending June 30, 2005
and the consolidated balance sheet data as of June 30, 2005
and 2006 are derived from our unaudited financial statements not
included in this prospectus. Until their merger in
December 2005 resulting in the formation of Mirion, we were
comprised of GDS, IST and Synodys, entities which were under the
common control of ACAS. The consolidated statements of
operations data for the six months ended December 31, 2008
and 2009 and the consolidated balance sheet data at
December 31, 2009 are derived from our unaudited
consolidated financial statements included elsewhere in this
prospectus. Our historical results are not necessarily
indicative of the results that should be expected in the future
and results for the six months ended December 31, 2009 are
not necessarily indicative of results to be expected for the
full year. The amounts below are in thousands, except
percentages, shares and per share data.
| |
|
|
|
|
|
|
|
|
|
|
|
|
|
|
|
|
|
|
|
|
|
|
|
|
|
|
|
|
|
|
|
|
|
|
|
|
|
|
|
|
|
|
|
|
|
|
Six Months Ended
|
|
|
|
|
Year Ended June 30,
|
|
|
December 31,
|
|
|
|
|
2005
|
|
|
2006
|
|
|
2007
|
|
|
2008
|
|
|
2009
|
|
|
2008
|
|
|
2009
|
|
|
|
|
Consolidated Statement of Operations Data:
|
|
|
|
|
|
|
|
|
|
|
|
|
|
|
|
|
|
|
|
|
|
|
|
|
|
|
|
|
|
Revenue
|
|
$
|
129,281
|
|
|
$
|
145,770
|
|
|
$
|
169,033
|
|
|
$
|
191,769
|
|
|
$
|
201,763
|
|
|
$
|
100,519
|
|
|
$
|
108,658
|
|
|
Cost of revenue
|
|
|
74,188
|
|
|
|
77,999
|
|
|
|
94,321
|
|
|
|
102,790
|
|
|
|
105,954
|
|
|
|
53,793
|
|
|
|
60,140
|
|
|
|
|
|
|
|
|
|
|
|
|
|
|
|
|
|
|
|
|
|
|
|
|
|
|
|
|
|
|
|
|
|
|
|
|
|
|
|
|
|
|
|
|
|
|
|
|
|
|
|
|
|
|
|
|
|
|
|
|
|
|
Gross profit
|
|
|
55,093
|
|
|
|
67,771
|
|
|
|
74,712
|
|
|
|
88,979
|
|
|
|
95,809
|
|
|
|
46,726
|
|
|
|
48,518
|
|
|
|
|
|
|
|
|
|
|
|
|
|
|
|
|
|
|
|
|
|
|
|
|
|
|
|
|
|
|
|
|
% of revenue
|
|
|
42.6
|
%
|
|
|
46.5
|
%
|
|
|
44.2
|
%
|
|
|
46.4
|
%
|
|
|
47.5
|
%
|
|
|
46.5
|
%
|
|
|
44.7
|
%
|
|
Operating expenses
|
|
|
|
|
|
|
|
|
|
|
|
|
|
|
|
|
|
|
|
|
|
|
|
|
|
|
|
|
|
Selling, general and administrative expenses
|
|
|
45,231
|
|
|
|
69,011
|
|
|
|
59,449
|
|
|
|
63,177
|
|
|
|
65,649
|
|
|
|
31,310
|
|
|
|
33,754
|
|
|
Research and development expenses
|
|
|
6,548
|
|
|
|
9,726
|
|
|
|
11,875
|
|
|
|
14,865
|
|
|
|
11,282
|
|
|
|
6,277
|
|
|
|
5,202
|
|
|
|
|
|
|
|
|
|
|
|
|
|
|
|
|
|
|
|
|
|
|
|
|
|
|
|
|
|
|
|
|
Total operating expenses
|
|
|
51,779
|
|
|
|
78,737
|
|
|
|
71,324
|
|
|
|
78,042
|
|
|
|
76,931
|
|
|
|
37,587
|
|
|
|
38,956
|
|
|
|
|
|
|
|
|
|
|
|
|
|
|
|
|
|
|
|
|
|
|
|
|
|
|
|
|
|
|
|
|
Income (loss) from operations
|
|
|
3,314
|
|
|
|
(10,966
|
)
|
|
|
3,388
|
|
|
|
10,937
|
|
|
|
18,878
|
|
|
|
9,139
|
|
|
|
9,562
|
|
|
Interest expense, net
|
|
|
21,287
|
|
|
|
20,689
|
|
|
|
19,153
|
|
|
|
20,207
|
|
|
|
17,711
|
|
|
|
9,736
|
|
|
|
7,570
|
|
|
Other income (expense), net
|
|
|
10,465
|
|
|
|
(5,103
|
)
|
|
|
(1,001
|
)
|
|
|
(1,759
|
)
|
|
|
(490
|
)
|
|
|
71
|
|
|
|
(530
|
)
|
|
|
|
|
|
|
|
|
|
|
|
|
|
|
|
|
|
|
|
|
|
|
|
|
|
|
|
|
|
|
|
(Loss) Income before provision for income taxes
|
|
|
(28,438
|
)
|
|
|
(26,552
|
)
|
|
|
(14,764
|
)
|
|
|
(7,511
|
)
|
|
|
1,657
|
|
|
|
(668
|
)
|
|
|
2,522
|
|
|
Provision for income taxes
|
|
|
2,122
|
|
|
|
1,525
|
|
|
|
4,937
|
|
|
|
5,838
|
|
|
|
5,612
|
|
|
|
2,890
|
|
|
|
3,293
|
|
|
|
|
|
|
|
|
|
|
|
|
|
|
|
|
|
|
|
|
|
|
|
|
|
|
|
|
|
|
|
|
Net loss
|
|
$
|
(30,560
|
)
|
|
$
|
(28,077
|
)
|
|
$
|
(19,701
|
)
|
|
$
|
(13,349
|
)
|
|
$
|
(3,955
|
)
|
|
$
|
(3,558
|
)
|
|
$
|
(771
|
)
|
|
|
|
|
|
|
|
|
|
|
|
|
|
|
|
|
|
|
|
|
|
|
|
|
|
|
|
|
|
|
|
Paid-in-kind
preferred dividends
|
|
|
(1,785
|
)
|
|
|
(4,949
|
)
|
|
|
(8,141
|
)
|
|
|
(8,993
|
)
|
|
|
(9,892
|
)
|
|
|
(4,864
|
)
|
|
|
(5,369
|
)
|
|
|
|
|
|
|
|
|
|
|
|
|
|
|
|
|
|
|
|
|
|
|
|
|
|
|
|
|
|
|
|
Net loss allocable to common stockholders
|
|
$
|
(32,345
|
)
|
|
$
|
(33,026
|
)
|
|
$
|
(27,842
|
)
|
|
$
|
(22,342
|
)
|
|
$
|
(13,847
|
)
|
|
$
|
(8,422
|
)
|
|
$
|
(6,140
|
)
|
|
|
|
|
|
|
|
|
|
|
|
|
|
|
|
|
|
|
|
|
|
|
|
|
|
|
|
|
|
|
|
Net loss per common share allocable to common stockholders per
share — basic and diluted
|
|
|
|
|
|
$
|
(738.51
|
)
|
|
$
|
(584.74
|
)
|
|
$
|
(468.72
|
)
|
|
$
|
(290.04
|
)
|
|
$
|
(176.41
|
)
|
|
$
|
(128.61
|
)
|
|
|
|
|
|
|
|
|
|
|
|
|
|
|
|
|
|
|
|
|
|
|
|
|
|
|
|
|
|
|
|
Weighted average number of shares used in computing net loss
allocable to common stockholders — basic and diluted
|
|
|
|
|
|
|
44,720
|
|
|
|
47,614
|
|
|
|
47,666
|
|
|
|
47,741
|
|
|
|
47,741
|
|
|
|
47,741
|
|
|
|
|
|
|
|
|
|
|
|
|
|
|
|
|
|
|
|
|
|
|
|
|
|
|
|
|
|
|
|
|
Pro forma net income per common share — diluted(l)
|
|
|
|
|
|
|
|
|
|
|
|
|
|
|
|
|
|
$
|
|
|
|
|
|
|
|
$
|
|
|
|
|
|
|
|
|
|
|
|
|
|
|
|
|
|
|
|
|
|
|
|
|
|
|
|
|
|
|
|
|
|
|
|
|
|
|
|
|
|
|
|
|
|
|
|
|
|
|
|
|
|
|
|
|
|
|
|
|
|
|
|
Pro forma net income per common share — as
adjusted(1)
|
|
|
|
|
|
|
|
|
|
|
|
|
|
|
|
|
|
$
|
|
|
|
|
|
|
|
$
|
|
|
|
|
|
|
|
|
|
|
|
|
|
|
|
|
|
|
|
|
|
|
|
|
|
|
|
|
|
|
|
|
38
| |
|
|
|
|
|
|
|
|
|
|
|
|
|
|
|
|
|
|
|
|
|
|
|
|
|
|
|
|
|
|
As of
|
|
|
|
|
Year Ended June 30,
|
|
|
December 31,
|
|
|
|
|
2005
|
|
|
2006
|
|
|
2007
|
|
|
2008
|
|
|
2009
|
|
|
2009
|
|
|
|
|
Consolidated Balance Sheet Data:
|
|
|
|
|
|
|
|
|
|
|
|
|
|
|
|
|
|
|
|
|
|
|
|
|
|
Cash and cash equivalents(2)
|
|
$
|
4,073
|
|
|
$
|
4,858
|
|
|
$
|
6,561
|
|
|
$
|
8,959
|
|
|
$
|
5,390
|
|
|
$
|
6,934
|
|
|
Total assets
|
|
|
287,254
|
|
|
|
307,975
|
|
|
|
310,249
|
|
|
|
344,377
|
|
|
|
329,754
|
|
|
|
348,540
|
|
|
Notes payable to ACAS(3)
|
|
|
128,456
|
|
|
|
148,273
|
|
|
|
159,461
|
|
|
|
173,186
|
|
|
|
170,080
|
|
|
|
183,790
|
|
|
Total stockholder’s (deficit) equity
|
|
|
(41,751
|
)
|
|
|
35,419
|
|
|
|
21,263
|
|
|
|
19,152
|
|
|
|
6,847
|
|
|
|
7,680
|
|
| |
|
|
|
|
|
|
|
|
|
|
|
|
|
|
|
|
|
|
|
|
|
|
|
Year Ended June 30,
|
|
|
Six Months Ended December 31,
|
|
|
|
|
2007
|
|
|
2008
|
|
|
2009
|
|
|
2008
|
|
|
2009
|
|
|
|
|
Other Data:
|
|
|
|
|
|
|
|
|
|
|
|
|
|
|
|
|
|
|
|
|
|
Adjusted EBITDA(4)
|
|
$
|
29,254
|
|
|
$
|
34,218
|
|
|
$
|
40,625
|
|
|
$
|
18,719
|
|
|
$
|
18,512
|
|
|
Amortization of intangible assets
|
|
|
12,200
|
|
|
|
10,140
|
|
|
|
8,144
|
|
|
|
4,161
|
|
|
|
3,699
|
|
|
Capital expenditures
|
|
|
4,316
|
|
|
|
4,953
|
|
|
|
6,649
|
|
|
|
2,441
|
|
|
|
3,354
|
|
| |
|
|
|
|
|
|
|
|
|
|
|
|
|
|
|
|
|
|
|
|
|
|
As of
|
|
|
|
|
As of June 30,
|
|
|
December 31,
|
|
|
|
|
2007
|
|
|
2008
|
|
|
2009
|
|
|
2009
|
|
|
|
|
Backlog(5)
|
|
$
|
143,887
|
|
|
$
|
177,956
|
|
|
$
|
183,960
|
|
|
$
|
247,083
|
|
|
Deferred contract revenue
|
|
|
44,640
|
|
|
|
53,539
|
|
|
|
62,031
|
|
|
|
66,747
|
|
|
|
|
|
(1)
|
|
Pro forma net income per common
share — diluted and as adjusted for the year ended
June 30, 2009 and the six months ended December 31,
2009 is calculated as follows:
|
| |
|
|
|
|
|
|
|
|
|
|
|
Year Ended
|
|
|
Six Months Ended
|
|
|
|
|
June 30,
|
|
|
December 31,
|
|
|
|
|
2009
|
|
|
2009
|
|
|
|
|
(unaudited)
|
|
|
|
|
Numerator:
|
|
|
|
|
|
|
|
|
|
Net loss allocable to common stockholders
|
|
$
|
(13,847
|
)
|
|
$
|
(6,140
|
)
|
|
Effect of preferred stock dividends(a)
|
|
|
9,892
|
|
|
|
5,369
|
|
|
Interest expense from paydown of ACAS debt using proceeds of
offering(b)
|
|
|
|
|
|
|
|
|
|
|
|
|
|
|
|
|
|
|
|
Pro forma net income allocable to common
stockholders — basic and diluted
|
|
$
|
|
|
|
$
|
|
|
|
Interest expense reduction from refinancing of ACAS debt(c)
|
|
|
|
|
|
|
|
|
|
|
|
|
|
|
|
|
|
|
|
Pro forma net income allocable to common
stockholders — basic and diluted — as
adjusted
|
|
$
|
|
|
|
$
|
|
|
|
|
|
|
|
|
|
|
|
|
| |
|
|
|
|
|
|
|
|
|
|
|
Year Ended
|
|
|
Six Months Ended
|
|
|
|
|
June 30, 2009
|
|
|
December 31, 2009
|
|
|
|
|
(unaudited)
|
|
|
|
|
Denominator:
|
|
|
|
|
|
|
|
|
|
Weighted average common shares outstanding from conversion of
common stock(d)
|
|
|
47,741
|
|
|
|
47,741
|
|
|
Weighted average common shares outstanding from conversion of
convertible preferred stock(e)
|
|
|
1,099,897
|
|
|
|
1,176,202
|
|
|
Common shares issued in offering(f)
|
|
|
|
|
|
|
|
|
|
|
|
|
|
|
|
|
|
|
|
Shares used in computing pro forma net income per common
share — basic(g)
|
|
|
|
|
|
|
|
|
|
Weighted average common share equivalents of stock options(h)
|
|
|
—
|
|
|
|
11,977
|
|
|
|
|
|
|
|
|
|
|
|
|
Shares used in computing pro forma net income per common
share — diluted(g)
|
|
|
|
|
|
|
|
|
|
|
|
|
|
|
|
|
|
|
|
|
|
|
(a)
|
|
The effect of preferred stock
dividends is added back as a reduction to net loss allocable to
common stockholders, assuming that all preferred stock has been
converted into common shares as of the beginning of the period
presented.
|
|
|
|
|
(b)
|
|
The pro forma reduction in interest
expense assumes the repayment of
$ of ACAS debt using the net
proceeds from this offering, giving effect to the elimination of
the related interest expense as of the beginning of the period
presented.
|
39
|
|
|
|
(c)
|
|
All ACAS debt not assumed to be
repaid from the net proceeds from this offering is assumed to be
refinanced with a loan from a third-party bank, at interest
rates averaging % lower than
existing interest rates with ACAS giving effect to the
elimination of the related interest expense as of the beginning
of the period presented.
|
|
|
|
|
(d)
|
|
The weighted average common shares
outstanding from the conversion of common stock assumes the
conversion of all outstanding shares of Class A Voting
Common Stock and Class B Non-Voting Common Stock on a
one-to-one basis into 47,741 shares of common stock.
|
|
|
|
|
(e)
|
|
The weighted average common shares
outstanding from the conversion of preferred stock assumes the
conversion of all outstanding convertible preferred stock into
common stock, including the conversion into common stock of all
accrued and unpaid
paid-in-kind
dividends on convertible preferred stock. The 1,099,897 weighted
average at June 30, 2009 is comprised of 864,307
A-1
preferred shares, which includes 185,503 accrued but unpaid
paid-in-kind
dividends, which are convertible at a rate of 1.1328 into
979,087 common shares and 116,522
A-2
preferred shares, which includes 46,522 accrued but unpaid
paid-in-kind
dividends, which are convertible at a rate of 1.0368 into
120,810 common shares. The 1,176,202 weighted average at
December 31, 2009 is comprised of 917,558
A-1
preferred shares, which includes 238,754 accrued but unpaid
paid-in-kind
dividends, which are convertible at a rate of 1.1328 into
1,039,409 common shares and 131,937
A-2
preferred shares, which includes 61,937 accrued but unpaid
paid-in-kind
dividends, which are convertible at a rate of 1.0368 into
136,793 common shares. The increase in number of preferred
shares between periods is due to the monthly accrual of
preferred dividends which are paid in the form of additional
shares of convertible preferred stock.
|
|
|
|
|
(f)
|
|
Includes all common shares issued
in connection with this offering. Because distributions to ACAS,
our primary stockholder, consisting of obligations under
existing debt arrangements of $
and amounts due of $8.0 million to terminate an existing
investment banking arrangement, exceed our earnings plus gross
proceeds from this offering of $ ,
all common shares are included in the calculation under existing
rules on pro forma calculations.
|
|
|
|
|
(g)
|
|
Excludes 402,428 shares of
common stock subject to outstanding warrants as of June 30,
2009 and December 31, 2009. These warrants only become
exercisable upon a sale, liquidation or dissolution of the
Company or approval by the Board of Directors. The Board of
Directors does not currently intend to approve the exercise of
such warrants.
|
|
|
|
|
(h)
|
|
Includes the impact of the weighted
average shares of common stock into which outstanding options
are convertible. The amount
excludes
and
shares of common stock because the effect would be anti-dilutive
as the strike price of the options exceeds the weighted average
fair value of our stock during the periods presented.
|
|
|
|
|
(2)
|
|
As of December 31, 2009, we
also had $6.9 million of restricted cash.
|
|
|
|
|
(3)
|
|
In addition, as of
December 31, 2009, we had $5.8 million of outstanding
debt held by third parties not affiliated with ACAS.
|
|
|
|
|
(4)
|
|
We include Adjusted EBITDA in this
prospectus because (i) it is a basis upon which our
management assesses our operating performance, (ii) it is a
factor in the evaluation of the performance of our management in
determining compensation and (iii) certain maintenance
covenants under our debt agreements are tied to ratios based
upon Adjusted EBITDA, as defined. Adjusted EBITDA, as defined in
our debt agreements, is calculated as net income (loss) plus
(a) without duplication and to the extent deducted in
determining net income for such period, the sum of
(i) interest expense, (ii) income tax expense,
(iii) all amounts attributable to depreciation and
amortization expense, (iv) any extraordinary cash charges
in an amount not to exceed $4,000,000, (v) any
extraordinary non-cash charges, (vi) any other non-cash
charges (but excluding any non-cash charge in respect of an item
that was included in net income in a prior period) and
(vii) any non-recurring fees, costs and expenses as
reflected in our consolidated financial statements and any
non-recurring fees, costs and expenses incurred in connection
with this offering minus (b) without
duplication and to the extent included in net income,
(i) any cash payments made in respect of non-cash charges
described in clauses (a)(vi) or (a)(vii) taken in a prior period
and (ii) any extraordinary gains and any non-cash items of
income, all calculated on a consolidated basis in accordance
with U.S. GAAP. Adjusted EBITDA is not a measure of financial
performance calculated in accordance with U.S. GAAP, and
should be viewed as a supplement to—not a substitute
for—our results of operations presented on the basis of
U.S. GAAP. Adjusted EBITDA also does not purport to represent
cash flow provided by, or used in, operating activities in
accordance with U.S. GAAP. Our statements of cash flows,
included elsewhere in this prospectus, present our cash flow
activity in accordance with U.S. GAAP. Furthermore, Adjusted
EBITDA is not necessarily comparable to similarly titled
measures reported by other companies.
|
40
The following is a reconciliation of cash (used in) provided by
operating activities to Adjusted EBITDA:
| |
|
|
|
|
|
|
|
|
|
|
|
|
|
|
|
|
|
|
|
|
|
|
|
|
|
|
Six Months
|
|
|
|
|
|
|
|
Ended
|
|
|
|
|
Year Ended June 30,
|
|
|
December 31,
|
|
|
|
|
2007
|
|
|
2008
|
|
|
2009
|
|
|
2008
|
|
|
2009
|
|
|
|
|
Cash (used in) provided by operating activities
|
|
$
|
(3,569
|
)
|
|
$
|
(6,712
|
)
|
|
$
|
10,031
|
|
|
$
|
(2,842
|
)
|
|
$
|
(4,835
|
)
|
|
Interest expense, net
|
|
|
19,153
|
|
|
|
20,207
|
|
|
|
17,711
|
|
|
|
9,736
|
|
|
|
7,570
|
|
|
Income tax expense
|
|
|
4,937
|
|
|
|
5,838
|
|
|
|
5,612
|
|
|
|
2,890
|
|
|
|
3,293
|
|
|
Fees paid to ACFS
|
|
|
1,625
|
|
|
|
1,625
|
|
|
|
1,739
|
|
|
|
893
|
|
|
|
813
|
|
|
Other nonrecurring charges(a)
|
|
|
6,645
|
|
|
|
5,458
|
|
|
|
5,867
|
|
|
|
1,778
|
|
|
|
631
|
|
|
Actuarial (gain) loss
|
|
|
282
|
|
|
|
226
|
|
|
|
(208
|
)
|
|
|
—
|
|
|
|
—
|
|
|
Pain-in-kind interest expense
|
|
|
(1,810
|
)
|
|
|
(1,904
|
)
|
|
|
(1,992
|
)
|
|
|
(993
|
)
|
|
|
(1,041
|
)
|
|
Loss on disposal of property, plant and equipment
|
|
|
(81
|
)
|
|
|
(502
|
)
|
|
|
(592
|
)
|
|
|
(302
|
)
|
|
|
(268
|
)
|
|
Amortization of loan fees, debt discount and preferred stock
discount
|
|
|
(568
|
)
|
|
|
(785
|
)
|
|
|
(522
|
)
|
|
|
(262
|
)
|
|
|
(236
|
)
|
|
Provision for doubtful accounts
|
|
|
(96
|
)
|
|
|
(30
|
)
|
|
|
(140
|
)
|
|
|
(69
|
)
|
|
|
(25
|
)
|
|
Provision for deferred income taxes
|
|
|
1,010
|
|
|
|
1,238
|
|
|
|
1,013
|
|
|
|
(763
|
)
|
|
|
916
|
|
|
Change in operating assets and liabilities
|
|
|
1,726
|
|
|
|
9,559
|
|
|
|
2,084
|
|
|
|
8,653
|
|
|
|
11,653
|
|
|
Currency effects
|
|
|
—
|
|
|
|
—
|
|
|
|
22
|
|
|
|
—
|
|
|
|
41
|
|
|
|
|
|
|
|
|
|
|
|
|
|
|
|
|
|
|
|
|
|
|
|
|
Adjusted EBITDA
|
|
$
|
29,254
|
|
|
$
|
34,218
|
|
|
$
|
40,625
|
|
|
$
|
18,719
|
|
|
$
|
18,512
|
|
|
|
|
|
|
|
|
|
|
|
|
|
|
|
|
|
|
|
|
|
|
|
|
|
|
|
(a)
|
|
Represents non-recurring expenses,
including severance expenses and costs associated with the
preparation for our initial public offering, as well as certain
professional and legal expenses.
|
|
|
|
|
(5)
|
|
Represents purchase orders or
contracts received by us that have not been shipped. Amounts
representing backlog are not recorded in our financial
statements.
|
41
MANAGEMENT’S
DISCUSSION AND ANALYSIS
OF FINANCIAL CONDITION AND RESULTS OF OPERATIONS
The following discussion and analysis of the financial
condition and results of our operations should be read together
with “Selected Consolidated Financial Data” and the
consolidated financial statements and the related notes included
elsewhere in this prospectus. This discussion contains
forward-looking statements, based on current expectations
related to future events and our future financial performance,
that involve risks and uncertainties. Our actual results may
differ materially from those anticipated in these
forward-looking statements as a result of many factors,
including those set forth under “Risk Factors” and
elsewhere in this prospectus.
Overview
We are a global provider of radiation detection, measurement,
analysis and monitoring products and services to the nuclear,
defense and medical end markets. Our customers rely on our
solutions to protect people, property and the environment from
nuclear and radiological hazards. Our products and services
include: dosimeters; contamination & clearance
monitors; detection & identification instruments;
radiation monitoring systems; electrical penetrations;
instrumentation & control equipment and systems;
dosimetry services; imaging systems; and related accessories,
software and services.
We provide our products and services through five segments:
Health Physics, Radiation Monitoring Systems, Sensing Systems,
Dosimetry Services and Imaging Systems. Our Health Physics
segment derives revenue from the nuclear, defense and medical
end markets. We provide our Health Physics customers, which
include power and utility companies, military organizations,
engineering companies as well as governmental agencies, with
dosimeters, contamination & clearance monitors as well
as equipment that detects and identifies radioactive isotopes.
Our Radiation Monitoring Systems segment offers systems that
provide process and post-event radiation monitoring to the
nuclear end market. Our Radiation Monitoring Systems customers
include power and utility companies, engineering companies,
research laboratories, universities, as well as governmental
agencies. Our Sensing Systems segment supplies electrical
penetrations as well as reactor instrumentation &
control equipment and systems to the builders and operators of
nuclear reactors. Our Sensing Systems customers include power
and utility companies, the U.S. Navy, as well as
engineering companies. Our Dosimetry Services segment provides
analytical services to determine occupational and environmental
radiation exposure to employers of radiation workers in the
nuclear and medical end markets. Our Dosimetry Services
customers include power and utility companies, hospitals,
governmental agencies, medical professionals, dentists and
veterinarians. Our Imaging Systems segment provides specialized
closed circuit camera systems used for inspection and
surveillance in difficult and hazardous environments to the
nuclear and other end markets. We provide these systems to power
and utility companies, operators of waste management facilities,
cement kilns and petrochemical facilities.
Of the $201.8 million in total revenue we generated in
fiscal 2009, $69.1 million, or 34.2%, was attributable to
our Health Physics segment, $41.1 million, or 20.4%, was
attributable to our Radiation Monitoring Systems segment,
$45.0 million, or 22.3%, was attributable to our Sensing
Systems segment, $29.5 million, or 14.6%, was attributable
to our Dosimetry Services segment and $17.1 million, or
8.5%, was attributable to our Imaging Systems segment. Please
see Note 15 of our consolidated financial statements for
additional financial information about our segments.
Despite achieving positive operating income in fiscal 2007, 2008
and 2009, we have not achieved positive net income, due in large
part to our leverage, in any fiscal year since our inception in
2005. As of December 31, 2009, we had an accumulated
deficit of $103.3 million. We expect to reduce our leverage
through the repayment of certain of our indebtedness with the
net proceeds from this offering. See “Use of Proceeds.”
We incorporated in Delaware in October 2005 as Global Monitoring
Services, Inc. Our business was formed through a series of
transactions in December 2005 resulting in the combination of
three companies, all owned by ACAS, our principal stockholder,
and its affiliates. The three companies were GDS, a provider of
dosimetry services to the nuclear and medical industries, IST, a
manufacturer of electrical penetrations, reactor
instrumentation & control equipment and systems and
imaging systems for the nuclear, defense and other
42
industries and Synodys, a designer and manufacturer of radiation
detection, measurement, analysis and monitoring equipment for
the nuclear, defense and medical industries. Following these
transactions, we changed our name in January 2006 to Mirion
Technologies, Inc.
We are a global company with operations in Canada, China,
Finland, France, Germany, the United Kingdom and the United
States. Accordingly, currency exchange rates can impact our
reported results of operations. Revenue outside of the United
States and Canada accounted for 64.1%, 61.6% and 62.7% of total
revenue for fiscal 2008 and 2009 and the six months ended
December 31, 2009. Please see Note 15 to our
consolidated financial statements for additional financial
information about geographic areas.
Our independent registered public accounting firm reported to us
that at each of June 30, 2008, June 30, 2009 and
September 30, 2009, we had material weaknesses in our
internal controls over financial reporting which we have not yet
corrected. The material weaknesses identified were with respect
to our controls in our financial accounting and reporting
functions, which are necessary in order to produce U.S.
generally accepted accounting principles (U.S. GAAP) compliant
financial statements. See “Risk Factors” for a further
description of the foregoing material weaknesses.
References to “fiscal” before any year refer to our
fiscal year ending on June 30th of the year referenced.
Key
Indicators of Performance
In evaluating our business, our management considers Adjusted
EBITDA as a key indicator of operating performance. We include
Adjusted EBITDA in this prospectus because (i) it is a
basis upon which our management assesses our operating
performance, (ii) it is a factor in the evaluation of the
performance of our management in determining compensation and
(iii) certain maintenance covenants under our debt
agreements are tied to ratios based upon Adjusted EBITDA, as
defined. We define Adjusted EBITDA as net income (loss) less
extraordinary gains (loss) and interest income, plus interest
expense, charges against income for taxes, depreciation expense,
amortization expense, mark to market (loss) gain, certain
non-recurring charges, management fees paid to ACFS and all
non-cash compensation expenses.
We use Adjusted EBITDA as a key performance measure because we
believe it facilitates operating performance comparisons from
period to period by excluding potential differences caused by
variations in capital structures (affecting interest expense),
tax positions (such as the impact on periods or companies of
changes in effective tax rates or net operating losses) and the
impact of depreciation and amortization expense on definite
lived intangible assets. Because Adjusted EBITDA facilitates
internal comparisons of our historical operating performance on
a more consistent basis, we also use Adjusted EBITDA for
business planning purposes, to incentivize and compensate our
management personnel, in measuring our performance relative to
that of our competitors and in evaluating acquisition
opportunities.
In addition, we believe Adjusted EBITDA and similar measures are
widely used by investors, securities analysts, ratings agencies
and other interested parties as a measure of financial
performance and debt-service capabilities. Our use of Adjusted
EBITDA has limitations as an analytical tool, and you should not
consider it in isolation or as a substitute for analysis of our
results as reported under U.S. GAAP. Some of these
limitations are:
|
|
|
| |
•
|
it does not reflect our cash expenditures for capital equipment
or other contractual commitments;
|
| |
| |
•
|
although depreciation, amortization and asset impairment charges
and write-offs are non-cash charges, the assets being
depreciated, amortized or written off may have to be replaced in
the future, and Adjusted EBITDA does not reflect cash capital
expenditure requirements for such replacements;
|
| |
| |
•
|
it does not reflect changes in, or cash requirements for, our
working capital needs;
|
| |
| |
•
|
it does not consider the potentially dilutive impact of issuing
equity-based compensation to our management team and employees;
|
| |
| |
•
|
it does not reflect the significant interest expense or the cash
requirements necessary to service interest or principal payments
on our indebtedness;
|
| |
| |
•
|
it does not reflect certain tax payments that may represent a
reduction in cash available to us; and
|
43
|
|
|
| |
•
|
other companies, including companies in our industry, may
calculate these measures differently, and as the number of
differences in the way two different companies calculate these
measures increases, the degree of their usefulness as a
comparative measure correspondingly decreases.
|
Because of these limitations, Adjusted EBITDA should not be
considered as a measure of discretionary cash available to us to
invest in the growth of our business. We compensate for these
limitations by relying primarily on our U.S. GAAP results
and using Adjusted EBITDA only supplementally. We carefully
review our operating income at a segment level, which is
discussed in detail in our
period-to-period
comparison of operating results.
Components
of Revenue and Expenses
Revenue
and Cost of Revenue
Health
Physics
We generate revenue in our Health Physics segment primarily from
the sale of dosimeters, both active and passive, which measure
ionizing radiation dose; contamination & clearance
monitors, which detect alpha, beta, gamma
and/or
neutron contamination of objects of various sizes and types,
from tools to trucks; and devices that detect, locate and
identify radioactive isotopes. We sell our equipment either
pursuant to written agreements or contracts requiring delivery
of products or services over a specified time period or one-time
purchase orders depending on the nature of the product and the
dollar value of the sale. We typically use contracts for large
installations of our equipment to power and utility companies as
well as military organizations. These contracts are typically
fixed price, where we bear the risk for changes in material
costs as well as currency movements. The time period from
receipt of a contract to the recognition of revenue generally
ranges from a few months to a year. We typically use purchase
orders for the sale of replacement components as well as small
dollar value orders. For customer projects with customer
specific acceptance criteria, we typically do not recognize
revenue and the related cost of revenue until our customer has
installed the equipment and certified that it is operating
correctly or until we have otherwise determined that all
customer-specific acceptance criteria have been met.
Furthermore, customers may delay delivery or acceptance of
equipment, causing postponement of revenue recognition even
though we may have received payment. We record payments received
from customers prior to the time we recognize revenue for
associated sales as deferred contract revenue.
Revenue in our Health Physics segment has been primarily driven
by product sales for new nuclear power reactor construction in
Asia, replacement product sales for NPPs in the Americas and
Europe, as well as replacement product sales for the defense end
market.
Cost of revenue in our Health Physics segment primarily consists
of cost of goods purchased for the manufacture of our equipment,
facility costs, compensation and benefits to manufacturing
employees and outsourcing costs for subcontractor services for
the manufacture of various material
sub-components.
Radiation
Monitoring Systems
We generate revenue in our Radiation Monitoring Systems segment
from the sale of radiation monitoring systems and services to
engineering firms that design and construct nuclear reactors,
power and utility companies that operate NPPs and, to a lesser
extent, research laboratories and universities. We generate most
of the revenue in our Radiation Monitoring Systems segment from
contracts with a duration greater than one year. These contracts
are typically fixed price, where we bear the risk for changes in
material cost as well as currency movements.
Revenue in our Radiation Monitoring Systems segment can
fluctuate significantly from period to period because of
customer requirements, which depend upon the operating schedules
of nuclear reactors. The operating schedules of nuclear reactors
are affected by, among other things, seasonality in the demand
for electricity and reactor refueling and maintenance. Power and
utility companies typically schedule refueling and maintenance
to coincide with periods of reduced power demand, typically in
the spring and fall. Therefore, our revenue may be higher during
these periods when equipment is typically installed. Revenue may
also fluctuate from period to period as our equipment is
installed in newly constructed nuclear reactors.
44
Our contracts often contain multiple elements with deliveries
scheduled over multiple reporting periods. Because we are unable
to achieve separation of the elements under U.S. GAAP, we
typically do not recognize revenue and the related cost of
revenue on these contracts until our customer has installed the
equipment and certified that it is operating correctly, which
generally can extend to 12 months from shipment, although
in some cases can be longer or until we have otherwise
determined that all customer-specific acceptance criteria have
been met. Furthermore, customers may delay delivery or
acceptance of equipment, causing postponement of revenue
recognition, even though we may have received payment. In each
of the preceding circumstances, we record payments received from
customers prior to the time we recognize revenue for associated
sales as deferred contract revenue.
The Radiation Monitoring Systems segment is a project-driven
business where each project is negotiated on a stand-alone
basis. Gross margins can vary significantly by project for a
number of reasons, including level of competition, type of
customer, and the uniqueness or complexity of the project.
Accordingly, an increase or decrease in revenues from one period
to another may not result in a proportional increase or decrease
in gross margins or operating income due to the mix of projects
completed in any given quarter or year.
Revenue in our Radiation Monitoring Systems segment has been
primarily driven by new nuclear power reactor construction in
Asia and Europe, as well as the retrofitting of existing
reactors. Revenue in the Americas region has been primarily
driven by renewed sales for the retrofitting of existing
reactors.
Cost of revenue in our Radiation Monitoring Systems segment
primarily consists of cost of goods purchased for the
manufacture of our equipment, facility costs, compensation and
benefits to employees and outsourcing costs for subcontractor
services for the manufacture of various material
sub-components.
Sensing
Systems
We generate revenue in our Sensing Systems segment primarily
through sales of our electrical penetrations which are conduits
through a nuclear reactor containment structure, as well as
sales of our reactor instrumentation & control
detectors, which are used in nuclear facilities to monitor
radiation and temperature within a nuclear reactor core
(“in-core” detectors) and in surrounding areas
(“ex-core” detectors). Our Sensing Systems segment
sells primarily through contracts with engineering firms that
design and construct nuclear reactors as well as power and
utility companies that operate NPPs. These contracts are
typically fixed price, where we bear the risk for changes in
material costs as well as currency movements. We have generated
the majority of the revenue in our Sensing Systems segment from
contracts with a duration greater than one year.
Revenue in our Sensing Systems segment has been primarily driven
by new nuclear power reactor construction in Asia and Europe for
our electrical penetrations as well as by the replacement of
reactor instrumentation & control equipment and
systems for existing reactors in Asia, Europe and the Americas.
Cost of revenue in our Sensing Systems segment primarily
consists of cost of goods purchased for the manufacture of our
equipment, facility costs, compensation and benefits to
employees and outsourcing costs for subcontractor services for
the manufacture of various material
sub-components.
Dosimetry
Services
Revenue from our Dosimetry Services segment is of a subscription
nature. We provide these services to customers on an
agreed-upon
recurring monthly, quarterly or annual basis. Badge production,
badge analysis and report preparation are all integral to the
service that we provide to our customers, and therefore, we
define the service period to include the provision of all of
those services. We recognize revenue and related costs on a
straight-line basis over the service period as the service is
continuous.
Revenue in our Dosimetry Services segment has been primarily
driven by the increased use of our dosimetry services in
hospitals and other medical facilities resulting from increases
in the incidence of radiological medical procedures, along with
the increased use of our services by dental and veterinary
offices in the United States.
45
Cost of revenue in our Dosimetry Services segment primarily
consists of compensation and benefits to employees, outsourcing
costs for subcontractor services and cost of goods purchased for
use in our badges.
Imaging
Systems
We generate revenue in our Imaging Systems segment through the
sale of highly specialized closed circuit camera systems used
for inspection and surveillance in difficult and hazardous
environments through contracts with engineering firms that
design and construct nuclear reactors, power and utility
companies that operate NPPs, waste management facilities, as
well as companies that operate pulp and paper recovery boilers,
gas or coal-fired power boilers and cement kilns. These
contracts are typically fixed price, where we bear the risk of
changes in material cost and currency movements.
Revenue in our Imaging Systems segment has been primarily driven
by increased demand in Asia for high radiation-tolerant cameras
for use in new NPP construction, and for use in radioactive
waste management and nuclear facility decommissioning projects
globally.
Cost of revenue in our Imaging Systems segment primarily
consists of cost of goods purchased for the manufacture of our
equipment, facility costs, compensation and benefits to
employees, and outsourcing costs for subcontractor services for
the manufacture of various material
sub-components.
Selling,
General and Administrative Expenses
Selling, general and administrative, or SG&A, expenses
consist primarily of personnel costs (including salaries,
performance-based bonuses, commissions and employee benefits),
facilities and equipment costs, costs related to advertising and
marketing and other general corporate and support costs
including utilities, insurance and professional fees. SG&A
expenses also include $1.6 million per year in management
fees we have paid to ACFS under an investment banking services
agreement. We intend to use a portion of the net proceeds from
this offering to make a one-time payment of $8.0 million to
ACFS upon completion of this offering to terminate the agreement
related to these payments. This $8.0 million payment will
be included in SG&A expenses in the period paid. See
“Certain Relationships and Related Party Transactions.”
Research
and Development Expenses
Research and development expenses consist primarily of the costs
associated with the design and testing of new products, as well
as the upgrading of existing products. These costs relate
primarily to compensation of personnel involved with our product
development efforts, materials and outside design and testing
services. Our customers sometimes compensate us separately for
design and engineering work involved in developing our products
for them. However, in most cases we expense product development
efforts for our customers and we do not receive reimbursement.
Interest
Expense, Net
Interest expense, net includes both cash and accrued interest
expense and income and amortization of financing costs, as well
as
paid-in-kind
interest on our long-term debt.
Other
Income, Net
Other income, net includes gains and losses on the sale of
assets,
mark-to-market
gains and losses on our interest rate swap agreements and
foreign exchange windows.
Paid-In-Kind
Preferred Dividends
Paid-in-kind,
or PIK, dividends consists of expenses attributable to dividends
on our convertible preferred stock payable in additional shares
of such convertible preferred stock. Our preferred stock will
convert into common stock upon the completion of this offering.
As a result, following the completion of this offering, we will
no longer pay any additional PIK dividends.
46
Provision
for Income Taxes
Provision for income taxes represents our estimated income tax
expense for the period presented. Despite historical net losses,
we have incurred income tax expense for each of the past three
fiscal years, as we incur income taxes in various jurisdictions
as a result of the global nature of our business and operations.
Off-Balance
Sheet Arrangements
We do not have any relationships with unconsolidated entities or
financial partnerships, such as entities often referred to as
structured finance or special purpose entities, which would have
been established for the purpose of facilitating off-balance
sheet arrangements or other contractually narrow or limited
purposes, nor do we have any undisclosed material transactions
or commitments involving related persons or entities.
Critical
Accounting Policies
This management’s discussion and analysis of financial
condition and results of operations is based upon our
consolidated financial statements, which have been prepared in
accordance with accounting principles generally accepted in the
United States. The preparation of these financial statements
requires us to make estimates and assumptions about matters that
are uncertain. These estimates and assumptions are often based
on judgments that we believe to be reasonable under the
circumstances, but all such estimates and assumptions are
inherently uncertain and unpredictable. Actual results may
differ from those estimates and assumptions, and it is possible
that other professionals, applying their own judgment to the
same facts and circumstances, could develop and support
alternative estimates and assumptions that would result in
material changes to our operating results and financial
condition.
Critical accounting policies are those that both are important
to the presentation of our financial condition and results of
operations and require management’s most difficult, complex
or subjective estimates and assumptions. Our critical accounting
policies are discussed below.
Revenue
Recognition
We record revenue and the related costs of revenue when all of
the following conditions exist:
|
|
|
| |
•
|
evidence of an agreement with our customer;
|
| |
| |
•
|
work has been performed;
|
| |
| |
•
|
the amount of revenue can be reasonably estimated; and
|
| |
| |
•
|
collection of revenue from our customer is reasonably assured.
|
Revenue from certain of our fixed-price contracts in our Sensing
Systems segment is recognized on the
percentage-of-completion
method, measured by the
cost-to-cost
method. A
cost-to-cost
approach accurately reflects our obligations and performance on
these contracts, as this is the best available measure of our
progress as well as meeting our customers’ expectations of
the production being performed. Therefore, we believe that input
measures used to measure progress toward completion on certain
fixed-price projects provide a reasonable surrogate for output
measures.
Revisions to revenue, cost and profit estimates, or measurements
of the extent of progress toward completion are changes in
accounting estimates accounted for in the period of change
(using the cumulative
catch-up
method). Contracts typically provide for periodic billings on a
monthly basis or based on contract milestones. Costs and
estimated earnings in excess of billings on uncompleted
contracts represent amounts recognized as revenue that has not
been billed. Billings in excess of costs represent amounts
billed and collected for which revenue has not been recognized
and is recorded as deferred contract revenue.
We derive most of our revenue in our Dosimetry Services segment
from subscriptions and such revenue is continuous. We recognize
revenue on a straight-line basis over a set service period that
includes badge production, badge wearing, badge analysis and
report preparation as the service is continuous and no other
discernable pattern of recognition is evident. We provide these
services to customers on an
agreed-upon
monthly, quarterly or annual basis that our customers choose for
their wear period, payable in advance or in
47
arrears. The amounts recorded as deferred contract revenue on
our balance sheets represent customer deposits invoiced in
advance for services to be rendered over the service period, net
of a reserve for estimated cancellations and net of services
recognized through the balance sheet date.
In our Radiation Monitoring Systems and Health Physics segments,
revenue recognition is sometimes delayed until customer
acceptance and certification of the product. As a result,
revenue recognition can be delayed, sometimes materially,
following delivery of the product by us to the customer. In
addition, certain of our contracts contain multiple elements
with deliveries scheduled over multiple reporting periods. When
we are not able to separate the elements under U.S. GAAP, we
delay recognition on products delivered to our customers until
we have completed delivery of all products associated with the
customer. Funds received from the customer in advance of revenue
recognition are recorded on our balance sheets as deferred
contract revenue.
Recoverability
of Long-Lived Assets, Including Goodwill
Goodwill represents the excess of costs over the fair value of
net assets of businesses acquired. Goodwill is tested at the
reporting unit level at least annually for impairment and is
reviewed for impairment more frequently if events and
circumstances indicate that the asset might be impaired.
FASB-issued authoritative guidance on goodwill and other
intangible assets requires a two-step impairment test. In the
first step, we determine the fair value of the reporting unit
using a discounted cash flow valuation model and compare the
fair value to the reporting unit’s carrying value. If the
fair value of the reporting unit exceeds its carrying value,
goodwill of the reporting unit is not impaired, and no further
testing is required. If the fair value does not exceed the
carrying value, the second step of the goodwill impairment test
is performed to measure the amount of impairment loss, if any.
In the second step of the goodwill impairment test, we compare
the implied fair value of the reporting unit’s goodwill to
the carrying value. We determine the implied fair value of the
reporting unit’s goodwill as if the reporting unit had been
acquired in a business combination. If the carrying value of the
reporting unit’s goodwill exceeds the implied value, we
recognize an impairment loss in an amount equal to the excess.
We estimate future cash flows at the reporting unit level using
a discounted cash flow methodology by assessing each major
existing contract and projecting the earnings that will be
recognized in future periods. We also make estimates for
earnings from new contracts that we anticipate based on our
evaluation of future business prospects. The valuation of
goodwill could be affected if actual results differ
substantially from our estimates. Circumstances that could
affect the valuation of goodwill include a significant change in
our business climate, decisions by our customers to terminate
our existing contracts and decisions by our customers to award
to our competitors new contracts that we anticipated to be
awarded to us.
We measure intangible assets acquired in a business combination
at fair value at the date of acquisition. We assess the useful
lives of other intangible assets to determine whether events or
circumstances warrant a revision to the remaining period of
amortization. If the estimate of an intangible asset’s
remaining useful life is changed, we amortize the remaining
carrying amount of the intangible asset prospectively over the
revised remaining useful life. We review intangible assets for
impairment whenever events or circumstances indicate that the
carrying value of such assets may not be recoverable. As of
December 31, 2009, we had $140.4 million of goodwill
and $20.2 million of intangible assets with estimable
useful lives on our consolidated balance sheets. We do not have
any intangible assets with indefinite useful lives.
Intangible assets subject to amortization consist of customer
relationships, backlog, qualifications, software, territorial
rights, trade names, technology and non-compete agreements. We
evaluate customer relationships and territorial rights, which
include the fair value of acquired customer contracts, using a
discounted cash flow methodology, and amortize them over a term
of five to 17 years. We derive estimated future cash flows
based on detailed budgets and projections prepared by
management. We amortize backlog over a term of one to three
years based on the estimated delivery of the backlog. We prepare
the valuation of order backlog based on a discounted cash flow
methodology. We evaluate qualifications using a discounted cash
flow methodology and amortize them over six years. We derive
estimated future cash flows based on projections prepared by
management. We amortize software over a five year life and
derive it by estimating
48
the replacement cost of the software. We amortize trade names
over a period of four to 13 years and derive it based on
the relief from royalty method, which tries to estimate a
royalty stream for the trade names derived from a benchmark for
similar industrial products. We evaluate technology and
non-compete agreements using a discounted cash flow methodology.
We amortize intangible technology assets over a term of eight
years, and non-compete agreements over a term of five years. We
derive estimated future cash flows for each technology and
non-compete agreement based on detailed budgets and projections
prepared by management.
We review long-lived assets such as property, plant and
equipment annually for impairment and whenever events or changes
in circumstances indicate the carrying amount of an asset may
not be recoverable. We measure recoverability of assets to be
held and used by comparing the carrying amount of the asset to
the estimated undiscounted future cash flows expected to be
generated by the asset. If the carrying amount of an asset
exceeds its estimated future cash flows, we recognize an
impairment charge by the amount of excess carrying value over
fair value.
Customer
Concentration
No single customer represented more than 10% of consolidated
revenue for fiscal 2007, 2008 or 2009 or for the six months
ended December 31, 2008 or 2009.
Stock-Based
Compensation Expense
Pursuant to FASB-issued authoritative guidance on stock-based
compensation, we account for equity-based compensation awards,
including grants of employee stock options, based on the fair
values of the equity instruments issued. We determine fair value
of our equity instruments based on a valuation using an option
pricing model which takes into account various assumptions that
are subjective. Key assumptions used in the valuation included
the expected term of the equity award taking into account both
the contractual term of the award, the effects of
employees’ expected exercise and post-vesting termination
behavior, expected volatility, expected dividends and the
risk-free interest rate for the expected term of the award. The
exercise prices of our options were set at values for us
consistent with the fair value of ACAS’s investment in
Mirion as reported in ACAS’s publicly filed financial
statements.
Prior to July 1, 2005, we measured compensation expense for
our employee stock-based compensation plans using the intrinsic
value method under the provisions of Accounting Principles Board
Opinion, Accounting for Stock Issued to Employees, and
related interpretations. As the exercise price of all options
granted under this plan was at or above the estimated market
price of the underlying common stock on the date of grant, no
stock-based compensation cost was recognized in the consolidated
statements of operations under this Accounting Principles Board
Opinion.
Effective July 1, 2005, we adopted FASB-issued updated
authoritative guidance on stock-based compensation using the
prospective transition method. This method requires the
recognition of compensation cost for all stock-based awards that
are unvested as of July 1, 2005. The cost related to
stock-based compensation included in the determination of
consolidation net loss for the twelve months ended June 30,
2007, 2008 and 2009 and the six months ended December 31,
2008 and 2009 includes all awards outstanding that vested during
those periods. In connection with the reorganization of our
three predecessor companies into Mirion in December 2005, we
established the Mirion 2006 stock plan and exchanged stock
options of the three predecessor companies for stock options in
the newly formed company. Under this guidance, the exchange was
deemed a modification, resulting in incremental compensation
expense of $749,000 recorded at January 1, 2006 for those
options that were vested as of January 1, 2006. For the
unvested options at January 1, 2006, we are expensing
incremental compensation expense of $618,000 over the remaining
vesting period of approximately two years.
The stock awards under the Mirion 2006 stock plan include stock
awards with performance and market-based vesting
(“PSA”) and time-based vesting (“TSA”).
Under the terms of the PSA agreements, we grant employee stock
option awards whose vesting is contingent upon meeting
company-wide market goals including earnings before interest,
taxes and depreciation targets or market conditions, including
internal rate of return targets. The TSAs include stock options
granted by us whose vesting occurs over a period of five to
49
60 months. The PSAs include 10,094 options for which the
market-based conditions are first contingent upon a performance
based goal of a qualified sale of the Company, which does not
include a public offering.
In order to determine the fair value of options granted, the
fair value of the underlying stock must first be determined.
Following is a discussion of the methodology used in the
valuation of our stock on dates when options were granted.
The valuation of our common stock was determined in accordance
with the guidance set forth in the AICPA Audit and Accounting
Practice Aid Series: Valuation of Privately Held Company Equity
Securities Issued as Compensation. Our calculation of the fair
value of our common stock was not performed contemporaneously
with the grant of options because we did not have in place a
process to perform such valuations at the time such options were
granted. However, we considered the retrospective valuation in
our calculation of the fair value of our common stock at the
grant dates. The calculation reflects our best estimate of
relevant variables at those dates. We considered three methods
for the allocation of value among our various classes of equity:
the Current Value Method, the Probability Weighted Expected
Return Method, or PWERM, and the Option-Pricing Method. The
Current Value Method is useful for early stage companies or when
a liquidation is imminent. PWERM is useful when there are
several potential future scenarios for a company to achieve a
return on investment for its investors; it is future looking and
incorporates future economic events and outcomes into the
determination of value as of the present. The Option-Pricing
Method is useful when the range of possible future outcomes is
difficult to predict.
We did not use the Current Value Method in our valuation since
we have not been an early stage company nor have we been near
liquidation. Since our inception there have been several
potential alternatives for changes in our ownership structure,
including an initial public offering, a sale or merger, and
retention in our current form as a private company. For most of
the time since our inception, the range of possible future
outcomes has been difficult to predict, and PWERM could not be
used. Therefore, we used the Option-Pricing Method. However, as
of the most recent valuation which was performed for June 2009,
we believe that the range of possible future outcomes could be
reasonably predicted, and as such used PWERM for this period.
Following is a description of the Option-Pricing Method, which
we used to allocate value among the various classes of equity
for the period from January 2006 through December 2008.
The first step in determining the valuation of our common stock
was to determine the value of our total equity. The second step
was to allocate the total equity among the different classes of
stock. In determining the fair value of our total equity, we
considered the three traditional approaches to valuation: the
cost approach, the market approach and the income approach. The
cost approach was not utilized, while the market approach and
income approach were.
The market approach is based on the assumption that the value of
an asset (including a company) is equal to the value of a
substitute asset with the same or similar characteristics.
Therefore, the value of an asset can be determined by finding
similar assets (or interest in similar assets) that have been
sold in recent arms-length transactions.
One methodology in the market approach is the Guideline Company
Method, which compares the subject company with guideline
publicly-traded companies. Valuation multiples are calculated
from selected guideline companies to provide an indication of
how much a current investor in the marketplace would be willing
to pay for a company with similar characteristics to the subject
company. The Guideline Company Method is most appropriate when
public companies that are reasonably similar to the subject
company can be found.
Another methodology in the market approach is the Guideline
Transaction Method. This method relies on data of actual
transactions (such as mergers and acquisitions) that have
occurred in the subject company’s industry or in related
industries. As in the Guideline Company Method, valuation
multiples are developed and applied to the subject
company’s operating data to estimate fair value.
The income approach seeks to measure the future benefits that
can be quantified in monetary terms. The income approach
typically involves two general steps: the first step is to make
a projection of the total cash flows expected to accrue to an
investor in the asset; the second step involves discounting
these cash flows to
50
present value at a discount rate that considers the degree of
risk (or uncertainty) associated with the realization of the
projected monetary benefits. The discounted cash flow method is
a form of the income approach often used in the valuation of
entire businesses, major segments of a business or intangible
property.
Once we determined our valuation using each of the various
methods, we then weighted the results to arrive at a single
valuation of our equity. The market approach Guideline Company
Method, the market approach Guideline Transaction Method and the
income approach were weighted 25%, 25% and 50%.
We then allocated this total value to the different classes of
our equity using the Option-Pricing Method. As disclosed in
Note 13 to our consolidated financial statements, we have
issued
Series A-1
and A-2
preferred stock, Class A and Class B common stock,
stock options and warrants, over which to allocate the total
value of equity. Stock options and warrants are assumed to be
converted if they are
in-the-money.
The Option-Pricing Method treats the preferred and common stock
as call options that give their owner the right but not the
obligation to buy the underlying total equity at a predetermined
price. This is done by creating a series of call options with
exercise prices based on the liquidation preference,
participation rights and conversion behavior of the preferred
stock. The value of each share of preferred and common stock can
then be inferred by analyzing these options. Based on the
seniority of the classes of equity in liquidation, three call
options were created and valued. The first option uses an
exercise price in which
Series A-1
and A-2
preferred stock begin to receive values in liquidation. Since
these are the most senior classes of equity, the exercise price
is $0. The second option uses an exercise price in which
Series A-1
and A-2
preferred stock have received their full liquidation
preferences. The third option uses an exercise price in which
Series A-1
and A-2
preferred stock will convert to common stock to share in the
upside gain (the as-converted value is greater than the
liquidation preference). Thus, common stock is valued as a call
option with a claim on us at an exercise price equal to the
remaining value beyond the preferred stock’s liquidation
preference.
The following is a description of the PWERM Method, which we
used to allocate value among the various classes of equity as of
June 2009.
In PWERM, our total equity valuation was developed for various
potential scenarios: an initial public offering, a sale or
maintaining current ownership as a private company.
In determining the fair value of our equity under each of the
scenarios, the three traditional approaches to valuation were
considered: the cost approach, the market approach and the
income approach. The cost approach was not utilized, while the
market approach and income approach were. We used the Guideline
Company Method of the market approach in the valuation of our
equity for the initial public offering scenario. We used the
Guideline Transaction Method of the market approach to value our
equity for the sale scenario. We used the income approach to
value our equity in the continuing operations scenario.
After we determined the valuation of our common equity using the
three methodologies above, the results were then weighted based
on our estimate of expected outcomes. The initial public
offering scenario, the sale scenario and the current ownership
as a private company scenario were weighted 60%, 35% and 5%.
During fiscal 2009, we granted options to employees to purchase
a total of 45,886 shares of common stock at exercise prices
ranging from $138.58 to $144.95 per share. The deemed market
value of our common stock on the dates these options were
granted ranged from $46.60 to $96.18 per share.
We also previously reserved 5,402 additional options for
issuance under our existing stock option plan to our employees,
including executive officers. The purpose of this option grant
will be to incentivize employees to work to increase stockholder
value. The options will be valued using the Black-Scholes option
pricing model. Key assumptions used to value these options will
be determined as of the grant date of the options and are as
follows: expected term
is
years, risk-free interest rate
is %, dividend yield is 0.0%,
volatility is %, the exercise price
is $ and the fair value of our
common stock is $ . The aggregate
value of these 5,402 options is $
, which will be recognized evenly over their four-year vesting
period.
51
Information on employee stock options, granted since the
beginning of fiscal 2009 is summarized as follows:
| |
|
|
|
|
|
|
|
|
|
|
|
|
|
|
|
|
|
|
|
|
|
|
|
Deemed
|
|
|
|
|
|
Number of
|
|
|
|
Market Value
|
|
Intrinsic
|
|
Date of Issuance
|
|
Options Granted
|
|
Exercise Price
|
|
Per Share
|
|
Value
|
|
|
|
July 28, 2008(1)
|
|
|
12,000
|
|
|
$
|
138.58
|
|
|
$
|
96.18
|
|
|
$
|
0.00
|
|
|
August 5, 2008
|
|
|
32,886
|
|
|
|
144.95
|
|
|
|
96.18
|
|
|
|
0.00
|
|
|
December 9, 2008
|
|
|
1,000
|
|
|
|
144.24
|
|
|
|
46.60
|
|
|
|
0.00
|
|
|
|
|
|
(1) |
|
The 12,000 options were a modification on July 28, 2008 of
15,000 options granted on November 5, 2007. The 12,000
options, which have time-based vesting, replaced the 15,000
options, which had performance-based vesting. |
We make a number of estimates and assumptions related to
FASB-issued authoritative guidance on stock-based compensation.
The estimation of stock awards that will ultimately vest
requires judgment, and to the extent actual results differ from
our estimates, we will record such amounts as an adjustment in
the period such estimates are revised. Actual results may differ
substantially from these estimates. In valuing stock-based
awards under this guidance, significant judgment is required in
determining the expected volatility of our common stock and the
expected term individuals will hold their stock-based awards
prior to exercising. We base expected volatility of the stock on
our peer group in the industry in which we do business, because
we do not have sufficient historical volatility data for our own
stock. We determine the expected term of the option based on
factors including vesting period, life of option, strike price
and fair market value of our common stock on the date of grant.
In the future, as we gain historical data for volatility in our
own stock and the actual term employees hold our options,
expected volatility and expected term may change, which could
substantially change the grant date fair value of future awards
of stock options and ultimately the expense we record.
We recorded non-cash compensation expense of $0.2 million,
$0.2 million, $1.2 million, $0.6 million and
$0.5 million for fiscal 2007, 2008 and 2009 and the six
months ended December 31, 2008 and 2009.
In addition to the stock options we granted to our employees,
our President, Chief Executive Officer and Chairman of the
Board, Thomas D. Logan, entered into a Call Option Agreement on
April 19, 2004 with ACAS and certain of its affiliates, in
which ACAS granted time and performance-based options with
market conditions to Mr. Logan to purchase shares of the
common stock of two of our predecessors in connection with his
services as an officer and director. Modification of these
options occurred in substance on January 1, 2006, in
connection with the formation of Mirion in December 2005, and
was formalized in an agreement dated August 18, 2006. As a
result of the modification, Mr. Logan was granted
performance-based options with market conditions to purchase
54,564 shares of Mirion’s common stock held by ACAS. These
options were further modified on December 7, 2007 such that
their vesting criteria was amended. The exercise price of these
options is $88.75 per share, and the total maximum value
resulting from the option modification is $2.1 million. The
original grant date fair value of these options was negligible.
We will recognize expense on these options in the period and to
the extent that we are able to either complete an effective
offering in the public markets or complete a qualifying sale of
the Company.
The performance-based options with market conditions are divided
into three tranches, each of which will either vest or be
cancelled in two halves upon an initial public offering
(“IPO”) or change in control, depending on whether
ACAS achieves certain internal rates of return or returns on
investment in such an event. Upon completion of an IPO
(i.e., the performance condition), vesting of these
performance-based options will occur in two stages upon
achievement of certain market-based conditions. The first stage
occurs 30 days after the effective time of the IPO at which
time 50% of the options in each tranche will vest if ACAS
achieves certain minimum internal rates of return, ranging
between 25–40% or certain minimum returns on investment
ranging between 2.0–2.7x. If neither goal is met, the
options in this tranche will be cancelled. The second stage
occurs on the earlier of two years after the effective time of
an IPO or upon the sale by ACAS of its investments in us, at
which time the remaining 50% of the options in each tranche will
vest if ACAS achieves certain minimum internal rates of return
ranging between 25–40% or certain minimum returns on
investment of 2.0–2.7x. If
52
neither goal is met, the options in this tranche will be
cancelled. We have not recorded stock compensation expense in
connection with these options because vesting is contingent upon
future events.
The modifications of the performance-based stock options with
market conditions were accounted for under FASB-issued
authoritative guidance on stock-based payments, such that the
total compensation cost measured at the date of modification was
determined to be the grant-date fair value of the original award
plus the incremental cost resulting from the modification, in
which vesting of both the original and modified awards were
considered to be probable. Because these options contain
market-based vesting criteria, we used a Monte Carlo simulation
model, rather than a Black-Scholes model, to value such options.
In the Monte Carlo simulation model, weekly stock prices were
simulated until the liquidity event time using a geometric
Brownian motion model. Based on the simulated stock price at the
liquidity event and the vesting requirements, the number of
vested shares was determined. The stock price at liquidity and
the options’ exercise price were used to determine the
intrinsic value per share of the options at the liquidity event.
The intrinsic value was then discounted to the present at the
risk free rate to determine the option value for each
simulation. Fifty thousand simulations were run for each
valuation date, and the sum value of those simulations was
averaged to determine the value of the options. Key valuation
assumptions as of the January 1, 2006 modification are an
expected term of 4.5 years, volatility of 41.8%, a
risk-free rate of interest of 4.3%, and a dividend yield of 0%.
Key valuation assumptions as of the December 7, 2007
modification are an expected term of 2.6 years, volatility
of 39.8%, a risk-free rate of interest of 3.1%, and a dividend
yield of 0%.
The Call Option Agreement also provides Mr. Logan with an
option to purchase 17,750 shares of our common stock held
by ACAS that vest on a monthly schedule. The exercise price of
these options is $88.75 per share and the total incremental
value resulting from the option modification is $592,000. All
such options have vested as of June 30, 2008. In connection
with these options, we recorded stock compensation expense of
$151,000 and $121,000 in fiscal 2007 and 2008.
The modification of the time-based stock options were accounted
for under FASB-issued authoritative guidance on stock-based
payments, such that the total compensation cost measured at the
date of modification was determined to be the grant-date fair
value of the original award plus the incremental cost resulting
from the modification, in which vesting of both the original and
modified awards were considered to be probable. These options
were valued using the Black-Scholes model. Key valuation
assumptions as of the January 1, 2006 modification are an
expected term of 4.5 years, volatility of 41.8%, a
risk-free rate of interest of 4.3%, and a dividend yield of 0%.
All options granted by ACAS and its affiliates to Mr. Logan
pursuant to the Call Option Agreement are to be reduced on an
economically equivalent basis in the event we grant
Mr. Logan options to purchase shares of our common stock
after the date of the Call Option Agreement, provided such
options are no less favorable to Mr. Logan.
In addition to the 54,564 performance-based options with market
conditions granted to Mr. Logan by ACAS, there are 10,094
unvested outstanding performance-based options that we have
granted to other employees. These 10,094 options are different
from those granted to Mr. Logan in that they were granted
by us rather than by ACAS. Furthermore, these options only vest
in the event of a sale transaction, which does not include this
offering. Therefore, it is not expected that we will record
expense for such options.
Accounts
Receivable
We evaluate the collectability of accounts receivable based on a
combination of factors. In cases where we are aware of
circumstances that may impair a specific customer’s ability
to meet its financial obligations, we record a specific
allowance against amounts due and, thereby, reduce the net
recognized receivable to the amount we reasonably believe will
be collected. We record increases to the allowance for bad debt
as a component of general and administrative expenses.
53
Income
Taxes
The determination of our tax provision is subject to judgments
and estimates due to the complexity of the tax law that we are
subject to in several tax jurisdictions. Earnings derived from
our international business are generally taxed at rates that are
different than U.S. rates, resulting in an effective tax
rate different than the U.S. statutory tax rate of 34.0%.
The ability to maintain our current effective tax rate is
contingent on existing tax laws in both the United States and
the respective countries in which our international subsidiaries
are located. In addition, a decrease in the percentage of our
total earnings from international business or a change in the
mix of international business among particular tax jurisdictions
could alter our overall effective tax rate.
Income taxes are accounted for under the asset and liability
method in accordance with FASB-issued authoritative guidance on
accounting for income taxes. Under this method, deferred tax
assets and liabilities are recognized for the estimated future
tax consequences attributable to differences between the tax
bases of assets and liabilities and their financial statement
carrying amounts, and consideration is given to operating losses
and tax credit carryforwards. Deferred tax assets and
liabilities are measured using enacted tax rates expected to
apply to taxable income in the years in which those temporary
differences are expected to be recovered or settled. The effect
on the deferred tax assets and liabilities of a change in tax
rates is recognized in income in the period that includes the
enactment date. This guidance also requires that deferred tax
assets be reduced by a valuation allowance if it is more likely
than not that some or all of the deferred tax asset will not be
realized. We have provided a valuation allowance of
$31.4 million as of June 30, 2009 and
$27.6 million as of June 30, 2008 on primarily our
U.S. jurisdiction deferred tax assets.
On July 1, 2007, we adopted FASB-issued authoritative
guidance on accounting for uncertainty in income taxes. This
guidance clarifies the accounting for uncertainty in income
taxes recognized in an enterprise’s financial statements in
accordance with FASB-issued authoritative guidance on accounting
for income taxes. This interpretation prescribes a recognition
threshold and measurement attribute for the financial statement
recognition and measurement of a tax position taken or expected
to be taken in a tax return. As a result of the implementation
of this guidance, we recognize the tax liability for uncertain
income tax positions on the income tax return based on the
two-step process prescribed in the interpretation. The first
step is to determine whether it is more likely than not that
each income tax position would be sustained upon audit. The
second step is to estimate and measure the tax benefit as the
amount that has a greater than 50% likelihood of being realized
upon ultimate settlement with the tax authority. Estimating
these amounts requires us to determine the probability of
various possible outcomes. We evaluate these uncertain tax
positions on a quarterly basis. This evaluation is based on the
consideration of several factors, including changes in facts or
circumstances, changes in applicable tax law, settlement of
issues under audit, and new exposures. If we later determine
that our exposure is lower or that the liability is not
sufficient to cover our revised expectations, we adjust the
liability and effect a related change in our tax provision
during the period in which we make such determination.
Inventory
Valuation
At each balance sheet date, we evaluate our ending inventories
for excess quantities and obsolescence. This evaluation includes
analysis of sales levels by products. Among other factors, we
consider historical demand and forecasted demand in relation to
the inventory on hand, product life cycles and the number of
facilities using our products when determining obsolescence and
net realizable value. We adjust remaining balances to
approximate the lower of our manufacturing cost or market value.
We determine inventory cost on a
first-in,
first-out basis and include material, labor and manufacturing
overhead costs. We may be required to write-down inventory for
reasons such as obsolescence, excess quantities and declines in
market value below our costs.
Outlook
We expect the following factors to affect our results of
operation in future periods. In addition to these factors,
please refer to “Risk Factors” for additional
information on what could cause our actual results to differ
from our expectations.
Industry growth trends. Our performance
depends on the timing and level of spending for our products by
each of our customers in each of our five segments. Our success
is dependent upon the continued increase in construction
activity for new NPPs in Asia and Europe, as well as the
operating life extension of plants in
54
Europe, Asia and the United States. We expect defense spending
to detect and prevent radiological threats to continue, as well
as spending in connection with large-scale public events. The
expansion of radiological medical procedures is also providing
us with opportunities for continued growth. For discussion of
the factors that influence spending on our products, see
“Industry.”
Research and development expenses. We
expect our research and development expenses as a percentage of
revenue to decrease as we grow our business, focus our
engineering activities on customer driven initiatives and
benefit from the reduced engineering costs associated with
optimized product lines.
SG&A expenses. We expect our
SG&A expenses as a percentage of revenue to decrease as our
business grows and we continue to manage expenses and reduce our
amortization expense on an annual basis. The majority of our
amortization expenses are in SG&A expenses. We have
incurred expenses in the past in connection with the integration
of the legacy businesses of which we are comprised, in addition
to severance costs associated with our cost reduction efforts.
We do not expect these expenses to recur. We also expect to
eliminate $1.6 million per year in annual management fees
we have paid to ACFS pursuant to an investment banking services
agreement that we intend to terminate by making a one-time
payment of $8.0 million to ACFS upon completion of this
offering. We expect any reduction in our SG&A expenses to
be partially offset by expenses we will incur as a result of
becoming a reporting company following this offering.
Interest expenses. We expect that our
interest expenses will be reduced in periods following the
completion of this offering reflecting the reduced level of our
outstanding indebtedness.
Foreign exchange impact. We are a
global company with operations in Canada, China, Finland,
France, Germany, the United Kingdom and the United States.
Accordingly, currency exchange rates can impact our reported
results of operations.
Unamortized debt issuance costs. We
expect to record a non-cash charge associated with the repayment
of certain of our indebtedness with a portion of the net
proceeds of this offering. This charge will consist of the
write-off of unamortized debt issuance costs.
Income taxes. Despite historical net
losses, we have incurred income tax expense for each of the past
three fiscal years. In any given period, the jurisdictional mix
of our income can vary significantly as a result of the global
nature of our business and operations. The income tax rates,
available deductions and credits vary significantly in the
jurisdictions we do business. Accordingly, the income tax
expense in any given period is a function of the effective tax
rate and related income secured in a particular jurisdiction.
Although we have reported historic consolidated losses, we
recognized income in foreign jurisdictions and losses in the
United States for the past three years. We have incurred tax
expense in foreign jurisdictions due to the taxable income
position. We have provided a valuation allowance on our United
States based tax attributes and as a result, no tax benefit is
recognized for the United States operating losses.
We have net operating loss carryforwards (“NOLs”)
which we can use to reduce our United States tax expense in
future periods. These NOLs are subject to elimination or
reduction in the event of a change of control. We do not expect
such a change of control to occur in connection with this
offering. However, a future sale of our common stock by ACAS
could result in such a change of control.
Amortization costs related to intangible
assets. Our non-cash amortization costs
related to intangible assets were $12.2 million,
$10.1 million, $8.1 million, $4.2 million and
$3.7 million for fiscal 2007, 2008 and
55
2009 and the six months ended December 31, 2008 and 2009.
Our future amortization expense at the foreign exchange rates
determined as of June 30, 2009 is as follows (in thousands):
| |
|
|
|
|
|
|
|
Annual
|
|
|
|
|
Amortization
|
|
|
Year Ending June 30,
|
|
Expense
|
|
|
|
|
2010
|
|
$
|
6,484
|
|
|
2011
|
|
|
4,760
|
|
|
2012
|
|
|
3,709
|
|
|
2013
|
|
|
2,749
|
|
|
2014
|
|
|
1,622
|
|
|
2015 and thereafter
|
|
|
4,364
|
|
|
|
|
|
|
|
|
Total
|
|
$
|
23,688
|
|
|
|
|
|
|
|
Consolidated
Results of Operations
The following table summarizes certain items of our consolidated
results of operations for fiscal 2007, 2008 and 2009 and the six
months ended December 31, 2008 and 2009 (in thousands,
except percentages):
| |
|
|
|
|
|
|
|
|
|
|
|
|
|
|
|
|
|
|
|
|
|
|
|
|
|
|
Six Months Ended
|
|
|
|
|
Year Ended June 30,
|
|
|
December 31,
|
|
|
|
|
2007
|
|
|
2008
|
|
|
2009
|
|
|
2008
|
|
|
2009
|
|
|
|
|
Revenue
|
|
$
|
169,033
|
|
|
$
|
191,769
|
|
|
$
|
201,763
|
|
|
$
|
100,519
|
|
|
$
|
108,658
|
|
|
Cost of revenue
|
|
|
94,321
|
|
|
|
102,790
|
|
|
|
105,954
|
|
|
|
53,793
|
|
|
|
60,140
|
|
|
|
|
|
|
|
|
|
|
|
|
|
|
|
|
|
|
|
|
|
|
|
|
Gross profit
|
|
|
74,712
|
|
|
|
88,979
|
|
|
|
95,809
|
|
|
|
46,726
|
|
|
|
48,518
|
|
|
% of revenue
|
|
|
44.2
|
%
|
|
|
46.4
|
%
|
|
|
47.5
|
%
|
|
|
46.5
|
%
|
|
|
44.7
|
%
|
|
Operating expenses:
|
|
|
|
|
|
|
|
|
|
|
|
|
|
|
|
|
|
|
|
|
|
Selling, general and administrative expenses
|
|
|
59,449
|
|
|
|
63,177
|
|
|
|
65,649
|
|
|
|
31,310
|
|
|
|
33,754
|
|
|
Research and development expenses
|
|
|
11,875
|
|
|
|
14,865
|
|
|
|
11,282
|
|
|
|
6,277
|
|
|
|
5,202
|
|
|
|
|
|
|
|
|
|
|
|
|
|
|
|
|
|
|
|
|
|
|
|
|
Total operating expenses
|
|
|
71,324
|
|
|
|
78,042
|
|
|
|
76,931
|
|
|
|
37,587
|
|
|
|
38,956
|
|
|
|
|
|
|
|
|
|
|
|
|
|
|
|
|
|
|
|
|
|
|
|
|
Income from operations
|
|
|
3,388
|
|
|
|
10,937
|
|
|
|
18,878
|
|
|
|
9,139
|
|
|
|
9,562
|
|
|
Interest expense, net
|
|
|
19,153
|
|
|
|
20,207
|
|
|
|
17,711
|
|
|
|
9,736
|
|
|
|
7,570
|
|
|
Other income, net
|
|
|
(1,001
|
)
|
|
|
(1,759
|
)
|
|
|
(490
|
)
|
|
|
71
|
|
|
|
(530
|
)
|
|
|
|
|
|
|
|
|
|
|
|
|
|
|
|
|
|
|
|
|
|
|
|
(Loss) income before provision for income taxes
|
|
|
(14,764
|
)
|
|
|
(7,511
|
)
|
|
|
1,657
|
|
|
|
(668
|
)
|
|
|
2,522
|
|
|
Provision for income taxes
|
|
|
4,937
|
|
|
|
5,838
|
|
|
|
5,612
|
|
|
|
2,890
|
|
|
|
3,293
|
|
|
|
|
|
|
|
|
|
|
|
|
|
|
|
|
|
|
|
|
|
|
|
|
Net loss
|
|
$
|
(19,701
|
)
|
|
$
|
(13,349
|
)
|
|
$
|
(3,955
|
)
|
|
$
|
(3,558
|
)
|
|
$
|
(771
|
)
|
|
|
|
|
|
|
|
|
|
|
|
|
|
|
|
|
|
|
|
|
|
|
Period-to-Period
Analysis
As the results of operations of our business are best understood
when examined on a
segment-by-segment
basis, we have more fully described
period-to-period
changes in the section of this Management’s Discussion and
Analysis of Financial Condition and Results of Operation
entitled “Segment Results of Operations” rather than
in the section immediately below.
Six
Months Ended December 31, 2009 as Compared to the Six
Months Ended December 31, 2008
Revenue
Consolidated revenue for the six months ended December 31,
2009 was $108.7 million, an increase of $8.1 million,
or 8.1%, from revenue of $100.5 million for the six months
ended December 31, 2008. Revenue in our Health Physics
segment increased $3.6 million, or 10.7%, with an
$11.4 million increase in revenue from contamination and
clearance monitors offset by a $6.8 million decrease in
dosimetry revenue due to completion of some large projects in
the six months ended December 31, 2008 with no similar
projects in the
56
comparable period of 2009, and a $1.3 million decrease in
detection and identification products. Revenue recognized for
sales by our Radiation Monitoring Systems segment increased
$7.0 million, or 33.5%, principally due to recognition of
revenue from a radiation monitoring systems installation project
in Asia. Revenue from sales by our Imaging Systems segment
decreased $1.5 million, or 16.6%, principally due to weak
demand for high-temperature cameras in industrial end markets.
Revenue for the six months ended December 31, 2009 was
positively impacted due to foreign currency movements by
approximately $3.3 million. $30.6 million, or 28.2%,
of revenue for the six months ended December 31, 2009 was
attributed to sales in connection with new nuclear plant
construction, an increase of $12.8 million, or 71.5%, from
revenue of $17.8 million in connection with new nuclear
plant construction for the six months ended December 31,
2008. The remaining revenue of $78.1 million for the six
months ended December 31, 2009 and remaining revenue of
$82.7 million for the six months ended December 31,
2008 was attributed to sales other than in connection with new
nuclear plant construction, including sales of replacement or
recurring products and services.
Gross
Profit
Consolidated gross profit for the six months ended
December 31, 2009 was $48.5 million, an increase of
$1.8 million, or 3.8% compared to the six months ended
December 31, 2008. Gross margin decreased 1.8% to 44.7% for
the six months ended December 31, 2009 primarily from lower
margins in both the Health Physics segment and the Radiation
Monitoring Systems segment due to product mix in each of these
segments. Gross profit was positively impacted due to foreign
currency movements by approximately $1.9 million.
Operating
Expenses
SG&A expenses for the six months ended December 31,
2009 were $33.8 million, an increase of $2.4 million,
or 7.8%, from $31.3 million for the comparable period of
2008. This increase was primarily due to an increase in
professional fees, principally associated with preparation for
our initial public offering.
Research and development expenses for the six months ended
December 31, 2009 were $5.2 million, a decrease of
$1.1 million, or 17.1%, from $6.3 million for the six
months ended December 31, 2008, primarily due to higher
professional fees associated with new product development in the
prior period.
Interest
Expense, Net
Interest expense, net for the six months ended December 31,
2009 was $7.6 million, a decrease of $2.2 million, or
22.3%, from $9.7 million for the comparable period of 2008.
This reduction was primarily the result of the decline in our
interest expense on our variable rate instruments as our
interest rates tied to LIBOR and EURIBOR declined from the
comparable period of 2008.
Other
Income, Net
Other income, net increased from a loss of $0.1 million in
the first half of fiscal 2009 to a gain of $0.5 million for
the first half of fiscal 2010. This increase was largely due to
foreign exchange gains in fiscal 2010.
Income
Taxes
The provision for income taxes for the six months ended
December 31, 2009 was approximately $3.3 million, with
an estimated effective tax rate of 130.6%, compared with a
provision for income taxes of approximately $2.9 million,
with an estimated effective tax rate of negative 433% for the
comparable period of fiscal 2009. The provision for income taxes
for the six months ended December 31, 2008 and 2009 are
comprised mainly of foreign income taxes. The fiscal 2010
effective tax rate was also impacted by losses generated in the
United States where we do not record any benefit for tax
attributes due to the valuation allowance.
57
Fiscal
2009 as Compared to Fiscal 2008
Revenue
Consolidated revenue for fiscal 2009 was $201.8 million, an
increase of $10.0 million, or 5.2%, from revenue of
$191.8 million for fiscal 2008.
$19.3 million of revenue in fiscal 2009 was attributed to
sales in connection with new nuclear plant construction, an
increase of $2.1 million, or 12.2%, from revenue of
$17.2 million in connection with new nuclear plant
construction for fiscal 2008. The remaining revenue of
$182.5 million for fiscal 2009 was attributed to sales
other than in connection with new nuclear plant construction,
including sales of replacement or recurring products and
services for existing plants and customers facilities. The
remaining revenue of $174.6 million for fiscal 2008 was
attributed to sales other than in connection with new nuclear
plant construction, which includes sales of replacement or
recurring products and services.
Revenue in our Health Physics segment increased 17.8%, or
$10.4 million, principally due to higher sales volumes in
the following product lines:
|
|
|
| |
•
|
$1.9 million increase in sales of dosimeters, principally
into existing NPPs in Asia and the Americas; and
|
|
|
|
| |
•
|
$5.4 million increase in sales of contamination &
clearance monitors, principally into existing NPPs in the
Americas.
|
|
|
|
| |
•
|
$3.1 million increase in sales of detection and
identification devices principally to the defense end market in
Europe.
|
Revenue in our Radiation Monitoring Systems segment decreased
$2.1 million, or 4.8%, principally due to the negative
impact of foreign currency movements of approximately
$3.5 million in fiscal 2009.
Revenue in our Sensing Systems segment increased
$5.1 million, or 12.8%, principally due to higher sales
volumes in the following product lines:
|
|
|
| |
•
|
$3.4 million increase in revenue recognized from contracts
for the production of penetration products used in the
construction of NPPs; and
|
| |
| |
•
|
$1.7 million increase in revenue recognized from contracts
for the production of detectors used in NPPs.
|
Revenue in our Dosimetry Services segment increased by
$0.6 million, or 2.2%, while revenues in our Imaging
Systems segment fell by $4.1 million, or 19.3%, due to
weakening demand for high-temperature cameras in industrial end
markets.
Revenue in fiscal 2009 was negatively impacted due to foreign
currency movements by approximately $10.3 million.
Gross
Profit
Consolidated gross profit for fiscal 2009 was
$95.8 million, an increase of $6.8 million, or 7.7%,
from gross profit of $89.0 million for fiscal 2008. Gross
margin increased 1.1% to 47.5% for fiscal 2009, primarily due to
lower material costs in the Sensing Systems segment. Gross
profit was negatively impacted due to foreign currency movements
by approximately $4.9 million.
Operating
Expenses
SG&A expenses for fiscal 2009 were $65.6 million, an
increase of $2.5 million, or 3.9%, from $63.2 million
for fiscal 2008. This increase was primarily due to an increase
in professional fees associated with preparation for our initial
public offering, offset by a reduction in compensation expense,
as well as an overall reduction of expense due to favorable
currency exchange as our expenses in U.S. dollars were
positively impacted by weaker foreign currencies, primarily the
euro and the British pound.
58
Research and development expenses for fiscal 2009 were
$11.3 million, a decrease of $3.6 million, or 24.1%,
from $14.9 million for fiscal 2008. This decrease was
primarily due to a decrease in compensation and subcontractor
expense due to product rationalization as well as a reduction of
expense due to favorable currency exchange as our expenses in
U.S. dollars were positively impacted by weaker foreign
currencies, principally the euro and the British pound, offset
by an increase in supplies and services.
Interest
Expense, Net
Interest expense, net for fiscal 2009 was $17.7 million, a
decrease of $2.5 million, or 12.4%, from $20.2 million
for fiscal 2008. This reduction was primarily the result of the
decline in our interest expense on our variable rate instruments
as our interest rates tied to LIBOR and EURIBOR declined from
fiscal 2008.
Other
Income, Net
Other income, net decreased $1.3 million, or 72.1%, to
other income, net of $0.5 million for fiscal 2009, from
other income, net of $1.8 million for fiscal 2008. This
decrease of other income, net was primarily a result of a
decrease in foreign exchange gains of $1.3 million.
Income
Taxes
We recognized income tax expense of $5.6 million for fiscal
2009, a decrease of $0.2 million, or 3.9%, from fiscal 2008. The
decrease was primarily due to the geographic composition of our
consolidated income, with less tax expense attributable to
foreign operations. In addition, the fiscal 2009 effective tax
rate was impacted by losses generated in the United States where
we do not record benefit for tax attributes due to the valuation
allowance.
Fiscal
2008 as Compared to Fiscal 2007
Revenue
Consolidated revenue for fiscal 2008 was $191.8 million, an
increase of $22.7 million, or 13.5%, from revenue of
$169.0 million in fiscal 2007. $17.2 million of
revenue in fiscal 2008 was attributed to sales in connection
with new nuclear plant construction, an increase of
$0.2 million, or 1.2%, from revenue of $17.0 million
in connection with new nuclear plant construction in fiscal
2007. The remaining revenue of $174.6 million for fiscal
2008 was attributed to sales other than in connection with new
nuclear plant construction, which includes sales of replacement
or recurring products and services for existing plants and
customer facilities. The remaining revenue of
$152.0 million for fiscal 2007 was attributed to sales
other than in connection with new nuclear plant construction,
which includes sales of replacement or recurring products and
services. Revenue from detectors sold by our Sensing Systems
segment into NPPs increased $5.2 million, or 33.2%, while
revenue recognized for electrical penetrations sold by our
Sensing Systems segment grew $5.6 million, or 41.9%.
Revenue of radiation monitoring equipment sold by our Radiation
Monitoring segment increased by $9.7 million or 28.9%
primarily related to the completion of a large NPP project,
shipped in previous years but with customer acceptance occurring
in fiscal 2008.
Revenue in fiscal 2008 was positively impacted due to foreign
currency movements by approximately $11.3 million.
Gross
Profit
Consolidated gross profit for fiscal 2008 was
$89.0 million, an increase of $14.3 million, or 19.1%,
from $74.7 million for fiscal 2007. Gross margin increased
2.2% to 46.4% for fiscal 2008, from 44.2% for fiscal 2007, due
to better factory utilization in our Health Physics and Sensing
Systems segments. The increase in gross profit was primarily due
to the increase in revenue in our Health Physics and Sensing
Systems segments. Gross profit in fiscal 2008 was positively
impacted due to foreign currency movements by approximately
$5.4 million.
59
Operating
Expenses
SG&A expenses for fiscal 2008 were $63.2 million, an
increase of $3.7 million, or 6.3%, from $59.4 million
for fiscal 2007. This increase was primarily due to an increase
in compensation and benefit cost due to the hiring of the
majority of our corporate staff and severance costs due to
employee terminations, offset by a reduction in amortization
cost and professional fees. SG&A expenses in fiscal 2008
were negatively impacted due to foreign currency movements by
approximately $3.3 million.
Research and development expenses for fiscal 2008 were
$14.9 million, an increase of $3.0 million, or 25.2%,
from $11.9 million for fiscal 2007. This increase was
primarily due to an increase in compensation and supplies
expense for new projects and products, offset by a decrease in
professional fees.
Interest
Expense, Net
Interest expense, net for fiscal 2008 was $20.2 million, an
increase of $1.1 million, or 5.5%, from fiscal 2007 expense
of $19.2 million. The $1.1 million increase was
primarily due to increased borrowings to fund our growth.
Other
Income, Net
Other income, net increased $0.8 million, or 75.7%, to
other income, net of $1.8 million for fiscal 2008, from
other income, net of $1.0 million for fiscal 2007. This
increase in other income, net was primarily the result of an
increase in foreign exchange gains of $0.8 million.
Income
Taxes
We recognized income tax expense of $5.8 million for fiscal
2008, versus $4.9 million for fiscal 2007. The
$0.9 million increase was primarily due to the geographic
composition of our consolidated income, with greater tax expense
attributable to foreign operations. In addition, the fiscal 2008
effective tax rate was impacted by losses generated in the
United States where we do not record benefit for tax attributes
due to the valuation allowance.
Segment
Results of Operations
The following table summarizes certain items for our segments
for fiscal 2007, 2008 and 2009 and the six months ended
December 31, 2008 and 2009. The amounts below are in
thousands.
| |
|
|
|
|
|
|
|
|
|
|
|
|
|
|
|
|
|
|
|
|
|
|
|
|
|
|
Six Months Ended
|
|
|
|
|
Year Ended June 30,
|
|
|
December 31,
|
|
|
|
|
2007
|
|
|
2008
|
|
|
2009
|
|
|
2008
|
|
|
2009
|
|
|
|
|
Revenue:
|
|
|
|
|
|
|
|
|
|
|
|
|
|
|
|
|
|
|
|
|
|
Health Physics
|
|
$
|
58,020
|
|
|
$
|
58,691
|
|
|
$
|
69,109
|
|
|
$
|
33,140
|
|
|
$
|
36,695
|
|
|
Radiation Monitoring Systems
|
|
|
33,521
|
|
|
|
43,201
|
|
|
|
41,116
|
|
|
|
20,803
|
|
|
|
27,765
|
|
|
Sensing Systems
|
|
|
29,049
|
|
|
|
39,866
|
|
|
|
44,979
|
|
|
|
22,858
|
|
|
|
22,339
|
|
|
Dosimetry Services
|
|
|
27,785
|
|
|
|
28,824
|
|
|
|
29,457
|
|
|
|
14,830
|
|
|
|
14,445
|
|
|
Imaging Systems
|
|
|
20,658
|
|
|
|
21,187
|
|
|
|
17,102
|
|
|
|
8,888
|
|
|
|
7,414
|
|
|
|
|
|
|
|
|
|
|
|
|
|
|
|
|
|
|
|
|
|
|
|
|
Total
|
|
$
|
169,033
|
|
|
$
|
191,769
|
|
|
$
|
201,763
|
|
|
$
|
100,519
|
|
|
$
|
108,658
|
|
|
|
|
|
|
|
|
|
|
|
|
|
|
|
|
|
|
|
|
|
|
|
|
Operating income:
|
|
|
|
|
|
|
|
|
|
|
|
|
|
|
|
|
|
|
|
|
|
Health Physics
|
|
$
|
(993
|
)
|
|
$
|
(912
|
)
|
|
$
|
6,317
|
|
|
$
|
776
|
|
|
$
|
1,875
|
|
|
Radiation Monitoring Systems
|
|
|
1,775
|
|
|
|
1,085
|
|
|
|
4,109
|
|
|
|
1,793
|
|
|
|
3,349
|
|
|
Sensing Systems
|
|
|
3,881
|
|
|
|
10,234
|
|
|
|
14,973
|
|
|
|
8,395
|
|
|
|
8,801
|
|
|
Dosimetry Services
|
|
|
5,879
|
|
|
|
7,746
|
|
|
|
7,968
|
|
|
|
4,019
|
|
|
|
3,561
|
|
|
Imaging Systems
|
|
|
200
|
|
|
|
1,339
|
|
|
|
1,064
|
|
|
|
428
|
|
|
|
334
|
|
|
Unallocated corporate items
|
|
|
(7,354
|
)
|
|
|
(8,555
|
)
|
|
|
(15,553
|
)
|
|
|
(6,272
|
)
|
|
|
(8,358
|
)
|
|
|
|
|
|
|
|
|
|
|
|
|
|
|
|
|
|
|
|
|
|
|
|
Total
|
|
$
|
3,388
|
|
|
$
|
10,937
|
|
|
$
|
18,878
|
|
|
$
|
9,139
|
|
|
$
|
9,562
|
|
|
|
|
|
|
|
|
|
|
|
|
|
|
|
|
|
|
|
|
|
|
|
60
Health
Physics
Six
Months Ended December 31, 2009 as Compared to the Six
Months Ended December 31, 2008
Revenue in our Health Physics segment increased
$3.6 million, or 10.7%, to $36.7 million for the six
months ended December 31, 2009, from $33.1 million for
the comparable period of 2008. This increase was primarily due
to increased revenue from contamination and clearance monitors
which saw strong growth in demand as customers spent against
their 2009 budgets more so than experienced in the end of 2008.
Revenues for the six months ended December 31, 2009 was
favorably impacted by foreign currency movements by
approximately $1.5 million.
Operating income in our Health Physics segment increased
$1.1 million, or 141.6%, to $1.9 million for the six
months ended December 31, 2009, from $0.8 million for
the comparable period of 2008. This increase was due to
increased gross profit and favorable exchange rates. Costs from
selling, general and administrative expenses, as well as
research and development expenses, remained relatively constant.
Fiscal
2009 as Compared to Fiscal 2008
Revenue in our Health Physics segment increased
$10.4 million, or 17.8%, to $69.1 million for fiscal
2009, from $58.7 million for fiscal 2008. This increase was
primarily due to increased dosimeter sales of $1.0 million,
principally into existing NPPs in Asia and the Americas,
$5.5 million of increased sales of
contamination & clearance monitors principally into
existing NPPs in the Americas and $3.0 million of increased
sales of detection and identification products into the defense
end market, primarily in Europe. Revenue for fiscal 2009 was
negatively impacted by foreign currency movements by
approximately $4.0 million.
Operating income in our Health Physics segment increased
$7.2 million, or 792.6%, to $6.3 million for fiscal
2009, from $(0.9) million for fiscal 2008. This increase
was due to increased gross profit due to higher revenues and
lower research and development expenses arising from our product
rationalization efforts. During fiscal 2009, we continued to
review our product portfolio and discontinued engineering work
on products that were deemed to be duplicative or nearing the
end of useful life. As a result we were able to eliminate a
portion of our temporary and consulting engineers and
correspondingly reduce engineering expense. Expenses were
positively impacted by foreign currency movements, which
partially offset the negative impact of currency movements on
revenue.
Fiscal
2008 as Compared to Fiscal 2007
Revenue in our Health Physics segment increased
$0.7 million, or 1.2%, to $58.7 million for fiscal
2008, from $58.0 million for fiscal 2007. Revenue in fiscal
2008 was positively impacted due to foreign currency movements
in the euro-dollar exchange rate by approximately
$5.0 million.
Operating income for our Health Physics segment increased
$0.1 million, or 8.2%, to $(0.9) million for fiscal
2008, from $(1.0) million for fiscal 2007. This increase
was due to increased gross profit margin due to improved factory
utilization and lower material costs, partly offset by an
increase in operating expenses related to professional fees for
cost improvement initiatives and severance costs due to employee
terminations. We engaged an outside consulting firm to review
our current cost structure and assist us with the implementation
of certain cost improvement initiates. Expenses were negatively
impacted by $2.7 million due to foreign exchange currency
movements in the euro-dollar exchange rate.
Radiation
Monitoring Systems
Six
Months Ended December 31, 2009 as Compared to the Six
Months Ended December 31, 2008
Revenue in our Radiation Monitoring Systems segment increased
$7.0 million, or 33.5%, to $27.8 million for the six
months ended December 31, 2009, from $20.8 million for
the comparable period of 2008. This increase was principally due
to the timing of revenue recognition on a single nuclear power
plant project in Asia in the second quarter of fiscal 2010. This
revenue was recognized upon product delivery to the customer
61
and prior to receipt of notification of formal customer
acceptance because we were able to demonstrate that it had met
all of the customer-specified objective acceptance criteria at
delivery.
Operating income in our Radiation Monitoring Systems segment
increased $1.5 million, or 86.8%, to $3.3 million for
the six months ended December 31, 2009, from
$1.8 million for the comparable period of 2008. The
disproportionate increase in operating income as compared to
revenues is due to a substantial portion of our costs being
fixed. Revenues were positively impacted by $1.6 million
due to foreign currency movements, which were partly offset by
the negative impact of currency movements on expenses.
Fiscal
2009 as Compared to Fiscal 2008
Revenue in our Radiation Monitoring Systems segment decreased
$2.1 million, or 4.8%, to $41.1 million for fiscal
2009, from $43.2 million for fiscal 2008. This decrease was
largely due to the negative impact of foreign currency movements
of approximately $3.5 million in fiscal 2009, and was
partially offset by increased revenue from a higher number of
customer installations in fiscal 2009.
Operating income in our Radiation Monitoring Systems segment
increased $3.0 million, or 278.7%, to $4.1 million for
fiscal 2009, from $1.1 million for fiscal 2008. This
increase was principally due to an increase in gross margin,
particularly on several European nuclear projects, while a
substantial portion of our fixed operating costs remained
constant. Expenses were positively impacted by foreign currency
movements, which partially offset the negative impact on revenue
related to currency movements.
Fiscal
2008 as Compared to Fiscal 2007
Revenue in our Radiation Monitoring Systems segment increased
$9.7 million, or 28.9%, to $43.2 million for fiscal
2008, from $33.5 million for fiscal 2007. This increase was
due to some large NPP Projects shipped in fiscal 2006 and fiscal
2007 but with customer acceptance in fiscal 2008. Revenue in
fiscal 2008 was positively impacted due to foreign currency
movements in the euro-dollar exchange rate by approximately
$4.8 million.
Operating income for our Radiation Monitoring Systems segment
decreased $0.7 million, or 38.9%, to $1.1 million for
fiscal 2008, from $1.8 million for fiscal 2007. This
decrease was due to a decrease in gross margin due to an
increase in material costs. Operating expenses also increased
due to professional fees for cost improvement initiatives and
severance costs due to employee terminations. We engaged an
outside consulting firm to review our current cost structure and
assist us with the implementation of certain cost improvement
initiates. Operating expenses were negatively impacted by
foreign exchange currency movements in the euro-dollar exchange
rate by $1.8 million.
Sensing
Systems
Six
Months Ended December 31, 2009 as Compared to the Six
Months Ended December 31, 2008
Revenue in our Sensing Systems segment decreased
$0.6 million, or 2.3%, to $22.3 million for the six
months ended December 31, 2009, from $22.9 million for
the comparable period of 2008, due to the timing of completion
of some long term contracts.
Operating income in our Sensing Systems segment increased
$0.4 million, or 4.8%, to $8.8 million for the six
months ended December 31, 2009, from $8.4 million for
the comparable period of 2008. This increase was primarily due
to decreased cost of goods sold despite no significant change in
revenue due to the mix of products sold in favor of higher gross
margin products, while operating expenses remained relatively
constant.
Fiscal
2009 as Compared to Fiscal 2008
Revenue in our Sensing Systems segment increased
$5.1 million, or 12.8%, to $45.0 million for fiscal
2009, from $39.9 million for fiscal 2008. This increase was
due to an increase in revenue recognized for new electrical
penetrations of $3.4 million and an increase in revenue
recognized for our ex-core detectors of
62
$2.3 million, partially offset by a reduction in nuclear
reactor core detector revenue of $0.6 million. Revenue in
fiscal 2009 was negatively impacted due to foreign currency
movements by approximately $0.8 million.
Operating income in our Sensing Systems segment increased
$4.7 million, or 46.3%, to $15.0 million for fiscal
2009, from $10.2 million for fiscal 2008. This increase was
primarily due to increased revenue as well as a decrease in
material costs due to declining prices over fiscal 2009 for
precious metals and other raw materials. Operating expenses
decreased by $0.4 million, or 7.2% primarily due to lower
amortization expenses.
Fiscal
2008 as Compared to Fiscal 2007
Revenue in our Sensing Systems segment increased
$10.8 million, or 37.2%, to $39.9 million for fiscal
2008, from $29.1 million for fiscal 2007. This increase was
due to an increase in other replaceable detector revenue of
$6.3 million and an increase in revenue recognized for new
electrical penetrations of $5.6 million, offset by a
reduction in nuclear core reactor detector revenue of
$1.1 million. Revenue in fiscal 2008 was favorably impacted
due to foreign currency movements by approximately
$1.2 million.
Operating income for our Sensing Systems segment increased
$6.4 million, or 163.7%, to $10.2 million for fiscal
2008, from $3.9 million for fiscal 2007. This increase was
primarily due to increased revenue and a $1.2 million
reduction in amortization expense in fiscal 2008, as customer
relationship intangible assets are amortized using an
accelerated method to reflect estimated customer attrition
patterns and rates. Other operating expenses remained constant
between years.
Dosimetry
Services
Six
Months Ended December 31, 2009 as Compared to the Six
Months Ended December 31, 2008
Revenue in our Dosimetry Services segment decreased
$0.4 million, or 2.6%, to $14.4 million for the six
months ended December 31, 2009, from $14.8 million for
the comparable period of 2008 due to slightly lower revenue from
the United Kingdom market and some competitive pricing pressures
in the American market.
Operating income in our Dosimetry Services segment decreased
$0.4 million, or 11.4%, to $3.6 million for the six
months ended December 31, 2009, from $4.0 million for
the comparable period of 2008. The decrease was primarily due to
increased production costs related to a new passive dosimeter
product introduced to the market in late fiscal 2009 and an
increase in operating expenses, primarily due to recruitment
related expenses.
Fiscal
2009 as Compared to Fiscal 2008
Revenue in our Dosimetry Services segment increased
$0.6 million, or 2.2%, to $29.5 million for fiscal
2009, from $28.8 million for fiscal 2008. This increase was
primarily due to an increase in sales to the small medical
practitioner market.
Operating income in our Dosimetry Services segment increased
$0.2 million, or 2.9%, to $8.0 million for fiscal
2009, from $7.7 million for fiscal 2008. This increase was
principally due to increased revenue, partially offset by
increased research and development expenses related to new
product development.
Fiscal
2008 as Compared to Fiscal 2007
Revenue in our Dosimetry Services segment increased
$1.0 million, or 3.7%, to $28.8 million for fiscal
2008, from $27.8 million for fiscal 2007. This increase was
primarily due to increased business in the nuclear and medical
end markets of $0.6 million and growth in sales of
dosimeters to the small medical practitioner market of
$0.2 million.
Operating income for our Dosimetry Services segment increased
$1.9 million, or 31.8%, to $7.7 million for fiscal
2008, from $5.9 million for fiscal 2007. This increase was
primarily due to increased revenue as well as a decrease in
amortization costs.
63
Imaging
Systems
Six
Months Ended December 31, 2009 as Compared to the Six
Months Ended December 31, 2008
Revenue in our Imaging Systems segment decreased
$1.5 million, or 16.6%, to $7.4 million for the six
months ended December 31, 2009, from $8.9 million for
the comparable period of 2008. This decrease was primarily
attributable to a reduction in sales of our high temperature
cameras. We continue to experience some weakening of demand for
these products in the industrial end market due to the current
economic climate.
Operating income in our Imaging Systems segment decreased
$0.1 million, or 21.7%, to $0.3 million for the six
months ended December 31, 2009, from $0.4 million for
the comparable period of 2008. Lower gross profit due to reduced
sales was partially offset by reduced amortization and marketing
expenses during the six months ended December 31, 2009.
Fiscal
2009 as Compared to Fiscal 2008
Revenue in our Imaging Systems segment decreased
$4.1 million, or 19.3%, to $17.1 million for fiscal
2009, from $21.2 million for fiscal 2008. This decrease was
primarily attributable to a reduction in sales of our high
temperature cameras of $3.0 million. We began to experience
some weakening of demand for these products into the industrial
end market, as a result of the economic climate in fiscal 2009.
The products represented $7.3 million, or 42.6%, of segment
sales in fiscal 2009, compared to $10.3 million, or 48.5%,
of segment sales in fiscal 2008. Revenues for fiscal 2009 were
negatively impacted by foreign currency movements by
approximately $2.0 million, due to the weaker British pound.
Operating income in our Imaging Systems segment decreased
$0.3 million, or 20.5%, to $1.1 million for fiscal
2009, from $1.3 million for fiscal 2008. This decrease was
primarily attributable to the impact of a weaker British pound,
with a $0.7 million positive currency impact on operating
expenses partially offsetting the negative impact on revenues.
Aside from the currency impact, there was a reduction of
operating expenses in fiscal 2009 due to a decrease in
facilities costs, primarily due to the consolidation of office
facilities.
Fiscal
2008 as Compared to Fiscal 2007
Revenue in our Imaging Systems segment increased
$0.5 million, or 2.6%, to $21.2 million for fiscal
2008, from $20.7 million for fiscal 2007. This increase was
due to an increase in sales of high temperature cameras of
$1.2 million, partially offset by a decrease in sales of
cameras for the nuclear end market of $0.7 million.
Operating income for our Imaging Systems segment increased
$1.1 million, or 569.5%, to $1.3 million for fiscal
2008, from $0.2 million for fiscal 2007. This increase was
due to a decrease in operating expenses, primarily reduced
compensation expenses, partially offset by higher costs for our
camera products for the nuclear end market.
Liquidity
and Capital Resources
We have financed our operations primarily through cash provided
by operations and our lines of credit. As of December 31,
2009, our principal sources of liquidity consisted of
$6.9 million of cash and cash equivalents and
$1.1 million available under our revolving credit
facilities. A substantial majority of our outstanding debt has
been provided by ACAS, our principal stockholder, through senior
and junior debt facilities as well as lines of credit. ACAS has
also provided us with substantially all of our equity financing.
The terms of our credit agreements with ACAS require us and our
subsidiaries to meet certain restrictive financial covenants and
ratios computed quarterly, including a minimum fixed charge
coverage ratio (Adjusted EBITDA minus capital expenditures, over
cash paid for interest, debt payments, tax payments and
management fees) of one-to-one, maximum debt to adjusted EBITDA
ratio (total debt over adjusted EBITDA) of 5.50-to-one, minimum
interest coverage ratio (adjusted EBITDA over cash interest
expense) of 1.50-to-one and a maximum capital expenditure level
of $7.5 million per fiscal year, with provisions for a
one-year carry-forward.
64
Our credit agreements with ACAS are material to our consolidated
business, and the financial covenants to our credit agreements
are material in that any non-compliance with such covenants
could result in an event of default under such credit
agreements. Upon an event of default, ACAS may require us to pay
penalty interest on debt under the credit agreements, accelerate
any unpaid principal and interest under the credit agreements
and charge a prepayment premium in the event of acceleration. In
particular, in the event of an acceleration of the indebtedness
held by ACAS, we may not be able to secure alternative financing
on acceptable terms or at all. In such an event, we could be
forced to sell assets to repay the indebtedness or take other
actions that could have a material adverse effect on our
business and operations. We are in compliance with all of our
financial covenants as of December 31, 2009.
Our anticipated new bank credit facilities that we expect to
enter into upon the consummation of this offering also include
financial covenants with which we will be required to comply.
These include (i) a minimum fixed charge coverage of
Adjusted EBITDA minus capital expenditures, over interest
expense and scheduled principal payments on indebtedness, of
1.50-to-one, (ii) a minimum net worth of 80% of our
consolidated stockholders’ equity as of the effective date
of the agreement plus 50% of net income earned in each fiscal
quarter thereafter and (iii) a maximum ratio of total
indebtedness over Adjusted EBITDA for four consecutive fiscal
quarters of 2.75-to-one, stepping down to 2.25-to-one. Our
anticipated new bank credit facilities will be material to our
business, and the financial covenants in our anticipated new
bank credit facilities will be material in that any
non-compliance with such covenants could result in an event of
default. Upon an event of default, the lenders may require us to
pay penalty interest on debt under the credit facilities and
accelerate any unpaid principal and interest under the credit
facilities. In particular, in the event of an acceleration of
the indebtedness under our anticipated new bank credit
facilities, we may not be able to secure alternative financing
on acceptable terms or at all. In such an event, we could be
forced to sell assets to repay the indebtedness or take other
actions that could have a material adverse effect on our
business and operations.
During the six months ended December 31, 2009, our cash and
cash equivalents increased $1.5 million to
$6.9 million. During this time, we had cash outflows from
operating activities of $4.8 million. We had cash outflows
from investing activities of $4.2 million, related to
purchase of property, plant and equipment and restrictions on
cash, and net cash inflows from financing activities of
$10.9 million. This was principally due to an increase in
borrowings under our ACAS revolving credit facilities of
$12.7 million, offset by reductions in borrowings from our
third-party revolving credit facilities of $1.6 million
during the period.
During fiscal 2009 our cash and cash equivalents decreased
$3.6 million to $5.4 million. During this time we had
cash inflows from operating activities of $10.0 million.
This was offset by cash outflows from investing activities of
$7.4 million, primarily for the purchase of property, plant
and equipment, and financing activities of $5.8 million
from payments under our revolving credit facilities.
During fiscal 2008, we incurred net cash outflows from investing
activities of $3.3 million, primarily for the purchase of
property, plant and equipment, and net cash outflows from
operating activities of $6.7 million. These outflows were
offset in part by net cash inflows from borrowings under our
revolving credit facilities with ACAS of $10.3 million, as
well as net borrowings under our third-party credit agreements
of $3.1 million.
Our principal need for liquidity has been, and will continue to
be, for working capital, to pay down debt and for capital
expenditures. We believe that our cash flow from operations,
available cash and cash equivalents and available borrowings
under the revolving portion of our credit facilities will be
sufficient to meet our liquidity requirements for at least the
next twelve months. However, our ability to make scheduled
payments of principal and to pay the interest on, or to
refinance, our debt and to fund planned capital expenditures
will depend on our future performance. Accordingly, we may be
required to raise debt or equity financing, and such financing
may not be available on acceptable terms.
Although we currently have no specific plans to do so, if we
decide to pursue one or more significant strategic acquisitions,
we may incur additional debt or sell additional equity to
finance the purchase of those businesses.
65
Historical
Cash Flows
Cash Flow
from Operating Activities
We used $4.8 million in cash flows from operating
activities during the six months ended December 31, 2009
and used $2.8 million from operating activities during the
six months ended December 31, 2008.
The $2.0 million decrease in net operating cash flows for
the six months ended December 31, 2009 compared to net
operating cash flows for the six months ended December 31,
2008 were primarily due to increased cash outflows from the
following components: (i) increased cash outflows from
changes in cost in excess of billings on uncompleted contracts,
reflecting changes in the timing of completion of project work,
which accounted for $1.1 million of net cash outflows for
the six months ended December 31, 2009 compared to net cash
inflows of $7.5 million for the six months ended
December 31, 2008 and (ii) increased net cash outflows
of $9.3 million for accrued expenses and other liabilities.
These decreases in net operating cash flows for the six months
ended December 31, 2009 compared to the comparable period
ended December 31, 2008 were partially offset by (i) a
$5.6 million reduction of operating cash outflow for
deferred cost of revenue, offset by a $0.7 million decrease
in cash inflow from changes in deferred revenues, which was the
result of timing differences on project completion activity
between the two periods, and (ii) a $6.0 million
increase in cash flows from accounts payable and a $4.2 million
increase in cash flows from accounts receivable balances,
including receivables pledged to creditors, with an increase of
$11.9 million during the six months ended December 31,
2009 compared to an increase of $16.1 million for the six
months ended December 31, 2008. The increase in the
accounts receivable and accounts payable balances reflects some
of the seasonal nature of our business, with a typical spike in
revenue, and associated cost of revenue, and an increase in
billing at the end of the calendar year. This is particularly
the case in our Dosimetry Services segment, where a significant
portion of our customers are on annual billing cycles.
We used $3.6 million and $6.7 million and generated
$10.0 million in cash flows from operating activities in
fiscal 2007, 2008 and 2009.
The $16.7 million increase in cash provided from operating
activities in fiscal 2009 compared to fiscal 2008 was primarily
due to (i) a $9.4 million decrease in net loss for the
period, due primarily to increased revenue and slightly improved
gross margins in fiscal 2009, (ii) cash inflow of
$2.7 million due to a decrease in costs in excess of
billings on uncompleted contracts in fiscal 2009 compared to a
cash outflow of $9.5 million due to an increase in costs in
excess of billings on uncompleted contracts during fiscal 2008,
primarily due to timing differences on project activity between
the two periods. This increase in operating cash inflows was
offset by an increase in operating cash outflow of
$7.8 million on accounts payable with higher purchases made
towards the end of fiscal 2009 when compared to fiscal 2008.
The $3.1 million increase in cash used in operating
activities in fiscal 2008 compared to fiscal 2007 was primarily
due to (i) a $13.4 million reduction in cash inflow
from accounts receivable, with a net cash outflow due to change
in accounts receivable balances of $3.7 million in fiscal
2008, compared to a net cash inflow due to change in accounts
receivable balance of $9.6 million in fiscal 2007,
(ii) increase in cash outflow due to changes in deferred
cost of revenue balances of $8.6 million, and costs in
excess of billings on completed contracts of $6.3 million,
with net cash outflow of $16.3 million due to changes in
these balances as a result of timing of project completion in
fiscal 2008, compared with a net cash outflow of
$3.0 million in fiscal 2007. These increases in cash
outflow were offset by (i) a $12.8 million reduction
of cash outflows due to changes in deferred contract revenue,
also due to the timing of completion and revenue recognition on
project activity, and (ii) a $4.6 million reduction of
cash outflows due to changes in accounts payable balances
between the periods.
Cash Flow
from Investing Activities
We used $3.1 million and $4.2 million in cash from
investing activities during the six months ended
December 31, 2008 and the six months ended
December 31, 2009. The increase of $1.1 million was
primarily
66
due to an increase of purchases of property, plant and
equipment for the six months ended December 31, 2009.
We used $5.0 million, $3.3 million and
$7.4 million in cash from investing activities during
fiscal 2007, 2008 and 2009.
The $4.1 million increased use of cash in fiscal 2009 as
compared to 2008 was due to higher purchases of property plant
and equipment in fiscal 2009 as well as a one-time return of
escrow funds that occurred in fiscal 2008. The $1.7 million
decreased use of cash in fiscal 2008 as compared to 2007 was
primarily due to the cash inflow of $2.8 million from
escrow funds during fiscal 2008, which was partly offset by
higher purchases of property, plant and equipment in that same
year.
Cash Flow
from Financing Activities
We generated $7.6 million and $10.9 million in cash
flow from financing activities during the six months ended
December 31, 2008 and 2009. The increase of
$3.3 million was primarily due to an increase of
$6.9 million in net borrowings on our ACAS revolving credit
facilities, from $5.6 million borrowed under these
facilities during the six months ended December 31, 2008 to
$12.5 million borrowed during the six months ended
December 31, 2009. In the six months ended
December 31, 2009, $1.5 million of this borrowing was
used to reduce other borrowings against third-party revolving
credit facilities and other third-party notes payable balances.
The balance of the ACAS borrowings was used to fund the
operational and investing net cash outflows in the period.
We generated $9.9 million and $13.4 million and used
$5.8 million in cash from financing activities during
fiscal 2007, 2008 and 2009.
The $19.2 million decrease in cash from financing
activities in fiscal 2009 as compared to 2008 was due to a
$14.2 million reduction in net borrowing on notes from ACAS
as well as a $4.9 million reduction in net borrowing from
third parties. The $3.5 million increase in cash from
financing activities in fiscal 2008 as compared to 2007 was due
to an increase in net borrowings on notes from ACAS of
$1.5 million and a $1.8 million increase in net
borrowing from third parties.
Capital
Expenditures
We had capital expenditures of $2.4 million and
$3.4 million in the six months ended December 31, 2008
and 2009 and $4.3 million, $5.0 million and
$6.6 million in fiscal 2007, 2008 and 2009. The majority of
our capital expenditures has been for the replacement of
existing equipment or the purchase of new equipment to support
our business. We are subject to a maximum annual capital
expenditure amount under the debt covenant terms of our credit
agreements with ACAS. We expect to invest $4.1 million in
capital expenditures for the remainder of fiscal 2010, although
we do not have any capital expenditure related commitments as of
December 31, 2009.
As of December 31, 2009, our contractual obligations and
other commitments were as follows (in thousands):
| |
|
|
|
|
|
|
|
|
|
|
|
|
|
|
|
|
|
|
|
|
|
|
|
|
|
|
2010
|
|
|
|
|
|
|
|
|
|
|
|
|
|
Total
|
|
|
(6 Months)
|
|
|
2011-2012
|
|
|
2013-2014
|
|
|
Thereafter
|
|
|
|
|
Debt obligations(1)
|
|
$
|
189,589
|
|
|
$
|
5,281
|
|
|
$
|
184,154
|
|
|
$
|
154
|
|
|
$
|
—
|
|
|
Operating lease obligations
|
|
|
15,828
|
|
|
|
4,142
|
|
|
|
6,679
|
|
|
|
4,061
|
|
|
|
946
|
|
|
|
|
|
|
|
|
|
|
|
|
|
|
|
|
|
|
|
|
|
|
|
|
Total
|
|
$
|
205,417
|
|
|
$
|
9,423
|
|
|
$
|
190,833
|
|
|
$
|
4,215
|
|
|
$
|
946
|
|
|
|
|
|
|
|
|
|
|
|
|
|
|
|
|
|
|
|
|
|
|
|
|
|
|
|
(1) |
|
Includes only obligations to pay principal (as described below)
and does not reflect the use of net proceeds from this offering.
A portion of our debt has a PIK interest feature. As a result,
the principal amount of such debt increases on a periodic basis.
Also does not include pensions, which are described in
Note 11 of our consolidated financial statements. |
67
Credit
Facilities and Long-term Debt
Our credit facilities and long-term debt with ACAS, our
principal stockholder, are as follows (in thousands):
| |
|
|
|
|
|
|
|
|
|
|
|
|
|
|
|
|
|
|
|
|
|
|
|
|
|
Amount
|
|
|
|
|
|
|
|
|
|
Interest Rate
|
|
|
Outstanding
|
|
|
|
|
Maturity
|
|
|
Contractual
|
|
as of
|
|
|
as of
|
|
|
Credit Facilities and Long-term Debt
|
|
Due
|
|
|
Interest Rate (%)
|
|
December 31, 2009
|
|
|
December 31, 2009
|
|
|
|
|
Revolving credit facilities:
|
|
|
|
|
|
|
|
|
|
|
|
|
|
|
|
$20.25 million
|
|
|
July 2011
|
|
|
LIBOR + 4.5%
|
|
|
4.73
|
%
|
|
$
|
20,250
|
|
|
$14.0 million
|
|
|
July 2011
|
|
|
LIBOR + 5%
|
|
|
5.23
|
%
|
|
|
13,997
|
|
|
$8.2 million
|
|
|
July 2011
|
|
|
EURIBOR + 2%
|
|
|
2.47
|
%
|
|
|
7,130
|
|
|
Senior term notes:
|
|
|
|
|
|
|
|
|
|
|
|
|
|
|
|
$24.9 million Senior Term B
|
|
|
July 2011
|
|
|
EURIBOR + 3%
|
|
|
3.47
|
%
|
|
|
24,944
|
|
|
$7.5 million Senior Term B
|
|
|
July 2011
|
|
|
LIBOR + 8%
|
|
|
8.23
|
%
|
|
|
5,026
|
|
|
$2.0 million Senior Term B
|
|
|
July 2011
|
|
|
LIBOR + 8%
|
|
|
8.23
|
%
|
|
|
1,924
|
|
|
$4.0 million Senior Term C
|
|
|
Oct 2011
|
|
|
LIBOR + 9%
|
|
|
9.23
|
%
|
|
|
4,000
|
|
|
$4.0 million Senior Term C
|
|
|
Nov 2011
|
|
|
LIBOR + 8.25%
|
|
|
8.48
|
%
|
|
|
4,000
|
|
|
$27.0 million Senior Term D
|
|
|
Oct 2011
|
|
|
LIBOR + 6.5%
|
|
|
6.73
|
%
|
|
|
25,920
|
|
|
$15.0 million Senior Term D
|
|
|
Oct 2011
|
|
|
LIBOR + 6.5%
|
|
|
6.73
|
%
|
|
|
14,362
|
|
|
Senior subordinated notes:
|
|
|
|
|
|
|
|
|
|
|
|
|
|
|
|
$7.5 million
paid-in-kind
|
|
|
July 2011
|
|
|
14%
|
|
|
14
|
%
|
|
|
8,402
|
|
|
$8.6 million
paid-in-kind
|
|
|
July 2011
|
|
|
15%
|
|
|
15
|
%
|
|
|
9,749
|
|
|
$12.2 million
paid-in-kind
|
|
|
July 2011
|
|
|
EURIBOR + 11%
|
|
|
11.47
|
%
|
|
|
15,992
|
|
|
Junior subordinated notes:
|
|
|
|
|
|
|
|
|
|
|
|
|
|
|
|
$4.3 million
paid-in-kind
|
|
|
July 2011
|
|
|
17%
|
|
|
17
|
%
|
|
|
5,191
|
|
|
$4.3 million
paid-in-kind
|
|
|
July 2011
|
|
|
17%
|
|
|
17
|
%
|
|
|
5,191
|
|
|
$1.25 million
paid-in-kind
|
|
|
May 2012
|
|
|
14%
|
|
|
14
|
%
|
|
|
1,400
|
|
|
$4.9 million
paid-in-kind
|
|
|
July 2011
|
|
|
EURIBOR + 12%
|
|
|
12.47
|
%
|
|
|
6,908
|
|
|
Stockholder loan:
|
|
|
|
|
|
Three-month
|
|
|
|
|
|
|
|
|
|
$8.0 million
|
|
|
June 2011
|
|
|
EURIBOR + 2%
|
|
|
2.76
|
%
|
|
|
9,404
|
|
|
|
|
|
|
|
|
|
|
|
|
|
|
|
|
|
|
Total notes payable to ACAS
|
|
|
|
|
|
|
|
|
|
|
|
|
183,790
|
|
|
Less current portion
|
|
|
|
|
|
|
|
|
|
|
|
|
(520
|
)
|
|
|
|
|
|
|
|
|
|
|
|
|
|
|
|
|
|
Notes payable to ACAS — long term
|
|
|
|
|
|
|
|
|
|
|
|
$
|
183,270
|
|
|
|
|
|
|
|
|
|
|
|
|
|
|
|
|
|
We were in compliance with all of our financial covenants as of
December 31, 2009. The credit facilities include customary
events of default and affirmative, restrictive and financial
covenants that, among other things, require us to maintain
certain financial ratios and limit our ability to incur
additional indebtedness, create liens, pay dividends, redeem
capital stock or make certain other restricted payments or
investments, sell assets including
68
capital stock, engage in transactions with affiliates and effect
a consolidation or merger. For more information on our financial
covenants, see “—Liquidity and Capital
Resources.” We are not in compliance with certain
non-financial covenants that were in effect prior to the
formation of Mirion. These non-financial covenants were
negotiated with the predecessor companies (GDS, IST and Synodys)
and were not amended at the time of the formation of Mirion. The
non-financial covenants relate to matters such as changing the
fiscal years or names of our subsidiaries, amending the charter
documents and bylaws of our subsidiaries and the provision of
audited financial statements to ACFS. We have obtained a waiver
for the violations of non-financial covenants through
July 1, 2010.
We have a term loan of €651,000 ($0.9 million) as of
December 31, 2009, which is due November 2012 and bears
interest at a rate of EURIBOR + 1%. We also have various line of
credit arrangements in Germany and France. The terms and use of
these credit arrangements are detailed in Note 8 of our
consolidated financial statements.
In connection with the consummation of this offering, we expect
to enter into new bank credit facilities. See “Description
of Certain Indebtedness.”
Recent
Accounting Pronouncements
Business
Combinations
In December 2007, the FASB issued authoritative guidance on
business combinations. This guidance changes the accounting for
acquisition transaction costs by requiring them to be expensed
in the period incurred and also changes the accounting for
contingent consideration, acquired contingencies and
restructuring costs related to an acquisition. FASB-issued
authoritative guidance on business combinations is effective for
fiscal years beginning on or after December 15, 2008, which
is effective for our fiscal year beginning July 1, 2009.
The adoption of this guidance is expected to change our
accounting treatment for business combinations on a prospective
basis.
Fair
Value Measurements
Effective July 1, 2008, we adopted the provisions of
FASB-issued authoritative guidance on fair value measurements,
which defines fair value, establishes a framework for measuring
fair value and expands disclosure of fair value measurements.
The fair value criteria are primarily applied prospectively upon
adoption of this guidance. FASB-issued authoritative guidance on
fair value measurements was effective for fiscal years beginning
November 15, 2007. In February 2008, the FASB issued
further guidance on fair value measurements, delaying the
effective date of this guidance for non financial assets and non
financial liabilities, except for items that are recognized or
disclosed at fair value on a recurring basis. We adopted the
delayed portions of this guidance beginning in the first quarter
of our fiscal year ending June 30, 2010. The adoption of
this guidance did not have a material impact on our consolidated
financial statements.
In October 2008, the FASB issued authoritative guidance on
determining the fair value of a financial asset when the market
for that asset is not active. This guidance clarified the
application of FASB-issued authoritative guidance on fair value
measurement. This guidance demonstrated how the fair value of a
financial asset is determined when the market for that financial
asset is inactive. This guidance was effective upon issuance,
including prior periods for which financial statements had not
been issued. The implementation of this guidance did not have a
material impact on our financial position, results of operations
or cash flows.
In April 2009, the FASB issued authoritative guidance on
determining fair value when the volume and level of activity for
the asset or liability have significantly decreased and
identifying transactions that are not orderly. This guidance
provides additional guidance for estimating fair value when the
market activity for an asset or liability has declined
significantly. This guidance is effective for interim and annual
periods ending after June 15, 2009 and we are applying this
guidance prospectively. The implementation of this guidance did
not have a material impact on our financial position, results of
operations or cash flows.
69
Fair
Value Option for Financial Assets and Liabilities
In February 2007, the FASB issued authoritative guidance on the
fair value option for financial assets and financial
liabilities. This guidance provides the option to measure, at
fair value, eligible financial instrument items using fair
value, which are not otherwise required to be measured at fair
value. The irrevocable decision to measure items at fair value
is made at specified election dates on an
instrument-by-instrument
basis. Changes in that instrument’s fair value must be
recognized in current earnings in subsequent reporting periods.
If elected, the first measurement to fair value is reported as a
cumulative-effect adjustment to the opening balance of retained
earnings in the year of adoption. We did not elect to measure
eligible assets at fair value. The guidance was effective for us
beginning in fiscal 2009.
Disclosures
about Derivative Instruments and Hedging
Activities
In March 2008, the FASB issued authoritative guidance on
disclosures about derivative instruments and hedging activities.
This guidance establishes enhanced disclosures about how and why
an entity uses derivative instruments, how derivative
instruments and related hedged items are accounted for under
FASB-issued authoritative guidance on accounting for derivative
instruments and hedging activities and its related
interpretations and how derivative instruments and related
hedged items affect an entity’s financial position,
financial performance and cash flows. It is effective for
financial statements issued for fiscal years and interim periods
beginning after November 15, 2008, with early adoption
encouraged. This guidance encourages, but does not require,
comparative disclosures for earlier periods at initial adoption.
We adopted this guidance at the beginning of the third quarter
of our fiscal 2009, as required.
Instruments
Granted in Stock-Based Payment Transactions
In June 2008, the FASB issued authoritative guidance on
determining whether instruments granted in stock-based payment
transactions are participating securities. This guidance states
that unvested stock-based payment awards that contain
nonforfeitable rights to dividends or dividend equivalents
(whether paid or unpaid) are participating securities and shall
be included in the computation of earnings per share pursuant to
the two-class method. This guidance is effective for financial
statements issued for fiscal years beginning after
December 15, 2008, and interim periods within those years.
Upon adoption, a company is required to retrospectively adjust
its earnings per share data (including any amounts related to
interim periods, summaries of earnings and selected financial
data) to conform with the provisions in this guidance. We
adopted this guidance beginning fiscal 2010, as required.
Adoption of this guidance did not have a material impact on our
consolidated financial position, results of operations or cash
flows.
Disclosures
about Postretirement Benefit Plan Assets
In December 2008, the FASB issued authoritative guidance on
employers’ disclosures about postretirement benefit plan
assets, which is effective for fiscal years ending after
December 15, 2009. This guidance requires additional
disclosures such as: the investment allocation decision making
process; the fair value of each major category of plan assets;
inputs and valuation techniques used to measure the fair value
of plan assets; and significant concentrations of risk within
plan assets. We adopted this guidance beginning in fiscal 2010,
as required. Adoption of this guidance did not have a material
impact on our consolidated financial position, results of
operations and cash flows.
Recognition
and Presentation of
Other-Than-Temporary
Impairments
In April 2009, the FASB issued authoritative guidance on
recognition and presentation of
other-than-temporary
impairments. This guidance establishes a new method for
recognizing and reporting
other-than-temporary
impairment of debt securities and also contain additional
disclosure requirements for both debt and equity securities.
This guidance is effective for interim and annual periods ended
after June 15,
70
2009. The implementation of this guidance did not have a
material impact on our financial position, results of operations
or cash flows.
Interim
Disclosures about Fair Value of Financial
Instruments
In April 2009, the FASB issued authoritative guidance on interim
disclosures about fair value of financial instruments. This
guidance amends previous guidance on disclosures about fair
value of financial instruments, to require an entity to provide
disclosures about the fair value of financial instruments in
interim financial information. This guidance also amends
previous guidance on interim financial reporting, to require
those disclosures in summarized financial information at interim
reporting periods. FASB-issued authoritative guidance on interim
disclosures about fair value of financial instruments is
effective for interim periods ending after June 15, 2009,
with early adoption permitted for periods ending after
March 15, 2009. We adopted this guidance beginning in our
first quarter of fiscal 2010.
Subsequent
Events
In May 2009, the FASB issued authoritative guidance on
subsequent events. This guidance is intended to establish
general standards of accounting for and disclosure of events
that occur after the balance sheet date but before financial
statements are issued or are available to be issued. It requires
the disclosure of the date through which an entity has evaluated
subsequent events and the basis for that date—that is,
whether that date represents the date the financial statements
were issued or were available to be issued. This guidance is
effective for interim and annual periods ended after
June 15, 2009 and should be applied prospectively. We have
adopted this guidance for fiscal 2009.
Codification
and the Hierarchy of Generally Accepted Accounting
Principles
In June 2009, the FASB issued authoritative guidance on the FASB
accounting standards codification and the hierarchy of generally
accepted accounting principles—establishes the FASB
Accounting Standards Codification as the source of authoritative
accounting principles and the framework for selecting the
principles used in the preparation of financial statements of
nongovernmental entities that are presented in conformity with
generally accepted accounting principles in the United States
(U.S. GAAP). This Statement is effective for our first
quarter of fiscal 2010. Beginning with the first fiscal quarter
of 2010, references made to U.S. GAAP by us will use the
new Codification numbering system prescribed by the FASB. As the
Codification is not intended to change or alter existing
U.S. GAAP, this guidance did not have any impact on our
consolidated financial statements.
In October 2009, the FASB issued guidance on
multiple-deliverable revenue arrangements. This new guidance
modifies the fair value requirements of the existing guidance by
allowing the use of the “best estimate of selling
price” in addition to vendor-specific objective evidence
and third-party evidence for determining the selling price of a
deliverable. This guidance establishes a selling price hierarchy
for determining the selling price of a deliverable, which is
based on: (a) vendor-specific objective evidence,
(b) third-party evidence, or (c) estimates. In
addition, the residual method of allocating arrangement
consideration is no longer permitted. The new guidance also
requires expanded quantitative and qualitative disclosures about
revenue from arrangements with multiple deliverables. This
guidance is effective for the Company beginning in its fiscal
year ending June 30, 2011. The Company is currently
evaluating the impact of this guidance on its consolidated
financial statements.
Qualitative
and Quantitative Disclosures about Market Risk
Foreign
Exchange Risks
We have foreign currency exposure related to our operations in
France, Germany and the United Kingdom, as well as in other
foreign locations. This foreign currency exposure arises
primarily from the translation or re-measurement of our foreign
subsidiaries’ financial statements into U.S. dollars.
For example,
71
a substantial portion of our annual revenue and operating costs
are denominated in euros, and we have exposure related to
revenue and operating costs increasing or decreasing based on
changes in currency exchange rates. If the U.S. dollar
increases in value against these foreign currencies, the value
in U.S. dollars of the assets and liabilities originally
recorded in these foreign currencies will decrease. Conversely,
if the U.S. dollar decreases in value against these foreign
currencies, the value in U.S. dollars of the assets and
liabilities originally recorded in these foreign currencies will
increase. Thus, increases and decreases in the value of the
U.S. dollar relative to these foreign currencies have a
direct impact on the value in U.S. dollars of our foreign
currency denominated assets and liabilities, even if the value
of these items has not changed in their original currency. At
present we do not purchase forward contracts as hedging
instruments, but may do so as circumstances warrant.
Interest
Rate Risks
We are subject to interest rate risk in connection with our
long-term debt and our revolving lines of credit. As of
December 31, 2009, we had total long-term debt of
$183.9 million. Our debt consists of both variable interest
rate as well as fixed interest rate debt. As of
December 31, 2009, we had $153.9 million of debt with
variable interest rates. We swapped approximately
$1.8 million of variable debt for a fixed rate of 3.865%
that expires in November 2012. A 1% increase in our variable
interest rates would increase our annual interest expense and
decrease our cash flows and income before taxes by approximately
$1.5 million per year.
Inflation
We do not believe that inflation has had a material effect on
our business, financial condition or results of operations. If
our costs were to become subject to significant inflationary
pressures, we may not be able to fully offset such higher costs
through price increases as many of our contracts are fixed-price
contracts which do not provide for price escalations. Our
inability or failure to do so could adversely affect our
business, financial condition and results of operations.
72
INDUSTRY
We sell our radiation detection, measurement, analysis and
monitoring products and services into the global nuclear,
defense and medical end markets. We believe that our end markets
are characterized by strong fundamentals that support an
established revenue base, as well as provide numerous growth
opportunities.
Nuclear
The nuclear end market spans the entire nuclear fuel cycle,
including mining, enrichment, fuel manufacturing, nuclear power
generation, waste management and fuel reprocessing. Key nuclear
installations include mines, fuel fabrication facilities,
commercial nuclear power reactors, reprocessing facilities,
research facilities, military facilities and ships, weapons
facilities and waste storage facilities. We sell products and
services for use in each of these types of installations, with
commercial nuclear power reactors representing the majority of
our sales into the nuclear end market.
Increasing
Global Demand For Electricity and Nuclear Power
Increasing electricity demand. The
International Energy Agency, or IEA, projects a near doubling of
world electricity demand from 2006 to 2030, creating the need
for approximately 4,500 GWe of new generating capacity. The IEA
projects this increase in electricity demand is expected to be
driven by a wide range of global trends including
(i) population growth, (ii) increasing standards of
living in the developing world, including in China and India and
(iii) continued proliferation and commercialization of
technologies dependent on the delivery of a reliable electricity
supply, such as consumer electronics and information technology.
Increasing demand for nuclear power. We
believe that nuclear energy is the best-positioned alternative
to fossil fuels (e.g., coal, natural gas and oil) with the
capability to meet electricity demand for base-load, or
continuously delivered, electricity production. In addition,
increased public concern regarding the effects of greenhouse gas
emissions has accelerated interest in reliable, low-emissions
alternatives to fossil fuels, such as nuclear power. The use of
other renewable energy sources, such as wind and solar power,
for base-load generation suffers from issues of intermittency
while also requiring major investments to create a transmission
grid capable of moving the power from the remote geographic
areas where it is generated to consumers, and to adequately
manage variable load-shifting requirements. We believe the
existing global installed base of nuclear power reactors to be
the most cost-effective and reliable source of base-load energy
currently available, with relatively low marginal cost of energy
production, as compared to fossil fueled generation with higher
input cost volatility.
Increased public support for nuclear power also has been
augmented by an increasing global desire to reduce dependency on
foreign sources of fossil fuels as well as the recognition that
nuclear power has maintained a very safe operating track record.
Significant regulatory oversight, as well as rigorously enforced
safety, quality and inspection protocols, have helped the
nuclear industry achieve a favorable safety record with respect
to attributable fatalities per GWe of electricity produced
compared to other forms of primary energy production, including
coal, natural gas and hydroelectric production. Many governments
around the world are adopting policies favorable to nuclear
power.
Nuclear
Power Global Installed Base
According to the WNA, as of February 2010, there were 436
nuclear power reactors in operation globally. Additionally,
there are 53 reactors currently under construction with an
additional 142 reactors planned and 327 proposed worldwide. The
average expected life cycle of an NPP (which contains one or
more reactors), including planning, construction, operation and
decommissioning, is between 55 and 80 years, of which the
expected operating life is 40 to 60 years.
As of February 2010, nuclear power was responsible for
approximately 15% of electricity generation globally and
substantially more in certain nuclear-intensive countries. As
shown in the table below, as of February 2010,
73
nuclear power provided 76% of the electricity output in France,
over 40% in Belgium, Ukraine and Sweden, over 30% in
Switzerland, South Korea and the Czech Republic and over
20% in Germany and Japan.
| |
|
|
|
|
|
Percentage of National Electricity Output from
|
|
Number of Operational Reactors by Country
|
|
Nuclear Power by Country
|
|
|
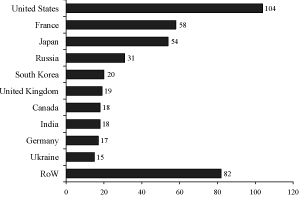
|
|
|
Source: World Nuclear Association, as of February 2010.
Nuclear power plant re-licensing. Regulatory
authorities worldwide have established timely license renewal
processes and requirements to extend plant life in a manner that
assures safe operation. In the United States, for instance,
the Atomic Energy Act and NRC regulations limit commercial power
reactor licenses to an initial term of 40 years, but also
permit such licenses to be renewed for up to an additional
20 years. The NRC views the timely renewal of licenses as
an important step to ensure an adequate domestic energy supply.
Of the 104 nuclear power reactors in operation in the United
States as of November 2009, eight are subject to license
expiration within the next five years. In the United States, the
NRC has approved license renewal for 59 reactors to date, with
an additional 19 reactor re-licensings currently under review
and 20 more reactor re-licensing applications anticipated.
License renewals are generally approved for those plants where
the reactor continues to operate at an efficient level and only
after any necessary upgrades to the instrumentation &
control equipment and systems have been made.
Nuclear power plant up-rating. NPP up-rating
is a licensing, improvement and equipment modification process
designed to enhance power output of existing plants by enabling
reactors to operate at increased temperature and pressure
levels. Utilities have used power up-rates since the 1970s as a
way to generate more electricity from existing nuclear plants.
In the United States alone, 129 up-rates have been approved by
the NRC as of October 2009, resulting in the creation of an
additional 5,726 MWe capacity within the existing nuclear
footprint. Collectively, these up-rates have added generating
capacity at existing plants that is equivalent to more than five
new reactors, according to the NRC. In most cases, up-rating
activities involve an upgrade of many critical reactor
components, including instrumentation & control
equipment and systems.
Nuclear power capacity factors. Increasing the
capacity factor of existing plants provides a means of
generating more nuclear power without building new reactors. The
capacity factor of a power plant is defined as its actual power
generation divided by its rated capacity. The average capacity
factor for U.S. NPPs was 56% in 1980, but improved
substantially to greater than 90% in 2002, according to a 2008
report of the United States Energy Information Administration.
Based on this data, we estimate that the increase in capacity
factor from 1990 to 2008 was equivalent to the construction of
approximately 26 new reactors at 1,000 MWe capacity each.
Suppliers providing reliable radiation detection, measurement,
analysis and monitoring products and services have played a
crucial role in the improvement of capacity factors.
New
Nuclear Power Plant Construction
The re-licensing, up-rating and increased capacity factors have
helped to improve the output of the existing nuclear power
reactor fleet. However, in order to keep pace with increasing
demand for nuclear power
74
globally, 53 new reactors are currently under construction,
with an additional 142 reactors planned and 327 proposed for
future development, as of February 2010.
We expect strong long-term economic growth in Asia and Eastern
Europe to drive the demand for new nuclear power reactor builds,
as economic growth and power usage in these regions would
require additional power generation capacity. Additionally, the
U.S. government has also initiated programs to provide
incentives to build new reactors. The Energy Policy Act of 2005,
for example, provides a tax credit of 1.8 cents per
kilowatt-hour
for up to 6 GWe of capacity built before 2021 and also
authorizes the Department of Energy to issue loan guarantees
worth approximately $18.5 billion for up to 80% of the cost
of new nuclear projects.
Worldwide
Nuclear Power Reactors
| |
|
|
|
|
|
|
|
|
|
|
|
|
|
|
|
|
|
|
|
|
|
|
|
|
|
|
|
Nuclear
|
|
|
|
|
|
|
|
|
|
|
|
|
|
|
|
|
|
|
|
Electricity
|
|
|
% of National
|
|
|
Number of Reactors
|
|
|
|
|
Generation 2008
|
|
|
Electricity
|
|
|
|
|
|
Under
|
|
|
|
|
|
|
|
|
Country
|
|
(Billion KWh)
|
|
|
Output
|
|
|
Operable
|
|
|
Construction
|
|
|
Planned(1)
|
|
|
Proposed(2)
|
|
|
|
|
United States
|
|
|
809
|
|
|
|
20
|
|
|
|
104
|
|
|
|
1
|
|
|
|
11
|
|
|
|
19
|
|
|
France
|
|
|
418
|
|
|
|
76
|
|
|
|
58
|
|
|
|
1
|
|
|
|
1
|
|
|
|
1
|
|
|
Japan
|
|
|
241
|
|
|
|
25
|
|
|
|
54
|
|
|
|
1
|
|
|
|
13
|
|
|
|
1
|
|
|
Russia
|
|
|
152
|
|
|
|
17
|
|
|
|
31
|
|
|
|
9
|
|
|
|
8
|
|
|
|
37
|
|
|
South Korea
|
|
|
144
|
|
|
|
36
|
|
|
|
20
|
|
|
|
6
|
|
|
|
6
|
|
|
|
0
|
|
|
United Kingdom
|
|
|
53
|
|
|
|
14
|
|
|
|
19
|
|
|
|
0
|
|
|
|
4
|
|
|
|
6
|
|
|
Canada
|
|
|
89
|
|
|
|
15
|
|
|
|
18
|
|
|
|
2
|
|
|
|
4
|
|
|
|
3
|
|
|
India
|
|
|
13
|
|
|
|
2
|
|
|
|
18
|
|
|
|
5
|
|
|
|
23
|
|
|
|
15
|
|
|
Germany
|
|
|
141
|
|
|
|
28
|
|
|
|
17
|
|
|
|
0
|
|
|
|
0
|
|
|
|
0
|
|
|
Ukraine
|
|
|
84
|
|
|
|
47
|
|
|
|
15
|
|
|
|
0
|
|
|
|
2
|
|
|
|
20
|
|
|
China
|
|
|
65
|
|
|
|
2
|
|
|
|
11
|
|
|
|
20
|
|
|
|
37
|
|
|
|
120
|
|
|
Sweden
|
|
|
61
|
|
|
|
42
|
|
|
|
10
|
|
|
|
0
|
|
|
|
0
|
|
|
|
0
|
|
|
Spain
|
|
|
56
|
|
|
|
18
|
|
|
|
8
|
|
|
|
0
|
|
|
|
0
|
|
|
|
0
|
|
|
Belgium
|
|
|
43
|
|
|
|
54
|
|
|
|
7
|
|
|
|
0
|
|
|
|
0
|
|
|
|
0
|
|
|
Czech Republic
|
|
|
25
|
|
|
|
33
|
|
|
|
6
|
|
|
|
0
|
|
|
|
0
|
|
|
|
2
|
|
|
Rest of World
|
|
|
206
|
|
|
|
N/A
|
|
|
|
40
|
|
|
|
8
|
|
|
|
33
|
|
|
|
103
|
|
|
|
|
|
|
|
|
|
|
|
|
|
|
|
|
|
|
|
|
|
|
|
|
|
|
|
|
Total
|
|
|
2,601
|
|
|
|
15
|
|
|
|
436
|
|
|
|
53
|
|
|
|
142
|
|
|
|
327
|
|
|
|
|
|
|
|
|
|
|
|
|
|
|
|
|
|
|
|
|
|
|
|
|
|
|
|
Source: World Nuclear Association, as of February 2010.
|
|
| (1) |
Planned reactors have approvals, funding or major commitments in
place, mostly expected to be in operation within eight to
ten years, or with construction well advanced but suspended
indefinitely.
|
|
|
| (2) |
Proposed reactors have specific program or site proposals, with
expected operation mostly within 15 years.
|
Nuclear
Decommissioning
Following the useful life of any nuclear reactor, it must be
decommissioned and decontaminated. The decommissioning process
can take ten years or more to complete, with the facility
requiring ongoing radiation detection, monitoring and
measurement services throughout this period. Through 2007, 90
commercial nuclear power reactors and 250 research reactors had
been retired from operation globally.
75
Other
Nuclear Facilities
According to the WNA, there were 250 operational nuclear
research reactors in 56 countries, with more under construction,
as of mid 2009. Most of these reactors reside on university
campuses and are used for research and training, materials
testing, medicine and industrial functions. Additionally, the
WNA estimates that, as of December 2009, approximately 150
maritime vessels, primarily naval submarines, are powered by
more than 220 nuclear reactors. Although not used for commercial
power generation, these facilities require similar levels of
radiation detection, measurement, analysis and monitoring
products and services as commercial reactors.
Defense
Our global defense end market is driven by a combination of
military, civil defense and event-driven security spending. The
proliferation of global security threats has reached
unprecedented levels, driven by an unstable geopolitical
climate, the emergence and expansion of terrorist organizations
and the proliferation of radiological and nuclear technologies.
Taken together, these threats have the potential to cause
significant human casualties and economic loss. As a result,
militaries, civil defense and other security organizations have
bolstered investment in the prevention and detection of
radiological threats as well as in technologies capable of
detecting and monitoring radiation levels in the aftermath of
radiological attack.
Militaries throughout the world utilize radiation detection
technologies for troop security. Spending on personnel
protection and detection of radiological threats is a high
priority for both NATO and non-NATO militaries and, as such, has
led many countries to provide dosimeters to military personnel
on a standard-issue basis. We believe that spending on these
technologies will remain a high priority among armed forces
globally.
Spending within the global civil defense, or homeland security,
market has rapidly expanded in recent years based on increased
threats presented by terrorist organizations. As a result, civil
defense, first responder and other security organizations have
invested in technologies and services designed both to protect
civil defense personnel, civilians and domestic infrastructure
from radiological threats and to detect and monitor radiation
levels following a radiological incident, such as the release of
a nuclear or other radiological device. In addition, homeland
security organizations are increasingly focused on enhancing
radiological detection capabilities at critical points of entry,
such as airports, ports and borders. Within the United States,
for example, the Domestic Nuclear Detection Office, or DNDO, was
created within the Department of Homeland Security to implement
a comprehensive inter-agency system to detect, report and
respond to nuclear or radiological threats.
Additionally, large-scale public meeting events have greatly
increased security measures at facilities, including rapid
adoption of radiological detection technologies to address the
increased threat of radiological attacks, due to their profile
as high visibility targets. For example, the Olympic Games
increased its security spending ten-fold from $180 million
for the 2000 Sydney summer games to $1.9 billion for the
2008 Beijing summer games. We believe security spending at the
Olympic Games and other public events and venues will continue
to expand and increasingly incorporate radiological detection
capabilities as a necessary component of crowd and facility
security solutions.
Medical
Nuclear and radiological medical technologies are used for
diagnostic and therapeutic procedures. These technologies
provide highly accurate, cost-effective and less invasive
alternatives compared to traditional techniques. Procedures
where radiation exposure is most prevalent include
radiodiagnostic procedures, such as x-rays and computed axial
tomography (CAT) scanning, as well as radiotherapeutic
procedures, such as external linear accelerator therapy, gamma
knife stereotactic radiotherapy and brachytherapy. Medical
imaging improves diagnosis and treatment of a variety of
illnesses and conditions, including cancer, stroke, heart
disease, trauma, sports injury and abdominal and neurological
conditions. According to the WNA, as of January 2010, there are
over 10,000 hospitals worldwide using radioisotopes in medicine,
with about 90% of
76
the procedures for diagnostics. There are approximately
37 million nuclear medicine procedures performed per year
globally, with the United States and Europe accounting for
approximately 18 million and 10 million procedures per
year.
As a result of the proliferation of radiological medical
technologies, hospitals, clinics and other medical facilities
rely on dosimetry systems and services to ensure the safety of
both medical personnel and patients. The proliferation of
nuclear and radiological medical technologies coupled with
increased use of radiological medical procedures have increased
the market for radiation detection and monitoring products and
services. The WNA estimates that the use of radiopharmaceuticals
in diagnosis continues to grow at over 10% per year.
Other
Other end markets include industrial facilities such as cement
kilns, pulp and paper mills and coal/gas fired power boilers
that utilize high-temperature industrial processes. These
high-temperature processes are critical to plant operation and
must be accurately monitored to ensure optimal operating
conditions. Imaging equipment capable of withstanding the high
temperatures and environmental conditions found in these
facilities is employed to monitor and optimize process
efficiency. Similar to the products employed in NPPs, these
imaging systems require routine replacement or upgrades.
77
BUSINESS
Business
Overview
We are a global provider of radiation detection, measurement,
analysis and monitoring products and services to the nuclear,
defense and medical end markets. Our customers rely on our
solutions to protect people, property and the environment from
nuclear and radiological hazards. Our products and services
include: dosimeters; contamination & clearance
monitors; detection & identification instruments;
radiation monitoring systems; electrical penetrations; reactor
instrumentation & control equipment and systems;
dosimetry services; imaging systems; and related accessories,
software and services. Many of our end markets are characterized
by the need to meet rigorous regulatory standards, design
qualifications and operating requirements. We believe these
industry dynamics create substantial barriers to entry, thereby
reinforcing our market position. We have successfully leveraged
the strength of our nuclear platform to expand the commercial
applications of our technologies to defense and other end
markets. The diversity of our end markets and the global nature
of our customer base are illustrated in the charts below:
| |
|
|
|
Fiscal 2009 Revenue by End Markets
|
|
Fiscal 2009 Revenue by Geography
|
|
|
|
|

|
|

|
|
|
|
Fiscal 2009 Revenue: $201.8 Million
|
For more than 50 years, we and our predecessor companies
have delivered products and services that help ensure the safe
and efficient operation of nuclear facilities. We believe the
breadth and proven performance of our solutions support our
longstanding strategic customer relationships across diverse end
markets. Our products and services have been sold directly and
indirectly to a variety of end-use customers including, but not
limited to, all of the U.S. nuclear power producers, 397 of
the global installed base of 436 active nuclear power reactors,
many of the leading reactor design firms, 17 of the 28 NATO
militaries, numerous international government and supranational
agencies, as well as medical service providers and industrial
companies worldwide.
Our broad product and services portfolio of radiation detection,
measurement, analysis and monitoring solutions is supported by
our research and development organization of 165 scientists,
engineers and technicians, who represented approximately 19% of
our workforce as of December 31, 2009. We possess numerous
product qualifications, trade secrets and patents that support
our market position and our ability to deliver next generation
products and services. In addition, we maintain design,
manufacturing and sales capabilities across seven countries,
enabling us to capitalize on growth opportunities, including the
anticipated increase in demand for nuclear power and the ongoing
spending for defense and homeland security.
Our financial performance is driven by the replacement of
products and the recurring provision of services into our core
end markets, as well as the construction of new NPPs globally.
Many of our products are ordered well in advance of the
anticipated shipment date, providing visibility into future
revenue through our backlog and deferred contract revenue, which
were $247.1 million and $66.8 million as of
December 31,2009. We generated revenue of
$201.8 million, Adjusted EBITDA of $40.6 million and a
net loss of $4.0 million for fiscal 2009. See pages 8
and 9 for a definition and reconciliation of Adjusted EBITDA to
cash provided by (used in) operating activities.
78
Our
Market Opportunity
We believe that significant opportunities for growth exist
within each of our primary end markets.
Nuclear
Our legacy in the nuclear industry positions us to capitalize on
the growth in demand for radiation detection, measurement,
analysis and monitoring products and services in each phase of
the nuclear life cycle, as outlined in the chart below.
We believe the following dynamics support the sustainability of
our existing business and will drive new sources of organic
growth.
Predictable upgrade, replacement and retirement
cycles. Our radiation detection, measurement,
analysis and monitoring products and systems have predictable
life spans, typically ranging from four to 25 years. Our
complex monitoring systems typically require at least one
comprehensive upgrade during their useful life to optimize their
functionality. In addition, many of our products require
replacement parts, components and service due to normal wear
during their useful lives.
Aging installed base. The existing global
installed base of nuclear reactors has an average age of
26 years. This aging installed base requires frequent
product replacements and upgrades over an operating life cycle
that generally ranges from 40 to 60 years. Furthermore, as
reactors reach the end of their useful lives, the onset of a
multi-year “decommissioning” process represents a
further revenue opportunity in the reactor life cycle for our
products.
Large installed base of “orphaned” products and
systems. Most currently operating reactors were
commissioned prior to 1990. Operators of many aging NPPs often
must consider new suppliers to meet their detection needs as
many of the suppliers of legacy radiation detection,
measurement, analysis and monitoring systems no longer service
the nuclear industry.
Reduction in trade barriers. Historically
closed markets, such as India, have recently opened due to
enhanced globalization and free trade.
Dosimetry outsourcing. NPPs have historically
managed the majority of their dosimetry service requirements
internally. However, the cost benefits of outsourcing these
services have become increasingly attractive to NPP operators as
they focus on improving profitability and enhancing service.
79
New build opportunity. We expect the increase
in the installed base of nuclear reactors worldwide to provide
opportunities across our offerings. The nuclear industry is
experiencing robust growth in activity related to new reactor
build. As of February 2010, there were 53 reactors under
construction, 142 planned and 327 proposed, according to the
WNA. The first phase of this “nuclear renaissance” is
occurring internationally and our global footprint positions us
to capitalize on these opportunities. Since the early stages of
reactor development generally represent more than 20% of our
revenue opportunity over the life cycle of a reactor, we are
positioned to benefit from increased global reactor
construction. In addition, as new plants are added to the global
nuclear fleet, we believe our recurring revenue opportunity
associated with replacements, spares, software, services and
system upgrades should continue to increase. Although no new
commercial reactors have been ordered in the United States since
the 1970s, there is some support to build new nuclear power
reactors in the United States, including federal government
incentives, the desire to meet long-term energy demand with
reduced
CO2
emissions and an increased focus on energy self-sufficiency.
Defense
Focus on military personnel. Global militaries
must contend with radiological threats and the difficulties of
protecting soldiers and monitoring areas of enemy engagement.
The combination of our active dosimeters and telemetry
technology provide a differentiated solution that addresses the
radiation detection needs of modern militaries.
Increased civil defense spending on radiation
detection. Civil defense and homeland security
organizations are focused on preventing the illicit
transportation of radiological materials across borders. The
commercial application of our radiation detection expertise
positions us to benefit from government spending on detection
technologies.
Enhanced event specific security. The
visibility of high profile events and venues has increased their
value as targets of terrorist activity. In response, security
spending at events, such as the Olympic Games, has increased
substantially, as has the utilization of radiation detection
technology, providing an expanding market opportunity for our
products.
Medical
Radiological procedure growth. The use of
radiodiagnostic and radiotherapeutic procedures is expanding
globally due to aging population demographics, technological
advancements and emerging middle classes in China and India. As
the use of radiological procedures increases in the medical
industry, so does our associated market opportunity.
Dosimetry outsourcing. In some regions outside
the United States, dosimetry services for health care
practitioners historically have been provided by government
agencies. We believe that more government agencies are
outsourcing dosimetry services to private providers due to
favorable cost dynamics in some regions, such as Europe. This
provides a market opportunity where we can leverage our
technical expertise and North American service experience to
expand into other regions.
Our
Competitive Strengths
We believe that the following competitive strengths will enable
us to maintain our position and capitalize on growth
opportunities in our end markets:
Trusted radiation detection, measurement, analysis and
monitoring provider. The nuclear industry is
highly regulated and requires compliance with strict product
specifications. Our track record in the nuclear end market
enables us to gain market share across our product and service
offerings. We and our predecessor companies have served the
radiation detection, measurement, analysis and monitoring needs
of our customers for over 50 years, having developed
trusted, recognized brands supported by our tradition of
technical excellence, product reliability and customer service.
In addition, we have leveraged our detection expertise to
commercialize applications for the defense and medical end
markets. In the defense market, our products serve as critical
components of personnel protection for military and civil
defense applications around the
80
world while our medical products and services support important
reporting and measurement requirements for medical personnel.
Broad and complementary product and service
portfolio. We are one of the only companies
that offers radiation detection, measurement, analysis and
monitoring products and services to satisfy customer
requirements throughout the NPP life cycle. Our comprehensive
product line supports virtually all radiation detection and
monitoring needs associated with the nuclear, defense and
medical end markets. As a result, we believe that we have
consistently gained market share as some of our key customers
rationalize their supply chain. Furthermore, our portfolio
provides us with a natural opportunity to cross-sell our
products and services to our customers. For example, our
relationships developed through sales of dosimeters led us to
win a recently announced contract to supply radiation monitoring
systems and electrical penetration adaptors to Ringhals NPP in
Sweden.
Large installed base driving recurring
revenue. We possess longstanding customer
relationships in all of our end markets. As of December 31,
2009, our products were installed at 397 of the 436 active
nuclear power reactors globally, which have an average age of
26 years. This installed base drives recurring revenue
through replacement and service cycles associated with our
offerings and the typical 40 to 60 year operating life
cycle of an NPP. The length and quality of supplier
relationships are important customer buying criteria due to high
switching costs and the importance of proven product
reliability. In addition, we maintain relationships with global
military and government organizations that value operating
longevity and technological expertise. For example, our products
have been sold to 17 of the 28 NATO militaries as well as the
U.S. Departments of Energy, State, Defense and Homeland
Security. Our customers’ focus on personnel protection
drives their recurring expenditures on service, recalibration
and product upgrades in our defense end market.
Technical complexity creates high barriers to
entry. Across our end markets, we design our
products to meet demanding customer specifications,
qualifications and regulatory requirements. In many
circumstances, we design our products to be compatible with
highly complex facilities and operate effectively in harsh
environments. Reliability is critical for our safety-related
products since a product failure may cause an unplanned nuclear
power reactor shutdown resulting in costs that may exceed
$1.0 million per day.
Global footprint designed to meet local customer
needs. Our global footprint, augmented by our
established network of suppliers and distributors, enables us to
be responsive to our customers and provide locally customized
solutions. We operate facilities in seven countries,
accommodating the desire of certain of our customers to procure
products and services from local providers. Sales outside of the
United States and Canada accounted for 61.6% of total revenue
for fiscal 2009. We believe that our established global
infrastructure provides a scalable platform to meet the growing
worldwide demand for our products and services.
Seasoned management team complemented by highly skilled
engineers. We are led by an experienced
management team with a mix of private sector and government
experience across different industries and functions. Our five
divisional presidents have an average tenure of over
20 years in the nuclear industry. Our management team has
successfully integrated the legacy businesses of which we are
comprised, and has positioned us as a global provider of
radiation detection, measurement, analysis and monitoring. Our
senior management team is complemented by a team of
165 scientists, engineers and technicians. A number of our
employees are participants in international and
U.S. standards setting organizations related to radiation
detection in the nuclear, defense and medical end markets.
Through these activities, we help define the setting of
standards and preview changes that impact our products,
customers and end markets.
Our
Strategy
Our objective is to continue enhancing our position as a global
provider of radiation detection, measurement, analysis and
monitoring products and services for the global nuclear, defense
and medical end markets. We intend to achieve this through the
following strategies:
Exploit under-penetrated market
opportunities. We believe that we can exploit
historically under-penetrated segments of our end markets by
leveraging our existing positions across our major product
categories. For example, we have leveraged our position in
active dosimetry in the North American nuclear
81
market to increase sales of our contamination &
clearance monitors, as evidenced by the sale of over 100 whole
body contamination monitors to Bruce Power L.P., a large
Canadian nuclear power generating company.
Expand addressable market. We believe
that substantial opportunities exist for us to expand our
addressable market by marketing our products and services to
customers in new geographic regions; providing products and
services to customers moving to an outsource model; entering
markets where the government is privatizing services; and
introducing new applications for existing technologies.
|
|
|
| |
•
|
Geographic expansion. Although we sold
products and services to customers in over 90 countries between
fiscal 2006 and 2009, there remain international markets where
we believe we can increase our presence. One such market is
India, where we intend to leverage our relationships with
leading reactor design firms to capitalize on the opening of the
nuclear end market to U.S. firms due to a recent treaty
ratification. Other markets for expansion include the Middle
East, Eastern Europe and the former Soviet Union, where we
intend to increase our presence by leveraging relationships with
local partners.
|
| |
| |
•
|
Customer outsourcing. We believe we will
continue to capitalize on customer outsourcing within the
nuclear end market. Within the United States, several NPP
operators have recently outsourced their dosimetry services in
order to reduce costs. We have been able to benefit from
economies of scale as well as advantages in materials
procurement and processing technology to provide enhanced
dosimetry services to many of these NPPs at a lower cost.
|
| |
| |
•
|
Service privatization. In regions outside the
United States, dosimetry services have historically been
provided by government agencies. However, privatization of
dosimetry services is accelerating in some regions, such as
Europe, as providers seek to reduce costs and benefit from
enhanced service offerings, providing an opportunity to leverage
our expertise and North American service experience.
|
| |
| |
•
|
New applications for existing technologies. A
portion of our development effort is focused on adapting
existing technologies to alternative applications. For example,
in response to market demand, we adapted our proprietary
fiber-optic detector technology used in our TwoStep-Exit whole
body monitor designed for the nuclear end market to create the
HandFoot-Fibre hand and foot monitor designed for both the
nuclear and medical end markets.
|
Develop new products and services. We
believe that significant near-term opportunities exist for us to
develop new products and services by capitalizing on our
understanding of our customers’ needs and requirements. For
example, we developed our proprietary fiber-optic technology
that is used in certain of our contamination &
clearance monitors through consultation with existing customers.
This technology is attractive to customers because, unlike
conventional contamination & clearance monitors, its
detection functionality does not require a gas supply, thus
reducing maintenance and total life cycle costs for end users.
This technology recently helped us secure a sale for
installation in two Russian utilities.
Continuously improve our cost structure and
productivity. As we continue to grow our
business, we have implemented a coordinated program of ongoing
operating improvements, such as rationalizing costs, optimizing
our product portfolio, minimizing working capital requirements,
as well as reducing the use of subcontractors, that we believe
will permit us to improve our operating margins. We will
continue to actively pursue other continuous improvement
initiatives through programs across all of our operating
segments.
Pursue strategic acquisitions. We have
successfully integrated acquisitions to augment our organic
growth. We were formed by the merger of GDS, IST and Synodys.
Since our formation, we have effectively integrated these
businesses, creating a global provider of radiation detection,
measurement, analysis and monitoring. We intend to further
complement our organic growth with selective acquisitions that
enhance our existing products and services, strengthen our
position with existing customers and enable us to expand into
new markets.
82
Our
Segments
Our segments correspond to our five operating divisions: Health
Physics, Radiation Monitoring Systems, Sensing Systems,
Dosimetry Services and Imaging Systems.
Health
Physics
The Health Physics division encompasses three major product
lines focused on detecting radiation and protecting individuals
from hazardous exposure. The dosimeters,
contamination & clearance monitors, and
detection & identification equipment have applications
across the nuclear, defense and medical end markets. The
products in our Health Physics division are summarized below:
| |
|
|
|
|
|
|
|
|
|
Product Category
|
|
End Markets
|
|
Applications
|
|
NPP Life Cycle Phase
|
|
Products
|
|
|
|
Dosimeters
|
|
• Nuclear
• Defense
• Medical
|
|
Pager-sized personnel monitors which monitor radiation dose rate
and cumulative dose, along with readers, telemetry, software and
other accessories
|
|
• Plant operation
• Recommissioning
• Decommissioning
• Waste management
|
|
• Active dosimeters
• Passive dosimeters
• Readers
• Calibrators
• Dosimetry software
• Telemetry systems
• Accessories
• Software
• Services
|
|
|
|
|
|
|
|
|
|
|
|
Contamination & Clearance Monitors
|
|
• Nuclear
• Defense
• Medical
|
|
Stationary systems designed to detect radioactive contamination
of people, waste, tools, laundry, vehicles and cargo
|
|
• Plant operations
• Recommissioning
• Decommissioning
• Waste management
|
|
• Body monitors
• Waste chambers
• Tool monitors
• Laundry monitors
• Vehicle monitors
• Accessories
• Software
• Services
|
|
|
|
|
|
|
|
|
|
|
|
Detection & Identification Devices
|
|
• Nuclear
• Defense
• Medical
|
|
Hand-held and fixed devices used for detecting and locating
ionizing radiation sources and/or spectroscopically identifying
the active radioisotopes
|
|
• Plant operations
• Recommissioning
• Waste management
|
|
• Survey meters
• Handheld identifiers
• Spectroscopic portal monitors
• Accessories
• Software
• Services
|
|
|
Dosimeters
Our dosimeter product line, which measures ionizing radiation
dose, consists of both active and passive dosimeters. Active
dosimeters detect and measure radiation levels in real time and
provide warnings if the dose rate or cumulative dose exceeds
specific thresholds. Passive dosimeters are worn by personnel
and monitor cumulative radiation dosage.
Our active dosimeters are most often utilized in NPP and defense
environments. Active dosimeters are typically pager sized, and
may be worn or fix-mounted, with some models having wireless
capabilities. We
83
generally sell our dosimeters as part of larger systems, which
often include readers, software, telemetry and other
accessories. Certain systems require commercially available,
sealed radioactive sources for calibration and quality assurance
purposes.
Our active dosimeters have an average lifespan of approximately
seven to ten years, depending on the usage and environment.
Replacement cycles can vary by country, depending on the
applicable regulatory regime or customer practices. This
provides recurring revenue opportunities as customers must
replace and upgrade components during this timeframe. In
addition, as companies upgrade their dosimeters, they often
purchase upgraded readers, software, services and accessories.
We are a global provider of active dosimetry products and
services to the nuclear end market. Over 68% of operating NPPs
in the United States use our active dosimetry products and
services. In addition, sales to the defense end market
constitute a significant portion of our active dosimeter
revenue. For example, 17 of the 28 NATO militaries have
purchased our active dosimeters. We designed our military
dosimeter to be flash-dose capable, enabling the device to
effectively measure radiation dose following a nuclear event.
Also, civil security forces in various countries, including
first responders from France, Italy and the United States, use
our active dosimeters to assess radiological risk.
We also sell passive dosimeters, which are worn by nuclear,
defense and medical and industrial workers with the potential to
be exposed to radiation. As with active dosimeters, we typically
sell passive dosimetry equipment as a system, consisting of
dosimeters, readers, accessories and software.
Contamination &
Clearance Monitors
Our contamination & clearance monitors include
products that detect alpha, beta, gamma
and/or
neutron contamination of objects of various sizes and types,
from people to trucks. We have a wide range of products, ranging
from small tool monitors to whole body monitors for personnel,
to large portal monitors for vehicles and cargo. Our monitors
utilize gas, inorganic or plastic scintillators with fiber-optic
technology to detect radioactive contamination. Our patented
fiber-optic technology is differentiated in the market because
its detection functionality does not require a gas supply, thus
reducing maintenance and total life cycle costs for end users.
Certain monitors require commercially available, sealed
radioactive sources for calibration and quality assurance
purposes.
In the nuclear end market, our monitors are used to screen
personnel, their clothing and tools, as well as vehicles
entering and exiting reactor sites. In the defense end market,
our products are used for homeland security applications to
screen people, luggage, vehicles and cargo transiting a port or
border. In the medical end market, our monitors are used to
screen the hands and feet of nuclear medicine workers in
hospitals and are used in the steel industry to screen scrap
metal for radioactive contamination.
Detection &
Identification Devices
We provide a suite of devices that detect, locate and identify
radioactive isotopes. These are typically handheld or fixed
devices and can also be integrated into more complex mobile
systems. For example, our SPIR Ident product has been
incorporated into both military vehicles and helicopters. These
detection & identification devices distinguish
themselves through their high level of sensitivity and their
capacity to distinguish between different radioisotopes using
spectroscopy identification algorithms.
For this reason, these devices are typically used in the defense
end market. In homeland security and military environments,
these devices are used to rapidly identify potential
radiological threats originating from dangerous nuclear
material, while distinguishing such threats from naturally
occurring radioactive materials and medical isotopes.
84
Radiation
Monitoring Systems
Our Radiation Monitoring Systems division supplies fixed and
mobile systems consisting of sensors, display and processing
electronics and software, which are used for barrier leak
control, effluent release monitoring, radiation protection of
workers, operational process monitoring and post event
monitoring in nuclear installations. The products in our
Radiation Monitoring Systems division are summarized below:
| |
|
|
|
|
|
|
|
|
|
Product Category
|
|
End Markets
|
|
Applications
|
|
NPP Life Cycle Phase
|
|
Products
|
|
|
|
Radiation Monitoring Systems
|
|
• Nuclear
|
|
Systems consisting of sensors, displays, control electronics and
software which are used for barrier leak control, effluent
release monitoring, radiation protection of workers, operational
process monitoring and “post event” monitoring in
NPPs, nuclear fuel cycle industry, reactors and military
installations.
|
|
• Construction
• Plant operation
• Recommissioning
• Decommissioning
• Waste management
|
|
• Alpha, beta, gamma and neutron sensors
• Channels for monitoring: volume contamination (particulates, iodine, gas and liquids); dose rates (gamma and neutron); and neutron flux
• Fixed and mobile instrumentation skids
• Display and processing electronics
• Accessories
• Software
• Services
|
|
|
We are a global provider of radiation monitoring systems, with
particularly strong positions in Europe and Asia. We sell fully
integrated systems that can transmit data to a central computer
that tracks radiation levels continuously throughout the plant.
Many of our systems incorporate or use commercially available,
sealed radioactive sources for calibration and quality assurance
purposes, the exact type and quantity of such sources being
dependent on the requirements of the intended application. To
accompany these systems, we also supply proprietary software,
which allows operators to monitor trends, alarm levels,
historical incident files and status reports.
Within a typical nuclear reactor, a radiation monitoring system
consists of between 40 and 120 sensors and a similar number of
processing and display units, all of which are generally
networked to a central control system. Safety-related monitors
are subject to qualifications which are time consuming and
expensive to obtain. Qualification of our products often
requires close cooperation by us with customers and substantial
technical expertise, sometimes requiring a multi-year process
and substantial expenditures of funds in advance of customer
orders. Qualification is a lengthy and costly endeavor in which
equipment is rigorously tested in simulated real-world
environmental conditions to ensure that it meets the criteria
defined in the standards applicable to the nuclear environment.
Qualifications must be performed according to independent
reference standards that define the methodologies, criteria and
severity required. Upon achievement, qualifications are not
typically subject to requalification, revocation or challenge,
although a qualification may be obsoleted or required to be
revised if the standards organization or regulatory changes
determine that the original qualification is insufficient for
its intended purpose or the standards themselves evolve,
inducing changes in the methodology, criteria or severity
required of the qualification. Some equipment requires lengthier
qualification periods than others, but the typical period ranges
from one to four years. Once a component’s qualified life
has been reached, it must be replaced. The qualification process
for our radiation monitoring systems typically requires one to
three years.
Radiation monitoring systems are typically installed in nuclear
facilities during construction, and they are replaced or
upgraded upon life extensions or reactor upgrades. The expected
life for a radiation monitoring system is 15 to 25 years,
depending on the usage and environment, necessitating a
significant upgrade of equipment at least once during a nuclear
facility’s useful life. Replacement cycles can vary by
country, depending on the applicable regulatory regime or
customer practices. This provides recurring revenue
opportunities as customers must replace and upgrade components
and services during this timeframe.
85
The decommissioning of an NPP, which can take over ten years,
also requires radiation monitoring systems. Typically, a larger
deployment of mobile monitors is required during the
decommissioning process than in normal NPP operations. The new
construction, operation and decommissioning phases of the NPP
life cycle each provide opportunities for sales of our radiation
monitoring systems.
Radiation monitoring systems are also prevalent in the nuclear
fuel cycle industry, spanning fuel fabrication, reprocessing and
storage. These systems are used in many types of accelerators,
including medical positron emission tomography and high-energy
particle accelerators and can also be used in the operation and
monitoring of nuclear military installations.
Sensing
Systems
Our Sensing Systems division provides products that facilitate
reactor control, safety and containment structure integrity.
These products meet proprietary reactor design qualifications
and are essential to the safe and efficient operation of a
reactor. The products in our Sensing Systems division are
summarized below:
| |
|
|
|
|
|
|
|
|
|
Product Category
|
|
End Markets
|
|
Applications
|
|
NPP Life Cycle Phase
|
|
Products
|
|
|
|
Electrical Penetrations
|
|
• Nuclear
|
|
Conduit systems that are used to pass electrical and fiber-optic
lines through the containment structure of an NPP, without
compromising the pressure or radiological integrity of the
structure
|
|
• Construction
• Recommissioning
|
|
• Electrical penetrations containment
assemblies
• Temperature sensors
• Instrumentation seals
• Thermowells
• Explosive valves
|
|
Reactor Instrumentation & Control Equipment and
Systems
|
|
• Nuclear
• Defense
|
|
Sensors and electronics designed to monitor radiation and
temperature within a reactor core and in surrounding areas to
facilitate safe and efficient reactor operation
|
|
• Construction
• Plant operation
• Recommissioning
|
|
• In-core detectors
• Ex-core detectors
• Control electronics
|
|
|
Electrical
Penetrations
Electrical penetrations are conduits through a nuclear reactor
containment structure. Our penetrations allow wiring for
electrical and optical signals to pass safely through the
containment structure wall, while maintaining the integrity of
the wall and not permitting radiation or pressure to escape.
Containment structures consist of concrete walls that can extend
up to fourteen feet in thickness with a stainless steel liner
designed to contain radioactive emissions in a confined space.
The containment wall is the primary safety barrier in the
reactor.
Our electrical penetrations enable the supply of power for
safety systems as well as the reception of signals from neutron
flux detectors, radiation monitoring detectors, cameras and
other control surveillance devices. Typically, a nuclear reactor
has 40 to 70 major electrical penetrations with up to 12,000
individual electrical connections, or feedthroughs.
We are a global provider of electrical penetrations. As with
radiation monitoring systems, electrical penetrations must be
qualified. The qualification process for our electrical
penetrations typically requires three to four years, and our
electrical penetrations have been qualified for installation in
most major reactor designs by reactor design firms and the major
utilities.
As a critical component of reactor design, electrical
penetrations provide us with increased visibility into new plant
builds. Our position in electrical penetrations provides us with
cross-selling opportunities for other products, such as
detectors, radiation monitoring systems, imaging systems and
contamination & clearance monitors.
86
Reactor
Instrumentation & Control Equipment and
Systems
We are a global provider of reactor instrumentation &
control equipment and systems. Our reactor
instrumentation & control detectors are used in
nuclear facilities to monitor radiation and temperature within a
nuclear reactor core (“in-core” detectors) and in
surrounding areas (“ex-core” detectors). Our detectors
measure the distribution of neutron/gamma flux and temperature
both in, and adjacent to, a reactor core and are critical
components to maintaining the efficient and safe operation of a
reactor. Our detectors incorporate various radioactive materials
and generate a signal, giving a precise measurement of the
radiation flux, which contributes to safe and efficient reactor
operation.
As with radiation monitoring systems and electrical
penetrations, these detectors must be qualified and such
qualification is established by tests which are designed to
demonstrate the intended function of a detector when subjected
to conditions that simulate installed life under design service
conditions. The qualification process typically requires one to
two years for our detectors. Our reactor
instrumentation & control detectors are qualified for
all major reactor designs. Once a qualification is obtained and
a contract is awarded, the supplier is well positioned for
replacement revenue due to the high switching costs involved in
qualifying new products and services from other suppliers.
Reactor instrumentation & control detectors are
typically installed in nuclear facilities during construction
and are replaced or upgraded regularly. The expected life of a
detector can range from four to 25 years, depending on the
type of detector and the operating environment. This provides
recurring revenue opportunities as customers must replace and
upgrade components during these timeframes. In addition, there
are opportunities to provide more comprehensive upgrades of
reactor instrumentation & control detector systems in
certain existing reactors to facilitate up-rating.
Dosimetry
Services
Our Dosimetry Services division provides an official “dose
of record” to employers of radiation workers. The services
in our Dosimetry Services division are illustrated below:
| |
|
|
|
|
|
|
|
|
|
Product Category
|
|
End Markets
|
|
Applications
|
|
NPP Life Cycle Phase
|
|
Products
|
|
|
|
Dosimetry Services
|
|
• Nuclear
• Defense
• Medical
|
|
An information service, which provides environmental radiation
monitoring services as well as an official dose of record to
employers and occupationally exposed employees
|
|
• Plant operation
• Decommissioning
• Waste management
|
|
• Extremity, whole body, eye, environmental and fetal monitoring reports
• Online applications for dosimetry data management
• Consulting services
|
|
|
At the request of employers, we provide cumulative dose
monitoring services to personnel at nuclear installations,
research labs, government agencies, hospitals, dental offices,
veterinary offices and other medical facilities where there is a
potential for radiation exposure. Government regulations and
industry guidelines (e.g., OSHA, NCRP, ANSI, IAEA) often require
these individuals to wear dosimeters to monitor their radiation
dose. We provide our customers with services such as cumulative
dose reports and data management. We are a provider of dosimetry
services, primarily serving the U.S. nuclear and medical
end markets.
Our service uses film, thermoluminescent and track-etch
dosimeters. Each of these has distinct characteristics that make
them suitable for specific applications and customer types.
Dose is calculated algorithmically using filtering mechanisms to
customize the dosimeter response for the type of radiation and
potential exposure. Each dosimeter is identified to provide a
chain of custody throughout the service cycle. We ship the
dosimeters to the customer, whose personnel wear them for
intervals ranging from one month to one year. As the wear period
nears its end, we send the customer a new set of dosimeters, and
the customer returns the original dosimeters to us for
processing. After processing, we report dose information to the
customer in a format that complies with relevant governing
standards or regulations.
87
Reports generally take seven to ten business days to process and
document each wearer’s current wear period dose,
quarter-to-date dose, year-to-date dose and lifetime dose.
In fiscal 2009 over 90% of our dosimetry services customers,
representing 65% of our dosimetry services revenue, pre-paid
their annual subscriptions. In the six months ended
December 31, 2009, over 89% of our dosimetry customers,
representing 68% of our dosimetry services revenue, pre-paid
their annual subscriptions.
Imaging
Systems
Our Imaging Systems division is a global provider of highly
specialized closed circuit camera systems used for inspection
and surveillance in difficult and hazardous environments. The
products in our Imaging Systems division are illustrated below:
| |
|
|
|
|
|
|
|
|
|
Product Category
|
|
End Markets
|
|
Applications
|
|
NPP Life Cycle Phases
|
|
Products
|
|
|
|
Imaging Systems
|
|
• Nuclear
• Other
|
|
Nuclear: imaging systems for nuclear fuel handling, control, monitoring and inspection; reactor vessel maintenance; underwater surveillance; tank and vessel inspection; and cameras for remotely operated vehicles
High-temperature: kiln viewing and recovery boiler monitoring
|
|
• Construction
• Plant operation
• Recommissioning
• Decommissioning
• Waste management
|
|
• Radiation hardened surveillance and inspection
cameras
• Video management and control systems
• Lighting systems
• Telemetry control units
• Thru-wall endoscopes
• High temperature cameras with pyrometry
• Software
|
|
|
We have designed our imaging systems to operate in nuclear
installations, with many of our cameras being radiation
“hardened,” allowing them to operate in the high
levels of radiation frequently found in these installations. We
supply cameras for all stages of the nuclear life cycle, from
construction through operation, to decommissioning and waste
management. Our products are used in NPPs, nuclear reprocessing
plants and waste management facilities. For example, our cameras
are used during refueling shutdowns for inspecting the integrity
of critical structures in nuclear reactors.
Our products are also designed for use in high temperature
environments, such as pulp and paper recovery boilers, gas or
coal-fired power boilers and cement kilns. In these
environments, our cameras provide real time video as well as
accurate temperature measurement. This enables operators to
closely monitor their processes, helping to ensure plant safety
and increased operational efficiency. For example, our cameras
are used by two of the world’s largest cement producers to
monitor flame patterns and temperature in cement kilns, helping
operators maximize operational efficiency.
The expected life of our cameras typically ranges from one to
five years, depending on the operating environment. This
provides recurring revenue opportunities as customers must
replace and upgrade components during these timeframes.
Research
and Development
Our research and development efforts allow us to introduce new
products to the marketplace, fulfill specific customer needs and
continue to meet qualification requirements for next generation
nuclear reactors and other evolving regulatory standards. Our
five operating divisions are committed to both technology
research and product development to fulfill their strategic
objectives and are supported by our engineering and research and
development organization consisting of 165 scientists,
technicians and engineers, representing approximately 19% of our
total workforce, as of December 31, 2009. A number of them
participate in international standards setting organizations and
committees. We engage in research and development activities at
most of our facilities worldwide.
88
We expensed approximately $11.9 million, $14.9 million
and $11.3 million on research and development for fiscal
2007, 2008 and 2009 and $6.3 million and $5.2 million
for the six months ended December 31, 2008 and 2009.
Research and development activities range from the development
of radiation tolerant electronics to the development of
customized software solutions for customer-specific
applications, among others. We conduct these efforts through a
mix of in-house research, collaboration with academia, customers
and regulatory authorities as well as selected outsourcing
through external vendors. The scope and extent of the outsourced
portion of research and development activities vary by division,
but typically, critical hardware design, software development
and project management activities are conducted in-house while
specialized services such as consulting services, algorithm
design, thermal analysis, complex modeling and calculations and
testing services are provided by third parties.
Sales and
Marketing
We sell our products and services through our direct sales
organization and indirectly through our global network of
independent, third-party sales representatives and distributors.
Our internal sales team is organized by operating division and
end market to provide a higher level of service and
understanding of our customers’ unique needs. We recently
instituted a key account strategy in which we have designated
senior executives taking a lead role with our top customers.
This enables us to systematically and actively maintain close
relationships with our top customers and provide solutions that
meet their specifications. We have 14 sales offices in North
America, Europe and Asia, and as of December 31, 2009, our
sales and marketing personnel consisted of 140 employees,
which represents approximately 16% of our total workforce.
We derive a portion of our revenue from sales of our products
and services through channel partners, such as independent sales
representatives and distributors. In particular, our independent
sales representatives are an important source of sales leads for
us and augment our internal resources in remote geographies. We
sell through distributors in situations in which our customers
prefer to purchase from a local business entity or purchase in
smaller volume.
Our marketing activities include participation in many
tradeshows worldwide across our nuclear, defense and medical end
markets. We advertise in technical journals, publish articles in
leading industry periodicals and utilize direct mail campaigns.
We host our annual Users’ Training and Benchmarking
Seminar, where customers participate in a variety of programs
designed to exchange ideas and discuss occupational challenges.
The event also brings together key channel partners and vendors
to strengthen our sales and marketing network. Attendees gain
insight into our product plans and participate in interactive
sessions that give them the opportunity to better understand our
current suite of products and services as well as provide
feedback on our product roadmap.
Our
Customers
Our principal customers include power and utility companies,
reactor design firms, NPPs, government agencies, military
organizations, medical service providers and industrial
companies. For fiscal 2009, no single customer accounted for
more than 10.0% of our consolidated revenue, while our top ten
customers together accounted for approximately 27.0% of our
consolidated sales. For the six months ended December 31,
2009, no customer accounted for greater than 10% of our
consolidated revenue and our top ten customers together
accounted for approximately 34.7% of our consolidated sales.
Manufacturing
and Supply Chain
Given the diversity of our products, we employ numerous
manufacturing techniques, including high-volume process
manufacturing, discrete manufacturing, cellular manufacturing
and hybrid approaches. Our production personnel engage in
manufacturing, procurement and logistics activities. Our
production activities are located in the United States, Canada,
France, Germany, Finland and the United Kingdom. As of
December 31, 2009, our production personnel consisted of
420 employees, which represents approximately 49% of our
total workforce.
89
Our manufacturing activities are focused mainly on the
production of the core value-add devices and components of our
products, while non-core components and sub-assemblies are
generally outsourced. This strategy enables us to protect
important intellectual property while minimizing the time, cost
and effort to produce commoditized components. Most of the time,
the design, assembly and integration of the components are
performed in-house, allowing our engineers to customize the
products according to customer specifications. For highly
engineered nuclear products, production volumes are typically
low, with a high degree of custom engineering required. For
other product lines, such as passive dosimetry products,
production volumes tend to be higher. We apply rigorous quality
control processes and calibrate radiation detection devices
internally, leading to high quality standards and customization
capabilities. Most of our production sites are certified to
production quality standards such as ISO 9001, 10 CFR
50 Appendix B and
ASME NQA-1.
The principal materials used in our manufacturing processes are
commodities that are available from a variety of sources. The
key metal materials used in our manufacturing processes include
precious metals, tungsten, copper, aluminum, magnesium products,
steel, stainless steel and various alloys, which are formed into
parts such as detectors, sensors and cable assemblies. The key
non-metal materials used include amorphous and crystalline
scintillator materials, ceramics, epoxies, silicon and fused
silica, polyethylene, polyurethane and injection molded plastic
parts and components such as lenses, monitors, sensors,
dosimeters, electronic boards, detectors and cables.
Properties
The table below lists our properties as of December 31,
2009:
| |
|
|
|
|
|
|
|
|
|
|
|
|
|
Approximate
|
|
|
|
|
Location
|
|
Square Feet
|
|
|
Facility Use / Description
|
|
|
|
Production facilities:
|
|
|
|
|
|
|
|
Canada
|
|
Cambridge, ON
|
|
|
31,800
|
|
|
Sensing Systems
|
|
Finland
|
|
Turku
|
|
|
9,800
|
|
|
Health Physics
|
|
France
|
|
Fussy (Bourges)
|
|
|
24,000
|
|
|
Sensing Systems
|
|
France
|
|
Lamanon
|
|
|
77,700
|
(1)
|
|
Health Physics & Radiation Monitoring Systems
|
|
France
|
|
Lamanon
|
|
|
6,500
|
|
|
Health Physics & Radiation Monitoring Systems
|
|
Germany
|
|
Hamburg
|
|
|
29,600
|
|
|
Health Physics
|
|
Germany
|
|
Munich
|
|
|
28,100
|
|
|
Radiation Monitoring Systems
|
|
United Kingdom
|
|
Alton
|
|
|
27,000
|
|
|
Imaging Systems
|
|
United States
|
|
Atlanta (Smyrna), GA
|
|
|
24,100
|
|
|
Health Physics & Radiation Monitoring Systems
|
|
United States
|
|
Buffalo (Cheektowaga), NY
|
|
|
26,200
|
|
|
Sensing Systems
|
|
United States
|
|
Horseheads, NY
|
|
|
50,500
|
(2)
|
|
Sensing Systems & Imaging Systems
|
|
United States
|
|
Irvine, CA
|
|
|
43,500
|
|
|
Dosimetry Services
|
|
|
|
|
|
Sales / Research and Development / Administrative
locations
|
|
|
|
China
|
|
Beijing
|
|
|
500
|
|
|
Sales center
|
|
China
|
|
Beijing
|
|
|
2,200
|
|
|
Sales center
|
|
Germany
|
|
Bonn
|
|
|
1,000
|
|
|
Imaging Systems
|
|
United Kingdom
|
|
Whitehaven, Cumbria
|
|
|
3,000
|
|
|
Imaging Systems
|
|
United States
|
|
Pickerington, OH
|
|
|
2,900
|
|
|
Imaging Systems
|
|
United States
|
|
San Ramon, CA
|
|
|
10,300
|
|
|
Corporate headquarters
|
|
United States
|
|
Woodinville, WA
|
|
|
1,000
|
|
|
Imaging Systems
|
|
|
|
|
(1)
|
|
We lease all listed properties
except the property located in Lamanon, France, which we own.
|
|
|
|
|
(2)
|
|
Our current lease consists of a
total of approximately 60,675 square feet, of which we
sublet, or otherwise do not use, approximately
10,175 square feet.
|
90
Competition
The global markets for our products and services are competitive
and continually evolving. Within each of our operating segments,
we encounter a variety of competitors, ranging from small
independent companies providing niche solutions to larger
multi-national corporations providing a broader set of products
and services to our targeted end markets. We believe that the
principal bases upon which we compete in our target end markets
include product quality and reliability, technical capability
and product qualification, strength of customer relationships,
customer service and price. In particular, customers in the
nuclear and defense end markets tend to emphasize product
quality and reliability, technical capability and strength of
supplier relationships, while customers in the medical end
markets, in particular for passive dosimetry products and
services, tend to make purchasing decisions on a combination of
brand recognition, price, service and reliability.
We believe the primary competitors in each of our segments are
as follows:
|
|
|
| |
•
|
Health Physics: Thermo Fisher Scientific and
Areva (Canberra).
|
| |
| |
•
|
Radiation Monitoring Systems: General Atomics
(Sorrento Electronics) and Areva (Canberra).
|
| |
| |
•
|
Sensing Systems: Reuter-Stokes (General
Electric), Schott and Areva.
|
| |
| |
•
|
Dosimetry Services: Landauer.
|
| |
| |
•
|
Imaging Systems: Diakont.
|
Intellectual
Property
We rely on a combination of intellectual property rights,
including qualifications, trade secrets, patents, copyrights and
trademarks, as well as contractual protections, to protect our
proprietary products, methods, documentation and other
technology.
As of December 31, 2009, we held approximately 12 issued
U.S. patents, 38 issued foreign counterparts of
U.S. patents and three other issued foreign patents with
expiration dates ranging from 2010 to 2025. In addition, we have
filed seven foreign counterpart patent applications and five
other foreign patent applications. We also hold exclusive and
non-exclusive licenses related to patents and other intellectual
property of third parties. We held approximately 14
U.S. registered and pending trademarks, 22 international
counterparts of such registered and pending trademarks and seven
additional international registered and pending trademarks, as
of December 31, 2009.
In many instances, we rely on trade secret protection and
confidentiality agreements to safeguard our interests. Due to
the long useful life of certain aspects of our technology, we
believe that the patent registration process, which requires
public disclosure of patented claims and inventions, could harm
our competitive position. We differentiate our products and
technologies primarily through our proprietary know-how,
technology or data that are not covered by patents or patent
applications, including technical processes, equipment designs,
testing and other procedures. Our employees are generally
required to assign to us all of the inventions, designs and
technologies they develop during the course of employment with
us, either through written agreements or by operation of law,
depending on the jurisdiction. Where appropriate, we require
third parties with whom we deal to enter into agreements with us
that address issues of confidentiality and intellectual property.
Environmental
Matters
We are subject to a variety of environmental, health and safety
and pollution-control laws and regulations in the jurisdictions
in which we operate. We do not believe the costs of compliance
with these laws and regulations will be material. We use,
generate, discharge and dispose of hazardous substances,
chemicals and wastes at some of our facilities in connection
with our product development, testing and manufacturing
activities. Any failure by us to control the use of, to
remediate the presence of, or to restrict adequately the
discharge of, such substances, chemicals or wastes could subject
us to potentially significant liabilities,
91
clean-up
costs, monetary damages and fines or suspensions in our business
operations. In addition, some of our facilities are located on
properties with a history of use involving hazardous substances,
chemicals and wastes and may be contaminated. Although we have
not incurred, and do not currently anticipate, any material
liabilities in connection with contamination, we may be required
to make expenditures for environmental remediation in the future
with respect to contamination at our or our predecessors’
former or current facilities or at third-party waste disposal
sites. See “Risk Factors—Risks Relating to Our
Business—We could incur substantial costs as a result of
violations of or liabilities under environmental laws.”
Regulation
We are subject to a variety of laws and regulations, including
but not limited to those of the United States, Canada, the EU,
the EU member states and the People’s Republic of China,
that impose regulatory systems that govern many aspects of our
operations, including but not limited to our use, storage and
disposal of radioactive materials and hazardous waste. In
addition, these jurisdictions impose trade controls requirements
that restrict trade to comply with applicable export controls
and economic sanctions laws and requirements, and legal
requirements that are intended to curtail bribery and
corruption. These laws and regulations apply by virtue of the
nature of our industry, end markets and products, as well as the
range of potential uses of our products, the origin of the
technology incorporated into our products, and the jurisdictions
in which we produce and sell our products.
The multi-jurisdictional legal and regulatory environments in
which we operate are subject to extensive and changing laws and
regulations administered by various national, regional and local
governmental agencies both within and outside the United States.
We are a federal government contractor and, as such, we are
subject to Executive Order 11246 and other relevant laws and
regulations. As part of our compliance obligations, we implement
on an annual basis an affirmative action plan and program which,
in part, include our good faith efforts to achieve in our
workforce full utilization of qualified women and minorities. In
addition, we have in place an affirmative action plan with
respect to disabled individuals, as well as Vietnam era,
disabled or other veterans.
Some of the U.S. laws affecting our operations include, but
are not limited to, the AEA, the Energy Reorganization Act of
1974, or ERA, the Resource Conservation and Recovery Act of 1976
as amended by the Hazardous and Solid Waste Amendments of 1984,
or RCRA, the Comprehensive Environmental Response, Compensation
and Liability Act of 1980, or CERCLA, the Hazardous Materials
Transportation Act, the Federal Water Pollution Control Act, or
the Clean Water Act, the Toxic Substances Control Act of 1976,
or TSCA, the Organized Crime Control Act of 1970, or the OCCA,
and the Occupational Safety and Health Act, or OSHA, as well as
the state laws governing radiation control, hazardous waste
management, water quality and air quality in the states of New
York, Georgia and California, each as from time to time amended.
We are also subject to a variety of U.S. federal and state
employment and labor laws and regulations, including the
Americans with Disabilities Act, the Federal Fair Labor
Standards Act, the Worker Adjustment and Restructuring
Notification Act, or WARN Act, which requires employers to give
affected employees at least 60 days’ notice of a plant
closing or mass layoff, and other regulations related to working
conditions,
wage-hour
pay, overtime pay, employee benefits, anti-discrimination and
termination of employment. The classified work that we currently
perform at one of our U.S. facilities subjects us to the
industrial security regulations of the Department of Defense and
other federal agencies that are designed to safeguard against
unauthorized access by foreigners and others to classified and
other sensitive information.
In the United States, the AEA and ERA authorize the NRC, and
state authorities where applicable, to regulate the receipt,
possession, use and transfer of radioactive materials. The NRC,
and state authorities where applicable, sets regulatory
standards for worker protection and public exposure to
radioactive materials or wastes to which we are required to
adhere in our operations that use radioactive materials in
research and development, product manufacture, testing and
calibration.
RCRA provides a comprehensive framework for the regulation of
hazardous and solid waste which applies to our operations. RCRA
prohibits improper hazardous waste disposal and imposes criminal
and civil liability for failure to comply with its requirements.
TSCA provides a comprehensive framework for the
92
management by the EPA of over 60,000 commercially produced
chemical substances, some of which are used by our operations.
The Clean Water Act regulates the discharge of pollutants into
certain waters and may require us to apply for and obtain
discharge permits, conduct sampling and monitoring and, under
certain circumstances, reduce the quantity of pollutants in
those discharges. The OCCA provides for the regulation of
explosives, which applies in particular to our facility in
Buffalo which manufactures and tests products that incorporate
explosives. The OCCA establishes a framework for licensing, use,
storage and sale of explosives and products containing
explosives and imposes criminal and civil liability for failure
to comply with its requirements. OSHA provides for the
establishment of standards governing workplace safety and health
requirements, including setting permissible exposure levels for
hazardous chemicals. We must follow OSHA standards, including
the preparation of material safety data sheets, hazardous
response training and process safety management, as well as
various record-keeping, disclosure and procedural requirements.
Our operations outside the United States are subject to similar,
and sometimes more stringent, laws and regulations. For example,
an EU directive relating to the restriction of hazardous
substances in electrical and electronic equipment, or RoHS
directive, and a directive relating to waste electrical and
electronic equipment, or WEEE directive, have been and are being
implemented in EU member states. Among other things, the RoHS
directive restricts the use of certain hazardous substances in
the manufacture of electrical and electronic equipment and the
WEEE directive requires producers of electrical goods to be
responsible for the collection, recycling, treatment and
disposal of these goods. In addition, laws similar to the RoHS
and WEEE directives were passed in China in 2006 and South Korea
in 2007. Governments in other countries and states, including
the United States, are considering implementing similar laws or
regulations. In addition, a regulation regarding the
registration, authorization and restriction of chemical
substances in industrial products, or REACH, became effective in
the EU in 2007. REACH and other regulations requires us or our
suppliers to substitute certain chemicals contained in our
products with substances the EU considers less dangerous. We
have assessed the impact that REACH is expected to have on us
and have determined the impact at this time to be immaterial. We
have completed the chemical substitutions required by REACH and
expect to complete any associated requalifications in fiscal
2010. We are also subject to the employment and labor laws and
regulations of the foreign jurisdictions where the majority of
our employees are located.
We deal with numerous U.S. and
non-U.S. government
agencies and entities, including the U.S. military, the
armed forces of many NATO countries, the U.S. Department of
Defense, the U.S. Department of State, the U.S. Department of
Treasury, the U.S. NRC, the U.S. Department of
Homeland Security and the corresponding governmental agencies
and entities in the European Union and Canada. When working with
these and other government agencies and entities, we must comply
with, and are affected by, laws and regulations relating to the
formation, administration and performance of contracts. These
laws and regulations, among other things require certification
and disclosure of all cost or pricing data in connection with
various contract negotiations; impose acquisition regulations
that define allowable and unallowable costs and otherwise govern
our right to reimbursement under various cost-based
U.S. government contracts; and restrict the use and
dissemination of information classified for national security
purposes and the exportation of certain products and technical
data.
We believe that certain of our products and technologies are
eligible for designation or certification as “qualified
anti-terrorism technologies” under the SAFETY Act
provisions of The Homeland Security Act of 2002, and its
implementing regulations. Under the SAFETY Act, the federal
government provides for certain liability limitations and a
presumption that the “government contractor” defense
applies if the Department of Homeland Security
“designates” or “certifies” technologies or
products as “qualified anti-terrorism technologies,”
and if certain other conditions apply. We may seek to qualify
some or all of our products and technologies under the SAFETY
Act’s provisions in order to obtain such liability
protections, but there is no guarantee that the Department of
Homeland Security will designate or certify our products and
technologies as qualified anti-terrorism technology. To date, we
have not sought such designation or certification as a qualified
anti-terrorism technology, and our products have been sold
without such qualification and we may continue to sell our
products and technologies without such qualification. To the
extent we do so, we will not be entitled to the benefit of the
SAFETY Act’s limitations on tort liability or to any
U.S. government indemnification.
93
Many of our products are subject to export controls of the
United States, Canada and the member states of the EU, depending
on a number of factors, including the nature of the product and
its potential uses, the origin of the technology incorporated
into the product, and the jurisdictions in which we produce and
sell our products. Certain of our products are subject to
U.S. export control laws and regulations, which have
certain registration, licensing and recordkeeping requirements
for the sale or transfer of controlled technology or information
to
non-U.S. persons.
These regulations include the U.S. Department of
Commerce’s Export Administration Regulations, or the EAR,
the U.S. Department of State’s International Traffic
in Arms Regulations, or ITAR and the U.S. Nuclear Regulatory
Commission regulations. Certain products that have dual-use
commercial and military applications are controlled under the
EAR’s Commerce Control List, and we have export compliance
systems for determining the proper export licensing requirements
for such products. We need to keep such export compliance
systems, which include third-party service provider screening of
compliance lists, monitoring of Department of Commerce
notifications and periodic reviews of applicable regulations, up
to date and properly maintained.
U.S. laws restrict the ability of U.S. companies,
U.S. citizens and U.S. permanent residents, or
U.S. persons, from involvement in certain types of
transactions with countries, businesses and individuals that
have been targeted by U.S. economic sanctions. For example,
U.S. persons are precluded from undertaking virtually any
activity of any kind on the part of any U.S. person with
regard to any potential or actual transactions involving Cuba,
Iran and Sudan without the prior approval of the
U.S. Department of Treasury’s Office of Foreign Assets
Control, or OFAC. OFAC also administers U.S. sanctions
against a lengthy list of entities and individuals, wherever
they may be located, that the United States considers to be
closely associated with these sanctioned countries or that are
considered terrorists or traffickers in either narcotics or
weapons of mass destruction. Furthermore, U.S. economic
sanctions forbid U.S. persons from circumventing direct
U.S. restrictions or from facilitating transactions by
non-U.S. persons
if those activities are forbidden to U.S. persons.
Penalties for violating provisions such as these can include
significant civil and criminal fines, imprisonment and loss of
tax credits or export privileges.
The Foreign Corrupt Practices Act of 1977, or the FCPA, as
amended by the Omnibus Trade and Competitiveness Act of 1988 and
the International Anti-Bribery and Fair Competition Act of 1998,
makes it a criminal offense for a U.S. corporation or other
U.S. domestic concern to make payments, gifts or give
anything of value directly or indirectly to foreign officials
for the purpose of obtaining or retaining business, or to obtain
any other unfair or improper advantage. In addition, the FCPA
imposes accounting standards and requirements on publicly traded
U.S. corporations and their foreign affiliates, which are
intended to prevent the diversion of corporate funds to the
payment of bribes and other improper payments, and to prevent
the establishment of “off books” slush funds from
which such improper payments can be made. We are also subject to
laws and regulations covering subject matter similar to that of
the FCPA that have been enacted by countries outside of the
United States. For example, the Convention on Combating Bribery
of Foreign Public Officials in International Business
Transactions was signed by the members of the Organization for
Economic Cooperation and Development and certain other countries
in December 1997. The Convention requires each signatory to
enact legislation that prohibits local persons and firms from
making payments to foreign officials for the purpose of
obtaining business or securing other unfair advantages from
foreign governments. Failure to comply with these laws could
subject us to, among other things, penalties and legal expenses,
which could harm our reputation and have a material adverse
effect on our business, financial condition and results of
operations.
Compliance with the myriad of export control laws of the various
jurisdictions in which we do business is a challenge for any
company involved in export activities within the nuclear and
defense end markets. We have compliance systems in our
U.S. and
non-U.S. subsidiaries
to identify those products and technologies that are subject to
export control regulatory restrictions and, where required, we
obtain authorization from relevant regulatory authorities for
sales to foreign buyers or for technology transfers to foreign
consultants, companies, universities or foreign national
employees. We also have a compliance system that is intended to
proactively address potential compliance issues including those
related to export control, trade sanctions and embargoes, as
well as anti-bribery situations, and we are implementing this
through such mechanisms as training, formalizing contracting
processes, performing diligence on agents and continuing to
improve our record-keeping and auditing practices with respect
to third-party relationships and otherwise. Thus far, as part
94
of our compliance system, for instance, we have developed a Code
of Ethics and Conduct that informs all of our employees of their
compliance obligations. Furthermore, we have developed an ethics
and conduct training program that all of our employees are
required to undertake, as well as other targeted compliance
training relevant to their position, such as specific FCPA
training for all of our worldwide controllers. Violations of any
of the various U.S. or
non-U.S. export
control laws can result in significant civil or criminal
penalties, or even loss of export privileges, as mentioned
above. We recognize that an effective compliance program can
help protect the reputation and relationship of a regulated
company with the regulatory agencies administering these laws
and regulations. In the United States, each of the regulatory
agencies administering these laws and regulations has a
voluntary disclosure program that offers the possibility of
significantly reduced penalties, if any are applicable, and we
intend to use these programs as part of our overall compliance
program, as necessary.
Backlog
and Deferred Contract Revenue
Total backlog represents committed but undelivered contracts and
purchase orders at period end. Backlog excludes
maintenance-related activity and agreements that do not
represent firm purchase orders. Customer agreements that contain
cancellation for convenience terms are generally not reflected
in backlog until firm purchase orders are received. Backlog is
not a complete measure of our future business due to these
customer agreements. Backlog can fluctuate significantly due to
the timing of large project awards. In addition, annual or
multi-year contracts are subject to rescheduling and
cancellation by customers due to the long-term nature of the
contracts.
Deferred contract revenue represents the prepayment of measuring
and monitoring services. The amounts are recorded as deferred
contract revenue in our balance sheets and represent customer
deposits invoiced in advance for services to be rendered over
the service period.
Information on backlog and deferred contract revenue follows (in
thousands):
| |
|
|
|
|
|
|
|
|
|
|
|
|
|
|
|
|
|
|
|
|
|
|
As of
|
|
|
|
|
As of June 30,
|
|
|
December 31,
|
|
|
|
|
2007
|
|
|
2008
|
|
|
2009
|
|
|
2009
|
|
|
|
|
Backlog
|
|
$
|
143,887
|
|
|
$
|
177,956
|
|
|
$
|
183,960
|
|
|
$
|
247,083
|
|
|
Deferred contract revenue
|
|
|
44,640
|
|
|
|
53,539
|
|
|
|
62,031
|
|
|
|
66,747
|
|
Furthermore, we anticipate that approximately 63% of our
December 31, 2009 total backlog will not be filled within
the current fiscal year.
Legal
Proceedings
From time to time, we are involved in various routine legal
proceedings. We cannot predict the outcome of these lawsuits,
legal proceedings and claims with certainty. Nevertheless, we
believe that the outcome of these proceedings, even if
determined adversely, would not have a material adverse effect
on our business, financial condition and results of operations.
Employees
As of December 31, 2009, we had 863 employees
worldwide, consisting of 140 employees in sales and
marketing, 420 in production, 165 in research and development
and 138 in general and administrative functions. Geographically,
we had 328 employees in North America, 531 in Europe and
four in Asia and other regions as of December 31, 2009. We
maintain both union and non-union workforces in the United
States, with unionized workforces comprising a small minority of
the overall U.S. employee base. As of December 31,
2009, 34
U.S.-based
employees, primarily located in Horseheads and Buffalo, New
York, were members of a union. Pursuant to applicable industrial
relations laws, our employees located in France and Germany were
represented by works councils, and our employees located in
France and Finland were represented by trade unions.
95
MANAGEMENT
The following table sets forth certain information with respect
to our executive officers and members of our Board of Directors:
| |
|
|
|
|
|
Name
|
|
Age
|
|
Position
|
|
|
|
Thomas D. Logan
|
|
49
|
|
President, Chief Executive Officer and Chairman of the Board
|
|
Jack A. Pacheco
|
|
50
|
|
Vice President and Chief Financial Officer
|
|
Seth B. Rosen
|
|
41
|
|
General Counsel, Vice President, Corporate Development, and
Secretary
|
|
W. Antony Besso
|
|
40
|
|
Regional Vice President, EMEA, and President, Health Physics
Division
|
|
Iain F. Wilson
|
|
47
|
|
Regional Vice President, Asia, and President, Sensing Systems
Division
|
|
Robert J. Klein(1)(2)(3)(4)
|
|
45
|
|
Director
|
|
Dustin G. Smith
|
|
33
|
|
Director Nominee
|
|
Brian S. Graff
|
|
44
|
|
Director Nominee
|
|
Michael T. Everett
|
|
60
|
|
Director Nominee
|
|
Earl R. Lewis
|
|
66
|
|
Director Nominee
|
|
Alfred E. Barry, Jr.
|
|
54
|
|
Director Nominee
|
|
|
|
|
(1) |
|
ACAS-designated representative. |
| |
|
(2) |
|
Member of the Nominating and Corporate Governance Committee. |
| |
|
(3) |
|
Member of the Audit Committee. |
| |
|
(4) |
|
Member of the Compensation Committee. |
Thomas D. Logan has been our President, Chief
Executive Officer and Chairman of the Board since our formation
in December 2005. From 2004 to 2007, Mr. Logan served as
CEO for Global Dosimetry Solutions, one of our predecessor
companies and currently a subsidiary of ours. Mr. Logan has
more than 22 years of energy industry experience. In
addition, he has nine years of experience within the contract
manufacturing and consumer products industries. Mr. Logan
holds a Bachelor of Science degree and a Master of Business
Administration degree from Cornell University.
Jack A. Pacheco has served as our Vice President
and Chief Financial Officer since March 2008. From 2004 to 2008,
Mr. Pacheco served as Chief Financial Officer of Smart
Modular Technologies, a public company listed on the NASDAQ
stock exchange. From 2001 to 2004, Mr. Pacheco served as
Chief Financial Officer for Ignis Optics, Inc., an optical
components startup acquired by Bookham Technology. He holds a
Master of Business Administration degree from Golden Gate
University and a Bachelor of Science degree in Business
Administration from Washington State University.
Seth B. Rosen is our General Counsel, Vice
President, Corporate Development, and Secretary, a position he
has held since January 2008. In 2007, Mr. Rosen served as a
business and legal consultant to a variety of existing and
startup businesses. From 2006 to 2007, he was CEO of Golden Gate
Energy Corporation, a solar energy startup company. From 1998 to
2006, he served as Senior Licensing Associate and then Principal
Licensing Associate at the Technology Transfer Department of
Lawrence Berkeley National Laboratory. From 1997 to 1998,
Mr. Rosen served as Corporate Counsel at Siebel Systems,
Inc. From 1994 to 1997, he was an associate at the law firm of
Baker & McKenzie. Mr. Rosen received his Juris
Doctor degree from Harvard Law School, his Master of Business
Administration from the joint program at the Haas School of
Business at the University of California at Berkeley and the
Graduate School of Business at Columbia University, and his
Bachelor of Arts from the University of California at Berkeley.
W. Antony Besso has been our Regional Vice
President, EMEA, and President, Health Physics Division since
February 2006. From 2004 to 2006, Mr. Besso acted as an
advisor and interim manager for private equity firms and
individual investors in a diverse range of industries. From 1996
to 2004, Mr. Besso held a
96
series of senior management positions in the global engineering
group ALSTOM SA. Mr. Besso was also a founding partner in
Advention Business Partners, a leading independent consulting
firm with operations in France, Germany and China.
Mr. Besso holds a Bachelor of Arts degree from Queen’s
University and a Master of Business Administration from
Dalhousie University.
Iain F. Wilson has served as our Regional Vice
President, Asia, and President, Sensing Systems Division since
our formation in December 2005. From 2000 to 2005,
Mr. Wilson was General Manager, Sensing Systems Group of
IST, one of our predecessor companies. Previously,
Mr. Wilson held numerous technical roles with IST, focused
principally in the areas of Quality Management, Engineering and
Plant Operations. He began his career as the Quality Manager for
GE Reuter Stokes, Canada. Mr. Wilson holds a Bachelor of
Science degree from Ryerson University, Toronto, Canada.
Mr. Wilson is a member of the American Nuclear Society.
Robert J. Klein has served as a Director since our
formation in December 2005. Mr. Klein has served as a
Managing Director and Senior Vice President of ACAS, our
principal stockholder, since 2004, where he leads the New York
private equity practice. From 2002 to 2004, he served as a
Principal of ACAS. Prior to joining ACAS, he was a Principal at
American Securities Capital Partners. Mr. Klein received a
Bachelor of Arts degree from Yale University and a Juris Doctor
degree from Stanford University Law School. Mr. Klein is an
ACAS-designated member of our Board of Directors.
Dustin G. Smith has been designated to serve as a
member of our Board of Directors upon the consummation of this
offering. Mr. Smith has served as a Principal and Vice
President in the Buyouts division of ACAS since July 2007 and
serves on the Board of Directors of Halt Medical, eLynx Holdings
and DelStar Technologies. Mr. Smith joined ACAS in 2004 as
an Associate and served as a Vice President from 2004 to 2007.
From 2002 to 2004, Mr. Smith was with Mezzanine Management,
a mezzanine and private equity fund specializing in growth
financings for middle-market companies. He is a graduate of
Georgetown University with both Bachelor of Science and Master
of Science degrees. Mr. Smith is an ACAS-designated member
of our Board of Directors.
Brian S. Graff has been designated to serve as a
member of our Board of Directors upon the consummation of this
offering. Mr. Graff has served as Senior Vice President of
ACAS since 2004 and as a Senior Managing Director since 2008.
From 2005 to 2008 he served as a Regional Managing Director of
ACAS and from 2004 to 2005 he served as a Managing Director of
ACAS. Mr. Graff also served as a Vice President and
Principal of ACAS from 2001 to 2004. From 2000 to 2001, he was a
Principal of Odyssey Investments Partners, a private equity
fund. Mr. Graff is an ACAS-designated member of our Board
of Directors.
Michael T. Everett has been designated to serve as
a member of our Board of Directors upon the consummation of this
offering. From May 2007 until his retirement in December 2008,
Mr. Everett served as a vice president of finance for Cisco
Systems. From April 2003 to May 2007, Mr. Everett was Chief
Financial Officer of WebEx Communications, Inc. From February
1997 to November 2000, Mr. Everett served as executive vice
president and Chief Financial Officer of Netro Corporation, a
wireless broadband access equipment provider. From August 1988
to August 1993, Mr. Everett served as senior vice president
and Chief Financial Officer of Raychem Corporation, a
telecommunications and electronics component manufacturer.
Before joining Raychem Corporation, Mr. Everett served as a
partner of Heller, Ehrman, White & McAuliffe LLC.
Mr. Everett serves as a director of Calix Networks, Inc.
and Broncus Technologies, Inc. Mr. Everett holds a Bachelor
of Arts degree from Dartmouth College and a Juris Doctor degree
from the University of Pennsylvania Law School.
Earl R. Lewis has been designated to serve as a
member of our Board of Directors upon the consummation of this
offering. Mr. Lewis has served as Chairman, President and
Chief Executive Officer of FLIR Systems, Inc. since
November 1, 2000. Prior to joining FLIR, Mr. Lewis
served in various capacities at Thermo Instrument Systems, Inc.,
with his last role as President and Chief Executive Officer.
Mr. Lewis is a member of the Board of Directors of Harvard
BioScience, NxStage Medical, Inc. and American DG Energy, Inc.
Mr. Lewis is a Trustee of Clarkson University and New
Hampton School. Mr. Lewis holds a Bachelor of Science
degree from Clarkson College of Technology and has attended
post-graduate programs at the University of Buffalo,
Northeastern University and Harvard University.
97
Alfred E. Barry, Jr. has been designated to
serve as a member of our Board of Directors upon the
consummation of this offering. Mr. Barry has served as
Principal of Al Barry Consulting LLC since October 2009.
Mr. Barry also currently serves as President of Stanlok
Corporation, an industrial components manufacturer, and as a
director of Wuxi REM Co., Ltd. From January 2008 to July 2009,
Mr. Barry served as a director of Standard Lock
Washer & Mfg. Co. Inc. From September 2001 until May
2007, Mr. Barry served as Chief Executive Officer of
Central Industrial Supply Co., Inc., a mechanical hardware
supplier for the computer server industry. Mr. Barry holds
a Bachelor of Science degree from Worcester Polytechnic
Institute, and Masters of Science degrees from Georgia Institute
of Technology.
Board
Structure and Compensation
The Bylaws that we will adopt upon the consummation of this
offering will provide that at least one of the directors
designated by ACAS must be part of the majority in any action
taken by our Board of Directors so long as ACAS and its
affiliated funds hold at least 50.1% of our outstanding common
stock, other than on matters in which ACAS has a conflict of
interest (as it would if it appointed a majority of our
directors). Our Bylaws will also provide that ACAS will have the
right to designate three of our seven directors so long as ACAS
and its affiliated funds hold at least 50.1% of our outstanding
common stock, two directors so long as they hold at least 25%
but less than 50.1% and one director so long as they hold at
least 10% but less than 25%.
Our Board of Directors currently consists of two members. Upon
the consummation of this offering, our Board of Directors will
consist of seven members and will be divided into three classes,
as follows:
|
|
|
| |
•
|
Class I, which will consist of Messrs. Logan and
Klein, and whose term will expire at our annual meeting of
stockholders to be held in 2010;
|
|
|
|
| |
•
|
Class II, which will consist of Messrs. Smith and
Everett, and whose term will expire at our annual meeting of
stockholders to be held in 2011; and
|
|
|
|
| |
•
|
Class III, which will consist of Messrs. Graff, Lewis
and Barry, and whose term will expire at our annual meeting of
stockholders to be held in 2012.
|
At each annual meeting of stockholders to be held after the
initial classification, the successors to directors whose terms
then expire will serve until the third annual meeting following
their election and until their successors are duly elected and
qualified.
Our Board of Directors has the following committees:
Audit
Committee
Upon the consummation of this offering, the Audit Committee
shall consist of Messrs. Everett, Lewis and Klein. We
intend to replace Mr. Klein with an independent director
prior to the date that is one year following the completion of
this offering. The Audit Committee reviews and, as it deems
appropriate, recommends to the Board of Directors our internal
accounting and financial controls and the accounting principles
and auditing practices and procedures to be employed in
preparation and review of our financial statements. The Audit
Committee also makes recommendations to the Board concerning the
engagement of independent public auditors and the scope of the
audit to be undertaken by such auditors. Mr. Everett shall
serve as chairperson of the Audit Committee.
Compensation
Committee
Upon the consummation of this offering, the Compensation
Committee shall consist of Messrs. Lewis, Klein, and Smith.
The Compensation Committee reviews and, as it deems appropriate,
recommends to the Board of Directors policies, practices and
procedures relating to the compensation of our officers and the
establishment and administration of employee benefit plans. The
Committee advises and consults with our officers as may be
requested regarding managerial personnel policies.
Mr. Lewis shall serve as chairperson of the Compensation
Committee.
98
Nominating
and Corporate Governance Committee
Upon the consummation of this offering, the Nominating and
Corporate Governance Committee shall consist of
Messrs. Klein, Smith and Graff. The Nominating and
Corporate Governance Committee reviews and, as it deems
appropriate, recommends to the Board of Directors policies and
procedures relating to director and board committee nominations
and corporate governance policies. Mr. Klein shall serve as
chairperson of the Nominating and Corporate Governance Committee.
Compensation
Committee Interlocks and Insider Participation
None of our executive officers currently serves, or in the past
year has served, as a member of the board of directors or
compensation committee of any entity that has one or more
executive officers serving on our Board of Directors or
Compensation Committee. Additional information concerning
transactions between us and entities affiliated with members of
the Compensation Committee is included in this prospectus under
the caption “Certain Relationships and Related Party
Transactions.”
Director
Compensation
During fiscal 2009, there was one non-employee director, Robert
J. Klein, who is affiliated with ACAS and received no
compensation for services as a member of either our Board of
Directors or of the Board’s Compensation Committee.
Mr. Logan’s compensation is reported below under the
Summary Compensation Table, and he did not receive separate
compensation for his service on our Board of Directors.
In connection with this offering, our Board of Directors will
adopt a compensation policy applicable to all directors who are
not employees of Mirion and who are not affiliated with ACAS. We
expect that the initial compensation policy will provide that
each such director will receive the following compensation:
|
|
|
| |
•
|
an annual cash retainer of $50,000 for serving on the board;
|
|
|
|
| |
•
|
an annual cash retainer of $10,000 for serving as the
Chairperson of the Audit Committee and of $5,000 for serving as
the Chairperson of each of the Compensation Committee and the
Nominating and Corporate Governance Committee; and
|
|
|
|
| |
•
|
upon first joining the board, an initial grant of an option to
purchase 1,000 shares of our common stock, and thereafter
an annual grant of an option to purchase 333 shares of our
common stock, with each such option vesting over a four-year
period and subject to accelerated vesting in the event of a
change in control.
|
Directors who are employees of Mirion or its subsidiaries or
affiliated with ACAS will receive no compensation for services
as members of either our Board of Directors or committees.
We will reimburse all directors for reasonable expenses incurred
to attend meetings of our Board of Directors or committees.
Code of
Ethics and Conduct
On June 12, 2008, our Board of Directors adopted a revised
Code of Ethics and Conduct that establishes the standards of
ethical conduct applicable to all of our directors, officers and
employees. The Code of Ethics and Conduct (the “Code of
Conduct”) addresses, among other things, competition and
fair dealing, conflicts of interest, financial matters and
external reporting, company funds and assets, confidentiality
and corporate opportunity requirements and the process for
reporting violations of the Code of Conduct, employee
misconduct, conflicts of interest or other violations.
In connection with this offering, our Board of Directors will
adopt a revised code of ethics that revises the process for
reporting violations of the Code of Conduct, employee
misconduct, conflicts of interest or other violations to conform
with applicable legal requirements of the United States and the
other jurisdictions in which Mirion operates.
Our Code of Conduct will be publicly available on our website at
www.mirion.com. Any waiver of the Code of Conduct with respect
to any of our executive officers or directors may only be
granted by the Board of Directors and must be disclosed to our
stockholders.
99
EXECUTIVE
COMPENSATION
Compensation
Discussion and Analysis
The following discussion specifically relates to the
compensation for fiscal 2009 of our “named executive
officers” set forth in the Summary Compensation Table
below, as well as discussing the overall principles underlying
our executive compensation policies and decisions.
Objectives
of Executive Compensation Program
The objectives of our executive compensation program are to
recruit and retain an executive management team with the skills
necessary to achieve our business objectives and thereby create
value for our stockholders. Our executive compensation program
is designed to support key business goals, such as integrating
acquired businesses and retaining key executives, that are
particularly important to us as a company with a limited
operating history.
We implement this program through a combination of fixed cash
compensation, variable short-term incentive compensation
(determined by our operating performance as well as achievement
of individual annual performance objectives), and equity
incentives designed to reward long-term performance and align
interests of our executive officers with our stockholders.
As a company whose equity was not publicly traded before this
offering, our compensation philosophy has focused on the
achievement of performance objectives that we believe would
deliver meaningful return to our investors through a public
offering or a sale of our company. In connection with this
offering, we have reviewed our compensation philosophy and
expect to adopt a compensation philosophy and objectives that
are generally more consistent with those of a public, rather
than private, company.
Executive
Compensation Program
Our compensation program reflects our stage of development as a
company. We have a limited operating history. We were
incorporated in October 2005 and consist of a series of earlier
acquisitions of geographically and technologically diverse
companies. We have recruited several of our executive officers
from other employers, and our initial compensation for these
officers generally reflects the outcome of negotiated
recruitment and hiring process.
As a company with a limited operating history, retention of
executive officers is a key business objective. Weathering
undesirable personnel changes would be more difficult for us
than for a more established company. Accordingly, our Board of
Directors believes it is critical to pay sufficient base
compensation and provide adequate incentives to our executive
officers to ensure continuity of our management team.
The Compensation Committee of the Board of Directors was
established in July 2006. During fiscal 2009, Mr. Robert
Klein was the sole member of the Compensation Committee. Our
current executive compensation policies and objectives were
developed and implemented by the Compensation Committee while we
were a private company. The Compensation Committee has allocated
compensation between long-term and short-term, between cash and
non-cash compensation and among different forms of non-cash
compensation in a manner considered to be typical of a private
equity-backed enterprise. Our compensation program has focused
on offering incentives necessary to recruit and retain
executives from diverse backgrounds who possess the skills
necessary to achieve our business objectives. We have not
adopted any formal or informal policies or guidelines for
allocating compensation between long-term and short-term
compensation, between cash and non-cash compensation or among
different forms of non-cash compensation.
Since the inception of the Compensation Committee, it has sought
to review our executive officers’ compensation packages at
least annually to determine whether they provide adequate
incentives to achieve our business goals. In evaluating the
market, the Compensation Committee has relied generally on its
experience as well as market feedback and experience derived
inherently from the process of recruiting new executives to our
team. Our Chief Executive Officer recommends to the Compensation
Committee compensation allocations
100
for our named executive officers other than himself. The
Compensation Committee sets the compensation for our Chief
Executive Officer.
During fiscal 2009, the Compensation Committee of our Board of
Directors engaged The Hay Group as an outside compensation
consultant to undertake a review of director and executive
officer compensation trends in the regions in which we operate
and at comparable public and private companies for the purpose
of providing recommendations with respect to future Compensation
arrangements for both executive officers and directors. The Hay
Group has provided the Compensation Committee with an assessment
of executive officer compensation and we expect that a
“third-party
compensation consultant” will provide recommendations with
respect to future compensation arrangements for both executive
officers and directors. The Hay Group has not provided us with
any other services beyond the scope of this engagement.
Elements
of Compensation
The following describes each element of our executive
compensation program and discusses determinations regarding
compensation for fiscal 2009:
Base Compensation. Our Compensation Committee
sets named executive officer base salaries based on the skills,
experience and scope of responsibilities of each executive. Our
Compensation Committee reviews base salaries at least annually.
Base salaries are adjusted from time to time to reflect each
executive’s overall contribution and to conform salaries to
the compensation committee’s views of market levels. Our
Compensation Committee has relied primarily on its experience to
negotiate base salaries. Our named executive officers’ base
salaries were determined initially in the context of negotiated
employment agreements. The Compensation Committee agreed to
increase the base compensation of our Chief Executive Officer as
of January 1, 2009 to $325,000 to be closer to what it
believes to be an appropriate level for a company preparing for
an initial public offering, to $400,000 on the date of the
initial public offering to reflect the significant increase in
responsibilities of a chief executive officer of a public
company and to $450,000 on the one-year anniversary of the
initial public offering. With respect to our other named
executive officers, we did not make material changes to base
compensation during fiscal 2009. The Compensation Committee
determined these amounts primarily based on its experience with
other private and public companies, as well as its experience in
determining pay levels required to recruit individuals in
similar roles. Although the Compensation Committee engaged the
Hay Group to undertake a review that included an assessment of
the compensation of the Chief Executive Officer, the
Compensation Committee did not make material changes based on
this review and did not target base compensation to a
specific percentile within a comparative group.
Annual Incentive Bonuses. Our executive bonus
program provides for executives to receive a bonus based on the
following factors:
|
|
|
| |
•
|
the achievement of financial and operational goals for the
fiscal year;
|
| |
| |
•
|
commitment to future growth in revenue and earnings for the
subsequent fiscal year in the financial forecast approved by our
Board of Directors upon recommendation of our Chief Executive
Officer; and
|
| |
| |
•
|
achievement of individual annual performance objectives.
|
Annual performance objectives are approved by the Compensation
Committee as part of the Board of Director’s review of our
prior fiscal year financial results. Our Chief Executive Officer
makes recommendations to our Compensation Committee regarding
individual performance objectives and awards for named executive
officers other than himself. Performance objectives and awards
for our Chief Executive Officer are determined solely by the
Compensation Committee. The Compensation Committee retains full
discretion to determine the final bonus amounts and does not
rely solely on our financial results. For fiscal 2009, the total
potential bonus pool is calculated based on achievement of the
financial goals, as further described below. Then payment of the
bonus pool is allocated as follows:
|
|
|
| |
•
|
50% of the bonus pool is paid based solely on this achievement
of Adjusted EBITDA and working capital, as described below;
|
101
|
|
|
| |
•
|
25% of the bonus pool is paid based on attainment of personal
objectives; and
|
| |
| |
•
|
25% of the bonus pool is paid based on financial objectives
specified in the following year’s plan.
|
For fiscal 2009, the Compensation Committee specified that the
financial goal would be achievement of Adjusted EBITDA (or, for
named executive officers who are division presidents, Adjusted
EBITDA for the applicable division), subject to a percentage
increase or decrease based on our goal of decreasing working
capital requirements. We calculate Adjusted EBITDA as net income
(loss), less extraordinary gains and losses and interest income,
plus interest expense, charges against income for taxes,
depreciation expense, amortization expense, non-recurring
charges, management fees paid to ACFS and all non-cash
compensation expenses. For more information about the
calculation of Adjusted EBITDA and a reconciliation to cash
provided by (used in) operating activities, see page 8 of this
prospectus. Adjusted EBITDA results are not set forth in our
audited financial statements and our calculations of these goals
as a private company may differ from actual audited results. For
purposes of the bonus plan, the determination of Adjusted EBITDA
is made on a currency-adjusted basis, so although the
calculation is derived from our audited result, the numbers will
not be the same as the audited result. Although we expect the
financial results to require improved performance and
exceptional work each year, the goals are set to be consistent
with our business plan objectives and to be achievable. For
fiscal 2009, the potential bonus pool percentage set forth in
the table below is increased or decreased by up to 30% depending
on how the change in our working capital (generally defined for
this purpose as accounts receivable plus inventory, minus the
sum of accounts payable and non-financial accrued liabilities)
compares to our percentage increase in revenue. That is, if
there was a 20% or greater increase in working capital versus
revenue, the bonus pool would be decreased by 30%; if there was
between a 10% increase and 10% decrease in working capital
versus revenue, there would be no change in the bonus pool; and
if there was a 20% or greater decrease in working capital versus
revenue, the bonus pool would be increased by 30%.
Each named executive officer was given a target bonus (expressed
as a percentage of base salary), with a minimum threshold and
maximum target bonus based on financial goal performance (prior
to any working capital adjustment). The following table shows
the target bonus pool amounts for each of our named executive
officers for different levels of achievement of the Adjusted
EBITDA financial target (which for fiscal 2009 ranged from
approximately $35 million to $42.8 million):
| |
|
|
|
|
|
|
|
|
|
|
|
|
|
|
|
|
|
|
|
Below
|
|
|
90%
|
|
|
100%
|
|
|
110%
|
|
|
|
|
Threshold
|
|
|
Target
|
|
|
Target
|
|
|
Target or Above
|
|
|
|
|
Thomas D. Logan
|
|
$
|
0
|
|
|
|
25% salary
|
|
|
|
50% salary
|
|
|
|
100% salary
|
|
|
Jack A. Pacheco
|
|
$
|
0
|
|
|
|
25% salary
|
|
|
|
50% salary
|
|
|
|
100% salary
|
|
|
Seth B. Rosen
|
|
$
|
0
|
|
|
|
25% salary
|
|
|
|
40% salary
|
|
|
|
80% salary
|
|
For each division president, target levels were based on
Adjusted EBITDA for the particularly business unit for which he
is responsible (the Health Physics Division for Mr. Besso
and the Sensing Systems Division for Mr. Wilson):
| |
|
|
|
|
|
|
|
|
|
|
|
|
|
|
|
|
|
|
|
Below
|
|
|
$1.5 MM
|
|
|
100%
|
|
|
$1.5 MM
|
|
|
|
|
Threshold
|
|
|
Below Plan
|
|
|
Target
|
|
|
Above Plan
|
|
|
|
|
W. Antony Besso
|
|
$
|
0
|
|
|
|
40% salary
|
|
|
|
50% salary
|
|
|
|
60% salary
|
|
|
Iain F. Wilson
|
|
$
|
0
|
|
|
|
25% salary
|
|
|
|
40% salary
|
|
|
|
80% salary
|
|
Although the determination of our financial performance is an
important factor in approving the actual bonus payment, our
Compensation Committee believes it is preferable to retain
discretion to determine awards (including above or below the
amounts in the table above) based on qualitative and
quantitative contributions of our named executive officers.
After determining our success during fiscal 2009 in achieving
the financial goals described above, the Compensation Committee
reviewed each named executive officer’s achievement of
individual annual performance objectives and addition of
long-term value, particularly in carrying out our integration
plan and positioning us for this offering. Many of the
individual performance objectives are subjectively determined,
but for any individual executive officer, each performance
objective generally carries the same weight as other objectives.
The individual objectives vary because they are specific for
each executive officer’s particular
102
functions. For example, for fiscal 2009: Mr. Logan’s
objectives included steps preparing for our initial public
offering as well as commercializing and repositioning specific
business lines and products; Mr. Pacheco’s goals
focused on audit objectives as well as reduction of working
capital; Mr. Rosen’s objectives focused on legal
preparation for an initial public offering and implementing
internal systems; Mr. Besso’s goals mainly related to
specific products and business lines for which he is
responsible; and Mr. Wilson’s goals included
developing and implementing business unit strategies in
particular locations.
In September 2009, the Compensation Committee determined
performance results for fiscal 2009 and awarded bonuses in the
amounts set forth under “Non-Equity Incentive Plan
Compensation” in the Summary Compensation Table below. In
determining the amount of the bonuses for the year, the
Committee first reviewed our financial results. Our Adjusted
EBITDA results exceeded our maximum target level at the
corporate level and for our Sensing Systems division, so the
potential bonus pool for Messrs. Logan, Pacheco, Rosen and
Wilson was the maximum amount in the table above. Mr.
Besso’s potential bonus pool was between his target and
maximum level. There was no working capital adjustment at the
corporate level, but each of Mr. Besso and Mr. Wilson achieved
the maximum working capital goals for their divisions, and so
their potential bonus pools were increased by 30% above the
amounts in the table above. The Committee then reviewed each
named executive officer’s individual performance
objectives, some of which require a subjective determination.
After this review, each of our chief executive officer, chief
financial officer and general counsel received a bonus greater
than his target bonus and received, on average, approximately
80% of the “maximum” bonus set forth in the table
above. Each of Mr. Besso and Mr. Wilson received a bonus greater
than their “maximum” bonus set forth in the table
above because of the upward working capital adjustment for each
of their divisions.
In approving payment of these particular amounts for each
executive officer, the Compensation Committee considered the
following successful individual performance factors:
|
|
|
| |
•
|
Mr. Logan: Preparation for the initial public
offering by developing MD&A and presenting a plan for the
public company’s board composition and recruitment;
commercialization of new products; and leadership training.
|
|
|
|
| |
•
|
Mr. Pacheo: Development of MD&A; implementing
new financial planning systems; and review of tax structure.
|
|
|
|
| |
•
|
Mr. Rosen: Preparation and support of corporate
document data room for the initial public offering; leadership
training; and implementation of management bonus program and
evaluation process for the general employee population.
|
|
|
|
| |
•
|
Mr. Besso: Organizational improvements in his
business unit’s sales, marketing and finance functions;
reduction of working capital for his business unit; and
completion of operational efficiency projects.
|
|
|
|
| |
•
|
Mr. Wilson: Achievement of product designs and
proposals; reduction of working capital for his business unit;
commercialization of new products; and organizational
improvements and planning.
|
Going forward, the type of financial performance target we use,
and individual performance objectives, may change if our
Compensation Committee determines it would be appropriate to use
different types of goals as a public company, although for
fiscal 2010 we expect to use the same types of financial goals.
In addition, we will pay bonuses to some of our employees,
including certain executive officers, if and when this initial
public offering is completed. Mr. Logan will be eligible to
receive a bonus of $125,000 and Mr. Besso will be eligible
to receive a bonus of up to $507,509. The amount of
Mr. Besso’s bonus was negotiated with him in
conjunction with efforts to retain him by fulfilling an earlier
commitment to him and as a supplement to his stock options,
which also vest on an initial public offering.
Equity Awards. We design our equity programs
to align employees’ interests with those of our
stockholders by offering employees the opportunity to acquire
stock and therefore have a direct interest in helping to
increase the value of our stock. The design of these equity
incentives is typical of the Compensation Committee’s
experience with a private equity-backed enterprise. To date, we
have granted stock options to our executive officers and a
limited group of other employees. Stock options permit the
employee
103
to exercise the option at a fixed price (at or above the fair
market value of the stock on the grant date) in the future after
the option has become vested. Grants typically are made around
the time an employee is hired, and we may make additional grants
following a significant change in job responsibilities or to
meet other specific retention objectives. Our Compensation
Committee determines the size and type of equity awards taking
into account the recommendations of management and also
determines the vesting schedule of the options. The terms of
initial equity grants made to each named executive upon joining
the company are based primarily on competitive conditions
applicable to the executive officers’ specific position. We
made the equity awards reflected in the compensation tables
below primarily in the context of negotiated employment
agreements. As a private company, the overall size of our option
pool was based on a range of potential dilution levels
historically used by our majority stockholder with its other
private companies. The chief executive officer receives the
largest share of the option pool because he has the most
significant impact on value. Other executive officers’
option amounts were then determined, although individual
allocations were not based on a specific formula or value.
Instead, the number of options depended on a combination of
share availability in the option pool, negotiations at the time
of offering employment to a new officer, the Compensation
Committee’s expectation for the officer’s potential
impact on future value of our company and the past experience of
the Compensation Committee. We have not currently adopted stock
ownership or equity grant guidelines, but we may implement
guidelines regarding the issuance of new equity awards in the
future.
Severance and Change in Control
Arrangements. Each of our named executive
officers, with the exception of Mr. Wilson, has an
employment agreement that would provide severance on specified
involuntary terminations of employment. We have also agreed to
accelerated vesting of Messrs. Logan’s and
Pacheco’s stock options in the event of certain change in
control events and of Mr. Besso in the event of this
initial public offering or a change in control. The terms and
estimated amounts of these benefits are described below under
“Employment Agreements and Potential Payments upon
Termination or Change in Control.” Based on the past
experience of the Compensation Committee, we believe these
arrangements are competitive with arrangements offered to senior
executives by companies with whom we compete for executives and
are necessary to the achievement of our business objective of
management retention. Given our limited operating history, our
Compensation Committee believes these provisions were a key part
of hiring and retaining management to ensure continuity of our
management team.
Perquisites and Other Benefits. Our named
executive officers are eligible to participate in our employee
benefit plans provided for employees which vary by country. In
the United States, these benefits include a 401(k) plan with a
matching contribution, group medical and dental insurance, group
life insurance and short- and long-term disability insurance. As
set forth in the Summary Compensation Table below,
Messrs. Besso and Wilson receive specified benefits that
are typical for executives in their locations, or required by
law, but these additional benefits are limited in amount and
scope.
Tax and Accounting Considerations. We
recognize a charge to earnings for accounting purposes for
equity awards granted. As we become a public company, we expect
that the Compensation Committee will consider the accounting
impact of equity awards in addition to consider the impact to
dilution and overhang when deciding on amounts and terms of
equity grants. We do not require executive compensation to be
tax deductible for us, but instead balance the cost and benefits
of tax deductibility to comply with our executive compensation
goals, including the potential future effects of
Section 162(m) of the Internal Revenue Code on the
compensation paid to our executive officers. Section 162(m)
disallows a tax deduction for any publicly held company for
individual compensation exceeding $1 million in any taxable
year for our Chief Executive Officer and each of the other named
executive officers (other than our Chief Financial Officer),
unless the compensation is performance-based.
104
Summary
Compensation Table
The following table sets forth information concerning the
compensation of our Chief Executive Officer, Chief Financial
Officer and three other most highly compensated executive
officers for fiscal 2009. We refer to these individuals as our
“named executive officers” elsewhere in this
prospectus.
| |
|
|
|
|
|
|
|
|
|
|
|
|
|
|
|
|
|
|
|
|
|
|
|
|
|
|
|
|
|
|
|
|
|
|
|
|
|
|
|
|
|
|
|
Non-Equity
|
|
|
|
|
|
|
|
|
|
|
|
|
|
|
|
|
|
|
|
Option
|
|
|
Incentive Plan
|
|
|
All Other
|
|
|
|
|
|
|
|
|
|
|
Salary
|
|
|
Bonus
|
|
|
Awards
|
|
|
Compensation
|
|
|
Compensation
|
|
|
Total
|
|
|
Name and Principal Position
|
|
Fiscal Year
|
|
|
($)
|
|
|
($)
|
|
|
($)(1)
|
|
|
($)
|
|
|
($)
|
|
|
($)
|
|
|
|
|
Thomas D. Logan
President, Chief
Executive Officer and Chairman
|
|
|
2009
|
|
|
|
312,473
|
|
|
|
—
|
|
|
|
—
|
|
|
|
251,094(2
|
)
|
|
|
36,884
|
(3)
|
|
|
600,451(2
|
)
|
|
Jack A. Pacheco
Vice President and Chief Financial Officer
|
|
|
2009
|
|
|
|
278,000
|
|
|
|
—
|
|
|
|
198,870
|
|
|
|
199,813(2
|
)
|
|
|
6,906
|
(3)
|
|
|
683,589(2
|
)
|
|
Seth B. Rosen
General Counsel,
Vice President Corporate
Development, and
Secretary
|
|
|
2009
|
|
|
|
232,000
|
|
|
|
—
|
|
|
|
100,698
|
|
|
|
154,667(2
|
)
|
|
|
6,853
|
(3)
|
|
|
494,218(2
|
)
|
|
W. Antony Besso(4)
Regional Vice
President, EMEA and
President, Health Physics
Division
|
|
|
2009
|
|
|
|
303,861
|
|
|
|
—
|
|
|
|
215,080
|
|
|
|
184,586(2
|
)
|
|
|
62,806
|
(3)
|
|
|
766,333(2
|
)
|
|
Iain F. Wilson(4)
Regional Vice President, Asia and President,
Sensing Systems Division
|
|
|
2009
|
|
|
|
185,726
|
|
|
|
—
|
|
|
|
71,629
|
|
|
|
204,298(2
|
)
|
|
|
16,749
|
(3)
|
|
|
478,402(2
|
)
|
|
|
|
|
(1) |
|
The amounts in this column reflect the dollar amount of
compensation cost recognized for financial statement reporting
purposes for fiscal 2009 in accordance with FASB-issued
authoritative guidance on stock-based payment with respect to
stock options that have been granted, whether or not the awards
were granted during fiscal 2009. Pursuant to SEC rules, the
amounts shown exclude the impact of estimated forfeitures
related to service-based vesting conditions. For information on
the valuation assumptions, see Note 14 to our consolidated
financial statements. See the Grants of Plan-Based Awards Table
below for additional information on the stock options granted in
fiscal 2009. |
|
|
|
|
(2) |
|
Represents payments under our executive bonus program for
performance during fiscal 2009, as described above under
Compensation Discussion and Analysis. |
| |
|
(3) |
|
Includes our matching 401(k) contributions for the following
named executive officers’ accounts in the following
amounts: Mr. Logan ($5,702), Mr. Pacheco ($6,906) and
Mr. Rosen ($6,853). For Mr. Logan, the amount also
includes car allowance ($9,217) and amounts paid for accrued
vacation above the maximum accrual limit ($21,965) under our
annual vacation cashout policy for executive officers. For
Mr. Besso, the amount consists of his car allowance
($6,259), an allowance for travel ($8,670), child school
allowance ($13,743), a housing allowance ($24,050) which was
discontinued in February 2009 and private unemployment insurance
($10,083). For Mr. Wilson, this amount consists of car
allowance ($5,183) and contributions to his Registered
Retirement Savings Plan, a defined contribution plan in Canada
($7,280) and vacation pay ($4,286). |
105
|
|
|
|
(4) |
|
Mr. Besso’s compensation, which is paid in euros, and
Mr. Wilson’s compensation, which is paid in Canadian
dollars, have been converted into U.S. dollars using the
respective average rate of exchange for the fiscal year. |
Grants of
Plan-Based Awards for Fiscal 2009
The following table sets forth information concerning grants of
plan-based awards made to the executive officers named in the
Summary Compensation Table during fiscal 2009.
| |
|
|
|
|
|
|
|
|
|
|
|
|
|
|
|
|
|
|
|
|
|
|
|
|
|
|
|
|
|
|
|
|
|
|
|
|
|
|
|
|
|
|
|
All Other
|
|
|
|
|
|
|
|
|
|
|
|
|
|
|
|
|
|
|
|
|
|
|
Option
|
|
|
|
|
|
|
|
|
|
|
|
|
|
Estimated Future
|
|
|
Awards:
|
|
|
|
|
|
|
|
|
|
|
|
|
|
Payouts Under
|
|
|
Number of
|
|
|
Exercise
|
|
|
Grant Date
|
|
|
|
|
|
|
|
Non-Equity Incentive
|
|
|
Securities
|
|
|
Price
|
|
|
Fair Value
|
|
|
|
|
|
|
|
Plan Awards(1)
|
|
|
Underlying
|
|
|
of Option
|
|
|
of Option
|
|
|
|
|
Grant
|
|
|
Threshold
|
|
|
Target
|
|
|
Maximum
|
|
|
Options
|
|
|
Awards
|
|
|
Awards
|
|
|
Name
|
|
Date
|
|
|
($)
|
|
|
($)
|
|
|
($)
|
|
|
(#)
|
|
|
($/Sh)
|
|
|
($)(2)
|
|
|
|
|
Thomas D. Logan
|
|
|
08/05/08
|
|
|
|
78,118
|
|
|
|
156,237
|
|
|
|
312,473
|
|
|
|
|
|
|
|
|
|
|
|
|
|
|
Jack A. Pacheco
|
|
|
08/05/08
|
|
|
|
69,500
|
|
|
|
139,000
|
|
|
|
278,000
|
|
|
|
|
|
|
|
|
|
|
|
|
|
|
Seth B. Rosen
|
|
|
08/05/08
|
|
|
|
58,000
|
|
|
|
92,800
|
|
|
|
185,600
|
|
|
|
|
|
|
|
|
|
|
|
|
|
|
|
|
|
08/05/08
|
|
|
|
|
|
|
|
|
|
|
|
|
|
|
|
2,000
|
|
|
|
144.95
|
|
|
|
99,400
|
|
|
W. Antony Besso(3)
|
|
|
08/05/08
|
|
|
|
120,635
|
|
|
|
150,794
|
|
|
|
180,953
|
|
|
|
|
|
|
|
|
|
|
|
|
|
|
|
|
|
08/05/08
|
|
|
|
|
|
|
|
|
|
|
|
|
|
|
|
12,731
|
|
|
|
144.95
|
|
|
|
598,742
|
|
|
Iain F. Wilson(3)
|
|
|
08/05/08
|
|
|
|
46,431
|
|
|
|
74,290
|
|
|
|
148,580
|
|
|
|
|
|
|
|
|
|
|
|
|
|
|
|
|
|
08/05/08
|
|
|
|
|
|
|
|
|
|
|
|
|
|
|
|
5,000
|
|
|
|
144.95
|
|
|
|
248,499
|
|
|
|
|
|
(1) |
|
Threshold, Target and Maximum amounts refer to the annualized
eligible bonus for each named executive officer if specified
financial performance criteria were met, as more fully discussed
above in the “Compensation Discussion and Analysis”
and below under “Executive Bonus Program.” The actual
annual performance bonus payable is subject to determination by
the Compensation Committee after a review of the financial
performance of Mirion or the applicable business unit, as well
as each named executive officer’s achievement of their
individual annual performance objectives, which may result in a
higher or lower actual bonus payment. See “Compensation
Discussion and Analysis—Elements of Compensation.”
Actual amounts paid for fiscal 2009 are set forth in the Summary
Compensation Table above. |
|
|
|
|
(2) |
|
The amounts in this column represent the grant date fair value,
computed in accordance with FASB-issued authoritative guidance
on stock-based payment of each option granted to the named
executive officer in fiscal 2009. For information on valuation
assumptions, see Note 14 to our consolidated financial
statements. |
|
|
|
|
(3) |
|
Converted into U.S. dollars using the average rate of exchange
for the fiscal year. |
Executive Bonus Program. As further described
in the Compensation Discussion and Analysis above, the awards
for fiscal 2009 were first determined on our corporate Adjusted
EBITDA performance (or business segment for each of
Messrs. Besso and Wilson) and working capital, but are also
subject to determination of individual performance and other
factors. Each of the executive bonus awards would be 0% of base
salary if the performance level was below a specified threshold
of performance. Between the threshold level and target level,
and between the target level (payable if 100% of plan was
achieved) and the maximum level, amounts would be interpolated.
The Compensation Committee retains discretion to pay amounts
over the maximum level for exceptional performance. Each
executive officer’s target bonus amount is set as a
percentage of base salary, with target amounts for fiscal 2009
of 50% of base salary for Messrs. Logan, Pacheco and Besso
and 40% of base salary for Messrs. Rosen and Wilson.
106
Outstanding
Equity Awards at Fiscal Year-End June 30, 2009
The following table sets forth information concerning
unexercised stock options for the executive officers named in
the Summary Compensation Table as of the end of fiscal 2009.
There were no unvested stock awards outstanding as of the end of
the fiscal year.
| |
|
|
|
|
|
|
|
|
|
|
|
|
|
|
|
|
|
|
|
|
|
|
|
Option Awards
|
|
|
|
|
|
|
|
|
|
|
Number of
|
|
|
|
|
|
|
|
|
|
|
Numbers of
|
|
|
Numbers of
|
|
|
Securities
|
|
|
|
|
|
|
|
|
|
|
Securities
|
|
|
Securities
|
|
|
Underlying
|
|
|
|
|
|
|
|
|
|
|
Underlying
|
|
|
Underlying
|
|
|
Unexercised
|
|
|
Option
|
|
|
|
|
|
|
|
Unexercised
|
|
|
Unexercised
|
|
|
Unearned
|
|
|
Exercise
|
|
|
Option
|
|
|
|
|
Options (#)
|
|
|
Options (#)
|
|
|
Options
|
|
|
Price
|
|
|
Expiration
|
|
|
Name
|
|
Exercisable
|
|
|
Unexercisable
|
|
|
(#)
|
|
|
($)
|
|
|
Date
|
|
|
|
|
Thomas D. Logan
|
|
|
14,564
|
|
|
|
|
|
|
|
|
|
|
|
88.75
|
|
|
|
1/1/16
|
|
|
|
|
|
17,750
|
(1)
|
|
|
—
|
|
|
|
54,564
|
(1)
|
|
|
88.75
|
|
|
|
8/18/14
|
|
|
Jack A. Pacheco
|
|
|
5,328
|
(2)
|
|
|
10,672
|
(2)
|
|
|
|
|
|
|
111.30
|
|
|
|
3/31/18
|
|
|
Seth B. Rosen
|
|
|
3,006
|
(3)
|
|
|
4,994
|
(3)
|
|
|
|
|
|
|
138.58
|
|
|
|
1/7/18
|
|
|
|
|
|
—
|
|
|
|
2,000
|
(4)
|
|
|
|
|
|
|
144.95
|
|
|
|
8/5/18
|
|
|
W. Antony Besso
|
|
|
—
|
|
|
|
12,731
|
(5)
|
|
|
|
|
|
|
144.95
|
|
|
|
8/5/18
|
|
|
Iain F. Wilson
|
|
|
1,837
|
|
|
|
—
|
|
|
|
|
|
|
|
88.75
|
|
|
|
1/1/16
|
|
|
|
|
|
1,837
|
|
|
|
—
|
|
|
|
|
|
|
|
88.75
|
|
|
|
1/1/16
|
|
|
|
|
|
484
|
(6)
|
|
|
841
|
(6)
|
|
|
|
|
|
|
121.24
|
|
|
|
9/6/17
|
|
|
|
|
|
—
|
|
|
|
5,000
|
(4)
|
|
|
|
|
|
|
144.95
|
|
|
|
8/5/18
|
|
|
|
|
|
(1) |
|
These options were not granted by us, and represent options to
purchase shares of Mirion stock from ACAS and its affiliates.
The unearned portion of these options is subject to performance
and market vesting following this initial public offering, as
described further under “Certain Relationships and Related
Party Transactions—Interested
Transactions—Transactions with Management.” |
|
|
|
|
(2) |
|
Options vest in equal monthly installments over four years from
March 31, 2008. |
| |
|
(3) |
|
Options vest in equal monthly installments over four years from
January 7, 2008. |
| |
|
(4) |
|
25% of options vest on August 5, 2009, and thereafter the
remaining 75% of options vest in equal monthly installments over
three years. |
| |
|
(5) |
|
25% of options vest on August 5, 2009, and thereafter the
remaining 75% of options vest in equal quarterly installments
over three years. |
| |
|
(6) |
|
Options vest in equal monthly installments over five years from
September 6, 2007. |
Option
Exercises and Stock Vested for Fiscal 2009
No executive officers named in the Summary Compensation Table
above exercised any stock options, or had any stock award become
vested, during fiscal 2009.
Pension
Benefits
Upon his retirement, Mr. Besso will be eligible for
benefits under a mandatory French pension system, and we will
pay Mr. Besso a lump-sum length of service award at his
retirement based on his years of service and salary.
| |
|
|
|
|
|
|
|
|
|
|
|
|
|
|
|
|
|
|
|
|
|
|
|
|
|
|
Number of
|
|
|
Present Value
|
|
|
Payments
|
|
|
|
|
|
|
|
|
|
|
Years of
|
|
|
of Accumulated
|
|
|
During
|
|
|
|
|
|
Name
|
|
Plan Name
|
|
|
Credited Service
|
|
|
Benefits
|
|
|
Last Fiscal Year
|
|
|
|
|
|
|
|
W. Antony Besso
|
|
|
French pension system
|
|
|
|
3
|
|
|
$
|
5,978
|
(1)
|
|
|
—
|
|
|
|
|
|
|
|
|
|
(1) |
|
This amount has been converted from euros into U.S. dollars
using the average rate of exchange for the fiscal year. For
information on the valuation assumptions, see Note 11 to
our consolidated financial statements. |
107
Employment
Agreements and Potential Payments on Termination and Change of
Control
We have entered into employment agreements with each of our
named executive officers as described below. Generally, these
agreements were the result of negotiations with the executive
and provide that we will pay severance benefits to an executive
if he is terminated without cause or resigns for good reason
(which generally includes a material reduction in compensation
or duties or a significant relocation), subject to the executive
signing a general release of claims. In addition, our Chief
Executive Officer and our Chief Financial Officer, as well as
Mr. Besso, would receive accelerated vesting of some of
their equity awards on change in control transactions, as
further described below.
Thomas D. Logan. Under the terms of his August
2006 employment agreement, as amended in December 2008 and
January 2009, if Mr. Logan is involuntarily terminated
without cause or resigns for good reason, he will be entitled to
receive the following benefits if he signs a general release:
|
|
|
| |
•
|
an amount equal to his annual base salary;
|
| |
| |
•
|
a pro rata portion of his incentive bonus, if any, for the
applicable period during the fiscal year in which termination
occurs; and
|
| |
| |
•
|
continuation of all health benefits offered to senior executive
for one year after the date of termination.
|
In addition, Mr. Logan’s Employment Agreement provides
that upon a change in control, 100% of his unvested options will
vest and, if applicable, he will receive reimbursement for
excise taxes imposed on him as a result of Section 280G of
the Internal Revenue Code, and that 50% of his unvested options
will vest upon the consummation of this offering. Further,
Mr. Logan’s Employment Agreement provides for a
one-time bonus upon the consummation of this offering, equal to
$50,000 plus an amount not to exceed $75,000, with such
additional amount to be determined based upon the time taken to
complete this offering.
Jack A. Pacheco. Under the terms of his March
2008 employment agreement, as amended in December 2008, if
Mr. Pacheco is involuntarily terminated without cause or
resigns for good reason, he will be entitled to receive the
following benefits if he signs a general release:
|
|
|
| |
•
|
an amount equal to his annual base salary; and
|
| |
| |
•
|
a pro rata portion of his incentive bonus, if any, for the
applicable period during the fiscal year in which termination
occurs.
|
In addition, his employment agreement provides that 100% of his
unvested options will vest in the event that either
(i) ACAS or its affiliates no longer own at least 50% of
the outstanding capital stock of us; provided that no such
vesting shall occur as a result of the initial public offering
of our capital stock or a company affiliated with us formed for
the purpose of an initial public offering; or (ii) all or
substantially all of our assets are sold, transferred or
disposed of to a person (or group of persons acting in concert)
that is not an affiliate of ACAS.)
Seth B. Rosen. Under the terms of his January
2008 employment agreement, as amended in December 2008, if
Mr. Rosen is involuntarily terminated without cause or
resigns for good reason, he will be entitled to receive the
following benefits if he signs a general release:
|
|
|
| |
•
|
an amount equal to his annual base salary;
|
| |
| |
•
|
a pro rata portion of his incentive bonus, if any, for the
applicable period during the fiscal year in which termination
occurs; and
|
| |
| |
•
|
continued payment by us for a maximum of 12 months of his
health coverage premiums under COBRA.
|
Iain F. Wilson. There are no specific
requirements with respect to any obligations of us in connection
with a termination of Mr. Wilson’s employment under
any employment agreement. Pursuant to Canadian law, executive
officers may be entitled to benefits or a notice period upon
termination of employment, depending on length of service and
other factors.
108
W. Antony Besso. Mr. Besso’s
employment agreement is governed by French law. Under the terms
of his 2006 employment agreement, as amended in November 2007,
if Mr. Besso is terminated, he will be entitled to receive
the following benefits:
|
|
|
| |
•
|
an amount equal to 12 months of remuneration, consisting of
base salary, incentive bonus, and all other bonuses and benefits
received by Mr. Besso during the last twelve months
preceding his termination; and
|
| |
| |
•
|
any payments under the applicable collective bargaining
agreement.
|
Mr. Besso’s agreement provides that either party may
terminate the agreement with three months’ notice. The
agreement includes a non-competition covenant for two years
following the termination of Mr. Besso’s employment,
if we pay to Mr. Besso an amount not to exceed
6/10
of the monthly average of specified pay and benefits from the
last 12 months of his employment. In addition,
Mr. Besso received stock options in August 2008 that
provided for accelerated vesting upon a change in control or an
initial public offering.
Potential Termination and Change in Control
Benefits. The table below provides an estimate of
the value of the compensation and benefits due to each of our
named executive officers in the event of: (i) an
involuntary termination; (ii) death or disability; or
(iii) a change in control. The amounts shown assume that
specified event was effective as of June 30, 2009. The
actual amounts to be paid can only be determined at the time of
the termination of employment or change in control, as
applicable.
| |
|
|
|
|
|
|
|
|
|
|
|
|
|
|
|
Involuntary
|
|
|
Disability
|
|
|
Change in
|
|
|
|
|
Termination
|
|
|
or Death
|
|
|
Control
|
|
|
Name
|
|
($)
|
|
|
($)
|
|
|
($)
|
|
|
|
|
Thomas D. Logan
|
|
|
497,661
|
(1)
|
|
|
172,661
|
(2)
|
|
|
|
(3)
|
|
Jack A. Pacheco
|
|
|
417,000
|
(1)
|
|
|
139,000
|
(2)
|
|
|
|
(3)
|
|
Seth B. Rosen
|
|
|
341,225
|
(1)
|
|
|
92,800
|
(2)
|
|
|
—
|
|
|
W. Antony Besso
|
|
|
517,461
|
(4)
|
|
|
—
|
|
|
|
|
(3)
|
|
Iain F. Wilson
|
|
|
—
|
(5)
|
|
|
—
|
|
|
|
—
|
|
|
|
|
|
(1) |
|
Consists of payments due on a termination without cause or
resignation for good reason, subject to the executive signing a
release. This amount consists of (i) 100% of annual base
salary, (ii) a pro rata portion of any incentive bonus
(which for a termination at June 30, 2009, we have assumed
to be 100% of the target bonus for fiscal 2009), and
(iii) our payments for continued health benefits in the
case of Mr. Logan and Mr. Rosen. Such amount would be
payable at the same time as such payment would be made while the
executive was employed with us. This amount does not include any
amounts that are accrued and owing at the time of termination
(such as accrued vacation and salary through the date of
termination). |
| |
|
(2) |
|
Consists of pro rata portion of any incentive bonus (which we
have assumed to be 100% of the target bonus) and, for
Mr. Logan, continued health benefits for his family for
12 months. |
| |
|
(3) |
|
For Mr. Logan, this amount reflects (i) 100% vesting
of any unvested stock options and (ii) remittance of net
proceeds upon the sale by ACAS of vested and unexercised IRR
Options under the Call Option Agreement. For Mr. Pacheco,
this reflects 100% vesting of any unvested stock options in the
event that (i) ACAS no longer owns at least 50% of our
outstanding capital stock, or (ii) all or substantially all
of our assets are sold, transferred or disposed of, in the case
of Mr. Pacheco. For Mr. Besso, this reflects 100%
vesting of any unvested stock options from an August 2008 grant
which will vest in the event of a change in control or upon the
consummation of this offering. The dollar value in each case is
based on an assumed public offering price of
$ , based on the mid-range of the
offering price range, but otherwise assumes the transaction
occurred based on unvested options at June 30, 2009. |
| |
|
(4) |
|
Amount includes 12 months of salary and other compensation
paid for 2009, assuming payment of the target bonus for fiscal
2009. Amount does not include three months of notice and assumes
we do not elect to pay for Mr. Besso’s continued
non-competition agreement, as described above. |
| |
|
(5) |
|
Does not include amounts that may be payable as required by law. |
109
Employee
Benefit Plans
Stock
Plan
The following contains a summary of the material terms of our
2006 Stock Plan, which was originally approved in December 2005.
Prior to the consummation of this offering, we expect our Board
of Directors and stockholders to approve amendments to this
plan, and we refer to the amended plan as the Stock Plan below.
Share Reserve. As of June 30, 2009, an
aggregate of 118,690 shares of our common stock were
reserved for issuance, options to purchase 113,288 shares
were outstanding and 5,402 shares were available for future
grant under the Stock Plan. Prior to the consummation of this
offering, we expect to reserve 106,160 additional shares under
the Stock Plan. In general, if options or other awards granted
under the Stock Plan are forfeited or terminate for any other
reason before being exercised or settled, then the shares
subject to such options or awards will again become available
for awards under the Stock Plan.
Administration of the Stock Plan. The Stock
Plan will be administered by our Board of Directors or our
Compensation Committee or another committee designated by our
Board of Directors. The administrator has complete discretion to
make all decisions relating to the interpretation and operation
of the Stock Plan. The administrator will have the discretion to
determine who will receive an award, the type of award, the
number of shares that will be covered by the award, the vesting
requirements of the award, if any, and all other features and
conditions of the award. The administrator may implement rules
and procedures that differ from those described below in order
to adapt the Stock Plan to the requirements of countries other
than the United States.
Eligibility. Any employee, consultant or
non-employee director may be selected by the administrator to
participate in the Stock Plan. Directors affiliated with ACAS
and its affiliates are not expected to receive grants.
Type of Awards. To date, we have granted
options under the Stock Plan. Following this offering, awards
granted under the Stock Plan may include any of the following:
|
|
|
| |
•
|
stock options to purchase shares of our common stock at a
specified exercise price;
|
| |
| |
•
|
restricted stock units, representing the right to receive a
specified number of shares of our common stock, the fair market
value of such common stock in cash or a combination of cash and
shares upon expiration of the vesting period specified for such
stock units by the administrator;
|
| |
| |
•
|
restricted shares, which are shares of common stock issued to
the participant subject to such forfeiture and other
restrictions as the administrator, in its sole discretion, shall
determine;
|
| |
| |
•
|
stock appreciation rights, which are rights to receive shares of
our common stock, cash or a combination of shares and cash, the
value of which is equal to the spread or excess of (i) the
fair market value per share on the date of exercise over
(ii) the fair market value per share on the date of grant
with respect to a specified number of shares of common
stock; and
|
| |
| |
•
|
other equity-based awards.
|
Vesting of Awards. Equity awards vest at the
time or times determined by the administrator. In most cases,
our options granted to date vest over the four-year period
following the date of grant, but the administrator has the
discretion to determine the vesting schedule and whether the
vesting will accelerate on events such as death, disability,
change in control or involuntary termination of employment. In
addition, the administrator may grant performance awards based
on performance criteria measured over a specified period.
Other Terms of Awards. After termination of
service by an employee, director or consultant, for any reason
other than misconduct, he or she has a period of 30 days
(or such longer period as specified in an award agreement)
following the date of termination during which to exercise his
or her option. The administrator may, at its discretion, extend
the period of time for which the option is to remain
exercisable, but no option may be exercisable after the
expiration of its term.
Change in Control. In the event of a merger or
consolidation of us, all outstanding awards will be subject to
the agreement of merger or consolidation, which may provide for
the continuation or assumption of
110
outstanding awards; substitution with substantially similar
awards; accelerated vesting of awards; or cancellation of awards
in exchange for a cash payment equal to the fair market value of
the shares over the applicable purchase price of the award.
Amendment and Termination of Plan. Our Board
of Directors may amend or terminate the Stock Plan at any time.
No amendment can be effective prior to its approval by our
stockholders, to the extent that such approval is required by
applicable legal requirements or any exchange on which our
common stock is listed. The Stock Plan will continue in effect
for ten years from the last approval by stockholders, unless our
Board of Directors decides to terminate the plan earlier.
Limitation
of Liability and Indemnification of Officers and
Directors
The Certificate of Incorporation and Bylaws that we will adopt
upon the consummation of this offering contain provisions that
limit the personal liability of our directors for monetary
damages to the fullest extent permitted by Delaware law.
Consequently, our directors will not be personally liable to us
or our stockholders for monetary damages or any breach of
fiduciary duties as directors, except liability for:
|
|
|
| |
•
|
any breach of the director’s duty of loyalty to us or our
stockholders;
|
| |
| |
•
|
any act or omission not in good faith or that involves
intentional misconduct or a knowing violation of law;
|
| |
| |
•
|
unlawful payments of dividends, or unlawful stock repurchases or
redemptions as provided in Section 174 of the Delaware
General Corporation Law; or
|
| |
| |
•
|
any transaction from which the director derived an improper
personal benefit.
|
The Certificate of Incorporation and Bylaws that we will adopt
upon the consummation of this offering provide that we must
indemnify our directors and officers to the fullest extent
permitted by Delaware law. Our Certificate of Incorporation and
Bylaws shall also provide that we shall advance expenses
incurred by a director or officer in advance of the final
disposition of any action or proceeding, and permit us to secure
insurance on behalf of any officer, director, employee or other
agent for any liability arising out of his or her actions in
that capacity, regardless of whether we would otherwise be
permitted to indemnify him or her under the provisions of
Delaware law. Upon the consummation of this offering, we expect
to enter into agreements to indemnify our directors and
executive officers, and other employees as determined by our
Board of Directors, against expenses and liabilities to the
fullest extent permitted by Delaware law. With certain
exceptions, these agreements also provide for indemnification
for related expenses including, among others, attorneys’
fees, judgments, fines and settlement amounts incurred by any of
these individuals in any action or proceeding. The
indemnification agreement also provides for indemnified
directors and officers to select the method by which a
determination of eligibility for indemnification is made. We
believe that these bylaw provisions and indemnification
agreements are necessary to attract and retain qualified persons
as directors and officers. We also maintain directors’ and
officers’ liability insurance.
The limitation of liability and indemnification provisions in
the Certificate of Incorporation and Bylaws that we will adopt
upon the consummation of this offering may discourage
stockholders from bringing a lawsuit against our directors for
breach of their fiduciary duty of care. They may also reduce the
likelihood of derivative litigation against our directors and
officers, even though an action, if successful, might benefit us
and other stockholders. Further, a stockholder’s investment
may be adversely affected to the extent that we pay the costs of
settlement and damage awards against directors and officers. At
present, there is no pending litigation or proceeding involving
any of our directors, officers or employees for which
indemnification is sought, and we are not aware of any
threatened litigation that may result in claims for
indemnification.
111
PRINCIPAL
STOCKHOLDERS
The following table sets forth certain information regarding the
beneficial ownership of our common stock by (1) each person
known by us to be the beneficial owner of 5% or more of the
outstanding common stock, (2) each of our directors and
each director nominee, (3) each of the executive officers
named in the section entitled “Management” above and
(4) all of our executive officers, directors and director
nominees as a group.
Percentage of ownership is based on 1,250,786 shares of
common stock outstanding as of December 31, 2009.
Beneficial ownership is calculated based on SEC requirements.
These requirements also treat as outstanding all shares of
common stock that a person would receive upon exercise of stock
options or warrants held by that person that are immediately
exercisable or exercisable within 60 days of the
determination date, which in the case of the following table is
December 31, 2009. Shares issuable pursuant to stock
options and warrants exercisable within 60 days are deemed
outstanding and held by the holder of such options or warrants
for computing the percentage of the person holding such options
or warrants, but are not deemed outstanding for computing the
percentage of any other person. To our knowledge, except as
indicated in the footnotes to this table and pursuant to
applicable community property laws, the persons named in the
table have sole voting and investment power with respect to all
shares of common stock.
Other than as specifically noted below, the address of each of
the named entities or individuals is
c/o Mirion
Technologies, Inc., 3000 Executive Parkway Suite 222,
San Ramon, California 94583.
| |
|
|
|
|
|
|
|
|
|
|
|
|
|
|
|
|
|
|
|
|
|
|
|
|
|
|
|
|
|
|
Common Stock
|
|
|
Common Stock
|
|
|
|
|
Common Stock
|
|
|
Beneficially Owned
|
|
|
Beneficially Owned
|
|
|
|
|
Beneficially Owned
|
|
|
After the Offering
|
|
|
After the Offering
|
|
|
|
|
Prior to the Offering
|
|
|
Without Over-Allotment
|
|
|
With Over-Allotment
|
|
|
Beneficial Owner
|
|
Number
|
|
|
Percentage
|
|
|
Number
|
|
|
Percentage
|
|
|
Number
|
|
|
Percentage
|
|
|
|
|
Greater than 5% Stockholders:
|
|
|
|
|
|
|
|
|
|
|
|
|
|
|
|
|
|
|
|
|
|
|
|
|
|
American Capital, Ltd. and affiliated entities(1)
|
|
|
1,242,925
|
|
|
|
99.37
|
%
|
|
|
|
|
|
|
|
|
|
|
|
|
|
|
|
|
|
2 Bethesda Metro Center
14th Floor
Bethesda, MD 20814
|
|
|
|
|
|
|
|
|
|
|
|
|
|
|
|
|
|
|
|
|
|
|
|
|
|
American Capital Equity I, LLC(2)
|
|
|
372,878
|
|
|
|
29.81
|
%
|
|
|
|
|
|
|
|
|
|
|
|
|
|
|
|
|
|
2 Bethesda Metro Center
14th Floor
Bethesda, MD 20814
|
|
|
|
|
|
|
|
|
|
|
|
|
|
|
|
|
|
|
|
|
|
|
|
|
|
American Capital Equity II, LP(3)
|
|
|
145,463
|
|
|
|
11.63
|
%
|
|
|
|
|
|
|
|
|
|
|
|
|
|
|
|
|
|
2 Bethesda Metro Center
14th Floor
Bethesda, MD 20814
|
|
|
|
|
|
|
|
|
|
|
|
|
|
|
|
|
|
|
|
|
|
|
|
|
|
Named Executive Officers, Directors and Director Nominees:
|
|
|
|
|
|
|
|
|
|
|
|
|
|
|
|
|
|
|
|
|
|
|
|
|
|
Thomas D. Logan(4)
|
|
|
35,842
|
|
|
|
2.79
|
%
|
|
|
|
|
|
|
|
|
|
|
|
|
|
|
|
|
|
Jack A. Pacheco(5)
|
|
|
7,992
|
|
|
|
*
|
|
|
|
|
|
|
|
|
|
|
|
|
|
|
|
|
|
|
Seth B. Rosen(6)
|
|
|
5,136
|
|
|
|
*
|
|
|
|
|
|
|
|
|
|
|
|
|
|
|
|
|
|
|
W. Antony Besso(7)
|
|
|
10,338
|
|
|
|
*
|
|
|
|
|
|
|
|
|
|
|
|
|
|
|
|
|
|
|
Iain F. Wilson(8)
|
|
|
6,312
|
|
|
|
*
|
|
|
|
|
|
|
|
|
|
|
|
|
|
|
|
|
|
|
Robert J. Klein(9)
|
|
|
1,242,925
|
|
|
|
99.37
|
%
|
|
|
|
|
|
|
|
|
|
|
|
|
|
|
|
|
|
Dustin G. Smith(9)
|
|
|
1,242,925
|
|
|
|
99.37
|
%
|
|
|
|
|
|
|
|
|
|
|
|
|
|
|
|
|
|
Brian S. Graff(9)
|
|
|
1,242,925
|
|
|
|
99.37
|
%
|
|
|
|
|
|
|
|
|
|
|
|
|
|
|
|
|
|
Michael T. Everett
|
|
|
—
|
|
|
|
*
|
|
|
|
|
|
|
|
|
|
|
|
|
|
|
|
|
|
|
Earl R. Lewis
|
|
|
—
|
|
|
|
*
|
|
|
|
|
|
|
|
|
|
|
|
|
|
|
|
|
|
|
Alfred E. Barry, Jr.
|
|
|
—
|
|
|
|
*
|
|
|
|
|
|
|
|
|
|
|
|
|
|
|
|
|
|
|
All Executive Officers and Directors as a group (11 persons)
|
|
|
1,308,545
|
|
|
|
100
|
%
|
|
|
|
|
|
|
|
|
|
|
|
|
|
|
|
|
112
|
|
|
|
* |
|
Indicates less than 1%. |
|
|
|
|
(1) |
|
Includes 24,503 shares of Class B Non-Voting Common
Stock held of record, 544,621 shares of
Series A-1
Convertible Participating Preferred Stock as-converted to
616,946 shares of common stock and 80,185 shares of
Series A-2
Convertible Participating Preferred Stock as-converted to
83,135 shares of common stock. Does not include a warrant
to purchase 222,156 shares of common stock that are
unexercisable within 60 days of December 31, 2009. The
members of the Board of Directors of American Capital, Ltd. are
Mary Baskin, Neil Hahl, Philip Harper, John Koskinen, Stan
Lundine, Kenneth Peterson, Alvin Puryear and Malon Wilkus. The
Board of Directors manages these shares and exercises voting and
investment power on behalf of American Capital, Ltd. As the
directors of American Capital, Ltd., these individuals may be
deemed to have shared voting and investment power over the
shares held by American Capital, Ltd., including the power to
dispose, or to direct the disposition of, such shares. Each of
these individuals disclaims beneficial ownership of such shares,
except to the extent of his or her pecuniary interest therein.
Also includes 372,878 shares held directly by American
Capital Equity I, LLC (“ACE I”), and
145,463 shares held directly by American Capital Equity II,
LP (“ACE II”). See footnotes (2) and
(3) below. Mr. Klein, one of our directors, is a
Managing Director and Senior Vice President at American Capital,
Ltd. and Messrs. Smith and Graff, two of our director
nominees, are a Principal and Vice President and a Senior Vice
President and Senior Managing Director at American Capital,
Ltd., respectively, and each as a result may be deemed to have
indirect shared voting and investment power over the shares held
by American Capital, Ltd. and be deemed to be a beneficial owner
for purposes of sections 13(d) and 13(g) of the Securities
Exchange Act of 1934, as amended. Each of Messrs. Klein,
Smith and Graff disclaim any beneficial ownership over such
shares. |
|
|
|
|
(2) |
|
Includes 12,610 shares of Class B Non-Voting Common
Stock held of record, 280,268 shares of
Series A-1
Convertible Participating Preferred Stock as-converted to
317,487 shares of common stock and 41,263 shares of
Series A-2
Convertible Participating Preferred Stock as-converted to
42,781 shares of common stock. Does not include a warrant
to purchase 113,017 shares of common stock that are
unexercisable within 60 days of December 31, 2009. American
Capital Equity Management, LLC (“ACEM”), a portfolio
company of American Capital, Ltd., is the manager of this
entity, and pursuant to an operating agreement, ACEM exercises
voting power on behalf of ACE I. The members of the Board of
Directors of American Capital, Ltd. are Mary Baskin, Neil Hahl,
Philip Harper, John Koskinen, Stan Lundine, Kenneth Peterson,
Alvin Puryear and Malon Wilkus. The Board of Directors manages
these shares and exercises voting and investment power on behalf
of American Capital, Ltd. As the directors of American Capital,
Ltd., these individuals may be deemed to have shared voting and
investment power over the shares held by American Capital, Ltd.,
including the power to dispose, or to direct the disposition of,
such shares. Each of these individuals disclaims beneficial
ownership of such shares, except to the extent of his or her
pecuniary interest therein. See footnote (1). Mr. Klein,
one of our directors, is a Managing Director and Senior Vice
President at American Capital, Ltd. and Messrs. Smith and
Graff, two of our director nominees, are a Principal and
Vice President and a Senior Vice President and Senior Managing
Director at American Capital, Ltd., respectively, and each as a
result may be deemed to have indirect shared voting and
investment power over the shares held by American Capital, Ltd.
and be deemed to be a beneficial owner for purposes of
sections 13(d) and 13(g) of the Securities Exchange Act of
1934, as amended. Each of Messrs. Klein, Smith and Graff
disclaim any beneficial ownership over such shares. |
|
|
|
|
(3) |
|
Includes 4,919 shares of Class B Non-Voting Common
Stock held of record, 109,336 shares of
Series A-1
Convertible Participating Preferred Stock as-converted to
123,855 shares of common stock and 16,097 shares of
Series A-2
Convertible Participating Preferred Stock as-converted to
16,689 shares of common stock. Does not include a warrant
to purchase 44,089 shares of common stock that are unexercisable
within 60 days of December 31, 2009. American Capital
Equity Management II, LLC (“ACEM II”), a portfolio
company of American Capital, Ltd., is the general partner of
this entity, and pursuant to a management agreement, ACEM II
exercises voting power on behalf of ACE II. The members of the
Board of Directors of American Capital, Ltd. are Mary Baskin,
Neil Hahl, Philip Harper, John Koskinen, Stan Lundine,
Kenneth Peterson, Alvin Puryear and Malon Wilkus. The Board
of Directors manages these shares and exercises voting and
investment power on behalf of American Capital, |
113
|
|
|
|
|
|
Ltd. As the directors of American Capital, Ltd., these
individuals may be deemed to have shared voting and investment
power over the shares held by American Capital, Ltd., including
the power to dispose, or to direct the disposition of, such
shares. Each of these individuals disclaims beneficial ownership
of such shares, except to the extent of his or her pecuniary
interest therein. See footnote (1). Mr. Klein, one of our
directors, is a Managing Director and Senior Vice President at
American Capital, Ltd. and Messrs. Smith and Graff, two of
our director nominees, are a Principal and Vice President and a
Senior Vice President and Senior Managing Director at American
Capital, Ltd., respectively, and each as a result may be deemed
to have indirect shared voting and investment power over the
shares held by American Capital, Ltd. and be deemed to be a
beneficial owner for purposes of sections 13(d) and 13(g)
of the Securities Exchange Act of 1934, as amended. Each of
Messrs. Klein, Smith and Graff disclaim any beneficial
ownership over such shares. |
|
|
|
|
(4) |
|
Consists of 2,091 shares of Class A Voting Common
Stock held of record, 1,269 shares of
Series A-1
Convertible Participating Preferred Stock as-converted to
1,437 shares of common stock, options to purchase
14,564 shares of common stock that are exercisable within
60 days of December 31, 2009 and options to purchase
17,750 shares of common stock held by ACAS that are
exercisable within 60 days of December 31, 2009. Does
not include a warrant to purchase 4,063 shares of common stock
that are unexersisable within 60 days of December 31, 2009. |
|
|
|
|
(5) |
|
Consists of options to purchase 7,992 shares of common
stock that are exercisable within 60 days of
December 31, 2009. |
|
|
|
|
(6) |
|
Consists of options to purchase 5,136 shares of common
stock that are exercisable within 60 days of
December 31, 2009. |
|
|
|
|
(7) |
|
Consists of 2,700 shares of Class B Non-Voting Common Stock held
of record and options to purchase 7,638 shares of common
stock that are exercisable within 60 days of
December 31, 2009. |
|
|
|
|
(8) |
|
Consists of options to purchase 6,312 shares of common stock
that are exercisable within 60 days of December 31, 2009. |
|
|
|
|
(9) |
|
Mr. Klein, one of our directors, is a Managing Director and
Senior Vice President at American Capital, Ltd. and
Messrs. Smith and Graff, two of our director nominees, are
a Principal and Vice President and a Senior Vice President and
Senior Managing Director at American Capital, Ltd.,
respectively, and each as a result are deemed to have indirect
shared voting and investment power over the shares held by
American Capital, Ltd. and be deemed to be a beneficial owner
for purposes of sections 13(d) and 13(g) of the Securities
Exchange Act of 1934, as amended. Each of Messrs. Klein,
Smith and Graff disclaim any beneficial ownership over such
shares. |
114
CERTAIN
RELATIONSHIPS AND RELATED PARTY TRANSACTIONS
Agreements
with ACAS
We have entered into certain agreements with ACAS and its
affiliates, which will own % of our
issued and outstanding common stock after the completion of this
offering, assuming no exercise of the underwriters’
over-allotment option. One of our directors, Mr. Klein, is
an employee of ACAS. Set forth below is a brief description of
the relationships and agreements between us and ACAS.
Certificate
of Incorporation and Bylaws
The Bylaws that we will adopt prior to the consummation of this
offering will provide that ACAS has the right to designate up to
three members of our seven member Board of Directors, as set
forth under “Management—Board Structure and
Compensation.”
The Bylaws that we will adopt prior to the consummation of this
offering will provide that at least one of the directors
designated by ACAS must be part of the majority in any action
taken by our Board of Directors so long as ACAS and its
affiliated funds hold at least 50.1% of our outstanding common
stock, other than on matters in which ACAS has a conflict of
interest (as it would if it appointed a majority of our
directors). Our Bylaws will also provide that ACAS will have the
right to designate three of our seven directors so long as ACAS
and its affiliated funds hold at least 50.1% of our outstanding
common stock, two directors so long as they hold at least 25%
but less than 50.1% and one director so long as they hold at
least 10% but less than 25%.
Registration
Rights Agreement
Prior to the consummation of this offering, we shall enter into
a registration rights agreement with ACAS and certain of its
affiliates, Thomas D. Logan, W. Antony Besso and certain other
of our stockholders, pursuant to which such stockholders will
have registration rights with respect to our common stock. Under
the agreement, ACAS may from time to time require us to effect
registrations of our securities held by ACAS and its affiliates,
and ACAS, Thomas D. Logan, W. Antony Besso and certain other of
our stockholders may join in registrations which we may effect,
either for our benefit or for the benefit of other holders of
our common stock. See “Description of Capital
Stock—Registration Rights.”
Investment
Banking Services Agreement
In December 2005, our predecessor entered into an investment
banking services agreement with ACFS, a subsidiary of ACAS,
pursuant to which ACFS may provide financial and advisory
services to us. These services include evaluating, initiating
and structuring any potential acquisitions by us, raising debt
or equity financing, financial analysis and modeling, and
related tasks.
The agreement also includes customary indemnification provisions
in favor of ACFS, and customary limitations of each
entity’s liability for services rendered under the
investment banking services agreement in good faith and with
reasonable care.
So long as the agreement is effective, we are required to pay to
ACFS an annual management fee of $1.6 million, plus
reimbursement for all reasonable
out-of-pocket
expenses. The management fee is payable on a quarterly basis, in
advance. We incurred $1.6 million for management fees in
each of fiscal 2007, 2008 and 2009. We and ACFS have agreed to
terminate this agreement upon the consummation of this offering
in return for a one-time payment by us to ACFS of
$8.0 million.
Indebtedness
ACAS and its affiliates hold certain indebtedness of our
subsidiaries. Such indebtedness consists of senior term notes,
senior subordinated notes, junior subordinated notes, revolving
notes and stockholder loans. Certain of such indebtedness are
governed by Note and Equity Purchase Agreements, and are
guaranteed and secured by us and our subsidiaries. See “Use
of Proceeds,” “Management’s Discussion and
Analysis of
115
Financial Condition and Results of Operation—Credit
Facilities And Long-Term Debt” and Note 8 of our
consolidated financial statements.
The largest aggregate principal amounts outstanding under our
NEPAs and stockholder loans were $159.5 million,
$173.2 million, $170.0 million and $174.7 million
in fiscal 2007, 2008 and 2009 and the six months ended
December 31, 2009. The amount outstanding (including
accrued paid-in-kind interest) as of January 31, 2010 is
$183.9 million. We paid $2.5 million,
$0.5 million, $0.5 million and $0.3 in principal in
fiscal 2007, 2008 and 2009 and the six months ended
December 31, 2009, and $16.5 million,
$17.2 million, $14.8 million and $6.3 million in
interest in fiscal 2007, 2008 and 2009 and the six months ended
December 31, 2009. The interest rates under our debt are
described in “Use of Proceeds.”
Dividend
Rights
ACAS and its affiliates ACE I and ACE II, together hold
approximately 757,426 shares of our
Series A-1
and A-2
Convertible Participating Preferred Stock. Under the terms of
our Certificate of Incorporation, all holders of our preferred
stock are entitled to receive, in preference to the holders of
shares of any common stock, cumulative dividends, at a rate of
8% and 17% annually, on each quarter. Such dividends are to be
paid-in-kind,
by validly issuing fully paid and non-assessable shares of
Series A-1
and A-2
Convertible Participating Preferred Stock. ACAS and its
affiliates have accrued 59,062, 64,181 and 69,366 shares of
Series A-1
preferred stock
paid-in-kind
dividends in fiscal 2007, 2008 and 2009, and 13,991, 16,611 and
19,617 shares of
Series A-2
preferred stock
paid-in-kind
dividends in fiscal 2007, 2008 and 2009. The liquidation value
of the
paid-in-kind
dividends on our
Series A-1
preferred stock was $6.7 million, $7.3 million and
$7.9 million at June 30, 2007, 2008 and 2009. The
liquidation value of the
paid-in-kind
dividends on our
Series A-2
preferred stock was $1.5 million, $1.7 million and
$2.0 million at June 30, 2007, 2008 and 2009. See
Note 12 to our consolidated financial statements.
Warrant
and Preferred Stock Reissues
From October 2006 to October 2007, we cancelled and re-issued
certain of our securities held by ACAS to allow ACAS to
redistribute the securities between itself, ACE I and ACE II:
|
|
|
| |
•
|
On October 3, 2006, we cancelled 42,032 shares of our
Class B Non-Voting Common Stock held by ACAS and re-issued
29,422 shares to ACAS and 12,610 shares to ACE I. On
October 3, 2007, we cancelled 29,422 shares held by
ACAS and re-issued 24,503 shares to ACAS and
4,919 shares to ACE II. As a re-issuance of existing
shares, we recognized no gain or loss on such transactions.
|
| |
| |
•
|
On October 3, 2006, we cancelled 677,426 shares of our
Series A-1
Convertible Participating Preferred Stock held by ACAS and
re-issued 474,198 shares to ACAS and 203,228 shares to
ACE I. On October 3, 2007, we cancelled
474,198 shares held by ACAS and re-issued
394,916 shares to ACAS and 79,282 shares to ACE II. As
a re-issuance of existing shares, we recognized no gain or loss
on such transactions.
|
|
|
|
| |
•
|
On October 3, 2006, we cancelled 70,000 shares of our
Series A-2
Convertible Participating Preferred Stock held by ACAS and
re-issued 49,000 shares to ACAS and 21,000 shares to
ACE I. On October 3, 2007, we cancelled
49,000 shares held by ACAS and re-issued 40,808 shares
to ACAS and 8,192 shares to ACE II. As a re-issuance
of existing shares, we recognized no gain or loss on such
transactions.
|
|
|
|
| |
•
|
On October 3, 2006, we cancelled a warrant held by ACAS to
purchase 379,262 shares of common stock and re-issued
warrants to ACAS to purchase 266,245 shares and a warrant
to ACE I to purchase 113,017 shares. On
October 3, 2007, we cancelled a warrant held by ACAS to
purchase 263,707 shares of common stock and reissued a
warrant to ACAS to purchase 219,618 shares and a warrant to
ACE II to purchase 44,089 shares. As a re-issuance of
existing warrants, we recognized no gain or loss on such
transactions.
|
We expect to borrow up to $85 million and
€25.75 million under our anticipated new bank credit
facilities, of which we expect to use approximately
$87.4 million, together with approximately
$93.3 million of the net proceeds of this offering, to
repay our indebtedness to ACAS. See “Use of Proceeds.”
116
Interested
Transactions—Transactions with Management
Call
Option Agreement between ACAS and Thomas D. Logan
Our President, Chief Executive Officer and Chairman of the
Board, Thomas D. Logan, entered into a Call Option Agreement
with ACAS and certain of its affiliates, in which ACAS granted
time and performance-based options with market conditions to
Mr. Logan to purchase shares of the common stock of two of
our predecessors in connection with his services as an officer
and director. Modification of these options occurred in
substance on January 1, 2006 in connection with the
formation of Mirion in December 2005. As a result of the
modification, Mr. Logan was granted performance-based
options with market conditions to purchase 54,564 shares of
Mirion’s Class A Common Stock held by ACAS. These options
were further modified on December 7, 2007 such that their
vesting criteria was amended. The exercise price of these
options is $88.75 per share, and the total incremental value
resulting from the option modification is $2.1 million and
incorporates the impact of the options’ market-based
conditions in the original grant date and modification date fair
values. The original grant date fair value of these options was
negligible. The Company will recognize expense on these options
in the period and to the extent that it satisfies the
performance-based vesting conditions, which require completion
of an effective offering in the public markets or a qualifying
sale of the Company.
The performance based options are divided into three tranches,
each of which will either vest or become cancelled in two halves
upon our IPO or change in control, depending on whether ACAS
achieves certain market-based conditions, internal rates of
return or returns on investment in such an event. Upon
completion of this offering, vesting of the performance-based
options will occur in two stages. The first stage occurs
30 days after the effective time of this offering at which
time 50% of the options in each tranche will vest if ACAS
achieves certain minimum internal rates of return, ranging
between 25–40% or certain minimum returns on investment
ranging between 2.0–2.7x. If neither goal is met, the
options in this tranche will be cancelled. The second stage
occurs on the earlier of two years after the effective time of
this offering or upon the sale by ACAS of its investments in us,
at which time the remaining 50% of the options in each tranche
will vest if ACAS achieves certain minimum internal rates of
return ranging between 25–40% or certain minimum returns on
investment of 2.0–2.7x. If neither goal is met, the options
in this tranche will be cancelled. The price of our common stock
required to achieve a 25% internal rate of return is
$ per share, and the price
required to achieve a 2.0x return on investment is
$ per share. The price of our
common stock required to achieve a 40% internal rate of return
is $ per share, and the price
required to achieve a 2.7x return on investment is
$ per share. The Company will
record stock compensation expense in connection with these
options in the event it completes an effective offering in the
public markets or a qualifying sale of the Company, regardless
of whether ACAS achieves the related market-based conditions.
The Call Option Agreement also provides Mr. Logan with a
time-based option to purchase 17,750 shares of our common
stock held by ACAS or its affiliates at an exercise price of
$88.75 per share. The incremental cost resulting from the
modification of the 17,750 time-based options granted to
Mr. Logan is $0.6 million. All such options have
vested as of June 30, 2008.
All options granted by ACAS and its affiliates to Mr. Logan
pursuant to the Call Option Agreement are to be reduced on an
economically equivalent basis in the event we grant
Mr. Logan options to purchase shares of our common stock
after the date of the Call Option Agreement, provided such
options are no less favorable to Mr. Logan.
Indemnification
and Employment Agreements
Upon the consummation of this offering, we shall enter into
indemnification agreements pursuant to which we will indemnify
our directors and our executive officers in certain
circumstances, and hold them harmless against any expenses and
liabilities incurred in the performance of their duties to us.
Such indemnification includes, among other things, advancement
of expenses to indemnitees, payment of fees of independent
counsel and conditions of full release of liability to
indemnitees in settlement. See “Executive
Compensation—Limitation of Liability and Indemnification of
Officers and Directors.” We have also entered into
employment agreements and non-competition agreements with
certain of our executive officers. See
117
“Executive Compensation—Employment Agreements and
Potential Payments on Termination and Change of Control.”
Policies
and Procedures for Related Party Transactions
We do not currently have a formal, written policy or procedure
for the review and approval of related party transactions.
However, all related party transactions are currently reviewed
by our Board of Directors.
Our Board of Directors intends to adopt a written related person
transaction policy to set forth the policies and procedures for
the review and approval or ratification of related person
transactions. This policy will cover any transaction,
arrangement or relationship, or any series of similar
transactions, arrangements or relationships in which we were or
are to be a participant, the amount involved exceeds $120,000
and a related person had or will have a direct or indirect
material interest, including, without limitation, purchases of
goods or services by or from the related person or entities in
which the related person has a material interest, indebtedness,
guarantees of indebtedness or employment by us of a related
person.
118
DESCRIPTION
OF CAPITAL STOCK
Following the consummation of this offering, our authorized
capital stock will consist
of shares
of common stock, par value $0.001 per share
and shares
of preferred stock, par value $0.001 per share, undesignated as
to series. As of December 31, 2009, 1,250,786 shares
of preferred and common stock were issued and outstanding and
held by nine stockholders of record and no shares of
undesignated preferred shares were outstanding, assuming the
conversion of all of our convertible preferred stock and the
conversion of our Class A Voting Common Stock and
Class B
Non-Voting
Common Stock on a one-to-one basis. In addition, as of
December 31, 2009, there were 402,428 shares of common
stock subject to outstanding warrants, which only become
exercisable upon a sale, liquidation or dissolution of the
Company or approval by the Board of Directors, and
113,288 shares of common stock subject to outstanding
options. The following summary description relating to our
capital stock does not purport to be complete and is qualified
in its entirety by the Certificate of Incorporation and Bylaws
that we will adopt prior to the consummation of this offering,
and that will be filed as an exhibit to the registration
statement of which this prospectus forms a part.
Common
Stock
The holders of common stock are entitled to one vote per share
on all matters to be voted upon by the stockholders. Subject to
preferences that may be applicable to any outstanding preferred
stock, the holders of common stock are entitled to receive
ratably such dividends, if any, as may be declared from time to
time by our Board of Directors out of funds legally available
therefor. See “Dividend Policy.” In the event of our
liquidation, dissolution or winding up, the holders of common
stock are entitled to share ratably in all assets remaining
after payment of liabilities, subject to prior distribution
rights of preferred stock, if any, then outstanding. The common
stock has no preemptive or conversion rights or other
subscription rights. There are no redemption or sinking fund
provisions applicable to the common stock. All outstanding
shares of common stock are fully paid and non-assessable, and
the shares of common stock to be issued upon completion of this
offering will be fully paid and non-assessable.
The Bylaws that we will adopt upon the consummation of this
offering will provide that at least one of the directors
designated by ACAS must be part of the majority in any action
taken by our Board of Directors so long as ACAS and its
affiliated funds hold at least 50.1% of our outstanding common
stock, other than on matters in which ACAS has a conflict of
interest (as it would if it appointed a majority of our
directors). Our Bylaws will also provide that ACAS will have the
right to designate three of our seven directors so long as ACAS
and its affiliated funds hold at least 50.1% of our outstanding
common stock, two directors so long as they hold at least 25%
but less than 50.1% and one director so long as they hold at
least 10% but less than 25%.
Preferred
Stock
Pursuant to the Certificate of Incorporation that we will adopt
upon the consummation of this offering, our Board of Directors
will be authorized, without any action by our stockholders, to
designate and issue shares of preferred stock in one or more
series and to designate the powers, preferences and rights of
each series, which may be greater than the rights of our common
stock. It is not possible to state the actual effect of the
issuance of any shares of preferred stock upon the rights of
holders of our common stock until our Board of Directors
determines the specific rights of the holders of such preferred
stock. However, the effects might include, among other things:
|
|
|
| |
•
|
impairing dividend rights of our common stock;
|
| |
| |
•
|
diluting the voting power of our common stock;
|
| |
| |
•
|
impairing the liquidation rights of our common stock; and
|
| |
| |
•
|
delaying or preventing a change of control of us without further
action by our stockholders.
|
Upon the consummation of this offering, no shares of our
preferred stock will be outstanding.
Registration
Rights
Upon the consummation of this offering, we shall enter into a
registration rights agreement with ACAS and certain of its
affiliates, Thomas D. Logan, W. Antony Besso and certain other
of our stockholders, under which these stockholders may require
us to register their shares of common stock under the securities
laws for sale.
119
Requested
Registration
The agreement shall provide that, any time following
180 days (subject to extension in the event the
lock-up
agreement with the underwriters is extended) after the effective
date of a registration statement for this offering, ACAS and any
transferee receiving at least 25% of ACAS’s registrable
securities held at the time of signing the agreement, so long as
the requesting party holds at least 25% of the registrable
securities held by all the parties holding requested
registration rights at the time of the request for registration,
may require us to effect a registration under the Securities Act
of 1933 of all or a portion of our securities held by them.
We may decline to honor any of these requested registrations if
more than four requested registrations have already been
undertaken.
Form S-3
Registration
We are also obligated in certain circumstances under the
registration rights agreement to use our best efforts to effect
and maintain the effectiveness of a registration on
Form S-3,
if ACAS, a permitted transferee of ACAS or other stockholder
under the agreement holding two percent or more of our common
stock requests that we make such registration and the aggregate
gross proceeds of such registration are reasonably anticipated
to exceed $5,000,000. Upon such a request, all other eligible
holders of our securities under the registration rights
agreement may also elect to register their securities under such
registration statement.
We may decline to honor a requested registration 30 days
prior to or 90 days immediately following the effective
date of another registration statement. Furthermore, we may
postpone the filing of a requested registration on
Form S-3,
but not more than once in any 12-month period, for a reasonable
period of time if filing the registration statement would have a
material adverse effect on us, including if our Board of
Directors determines that a registration would materially
interfere with a significant acquisition or company
reorganization, require premature disclosure of material
nonpublic information or render us unable to comply with
requirements under the Securities Act or the Securities Exchange
Act of 1934, as amended, or the Exchange Act.
Incidental
Registration
In addition to our obligations with respect to requested
registrations, if we propose to register any of our securities
(other than a registration on From
S-8 or
S-4 or
successor forms to these forms), whether or not such
registration is for our own account, ACAS, permitted transferees
of ACAS and other stockholders party to the registration rights
agreement will have the opportunity to participate in such
registration.
If the incidental registration relates to an underwritten
primary registration on our behalf and marketing factors require
a limitation of the number of shares to be offered, first
priority of inclusion shall be given to us and second priority
will be given to ACAS and other stockholders participating in
the incidental registration. If the incidental registration
relates to an underwritten secondary registration on behalf of
holders of our securities and marketing factors require a
limitation of the number of shares to be offered, first priority
of inclusion will be given to the original requesting
stockholder, and second priority will be given to the remaining
stockholders participating in the incidental registration.
Expenses
of Registration
We will pay all expenses of registration, other than
underwriting discounts and commissions, related to any
requested,
Form S-3
or incidental registration.
Indemnification
The agreement contains customary cross-indemnification
provisions under which we are obligated to indemnify the selling
stockholders in the event of material misstatements or omissions
in the registration statement attributable to us, and they are
obligated to indemnify us for material misstatements or
omissions attributable to them.
Anti-Takeover
Effects of Delaware Law
Pursuant to the Certificate of Incorporation that we will adopt
upon the consummation of this offering, we shall opt out of the
provisions of Section 203 of the Delaware General
Corporation Law regulating
120
corporate takeovers. Section 203 prohibits a publicly held
Delaware corporation from engaging, under certain circumstances,
in a business combination with an interested stockholder
(defined generally as a person owning 15% or more of the
corporation’s voting stock) for a period of three years
following the date the person became an interested stockholder
unless:
|
|
|
| |
•
|
prior to the date the person became an interested person, the
board of directors of the corporation approved either the
business combination or the transaction which resulted in the
stockholder becoming an interested stockholder;
|
| |
| |
•
|
upon completion of the transaction that resulted in the
stockholder becoming an interested stockholder, the interested
stockholder owned at least 85% of the voting stock of the
corporation outstanding at the time the transaction
commenced; or
|
| |
| |
•
|
at or subsequent to the date of the transaction, the business
combination is approved by the board of directors of the
corporation and authorized at an annual or special meeting of
stockholders, and not by written consent, by the affirmative
vote of at least
662/3%
of the outstanding voting stock which is not owned by the
interested stockholder.
|
Listing
We have applied to have the common stock approved for quotation
on the NASDAQ Global Market under the symbol “MION.”
Transfer
Agent and Registrar
The transfer agent and registrar for our common stock is
Computershare Trust Company, N.A.
121
DESCRIPTION
OF CERTAIN INDEBTEDNESS
The following is a summary of our anticipated new bank credit
facilities with J.P. Morgan Securities Inc. as lead
arranger and bookrunner. We expect the debt will have the
following principal terms:
New
Senior Secured Credit Facilities
In connection with the consummation of this offering, we expect
to enter into new senior secured credit facilities. The new
senior secured credit facilities will provide for an aggregate
borrowing capacity of up to $50 million through a revolving
credit facility, $35 million through a domestic term loan
facility and €25.75 million through a French term loan
facility. The borrowers under the senior secured credit
facilities will be Mirion Technologies, Inc., and our subsidiary
Dosimetry Acquisition (France) SAS.
Revolving
Credit Facility
Mirion Technologies, Inc. will be the borrower under the
revolving credit facility, which will initially have an
aggregate borrowing capacity of $25 million. We may elect
to increase the revolving credit facility by an additional
$25 million, so long as we are not in default under the
terms of the credit agreement and subject to the consent of any
increasing lenders. Up to $15 million of the revolving
credit facility may be in the form of letters of credit, and up
to $5 million of the revolving credit facility may be in
the form of swingline loans. Any issuances of letters of credit
and borrowing under the swingline loan will reduce availability
for borrowing under the revolving credit facility. Loans under
the revolving credit facility will be used to refinance our
existing indebtedness to ACAS and for general corporate
purposes, and will be so available for four years after entering
into the new senior secured credit facilities.
Obligations of Mirion Technologies, Inc. under the revolving
credit facility will be guaranteed by each of our existing and
future wholly owned domestic subsidiaries, and such obligations
will be secured by substantially all of the assets, including by
blanket liens, of us and our domestic subsidiaries, limited, in
the case of stock of our foreign subsidiaries to 66% of the
capital stock of such subsidiaries.
Term
Loan Facilities
Mirion Technologies, Inc. will be the domestic borrower of
$35 million and Dosimetry Acquisition (France) SAS will be
the French subsidiary borrower of €25.75 million under
the term loan facilities of our senior secured credit
facilities. The term loans will be made available in a single
borrowing, and will mature four years after entering into the
new senior secured credit facilities. The term loans will
amortize in quarterly installments over the life of the loan,
equal to 15% of the original principal balance in the first,
second and third years after the closing date and 20% in the
fourth year.
The term loans of Mirion Technologies, Inc. will be guaranteed
by each of our existing and future wholly owned domestic
subsidiaries. All obligations under term loans to Mirion
Technologies, Inc. will be secured by substantially all of the
assets, including by blanket liens, of us and our domestic
subsidiaries, limited, in the case of stock of our foreign
subsidiaries to 66% of the capital stock of such subsidiaries.
The term loans of our French subsidiary borrowers will be
guaranteed by us, our domestic subsidiaries and, to the extent
that no material adverse tax consequences would result, our
English, Canadian, French and German subsidiaries. All
obligations under the term loans to our French subsidiary
borrower will be secured by assets of us and several of our
subsidiaries, including blanket liens on us and our domestic
subsidiaries and pledges of assets or securities of our foreign
subsidiaries.
Other
Terms
Borrowings under the senior secured credit facilities will bear
interest at a rate based on the prime rate, LIBOR or EURIBOR,
subject to certain adjustments. In addition, certain fees may
accrue in conjunction with the revolving credit facility.
The senior secured credit facilities will contain, among other
things, covenants restricting our ability and the ability of our
subsidiaries to incur indebtedness, prepay or amend other
indebtedness, create liens,
122
guarantee obligations, make certain fundamental changes
including mergers or dissolutions, pay dividends and other
payments in respect of capital stock, make capital expenditures,
make certain investments, sell assets, change our lines of
business, enter into transactions with affiliates and other
corporate actions. The senior secured credit facilities will
also require us to maintain a fixed charge coverage ratio
(defined as the ratio of EBITDA minus capital expenditures to
interest expense and scheduled principal payments of
indebtedness) of 1.50-to-one, a minimum net worth of 80% of our
consolidated stockholders’ equity as of the effective date
of the agreement plus 50% of net income earned in each fiscal
quarter thereafter and a maximum leverage ratio (defined as the
ratio of total indebtedness to Adjusted EBITDA) of 2.75-to-one,
stepping down to 2.25-to-one. The senior secured credit
facilities also contain mandatory prepayment provisions, which
require us in certain instances to prepay obligations owing
under the senior secured credit facilities in connection with
asset sales, excess cash flow and subordinated debt issuances.
Borrowings under the senior secured credit facilities will also
be subject to certain conditions, including the absence of any
event of default and any material adverse change.
The senior secured credit facilities will also include events of
default typical of these types of credit facilities and
transactions, including but not limited to the nonpayment of
principal, interest, fees or other amounts owing under the
senior secured credit facilities (in certain cases, subject to a
grace period), the violation of covenants (subject, in certain
cases, to a grace period), the inaccuracy of representations and
warranties, cross defaults, bankruptcy events, certain ERISA
events, material judgments and a change of control. The
occurrence of an event of default could result in the lenders
not being required to lend any additional amounts and the
acceleration of obligations under the senior secured credit
facilities, causing such obligations to be due and payable
immediately, which could materially and adversely affect us.
Upon the terms as presently contemplated, we anticipate that
J.P. Morgan Securities Inc. as lead arranger and bookrunner
of our new bank credit facilities will be paid one-time fees
equal to $800,000, annual administration fees equal to $25,000
and fees earned on the ongoing credit spread.
123
SHARES ELIGIBLE
FOR FUTURE SALE
Prior to this offering, there has been no market for our common
stock. Future sales of substantial amounts of our common stock
in the public market could adversely affect market prices
prevailing from time to time. Furthermore, because only a
limited number of shares will be available for sale shortly
after this offering due to existing contractual and legal
restrictions on resale as described below, there may be sales of
substantial amounts of our common stock in the public market
after the restrictions lapse. This may adversely affect the
prevailing market price and our ability to raise equity capital
in the future.
Upon completion of this offering, we will
have shares
of common stock outstanding, assuming the exercise of the
underwriters’ over-allotment option, the conversion
of
outstanding shares of preferred stock and no exercise of any
options and warrants outstanding as
of .
Of these shares,
the shares,
or shares
if the underwriters exercise their over-allotment option in
full, sold in this offering will be freely transferable without
restriction or registration under the Securities Act, except for
any shares purchased by one of our existing
“affiliates,” as that term is defined in Rule 144
under the Securities Act. The
remaining shares
of common stock existing are “restricted shares” as
defined in Rule 144. Restricted shares may be sold in the
public market only if registered or if they qualify for an
exemption from registration under Rules 144 or 701 of the
Securities Act. As a result of the contractual
180-day
lock-up
period (subject to customary extension) described below and the
provisions of Rules 144 and 701, these shares will be
available for sale in the public market as follows:
| |
|
|
|
Number of Shares
|
|
Date
|
|
|
|
|
|
On the date of this prospectus.
|
|
|
|
After 90 days from the date of this prospectus.
|
|
|
|
After 180 days from the date of this prospectus (subject,
in some cases, to volume limitations).
|
|
|
|
At various times after 180 days from the date of this
prospectus (subject, in some cases, to volume limitations).
|
Rule 144
In general, under Rule 144 as currently in effect, once we
have been a reporting company subject to the reporting
requirements of Section 13 or Section 15(d) of the
Exchange Act for 90 days, an affiliate who has beneficially
owned restricted shares of our common stock for at least six
months would be entitled to sell within any three-month period a
number of shares that does not exceed the greater of either of
the following:
|
|
|
| |
•
|
1% of the number of shares of common stock then outstanding,
which will equal shares immediately after this offering; and
|
| |
| |
•
|
the average weekly reported volume of trading of our common
stock during the four calendar weeks preceding the filing of a
notice on Form 144 with respect to the sale.
|
However, the six month holding period increases to one year in
the event we have not been a reporting company for at least
90 days. In addition, any sales by affiliates under
Rule 144 are also limited by manner of sale provisions and
notice requirements and the availability of current public
information about us.
The volume limitation, manner of sale and notice provisions
described above will not apply to sales by non-affiliates. For
purposes of Rule 144, a non-affiliate is any person or
entity who is not our affiliate at the time of sale and has not
been our affiliate during the preceding three months. Once we
have been a reporting company for 90 days, a non-affiliate
who has beneficially owned restricted shares of our common stock
for six months may rely on Rule 144 provided that certain
public information regarding us is available. The six month
holding period increases to one year in the event we have not
been a reporting company for at least 90 days. However, a
non-affiliate who has beneficially owned the restricted shares
proposed to be sold for at least one year will not be subject to
any restrictions under Rule 144 regardless of how long we
have been a reporting company.
124
We are unable to estimate the number of shares that will be sold
under Rule 144 since this will depend on the market price
for our common stock, the personal circumstances of the
stockholder and other factors.
Rule 701
In general, our employees, directors, officers, consultants or
advisors who purchase shares from us under Rule 701 in
connection with a compensatory stock or option plan or other
written agreement before the effective date of this offering are
entitled to resell such shares 90 days after the effective
date of this offering in reliance on Rule 144, without
having to comply with the holding period requirements of
Rule 144 described above, but subject to the lock-up
agreements described below.
Registration
Rights
Prior to the consummation of this offering, we shall enter into
a registration rights agreement with ACAS and certain of its
affiliates, Thomas D. Logan, W. Antony Besso and certain other
of our stockholders, under which these stockholders may require
us to register their shares of common stock under the securities
laws for sale. Registration of these shares under the Securities
Act would result in these shares becoming freely tradable
without restriction under the Securities Act immediately upon
the effectiveness of the registration, except for shares
purchased by affiliates.
Stock
Options
As of June 30, 2009, options to purchase a total of
113,288 shares of common stock were outstanding. All of the
shares subject to options are subject to
lock-up
agreements. An additional 5,402 shares of common stock were
available for future option grants under our Stock Plan.
Upon the consummation of this offering, we intend to file a
registration statement under the Securities Act covering all
shares of common stock subject to outstanding options or
issuable pursuant to our equity plans. Shares registered under
this registration statement will be available for sale in the
open market, subject to Rule 144 volume limitations
applicable to affiliates, vesting restrictions with us or the
contractual restrictions described below.
Lock-up
Agreements
Our officers, directors and substantially all of our
stockholders, who hold an aggregate of
approximately shares
of our common stock, have agreed, subject to customary
exceptions, not to offer, pledge, sell, contract to sell, sell
any option or contract to purchase, purchase any option or
contract to sell, grant any option, right or warrant to
purchase, or otherwise transfer or dispose of, directly or
indirectly, or enter into any swap or other arrangement that
transfers to another, in whole or in part, any of the economic
consequences of ownership of any shares of common stock or any
securities convertible into or exercisable or exchangeable for
shares of common stock for a period of 180 days after the
date of this prospectus, without the prior written consent of
each of Credit Suisse Securities (USA) LLC, Merrill Lynch,
Pierce, Fenner & Smith Incorporated and
J.P. Morgan Securities Inc.
MATERIAL
U.S. FEDERAL TAX CONSIDERATIONS FOR
NON-U.S.
HOLDERS OF COMMON STOCK
The following is a general discussion of the material
U.S. federal income and estate tax consequences of the
ownership and disposition of our common stock by a beneficial
owner that is a
“Non-U.S. Holder,”
other than a
Non-U.S. Holder
that owns, or has owned, actually or constructively, more than
5% of our common stock. A
“Non-U.S. Holder”
is a person or entity that, for U.S. federal income tax
purposes, is a:
|
|
|
| |
•
|
nonresident alien individual, other than a former citizen or
resident of the United States subject to tax as an expatriate;
|
| |
| |
•
|
foreign corporation; or
|
| |
| |
•
|
foreign estate or trust.
|
125
A
“Non-U.S. Holder”
generally does not include a nonresident alien individual who is
present in the United States for 183 days or more in the
taxable year of disposition of our common stock. Such an
individual is urged to consult his or her own tax adviser
regarding the U.S. federal income tax consequences of the
sale, exchange or other disposition of our common stock.
If an entity that is classified as a partnership for
U.S. federal income tax purposes holds our common stock,
the U.S. federal income tax treatment of a partner will
generally depend on the status of the partner and the activities
of the partnership. Partnerships holding our common stock and
partners in such partnerships are urged to consult their tax
advisers as to the particular U.S. federal income tax
consequences of holding and disposing of our common stock.
This discussion is based on the Internal Revenue Code of 1986,
as amended (the “Code”), and administrative
pronouncements, judicial decisions and final, temporary and
proposed Treasury Regulations, changes to any of which
subsequent to the date of this prospectus may affect the tax
consequences described herein. This discussion does not address
all aspects of U.S. federal income and estate taxation that
may be relevant to
Non-U.S. Holders
in light of their particular circumstances and does not address
any tax consequences arising under the laws of any state, local
or foreign jurisdiction. Prospective holders are urged to
consult their tax advisers with respect to the particular tax
consequences to them of owning and disposing of our common
stock, including the consequences under the laws of any state,
local or foreign jurisdiction.
Dividends
As discussed under “Dividend Policy” above, we do not
currently expect to pay dividends. In the event that we do pay
dividends, dividends paid to a
Non-U.S. Holder
of our common stock generally will be subject to withholding tax
at a 30% rate or a reduced rate specified by an applicable
income tax treaty. In order to obtain a reduced rate of
withholding, a
Non-U.S. Holder
will be required to provide an Internal Revenue Service
Form W-8BEN
certifying its entitlement to benefits under a treaty.
If a
Non-U.S. Holder
is engaged in a trade or business in the United States, and if
dividends paid to the
Non-U.S. Holder
are effectively connected with the conduct of this trade or
business (and, if required by an applicable income tax treaty,
are attributable to a U.S. permanent establishment), the
Non-U.S. Holder,
although exempt from the withholding tax discussed in the
preceding paragraph, will generally be taxed in the same manner
as a U.S. person. Such a
Non-U.S. Holder
will be required to provide a properly executed Internal Revenue
Service
Form W-8ECI
in order to claim an exemption from withholding. A
non-U.S. corporation
receiving effectively connected dividends may also be subject to
an additional “branch profits tax” imposed at a rate
of 30% (or a lower treaty rate).
Gain on
Disposition of Common Stock
Subject to the backup withholding rules discussed below, a
Non-U.S. Holder
generally will not be subject to U.S. federal income tax on
gain realized on a sale or other disposition of our common stock
unless:
|
|
|
| |
•
|
the gain is effectively connected with a trade or business of
the
non-U.S. holder
in the United States, or
|
| |
| |
•
|
we are or have been a U.S. real property holding
corporation, as defined in the Code, at any time within the
five-year period preceding the disposition or the
Non-U.S. Holder’s
holding period, whichever period is shorter, and our common
stock has ceased to be traded on an established securities
market prior to the beginning of the calendar year in which the
sale or disposition occurs.
|
We believe that we are not, and do not anticipate becoming, a
U.S. real property holding corporation.
If a
Non-U.S. Holder
is engaged in a trade or business in the United States and gain
recognized by the
Non-U.S. Holder
on a sale or other disposition of our common stock is
effectively connected with the conduct of such trade or
business, the
Non-U.S. Holder
will generally be taxed in the same manner as a
U.S. person, subject to an applicable income tax treaty
providing otherwise.
Non-U.S. Holders
whose gain from dispositions of our common stock may be
effectively connected with a conduct of a trade or business in
the United States are urged to consult their own tax advisers
with respect to the U.S. tax consequences of the ownership
and disposition of our common stock, including the possible
imposition of a branch profits tax.
126
Information
Reporting Requirements and Backup Withholding
Information returns will be filed with the Internal Revenue
Service in connection with payments of dividends on our common
stock. Unless the
Non-U.S. Holder
complies with certification procedures to establish that it is
not a U.S. person, information returns may be filed with
the Internal Revenue Service in connection with the proceeds
from a sale or other disposition of our common stock and the
Non-U.S. Holder
may be subject to backup withholding on dividend payments on our
common stock or on the proceeds from a sale or other disposition
of our common stock. The certification procedures required to
claim a reduced rate of withholding under a treaty described
above will satisfy the certification requirements necessary to
avoid backup withholding as well. The amount of any backup
withholding from a payment to a
Non-U.S. Holder
will be allowed as a credit against such holder’s
U.S. federal income tax liability and may entitle such
holder to a refund, provided that the required information is
timely furnished to the Internal Revenue Service.
Federal
Estate Tax
Individual
Non-U.S. Holders
and entities the property of which is potentially includible in
such an individual’s gross estate for U.S. federal
estate tax purposes (for example, a trust funded by such an
individual and with respect to which the individual has retained
certain interests or powers), should note that, absent an
applicable treaty benefit, our common stock will be treated as
U.S. situs property subject to U.S. federal estate tax.
127
UNDERWRITING
Under the terms and subject to the conditions contained in an
underwriting agreement
dated ,
we have agreed to sell to the underwriters named below, for whom
Credit Suisse Securities (USA) LLC, Merrill Lynch, Pierce,
Fenner & Smith Incorporated and J.P. Morgan
Securities Inc. are acting as representatives, the following
respective numbers of shares of common stock:
| |
|
|
|
|
|
|
|
Number
|
|
|
Underwriter
|
|
of Shares
|
|
|
|
|
Credit Suisse Securities (USA) LLC
|
|
|
|
|
|
Merrill Lynch, Pierce, Fenner & Smith
Incorporated
|
|
|
|
|
|
J.P. Morgan Securities Inc.
|
|
|
|
|
|
Robert W. Baird & Co.
|
|
|
|
|
|
|
|
|
|
|
|
Total
|
|
|
|
|
|
|
|
|
|
|
The underwriting agreement provides that the underwriters are
obligated to purchase all the shares of common stock in this
offering if any are purchased, other than those shares covered
by the over-allotment option described below. The underwriting
agreement also provides that if an underwriter defaults, the
purchase commitments of non-defaulting underwriters may be
increased or this offering may be terminated.
We have granted to the underwriters a
30-day
option to purchase on a pro rata basis up
to
additional shares from us at the initial public offering price
less the underwriting discounts and commissions. The option may
be exercised only to cover any over allotments of common stock.
The underwriters propose to offer the shares of common stock
initially at the public offering price on the cover page of this
prospectus and to selling group members at that price less a
selling concession of $ per share.
The underwriters and selling group members may allow a discount
of $ per share on sales to other
broker/dealers. After the initial public offering the
representatives may change the public offering price and
concession and discount to broker/dealers.
The following table summarizes the compensation and estimated
expenses we will pay:
| |
|
|
|
|
|
|
|
|
|
|
|
|
|
|
|
|
|
|
|
Per Share
|
|
|
Total
|
|
|
|
|
Without
|
|
|
With
|
|
|
Without
|
|
|
With
|
|
|
|
|
Over-Allotment
|
|
|
Over-Allotment
|
|
|
Over-Allotment
|
|
|
Over-Allotment
|
|
|
|
|
Underwriting Discounts and Commissions paid by us
|
|
$
|
|
|
|
$
|
|
|
|
$
|
|
|
|
$
|
|
|
|
Expenses payable by us
|
|
$
|
|
|
|
$
|
|
|
|
$
|
|
|
|
$
|
|
|
The representatives have informed us that they do not expect
sales to accounts over which the underwriters have discretionary
authority to exceed 5% of the shares of common stock being
offered. The underwriters will not confirm sales to any accounts
over which they exercise discretionary authority without first
receiving a written consent from those accounts.
We have agreed that we will not offer, sell, contract to sell,
pledge or otherwise dispose of, directly or indirectly, or file
with the Securities and Exchange Commission a registration
statement under the Securities Act relating to, any shares of
our common stock or securities convertible into or exchangeable
or exercisable for any shares of our common stock, or publicly
disclose the intention to make any offer, sale, pledge,
disposition or filing, without the prior written consent of each
of Credit Suisse Securities (USA) LLC, Merrill Lynch,
Pierce, Fenner & Smith Incorporated and
J.P. Morgan Securities Inc. for a period of 180 days
after the date of this prospectus. However, in the event that
either (1) during the last 17 days of the
“lock-up”
period, we release earnings results or material news or a
material event relating to us occurs or (2) prior to the
expiration of the
“lock-up”
period, we announce that we will release earnings results during
the 16-day
period beginning on the last day of the
“lock-up”
period, then in either case the expiration of the
“lock-up”
will be extended until the
128
expiration of the
18-day
period beginning on the date of the release of the earnings
results or the occurrence of the material news or event, as
applicable, unless each of Credit Suisse Securities (USA) LLC,
Merrill Lynch, Pierce, Fenner & Smith Incorporated and
J.P. Morgan Securities Inc. waives, in writing, such an
extension.
Our officers, directors and substantially all of our
stockholders have agreed that they will not offer, sell,
contract to sell, pledge or otherwise dispose of, directly or
indirectly, any shares of our common stock or securities
convertible into or exchangeable or exercisable for any shares
of our common stock, enter into a transaction that would have
the same effect, or enter into any swap, hedge or other
arrangement that transfers, in whole or in part, any of the
economic consequences of ownership of our common stock, whether
any of these transactions are to be settled by delivery of our
common stock or other securities, in cash or otherwise, or
publicly disclose the intention to make any offer, sale, pledge
or disposition, or to enter into any transaction, swap, hedge or
other arrangement, without, in each case, the prior written
consent of each of Credit Suisse Securities (USA) LLC, Merrill
Lynch, Pierce, Fenner & Smith Incorporated and
J.P. Morgan Securities Inc. for a period of 180 days
after the date of this prospectus, subject to customary
exceptions. However, in the event that either (1) during
the last 17 days of the
“lock-up”
period, we release earnings results or material news or a
material event relating to us occurs or (2) prior to the
expiration of the
“lock-up”
period, we announce that we will release earnings results during
the 16-day
period beginning on the last day of the
“lock-up”
period, then in either case the expiration of the
“lock-up”
will be extended until the expiration of the
18-day
period beginning on the date of the release of the earnings
results or the occurrence of the material news or event, as
applicable, unless each of Credit Suisse Securities (USA) LLC,
Merrill Lynch, Pierce, Fenner & Smith Incorporated and
J.P. Morgan Securities Inc. waives, in writing, such an
extension.
We have agreed to indemnify the underwriters against liabilities
under the Securities Act, or contribute to payments that the
underwriters may be required to make in that respect.
We will apply to list the shares of common stock on the NASDAQ
Global Market.
In connection with this offering, the underwriters may engage in
stabilizing transactions, over-allotment transactions, syndicate
covering transactions and penalty bids in accordance with
Regulation M under the Exchange Act.
|
|
|
| |
•
|
Stabilizing transactions permit bids to purchase the underlying
security so long as the stabilizing bids do not exceed a
specified maximum.
|
| |
| |
•
|
Over-allotment involves sales by the underwriters of shares in
excess of the number of shares the underwriters are obligated to
purchase, which creates a syndicate short position. The short
position may be either a covered short position or a naked short
position. In a covered short position, the number of shares
over-allotted by the underwriters is not greater than the number
of shares that they may purchase in the over-allotment option.
In a naked short position, the number of shares involved is
greater than the number of shares in the over-allotment option.
The underwriters may close out any covered short position by
either exercising their over-allotment option
and/or
purchasing shares in the open market.
|
|
|
|
| |
•
|
Syndicate covering transactions involve purchases of the common
stock in the open market after the distribution has been
completed in order to cover syndicate short positions. In
determining the source of shares to close out the short
position, the underwriters will consider, among other things,
the price of shares available for purchase in the open market as
compared to the price at which they may purchase shares through
the over-allotment option. If the underwriters sell more shares
than could be covered by the over-allotment option, a naked
short position, the position can only be closed out by buying
shares in the open market. A naked short position is more likely
to be created if the underwriters are concerned that there could
be downward pressure on the price of the shares in the open
market after pricing that could adversely affect investors who
purchase in this offering.
|
|
|
|
| |
•
|
Penalty bids permit the representatives to reclaim a selling
concession from a syndicate member when the common stock
originally sold by the syndicate member is purchased in a
stabilizing or syndicate covering transaction to cover syndicate
short positions.
|
129
|
|
|
| |
•
|
In passive market making, market makers in the common stock who
are underwriters or prospective underwriters may, subject to
limitations, make bids for or purchases of our common stock
until the time, if any, at which a stabilizing bid is made.
|
These stabilizing transactions, syndicate covering transactions
and penalty bids may have the effect of raising or maintaining
the market price of our common stock or preventing or retarding
a decline in the market price of the common stock. As a result
the price of our common stock may be higher than the price that
might otherwise exist in the open market. These transactions, if
commenced, may be discontinued at any time.
A prospectus in electronic format may be made available on the
web sites maintained by one or more of the underwriters, or
selling group members, if any, participating in this offering
and one or more of the underwriters participating in this
offering may distribute prospectuses electronically. The
representatives may agree to allocate a number of shares to
underwriters and selling group members for sale to their online
brokerage account holders. Internet distributions will be
allocated by the underwriters and selling group members that
will make internet distributions on the same basis as other
allocations.
In connection with the consummation of this offering, we expect
to enter into new bank credit facilities with a group of lenders
that will include some of the underwriters and affiliates of
some of the underwriters, including J.P. Morgan Securities
Inc. The underwriters may in the future perform investment
banking, commercial banking and advising services for us and
certain of our affiliates from time to time for which they may
in the future receive customary fees and expenses.
130
NOTICE TO
CANADIAN RESIDENTS
Resale
Restrictions
The distribution of the shares of our common stock which are the
subject of this offering (the “Shares”) in Canada is
being made only on a private placement basis exempt from the
requirement that we prepare and file a prospectus with the
securities regulatory authorities in each province where trades
of the Shares are made. Any resale of the Shares in Canada must
be made under applicable securities laws which will vary
depending on the relevant jurisdiction, and which may require
resales to be made under available statutory exemptions or under
a discretionary exemption granted by the applicable Canadian
securities regulatory authority. Purchasers are advised to seek
legal advice prior to any resale of the Shares.
Representations
of Purchasers
By purchasing the Shares in Canada and accepting a purchase
confirmation a purchaser is representing to us and the dealer
from whom the purchase confirmation is received that:
|
|
|
| |
•
|
the purchaser is entitled under applicable provincial securities
laws to purchase the Shares without the benefit of a prospectus
qualified under those securities laws,
|
| |
| |
•
|
where required by law, that the purchaser is purchasing as
principal and not as agent,
|
| |
| |
•
|
the purchaser has reviewed the text above under Resale
Restrictions, and
|
| |
| |
•
|
the purchaser acknowledges and consents to the provision of
specified information concerning its purchase of the Shares to
the regulatory authority that by law is entitled to collect the
information.
|
Further details concerning the legal authority for this
information is available on request.
Rights of
Action—Ontario Purchasers Only
Under Ontario securities legislation, certain purchasers who
purchase a security offered by this prospectus during the period
of distribution will have a statutory right of action for
damages, or while still the owner of the Shares, for rescission
against us in the event that this prospectus contains a
misrepresentation without regard to whether the purchaser relied
on the misrepresentation. The right of action for damages is
exercisable not later than the earlier of 180 days from the
date the purchaser first had knowledge of the facts giving rise
to the cause of action and three years from the date on which
payment is made for the Shares. The right of action for
rescission is exercisable not later than 180 days from the
date on which payment is made for the Shares. If a purchaser
elects to exercise the right of action for rescission, the
purchaser will have no right of action for damages against us.
In no case will the amount recoverable in any action exceed the
price at which the Shares were offered to the purchaser and if
the purchaser is shown to have purchased the securities with
knowledge of the misrepresentation, we will have no liability.
In the case of an action for damages, we will not be liable for
all or any portion of the damages that are proven to not
represent the depreciation in value of the Shares as a result of
the misrepresentation relied upon. These rights are in addition
to, and without derogation from, any other rights or remedies
available at law to an Ontario purchaser. The foregoing is a
summary of the rights available to an Ontario purchaser. Ontario
purchasers should refer to the complete text of the relevant
statutory provisions.
Enforcement
of Legal Rights
All of our directors and officers as well as the experts named
herein may be located outside of Canada and, as a result, it may
not be possible for Canadian purchasers to effect service of
process within Canada upon us or those persons. All or a
substantial portion of our assets and the assets of those
persons may be located outside of Canada and, as a result, it
may not be possible to satisfy a judgment against us or those
persons in Canada or to enforce a judgment obtained in Canadian
courts against us or those persons outside of Canada.
Taxation
and Eligibility for Investment
Canadian purchasers of the Shares should consult their own legal
and tax advisors with respect to the tax consequences of an
investment in the in their particular circumstances and about
the eligibility of
the
for investment by the purchaser under relevant Canadian
legislation.
131
NOTICE TO
RESIDENTS OF THE
EUROPEAN ECONOMIC AREA AND THE UNITED KINGDOM
In relation to each Member State of the European Economic Area
which has implemented the Prospectus Directive (each, a
“Relevant Member State”) an offer to the public of the
Shares which are the subject of the offering contemplated by
this prospectus may not be made in that Relevant Member State
except that an offer to the public in that Relevant Member State
of the Shares may be made at any time under the following
exemptions under the Prospectus Directive, if they have been
implemented in that Relevant Member State:
(a) to legal entities which are authorised or regulated to
operate in the financial markets or, if not so authorised or
regulated, whose corporate purpose is solely to invest in
securities;
(b) to any legal entity which has two or more of
(1) an average of at least 250 employees during the
last financial year; (2) a total balance sheet of more than
€43,000,000 and (3) an annual net turnover of more
than €50,000,000, as shown in its last annual or
consolidated accounts;
(c) by the underwriters to fewer than 100 natural or legal
persons (other than “qualified investors” as defined
in the Prospectus Directive) subject to obtaining the prior
consent of each of Credit Suisse Securities (USA) LLC, Merrill
Lynch, Pierce, Fenner & Smith Incorporated and
J.P. Morgan Securities Inc. for any such offer; or
(d) in any other circumstances falling within
Article 3(2) of the Prospectus Directive,
provided that no such offer of the Shares shall result in a
requirement for the publication by us or any underwriter of a
prospectus pursuant to Article 3 of the Prospectus
Directive.
Any person making or intending to make any offer within the EEA
of the Shares which are the subject of the offering contemplated
in this prospectus should only do so in circumstances in which
no obligation arises for us or any of the underwriters to
produce a prospectus for such offer. Neither we nor the
underwriters have authorised, nor do they authorise, the making
of any offer of the Shares through any financial intermediary,
other than offers made by underwriters which constitute the
final offering of Shares contemplated in this prospectus.
For the purposes of this provision, and the buyer’s
representation below, the expression an “offer to the
public” in relation to the Shares in any Relevant Member
State means the communication in any form and by any means of
sufficient information on the terms of the offer and the Shares
to be offered so as to enable an investor to decide to purchase
the Shares, as the same may be varied in that Relevant Member
State by any measure implementing the Prospectus Directive in
that Relevant Member State and the expression “Prospectus
Directive” means Directive 2003/71/EC and includes any
relevant implementing measure in each Relevant Member State.
Buyer’s
Representation
Each person in a Relevant Member State who receives any
communication in respect of, or who acquires the Shares under,
the offers contemplated in this prospectus will be deemed to
have represented, warranted and agreed to and with each
underwriter and us that:
(a) it is a qualified investor within the meaning of the
law in that Relevant Member State implementing
Article 2(1)(e) of the Prospectus Directive; and
(b) in the case of the Shares acquired by it as a financial
intermediary, as that term is used in Article 3(2) of the
Prospectus Directive, (i) the Shares acquired by it in the
offering have not been acquired on behalf of, nor have they been
acquired with a view to their offer or resale to, persons in any
Relevant Member State other than “qualified investors”
as defined in the Prospectus Directive, or in circumstances in
which the prior consent of each of Credit Suisse Securities
(USA) LLC, Merrill Lynch, Pierce, Fenner & Smith
Incorporated and J.P. Morgan Securities Inc. has been given
to the offer or resale; or (ii) where the Shares have been
acquired by it on behalf of persons in any Relevant Member State
other than qualified investors, the offer of the Shares to it is
not treated under the Prospectus Directive as having been made
to such persons.
132
NOTICE TO
PROSPECTIVE INVESTORS IN SWITZERLAND
This document as well as any other material relating to the
Shares which are the subject of the offering contemplated by
this prospectus do not constitute an issue prospectus pursuant
to Article 652a of the Swiss Code of Obligations. The
Shares will not be listed on the SIX Swiss Exchange and,
therefore, the documents relating to the Shares, including, but
not limited to, this document, do not claim to comply with the
disclosure standards of the listing rules of SIX Swiss Exchange
and corresponding prospectus schemes annexed to the listing
rules of the SIX Swiss Exchange.
The Shares are being offered in Switzerland by way of a private
placement, i.e., to a small number of selected investors only,
without any public offer and only to investors who do not
purchase the Shares with the intention to distribute them to the
public. The investors will be individually approached by the
Issuer from time to time.
This document as well as any other material relating to the
Shares is personal and confidential and do not constitute an
offer to any other person. This document may only be used by
those investors to whom it has been handed out in connection
with the offering described herein and may neither directly nor
indirectly be distributed or made available to other persons
without express consent of the Issuer. It may not be used in
connection with any other offer and shall in particular not be
copied
and/or
distributed to the public in (or from) Switzerland.
133
NOTICE TO
PROSPECTIVE INVESTORS IN THE DUBAI INTERNATIONAL FINANCIAL
CENTRE
This document relates to an exempt offer in accordance with the
Offered Securities Rules of the Dubai Financial Services
Authority. This document is intended for distribution only to
persons of a type specified in those rules. It must not be
delivered to, or relied on by, any other person. The Dubai
Financial Services Authority has no responsibility for reviewing
or verifying any documents in connection with exempt offers. The
Dubai Financial Services Authority has not approved this
document nor taken steps to verify the information set out in
it, and has no responsibility for it. The Shares which are the
subject of the offering contemplated by this prospectus may be
illiquid
and/or
subject to restrictions on their resale. Prospective purchasers
of the Shares offered should conduct their own due diligence on
the Shares. If you do not understand the contents of this
document you should consult an authorised financial adviser.
134
LEGAL
MATTERS
The validity of the issuance of the shares of common stock
offered hereby will be passed upon for us by Davis
Polk & Wardwell LLP, Menlo Park, California and by
Latham & Watkins LLP, Menlo Park, California for the
underwriters.
EXPERTS
The consolidated financial statements of Mirion Technologies,
Inc. at June 30, 2009 and 2008, and for each of the three
years in the period ended June 30, 2009, appearing in this
prospectus and Registration Statement have been audited by
Ernst & Young LLP, independent registered public
accounting firm, as set forth in their report thereon appearing
elsewhere herein, and are included in reliance upon such report
given on the authority of such firm as experts in accounting and
auditing.
WHERE YOU
CAN FIND MORE INFORMATION
We have filed with the SEC, Washington, D.C. 20549, a
Registration Statement on
Form S-1
under the Securities Act with respect to the common stock
offered hereby. This prospectus does not contain all of the
information set forth in the registration statement and the
exhibits and schedules thereto. For further information with
respect to the company and its common stock, reference is made
to the Registration Statement and the exhibits and any schedules
filed therewith. Statements contained in this prospectus as to
the contents of any contract or other document referred to are
not necessarily complete and in each instance, if such contract
or document is filed as an exhibit, reference is made to the
copy of such contract or other document filed as an exhibit to
the registration statement, each statement being qualified in
all respects by such reference. A copy of the registration
statement, including the exhibits and schedules thereto, may be
read and copied at the SEC’s Public Reference Room at
100 F Street, N.E., Washington, D.C. 20549.
Information on the operation of the Public Reference Room may be
obtained by calling the SEC at
1-800-SEC-0330.
In addition, the SEC maintains an Internet website that contains
reports, proxy statements and other information about issuers,
like us, that file electronically with the SEC. The address of
that site is www.sec.gov. The registration statement, including
the exhibits and schedules thereto, are also available for
reading and copying at the offices of NASDAQ Operations,
1735 K Street, N.W., Washington, D.C. 20006.
As a result of this offering, we will become subject to the full
informational requirements of the Securities Exchange Act of
1934, as amended. We will fulfill our obligations with respect
to such requirements by filing periodic reports and other
information with the SEC. We intend to furnish our stockholders
with annual reports containing consolidated financial statements
certified by an independent public accounting firm. We also
maintain an Internet site at www.mirion.com. Our website and the
information contained therein or connected thereto shall not be
deemed to be incorporated into this prospectus or the
registration statement of which it forms a part.
135
MIRION
TECHNOLOGIES, INC. AND SUBSIDIARIES
| |
|
|
|
|
|
|
|
Page
|
|
|
|
Mirion Technologies, Inc. Consolidated Financial
Statements:
|
|
|
|
|
|
|
|
|
F-2
|
|
|
|
|
|
F-3
|
|
|
|
|
|
F-4
|
|
|
|
|
|
F-5
|
|
|
|
|
|
F-6
|
|
|
|
|
|
F-7
|
|
F-1
REPORT OF
ERNST & YOUNG LLP,
INDEPENDENT REGISTERED PUBLIC ACCOUNTING FIRM
The Board of Directors and Shareholders
Mirion Technologies, Inc.
We have audited the accompanying consolidated balance sheets of
Mirion Technologies, Inc. and subsidiaries (the Company) as of
June 30, 2009 and 2008, and the related consolidated
statements of operations, stockholders’ equity, and cash
flows for each of the three years in the period ended
June 30, 2009. These financial statements are the
responsibility of the Company’s management. Our
responsibility is to express an opinion on these financial
statements based on our audits.
We conducted our audits in accordance with the standards of the
Public Company Accounting Oversight Board (United States). Those
standards require that we plan and perform the audit to obtain
reasonable assurance about whether the financial statements are
free of material misstatement. We were not engaged to perform an
audit of the Company’s internal control over financial
reporting. Our audits included consideration of internal control
over financial reporting as a basis for designing audit
procedures that are appropriate in the circumstances, but not
for the purpose of expressing an opinion on the effectiveness of
the Company’s internal control over financial reporting.
Accordingly, we express no such opinion. An audit also includes
examining, on a test basis, evidence supporting the amounts and
disclosures in the financial statements, assessing the
accounting principles used and significant estimates made by
management, and evaluating the overall financial statement
presentation. We believe that our audits provide a reasonable
basis for our opinion.
In our opinion, the financial statements referred to above
present fairly, in all material respects, the consolidated
financial position of Mirion Technologies, Inc. and subsidiaries
at June 30, 2009 and 2008, and the consolidated results of
their operations and their cash flows for each of the three
years in the period ended June 30, 2009, in conformity with
U.S. generally accepted accounting principles.
As discussed in Note 2 to the consolidated financial
statements, the Company adopted the provisions of Financial
Accounting Standards Board Interpretation No. 48,
Accounting for Uncertainty in Income Taxes — An
Interpretation of FASB No. 109, effective July 1,
2007.
/s/ Ernst & Young LLP
San Francisco, California
January 15, 2010
F-2
| |
|
|
|
|
|
|
|
|
|
|
|
|
|
|
|
|
|
|
|
|
|
|
|
|
|
|
|
|
|
|
|
|
|
|
|
|
Pro Forma
|
|
|
|
|
|
|
|
|
|
|
|
|
|
|
|
|
Pro Forma
|
|
|
As Adjusted
|
|
|
|
|
|
|
|
June 30,
|
|
|
December 31,
|
|
|
December 31,
|
|
|
December 31,
|
|
|
|
|
|
|
|
2008
|
|
|
2009
|
|
|
2009
|
|
|
2009
|
|
|
2009
|
|
|
|
|
|
|
|
|
|
|
|
|
|
(unaudited)
|
|
|
(unaudited)
|
|
|
(unaudited)
|
|
|
|
|
|
|
|
ASSETS
|
|
Current assets:
|
|
|
|
|
|
|
|
|
|
|
|
|
|
|
|
|
|
|
|
|
|
|
|
|
|
Cash and cash equivalents
|
|
$
|
8,959
|
|
|
$
|
5,390
|
|
|
$
|
6,934
|
|
|
|
|
|
|
|
|
|
|
|
|
|
|
Restricted cash — current
|
|
|
1,455
|
|
|
|
1,515
|
|
|
|
2,997
|
|
|
|
|
|
|
|
|
|
|
|
|
|
|
Accounts receivable — net of allowance for doubtful
accounts
|
|
|
36,710
|
|
|
|
40,165
|
|
|
|
50,168
|
|
|
|
|
|
|
|
|
|
|
|
|
|
|
Costs in excess of billings on uncompleted contracts
|
|
|
17,515
|
|
|
|
17,073
|
|
|
|
17,017
|
|
|
|
|
|
|
|
|
|
|
|
|
|
|
Receivables pledged to creditors
|
|
|
5,272
|
|
|
|
2,364
|
|
|
|
4,694
|
|
|
|
|
|
|
|
|
|
|
|
|
|
|
Inventories — net of provision for excess and obsolete
inventory
|
|
|
36,092
|
|
|
|
33,728
|
|
|
|
34,919
|
|
|
|
|
|
|
|
|
|
|
|
|
|
|
Prepaid expenses and other current assets
|
|
|
3,859
|
|
|
|
5,253
|
|
|
|
10,404
|
|
|
|
|
|
|
|
|
|
|
|
|
|
|
Deferred cost of revenue
|
|
|
24,522
|
|
|
|
29,536
|
|
|
|
27,324
|
|
|
|
|
|
|
|
|
|
|
|
|
|
|
Deferred income taxes — current
|
|
|
5,691
|
|
|
|
5,541
|
|
|
|
6,787
|
|
|
|
|
|
|
|
|
|
|
|
|
|
|
|
|
|
|
|
|
|
|
|
|
|
|
|
|
|
|
|
|
|
|
|
|
|
|
|
|
Total current assets
|
|
|
140,075
|
|
|
|
140,565
|
|
|
|
161,244
|
|
|
|
|
|
|
|
|
|
|
|
|
|
|
Property, plant and equipment — net
|
|
|
17,618
|
|
|
|
18,080
|
|
|
|
18,682
|
|
|
|
|
|
|
|
|
|
|
|
|
|
|
Goodwill
|
|
|
147,678
|
|
|
|
139,021
|
|
|
|
140,407
|
|
|
|
|
|
|
|
|
|
|
|
|
|
|
Intangible assets — net
|
|
|
33,171
|
|
|
|
23,688
|
|
|
|
20,225
|
|
|
|
|
|
|
|
|
|
|
|
|
|
|
Restricted cash
|
|
|
3,909
|
|
|
|
4,532
|
|
|
|
3,907
|
|
|
|
|
|
|
|
|
|
|
|
|
|
|
Deferred income taxes
|
|
|
230
|
|
|
|
2,794
|
|
|
|
3,155
|
|
|
|
|
|
|
|
|
|
|
|
|
|
|
Other assets
|
|
|
1,696
|
|
|
|
1,074
|
|
|
|
920
|
|
|
|
|
|
|
|
|
|
|
|
|
|
|
|
|
|
|
|
|
|
|
|
|
|
|
|
|
|
|
|
|
|
|
|
|
|
|
|
|
Total assets
|
|
$
|
344,377
|
|
|
$
|
329,754
|
|
|
$
|
348,540
|
|
|
|
|
|
|
|
|
|
|
|
|
|
|
|
|
|
|
|
|
|
|
|
|
|
|
|
|
|
|
|
|
|
|
|
|
|
|
|
|
|
|
LIABILITIES AND STOCKHOLDERS’ EQUITY
|
|
Current liabilities:
|
|
|
|
|
|
|
|
|
|
|
|
|
|
|
|
|
|
|
|
|
|
|
|
|
|
Accounts payable
|
|
$
|
25,323
|
|
|
$
|
19,088
|
|
|
$
|
22,711
|
|
|
|
|
|
|
|
|
|
|
|
|
|
|
Accrued expenses and other current liabilities
|
|
|
34,802
|
|
|
|
35,008
|
|
|
|
30,872
|
|
|
|
|
|
|
|
|
|
|
|
|
|
|
Income taxes payable
|
|
|
2,840
|
|
|
|
1,452
|
|
|
|
1,657
|
|
|
|
|
|
|
|
|
|
|
|
|
|
|
Deferred contract revenue
|
|
|
53,539
|
|
|
|
62,031
|
|
|
|
66,747
|
|
|
|
|
|
|
|
|
|
|
|
|
|
|
Deferred income tax liabilities — current
|
|
|
1,831
|
|
|
|
736
|
|
|
|
850
|
|
|
|
|
|
|
|
|
|
|
|
|
|
|
Notes payable — current
|
|
|
9,033
|
|
|
|
6,442
|
|
|
|
5,177
|
|
|
|
|
|
|
|
|
|
|
|
|
|
|
Notes payable to ACAS — current
|
|
|
520
|
|
|
|
520
|
|
|
|
520
|
|
|
|
|
|
|
|
|
|
|
|
|
|
|
|
|
|
|
|
|
|
|
|
|
|
|
|
|
|
|
|
|
|
|
|
|
|
|
|
|
Total current liabilities
|
|
|
127,888
|
|
|
|
125,277
|
|
|
|
128,534
|
|
|
|
|
|
|
|
|
|
|
|
|
|
|
Notes payable to ACAS
|
|
|
172,666
|
|
|
|
169,560
|
|
|
|
183,270
|
|
|
|
|
|
|
|
|
|
|
|
|
|
|
Notes payable
|
|
|
1,200
|
|
|
|
762
|
|
|
|
622
|
|
|
|
|
|
|
|
|
|
|
|
|
|
|
Deferred income taxes
|
|
|
11,795
|
|
|
|
14,339
|
|
|
|
14,861
|
|
|
|
|
|
|
|
|
|
|
|
|
|
|
Other liabilities
|
|
|
11,676
|
|
|
|
12,969
|
|
|
|
13,573
|
|
|
|
|
|
|
|
|
|
|
|
|
|
|
|
|
|
|
|
|
|
|
|
|
|
|
|
|
|
|
|
|
|
|
|
|
|
|
|
|
Total liabilities
|
|
|
325,225
|
|
|
|
322,907
|
|
|
|
340,860
|
|
|
|
|
|
|
|
|
|
|
|
|
|
|
|
|
|
|
|
|
|
|
|
|
|
|
|
|
|
|
|
|
|
|
|
|
|
|
|
|
Commitments and contingencies (Note 9)
|
|
|
|
|
|
|
|
|
|
|
|
|
|
|
|
|
|
|
|
|
|
|
|
|
|
Stockholders’ equity:
|
|
|
|
|
|
|
|
|
|
|
|
|
|
|
|
|
|
|
|
|
|
|
|
|
|
Convertible Participating Preferred stock —
$0.001 par value;
Series A-1
authorized, 1,200,000 shares; issued and outstanding
678,804 shares at June 30, 2008 and 2009 and
December 31, 2009 (unaudited);
Series A-2
authorized, 300,000 shares; issued and outstanding
70,000 shares at June 30, 2008 and 2009 and
December 31, 2009 (unaudited); no shares issued and
outstanding, pro forma (unaudited)
|
|
|
1
|
|
|
|
1
|
|
|
|
1
|
|
|
|
|
|
|
|
|
|
|
|
|
|
|
Common stock — $0.001 par value;
Class A — authorized 2,500,000 shares:
issued and outstanding, 2,091 shares at June 30, 2008
and 2009 and December 31, 2009 (unaudited);
Class B — authorized 700,000 shares; issued
and outstanding 45,650 shares at June 30, 2008 and
2009 and December 31, 2009
(unaudited); shares
issued and outstanding, pro forma (unaudited)
|
|
|
—
|
|
|
|
—
|
|
|
|
—
|
|
|
|
|
|
|
|
|
|
|
|
|
|
|
Additional paid-in capital
|
|
|
97,317
|
|
|
|
98,478
|
|
|
|
99,016
|
|
|
|
|
|
|
|
|
|
|
|
|
|
|
Accumulated deficit
|
|
|
(98,606
|
)
|
|
|
(102,561
|
)
|
|
|
(103,332
|
)
|
|
|
|
|
|
|
|
|
|
|
|
|
|
Accumulated other comprehensive income
|
|
|
20,440
|
|
|
|
10,929
|
|
|
|
11,995
|
|
|
|
|
|
|
|
|
|
|
|
|
|
|
|
|
|
|
|
|
|
|
|
|
|
|
|
|
|
|
|
|
|
|
|
|
|
|
|
|
Total stockholders’ equity
|
|
|
19,152
|
|
|
|
6,847
|
|
|
|
7,680
|
|
|
|
|
|
|
|
|
|
|
|
|
|
|
|
|
|
|
|
|
|
|
|
|
|
|
|
|
|
|
|
|
|
|
|
|
|
|
|
|
Total liabilities and stockholders’ equity
|
|
$
|
344,377
|
|
|
$
|
329,754
|
|
|
$
|
348,540
|
|
|
|
|
|
|
|
|
|
|
|
|
|
|
|
|
|
|
|
|
|
|
|
|
|
|
|
|
|
|
|
|
|
|
|
|
|
|
|
See notes to consolidated financial statements.
F-3
| |
|
|
|
|
|
|
|
|
|
|
|
|
|
|
|
|
|
|
|
|
|
|
|
|
|
|
Six Months Ended
|
|
|
|
|
Years Ended June 30,
|
|
|
December 31,
|
|
|
|
|
2007
|
|
|
2008
|
|
|
2009
|
|
|
2008
|
|
|
2009
|
|
|
|
|
|
|
|
|
|
|
|
|
|
(unaudited)
|
|
|
|
|
Revenue
|
|
$
|
169,033
|
|
|
$
|
191,769
|
|
|
$
|
201,763
|
|
|
$
|
100,519
|
|
|
$
|
108,658
|
|
|
Cost of revenue
|
|
|
94,321
|
|
|
|
102,790
|
|
|
|
105,954
|
|
|
|
53,793
|
|
|
|
60,140
|
|
|
|
|
|
|
|
|
|
|
|
|
|
|
|
|
|
|
|
|
|
|
|
|
Gross profit
|
|
|
74,712
|
|
|
|
88,979
|
|
|
|
95,809
|
|
|
|
46,726
|
|
|
|
48,518
|
|
|
|
|
|
|
|
|
|
|
|
|
|
|
|
|
|
|
|
|
|
|
|
|
Operating expenses:
|
|
|
|
|
|
|
|
|
|
|
|
|
|
|
|
|
|
|
|
|
|
Selling, general and administrative expenses
|
|
|
59,449
|
|
|
|
63,177
|
|
|
|
65,649
|
|
|
|
31,310
|
|
|
|
33,754
|
|
|
Research and development
|
|
|
11,875
|
|
|
|
14,865
|
|
|
|
11,282
|
|
|
|
6,277
|
|
|
|
5,202
|
|
|
|
|
|
|
|
|
|
|
|
|
|
|
|
|
|
|
|
|
|
|
|
|
Total operating expenses
|
|
|
71,324
|
|
|
|
78,042
|
|
|
|
76,931
|
|
|
|
37,587
|
|
|
|
38,956
|
|
|
|
|
|
|
|
|
|
|
|
|
|
|
|
|
|
|
|
|
|
|
|
|
Income from operations
|
|
|
3,388
|
|
|
|
10,937
|
|
|
|
18,878
|
|
|
|
9,139
|
|
|
|
9,562
|
|
|
Interest income
|
|
|
(127
|
)
|
|
|
(143
|
)
|
|
|
(78
|
)
|
|
|
(47
|
)
|
|
|
(17
|
)
|
|
Interest expense
|
|
|
19,280
|
|
|
|
20,350
|
|
|
|
17,789
|
|
|
|
9,783
|
|
|
|
7,587
|
|
|
Other income, net
|
|
|
(1,001
|
)
|
|
|
(1,759
|
)
|
|
|
(490
|
)
|
|
|
71
|
|
|
|
(530
|
)
|
|
|
|
|
|
|
|
|
|
|
|
|
|
|
|
|
|
|
|
|
|
|
|
(Loss) Income before provision for income taxes
|
|
|
(14,764
|
)
|
|
|
(7,511
|
)
|
|
|
1,657
|
|
|
|
(668
|
)
|
|
|
2,522
|
|
|
Provision for income taxes
|
|
|
4,937
|
|
|
|
5,838
|
|
|
|
5,612
|
|
|
|
2,890
|
|
|
|
3,293
|
|
|
|
|
|
|
|
|
|
|
|
|
|
|
|
|
|
|
|
|
|
|
|
|
Net loss
|
|
|
(19,701
|
)
|
|
|
(13,349
|
)
|
|
|
(3,955
|
)
|
|
|
(3,558
|
)
|
|
|
(771
|
)
|
|
Paid-in-kind preferred dividends
|
|
|
(8,141
|
)
|
|
|
(8,993
|
)
|
|
|
(9,892
|
)
|
|
|
(4,864
|
)
|
|
|
(5,369
|
)
|
|
|
|
|
|
|
|
|
|
|
|
|
|
|
|
|
|
|
|
|
|
|
|
Net loss allocable to common stockholders
|
|
$
|
(27,842
|
)
|
|
$
|
(22,342
|
)
|
|
$
|
(13,847
|
)
|
|
$
|
(8,422
|
)
|
|
$
|
(6,140
|
)
|
|
|
|
|
|
|
|
|
|
|
|
|
|
|
|
|
|
|
|
|
|
|
|
Net loss per common share allocable to common stockholders per
share — basic and diluted
|
|
$
|
(584.74
|
)
|
|
$
|
(468.72
|
)
|
|
$
|
(290.04
|
)
|
|
$
|
(176.41
|
)
|
|
$
|
(128.61
|
)
|
|
Weighted average number of shares used in computing net loss
allocable to common stockholders — basic and diluted
|
|
|
47,614
|
|
|
|
47,666
|
|
|
|
47,741
|
|
|
|
47,741
|
|
|
|
47,741
|
|
|
|
|
|
|
|
|
|
|
|
|
|
|
|
|
|
|
|
|
|
|
|
|
Pro forma net income per common share — basic
|
|
|
|
|
|
|
|
|
|
$
|
|
|
|
|
|
|
|
$
|
|
|
|
|
|
|
|
|
|
|
|
|
|
|
|
|
|
|
|
|
|
|
|
|
|
Pro forma net income per common share — diluted
|
|
|
|
|
|
|
|
|
|
$
|
|
|
|
|
|
|
|
$
|
|
|
|
|
|
|
|
|
|
|
|
|
|
|
|
|
|
|
|
|
|
|
|
|
|
Pro forma net income per common share — basic as
adjusted
|
|
|
|
|
|
|
|
|
|
$
|
|
|
|
|
|
|
|
$
|
|
|
|
|
|
|
|
|
|
|
|
|
|
|
|
|
|
|
|
|
|
|
|
|
|
Pro forma net income per common share — diluted as
adjusted
|
|
|
|
|
|
|
|
|
|
$
|
|
|
|
|
|
|
|
$
|
|
|
|
|
|
|
|
|
|
|
|
|
|
|
|
|
|
|
|
|
|
|
|
|
|
Shares used in computing pro forma net income per
share — basic and basic as adjusted
|
|
|
|
|
|
|
|
|
|
|
|
|
|
|
|
|
|
|
|
|
|
|
|
|
|
|
|
|
|
|
|
|
|
|
|
|
|
|
|
|
|
|
|
Shares used in computing pro forma net income per
share — diluted and diluted as adjusted
|
|
|
|
|
|
|
|
|
|
|
|
|
|
|
|
|
|
|
|
|
|
|
|
|
|
|
|
|
|
|
|
|
|
|
|
|
|
|
|
|
|
|
See notes to consolidated financial statements.
F-4
MIRION
TECHNOLOGIES, INC.
(in
thousands, except share amounts)
| |
|
|
|
|
|
|
|
|
|
|
|
|
|
|
|
|
|
|
|
|
|
|
|
|
|
|
|
|
|
|
|
|
|
|
|
Convertible
|
|
|
|
|
|
|
|
|
|
|
|
|
|
|
Accumulated
|
|
|
|
|
|
|
|
Participating
|
|
|
|
|
|
|
|
|
Additional
|
|
|
|
|
|
Other
|
|
|
Total
|
|
|
|
|
Preferred Stock
|
|
|
Common Stock
|
|
|
Paid-in
|
|
|
Accumulated
|
|
|
Comprehensive
|
|
|
Stockholders’
|
|
|
|
|
Shares
|
|
|
Amount
|
|
|
Shares
|
|
|
Amount
|
|
|
Capital
|
|
|
Deficit
|
|
|
Income (Loss)
|
|
|
Equity
|
|
|
BALANCE — June 30, 2006
|
|
|
748,804
|
|
|
$
|
1
|
|
|
|
47,637
|
|
|
|
—
|
|
|
$
|
96,864
|
|
|
$
|
(65,556
|
)
|
|
$
|
4,110
|
|
|
$
|
35,419
|
|
|
Stock issued for compensation
|
|
|
—
|
|
|
|
—
|
|
|
|
1,104
|
|
|
|
—
|
|
|
|
130
|
|
|
|
—
|
|
|
|
—
|
|
|
|
130
|
|
|
Stock-based compensation
|
|
|
—
|
|
|
|
—
|
|
|
|
—
|
|
|
|
—
|
|
|
|
177
|
|
|
|
—
|
|
|
|
—
|
|
|
|
177
|
|
|
Repurchase of common stock
|
|
|
—
|
|
|
|
—
|
|
|
|
(1,150
|
)
|
|
|
—
|
|
|
|
(115
|
)
|
|
|
—
|
|
|
|
—
|
|
|
|
(115
|
)
|
|
Preferred stock dividend
|
|
|
—
|
|
|
|
—
|
|
|
|
—
|
|
|
|
—
|
|
|
|
(8,141
|
)
|
|
|
—
|
|
|
|
—
|
|
|
|
(8,141
|
)
|
|
Dividends distributable
|
|
|
—
|
|
|
|
—
|
|
|
|
—
|
|
|
|
—
|
|
|
|
8,141
|
|
|
|
—
|
|
|
|
—
|
|
|
|
8,141
|
|
|
Components of comprehensive loss:
|
|
|
|
|
|
|
|
|
|
|
|
|
|
|
|
|
|
|
|
|
|
|
|
|
|
|
|
|
|
|
|
|
|
Net loss
|
|
|
—
|
|
|
|
—
|
|
|
|
—
|
|
|
|
—
|
|
|
|
—
|
|
|
|
(19,701
|
)
|
|
|
—
|
|
|
|
(19,701
|
)
|
|
Unrecognized actuarial gains and prior service benefit, net of
tax of $34
|
|
|
—
|
|
|
|
—
|
|
|
|
—
|
|
|
|
—
|
|
|
|
—
|
|
|
|
—
|
|
|
|
248
|
|
|
|
248
|
|
|
Foreign currency translation, net of tax of $0
|
|
|
—
|
|
|
|
—
|
|
|
|
—
|
|
|
|
—
|
|
|
|
—
|
|
|
|
—
|
|
|
|
5,105
|
|
|
|
5,105
|
|
|
|
|
|
|
|
|
|
|
|
|
|
|
|
|
|
|
|
|
|
|
|
|
|
|
|
|
|
|
|
|
|
|
|
|
Total comprehensive loss
|
|
|
—
|
|
|
|
—
|
|
|
|
—
|
|
|
|
—
|
|
|
|
—
|
|
|
|
—
|
|
|
|
—
|
|
|
|
(14,348
|
)
|
|
|
|
|
|
|
|
|
|
|
|
|
|
|
|
|
|
|
|
|
|
|
|
|
|
|
|
|
|
|
|
|
|
|
|
BALANCE — June 30, 2007
|
|
|
748,804
|
|
|
|
1
|
|
|
|
47,591
|
|
|
|
—
|
|
|
|
97,056
|
|
|
|
(85,257
|
)
|
|
|
9,463
|
|
|
|
21,263
|
|
|
Exercise of stock options
|
|
|
—
|
|
|
|
—
|
|
|
|
150
|
|
|
|
—
|
|
|
|
13
|
|
|
|
—
|
|
|
|
—
|
|
|
|
13
|
|
|
Stock-based compensation
|
|
|
—
|
|
|
|
—
|
|
|
|
—
|
|
|
|
—
|
|
|
|
248
|
|
|
|
—
|
|
|
|
—
|
|
|
|
248
|
|
|
Preferred stock dividend
|
|
|
—
|
|
|
|
—
|
|
|
|
—
|
|
|
|
—
|
|
|
|
(8,993
|
)
|
|
|
—
|
|
|
|
—
|
|
|
|
(8,993
|
)
|
|
Dividends distributable
|
|
|
—
|
|
|
|
—
|
|
|
|
—
|
|
|
|
—
|
|
|
|
8,993
|
|
|
|
—
|
|
|
|
—
|
|
|
|
8,993
|
|
|
Components of comprehensive loss:
|
|
|
|
|
|
|
|
|
|
|
|
|
|
|
|
|
|
|
|
|
|
|
|
|
|
|
|
|
|
|
|
|
|
Net loss
|
|
|
—
|
|
|
|
—
|
|
|
|
—
|
|
|
|
—
|
|
|
|
—
|
|
|
|
(13,349
|
)
|
|
|
—
|
|
|
|
(13,349
|
)
|
|
Unrecognized actuarial gains and prior service benefit, net of
tax of $65
|
|
|
—
|
|
|
|
—
|
|
|
|
—
|
|
|
|
—
|
|
|
|
—
|
|
|
|
—
|
|
|
|
161
|
|
|
|
161
|
|
|
Foreign currency translation, net of tax of $0
|
|
|
—
|
|
|
|
—
|
|
|
|
—
|
|
|
|
—
|
|
|
|
—
|
|
|
|
—
|
|
|
|
10,816
|
|
|
|
10,816
|
|
|
|
|
|
|
|
|
|
|
|
|
|
|
|
|
|
|
|
|
|
|
|
|
|
|
|
|
|
|
|
|
|
|
|
|
Total comprehensive loss
|
|
|
—
|
|
|
|
—
|
|
|
|
—
|
|
|
|
—
|
|
|
|
—
|
|
|
|
—
|
|
|
|
—
|
|
|
|
(2,372
|
)
|
|
|
|
|
|
|
|
|
|
|
|
|
|
|
|
|
|
|
|
|
|
|
|
|
|
|
|
|
|
|
|
|
|
|
|
BALANCE — June 30, 2008
|
|
|
748,804
|
|
|
|
1
|
|
|
|
47,741
|
|
|
|
—
|
|
|
|
97,317
|
|
|
|
(98,606
|
)
|
|
|
20,440
|
|
|
|
19,152
|
|
|
Stock-based compensation
|
|
|
—
|
|
|
|
—
|
|
|
|
—
|
|
|
|
—
|
|
|
|
1,161
|
|
|
|
—
|
|
|
|
—
|
|
|
|
1,161
|
|
|
Preferred stock dividend
|
|
|
—
|
|
|
|
—
|
|
|
|
—
|
|
|
|
—
|
|
|
|
(9,892
|
)
|
|
|
—
|
|
|
|
—
|
|
|
|
(9,892
|
)
|
|
Dividends distributable
|
|
|
—
|
|
|
|
—
|
|
|
|
—
|
|
|
|
—
|
|
|
|
9,892
|
|
|
|
—
|
|
|
|
—
|
|
|
|
9,892
|
|
|
Components of comprehensive loss:
|
|
|
|
|
|
|
|
|
|
|
|
|
|
|
|
|
|
|
|
|
|
|
|
|
|
|
|
|
|
|
|
|
|
Net loss
|
|
|
—
|
|
|
|
—
|
|
|
|
—
|
|
|
|
—
|
|
|
|
—
|
|
|
|
(3,955
|
)
|
|
|
—
|
|
|
|
(3,955
|
)
|
|
Unrecognized actuarial losses and prior service benefit, net of
tax of $22
|
|
|
—
|
|
|
|
—
|
|
|
|
—
|
|
|
|
—
|
|
|
|
—
|
|
|
|
—
|
|
|
|
(192
|
)
|
|
|
(192
|
)
|
|
Foreign currency translation, net of tax of $0
|
|
|
—
|
|
|
|
—
|
|
|
|
—
|
|
|
|
—
|
|
|
|
—
|
|
|
|
—
|
|
|
|
(9,319
|
)
|
|
|
(9,319
|
)
|
|
|
|
|
|
|
|
|
|
|
|
|
|
|
|
|
|
|
|
|
|
|
|
|
|
|
|
|
|
|
|
|
|
|
|
Total comprehensive loss
|
|
|
—
|
|
|
|
—
|
|
|
|
—
|
|
|
|
—
|
|
|
|
—
|
|
|
|
—
|
|
|
|
—
|
|
|
|
(13,466
|
)
|
|
|
|
|
|
|
|
|
|
|
|
|
|
|
|
|
|
|
|
|
|
|
|
|
|
|
|
|
|
|
|
|
|
|
|
BALANCE — June 30, 2009
|
|
|
748,804
|
|
|
|
1
|
|
|
|
47,741
|
|
|
|
—
|
|
|
|
98,478
|
|
|
|
(102,561
|
)
|
|
|
10,929
|
|
|
|
6,847
|
|
|
Stock-based compensation (unaudited)
|
|
|
—
|
|
|
|
—
|
|
|
|
—
|
|
|
|
—
|
|
|
|
538
|
|
|
|
—
|
|
|
|
—
|
|
|
|
538
|
|
|
Preferred stock dividend (unaudited)
|
|
|
—
|
|
|
|
—
|
|
|
|
—
|
|
|
|
—
|
|
|
|
(5,369
|
)
|
|
|
—
|
|
|
|
—
|
|
|
|
(5,369
|
)
|
|
Dividends distributable (unaudited)
|
|
|
—
|
|
|
|
—
|
|
|
|
—
|
|
|
|
—
|
|
|
|
5,369
|
|
|
|
—
|
|
|
|
—
|
|
|
|
5,369
|
|
|
Components of comprehensive income:
|
|
|
|
|
|
|
|
|
|
|
|
|
|
|
|
|
|
|
|
|
|
|
|
|
|
|
|
|
|
|
|
|
|
Net loss (unaudited)
|
|
|
—
|
|
|
|
—
|
|
|
|
—
|
|
|
|
—
|
|
|
|
—
|
|
|
|
(771
|
)
|
|
|
—
|
|
|
|
(771
|
)
|
|
Foreign currency translation, net of tax of $0 (unaudited)
|
|
|
—
|
|
|
|
—
|
|
|
|
—
|
|
|
|
—
|
|
|
|
—
|
|
|
|
—
|
|
|
|
1,066
|
|
|
|
1,066
|
|
|
|
|
|
|
|
|
|
|
|
|
|
|
|
|
|
|
|
|
|
|
|
|
|
|
|
|
|
|
|
|
|
|
|
|
Total comprehensive income (unaudited)
|
|
|
—
|
|
|
|
—
|
|
|
|
—
|
|
|
|
—
|
|
|
|
—
|
|
|
|
—
|
|
|
|
—
|
|
|
|
295
|
|
|
|
|
|
|
|
|
|
|
|
|
|
|
|
|
|
|
|
|
|
|
|
|
|
|
|
|
|
|
|
|
|
|
|
|
BALANCE — December 31, 2009 (unaudited)
|
|
|
748,804
|
|
|
$
|
1
|
|
|
|
47,741
|
|
|
$
|
—
|
|
|
$
|
99,016
|
|
|
$
|
(103,332
|
)
|
|
$
|
11,995
|
|
|
$
|
7,680
|
|
|
|
|
|
|
|
|
|
|
|
|
|
|
|
|
|
|
|
|
|
|
|
|
|
|
|
|
|
|
|
|
|
|
|
See notes to consolidated financial statements.
F-5
MIRION
TECHNOLOGIES, INC.
(in
thousands)
| |
|
|
|
|
|
|
|
|
|
|
|
|
|
|
|
|
|
|
|
|
|
|
|
|
|
|
Six Months Ended
|
|
|
|
|
Year Ended June 30,
|
|
|
December 31,
|
|
|
|
|
2007
|
|
|
2008
|
|
|
2009
|
|
|
2008
|
|
|
2009
|
|
|
|
|
|
|
|
|
|
|
|
|
|
(unaudited)
|
|
|
Operating activities:
|
|
|
|
|
|
|
|
|
|
|
|
|
|
|
|
|
|
|
|
|
|
Net loss
|
|
$
|
(19,701
|
)
|
|
$
|
(13,349
|
)
|
|
$
|
(3,955
|
)
|
|
$
|
(3,558
|
)
|
|
$
|
(771
|
)
|
|
Adjustments to reconcile net loss to net cash (used in) provided
by operating activities:
|
|
|
|
|
|
|
|
|
|
|
|
|
|
|
|
|
|
|
|
|
|
Depreciation and amortization
|
|
|
16,302
|
|
|
|
14,182
|
|
|
|
12,479
|
|
|
|
6,272
|
|
|
|
6,321
|
|
|
Actuarial (gain) loss
|
|
|
(282
|
)
|
|
|
(226
|
)
|
|
|
208
|
|
|
|
—
|
|
|
|
—
|
|
|
Paid-in-kind
interest expense
|
|
|
1,810
|
|
|
|
1,904
|
|
|
|
1,992
|
|
|
|
993
|
|
|
|
1,041
|
|
|
Stock-based compensation
|
|
|
307
|
|
|
|
248
|
|
|
|
1,161
|
|
|
|
625
|
|
|
|
538
|
|
|
Loss on disposal of property, plant and equipment
|
|
|
81
|
|
|
|
502
|
|
|
|
592
|
|
|
|
302
|
|
|
|
268
|
|
|
Amortization of loan fees, debt discounts and preferred stock
discounts
|
|
|
568
|
|
|
|
785
|
|
|
|
522
|
|
|
|
262
|
|
|
|
236
|
|
|
Provision for doubtful accounts
|
|
|
96
|
|
|
|
30
|
|
|
|
140
|
|
|
|
69
|
|
|
|
25
|
|
|
Provision for deferred income taxes
|
|
|
(1,010
|
)
|
|
|
(1,238
|
)
|
|
|
(1,013
|
)
|
|
|
763
|
|
|
|
(916
|
)
|
|
Change in estimated fair value of derivative instruments
|
|
|
(14
|
)
|
|
|
9
|
|
|
|
(11
|
)
|
|
|
83
|
|
|
|
76
|
|
|
Changes in operating assets and liabilities:
|
|
|
|
|
|
|
|
|
|
|
|
|
|
|
|
|
|
|
|
|
|
Accounts receivable
|
|
|
9,639
|
|
|
|
(3,712
|
)
|
|
|
(6,401
|
)
|
|
|
(14,511
|
)
|
|
|
(9,614
|
)
|
|
Receivables pledged to creditors
|
|
|
(2,235
|
)
|
|
|
(2,389
|
)
|
|
|
2,273
|
|
|
|
(1,596
|
)
|
|
|
(2,315
|
)
|
|
Prepaid expenses and other current assets
|
|
|
133
|
|
|
|
1,928
|
|
|
|
(1,622
|
)
|
|
|
(835
|
)
|
|
|
(4,689
|
)
|
|
Inventories
|
|
|
(4,401
|
)
|
|
|
(2,236
|
)
|
|
|
(609
|
)
|
|
|
(576
|
)
|
|
|
(883
|
)
|
|
Other assets
|
|
|
1,616
|
|
|
|
350
|
|
|
|
112
|
|
|
|
25
|
|
|
|
(87
|
)
|
|
Deferred cost of revenue
|
|
|
2,338
|
|
|
|
(6,215
|
)
|
|
|
(7,569
|
)
|
|
|
(2,807
|
)
|
|
|
2,828
|
|
|
Costs in excess of billings on uncompleted contracts
|
|
|
(3,210
|
)
|
|
|
(9,532
|
)
|
|
|
2,663
|
|
|
|
7,525
|
|
|
|
(1,132
|
)
|
|
Accounts payable
|
|
|
(575
|
)
|
|
|
4,029
|
|
|
|
(3,771
|
)
|
|
|
(2,622
|
)
|
|
|
3,402
|
|
|
Accrued expenses and other current liabilities
|
|
|
378
|
|
|
|
1,809
|
|
|
|
2,688
|
|
|
|
4,740
|
|
|
|
(5,033
|
)
|
|
Income taxes payable
|
|
|
2,596
|
|
|
|
(6,338
|
)
|
|
|
(1,103
|
)
|
|
|
(2,396
|
)
|
|
|
206
|
|
|
Deferred contract revenue
|
|
|
(6,118
|
)
|
|
|
6,671
|
|
|
|
9,320
|
|
|
|
4,497
|
|
|
|
5,236
|
|
|
Other liabilities
|
|
|
(1,887
|
)
|
|
|
6,076
|
|
|
|
1,935
|
|
|
|
(98
|
)
|
|
|
428
|
|
|
|
|
|
|
|
|
|
|
|
|
|
|
|
|
|
|
|
|
|
|
|
|
Net cash (used in) provided by operating activities
|
|
|
(3,569
|
)
|
|
|
(6,712
|
)
|
|
|
10,031
|
|
|
|
(2,843
|
)
|
|
|
(4,835
|
)
|
|
|
|
|
|
|
|
|
|
|
|
|
|
|
|
|
|
|
|
|
|
|
|
Investing activities:
|
|
|
|
|
|
|
|
|
|
|
|
|
|
|
|
|
|
|
|
|
|
Purchases of property, plant and equipment
|
|
|
(4,316
|
)
|
|
|
(4,953
|
)
|
|
|
(6,649
|
)
|
|
|
(2,441
|
)
|
|
|
(3,354
|
)
|
|
Return of escrow funds
|
|
|
—
|
|
|
|
2,750
|
|
|
|
—
|
|
|
|
—
|
|
|
|
—
|
|
|
Change in restricted cash
|
|
|
(699
|
)
|
|
|
(1,093
|
)
|
|
|
(779
|
)
|
|
|
(614
|
)
|
|
|
(847
|
)
|
|
|
|
|
|
|
|
|
|
|
|
|
|
|
|
|
|
|
|
|
|
|
|
Net cash used in investing activities
|
|
|
(5,015
|
)
|
|
|
(3,296
|
)
|
|
|
(7,428
|
)
|
|
|
(3,055
|
)
|
|
|
(4,201
|
)
|
|
|
|
|
|
|
|
|
|
|
|
|
|
|
|
|
|
|
|
|
|
|
|
Financing activities:
|
|
|
|
|
|
|
|
|
|
|
|
|
|
|
|
|
|
|
|
|
|
Borrowings from notes payable to ACAS
|
|
|
15,259
|
|
|
|
13,780
|
|
|
|
6,600
|
|
|
|
5,800
|
|
|
|
12,684
|
|
|
Payments of notes payable to ACAS
|
|
|
(6,520
|
)
|
|
|
(3,520
|
)
|
|
|
(10,576
|
)
|
|
|
(193
|
)
|
|
|
(193
|
)
|
|
Net payments from notes payable to third parties
|
|
|
(282
|
)
|
|
|
(318
|
)
|
|
|
(298
|
)
|
|
|
(153
|
)
|
|
|
(157
|
)
|
|
Net borrowings (payments) under revolving credit facility
|
|
|
1,532
|
|
|
|
3,396
|
|
|
|
(1,556
|
)
|
|
|
2,108
|
|
|
|
(1,414
|
)
|
|
Proceeds from (repurchases) issuance of common stock
|
|
|
(115
|
)
|
|
|
13
|
|
|
|
—
|
|
|
|
—
|
|
|
|
—
|
|
|
|
|
|
|
|
|
|
|
|
|
|
|
|
|
|
|
|
|
|
|
|
|
Net cash provided by (used in) financing activities
|
|
|
9,874
|
|
|
|
13,351
|
|
|
|
(5,830
|
)
|
|
|
7,562
|
|
|
|
10,920
|
|
|
|
|
|
|
|
|
|
|
|
|
|
|
|
|
|
|
|
|
|
|
|
|
Effect of exchange rate changes on cash and cash equivalents
|
|
|
413
|
|
|
|
(945
|
)
|
|
|
(342
|
)
|
|
|
(344
|
)
|
|
|
(340
|
)
|
|
|
|
|
|
|
|
|
|
|
|
|
|
|
|
|
|
|
|
|
|
|
|
Net increase (decrease) in cash and cash equivalents
|
|
|
1,703
|
|
|
|
2,398
|
|
|
|
(3,569
|
)
|
|
|
1,320
|
|
|
|
1,544
|
|
|
Cash and cash equivalents at beginning of period
|
|
|
4,858
|
|
|
|
6,561
|
|
|
|
8,959
|
|
|
|
8,959
|
|
|
|
5,390
|
|
|
|
|
|
|
|
|
|
|
|
|
|
|
|
|
|
|
|
|
|
|
|
|
Cash and cash equivalents at end of period
|
|
$
|
6,561
|
|
|
$
|
8,959
|
|
|
$
|
5,390
|
|
|
|
10,279
|
|
|
|
6,934
|
|
|
|
|
|
|
|
|
|
|
|
|
|
|
|
|
|
|
|
|
|
|
|
|
Supplemental information:
|
|
|
|
|
|
|
|
|
|
|
|
|
|
|
|
|
|
|
|
|
|
Cash paid for interest
|
|
$
|
16,032
|
|
|
$
|
16,515
|
|
|
$
|
15,505
|
|
|
$
|
8,410
|
|
|
$
|
6,382
|
|
|
|
|
|
|
|
|
|
|
|
|
|
|
|
|
|
|
|
|
|
|
|
|
Cash paid for income taxes
|
|
$
|
3,324
|
|
|
$
|
7,179
|
|
|
$
|
6,277
|
|
|
$
|
4,518
|
|
|
$
|
5,394
|
|
|
|
|
|
|
|
|
|
|
|
|
|
|
|
|
|
|
|
|
|
|
|
|
Mirion common stock issued for compensation
|
|
$
|
130
|
|
|
$
|
—
|
|
|
$
|
—
|
|
|
|
—
|
|
|
|
—
|
|
|
|
|
|
|
|
|
|
|
|
|
|
|
|
|
|
|
|
|
|
|
|
|
Paid-in-kind
preferred dividends
|
|
$
|
8,141
|
|
|
$
|
8,993
|
|
|
$
|
9,892
|
|
|
$
|
4,864
|
|
|
$
|
5,369
|
|
|
|
|
|
|
|
|
|
|
|
|
|
|
|
|
|
|
|
|
|
|
|
See notes to consolidated financial statements.
F-6
MIRION
TECHNOLOGIES, INC.
|
|
|
1.
|
ORGANIZATION
AND OPERATIONS OF THE COMPANY
|
Mirion Technologies, Inc. (“Mirion” or the
“Company”) is a global provider of radiation
detection, measurement, analysis and monitoring products and
services to the nuclear, defense and medical end markets. Mirion
was incorporated in October 2005 as Global Monitoring Systems,
Inc. in the state of Delaware and subsequently changed its name
to Mirion Technologies, Inc. in January 2006.
Mirion was formed through the combination of three companies:
Global Dosimetry Solutions, Inc. (“GDS”), Imaging and
Sensing Technology Corporation (“IST”) and Synodys SA
(“Synodys”), all owned by American Capital, Ltd. and
affiliates (together “ACAS”). The combination (
“Reorganization”) was effective as of
December 31, 2005. Because the three companies were under
the common control of ACAS, the Reorganization was accounted for
by combining the assets, liabilities and accumulated deficit of
the three companies at each company’s historical basis. The
accompanying financial statements and related notes present the
combined financial performance of the three companies.
The Company is headquartered in San Ramon, California, and
has operations in the United States, Canada, the United Kingdom,
France, Germany, Finland and China.
Basis of Presentation — The accompanying annual
consolidated financial statements of the Company include the
accounts of the Company and its wholly owned subsidiaries. All
significant intercompany balances and transactions have been
eliminated in consolidation.
The accompanying financial statements have been prepared
assuming that the Company will continue as a going concern. The
Company has incurred significant losses and negative cash flows
from operations since its inception. At June 30, 2009, the
Company had an accumulated deficit of $102.6 million, and
approximately $170.1 million of debt obligations due to
American Capital Financial Services (“ACFS”), a
related party. The Company has negotiated extensions on the
repayment of its debt obligations with ACFS. As more fully
disclosed in Note 8, debt obligations due in 2010 to ACFS
total $520,000, debt obligations due in 2011 to ACFS total
approximately $9.7 million and debt obligations due in 2012
to ACFS total approximately $159.8 million.
Unaudited Pro Forma Information — If a public
offering is consummated, all of the currently outstanding shares
of Convertible Participating Preferred Stock will convert into
1,203,045 shares of common stock, and currently outstanding
shares of Class A and Class B Common Stock will convert on a
one-to-one basis to 47,741 shares of common stock based on the
number of shares outstanding as of December 31, 2009.
Unaudited pro forma stockholders’ equity and liabilities
for the assumed conversion of the convertible preferred stock
and certain other adjustments associated with an anticipated
capital distribution to ACAS is set forth in the accompanying
Consolidated Balance Sheets. The following assumptions were made
in reflecting the impact to the consolidated pro forma balance
sheet at December 31, 2009:
|
|
|
| |
•
|
An $8.0 million increase to other current liabilities to
reflect the accrual of an $8 million payment to ACAS to
terminate an investment banking arrangement, with a
corresponding increase in accumulated deficit.
|
|
|
|
| |
•
|
A $ million reduction in Notes payable to ACAS
to reflect the assumed distribution to ACAS in connection with
this offering, with a corresponding increased in other current
liabilities.
|
|
|
|
| |
•
|
A $ increase in Notes Payable to reflect the
assumed re-financing of a portion of the Notes Payable to ACAS
at December 31, 2009 in connection with this offering.
|
|
|
|
| |
•
|
The conversion of the outstanding shares of Convertible
Participating Preferred Stock into 1,203,045 shares of
common stock as of December 31, 2009, based upon a
conversion rate of 1.1328 for Series A-1 preferred stock
and 1.0368 for Series A-2 preferred stock.
|
F-7
MIRION
TECHNOLOGIES, INC.
Notes to
Consolidated Financial
Statements — (Continued)
|
|
|
| |
•
|
The conversion of the outstanding shares of Class A Voting
and Class B Non-Voting Common Stock into 47,741 shares
of common stock as of December 31, 2009. These shares will
convert on a one-to-one basis.
|
The following table sets forth the computation of basic and
diluted pro forma net income per common share and the pro forma
net income per common share-as adjusted for the periods
indicated (in thousands, except share and per share amounts):
| |
|
|
|
|
|
|
|
|
|
|
|
Year Ended
|
|
|
Six Months Ended
|
|
|
|
|
June 30,
|
|
|
December 31,
|
|
|
|
|
2009
|
|
|
2009
|
|
|
|
|
(unaudited)
|
|
|
|
|
Numerator:
|
|
|
|
|
|
|
|
|
|
Net loss allocable to common stockholders
|
|
$
|
(13,847
|
)
|
|
$
|
(6,140
|
)
|
|
Effect of preferred stock dividends(1)
|
|
|
9,892
|
|
|
|
5,369
|
|
|
Interest expense reduction from paydown of ACAS debt using
proceeds of offering(2)
|
|
|
|
|
|
|
|
|
|
|
|
|
|
|
|
|
|
|
|
Pro forma net income allocable to common
stockholders — basic and diluted
|
|
$
|
|
|
|
$
|
|
|
|
Interest expense reduction from refinancing of ACAS debt(3)
|
|
|
|
|
|
|
|
|
|
|
|
|
|
|
|
|
|
|
|
Pro forma net income allocable to common
stockholders — basic and diluted as adjusted
|
|
$
|
|
|
|
$
|
|
|
|
|
|
|
|
|
|
|
|
|
| |
|
|
|
|
|
|
|
|
|
|
|
Year Ended
|
|
|
Six Months Ended
|
|
|
|
|
June 30, 2009
|
|
|
December 31, 2009
|
|
|
|
|
(unaudited)
|
|
|
|
|
Denominator:
|
|
|
|
|
|
|
|
|
|
Weighted average common shares outstanding from conversion of
common stock(4)
|
|
|
47,741
|
|
|
|
47,741
|
|
|
Weighted average common shares outstanding from conversion of
convertible preferred stock(5)
|
|
|
1,099,897
|
|
|
|
1,176,202
|
|
|
Common shares issued in offering(6)
|
|
|
|
|
|
|
|
|
|
|
|
|
|
|
|
|
|
|
|
Shares used in computing pro forma net income per common
share — basic(7)
|
|
|
|
|
|
|
|
|
|
Weighted average common share equivalents of stock options(8)
|
|
|
—
|
|
|
|
11,977
|
|
|
|
|
|
|
|
|
|
|
|
|
Shares used in computing pro forma net income per common
share — diluted(7)
|
|
|
|
|
|
|
|
|
|
|
|
|
|
|
|
|
|
|
Footnotes:
|
|
|
|
(1) |
|
The effect of preferred stock dividends is added back as a
reduction to net loss allocable to common stockholders, assuming
that all preferred stock has been converted into common shares
as of the beginning of the period presented. |
|
|
|
|
(2) |
|
The pro forma reduction in interest expense assumes the
repayment of $ of ACAS debt using
the net proceeds from this offering, giving effect to the
elimination of the related interest expense as of the beginning
of the period presented. |
|
|
|
|
(3) |
|
All ACAS debt not assumed to be repaid from the net proceeds
from this offering is assumed to be refinanced with a loan from
a third-party bank, at interest rates averaging %
lower than existing interest |
F-8
MIRION
TECHNOLOGIES, INC.
Notes to
Consolidated Financial
Statements — (Continued)
|
|
|
|
|
|
rates with ACAS giving effect to the elimination of the related
interest expense as of the beginning of the period presented. |
|
|
|
|
(4) |
|
The weighted average common shares outstanding from the
conversion of common stock assumes the conversion of all
outstanding shares of Class A Voting Common Stock and
Class B Non-Voting Common Stock on a one-to-one basis into
47,741 shares of common stock. |
|
|
|
|
(5) |
|
The weighted average common shares outstanding from the
conversion of preferred stock assumes the conversion of all
outstanding convertible preferred stock into common stock,
including the conversion into common stock of all accrued and
unpaid
paid-in-kind
dividends on convertible preferred stock. The 1,099,897 weighted
average at June 30, 2009 is comprised of 864,307
A-1
preferred shares, which includes 185,503 accrued but unpaid
paid-in-kind
dividends, which are convertible at a rate of 1.1328 into
979,087 common shares and 116,522
A-2
preferred shares, which includes 46,522 accrued but unpaid
paid-in-kind
dividends, which are convertible at a rate of 1.0368 into
120,810 common shares. The 1,176,202 weighted average at
December 31, 2009 is comprised of 917,558
A-1
preferred shares, which includes 238,754 accrued but unpaid
paid-in-kind
dividends, which are convertible at a rate of 1.1328 into
1,039,409 common shares and 131,937
A-2
preferred shares, which includes 61,937 accrued but unpaid
paid-in-kind
dividends, which are convertible at a rate of 1.0368 into
136,793 common shares. The increase in number of preferred
shares between periods is due to the monthly accrual of
preferred dividends which are paid in the form of additional
shares of convertible preferred stock. |
|
|
|
|
(6) |
|
Includes all common shares issued in connection with this
offering. Because distributions to ACAS, the Company’s
primary stockholder, consisting of obligations under existing
debt arrangements of $ and amounts
due of $8.0 million to terminate an existing investment
banking arrangement, exceed the Company’s earnings plus
gross proceeds from this offering of
$ , all common shares are included
in the calculation under existing rules on pro forma
calculations. |
|
|
|
|
(7) |
|
Excludes 402,428 shares of common stock subject to
outstanding warrants as of June 30, 2009 and
December 31, 2009. These warrants only become exercisable
upon a sale, liquidation or dissolution of the Company or
approval by the Board of Directors. The Board of Directors does
not currently intend to approve the exercise of such warrants. |
|
|
|
|
(8) |
|
Includes the impact of the weighted average shares of common
stock into which outstanding options are convertible. The amount
excludes
and
shares of common stock because the effect would be anti-dilutive
as the Company generated a net loss during the period or the
strike price of the options exceeds the weighted average fair
value of the Company’s stock during the periods presented. |
Unaudited Interim Financial Information — The
accompanying unaudited interim consolidated balance sheet as of
December 31, 2009, the consolidated statements of
operations and cash flows for the six month periods ended
December 31, 2008 and 2009, and the consolidated statement
of changes in stockholders’ equity and comprehensive income
for the six months ended December 31, 2009 are unaudited.
These unaudited interim consolidated financial statements have
been prepared in accordance with U.S. generally accepted
accounting principles (“GAAP”) on the same basis as
the audited consolidated financial statements
F-9
MIRION
TECHNOLOGIES, INC.
Notes to
Consolidated Financial
Statements — (Continued)
and, in the opinion of management, reflect all adjustments
consisting of normal recurring accruals considered necessary to
present fairly the company’s financial position at
December 31, 2009, and the results of operations and cash
flows for the six months ended December 31, 2008 and 2009.
The results of operations for the six months ended
December 31, 2009 are not necessarily indicative of the
results that may be expected for the year ending June 30,
2010.
|
|
|
2.
|
SUMMARY
OF SIGNIFICANT ACCOUNTING POLICIES
|
Cash and Cash Equivalents — The Company
considers all cash on deposit, money market accounts and highly
liquid debt instruments purchased with original maturities of
three months or fewer to be cash and cash equivalents. Cash
equivalents primarily consist of amounts held in
interest-bearing money market accounts that are readily
convertible to cash.
The Company invests its excess cash with high credit quality
financial institutions. The Company reviews its investments in
money market accounts or other instruments for potential
impairment on a regular basis. As part of the evaluation
process, the Company considers the credit ratings of these
securities and its intent and ability to hold the investment for
a period of time sufficient to allow for any anticipated
improvement in financial condition.
Restricted Cash — The Company maintains
restricted cash and cash equivalent accounts held with financial
institutions to support performance bonds with irrevocable
letters of credit for contractual obligations to certain
customers.
Accounts Receivable and Allowance for Doubtful
Accounts — Accounts receivable are recorded at the
invoiced amount and do not bear interest. The allowance for
doubtful accounts is based on the Company’s assessment of
the collectability of customer accounts. The Company regularly
reviews the allowance by considering factors such as historical
experience, credit quality, the age of the accounts receivable
balances and current economic conditions that may affect a
customer’s ability to pay. The Company has an allowance for
doubtful accounts of $223,000, $135,000 and $48,000 (unaudited)
as of June 30, 2008 and 2009 and December 31, 2009.
Accounts Receivable Securitization — The
Company sold certain of its European-based accounts receivable
without recourse to an unrelated third-party financial
institution. The securitization agreement allowed the operating
subsidiaries participating in the securitization program to
receive a cash payment for sold receivables, less a fee paid of
5%. In accordance with the Financial Accounting Standards Board
(“FASB”) issued authoritative guidance on accounting
for transfers and servicing of financial assets and
extinguishments of liabilities, the accounts receivable balances
that were sold were determined to not have been legally isolated
from the transferor. The uncollected balances of $864,000, $0
and $0 (unaudited) are therefore included in accounts receivable
and notes payables as of June 30, 2008 and 2009 and
December 31, 2009. Fees incurred in connection with the
factoring arrangement were recorded as part of selling, general
and administrative expenses and totaled $154,000, $158,000,
$1,000, $1,000 (unaudited) and $1,000 (unaudited) in fiscal
2007, 2008 and 2009 and the six months ended December 31,
2008 and 2009.
The Company also has arrangements with several French financial
institutions for borrowings which are effectively secured by the
Company’s French subsidiary’s accounts receivables.
Borrowings outstanding at June 30, 2008 and 2009 and
December 31, 2009 were $5.3 million, $2.4 million
and $4.7 million (unaudited), which were equal to the
accounts receivables pledged. As the financial institutions have
the right to sell or repledge the collateral, the Company
records these accounts receivables to “Receivables pledged
to creditors” in the consolidated balance sheets in
accordance with FASB-issued authoritative guidance on accounting
for transfer of servicing of financial assets and
extinguishments of liabilities.
Inventories — Inventories are stated at the
lower of cost or market. Cost is computed using actual costs or
standard costs that approximate actual cost, determined on a
first-in,
first-out basis. The Company records
F-10
MIRION
TECHNOLOGIES, INC.
Notes to
Consolidated Financial
Statements — (Continued)
inventory provisions for excess and obsolete inventories, as
determined by either future demand forecasts or historical
demand trends.
Deferred Cost of Revenue — Deferred cost of
revenue consists of completed products shipped to customers for
which the related revenue has been deferred pending completion
of services or determination that all customer-specific
acceptance criteria have been met. The deferred costs are
recognized in cost of revenue in the same period that the
related revenues are recognized. The Company evaluates the
carrying value of deferred cost of revenue on a lower of cost or
market basis, consistent with its evaluation of the carrying
value of the related products.
Property, Plant and Equipment — Property, plant
and equipment are stated at cost, net of accumulated
depreciation and amortization. Property, plant and equipment
acquired through the acquisition of a business are recorded at
their estimated fair value at the date of acquisition.
Depreciation is computed when assets are placed into service
using the straight-line method over the estimated useful lives
of the assets. Leasehold improvements are amortized on the
straight-line method over the shorter of the related lease term
or estimated useful life of the improvements. Repair and
maintenance costs are expensed as incurred.
Estimated useful lives of property, plant and equipment are as
follows:
| |
|
|
|
|
|
Buildings and leasehold improvements
|
|
|
3–39 years
|
|
|
Machinery and equipment
|
|
|
5–15 years
|
|
|
Furniture, fixtures, computer equipment and software
|
|
|
3–10 years
|
|
Goodwill and Purchased Intangible Assets —
Goodwill is recorded as the excess of the acquisition purchase
price over the fair value of net tangible and identifiable
intangible assets acquired. In accordance with FASB-issued
authoritative guidance on goodwill and other intangible assets,
goodwill is not amortized but is tested for impairment on an
annual basis or more frequently if indicators of potential
impairment arise. The Company has tested goodwill for impairment
based on an evaluation of the Company’s five operating
segments, which are also reporting units. Based on the
impairment tests performed, there was no impairment of goodwill
in fiscal 2007, 2008 or 2009 and no impairment indicators have
been identified through December 31, 2009 (unaudited).
Purchased intangible assets other than goodwill are amortized
using a straight-line or an accelerated method over their
estimated useful lives, which range from three to seventeen
years. Remaining useful lives of definite-lived intangible
assets are evaluated on a periodic basis to determine whether
events or circumstances warrant a revision to the remaining
estimated amortization period.
Impairment of Long-Lived Assets — The Company
reviews long-lived assets and definite-lived intangible assets
for impairment whenever events or changes in circumstances
indicate that the carrying amount of an asset may not be
recoverable. Determination of recoverability of long-lived
assets is based on an estimate of undiscounted future cash flows
resulting from the use of the asset as compared to its carrying
value. If an asset is determined to be impaired, the Company
measures the amount of any impairment as the difference between
the carrying amount and the fair value of the impaired asset. No
impairment indicators have been identified through June 30,
2009 and December 31, 2009 (unaudited).
Facility and Equipment Decommissioning
Liabilities — The Company accounts for asset
retirement obligations (primarily equipment and facility
decommissioning costs) in accordance with FASB-issued
authoritative guidance on accounting for asset retirement
obligations. This guidance requires that the estimated fair
value of liabilities for asset retirement obligations
(“ARO”) be recognized in the period in which they are
incurred. A corresponding increase to the carrying value of the
related asset is recorded and depreciated over the useful life
of the asset. The estimates are based principally on legal and
regulatory requirements. The amount of the liability is subject
to remeasurement at each reporting period. The Company’s
estimates of its ultimate asset retirement obligation could
change as a result of changes in regulations, the extent of
F-11
MIRION
TECHNOLOGIES, INC.
Notes to
Consolidated Financial
Statements — (Continued)
environmental remediation required, the means of reclamation,
cost estimates, or time period estimates. Changes in estimates
are accounted for prospectively from the period in which the
estimate is revised.
As of June 30, 2008 and 2009 and December 31, 2009,
the Company’s ARO liabilities totaled $423,000, $422,000
and $446,000 (unaudited) and were included in other long-term
liabilities. Accretion expense related to these liabilities was
$26,000, $30,000, $31,000, $15,000 (unaudited) and $17,000
(unaudited) in fiscal 2007, 2008 and 2009 and for the six months
ended December 31, 2008 and 2009.
Revenue Recognition — The Company recognizes
revenue from sales contracts in accordance with
FASB-issued
authoritative guidance on revenue recognition. Under this
guidance, revenue is recognized when there is persuasive
evidence of an arrangement, product delivery has occurred or
services have been provided, the sales price is fixed or
determinable and collectability is reasonably assured. For sales
contracts that contain customer-specific acceptance provisions,
revenue and the related costs are deferred until the customer
has indicated successful completion of site acceptance tests or
the Company has otherwise determined that all customer-specific
acceptance criteria have been met. In the Health Physics and
Radiation Monitoring Systems segments, the Company performs
detailed factory acceptance testing on completed products which
in some instances is sufficiently extensive and reliable to
demonstrate that its products meet all of the customer-specified
objective acceptance criteria set forth in its sales
arrangements. In such instances, the Company’s policy is to
recognize revenue based on the product’s delivery terms and
prior to the receipt of notification of formal acceptance from
the customer. For sales contracts that contain multiple
deliverables, such as equipment and commissioning services, the
Company recognizes revenue and the related costs as each element
is delivered or completed based upon its relative fair value. In
instances where the Company has not established fair value for
any undelivered element, revenue for all elements is deferred
until delivery of the final element is complete and all
recognition criteria are met. All amounts billed to a customer
related to shipping and handling are classified as revenue,
while all costs incurred by the Company for shipping and
handling are classified as cost of revenue. Provisions and
allowances for discounts to customers, estimated sales returns,
service cancellations and other adjustments are provided for in
the same period that the related revenue is recorded.
Certain of the Company’s products are sold through
distributors and third-party sales representatives under
standard agreements whereby distributors purchase products from
the Company and resell them to customers. These agreements give
distributors the right to sell the Company’s products
within certain territories and establishes minimum order
requirements. These arrangements do not provide stock rotation
or price protection rights. Rights of return are limited to
repair or replacement of delivered products that are defective
or fail to meet the Company’s published specifications.
Provisions for these warranty costs are provided for in the same
period that the related sale is recorded.
Revenue from certain fixed price contracts in the Sensing
Systems and Imaging Systems divisions that involve customization
of equipment to customer specifications is recognized in
accordance with
FASB-issued
authoritative guidance on accounting for performance of
construction-type and certain production-type contracts, using
the
percentage-of-completion
method measured by the
cost-to-cost
method. The
cost-to-cost
method is used because management considers incurred costs to be
the best available measure of progress on these contracts.
Contract costs include all direct materials and labor costs, as
well as indirect costs related to contract performance. Changes
in job performance, job conditions and estimated profitability
result in revisions to costs and revenue and are recognized in
the period in which the revisions are determined. Provisions for
estimated losses on uncompleted contracts are made in the period
in which such losses are first determined. Revenue earned in
excess of billings on contracts in progress (underbillings) is
classified as a current asset. Amounts billed in excess of
revenue earned (advance billings) are classified as a current
liability and included in deferred contract revenue.
Revenue from the Company’s Dosimetry Services division is
of a subscription nature, with passive dosimetry and analytical
services provided to customers on an
agreed-upon
recurring monthly, quarterly or annual basis. Services are
provided principally through film and thermo luminescent
dosimeter badges that are worn by the customer’s personnel
and returned to the Company for analysis. The Company believes
that
F-12
MIRION
TECHNOLOGIES, INC.
Notes to
Consolidated Financial
Statements — (Continued)
badge production, badge wearing, badge analysis and report
preparation are all integral to the benefit that the Company
provides to its customers, and therefore, the service period is
defined as the period over which all of these services are
provided. Revenue and the related costs are recognized on a
straight-line basis over the service period as the service is
continuous, and no other discernible pattern of recognition is
evident. Many customers pay for these measuring and monitoring
services in advance. The amounts are recorded as deferred
contract revenue in the balance sheets and represent customer
deposits invoiced in advance for services to be rendered over
the service period, net of a reserve for estimated cancellations.
Derivative and Hedging Activities — The Company
uses certain derivative financial instruments to help manage its
risk or exposure to changes in interest rates in relation to
variable rate debt and foreign currency exchange rate
fluctuations. The Company records these derivatives at fair
value in the balance sheets as either an asset or a liability as
required by
FASB-issued
authoritative guidance on the accounting for derivative
instruments and hedging activities. The Company did not meet the
hedge criteria for these existing derivatives, so any changes in
fair value are recognized in earnings as incurred. As of
June 30, 2008 and 2009 and December 31, 2009, the
Company has recorded other assets (liabilities) of $73,000,
$(21,000) and $(3,000) (unaudited) to reflect the fair value of
the Company’s interest rate swap. The Company has recorded
gains (losses) of $14,000, $(9,000), $(83,000), $(8,000)
(unaudited) and $18,000 (unaudited) in other income, net for
fiscal 2007, 2008 and 2009 and the six months ended
December 31, 2008 and 2009. The swap had an initial
notional value of $1.8 million that declines through
expiration in November 2012. The notional amount was
$1.1 million and $0.9 million (unaudited) at
June 30, 2009 and December 31, 2009.
On January 1, 2009 the Company executed a series of foreign
currency window contracts to mitigate currency exposure on sales
contracts due to fluctuations in the euro/U.S. dollar
exchange rate. Each window is an agreement to sell the
U.S. dollar and purchase euros. There were a total of 17
contracts to sell $5.8 million and purchase
€4.2 million from February 2, 2009 through
September 18, 2009. As of June 30, 2009, the Company
has recorded other assets of $94,000 to reflect the fair value
of the Company’s foreign currency window contracts. The
Company recognized in earnings a total net gain of $94,000 and a
total net loss of $94,000 (unaudited) on foreign currency window
forward contracts not designated as hedging instruments in
accordance with FASB issued authoritative guidance on accounting
for derivative instruments and hedging activities, during the
year ended June 30, 2009 and the six months ended
December 31, 2009.
Stock-Based Payment — The Company recognizes
compensation expense for the fair value of all stock-based
awards granted to employees and directors in exchange for
services over the requisite service period, which is typically
the vesting period. The fair value of stock options with time
and performance-based vesting criteria is estimated using the
Black-Scholes-Merton option valuation model. The fair value of
stock options with market-based vesting criteria is estimated
using a Monte Carlo simulation model. This model requires the
input of subjective assumptions, including estimated stock
volatility, risk-free interest rate and the expected life of
each award. Furthermore, this guidance requires the Company to
estimate forfeitures of each award. The Company amortizes the
fair value using the straight-line method over the requisite
service period.
Prior to July 1, 2005, the Company measured compensation
expense for its employee stock-based compensation plans using
the intrinsic value method. As the exercise price of all options
granted under this plan was at or above the estimated market
price of the underlying common stock on the date of grant, no
stock-based compensation cost was recognized in the consolidated
statements of operations.
The Company adopted updated
FASB-issued
authoritative guidance on July 1, 2005 on stock based
payment using the modified prospective transition method. This
method requires the recognition of compensation cost for all
stock-based
payments that are unvested as of July 1, 2005. The cost
related to stock-based compensation included in the
determination of consolidated net loss for the twelve months
ended June 30, 2007, 2008 and 2009 includes all awards
outstanding that are vesting during those periods. In connection
with the Reorganization, on January 1, 2006 stock options
of the three predecessor companies were exchanged for stock
options in Mirion. Under
FASB-issued
authoritative guidance on
stock-based
F-13
MIRION
TECHNOLOGIES, INC.
Notes to
Consolidated Financial
Statements — (Continued)
payment, the exchange was deemed a modification, resulting in
incremental compensation expense of $749,000 recorded at
January 1, 2006 for those options that were vested as of
January 1, 2006. For the unvested options at
January 1, 2006, incremental compensation expense of
$618,000 is being expensed over the remaining vesting period of
approximately two years.
Advertising Costs — The Company expenses
advertising costs in the period incurred.
Accounting for Income Taxes — The determination
of the Company’s tax provision is subject to judgments and
estimates due to the complexity of the tax law that the Company
is subject to in several tax jurisdictions. Earnings derived
from the Company’s international business are generally
taxed at rates that are different than U.S. rates, resulting in
an effective tax rate different than the U.S. statutory tax rate
of 34%. The ability to maintain the Company’s current
effective tax rate is contingent on existing tax laws in both
the United States and the respective countries in which the
Company’s international subsidiaries are located. In
addition, a decrease in the percentage of the Company’s
total earnings from international business or a change in the
mix of international business among particular tax jurisdictions
could alter the Company’s overall effective tax rate.
Income taxes are accounted for under the asset and liability
method in accordance with
FASB-issued
authoritative guidance on accounting for income taxes. Under
this method, deferred tax assets and liabilities are recognized
for the estimated future tax consequences attributable to
differences between the tax bases of assets and liabilities and
their financial statement carrying amounts, and consideration is
given to operating losses and tax credit carryforwards. Deferred
tax assets and liabilities are measured using enacted tax rates
expected to apply to taxable income in the years in which those
temporary differences are expected to be recovered or settled.
The effect on the deferred tax assets and liabilities of a
change in tax rates is recognized in income in the period that
includes the enactment date. The FASB issued authoritative
guidance on accounting for income taxes also requires that
deferred tax assets be reduced by a valuation allowance if it is
more likely than not that some or all of the deferred tax asset
will not be realized. The Company has provided a valuation
allowance of $27.6 million as of June 30, 2008 and
$31.4 million as of June 30, 2009 primarily on its
U.S. jurisdiction deferred tax assets.
On July 1, 2007, the Company adopted
FASB-issued
authoritative guidance on accounting for uncertainty in income
taxes. This guidance clarifies the accounting for uncertainty in
income taxes recognized in an enterprise’s financial
statements. This interpretation prescribes a recognition
threshold and measurement attribute for the financial statement
recognition and measurement of a tax position taken or expected
to be taken in a tax return. As a result of the implementation
of this guidance, the Company recognizes the tax liability for
uncertain income tax positions on the income tax return based on
the two-step process prescribed in the interpretation. The first
step is to determine whether it is more likely than not that
each income tax position would be sustained upon audit. The
second step is to estimate and measure the tax benefit as the
amount that has a greater than 50% likelihood of being realized
upon ultimate settlement with the tax authority. Estimating
these amounts requires the Company to determine the probability
of various possible outcomes. The Company evaluates these
uncertain tax positions on a quarterly basis. This evaluation is
based on the consideration of several factors, including changes
in facts or circumstances, changes in applicable tax law,
settlement of issues under audit, and new exposures. If the
Company later determines that its exposure is lower or that the
liability is not sufficient to cover its revised expectations,
the Company adjusts the liability and effects a related change
in its tax provision during the period in which it makes such
determination.
Defined Benefit Pension Plans and Other Employee
Benefits — The Company has defined benefit pension
plans that cover the majority of its employees in France and
Germany. The Company also has a postretirement plan that
provides for the reimbursement of a portion of medical and life
insurance premiums for certain retirees and eligible dependents.
The accounting for these plans is subject to the guidance
provided in
FASB-issued
authoritative guidance on employers’ accounting for defined
benefit pension and other postretirement plans.
F-14
MIRION
TECHNOLOGIES, INC.
Notes to
Consolidated Financial
Statements — (Continued)
Plan liabilities are revalued annually based on assumptions
relating to the long-term rate of return on plan assets,
discount rates used to measure future obligations and expenses,
salary-scale inflation rates, health care cost trend rates,
mortality and other assumptions. The selection of assumptions is
based on historical trends and known economic and market
conditions at the time of valuation; however, actual results may
differ substantially from the Company’s estimates. For
pension plans, accumulated gains and losses and prior service
costs are recognized in income when incurred.
Use of Estimates — The Company’s
consolidated financial statements are prepared in conformity
with generally accepted accounting principles, which require the
use of estimates, judgments and assumptions that affect the
reported amounts of assets and liabilities at the date of the
financial statements and the reported amounts of revenue and
expenses during the periods presented. Specific areas, among
others, requiring the application of management’s estimates
and judgment include assumptions pertaining to the valuation of
fixed assets, including depreciable lives assigned, the
estimated earnings on contracts in progress, accruals,
stock-based compensation costs, pension and post-employment
benefit costs, fair value of derivatives, future cash flows
associated with impairment testing of goodwill and other
long-lived assets, credit worthiness of customers, uncertain tax
positions, tax valuation allowances and legal, environmental and
insurance matters. Management believes that the accounting
estimates employed are appropriate and the resulting balances
are reasonable; however, due to the inherent uncertainties in
making estimates, actual results could differ from the original
estimates.
Fair Value of Financial Instruments — The
Company has evaluated the estimated fair value of financial
instruments using available market information and management
estimates. The use of different market assumptions or estimation
methodologies could have a significant effect on the estimated
fair value amounts. The fair value of the Company’s cash,
cash equivalents, short-term investments, accounts receivable
and other current and noncurrent liabilities approximate their
carrying amounts due to the relatively short maturity of these
items. The fair values of the debt instruments are estimated
using a discounted cash flow analysis with an interest rate
similar to that of current market borrowing arrangements. The
estimated fair value of the Company’s debt instruments is
$181.0 million, $162.8 million and $180.0 million
(unaudited) as of June 30, 2008 and 2009 and
December 31, 2009.
Fair Value — Effective July 1, 2008, the
Company adopted the provisions of FASB issued authoritative
guidance on fair value measurements, which defines fair value,
establishes a framework for measuring fair value and expands
disclosure of fair value measurements. The fair value criteria
are primarily applied prospectively upon adoption of this
guidance. FASB-issued authoritative guidance on fair value
measurements was effective for fiscal years beginning
November 15, 2007. In February 2008, the FASB issued
further guidance on fair value measurements, delaying the
effective date of this guidance for non financial assets and non
financial liabilities, except for items that are recognized or
disclosed at fair value on a recurring basis. The delayed
portions of this guidance will be adopted by the Company
beginning in the first quarter of its fiscal year ending
June 30, 2010 and the Company does not expect the adoption
of those delayed portions to have a material impact on the
Company’s consolidated financial statements. The adoption
of FASB-issued authoritative guidance on fair value measurements
for financial assets and liabilities did not have a material
impact on the Company’s consolidated financial statements.
FASB-issued authoritative guidance on fair value measurements
establishes a fair value hierarchy that prioritizes the inputs
to valuation techniques used to measure fair value. The
hierarchy gives the highest priority to unadjusted quoted prices
in active markets for identical assets or liabilities
(Level 1 measurements) and the lowest priority to
unobservable inputs (Level 3 measurements). The three
levels of the fair value hierarchy under this guidance are
described below:
Level 1 — Quoted prices (unadjusted) in
active markets that are accessible at the measurement date for
identical assets or liabilities. The fair value hierarchy gives
the highest priority to Level 1 inputs.
F-15
MIRION
TECHNOLOGIES, INC.
Notes to
Consolidated Financial
Statements — (Continued)
Level 2 — Observable prices that are based
on inputs not quoted on active markets, but corroborated by
market data.
Level 3 — Unobservable inputs are used
when little or no market data is available. The fair value
hierarchy gives the lowest priority to Level 3 inputs.
A financial instrument’s level within the fair value
hierarchy is based on the lowest level of any input that is
significant to the fair value measurement.
The following table summarizes the financial assets and
liabilities of the Company measured at fair value on a recurring
basis in accordance with FASB-issued authoritative guidance on
fair value measurements (in thousands):
| |
|
|
|
|
|
|
|
|
|
|
|
|
|
|
|
|
|
|
|
Balance
|
|
|
|
|
|
|
|
|
|
|
|
|
|
as of
|
|
|
Fair Value Measurements at
|
|
|
|
|
June 30,
|
|
|
June 30, 2009 Using
|
|
|
|
|
2009
|
|
|
Level 1
|
|
|
Level 2
|
|
|
Level 3
|
|
|
|
|
Assets (Long Term Liabilities):
|
|
|
|
|
|
|
|
|
|
|
|
|
|
|
|
|
|
FX forward rate contracts
|
|
$
|
94
|
|
|
|
—
|
|
|
$
|
94
|
|
|
|
—
|
|
|
Interest rate swaps
|
|
$
|
(21
|
)
|
|
|
—
|
|
|
$
|
(21
|
)
|
|
|
—
|
|
| |
|
|
|
|
|
|
|
|
|
|
|
|
|
|
|
|
|
|
|
Balance
|
|
|
|
|
|
|
|
|
|
|
|
|
|
as of
|
|
|
Fair Value Measurements at
|
|
|
|
|
December 31,
|
|
|
December 31, 2009 Using
|
|
|
|
|
2009
|
|
|
Level 1
|
|
|
Level 2
|
|
|
Level 3
|
|
|
|
|
|
|
|
(unaudited)
|
|
|
|
|
Liabilities:
|
|
|
|
|
|
|
|
|
|
|
|
|
|
|
|
|
|
Interest rate swaps
|
|
$
|
(3
|
)
|
|
|
—
|
|
|
$
|
(3
|
)
|
|
|
—
|
|
Foreign Currency Translation — Local currencies
are the functional currencies for substantially all of the
Company’s foreign operations. When the transactional
currency is different than the functional currency, transaction
gains and losses are included as a component of other income,
net. Assets and liabilities of foreign operations are translated
into U.S. dollars using the exchange rates in effect at the
balance sheet reporting date. Income and expenses are translated
at the average monthly exchange rates during the year. Gains and
losses on foreign currency translations are reported as a
component of other comprehensive income. Deferred taxes are not
provided on cumulative translation adjustments where the Company
expects earnings of a foreign subsidiary to be indefinitely
reinvested. The income tax effect of currency translation
adjustments related to foreign subsidiaries from certain
subsidiaries and joint ventures that are not considered
indefinitely reinvested is recorded as a component of deferred
taxes with an offset to other comprehensive income.
Concentrations of Risk — The Company maintains
cash in bank deposit accounts that, at times, may exceed the
insured limits of the local country. The Company has not
experienced any losses in such accounts. Management believes
that the Company is not exposed to significant credit risk
related to cash.
The Company sells its products and services mainly to large
private and governmental organizations in the Americas, Europe,
Middle East and Asia Pacific regions. The Company performs
ongoing evaluations of its customers’ financial conditions
and limits the amount of credit extended when deemed necessary.
The Company generally does not require its customers to provide
collateral or other security to support accounts receivable.
No single customer represented more than 10% of consolidated
revenue for fiscal 2007, 2008 or 2009, nor for the six months
ended December 31, 2008 or 2009 (unaudited).
Net Loss Per Common Share — The Company
calculates net loss per common share in accordance with
FASB-issued authoritative guidance on the computation of
earnings per share. Under this guidance, basic loss per common
share is calculated by dividing net loss allocable to common
stockholders by the weighted-
F-16
MIRION
TECHNOLOGIES, INC.
Notes to
Consolidated Financial
Statements — (Continued)
average number of common shares outstanding for the period using
the two-class method. Under the two-class method, net income is
allocated between common stock and convertible preferred stock
as it is deemed to be a participating security based on its
participation rights. Diluted loss per common share is
calculated by dividing net loss attributable to common
stockholders by the weighted average number of common and
potential dilutive securities outstanding during the period if
the effect is dilutive. The numerator of diluted earnings per
share is calculated by starting with income allocable to common
stock under the two-class method and adding back income
allocable to preferred stock to the extent they are dilutive.
Potential common shares consist of incremental shares of common
stock issuable upon the exercise of the stock options and
warrants and upon conversion of preferred stock.
The following table sets forth the computation of basic and
diluted net loss per share for the periods indicated (in
thousands, except per share amounts):
| |
|
|
|
|
|
|
|
|
|
|
|
|
|
|
|
|
|
|
|
|
|
|
|
|
|
|
Six Months Ended
|
|
|
|
|
Year Ended June 30,
|
|
|
December 31,
|
|
|
|
|
2007
|
|
|
2008
|
|
|
2009
|
|
|
2008
|
|
|
2009
|
|
|
|
|
|
|
|
|
|
|
|
|
|
(unaudited)
|
|
|
|
|
Numerator:
|
|
|
|
|
|
|
|
|
|
|
|
|
|
|
|
|
|
|
|
|
|
Net loss
|
|
$
|
(19,701
|
)
|
|
$
|
(13,349
|
)
|
|
$
|
(3,955
|
)
|
|
$
|
(3,558
|
)
|
|
$
|
(771
|
)
|
|
Effect of preferred stock dividends
|
|
|
(8,141
|
)
|
|
|
(8,993
|
)
|
|
|
(9,892
|
)
|
|
|
(4,864
|
)
|
|
|
(5,369
|
)
|
|
|
|
|
|
|
|
|
|
|
|
|
|
|
|
|
|
|
|
|
|
|
|
Net loss allocable to common stockholders
|
|
$
|
(27,842
|
)
|
|
$
|
(22,342
|
)
|
|
$
|
(13,847
|
)
|
|
$
|
(8,422
|
)
|
|
$
|
(6,140
|
)
|
|
|
|
|
|
|
|
|
|
|
|
|
|
|
|
|
|
|
|
|
|
|
|
Denominator:
|
|
|
|
|
|
|
|
|
|
|
|
|
|
|
|
|
|
|
|
|
|
Weighted average common shares outstanding (basic)
|
|
|
47,614
|
|
|
|
47,666
|
|
|
|
47,741
|
|
|
|
47,741
|
|
|
|
47,741
|
|
|
Effect of dilutive securities
|
|
|
—
|
|
|
|
—
|
|
|
|
—
|
|
|
|
—
|
|
|
|
—
|
|
|
|
|
|
|
|
|
|
|
|
|
|
|
|
|
|
|
|
|
|
|
|
|
Weighted average common shares outstanding (diluted)
|
|
|
47,614
|
|
|
|
47,666
|
|
|
|
47,741
|
|
|
|
47,741
|
|
|
|
47,741
|
|
|
|
|
|
|
|
|
|
|
|
|
|
|
|
|
|
|
|
|
|
|
|
|
Net loss per share:
|
|
|
|
|
|
|
|
|
|
|
|
|
|
|
|
|
|
|
|
|
|
Basic and Diluted
|
|
$
|
(584.74
|
)
|
|
$
|
(468.72
|
)
|
|
$
|
(290.04
|
)
|
|
$
|
(176.41
|
)
|
|
$
|
(128.61
|
)
|
|
|
|
|
|
|
|
|
|
|
|
|
|
|
|
|
|
|
|
|
|
|
The computation of basic loss per share excludes the conversion
of Convertible Participating Preferred Stock as the Company has
net losses and therefore the effect of applying the two-class
method is anti-dilutive. The computation of dilutive shares
outstanding excludes the common equivalent shares related to
paid-in-kind
dividends, conversion of the Convertible Participating Preferred
Stock, stock options and warrants as the Company had net losses
and the effect would be anti-dilutive.
The following table shows the weighted-average common equivalent
shares related to
paid-in-kind
dividends, the conversion of Convertible Participating Preferred
Stock, stock options and warrants that would have been included
in diluted earnings per share had the Company recorded net
income as of the respective dates:
| |
|
|
|
|
|
|
|
|
|
|
|
|
|
|
|
|
|
|
|
|
|
|
|
|
|
|
Six Months Ended
|
|
|
|
|
Year Ended June 30,
|
|
|
December 31,
|
|
|
|
|
2007
|
|
|
2008
|
|
|
2009
|
|
|
2008
|
|
|
2009
|
|
|
|
|
|
|
|
|
|
|
|
|
|
(unaudited)
|
|
|
|
|
Weighted Average Common Share Equivalents of Potentially
Dilutive Securities:
|
|
|
|
|
|
|
|
|
|
|
|
|
|
|
|
|
|
|
|
|
|
Convertible preferred stock, including
paid-in-kind
dividends
|
|
|
919,806
|
|
|
|
1,005,475
|
|
|
|
1,099,897
|
|
|
|
1,074,760
|
|
|
|
1,176,202
|
|
|
Stock options
|
|
|
411
|
|
|
|
1,889
|
|
|
|
—
|
|
|
|
—
|
|
|
|
11,977
|
|
|
Warrants
|
|
|
402,428
|
|
|
|
402,428
|
|
|
|
402,428
|
|
|
|
402,428
|
|
|
|
402,428
|
|
|
|
|
|
|
|
|
|
|
|
|
|
|
|
|
|
|
|
|
|
|
|
|
Total
|
|
|
1,322,645
|
|
|
|
1,409,792
|
|
|
|
1,502,325
|
|
|
|
1,477,188
|
|
|
|
1,590,607
|
|
|
|
|
|
|
|
|
|
|
|
|
|
|
|
|
|
|
|
|
|
|
|
F-17
MIRION
TECHNOLOGIES, INC.
Notes to
Consolidated Financial
Statements — (Continued)
New
Accounting Pronouncements
In February 2007, the FASB issued authoritative guidance on the
fair value option for financial assets and financial
liabilities. This guidance provides the option to measure, at
fair value, eligible financial instrument items using fair
value, which are not otherwise required to be measured at fair
value. The irrevocable decision to measure items at fair value
is made at specified election dates on an
instrument-by-instrument
basis. Changes in that instrument’s fair value must be
recognized in current earnings in subsequent reporting periods.
If elected, the first measurement to fair value is reported as a
cumulative-effect adjustment to the opening balance of retained
earnings in the year of adoption. The Company did not elect to
measure eligible assets at fair value. The guidance was
effective for the Company beginning in its fiscal year ending
June 30, 2009.
In December 2007, the FASB issued authoritative guidance on
business combinations. This guidance will significantly change
the accounting for future business combinations after adoption.
FASB-issued authoritative guidance on business combinations
establishes principles and requirements for how the acquirer of
a business recognizes and measures in its financial statements
the identifiable assets acquired, the liabilities assumed
(including contingent liabilities) and any non controlling
interest in the acquired business. This guidance also provides
guidance for recognizing and measuring the goodwill acquired in
the business combination and determines what information to
disclose to enable users of the financial statements to evaluate
the nature and financial effects of the business combination.
FASB-issued authoritative guidance on business combinations is
effective for fiscal years, and interim periods within those
fiscal years, beginning on or after December 15, 2008.
Earlier adoption is prohibited. This statement was effective for
the Company beginning in its fiscal year ending June 30,
2010. Adoption of this guidance did not have a material impact
on the consolidated financial statements.
In June 2008 the FASB issued authoritative guidance on
determining whether instruments granted in stock-based payment
transactions are participating securities. This guidance states
that unvested stock-based payment awards that contain
nonforfeitable rights to dividends or dividend equivalents
(whether paid or unpaid) are participating securities and shall
be included in the computation of earnings per share pursuant to
the two-class method. FASB-issued authoritative guidance on
determining whether instruments granted in stock-based payment
transactions are participating securities is effective for
financial statements issued for fiscal years beginning after
December 15, 2008, and interim periods within those years.
Upon adoption, a company is required to retrospectively adjust
its earnings per share data (including any amounts related to
interim periods, summaries of earnings and selected financial
data) to conform with the provisions in this guidance. Earlier
adoption is prohibited. This guidance was adopted by the Company
beginning in its fiscal year ending June 30, 2010, as
required. Adoption of this guidance did not have a material
impact on the consolidated financial statements.
In October 2008, the FASB issued authoritative guidance on
determining the fair value of a financial asset when the market
for that asset is not active. This guidance clarified the
application of, and demonstrated how the fair value of a
financial asset is determined when the market for that financial
asset is inactive. This guidance was effective upon issuance,
including prior periods for which financial statements had not
been issued. The implementation of this guidance did not have a
material impact on the Company’s financial position,
results of operations or cash flows.
In December 2008, the FASB issued authoritative guidance on
employers’ disclosures about postretirement benefit plan
assets, which is effective for fiscal years ending after
December 15, 2009. This guidance requires additional
disclosures such as: the investment allocation decision making
process; the fair value of each major category of plan assets;
inputs and valuation techniques used to measure the fair value
of plan assets; and significant concentrations of risk within
plan assets. This guidance was adopted by the Company beginning
in its fiscal year ending June 30, 2010, as required.
Adoption of this guidance did not have a material impact on the
consolidated financial statements.
F-18
MIRION
TECHNOLOGIES, INC.
Notes to
Consolidated Financial
Statements — (Continued)
In April 2009, the FASB issued authoritative guidance on
determining fair value when the volume and level of activity for
the asset or liability have significantly decreased and
identifying transactions that are not orderly. This guidance
provides additional guidance for estimating fair value when the
market activity for an asset or liability has declined
significantly. This guidance is effective for interim and annual
periods ending after June 15, 2009 and will be applied
prospectively. The implementation of this guidance did not have
a material impact on the Company’s financial position,
results of operations or cash flows.
In March 2008, the FASB issued authoritative guidance on
disclosures about derivative instruments and hedging activities.
This guidance requires disclosure of how and why an entity uses
derivative instruments, how derivative instruments and related
hedged items are accounted for and how derivative instruments
and related hedged items affect an entity’s financial
position, financial performance and cash flows. This guidance is
effective for fiscal years and interim periods beginning after
November 15, 2008, with early application encouraged. This
guidance was adopted by the Company at the beginning of the
third quarter of its fiscal year ending June 30, 2009, as
required.
In April 2009, the FASB issued authoritative guidance on
recognition and presentation of
other-than-temporary
impairments. This guidance establishes a new method for
recognizing and reporting
other-than-temporary
impairment of debt securities and also contains additional
disclosure requirements for both debt and equity securities.
This guidance is effective for interim and annual periods ending
after June 15, 2009. The implementation of this guidance
did not have a material impact on the Company’s financial
position, results of operations or cash flows.
In April 2009, the FASB issued authoritative guidance on interim
disclosures about fair value of financial instruments. This
guidance amends previous guidance on, disclosures about fair
value of financial instruments, to require an entity to provide
disclosures about the fair value of financial instruments in
interim financial information. This guidance also amends
FASB-issued authoritative guidance on interim financial
reporting, to require those disclosures in summarized financial
information at interim reporting periods. This guidance is
effective for interim periods ending after June 15, 2009,
with early adoption permitted for periods ending after
March 15, 2009. This guidance was adopted by the Company
beginning in its first quarter of fiscal year 2010. Adoption of
this guidance did not have a material impact on the consolidated
financial statements.
In May 2009, the FASB issued authoritative guidance on
subsequent events. This guidance is intended to establish
general standards of accounting for and disclosure of events
that occur after the balance sheet date but before financial
statements are issued or are available to be issued. It requires
the disclosure of the date through which an entity has evaluated
subsequent events and the basis for that date — that
is, whether that date represents the date the financial
statements were issued or were available to be issued. This
guidance is effective for interim and annual periods ended after
June 15, 2009 and should be applied prospectively. The
adoption of FASB-issued authoritative guidance on subsequent
events on July 1, 2008 did not have an impact on the
Company’s financial position or results of operations. The
Company determined that the basis for the date through which the
entity has evaluated subsequent events represents the date the
financial statements were issued: October 15, 2009. Details
of subsequent events can be found in Notes 8 and 16 to
these consolidated financial statements.
In June 2009, FASB issued authoritative guidance on the FASB
accounting standards codification and the hierarchy of generally
accepted accounting principles. This guidance establishes the
FASB Accounting Standards Codification as the source of
authoritative accounting principles and the framework for
selecting the principles used in the preparation of financial
statements of nongovernmental entities that are presented in
conformity with generally accepted accounting principles in the
United States (U.S. GAAP). This statement was effective for
the Company’s first quarter of fiscal 2010. As the
Codification is not intended to change or alter existing
U.S. GAAP, implementation of this guidance did not impact
on its consolidated financial statements.
F-19
MIRION
TECHNOLOGIES, INC.
Notes to
Consolidated Financial
Statements — (Continued)
In October 2009, the FASB issued guidance on
multiple-deliverable revenue arrangements. This new guidance
modifies the fair value requirements of the existing guidance by
allowing the use of the “best estimate of selling
price” in addition to vendor-specific objective evidence
and third-party evidence for determining the selling price of a
deliverable. This guidance establishes a selling price hierarchy
for determining the selling price of a deliverable, which is
based on: (a) vendor-specific objective evidence,
(b) third-party evidence, or (c) estimates. In
addition, the residual method of allocating arrangement
consideration is no longer permitted. The new guidance also
requires expanded quantitative and qualitative disclosures about
revenue from arrangements with multiple deliverables. This
guidance is effective for the Company beginning in its fiscal
year ending June 30, 2011. The Company is currently
evaluating the impact of this guidance on its consolidated
financial statements.
Reclassifications — The Company has
reclassified certain prior year balances to conform to current
year presentation.
Costs and billings on uncompleted construction-type contracts
consist of the following (in thousands):
| |
|
|
|
|
|
|
|
|
|
|
|
|
|
|
|
As of June 30,
|
|
|
As of December 31,
|
|
|
|
|
2008
|
|
|
2009
|
|
|
2009
|
|
|
|
|
|
|
|
|
|
|
(unaudited)
|
|
|
|
|
Costs incurred
|
|
$
|
26,151
|
|
|
$
|
34,602
|
|
|
$
|
30,363
|
|
|
Estimated earnings
|
|
|
16,448
|
|
|
|
26,329
|
|
|
|
23,685
|
|
|
|
|
|
|
|
|
|
|
|
|
|
|
|
|
Contracts in progress
|
|
|
42,599
|
|
|
|
60,931
|
|
|
|
54,048
|
|
|
Progress billings on contracts in progress
|
|
|
(27,382
|
)
|
|
|
(49,132
|
)
|
|
|
(41,028
|
)
|
|
|
|
|
|
|
|
|
|
|
|
|
|
|
|
|
|
$
|
15,217
|
|
|
$
|
11,799
|
|
|
$
|
13,020
|
|
|
|
|
|
|
|
|
|
|
|
|
|
|
|
|
Costs and estimated earnings in excess of billings on
uncompleted contracts
|
|
$
|
17,515
|
|
|
$
|
17,073
|
|
|
$
|
17,017
|
|
|
Billings in excess of costs and estimated earnings on
uncompleted contracts(1)
|
|
|
(2,298
|
)
|
|
|
(5,274
|
)
|
|
|
(3,997
|
)
|
|
|
|
|
|
|
|
|
|
|
|
|
|
|
|
|
|
$
|
15,217
|
|
|
$
|
11,799
|
|
|
$
|
13,020
|
|
|
|
|
|
|
|
|
|
|
|
|
|
|
|
|
|
|
|
(1) |
|
Included in deferred contract revenue within the consolidated
balance sheets. |
The components of inventories consist of the following (in
thousands):
| |
|
|
|
|
|
|
|
|
|
|
|
|
|
|
|
As of June 30,
|
|
|
As of December 31,
|
|
|
|
|
2008
|
|
|
2009
|
|
|
2009
|
|
|
|
|
|
|
|
|
|
|
(unaudited)
|
|
|
|
|
Raw materials
|
|
$
|
12,398
|
|
|
$
|
10,234
|
|
|
$
|
11,650
|
|
|
Work in progress
|
|
|
10,126
|
|
|
|
9,889
|
|
|
|
11,000
|
|
|
Finished goods
|
|
|
13,568
|
|
|
|
13,605
|
|
|
|
12,269
|
|
|
|
|
|
|
|
|
|
|
|
|
|
|
|
|
Net inventories
|
|
$
|
36,092
|
|
|
$
|
33,728
|
|
|
$
|
34,919
|
|
|
|
|
|
|
|
|
|
|
|
|
|
|
|
As of June 30, 2008 and 2009 and December 31, 2009,
inventory reserves were approximately $4.5 million,
$4.3 million and $4.3 million (unaudited).
F-20
MIRION
TECHNOLOGIES, INC.
Notes to
Consolidated Financial
Statements — (Continued)
|
|
|
5.
|
PROPERTY,
PLANT AND EQUIPMENT
|
Property, plant and equipment consist of the following (in
thousands):
| |
|
|
|
|
|
|
|
|
|
|
|
|
|
|
|
As of June 30,
|
|
|
As of December 31,
|
|
|
|
|
2008
|
|
|
2009
|
|
|
2009
|
|
|
|
|
|
|
|
|
|
|
(unaudited)
|
|
|
|
|
Land, buildings and leasehold improvements
|
|
$
|
12,178
|
|
|
$
|
11,352
|
|
|
$
|
11,909
|
|
|
Machinery and equipment
|
|
|
23,476
|
|
|
|
24,108
|
|
|
|
25,435
|
|
|
Furniture, fixtures, computer equipment and software
|
|
|
14,269
|
|
|
|
16,951
|
|
|
|
17,619
|
|
|
Construction in progress
|
|
|
1,526
|
|
|
|
840
|
|
|
|
1,499
|
|
|
|
|
|
|
|
|
|
|
|
|
|
|
|
|
|
|
|
51,449
|
|
|
|
53,251
|
|
|
|
56,462
|
|
|
Less accumulated depreciation and amortization
|
|
|
(33,831
|
)
|
|
|
(35,171
|
)
|
|
|
(37,780
|
)
|
|
|
|
|
|
|
|
|
|
|
|
|
|
|
|
|
|
$
|
17,618
|
|
|
$
|
18,080
|
|
|
$
|
18,682
|
|
|
|
|
|
|
|
|
|
|
|
|
|
|
|
Total depreciation and amortization of property, plant and
equipment was $4.1 million, $4.0 million,
$4.4 million, $2.1 million (unaudited) and
$2.7 million (unaudited) for fiscal 2007, 2008 and 2009 and
the six months ended December 31, 2008 and 2009.
|
|
|
6.
|
ACCRUED
EXPENSES AND OTHER CURRENT LIABILITIES
|
Accrued expenses and other current liabilities consist of the
following (in thousands):
| |
|
|
|
|
|
|
|
|
|
|
|
|
|
|
|
As of June 30,
|
|
|
As of December 31,
|
|
|
|
|
2008
|
|
|
2009
|
|
|
2009
|
|
|
|
|
|
|
|
|
|
|
(unaudited)
|
|
|
|
|
Compensation and related benefit costs
|
|
$
|
13,654
|
|
|
$
|
14,151
|
|
|
$
|
12,024
|
|
|
Customer deposits
|
|
|
4,564
|
|
|
|
9,525
|
|
|
|
9,967
|
|
|
Accrued warranty
|
|
|
1,620
|
|
|
|
1,409
|
|
|
|
1,168
|
|
|
Accrued legal, accounting and professional fees
|
|
|
8,149
|
|
|
|
4,071
|
|
|
|
2,349
|
|
|
Other accrued expenses
|
|
|
6,815
|
|
|
|
5,852
|
|
|
|
5,364
|
|
|
|
|
|
|
|
|
|
|
|
|
|
|
|
|
|
|
$
|
34,802
|
|
|
$
|
35,008
|
|
|
$
|
30,872
|
|
|
|
|
|
|
|
|
|
|
|
|
|
|
|
|
|
|
7.
|
GOODWILL
AND INTANGIBLE ASSETS
|
Goodwill and intangible assets were recorded in connection with
the acquisitions of GDS, IST and Synodys by ACAS as well as
other subsequent acquisitions by Mirion. GDS was acquired by
ACAS in October 2003 for cash of $60.8 million. IST was
acquired by ACAS in May 2004 for cash of $53.5 million.
Synodys was acquired by ACAS in June 2004 for cash and equity of
$75.1 million. The three acquisitions by ACAS were
accounted for using the purchase method of accounting which
resulted in goodwill of approximately $123.9 million
(including the recognition of deferred tax assets of
$18.4 million associated with the acquisitions) and
intangible assets of approximately $72.3 million (valued
using exchange rates in effect on the date of each acquisition).
The Company completed three other acquisitions during fiscal
2005 and 2006 that resulted in goodwill of approximately
$8.3 million and intangible assets of approximately
$12.5 million. In fiscal 2008, the Company received
$2.8 million from the return of escrow funds associated
with the IST acquisition. This payment was treated as a
reduction in the IST purchase price, with a corresponding
reduction in goodwill.
F-21
MIRION
TECHNOLOGIES, INC.
Notes to
Consolidated Financial
Statements — (Continued)
The changes in the carrying amount of goodwill allocated to the
Company’s reportable segments are as follows (in thousands):
| |
|
|
|
|
|
|
|
|
|
|
|
|
|
|
|
|
|
|
|
|
|
|
|
|
|
|
|
|
|
|
Radiation
|
|
|
|
|
|
|
|
|
|
|
|
|
|
|
|
|
Health
|
|
|
Monitoring
|
|
|
Sensing
|
|
|
Dosimetry
|
|
|
Imaging
|
|
|
|
|
|
|
|
Physics
|
|
|
Systems
|
|
|
Systems
|
|
|
Services
|
|
|
Systems
|
|
|
Total
|
|
|
|
|
Balance — June 30, 2007
|
|
$
|
46,235
|
|
|
$
|
19,312
|
|
|
$
|
11,001
|
|
|
$
|
52,413
|
|
|
$
|
9,965
|
|
|
$
|
138,926
|
|
|
Return of escrow funds
|
|
|
—
|
|
|
|
—
|
|
|
|
(1,367
|
)
|
|
|
—
|
|
|
|
(1,383
|
)
|
|
|
(2,750
|
)
|
|
Translation adjustment
|
|
|
7,972
|
|
|
|
3,330
|
|
|
|
200
|
|
|
|
—
|
|
|
|
—
|
|
|
|
11,502
|
|
|
|
|
|
|
|
|
|
|
|
|
|
|
|
|
|
|
|
|
|
|
|
|
|
|
|
|
Balance — June 30, 2008
|
|
|
54,207
|
|
|
|
22,642
|
|
|
|
9,834
|
|
|
|
52,413
|
|
|
|
8,582
|
|
|
|
147,678
|
|
|
Translation adjustment
|
|
|
(6,000
|
)
|
|
|
(2,507
|
)
|
|
|
(150
|
)
|
|
|
—
|
|
|
|
—
|
|
|
|
(8,657
|
)
|
|
|
|
|
|
|
|
|
|
|
|
|
|
|
|
|
|
|
|
|
|
|
|
|
|
|
|
Balance — June 30, 2009
|
|
|
48,207
|
|
|
|
20,135
|
|
|
|
9,684
|
|
|
|
52,413
|
|
|
|
8,582
|
|
|
|
139,021
|
|
|
Translation adjustment (unaudited)
|
|
|
961
|
|
|
|
401
|
|
|
|
24
|
|
|
|
—
|
|
|
|
—
|
|
|
|
1,386
|
|
|
|
|
|
|
|
|
|
|
|
|
|
|
|
|
|
|
|
|
|
|
|
|
|
|
|
|
Balance — December 31, 2009 (unaudited)
|
|
$
|
49,168
|
|
|
$
|
20,536
|
|
|
$
|
9,708
|
|
|
$
|
52,413
|
|
|
$
|
8,582
|
|
|
$
|
140,407
|
|
|
|
|
|
|
|
|
|
|
|
|
|
|
|
|
|
|
|
|
|
|
|
|
|
|
|
Intangible assets consist of the following (in thousands):
| |
|
|
|
|
|
|
|
|
|
|
|
|
|
|
|
|
|
|
|
|
|
|
|
|
|
|
|
|
|
|
|
|
|
|
|
|
|
|
|
|
|
|
|
|
|
As of June 30, 2008
|
|
|
As of June 30, 2009
|
|
|
As of December 31, 2009 (unaudited)
|
|
|
|
|
Weighted
|
|
Gross
|
|
|
|
|
|
Net
|
|
|
Gross
|
|
|
|
|
|
Net
|
|
|
Gross
|
|
|
|
|
|
Net
|
|
|
|
|
Average Life
|
|
Carrying
|
|
|
Accumulated
|
|
|
Book
|
|
|
Carrying
|
|
|
Accumulated
|
|
|
Book
|
|
|
Carrying
|
|
|
Accumulated
|
|
|
Book
|
|
|
|
|
in Years
|
|
Amount
|
|
|
Amortization
|
|
|
Value
|
|
|
Amount
|
|
|
Amortization
|
|
|
Value
|
|
|
Amount
|
|
|
Amortization
|
|
|
Value
|
|
|
|
|
Customer relationships
|
|
|
11
|
|
|
$
|
64,360
|
|
|
$
|
(39,826
|
)
|
|
$
|
24,534
|
|
|
$
|
61,714
|
|
|
$
|
(44,069
|
)
|
|
$
|
17,645
|
|
|
$
|
62,124
|
|
|
$
|
(46,981
|
)
|
|
$
|
15,143
|
|
|
Trade names
|
|
|
11
|
|
|
|
9,128
|
|
|
|
(3,597
|
)
|
|
|
5,531
|
|
|
|
8,605
|
|
|
|
(4,153
|
)
|
|
|
4,452
|
|
|
|
8,689
|
|
|
|
(4,600
|
)
|
|
|
4,089
|
|
|
Backlog
|
|
|
2
|
|
|
|
9,190
|
|
|
|
(9,190
|
)
|
|
|
—
|
|
|
|
8,659
|
|
|
|
(8,659
|
)
|
|
|
—
|
|
|
|
8,744
|
|
|
|
(8,744
|
)
|
|
|
—
|
|
|
Enterprise software
|
|
|
5
|
|
|
|
2,500
|
|
|
|
(2,375
|
)
|
|
|
125
|
|
|
|
2,500
|
|
|
|
(2,500
|
)
|
|
|
—
|
|
|
|
2,500
|
|
|
|
(2,500
|
)
|
|
|
—
|
|
|
Qualifications
|
|
|
6
|
|
|
|
1,600
|
|
|
|
(1,094
|
)
|
|
|
506
|
|
|
|
1,600
|
|
|
|
(1,360
|
)
|
|
|
240
|
|
|
|
1,600
|
|
|
|
(1,494
|
)
|
|
|
106
|
|
|
Complete technology
|
|
|
8
|
|
|
|
3,500
|
|
|
|
(1,957
|
)
|
|
|
1,543
|
|
|
|
3,500
|
|
|
|
(2,394
|
)
|
|
|
1,106
|
|
|
|
3,500
|
|
|
|
(2,613
|
)
|
|
|
887
|
|
|
Territorial rights
|
|
|
5
|
|
|
|
2,852
|
|
|
|
(2,025
|
)
|
|
|
827
|
|
|
|
2,537
|
|
|
|
(2,292
|
)
|
|
|
245
|
|
|
|
2,587
|
|
|
|
(2,587
|
)
|
|
|
—
|
|
|
Other
|
|
|
3
|
|
|
|
279
|
|
|
|
(174
|
)
|
|
|
105
|
|
|
|
89
|
|
|
|
(89
|
)
|
|
|
—
|
|
|
|
82
|
|
|
|
(82
|
)
|
|
|
—
|
|
|
|
|
|
|
|
|
|
|
|
|
|
|
|
|
|
|
|
|
|
|
|
|
|
|
|
|
|
|
|
|
|
|
|
|
|
|
|
|
|
|
|
|
Total
|
|
|
|
|
|
$
|
93,409
|
|
|
$
|
(60,238
|
)
|
|
$
|
33,171
|
|
|
$
|
89,204
|
|
|
$
|
(65,516
|
)
|
|
$
|
23,688
|
|
|
$
|
89,826
|
|
|
$
|
(69,601
|
)
|
|
$
|
20,225
|
|
|
|
|
|
|
|
|
|
|
|
|
|
|
|
|
|
|
|
|
|
|
|
|
|
|
|
|
|
|
|
|
|
|
|
|
|
|
|
|
|
|
|
Aggregate amortization expense for intangible assets was
$12.2 million, $10.1 million and $8.1 million for
fiscal 2007, 2008 and 2009 and $4.2 million (unaudited) and
$3.7 million (unaudited) for the six months ended
December 31, 2008 and 2009. Future annual amortization
expense at the current foreign exchange rate is as follows (in
thousands):
| |
|
|
|
|
|
|
|
Annual
|
|
Years Ending
|
|
Amortization
|
|
|
June 30,
|
|
Expense
|
|
|
|
|
2010
|
|
$
|
6,484
|
|
|
2011
|
|
|
4,760
|
|
|
2012
|
|
|
3,709
|
|
|
2013
|
|
|
2,749
|
|
|
2014
|
|
|
1,622
|
|
|
2015 and thereafter
|
|
|
4,364
|
|
|
|
|
|
|
|
|
Total
|
|
$
|
23,688
|
|
|
|
|
|
|
|
F-22
MIRION
TECHNOLOGIES, INC.
Notes to
Consolidated Financial
Statements — (Continued)
Notes Payable to ACAS — The Company has entered
into several Note and Equity Purchase Agreements
(“NEPAs”) with ACFS, a subsidiary of ACAS, which
contain revolving credit facilities, senior term notes payable
and subordinated note agreements. The interest rates on the
revolving credit facilities and notes payable are based on a
fixed stated rate or a variable LIBOR or EURIBOR based rate plus
additional basis points. The one-month LIBOR rates were 2.5%,
0.3% and 0.3% (unaudited), the one-month EURIBOR rates were
4.4%, 0.8% and 0.4% (unaudited) and the three-month EURIBOR
rates were 4.9%, 1.1% and 0.8% (unaudited) as of June 30,
2008 and 2009 and December 31, 2009.
Notes payable to ACAS consist of the following (in thousands):
| |
|
|
|
|
|
|
|
|
|
|
|
|
|
|
|
|
|
|
|
|
|
Contractual
|
|
As of June 30,
|
|
|
December 31,
|
|
|
|
|
Due
|
|
Interest Rate
|
|
2008
|
|
|
2009
|
|
|
2009
|
|
|
|
|
|
|
|
|
|
|
|
|
|
|
(unaudited)
|
|
|
|
|
Revolving Credit Facilities:
|
|
|
|
|
|
|
|
|
|
|
|
|
|
|
|
|
|
$20.25 million
|
|
July 2011
|
|
LIBOR + 4.5%
|
|
$
|
13,750
|
|
|
$
|
11,000
|
|
|
$
|
20,250
|
|
|
$14.0 million
|
|
July 2011
|
|
LIBOR + 5%
|
|
|
10,197
|
|
|
|
13,997
|
|
|
|
13,997
|
|
|
$8.2 million
|
|
July 2011
|
|
EURIBOR + 2%
|
|
|
8,205
|
|
|
|
3,631
|
|
|
|
7,130
|
|
|
Senior Term Notes:
|
|
|
|
|
|
|
|
|
|
|
|
|
|
|
|
|
|
$24.9 million Senior Term B
|
|
July 2011
|
|
EURIBOR + 3%
|
|
|
24,944
|
|
|
|
24,944
|
|
|
|
24,944
|
|
|
$7.5 million Senior Term B
|
|
July 2011
|
|
LIBOR + 8%
|
|
|
5,135
|
|
|
|
5,062
|
|
|
|
5,026
|
|
|
$2.0 million Senior Term B
|
|
July 2011
|
|
LIBOR + 8%
|
|
|
1,965
|
|
|
|
1,938
|
|
|
|
1,924
|
|
|
$4.0 million Senior Term C
|
|
October 2011
|
|
LIBOR + 9%
|
|
|
4,000
|
|
|
|
4,000
|
|
|
|
4,000
|
|
|
$4.0 million Senior Term C
|
|
November 2011
|
|
LIBOR + 8.25%
|
|
|
4,000
|
|
|
|
4,000
|
|
|
|
4,000
|
|
|
$27.0 million Senior Term D
|
|
October 2011
|
|
LIBOR + 6.5%
|
|
|
26,258
|
|
|
|
26,056
|
|
|
|
25,920
|
|
|
$15.0 million Senior Term D
|
|
October 2011
|
|
LIBOR + 6.5%
|
|
|
14,588
|
|
|
|
14,437
|
|
|
|
14,362
|
|
|
Senior Subordinated Notes:
|
|
|
|
|
|
|
|
|
|
|
|
|
|
|
|
|
|
$7.5 million
paid-in-kind
|
|
July 2011
|
|
14%
|
|
|
8,150
|
|
|
|
8,317
|
|
|
|
8,402
|
|
|
$8.6 million
paid-in-kind
|
|
July 2011
|
|
15%
|
|
|
9,446
|
|
|
|
9,650
|
|
|
|
9,749
|
|
|
$12.2 million
paid-in-kind
|
|
July 2011
|
|
EURIBOR + 11%
|
|
|
14,710
|
|
|
|
15,552
|
|
|
|
15,992
|
|
|
Junior Subordinated Notes:
|
|
|
|
|
|
|
|
|
|
|
|
|
|
|
|
|
|
$4.3 million
paid-in-kind
|
|
July 2011
|
|
17%
|
|
|
4,951
|
|
|
|
5,112
|
|
|
|
5,191
|
|
|
$4.3 million
paid-in-kind
|
|
July 2011
|
|
17%
|
|
|
4,951
|
|
|
|
5,112
|
|
|
|
5,191
|
|
|
$1.25 million
paid-in-kind
|
|
May 2012
|
|
14%
|
|
|
1,358
|
|
|
|
1,386
|
|
|
|
1,400
|
|
|
$4.9 million
paid-in-kind
|
|
July 2011
|
|
EURIBOR + 12%
|
|
|
6,211
|
|
|
|
6,666
|
|
|
|
6,908
|
|
|
Stockholder Loan:
|
|
|
|
Three-month
|
|
|
|
|
|
|
|
|
|
|
|
|
|
$8.0 million
|
|
June 2011
|
|
EURIBOR + 2%
|
|
|
10,367
|
|
|
|
9,220
|
|
|
|
9,404
|
|
|
|
|
|
|
|
|
|
|
|
|
|
|
|
|
|
|
|
|
Total notes payable to ACAS
|
|
|
|
|
|
|
173,186
|
|
|
|
170,080
|
|
|
|
183,790
|
|
|
Less current portion
|
|
|
|
|
|
|
(520
|
)
|
|
|
(520
|
)
|
|
|
(520
|
)
|
|
|
|
|
|
|
|
|
|
|
|
|
|
|
|
|
|
|
|
Notes payable to ACAS — long term
|
|
|
|
|
|
$
|
172,666
|
|
|
$
|
169,560
|
|
|
$
|
183,270
|
|
|
|
|
|
|
|
|
|
|
|
|
|
|
|
|
|
|
|
The revolving credit facilities and notes issued under the NEPAs
require the Company to maintain certain financial ratios and
contain financial covenants and non-financial restrictive and
affirmative covenants. As of June 30, 2008 and 2009, the
Company was not in compliance with certain non-financial
covenants that were in effect prior to the formation of Mirion.
These non-financial covenants were negotiated with the
predecessor companies (GDS, IST and Synodys) and were not
amended at the time of the formation of Mirion. The
non-financial covenants relate to matters such as changing the
fiscal years or names of subsidiaries, amending the charter
documents and by-laws of subsidiaries and the provision of
audited financial statements to ACFS. In
F-23
MIRION
TECHNOLOGIES, INC.
Notes to
Consolidated Financial
Statements — (Continued)
September 2009, the Company obtained waivers from ACFS for
breaches of any non-financial covenants that may occur through
July 1, 2010. A description of the debt agreements payable
to ACAS is as follows:
Revolving Credit Facilities — The Company has
entered into three separate credit facilities with ACFS, each
represented by a revolving credit note. The Revolving Credit
Facilities contain various financial covenants and a first
security position on all Company assets. The Company is required
to pay an annual non-usage fee of 0.7% of the average annual
unused balance on the Revolving Credit Facilities.
Senior Term Notes — The $24.9 million
Senior Term B Note and the Senior Term C Notes provide for
monthly interest only payments. The notes are secured by assets
of the Company and are subordinated to the Revolving Credit
Facilities and Senior Term Notes B and D. The
$7.5 million and $2.0 million Senior Term B Notes
provide for quarterly principal payments totaling $25,000 plus
monthly payments of interest. The notes are secured by assets of
the Company and are subordinated to the Revolving Credit
Facilities and the Senior Term D Notes. The Senior Term D Notes
provide for quarterly principal payments of $105,000 plus
monthly payments of interest. The notes are secured by assets of
the Company and are subordinated to the Revolving Credit
Facilities.
Senior Subordinated Notes — The outstanding
balances on Senior Subordinated Notes include the principal
amount outstanding plus a compounding
paid-in-kind
(“PIK”) interest component calculated at rates between
2% and 5.5% per annum. The Company is required to make monthly
payments of stated interest only. The notes are secured by
assets of the Company and are subordinated to the Revolving
Credit Facilities and Senior Term B, C and D Notes.
Junior Subordinated Notes — The outstanding
balances on Junior Subordinated Notes include the principal
amount outstanding plus a compounding PIK interest component
calculated at rates between 2% and 7% per annum. The Company is
required to make monthly payments of stated interest only. The
notes are secured by assets of the Company and are subordinated
to the Revolving Credit Facilities and Senior Term B, C and D
Notes and Senior Subordinated Notes.
Stockholder Loan — The stockholder loan
provides for quarterly interest-only payments. The loan is
secured by the assets of the Company and is subordinated to all
other debt.
During 2007, the NEPAs were amended to (i) increase the
$20.25 million revolving credit facility from an original
commitment of $5.25 million to $10.25 million,
(ii) increase the $14 million revolving credit
facility from a commitment of $6 million to
$14 million, (iii) extend the due date on the
stockholder loan from September 13, 2006 to
September 23, 2008 and (iv) issue an additional
$2.0 million of Senior Term B Notes on March 20, 2007
with an interest rate of LIBOR + 8% and a due date May 24,
2010.
During 2008, the NEPAs were further amended to (i) increase
the $20.25 million revolving credit facility from a
commitment amount of $10.25 million to $20.25 million
and extend the due date from May 24, 2008 to
October 14, 2010, (ii) extend the due date on the
$8.2 million revolving credit facility from June 23,
2008 to October 14, 2010 and (iii) extend the due date
on the stockholder loan from September 23, 2008 to
October 14, 2010.
The modifications made during 2007 and 2008 were analyzed in
accordance with FASB-issued authoritative guidance on
debtor’s accounting for changes in
line-of-credit
or
revolving-debt
arrangements and were not determined to be significant to the
financial statements. There were no unamortized loan fees
expensed in 2007 or 2008 as a result of the amendments.
In August 2009, the Note and Equity Purchase Agreements with
ACFS were amended to extend the due dates on the (i) Senior
Term B Notes to July 1, 2011, (ii) Senior Subordinated
Notes to July 1, 2011, (iii) Junior Subordinated Notes
to July 1, 2011 except $1.25 million Junior
Subordinated Notes which due date remains unchanged,
(iv) Stockholder loan to June 30, 2011 and
(v) Revolving Credit Facilities to July 2011.
F-24
MIRION
TECHNOLOGIES, INC.
Notes to
Consolidated Financial
Statements — (Continued)
Third-Party
Borrowings
The Company has notes payable and other borrowings to third
parties as follows (in thousands):
| |
|
|
|
|
|
|
|
|
|
|
|
|
|
|
|
|
|
|
|
As of June 30,
|
|
December 31,
|
|
|
|
Due
|
|
2008
|
|
2009
|
|
2009
|
|
|
|
|
|
|
|
|
|
(unaudited)
|
|
|
|
Term loan
|
|
November 2012
|
|
$
|
1,543
|
|
|
$
|
1,067
|
|
|
$
|
933
|
|
|
Revolving line of credit
|
|
On demand
|
|
|
5,272
|
|
|
|
2,364
|
|
|
|
4,694
|
|
|
Bank lines of credit
|
|
On demand
|
|
|
2,554
|
|
|
|
3,773
|
|
|
|
172
|
|
|
Factoring financing
|
|
As collected
|
|
|
864
|
|
|
|
—
|
|
|
|
—
|
|
|
|
|
|
|
|
|
|
|
|
|
|
|
|
|
|
|
Total third-party borrowings
|
|
|
|
|
10,233
|
|
|
|
7,204
|
|
|
|
5,799
|
|
|
Less current portion
|
|
|
|
|
(9,033
|
)
|
|
|
(6,442
|
)
|
|
|
(5,177
|
)
|
|
|
|
|
|
|
|
|
|
|
|
|
|
|
|
|
|
Third-party borrowings-long term
|
|
|
|
$
|
1,200
|
|
|
$
|
762
|
|
|
$
|
622
|
|
|
|
|
|
|
|
|
|
|
|
|
|
|
|
|
|
The Company has a term loan with a French financial institution
with an initial balance of €1.4 million as of May 2006
($1.8 million), which is due November 2012. The note bears
annual interest at the three-month EURIBOR + 1% with quarterly
payments of €54,000. The amount due under this term loan at
June 30, 2009 was €760,000 ($1.1 million).
As described in Note 2, the Company has pledged certain
accounts receivable balances to several French institutions to
secure a revolving line of credit. The line of credit bears
interest at EURIBOR + 1%. Amounts outstanding under these
arrangements are due when the related receivable is collected or
upon demand. The Company also has a factoring arrangement which
allows it to sell certain receivables without recourse for a 5%
fee. Amounts outstanding under this arrangement are repaid as
the related receivables are collected.
The Company has entered into various line of credit arrangements
with local banks in France and Germany. In Germany, these
arrangements provide for short-term bank overdrafts, U.S. dollar
advances and the issuance of documentary and standby letters of
credit of up to €3.5 million. As of June 30,
2009, €2.0 million of the lines had been utilized to
guarantee documentary and standby letters of credit, with
interest rates ranging from 1.25% to 1.35%. In France, these
arrangements provide for short-term bank overdrafts that are due
on demand and bear interest at EURIBOR + 1%. Additionally,
during fiscal 2008, the Company obtained a credit line with
French financial institution to borrow up to
€2.0 million bearing interest at EURIBOR + 1%. Amounts
outstanding on the credit line are due on demand or at the
termination of the credit line in June 2015.
Maturities on all notes payable as of June 30, 2009 are as
follows (in thousands):
| |
|
|
|
|
Years Ending
|
|
|
|
|
June 30,
|
|
Amount
|
|
|
|
|
2010
|
|
$
|
6,962
|
|
|
2011
|
|
|
10,044
|
|
|
2012
|
|
|
160,126
|
|
|
2013
|
|
|
152
|
|
|
2014 and thereafter
|
|
|
—
|
|
|
|
|
|
|
|
|
Total
|
|
$
|
177,284
|
|
|
|
|
|
|
|
F-25
MIRION
TECHNOLOGIES, INC.
Notes to
Consolidated Financial
Statements — (Continued)
|
|
|
9.
|
COMMITMENTS
AND CONTINGENCIES
|
Leases and Other Contractual Obligations — In
the normal course of business, the Company enters into
contractual arrangements with third parties for noncancelable
operating lease agreements for its offices and vehicles. Under
these agreements, the Company commits to provide specified
payments to a lessor, based upon contractual arrangements.
The total future minimum commitments for these and other
contractual arrangements in place as of June 30, 2009, are
scheduled to be paid as follows (in thousands):
| |
|
|
|
|
|
|
|
|
|
|
|
|
|
|
|
|
|
|
|
|
|
|
|
|
|
|
|
|
|
|
|
2010
|
|
|
2011
|
|
|
2012
|
|
|
2013
|
|
|
2014
|
|
|
Thereafter
|
|
|
Total
|
|
|
|
|
Minimum future operating lease payments
|
|
$
|
4,377
|
|
|
$
|
3,929
|
|
|
$
|
3,310
|
|
|
$
|
2,875
|
|
|
$
|
1,719
|
|
|
$
|
946
|
|
|
$
|
17,156
|
|
|
Less income from subleases
|
|
|
(170
|
)
|
|
|
(170
|
)
|
|
|
(170
|
)
|
|
|
(170
|
)
|
|
|
(170
|
)
|
|
|
—
|
|
|
|
(850
|
)
|
|
|
|
|
|
|
|
|
|
|
|
|
|
|
|
|
|
|
|
|
|
|
|
|
|
|
|
|
|
|
|
Net minimum operating lease payments
|
|
$
|
4,207
|
|
|
$
|
3,759
|
|
|
$
|
3,140
|
|
|
$
|
2,705
|
|
|
$
|
1,549
|
|
|
$
|
946
|
|
|
$
|
16,306
|
|
|
|
|
|
|
|
|
|
|
|
|
|
|
|
|
|
|
|
|
|
|
|
|
|
|
|
|
|
|
|
Total rent expense for fiscal 2007, 2008 and 2009 was
$2.8 million, $2.9 million, $3.2 million,
$1.6 million (unaudited) and $1.7 million (unaudited) for
the six months ended December 31, 2008 and 2009.
Legal Proceedings — The Company is subject to
claims and legal proceedings for matters that have arisen
through the ordinary course of business. Management believes any
liability that may ultimately result from the resolution of
these matters will not have a material adverse effect on the
Company’s consolidated financial position, operating
results and cash flows.
Performance Bonds and Letters of Credit — The
Company posts performance bonds with irrevocable letters of
credit to support certain contractual obligations to customers
for equipment delivery. These letters of credit are supported by
restricted cash accounts, which totaled $5.4 million,
$6.0 million and $6.9 million (unaudited) as of
June 30, 2008 and 2009 and December 31, 2009.
F-26
MIRION
TECHNOLOGIES, INC.
Notes to
Consolidated Financial
Statements — (Continued)
The Company’s (loss) income before income taxes and the
details of the income tax provision consist of the following (in
thousands):
| |
|
|
|
|
|
|
|
|
|
|
|
|
|
|
|
Year Ended June 30,
|
|
|
|
|
2007
|
|
|
2008
|
|
|
2009
|
|
|
|
|
(Loss) income before income taxes
|
|
|
|
|
|
|
|
|
|
|
|
|
|
Domestic
|
|
$
|
(19,881
|
)
|
|
$
|
(14,346
|
)
|
|
$
|
(11,366
|
)
|
|
Foreign
|
|
|
5,117
|
|
|
|
6,835
|
|
|
|
13,023
|
|
|
|
|
|
|
|
|
|
|
|
|
|
|
|
|
Total (loss) income before income taxes
|
|
$
|
(14,764
|
)
|
|
$
|
(7,511
|
)
|
|
$
|
1,657
|
|
|
|
|
|
|
|
|
|
|
|
|
|
|
|
|
Income tax provision
|
|
|
|
|
|
|
|
|
|
|
|
|
|
Current
|
|
|
|
|
|
|
|
|
|
|
|
|
|
Federal
|
|
$
|
170
|
|
|
$
|
101
|
|
|
$
|
—
|
|
|
State
|
|
|
10
|
|
|
|
17
|
|
|
|
17
|
|
|
Foreign
|
|
|
4,895
|
|
|
|
5,241
|
|
|
|
6,172
|
|
|
|
|
|
|
|
|
|
|
|
|
|
|
|
|
Total current
|
|
|
5,075
|
|
|
|
5,359
|
|
|
|
6,189
|
|
|
Deferred
|
|
|
|
|
|
|
|
|
|
|
|
|
|
Federal
|
|
|
1,188
|
|
|
|
1,188
|
|
|
|
1,188
|
|
|
State
|
|
|
113
|
|
|
|
(119
|
)
|
|
|
66
|
|
|
Foreign
|
|
|
(1,439
|
)
|
|
|
(590
|
)
|
|
|
(1,831
|
)
|
|
|
|
|
|
|
|
|
|
|
|
|
|
|
|
Total deferred
|
|
|
(138
|
)
|
|
|
479
|
|
|
|
(577
|
)
|
|
|
|
|
|
|
|
|
|
|
|
|
|
|
|
Income tax provision
|
|
$
|
4,937
|
|
|
$
|
5,838
|
|
|
$
|
5,612
|
|
|
|
|
|
|
|
|
|
|
|
|
|
|
|
The provision for income taxes differs from the amount computed
by applying the statutory federal income tax rate to (loss)
income before income taxes as follows (in thousands):
| |
|
|
|
|
|
|
|
|
|
|
|
|
|
|
|
Year Ended June 30,
|
|
|
|
|
2007
|
|
|
2008
|
|
|
2009
|
|
|
|
|
(Loss) income before provision for income taxes
|
|
$
|
(14,764
|
)
|
|
$
|
(7,511
|
)
|
|
$
|
1,657
|
|
|
|
|
|
|
|
|
|
|
|
|
|
|
|
|
Federal income tax at statutory rate
|
|
|
(5,020
|
)
|
|
|
(2,554
|
)
|
|
|
563
|
|
|
State income tax (net of federal benefit)
|
|
|
(521
|
)
|
|
|
(517
|
)
|
|
|
(598
|
)
|
|
Foreign income taxed at different rates
|
|
|
4,144
|
|
|
|
3,625
|
|
|
|
2,212
|
|
|
Change in valuation allowance(1)
|
|
|
5,718
|
|
|
|
5,011
|
|
|
|
3,171
|
|
|
Change in tax rates
|
|
|
112
|
|
|
|
181
|
|
|
|
0
|
|
|
Other non-deductible expenses
|
|
|
688
|
|
|
|
664
|
|
|
|
629
|
|
|
Benefit of tax credits
|
|
|
—
|
|
|
|
(939
|
)
|
|
|
(536
|
)
|
|
Other
|
|
|
(184
|
)
|
|
|
367
|
|
|
|
171
|
|
|
|
|
|
|
|
|
|
|
|
|
|
|
|
|
Total income tax provision
|
|
$
|
4,937
|
|
|
$
|
5,838
|
|
|
$
|
5,612
|
|
|
|
|
|
|
|
|
|
|
|
|
|
|
|
|
|
|
|
(1) |
|
Affecting the provision for income taxes. |
F-27
MIRION
TECHNOLOGIES, INC.
Notes to
Consolidated Financial
Statements — (Continued)
The components of the Company’s net deferred tax assets and
liabilities consisted of the following (in thousands):
| |
|
|
|
|
|
|
|
|
|
|
|
2008
|
|
|
2009
|
|
|
|
|
Deferred tax assets:
|
|
|
|
|
|
|
|
|
|
Net operating losses
|
|
$
|
19,452
|
|
|
$
|
16,398
|
|
|
Tax credits
|
|
|
6,006
|
|
|
|
7,430
|
|
|
Other reserves and accrued expenses
|
|
|
15,461
|
|
|
|
16,026
|
|
|
|
|
|
|
|
|
|
|
|
|
Total deferred tax assets
|
|
|
40,919
|
|
|
|
39,854
|
|
|
Deferred tax liabilities:
|
|
|
|
|
|
|
|
|
|
Amortization
|
|
|
(3,287
|
)
|
|
|
(2,317
|
)
|
|
Depreciation
|
|
|
(436
|
)
|
|
|
(236
|
)
|
|
Other liabilities
|
|
|
(3,887
|
)
|
|
|
(10
|
)
|
|
Purchased technology, goodwill, & other intangibles
|
|
|
(13,413
|
)
|
|
|
(12,638
|
)
|
|
|
|
|
|
|
|
|
|
|
|
Total deferred tax liabilities
|
|
|
(21,023
|
)
|
|
|
(15,201
|
)
|
|
Less: Valuation allowance
|
|
|
(27,601
|
)
|
|
|
(31,393
|
)
|
|
|
|
|
|
|
|
|
|
|
|
Net deferred tax liabilities
|
|
$
|
(7,705
|
)
|
|
$
|
(6,740
|
)
|
|
|
|
|
|
|
|
|
|
|
The provision for income taxes for the first six months of
fiscal 2010 was approximately $3.3 million (unaudited),
with an estimated effective tax rate of 130.6% (unaudited). The
effective tax rate for the six months differs from the US
statutory rate of 34% primarily due to tax liabilities in
foreign jurisdictions. The fiscal 2010 effective tax rate for
the first six months of fiscal 2010 is also impacted by losses
generated in the U.S. where no benefit is recorded due to the
valuation allowance.
Management regularly evaluates the recoverability of deferred
tax assets and recognizes the tax benefit only if reassessment
demonstrates that they are realizable. At such time, if it is
determined that it is more likely than not that the deferred tax
assets are realizable, the valuation allowance will be adjusted.
As of June 30, 2008 and 2009 and December 31, 2009,
the Company has provided a valuation allowance for certain
U.S. and foreign deferred tax assets that it believes are
more likely than not unrealizable.
As of June 30, 2009, the Company had federal and state net
operating loss carryforwards of approximately $59.1 million
and $73.4 million. The federal net operating losses will
begin to expire in 2023. The state net operating losses will
begin to expire in 2013. As of June 30, 2009, the Company
had tax credit carryforwards of approximately $7.7 million,
available to offset foreign taxes paid for federal income tax
purposes. Federal tax credit carryforwards will begin to expire
in fiscal 2010.
The Company has not provided U.S. income tax on certain
foreign earnings that are deemed to be indefinitely invested
outside the U.S. For fiscal 2007, 2008 and 2009, the amount
of accumulated unremitted earnings from the Company’s
foreign subsidiaries under
FASB-issued
authoritative guidance on accounting for income taxes is
approximately $17.0 million, $13.2 million and
$17.3 million. Determination of the amount of unrecognized
deferred U.S. income tax liability is not practical due to
the complexities associated with its hypothetical calculation.
On July 1, 2007, the Company adopted the provisions of
FASB-issued
authoritative guidance which clarifies the accounting for
uncertainty in income taxes recognized in an enterprise’s
financial statements. This interpretation prescribes a
recognition threshold and measurement attribute for the
financial statement recognition and measurements of a tax
position taken or expected to be taken in a tax return. This
guidance also provides guidance on derecognition of tax
benefits, classification on the balance sheet, interest and
penalties, accounting in interim periods, disclosure and
transition.
F-28
MIRION
TECHNOLOGIES, INC.
Notes to
Consolidated Financial
Statements — (Continued)
A reconciliation of the beginning and ending amount of
unrecognized tax benefits is as follows (in thousands):
| |
|
|
|
|
|
|
|
Year Ended
|
|
|
|
|
June 30, 2009
|
|
|
|
|
Balance at beginning of period
|
|
$
|
13,460
|
|
|
|
|
|
|
|
|
Additions based on tax positions taken related to prior years
|
|
|
451
|
|
|
Additions based on tax positions taken related to current year
|
|
|
2,247
|
|
|
Reductions based on settlements
|
|
|
—
|
|
|
Reductions for tax positions of prior years
|
|
|
—
|
|
|
Foreign currency translation adjustments
|
|
|
(1,205
|
)
|
|
|
|
|
|
|
|
Balance at end of period
|
|
$
|
14,953
|
|
|
|
|
|
|
|
As of June 30, 2009, the Company had approximately
$15.0 million of unrecognized tax benefits related to
uncertain tax positions, of which $9.6 million would affect
its effective tax rate if recognized. The Company anticipates a
decrease to its unrecognized tax benefits in the amount of
approximately $1.7 million during the next 12 months
primarily due to amended tax filings. The Company does not
believe the remaining amount of unrecognized tax benefits as of
June 30, 2009 and December 31, 2009, will materially
change in the next 12 months.
No significant change to the Company’s unrecognized tax
benefits related to uncertain tax positions occurred during the
six months ended December 31, 2009.
The Company recognizes interest and penalties associated with
uncertain tax positions in income tax expense. As of
June 30, 2008 and June 30, 2009, the provision for
interest and penalties was $1.0 million and
$1.2 million. The ultimate amount and timing of any future
cash settlements cannot be predicted with reasonable certainty.
The Company conducts business globally and as a result, one or
more of its subsidiaries file income tax returns in the
U.S. federal jurisdiction and various state and foreign
jurisdictions. In the normal course of business, the Company is
subject to examination by taxing authorities throughout the
world, including such major jurisdictions as the United Kingdom,
France, Germany and the United States. With a few insignificant
jurisdictions, the Company is no longer subject to
U.S. federal, state and local, or
non-U.S. income
tax examinations for years prior to fiscal 2001.
In many cases, the Company’s uncertain tax positions are
related to tax years that remain subject to examination by tax
authorities. The following describes open tax years by major tax
jurisdictions as of June 30, 2009:
| |
|
|
|
|
|
|
|
Years Open
|
|
|
|
|
Jurisdiction:
|
|
|
|
|
|
United Kingdom
|
|
|
2007–2009
|
|
|
France
|
|
|
2005–2009
|
|
|
Germany
|
|
|
2003–2009
|
|
|
United States
|
|
|
2005–2009
|
|
F-29
MIRION
TECHNOLOGIES, INC.
Notes to
Consolidated Financial
Statements — (Continued)
|
|
|
11.
|
EMPLOYEE
BENEFIT PLANS
|
Defined Benefit Pension Plans — The Company
maintains contributory and noncontributory defined benefit plans
for certain employees in France and Germany.
In France, the Company contributes to the national pension
system, and its obligation to employees in terms of pensions is
restricted to a lump-sum length of service award payable at the
date that the employee reaches retirement age, such award being
determined for each individual based upon years of service
provided and projected final salary. The benefit obligation is
unfunded. Accordingly, the fair value of plan assets is zero for
the periods presented.
In Germany, plan benefits are generally based on an
employee’s years of service and final salary. The benefit
obligations of the German entities are unfunded. Accordingly,
the fair value of plan assets is zero for the periods presented.
The components of the pension plan benefit obligations are as
follows (in thousands):
| |
|
|
|
|
|
|
|
|
|
|
|
|
|
|
|
|
|
|
|
Year Ended June 30,
|
|
|
|
|
2008
|
|
|
2009
|
|
|
|
|
France
|
|
|
Germany
|
|
|
France
|
|
|
Germany
|
|
|
|
|
Change in projected benefit obligations:
|
|
|
|
|
|
|
|
|
|
|
|
|
|
|
|
|
|
Projected benefit obligation — at beginning of
period/year
|
|
$
|
1,147
|
|
|
$
|
1,132
|
|
|
$
|
1,375
|
|
|
$
|
1,163
|
|
|
Foreign currency translation
|
|
|
197
|
|
|
|
197
|
|
|
|
(152
|
)
|
|
|
(128
|
)
|
|
Service cost
|
|
|
91
|
|
|
|
35
|
|
|
|
84
|
|
|
|
28
|
|
|
Interest cost
|
|
|
67
|
|
|
|
63
|
|
|
|
70
|
|
|
|
68
|
|
|
Benefit paid
|
|
|
(128
|
)
|
|
|
(51
|
)
|
|
|
(134
|
)
|
|
|
(21
|
)
|
|
Assumptions changes
|
|
|
(15
|
)
|
|
|
—
|
|
|
|
(10
|
)
|
|
|
9
|
|
|
Net actuarial loss (gain)
|
|
|
16
|
|
|
|
(213
|
)
|
|
|
51
|
|
|
|
88
|
|
|
|
|
|
|
|
|
|
|
|
|
|
|
|
|
|
|
|
|
Projected benefit obligation — at end of year
|
|
$
|
1,375
|
|
|
$
|
1,163
|
|
|
$
|
1,284
|
|
|
$
|
1,207
|
|
|
|
|
|
|
|
|
|
|
|
|
|
|
|
|
|
|
|
|
Accumulated benefit obligation
|
|
$
|
1,375
|
|
|
$
|
1,157
|
|
|
$
|
1,284
|
|
|
$
|
1,189
|
|
|
|
|
|
|
|
|
|
|
|
|
|
|
|
|
|
|
|
Amounts recognized in the Consolidated Balance Sheets consist of
(in thousands):
| |
|
|
|
|
|
|
|
|
|
|
|
|
|
|
|
|
|
|
|
As of June 30,
|
|
|
|
|
2008
|
|
|
2009
|
|
|
|
|
France
|
|
|
Germany
|
|
|
France
|
|
|
Germany
|
|
|
|
|
Current liabilities
|
|
$
|
(132
|
)
|
|
$
|
(26
|
)
|
|
$
|
(53
|
)
|
|
$
|
(26
|
)
|
|
Other liabilities — non current
|
|
|
(1,243
|
)
|
|
|
(1,137
|
)
|
|
|
(1,231
|
)
|
|
|
(1,163
|
)
|
|
|
|
|
|
|
|
|
|
|
|
|
|
|
|
|
|
|
|
Total
|
|
$
|
(1,375
|
)
|
|
$
|
(1,163
|
)
|
|
$
|
(1,284
|
)
|
|
$
|
(1,189
|
)
|
|
|
|
|
|
|
|
|
|
|
|
|
|
|
|
|
|
|
Amounts recognized in Accumulated Other Comprehensive Income
consist of (in thousands):
| |
|
|
|
|
|
|
|
|
|
|
|
|
|
|
|
|
|
|
|
Year Ended June 30,
|
|
|
|
|
2008
|
|
|
2009
|
|
|
|
|
France
|
|
|
Germany
|
|
|
France
|
|
|
Germany
|
|
|
|
|
Unrecognized actuarial loss (gain)
|
|
$
|
26
|
|
|
$
|
(306
|
)
|
|
$
|
76
|
|
|
$
|
(217
|
)
|
|
|
|
|
|
|
|
|
|
|
|
|
|
|
|
|
|
|
Unrecognized gains and losses are recognized over the average
remaining service period of active plan participants. The
estimated gains and losses that will be amortized from
accumulated other comprehensive income into benefits expense
over the next fiscal year is not significant.
F-30
MIRION
TECHNOLOGIES, INC.
Notes to
Consolidated Financial
Statements — (Continued)
Net periodic pension costs for the defined benefit plans
consisted of the following elements (in thousands):
| |
|
|
|
|
|
|
|
|
|
|
|
|
|
|
|
|
|
|
|
|
|
|
|
|
|
|
|
Year Ended
|
|
|
Year Ended
|
|
|
Year Ended
|
|
|
|
|
June 30, 2007
|
|
|
June 30, 2008
|
|
|
June 30, 2009
|
|
|
|
|
France
|
|
|
Germany
|
|
|
France
|
|
|
Germany
|
|
|
France
|
|
|
Germany
|
|
|
|
|
Annual service cost
|
|
$
|
67
|
|
|
$
|
39
|
|
|
$
|
91
|
|
|
$
|
35
|
|
|
$
|
84
|
|
|
$
|
28
|
|
|
Interest accrued on pension obligations
|
|
|
54
|
|
|
|
51
|
|
|
|
67
|
|
|
|
63
|
|
|
|
70
|
|
|
|
68
|
|
|
|
|
|
|
|
|
|
|
|
|
|
|
|
|
|
|
|
|
|
|
|
|
|
|
|
|
Total period pension cost
|
|
$
|
121
|
|
|
$
|
90
|
|
|
$
|
158
|
|
|
$
|
98
|
|
|
$
|
154
|
|
|
$
|
96
|
|
|
|
|
|
|
|
|
|
|
|
|
|
|
|
|
|
|
|
|
|
|
|
|
|
|
|
The weighted-average rates used for each plan were as follows:
| |
|
|
|
|
|
|
|
|
|
|
|
|
|
|
|
|
|
|
|
Year Ended June 30,
|
|
|
|
|
2008
|
|
|
2009
|
|
|
|
|
France
|
|
|
Germany
|
|
|
France
|
|
|
Germany
|
|
|
|
|
Projected benefit obligation:
|
|
|
|
|
|
|
|
|
|
|
|
|
|
|
|
|
|
Discount rate
|
|
|
6.00
|
%
|
|
|
6.30
|
%
|
|
|
5.75
|
%
|
|
|
6.15
|
%
|
|
Expected rate of return on plan assets
|
|
|
—
|
|
|
|
—
|
|
|
|
—
|
|
|
|
—
|
|
|
Assumed rate of compensation increase
|
|
|
3.00
|
%
|
|
|
2.50
|
%
|
|
|
3.00
|
%
|
|
|
2.30
|
%
|
|
Assumed rate of inflation
|
|
|
2.00
|
%
|
|
|
2.20
|
%
|
|
|
2.00
|
%
|
|
|
2.00
|
%
|
|
|
|
|
|
|
|
|
|
|
|
|
|
|
|
|
|
|
|
Net periodic pension cost:
|
|
|
|
|
|
|
|
|
|
|
|
|
|
|
|
|
|
Discount rate
|
|
|
5.25
|
%
|
|
|
4.75
|
%
|
|
|
6.00
|
%
|
|
|
6.30
|
%
|
|
Assumed rate of compensation increase
|
|
|
3.00
|
%
|
|
|
2.50
|
%
|
|
|
3.00
|
%
|
|
|
2.50
|
%
|
|
Assumed rate of inflation
|
|
|
2.00
|
%
|
|
|
1.80
|
%
|
|
|
2.00
|
%
|
|
|
2.20
|
%
|
Estimated future benefit payments are as follows (in thousands):
| |
|
|
|
|
|
|
|
|
|
|
|
|
|
|
|
Amount
|
|
|
Years Ending June 30,
|
|
France
|
|
|
Germany
|
|
|
Total
|
|
|
|
|
2010
|
|
$
|
53
|
|
|
$
|
26
|
|
|
$
|
79
|
|
|
2011
|
|
|
25
|
|
|
|
48
|
|
|
|
73
|
|
|
2012
|
|
|
68
|
|
|
|
66
|
|
|
|
134
|
|
|
2013
|
|
|
13
|
|
|
|
69
|
|
|
|
82
|
|
|
2014
|
|
|
145
|
|
|
|
72
|
|
|
|
217
|
|
|
Thereafter
|
|
|
803
|
|
|
|
414
|
|
|
|
1,217
|
|
|
|
|
|
|
|
|
|
|
|
|
|
|
|
|
|
|
$
|
1,107
|
|
|
$
|
695
|
|
|
$
|
1,802
|
|
|
|
|
|
|
|
|
|
|
|
|
|
|
|
Defined Contribution Plans — The Company
maintains voluntary noncontributory defined contribution
retirement plans for certain eligible employees. Under each
plan, eligible employees may make voluntary contributions, while
the Company makes contributions as defined by each plan
agreement. Employee contributions in each plan are fully vested.
Company contributions vest in accordance with the provision of
each plan agreement. The following summarizes the features of
each plan:
Retirement Plans — The Company maintains two
retirement plans. Under the provisions of the plans, the Company
is required to contribute a percentage of each eligible
employee’s compensation. Total expense relating to these
plans for fiscal 2007, 2008 and 2009 was $327,000, $325,000 and
$256,000 and $251,000 (unaudited) and $278,000 (unaudited) for
the six months ended December 31, 2008 and 2009.
F-31
MIRION
TECHNOLOGIES, INC.
Notes to
Consolidated Financial
Statements — (Continued)
401(k) Savings Plan and Other Investment Savings
Plans — The Company’s 401(k) savings and
other investment savings plans cover certain of the
Company’s eligible employees. Both the employee and the
Company make contributions to the plans. Company contributions
are based on the level of employee contributions. Certain
subsidiaries of the Company offer retirement plans in lieu of
participation in the Company’s 401(k) savings plans.
Company contributions to these plans are based on formulas
determined by the Company.
The amount expensed for 401(k) savings plans and other defined
contribution plans amounted to $395,000, $439,000 and $375,000
for fiscal 2007, 2008 and 2009 and $233,000 (unaudited) and
$309,000 (unaudited) for the six months ended December 31,
2008 and 2009.
Deferred Compensation Plan — The Company had a
deferred compensation program for directors and key employees of
the Company. The program allowed eligible participants to defer
a portion of their compensation and bonuses. The deferred
compensation together with certain discretionary Company
contributions were invested in a trust account with three
participant-directed investment options. Funds could be
distributed to participants upon retirement or for certain
instances of unforeseen financial hardship. There was no expense
associated with the deferred compensation plan for fiscal 2007,
2008 and 2009 and for the six months ended December 31,
2008 and 2009.
The Company projects its contributions for all of the above
defined contribution plans to be $662,000 for the year ending
June 30, 2010.
Other Postretirement Benefit Plans — The
Company maintains a postretirement benefit plan for certain
eligible employees. Under the provisions of the plan, certain
retired employees will secure their own health insurance
coverage, and the Company will reimburse the retired employee an
amount specified in the plan. The premium reimbursement is only
available to retirees who carried the Company’s health
insurance at the date of retirement. This benefit obligation is
unfunded and, accordingly, the fair value of plan assets is zero.
Coverage under the plan ends when the participant is eligible
for Medicare benefits, which is assumed to be age 65. It is
assumed that 70% of retirees eligible for coverage will select
the family plan. Benefits are assumed to be available upon
completion of 30 years of service and attainment of
age 58 using a weighted-average discount rate of 6.1%.
The components of the Company’s postretirement benefit plan
as of June 30, 2008 and 2009 are as follows (in thousands):
| |
|
|
|
|
|
|
|
|
|
|
|
Year Ended June 30,
|
|
|
|
|
2008
|
|
|
2009
|
|
|
|
|
Change in projected benefit obligations:
|
|
|
|
|
|
|
|
|
|
Projected benefit obligation — at beginning of year
|
|
$
|
513
|
|
|
$
|
523
|
|
|
Service cost
|
|
|
25
|
|
|
|
23
|
|
|
Interest cost
|
|
|
30
|
|
|
|
39
|
|
|
Benefit paid
|
|
|
(17
|
)
|
|
|
(12
|
)
|
|
Assumptions changes
|
|
|
1
|
|
|
|
(22
|
)
|
|
Actuarial loss (gain)
|
|
|
(29
|
)
|
|
|
75
|
|
|
|
|
|
|
|
|
|
|
|
|
Projected benefit obligation — at end of year
|
|
$
|
523
|
|
|
$
|
626
|
|
|
|
|
|
|
|
|
|
|
|
|
|
|
|
|
|
|
|
|
|
|
|
|
As of June 30,
|
|
|
|
|
2008
|
|
|
2009
|
|
|
|
|
Accumulated benefit obligation
|
|
$
|
523
|
|
|
$
|
626
|
|
|
|
|
|
|
|
|
|
|
|
F-32
MIRION
TECHNOLOGIES, INC.
Notes to
Consolidated Financial
Statements — (Continued)
Amounts recognized in the Consolidated Balance Sheets as of
June 30, 2008 and 2009 consist of (in thousands):
| |
|
|
|
|
|
|
|
|
|
|
|
Year Ended June 30,
|
|
|
|
|
2008
|
|
|
2009
|
|
|
|
|
Other liabilities-non current
|
|
$
|
(523
|
)
|
|
$
|
(626
|
)
|
|
|
|
|
|
|
|
|
|
|
Amounts recognized in Accumulated Other Comprehensive Income for
fiscal 2008 and 2009 consist of (in thousands):
| |
|
|
|
|
|
|
|
|
|
|
|
Year Ended June 30,
|
|
|
|
|
2008
|
|
|
2009
|
|
|
|
|
Unrecognized actuarial gain
|
|
$
|
(262
|
)
|
|
$
|
(240
|
)
|
|
Unrecognized service cost
|
|
|
34
|
|
|
|
87
|
|
|
|
|
|
|
|
|
|
|
|
|
|
|
$
|
(228
|
)
|
|
$
|
(153
|
)
|
|
|
|
|
|
|
|
|
|
|
Unrecognized gains and losses are recognized over the average
remaining service period of active plan participants. The
estimated gains and losses, net that will be amortized from
accumulated other comprehensive income into benefits expense
over the next fiscal year is not significant.
Estimated future benefit payments are as follows (in thousands):
| |
|
|
|
|
Years
|
|
|
|
|
Ending June 30,
|
|
Amount
|
|
|
|
|
2010
|
|
$
|
46
|
|
|
2011
|
|
|
41
|
|
|
2012
|
|
|
41
|
|
|
2013
|
|
|
37
|
|
|
2014
|
|
|
51
|
|
|
Thereafter
|
|
|
328
|
|
|
|
|
|
|
|
|
Total
|
|
$
|
544
|
|
|
|
|
|
|
|
Mirion was formed through the exchange of the capital stock of
GDS, IST and Synodys on December 22, 2005, with the
combination effective as of December 31, 2005. This
transaction was considered a reorganization of entities under
common control since GDS, IST and Synodys were under the common
control of ACAS prior to the Reorganization. In order to effect
the Reorganization, ACAS established a wholly-owned subsidiary,
Global Monitoring Systems, Inc., on October 24, 2005, which
was renamed Mirion Technologies, Inc. on January 4, 2006.
Prior to the Reorganization, ACAS owned 90.5% of GDS, 92.5% of
IST and 93.5% of Synodys. After the Reorganization, ACAS held
93.6% of Mirion. In accordance with
FASB-issued
authoritative guidance on exchanges of ownership interests
between entities under common control and
FASB-issued
guidance on business combinations, the issuance of Mirion stock
through the reorganization is accounted for in a manner similar
to a pooling of interests which means that the historical basis
of the net assets of GDS, IST and Synodys are combined for all
periods prior to January 1, 2006.
F-33
MIRION
TECHNOLOGIES, INC.
Notes to
Consolidated Financial
Statements — (Continued)
Mirion
Convertible Participating Preferred Stock
Mirion has 678,804 shares of
Series A-1
Convertible Participating Preferred Stock outstanding and
70,000 shares of
Series A-2
Convertible Participating Preferred Stock outstanding for all
periods presented. The significant rights and obligations of the
Mirion’s Convertible Participating Preferred stock are as
follows:
Liquidation Rights — In the event of any
liquidation, dissolution or
winding-up
of the Company, whether voluntary or involuntary, the available
funds and assets that may be legally distributed to the
Company’s stockholders shall be distributed in preference
to the Series A Convertible Participating Preferred
Stockholders. The holders of shares of Series A Convertible
Participating Preferred Stock will be entitled to receive an
amount per share equal to the greater of (a) $113.28 per
share in the case of the
Series A-1
Convertible Participating Preferred Stock and $103.68 per share
in the case of the
Series A-2
Convertible Participating Preferred Stock as adjusted for stock
splits, stock dividends or combinations plus any accrued or
declared but unpaid dividends or (b) the amount the holders
of Series A Convertible Participating Preferred Stock would
be entitled to receive on an as-converted basis, according to
the number of shares of common stock into which such shares
could then be converted. If upon any liquidation, dissolution or
winding-up
of the Company, the available funds and assets shall be
insufficient to permit the payment to holders of the
Series A Convertible Participating Preferred Stock of their
full preferential amount, then the entire available funds and
assets should be distributed on a pro rata basis among the
holders of the outstanding Series A Convertible
Participating Preferred Stock. If any assets of the Company
distributed to stockholders in connection with any liquidation,
dissolution or
winding-up
of the Company are in a form other than cash, then the value of
such assets shall be their fair market value.
Upon completion of the distributions to the Series A
Convertible Participating Preferred stockholders and the payment
of all debts and liabilities of the Company, all of the
remaining assets of the Company available for distribution will
be distributed on a pro rata basis among the holders of common
stock.
A liquidation, dissolution or
winding-up
of the Company shall include the acquisition of the Company by
another entity by means of a transaction or series of related
transactions including without limitation any reorganization,
merger or consolidation that results in the transfer of 50% or
more of the outstanding voting power of the Company or the sale
of all or substantially all assets of the Company.
Dividends Rights — The holders of shares of
Series A-1
and A-2
Convertible Participating Preferred Stock, in preference to the
holders of shares of any common stock, are entitled to receive
cumulative dividends, at a rate of 8% and 17% per annum, payable
on the first business day of each quarter commencing on
January 1, 2006, by validly issuing fully paid and
nonassessable shares of
Series A-1
and A-2 Convertible Participating Preferred Stock with an
aggregate liquidation preference equal to the amount of the
dividends to be paid. Cumulative dividends have not been settled
to date. All undeclared dividends and declared but unpaid
dividends including unissued additional shares of
Series A-1
Convertible Participating Preferred Stock shall compound on a
quarterly basis at the
Series A-l
dividend rate, without any duplication when and if the dividends
are actually paid.
No dividends should be paid on any share of common stock unless
a dividend is paid with respect to all outstanding shares of
Series A Convertible Participating Preferred Stock in an
amount for each such share equal to or greater than the
aggregate amount of such dividends for all shares of common
stock into which such share of Series A Convertible
Participating Preferred Stock could then be converted.
Conversion Rights — Each share of Series A
Convertible Participating Preferred Stock is convertible at any
time, at the option of the holder, into the number of fully paid
and nonassessable shares of Class A Voting Common Stock
that results from dividing the applicable original issue price
per share by the initial conversion price of $100. The
conversion price is subject to adjustments upon the occurrence
of certain triggering events related to anti-dilution protection
rights.
F-34
MIRION
TECHNOLOGIES, INC.
Notes to
Consolidated Financial
Statements — (Continued)
Each share of Convertible Participating Preferred Stock shall
automatically convert into Class A Voting Common Stock at
the conversion price at the time in effect, upon the vote or
written consent of the holders of not less than a majority of
the then-outstanding shares of Series A Convertible
Participating Preferred Stock.
Anti-Dilution Provisions — No adjustment in the
number of shares of Class A Voting Common Stock into which
the shares of any Series A Convertible Participating
Preferred Stock is convertible should be made, unless the
effective price of additional shares of common stock is less
than the conversion price in effect on the date of the issue of
such additional shares of common stock.
Voting Rights — The holders of shares of
Series A Convertible Participating Preferred Stock do not
have voting rights of any kind. The Company cannot amend, alter
or repeal any provision of the certificate of incorporation of
the Company so as to adversely affect the preferences, rights,
privileges or powers of the Series A Convertible
Participating Preferred Stock without the consent of the holders
of a majority of the outstanding shares of Series A
Convertible Participating Preferred Stock. However, each holder
of Series A Convertible Participating Preferred Stock would
need to approve an amendment to the certificate of incorporation
that reduces the dividend payable on or the liquidation
preference of the Series A Convertible Participating
Preferred Stock. Also, the Company cannot create, authorize or
issue any securities senior to the Series A Convertible
Participating Preferred Stock as to dividends and distributions
upon the liquidation,
winding-up
and dissolution of the Company.
Mirion
Common Stock
Mirion has authorized 2,500,000 shares of Class A
Voting Common Stock and 700,000 shares of Class B
Non-Voting Common Stock. The rights and privileges of
Class A and Class B common stock are the same except
for voting rights. Common stock reserved for future issuance as
of December 31, 2009, was as follows:
| |
|
|
|
|
|
|
|
Number of
|
|
|
|
|
Shares
|
|
|
|
|
(unaudited)
|
|
|
|
|
2006 Stock Plan:
|
|
|
|
|
|
Shares authorized under the 2006 plan
|
|
|
118,840
|
|
|
Options exercised
|
|
|
150
|
|
|
Outstanding stock options
|
|
|
113,288
|
|
|
Reserved for future option grants
|
|
|
5,402
|
|
|
|
|
|
|
|
|
Total common stock reserved for stock options
|
|
|
118,690
|
|
|
Warrants to purchase common stock
|
|
|
402,428
|
|
|
Convertible preferred stock, including paid-in-kind dividends
(as converted):
|
|
|
|
|
|
Series A-1
|
|
|
1,060,440
|
|
|
Series A-2
|
|
|
142,605
|
|
|
|
|
|
|
|
|
Total convertible preferred stock
|
|
|
1,203,045
|
|
|
|
|
|
|
|
|
Total common stock reserved for future issuances
|
|
|
1,724,163
|
|
|
|
|
|
|
|
Detachable
Warrants
On January 1, 2006, Mirion issued warrants granting the
holders the right to purchase Class A Voting Common Stock
of the Company. These warrants only become exercisable upon a
sale, liquidation or dissolution of the Company or approval by
the Board of Directors or upon liquidation of the Company. The
warrants expire on December 22, 2015. As of June 30,
2008 and 2009, there were 402,428 shares of common stock
issuable upon the exercise of outstanding detachable warrants,
of which 23,166 have an exercise price of
F-35
MIRION
TECHNOLOGIES, INC.
Notes to
Consolidated Financial
Statements — (Continued)
$0.01 and 379,262 have an exercise price of $0.001. As of
December 31, 2009, the Board of Directors had not approved
the exercise of these warrants.
|
|
|
13.
|
STOCK-BASED
COMPENSATION
|
The Board of Directors approved the Mirion 2006 Stock Plan,
effective as of December 22, 2005. The plan approves the
granting of awards in the form of nonqualified stock options to
directors, employees or consultants. The total number of shares
available for distribution under the plan is 118,840. Under the
terms of the plan, the exercise price for awards issued under
the plan is determined at the sole discretion of the Board of
Directors.
Following is the stock-based compensation expense (in thousands)
included in the consolidated statement of operations for options
granted through the Mirion 2006 Stock Plan as well as those
granted by ACAS to the Company’s Chief Executive Officer
and Chairman of the Board. Expense from the options granted by
ACAS was $151,000 and $121,000 in fiscal years 2007 and 2008,
respectively. See Note 14.
| |
|
|
|
|
|
|
|
|
|
|
|
|
|
|
|
|
|
|
|
|
|
|
|
|
|
|
Six Months Ended
|
|
|
|
|
Year Ended June 30,
|
|
|
December 31,
|
|
|
|
|
2007
|
|
|
2008
|
|
|
2009
|
|
|
2008
|
|
|
2009
|
|
|
|
|
|
|
|
|
|
|
|
|
|
(unaudited)
|
|
|
|
|
Selling, general and administrative expenses
|
|
$
|
177
|
|
|
$
|
223
|
|
|
$
|
1,128
|
|
|
$
|
609
|
|
|
$
|
522
|
|
|
Research and development expense
|
|
|
—
|
|
|
|
25
|
|
|
|
33
|
|
|
|
16
|
|
|
|
16
|
|
|
|
|
|
|
|
|
|
|
|
|
|
|
|
|
|
|
|
|
|
|
|
|
Total stock-based compensation expense
|
|
$
|
177
|
|
|
$
|
248
|
|
|
$
|
1,161
|
|
|
$
|
625
|
|
|
$
|
538
|
|
|
|
|
|
|
|
|
|
|
|
|
|
|
|
|
|
|
|
|
|
|
|
The stock awards under the Mirion 2006 stock plan include stock
awards with performance and market-based vesting
(“PSA”) and time-based vesting (“TSA”).
Under the terms of the PSA agreements, Mirion grants employee
stock option awards whose vesting is contingent upon meeting
company-wide performance goals including earnings before
interest, taxes and depreciation targets or market conditions,
including internal rate of return targets. The TSAs include
stock options granted by the Company whose vesting occurs over a
period of five to 60 months.
Under
FASB-issued
authoritative guidance on stock-based payment, the Company
estimates the value of the employee stock options on the date of
grant using the Black-Scholes model for TSAs and using a Monte
Carlo simulation for PSAs containing market conditions. The key
assumptions used in the model for valuation of options granted
under the Mirion 2006 Stock Plan are provided below:
| |
|
|
|
|
|
|
|
|
|
|
|
|
|
|
|
|
|
|
|
Performance-Based Vested Awards
|
|
|
Six Months Ended
|
|
|
|
|
Year Ended June 30,
|
|
|
December 31,
|
|
|
|
|
2007
|
|
2008
|
|
2009
|
|
|
2008
|
|
|
2009
|
|
|
|
|
|
|
|
|
|
|
|
(unaudited)
|
|
|
|
|
Expected term (in years)
|
|
3.8–3.9
|
|
2.7–2.8
|
|
|
N/A
|
|
|
|
N/A
|
|
|
|
N/A
|
|
|
Risk-free interest rate
|
|
4.6%–4.9%
|
|
3.7%–4.1%
|
|
|
N/A
|
|
|
|
N/A
|
|
|
|
N/A
|
|
|
Volatility
|
|
36%
|
|
35%
|
|
|
N/A
|
|
|
|
N/A
|
|
|
|
N/A
|
|
|
Dividend yield
|
|
0%
|
|
0%
|
|
|
N/A
|
|
|
|
N/A
|
|
|
|
N/A
|
|
|
Weighted-average fair value at grant date
|
|
$25.82
|
|
$21.54
|
|
|
N/A
|
|
|
|
N/A
|
|
|
|
N/A
|
|
F-36
MIRION
TECHNOLOGIES, INC.
Notes to
Consolidated Financial
Statements — (Continued)
| |
|
|
|
|
|
|
|
|
|
|
|
|
|
|
|
Time-Based Vested Awards
|
|
Six Months Ended
|
|
|
|
|
Year Ended June 30,
|
|
December 31,
|
|
|
|
|
2007
|
|
2008
|
|
2009
|
|
2008
|
|
2009
|
|
|
|
|
|
|
|
|
|
|
(unaudited)
|
|
|
|
|
Expected term (in years)
|
|
9.8
|
|
8.0–10.0
|
|
10
|
|
10
|
|
|
N/A
|
|
|
Risk-free interest rate
|
|
4.6%–4.8%
|
|
2.9%–4.5%
|
|
2.7%–4.1%
|
|
2.7%–4.1%
|
|
|
N/A
|
|
|
Volatility
|
|
46%
|
|
46%
|
|
46%–47%
|
|
46%-47%
|
|
|
N/A
|
|
|
Dividend yield
|
|
0%
|
|
0%
|
|
0%
|
|
0%
|
|
|
N/A
|
|
|
Weighted-average fair value at grant date
|
|
$46.59
|
|
$45.15
|
|
$49.37
|
|
$49.37
|
|
|
N/A
|
|
The expected term of the option is determined based on factors
including vesting period, life of option, strike price and fair
market value of the Company’s stock on the date of grant.
The fair market value of the Company’s stock on the date of
grant was determined in a retrospective valuation. The risk-free
rate of interest over the contractual life of the option is
based on the U.S. Treasury yield curve in effect at the
time of grant. Since the Company’s stock is not publicly
traded, volatility has been determined based on the volatility
of stocks of comparable companies within the Company’s
industry. No dividends on the Company’s common stock have
been declared in the past, and the Company does not expect to do
so in the foreseeable future.
Share option activity for the Mirion 2006 Stock Plan is as
follows:
| |
|
|
|
|
|
|
|
|
|
|
|
|
|
|
|
|
|
|
|
|
|
|
|
|
|
|
|
Year Ended June 30,
|
|
|
|
|
2007
|
|
|
2008
|
|
|
2009
|
|
|
|
|
|
|
|
Weighted-
|
|
|
|
|
|
Weighted-
|
|
|
|
|
|
Weighted-
|
|
|
|
|
|
|
|
Average
|
|
|
|
|
|
Average
|
|
|
|
|
|
Average
|
|
|
|
|
|
|
|
Exercise
|
|
|
|
|
|
Exercise
|
|
|
|
|
|
Exercise
|
|
|
|
|
Shares
|
|
|
Price
|
|
|
Shares
|
|
|
Price
|
|
|
Shares
|
|
|
Price
|
|
|
|
|
Outstanding — beginning of year
|
|
|
48,646
|
|
|
$
|
88.75
|
|
|
|
45,139
|
|
|
$
|
91.79
|
|
|
|
86,705
|
|
|
$
|
115.72
|
|
|
Granted
|
|
|
26,029
|
|
|
|
117.58
|
|
|
|
59,325
|
|
|
|
128.16
|
|
|
|
45,886
|
|
|
|
143.27
|
|
|
Exercised
|
|
|
—
|
|
|
|
—
|
|
|
|
(150
|
)
|
|
|
88.75
|
|
|
|
—
|
|
|
|
—
|
|
|
Forfeited or expired
|
|
|
(29,536
|
)
|
|
|
109.52
|
|
|
|
(17,609
|
)
|
|
|
96.53
|
|
|
|
(19,303
|
)
|
|
|
139.83
|
|
|
|
|
|
|
|
|
|
|
|
|
|
|
|
|
|
|
|
|
|
|
|
|
|
|
|
|
Outstanding — end of year
|
|
|
45,139
|
|
|
$
|
91.79
|
|
|
|
86,705
|
|
|
$
|
115.72
|
|
|
|
113,288
|
|
|
$
|
122.77
|
|
|
|
|
|
|
|
|
|
|
|
|
|
|
|
|
|
|
|
|
|
|
|
|
|
|
|
|
Vested or Expected to Vest — end of year
|
|
|
45,139
|
|
|
$
|
91.79
|
|
|
|
86,705
|
|
|
$
|
115.72
|
|
|
|
113,288
|
|
|
$
|
122.77
|
|
|
|
|
|
|
|
|
|
|
|
|
|
|
|
|
|
|
|
|
|
|
|
|
|
|
|
|
Exercisable — end of year
|
|
|
28,210
|
|
|
$
|
88.75
|
|
|
|
24,726
|
|
|
$
|
95.00
|
|
|
|
48,527
|
|
|
$
|
114.75
|
|
|
|
|
|
|
|
|
|
|
|
|
|
|
|
|
|
|
|
|
|
|
|
|
|
|
|
Options grant activity for the year ended June 30, 2009 is
as follow:
| |
|
|
|
|
|
|
|
|
|
|
|
|
|
|
|
|
|
|
|
|
|
|
|
|
|
Fair Value of
|
|
|
Intrinsic
|
|
|
|
|
|
|
|
|
|
|
Stock on
|
|
|
Value of
|
|
|
|
|
# Options
|
|
|
Exercise Price
|
|
|
Option Grant
|
|
|
Options on
|
|
|
Grant Date
|
|
Granted
|
|
|
per Share
|
|
|
Date
|
|
|
Grant Date
|
|
|
|
|
July 28, 2008(1)
|
|
|
12,000
|
|
|
$
|
138.58
|
|
|
$
|
96.18
|
|
|
$
|
0.00
|
|
|
August 5, 2008
|
|
|
32,886
|
|
|
$
|
144.95
|
|
|
$
|
96.18
|
|
|
$
|
0.00
|
|
|
December 9, 2008
|
|
|
1,000
|
|
|
$
|
144.24
|
|
|
$
|
46.60
|
|
|
$
|
0.00
|
|
|
|
|
|
|
|
|
|
|
|
|
|
|
|
|
|
|
|
|
Total
|
|
|
45,886
|
|
|
|
|
|
|
|
|
|
|
$
|
0.00
|
|
|
|
|
|
|
|
|
|
|
|
|
|
|
|
|
|
|
|
|
|
|
|
(1) |
|
The 12,000 options granted July 28, 2008 were a
modification of 15,000 options granted on November 5, 2007.
The 12,000 options, which have time-based vesting, replaced the
15,000 options, which had performance-based vesting. The stock
option modification was accounted for in accordance with
FASB-issued
authoritative guidance on
stock-based
payment, such that the total compensation cost measured at the
date of modification was determined to be the grant-date fair |
F-37
MIRION
TECHNOLOGIES, INC.
Notes to
Consolidated Financial
Statements — (Continued)
|
|
|
|
|
|
value of the original award plus the incremental fair value
resulting from the modification, in which vesting of both the
original and modified awards were considered to be probable. The
incremental fair value resulting from the modification was
calculated using the Black-Scholes model and was determined to
be $496,000. |
In order to determine the fair value of options granted, the
fair value of the underlying stock must first be determined.
Valuations of Mirion’s common stock as of the grant date of
all options issued were determined in accordance with the AICPA
Practice Aid “Valuation of Privately-Held Company Equity
Securities Issued as Compensation.”
The following table shows the weighted-average remaining
contractual term and aggregate intrinsic value for options
outstanding, vested and exercisable at June 30, 2009:
| |
|
|
|
|
|
|
|
|
|
|
|
Weighted-
|
|
|
|
|
|
|
|
Average
|
|
|
|
|
|
|
|
Remaining
|
|
|
Aggregate
|
|
|
|
|
Contractual
|
|
|
Intrinsic
|
|
|
|
|
Term
|
|
|
Value(1)
|
|
|
|
|
(in years)
|
|
|
(in thousands)
|
|
|
|
|
Outstanding
|
|
|
8.2
|
|
|
$
|
466
|
|
|
Vested and exercisable
|
|
|
7.8
|
|
|
|
354
|
|
|
|
|
|
(1) |
|
Excludes options with a strike price greater than the market
value of the underlying stock. |
The total intrinsic value of stock options exercised during the
years ended June 30, 2008, 2009 and six month ended
December 31, 2009 was $2,070, $0 and $0 (unaudited). The
aggregate intrinsic value of the share options shown in the
table above was calculated using the estimated market price of
common stock at June 30, 2009, which was $105.76 per share.
As of June 30, 2009, there was $2.9 million of
unrecognized compensation cost related to nonvested stock-based
compensation arrangements granted under the Mirion 2006 Stock
Plan; that cost is expected to be recognized over a
weighted-average period of 2.3 years. This excludes 10,094
nonvested outstanding performance-based stock options whose fair
value could be recognized upon a sale of the Company. These
performance-based stock options will only vest in the event of a
sale transaction, which does not include a public offering.
A summary of the activity is presented below:
| |
|
|
|
|
|
|
|
|
|
|
|
|
|
|
Weighted-
|
|
|
|
|
|
|
|
Average
|
|
|
|
|
|
|
|
Grant-Date
|
|
|
Nonvested Shares
|
|
Shares
|
|
|
Fair Value
|
|
|
|
|
Nonvested — July 1, 2008
|
|
|
61,979
|
|
|
$
|
37.59
|
|
|
Granted
|
|
|
45,886
|
|
|
|
49.37
|
|
|
Vested
|
|
|
(24,289
|
)
|
|
|
48.20
|
|
|
Forfeited
|
|
|
(18,815
|
)
|
|
|
25.66
|
|
|
|
|
|
|
|
|
|
|
|
|
Nonvested — June 30, 2009
|
|
|
64,761
|
|
|
$
|
45.43
|
|
|
|
|
|
|
|
|
|
|
|
No tax benefit was realized for tax deductions from stock-based
arrangements, including from the exercise of stock options,
during fiscal 2007, 2008 and 2009. The Company did not use any
cash to settle equity instruments granted under its stock-based
payment arrangements for fiscal 2007, 2008 and 2009 and for the
six months ended December 31, 2008 (unaudited) and 2009
(unaudited). There was no compensation cost capitalized as part
of inventory or property, plant and equipment during fiscal
2007, 2008 and 2009 and for the six months ended
December 31, 2008 (unaudited) and 2009 (unaudited).
F-38
MIRION
TECHNOLOGIES, INC.
Notes to
Consolidated Financial
Statements — (Continued)
|
|
|
14.
|
RELATED-PARTY
TRANSACTIONS
|
The Company has NEPAs with its primary investor ACAS and its
subsidiary ACFS (see Note 8). The terms of the NEPAs
require the Company to pay ACFS annual management fees
aggregating $1.6 million per year. In return, ACFS
provides various investment banking services relating to
financing arrangements, mergers and acquisitions, financial
analysis and other services. The NEPAs are not cancelable by the
Company as long as ACFS has an investment in the Company’s
debt or equity securities. Such transactions were not
consummated on terms equivalent to those that prevail in
arm’s length transactions.
Amounts paid to ACFS were as follows (in thousands):
| |
|
|
|
|
|
|
|
|
|
|
|
|
|
|
|
|
|
|
|
|
|
|
|
Year Ended June 30,
|
|
|
Six Months Ended December 31,
|
|
|
|
|
2007
|
|
|
2008
|
|
|
2009
|
|
|
2008
|
|
|
2009
|
|
|
|
|
|
|
|
|
|
|
|
|
|
(unaudited)
|
|
|
|
|
Expense invoices
|
|
$
|
166
|
|
|
$
|
111
|
|
|
$
|
114
|
|
|
$
|
80
|
|
|
$
|
18
|
|
|
Loan fees
|
|
|
260
|
|
|
|
201
|
|
|
|
—
|
|
|
|
—
|
|
|
|
—
|
|
|
Management fees
|
|
|
1,625
|
|
|
|
1,625
|
|
|
|
1,625
|
|
|
|
813
|
|
|
|
813
|
|
|
Interest on debt
|
|
|
16,517
|
|
|
|
17,211
|
|
|
|
14,760
|
|
|
|
8,083
|
|
|
|
6,275
|
|
|
|
|
|
|
|
|
|
|
|
|
|
|
|
|
|
|
|
|
|
|
|
|
|
|
$
|
18,568
|
|
|
$
|
19,148
|
|
|
$
|
16,499
|
|
|
$
|
8,976
|
|
|
$
|
7,106
|
|
|
|
|
|
|
|
|
|
|
|
|
|
|
|
|
|
|
|
|
|
|
|
The Company’s President, Chief Executive Officer and
Chairman of the Board, Thomas D. Logan, entered into a Call
Option Agreement on April 19, 2004 with ACAS and certain of
its affiliates, in which ACAS granted time and performance-based
options with market conditions to Mr. Logan to purchase
shares of the common stock of two of Mirion’s predecessors
in connection with his services as an officer and director.
Modification of these options occurred in substance on
January 1, 2006, in connection with the formation of Mirion
in December 2005. As a result of the modification,
Mr. Logan was granted performance-based options with market
conditions to purchase 54,564 shares of Mirion’s
Class A Common Stock held by ACAS. These options were
further modified on December 7, 2007 such that their
vesting criteria was amended. The exercise price of these
options is $88.75 per share, and the total incremental value
resulting from the option modification is $2.1 million and
incorporates the impact of the options’ market-based
conditions in the original grant date and modification date fair
values. The original grant date fair value of these options was
negligible. The Company will recognize expense on these options
in the period and to the extent that it satisfies the
performance-based vesting conditions, which require completion
of an effective offering in the public markets or a qualifying
sale of the Company.
The performance-based options are divided into three tranches,
each of which will either vest or be cancelled in two halves
upon an initial public offering (“IPO”) or change in
control, depending on whether ACAS achieves certain market-based
conditions, internal rates of return or returns on investment in
such an event. Upon completion of an IPO, vesting of the
performance-based options will occur in two stages. The first
stage occurs 30 days after the effective time of the IPO at
which time 50% of the options in each tranche will vest if ACAS
achieves certain minimum internal rates of return, ranging
between 25–40% or certain minimum returns on investment
ranging between 2.0–2.7x. If neither goal is met, the
options in this tranche will be cancelled. The second stage
occurs on the earlier of two years after the effective time of
an IPO or upon the sale by ACAS of its investments in the
Company, at which time the remaining 50% of the options in each
tranche will vest if ACAS achieves certain minimum internal
rates of return ranging between 25–40% or certain minimum
returns on investment of 2.0–2.7x. If neither goal is met,
the options in this tranche will be cancelled. The Company will
record stock compensation expense in connection with these
options in the event it completes an effective offering in the
public markets or a qualifying sale of the Company, regardless
of whether ACAS achieves the related market-based conditions.
F-39
MIRION
TECHNOLOGIES, INC.
Notes to
Consolidated Financial
Statements — (Continued)
The modifications of the performance-based stock options were
accounted for under FASB-issued authoritative guidance on
stock-based payments, such that the total compensation cost
measured at the date of modification was determined to be the
grant-date fair value of the original award plus the incremental
cost resulting from the modification, in which vesting of both
the original and modified awards were considered to be probable.
Because these options contain market-based vesting criteria, the
Company used a Monte Carlo simulation model, as opposed to a
Black-Scholes model, to value such options. In the Monte Carlo
simulation model, weekly stock prices were simulated until the
liquidity event time using a geometric Brownian motion model.
Based on the simulated stock price at the liquidity event and
the vesting requirements, the number of vested shares was
determined. The stock price at liquidity and the options’
exercise price were used to determine the intrinsic value per
share of the options at the liquidity event. The intrinsic value
was then discounted to the present at the risk free rate to
determine the option fair value for each simulation. Fifty
thousand simulations were run for each valuation date, and the
sum value of those simulations was averaged to determine the
value of the options. Key valuation assumptions as of the
January 1, 2006 modification are an expected term of
4.5 years, volatility of 41.8%, a risk-free rate of
interest of 4.3%, and a dividend yield of 0%. Key valuation
assumptions as of the December 7, 2007 modification are an
expected term of 2.6 years, volatility of 39.8%, a
risk-free rate of interest of 3.1%, and a dividend yield of 0%.
The Call Option Agreement also provides Mr. Logan with an
option to purchase 17,750 shares of the Company’s
common stock held by ACAS that vest on a monthly schedule. The
exercise price of these options is $88.75 per share and the
total incremental fair value resulting from the option
modification is $592,000. All such options vested as of
June 30, 2008.
The modification of the time-based stock options were accounted
for under FASB-issued authoritative guidance on stock-based
payments, such that the total compensation cost measured at the
date of modification was determined to be the grant-date fair
value of the original award plus the incremental cost resulting
from the modification, in which vesting of both the original and
modified awards were considered to be probable. These options
were valued using the Black-Scholes model. Key valuation
assumptions as of the January 1, 2006 modification are an
expected term of 4.5 years, volatility of 41.8%, a
risk-free rate of interest of 4.3%, and a dividend yield of 0%.
All options granted by ACAS and its affiliates to Mr. Logan
pursuant to the Call Option Agreement are to be reduced on an
economically equivalent basis in the event the Company grants
Mr. Logan options to purchase shares of Mirion common stock
after the date of the Call Option Agreement, provided such
options are no less favorable to Mr. Logan.
These 54,564 and 17,750 options were granted by ACAS and are
supported by the Company’s stock held by ACAS. They are not
part of the Mirion 2006 stock plan and are therefore not
included in the “Share options activity” table
presented in Note 13.
|
|
|
15.
|
SEGMENT
AND GEOGRAPHIC INFORMATION
|
The Company manages its business operations through five
strategic business units. Based upon the information reported to
the chief operating decision maker, who is the Chief Executive
Officer, the Company has the following reportable segments:
Health Physics, Radiation Monitoring Systems, Sensing Systems,
Dosimetry Services and Imaging Systems.
|
|
|
| |
•
|
The Health Physics segment sells dosimeters, detection equipment
and contamination & clearance monitors to power and
utility companies, military organizations and governmental
agencies. In the Health Physics segment, the active dosimetry
product line represented 12%, 11% and 11% of consolidated
revenue for fiscal 2007, 2008 and 2009 and 11% (unaudited) and
6% (unaudited) of consolidated revenue for the six months ended
December 31, 2008 and 2009. The contamination and clearance
monitors product line represented 8%, 8% and 10% of consolidated
revenue for fiscal 2007,
|
F-40
MIRION
TECHNOLOGIES, INC.
Notes to
Consolidated Financial
Statements — (Continued)
|
|
|
| |
|
2008 and 2009 and 8% (unaudited) and 16% (unaudited) of
consolidated revenue for the six months ended December 31,
2008 and 2009.
|
|
|
|
| |
•
|
The Radiation Monitoring Systems segment sells radiation
monitoring systems to the nuclear end market. The Radiation
Monitoring Systems segment consists of a single product line and
represents 20%, 23% and 20% of consolidated revenue for fiscal
2007, 2008 and 2009 and 21% (unaudited) and 26% (unaudited) of
consolidated revenue for the six months ended December 31,
2008 and 2009.
|
|
|
|
| |
•
|
The Sensing Systems segment supplies electrical penetration and
reactor control equipment to the builders and operators of
nuclear reactors. No single product line in the Sensing Systems
segment represented more than 10% of consolidated revenue for
fiscal 2007, 2008 and 2009 and no single product line in the
Sensing Systems segment represented more than 10% (unaudited) of
consolidated revenue for the six months ended December 31,
2008 and 2009.
|
|
|
|
| |
•
|
The Dosimetry Services segment provides dosimetry services to
employers of radiation workers in the nuclear and medical end
markets. The Dosimetry Services segment consists of a single
product line and represents 16%, 15% and 15% of consolidated
revenue for fiscal 2007, 2008 and 2009 and 15% (unaudited) and
13% (unaudited) of consolidated revenue for the six months ended
December 31, 2008 and 2009.
|
|
|
|
| |
•
|
The Imaging Systems segment sells specialized cameras for use in
difficult and hazardous environments. No single product line in
the Imaging Systems segment represented more than 10% of
consolidated revenue in fiscal 2007, 2008 and 2009 and no single
product line in the Imaging Systems segment represented more
than 10% (unaudited) of consolidated revenue for the six months
ended December 31, 2008 and 2009.
|
F-41
MIRION
TECHNOLOGIES, INC.
Notes to
Consolidated Financial
Statements — (Continued)
Summarized financial information by reporting segment was as
follows (in thousands):
| |
|
|
|
|
|
|
|
|
|
|
|
|
|
|
|
|
|
|
|
|
|
|
|
|
|
|
Six Months Ended
|
|
|
|
|
Year Ended June 30,
|
|
|
December 31,
|
|
|
|
|
2007
|
|
|
2008
|
|
|
2009
|
|
|
2008
|
|
|
2009
|
|
|
|
|
|
|
|
|
|
|
|
|
|
(unaudited)
|
|
|
|
|
Revenue:
|
|
|
|
|
|
|
|
|
|
|
|
|
|
|
|
|
|
|
|
|
|
Health Physics
|
|
$
|
58,020
|
|
|
$
|
58,691
|
|
|
$
|
69,109
|
|
|
$
|
33,140
|
|
|
$
|
36,696
|
|
|
Radiation Monitoring Systems
|
|
|
33,521
|
|
|
|
43,201
|
|
|
|
41,116
|
|
|
|
20,803
|
|
|
|
27,765
|
|
|
Sensing Systems
|
|
|
29,049
|
|
|
|
39,866
|
|
|
|
44,979
|
|
|
|
22,858
|
|
|
|
22,338
|
|
|
Dosimetry Services
|
|
|
27,785
|
|
|
|
28,824
|
|
|
|
29,457
|
|
|
|
14,830
|
|
|
|
14,445
|
|
|
Imaging Systems
|
|
|
20,658
|
|
|
|
21,187
|
|
|
|
17,102
|
|
|
|
8,888
|
|
|
|
7,414
|
|
|
|
|
|
|
|
|
|
|
|
|
|
|
|
|
|
|
|
|
|
|
|
|
Total
|
|
$
|
169,033
|
|
|
$
|
191,769
|
|
|
$
|
201,763
|
|
|
$
|
100,519
|
|
|
$
|
108,658
|
|
|
|
|
|
|
|
|
|
|
|
|
|
|
|
|
|
|
|
|
|
|
|
|
(Loss) income from operations:
|
|
|
|
|
|
|
|
|
|
|
|
|
|
|
|
|
|
|
|
|
|
Health Physics
|
|
$
|
(993
|
)
|
|
$
|
(912
|
)
|
|
$
|
6,317
|
|
|
$
|
776
|
|
|
$
|
1,875
|
|
|
Radiation Monitoring Systems
|
|
|
1,775
|
|
|
|
1,085
|
|
|
|
4,109
|
|
|
|
1,793
|
|
|
|
3,349
|
|
|
Sensing Systems
|
|
|
3,881
|
|
|
|
10,234
|
|
|
|
14,973
|
|
|
|
8,395
|
|
|
|
8,801
|
|
|
Dosimetry Services
|
|
|
5,879
|
|
|
|
7,746
|
|
|
|
7,968
|
|
|
|
4,019
|
|
|
|
3,561
|
|
|
Imaging Systems
|
|
|
200
|
|
|
|
1,339
|
|
|
|
1,064
|
|
|
|
428
|
|
|
|
334
|
|
|
Unallocated corporate items
|
|
|
(7,354
|
)
|
|
|
(8,555
|
)
|
|
|
(15,553
|
)
|
|
|
(6,272
|
)
|
|
|
(8,358
|
)
|
|
|
|
|
|
|
|
|
|
|
|
|
|
|
|
|
|
|
|
|
|
|
|
Total
|
|
$
|
3,388
|
|
|
$
|
10,937
|
|
|
$
|
18,878
|
|
|
$
|
9,139
|
|
|
$
|
9,562
|
|
|
|
|
|
|
|
|
|
|
|
|
|
|
|
|
|
|
|
|
|
|
|
|
Depreciation and amortization:
|
|
|
|
|
|
|
|
|
|
|
|
|
|
|
|
|
|
|
|
|
|
Health Physics
|
|
$
|
3,167
|
|
|
$
|
3,225
|
|
|
$
|
2,780
|
|
|
$
|
1,369
|
|
|
$
|
1,162
|
|
|
Radiation Monitoring Systems
|
|
|
2,188
|
|
|
|
2,268
|
|
|
|
1,927
|
|
|
|
1,119
|
|
|
|
1,108
|
|
|
Sensing Systems
|
|
|
3,321
|
|
|
|
2,172
|
|
|
|
1,806
|
|
|
|
852
|
|
|
|
959
|
|
|
Dosimetry Services
|
|
|
5,773
|
|
|
|
5,025
|
|
|
|
4,283
|
|
|
|
2,030
|
|
|
|
2,167
|
|
|
Imaging Systems
|
|
|
1,849
|
|
|
|
1,467
|
|
|
|
1,410
|
|
|
|
824
|
|
|
|
625
|
|
|
Unallocated corporate items
|
|
|
4
|
|
|
|
25
|
|
|
|
273
|
|
|
|
78
|
|
|
|
300
|
|
|
|
|
|
|
|
|
|
|
|
|
|
|
|
|
|
|
|
|
|
|
|
|
Total
|
|
$
|
16,302
|
|
|
$
|
14,182
|
|
|
$
|
12,479
|
|
|
$
|
6,272
|
|
|
$
|
6,321
|
|
|
|
|
|
|
|
|
|
|
|
|
|
|
|
|
|
|
|
|
|
|
|
|
Interest expense:
|
|
|
|
|
|
|
|
|
|
|
|
|
|
|
|
|
|
|
|
|
|
Health Physics
|
|
$
|
2,932
|
|
|
$
|
3,326
|
|
|
$
|
3,019
|
|
|
$
|
1,766
|
|
|
$
|
1,065
|
|
|
Radiation Monitoring Systems
|
|
|
2,932
|
|
|
|
3,326
|
|
|
|
3,019
|
|
|
|
1,766
|
|
|
|
1,074
|
|
|
Sensing Systems
|
|
|
2,871
|
|
|
|
2,971
|
|
|
|
2,408
|
|
|
|
1,286
|
|
|
|
1,105
|
|
|
Dosimetry Services
|
|
|
7,674
|
|
|
|
7,756
|
|
|
|
6,935
|
|
|
|
3,697
|
|
|
|
3,238
|
|
|
Imaging Systems
|
|
|
2,871
|
|
|
|
2,971
|
|
|
|
2,408
|
|
|
|
1,268
|
|
|
|
1,105
|
|
|
Unallocated corporate items
|
|
|
—
|
|
|
|
—
|
|
|
|
—
|
|
|
|
—
|
|
|
|
—
|
|
|
|
|
|
|
|
|
|
|
|
|
|
|
|
|
|
|
|
|
|
|
|
|
Total
|
|
$
|
19,280
|
|
|
$
|
20,350
|
|
|
$
|
17,789
|
|
|
$
|
9,783
|
|
|
$
|
7,587
|
|
|
|
|
|
|
|
|
|
|
|
|
|
|
|
|
|
|
|
|
|
|
|
| |
|
|
|
|
|
|
|
|
|
|
|
|
|
|
|
As of June 30,
|
|
|
As of December 31,
|
|
|
|
|
2008
|
|
|
2009
|
|
|
2009
|
|
|
|
|
|
|
|
|
|
|
(unaudited)
|
|
|
|
|
Total assets:
|
|
|
|
|
|
|
|
|
|
|
|
|
|
Health Physics
|
|
$
|
112,324
|
|
|
$
|
94,883
|
|
|
$
|
103,521
|
|
|
Radiation Monitoring Systems
|
|
|
76,634
|
|
|
|
85,915
|
|
|
|
80,743
|
|
|
Sensing Systems
|
|
|
52,713
|
|
|
|
47,641
|
|
|
|
52,924
|
|
|
Dosimetry Services
|
|
|
74,219
|
|
|
|
71,690
|
|
|
|
74,111
|
|
|
Imaging Systems
|
|
|
28,033
|
|
|
|
24,829
|
|
|
|
25,325
|
|
|
Unallocated corporate items
|
|
|
454
|
|
|
|
4,796
|
|
|
|
11,916
|
|
|
|
|
|
|
|
|
|
|
|
|
|
|
|
|
Total
|
|
$
|
344,377
|
|
|
$
|
329,754
|
|
|
$
|
348,540
|
|
|
|
|
|
|
|
|
|
|
|
|
|
|
|
F-42
MIRION
TECHNOLOGIES, INC.
Notes to
Consolidated Financial
Statements — (Continued)
The Company conducts its operations throughout the world.
Revenue is attributed to each geographic location based on the
locations of end customers. Assets and Long-lived assets are
attributed based on where the assets are located. Revenue,
assets and long-lived assets by geographic location were as
follows (in thousands):
| |
|
|
|
|
|
|
|
|
|
|
|
|
|
|
|
|
|
|
|
|
|
|
|
|
|
|
Six Months Ended
|
|
|
|
|
Year Ended June 30,
|
|
|
December 31,
|
|
|
|
|
2007
|
|
|
2008
|
|
|
2009
|
|
|
2008
|
|
|
2009
|
|
|
|
|
|
|
|
|
|
|
|
|
|
(unaudited)
|
|
|
|
|
Revenue:
|
|
|
|
|
|
|
|
|
|
|
|
|
|
|
|
|
|
|
|
|
|
North American markets(1)
|
|
$
|
65,356
|
|
|
$
|
68,840
|
|
|
$
|
77,435
|
|
|
$
|
39,886
|
|
|
$
|
40,550
|
|
|
European markets
|
|
|
82,117
|
|
|
|
90,189
|
|
|
|
93,977
|
|
|
|
40,950
|
|
|
|
52,139
|
|
|
Asia Pacific markets
|
|
|
21,560
|
|
|
|
32,740
|
|
|
|
30,351
|
|
|
|
19,683
|
|
|
|
15,969
|
|
|
|
|
|
|
|
|
|
|
|
|
|
|
|
|
|
|
|
|
|
|
|
|
Total
|
|
$
|
169,033
|
|
|
$
|
191,769
|
|
|
$
|
201,763
|
|
|
$
|
100,519
|
|
|
$
|
108,658
|
|
|
|
|
|
|
|
|
|
|
|
|
|
|
|
|
|
|
|
|
|
|
|
| |
|
|
|
|
|
|
|
|
|
|
|
|
|
|
|
As of June 30,
|
|
|
As of December 31,
|
|
|
|
|
2008
|
|
|
2009
|
|
|
2009
|
|
|
|
|
|
|
|
|
|
|
(unaudited)
|
|
|
|
|
Assets:
|
|
|
|
|
|
|
|
|
|
|
|
|
|
North America
|
|
$
|
140,520
|
|
|
$
|
140,927
|
|
|
$
|
155,345
|
|
|
Europe
|
|
|
203,784
|
|
|
|
188,626
|
|
|
|
192,988
|
|
|
Asia Pacific/Japan
|
|
|
73
|
|
|
|
201
|
|
|
|
207
|
|
|
|
|
|
|
|
|
|
|
|
|
|
|
|
|
Total Assets
|
|
$
|
344,377
|
|
|
$
|
329,754
|
|
|
$
|
348,540
|
|
|
|
|
|
|
|
|
|
|
|
|
|
|
|
|
Long-lived assets:
|
|
|
|
|
|
|
|
|
|
|
|
|
|
North America
|
|
$
|
7,506
|
|
|
$
|
8,593
|
|
|
$
|
8,697
|
|
|
Europe
|
|
|
10,111
|
|
|
|
9,486
|
|
|
|
9,984
|
|
|
Asia Pacific/Japan
|
|
|
1
|
|
|
|
1
|
|
|
|
1
|
|
|
|
|
|
|
|
|
|
|
|
|
|
|
|
|
Total
|
|
$
|
17,618
|
|
|
$
|
18,080
|
|
|
$
|
18,682
|
|
|
|
|
|
|
|
|
|
|
|
|
|
|
|
|
|
|
|
(1) |
|
North American markets include all products marketed in the
United States and Canada. |
The Company evaluated subsequent events in the annual financial
statements in accordance with FASB-issued authoritative guidance
through January 15, 2010, the date that the financial
statements were issued.
(unaudited)
The Company evaluated subsequent events in the interim financial
statements for the six months ended December 31, 2009,
through February 17, 2010, the date that the financial
statements were issued.
F-43
PART II
INFORMATION
NOT REQUIRED IN PROSPECTUS
|
|
|
Item 13.
|
Other
Expenses of Issuance and Distribution.
|
The following table sets forth expenses to be paid by the
registrant in connection with the offering described in this
Registration Statement. Each of the amounts set forth below,
other than the Registration fee and the FINRA filing fee, is an
estimate.
| |
|
|
|
|
|
|
Amount
|
|
|
|
Registration fee
|
|
$
|
5,580
|
|
FINRA filing fee
|
|
|
10,500
|
|
NASDAQ listing fee
|
|
|
*
|
|
Transfer agent’s fees
|
|
|
*
|
|
Printing and engraving expenses
|
|
|
*
|
|
Legal fees and expenses
|
|
|
*
|
|
Accounting fees and expenses
|
|
|
*
|
|
Blue Sky fees and expenses
|
|
|
*
|
|
Miscellaneous
|
|
|
*
|
|
|
|
|
|
|
Total
|
|
$
|
|
|
|
|
|
|
|
|
|
|
* |
|
To be filed by amendment. |
|
|
|
Item 14.
|
Indemnification
of Directors and Officers.
|
Section 145 of the Delaware General Corporation Law
provides that a corporation may indemnify directors and officers
as well as other employees and individuals against expenses
(including attorneys’ fees), judgments, fines and amounts
paid in settlement actually and reasonably incurred by such
person in connection with any threatened, pending or completed
actions, suits or proceedings in which such person is made a
party by reason of such person being or having been a director,
officer, employee or agent to the Registrant. The Delaware
General Corporation Law provides that Section 145 is not
exclusive of other rights to which those seeking indemnification
may be entitled under any bylaw, agreement, vote of stockholders
or disinterested directors or otherwise. The Bylaws that will be
adopted by the Registrant upon the consummation of this offering
provide for indemnification by the Registrant of its directors,
officers and employees to the fullest extent permitted by the
Delaware General Corporation Law.
Section 102(b)(7) of the Delaware General Corporation Law
permits a corporation to provide in its certificate of
incorporation that a director of the corporation shall not be
personally liable to the corporation or its stockholders for
monetary damages for breach of fiduciary duty as a director,
except for liability (i) for any breach of the
director’s duty of loyalty to the corporation or its
stockholders, (ii) for acts or omissions not in good faith
or which involve intentional misconduct or a knowing violation
of law, (iii) for unlawful payments of dividends or
unlawful stock repurchases, redemptions or other distributions,
or (iv) for any transaction from which the director derived
an improper personal benefit. The Certificate of Incorporation
that will be adopted by the Registrant upon the consummation of
this offering provides for such limitation of liability.
The Registrant maintains standard policies of insurance under
which coverage is provided (a) to its directors and
officers against loss rising from claims made by reason of
breach of duty or other wrongful act, and (b) to the
Registrant with respect to payments which may be made by the
Registrant to such officers and directors pursuant to the above
indemnification provision or otherwise as a matter of law.
The Underwriting Agreement to be filed as Exhibit 1.1 to
this Registration Statement will provide for indemnification of
the Registrant and its directors and certain officers by the
underwriters of this offering. The Registration Rights Agreement
to be filed as Exhibit 4.2 to this Registration Statement
will provide for
II-1
indemnification of the Registrant and its directors and certain
officers against certain liabilities related to the offering of
the common stock thereunder.
|
|
|
Item 15.
|
Recent
Sales of Unregistered Securities.
|
(a) Since September 30, 2006, the Registrant issued
the following unregistered securities:
On October 3, 2006, the Registrant issued
42,032 shares of Class B Non-Voting Common Stock to
ACAS and certain of its affiliates upon cancellation of a prior
issuance of 42,032 shares of Class B Non-Voting Common
Stock held by ACAS.
On October 3, 2006, the Registrant issued
677,426 shares of
Series A-1
Convertible Participating Preferred Stock to ACAS and certain of
its affiliates upon cancellation of a prior issuance of
677,426 shares of
Series A-1
Convertible Participating Preferred Stock to ACAS.
On October 3, 2006, the Registrant issued
70,000 shares of
Series A-2
Convertible Participating Preferred Stock to ACAS and
certain of its affiliates upon cancellation of a prior issuance
of 70,000 shares of
Series A-2
Convertible Participating Preferred Stock to ACAS.
On October 3, 2006, the Registrant issued warrants to
purchase 379,262 shares of common stock at an exercise
price of $0.001 per share to ACAS and certain of its affiliates
upon cancellation of a prior issuance of warrants to purchase
379,262 shares of common stock at an exercise price of
$0.01 per share to ACAS.
On October 3, 2007, the Registrant issued
29,422 shares of Class B Non-Voting Common Stock to
ACAS and certain of its affiliates upon cancellation of a prior
issuance of 29,422 shares of Class B Non-Voting Common
Stock to ACAS.
On October 3, 2007, the Registrant issued
474,198 shares of
Series A-1
Convertible Participating Preferred Stock to ACAS and certain of
its affiliates upon cancellation of a prior issuance of
474,198 shares of
Series A-1
Convertible Participating Preferred Stock to ACAS.
On October 3, 2007, the Registrant issued
49,000 shares of
Series A-2
Convertible Participating Preferred Stock to ACAS and certain of
its affiliates upon cancellation of a prior issuance of
49,000 shares of
Series A-2
Convertible Participating Preferred Stock to ACAS.
On October 3, 2007, the Registrant issued warrants to
purchase 263,707 shares of common stock at an exercise
price of $0.001 per share to ACAS and certain of its affiliates
upon cancellation of a prior issuance of warrants to purchase
263,707 shares of common stock at an exercise price of
$0.001 per share to ACAS.
On May 1, 2008, the Registrant issued and sold
150 shares of Class B Non-Voting Common Stock to an
employee upon an exercise of stock options vested under the
Registrant’s 2006 Stock Plan at an exercise price of $88.75
per share, for aggregate consideration of $13,312.50.
II-2
None of the foregoing transactions involved any underwriters,
underwriting discounts or commissions, or any public offering,
and the registrant believes that each transaction was exempt
from the registration requirements of the Securities Act
pursuant to Section 4(2), with respect to items
(1) through (8) above, as transactions by an issuer
not involving a public offering, and Rule 701 promulgated
thereunder, with respect to item (9) above, as a
transaction pursuant to compensatory benefit plans and contracts
relating to compensation as provided under such Rule 701.
The recipients of securities in such transactions represented
their intention to acquire the securities for investment only
and not with a view to or for sale in connection with any
distribution thereof, and appropriate legends were affixed to
the share certificates and instruments issued in such
transactions.
(b) Since September 30, 2006, the Registrant granted
the following stock options to purchase common stock to
employees, directors and consultants:
1. On October 2, 2006, the Registrant issued stock
options covering an aggregate of 4,754 shares of its common
stock at an exercise price of $117.58 per share and an aggregate
price of $558,975 under the Registrant’s 2006 Stock Plan.
2. On September 6, 2007, the Registrant issued stock
options covering an aggregate of 7,325 shares of its common
stock at an exercise price of $121.24 per share and an aggregate
price of $888,083 under the Registrant’s 2006 Stock Plan.
3. On November 5, 2007, the Registrant issued stock
options covering an aggregate of 15,000 shares of its
common stock at an exercise price of $138.58 per share and an
aggregate price of $1,662,960 under the Registrant’s 2006
Stock Plan, 3,000 of which were cancelled in July 2008.
4. On January 7, 2008, the Registrant issued stock
options covering an aggregate of 8,000 shares of its common
stock at an exercise price of $138.58 per share and an aggregate
price of $1,108,640 under the Registrant’s 2006 Stock Plan.
5. On January 8, 2008, the Registrant issued stock
options covering an aggregate of 1,500 shares of its common
stock at an exercise price of $138.58 per share and an aggregate
price of $207,870 under the Registrant’s 2006 Stock Plan.
6. On January 22, 2008, the Registrant issued stock
options covering an aggregate of 500 shares of its common
stock at an exercise price of $138.58 per share and an aggregate
price of $69,290 under the Registrant’s 2006 Stock Plan.
7. On January 28, 2008, the Registrant issued stock
options covering an aggregate of 9,000 shares of its common
stock at an exercise price of $138.58 per share and an aggregate
price of $1,247,220 under the Registrant’s 2006 Stock Plan.
8. On March 28, 2008, the Registrant issued stock
options covering an aggregate of 2,000 shares of its common
stock at an exercise price of $111.30 per share and an aggregate
price of $ under the Registrant’s 2006 Stock Plan.
9. On March 31, 2008, the Registrant issued stock
options covering an aggregate of 16,000 shares of its
common stock at an exercise price of $111.30 per share and an
aggregate price of $ under the Registrant’s 2006 Stock Plan.
10. On August 5, 2008, the Registrant issued stock
options covering an aggregate of 30,886 shares of its
common stock at an exercise price of $144.95 per share and an
aggregate price of $4,476,926 under the Registrant’s 2006
Stock Plan.
11. On August 5, 2008, the Registrant issued stock
options covering an aggregate of 2,000 shares of its common
stock at an exercise price of $144.95 per share and an aggregate
price of $289,900 under the Registrant’s 2006 Stock Plan.
II-3
12. On December 9, 2008, the Registrant issued stock
options covering an aggregate of 1,000 shares of its common
stock at an exercise price of $144.24 per share and an aggregate
price of $144,240 under the Registrant’s 2006 Stock Plan.
None of the foregoing transactions involved any underwriters,
underwriting discounts or commissions, or any public offering,
and the registrant believes each transaction was exempt from the
registration requirements of the Securities Act in reliance on
Rule 701 promulgated thereunder, with respect to items (1),
(2), (3), (5), (7), (8), (10) and (12) above, as
transactions pursuant to compensatory benefit plans and
contracts relating to compensation as provided under such
Rule 701, and Section 4(2) thereof and
Regulation D promulgated thereunder, with respect to items
(4), (9) and (11) above, as transactions by an issuer
not involving a public offering. The recipients of securities in
such transactions represented their intention to acquire the
securities for investment only and not with a view to or for
sale in connection with any distribution thereof, and
appropriate legends were affixed to the share certificates and
instruments issued in such transactions.
|
|
|
Item 16.
|
Exhibits
and Financial Statement Schedules.
|
| |
|
|
|
|
|
Exhibit No.
|
|
Document
|
|
|
|
|
1.1
|
*
|
|
Form of Underwriting Agreement
|
|
|
3.1
|
*
|
|
Form of Amended and Restated Certificate of Incorporation
|
|
|
3.2
|
*
|
|
Form of Amended and Restated Bylaws
|
|
|
4.1
|
*
|
|
Specimen Common Stock Certificate of the Registrant
|
|
|
4.2
|
*
|
|
Form of Registration Rights Agreement
|
|
|
5.1
|
*
|
|
Opinion of Davis Polk & Wardwell LLP
|
|
|
10.1
|
**
|
|
Shareholder Loan Agreement dated September 23, 2005 between
Dosimetry Acquisitions (France) and ACAS
|
|
|
10.1.1
|
**
|
|
Amendment 1 dated November 14, 2005 to Shareholder Loan
Agreement
|
|
|
10.1.2
|
**
|
|
Amendment No. 2 dated September 13, 2006 to
Shareholder Loan Agreement
|
|
|
10.1.3
|
**
|
|
Third Amendment dated May 14, 2008 to Shareholder Loan
Agreement
|
|
|
10.1.4
|
**
|
|
Fourth Amendment dated July 20, 2009 to Shareholder Loan
Agreement
|
|
|
10.2
|
**
|
|
Note and Equity Purchase Agreement dated June 23, 2004 by
and among MGP Instruments, Inc., Dosimetry Acquisitions (U.S.),
Inc. and American Capital Financial Services, Inc. and various
purchasers
|
|
|
10.2.1
|
**
|
|
Amendment No. 1 to Note and Equity Purchase Agreement of
MGP Instruments, Inc. dated October 22, 2004
|
|
|
10.2.2
|
**
|
|
Amendment No. 2 to Note and Equity Purchase Agreement of
MGP Instruments, Inc. dated November 1, 2005
|
|
|
10.2.3
|
**
|
|
Amendment No. 2 and Consent to Note and Equity Purchase
Agreement of MGP Instruments, Inc. dated December 22, 2005
|
|
|
10.2.4
|
**
|
|
Amendment No. 3 to Note and Equity Purchase Agreement of
MGP Instruments, Inc. dated June 30, 2006
|
|
|
10.2.5
|
**
|
|
Amendment No. 4 and Waiver to Note and Equity Purchase
Agreement of MGP Instruments, Inc. dated December 22, 2006
|
|
|
10.2.6
|
**
|
|
Amendment No. 4 to Note and Equity Purchase Agreement of
MGP Instruments, Inc. dated May 14, 2008
|
|
|
10.2.7
|
**
|
|
Cross Guaranty of the Registrant, MGP Instruments, Inc. and
Dosimetry Acquisitions (U.S.), Inc.
|
|
|
10.2.8
|
**
|
|
Waiver Agreement to Note and Equity Purchase Agreement of Mirion
Technologies (MGPI), Inc. (fka MGP Instruments, Inc.) dated
June 15, 2009
|
|
|
10.2.9
|
**
|
|
Waiver and Amendment Agreement to Note and Equity Purchase
Agreement of Mirion Technologies (MGPI), Inc. dated
July 31, 2009
|
|
|
10.2.10
|
**
|
|
Waiver Agreement to Note and Equity Purchase Agreement of Mirion
Technologies (MGPI), Inc. dated September 17, 2009
|
II-4
| |
|
|
|
|
|
Exhibit No.
|
|
Document
|
|
|
|
|
10.2.11
|
*
|
|
Senior Subordinated Note dated June 23, 2004 between MGP
Instruments, Inc. and American Capital Strategies, Ltd.
|
|
|
10.2.12
|
*
|
|
Junior Subordinated Note dated June 23, 2004 between MGP
Instruments, Inc. and American Capital Strategies, Ltd.
|
|
|
10.2.13
|
*
|
|
Revolving Note dated June 23, 2004 between MGP Instruments,
Inc. and American Capital Strategies, Ltd.
|
|
|
10.2.14
|
*
|
|
Form of Senior Term B Note
|
|
|
10.2.15
|
*
|
|
Schedule of Senior Term B Notes substantially identical in all
material respects to the Form of Senior Term B Note
|
|
|
10.3
|
**
|
|
Amended and Restated Note and Equity Purchase Agreement dated
October 29, 2004 by and among IST Acquisitions, Inc.,
Imaging and Sensing Technology Corporation and subsidiaries and
American Capital Financial Services, Inc. and various purchasers
|
|
|
10.3.1
|
**
|
|
Amendment No. 1 to Amended and Restated Note and Equity
Purchase Agreement of Imaging and Sensing Technology Corporation
dated May 24, 2005
|
|
|
10.3.2
|
**
|
|
Amendment No. 1 to Amended and Restated Note and Equity
Purchase Agreement of Imaging and Sensing Technology Corporation
dated October 21, 2005
|
|
|
10.3.3
|
**
|
|
Amendment No. 2 and Consent to Amended and Restated Note
and Equity Purchase Agreement of Imaging and Sensing Technology
Corporation dated December 22, 2005
|
|
|
10.3.4
|
**
|
|
Amendment No. 3 to Amended and Restated Note and Equity
Purchase Agreement of Imaging and Sensing Technology Corporation
dated May 16, 2006
|
|
|
10.3.5
|
**
|
|
Amendment No. 3 to Amended and Restated Note and Equity
Purchase Agreement of Imaging and Sensing Technology Corporation
dated September 13, 2006
|
|
|
10.3.6
|
**
|
|
Amendment No. 4 and Waiver to Amended and Restated Note and
Equity Purchase Agreement of Imaging and Sensing Technology
Corporation dated December 22, 2006
|
|
|
10.3.7
|
**
|
|
Amendment No. 4 to Amended and Restated Note and Equity
Purchase Agreement of Imaging and Sensing Technology Corporation
dated July 20, 2007
|
|
|
10.3.8
|
**
|
|
Amendment No. 5 to Amended and Restated Note and Equity
Purchase Agreement of Imaging and Sensing Technology Corporation
dated May 14, 2008
|
|
|
10.3.9
|
**
|
|
Cross Guaranty of the Registrant and Imaging and Sensing
Technology Corporation dated January 1, 2006
|
|
|
10.3.10
|
**
|
|
Waiver Agreement to Amended and Restated Note and Equity
Purchase Agreement of Mirion Technologies (IST) Corporation (fka
Imaging and Sensing Technology Corporation) dated June 15,
2009
|
|
|
10.3.11
|
**
|
|
Waiver and Amendment Agreement to Amended and Restated Note and
Equity Purchase Agreement of Mirion Technologies (IST)
Corporation dated August 4, 2009
|
|
|
10.3.12
|
**
|
|
Waiver Agreement to Note and Equity Purchase Agreement of Mirion
Technologies (IST) Corporation dated September 17, 2009
|
|
|
10.3.13
|
*
|
|
Senior Term C Note dated October 29, 2004 between IST
Acquisitions, Inc., Imaging and Sensing Technology Corporation,
I.S. Technology de Puerto Rico, Inc., IST Instruments, Inc.,
Imaging and Sensing Technology International Corp., IST Conax
Nuclear, Inc., Quadtek, Inc. and American Capital Strategies,
Ltd.
|
|
|
10.3.14
|
*
|
|
Stockholders Agreement dated May 24, 2004 between IST
Acquisitions, Inc. and American Capital Strategies, Ltd.
|
|
|
10.4
|
**
|
|
Amended and Restated Note and Equity Purchase Agreement dated
November 10, 2004 by and among Global Dosimetry Solutions,
Inc. and American Capital Financial Services, Inc. and various
purchasers
|
|
|
10.4.1
|
**
|
|
Amendment No. 1 to Amended and Restated Note and Equity
Purchase Agreement of Global Dosimetry Solutions, Inc. dated
October 14, 2005
|
|
|
10.4.2
|
**
|
|
Consent to Amended and Restated Note and Equity Purchase
Agreement of Global Dosimetry Solutions, Inc. dated
December 22, 2005
|
|
|
10.4.3
|
**
|
|
Amendment No. 2 to Amended and Restated Note and Equity
Purchase Agreement of Global Dosimetry Solutions, Inc. dated
February 1, 2006
|
II-5
| |
|
|
|
|
|
Exhibit No.
|
|
Document
|
|
|
|
|
10.4.4
|
**
|
|
Amendment No. 3 to Amended and Restated Note and Equity
Purchase Agreement of Global Dosimetry Solutions, Inc. dated
March 28, 2006
|
|
|
10.4.5
|
**
|
|
Amendment No. 4 to Amended and Restated Note and Equity
Purchase Agreement of Global Dosimetry Solutions, Inc. dated
December 15, 2006
|
|
|
10.4.6
|
**
|
|
Amendment No. 5 and Waiver to Amended and Restated Note and
Equity Purchase Agreement of Global Dosimetry Solutions, Inc.
dated December 22, 2006
|
|
|
10.4.7
|
**
|
|
Cross Guaranty of the Registrant and Global Dosimetry Solutions,
Inc. dated January 1, 2006
|
|
|
10.4.8
|
**
|
|
Waiver Agreement to Amended and Restated Note and Equity
Purchase Agreement of Mirion Technologies (GDS), Inc. (fka
Global Dosimetry Solutions, Inc.) dated June 15, 2009
|
|
|
10.4.9
|
**
|
|
Waiver and Amendment Agreement to Amended and Restated Note and
Equity Purchase Agreement of Mirion Technologies (GDS), Inc.
dated July 31, 2009
|
|
|
10.4.10
|
**
|
|
Waiver Agreement to Note and Equity Purchase Agreement of Mirion
Technologies (GDS), Inc. dated September 17, 2009
|
|
|
10.5
|
**
|
|
First Lien Pledge and Security Agreement made by the Registrant
in favor of American Financial Services, Inc. dated
January 1, 2006
|
|
|
10.6
|
*
|
|
Form of Indemnification Agreement
|
|
|
10.7
|
**
|
|
Investment Banking Services Agreement dated December 25,
2005 between the Registrant and American Capital Financial
Services, Inc.
|
|
|
10.8
|
**
|
|
Lease Agreement dated December 28, 2005 between the
Registrant and Alexander Properties Company
|
|
|
10.8.1
|
**
|
|
Addendum 1 dated August 29, 2007 to Lease Agreement dated
December 28, 2005 between the Registrant and Alexander
Properties Company
|
|
|
10.8.2
|
**
|
|
Addendum 2 dated June 10, 2008 to Lease Agreement dated
December 22, 2005 between the Registrant and Alexander
Properties Company
|
|
|
10.9
|
**
|
|
Lease Agreement dated December 1, 1999 between the
Registrant and Sonwil Development Group, L.L.C.
|
|
|
10.10
|
**
|
|
Lease Agreement dated January 29, 2004 between the
Registrant and The Irvine Company
|
|
|
10.11
|
**
|
|
2006 Stock Plan
|
|
|
10.11.1
|
**
|
|
First Amendment to 2006 Stock Plan
|
|
|
10.11.2
|
**
|
|
Amendment to 2006 Stock Plan
|
|
|
10.12
|
**
|
|
Form of Stock Option Agreement under 2006 Stock Plan
|
|
|
10.13
|
|
|
Form of Amended and Restated 2006 Stock Plan
|
|
|
10.14
|
*
|
|
Form of Stock Option Agreement under Amended and Restated 2006
Stock Plan
|
|
|
10.15
|
**
|
|
Second Amended and Restated Call Option Agreement among Thomas
D. Logan and ACAS
|
|
|
10.16
|
**
|
|
Employment Agreement dated August 15, 2006 between the
Registrant and Thomas D. Logan
|
|
|
10.16.1
|
**
|
|
Section 409A Amendment dated December 22, 2008 to
Employment Agreement of Thomas D. Logan
|
|
|
10.16.2
|
**
|
|
Amendment 2 dated January 1, 2009 to the Employment
Agreement dated August 15, 2006 between the Registrant and
Thomas D. Logan
|
|
|
10.17
|
**
|
|
Employment Agreement dated March 28, 2008 between the
Registrant and Jack Pacheco
|
|
|
10.17.1
|
**
|
|
Section 409A Amendment dated December 18, 2008 to
Employment Agreement of Jack Pacheco
|
|
|
10.18
|
**
|
|
Employment Agreement dated January 7, 2008 between the
Registrant and Seth Rosen
|
|
|
10.18.1
|
**
|
|
Section 409A Amendment dated December 18, 2008 to
Employment Agreement of Seth Rosen
|
|
|
10.19
|
**
|
|
Employment Agreement dated March 2, 2006 between the
Registrant and W. Antony Besso
|
|
|
10.19.1
|
**
|
|
Addendum dated November 26, 2007 to Employment Agreement of
W. Antony Besso
|
|
|
10.19.2
|
**
|
|
Bonus Agreement dated December 13, 2008 between the Registrant
and W. Antony Besso
|
|
|
10.20
|
*
|
|
Executive Bonus Plan
|
|
|
10.21
|
|
|
Form of Warrant
|
|
|
10.22
|
|
|
Schedule of warrants substantially identical in all material
respects to the Form of Warrant
|
|
|
21.1
|
**
|
|
Subsidiaries of the Registrant
|
II-6
| |
|
|
|
|
|
Exhibit No.
|
|
Document
|
|
|
|
|
23.1
|
|
|
Consent of Ernst & Young LLP, Independent Registered
Public Accounting Firm
|
|
|
23.2
|
*
|
|
Consent of Davis Polk & Wardwell LLP (included in
Exhibit 5.1)
|
|
|
24.1
|
**
|
|
Power of Attorney (included on signature page)
|
|
|
99.1
|
|
|
Consent of Dustin G. Smith to being named as a director nominee
|
|
|
99.2
|
|
|
Consent of Brian S. Graff to being named as a director nominee
|
|
|
99.3
|
|
|
Consent of Michael T. Everett to being named as a director
nominee
|
|
|
99.4
|
|
|
Consent of Earl R. Lewis to being named as a director nominee
|
|
|
99.5
|
|
|
Consent of Alfred E. Barry, Jr. to being named as a director
nominee
|
|
|
|
|
* |
|
To be filed by amendment. |
|
** |
|
Previously filed. |
The undersigned registrant hereby undertakes to provide to the
underwriters at the closing specified in the underwriting
agreement certificates in such denominations and registered in
such names as required by the underwriters to permit prompt
delivery to each purchaser.
Insofar as indemnification for liabilities arising under the
Securities Act of 1933 may be permitted to directors,
officers and controlling persons of the registrant pursuant to
the provisions referenced in Item 14 of this Registration
Statement, or otherwise, the registrant has been advised that in
the opinion of the Securities and Exchange Commission such
indemnification is against public policy as expressed in the Act
and is, therefore, unenforceable. In the event that a claim for
indemnification against such liabilities (other than the payment
by the registrant of expenses incurred or paid by a director,
officer, or controlling person of the registrant in the
successful defense of any action, suit or proceeding) is
asserted by such director, officer or controlling person in
connection with the securities being registered hereunder, the
registrant will, unless in the opinion of its counsel the matter
has been settled by controlling precedent, submit to a court of
appropriate jurisdiction the question of whether such
indemnification by it is against public policy as expressed in
the Act and will be governed by the final adjudication of such
issue.
The undersigned registrant hereby undertakes that:
(1) For purposes of determining any liability under the
Securities Act, the information omitted from the form of
prospectus filed as part of this Registration Statement in
reliance upon Rule 430A and contained in a form of
prospectus filed by the Registrant pursuant to
Rule 424(b)(1) or (4) or 497(h) under the Securities
Act shall be deemed to be part of this Registration Statement as
of the time it was declared effective.
(2) For the purpose of determining any liability under the
Securities Act, each post-effective amendment that contains a
form of prospectus shall be deemed to be a new Registration
Statement relating to the securities offered therein, and the
offering of such securities at that time shall be deemed to be
the initial bona fide offering thereof.
(3) For the purpose of determining liability under the
Securities Act to any purchaser, if the registrant is subject to
Rule 430C, each prospectus filed pursuant to
Rule 424(b) as part of a Registration Statement relating to
an offering, other than registration statements relying on
Rule 430B or other than prospectuses filed in reliance on
Rule 430A, shall be deemed to be part of and included in
the Registration Statement as of the date it is first used after
effectiveness. Provided, however, that no statement made
in a registration statement or prospectus that is part of the
registration statement or made in a document incorporated or
deemed incorporated by reference into the Registration Statement
or prospectus that is part of the Registration Statement will,
as to a purchaser with a time of contract of sale prior to such
first use, supersede or modify any statement that was made in
the registration statement or prospectus that was part of the
Registration Statement or made in any such document immediately
prior to such date of first use.
(4) For the purpose of determining liability of the
registrant under the Securities Act of 1933 to any purchaser in
the initial distribution of securities, in a primary offering of
securities of the registrant
II-7
pursuant to this Registration Statement, regardless of the
underwriting method used to sell the securities to the
purchaser, if the securities are offered or sold to such
purchaser by means of any of the following communications, the
registrant will be a seller to the purchaser and will be
considered to offer or sell such securities to the purchaser:
(i) any preliminary prospectus or prospectus of the
registrant relating to the offering required to be filed
pursuant to Rule 424;
(ii) any free writing prospectus relating to the offering
prepared by or on behalf of the registrant or used or referred
to by the registrant;
(iii) the portion of any other free writing prospectus
relating to the offering containing material information about
the registrant or its securities provided by or on behalf of the
registrant; and
(iv) any other communication that is an offer in the
offering made by the registrant to the purchaser.
II-8
SIGNATURES
Pursuant to the requirements of the Securities Act of 1933, the
Registrant has duly caused this amendment number three to this
Registration Statement to be signed on its behalf by the
undersigned, thereunto duly authorized, in the City of
San Ramon, State of California, on February 17, 2010.
MIRION TECHNOLOGIES, INC.
Name: Thomas D. Logan
|
|
|
| |
Title:
|
President, Chief Executive Officer and Chairman of the Board
|
Pursuant to the requirements of the Securities Act of 1933, as
amended, this Registration Statement has been signed by the
following persons in the capacities and on the dates indicated.
| |
|
|
|
|
|
|
|
Signature
|
|
Title
|
|
Date
|
|
|
|
|
|
|
|
|
|
/s/ Thomas
D. Logan
Thomas
D. Logan
(Principal Executive Officer)
|
|
President, Chief Executive Officer
and Chairman of the Board
|
|
February 17, 2010
|
|
|
|
|
|
|
|
/s/ Jack
A. Pacheco
Jack
A. Pacheco
(Principal Financial and Accounting Officer)
|
|
Vice President and Chief Financial Officer
|
|
February 17, 2010
|
|
|
|
|
|
|
|
*
Robert
J. Klein
|
|
Director
|
|
February 17, 2010
|
|
|
|
|
|
|
|
|
|
*By:
|
|
/s/ Thomas
D. Logan
Thomas
D. Logan
Attorney-in-fact
|
|
|
|
|
II-9
EXHIBIT INDEX
| |
|
|
|
|
|
Exhibit No.
|
|
Document
|
|
|
|
|
1.1
|
*
|
|
Form of Underwriting Agreement
|
|
|
3.1
|
*
|
|
Form of Amended and Restated Certificate of Incorporation
|
|
|
3.2
|
*
|
|
Form of Amended and Restated Bylaws
|
|
|
4.1
|
*
|
|
Specimen Common Stock Certificate of the Registrant
|
|
|
4.2
|
*
|
|
Form of Registration Rights Agreement
|
|
|
5.1
|
*
|
|
Opinion of Davis Polk & Wardwell LLP
|
|
|
10.1
|
**
|
|
Shareholder Loan Agreement dated September 23, 2005 between
Dosimetry Acquisitions (France) and ACAS
|
|
|
10.1.1
|
**
|
|
Amendment 1 dated November 14, 2005 to Shareholder Loan
Agreement
|
|
|
10.1.2
|
**
|
|
Amendment No. 2 dated September 13, 2006 to
Shareholder Loan Agreement
|
|
|
10.1.3
|
**
|
|
Third Amendment dated May 14, 2008 to Shareholder Loan
Agreement
|
|
|
10.1.4
|
**
|
|
Fourth Amendment dated July 20, 2009 to Shareholder Loan
Agreement
|
|
|
10.2
|
**
|
|
Note and Equity Purchase Agreement dated June 23, 2004 by
and among MGP Instruments, Inc., Dosimetry Acquisitions (U.S.),
Inc. and American Capital Financial Services, Inc. and various
purchasers
|
|
|
10.2.1
|
**
|
|
Amendment No. 1 to Note and Equity Purchase Agreement of
MGP Instruments, Inc. dated October 22, 2004
|
|
|
10.2.2
|
**
|
|
Amendment No. 2 to Note and Equity Purchase Agreement of
MGP Instruments, Inc. dated November 1, 2005
|
|
|
10.2.3
|
**
|
|
Amendment No. 2 and Consent to Note and Equity Purchase
Agreement of MGP Instruments, Inc. dated December 22, 2005
|
|
|
10.2.4
|
**
|
|
Amendment No. 3 to Note and Equity Purchase Agreement of
MGP Instruments, Inc. dated June 30, 2006
|
|
|
10.2.5
|
**
|
|
Amendment No. 4 and Waiver to Note and Equity Purchase
Agreement of MGP Instruments, Inc. dated December 22, 2006
|
|
|
10.2.6
|
**
|
|
Amendment No. 4 to Note and Equity Purchase Agreement of
MGP Instruments, Inc. dated May 14, 2008
|
|
|
10.2.7
|
**
|
|
Cross Guaranty of the Registrant, MGP Instruments, Inc. and
Dosimetry Acquisitions (U.S.), Inc.
|
|
|
10.2.8
|
**
|
|
Waiver Agreement to Note and Equity Purchase Agreement of Mirion
Technologies (MGPI), Inc. (fka MGP Instruments, Inc.) dated
June 15, 2009
|
|
|
10.2.9
|
**
|
|
Waiver and Amendment Agreement to Note and Equity Purchase
Agreement of Mirion Technologies (MGPI), Inc. dated
July 31, 2009
|
|
|
10.2.10
|
**
|
|
Waiver Agreement to Note and Equity Purchase Agreement of Mirion
Technologies (MGPI), Inc. dated September 17, 2009
|
|
|
10.2.11
|
*
|
|
Senior Subordinated Note dated June 23, 2004 between MGP
Instruments, Inc. and American Capital Strategies, Ltd.
|
|
|
10.2.12
|
*
|
|
Junior Subordinated Note dated June 23, 2004 between MGP
Instruments, Inc. and American Capital Strategies, Ltd.
|
|
|
10.2.13
|
*
|
|
Revolving Note dated June 23, 2004 between MGP Instruments, Inc.
and American Capital Strategies, Ltd.
|
|
|
10.2.14
|
*
|
|
Form of Senior Term B Note
|
|
|
10.2.15
|
*
|
|
Schedule of Senior Term B Notes substantially identical in all
material respects to the Form of Senior Term B Note
|
|
|
10.3
|
**
|
|
Amended and Restated Note and Equity Purchase Agreement dated
October 29, 2004 by and among IST Acquisitions, Inc.,
Imaging and Sensing Technology Corporation and subsidiaries and
American Capital Financial Services, Inc. and various purchasers
|
|
|
10.3.1
|
**
|
|
Amendment No. 1 to Amended and Restated Note and Equity
Purchase Agreement of Imaging and Sensing Technology Corporation
dated May 24, 2005
|
| |
|
|
|
|
|
Exhibit No.
|
|
Document
|
|
|
|
|
10.3.2
|
**
|
|
Amendment No. 1 to Amended and Restated Note and Equity
Purchase Agreement of Imaging and Sensing Technology Corporation
dated October 21, 2005
|
|
|
10.3.3
|
**
|
|
Amendment No. 2 and Consent to Amended and Restated Note
and Equity Purchase Agreement of Imaging and Sensing Technology
Corporation dated December 22, 2005
|
|
|
10.3.4
|
**
|
|
Amendment No. 3 to Amended and Restated Note and Equity
Purchase Agreement of Imaging and Sensing Technology Corporation
dated May 16, 2006
|
|
|
10.3.5
|
**
|
|
Amendment No. 3 to Amended and Restated Note and Equity
Purchase Agreement of Imaging and Sensing Technology Corporation
dated September 13, 2006
|
|
|
10.3.6
|
**
|
|
Amendment No. 4 and Waiver to Amended and Restated Note and
Equity Purchase Agreement of Imaging and Sensing Technology
Corporation dated December 22, 2006
|
|
|
10.3.7
|
**
|
|
Amendment No. 4 to Amended and Restated Note and Equity
Purchase Agreement of Imaging and Sensing Technology Corporation
dated July 20, 2007
|
|
|
10.3.8
|
**
|
|
Amendment No. 5 to Amended and Restated Note and Equity
Purchase Agreement of Imaging and Sensing Technology Corporation
dated May 14, 2008
|
|
|
10.3.9
|
**
|
|
Cross Guaranty of the Registrant and Imaging and Sensing
Technology Corporation dated January 1, 2006
|
|
|
10.3.10
|
**
|
|
Waiver Agreement to Amended and Restated Note and Equity
Purchase Agreement of Mirion Technologies (IST) Corporation (fka
Imaging and Sensing Technology Corporation) dated June 15,
2009
|
|
|
10.3.11
|
**
|
|
Waiver and Amendment Agreement to Amended and Restated Note and
Equity Purchase Agreement of Mirion Technologies (IST)
Corporation dated August 4, 2009
|
|
|
10.3.12
|
**
|
|
Waiver Agreement to Note and Equity Purchase Agreement of Mirion
Technologies (IST) Corporation dated September 17, 2009
|
|
|
10.3.13
|
*
|
|
Senior Term C Note dated October 29, 2004 between IST
Acquisitions, Inc., Imaging and Sensing Technology Corporation,
I.S. Technology de Puerto Rico, Inc., IST Instruments, Inc.,
Imaging and Sensing Technology International Corp., IST Conax
Nuclear, Inc., Quadtek, Inc. and American Capital Strategies,
Ltd.
|
|
|
10.3.14
|
*
|
|
Stockholders Agreement dated May 24, 2004 between IST
Acquisitions, Inc. and American Capital Strategies, Ltd.
|
|
|
10.4
|
**
|
|
Amended and Restated Note and Equity Purchase Agreement dated
November 10, 2004 by and among Global Dosimetry Solutions,
Inc. and American Capital Financial Services, Inc. and various
purchasers
|
|
|
10.4.1
|
**
|
|
Amendment No. 1 to Amended and Restated Note and Equity
Purchase Agreement of Global Dosimetry Solutions, Inc. dated
October 14, 2005
|
|
|
10.4.2
|
**
|
|
Consent to Amended and Restated Note and Equity Purchase
Agreement of Global Dosimetry Solutions, Inc. dated
December 22, 2005
|
|
|
10.4.3
|
**
|
|
Amendment No. 2 to Amended and Restated Note and Equity
Purchase Agreement of Global Dosimetry Solutions, Inc. dated
February 1, 2006
|
|
|
10.4.4
|
**
|
|
Amendment No. 3 to Amended and Restated Note and Equity
Purchase Agreement of Global Dosimetry Solutions, Inc. dated
March 28, 2006
|
|
|
10.4.5
|
**
|
|
Amendment No. 4 to Amended and Restated Note and Equity
Purchase Agreement of Global Dosimetry Solutions, Inc. dated
December 15, 2006
|
|
|
10.4.6
|
**
|
|
Amendment No. 5 and Waiver to Amended and Restated Note and
Equity Purchase Agreement of Global Dosimetry Solutions, Inc.
dated December 22, 2006
|
|
|
10.4.7
|
**
|
|
Cross Guaranty of the Registrant and Global Dosimetry Solutions,
Inc. dated January 1, 2006
|
|
|
10.4.8
|
**
|
|
Waiver Agreement to Amended and Restated Note and Equity
Purchase Agreement of Mirion Technologies (GDS), Inc. (fka
Global Dosimetry Solutions, Inc.) dated June 15, 2009
|
|
|
10.4.9
|
**
|
|
Waiver and Amendment Agreement to Amended and Restated Note and
Equity Purchase Agreement of Mirion Technologies (GDS), Inc.
dated July 31, 2009
|
|
|
10.4.10
|
**
|
|
Waiver Agreement to Note and Equity Purchase Agreement of Mirion
Technologies (GDS), Inc. dated September 17, 2009
|
| |
|
|
|
|
|
Exhibit No.
|
|
Document
|
|
|
|
|
10.5
|
**
|
|
First Lien Pledge and Security Agreement made by the Registrant
in favor of American Financial Services, Inc. dated
January 1, 2006
|
|
|
10.6
|
*
|
|
Form of Indemnification Agreement
|
|
|
10.7
|
**
|
|
Investment Banking Services Agreement dated December 25,
2005 between the Registrant and American Capital Financial
Services, Inc.
|
|
|
10.8
|
**
|
|
Lease Agreement dated December 28, 2005 between the
Registrant and Alexander Properties Company
|
|
|
10.8.1
|
**
|
|
Addendum 1 dated August 29, 2007 to Lease Agreement dated
December 28, 2005 between the Registrant and Alexander
Properties Company
|
|
|
10.8.2
|
**
|
|
Addendum 2 dated June 10, 2008 to Lease Agreement dated
December 22, 2005 between the Registrant and Alexander
Properties Company
|
|
|
10.9
|
**
|
|
Lease Agreement dated December 1, 1999 between the
Registrant and Sonwil Development Group, L.L.C.
|
|
|
10.10
|
**
|
|
Lease Agreement dated January 29, 2004 between the
Registrant and The Irvine Company
|
|
|
10.11
|
**
|
|
2006 Stock Plan
|
|
|
10.11.1
|
**
|
|
First Amendment to 2006 Stock Plan
|
|
|
10.11.2
|
**
|
|
Amendment to 2006 Stock Plan
|
|
|
10.12
|
**
|
|
Form of Stock Option Agreement under 2006 Stock Plan
|
|
|
10.13
|
|
|
Form of Amended and Restated 2006 Stock Plan
|
|
|
10.14
|
*
|
|
Form of Stock Option Agreement under Amended and Restated 2006
Stock Plan
|
|
|
10.15
|
**
|
|
Second Amended and Restated Call Option Agreement among Thomas
D. Logan and ACAS
|
|
|
10.16
|
**
|
|
Employment Agreement dated August 15, 2006 between the
Registrant and Thomas D. Logan
|
|
|
10.16.1
|
**
|
|
Section 409A Amendment dated December 22, 2008 to
Employment Agreement of Thomas D. Logan
|
|
|
10.16.2
|
**
|
|
Amendment 2 dated January 1, 2009 to the Employment
Agreement dated August 15, 2006 between the Registrant and
Thomas D. Logan
|
|
|
10.17
|
**
|
|
Employment Agreement dated March 28, 2008 between the
Registrant and Jack Pacheco
|
|
|
10.17.1
|
**
|
|
Section 409A Amendment dated December 18, 2008 to
Employment Agreement of Jack Pacheco
|
|
|
10.18
|
**
|
|
Employment Agreement dated January 7, 2008 between the
Registrant and Seth Rosen
|
|
|
10.18.1
|
**
|
|
Section 409A Amendment dated December 18, 2008 to
Employment Agreement of Seth Rosen
|
|
|
10.19
|
**
|
|
Employment Agreement dated March 2, 2006 between the
Registrant and W. Antony Besso
|
|
|
10.19.1
|
**
|
|
Addendum dated November 26, 2007 to Employment Agreement of
W. Antony Besso
|
|
|
10.19.2
|
**
|
|
Bonus Agreement dated December 13, 2008 between the
Registrant and W. Antony Besso
|
|
|
10.20
|
*
|
|
Executive Bonus Plan
|
|
|
10.21
|
|
|
Form of Warrant
|
|
|
10.22
|
|
|
Schedule of warrants substantially identical in all material
respects to the Form of Warrant
|
|
|
21.1
|
**
|
|
Subsidiaries of the Registrant
|
|
|
23.1
|
|
|
Consent of Ernst & Young LLP, Independent Registered
Public Accounting Firm
|
|
|
23.2
|
*
|
|
Consent of Davis Polk & Wardwell LLP (included in
Exhibit 5.1)
|
|
|
24.1
|
**
|
|
Power of Attorney (included on signature page)
|
|
|
99.1
|
|
|
Consent of Dustin G. Smith to being named as a director nominee
|
|
|
99.2
|
|
|
Consent of Brian S. Graff to being named as a director nominee
|
|
|
99.3
|
|
|
Consent of Michael T. Everett to being named as a director
nominee
|
|
|
99.4
|
|
|
Consent of Earl R. Lewis to being named as a director nominee
|
|
|
99.5
|
|
|
Consent of Alfred E. Barry, Jr. to being named as a director
nominee
|
|
|
|
|
* |
|
To be filed by amendment. |
|
** |
|
Previously filed. |