Attached files
Table of Contents
UNITED STATES
SECURITIES AND EXCHANGE COMMISSION
WASHINGTON, D.C. 20549
Form 10-K
ANNUAL REPORT PURSUANT TO SECTION 13 OR 15(D) OF THE SECURITIES EXCHANGE ACT OF 1934
For the fiscal year ended December 31, 2009
Commission file number 000-33047
MAX CAPITAL GROUP LTD.
(Exact name of registrant as specified in its charter)
| Bermuda | 98-0584464 | |
| (State of or other jurisdiction of incorporation or organization) |
(I.R.S. Employer Identification No.) |
Max House
2 Front Street
Hamilton, HM 11
Bermuda
(441) 295-8800
(Address and telephone number, including area code, of registrant’s principal executive offices)
Securities Registered Pursuant to Section 12(b) of the Act:
Common Shares, Par Value $1.00 per share
Name of each exchange on which registered
The NASDAQ Stock Market LLC
Securities Registered Pursuant to Section 12(g) of the Act:
None
Indicate by check mark if the registrant is a well-known seasoned issuer, as defined in Rule 405 of the Securities Act. Yes x No ¨
Indicate by check mark if the registrant is not required to file reports pursuant to Section 13 or Section 15(d) of the Act. Yes ¨ No x
Indicate by check mark whether the registrant (1) has filed all reports required to be filed by Section 13 or 15(d) of the Securities Exchange Act of 1934 during the preceding 12 months (or for such shorter period that the registrant was required to file such reports), and (2) has been subject to such filing requirements for the past 90 days. Yes x No ¨
Indicate by check mark whether the registrant has submitted electronically and posted on its corporate Web site, if any, every Interactive Data File required to be submitted and posted pursuant to Rule 405 of Regulation S-T (§ 232.405 of this chapter) during the preceding 12 months (or for such shorter period that the registrant was required to submit and post such files). Yes ¨ No ¨
Indicate by check mark if disclosure of delinquent filers pursuant to Item 405 of Regulation S-K is not contained herein, and will not be contained, to the best of registrant’s knowledge, in any definitive proxy or information statements incorporated by reference in Part III of this Form 10-K or any amendment to this Form 10-K. ¨
Indicate by check mark whether the registrant is a large accelerated filer, an accelerated filer, a non-accelerated filer or a smaller reporting company. See definition of “accelerated filer”, “large accelerated filer” and “smaller reporting company” in Rule 12b-2 of the Exchange Act.
Large accelerated filer x Accelerated filer ¨ Non-accelerated filer ¨ Smaller reporting company ¨
Indicate by check mark whether the registrant is a shell company (as defined in Rule 12b-2 of the Act.). Yes ¨ No x
The aggregate market value of the voting and non-voting common equity held by non-affiliates of the registrant as of June 30, 2009 was $849,659,177, based on the closing price of the registrant’s common shares on June 30, 2009, the last business day of the registrant’s most recently completed second fiscal quarter. Solely for the purpose of this calculation and for no other purpose, the non-affiliates of the registrant are assumed to be all shareholders of the registrant other than (i) directors of the registrant, (ii) executive officers of the registrant who are identified as “named executive officers” pursuant to Item 11 of this Form 10-K, (iii) any shareholder that beneficially owns 10% or more of the registrant’s common shares and (iv) any shareholder that has one or more of its affiliates on the registrant’s board of directors. Such exclusion is not intended, nor shall it be deemed, to be an admission that such persons are affiliates of the registrant.
The number of shares of the registrant’s common shares outstanding as of January 31, 2010 was 55,867,125.
DOCUMENTS INCORPORATED BY REFERENCE:
Portions of the proxy statement for the registrant’s 2010 annual meeting of shareholders, to be filed subsequently with the Securities and Exchange Commission, or SEC, pursuant to Regulation 14A, are incorporated by reference in Part III of this Annual Report on Form 10-K.
Table of Contents
| Page | ||||
| 1 | ||||
| ITEM 1. |
BUSINESS | 1 | ||
| ITEM 1A |
RISK FACTORS | 21 | ||
| ITEM 1B |
UNRESOLVED STAFF COMMENTS | 45 | ||
| ITEM 2. |
PROPERTIES | 47 | ||
| ITEM 3. |
LEGAL PROCEEDINGS | 47 | ||
| ITEM 4. |
SUBMISSION OF MATTERS TO A VOTE OF SECURITY HOLDERS | 47 | ||
| 49 | ||||
| ITEM 5. |
49 | |||
| ITEM 6. |
51 | |||
| ITEM 7. |
MANAGEMENT’S DISCUSSION AND ANALYSIS OF FINANCIAL CONDITION AND RESULTS OF OPERATIONS |
52 | ||
| ITEM 7A. |
94 | |||
| ITEM 8. |
95 | |||
| ITEM 9. |
CHANGES IN AND DISAGREEMENTS WITH ACCOUNTANTS ON ACCOUNTING AND FINANCIAL DISCLOSURE |
95 | ||
| ITEM 9A. |
95 | |||
| ITEM 9B. |
96 | |||
| 97 | ||||
| ITEM 10. |
DIRECTORS AND EXECUTIVE OFFICERS OF THE REGISTRANT AND CORPORATE GOVERNANCE |
97 | ||
| ITEM 11. |
97 | |||
| ITEM 12. |
SECURITY OWNERSHIP OF CERTAIN BENEFICIAL OWNERS AND MANAGEMENT AND RELATED STOCKHOLDER MATTERS |
97 | ||
| ITEM 13. |
CERTAIN RELATIONSHIPS AND RELATED TRANSACTIONS, AND DIRECTOR INDEPENDENCE |
97 | ||
| ITEM 14. |
97 | |||
| 98 | ||||
| ITEM 15. |
EXHIBITS AND FINANCIAL STATEMENT SCHEDULES | 98 | ||
Table of Contents
Unless otherwise indicated or unless the context otherwise requires, all references in this Annual Report on Form 10-K to the Company “we,” “us,” “our” and similar expressions are references to Max Capital Group Ltd. and its consolidated subsidiaries. Unless otherwise indicated or unless the context otherwise requires, all references in this annual report to entity names are as set forth in the following table:
| Reference |
Entity’s legal name |
Direct parent company | ||
| Max Capital |
Max Capital Group Ltd. |
|||
| Max Bermuda |
Max Bermuda Ltd. |
Max Capital Group Ltd. | ||
| Max Europe |
Collectively: Max Europe Holdings Limited, Max Re Europe Limited and Max Insurance Europe Limited |
|||
| Max Europe Holdings |
Max Europe Holdings Limited |
Max Bermuda Ltd. | ||
| Max Re Europe |
Max Re Europe Limited |
Max Europe Holdings Limited | ||
| Max Insurance Europe |
Max Insurance Europe Limited |
Max Europe Holdings Limited | ||
| Max Diversified |
Max Diversified Strategies Ltd. |
Max Bermuda Ltd. | ||
| Max Managers |
Max Managers Ltd. |
Max Capital Group Ltd. | ||
| Max USA |
Max USA Holdings Ltd. |
Max Capital Group Ltd. | ||
| Max Specialty |
Max Specialty Insurance Company |
Max USA Holdings Ltd. | ||
| Max America |
Max America Insurance Company |
Max Specialty Insurance Company | ||
| Max Specialty Services |
Max Specialty Insurance Services Ltd. |
Max USA Holdings Ltd. | ||
| Max California |
Max California Insurance Services Ltd. |
Max Specialty Insurance Services Ltd. | ||
| Max Managers USA |
Max Managers USA Ltd. |
Max USA Holdings Ltd. | ||
| Max UK |
Max UK Holdings Ltd. |
Max Capital Group Ltd. | ||
| Max at Lloyd’s |
Max at Lloyd’s Ltd. |
Max UK Holdings Ltd. | ||
| Max UK Underwriting |
Max UK Underwriting Services Ltd. |
Max UK Holdings Ltd. | ||
| Max Denmark |
Max Denmark ApS |
Max UK Holdings Ltd. | ||
| MCC2L |
Max Corporate Capital 2 Ltd. |
Max UK Holdings Ltd. | ||
| MCC3L |
Max Corporate Capital 3 Ltd. |
Max UK Holdings Ltd. | ||
| MCC4L |
Max Corporate Capital 4 Ltd. |
Max UK Holdings Ltd. | ||
| MCC5L |
Max Corporate Capital 5 Ltd. |
Max UK Holdings Ltd. | ||
| MCC6L |
Max Corporate Capital 6 Ltd. |
Max UK Holdings Ltd. | ||
| Max Corporate Capital Vehicles |
Collectively: MCC2L, MCC3L, MCC4L, MCC5L and MCC6L |
|||
| Max Singapore |
Max Singapore Insurance Managers Pte. Ltd. |
Max Denmark ApS | ||
| Max Brazil |
Max Brasil Serviços Técnicos Limitada |
Max at Lloyd’s Ltd. | ||
| MCS Ireland |
Max Capital Services Limited |
Max Capital Group Ltd. | ||
| MCS USA |
Max Capital Services USA LLC |
Max Capital Services Limited | ||
| MCS BDA |
Max Capital Services BDA Ltd. |
Max Capital Services Limited | ||
| MCS UK |
Max Capital Services UK Ltd. |
Max Capital Services Limited | ||
| Danish Re |
Danish Re (UK) Group Limited |
Max UK Holdings Ltd. |
We consider Max Bermuda, Max Re Europe, Max Insurance Europe, Max Specialty, Max America and Max at Lloyd’s to be the operating subsidiaries of Max Capital. All other subsidiaries are either holding companies or companies providing services to the operating companies.
Certain terms and financial measures used below are in accordance with U.S. generally accepted accounting principles, or U.S. GAAP. Certain terms and non-GAAP financial measures used below are defined in the “Glossary of Selected Insurance Industry Terms and non-GAAP financial measures” appearing on page 45 of this Form 10-K. We have included certain non-GAAP financial measures in this Form 10-K within the meaning of Regulation G. We have generally provided these financial measurements in previous filings
1
Table of Contents
and we believe that these measurements are important to investors and other interested parties, and that investors and such other persons benefit from having a consistent basis of comparison with other companies within the insurance industry. These measures may not be comparable to similarly titled measures used by companies outside the insurance industry. Investors are cautioned not to place undue reliance on these non-GAAP measures in assessing our overall financial performance.
Safe Harbor Disclosure
This Form 10-K contains forward-looking statements within the meaning of Section 27A of the Securities Act of 1933 and Section 21E of the Securities Exchange Act of 1934. We intend that the “safe harbor” provisions of the Private Securities Litigation Reform Act of 1995 apply to these forward-looking statements. Forward-looking statements are not statements of historical fact but rather reflect our current expectations, estimates and predictions about future results and events.
These statements may use words such as “anticipate,” “believe,” “estimate,” “expect,” “intend,” “predict,” “project” and similar expressions as they relate to us or our management. When we make forward-looking statements, we are basing them on management’s beliefs and assumptions, using information currently available to us. These forward-looking statements are subject to risks, uncertainties and assumptions. Factors that could cause such forward-looking statements not to be realized (which are described in more detail included or incorporated by reference herein and in documents filed by us with the SEC) include, but are not limited to:
| • | claims development; |
| • | cyclical trends, general economic conditions and conditions specific to the reinsurance and insurance markets in which we operate; |
| • | pricing competition; |
| • | rating agency policies and practices; |
| • | catastrophic events; |
| • | the amount of underwriting capacity from time to time in the market; |
| • | material fluctuations in interest rates and inflation; |
| • | unexpected volatility associated with investments; |
| • | tax and regulatory changes and conditions; and |
| • | loss of key executives. |
Other factors such as changes in U.S. and global equity and debt markets resulting from general economic conditions, market disruptions and significant interest rate fluctuations, foreign exchange rate fluctuations and changes in credit spreads may adversely impact our business or impede our access to, or increase the cost of, financing our operations. We caution that the foregoing list of important factors is not intended to be, and is not, exhaustive. We undertake no obligation to update or revise publicly any forward-looking statements, whether as a result of new information, future events or otherwise. If one or more risks or uncertainties materialize, or if our underlying assumptions prove to be incorrect, actual results may vary materially from what we projected. Any forward-looking statements in this Form 10-K reflect our current view with respect to future events and are subject to these and other risks, uncertainties and assumptions relating to our operations, results of operations, growth strategy and liquidity. All subsequent written and oral forward-looking statements attributable to us or individuals acting on our behalf are expressly qualified in their entirety by this safe harbor disclosure.
2
Table of Contents
Generally, our policy is to communicate events that we believe may have a material adverse impact on the Company’s operations or financial position, including property and casualty catastrophic events and material losses in our investment portfolio, in a timely manner through a public announcement. It is also our policy not to make public announcements regarding events that we believe have no material impact on the Company’s operations or financial position based on management’s current estimates and available information, other than through regularly scheduled calls, press releases or filings.
General Description
We are a Bermuda headquartered global provider of specialty insurance and reinsurance products for the property and casualty market, with underwriting operations based in Bermuda, Ireland, the United States and the United Kingdom. We underwrite a diversified portfolio of risks and serve clients ranging from Fortune 1000 companies to small owner-operated businesses. We also provide reinsurance for the life and annuity market when attractive opportunities arise.
In the fourth quarter of 2009 we expanded our underwriting operations to Latin America, where we intend to start providing reinsurance products in 2010, placing the risks in our Max at Lloyd’s and Max Re Europe platforms.
We have $1,564.6 million in consolidated shareholders’ equity as of December 31, 2009. Our principal operating subsidiary is Max Bermuda. We conduct our non-Lloyd’s European activities through Max Europe Holdings Limited and its two operating subsidiaries, Max Re Europe and Max Insurance Europe. We conduct our U.S. operations through Max USA and its operating subsidiaries, Max Specialty and Max America. Our United Kingdom Lloyd’s operations are conducted through Max UK and its operating subsidiary Max at Lloyd’s. We hold all material other investments in Max Diversified. We house certain personnel and assets within our global service companies which we believe improves the efficiency of certain corporate services across the group. The global service companies comprise MCS Ireland and its three wholly-owned subsidiaries, MCS Bermuda, MCS USA and MCS UK.
To manage our insurance and reinsurance liability exposure, make our investment decisions and assess our overall enterprise risk, we model our underwriting and investing activities on an integrated basis for all of our non-Lloyd’s operations, with full integration of our Max at Lloyd’s platform expected by the second quarter of 2010. Our integrated risk management, as well as terms and conditions of our products, provides flexibility in making decisions regarding investments. Our investments comprise three high grade fixed maturity portfolios (one held for trading, one held as available for sale, the other held to maturity) and a diversified hedge fund portfolio. Our investment portfolio is designed to provide diversification and to generate positive returns while attempting to reduce the frequency and severity of credit losses. Based on carrying values at December 31, 2009, the allocation of invested assets was 94.0% in cash and fixed maturities and 6.0% in other investments.
3
Table of Contents
Business Segments
We operate in five segments: the Bermuda/Dublin insurance segment, the Bermuda/Dublin reinsurance segment, the U.S. specialty segment, the Max at Lloyd’s segment and the life and annuity reinsurance segment. The table below sets forth gross premiums written by type of risk for the years ended December 31, 2009, 2008 and 2007.
| 2009 | 2008 | 2007 | ||||||||||||||||
| Gross Premiums Written |
Percentage of Total Premiums Written |
Gross Premiums Written |
Percentage of Total Premiums Written |
Gross Premiums Written |
Percentage of Total Premiums Written |
|||||||||||||
| (in thousands) | (in thousands) | (in thousands) | ||||||||||||||||
| Bermuda/Dublin Insurance: |
||||||||||||||||||
| Aviation |
$ | 69,834 | 5.1 | % | $ | 53,034 | 4.2 | % | $ | 40,934 | 3.8 | % | ||||||
| Excess Liability |
113,767 | 8.3 | 123,490 | 9.8 | 131,515 | 12.2 | ||||||||||||
| Professional Liability |
179,904 | 13.1 | 159,140 | 12.7 | 157,450 | 14.6 | ||||||||||||
| Property |
64,262 | 4.6 | 53,704 | 4.3 | 53,027 | 4.9 | ||||||||||||
| Total Bermuda/Dublin Insurance |
427,767 | 31.1 | 389,368 | 31.0 | 382,926 | 35.5 | ||||||||||||
| Bermuda/Dublin Reinsurance: |
||||||||||||||||||
| Agriculture |
89,550 | 6.5 | 80,454 | 6.4 | 985 | 0.1 | ||||||||||||
| Aviation |
34,715 | 2.5 | 31,555 | 2.5 | 34,095 | 3.1 | ||||||||||||
| General Casualty |
29,185 | 2.1 | 10,165 | 0.8 | 16,716 | 1.6 | ||||||||||||
| Marine and Energy |
18,321 | 1.3 | 12,769 | 1.0 | 47,077 | 4.4 | ||||||||||||
| Medical Malpractice |
67,483 | 4.9 | 77,133 | 6.2 | 53,138 | 4.9 | ||||||||||||
| Other |
2,297 | 0.2 | 1,934 | 0.2 | 6,031 | 0.6 | ||||||||||||
| Professional Liability |
71,531 | 5.2 | 38,718 | 3.1 | 33,640 | 3.1 | ||||||||||||
| Property |
87,039 | 6.4 | 99,280 | 7.9 | 89,197 | 8.3 | ||||||||||||
| Whole Account |
11,456 | 0.9 | 12,906 | 1.0 | 15,080 | 1.4 | ||||||||||||
| Workers’ Compensation |
77,451 | 5.6 | 54,595 | 4.4 | 49,197 | 4.5 | ||||||||||||
| Total Bermuda/Dublin Reinsurance |
489,028 | 35.6 | 419,509 | 33.5 | 345,156 | 32.0 | ||||||||||||
| U.S. Specialty: |
||||||||||||||||||
| General Casualty |
87,782 | 6.5 | 59,838 | 4.8 | 12,302 | 1.2 | ||||||||||||
| Marine |
61,360 | 4.5 | 38,667 | 3.1 | 1,220 | 0.1 | ||||||||||||
| Professional Liability |
576 | 0.0 | — | — | — | — | ||||||||||||
| Property |
135,760 | 9.8 | 95,848 | 7.6 | 34,721 | 3.2 | ||||||||||||
| Total U.S. Specialty |
285,478 | 20.8 | 194,353 | 15.5 | 48,243 | 4.5 | ||||||||||||
| Max at Lloyd’s (1): |
||||||||||||||||||
| Accident and Health |
22,602 | 1.6 | 408 | 0.0 | — | — | ||||||||||||
| Aviation |
2,611 | 0.2 | — | — | — | — | ||||||||||||
| Financial Institutions |
23,822 | 1.7 | 4,062 | 0.3 | — | — | ||||||||||||
| Professional Liability |
19,889 | 1.4 | 2,928 | 0.3 | — | — | ||||||||||||
| Property |
60,049 | 4.4 | 1,446 | 0.1 | — | — | ||||||||||||
| Total Max at Lloyd’s |
128,973 | 9.3 | 8,844 | 0.7 | — | — | ||||||||||||
| Aggregate Property and Casualty |
$ | 1,331,246 | 96.8 | % | $ | 1,012,074 | 80.7 | % | $ | 776,325 | 72.0 | % | ||||||
| Life and Annuity Reinsurance: |
||||||||||||||||||
| Annuity |
$ | — | — | $ | 239,555 | 19.1 | % | $ | 299,261 | 27.8 | % | |||||||
| Health |
— | — | — | — | 29 | 0.0 | ||||||||||||
| Life |
43,755 | 3.2 | 2,621 | 0.2 | 2,671 | 0.2 | ||||||||||||
| Total Life and Annuity Reinsurance |
$ | 43,755 | 3.2 | % | $ | 242,176 | 19.3 | % | $ | 301,961 | 28.0 | % | ||||||
| Aggregate Property and Casualty, and Life and Annuity |
$ | 1,375,001 | 100.0 | % | $ | 1,254,250 | 100.0 | % | $ | 1,078,286 | 100.0 | % | ||||||
| (1) | The results of operations for our Max at Lloyd’s segment are consolidated from November 6, 2008, the date Max at Lloyd’s was acquired. |
4
Table of Contents
| 2009 | 2008 | 2007 | ||||||||||||||||
| Gross Premiums Written |
Percentage of Total Premiums Written |
Gross Premiums Written |
Percentage of Total Premiums Written |
Gross Premiums Written |
Percentage of Total Premiums Written |
|||||||||||||
| (in thousands) | (in thousands) | (in thousands) | ||||||||||||||||
| Short tail lines |
$ | 648,400 | 48.7 | % | $ | 469,099 | 46.4 | % | $ | 307,287 | 39.6 | % | ||||||
| Long tail lines |
682,846 | 51.3 | 542,975 | 53.6 | 469,038 | 60.4 | % | |||||||||||
| Aggregate Property and Casualty |
$ | 1,331,246 | 100.0 | % | $ | 1,012,074 | 100.0 | % | $ | 776,325 | 100.0 | % | ||||||
Short tail lines are those lines of business which generally have a short claims pay-out period. Long tail lines are those which generally have a long claims pay-out period. We consider our short tail lines of business to include aviation, property, agriculture, marine and energy, accident and health, and other. We consider our long tail lines to include excess liability, professional liability, general casualty, medical malpractice, whole account, workers’ compensation, and financial institutions.
Additional information about our business segments is set forth in Item 7—Management’s Discussion and Analysis and Note 21 to our audited consolidated financial statements included herein.
For our property and casualty businesses, the majority of our clients are insurers, reinsurers and companies located in North America. During the years ended December 31, 2009, 2008 and 2007, we derived approximately 78.5%, 81.0% and 75.4%, respectively, of property and casualty gross premiums written from clients located in North America. We also source business outside North America, predominantly in Europe, which represented approximately 13.6%, 13.8% and 19.1% of gross premiums written for the years ended December 31, 2009, 2008 and 2007, respectively. Gross premiums written associated with the rest of the world represented approximately 7.9%, 5.2% and 5.5% for the years ended December 31, 2009, 2008 and 2007, respectively.
For our life and annuity business, our clients are insurers, reinsurers and companies located in either Europe or North America. During the year ended December 31, 2009, we derived all of our life and annuity gross premiums written from clients in North America. During the years ended December 31, 2008 and 2007, we derived approximately 98.9%, and 99.0% respectively, of our life and annuity gross premiums written from clients located in Europe, principally Ireland.
Description of Business
Bermuda/Dublin Insurance
Our Bermuda/Dublin insurance segment offers professional lines, excess liability, aviation and property insurance products, primarily to Fortune 1000 companies. Our excess liability products include excess umbrella liability insurance, excess product liability insurance, excess medical malpractice insurance and excess product recall insurance. Our professional lines products include errors and omissions insurance, employment practices liability insurance and directors and officers insurance. Our insurance products are underwritten in Bermuda and Ireland. We underwrite our insurance products on an individual risk basis, which, in many cases, includes holding an in-person meeting with the client in Bermuda or Ireland.
Bermuda/Dublin Reinsurance
Our Bermuda/ Dublin reinsurance segment offers excess of loss and quota share, also known as proportional or pro rata, products in the property and casualty reinsurance market. Generally, we participate on reinsurance treaties with a number of other reinsurers, each with an allocated portion of the treaty and whereby the terms and conditions of the treaty are substantially the same for each reinsurer participating. Our balance between long tail business and short tail business can shift based on the opportunities available in those markets.
5
Table of Contents
Starting in 2010, we expect to provide reinsurance to clients in Latin America through Max Re Europe, which is establishing a representative office in Bogota, Colombia.
We typically write our Bermuda/Dublin reinsurance products in the form of treaty reinsurance contracts, which are contractual arrangements that provide for automatic reinsuring of a type or category of risk underwritten by our clients. With treaty reinsurance contracts, we do not separately evaluate each of the individual risks assumed under the contracts and are largely dependent on the individual underwriting decisions made by the ceding client. Accordingly, we review and analyze the ceding client’s risk management and underwriting practices in deciding whether to provide treaty reinsurance and in our pricing of the treaty reinsurance contract.
With respect to excess of loss reinsurance, we indemnify the ceding client against all or a specified portion of losses and expenses in excess of a specified dollar or percentage amount. With respect to quota share reinsurance, we share the premiums as well as the losses and expenses in an agreed proportion with the ceding client. In both types of contracts, we may provide a ceding commission to the client. Our reinsurance products may include features such as contractual provisions that require our client to share in a portion of losses resulting from its ceded risks, may require payment of additional premium amounts if we incur greater losses than those projected at the time of the execution of the contract, may require reinstatement premium to restore the coverage after there has been a loss occurrence or may provide for refunds if the losses we incur are less than those projected at the time the contract is executed.
During the years ended December 31, 2009, 2008 and 2007, we wrote $239.0 million, $257.8 million and $255.9 million, respectively, or 48.9%, 61.5% and 74.2%, respectively, of Bermuda/Dublin reinsurance gross premiums on an excess of loss basis and $250.0 million, $161.7 million and $89.2 million, respectively, or 51.1%, 38.5% and 25.8%, respectively, of Bermuda/Dublin reinsurance gross premiums on a quota share basis.
U.S. Specialty
We offer property, general casualty, inland marine, ocean marine, and professional liability (which commenced writing business towards the end of 2009) insurance products to small- to medium-sized companies in the United States. We operate in the excess and surplus lines market through Max Specialty, and in the admitted insurance market through Max America. Excess and surplus lines insurance is a segment of the U.S. insurance market that allows consumers to buy property and casualty insurance through non-admitted carriers. Risks placed in the excess and surplus lines insurance market are often insurance programs that cannot be filled in the conventional insurance markets due to a shortage of state-regulated insurance capacity. This market has significant flexibility regarding insurance rate and form, enabling us to utilize our underwriting expertise to develop customized insurance solutions for our clients.
Max Specialty is licensed in Delaware and is approved to write excess and surplus business on a non-admitted basis in all other states along with Puerto Rico and the U.S. Virgin Islands. Max America is domiciled in Indiana and licensed to write business on an admitted basis in all 50 states plus the District of Columbia.
Max at Lloyd’s
Our Max at Lloyd’s segment operates through Max at Lloyd’s, which is the managing agent for Syndicates 1400, 2525 and 2526, which we collectively refer to as, the Syndicates. Max at Lloyd’s, through the Syndicates, underwrites a diverse portfolio of specialty risks. Syndicate 1400 offers property reinsurance, aviation insurance, accident and health insurance and reinsurance, and financial institutions insurance products (and starting in 2010, international casualty reinsurance). Syndicate 2525 offers employers’ and public liability insurance products. Syndicate 2526 specializes in professional liability and medical
6
Table of Contents
malpractice insurance products. We include Syndicate 2525 and 2526 lines of business in professional lines in the table above. The Syndicates operate in the Lloyd’s market, the world’s oldest specialty insurance marketplace. We believe this segment complements our specialty insurance underwriting capabilities and extends our ability to write business in multiple jurisdictions around the world.
Starting in 2010, we expect to provide reinsurance to clients in Latin America through Max at Lloyd’s, operating locally in Rio de Janeiro, Brazil, using Lloyd’s admitted status.
Life and Annuity Reinsurance
Our life and annuity reinsurance products focus on existing blocks of business and typically take the form of co-insurance structures, where the risk is generally reinsured on the same basis as that of the original policy. In a co-insurance transaction, we receive a percentage of the gross premium charged to the policyholder by the client, less an expense allowance that we grant to the client, as the primary insurer. By accepting the transfer of liabilities and the related assets from our clients in these co-insurance transactions, we seek to enable these clients to achieve capital relief and improved returns on equity. We seek to write life and annuity reinsurance agreements with respect to individual and group disability, whole life, universal life, corporate owned life, term life, fixed annuities, annuities in payment and structured settlements. We do not write any variable annuity products.
The life reinsurance risks that we underwrite include mortality and investment risks and, to a lesser extent, early surrender and lapse risks. The annuity products that we underwrite include longevity and investment risks. The disability products that we underwrite include investment risk and, to a lesser extent, morbidity risk and longevity risk. Mortality risk measures the sensitivity of the insurance company’s liability to higher mortality rates than were assumed in setting the premium. Longevity risk measures the sensitivity of the insurance company’s liability to future mortality improvement being greater than expected. Morbidity risk measures the sensitivity of the insurance company’s liability for higher illness, sickness and disease rates than were assumed in setting the premium. Early surrender and lapse risks measure the sensitivity of the insurance company’s liability to early or changing policy surrender distributions.
Pricing of our life and annuity reinsurance products is based on actuarial models that incorporate a number of factors, including assumptions based on industry mortality, longevity and morbidity tables, expenses, demographics, persistency, investment returns, certain macroeconomic factors, such as inflation, and certain regulatory factors, such as taxation and minimum surplus requirements.
Underwriting and Risk Management
We attempt to manage our underwriting exposures in the property and casualty markets by diversifying across many underlying insureds with small policy limits per insured. With respect to our life and annuity reinsurance segment, we seek to reinsure blocks of business that have small underlying policy limits spread across a large population of insureds.
The difference between premium volume and potential ultimate losses is smaller for our long tail business than for our short tail business. Short tail business represents approximately 48.7% of our property and casualty premium volume in the current year. Furthermore, we believe our casualty business is less susceptible to the aggregation of losses from one or two major events. Our short tail catastrophe exposed business comprises mostly our property, agriculture, aviation and marine and energy products in both insurance and reinsurance, which are susceptible to large catastrophe events that may trigger losses to a number of our cedants. As a result, we believe our short tail catastrophe exposed business is our largest exposure in terms of potential adverse earnings impact from a single event or series of events. We have established a corporate
7
Table of Contents
policy of limiting the maximum impact of a catastrophe event or series of catastrophe events on our short tail catastrophe exposed business to 20% of opening shareholders’ equity on an annual basis for a modeled 1 in 250 year event.
We seek to reduce the volatility arising out of the underlying risks assumed through our written business by setting and maintaining contractual features that may include overall aggregate limits on liabilities, sub-limits on liabilities and attachment points for liabilities. Additionally, we seek to manage our property catastrophe reinsurance aggregation risk by utilizing internally developed catastrophe models that are based upon the results of commercially available products provided by companies such as Risk Management Solutions, Inc. and AIR Worldwide Corporation. Further protection against volatility and aggregation risk is obtained through the purchase of reinsurance as described under “Retrocessional and Balance Sheet Protections.”
We manage the duration, volatility and currency of our asset mix in relation to our liabilities in an attempt to manage our overall risk. We believe that our portfolio of underwriting risks benefits from diversification and we tailor our investment strategy accordingly. Because we currently write predominantly traditional property and casualty insurance and reinsurance business, and as we have expanded our short tail business, in 2009 we decreased our other investment allocation to approximately 6% of total invested assets with the remaining invested assets allocated to cash and fixed maturities investments.
We use a series of proprietary and non-proprietary actuarial and financial models in order to analyze the underlying risk characteristics of our liabilities and assets. We conduct both contract-by-contract modeling as well as portfolio aggregation modeling and then analyze these modeled results on an integrated basis in an effort to determine the aggregation of our underwriting risk and investment risk and the ultimate impact that adverse events might have on our shareholders’ equity.
We utilize dynamic financial analysis to examine the possible effects of future variables, such as the effect of inflation on the cost of losses, using multiple scenarios to predict the range of outcomes and prices of our products. In addition, we attempt to manage capital adequacy by incorporating value at risk and risk based capital analyses into our modeling. Through the use of dynamic financial analysis, we seek to measure the risk inherent in each underwriting transaction as well as our overall asset and liability risk, and the potential for adverse scenarios producing projected losses and potential adverse cash flow. Additionally, by employing a risk based capital analysis rather than using premium income as a measure of risk, we are able to obtain an estimate of the amount of capital to be allocated to each transaction and our overall asset and liability portfolio. We believe that our actuarial analysis of loss payment patterns enables us to generate meaningful projections of the total and interim cash flows of our overall liability portfolios and use these projections to determine the profile of liquidity and investment returns required of our investment portfolio. We believe that this integrated approach allows us to optimize the use of our capital by providing a dynamic measurement of risk and return to evaluate competing reinsurance, insurance and investment opportunities.
Our underwriting and risk management processes and procedures described in this section and in the sections below continue to be expanded to include the Max at Lloyd’s segment. The integration of Max at Lloyd’s into our underwriting and risk management system is substantially complete, and is expected to be finalized by the second quarter of 2010. Max at Lloyd’s and the Syndicates are subject to stringent financial and regulatory oversight by the Financial Services Authority, or FSA, and the Society of Lloyd’s, including a quarterly filing to Lloyd’s by each syndicate. The integration of the Max at Lloyd’s underwriting process with our existing process is being gradually phased-in to all lines of business offered by our Max at Lloyd’s segment.
8
Table of Contents
We recognize the importance of information technology in supporting our business platform growth. We continue to develop and enhance our existing technology platforms to assist in our underwriting and risk management processes and procedures across all of our segments.
We perform due diligence as we believe appropriate on transactions that we consider underwriting and perform regular monitoring and periodic due diligence on the transactions that we complete. When we believe appropriate, we complement our internal skills with reputable third party service providers, including actuaries, attorneys, claim adjusters and other professionals. These third parties perform on-site client due diligence on our behalf, assist us in modeling transactions and provide legal advice on contract documentation.
Retrocessional and Balance Sheet Protections
As part of our underwriting process, we reinsure or retrocede portions of certain risks for which we have accepted liability. In these transactions, we cede to another counterparty reinsurer or retrocessionaire all or part of the risk that we have assumed. However, these arrangements do not legally discharge our liability with respect to the obligations that we have insured or reinsured. Like many other insurance and reinsurance companies, we cede risks to reinsurers and retrocessionaires for one or more of the following reasons:
| • | reduce net liability on individual risks; |
| • | protect against catastrophic losses; |
| • | manage volatility of underwriting ratios; |
| • | obtain additional underwriting capacity; and |
| • | enhance underwriting pricing margins. |
When we reinsure portions of risk, we utilize reinsurance arrangements, such as quota share reinsurance, excess of loss reinsurance and stop-loss reinsurance contracts that are available in the reinsurance and retrocessional market as a means to manage risk on the products that we write. In quota share reinsurance arrangements, the reinsurer or retrocessionaire shares a proportional part of our premiums and losses associated with the risks being reinsured. Under the terms of excess of loss reinsurance and stop-loss reinsurance, the reinsurer or retrocessionaire agrees to cover losses in excess of the amount of risk that we have retained, subject to negotiated limits. Our reinsurance strategy includes purchasing reinsurance to limit losses on a single risk or transaction and on a whole portfolio basis as the need arises. Generally, we will utilize quota share reinsurance for our casualty business in order to allow us to provide increased capacity to our clients while still meeting our internally governed maximum net exposure thresholds. During the year ended December 31, 2009, the largest component of our ceded reinsurance has been quota share treaty reinsurance, principally related to our insurance and U.S. specialty segments. Our underwriting policy is to retain a maximum net exposure of not more than 3% of our shareholders’ equity for any individual contract we write. For our property and aviation business, we purchase excess of loss reinsurance in order to reduce the volatility of our underwriting results. Our underwriting policy is to limit the maximum impact of a catastrophe event or series of catastrophe events on our short tail catastrophe exposed business to 20% of opening shareholders’ equity on an annual basis for a modeled 1 in 250 year event.
Credit Risk
Our reinsurance and retrocessional arrangements do not legally discharge our liability with respect to obligations that we have insured or reinsured. We remain liable with respect to the liabilities that we cede if a counterparty is unable to meet its obligations assumed under a reinsurance or retrocessional agreement. Accordingly, we evaluate and monitor the financial strength of each of our counterparties. Certain reinsurance and retrocessional agreements give us the right to receive additional collateral or to terminate the agreement in the event of deterioration in the financial strength of the counterparty.
9
Table of Contents
At December 31, 2009, 83.6% of our losses recoverable were with reinsurers rated “A” or above by A.M. Best Company and 5.3% are rated “A-”. Grand Central Re Limited, or Grand Central Re, a Bermuda domiciled reinsurance company in which Max Bermuda has a 7.5% equity investment, is our largest “NR—not rated” retrocessionaire and accounted for 10.1% of our losses recoverable at December 31, 2009. As security for outstanding loss obligations, we retain funds from Grand Central Re amounting to 108.0% of its loss recoverable obligations. The remaining 1.0% of losses recoverable are with “B+” or lower reinsurers.
Loss and Benefit Reserves
We establish and carry as liabilities an actuarially determined amount of loss reserves. These reserve amounts have been established to meet our estimated future obligations for losses and related expenses that have occurred relating to premiums we have earned. Future loss and benefit payments comprise the majority of our financial obligations. We use our own property and casualty and life and annuity actuaries as part of our loss reserving process, with the exception of our Max at Lloyd’s segment. In addition, we engage external independent actuaries to perform an annual review of our loss reserve estimates. For our Max at Lloyd’s segment, external independent actuaries are used by senior management to assist in the establishment of loss reserve estimates.
Loss and benefit reserves do not represent an exact calculation of our liability. The estimation of loss and benefit reserves is a complex process impacted by many external factors that affect the payment of losses and benefits. We apply the assumption that past experience (both industry and our own), adjusted for the effect of current developments and likely future trends, is an appropriate basis for estimating ultimate liabilities. The reserves presented represent our estimate of the expected cost of the ultimate settlement and administration of our claims and are based upon quantitative techniques overlaid with subjective considerations and managerial judgment.
In determining an initial reserve estimate, our actuaries utilize the underwriting information received when a transaction is negotiated. This data, when combined with our own experience on prior period or similar contracts, helps us to select the appropriate actuarial methods and assumptions that we use to create an initial pricing and reserving model. Initial assumptions include estimates of future trends in claims severity and frequency, mortality, judicial theories of liability and other factors. We regularly evaluate and update our initial loss development and trending factor selections using client specific and industry data. We also subscribe to industry publications to enable us to keep current with the latest industry trends. During the underwriting process, the client’s data is analyzed by our underwriting teams to ascertain its quality and credibility. This process may include an underwriting audit and claims audit of a client’s operations as well as inquiry of the insured or ceding company as to the trends and methodologies utilized in arriving at their estimates. In cases where we find the data initially provided by the client is not sufficient, we will utilize industry data that we have collected from either third party sources or from our own historical submission database to enhance the quality of the reserve model that is created.
On a quarterly basis, we perform a detailed review of our contracts and of the actuarial method utilized in arriving at reserve estimates and the related reinsurance recoverables. This review is performed by our corporate actuarial group, which is staffed by a team of qualified actuaries, on a contract by contract basis for our reinsurance segment, and on a portfolio basis for our insurance and U.S. specialty segments. The Max at Lloyd’s segment review is performed by external independent actuaries. The quarterly review utilizes the initial submission information updated by current premium, loss and claims data reported to us. The newly reported loss information from our clients is the principal contributor to changes in our loss reserve estimates. As part of this process, our actuaries validate that the actuarial method applied continues to be appropriate to allow us to form a sound basis for projection of future liabilities. In addition, our reserve estimates are reviewed annually by external actuaries in order to corroborate management’s estimates.
10
Table of Contents
Marketing
We believe that diversity in our sources of business reduces the potential adverse effects arising from the termination of any one of our business relationships. Our marketing plan calls for the development of relationships with brokers and potential clients that we or brokers believe have a need for reinsurance or insurance, based on regulatory filings, industry knowledge and market trends. A significant volume of premium for the insurance and reinsurance industry is produced through a small number of large intermediaries and brokerage firms. We have relationships with multiple key personnel in these companies and therefore expect to maintain strong working relationships in the future.
During the years ended December 31, 2009, 2008 and 2007, brokered transactions accounted for the majority of our property and casualty gross premiums written. During the years ended December 31, 2009, 2008 and 2007, the top three independent producing intermediaries and brokerage firms accounted for 25%, 11% and 7%; 18%, 16% and 10%; and 22%, 13% and 12%, respectively, of property and casualty gross premiums written.
Our life and annuity reinsurance segment generally writes a limited number of transactions in a year, with a potentially large variation in premium volume. As a result, the number of possible brokers used in a year is limited to the number of transactions written. During each of the years ended December 31, 2009, 2008 and 2007, the largest independent producing intermediary and brokerage firm accounted for 95%, 27% and 30% of life and annuity gross premiums written, respectively.
Potential credit risk associated with brokers and intermediaries is discussed in Item 1A—Risk Factors—The involvement of reinsurance brokers subjects us to their credit risk.
In addition, we attempt to capitalize on existing relationships with reinsurance and insurance companies, large global corporations and financial intermediaries to develop and underwrite business.
Overview of Investments
We seek to earn a superior risk-adjusted total return on our assets by engaging in an investment strategy that combines fixed maturities and other investments (principally hedge fund investments) and employs strategies intended to manage investment risk. We diversify our portfolio in an attempt to limit volatility and maintain adequate liquidity in our fixed maturities and other investments to fund operations and losses from unexpected events. We seek to manage our credit risk through industry and issuer diversification and interest rate risk by monitoring the duration and structure of the investment portfolio relative to the duration and structure of the liability portfolio. The finance and investment committee of our board of directors monitors the performance of our investment managers. The finance and investment committee also periodically reviews our investment guidelines in light of prevailing market conditions and amends them from time to time as it deems appropriate. Based on fair values at December 31, 2009, the allocation of invested assets was 94.0% in cash and fixed maturities and 6.0% in other investments.
11
Table of Contents
Aggregate Portfolio Results
The table below shows the annual total rate of return of our cash and fixed maturities portfolio, other investment portfolio and aggregate investment portfolio for the years ended December 31, 2009, 2008 and 2007 (1).
| Year Ended December 31, | |||||||||
| 2009 | 2008 | 2007 | |||||||
| Cash and Fixed Maturities Investments |
5.86 | % | 4.66 | % | 5.11 | % | |||
| Other Investments |
12.35 | % | (19.27 | )% | 16.97 | % | |||
| Aggregate Portfolio |
6.68 | % | (0.09 | )% | 10.38 | % | |||
| (1) | Annual total rate of return means the annual total rate of return calculated by compounding the 12 consecutive monthly rates of return that are calculated by dividing monthly net performance (comprising net investment income and realized and unrealized gains/losses) by the beginning net asset value of that month. One is then subtracted from the product and the result is multiplied by 100. |
This annual total rate of return information for our investment portfolio should not be relied upon as a representation of future results. Future results may vary and these variations may be significant.
Fixed Maturities Investments
Based on fair values at December 31, 2009, approximately 94.0% our total investment portfolio was invested in cash and fixed maturities. Our fixed maturities portfolio was managed by seven independent investment managers. Our fixed maturities investments comprise liquid, high quality securities. As of December 31, 2009, our fixed maturities investments had a dollar-weighted average rating of Aa1/AA+, an average duration of approximately 5.4 years and an average book yield to maturity of 4.69%. Including cash and cash equivalents, the average duration was approximately 4.7 as of December 31, 2009.
The investment strategy and guidelines for our fixed maturities investments emphasize diversification and preservation of principal. Under our current fixed maturities investment guidelines, securities in our fixed maturities portfolio, when purchased, must have a minimum rating of Baa3/BBB-, or its equivalent, from at least one internationally recognized statistical rating organization. We allow two of our investment managers (managing approximately 1.8% of our invested assets by fair value at December 31, 2009) to follow an opportunistic strategy, allowing them to purchase securities below investment-grade; however, no more than 10.0% of their holdings may be rated below B3/B-. In addition, a minimum weighted average credit quality rating of Aa2/AA, or its equivalent, must be maintained for our fixed maturities investment portfolio as a whole. Our fixed maturities investment guidelines also provide that we cannot leverage our fixed maturities investments.
During 2009 we implemented a strategy to hold certain fixed income securities to maturity. These securities are principally of long duration and match the more predictable cash flow requirements of our long term liabilities.
Our cash and fixed maturities investments, excluding those which are being held to maturity, provide liquidity for day-to-day operations. We believe that we will be able to satisfy our foreseeable cash needs from our cash and available for sale fixed maturities investments and we maintain significant cash and cash equivalent balances to reduce the likelihood of needing to sell fixed maturities investments before maturity.
Our investments are held by four different custodians. These custodians are all large financial institutions, which are highly regulated. These institutions have controls over their investment processes, which are certified annually.
Additional information about our fixed maturities investments can be found in Note 3 to our audited consolidated financial statements included herein.
12
Table of Contents
Other Investments
Overview. Other investments comprise the Company’s investment in hedge funds and the Company’s investment in Grand Central Re, a private equity investment. Together, the hedge funds and the private equity investment are referred to as the Company’s hedge fund portfolio.
Based on fair values at December 31, 2009, approximately 6.0% (Max Diversified—5.9% and reinsurance private equity—0.1%) of our investment portfolio was invested in our hedge fund portfolio. Max Diversified holds all of our hedge fund portfolio, other than a reinsurance private equity investment, which is held by Max Bermuda. Alstra Capital Management, LLC, an affiliate of one of our former directors and which we refer to as Alstra, served as fund advisor for Max Diversified from April 1, 2004 until January 31, 2009. With the reduction in the size of our hedge fund portfolio, we now manage our hedge funds internally. Early in 2009, we hired certain staff from Alstra and terminated our investment advisor agreement with Alstra.
As of December 31, 2009, Max Diversified was invested in 30 underlying trading entities representing the following investment strategies: Distressed Securities Investing, Diversified Arbitrage, Emerging Markets, Event Driven Arbitrage, Fixed Income Arbitrage, Global Macro, Long/Short Credit, Long/Short Equities and Opportunistic Investing. These strategies were selected because of their low correlation with the stock market, the bond market and each other. Our hedge fund portfolio investment guidelines also provide that Max Diversified may be invested in Commodities Trading and Merger Arbitrage.
In 2009, to better support our changing and growing underwriting platforms, we reduced our target allocation to the hedge fund portfolio to approximately 5-7% of total invested assets, down from the previous target range of 10-15% in 2008 and 15-25% in 2007. While our allocation to the hedge fund portfolio has been reduced, we expect it to remain an important component of our asset mix.
Our hedge fund portfolio investments are invested in accordance with our investment guidelines, which may be amended from time to time by our board of directors, or a committee thereof. Our investment guidelines currently mandate, among other things, that:
| • | at least five distinct hedge fund investment strategies must be employed at all times; |
| • | no more than 5.0% of the fair value of the hedge fund portfolio may be invested in any single underlying hedge fund; |
| • | no more than 10.0% of the fair value of the hedge fund portfolio may be allocated to any single hedge fund manager; and |
| • | monthly or quarterly liquidity must be available on 80.0% or more, by fair value, of the active hedge fund investments in our hedge fund portfolio, unless revised by the finance and investment committee. |
The above guidelines have been temporarily waived, where considered necessary, by the finance and investment committee as we executed our strategy of reducing our allocation to hedge funds. This waiver has been and will be reviewed on a quarterly basis by the finance and investment committee.
Since the termination of the management agreement with Alstra, we manage our hedge fund portfolio internally. Our internal portfolio managers may make discretionary investment determinations in accordance with our investment guidelines and in underlying strategies approved by the finance and investment committee of the board of directors.
Prior to October 1, 2008, Max Diversified paid Alstra a management fee of 70 basis points plus an incentive fee of 7.5% of the return in excess of a 10% threshold on the net asset value of the funds in which Max Diversified had invested. In October 2008, this fee
13
Table of Contents
was replaced with a flat management fee. Alstra was paid management fees of $0.7 million in 2009 (2008—$8.2 million). In addition, we paid Alstra a termination fee of $2.0 million in 2009.
Hedge Fund Portfolio Strategies. The following is a summary of the underlying strategies of funds in which we may invest:
Commodities Trading. Commodities trading advisors seek to make returns by trading futures, options and other securities in the over-the-counter market and on the regulated commodities exchanges.
Convertible Arbitrage. This strategy typically entails the simultaneous purchase of a convertible bond and a short sale of the underlying common stock, which results in an offsetting hedged position. This strategy generates returns from equity market volatility in either up or down directions. Income is also earned from the coupon interest payment on the convertible bond and from the short sale rebate, which is effectively interest paid on balances generated from the short sale of the underlying common stock. The principal risk of this strategy is a decline in the price of the convertible bond due to interest rate movements or credit quality changes that are not offset by an increase in the value of the corresponding common stock short position.
Distressed Securities. Funds that pursue a distressed investing strategy purchase securities of companies experiencing financial distress. Typically, these companies are engaged in out-of-court debt restructurings or bankruptcy proceedings.
Diversified Arbitrage. This strategy typically entails simultaneously pursuing a variety of market-neutral strategies such as convertible arbitrage and event-driven arbitrage. By combining multiple skill sets within the same fund, these managers are able to allocate resources from one market neutral strategy to another in an effort to focus opportunistically on the strategies that are perceived as offering the greatest potential for returns in any given environment.
Emerging Markets. Emerging market funds seek to generate returns by employing fundamental analysis of emerging market countries and investing in government and corporate securities of emerging market countries.
Event-Driven Arbitrage. This strategy typically entails the purchase of securities of a company involved in a significant corporate event. Event-driven arbitrage funds will typically employ merger arbitrage techniques along with additional arbitrage techniques for companies that are spinning off divisions, going through reorganizations or undergoing other significant corporate events.
Fixed Income Arbitrage. Fixed income arbitrage funds seek to make returns by arbitraging fixed income securities. Principal trading activities include making arbitrage trades based on aberrations in the yield curve, credit spreads or between sectors in the fixed maturities market, such as between mortgage backed securities and asset backed securities.
Global Macro. Funds that pursue a global macro strategy typically participate in directional trading of bonds, stocks and currencies in an attempt to take advantage of perceived changes in macroeconomic conditions. A global macro fund will typically buy or sell securities such as Treasury bills and government notes and bonds, corporate bonds, foreign currencies and common stocks of individual companies or futures contracts on stock indices such as the S&P 500 Index ®. A global macro fund typically purchases both securities, such as common stock or government bonds, as well as derivatives of these securities, including futures, forward contracts and options. The principal risk of this strategy is that funds pursuing the strategy may incorrectly predict macroeconomic trends.
14
Table of Contents
Long/Short Credit. Funds that pursue a long/short credit strategy seek opportunities to invest primarily in high grade, high yield and distressed fixed maturities based on the identification of imbalance in valuation and capital allocation across credit ratings, industry sectors and geographic regions.
Long/Short Equities. Funds that pursue a long/short strategy typically purchase common stock (go long) of companies in a particular sector with perceived strong fundamentals and sell common stock (go short) of companies in the same sector that are perceived to have deteriorating fundamentals. The strategy attempts to create investment returns through superior stock selection based upon fundamental analysis rather than creating returns based simply upon an upward price direction of the overall stock market. While this strategy can profit from either positive or negative price trends in the overall stock market, investment managers of long/short equity funds generally have a net long position and returns tend to benefit from upward movement in the stock market and be negatively affected by declines in the stock market. Funds that pursue this strategy generally purchase and sell common stock of publicly-traded companies.
Merger Arbitrage. This strategy typically entails the simultaneous purchase of common stock of a company being acquired or merged and a short sale of the common stock of the acquiring company.
Opportunistic. Our principal opportunistic investment focuses on investing in distressed loan portfolios. These loans tend to be collateralized by real estate and are typically purchased for a small fraction of the original loan amount. This strategy involves analysis of the value of the real estate collateral underlying each loan. The fund then attempts to reach an agreement with the debtor under each of the individual loans to satisfy the indebtedness for an amount greater than the purchase price of the loan. Securities purchased pursuant to this strategy are normally private debt obligations for which there is no public market.
Hedge Fund Portfolio. As of December 31, 2009 and 2008, the distribution of the hedge fund portfolio by investment strategy was:
| As of December 31, | ||||||||||||
| 2009 | 2008 | |||||||||||
| Fair Value | Allocation % | Fair Value | Allocation % | |||||||||
| (in thousands) | (in thousands) | |||||||||||
| Convertible arbitrage |
$ | — | — | % | $ | 10,650 | 1.4 | % | ||||
| Distressed securities |
62,897 | 20.0 | 115,900 | 15.4 | ||||||||
| Diversified arbitrage |
34,503 | 10.9 | 46,034 | 6.1 | ||||||||
| Emerging markets |
26,211 | 8.3 | 39,683 | 5.3 | ||||||||
| Event driven arbitrage |
41,724 | 13.3 | 75,205 | 9.9 | ||||||||
| Fixed income arbitrage |
14,351 | 4.6 | 30,881 | 4.1 | ||||||||
| Global macro |
34,299 | 10.9 | 87,304 | 11.6 | ||||||||
| Long/short credit |
9,426 | 3.0 | 38,581 | 5.1 | ||||||||
| Long/short equity |
85,901 | 27.3 | 290,224 | 38.5 | ||||||||
| Opportunistic |
2,765 | 0.8 | 14,746 | 2.0 | ||||||||
| Total hedge funds |
312,077 | 99.1 | 749,208 | 99.4 | ||||||||
| Reinsurance private equity |
2,772 | 0.9 | 4,450 | 0.6 | ||||||||
| Total other investments |
$ | 314,849 | 100.0 | % | $ | 753,658 | 100.0 | % | ||||
Cash and cash equivalent balances of $22.3 million and $133.4 million held within the hedge fund portfolio are excluded from the above table and are presented within cash and cash equivalents in our consolidated balance sheets at December 31, 2009 and 2008, respectively. Redemptions receivable of $79.1 million and $98.1 million held within the hedge fund portfolio are excluded from the above table and are presented within trades pending settlement in our consolidated balance sheets at December 31, 2009 and 2008, respectively. The cash and cash equivalent balances held within the hedge fund portfolio are included in the calculation of total return on the hedge fund portfolio.
15
Table of Contents
Additional information about the hedge fund portfolio can be found in Item 7—Management’s Discussion and Analysis – Financial Condition and Note 3 and Note 4 to our audited consolidated financial statements included herein.
Competition
The reinsurance and insurance industry is highly competitive. Competition in the types of business that we currently underwrite and intend to underwrite in the future is based principally on:
| • | premium rates; |
| • | ability to obtain terms and conditions appropriate with the risk being assumed and in accordance with underwriting guidelines; |
| • | the general reputation and perceived financial strength of the insurer or reinsurer; |
| • | relationships with reinsurance and insurance intermediaries; |
| • | ratings assigned by independent rating agencies; |
| • | speed of claims payment and administrative activities; and |
| • | experience in the particular line of insurance or reinsurance to be underwritten. |
We compete directly with numerous independent reinsurance companies, captive insurance companies, insurance companies, subsidiaries or affiliates of established insurance companies or newly formed companies, reinsurance departments of primary insurance companies and underwriting syndicates from countries throughout the world in our chosen product lines. Many of these competitors are well established, have significant operating histories and have developed longstanding customer relationships. We believe insurance and reinsurance capacity has increased during 2009, aided by the relatively few property catastrophe events and the positive impact on insurers/reinsurers’ investment portfolios of the improvement in the worldwide financial markets. We expect this to create downward pressure on premium rates in the short to medium term.
Ratings
Ratings are an important factor in establishing the competitive position of reinsurance and insurance companies and are important to our ability to market our products. We have a financial strength rating for our non-Lloyd’s reinsurance and insurance subsidiaries from each of A.M. Best Company, or A.M. Best, Fitch, Inc., or Fitch, Moody’s Investors Service, Inc., or Moody’s and Standard & Poor’s Rating Services, or S&P (see table below). These ratings reflect each rating agency’s opinion of our financial strength, operating performance and ability to meet obligations. They are not evaluations directed toward the protection of investors in securities issued by Max Capital.
As of December 31, 2009 and 2008, Max USA has outstanding $90.6 million and $91.5 million aggregate principal amount, respectively, of 7.20% senior notes due April 14, 2017. The senior notes are guaranteed by Max Capital. The senior notes were assigned a senior unsecured debt rating by A.M. Best, Fitch, Moody’s and S&P (see table below). The senior unsecured debt ratings assigned by rating agencies to reinsurance and insurance companies are based upon factors and criteria established independently by each rating agency. They are not an evaluation directed to investors in our senior notes, and are not a recommendation to buy, sell or hold our senior notes. These ratings are subject to periodic review by the rating agencies or may be revised downward or revoked at the sole discretion of the rating agencies.
16
Table of Contents
At December 31, 2009, we were rated as follows:
| A.M. Best |
Fitch |
Moody’s |
S&P | |||||
| Financial strength rating for non-Lloyd’s reinsurance and insurance subsidiaries |
A-(excellent)(1) |
A (strong)(1) |
A3(2) |
A- (1) | ||||
| Outlook on financial strength rating |
Positive(1) |
Negative(1) |
Negative(2) |
Stable (1) | ||||
| Senior notes senior unsecured debt rating(3) |
bbb- |
BBB+ |
Baa2 |
BBB | ||||
| Outlook on debt rating(3) |
Positive |
Negative |
Negative |
Stable | ||||
| Lloyd’s financial strength rating applicable to the Syndicates(4) |
A (excellent) |
A+ (strong) |
Not applicable |
A+ (strong) |
| (1) | Applicable to Max Bermuda, Max Specialty, Max America, Max Re Europe and Max Insurance Europe. |
| (2) | Applicable to Max Bermuda. |
| (3) | Applicable to Max USA. |
| (4) | Applicable to the Syndicates. |
Administration
We provide most of our own management and administrative services and establish and administer our loss reserves and policy benefits. Our underwriters, financial staff, chief operating officer and actuaries assist our claims personnel in performing traditional claims tasks such as monitoring claims and reserving. In addition, when we write highly specialized business, we from time to time hire third-party claims specialists to assist in evaluating loss exposure and establishing reserving practices and claims-paying procedures. Generally, we self-manage and administer the claims activity associated with our insurance and reinsurance operations and utilize both internal resources and external experts in the reserving and settlement of claims.
In connection with the administration of the life and annuity benefit payments of our clients’ primary insureds that are covered on certain reinsurance transactions, our company, together with the client, may select an independent third-party claims administrator. We and our client then enter into a contract with the third-party administrator that will typically contain a provision requiring a significant amount of advance notice in order to terminate the contract. We are responsible for the loss and benefit payment expense charged by the third party administrator.
Regulation
The principal jurisdictions of our operations are Bermuda, Ireland, the United Kingdom and the United States.
Bermuda
The Insurance Act 1978 of Bermuda and its related regulations, which we refer to collectively as the Bermuda Insurance Act, regulates the reinsurance and insurance business of Max Bermuda and the reinsurance and insurance management business of Max Managers. The Bermuda Insurance Act imposes solvency and liquidity standards and auditing and reporting requirements on Max Bermuda and grants to the Bermuda Monetary Authority powers to supervise, investigate and intervene in the affairs of Bermuda reinsurance and insurance companies. Max Bermuda is required to prepare annual statutory financial statements, file an annual statutory financial return and have its statutory reserves actuarially certified. Under the Bermuda Insurance Act, Max Bermuda is subject to risk-based capital requirements in addition to minimum solvency and liquidity
17
Table of Contents
requirements. The risk-based capital model determines a control threshold for statutory capital and surplus. If a company falls below the control level, various degrees of regulatory action may be taken by the Bermuda Monetary Authority. In addition, Max Capital, Max Bermuda, Max Managers and Max Diversified are each required to comply with the provisions of the Companies Act 1981 of Bermuda, which we refer to as the Bermuda Companies Act, regulating, among other things, the payment of dividends and making of distributions from contributed surplus.
Pursuant to the Bermuda Insurance Act, any person who becomes a holder of at least 10%, 20%, 33% or 50% of our common shares must notify the Bermuda Monetary Authority in writing within 45 days of becoming such a holder or 30 days from the date they have knowledge of having become such a holder, whichever is later. The Bermuda Monetary Authority has the power to object to a person holding 10% or more of our common shares if it appears to the Authority that the person is not fit and proper to be such a holder. In such a case, the Bermuda Monetary Authority may require the holder to reduce their shareholding in us and may direct, among other things, that the voting rights attaching to their common shares shall not be exercisable. A person that does not comply with such a direction from the Bermuda Monetary Authority will be guilty of an offense.
Ireland
Our Irish operating subsidiaries, Max Insurance Europe and Max Re Europe, are subject to regulation by the Irish Financial Services Regulatory Authority, or IFSRA. Max Insurance Europe must comply with the Irish Insurance Acts 1909 to 2000, regulations promulgated thereunder, regulations relating to insurance business promulgated under the European Communities Act 1972, the Irish Central Bank Acts 1942 to 2004 as amended, regulations promulgated thereunder and directions and guidelines, and codes of conduct, issued by IFSRA, which we refer to collectively as the Insurance Acts and Regulations.
Max Insurance Europe is required to maintain statutory reserves, particularly in respect of underwriting liabilities and a solvency margin as provided for in the Insurance Acts and Regulations. Assets constituting statutory reserves must comply with admissibility, diversification, localization and currency matching rules. Statutory reserves must be actuarially certified annually.
Max Re Europe must comply with the European Communities (Reinsurance) Regulations, 2006 and rules made thereunder, regulations relating to reinsurance business promulgated under the European Communities Act 1972, and insofar as relevant to reinsurance, the Insurance Acts and Regulations.
Max Re Europe is required to maintain statutory reserves, particularly in respect of underwriting liabilities and a solvency margin as provided for in the European Communities (Reinsurance) Regulations, 2006. Assets constituting statutory reserves must comply with certain principles including obligations to diversify the assets, to secure sufficiency, liquidity, security, quality, profitability and currency matching of investments. Statutory reserves must be actuarially certified annually.
United Kingdom and Lloyd’s
The financial services industry in the United Kingdom is regulated by the Financial Services Authority, or FSA. The FSA is an independent non-governmental body, given statutory powers by the Financial Services and Markets Act 2000. Although accountable to treasury ministers and through them to Parliament, it is funded entirely by the firms it regulates. The FSA has wide ranging powers in relation to rule-making, investigation and enforcement to enable it to meet its four statutory objectives, which are summarized as one overall aim: “to promote efficient, orderly and fair markets and to help retail consumers achieve a fair deal.”
18
Table of Contents
The Lloyd’s market permits members of Lloyd’s to underwrite insurance and reinsurance risks through Lloyd’s syndicates. Members of Lloyd’s may participate on a Lloyd’s syndicate for one or more underwriting years by providing capital to support the syndicate’s underwriting activities. All syndicates at Lloyd’s are managed by managing agents that receive fees and profit commissions in respect of the underwriting and administrative services they provide to the syndicates.
We participate in the Lloyd’s market through the Syndicates. Max at Lloyd’s is the managing agent for each of the Syndicates. The Max Corporate Capital Vehicles are corporate members of Lloyd’s and participate in the underwriting years of the Syndicates for which they are a Syndicate member. By entering into a membership agreement with Lloyd’s, the Max Corporate Capital Vehicles have undertaken to comply with all Lloyd’s byelaws and regulations as well as the provisions of the Lloyd’s Acts and the Financial Services and Markets Act 2000. The Syndicates, as well as the Max Corporate Capital Vehicles, Max at Lloyd’s and their directors, are subject to the Lloyd’s regulatory regime.
In relation to insurance business, the FSA regulates insurers, insurance intermediaries and Lloyd’s itself. The FSA and Lloyd’s have common objectives in ensuring that Lloyd’s market is appropriately regulated and, to minimize duplication, the FSA has agreed arrangements with Lloyd’s for co-operation on supervision and enforcement.
Max at Lloyd’s underwriting activities are therefore regulated by the FSA as well as being subject to the Lloyd’s “franchise”. Both the FSA and Lloyd’s have powers to remove their respective authorization to manage Lloyd’s syndicates. Lloyd’s approves annually the business plan of each of the Syndicates along with any subsequent material changes, and the amount of capital required to support those plans. The FSA requires that the managing agent of the Syndicates carries out a capital assessment of the Syndicates in order to determine whether any additional capital should be held by the Syndicates on account of any particular risks arising from its business or operational infrastructure. This assessment (known as an “individual capital assessment”) is reviewed and may be challenged by Lloyd’s.
United States
Max Specialty is domiciled and licensed in Delaware as a property and casualty insurer and does not hold insurance certificates of authority in any other jurisdiction. Notwithstanding the foregoing, Max Specialty is listed or authorized as an eligible surplus lines insurer in 49 other U.S. states along with Puerto Rico and the U.S. Virgin Islands. Although Max Specialty is subject to regulation as an eligible surplus lines insurer by state insurance departments and under applicable state insurance laws in each jurisdiction in which it is listed or authorized, the principal insurance regulatory authority is the Delaware Department of Insurance.
Max America is domiciled in Indiana and is admitted as a licensed insurer in all 50 states and the District of Colombia. As such, Max America is also subject to regulation by all state insurance departments and under all applicable state insurance laws. The principal insurance regulatory authority, however, is the Indiana Department of Insurance.
As an insurance holding company, we are also subject to regulation under the Delaware and Indiana insurance holding company system laws. Such laws and applicable regulations require periodic disclosure concerning stock ownership and prior approval of certain intercompany transactions within the holding company system. Furthermore, no person, corporation or other entity is permitted to acquire control of Max Capital, Max USA, Max Specialty or Max America unless such person, corporation or entity has obtained the prior approval of the Delaware and/or Indiana Insurance Commissioner. For purposes of the Delaware and Indiana insurance holding company system laws, any person acquiring, directly or indirectly, 10% or more of the voting securities of an insurance company or any of its parent companies is presumed to have acquired “control” of that company.
19
Table of Contents
The laws and regulations of the jurisdictions in which Max Specialty and Max America are domiciled require, among other things, that Max Specialty and Max America maintain minimum levels of statutory capital, surplus and liquidity, meet solvency standards and submit to periodic examinations of its financial condition. Specifically, Max USA and its subsidiaries are subject to risk-based capital standards and other minimum capital and surplus requirements imposed by state laws, including the laws of their states of domicile (Delaware and Indiana). The risk-based capital standards, or RBC standards, based upon the Risk-Based Capital Model Act adopted by the National Association of Insurance Commissioners, or NAIC, require Max USA and its subsidiaries to report their results of RBC calculations to state insurance departments and the NAIC. These RBC standards provide for different levels of regulatory attention depending upon the ratio of an insurance company’s total adjusted capital, as calculated in accordance with NAIC guidelines, to its authorized control level RBC limits. These laws and regulations also sometimes restrict payments of dividends and reductions of capital. These statutes, regulations and policies may also restrict the ability of Max Specialty or Max America to write insurance policies, to make certain investments and to distribute funds.
We may from time to time be subject to regulation under the insurance and insurance holding company statutes of one or more additional states.
Other Jurisdictions
As a global provider of specialty insurance and reinsurance, our company must comply with various regulatory requirements in jurisdictions where we provide coverage or have activities in addition to the principal jurisdictions set forth above. For example, Max Re Europe and Max at Lloyd’s will need to comply with applicable Latin America regulatory requirements in connection with our new Latin American reinsurance operations, and Max Insurance Europe must comply with applicable German and Swiss regulatory requirements in connection with its activities in those countries.
We do not intend to conduct any activities that may constitute the transaction of the business of insurance in any jurisdiction in which we are not licensed or otherwise authorized to engage in such activities.
In addition to the regulatory requirements imposed by the jurisdictions in which a reinsurer is licensed, a reinsurer’s business operations are affected by regulatory requirements governing credit for reinsurance in other jurisdictions in which its ceding companies are located. In general, a ceding company that obtains reinsurance from a reinsurer that is licensed, accredited or approved by the jurisdiction in which the ceding company files statutory financial statements is permitted to reflect in its statutory financial statements a credit in an aggregate amount equal to the liability for unearned premiums and loss reserves and loss expense reserves ceded to the reinsurer. Many jurisdictions also permit ceding companies to take credit on their statutory financial statements for reinsurance obtained from unlicensed or non-admitted reinsurers if certain prescribed security arrangements are made. Because Max Bermuda is not licensed, accredited or approved in any jurisdiction other than Bermuda, in certain instances our reinsurance customers require Max Bermuda to provide a letter of credit or enter into other security arrangements.
Employees
As of December 31, 2009, we had 394 employees.
Available Information
Our Annual Report on Form 10-K, Quarterly Reports on Form 10-Q, Current Reports on Form 8-K and all amendments to those reports and the Proxy Statement for our Annual General Meeting of Shareholders are made available, free of charge, on our
20
Table of Contents
web site, http://www.maxcapgroup.com, as soon as reasonably practicable after such reports have been filed with or furnished to the SEC. In addition, our Code of Business Conduct and Ethics is available on our web site.
Any of the following risk factors could cause our actual results to differ materially from historical results or anticipated results. These risks and uncertainties are not the only ones we face, but represent the risks that we believe are material. However, there may be additional risks that we currently consider not to be material or of which we are not currently aware, and any of these risks could have the effects set forth above.
Risks Related to Our Business
Our losses and benefits may exceed our loss and benefit reserves, which could significantly increase our liabilities and reduce our net income.
Our success depends on our ability to assess accurately the risks associated with the business that we insure and reinsure. If we fail to assess these risks accurately, or if events or circumstances cause our estimates to be incorrect, we may not establish appropriate premium rates and our reserves may be inadequate to cover our losses. If our actual claims experience is less favorable than our underlying assumptions, we will be required to increase our liabilities, which will reduce our net income.
As of December 31, 2009, we had property and casualty losses and life and annuity benefit reserves of $4,550.6 million. During the year ended December 31, 2009, we incurred net loss and loss expenses and claims and policy benefits of $594.7 million. We periodically review and, where appropriate, adjust our property and casualty losses and life and annuity benefit reserves in the period in which this review occurs.
Reserves are actuarial and statistical projections at a given point in time of what we ultimately expect to pay on claims and benefits, based on facts and circumstances then known, predictions of future events, estimates of future trends in claim frequency and severity, mortality, morbidity and other variable factors such as inflation. Reinsurance has inherently greater uncertainties of property and casualty losses and life and annuity benefit reserves as compared to insurance, primarily due to:
| • | the necessary reliance on the ceding company or insurer for information regarding losses and benefits; and |
| • | the lapse of time from the occurrence of the event to the reporting of the loss or benefit to the reinsurer and the ultimate resolution or settlement of the loss or benefit. |
Our actual property and casualty losses and life and annuity benefit reserves may deviate, perhaps substantially, from the reserve estimates contained in our financial statements. Although we conduct due diligence on the transactions that we underwrite in connection with our reinsurance business, we are dependent on the original underwriting decisions made by ceding companies. Specifically, we are subject to the risk that the ceding companies may not have adequately evaluated the risks reinsured by us and that the premiums ceded may not adequately compensate us for the risks we assume.
As industry practices and legal, judicial and social conditions change, unexpected issues related to claims and coverage may emerge. These issues may adversely affect our business by either extending coverage beyond the period that we intended or by increasing the number or size of claims. In some instances, these changes may not manifest themselves until many years after we issue insurance or reinsurance contracts affected by these changes. As a result, we may not be able to ascertain the full extent of our liabilities under our insurance or reinsurance contracts for many years following the issuance of our contracts.
21
Table of Contents
If we determine that our reserves are inadequate, we will increase our reserves with a corresponding reduction in net income for the period in which the deficiency is identified.
Our ability to write reinsurance and insurance in the property and casualty market may be affected by cyclical trends and in the life and annuity market by global economic conditions and fluctuations in interest rates.
The property and casualty reinsurance and insurance industry has historically been affected by cyclical trends. Demand for property and casualty reinsurance and insurance is influenced significantly by underwriting results and prevailing general economic and market conditions, all of which affect reinsurance and insurance premium rates and liability retention decisions of companies and insurers. The supply of property and casualty reinsurance and insurance is directly related to the levels of surplus available to support assumed business that, in turn, may fluctuate in response to changes in rates of return on investments being realized in the reinsurance and insurance industry, the frequency and severity of losses and prevailing general economic and market conditions. The cyclical trends in the property and casualty reinsurance and insurance industries and the profitability of these industries can also be significantly affected by volatile and unpredictable developments, including what our management believes to be a trend of courts to grant increasingly larger awards for certain damages, natural disasters such as catastrophic hurricanes, windstorms, tornadoes, earthquakes, floods and fires, fluctuations in interest rates, changes in the investment environment that affect market prices of investments and inflationary pressures that may tend to affect the size of losses experienced by insureds and primary insurance companies. We cannot predict with accuracy whether market conditions will remain constant, improve or deteriorate. Adverse market conditions may lead to a significant reduction in property and casualty premium rates, less favorable policy terms and/or less premium volume.
The nature of the life and annuity transactions we consider results in a limited number of transactions actually bound with potentially large variations in annual premium volume. We cannot predict how market conditions will develop or the magnitude of their effect on our life and annuity reinsurance business in the future.
Competitors and/or consolidation in our industry may make it difficult for us to market our products effectively and offer our products at a profit.
The reinsurance and insurance industry is highly competitive. Competition in the types of business that we currently underwrite and intend to underwrite in the future is based principally on:
| • | premium rates; |
| • | ability to obtain terms and conditions appropriate with the risk being assumed and in accordance with underwriting guidelines; |
| • | the general reputation and perceived financial strength of the insurer or reinsurer; |
| • | relationships with reinsurance and insurance intermediaries; |
| • | ratings assigned by independent rating agencies; |
| • | speed of claims payment and administrative activities; and |
| • | experience in the particular line of reinsurance or insurance to be written. |
We compete directly with numerous independent reinsurance companies, captive insurance companies, insurance companies, subsidiaries or affiliates of established insurance companies or newly formed companies, reinsurance departments of primary insurance companies and underwriting syndicates from countries throughout the world in our chosen product lines. Many of these competitors are well established, have significant operating histories, underwriting expertise and extensive capital resources and have developed longstanding customer relationships. Our worldwide insurance and reinsurance competitors
22
Table of Contents
include Allied World Assurance Company, Ltd., Arch Capital Group Ltd., Aspen Insurance Holdings Limited, AXIS Capital Holdings Limited, Endurance Specialty Holdings Ltd., Everest Re Group, Ltd., Montpelier Re Holdings Ltd., Platinum Underwriters Holdings, Ltd., Transatlantic Holdings, Inc., and Validus Holdings, Ltd., many of whom are larger companies with higher credit ratings and greater credit capacity.
Further, our ability to compete may be harmed if insurance industry participants consolidate. Consolidated entities may try to use their enhanced market power to negotiate price reductions for our products and services. If competitive pressures reduce our prices, we would expect to write less business. As the insurance industry consolidates, if at all, competition for customers will become more intense and the importance of acquiring and properly servicing each customer will become greater. We could incur greater expenses relating to customer acquisition and retention, further reducing our operating margins. In addition, insurance companies that merge may be able to spread their risks across a consolidated, larger capital base so that they require less reinsurance. The number of companies offering retrocessional reinsurance may decline. Reinsurance intermediaries could also consolidate, potentially adversely impacting our ability to access business and distribute our products. We could also experience more robust competition from larger, better capitalized competitors. Any of the foregoing could significantly and negatively affect our business or our results of operation.
The property, aviation, marine insurance and reinsurance and terrorism coverage that we offer may make us vulnerable to losses from catastrophic or terrorism events and may cause our results of operations to vary significantly from period to period.
The property, aviation and marine insurance and reinsurance that we offer may cause us to be vulnerable to losses from catastrophes. Catastrophes can be caused by various unpredictable events, including earthquakes, hurricanes, hailstorms, severe winter weather, floods, fires, tornadoes, volcano eruptions, explosions, airplane crashes and other natural or man-made disasters.
Further worldwide terrorist attacks, threats of future terrorist attacks and the military initiatives and political unrest in certain geographic areas, increases many of the risks associated with the insurance markets worldwide. Although, we attempt to exclude losses from terrorism and certain other similar risks from some coverage that we write, we may not be successful in doing so. In addition, we have written and will continue to write some policies explicitly covering acts of terrorism. These risks are inherently unpredictable.
The incidence and severity of catastrophes and terrorism is inherently unpredictable, but the loss experience of property catastrophe insurers and reinsurers has been generally characterized as low frequency and high severity in nature. In addition, because accounting regulations do not permit insurers and reinsurers to reserve for such catastrophic or terrorist events until they occur, claims from catastrophic or terrorist events could cause substantial volatility in our financial results for any fiscal quarter or year, as well as subsequent fiscal periods, and could have a significant and negative effect on our financial condition and results of operations. Our ability to write new business also could be significantly and negatively impacted.
A downgrade or withdrawal of any of our ratings may significantly and negatively affect our ability to implement our business strategy successfully.
Companies, insurers and reinsurance and insurance intermediaries use financial ratings as an important means of assessing the financial strength and quality of insurers and reinsurers. An unfavorable rating or the lack of a rating of its reinsurer or insurer may adversely affect the rating of a company purchasing reinsurance or insurance.
Our non-Lloyd’s financial strength ratings as of December 31, 2009 are “A-” (4th out of 16 categories) by A.M. Best, “A” (6th out of 21 categories) by Fitch, and “A3” (7th out
23
Table of Contents
of 21 categories) by Moody’s, and “A-” (7th out of 21 categories) by S&P. The ratings assigned by rating agencies to reinsurance and insurance companies are based upon factors relevant to policyholders and are not directed toward the protection of investors or a recommendation to buy, sell or hold securities. To date, none of our ratings issued by an independent rating agency has been downgraded. However, if an independent rating agency downgrades or withdraws any of our ratings, we could be severely limited or prevented from writing any new reinsurance and insurance contracts and certain existing contracts may be terminated, which would significantly and negatively affect our ability to implement our business strategy successfully.
The Lloyd’s market is currently rated “A” (excellent) by A.M. Best, “A+” (strong) by Fitch, and “A+” (strong) by S&P. In the event that Lloyd’s rating is downgraded below “A-” in the future, the downgrade could have a material adverse effect on our ability to underwrite business through the Syndicates and on our financial condition or results of operations.
A limited number of reinsurance and insurance brokers and broker transactions account for a large portion of our revenues, and a loss of all or a substantial portion of this brokered business could have a significant and negative effect on our business and results of operations.
A substantial portion of our reinsurance and insurance business is placed through brokered transactions, which involve a limited number of reinsurance and insurance brokers. We have relationships with multiple key personnel in these companies, however, and therefore expect to maintain strong working relationships in the future. During the years ended December 31, 2009, 2008 and 2007, the top three independent producing intermediaries and brokerage firms accounted for 25%, 11% and 7%; 18%, 16% and 10%; and 22%, 13% and 12%, respectively, of property and casualty gross premiums written. During the years ended December 31, 2009, 2008 and 2007, the top independent producing intermediary and brokerage firm accounted for 95%, 27% and 30%, respectively, of life and annuity gross premiums written. Loss of all or a substantial portion of the brokered business provided through one or more of these brokers could have a significant and negative effect on our business and results of operations.
The involvement of reinsurance brokers subjects us to their credit risk.
In accordance with industry practice, we frequently pay amounts owed on claims under our policies to reinsurance brokers, and these brokers, in turn, pay these amounts over to the ceding insurers that have reinsured a portion of their liabilities with us. Although the law is unsettled and depends upon the facts and circumstances of any particular case, in some jurisdictions, if a broker fails to make such a payment, we might remain liable to the ceding insurer for the deficiency. Conversely, in certain jurisdictions, when the ceding insurer pays premiums for these policies to reinsurance brokers for payment to us, these premiums are considered to have been paid and the ceding insurer will no longer be liable to us for these premiums, whether or not we have actually received them. Consequently, consistent with the industry, we assume a degree of credit risk associated with brokers with whom we do business. However, due to the unsettled and fact-specific nature of the law, we are unable to quantify our exposure to this risk. To date, we have not experienced any material losses related to these credit risks.
The failure of any of the loss limitation methods we employ could have a significant and negative effect on our financial condition and results of operations.
We seek to mitigate our loss exposure by writing a number of our insurance and reinsurance contracts on an excess of loss basis. Excess of loss insurance and reinsurance indemnifies the insured against losses in excess of a specified amount. We also seek to limit our loss exposure by geographic diversification. Geographic zone limitations involve
24
Table of Contents
significant underwriting judgments, including the determination of the area of the zones and the inclusion of a particular policy within a particular zone’s limits. Underwriting involves the exercise of considerable judgment and the making of important assumptions about matters that are inherently unpredictable and beyond our control, and for which historical experience and probability analysis may not provide sufficient guidance. Various provisions of our policies, such as limitations or exclusions from coverage or choice of forum negotiated to limit our risks may not be enforceable in the manner we intend. As a result of these risks, one or more catastrophic or other events could cause substantial volatility in our financial results and could have a significant and negative effect on our financial condition and results of operations.
In addition, we purchase reinsurance and retrocessional reinsurance for our own account in order to mitigate the effect of large and multiple losses. A reinsurer’s insolvency or inability or refusal to make payments under the terms of its reinsurance or retrocessional agreement with us could have an adverse effect on our Company because we remain liable to our client irrespective of our reinsurance or retrocessional reinsurance. We cannot be sure that any of the loss limitation methods will be effective and mitigate our exposure.
From time to time, market conditions have limited, and in some cases have prevented, insurers and reinsurers from obtaining the types and amounts of reinsurance that they consider adequate for their business needs. Accordingly, as a result of these unfavorable market conditions, we may be unable to obtain desired amounts of reinsurance or retrocessional reinsurance. In addition, even if we are able to obtain such reinsurance or retrocessional reinsurance, we may not be able to negotiate appropriate or acceptable terms or obtain reinsurance or retrocessional reinsurance from entities with satisfactory creditworthiness. If we fail to obtain reinsurance or retrocessional reinsurance at all or on acceptable terms, our capacity to underwrite new business may be limited.
If we fail to write insurance or reinsurance contracts with the provisions that provide loss limitation protection or if we purchase reinsurance or retrocessional reinsurance but are unable to collect, we may have difficulty mitigating the effect of large or multiple losses which, in turn, could have a significant and negative effect on our business.
Operational risks, including human or systems failures are inherent in our business.
Operational risks and losses can result from, among other things, fraud, errors, failure to document transactions properly or to obtain proper internal authorization, failure to comply with regulatory requirements, information technology failures or external events.
We believe that our modeling, underwriting and information technology and application systems are critical to our business. Moreover, our information technology and application systems have been an important part of our underwriting process and our ability to compete successfully. We have also licensed certain systems and data from third parties. We cannot be certain that we will have access to these, or comparable, service providers, or that our information technology or application systems will continue to operate as intended. A major defect or failure in our internal controls or information technology and application systems could result in management distraction, harm our reputation or increase expenses. We believe appropriate controls and mitigation procedures are in place to prevent significant risk of defect in our internal controls, information technology, investment management, custody and record-keeping and application systems, but internal controls provide only a reasonable, not absolute, assurance as to the absence of errors or irregularities and any ineffectiveness of such controls and procedures could have a significant and negative effect on our business.
We may require additional capital in the future, which may not be available to us on satisfactory terms, if at all.
We need liquidity to pay our operating expenses, interest on our debt and dividends, as well as to establish premium rates and reserves at levels sufficient to cover our losses.
25
Table of Contents
To the extent that the funds generated by our ongoing operations are insufficient to fund future operating requirements and cover claim payments, we may need to raise additional funds through financings or curtail our growth. Markets in the United States and elsewhere have experienced volatility and disruption for more than 18 months, due in part to the global recession. These circumstances may reduce access to the equity and debt markets.
Although we currently believe we have access to the equity and debt markets, any future equity or debt financing may not be available on terms that are favorable to us, if at all. Any future equity financings could be dilutive to our existing shareholders or could result in the issuance of securities that have rights, preferences and privileges that are senior to those of our other securities. Our access to funds under existing credit facilities is dependent on the ability of the banks that are parties to the facilities to meet their funding commitments. Those banks may not be able to meet their funding commitments if they experience shortages of capital and liquidity or if they experience excessive volumes of borrowing requests within a short period of time, and we might be forced to replace credit sources in a difficult market.
There has also been recent consolidation in the industry, which could lead to increased reliance on and exposure to particular institutions. If we cannot obtain adequate capital or sources of credit on favorable terms, or at all, our business, operating results, and financial condition could be adversely affected. It is possible that, in the future, one or more of the rating agencies may reduce our existing ratings. If one or more of our ratings were downgraded, we could incur higher borrowing costs and our ability to access the capital markets could be impacted. Our inability to obtain adequate capital could have a significant and negative effect on our business, financial condition and results of operations.
Adverse consequences of the U.S. and global economic and financial industry downturns could harm our business, our liquidity and financial condition, and our stock price.
Adverse global market and economic conditions may affect (among other aspects of our business) the demand for and claims made under our products, the ability of customers, counterparties and others to establish or maintain their relationships with us, our ability to access and efficiently use internal and external capital resources and our investment performance.
We could incur substantial losses and reduced liquidity if one of the financial institutions we use in our operations, including those institutions that participate in our credit facilities, fails.
We maintain cash balances, including restricted cash held in premium trust accounts, significantly in excess of the U.S. Federal Deposit Insurance Corporation insurance limits at various U.S. depository institutions. We also maintain cash balances in foreign banks and institutions and rely upon funding commitments from several banks and financial institutions that participate in our credit facilities. If one or more of these financial institutions were to fail, our ability to access cash balances and draw down on our credit facilities might be temporarily or permanently limited, which could have a significant and negative effect on our results of operations, financial condition or cash flows.
If we lose or are unable to retain our senior management and other key personnel, or if we are unable to renew the Bermudian work permits of any members of our senior management or other key personnel, our ability to implement our business strategy could be delayed or hindered, which, in turn, could significantly and negatively affect our business.
Our future success depends to a significant extent on the efforts of our senior management and other key personnel to implement our business strategy. We do not currently maintain key man life insurance with respect to any of our senior management.
26
Table of Contents
In addition, under Bermuda law, non-Bermudians, other than spouses of Bermudians, may not engage in any gainful occupation in Bermuda without an appropriate governmental work permit. A work permit may be granted or renewed only upon showing that, after proper public advertisement, no Bermudian, spouse of a Bermudian, holder of a permanent resident’s certificate or holder of a working resident’s certificate is available who meets the minimum standards reasonably required by the employer. The Bermuda government limits the term of work permits to six years, subject to certain exemptions for key employees.
The loss of the services of one or more of the members of our senior management or other key personnel, including as a result of our inability to renew the Bermudian work permit of such individual, or our inability to hire and retain other senior management and other key personnel, could delay or prevent us from fully implementing our business strategy and, consequently, significantly and negatively affect our business.
Currency fluctuations could result in exchange losses and our failure to manage our multiple currency liabilities effectively could significantly and negatively impact our business.
We maintain a portion of our investments, insurance and reinsurance liabilities, and insurance and reinsurance assets denominated in currencies other than U.S. dollars. Consequently, we and our subsidiaries may experience foreign exchange losses. As of December 31, 2009, approximately 66.1% of our reinsurance and insurance reserves were denominated in U.S. dollars. We purchase fixed maturities denominated in the currencies of the relevant reinsurance and insurance liabilities to manage our multiple currency exposures. We continually monitor those assets and liabilities to reduce our exposure to currency risk. Mismatches in multiple currency assets and liabilities may give rise to currency losses and our business could be significantly and negatively affected.
We publish our consolidated financial statements in U.S. dollars. Therefore, fluctuations in exchange rates used to convert other currencies, particularly other European currencies including the Euro and British pound, into U.S. dollars will impact our reported consolidated financial condition, results of operations and cash flows from year to year.
Our failure to maintain sufficient letter of credit facilities or to increase our letter of credit capacity on commercially acceptable terms as we grow could significantly and negatively affect our ability to implement our business strategy.
Our principal reinsurance operations are conducted by our companies licensed and operated in Bermuda, the United Kingdom, and Ireland. Many jurisdictions do not permit insurance companies to take statutory credit for reinsurance obtained from unlicensed or non-admitted reinsurers, such as Max Bermuda and Max Re Europe, in their statutory financial statements unless appropriate security measures are implemented. Consequently, the majority of our reinsurance clients typically require us to obtain a letter of credit or provide other collateral through funds withheld or trust arrangements. When we obtain a letter of credit facility, we are required to provide collateral to secure our obligations under the facility.
As of December 31, 2009, we had two letter of credit facilities totaling $675.0 million with an additional $200.0 million available subject to certain conditions. As of December 31, 2009, we had $461.3 million in letters of credit outstanding under these facilities. We also had a GBP 90.0 million ($145.5 million) letter of credit facility supporting our Funds at Lloyd’s commitments, of which GBP 63.6 million ($102.9 million) is utilized as of December 31, 2009. Our failure to maintain our letter of credit facilities or to increase our letter of credit capacity on commercially acceptable terms as we grow could significantly and negatively affect our ability to implement our business strategy.
27
Table of Contents
A significant decrease in our capital or surplus could enable certain clients to terminate reinsurance agreements or to require additional collateral.
Certain of our assumed reinsurance contracts contain provisions that permit our clients to cancel the contract or require additional collateral in the event of a downgrade in our ratings below specified levels or our capital or surplus is reduced (typically by 20% to 50%) since inception or effectiveness of the agreement. Whether a client would exercise such cancellation rights would likely depend, among other things, on the reason the provision is triggered, the prevailing market conditions, the degree of unexpired coverage and the pricing and availability of replacement reinsurance coverage. If any such provisions were to become exercisable, we cannot predict whether or how many of our clients would actually exercise such rights or the extent to which they would have a significant and negative effect on our financial condition, results of operations or future prospects and could have a significant adverse effect on the market price for our securities.
Our results of operations may fluctuate significantly from period to period and may not be indicative of our long-term prospects.
Our results of operations may fluctuate significantly from period to period. These fluctuations result from a variety of factors, including the seasonality of the reinsurance and insurance business, the volume and mix of reinsurance and insurance products that we write, loss experience on our reinsurance and insurance liabilities, the performance of our investment portfolio and our ability to assess and integrate our risk management strategy effectively. In particular, we seek to underwrite products and make investments to achieve long-term results. As a result, our short-term results of operations may not be indicative of our long-term prospects.
We are a holding company that depends on the ability of our subsidiaries to pay dividends.
Max Capital is a holding company and does not have any significant operations or assets other than its ownership of the shares of its subsidiaries. Dividends and other permitted distributions from our subsidiaries are our primary source of funds to meet ongoing cash requirements, including any future debt service payments and other expenses, and to pay dividends to our shareholders. Some of our insurance and reinsurance subsidiaries are subject to significant regulatory restrictions limiting their ability to declare and pay dividends. The inability of our insurance and reinsurance subsidiaries to pay dividends in an amount sufficient to enable us to meet our cash requirements at the holding company level could have an adverse effect on our operations and our ability to pay dividends to our shareholders and/or meet our debt service obligations.
In addition, each of Max Bermuda’s credit facilities prohibits Max Bermuda from paying dividends at any time that there is a default under the particular facility, which will occur if Max Capital’s shareholders’ equity or Max Bermuda’s shareholders’ equity is less than a specified amount, as well as in certain other circumstances. Max Capital is party to one credit facility that imposes parallel restrictions on its ability to pay dividends.
The payment of dividends and making of distributions by Max Capital, Max Bermuda, Max Managers and Max Diversified are limited under Bermuda law and regulations. Under the Bermuda Insurance Act, Max Bermuda must maintain specified minimum solvency levels and is prohibited from declaring or paying dividends that would result in noncompliance. Further, as a long-term insurer, Max Bermuda must maintain long-term business assets of a value at least $0.25 million greater than its long-term business liabilities and is prohibited from declaring or paying dividends if it does not comply or such action would result in noncompliance with the Bermuda Insurance Act. Additionally, under the Bermuda Companies Act, each of Max Capital, Max Bermuda, Max Managers and Max Diversified may only declare or pay a dividend if, among other things, it has reasonable grounds for believing that it is, or would after the payment be, able to pay its respective liabilities as they become due.
28
Table of Contents
To the extent we look to declare dividends at subsidiaries located in other jurisdictions, we are required to comply with restrictions set forth under applicable law and regulations in such other jurisdictions. These restrictions could act in a way as to impact adversely on the Company.
If we do not generate positive cash flows, we may be unable to service our indebtedness.
Our ability to pay principal and interest on the notes and on our other indebtedness depends on our future operating performance. Future operating performance is subject to market conditions and business factors that are often beyond our control. Consequently, we cannot assure you that we will have sufficient cash flows to pay the principal, premium, if any, and interest on our indebtedness. If our cash flows and capital resources are insufficient to allow us to make scheduled payments on our indebtedness, we may have to seek additional capital or restructure or refinance our indebtedness. We cannot assure you that the terms of our indebtedness will allow us to take these measures or that these measures would satisfy our scheduled debt service obligations.
Our failure to comply with restrictive covenants contained in the indenture governing the senior notes or our current or future credit facilities could trigger prepayment obligations, which could adversely affect our business, financial condition and results of operations.
The indenture governing the senior notes contains covenants that impose restrictions on our Company and certain of our subsidiaries with respect to, among other things, the incurrence of liens and the disposition of capital stock of these subsidiaries. In addition, each of our credit facilities requires our Company and/or certain of our subsidiaries to comply with certain covenants, including the maintenance of a minimum consolidated net tangible worth and restrictions on the payment of dividends. Our failure to comply with these covenants could result in an event of default under the indenture or any credit facility we may enter into in the future, which, if not cured or waived, could result in us being required to repay the notes or any amounts outstanding under these facilities prior to maturity. As a result, our business, financial condition and results of operations could be adversely affected.
The integration of new insurance and reinsurance initiatives into our existing operations may present significant challenges.
We may face significant challenges in integrating new insurance and reinsurance initiatives into our existing operations in a timely, efficient and effective manner. Successful integration depends on, among other things, the effective execution of our business plan for the new insurance and reinsurance initiatives, our ability to effectively integrate the operations of new insurance and reinsurance initiatives into our existing risk management techniques, our ability to effectively manage any regulatory issues created by our entry into new markets and geographic locations, our ability to retain key personnel and other operational and economic factors. There can be no assurance that the integration of new insurance and reinsurance initiatives will be successful or that the business derived therefrom will prove to be profitable. The failure to integrate new insurance and reinsurance initiatives successfully or to manage the challenges presented by the integration process may adversely impact our financial results.
Changing climate conditions may adversely affect our financial condition, profitability or cash flows
We recognize the scientific view that the world is getting warmer. Climate change, to the extent it produces rising temperatures and changes in weather patterns, could impact the frequency or severity of weather events and wildfires. These changes may effect pricing and losses and consequentially adversely impact our financial results.
29
Table of Contents
Risks Related to Our Investment Strategy
Changes in market interest rates and general economic conditions could have a significant and negative effect on our investment portfolio, investment income and results of operations.
Increasing market interest rates reduce the value of our fixed maturities, and we may realize a loss if we sell fixed maturities whose value has fallen below their acquisition cost. Declining market interest rates can have the effect of reducing our investment income, as we invest proceeds from positive cash flows from operations and reinvest proceeds from maturing and called investments in new investments that may yield less than our investment portfolio’s average rate of return. Interest rates are highly sensitive to many factors, including governmental monetary policies, domestic and international economic and political conditions and other factors beyond our control. Our mitigation efforts with respect to interest rate risk are primarily focused towards monitoring the duration and structure of our investment portfolio relative to the duration and structure of our liability portfolio. However, our estimates of the duration and structure of our liability portfolio may be inaccurate and we may be forced to liquidate investments prior to maturity at a loss in order to cover the liability. Any measures we take that are intended to manage the risks of operating in a changing interest rate environment may not effectively mitigate such interest rate sensitivity. Accordingly, changes in interest rates could have a material adverse effect on our investment portfolio, investment income and results of operations.
The success of our investment strategy is also affected by general economic conditions, including volatility in interest rates and the price of securities. Unexpected volatility or illiquidity in the financial markets could significantly and negatively affect our ability to conduct business.
Unexpected volatility or illiquidity associated with our fixed maturities investment portfolio could significantly and negatively affect our ability to conduct business.
Although our investment strategy requires a minimum weighted average credit quality rating of Aa2/AA, or its equivalent from at least one internationally recognized statistical rating organization, to be maintained for our fixed maturities investment portfolio as a whole, unexpected volatility or illiquidity in the financial markets could have a significant adverse impact on the credit ratings of the fixed maturities investment we hold. Deterioration of credit ratings on our fixed maturities investments may result in the need to liquidate these securities in the financial markets. If we are required to liquidate these securities during a period of tightening credit in the financial markets, we may realize a significant loss.
Our portfolio of investment grade fixed maturities includes mortgage-backed and asset-backed securities and collateralized mortgage obligations. These types of securities have cash flows that are backed by the principal and interest payments of a group of underlying mortgages or other receivables. As a result of the increasing default rates of borrowers, there is a greater risk of defaults on mortgage-backed and asset-backed securities and collateralized mortgage obligations, especially those that are non-investment grade. These factors make the estimate of fair value more uncertain. We obtain fair value estimates from multiple independent pricing sources in an effort to mitigate some of the uncertainty surrounding the fair value estimates. Should we need to liquidate these securities within a short period of time, the actual realized proceeds may be significantly different from the fair values estimated at December 31, 2009.
Unexpected volatility or illiquidity associated with our fixed maturities investment portfolio could significantly and adversely affect our investment portfolio, investment income and results of operations.
30
Table of Contents
The determination of the impairments taken on our investments is subjective and could materially impact our financial position or results of operations.
The determination of the impairments taken on our investments vary by investment type and is based upon our periodic evaluation and assessment of known and inherent risks associated with the respective asset class. Such evaluations and assessments are revised as conditions change and new information becomes available. Management updates its evaluations regularly and reflects impairments in operations as such evaluations are revised. There can be no assurance that our management has accurately assessed the level of impairments taken in our financial statements. Furthermore, additional impairments may need to be taken in the future, which could materially impact our financial position or results of operations. Historical trends may not be indicative of future impairments.
Our valuation of fixed maturity securities and hedge fund investments may include methodologies, estimations and assumptions which are subject to differing interpretations and could result in changes to investment valuations that may materially adversely affect our results of operations or financial condition.
Fixed maturity and hedge fund investments, which are reported at fair value on the consolidated balance sheet, represent the majority of our total cash and invested assets.
Fair value prices for all securities in the fixed maturities portfolio are independently provided by both our investment custodians and our investment managers, which each utilize internationally recognized independent pricing services. We record the unadjusted price provided by the investment custodian and our validation process includes, but is not limited to: (i) comparison to the price provided by the investment manager, with significant differences investigated; (ii) quantitative analysis (e.g., comparing the quarterly return for each managed portfolio to its target benchmark, with significant differences identified and investigated); (iii) evaluation of methodologies used by external parties to calculate fair value; and (iv) comparing the price to its knowledge of the current investment market.
Investments in hedge funds comprise a portfolio of limited partnerships and stock investments in trading entities, or funds, which invest in a wide range of financial products. The units of account that are fair valued are our interest in the funds and not the underlying holdings of such funds. Thus, the inputs we use to value our investment in each of the funds may differ from the inputs used to value the underlying holdings of such funds. These funds are stated at fair value which ordinarily will be the most recently reported net asset value as advised by the fund manager, where the fund’s underlying holdings can be in various quoted and unquoted investments. We believe the reported net asset value represents the fair value market participants would apply to an interest in the fund. The fund managers value their underlying investments in accordance with policies established by each fund, as described in each of their financial statements and offering memoranda.
During periods of market disruption including periods of significantly rising or high interest rates, rapidly widening credit spreads or illiquidity, it may be difficult to value certain of our securities, for example mortgage backed securities, if trading becomes less frequent or market data becomes less observable. In addition, there may be certain asset classes that were in active markets with significant observable data that become illiquid due to the current financial environment. In such cases, more securities may require more subjectivity and management judgment. As such, valuations may include inputs and assumptions that are less observable or require greater estimation as well as valuation methods which are more sophisticated or require greater estimation thereby resulting in values which may be less than the value at which the investments may be ultimately sold. Further, rapidly changing and unprecedented credit and equity market conditions could materially impact the valuation of securities as reported within our consolidated financial statements and the period-to-period changes in value could vary significantly. Decreases in value may have a significant and negative effect on our results of operations or financial condition.
31
Table of Contents
Unexpected volatility or illiquidity associated with our hedge fund investment portfolio could significantly and negatively affect our ability to conduct business.
As of December 31, 2009, we had reduced our allocation to hedge fund investments to approximately 6% of total invested assets, although our investment guidelines permit us to invest up to 15% of our investment portfolio in a hedge fund investment portfolio. Max Diversified invests in various hedge funds, which follow investment strategies that involve investing in a broad range of investments, some of which may be volatile. We invest the remainder of our hedge fund investment portfolio through Max Bermuda, which makes strategic investments in reinsurance companies. Although we believe that our investment portfolio assists us in maintaining low overall volatility, the risks associated with our hedge fund investment portfolio may be substantially greater than the risks associated with fixed maturities investments. Further, because many of the hedge funds in which we invest impose limitations on the timing of withdrawals, or may suspend withdrawals for a period of time, we may be unable to withdraw our investment from a particular hedge fund on a timely basis. Unexpected volatility or illiquidity associated with our hedge fund investment portfolio could significantly and negatively affect our ability to conduct business.
Deterioration in the public debt and equity markets could lead to additional investment losses.
Disruptions in the public debt and equity markets, including among other things, widening of credit spreads, bankruptcies and government intervention in large financial institutions, could result in significant realized and unrealized losses in our investment portfolio. Depending on market conditions, we could incur additional realized and unrealized losses in future periods, which could have a significant and negative effect on our results of operations, financial condition and business.
Losses due to defaults by others, including issuers of investment securities (which include structured securities such as commercial mortgage-backed securities and residential mortgage backed securities or other high yielding bonds) or reinsurance counterparties, could adversely affect the value of our investments, results of operations, financial condition or cash flows.
Issuers or borrowers whose securities or loans we hold, customers, reinsurers, clearing agents, exchanges, clearing houses and other financial intermediaries and guarantors may default on their obligations to us due to bankruptcy, insolvency, lack of liquidity, adverse economic conditions, operational failure, fraud or other reasons. Such defaults could have a significant and negative effect on our results of operations, financial condition and cash flows. Additionally, the underlying assets supporting our structured securities may deteriorate causing these securities to incur losses.
In addition, our reinsurers and retrocessionaires may be affected by such developments in the financial markets, which could adversely affect their ability to meet their obligations to us.
The failure of our investment managers to perform their services in a manner consistent with our expectations and investment objectives, or the termination of our agreements with one or more of these investment managers, could significantly and negatively affect our ability to conduct business.
We have entered into investment management agreements with a number of managers to manage portions of our aggregate fixed maturities portfolio. Additionally, each underlying hedge fund manager for our hedge fund investment portfolio invested through Max Diversified has discretionary authority over the portion of our underlying hedge fund investment portfolio that it manages. As a result, the aggregate performance of our investment portfolio depends to a significant extent on the ability of our investment
32
Table of Contents
managers, and the investment managers of each underlying hedge fund, to select and manage appropriate investments. We cannot assure you that any or all of these investment managers will be successful in meeting our investment objectives, or that these investment managers will not terminate their respective agreements with our Company. The failure of these investment managers to perform their services in a manner consistent with our expectations and investment objectives, or the termination of our agreements with one or more of these investment managers, could significantly and negatively affect our ability to conduct our business.
Our fixed maturities investment portfolio is managed by outside managers, therefore we do not directly control individual trading activity.
Our investment managers are contractually obligated to follow our investment guidelines, including requiring consent before selling any fixed maturity securities. However, we cannot assure you as to how our assets will be allocated among different securities or as to our level of risk exposure. Further, while nearly all securities in our fixed maturities portfolio are investment grade when originally purchased, these securities are still subject to credit risk, interest rate risk and currency risk. The volatility of our loss claims may force us to liquidate securities, which may cause us to incur capital losses. Investment losses could significantly decrease our book value, thereby affecting our ability to conduct business.
Our investment portfolio may be subject to political risk.
Our investments, in both our hedge fund investment and fixed maturities portfolio, may be exposed to political risk to the extent that our investment advisors and underlying funds, on our behalf and subject to our investment guidelines, trade securities that are listed on various US and non-US exchanges and markets. The government in any of these jurisdictions could impose restrictions, regulations or permanent measures, which may have a significant and negative impact on the ability of our advisors to implement our fixed maturities or other investment strategies.
If our calculations with respect to our liabilities are incorrect, or if we do not appropriately structure our investments in relation to our anticipated liabilities, we could be forced to liquidate investments at a significant loss.
Our ability to measure and manage risk and to implement our investment strategy is crucial to our success. We cannot assure investors that we will successfully structure our investments in relation to our anticipated liabilities under our reinsurance and insurance policies. If our calculations with respect to these liabilities are incorrect, or if we do not properly structure our investments to satisfy such liabilities, we could be forced to liquidate investments at a significant loss.
Risks Related to Regulation of Our Company
The regulatory systems under which we operate, and potential changes thereto, could have a significant and negative effect on our business.
Our insurance and reinsurance subsidiaries operate in numerous countries around the world as well as in all 50 U.S. states. Our operations in each of these jurisdictions are subject to varying degrees of regulation and supervision. The laws and regulations of the jurisdictions in which our insurance and reinsurance subsidiaries are domiciled require, among other things, that these subsidiaries maintain minimum levels of statutory capital, surplus and liquidity, meet solvency standards, submit to periodic examinations of their financial condition and restrict payments of dividends and reductions of capital. Statutes, regulations and policies that our insurance and reinsurance subsidiaries are subject to may also restrict the ability of these subsidiaries to write insurance and reinsurance policies, make certain investments and distribute funds.
33
Table of Contents
In recent years, the U.S. insurance regulatory framework has come under increased federal scrutiny. In addition, some state legislatures have considered or enacted laws that may alter or increase state regulation of insurance and reinsurance companies and holding companies. Moreover, the National Association of Insurance Commissioners, which is the organization of insurance regulators from the 50 U.S. states, the District of Columbia and the four U.S. territories, as well as state insurance regulators regularly reexamine existing laws and regulations.
In addition, European legislation known as “Solvency II”, which will govern the prudential regulation of insurers and reinsurers, is due to come into force in 2012. Solvency II will require insurers and reinsurers in Europe to meet risk-based solvency requirements. It will also impose group solvency and governance requirements on groups with insurers and/or reinsurers operating in the European Economic Area.
We may not be able to comply fully with, or obtain desired exemptions from, revised statutes, regulations and policies that govern the conduct of our business. Failure to comply with, or to obtain desired authorizations and/or exemptions under, any applicable laws could result in restrictions on our ability to do business or undertake activities that are regulated in one or more of the jurisdictions in which we operate and could subject us to fines and other sanctions. In addition, changes in the laws or regulations to which our insurance and reinsurance subsidiaries are subject, or in the interpretations thereof by enforcement or regulatory agencies, could have a material adverse effect on our business.
Certain of our subsidiaries are subject to minimum capital and surplus requirements, and our failure to meet these requirements could subject us to regulatory action.
Max USA and its subsidiaries are subject to risk-based capital standards and other minimum capital and surplus requirements imposed by state laws, including the laws of their states of domicile (Delaware and Indiana). The risk-based capital standards, or RBC standards, are based upon the Risk-Based Capital Model Act adopted by the National Association of Insurance Commissioners, or NAIC, and require Max USA and its subsidiaries to report their results of RBC calculations to state insurance departments and the NAIC. These RBC standards provide for different levels of regulatory attention depending upon the ratio of an insurance company’s total adjusted capital, as calculated in accordance with NAIC guidelines, to its authorized control level RBC limits. In addition, Max USA and its subsidiaries are subject to minimum capital requirements imposed under the laws of some of the states in which it conducts business.
Max Bermuda is also subject to risk-based capital standards and minimum capital and surplus requirements imposed by the Bermuda Monetary Authority. Generally, reinsurers are required to hold capital determined in part using the Bermuda Solvency Capital Requirement or an alternative model approved by the Bermuda Monetary Authority.
Max Insurance Europe is required to maintain statutory reserves, particularly in respect of underwriting liabilities and a solvency margin as provided for in the Irish Insurance Acts 1909 to 2000, regulations promulgated thereunder, regulations relating to insurance business promulgated under the European Communities Act 1972, the Irish Central bank acts 1942 to 2004 as amended, regulations promulgated thereunder and directions and guidelines and codes of conduct, issued by IFSRA (the Insurance Acts and Regulations). Assets constituting statutory reserves must comply with admissibility, diversification, localization and currency matching rules. Statutory reserves must be actuarially certified annually.
Max Re Europe is required to maintain statutory reserves, particularly in respect of underwriting liabilities and a solvency margin as provided for in the European Communities (Reinsurance) Regulations, 2006 and rules made thereunder and regulations relating to reinsurance business promulgated under the European Communities Act 1972 and insofar
34
Table of Contents
as relevant to reinsurance, the Insurance Acts and Regulations. Assets constituting statutory reserves must comply with certain principles including obligations to diversify the assets, to secure sufficiency, liquidity, security, quality, profitability and currency matching of investments. Statutory reserves must be actuarially certified annually.
Max at Lloyd’s underwriting activities are regulated by the FSA as well as being subject to the Lloyd’s “franchise.” Both the FSA and Lloyd’s have powers to remove their respective authorization to manage Lloyd’s syndicates. Lloyd’s approves annually the business plan of each of the Syndicates along with any subsequent material changes, and the amount of capital required to support those plans. The FSA requires that the managing agent of the Syndicates carry out a capital assessment of the Syndicates in order to determine whether any additional capital should be held by the Syndicates on account of any particular risks arising from its business or operational infrastructure. This assessment (known as an “individual capital assessment”) is reviewed and may be challenged by Lloyd’s.
Any failure to meet applicable requirements or minimum statutory capital requirements could subject us to further examination or corrective action by regulators, including limitations on our writing of additional business or engaging in finance activities, supervision or liquidation. Further, any changes in existing risk based capital requirements or minimum statutory capital requirements may require us to increase our statutory capital levels, which we might be unable to do.
Political, regulatory and industry initiatives could adversely affect our business.
The insurance and reinsurance regulatory framework is subject to heavy scrutiny by the U.S. and individual state governments as well as an increasing number of international authorities. Government regulators are generally concerned with the protection of policyholders to the exclusion of other constituencies, including shareholders. Increasingly, governmental authorities in both the United States and worldwide seem to be interested in the potential risks posed by the insurance and reinsurance industry as a whole, and to commercial and financial systems in general. While we do not believe these inquiries have identified meaningful new risks posed by the insurance and reinsurance industry, and we cannot predict the exact nature, timing or scope of possible governmental initiatives, we believe it is likely there will be increased regulatory intervention in our industry in the future. For example, the U.S. federal government has increased its scrutiny of the insurance regulatory framework in recent years, and some state legislators have considered or enacted laws that will alter and likely increase state regulation of insurance and reinsurance companies and holding companies. Moreover, the NAIC regularly reexamines existing laws and regulations.
For example, we could be adversely affected by proposals to:
| • | provide insurance and reinsurance capacity in markets and to consumers that we target; |
| • | require our participation in industry pools and guaranty associations; |
| • | increasingly mandate the terms of insurance and reinsurance policies; or |
| • | disproportionately benefit the companies of one country over those of another. |
The growth of our primary insurance business, which is regulated more comprehensively than reinsurance, increases our exposure to adverse political, judicial and legal developments. Moreover, our exposure to potential regulatory initiatives could be heightened by the fact that our principal operating company is domiciled in, and operates exclusively from, Bermuda. For example, Bermuda, a small jurisdiction, may be disadvantaged in participating in global or cross border regulatory matters as compared with larger jurisdictions such as the United States or the leading European Union countries. In addition, Bermuda, which is currently an overseas territory of the United Kingdom, may
35
Table of Contents
consider changes to its relationship with the United Kingdom in the future. These changes could significantly and negatively affect Bermuda’s position in respect of future regulatory initiatives, which could adversely impact us commercially.
Changes in current accounting practices and future pronouncements may materially impact our reported financial results.
Unanticipated developments in accounting practices may require us to incur considerable additional expenses to comply with such developments, particularly if it is required to prepare information relating to prior periods for comparative purposes or to apply the new requirements retroactively. The impact of changes in current accounting practices and future pronouncements cannot be predicted but may affect the calculation of net income, net equity, and other relevant financial statement line items. In particular, recent guidance and ongoing projects put in place by standard setters globally have indicated a possible move away from the current insurance accounting models toward more “fair value” based models which could introduce significant volatility in the earnings of insurance industry participants. Furthermore, rules relating to certain accounting practices in the financial guarantee insurance and reinsurance industry are currently being reviewed by applicable regulatory bodies and any changes required by that review could have a material effect on the reported operating results and financial condition of the industry or particular market participants.
The reinsurance to close of an underwriting year at Lloyd’s does not discharge the liability of the members of the reinsured syndicate.
The reinsurance to close of an underwriting year on which a corporate member participates does not legally discharge the member from liability for the insurance obligations of the underwriting year. Instead, it provides to the member a full indemnity from the reinsuring underwriting year in respect of these obligations. Therefore, even after all the underwriting years on which a member has participated have been reinsured to close, the member is required to stay in existence and to remain a non-underwriting member of Lloyd’s. Accordingly, although Lloyd’s will release the member’s Funds at Lloyd’s, there nevertheless continues to be an administrative and financial burden for corporate members between the time of reinsurance to close of the underwriting years on which they participated and the time their insurance obligations are extinguished.
Continued or increased levies by Lloyd’s for the Lloyd’s Central Fund and cash calls for trust fund deposits would materially and adversely affect us.
We participate in Lloyd’s through the Syndicates. Whenever any member of Lloyd’s is unable to pay its debts to policyholders or to meet certain other obligations, these debts or obligations may be payable by the Lloyd’s Central Fund.
The Lloyd’s Central Fund protects Lloyd’s policyholders against the failure of a member of Lloyd’s to meet its obligations. The Central Fund is a mechanism that, in effect, “mutualizes” unpaid liabilities among all members, whether individual or corporate. The fund is available to back Lloyd’s policies issued after 1992.
Lloyd’s requires members to contribute to the Central Fund in the form of an annual contribution. The Council of Lloyd’s has discretion to require members to make further Central Fund contributions of up to 3% of their underwriting capacity in any one year.
Additionally, Lloyd’s insurance and reinsurance business is subject to local regulation. Regulators in the United States require Lloyd’s to maintain certain minimum deposits in trust funds as protection for policyholders in the United States. These deposits may be used to cover liabilities in the event of a major claim arising in the United States and Lloyd’s may require the Max Corporate Capital Vehicles to satisfy cash calls to meet claims payment obligations and to maintain minimum trust fund amounts.
36
Table of Contents
The failure of Lloyd’s to satisfy the FSA’s solvency requirements could result in limitations on our ability to underwrite business.
The FSA requires Lloyd’s to satisfy an annual solvency test and to maintain solvency on a continuous basis. The solvency position of each member, and of Lloyd’s as a whole, is monitored on a regular basis. The solvency requirement in essence measures whether Lloyd’s has sufficient assets in the aggregate to meet all outstanding liabilities of its members, both current and in run-off, plus a margin of solvency. If Lloyd’s fails to satisfy the test in any year, the FSA may require Lloyd’s to cease trading and/or its members to cease or reduce underwriting.
An increase in the charges paid by Max at Lloyd’s and the Max Corporate Capital Vehicles to participate in the Lloyd’s market could adversely affect their financial and operating results.
Lloyd’s imposes a number of charges on businesses operating in the Lloyd’s market, including, for example, annual subscriptions and central fund contributions for members and policy signing charges. The bases and amounts of charges may be varied by Lloyd’s and could adversely affect Max at Lloyd’s and the Max Corporate Capital Vehicles.
Risks Related to Our Common Shares
Our common shares are subject to limitations on ownership and voting rights.
Under our bye-laws, our directors or their designees are authorized to decline to register any transfer of our common shares if they have any reason to believe that such transfer would result in a shareholder owning, directly or indirectly, 9.5% or more of our common shares. Similar restrictions apply to issuances and repurchases of our common shares by us. Our directors or their designees also may, in their absolute discretion, decline to register the transfer of any common shares if they have reason to believe that such transfer may expose us, our subsidiaries, any shareholder or any person ceding insurance to us to adverse tax or regulatory treatment in any jurisdiction. Our board of directors expects to apply these restrictions fully except with respect to the purchase and sale of our common shares on the Nasdaq Global Select Market. Although our board of directors will not decline to register any transfer of our common shares on the Nasdaq Global Select Market, it will require the transferee to surrender the common shares to an agent designated by the board if the transfer results in the transferee owning, directly or indirectly, 9.5% or more of any class of our capital stock or causes our board to have reason to believe that the transfer may expose us, any subsidiary or shareholder or any person insured or reinsured or proposing to be insured or reinsured to adverse tax or regulatory treatment in any jurisdiction. A transferor of our common shares will be deemed to own those shares for dividend, voting and reporting purposes until a transfer of such common shares has been registered on our Register of Members. We are authorized to request information from any holder or prospective acquiror of our common shares as necessary to effect registration of any such transaction and may decline to register any such transaction if complete and accurate information is not received as requested.
In addition, our bye-laws generally provide that any shareholder owning, directly or by attribution, 9.5% or more of our common shares will have the voting rights attached to such common shares reduced such that the common shares will constitute less than 9.5% of the voting power of all of the shares. Because of the attribution provisions of the Internal Revenue Code and the rules of the SEC regarding determination of beneficial ownership, this requirement may have the effect of reducing the voting rights of a shareholder whether or not that shareholder directly holds of record 9.5% or more of our common shares. Further, our directors or their designees have the authority to request from any shareholder certain information for the purpose of determining whether that shareholder’s voting rights are to be reduced. Failure to respond to such a notice, or submitting incomplete or inaccurate information, gives the directors or their designees discretion to disregard all votes attached to such shareholder’s common shares.
37
Table of Contents
Furthermore, applicable U.S. state insurance laws prevent any person from acquiring control of us, Max USA, Max Specialty or Max America, unless the person has filed a notification with the specified information with the applicable state insurance commissioner and has obtained his approval. Under the Delaware and Indiana insurance holding company system laws, acquiring 10% or more of the voting stock of an insurance company or any of its parent companies is presumptively considered a change of control, although such presumption may be rebutted. Accordingly, any person who acquires, directly or indirectly, 10% or more of the voting securities of Max Capital without the prior approval of the Delaware or Indiana Insurance Commissioner will be in violation of these laws and may be subject to injunctive action requiring the disposition or seizure of those securities by the applicable state insurance commissioner. In addition, many U.S. state insurance laws require prior notification of state insurance departments of a change in control of a non-domiciliary insurance company doing business in that state. While these pre-notification statutes do not authorize the state insurance departments to disapprove a change of control, they authorize regulatory action in the affected state if particular conditions exist such as undue market concentration. Any future transactions that would constitute a change in control of Max Capital may require prior notification in those that have adopted pre-acquisition notification laws.
U.S. persons who own our common shares may have more difficulty in protecting their interests than U.S. persons who are shareholders of a U.S. corporation.
The Bermuda Companies Act, which applies to us, differs in certain material respects from laws generally applicable to U.S. corporations and their shareholders. Set forth below is a summary of certain significant provisions of the Bermuda Companies Act, including modifications adopted pursuant to our bye-laws, applicable to us which differ in certain respects from provisions of Delaware corporate law. Because the following statements are summaries, they do not discuss all aspects of Bermuda law that may be relevant to us and our shareholders.
Interested Directors. Bermuda law provides that if a director has a personal interest in a transaction to which the Company is also a party and if the director discloses the nature of this personal interest at the first opportunity, either at a meeting of directors or in writing to the directors, then the Company will not be able to declare the transaction void solely due to the existence of that personal interest and the director will not be liable to the company for any profit realized from the transaction. In addition, Bermuda law and our bye-laws provide that, after a director has made the declaration of interest referred to above, he is allowed to be counted for purposes of determining whether a quorum is present and to vote on a transaction in which he has an interest, unless disqualified from doing so by the chairman of the relevant board meeting. Under Delaware law such transaction would not be voidable if:
| • | the material facts as to such interested director’s relationship or interests are disclosed or are known to the board of directors and the board in good faith authorizes the transaction by the affirmative vote of a majority of the disinterested directors; |
| • | such material facts are disclosed or are known to the stockholders entitled to vote on such transaction and the transaction is specifically approved in good faith by vote of the majority of shares entitled to vote thereon; or |
| • | the transaction is fair as to the corporation as of the time it is authorized, approved or ratified. |
Under Delaware law, such interested director could be held liable for a transaction in which such director derived an improper personal benefit.
Mergers and Similar Arrangements. The amalgamation of a Bermuda company with another company or corporation (other than certain affiliated companies) requires the
38
Table of Contents
amalgamation agreement to be approved by the Company’s board of directors and by its shareholders. We may, with the approval of a majority of votes cast at a general meeting of our shareholders at which a quorum is present, amalgamate with another Bermuda company or with a body incorporated outside Bermuda. In the case of an amalgamation, a shareholder may apply to a Bermuda court for a proper valuation of such shareholder’s shares if such shareholder is not satisfied that fair value has been paid for such shares. Under Delaware law, with certain exceptions, a merger, consolidation or sale of all or substantially all the assets of a corporation must be approved by the board of directors and a majority of the outstanding shares entitled to vote thereon. Under Delaware law, a stockholder of a corporation participating in certain major corporate transactions may, under certain circumstances, be entitled to appraisal rights pursuant to which such stockholder may receive cash in the amount of the fair value of the shares held by such stockholder (as determined by a court) in lieu of the consideration such stockholder would otherwise receive in the transaction.
Shareholders’ Suit. The rights of shareholders under Bermuda law are not as extensive as the rights of shareholders under legislation or judicial precedent in many U.S. jurisdictions. Class actions and derivative actions are generally not available to shareholders under the laws of Bermuda. However, the Bermuda courts ordinarily would be expected to follow English case law precedent, which would permit a shareholder to commence an action in the name of the Company to remedy a wrong done to the Company where the act complained of is alleged to be beyond the corporate power of the Company, is illegal or would result in the violation of our memorandum of association or bye-laws. Furthermore, consideration would be given by the court to acts that are alleged to constitute a fraud against the minority shareholders or where an act requires the approval of a greater percentage of our shareholders than actually approved it. The winning party in such an action generally would be able to recover a portion of attorneys’ fees incurred in connection with such action. Our bye-laws provide that shareholders waive all claims or rights of action that they might have, individually or in the right of the Company, against any director or officer for any act or failure to act in the performance of such director’s or officer’s duties, except with respect to any fraud or dishonesty of such director or officer. Class actions and derivative actions generally are available to stockholders under Delaware law for, among other things, breach of fiduciary duty, corporate waste and actions not taken in accordance with applicable law. In such actions, the court has discretion to permit the winning party to recover attorneys’ fees incurred in connection with such action.
Indemnification of Directors. We may indemnify our directors or officers in their capacity as directors or officers of any loss arising or liability attaching to them by virtue of any rule of law in respect of any negligence, default, breach of duty or breach of trust of which a director or officer may be guilty in relation to us other than in respect of his own fraud or dishonesty. Under Delaware law, a corporation may indemnify a director or officer of the corporation against expenses (including attorneys’ fees), judgments, fines and amounts paid in settlement actually and reasonably incurred in defense of an action, suit or proceeding by reason of such position if such director or officer acted in good faith and in a manner he or she reasonably believed to be in or not opposed to the best interests of the corporation and, with respect to any criminal action or proceeding, such director or officer had no reasonable cause to believe his or her conduct was unlawful.
There are anti-takeover provisions contained in our bye-laws that could impede an attempt to replace or remove our management or delay or prevent the sale of our Company, which could diminish the value of our common shares.
Our bye-laws contain provisions that could delay or prevent changes in our management or a change of control that a shareholder might consider favorable. For example, they may prevent a shareholder from receiving the benefit from any premium over the market price of our common shares offered by a bidder in a potential takeover. Even in the absence of a takeover attempt, these provisions may adversely affect the
39
Table of Contents
prevailing market price of our common shares if they are viewed as discouraging takeover attempts in the future. For example, the board of directors’ authority as expressed in the bye-laws permits the board to issue up to 20,000,000 preferred shares and to fix the price, rights, preferences, privileges and restrictions of the preferred shares without any further vote or action by our shareholders. The issuance of preferred shares may delay or prevent a change in control transaction by making it more difficult for a bidder to acquire enough votes to influence or control our board of directors and the management of our Company.
Our bye-laws contain other provisions that could have a similar effect, including:
| • | election of our directors is staggered, meaning that the members of only one of three classes of our directors are elected each year; |
| • | shareholders have limited ability to remove directors; |
| • | shareholders must give advance notice to nominate directors at shareholder meetings; |
| • | the total voting power of any U.S. shareholder owning 9.5% or more of our common shares is automatically reduced to less than 9.5% of the total voting power of our capital stock, unless the reduction is otherwise waived by the unanimous consent of our board of directors; and |
| • | our directors may, in their absolute discretion, decline to register the transfer of any common shares if they believe that the transfer may expose us, any subsidiary, shareholder or client to adverse tax or regulatory treatment or if they believe that registration of the transfer under any federal or state securities law or under the laws of any other jurisdiction is required and the registration has not yet been effected. |
A shareholder may be required to sell its shares of Max Capital.
Our bye-laws provide that we have the option, but not the obligation, to require a shareholder to sell its common shares for their fair market value to us, to other shareholders or to third parties if our board of directors determines that ownership of our common shares by such shareholder may result in adverse tax, regulatory or legal consequences to us, any of our subsidiaries or any of our shareholders and that such sale is necessary to avoid or cure such adverse consequences.
You may have difficulty effecting service of process on us or enforcing judgments against us in the United States.
We are incorporated pursuant to the laws of Bermuda and our business is based in Bermuda. In addition, certain of our directors and officers reside outside the United States, and all or a substantial portion of our assets and the assets of such persons are located in jurisdictions outside the United States. Accordingly, we have been advised that there is doubt as to whether:
| • | a holder of our common shares would be able to enforce, in the courts of Bermuda, judgments of U.S. courts based upon the civil liability provisions of the U.S. federal securities laws; |
| • | a holder of our common shares would be able to bring an original action in the Bermuda courts to enforce liabilities against us or our directors and officers who reside outside the United States, based solely upon U.S. federal securities laws. |
We have also been advised that there is no treaty in effect between the United States and Bermuda providing for the enforcement of judgments of U.S. courts, and there are grounds upon which Bermuda courts may not enforce judgments of U.S. courts. Further, certain remedies available under U.S. federal and state laws, including U.S. federal securities laws, may not be available under Bermuda law. Because judgments of U.S. courts are not automatically enforceable in Bermuda, it may be difficult for you to recover against us based upon such judgments.
40
Table of Contents
Risks Related to Taxation
Max Capital and its non-U.S. subsidiaries may be subject to U.S. federal income taxation.
If Max Capital or any of our non-U.S. subsidiaries were treated as engaged in a trade or business in the United States, that entity could be subject to U.S. income and branch profits tax on all or a portion of the income that is effectively connected with such trade or business. We intend to operate in a manner such that neither Max Capital nor any of our non-U.S. subsidiaries, other than the Max Corporate Capital Vehicles (which are considered to have a taxable presence in the United States pursuant to a closing agreement between the IRS and the Corporation of Lloyd’s), MCS Ireland, MCS BDA and MCS UK , will be treated as being engaged in a trade or business in the United States. Accordingly, we do not believe that Max Capital or any of our non-U.S. subsidiaries, other than the Max Corporate Capital Vehicles, MCS Ireland, MCS BDA and MCS UK are or will be subject to U.S. federal income taxation on net income. However, this determination is essentially factual in nature, and there are no definitive standards provided by the Internal Revenue Code, regulations or court decisions as to what activities constitute being engaged in a trade or business within the United States. Accordingly, there can be no assurance that the U.S. Internal Revenue Service, or IRS, would not find that Max Capital or any of our non-U.S. subsidiaries, other than the Max Corporate Capital Vehicles, MCS Ireland, MCS BDA and MCS UK, is engaged in a trade or business in the United States. Any such income or branch profits tax could materially adversely affect our results of operations.
Even if Max Capital and our non-U.S. subsidiaries, other than the Max Corporate Capital Vehicles, MCS Ireland, MCS BDA and MCS UK, are not treated as being engaged in a trade or business in the United States, we may be subject to U.S. federal income tax on certain fixed or determinable annual or periodical gains, profits, and income (such as dividends and certain interest on investments) derived from sources within the United States. In addition, we will be subject to a U.S. excise tax that is imposed on reinsurance and insurance premiums received with respect to risks or insureds located in the United States.
U.S. legislative action or other changes in U.S. tax law might adversely affect us.
The tax treatment of non-U.S. insurance companies and their U.S. insurance subsidiaries has been the subject of discussion and legislative proposals in the U.S. Congress and by the U.S tax authorities. In particular, Congress has been considering legislation intended to eliminate certain perceived tax advantages of Bermuda and other non-U.S. insurance companies and U.S. insurance companies having Bermuda and other non-U.S. affiliates, including perceived tax benefits resulting principally from reinsurance between or among U.S. insurance companies and their Bermuda affiliates. Some U.S. insurance companies have also been lobbying Congress recently to pass such legislation. In addition, Congress has recently conducted hearings relating to the tax treatment of reinsurance between affiliates and is reported to be considering legislation that would adversely affect reinsurance between U.S. and non-U.S. affiliates. One such proposal would increase the excise tax rate on reinsurance premiums paid to affiliated non-U.S. reinsurers. A Senate Finance Committee staff discussion draft and other prior proposals would limit deductions for premiums ceded to affiliated non-U.S. reinsurers above certain levels. Enactment of some version of such legislation as well as other changes in U.S. tax laws, regulations and interpretations thereof to address these issues could result in our financial condition and results of operations being significantly and negatively affected.
Shareholders who are U.S. persons may recognize income for U.S. federal income tax purposes on our undistributed earnings.
Shareholders who are U.S. persons may recognize income for U.S. federal income tax purposes on our undistributed earnings if we are treated as a passive foreign investment
41
Table of Contents
company or a controlled foreign corporation or if we have generated more than a permissible amount of related person insurance income. In addition, gain on the disposition of our common shares may be treated as dividend income.
Passive Foreign Investment Company. In order to avoid significant potential adverse U.S. federal income tax consequences for any U.S. person who owns our common shares, we must not constitute a passive foreign investment company in any year in which such U.S. person is a shareholder. Those consequences could include increasing the tax liability of the investor, accelerating the imposition of the tax and causing a loss of the basis step-up on the death of the investor. In general, a non-U.S. corporation is a passive foreign investment company for a taxable year if 75% or more of its income constitutes passive income or 50% or more of its assets produce passive income. Passive income generally includes interest, dividends and other investment income. However, passive income does not include income derived in the active conduct of an insurance business by a company that is predominantly engaged in an insurance business. This exception is intended to ensure that income derived by a bona fide insurance company is not treated as passive income, except to the extent such income is attributable to financial reserves in excess of the reasonable needs of the insurance business. Currently, we do not believe that we maintain financial reserves in excess of the reasonable needs of our insurance business. If, because of a change in the business plan or for any other reason, we maintain excess financial reserves, we may be characterized as a passive foreign investment company. Although Max Capital’s insurance and reinsurance subsidiaries, which we refer to as the Insurance Subsidiaries, expect to engage predominantly in insurance activities that involve significant risk transfer and do not expect to have financial reserves in excess of the reasonable needs of their insurance businesses, we could nonetheless be deemed to be a passive foreign investment company. We may be characterized as a passive foreign investment company if any Insurance Subsidiary engages in certain non-traditional insurance activities that do not involve sufficient transfer of risk or if any company maintains financial reserves in excess of the reasonable needs of its respective insurance business. In addition, there may be other circumstances that may cause us not to satisfy the exception for insurance companies. For example, the IRS may disagree with our interpretation of the current scope of the active insurance company exception and successfully challenge our position that we qualify for the exception. In addition, the IRS may issue regulatory or other guidance that applies on either a prospective or retroactive basis under which we may fail to qualify for the active insurance company exception. While we do not believe that we are or will be a passive foreign investment company, we cannot assure shareholders that the IRS or a court will concur that we are not a passive foreign investment company with respect to any given year. If we were treated as a passive foreign investment company, the availability of the mark to market election is uncertain for shareholders who are U.S. persons. This election may under certain circumstances mitigate the negative tax consequences of an investment in a passive foreign investment company.
Controlled Foreign Corporation. Each U.S. person who, directly, indirectly, or through attribution rules, owns 10% or more of our common shares should consider the possible application of the controlled foreign corporation rules.
Each U.S. 10% shareholder of a controlled foreign corporation on the last day of the controlled foreign corporation’s taxable year generally must include in its gross income for U.S. federal income tax purposes its pro-rata share of the controlled foreign corporation’s subpart F income, even if the subpart F income has not been distributed. In general, a non-U.S. insurance company is treated as a controlled foreign corporation only if such U.S. 10% shareholders collectively own more than 25% of the total combined voting power or total value of the company’s capital stock for an uninterrupted period of 30 days or more during any year. We believe that, because of the anticipated dispersion of share ownership among holders and because of the restrictions in our bye-laws on transfer, issuance or repurchase of our common shares, shareholders will not be subject to treatment as U.S. 10% shareholders of a controlled foreign corporation. In addition, because under our bye-laws no single shareholder is permitted to exercise 9.5% or more of the total
42
Table of Contents
combined voting power, unless such provision is waived by the unanimous consent of the board of directors, we believe that our shareholders should not be viewed as U.S. 10% shareholders of a controlled foreign corporation for purposes of the controlled foreign corporation rules. We cannot assure shareholders, however, that these rules will not apply to our shareholders.
Related Person Insurance Income. If any Insurance Subsidiary’s related person insurance income determined on a gross basis were to equal or exceed 20% of its gross insurance income in any taxable year and direct or indirect insureds and persons related to such insureds were directly or indirectly to own more than 20% of the voting power or value of such Insurance Subsidiary’s capital stock, then a U.S. person who owns our common shares directly or indirectly on the last day of the taxable year most likely would be required to include in income for U.S. federal income tax purposes the U.S. person’s pro-rata share of such Insurance Subsidiary’s related person insurance income for the taxable year, determined as if such related person insurance income were distributed proportionately to such U.S. person at that date. Related person insurance income is generally underwriting profits and related investment income attributable to insurance or reinsurance policies where the direct or indirect insureds are direct or indirect U.S. shareholders or are related to such direct or indirect U.S. shareholders. We do not expect any Insurance Subsidiary will knowingly enter into insurance or reinsurance agreements in which, in the aggregate, the direct or indirect insureds are, or are related to, owners of 20% or more of our common shares. Currently, we do not believe that the 20% gross insurance income threshold has been met. However, we cannot assure shareholders that this is or will continue to be the case. Consequently, we cannot assure shareholders that a person who is a direct or indirect U.S. shareholder will not be required to include amounts in its income in respect of related person insurance income in any taxable year.
If a U.S. shareholder is treated as disposing of shares in a non-U.S. insurance corporation that has related person insurance income and in which U.S. persons own 25% or more of the voting power or value of the company’s capital stock, any gain from the disposition will generally be treated as dividend income to the extent of the U.S. shareholder’s portion of the corporation’s undistributed earnings and profits that were accumulated during the period that the U.S. shareholder owned the shares. In addition, such a shareholder will be required to comply with certain reporting requirements, regardless of the amount of shares owned by the direct or indirect U.S. shareholder. These rules should not apply to dispositions of our common shares because Max Capital is not itself directly engaged in the insurance business and because proposed U.S. Treasury regulations applicable to this situation appear to apply only in the case of shares of corporations that are directly engaged in the insurance business. We cannot assure shareholders, however, that the IRS will interpret the proposed regulations in this manner or that the proposed regulations will not be promulgated in final form in a manner that would cause these rules to apply to dispositions of our common shares.
U.S. tax-exempt organizations who own our common shares may recognize unrelated business taxable income.
A U.S. tax-exempt organization may recognize unrelated business taxable income if a portion of our subpart F insurance income is allocated to the organization. In general, subpart F insurance income will be allocated to a U.S. tax-exempt organization if either we are a controlled foreign corporation and the tax-exempt shareholder is a U.S. 10% shareholder or there is related person insurance income and certain exceptions do not apply. Although we do not believe that any U.S. persons will be allocated subpart F insurance income, we cannot assure shareholders that this will be the case.
43
Table of Contents
Changes in U.S. tax laws may be retroactive and could subject us and/or U.S. persons who own our common shares to U.S. income taxation on our undistributed earnings.
The tax laws and interpretations regarding whether a company is engaged in a U.S. trade or business, is a passive foreign investment company, is a controlled foreign corporation, or has related party insurance income are subject to change, possibly on a retroactive basis. There are currently no regulations regarding the application of the passive foreign investment company rules to an insurance company but new regulations or pronouncements may be forthcoming. It is possible that the IRS may issue new regulations or pronouncements interpreting or clarifying such rules. We are not able to predict if, when or in what form any such guidance will be provided and whether such guidance will have a retroactive effect.
We may become subject to taxes in Bermuda after March 28, 2016, which would have a significant and negative effect on our business and results of operations.
Under current Bermuda law, there is no income, corporate, profits, withholding, capital gains or capital transfer tax payable by Max Capital, Max Bermuda, Max Managers, MCS BDA or Max Diversified. Each of these entities has obtained from the Minister of Finance under The Exempted Undertakings Tax Protection Act 1966, as amended, an assurance that, in the event that Bermuda enacts legislation imposing tax computed on profits, income, any capital asset, gain or appreciation, or any tax in the nature of estate duty or inheritance, then the imposition of any such tax shall not be applicable to any of these entities, their operations or their shares, debentures or other obligations, until March 28, 2016. Given the limited duration of the Minister of Finance’s assurance we cannot be certain that we will not be subject to any Bermuda taxes after March 28, 2016. Our business and results of operations would be significantly and negatively affected if we were to become subject to taxes in Bermuda.
The impact of Bermuda’s commitment to the Organization for Economic Cooperation and Development to eliminate harmful tax practices is uncertain and could adversely affect our tax status in Bermuda.
The Organization for Economic Cooperation and Development has published reports and launched a global dialogue among member and non-member countries on measures to limit harmful tax competition. These measures are largely directed at counteracting the effects of tax havens and preferential tax regimes in countries around the world. According to the OECD, Bermuda is a jurisdiction that has substantially implemented the internationally agreed tax standard and as such is listed on the OECD “white list”. However, we are not able to predict whether any changes will be made to this classification or whether any such changes will subject us to additional taxes.
44
Table of Contents
ITEM 1B. UNRESOLVED STAFF COMMENTS
There are no unresolved staff comments regarding our current or periodic reports.
GLOSSARY OF SELECTED INSURANCE INDUSTRY TERMS AND NON-GAAP FINANCIAL MEASURES
| Annual total rate of return | Annual total rate of return is calculated by compounding the 12 consecutive monthly rates of return that are calculated by dividing monthly net performance (comprising net investment income and realized and unrealized gains/losses) by the beginning net asset value of that month. One is then subtracted from the product and the result is multiplied by 100. | |
| Book value per share | Book value per share is calculated as shareholders’ equity divided by the number of common shares outstanding at the balance sheet date | |
| Capacity | The percentage of shareholders’ equity, or the dollar amount of exposure, that an insurer or reinsurer is willing or able to place at risk. | |
| Case Reserves | Loss reserves established for individual claims (and as reported by our cedants in the case of reinsurance). | |
| Combined Ratio | The combined ratio is calculated by dividing the sum of losses, acquisition costs and general and administrative expenses by net premiums earned. A combined ratio below 100% indicates profitable underwriting prior to the consideration of investment income. | |
| Contract Binding | A term to describe a distribution channel for writing insurance using a network of appointed wholesale general agents. The agents have binding authority for the insurer, which allows them to quote and bind policies on behalf of the insurer. | |
| Diluted book value per share | Diluted book value per share is calculated as shareholders’ equity divided by the number of common shares outstanding at the balance sheet date, after considering the dilutive effects of stock-based compensation and warrants, calculated using the treasury stock method. | |
| Excess and surplus lines insurance | Any type of coverage that cannot be placed with an insurer admitted to do business in a certain jurisdiction. Risks placed in excess and surplus lines markets are often unique, unusual or difficult to place in conventional markets due to a shortage of capacity. | |
| Annualized five year return | Annualized five year return is calculated by compounding the 60 consecutive monthly rates of return that are calculated by dividing monthly net performance by the beginning net asset value of that month. One is then subtracted from the product and the result is multiplied by 100 and divided by 5. | |
| Incurred but not reported, or IBNR | Incurred but not reported reserves, which include reserves for the following:
• Pure incurred but not reported claims;
• Future development on known claims. | |
45
Table of Contents
| Loss ratio | The loss ratio is calculated by dividing losses by net premiums earned. | |
| Loss reserve | For an individual loss, an estimate of the amount the insurer expects to pay for the reported claim. For total losses, estimates of expected payments for reported and unreported claims. These may include amounts for claims expenses. | |
| Monthly net performance | Monthly net performance is the total income generated by an investment in the form of interest or dividends and the change in value of that investment in the form of unrealized or realized gains and losses. | |
| Net operating income | Net income excluding after-tax net realized and unrealized gains or losses on fixed maturities (this includes net realized and unrealized gains or losses on trading securities, net realized gains or losses on available for sale securities and changes in fair value of investment derivatives), after-tax net foreign exchange gains or losses and after-tax merger and acquisition expenses. We believe that this non-GAAP measure provides a better indication of management performance as realized and unrealized gains and losses on fixed maturities may fluctuate from period to period and foreign exchange gains and losses are typically outside the control of management. Merger and acquisition expenses are not indicative of expenses fundamental to the business and may fluctuate from period to period. | |
| Net operating return on average shareholders’ equity |
Net operating return on average shareholders’ equity is calculated by dividing the net operating income by the average of the beginning and ending shareholders’ equity. This non-GAAP measure allows management to assess how the company has performed in terms of wealth generated for our shareholders. | |
| Non-admitted carrier |
A non-admitted carrier is not licensed by the state, but is allowed to do business in that state. Non-admitted carriers are not bound by most of the rate and form regulations imposed on standard market companies, allowing them the flexibility to change the coverage offered and the rate charged without time constraints and financial costs associated with the filing process. | |
| Rate of return | Rates of return are calculated by dividing monthly net performance by the beginning net asset value of that month. One is then subtracted from the product and the result is multiplied by 100. | |
| Return on average shareholders’ equity |
Return on average shareholders’ equity is calculated by dividing net income by the average of the beginning and ending shareholders’ equity. This non-GAAP measure allows management to assess how we have performed in terms of wealth generated for our shareholders. | |
| Total return | See Annual total rate of return. | |
46
Table of Contents
The Company leases office space in Hamilton, Bermuda where the Company’s principal executive office is located. Additionally, the Company and its subsidiaries lease office space in the United States, Ireland, the United Kingdom and other jurisdictions sufficient for the operation of its insurance and reinsurance operations. We renew and enter into new leases in the ordinary course of business. For further discussion of our leasing commitments at December 31, 2009, see Note 20 of our audited consolidated financial statements.
We are from time to time, party to litigation and/or arbitration that arises in the normal course of our business operations. We are also subject to other potential litigation, disputes and regulatory or governmental inquiry.
Antitrust. Two lawsuits filed in the United States District Court for The Northern District of Georgia name Max Bermuda, along with approximately 100 other insurance companies and brokers. The claims in each case are that the defendants conspired to manipulate bidding practices for insurance policies in certain insurance lines and failed to disclose certain commission arrangements. The first of these cases was filed on April 4, 2006 by New Cingular Wireless Headquarter LLC and 16 other corporations. The complaint asserts statutory claims under the Sherman Antitrust Act, the Racketeer Influenced and Corrupt Organization Act, the antitrust laws of several states, as well as common law claims alleging breach of fiduciary duty and fraud. On October 16, 2006, the Judicial Panel on Multidistrict Litigation transferred the case to the U.S. District Court for the District of New Jersey for pretrial proceedings on a consolidated basis with other lawsuits raising smaller claims. The second action was filed October 12, 2007 by Sears, Roebuck & Co. and two affiliated corporations. The complaint in this suit charges Max Bermuda and certain other insurance company defendants with violations of the antitrust and consumer fraud laws of Georgia and other states and common law claims of inducement of breach of fiduciary duties, tortuous interference with contract, unjust enrichment, and aiding and abetting fraud. The Judicial Panel on Multidistrict Litigation transferred this case to the U.S. District Court for the District of New Jersey for consolidated pretrial proceedings in November 2007. We intend to defend ourselves vigorously in these suits but cannot at this time predict the outcome of the matters described above or estimate the potential costs related to defending the action. No liability has been established in our consolidated financial statements as of December 31, 2009.
While any proceeding contains an element of uncertainty, we currently do not believe that the ultimate outcome of all outstanding litigation, arbitrations and inquiries will have a material adverse effect on our consolidated financial condition, future operating results and/or liquidity, although an adverse resolution of a number of these items could have a material adverse effect on our results of operations in a particular fiscal quarter or year.
ITEM 4. SUBMISSION OF MATTERS TO A VOTE OF SECURITY HOLDERS
Annual General Meeting of Shareholders. Max Capital held its Annual General Meeting of Shareholders on November 2, 2009. For more information on the following proposals, see Max Capital’s proxy statement filed with the SEC on September 9, 2009.
(1) The shareholders elected two Class 3 directors of Max Capital to serve until Max Capital’s annual general meeting of shareholders in 2012:
| DIRECTOR | FOR | AGAINST | ABSTAIN | |||
| William Kronenberg III | 51,836,032 | 224,487 | 10,530 | |||
| James L. Zech | 50,443,724 | 1,624,498 | 2,827 |
47
Table of Contents
The terms of directors W. Marston Becker, Gordon F. Cheesbrough, K. Bruce Connell, Willis T. King Jr., James H. MacNaughton, Peter A. Minton, Steven M. Skala and Mario P. Torsiello continued after the meeting. The term of Mr. Zack H. Bacon III expired at the meeting.
(2) The shareholders authorized the election of one Class 3 director of Max Bermuda to serve until Max Bermuda’s annual general meeting of shareholders in 2012:
| DIRECTOR | FOR | AGAINST | ABSTAIN | |||
| Angelo Guagliano | 51,834,958 | 203,678 | 32,412 |
The terms of directors W. Marston Becker and Peter A. Minton continued after the meeting.
(3) The shareholders ratified the appointment of KPMG, Hamilton, Bermuda as Max Capital’s independent auditors for 2009:
| FOR | 51,922,447 | |
| AGAINST | 145,552 | |
| ABSTAIN | 3,051 |
(4) The shareholders authorized the ratification of the appointment of KPMG, Hamilton, Bermuda as Max Bermuda’s independent auditors for 2009:
| FOR | 51,921,428 | |
| AGAINST | 146,570 | |
| ABSTAIN | 3,051 |
48
Table of Contents
ITEM 5. MARKET FOR REGISTRANT’S COMMON EQUITY, RELATED STOCKHOLDER MATTERS AND ISSUER REPURCHASES OF EQUITY SECURITIES
(A) Market Information
Our common shares began trading on the Nasdaq National Market on August 14, 2001 under the symbol MXRE. Effective May 7, 2007, Max Capital’s symbol was changed to MXGL. Prior to August 14, 2001, there was no trading market for Max Capital common shares. The following table sets forth for the periods indicated the high and low reported sale price of our common shares on the Nasdaq Global Select Market.
| 2009 | 2008 | |||||||||||
| High | Low | High | Low | |||||||||
| First Quarter |
$ | 19.50 | $ | 13.00 | $ | 30.61 | $ | 25.72 | ||||
| Second Quarter |
$ | 19.47 | $ | 15.25 | $ | 26.85 | $ | 21.30 | ||||
| Third Quarter |
$ | 21.98 | $ | 17.16 | $ | 31.00 | $ | 20.70 | ||||
| Fourth Quarter |
$ | 23.69 | $ | 20.06 | $ | 26.10 | $ | 9.56 | ||||
(B) Holders
As of January 31, 2010, the number of holders of record of our common shares was 208.
(C) Dividends
We have paid a quarterly cash dividend of $0.10 per common share ($0.40 annually) since the second quarter of 2009. From the first quarter of 2008 to the second quarter of 2009 we paid a quarterly cash dividend of $0.09 per common share ($0.36 annually). For our cash dividends per common share on an annual basis see Item 6—Selected Financial Data. Any determination to pay cash dividends is at the discretion of our board of directors and is dependent upon the results of operations and cash flows, the financial position and capital requirements, general business conditions, legal, tax, regulatory and any contractual restrictions on the payment of dividends and other factors the board of directors deems relevant.
Max Capital’s ability to pay dividends depends, in part, on the ability of its subsidiaries to pay dividends to it. As a result of our structure and history of operations, we have looked principally to Max Bermuda to provide capital in those instances when subsidiary transfers are desirable to fund Max Capital’s dividend. Max Bermuda is subject to Bermuda regulatory constraints that affect its ability to pay dividends to Max Capital. Under the Bermuda Insurance Act, Max Bermuda must maintain a minimum solvency margin and minimum liquidity ratio and is prohibited from declaring or paying dividends if it does not comply or such action would result in noncompliance with the Bermuda Insurance Act. Max Bermuda must maintain a minimum solvency margin and minimum liquidity ratio in relation to its property and casualty business and maintain a further $0.25 million in relation to its long-term business in order to declare or pay dividends under the Bermuda Insurance Act. Additionally, the amounts of any such dividend shall not exceed the aggregate of that excess and other funds properly available for the payment of dividends, being funds arising out of its business, other than its long-term business.
Under the Bermuda Companies Act, Max Capital and Max Bermuda may only declare or pay a dividend if, among other matters, there are reasonable grounds for believing that it is, or would after the payment be, able to pay its respective liabilities as they become due.
In addition, each of Max Bermuda’s two letter of credit facilities prohibits Max Bermuda from paying dividends at any time that it is in default under the respective facility,
49
Table of Contents
which will occur if Max Capital’s shareholders’ equity or Max Bermuda’s shareholders’ equity is less than a specified amount as well as in certain other circumstances. Max Capital is party to one credit facility that imposes parallel restrictions on its ability to pay dividends.
(D) Securities Authorized for Issuance Under Equity Compensation Plans
Information with respect to Item 5(D) is set forth under Item 12.
(E) Performance Graph
Set forth below is a line graph comparing the yearly dollar change in the cumulative total shareholder return on our common shares from December 31, 2004 through December 31, 2009 against the Total Return Index for the S &P 500 Index and the Nasdaq Insurance Index for the same period. The performance graph assumes $100 invested on December 31, 2004 in the stock of Max Capital, the S&P 500 Index and the Nasdaq Insurance Index. It also assumes that all dividends are reinvested.
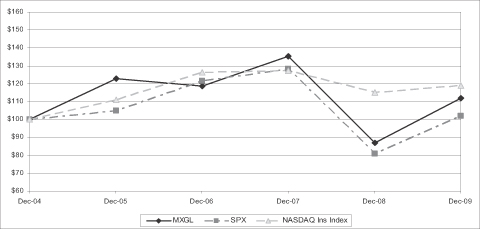
The performance reflected in the graph above is not necessarily indicative of future performance.
This graph is not “soliciting material,” is not deemed filed with the SEC and is not to be incorporated by reference in any filing by us under the Securities Act of 1933, as amended or the Securities and Exchange Act of 1934, whether made before or after the date hereof and irrespective of any general incorporation language in any such filing.
50
Table of Contents
ITEM 6. SELECTED FINANCIAL DATA
The following table of selected financial data should be read in conjunction with our audited consolidated financial statements and the notes thereto and with “Management’s Discussion and Analysis of Financial Condition and Results of Operations,” each contained herein.
| Year Ended December 31, | ||||||||||||||||||||
| 2009 | 2008 | 2007 | 2006 | 2005 | ||||||||||||||||
| (dollars in millions, except percentages and per share data) | ||||||||||||||||||||
| Gross premiums written |
$ | 1,375.0 | $ | 1,254.3 | $ | 1,078.3 | $ | 865.2 | $ | 1,246.0 | ||||||||||
| Net premiums earned |
834.4 | 813.5 | 817.9 | 665.0 | 1,053.5 | |||||||||||||||
| Net investment income |
169.7 | 181.6 | 188.2 | 150.0 | 106.8 | |||||||||||||||
| Net realized and unrealized gains (losses) on investments |
81.8 | (235.0 | ) | 183.8 | 79.0 | 39.1 | ||||||||||||||
| Net income (loss) |
246.2 | (175.3 | ) | 303.2 | 216.9 | 9.5 | ||||||||||||||
| Fixed maturities and cash |
4,944.3 | 4,603.3 | 4,060.9 | 3,470.0 | 2,996.9 | |||||||||||||||
| Other investments |
314.8 | 753.7 | 1,061.7 | 1,065.9 | 1,230.9 | |||||||||||||||
| Total assets |
7,339.7 | 7,252.0 | 6,538.5 | 5,849.0 | 5,305.2 | |||||||||||||||
| Shareholders’ equity |
1,564.6 | 1,280.3 | 1,583.9 | 1,390.1 | 1,185.7 | |||||||||||||||
| Book value per share |
28.01 | 22.94 | 27.54 | 23.06 | 20.16 | |||||||||||||||
| Diluted book value per share |
27.36 | 22.46 | 25.59 | 21.55 | 18.65 | |||||||||||||||
| Diluted earnings per share |
4.26 | (3.10 | ) | 4.75 | 3.43 | 0.18 | ||||||||||||||
| Cash dividends per share |
0.38 | 0.36 | 0.32 | 0.24 | 0.18 | |||||||||||||||
| Return on average shareholders’ equity |
17.3 | % | (12.2 | )% | 20.4 | % | 16.8 | % | 0.9 | % | ||||||||||
51
Table of Contents
ITEM 7. MANAGEMENT’S DISCUSSION AND ANALYSIS OF FINANCIAL CONDITION AND RESULTS OF OPERATIONS
The following is a discussion and analysis of our results of operations for the year ended December 31, 2009 compared to the year ended December 31, 2008 and for the year ended December 31, 2008 compared to the year ended December 31, 2007, and also a discussion of our financial condition as of December 31, 2009. This discussion and analysis should be read in conjunction with the audited consolidated financial statements and related notes that are included in this Annual Report on Form 10-K.
Executive Summary
Our results for the year ended December 31, 2009 reflect profitable underwriting results from all of our segments, a significant rebound in investment results and the continuation of our targeted diversification and expansion strategy.
Selected operating results for the year include:
| • | Total gross premiums written of $1,375.0 million, compared to $1,254.3 million in 2008, an increase of 9.6%; |
| • | Net income of $246.2 million, compared to a net loss of $175.3 million in 2008; |
| • | Net income per diluted share of $4.26, compared to a net loss per diluted share of $3.10 in 2008; |
| • | Shareholders’ equity at December 31, 2009 of $1,564.6 million, compared to $1,280.3 million at December 31, 2008, an increase of 22.2%; |
| • | Combined ratio on property and casualty business of 88.1%, compared to 91.9% in 2008; and |
| • | Net favorable prior year loss reserve development, excluding the effect of premium adjustments, on property and casualty business of $78.3 million, compared to $90.8 million in 2008. |
Gross premiums written in our property and casualty business totaled $1,331.2 million, an increase of 31.5% over 2008. Approximately 62.4%, or $199.0 million, of this growth came from our Bermuda/Dublin insurance, Bermuda/Dublin reinsurance and U.S. specialty segments, with a relatively balanced mix of short tail and long tail growth (short tail lines increased by $95.9 million, long tail lines increased by $102.6 million). The remaining 37.6% of our gross premium written increase came from our newest segment, Max at Lloyd’s, which was acquired as a pre-existing operation in November 2008 and, therefore, the premium is additive to Max’s results but is not entirely newly underwritten business.
Max at Lloyd’s was acquired in late 2008 for $16.3 million over its recorded net book value. For the year ended December 31, 2009 this segment has contributed $25.7 million of income before taxes to the group, writing a mix of property and casualty business at an attractive 86.3% combined ratio.
Underwriting results for all of our property and casualty segments were favorable in 2009. Our overall combined ratio improved from 91.9% in 2008 to 88.1% in 2009. This improvement is principally due to our increase in short tail lines of business and a lower level of property catastrophe losses in 2009 compared to 2008. Combined ratios in our four property and casualty segments for 2009 were 75.6% for Bermuda/Dublin insurance, 92.1% for Bermuda/Dublin reinsurance, 99.5% for U.S. specialty, and 86.3% for Max at Lloyd’s.
We focused on taking advantage of opportunities where we believed market conditions were favorable. Our Bermuda/Dublin insurance and Bermuda/Dublin reinsurance segments took advantage of favorable market dislocations in the professional
52
Table of Contents
liability arena to significantly increase our premium volume at attractive rates, while we also increased our premium volumes in short tail lines that were experiencing rate increases in the year, such as property and aviation.
Net investment income for the year ended December 31, 2009 decreased $11.9 million to $169.7 million compared to the 2008 year, principally due to the lower interest rate environment and our significant holdings in lower-yielding cash and cash equivalents. Net realized and unrealized gains on investments included within net income increased from a net loss of $235.0 million in 2008 to a net gain of $81.8 million in 2009. In addition, unrealized investment gains within shareholders’ equity increased by $50.5 million during the year ended December 31, 2009. The rebound in fair values of our fixed maturities and hedge fund investments in 2009 compared to the declines experienced in 2008 have significantly contributed to the improvement in net income and shareholders’ equity for the year ended December 31, 2009. The total return on our invested assets was 6.68% for the year ended December 31, 2009, compared to negative 0.09% for the 2008 year.
The credit quality of our fixed maturities investment portfolio remained high. At December 31, 2009, 62.8% of our fixed maturities portfolio is AAA-rated or better, and 3.4% of our portfolio is rated BB+ or less. At December 31, 2009 the allocation of our invested assets is 13.4% in cash and cash equivalents, 80.6% in fixed maturities, and 6.0% in other investments (principally hedge funds).
We anticipate market conditions to be challenging in 2010 but continue to present select opportunities. We believe the improvement in the financial markets together with the relatively benign year for property catastrophe losses has resulted in increased insurance and reinsurance capacity in many lines of business. In some cases supply currently exceeds demand. However, whilst pricing is soft in several product markets, it is not uniform across all lines of business and market segments. We believe we can select and compete in those lines of business that remain attractively priced while shrinking our presence in the less profitable lines.
Consistent with our practice of identifying new opportunities and adding talented underwriting teams to the Company, we intend to begin underwriting reinsurance business in Latin America in 2010 through local offices in Brazil and Columbia, placing these risks with our Max at Lloyd’s and Max Re Europe entities. We believe that by expanding our global reach and geographic diversity, we will be better positioned in a growing reinsurance market.
Drivers of Profitability
Revenues
We derive operating revenues from premiums from our insurance and reinsurance businesses. Additionally, we recognize returns from our investment portfolios.
Insurance and reinsurance premiums are a function of the amount and type of contracts written as well as prevailing market prices. Property and casualty premiums are earned over the terms of the underlying coverage. Life and annuity reinsurance premiums are generally earned when the premium is due from policyholders. Each of our insurance and reinsurance contracts contain different pricing, terms and conditions and expected profit margins. Therefore, the amount of premiums is not necessarily an accurate indicator of our anticipated profitability. Premium estimates are based upon information in underlying contracts, data received from clients and from premium audits. Changes in premium estimates are expected and may result in significant adjustments in any period. These estimates change over time as additional information regarding the underlying business volume of our clients is obtained. There is often a delay in the receipt of updated premium information from clients due to the time lag in preparing and reporting the data to us. After review by our underwriters and finance staff, we increase or decrease premium estimates as updated information from our clients is received.
53
Table of Contents
Our net investment income is a function of the average invested assets and the average yield that we earn on those invested assets. The investment yield on our fixed maturities investments is a function of market interest rates as well as the credit quality and maturity of our fixed maturities portfolio. Our net realized and unrealized gains or losses on investments includes realized capital gains or losses on our fixed maturity securities and changes in fair value of our trading securities and other investments. We recognize the realized capital gains or losses at the time of sale, and they, along with the change in fair value of our trading securities, reflect the results of changing market values and conditions, including changes in market interest rates and changes in the market’s perception of the credit quality of our fixed maturities holdings. The change in fair value of other investments is a function of the success of the funds in which we are invested, which depends on, among other things, the underlying strategies of the funds, the ability of the fund managers to execute the fund strategies, general economic and investment market conditions.
Expenses
Our principal expenses are losses and benefits, acquisition costs, interest expense and general and administrative expenses. Losses and benefits are based on the amount and type of insurance and reinsurance contracts written by us during the current reporting period and information received during the current reporting period from clients pertaining to contracts written in prior years. We record losses and benefits based on actuarial estimates of the expected losses and benefits to be incurred on each contract written. The ultimate losses and benefits depend on the actual costs to settle these liabilities. We increase or decrease losses and benefits estimates as actual claim reports are received. Our ability to make reasonable estimates of losses and benefits at the time of pricing our contracts is a critical factor in determining profitability.
Acquisition costs consist principally of ceding commissions paid to ceding clients and brokerage expenses. These typically represent a negotiated percentage of the premiums on insurance and reinsurance contracts written. Acquisition costs are stated net of ceding commissions associated with premiums ceded to our quota share partners on our insurance and reinsurance business. These ceding commissions are designed to compensate us for the costs of producing the portfolio of risks ceded to our reinsurers. We defer and amortize these costs over the period in which the related premiums are earned.
Interest expense principally reflects interest on any bank loans and interest on our senior notes. In addition, interest expense also includes the net interest charge on funds withheld from reinsurers under reinsurance and retrocessional contracts. Interest expense on funds withheld from other reinsurers under reinsurance and retrocessional contracts will vary principally due to changes in the balance of funds withheld. Finally, interest expense also includes interest on deposit contracts.
General and administrative expenses are principally employee salaries, bonuses and related personnel costs, office rent, amortization of leasehold improvements, information technology expenditure and other operating costs. These costs generally do not vary with the amount of premiums written.
Critical Accounting Policies
Our consolidated financial statements are prepared in accordance with U.S. GAAP, which require management to make estimates and assumptions. We believe that the following accounting policies affect the more significant judgments and estimates used in the preparation of our consolidated financial statements.
Revenue recognition
We follow Accounting Standards Codification, ASC, 944 – Financial Services – Insurance in determining the accounting for our reinsurance and insurance products.
54
Table of Contents
Assessing whether or not the contracts we write meet the conditions for risk transfer requires judgment. The determination of risk transfer is based, in part, on the use of actuarial and pricing models and assumptions.
Insurance revenue recognition
Our insurance premiums are recorded at the inception of each contract, based upon contract terms. The amount of minimum and/or deposit premium is usually contractually documented at inception, and variances between deposit premium and final premium are generally small. An adjustment is posted to amend the minimum and/or deposit premium if there are changes in underlying exposures insured, based on information received from our clients. Premiums are earned on a pro rata basis over the coverage period.
Reinsurance revenue recognition
Our reinsurance premiums are recorded at the inception of each contract, based upon contract terms and information received from ceding clients and their brokers. For excess of loss contracts, the amount of minimum and/or deposit premium is usually contractually documented at inception, and variances between this premium and final premium are generally small. An adjustment is posted to amend the minimum and/or deposit premium, when notified, if there are changes in underlying exposures insured. For quota share or proportional reinsurance contracts, gross premiums written are normally estimated at inception based on information provided by cedants and/or brokers. We generally account for such premiums using the client’s initial estimates, and then adjust them as more current information becomes available, with such adjustments recorded as premiums written in the period they are determined. We believe that the ceding clients’ estimate of the volume of business they expect to cede to us represents the best estimate of gross premium written at the beginning of the contract. As the contract progresses, we monitor actual premium received in conjunction with correspondence from the ceding client in order to refine our estimate. Variances from original premium estimates are normally greater for quota share contracts than excess of loss contracts. Premiums are earned on a pro rata basis over the coverage period. The net adjustments to gross premiums written as a result of changes in premium estimates for the years ended December 31, 2009, 2008 and 2007 were $10.9 million, $46.0 million and $9.3 million, respectively. Such adjustments are generally the result of changing market conditions experienced by our clients.
Additional premiums
Certain contracts that we write are retrospectively rated and we are entitled to additional premium should losses exceed pre-determined, contractual thresholds. These additional premiums are based upon contractual terms and the only element of management judgment involved is with respect to the estimate of the amount of losses that we expect to be ceded to us. Additional premiums are recognized at the time loss thresholds specified in the contract are exceeded and are earned over the policy period. Changes in estimates of losses recorded on contracts with additional premium features will result in changes in additional premiums based on contractual terms.
Additional premiums assumed and ceded, related additional acquisition costs, related net losses and the net impact on operating results for each of the three years to December 31, 2009 are as follows:
| 2009 | 2008 | 2007 | ||||||||||
| (000’s) | (000’s) | (000’s) | ||||||||||
| Additional premiums assumed |
$ | 10,022 | $ | 9,419 | $ | (6,404 | ) | |||||
| Additional premiums ceded |
(1,503 | ) | (1,413 | ) | 960 | |||||||
| Additional acquisition costs |
— | — | (43 | ) | ||||||||
| Net losses |
— | — | 13,201 | |||||||||
| Net operating result |
$ | 8,519 | $ | 8,006 | $ | 7,714 | ||||||
55
Table of Contents
For each of the years ended December 31, 2009, 2008 and 2007, additional premiums relate to contracts where the coverage period had expired. Therefore, these additional premiums, representing revisions to our initial estimate of ultimate premiums as a result of changes in the estimate of loss reserves, were fully earned since the exposure period has ended.
Reinstatement premiums
Certain of the contracts we write, particularly the property reinsurance risks, provide for reinstatements of coverage. Reinstatement premiums are the premiums for the restoration of the insurance or reinsurance limit of a contract to its full amount after a loss occurrence by the insured or reinsured and principally relate to our property catastrophe reinsurance contracts. The purpose of optional and required reinstatements is to permit the insured / reinsured to reinstate the insurance coverage at a pre-determined price level once a loss event has penetrated the insured layer. In addition, required reinstatement premiums permit the insurer / reinsurer to obtain additional premiums to cover the additional loss limits provided.
We accrue for reinstatement premiums resulting from losses recorded. Such accruals are based upon contractual terms and the only element of management judgment involved is with respect to the amount of losses recorded. Changes in estimates of losses recorded on contracts with reinstatement premium features will result in changes in reinstatement premiums based on contractual terms. Reinstatement premiums are recognized at the time we record losses and are earned on a pro-rata basis over the coverage period. Reinstatement premiums assumed and ceded for each of the three years to December 31, 2009 are not material to our financial results.
Life and annuity reinsurance premium
Our life and annuity reinsurance premiums are recorded at the inception of the contract based on actual premiums received and are fully earned at that time. We may periodically receive additional premiums, which are recorded and earned when received. Additional premium receipts are generally infrequent and not material.
Premiums receivable
For quota share or proportional contracts, we are entitled to receive premium as the ceding client collects the premium under contractual reporting and payment terms, which are usually quarterly. Premiums are usually collected over a two year period on our quota share or proportional contracts. For excess of loss contracts, premium is generally paid in contractually stipulated installments with payment terms ranging from payment at the inception of the contract to four quarterly payments. As a result of recognizing the estimated gross premium written at the inception of the policy and collecting that premium over an extended period, we include a premium receivable asset on our balance sheet. We actively monitor our premium receivable asset to consider whether we need an allowance for doubtful accounts. As part of this process, we consider the credit quality of our cedants and monitor premium receipts versus expectations. We also seek to include a right of offset in the contract terms. Since commencing our operations, premiums receivable written off have not been material and, currently, no material premiums receivable are significantly beyond their due dates or in dispute.
Property and casualty losses
The liability for losses, including loss adjustment expenses, represents estimates of the ultimate cost of all losses incurred but not paid as of the balance sheet date. In estimating reserves, we utilize a variety of standard actuarial methods. Although these actuarial methods have been developed over time, assumptions about anticipated size of loss and loss emergence patterns are subject to fluctuations. Newly reported loss information from
56
Table of Contents
clients is the principal contributor to changes in the loss reserve estimates. These estimates, which generally involve actuarial projections, are based upon an assessment of known facts and circumstances, as well as estimates of future trends in claims severity and frequency and judicial theories of liability factors, including the actions of third parties, which are beyond our control.
We rely on data reported by clients when calculating reserves. The quality of the data varies from client to client. On a periodic basis, the clients’ loss data is analyzed by our actuarial and claims management teams to ascertain its quality and credibility. This process may involve comparisons with submission data and industry loss data, claims audits and inquiries about the methods of establishing case reserves associated with large industry events.
When determining reserves, we also consider historical data, industry loss trends, legal developments, changes in social attitudes and economic conditions, including the effects of inflation.
We believe the provision for outstanding losses and benefits will be adequate to cover the ultimate net cost of losses incurred to the balance sheet date but the provision is necessarily an estimate and may ultimately be settled for a significantly greater or lesser amount. These estimates are reviewed regularly and any adjustments to the estimates are recorded in the period they are determined.
In estimating reserves we, consistent with industry practice, utilize a variety of standard actuarial methods together with management judgment. The loss reserve selection from these various methods is based on the loss development characteristics of the specific line of business and specific contracts which take into consideration coverage terms, type of business, maturity of loss data, reported claims and paid claims. We do not necessarily utilize the same actuarial method or group of actuarial methods for all contracts within a line of business or segment, as variations between contracts result in a number of different methods or groups of methods being appropriate. These actuarial methods have been designed to address the lag in loss reporting in the insurance industry as well as the delay in obtaining information that would allow us to more accurately estimate future payments. There is often a time lag between reinsurance clients establishing case reserves and re-estimating their reserves, and notifying us of the new or revised case reserves. Reporting lag is more pronounced in our reinsurance contracts than in our insurance contracts and more pronounced in casualty business, which generally has a longer claims pay-out period, than property business, which generally has a shorter claims pay-out period. On casualty reinsurance transactions the reporting lag will generally be 60-90 days after the end of a reporting period, but can be longer than this in some cases. Based on the experience of our actuaries and management, we select loss development factors and trending techniques to mitigate the problems caused by reporting lags and claims tails. We regularly evaluate and update our loss development and trending factor selections using client specific and industry data. The principal actuarial methods we use to perform our quarterly loss reserve analysis may include one or more of the following methods:
Expected Loss Ratio Method. To estimate ultimate losses under the expected loss ratio method, we multiply earned premiums by an expected loss ratio. The expected loss ratio is selected utilizing industry data, historical client data, frequency-severity and rate level forecasts and professional judgment.
Paid Loss Development Method. This method estimates ultimate losses by calculating past paid loss development factors and applying them to exposure periods with further expected paid loss development. The paid loss development method assumes that losses are paid at a rate consistent with the historical rate of payment. It provides an objective test of reported loss projections because paid losses contain no reserve estimates. For many coverages, claim payments are made very slowly and it may take years for claims to be fully reported and settled.
57
Table of Contents
Reported Loss Development Method. This method estimates ultimate losses by calculating past reported loss development factors and applying them to exposure periods with further expected reported loss development. Since reported losses include payments and case reserves, changes in both of these amounts are incorporated in this method. This approach provides a larger volume of data to estimate ultimate losses than paid loss methods. Thus, reported loss patterns may be less varied than paid loss patterns, especially for coverages that have historically been paid out over a long period of time but for which claims are reported relatively early and case loss reserve estimates established.
Bornhuetter-Ferguson Paid Loss Method. The Bornhuetter-Ferguson paid loss method is a combination of the paid loss development method and the expected loss ratio method. The amount of losses yet to be paid is based upon the expected loss ratios. This method avoids some of the distortions that could result from a large development factor being applied to a small base of paid losses to calculate ultimate losses. This method will react slowly if actual paid loss experience develops differently than historical paid loss experience because of major changes in rate levels, retentions or deductibles, the forms and conditions of coverage, the types of risks covered or a variety of other factors.
Bornhuetter-Ferguson Reported Loss Method. The Bornhuetter-Ferguson reported loss method is similar to the Bornhuetter-Ferguson paid loss method with the exception that it uses reported losses and reported loss development factors.
Frequency-Severity Method. This method is based on assumptions about the number of claims that will impact a transaction and the average ultimate size of those claims. On excess of loss contracts, reported claims in lower layers provide insight to the expected number of claims that will likely impact the upper layers.
Although these actuarial methods for establishing reserves have been developed over time, assumptions about anticipated size of loss and loss emergence patterns are subject to fluctuation. Newly reported loss information from our clients or insureds is the principal contributor to changes in our loss reserve estimates. The selection of appropriate actuarial methods to establish reserves may change over time as the underlying loss information becomes more seasoned. Additional discussion of the reserving practices by business segment is included below.
Property and casualty losses, net of related reinsurance recoverables, are charged to income as incurred. Unpaid losses (including loss adjustment expenses) represent the accumulation of:
| • | case reserves, which are reserves established for individual claims (and as reported by our cedants in the case of reinsurance); |
| • | incurred but not reported reserves (which we refer to as IBNR), which include reserves for the following: |
| • | Pure incurred but not reported claims; |
| • | Future development on known claims. |
The table below breaks our reserves as of December 31, 2009 into these components by segment.
| In millions of U.S. Dollars |
Bermuda / Dublin insurance |
Bermuda / Dublin reinsurance |
U.S. specialty | Max at Lloyd’s |
Life and annuity reinsurance | ||||||||||
| Case reserves |
$ | 297.5 | $ | 406.4 | $ | 68.6 | $ | 139.6 | $ | 1,372.5 | |||||
| IBNR |
942.5 | 1,064.3 | 120.5 | 138.7 | — | ||||||||||
| Total |
$ | 1,240.0 | $ | 1,470.7 | $ | 189.1 | $ | 278.3 | $ | 1,372.5 | |||||
58
Table of Contents
Our reserving methodologies, as discussed above, uses a loss reserving model that calculates a point estimate for our ultimate losses, as opposed to a methodology that develops a range of estimates. Although we believe that our assumptions and methodologies are reasonable, we cannot be certain that our ultimate payments will not vary, perhaps materially, from the estimates we have made. If we determine that adjustments to an earlier estimate are appropriate, those adjustments are reflected in our net income during the period in which we determine these adjustments. The establishment of new reserves, or the adjustment of reserves for reported claims, could result in significant upward or downward changes to our financial condition or results of operations in any particular period. We regularly review and update these estimates using the most current information available to us.
Development of our prior period incurred losses for each of the three years ended December 31, 2009 is reported in Note 7—”Property and casualty losses and loss adjustment expenses” to our consolidated financial statements. Our development of prior period loss reserves has been less than 6.0% in each of the three years ending December 31, 2009 and an average of 3.7% over the past eight years. Based on this experience, we currently believe it reasonably likely that loss reserves could change 3.5% from currently reported amounts. This change could be higher or lower depending on our client reported data and potential future commutation of reserves. As at December 31, 2009, we estimate that a 3.5% change in loss reserves would impact our net income and shareholders’ equity by $111.2 million. Depending on whether the reasonably likely adjustments to loss reserves are on contracts ceded to one of our various reinsurance arrangements, there may also be a partially offsetting change in the losses recoverable, net income and shareholders’ equity.
Bermuda/Dublin insurance loss reserve process
Our Bermuda/Dublin casualty insurance loss reserves, which include case reserves, amount for IBNR reserves and loss adjustment expenses, are compiled on a portfolio basis and are computed on an undiscounted basis. The majority of our Bermuda/Dublin insurance reserves are related to casualty business. Historically, losses associated with casualty business have had a long claim-tail, which is the time period between the occurrence of a loss and the time it is settled by the insurer. Casualty losses are also generally more susceptible to litigation and can be significantly affected by changing contract interpretations and a changing legal environment. Due to the long claim-tail nature of casualty business, a high degree of judgment is involved in establishing loss reserves.
Our Bermuda/Dublin property insurance loss reserves, which include case reserves, IBNR reserves and loss adjustment expenses, are compiled on a portfolio basis and are computed on an undiscounted basis. These reserves are adjusted for losses reported by our clients and for our estimate of losses resulting from catastrophe events, based on a detailed, location specific analysis of our clients’ properties impacted by the events.
In connection with our ongoing analysis of our Bermuda/Dublin insurance loss reserves, we review loss reports received from our clients to confirm that submitted claims are covered under the contract terms and take into account industry loss activity and industry loss trends. We also consider historical data, legal developments, changes in social attitudes and economic conditions, including the effects of inflation. As additional data becomes available and is reviewed, we may revise our Bermuda/Dublin insurance reserve estimates to reflect this additional data, which may result in increases or decreases to reserves for insured events of prior years. These adjustments are recorded in the period they are determined.
We establish and review our Bermuda/Dublin insurance loss reserves on a quarterly basis. The process for adjusting our Bermuda/Dublin insurance loss reserves is based upon loss reports received from clients, which are input into actuarial models. We use a variety
59
Table of Contents
of actuarial techniques and methods in estimating our ultimate liability for property and casualty insurance losses and loss expenses, together with management judgment. As noted above, these methods include paid loss development, incurred loss development, paid and incurred Bornhuetter-Ferguson methods and frequency-severity methods. This actuarial data is analyzed by product, type of risk, coverage and accident or policy year. Industry loss experience is also used to supplement our own data in selecting long term trend and development factors and in areas where our own data or the insureds’ data is limited. The table below breaks our insurance reserves as of December 31, 2009 and 2008 into casualty and property components.
| In millions of U.S. Dollars |
December 31, 2009 |
December 31, 2008 | ||||
| Casualty |
$ | 1,108.8 | $ | 981.5 | ||
| Property |
131.2 | 92.3 | ||||
| Total |
$ | 1,240.0 | $ | 1,073.8 | ||
Bermuda/Dublin reinsurance loss reserve process
Our Bermuda/Dublin reinsurance loss reserves include case reserves, amounts for IBNR reserves and loss adjustment expenses. The reserves are compiled on a contract-by-contract basis and are computed on an undiscounted basis. The majority of our Bermuda/Dublin reinsurance reserves are related to casualty business. Historically, losses associated with casualty business have had a long claim-tail, the time period between the occurrence of a loss and the time it is settled by the insurer we reinsure. Casualty losses are also more susceptible to litigation and can be significantly affected by changing contract interpretations and a changing legal environment. Due to the long claim-tail nature of casualty business, a high degree of judgment is involved in establishing loss reserves.
Our Bermuda/Dublin property reinsurance loss reserves are established on a contract-by-contract basis, based on expected loss ratios, losses reported by clients and our assessment of potential losses from catastrophe events. After a catastrophe event, our initial estimate is based upon a combination of internal and external catastrophe models, and client- and location-specific assessments and reports, when and as available. Loss estimates are subsequently refined based on broker advices and client notifications.
We establish and review our Bermuda/Dublin reinsurance loss reserves on a quarterly basis. The process for establishing our Bermuda/Dublin reinsurance loss reserves is based upon actuarial analysis of exposure loss data provided by clients. We use a variety of actuarial techniques and methods in estimating our ultimate liability for Bermuda/Dublin reinsurance losses and loss expenses, together with management judgment. These methods include expected loss ratio, paid loss development, incurred loss development, paid and incurred Bornhuetter-Ferguson methods and frequency-severity methods. This actuarial data is analyzed by product, type of risk, coverage and accident or policy year, as appropriate. Industry loss experience is also used to supplement our own data in selecting development factors in areas where our own data or the clients’ data is limited.
With respect to our reinsurance products, we rely on loss data reported by our clients when calculating our reserves. The quality of the loss data varies from client to client. On a periodic basis, the clients’ loss data is analyzed by our actuarial and claims management teams to ascertain its quality and credibility. This process may involve comparisons with submission data and industry loss data, claim audits and inquiries about the methods of establishing case reserves or reserves associated with large industry events. There is often a time lag between our clients establishing case reserves and re-estimating their reserves, and notifying us of the new or revised case reserves. On casualty reinsurance transactions, the reporting lag will generally be 60-90 days after the end of a reporting period, but can be longer in some cases. Appropriate selection of loss development factors is used to mitigate these problems. We utilize the latest information received from our clients and work to ensure that the loss data is current. However, due to the varying quality
60
Table of Contents
of data from our reinsureds and the inherent reporting delays, our Bermuda/Dublin reinsurance reserves will have more uncertainty than our Bermuda/Dublin insurance reserves, where we receive loss information directly from our insureds.
As of December 31, 2009 and December 31, 2008, approximately 29% and 30%, respectively, of the total Bermuda/Dublin reinsurance reserves were on contracts that are recorded at contractual aggregate limits. Mitigating the uncertainty inherent in the reserves of our Bermuda/Dublin reinsurance portfolio is the fact that a large portion of our recorded reinsurance reserves are attributable to contracts that are recorded at contractual aggregate limits.
When determining reserves, we also consider additional historical data, industry loss trends, legal developments, changes in social attitudes and economic conditions, including the effects of inflation. Rapidly changing economic conditions will increase the inherent uncertainty of the reserve estimates. As additional data becomes available and is reviewed, we revise our Bermuda/Dublin reinsurance reserve estimates to reflect this additional data, which may result in increases or decreases to reserves for insured events of prior years. These adjustments are recorded in the period they are determined. The table below breaks our Bermuda/Dublin reinsurance reserves as of December 31, 2009 and 2008 into casualty and property components.
| In millions of U.S. Dollars |
December 31, 2009 |
December 31, 2008 | ||||
| Casualty |
$ | 1,237.5 | $ | 1,210.0 | ||
| Property |
233.2 | 262.5 | ||||
| Total |
$ | 1,470.7 | $ | 1,472.5 | ||
U.S. specialty loss reserve process
On a gross of reinsurance basis through December 31, 2009 the majority of the U.S. specialty business we have written is property business. On a net of reinsurance basis, the earned premium is approximately equally split between property and casualty. Our U.S. specialty property and casualty loss reserves, which include case reserves, amounts for IBNR reserves and loss adjustment expenses, are compiled on a portfolio basis and are computed on an undiscounted basis.
We determine our IBNR reserves by first projecting the ultimate expected losses by product within each line of business. We then subtract paid losses and case reserves from the ultimate loss reserves. The remainder is our incurred but not reported reserves. The level of IBNR reserves in relation to total reserves depends upon the characteristics of the line of business, particularly with respect to the speed that losses are reported and outstanding loss reserves are adjusted. Lines for which losses are reported quickly will have a lower percentage of IBNR reserves than lines for which losses are reported more slowly, and lines for which reserve volatility is low will have a lower percentage of IBNR reserves than higher volatility lines.
The case reserves related to our U.S. specialty business are initially set by our claims personnel or independent claims adjusters we retain. The case reserves are subject to our review, with a goal of setting them at the ultimate expected loss amount as soon as possible when the information becomes available.
We establish and review our U.S. specialty IBNR loss and loss expense reserves on a quarterly basis. We use a variety of actuarial techniques and methods in estimating our ultimate liability for excess and surplus lines insurance losses and loss expenses, together with management judgment. These methods include paid loss development, incurred loss development, paid and incurred Bornhuetter-Ferguson methods. Industry loss experience is also used to supplement our own data in selecting loss reporting and payment patterns and expected loss ratios. The table below breaks our U.S. specialty reserves as of December 31, 2009 and 2008 into casualty and property components.
61
Table of Contents
| In millions of U.S. Dollars |
December 31, 2009 |
December 31, 2008 | ||||
| Casualty |
$ | 117.9 | $ | 72.8 | ||
| Property |
71.2 | 45.2 | ||||
| Total |
$ | 189.1 | $ | 118.0 | ||
Max at Lloyd’s loss reserve process
Our Max at Lloyd’s property and casualty reinsurance loss reserves, which include case reserves, amounts for IBNR reserves and loss adjustment expenses, are compiled on a portfolio basis and are computed on an undiscounted basis. The majority of the reinsurance business written by the Syndicates is property business. These reserves are adjusted for losses reported by our clients and for our estimate of losses resulting from catastrophe events, based on a detailed, location specific analysis of our clients’ properties impacted by the events.
Our Max at Lloyd’s casualty insurance loss reserves, which include case reserves, amounts for IBNR reserves and loss adjustment expenses, are compiled on a portfolio basis and are computed on an undiscounted basis. Historically, losses associated with casualty business have had a long claim-tail, which is the time period between the occurrence of a loss and the time it is settled by the insurer. Casualty losses are also generally more susceptible to litigation and can be significantly affected by changing contract interpretations and a changing legal environment. Due to the long claim-tail nature of casualty business, a high degree of judgment is involved in establishing loss reserves.
The loss reserving process involves the use of external actuarial consultants to assist management in the estimation of IBNR reserves and loss adjustment expenses. Loss reserves are established and reviewed on a quarterly basis. The process for adjusting the loss reserves is based upon loss reports received from clients, which are input into actuarial models. A variety of actuarial techniques and methods are used in estimating our ultimate liability for property and casualty insurance and reinsurance losses and loss expenses, together with management judgment. As noted above, these methods include paid loss development, incurred loss development, paid and incurred Bornhuetter-Ferguson methods and frequency-severity methods. This actuarial data is analyzed by product, type of risk, coverage and accident or policy year. Industry loss experience is also used to supplement our own data in selecting long term trend and development factors and in areas where our own data or the insureds’ data is limited.
In connection with our ongoing analysis of our Max at Lloyd’s loss reserves, we review loss reports received from our clients to confirm that submitted claims are covered under the contract terms and take into account industry loss activity and industry loss trends. We also consider historical data, legal developments, changes in social attitudes and economic conditions, including the effects of inflation. As additional data becomes available and is reviewed, we may revise our Max at Lloyd’s reserve estimates to reflect this additional data, which may result in increases or decreases to reserves for insured events of prior years. These adjustments are recorded in the period they are determined.
The table below breaks our Max at Lloyd’s loss reserves as of December 31, 2009 and 2008 into casualty and property components.
| In millions of U.S. Dollars |
December 31, 2009 |
December 31, 2008 | ||||
| Casualty |
$ | 218.7 | $ | 225.1 | ||
| Property |
59.6 | 48.8 | ||||
| Total |
$ | 278.3 | $ | 273.9 | ||
62
Table of Contents
Disputes
In connection with our ongoing analysis of our Bermuda/Dublin insurance, Bermuda/Dublin reinsurance, U.S. specialty, and Max at Lloyd’s loss reserves, we review loss notifications and reports received from our clients to confirm that submitted claims are covered under the contract terms. Disputes with clients arise in the ordinary course of business due to coverage issues such as classes of business covered and interpretation of contract wording. We typically resolve any disputes through negotiations that could vary from a simple exchange of email correspondence to arbitration with a panel of experts. Our contracts generally provide for dispute resolution through arbitration. We are not currently involved in any coverage disputes that we believe would, individually or in the aggregate, be material to us.
Property and casualty loss reserve development
The following table presents the development of balance sheet property and casualty loss reserves calculated in accordance with U.S. GAAP, as of December 31, 2000 through December 31, 2009. This table does not present accident or policy year development data. The top line of the table shows the gross reserves at the balance sheet date for each of the indicated years and is reconciled to the net reserve by adjusting for reinsurance recoverables. This represents the estimated amount of net claims and claim expenses arising in the current year and all prior years that are unpaid at the balance sheet date, including IBNR reserves. The table also shows the re-estimated amount of the previously recorded reserves as adjusted for new information received as of the end of each succeeding year. The estimate changes as more information becomes known about the frequency and severity of claims for individual years. The “net cumulative redundancy (deficiency)” represents the aggregate change to date from the original estimate on the third line of the table “reserve for property and casualty losses, originally stated, net of reinsurance.” The “gross cumulative redundancy (deficiency)” represents the aggregate change to date from the original gross estimate on the top line of the table. The table also shows the cumulative net paid amounts as of successive years with respect to the net reserve liability.
63
Table of Contents
| 2000 | 2001 | 2002 | 2003 | 2004 | 2005 | 2006 | 2007 | 2008 | 2009 | |||||||||||||||||||||||||||||||
| (1) | (1) | (4) | (5)(6) | |||||||||||||||||||||||||||||||||||||
| Gross reserve for property and casualty losses |
$ | 136,338 | $ | 456,377 | $ | 617,404 | $ | 991,687 | $ | 1,455,099 | $ | 2,006,032 | $ | 2,335,109 | $ | 2,333,877 | $ | 2,938,171 | $ | 3,178,094 | ||||||||||||||||||||
| Reinsurance recoverable |
(5,370 | ) | (51,838 | ) | (80,407 | ) | (163,348 | ) | (293,512 | ) | (409,229 | ) | (496,173 | ) | (537,864 | ) | (810,113 | ) | (964,818 | )(2) | ||||||||||||||||||||
| Reserve for property and casualty losses originally stated, net of reinsurance |
130,968 | 404,539 | 536,997 | 828,339 | 1,161,587 | 1,596,803 | 1,838,936 | 1,796,013 | 2,128,058 | 2,213,276 | ||||||||||||||||||||||||||||||
| Cumulative net paid losses |
||||||||||||||||||||||||||||||||||||||||
| 1 year later |
7,752 | 136,734 | 106,076 | 119,269 | 217,637 | 169,008 | 361,702 | 184,223 | 368,539 | — | ||||||||||||||||||||||||||||||
| 2 years later |
117,230 | 202,134 | 165,539 | 257,182 | 321,533 | 501,837 | 504,462 | 385,859 | — | — | ||||||||||||||||||||||||||||||
| 3 years later |
141,134 | 242,681 | 244,578 | 333,238 | 545,653 | 608,195 | 658,719 | — | — | — | ||||||||||||||||||||||||||||||
| 4 years later |
150,212 | 285,166 | 309,183 | 502,167 | 611,463 | 731,446 | — | — | — | — | ||||||||||||||||||||||||||||||
| 5 years later |
158,738 | 326,529 | 420,454 | 553,107 | 693,893 | — | — | — | — | — | ||||||||||||||||||||||||||||||
| 6 years later |
162,217 | 359,823 | 458,930 | 597,605 | — | — | — | — | — | — | ||||||||||||||||||||||||||||||
| 7 years later |
166,002 | 380,898 | 484,443 | — | — | — | — | — | — | — | ||||||||||||||||||||||||||||||
| 8 years later |
168,901 | 405,541 | — | — | — | — | — | — | — | — | ||||||||||||||||||||||||||||||
| 9 years later |
171,577 | — | — | — | — | — | — | — | — | — | ||||||||||||||||||||||||||||||
| Reserves re-estimated as of |
||||||||||||||||||||||||||||||||||||||||
| 1 year later |
150,154 | 442,101 | 554,795 | 826,799 | 1,296,558 | 1,585,834 | 1,774,591 | 1,689,054 | 2,040,403 | |||||||||||||||||||||||||||||||
| 2 years later |
178,460 | 439,490 | 563,469 | 975,441 | 1,277,712 | 1,533,584 | 1,679,434 | 1,628,832 | — | |||||||||||||||||||||||||||||||
| 3 years later |
175,057 | 444,348 | 666,781 | 977,590 | 1,229,303 | 1,475,583 | 1,628,019 | — | — | |||||||||||||||||||||||||||||||
| 4 years later |
175,057 | 496,631 | 676,365 | 945,186 | 1,205,584 | 1,433,523 | — | — | — | |||||||||||||||||||||||||||||||
| 5 years later |
175,057 | 497,449 | 655,532 | 932,423 | 1,184,617 | — | — | — | — | |||||||||||||||||||||||||||||||
| 6 years later |
175,057 | 482,046 | 652,881 | 924,962 | — | — | — | — | — | |||||||||||||||||||||||||||||||
| 7 years later |
175,057 | 481,846 | 653,148 | — | — | — | — | — | — | |||||||||||||||||||||||||||||||
| 8 years later |
175,057 | 481,899 | — | — | — | — | — | — | — | |||||||||||||||||||||||||||||||
| 9 years later |
175,057 | |||||||||||||||||||||||||||||||||||||||
| Net cumulative redundancy (deficiency) |
(44,089 | ) | (77,360 | ) | (116,151 | ) | (96,623 | ) | (23,030 | ) | 163,280 | 210,917 | 167,181 | 87,655 | (3) | |||||||||||||||||||||||||
| Gross cumulative redundancy (deficiency) |
(44,089 | ) | (86,958 | ) | (136,941 | ) | (111,012 | ) | (22,552 | ) | 204,364 | 242,448 | 194,291 | 106,144 | ||||||||||||||||||||||||||
| (1) | Adjusted for reclassification of a contract to a deposit liability. |
| (2) | The difference between the reinsurance recoverable included above and that reflected in the reconciliation of losses and loss adjustment expenses in Note 7 to the consolidated financial statements of $498 relates to the remaining net deferred charge on retroactive reinsurance. |
| (3) | The difference between the loss development included above and that reflected in the reconciliation of losses and loss adjustment expenses in Note 7 to the consolidated financial statements of $298 relates to amortization of deferred charges on retroactive reinsurance. |
| (4) | Gross and net reserve for property and casualty losses includes, for the first time, Max Specialty, which we acquired in April 2007. |
| (5) | Gross and net reserve for property and casualty losses includes, for the first time, Max America, which we acquired in June 2008. |
| (6) | Gross and net reserve for property and casualty losses includes, for the first time, Max UK, which we acquired in November 2008. |
During 2009 our re-estimated balance sheet reserves for 2003 and each subsequent balance sheet decreased as a result of net favorable development on a large number of contracts with varied underwriting years and lines of business. The more significant development included:
| • | Net favorable development for the Bermuda/Dublin insurance segment of $41.3 million; $21.0 million of which was recognized on professional liability and $7.1 million on general casualty lines of business, primarily on the 2005 and prior years, and $13.3 million on the short tail property and aviation lines of business from the 2008 and 2007 years. |
| • | Net favorable development for the Bermuda/Dublin reinsurance segment of $32.0 million, excluding the development associated with changes in reinsurance premium estimates described below. We recorded net favorable development on long tail lines of business, including $10.5 million from general casualty primarily on 2005 and prior years, $8.6 million on professional liability primarily on 2006 and prior years, $7.9 million on medical malpractice primarily on 2007 and prior years, and $3.3 million on other long tail lines of business. We recorded net favorable development on short tail lines of business |
64
Table of Contents
| primarily on the 2008 and prior years, including $20.3 million on property reinsurance, and $5.5 million on other short tail lines, offset by adverse development of $24.3 million on the marine and energy lines of business. |
| • | Net favorable development for our Max at Lloyd’s segment of $6.1 million, largely recognized on the professional liability line of business. This was partially offset by adverse development of $1.1 million in our U.S specialty segment. |
| • | Favorable development of $11.4 million arising from reductions in reinsurance premium estimates of $10.9 million. Changes in premium estimates occur on prior year contracts each year as we receive additional information on the underlying exposures insured and the associated loss is recorded, at the original loss ratio, concurrently with the premium adjustment. The favorable development is offset by a decrease in earned premium net of acquisition costs of $11.7 million. |
| • | Premium adjustments in our Bermuda/Dublin insurance segment resulted in adverse development of $2.1 million which was offset by an increase in earned premium during the year. |
Our balance sheet reserves for 2001 and each subsequent balance sheet date through 2004 in the above tables shows the effects of the development on two specific contracts recorded in 2005. The development on these two contracts in the years subsequent to 2004 has not been significant. The first contract increased 2001 reserves by $50.2 million, with the recording of such increased losses triggering additional premiums and interest on additional premiums of $49.3 million, which are not reflected in the table above. The second contract increased 2002 reserves by $49.6 million, 2003 reserves by $64.8 million and 2004 reserves by $15.3 million, for a total increase of $129.7 million. The adverse development triggered additional premiums and interest on such additional premiums of $105.3 million, which are not reflected in the table above.
Changes in loss estimates principally arise from changes in underlying reported, incurred and paid claims data on contracts. Other assumptions used in our process, such as inflation, change infrequently in the reserving process and we do not perform a sensitivity analysis of changes in these assumptions. Given the variety of assumptions and judgments involved in establishing reserves for losses and benefits we have not designed and maintained a system to capture and quantify the financial impact of changes in each of our underlying individual assumptions and judgments.
For additional information on our reserves, including a reconciliation of losses and loss adjustment expense reserves for the years ended December 31, 2009, 2008 and 2007 refer to Note 7 of our audited consolidated financial statements included herein.
Life and annuity reinsurance benefit reserve process
Our life and annuity reinsurance benefit and claim reserves are compiled by our life and annuity actuaries on a contract-by-contract basis and are computed on a discounted basis using standard actuarial techniques and cash flow models. We establish and review our life and annuity reinsurance reserves regularly based upon cash flow projection models utilizing data provided by clients and actuarial models. We establish and maintain our life and annuity reinsurance reserves at a level that we estimate will, when taken together with future premium payments and investment income expected to be earned on associated premiums, be sufficient to support all future cash flow benefit and third party servicing obligations as they become payable.
Since the development of our life and annuity reinsurance reserves is based upon cash flow projection models, we make estimates and assumptions based on cedant experience and industry mortality tables, longevity, expense and investment experience, including a provision for adverse deviation. The assumptions used to determine policy benefit reserves are best estimate assumptions that are determined at the inception of the contracts and are locked-in throughout the life of the contract unless a premium deficiency develops. We
65
Table of Contents
establish these estimates based upon transaction specific historical experience, information provided by the ceding company and industry experience studies. Actual results could differ materially from these estimates. As the experience on the contracts emerges, the assumptions are reviewed by management. We determine whether actual and anticipated experience indicates that existing policy reserves, together with the present value of future gross premiums, are sufficient to cover the present value of future benefits, settlement and maintenance costs and to recover unamortized acquisition costs. If such a review produces reserves in excess of those currently held then the lock-in assumptions are revised and a life and annuity benefit is recognized at that time.
There have been no material reserve adjustments to our life and annuity reinsurance benefit reserves during the years ended December 31, 2009, 2008 and 2007.
The assumptions used to determine claim reserves are best estimate assumptions and are reviewed no less than annually. The assumptions are un-locked if they result in a material reserve change. We establish these assumptions based upon transaction specific historical experience, information provided by the ceding company and industry experience studies. Actual results could differ materially from these estimates.
Because of the many assumptions and estimates used in establishing reserves and the long-term nature of reinsurance contracts, the reserving process, while based on actuarial science, is inherently uncertain.
Investments
We own a trading portfolio, an available for sale portfolio and a held to maturity portfolio of fixed maturities securities. The trading portfolio comprises the fixed maturities securities held by our Max at Lloyd’s segment. We record the trading and available for sale portfolios at fair value on our balance sheet. For our trading portfolio, the unrealized gain or loss associated with the difference between the fair value and the amortized cost of the investments is recorded in net income. For our available for sale portfolio, the unrealized gain or loss (absent credit losses) is recorded in other comprehensive income in the shareholders’ equity section of our consolidated balance sheet.
To match the more predictable cash flow requirements of our long term liabilities, we invest a portion of our fixed maturities investments in long duration securities. Because we have the intent to hold certain of these securities to maturity, we reclassified those securities into a held to maturity portfolio during 2009. This held to maturity portfolio is recorded at amortized cost rather than at fair value, which should reduce the impact on shareholders’ equity of fluctuations in fair value of those investments.
Fixed maturities are subject to fluctuations in fair value due to changes in interest rates, changes in issuer specific circumstances such as credit rating and changes in industry specific circumstances such as movements in credit spreads based on the market’s perception of industry risks. As a result of these potential fluctuations, it is possible to have significant unrealized gains or losses on a security. Our strategy for our fixed maturities portfolio is to tailor the maturities of the portfolio to the timing of expected loss and benefit payments. At maturity, absent any credit loss, fixed maturities’ amortized cost will equal their fair value and no realized gain or loss will be recognized in income. If, due to an unforeseen change in loss payment patterns, we need to sell any available for sale investments before maturity, we could realize significant gains or losses in any period, which could result in a meaningful effect on reported net income for such period.
In order to reduce the likelihood of needing to sell our available for sale investments before maturity, especially given the unpredictable and potentially significant cash flow requirements of our property catastrophe business, we maintain significant cash and cash equivalent balances and can access our credit facility, which is described in Note 20 of our audited consolidated financial statements. We believe it is more likely than not that we will not be required to sell those fixed maturity securities in an unrealized loss position until such time as they reach maturity or the fair value increases.
66
Table of Contents
We perform regular reviews of our available for sale and held to maturity fixed maturities portfolios and utilize a process that considers numerous indicators in order to identify investments that are showing signs of potential other than temporary impairments. These indicators include the length of time and extent of the unrealized loss, any specific adverse conditions, historic and implied volatility of the security, failure of the issuer of the security to make scheduled interest payments, expected cash flow analysis, significant rating changes and recoveries or additional declines in fair value subsequent to the balance sheet date. The consideration of these indicators and the estimation of credit losses involve significant management judgment.
Any other-than-temporary impairment, or OTTI, related to a credit loss is recognized in earnings, and the amount of the OTTI related to other factors (e.g. interest rates, market conditions, etc.) is recorded as a component of other comprehensive income. If no credit loss exists but either: (a) we have the intent to sell the debt security or (b) it is more likely than not that we will be required to sell the debt security before its anticipated recovery, the entire unrealized loss is recognized in earnings. In periods after the recognition of an OTTI loss on debt securities, we account for such securities as if they had been purchased on the measurement date of the OTTI at an amortized cost basis equal to the previous amortized cost basis less the net impairment loss recognized in earnings.
We recognized other than temporary impairment charges through earnings of $3.1 million, $16.9 million and $1.1 during the years ended December 31, 2009, 2008 and 2007, respectively.
We utilize dynamic financial analysis to determine our overall asset and liability risk and the potential for adverse scenarios producing projected losses and potential adverse cash flow. This analysis is accomplished through a stochastic simulation of future periods with asset and liability cash flows individually modeled. This stochastic simulation utilizes the expected volatility of each of our individual asset and liability cash flows. We construct our asset portfolio based on the characteristics of our liability portfolio. Fixed maturities securities are purchased to meet cash flows along the entire maturity spectrum of the liabilities. Our liability cash flows are highly variable. Because of this risk, we maintain a significant cash balance, which has consistently exceeded $250.0 million. We have also generated at least $175.0 million of positive operating cash flow in each of the five years ended December 31, 2009.
We measure fair value in accordance with ASC 820, Fair Value Measurements. The guidance dictates a framework for measuring fair value and a fair value hierarchy based on the quality of inputs used to measure fair value. The hierarchy gives the highest priority to unadjusted quoted prices in active markets for identical assets or liabilities (Level 1 measurements) and the lowest priority to unobservable inputs (Level 3 measurements). The three levels of the fair value hierarchy are described below:
Level 1—Quoted prices for identical instruments in active markets.
Level 2—Quoted prices for similar instruments in active markets; quoted prices for identical or similar instruments in markets that are not active; and model-derived valuations in which all significant inputs and significant value drivers are observable in active markets.
Level 3—Model derived valuations in which one or more significant inputs or significant value drivers are unobservable.
When the inputs used to measure fair value fall within different levels of the hierarchy, the level within which the fair value measurement is categorized is based on the lowest level input that is significant to the fair value measurement in its entirety. Thus, a Level 3 fair value measurement may include inputs that are observable (Level 1 and 2) and unobservable (Level 3).
67
Table of Contents
Fair value prices for all securities in our fixed maturities portfolio are independently provided by both our investment custodians and our investment managers, which each utilize internationally recognized independent pricing services. We record the unadjusted price provided by the investment custodians and our validation process includes, but is not limited to: (i) comparison to the price provided by the investment manager, with significant differences investigated; (ii) quantitative analysis (e.g., comparing the quarterly return for each managed portfolio to its target benchmark, with significant differences identified and investigated); (iii) evaluation of methodologies used by external parties to calculate fair value; and (iv) comparing the price to our knowledge of the current investment market.
The independent pricing services used by our investment custodians and investment managers obtain actual transaction prices for securities that have quoted prices in active markets. Each pricing service has its own proprietary method for determining the fair value of securities that are not actively traded. In general, these methods involve the use of “matrix pricing” in which the independent pricing service uses observable market inputs including, but not limited to, reported trades, benchmark yields, broker/dealer quotes, interest rates, prepayment speeds, default rates and such other inputs as are available from market sources to determine a reasonable fair value. In addition, pricing services use valuation models, such as an Option Adjusted Spread model, to develop prepayment and interest rate scenarios. The Option Adjusted Spread model is commonly used to estimate fair value for securities such as mortgage-backed and asset-backed securities. The ability to obtain quoted market prices is reduced in periods of decreasing liquidity, which generally increases the use of matrix pricing methods and generally increases the uncertainty surrounding the fair value estimates. This could result in the reclassification of a security between levels of the hierarchy.
Our hedge fund portfolio comprises a portfolio of limited partnerships and stock investments in trading entities, or funds, which invest in a wide range of financial products. Investments in the funds are carried at fair value. The change in fair value is included in net realized and unrealized gains on investments and recognized in net income. The units of account that we fair value are our interests in the funds and not the underlying holdings of such funds. Thus, the inputs we use to value our investments in each of the funds may differ from the inputs used to value the underlying holdings of such funds. These funds are stated at fair value which ordinarily will be the most recently reported net asset value as advised by the fund manager or administrator, where the fund’s underlying holdings can be in various quoted and unquoted investments. We believe the reported net asset value represents the fair value market participants would apply to an interest in the fund. The fund managers value their underlying investments at fair value in accordance with policies established by each fund, as described in each of their financial statements and offering memoranda. Based upon information provided by the fund managers, at December 31, 2009, we estimate that over 74% of the underlying assets in the funds are publicly traded securities or have broker quotes available.
We have designed ongoing due diligence processes with respect to funds and their managers. These processes are designed to assist us in assessing the quality of information provided by, or on behalf of, each fund and in determining whether such information continues to be reliable or whether further review is necessary. Certain funds do not provide full transparency of their underlying holdings; however, we obtain the audited financial statements for every fund annually, and regularly review and discuss the fund performance with the fund managers to corroborate the reasonableness of the reported net asset values. While reported net asset value is the primary input to the review, when the net asset value is deemed not to be indicative of fair value, we may incorporate adjustments to the reported net asset value. Such adjustments may involve significant management judgment.
Certain of our funds have either imposed a gate on redemptions, or have segregated a portion of the underlying assets into a side-pocket. Based on the review process applied by management, a reduction of $0.7 million was made to the net asset values reported by
68
Table of Contents
the fund managers as at December 31, 2009 (2008—$2.0 million) to adjust the carrying value of the funds to our best estimate of fair value.
A review of fair value hierarchy classifications is conducted on a quarterly basis. Changes in the observability of valuation inputs may result in a reclassification for certain financial assets and liabilities. Reclassifications impacting Level 3 of the fair value hierarchy are reported as transfers in/out of the Level 3 category as of the beginning of the quarter in which the reclassifications occur. During the year ended December 31, 2009, we reclassified $206.7 million of our hedge fund portfolio investments from Level 3 to Level 2. This reclassification was made as a result of developing interpretation and guidance regarding the U.S. GAAP treatment in this area.
Additional information about the fair values of the hedge fund portfolio can be found in Note 4 to our audited consolidated financial statements included herein.
As at December 31, 2009, the hedge fund portfolio contained 30 underlying investments in nine different strategies. We focus on risk, as opposed to return, in the selection of each of our investments within the hedge fund portfolio. This causes us to select individual hedge funds that have exhibited attractive risk/reward characteristics and low correlation to other investments in the portfolio, as opposed to individual investments that have shown the highest return, but also higher volatility of return. We then combine the selected hedge fund investments into a portfolio of hedge fund investments. By combining investments with moderate volatility and low correlations, we aim to achieve a hedge fund portfolio that has overall lower volatility relative to investing in a common stock portfolio or a typical fund of hedge funds portfolio.
We have attempted to construct our hedge fund portfolio to have less risk, as measured by standard deviation of return, than a common stock portfolio, which is the equity investment choice of many insurance organizations. For the five years ended December 31, 2009, our hedge fund portfolio has produced an annual standard deviation of return of 6.87% compared to the annual standard deviation of return of 12.58% for the HFRI Fund of Funds Composite Index and 16.01% for the S&P 500 Index. The annualized five year total return on our hedge fund portfolio of 3.37% compares to the HFRI Fund of Funds Composite Index return of 2.77% and the S&P 500 Index return of negative 0.21% for the same period, and with lower volatility as measured by standard deviation. There is significant risk in all our investment activities, and the results of our hedge fund portfolio will vary over time with the investment markets. With the exception of 2008, our hedge fund portfolio has produced positive results for every annual period since inception and has shown approximately one-half the volatility of the S&P 500 Index.
| Annual Total Return | |||||||||
| Year |
Max Hedge Fund Portfolio | HFRI Fund of Funds Composite Index |
S&P 500 Index | ||||||
| 2009 |
12.35 | % | 11.46 | % | 26.47 | % | |||
| 2008 |
(19.27 | )% | (20.97 | )% | (37.00 | )% | |||
| 2007 |
16.97 | % | 10.25 | % | 5.49 | % | |||
| 2006 |
6.96 | % | 10.39 | % | 11.85 | % | |||
| 2005 |
3.34 | % | 7.49 | % | 3.00 | % | |||
Despite the lower volatility of the hedge fund portfolio there is potential for losses, as there is for any investment portfolio. We approach our investment strategies based on long term performance and believe the annualized five year total return of our hedge fund portfolio of 3.37% compares favorably to the return profile of other alternative investment vehicles.
Investments in reinsurance private equities, where we have a meaningful ownership position and the ability to exercise significant influence over operating and financial policies of the investee, are carried under the equity method of accounting. Under this method, we initially record the investments at cost and periodically adjust the carrying values to
69
Table of Contents
recognize our proportionate share of income or loss and dividends from these investments. Future adverse changes in general market, global and economic conditions, changes to the interest and currency rate environment or poor operating results by our investments carried under the equity method of accounting could result in losses. At December 31, 2009, our total investment in reinsurance private equity was an interest in Grand Central Re of $2.8 million.
See Note 2 to our audited consolidated financial statements included herein for our significant accounting policies.
Results of Operations
We monitor the performance of our underwriting operations in five segments:
| • | Bermuda/Dublin insurance—This segment offers property and casualty excess of loss capacity from our Bermuda and Dublin offices on specific risks related to individual insureds. |
| • | Bermuda/Dublin reinsurance—This segment offers property and casualty quota share and excess of loss capacity from our Bermuda and Dublin offices, providing coverage for a portfolio of underlying risks written by our clients. |
| • | U.S. specialty—This segment offers property and casualty coverage insurance from offices in the United States on specific risks related to individual insureds. |
| • | Max at Lloyd’s—This segment offers property and casualty quota share and excess of loss capacity from our London and Copenhagen offices. This segment comprises our proportionate share of the underwriting results of the Syndicates, and the results of our managing agent, Max at Lloyd’s. |
| • | Life and annuity reinsurance—This segment operates out of Bermuda only and offers reinsurance products focusing on existing blocks of life and annuity business, which take the form of co-insurance transactions whereby the risks are reinsured on the same basis as the original policies. |
We also have a corporate function that manages our investment and financing activities.
Invested assets relating to the Bermuda/Dublin insurance, Bermuda/Dublin reinsurance and life and annuity segments are managed on a consolidated basis. Consequently, investment income on this consolidated portfolio and gains on the hedge fund portfolio are not directly captured in any one of these segments. However, because of the longer duration of liabilities on casualty insurance and reinsurance business (as compared to property), and life and annuity reinsurance business, investment returns are important in evaluating the profitability of these segments. Accordingly, we allocate investment returns from the consolidated portfolio to each of these three segments. This is based on a notional allocation of invested assets from the consolidated portfolio using durations that are determined based on estimated cash flows into and out of each segment. The balance of investment returns from this consolidated portfolio is allocated to our corporate function for the purposes of segment reporting.
The U.S. specialty and the Max at Lloyd’s segments each have their own portfolio of fixed maturities investments; as a result the investment income earned by each of these portfolios is reported in its respective segment. The management of these portfolios, however, is handled on a consolidated basis together with the invested assets of the Bermuda/Dublin insurance, Bermuda/Dublin reinsurance and life and annuity segments.
70
Table of Contents
Results of Underwriting Operations
Bermuda/Dublin Insurance Segment
| 2009 | % change | 2008 | % change | 2007 | ||||||||||||||
| In millions of U.S. Dollars | ||||||||||||||||||
| Gross premiums written |
$ | 427.8 | 9.9 | % | $ | 389.4 | 1.7 | % | $ | 382.9 | ||||||||
| Reinsurance premiums ceded |
(212.1 | ) | 7.1 | % | (198.1 | ) | (1.9 | )% | (202.0 | ) | ||||||||
| Net premiums written |
215.7 | 12.8 | % | 191.3 | 5.7 | % | 180.9 | |||||||||||
| Net premiums earned(a) |
206.0 | 13.2 | % | 182.0 | (8.8 | )% | 199.6 | |||||||||||
| Net investment income |
22.9 | 24.5 | % | 18.4 | 14.3 | % | 16.1 | |||||||||||
| Net realized and unrealized gains (losses) on investments |
4.4 | N/A | (23.5 | ) | N/A | 14.3 | ||||||||||||
| Other income |
1.2 | 9.1 | % | 1.1 | N/A | — | ||||||||||||
| Total revenues |
234.5 | 31.7 | % | 178.0 | (22.6 | )% | 230.0 | |||||||||||
| Net losses and loss expenses(b) |
132.3 | (6.9 | )% | 142.1 | (7.6 | )% | 153.8 | |||||||||||
| Acquisition costs |
(1.2 | ) | (57.1 | )% | (2.8 | ) | (133.3 | )% | (1.2 | ) | ||||||||
| Interest expense |
0.8 | N/A | — | — | — | |||||||||||||
| General and administrative expenses |
24.6 | 16.6 | % | 21.1 | 8.8 | % | 19.4 | |||||||||||
| Total losses and expenses(c) |
156.5 | (2.4 | )% | 160.4 | (6.7 | )% | 172.0 | |||||||||||
| Income before taxes |
$ | 78.0 | N/A | $ | 17.6 | (69.7 | )% | $ | 58.0 | |||||||||
| Loss ratio(b)/(a) |
64.3 | % | 78.1 | % | 77.1 | % | ||||||||||||
| Combined ratio(c)/(a) |
75.6 | % | 88.2 | % | 86.2 | % | ||||||||||||
The loss ratio is calculated by dividing net losses and loss expenses (shown as (b)) by net premiums earned (shown as (a)). The combined ratio is calculated by dividing the sum of net losses and loss expenses, acquisition costs and general and administrative expenses (shown as (c)) by net premiums earned (shown as (a)).
| Year Ended December 31, 2009 |
% of Premium Written |
Year Ended December 31, 2008 |
% of Premium Written |
Year Ended December 31, 2007 |
% of Premium Written |
|||||||||||||
| In millions of U.S. Dollars | ||||||||||||||||||
| Gross Premiums Written by Type of Risk: |
||||||||||||||||||
| Aviation |
$ | 69.8 | 16.3 | % | $ | 53.1 | 13.6 | % | $ | 40.9 | 10.7 | % | ||||||
| Excess liability |
113.8 | 26.6 | % | 123.5 | 31.7 | % | 131.5 | 34.3 | % | |||||||||
| Professional liability |
179.9 | 42.1 | % | 159.1 | 40.9 | % | 157.5 | 41.1 | % | |||||||||
| Property |
64.3 | 15.0 | % | 53.7 | 13.8 | % | 53.0 | 13.9 | % | |||||||||
| $ | 427.8 | 100.0 | % | $ | 389.4 | 100.0 | % | $ | 382.9 | 100.0 | % | |||||||
The combined ratio for 2009 was 75.6% compared to 88.2% in 2008. This 12.6 percentage point decrease was primarily due to a 13.8 percentage point decrease in the loss ratio.
Gross premiums written increased in 2009 by 9.9% to $427.8 million from $389.4 million in 2008. The increase in premiums in 2009 has principally been in our professional liability, aviation and property lines, where we have seen favorable market pricing and reduced market capacity, particularly in professional liability. In the excess liability line of business we have continued to see a more competitive pricing environment with additional capacity entering the market place. As a result we have been more selective in our excess liability renewals, focusing on business that meets our rate of return requirements. Gross
71
Table of Contents
premiums written were relatively stable in 2008 compared to 2007, with an increase of 1.7%. This was due to growth in our aviation and modest growth in our professional liability business which was partially offset by the impact of increased competition on our excess liability business which has continued into 2009.
The 2009 loss ratio decreased over the comparative 2008 period by 13.8 percentage points to 64.3%. The decrease in the loss ratio in 2009 was principally attributable to lower property catastrophe and per-risk losses compared to 2008. Significant items impacting the loss ratio were:
| • | Net favorable development of $41.3 million; $21.0 million of which was recognized on professional liability and $7.1 million on general casualty lines of business, primarily on the 2005 and prior years, and $13.3 million on the short tail property and aviation lines of business from the 2008 and 2007 years. The net favorable development in 2008 was principally related to the property ($18.3 million) and aviation ($2.0 million) lines of business; |
| • | Excluding net favorable loss development, the 2009 loss ratio is 84.3% compared to 90.6% for the 2008 year; |
| • | There were no significant catastrophe-related losses in 2009, compared to $5.4 million of hurricane losses in 2008. |
The 2008 loss ratio increased 1.0 percentage point over the 2007 loss ratio. The increase in the loss ratio in 2008 was principally attributable to higher property catastrophe and per-risk losses, partly offset by a greater amount of favorable prior year loss reserve development. Significant items impacting the loss ratio were:
| • | Net favorable loss development of prior year reserves in 2008 of $22.6 million compared to $8.8 million of net favorable development in 2007. The lines of business with the largest favorable development in 2008 were property ($18.3 million) and aviation ($2.0 million). In 2007 the lines of business with the largest favorable development were property ($5.7 million) and excess liability ($1.7 million); |
| • | Excluding net favorable loss development, the 2008 loss ratio was 90.6% compared to 81.5% for the 2007 year; |
| • | There were net losses of $5.4 million related to hurricane losses in 2008, compared to no significant catastrophe losses in 2007. |
The ratio of reinsurance premiums ceded to gross premiums written has continued to decrease from 52.8% in 2007 to 50.9% in 2008 and 49.6% in 2009. Reinsurance premiums ceded are principally related to our quota share treaties and tend to fluctuate in line with gross premiums written. The decrease in the percentage of reinsurance premiums ceded is principally due to changes in the mix of business.
Acquisition costs are net of ceding commissions associated with premiums ceded to our quota share partners. These ceding commissions are designed to compensate us for the costs of producing the portfolio of risks ceded to our reinsurers. Acquisition costs have remained relatively stable from 2007 to 2009.
General and administration expenses for the year ended December 31, 2009 increased $3.5 million compared to the same period in 2008. The improvement in the segment’s income before taxes in 2009 compared to the corresponding 2008 period resulted in increased incentive based compensation for the 2009 year. The 2009 year also includes increased expenses related to information technology, compared to the comparable 2008 period. The increase of $1.7 million in general and administrative
72
Table of Contents
expenses in 2008 compared to 2007 resulted principally from additional claims and underwriting staff added over the course of 2008 and 2007 in order to service a growing base of clients, as well as higher expense associated with the vesting of long-term stock-based compensation.
Net investment income and net realized and unrealized gains on investments are discussed within the corporate function results of operations as we manage investments for this segment on a consolidated basis with the Bermuda/Dublin reinsurance and life and annuity reinsurance segments.
Bermuda/Dublin Reinsurance Segment
| 2009 | % change | 2008 | % change | 2007 | ||||||||||||||
| In millions of U.S. Dollars | ||||||||||||||||||
| Gross premiums written |
$ | 489.0 | 16.6 | % | $ | 419.5 | 21.5 | % | $ | 345.2 | ||||||||
| Reinsurance premiums ceded |
(80.0 | ) | (13.4 | )% | (92.4 | ) | 107.2 | % | (44.6 | ) | ||||||||
| Net premiums written |
409.0 | 25.0 | % | 327.1 | 8.8 | % | 300.6 | |||||||||||
| Net premiums earned(a) |
387.9 | 13.5 | % | 341.8 | 9.2 | % | 312.9 | |||||||||||
| Net investment income |
40.2 | 11.4 | % | 36.1 | (12.2 | )% | 41.1 | |||||||||||
| Net realized and unrealized (losses) gains on investments |
10.5 | N/A | (51.1 | ) | (196.4 | )% | 53.0 | |||||||||||
| Total revenues |
438.6 | 34.2 | % | 326.8 | 19.7 | % | 407.0 | |||||||||||
| Net losses and loss expenses(b)(c) |
254.5 | 16.3 | % | 218.8 | 26.3 | % | 173.3 | |||||||||||
| Acquisition costs(c) |
71.1 | 38.6 | % | 51.3 | (15.8 | )% | 60.9 | |||||||||||
| Interest expense |
6.6 | (12.0 | )% | 7.5 | (37.0 | )% | 11.9 | |||||||||||
| General and administrative expenses(c) |
31.7 | 10.8 | % | 28.6 | 0.7 | % | 28.4 | |||||||||||
| Total losses and expenses |
363.9 | 18.8 | % | 306.2 | 11.5 | % | 274.5 | |||||||||||
| Income before taxes |
$ | 74.7 | N/A | $ | 20.6 | (84.5 | )% | $ | 132.5 | |||||||||
| Loss ratio(b)/(a) |
65.6 | % | 64.0 | % | 55.4 | % | ||||||||||||
| Combined ratio(c)/(a) |
92.1 | % | 87.4 | % | 83.9 | % | ||||||||||||
The loss ratio is calculated by dividing losses (shown as (b)) by net premium earned (shown as (a)). The combined ratio is calculated by dividing the sum of losses, acquisition costs and general and administrative expenses (shown as (c)) by net premiums earned (shown as (a)).
73
Table of Contents
| Year Ended December 31, 2009 |
% of Premium Written |
Year Ended December 31, 2008 |
% of Premium Written |
Year Ended December 31, 2007 |
% of Premium Written |
|||||||||||||
| In millions of U.S. Dollars | ||||||||||||||||||
| Gross Premiums Written by Type of Risk: |
||||||||||||||||||
| Agriculture |
$ | 89.6 | 18.3 | % | $ | 80.5 | 19.2 | % | $ | 1.0 | 0.3 | % | ||||||
| Aviation |
34.7 | 7.1 | % | 31.5 | 7.5 | % | 34.1 | 9.9 | % | |||||||||
| General casualty |
29.2 | 6.0 | % | 10.2 | 2.4 | % | 16.7 | 4.8 | % | |||||||||
| Marine and energy |
18.3 | 3.7 | % | 12.8 | 3.0 | % | 47.1 | 13.6 | % | |||||||||
| Medical malpractice |
67.5 | 13.8 | % | 77.1 | 18.4 | % | 53.1 | 15.4 | % | |||||||||
| Other |
2.3 | 0.5 | % | 1.9 | 0.5 | % | 6.0 | 1.7 | % | |||||||||
| Professional liability |
71.5 | 14.6 | % | 38.7 | 9.2 | % | 33.7 | 9.8 | % | |||||||||
| Property |
87.0 | 17.8 | % | 99.3 | 23.7 | % | 89.2 | 25.8 | % | |||||||||
| Whole account |
11.4 | 2.3 | % | 12.9 | 3.1 | % | 15.1 | 4.4 | % | |||||||||
| Workers compensation |
77.5 | 15.9 | % | 54.6 | 13.0 | % | 49.2 | 14.3 | % | |||||||||
| $ | 489.0 | 100.0 | % | $ | 419.5 | 100.0 | % | $ | 345.2 | 100.0 | % | |||||||
The combined ratio for 2009 was 92.1% compared to 87.4% for the year ended December 31, 2008 and 83.9% for the year ended December 31, 2007. The 2009 combined ratio increased over 2008 principally due to increases in the loss ratio and the ratio of acquisition costs to net premiums earned. The 2008 combined ratio increased over 2007 principally due to an increased loss ratio partially offset by lower acquisition costs.
Gross premiums written for the year ended December 31, 2009 increased by 16.6% compared to the 2008 year. The increase in premiums is principally in our professional liability, workers compensation and general casualty lines of business. We increased our professional liability business to take advantage of favorable market pricing and reduced market capacity. The increase in workers compensation premiums is principally due to a significant quota share treaty written in 2009. We expect this treaty to be renewed in 2010 at a reduced premium level. Our general casualty premium volume is generally flat year-over-year; the comparative 2008 year includes negative premium adjustments which have not recurred in 2009. The market for property was favorable and our renewals benefited from an increase in rates. However, with the 41.6% growth in our Max Specialty property business in the United States, we have kept our reinsurance premium volumes stable year-over-year as part of our strategy to limit aggregate property exposures. The year ended December 31, 2009 included reductions in premium estimates on prior year contracts of $10.9 million compared to reductions of $46.0 million in 2008. The year ended December 31, 2008 also includes $10.8 million of reinstatement premiums principally triggered by property catastrophe losses incurred in 2008.
Gross premiums written for the year ended December 31, 2008 increased 21.5% compared to the 2007 year. This was principally due to a $79.5 million increase in agriculture business written, partially offset by decreases in general casualty and marine and energy lines of business. The year ended December 31, 2008 included reductions in premium estimates on prior year contracts of $46.0 million compared to reductions of $9.3 million in 2007.
74
Table of Contents
The 2009 loss ratio increased over the 2008 year by 1.6 percentage points to 65.6%. The increase in the 2009 loss ratio was principally attributable to lower net favorable prior year reserve development, offset by lower property catastrophe and per-risk losses compared to 2008. Significant items impacting the loss ratio were:
| • | Net favorable development of $32.0 million, excluding the development associated with changes in reinsurance premium estimates described below. We recorded net favorable development on long tail lines of business, including $10.5 million from general casualty primarily on 2005 and prior years, $8.6 million on professional liability primarily on 2006 and prior years, $7.9 million on medical malpractice primarily on 2007 and prior years, and $3.3 million on other long tail lines of business. We recorded net favorable development on short tail lines of business primarily on the 2008 and prior years, including $20.3 million on property reinsurance, and $5.5 million on other short tail lines, offset by adverse development of $24.3 million on the marine and energy lines of business. The net favorable development in 2008 was principally related to the professional liability ($25.8 million), property ($22.1 million), whole account ($15.1 million), and general casualty ($9.5 million), lines of business. This development was partially offset by adverse development of $13.5 million in the marine and energy line of business. |
| • | Excluding net favorable loss development, the 2009 loss ratio is 73.9% compared to 83.9% for the 2008 year; |
| • | Changes in reinsurance premium estimates resulted in a decrease in loss reserves of $11.4 million in 2009 compared to a decrease of $17.0 million in 2008. In both years, this favorable development was more than offset by decreases in net earned premiums net of acquisition costs of $11.7 million and $24.2 million, in 2009 and 2008, respectively; |
| • | There were $2.0 million of catastrophe-related losses in 2009, (representing 0.5 loss ratio points), compared to $47.0 million in 2008 (or 13.8 loss ratio percentage points). |
The 2008 loss ratio was 8.6 percentage points higher than the 2007 loss ratio of 55.4%. The increase in the 2008 loss ratio was principally attributable to greater property catastrophe and per-risk losses compared to 2007, partly offset by greater favorable development on prior year loss reserves. Significant items impacting the 2008 loss ratio were:
| • | Net favorable loss development of prior year reserves in 2008 of $68.1 million compared to $49.3 million of net favorable development in 2007. This loss development arises from the re-estimation of liabilities from our quarterly and annual actuarial review process. It includes gains on the final settlement, or commutation, of prior year reinsurance reserves, and excludes changes in reserves resulting from changes in premium estimates; |
| • | The prior year net favorable loss development in 2008 was principally related to our professional liability ($25.8 million), property ($22.1 million), whole account ($15.1 million), and general casualty ($9.5 million) lines of business. The net favorable development in 2007 was principally related to our medical malpractice, professional liability and workers compensation lines of business, all of which had between $5.0 million and $10.0 million in favorable development, with most other lines of business having between $nil and $5.0 million in favorable development. . In both years the favorable development was partially offset by adverse development in the marine and energy line of business of $13.5 million in 2008 and $20.0 million in 2007. The majority of loss development in 2008 occurred on 2005 and prior years; |
| • | Excluding net favorable loss development, the 2008 loss ratio was 83.9% compared to 71.1% for the 2007 year; |
75
Table of Contents
| • | Changes in reinsurance premium estimates resulted in a decrease in loss reserves of $17.0 million in 2008 compared to a decrease of $5.6 million in 2007. |
| • | There were $47.0 million of catastrophe-related losses in 2008, compared to no significant property catastrophe losses in 2007. |
The ratio of reinsurance premiums ceded to gross premiums written for the year ended December 31, 2009 was 16.4%, a decrease of 5.6 percentage points from 22.0% in 2008. The decrease was due to a significant quota share contract incepting in the third quarter of 2008 which renewed in 2009 at a significantly lower amount. In addition, reinstatement premiums ceded triggered by property catastrophe losses during 2008 were $1.7 million compared to no significant reinstatement premiums ceded in 2009. These items also explain the increase from 2007 to 2008 in the ratio of premiums ceded to premiums written.
The ratio of acquisition costs to net premiums earned increased 3.3 percentage points (to 18.3% from 15.0%) for the year ended December 31, 2009 compared to 2008. This is principally as a result of changes in the mix of business written, in particular the significant growth in professional liability and workers compensation business, which raised the average ceding commission. The decrease in the ratio of acquisition costs to net premiums earned of 4.4 percentage points to 15.0% in 2008 from 19.4% in 2007 was principally attributable to changes in our business mix, with the lower acquisition costs in our agriculture product line having the largest impact.
Interest expense relates to interest on funds withheld from reinsurers, certain deposit liabilities, and the variable quota share retrocession agreement with Grand Central Re. The interest expense on funds withheld from Grand Central Re is based on the average of two total return fixed maturity indices, which varies from period to period.
General and administration expenses for the year ended December 31, 2009 increased $3.1 million compared to 2008. The improvement in the segment’s income before taxes in 2009 compared to 2008 resulted in increased incentive based compensation for 2009. The year ended December 31, 2009 also includes increased expenses related to information technology, compared to 2008. General and administrative expenses for the year ended December 31, 2008 were stable compared to the 2007 year.
Net investment income and net realized and unrealized gains on investments are discussed within the corporate function results of operations as we manage investments for this segment on a consolidated basis with the Bermuda/Dublin insurance and life and annuity reinsurance segments.
76
Table of Contents
U.S. Specialty Segment
Our U.S. specialty segment, which comprises the underwriting operations of our U.S.-based business, commenced underwriting activities in April 2007. The rate of growth from 2007 to 2009 may not necessarily be representative of future trends.
| 2009 | % change | 2008 | % change | 2007 | ||||||||||||||
| In millions of U.S. Dollars | ||||||||||||||||||
| Gross premiums written |
$ | 285.5 | 46.9 | % | $ | 194.3 | N/A | $ | 48.2 | |||||||||
| Reinsurance premiums ceded |
(155.1 | ) | 30.7 | % | (118.7 | ) | N/A | (34.6 | ) | |||||||||
| Net premiums written |
130.4 | 72.5 | % | 75.6 | N/A | 13.6 | ||||||||||||
| Net premiums earned(a) |
102.1 | 133.1 | % | 43.8 | N/A | 4.0 | ||||||||||||
| Net investment income |
6.0 | (16.7 | )% | 7.2 | 20.0 | % | 6.0 | |||||||||||
| Net realized and unrealized gains (losses) on investments |
0.2 | N/A | (0.5 | ) | N/A | — | ||||||||||||
| Other income |
0.3 | — | 0.3 | — | — | |||||||||||||
| Total revenues |
108.6 | 113.8 | % | 50.8 | N/A | 10.0 | ||||||||||||
| Net losses and loss expenses(b)(c) |
62.8 | 106.6 | % | 30.4 | N/A | 3.3 | ||||||||||||
| Acquisition costs(c) |
7.5 | 150.0 | % | 3.0 | N/A | 0.4 | ||||||||||||
| General and administrative expenses(c) |
31.2 | 14.7 | % | 27.2 | 56.3 | % | 17.4 | |||||||||||
| Total losses and expenses |
101.5 | 67.5 | % | 60.6 | 187.2 | % | 21.1 | |||||||||||
| Income (loss) before taxes |
$ | 7.1 | N/A | $ | (9.8 | ) | (11.7 | )% | $ | (11.1 | ) | |||||||
| Loss ratio(b)/(a) |
61.5 | % | 69.4 | % | 82.0 | % | ||||||||||||
| Combined ratio(c)/(a) |
99.5 | % | 138.5 | % | N/A | |||||||||||||
The loss ratio is calculated by dividing losses (shown as (b)) by net premium earned (shown as (a)). The combined ratio is calculated by dividing the sum of losses, acquisition costs and general and administrative expenses (shown as (c)) by net premiums earned (shown as (a)).
| Year Ended December 31, 2009 |
% of Premium Written |
Year Ended December 31, 2008 |
% of Premium Written |
Year Ended December 31, 2007 |
% of Premium Written |
|||||||||||||
| In millions of U.S. Dollars | ||||||||||||||||||
| Gross Premiums Written by Type of Risk: |
||||||||||||||||||
| General casualty |
$ | 87.8 | 30.8 | % | $ | 59.8 | 30.8 | % | $ | 12.3 | 25.5 | % | ||||||
| Marine |
61.4 | 21.5 | % | 38.7 | 19.9 | % | 1.2 | 2.5 | % | |||||||||
| Professional Liability |
0.6 | 0.2 | % | — | — | — | — | |||||||||||
| Property |
135.7 | 47.5 | % | 95.8 | 49.3 | % | 34.7 | 72.0 | % | |||||||||
| $285.5 | 100.0 | % | $194.3 | 100.0 | % | $48.2 | 100.0 | % | ||||||||||
The combined ratio for the year ended December 31, 2009 was 99.5% compared to 138.5% in 2008. The significant improvement in the combined ratio is principally due to the growth of net premiums earned exceeding the growth in general and administrative expenses, as well as improvement in underwriting results.
Gross premiums written reflect the continued expansion of our U.S. platform including the writing of business in the full suite of licensed states during 2009. This build out of business resulted in a 46.9% increase in gross premiums written for 2009 over 2008. We anticipate gross premiums written to grow at a slower pace over the next few years. Reinsurance premiums ceded reflect the purchase of quota share and excess of loss reinsurance coverage to manage our retained exposure for risks underwritten. The ratio of
77
Table of Contents
premiums ceded to premiums written has trended downwards over the last two years and we expect this to continue and then stabilize as the segment’s capital base increases.
Gross premiums written and ceded increased substantially in 2008 compared to 2007 reflecting the initial growth of this segment in its first full year of operations.
The loss ratio for the year ended December 31, 2009 improved 7.9 percentage points compared to 2008, after improving 12.6 percentage points over 2007. As gross premiums written volume increased, creating a broader client base, we expected to see this improvement in our net loss ratio. Our planned increase in the mix of general casualty business and our planned addition of professional liability business may temper the reduction in the loss ratio in future periods as those lines tend to have higher average loss ratios than property lines. Net losses and loss expenses in this segment typically comprise a larger volume of smaller dollar value losses compared to our Bermuda/Dublin insurance and reinsurance segments. The years ended December 31, 2008 and 2007 included $5.0 million and $nil losses, respectively, related to hurricane events, net of reinsurance recoveries. There were no equivalent catastrophic losses in 2009. For the year ended December 31, 2009, net adverse development on prior year reserves was $1.1 million. This was principally in the marine line of business ($2.2 million) and general casualty ($0.6 million), partially offset by favorable development of prior year property reserves ($1.7 million). There was no significant development on prior year reserves in 2008 or 2007.
General and administrative expenses principally comprise personnel and infrastructure costs. As expected, with the increasing scale of this segment, general and administrative expenses continue to decrease as a percentage of net premiums earned. Compared to our other segments this segment writes a higher volume of smaller-sized transactions. Due to the greater number of personnel required to generate and process the high volume of transactions we expect a higher general and administrative expense ratio in this segment compared to our other segments.
Net investment income, which excludes realized and unrealized gains and losses, is comprised principally of interest on cash and fixed maturities investments held by Max Specialty and Max America. The average annualized investment yield on cash and fixed maturities for the year ended December 31, 2009 was 3.86%, compared to 4.59% for the year ended December 31, 2008 and 5.08% for the year ended December 31, 2007.
78
Table of Contents
Max at Lloyd’s Segment
Our Max at Lloyd’s segment comprises all of our Lloyd’s-based operating businesses acquired on November 6, 2008. Because the 2008 comparative period was less than two months, any comparison between 2008 and 2009 may not be representative of future growth rates. Results for the Max at Lloyd’s segment include the underwriting operations of the Syndicates for which we record our proportionate share.
| 2009 | % change | 2008 | ||||||||
| (In millions of U.S. Dollars) | ||||||||||
| Gross premiums written |
$ | 129.0 | N/A | $ | 8.8 | |||||
| Reinsurance premiums ceded |
(32.9 | ) | N/A | (4.3 | ) | |||||
| Net premiums written |
96.1 | N/A | 4.5 | |||||||
| Net premiums earned(a) |
95.1 | N/A | 4.3 | |||||||
| Net investment income |
4.4 | N/A | 0.5 | |||||||
| Net realized and unrealized gains (losses) on investments |
2.6 | N/A | 0.5 | |||||||
| Other income |
0.6 | N/A | 0.2 | |||||||
| Total revenues |
102.7 | N/A | 5.5 | |||||||
| Net losses and loss expenses(b)(c) |
44.0 | N/A | 2.5 | |||||||
| Acquisition costs(c) |
18.1 | N/A | 1.0 | |||||||
| Net foreign exchange (gains) |
(5.1 | ) | N/A | (0.4 | ) | |||||
| General and administrative expenses(c) |
20.0 | N/A | 2.5 | |||||||
| Total losses and expenses |
77.0 | N/A | 5.6 | |||||||
| Income (loss) before taxes |
$ | 25.7 | N/A | $ | (0.1 | ) | ||||
| Loss ratio(b)/(a) |
46.2 | % | 57.3 | % | ||||||
| Combined ratio(c)/(a) |
86.3 | % | 138.5 | % | ||||||
The loss ratio is calculated by dividing losses (shown as (b)) by net premium earned (shown as (a)). The combined ratio is calculated by dividing the sum of losses, acquisition costs and general and administrative expenses (shown as (c)) by net premiums earned (shown as (a)).
| Year Ended December 31, 2009 |
% of Premium Written |
Period Ended December 31, 2008 |
% of Premium Written |
|||||||||
| In millions of U.S. Dollars | ||||||||||||
| Gross Premiums Written by Type of Risk: |
||||||||||||
| Accident and health |
$ | 22.6 | 17.5 | % | $ | 0.4 | 4.5 | % | ||||
| Aviation |
2.6 | 2.0 | % | — | — | |||||||
| Financial institutions |
23.8 | 18.5 | % | 4.1 | 46.6 | % | ||||||
| Professional liability |
19.9 | 15.4 | % | 2.9 | 33.0 | % | ||||||
| Property |
60.1 | 46.6 | % | 1.4 | 15.9 | % | ||||||
| $ | 129.0 | 100.0 | % | $ | 8.8 | 100.0 | % | |||||
The combined ratio was 86.3% for the year ended December 31, 2009. The combined ratio for the period from acquisition to December 31, 2008 of 138.5% is not a meaningful comparative figure due to the short time period involved.
Gross premiums written of $129.0 million were in line with our plan for 2009 for existing lines of business. Gross premiums written in 2009 increased 7.3% in comparison to full year 2008 gross premiums written of $120.2 million ($111.4 million of which were written prior to our acquisition of Max at Lloyd’s, and therefore are not included in the consolidated results for the year ended December 31, 2008, and $8.8 million was written following the acquisition and is reflected in the table above). This growth was predominantly in the property and accident and health business lines. Also, in the fourth
79
Table of Contents
quarter of 2009 we added international casualty reinsurance and aviation insurance product lines, both written by Syndicate 1400. We expect these lines to be an area of profitable growth for the segment in 2010.
The loss ratio for the year ended December 31, 2009 was in line with our expectations for this segment. During the year there was net favorable development of prior year loss reserves of $6.1 million, with the majority from our professional liability line of business and the remainder from the property, financial institutions and accident and health lines of business. Net losses from property catastrophe events were $1.4 million during the year. In the absence of catastrophe losses, our property line of business, which is principally property catastrophe risks, and our accident and health lines of business, tend to have lower loss ratios than our financial institutions and professional liability lines of business. In this segment, the higher proportion of property and accident and health premiums compared to financial institutions and professional liability premiums generally results in a lower loss ratio than our other segments.
General and administrative expenses principally comprise personnel and infrastructure costs. The ratio of general and administration expenses to net premiums earned was 21.0% for the year ended December 31, 2009 compared to 58.5% for the period ended December 31, 2008. The 2008 ratio is not a meaningful comparative figure due to the short period involved, which included significant initial integration and infrastructure costs.
Net investment income, which excludes realized and unrealized gains and losses on Max at Lloyd’s trading portfolio, is comprised principally of interest on cash and fixed maturities investments held by the Syndicates. The average annualized investment yield on cash and fixed maturities for year ended December 31, 2009 was 1.48%. This segment held a higher ratio of cash and cash equivalents to fixed maturity securities than the rest of our group for the majority of 2009, resulting in a lower investment yield than our other segments. Late in the fourth quarter of 2009 we began to deploy some of this segment’s cash and cash equivalents into fixed maturity securities, which should improve the investment yield for this segment.
Life and Annuity Reinsurance Segment
| 2009 | % change | 2008 | % change | 2007 | ||||||||||||||
| In millions of U.S. Dollars | ||||||||||||||||||
| Gross premiums written |
$ | 43.7 | (82.0 | )% | $ | 242.2 | (19.8 | )% | $ | 301.9 | ||||||||
| Reinsurance premiums ceded |
(0.4 | ) | (20.0 | )% | (0.5 | ) | N/A | (0.5 | ) | |||||||||
| Net premiums written |
43.3 | (82.1 | )% | 241.7 | (19.8 | )% | 301.4 | |||||||||||
| Net premiums earned |
43.3 | (82.1 | )% | 241.7 | (19.8 | )% | 301.4 | |||||||||||
| Net investment income |
51.0 | 27.5 | % | 40.0 | (18.0 | )% | 33.9 | |||||||||||
| Net realized and unrealized gains (losses) on investments |
37.3 | N/A | (100.9 | ) | N/A | 60.7 | ||||||||||||
| Total revenues |
131.6 | (27.2 | )% | 180.8 | (54.3 | )% | 396.0 | |||||||||||
| Claims and policy benefits |
101.1 | (66.5 | )% | 301.5 | (12.8 | )% | 345.6 | |||||||||||
| Acquisition costs |
1.4 | N/A | (0.1 | ) | (108.3 | )% | 1.2 | |||||||||||
| Interest expense |
3.3 | (51.5 | )% | 6.8 | (1.4 | )% | 6.9 | |||||||||||
| General and administrative expenses |
2.8 | (3.4 | )% | 2.9 | 3.6 | % | 2.8 | |||||||||||
| Total benefits and expenses |
108.6 | (65.1 | )% | 311.1 | (12.7 | )% | 356.5 | |||||||||||
| Income (loss) before taxes |
$ | 23.0 | N/A | $ | (130.3 | ) | N/A | $ | 39.5 | |||||||||
| Number of transactions written |
1 | 3 | 6 | |||||||||||||||
80
Table of Contents
We write life and annuity reinsurance transactions when attractive opportunities arise. The nature of life and annuity reinsurance transactions that we consider results in a limited number of transactions actually bound with potentially large variations in quarterly and annual premium volume. Consequently, components of our underwriting results, such as premiums written, premiums earned and benefits can be volatile and, accordingly, period-to-period comparisons are not necessarily representative of future trends. Our life and annuity benefit reserves are recorded on a discounted present value basis. This discount is amortized through net income as a claims and policy benefits expense, over the term of the underlying policies. As a result, income before taxes is driven by the spread between the actual rate of return on our investments and the interest discount on our reserves, together with differences between estimated and actual claims, premiums, expenses and persistency of the underlying policies.
We wrote one life and annuity contract during the year ended December 31, 2009 with gross premiums written totaling $41.6 million, covering a closed block of traditional life insurance for a new client. For the year ended December 31, 2008, we wrote three contracts totaling gross premiums written of $239.6 million, each covering closed blocks of pension annuities for existing clients. For the year ended December 31, 2007 we wrote six contracts totaling gross premiums written of $299.3 million, each covering closed blocks of pension annuities; $207.9 million was from new clients and $91.4 million was from existing clients.
Apart from the components related to the contracts incepting during the years ended December 31, 2009, 2008 and 2007, gross premiums written, reinsurance premiums ceded, net premiums earned, acquisition costs and general and administrative expenses represent ongoing premium receipts or adjustments and related administration expenses on existing contracts. Interest expense relates to interest on funds withheld on the variable quota share retrocession agreement with Grand Central Re and on certain deposit liabilities. The interest expense on funds withheld from Grand Central Re is based on the average of two total return fixed maturity indices, which varies from period to period.
Claims and policy benefits were $101.1 million for the year ended December 31, 2009 compared to $301.5 million and $345.6 million for the years ended December 31, 2008 and 2007, respectively. Excluding the reinsurance contracts incepting during each year, claims and policy benefits were $59.0 million for the year ended December 31, 2009 compared to $61.9 million and $46.3 million for the years ended December 31, 2008 and 2007, respectively.
Net investment income and net realized and unrealized gains on investments are discussed within the corporate function results of operations as we manage investments for this segment on a consolidated basis with the Bermuda/Dublin insurance and Bermuda/Dublin reinsurance segments.
81
Table of Contents
Corporate Function
The results of operations for the corporate function discussed below include the net investment income, net realized and unrealized gains/losses on investments, net impairment losses recognized in income and net realized gain on retirement of senior notes for all of our segments, including amounts which are allocated to the segments and included in the segment discussions above. These investment results are presented below on a consolidated basis for purposes of ease of discussion.
All other items represent the portion not allocated or discussed in the results of operations of our other segments.
| 2009 | % change | 2008 | % change | 2007 | ||||||||||||||
| In millions of U.S. Dollars | ||||||||||||||||||
| Net investment income |
$ | 169.7 | (6.6 | )% | $ | 181.6 | (3.5 | )% | $ | 188.2 | ||||||||
| Net realized and unrealized gains (losses) on investments |
81.8 | N/A | (235.0 | ) | N/A | 183.8 | ||||||||||||
| Net impairment losses recognized in earnings |
(3.1 | ) | (81.7 | )% | (16.9 | ) | N/A | (1.1 | ) | |||||||||
| Net realized gain on retirement of senior notes |
0.1 | (95.5 | )% | 2.2 | N/A | — | ||||||||||||
| Other income (expense)(1) |
0.8 | N/A | (0.1 | ) | N/A | 0.7 | ||||||||||||
| Interest expense(1) |
10.6 | (51.4 | )% | 21.8 | (8.8 | )% | 23.9 | |||||||||||
| Net foreign exchange (gains) losses(1) |
(0.7 | ) | N/A | 10.3 | N/A | — | ||||||||||||
| Merger and acquisition (income) expenses (1) |
(31.6 | ) | N/A | 2.9 | N/A | — | ||||||||||||
| General and administrative expenses(1) |
43.6 | 3.3 | % | 42.2 | 9.0 | % | 38.7 | |||||||||||
| (1) | Amounts not included in segment results. |
Net investment income. Net investment income, which excludes realized and unrealized gains and losses on investments, decreased 6.6% to $169.7 million for the year ended December 31, 2009 as compared to $181.6 million in 2008. In 2008, net investment income decreased 3.5% from $188.2 million for the year ended December 31, 2007. Net investment income is a function of the investment yield on cash, fixed maturities and funds withheld by clients. The ratio of cash to invested assets and the investment yield on cash, fixed maturities and funds withheld by clients for the three years ended December 31, 2009, 2008 and 2007 were as follows:
| Year |
2009 | 2008 | 2007 | ||||||
| Investment yield |
3.56 | % | 4.35 | % | 4.96 | % | |||
| Ratio of average cash to average invested assets |
15.6 | % | 12.9 | % | 8.7 | % |
The increase in the ratio of cash to invested assets since 2007 is principally attributable to significant cash redemptions received from our hedge fund portfolio, growth in gross premiums written, and a desire to maintain high levels of liquidity, partially offset by the repayment of debt during the period. We anticipate this ratio to decrease as we seek to deploy cash in higher-yielding investments.
82
Table of Contents
Net realized and unrealized gains (losses) on investments include the following:
| 2009 | 2008 | 2007 | |||||||||
| Change in fair value of other investments |
$ | 76.5 | $ | (233.0 | ) | $ | 186.7 | ||||
| Net realized and unrealized gains (losses) on fixed maturities |
4.5 | (2.0 | ) | (2.9 | ) | ||||||
| Change in fair value of derivatives |
0.8 | — | — | ||||||||
| Net realized and unrealized gains (losses) on investments |
$ | 81.8 | $ | (235.0 | ) | $ | 183.8 | ||||
Change in fair value of other investments. Net gains on the hedge fund portfolio were $76.5 million, or a 12.35% rate of return, for the year ended December 31, 2009, compared to net losses of $233.0 million, or a negative 19.27% rate of return, for the year ended December 31, 2008. Net gains on the hedge fund portfolio were $186.7 million, or 16.97% for the year ended December 31, 2007. During 2009 there has been a significant improvement in major equity markets in comparison to the declines seen in 2008. The comparable returns of the HFRI Fund of Funds Composite Index, the Merrill Lynch Master Bond Index and the S&P 500 for the years ended December 31, 2009, 2008 and 2007 were as follows:
| Annual Return | ||||||||||||
| Year |
Max Hedge Fund Portfolio |
HFRI Fund of Funds Composite Index |
Merrill Lynch Master Bond Index |
S&P 500 Index | ||||||||
| 2009 |
12.35 | % | 11.46 | % | 5.24 | % | 26.47 | % | ||||
| 2008 |
(19.27 | )% | (20.97 | )% | 6.20 | % | (37.00 | )% | ||||
| 2007 |
16.97 | % | 10.25 | % | 7.17 | % | 5.49 | % | ||||
Eight out of the nine hedge fund strategies we employed had positive returns during the year ended December 31, 2009. The largest contributors by investment strategy to the net gain for the current year were the distressed securities and the event-driven arbitrage strategies. As of December 31, 2009, 20.0% and 13.3% of our hedge fund portfolio was allocated to the distressed securities and the event-driven arbitrage strategies, respectively.
We reduced the allocation to our hedge fund portfolio from 14.1% of invested assets as of December 31, 2008 to 6.0% as of December 31, 2009. The objective of our hedge fund portfolio is to achieve a market neutral/absolute return strategy, with diversification by strategy and underlying fund. A market neutral strategy strives to generate consistent returns in both up and down markets by selecting long and short positions with a total net exposure of zero. Returns are derived from the long/short spread, or the amount by which long positions outperform short positions. The objective of an absolute return strategy is to provide stable performance regardless of market conditions, with minimal correlation to market benchmarks.
All but one of the hedge fund portfolio strategies we employed experienced negative returns during the year ended December 31, 2008. The largest contributors by investment strategy to the loss in 2008 were the long/short equity and the event-driven arbitrage strategies. As of December 31, 2008, 38.5% and 9.9% of our hedge fund portfolio was allocated to long/short equity and event-driven arbitrage strategies, respectively.
Each hedge fund portfolio strategy we employed was profitable during the year ended December 31, 2007. The hedge fund strategies which principally contributed to the gains in 2007 were the event-driven arbitrage and long/short equity strategies. Contributing to the returns were meaningful gains from a variety of long and short sub-prime mortgage positions taken by several of the underlying funds in our hedge fund portfolio. As at December 31, 2007, 16.1% and 25.4% of our hedge fund portfolio was allocated to the event-driven arbitrage and long/short equity strategies, respectively.
Included in change in fair value of other investments for the year ended December 31, 2008 was a $3.8 million realized loss on a futures transaction that was initiated and fully settled in September 2008. This transaction was initiated as an economic hedge on a portion of our holdings of U.S. government securities.
83
Table of Contents
Net realized and unrealized gains and losses on fixed maturities
Our total fixed maturities portfolio is split into three portfolios:
| • | an available for sale portfolio; |
| • | a held to maturity portfolio; and |
| • | a trading portfolio. |
Our available for sale portfolio is recorded at fair value with unrealized gains and losses recorded in other comprehensive income as part of total shareholders’ equity. Our available for sale fixed maturities investment strategy is not intended to generate significant realized gains and losses as more fully discussed below in the Financial Condition section. Our held to maturity portfolio includes securities for which we have the ability and intent to hold to maturity or redemption, and is recorded at amortized cost. There should be no realized gains or losses related to this portfolio unless there is an other than temporary impairment loss. Our trading portfolio is recorded at fair value with unrealized gains and losses recorded in net income, all of which are reported within our Max at Lloyd’s segment. Net realized and unrealized gains (losses) on our fixed maturities portfolios for the years ended December 31, 2009, 2008 and 2007, were $4.5 million, $(2.0) million and $(2.9) million, respectively.
Net realized and unrealized losses on fixed maturities for the year ended December 31, 2007 includes $1.7 million of realized losses resulting from the sale of fixed maturities triggered by the closing of a restricted account upon the commutation of a reinsurance contract.
The change in fair value of investment derivatives for the year ended December 31, 2009 of $0.8 million related to equity call options embedded in certain convertible fixed maturity securities.
Net impairment losses recognized in earnings.
As a result of our review of securities in an unrealized loss position, which is performed every quarter, we recorded other-than-temporary impairment losses through earnings for the years ended December 31, 2009, 2008 and 2007 of $3.1 million, $16.9 million and $1.1 million, respectively. These impairment losses are presented separately from all other net realized gains and losses on fixed maturities. A discussion of our process for estimating other-than-temporary impairments is included in Note 3 of our audited consolidated financial statements included herein.
Interest expense. Interest expense principally reflects interest on our bank loans and senior notes outstanding. The 51.4% decrease in interest expense for the year ended December 31, 2009 compared to 2008, is principally attributable to the repayment of $150.0 million in bank loans in April 2009 and the $225.0 million repayment of the swap loan in August 2009. The remaining debt at December 31, 2009 comprises $90.6 million in senior notes outstanding that bear interest at 7.20%.
Interest expense for 2008 decreased by 8.8% compared to 2007 primarily due to the impact of decreased LIBOR interest rates, partially offset by the $36.6 million increase in outstanding debt as of December 31, 2008 compared to December 31, 2007.
Merger and acquisition expenses. Merger and acquisition expenses in 2009 are principally comprised of the professional fees related to the proposed amalgamation with IPC Holdings, Ltd, or IPC, and IPC Limited, which was terminated in June 2009. A $50.0 million termination fee received from IPC is included within merger and acquisition expenses for the year ended December 31, 2009. Merger and acquisition expenses in 2008 comprise the professional and legal fees related to the acquisition of Max UK and the creation of our Max at Lloyd’s segment.
Foreign exchange gains and losses. Foreign exchange losses for the year ended December 31, 2008 of $10.6 million arose in connection with the purchase of Max UK.
84
Table of Contents
We purchased British pounds in advance of the acquisition of Max UK and before the transaction closed the value of the British pound dropped significantly relative to the U.S. dollar. Foreign exchange gains and losses for the years 2009 and 2007 were not significant to our operating results.
General and administrative expenses. General and administrative expenses for the year ended December 31, 2009 increased $1.4 million compared to 2008, principally due to a higher level of expense related to information technology. We consider information technology to be a critical component of our business and we expect to make recurring and often significant investments in upgrading and maintaining our technology infrastructure in future years. Some of these costs are retained in the corporate function; however the majority of these costs are allocated to the relevant segments.
The increase in general and administrative expense for the year ended December 31, 2008 compared to 2007 was principally related to an increase in personnel and information technology related costs.
Financial Condition
Cash and invested assets. Aggregate invested assets, comprising cash and cash equivalents, fixed maturities and other investments, were $5,259.1 million at December 31, 2009 compared to $5,356.9 million at December 31, 2008, a decrease of 1.8%. The decrease in cash and invested assets resulted principally from the settlement of claims and the repayment of bank loans during the period, partially offset by positive cash flow from the growth in net premiums written.
We own an available for sale portfolio, a trading portfolio, and a held to maturity portfolio of fixed maturities securities.
We record the available for sale and trading investment portfolios at fair value on our balance sheet. On our available for sale portfolio, the unrealized gain or loss (absent credit losses) associated with the difference between the fair value and the amortized cost of the investments is recorded in other comprehensive income in the shareholders’ equity section of our consolidated balance sheet. On our trading portfolio, the unrealized gain or loss associated with the difference between the fair value and the amortized cost of the investments is recorded in net income as a net realized gain or loss.
To match the more predictable cash flow requirements of our long term liabilities, we invest a portion of our fixed maturities investments in long duration securities. Because we have the intent to hold certain of these securities to maturity, we reclassified those securities into a held to maturity portfolio during 2009. This held to maturity portfolio is recorded at amortized cost rather than at fair value, which should reduce the impact on shareholders’ equity of fluctuations in fair value of those investments.
Fixed maturities are subject to fluctuations in fair value due to changes in interest rates, changes in issuer specific circumstances, such as credit rating changes, and changes in industry specific circumstances, such as movements in credit spreads based on the market’s perception of industry risks. As a result of these potential fluctuations, it is possible to have significant unrealized gains or losses on a security. Our strategy for our fixed maturities portfolios is to tailor the maturities of the portfolios to the timing of expected loss and benefit payments. At maturity, absent any credit loss, a fixed maturity’s amortized cost will equal its fair value and no realized gain or loss will be recognized in income. If, due to an unforeseen change in loss payment patterns, we need to sell available for sale fixed maturity securities before maturity, we could realize significant gains or losses in any period, which could result in a meaningful effect on reported net income for such period.
In order to reduce the likelihood of needing to sell investments before maturity, especially given the unpredictable and potentially significant cash flow requirements of our
85
Table of Contents
property catastrophe business, we maintain significant cash and cash equivalent balances. We believe it is more likely than not that we will not be required to sell those fixed maturities securities in an unrealized loss position until such time as they reach maturity or the fair value increases.
We perform regular reviews of our fixed maturities portfolio and utilize a process that considers numerous indicators in order to identify investments that are showing signs of potential other than temporary impairments. The indicators include the issuer’s financial condition and ability to make future scheduled interest and principal payments, benchmark yield spreads, the nature of collateral or other credit support and significant economic events that have occurred that affect the industry in which the issuer participates.
Our portfolio of investment grade fixed maturities includes mortgage-backed and asset-backed securities and collateralized mortgage obligations. These types of securities have cash flows that are backed by the principal and interest payments of a group of underlying mortgages or other receivables. As a result of the increasing default rates of borrowers, there is a greater risk of defaults on mortgage-backed and asset-backed securities and collateralized mortgage obligations, especially those that are non-investment grade. These factors make the estimate of fair value more uncertain. We obtain fair value estimates from multiple independent pricing sources in an effort to mitigate some of the uncertainty surrounding the fair value estimates. If we need to liquidate these securities within a short period of time, the actual realized proceeds may be significantly different from the fair values estimated at December 31, 2009.
We performed a review of these securities, at December 31, 2009, for other-than-temporary impairments, which includes the consideration of relevant factors, including prepayment rates, subordination levels, default rates, credit ratings, weighted average life and cash flow testing. Together with our investment managers, we continue to monitor our potential exposure to mortgage-backed and asset-backed securities, and we will make adjustments to the investment portfolio, if and when it is deemed necessary. As a result of this process, we recognized an other than temporary impairment charge through net income of $3.1 million during the year ended December 31, 2009.
A discussion of our process for estimating other-than-temporary impairments is included in Note 3 of our audited consolidated financial statements.
As described in Note 4 of our audited consolidated financial statements, our available for sale and trading fixed maturities investments and our hedge fund investment portfolio are carried at fair value.
Fair value prices for all securities in our fixed maturities portfolio, which are carried at fair value, are independently provided by both our investment custodians and our investment managers, which each utilize internationally recognized independent pricing services. We record the unadjusted price provided by the investment custodians and our validation process includes, but is not limited to: (i) comparison to the price provided by the investment manager, with significant differences investigated; (ii) quantitative analysis (e.g., comparing the quarterly return for each managed portfolio to its target benchmark, with significant differences identified and investigated); (iii) evaluation of methodologies used by external parties to calculate fair value; and (iv) comparing the price to our knowledge of the current investment market.
The independent pricing services used by our investment custodians and investment managers obtain actual transaction prices for securities that have quoted prices in active markets. Each pricing service has its own proprietary method for determining the fair value of securities that are not actively traded. In general, these methods involve the use of “matrix pricing” in which the independent pricing service uses observable market inputs including, but not limited to, reported trades, benchmark yields, broker/dealer quotes, interest rates, prepayment speeds, default rates and such other inputs as are available from
86
Table of Contents
market sources to determine a reasonable fair value. In addition, pricing services use valuation models, such as an Option Adjusted Spread model, to develop prepayment and interest rate scenarios. The Option Adjusted Spread model is commonly used to estimate fair value for securities such as mortgage-backed and asset-backed securities. The ability to obtain quoted market prices is reduced in periods of decreasing liquidity, which generally increases the use of matrix pricing methods and generally increases the uncertainty surrounding the fair value estimates.
Investments in hedge funds comprise a portfolio of limited partnerships and stock investments in trading entities, or funds, which invest in a wide range of financial products. The units of account that we value are our interests in the funds and not the underlying holdings of such funds. Thus, the inputs we use to value our investments in each of the funds may differ from the inputs used to value the underlying holdings of such funds. These funds are stated at fair value which ordinarily will be the most recently reported net asset value as advised by the fund manager or administrator, where the fund’s underlying holdings can be in various quoted and unquoted investments. We believe the reported net asset value represents the fair value market participants would apply to an interest in the fund. The fund managers value their underlying investments at fair value in accordance with policies established by each fund, as described in each of their financial statements and offering memoranda.
We have designed ongoing due diligence processes with respect to funds and their managers. These processes are designed to assist us in assessing the quality of information provided by, or on behalf of, each fund and in determining whether such information continues to be reliable or whether further review is necessary. While reported net asset value is the primary input to the review, when the net asset value is deemed not to be indicative of fair value, we may incorporate adjustments to the reported net asset value. Such adjustments may involve significant judgment. We obtain the audited financial statements for every fund annually, and regularly review and discuss the fund performance with the fund managers to corroborate the reasonableness of the reported net asset values.
We are able to redeem the hedge fund portfolio held through Max Diversified on the same terms that the underlying funds can be liquidated. In general, the funds in which we are invested require at least 30 days notice of redemption, and may be redeemed on a monthly, quarterly, semi-annual, annual, or longer basis, depending on the fund.
Certain funds in which we are invested have a lock-up period. A lock-up period refers to the initial amount of time an investor is contractually required to invest before having the ability to redeem. Funds that do provide for periodic redemptions may, depending on the funds’ governing documents, have the ability to deny or delay a redemption request, called a gate. The fund may implement this restriction because the aggregate amount of redemption requests as of a particular date exceeds a specified level, generally ranging from 15% to 25% of the fund’s net assets. The gate is a method for executing an orderly redemption process which allows for redemption requests to be executed in a timely manner to reduce the possibility of adversely affecting the remaining investors in the fund.
The majority of our hedge fund portfolio is redeemable within one year, and the imposition of gates by certain funds is not expected to significantly impact our cash flow needs. Based upon information provided by the fund managers, as of December 31, 2009, we estimate that over 74% (2008—87.0%) of the underlying assets held by our hedge fund investment portfolio are traded securities or have broker quotes available. Typically, the imposition of a gate delays a portion of the requested redemption, with the remaining portion settled in cash shortly after the redemption date. Of our December 31, 2009 outstanding redemptions receivable of $79.1 million (2008—$98.1 million), none of which are gated, $64.0 million were received in cash prior to February 12, 2010. The fair value of our holdings in funds with gates imposed as at December 31, 2009 was $41.8 million (2008—$42.7 million).
87
Table of Contents
Certain funds may be allowed to invest a portion of their assets in illiquid securities, such as private equity and convertible debt. In such cases, a common mechanism used is a side-pocket, whereby the illiquid security is assigned to a separate memorandum capital account or designated account. Typically, the investor loses its redemption rights to the designated account. Only when the illiquid security is sold, or otherwise deemed liquid by the fund, may investors redeem their interest. As at December 31, 2009, the fair value of our hedge funds held in side-pockets is $99.8 million (2008—$113.4 million).
Due to the uncertainty surrounding the timing of the redemption of the underlying assets within side-pockets and funds with gates imposed we have included these funds in the greater than 365 days category in the table below.
Had we requested full redemptions for all of our holdings in the funds, the tables below indicate our best estimate of the earliest date from December 31, 2009, on which such redemptions might be received. This estimate is based on available information from the funds and is subject to significant change.
| As at December 31, 2009 | ||||||
| Fair Value | % of Hedge fund portfolio | |||||
| (in thousands) | ||||||
| Liquidity: |
||||||
| Within 90 days |
$ | 90,515 | 29.0 | % | ||
| Between 91 to 180 days |
32,278 | 10.3 | ||||
| Between 181 to 365 days |
41,367 | 13.3 | ||||
| Greater than 365 days |
147,917 | 47.4 | ||||
| Total |
$ | 312,077 | 100.0 | % | ||
Although we believe that our significant cash balances, fixed maturities investments, and credit facilities provide sufficient liquidity to satisfy the claims of insureds and ceding clients, in the event that we were required to access assets invested in the hedge fund investment portfolio, our ability to do so may be impaired by these liquidity constraints. See “Risk Factors—Unexpected volatility or illiquidity associated with our hedge fund investment portfolio could significantly and negatively affect our ability to conduct business.”
Additional information about the hedge fund portfolio can be found in Note 3 and Note 4 to our audited consolidated financial statements included herein.
Losses and benefits recoverable from reinsurers. Losses and benefits recoverable from reinsurers totaled $1,001.4 million at December 31, 2009 compared to $846.6 million at December 31, 2008, an increase of 18.3%, principally reflecting losses ceded under our reinsurance and retrocessional agreements resulting from net earned premiums during the year ended December 31, 2009.
At December 31, 2009, 83.6% of our losses recoverable were with reinsurers rated “A” or above by A.M. Best and 5.3% are rated “A-”. Grand Central Re, a Bermuda domiciled reinsurance company in which Max Bermuda has a 7.5% equity investment, is our largest “NR—not rated” retrocessionaire and accounted for 10.1% of our losses recoverable at December 31, 2009. As security for outstanding loss obligations, we retain funds from Grand Central Re amounting to 108.0% of its loss recoverable obligations. The remaining 1.0% of losses recoverable are with “B+” rated or lower reinsurers.
Liabilities for property and casualty losses. Property and casualty losses totaled $3,178.1 million at December 31, 2009 compared to $2,938.2 million at December 31, 2008, an increase of 8.2%. The increase in property and casualty losses was principally attributable to estimated losses associated with premiums earned during the year ended December 31, 2009 partially offset by amounts paid on property and casualty losses and releases of
88
Table of Contents
reserves on prior period contracts. During the year ended December 31, 2009, we paid $513.6 million in property and casualty losses and recorded gross favorable development on prior period reserves of $104.9 million.
Liabilities for life and annuity benefits. Life and annuity benefits totaled $1,372.5 million at December 31, 2009 compared to $1,367.0 million at December 31, 2008. The increase was principally attributable to the reinsurance contract written in the year ended December 31, 2009, which increased life and annuity benefits by $42.1 million, together with foreign exchange movements, partially offset by benefit payments. During the year ended December 31, 2009, we paid $126.0 million of benefit payments.
Bank loans. As described in Note 11 to our consolidated financial statements included herein, we repaid $375.0 million of bank loans during the year. The $150.0 million borrowed under our revolving credit facility was fully repaid in April 2009 and the swap loan, which had a balance of $225.0 million at December 31, 2008 was repaid in full by September 30, 2009.
Senior notes. On April 16, 2007, Max USA privately issued $100.0 million principal amount of 7.20% senior notes, due April 14, 2017 with interest payable on April 16 and October 16 of each year. The senior notes are Max USA’s senior unsecured obligations and rank equally in right of payment with all existing and future senior unsecured indebtedness of Max USA. The senior notes are fully and unconditionally guaranteed by Max Capital. The effective interest rate related to the senior notes, based on the net proceeds received, was approximately 7.27%. The net proceeds from the sale of the senior notes were $99.5 million, and they were used to repay the $100.0 million short-term borrowing of Max USA under the revolving credit facility.
On December 10, 2009, Max USA repurchased $0.9 million principal amount of these notes for a purchase price of $0.8 million, recognizing a gain of $0.1 million. The principal amount of the senior notes outstanding at December 31, 2009 is $90.6 million. On December 30, 2008, Max USA repurchased $8.5 million principal amount of these notes, recognizing a gain of $2.2 million.
Shareholders’ equity. Our shareholders’ equity increased to $1,564.6 million at December 31, 2009 from $1,280.3 million at December 31, 2008, an increase of 22.2%, principally due to the net income of $246.2 million and an increase in accumulated other comprehensive income of $70.8 million. The increase in accumulated other comprehensive income was due to improvements in fair value of our available for sale investment portfolio, and the impact of the weakening of the US dollar against the Euro and British pound during the year. These increases were partially offset by the payments of dividends of $21.7 million and the repurchase of common shares of $34.3 million during the year ended December 31, 2009.
Liquidity. We generated $193.2 million of cash from operations during the year ended December 31, 2009 compared to $482.0 million for the year ended December 31, 2008. The two principal factors that impact our operating cash flow are premium collections and timing of loss and benefit payments. The decrease in cash flow from operations is principally due to the timing of the payment of property and casualty losses, the payment of reinsurance premiums ceded and the decrease in life and annuity gross premiums written.
The casualty business we write generally has a long claim-tail, and we expect that we will generate significant operating cash flow as we accumulate property and casualty loss reserves and life and annuity benefit reserves on our balance sheet. As we continue to diversify into property business, which generally has a short claim-tail, and as losses are incurred, we expect potential volatility in our operating cash flow levels. We believe that our property and casualty loss reserves and life and annuity benefit reserves currently have an average duration of approximately 5.1 years and we expect to see increases in the amount of expected loss payments in future periods with a resulting decrease in operating
89
Table of Contents
cash flow. We do not expect loss payments to exceed the premiums generated and therefore expect to have continued positive cash flow. However, actual premiums written and collected and losses and loss expenses paid in any period could vary from our expectations and could have a significant and adverse effect on operating cash flow.
While we tailor our fixed maturities portfolios to match the duration of expected loss and benefit payments, increased loss amounts or settlement of losses and benefits earlier than anticipated can result in greater cash needs. We maintain a significant working cash balance and have generated positive cash flow from operations in each of our last eight years of operating history. In recent years our allocation of invested assets to cash has increased as we have elected to maintain a larger cash position in the current investment environment. Our cash and cash equivalents balance is $702.3 million at December 31, 2009. We believe that we currently maintain sufficient liquidity to cover existing requirements and provide for contingent liquidity. Nonetheless, it is possible that significant deviations in expected loss and benefit payments can occur, potentially requiring us to liquidate a portion of our fixed maturities portfolios. If we need to liquidate our fixed maturities securities within a short period of time, the actual realized proceeds may be significantly different from the fair values estimated at December 31, 2009. We believe that most of our portfolio has sufficient liquidity to mitigate this risk, and we believe that we can continue to hold any potentially illiquid position until we can initiate an appropriately priced transaction.
As a holding company, Max Capital’s principal assets are its investments in the common shares of its principal subsidiary, Max Bermuda, and its other subsidiaries. Max Capital’s principal source of funds is from interest income on cash balances and cash dividends from its subsidiaries, including Max Bermuda. The payment of dividends is limited under Bermuda insurance laws. In particular, Max Bermuda may not declare or pay any dividends if it is in breach of its minimum solvency or liquidity levels under Bermuda law or if the declaration or payment of the dividends would cause it to fail to meet the minimum solvency or liquidity levels under Bermuda law. At December 31, 2009, Max Bermuda had approximately $1,425.0 million in statutory capital and surplus and met all minimum solvency and liquidity requirements. Max Bermuda returned $50.0 million of capital and surplus to Max Capital during the year ended December 31, 2009.
In the ordinary course of business, we are required to provide letters of credit or other regulatory approved security to certain of our clients to meet contractual and regulatory requirements. As of December 31, 2009, we had two letter of credit facilities totaling $675.0 million with an additional $200.0 million available subject to certain conditions. On that date, we had $461.3 million in letters of credit outstanding under these facilities. We also have a GBP 90.0 million ($145.5 million) letter of credit facility supporting our Funds at Lloyd’s commitments, of which GBP 63.6 million ($102.9 million) was utilized as of December 31, 2009. Each of our credit facilities requires that we comply with certain covenants, which may include a minimum consolidated tangible net worth, a minimum insurer financial strength rating and restrictions on the payment of dividends. We were in compliance with all the covenants of each of our credit facilities at December 31, 2009.
The amount which Max Capital provides as Funds at Lloyd’s is not available for distribution for the payment of dividends. Our corporate members may also be required to maintain funds under the control of Lloyd’s in excess of their capital requirements and such funds also may not be available for distribution of the payment of dividends.
Capital resources. At December 31, 2009, our capital structure consisted of common equity. Total capitalization amounted to $1,564.6 million as compared to $1,280.3 million at December 31, 2008, an increase of 22.2%. On August 20, 2007, we filed an automatic shelf registration statement on Form S-3 with the SEC indicating that we may periodically issue up to $500.0 million in debt securities, common shares, preferred shares, depository shares, warrants, share-purchase contracts and share purchase units. The shelf registration statement also covers debt securities of Max USA and trust preferred securities of Max
90
Table of Contents
Capital Trust I. No securities have been issued under the shelf registration statement. We believe that we have sufficient capital to meet our financial obligations.
In December 2009 we entered into a pre-arranged stock trading plan to repurchase our common shares through a brokerage account. The stock trading plan is intended to be in accordance with guidelines specified under Rule 10b5-1 of the Securities and Exchange Act of 1934. Rule 10b5-1 allows public companies to adopt written, pre-arranged stock trading plans when they do not have material, non-public information in their possession. Pursuant to the plan, we may purchase up to $35.0 million of our common shares on the open market from time to time until April 30, 2010, subject to market conditions and other factors.
In April 2007, Max USA privately issued $100.0 million aggregate principal amount of 7.20% senior notes due April 14, 2017, of which $90.6 million remained outstanding at December 31, 2009. The senior notes are guaranteed by Max Capital. As of December 31, 2009, the senior notes were assigned a senior unsecured debt rating by S&P, A.M. Best, Fitch, and Moody’s (see table below). The ratings assigned by rating agencies to reinsurance and insurance companies are based upon factors and criteria established independently by each rating agency. They are not an evaluation directed to investors in our senior notes, and are not a recommendation to buy, sell or hold our senior notes. These ratings are subject to periodic review by the rating agencies or may be revised downward or revoked at the sole discretion of the rating agencies.
Ratings are an important factor in establishing the competitive position of reinsurance and insurance companies and are important to our ability to market our products. We have a financial strength rating for our non-Lloyd’s reinsurance and insurance subsidiaries from each of A.M. Best, Fitch, Moody’s and S&P (see table below). These ratings reflect each rating agency’s opinion of our financial strength, operating performance and ability to meet obligations. They are not evaluations directed toward the protection of investors in securities issued by Max Capital. The Syndicates share the Lloyd’s market ratings (see table below).
At December 31, 2009, we were rated as follows:
| A.M. Best |
Fitch |
Moody’s |
S&P | |||||
| Financial strength rating for non-Lloyd’s reinsurance and insurance subsidiaries |
A-(excellent)(1) | A (strong)(1) | A3(2) | A- (1) | ||||
| Outlook on financial strength rating |
Positive(1) | Negative(1) | Negative(2) | Stable (1) | ||||
| Senior notes senior unsecured debt rating(3) |
bbb- | BBB+ | Baa2 | BBB | ||||
| Outlook on debt rating(3) |
Positive | Negative | Negative | Stable | ||||
| Lloyd’s financial strength rating applicable to the Syndicates(4) |
A (excellent) | A+ (strong) | Not applicable | A+ (strong) |
| (1) | Applicable to Max Bermuda, Max Specialty, Max America, Max Re Europe and Max Insurance Europe. |
| (2) | Applicable to Max Bermuda. |
| (3) | Applicable to Max USA. |
| (4) | Applicable to the Syndicates. |
Max Capital’s board of directors declared the following dividends during 2009 and the first quarter of 2010:
| Date Declared |
Dividend | Dividend to be paid to shareholders of record on |
Payable on | ||||
| February 9, 2010 |
$ | 0.10 | February 23, 2010 | March 9, 2010 | |||
| November 3, 2009 |
$ | 0.10 | November 16, 2009 | November 30, 2009 | |||
| August 4, 2009 |
$ | 0.10 | August 18, 2009 | September 1, 2009 | |||
| May 4, 2009 |
$ | 0.09 | May 18, 2009 | June 1, 2009 | |||
| February 10, 2009 |
$ | 0.09 | February 24, 2009 | March 10, 2009 | |||
91
Table of Contents
Continuation of cash dividends in the future will be at the discretion of the board of directors and will be dependent upon our results of operations and cash flows, and our financial position and capital requirements, general business conditions, legal, tax, regulatory and any contractual restrictions on the payment of dividends and other factors the board of directors deems relevant.
No off-balance sheet arrangements. We do not participate in transactions that generate relationships with unconsolidated entities or financial partnerships, such as entities often referred to as structured finance or variable interest entities that would have been established for the purpose of facilitating off-balance sheet arrangements or other contractually narrow or limited purposes.
Contractual Obligations
| Payment due by period (in thousands of U.S. dollars) | |||||||||||||||
| Contractual Obligations |
Total | Less than 1 year |
1-3 years |
3-5 years |
More than 5 years | ||||||||||
| Senior notes |
$ | 139,569 | $ | 6,525 | $ | 13,051 | $ | 13,051 | $ | 106,942 | |||||
| Operating lease obligations |
22,866 | 6,519 | 9,996 | 4,341 | 2,010 | ||||||||||
| Property and casualty losses |
3,178,094 | 618,103 | 1,079,162 | 694,944 | 785,885 | ||||||||||
| Life and annuity benefits |
2,432,472 | 115,319 | 218,849 | 203,588 | 1,894,716 | ||||||||||
| Deposit liabilities |
198,326 | 41,629 | 89,115 | 10,692 | 56,890 | ||||||||||
| Total |
$ | 5,971,327 | $ | 788,095 | $ | 1,410,173 | $ | 926,616 | $ | 2,846,443 | |||||
The reserves for losses and benefits together with deposit liabilities represent management’s estimate of the ultimate cost of settling losses, benefits and deposit liabilities. As more fully discussed in our “Critical Accounting Policies—Losses and benefits” above, the estimation of losses and benefits is based on various complex and subjective judgments. Actual losses and benefits paid may differ, perhaps significantly, from the reserve estimates reflected in our financial statements. Similarly, the timing of payment of our estimated losses and benefits is not fixed and there may be significant changes in actual payment activity. The assumptions used in estimating the likely payments due by period are based on our historical claims payment experience and industry payment patterns, but due to the inherent uncertainty in the process of estimating the timing of such payments, there is a risk that the amounts paid in any such period can be significantly different than the amounts disclosed above.
The amounts in this table represent our gross estimates of known liabilities as of December 31, 2009 and do not include any allowance for claims for future events within the time period specified. Accordingly, it is highly likely that the total amounts paid out in the time periods shown will be greater than that indicated in the table.
Furthermore, life and annuity benefits and deposit liabilities recorded in the audited consolidated financial statements at December 31, 2009 are computed on a net present value basis, whereas the expected payments by period in the table above are the estimated payments at a future time and do not reflect a discount of the amount payable.
New Accounting Pronouncements
ASU 2010-06, Fair Value Measurements and Disclosures (820)—Improving Disclosures about Fair Value Measurements
ASU 2010-06 requires additional disclosure, and clarifies existing disclosure requirements, about fair value measurements. The additional requirements include disclosure regarding the amounts and reasons for significant transfers in and out of Level 1 and 2 of the fair value hierarchy and also separate presentation of purchases, sales, issuances and settlements of items measured using significant unobservable inputs (i.e. Level 3). The guidance clarifies existing disclosure requirements regarding the inputs and
92
Table of Contents
valuation techniques used to measure fair value for measurements that fall in either Level 2 or Level 3 of the hierarchy. The requirements are effective for interim and annual reporting periods beginning after December 15, 2009 except for the disclosures about purchases, sales, issuances and settlements which is effective for fiscal years beginning after December 15, 2010 and for interim periods within those fiscal years. The guidance is not expected to have a material impact on our consolidated financial statements.
ASU 2009-12, Fair Value Measurements and Disclosures (820)—Investments in Certain Entities That Calculate Net Asset Value per Share (or its Equivalent)
ASU 2009-12 expands the circumstances in which a practical expedient may be used to estimate fair value to include investments in foreign and other entities that have attributes of investment companies and report net asset value or its equivalent to their investors. The practical expedient cannot be used for investments that have a readily determinable fair value. The ASU sets forth disclosure requirements for investments within its scope. The amendments in ASU 2009-12 are effective for interim and annual periods ending after December 15, 2009 with early adoption permitted. We adopted this accounting standards update for the year ended December 31, 2009. It did not have a material impact on our consolidated financial statements.
ASU 2009-05, Fair Value Measurements and Disclosures (820)—Measuring Liabilities at Fair Value
ASU 2009-05 allows companies determining the fair value of a liability to use the perspective of an investor that holds the related obligation as an asset. The guidance was effective for interim and annual periods beginning after August 27, 2009 and applied to all fair value measurements of liabilities. This accounting standards update did not have a material impact on our consolidated financial statements.
ASU 2009-01—The FASB Accounting Standards Codification and Hierarchy of Generally Accepted Accounting Principles
On July 1, 2009, the FASB launched its Accounting Standards Codification (the “Codification”). The Codification became the sole source of authoritative U.S. GAAP for interim and annual periods ending after September 15, 2009. Other than resolving certain minor inconsistencies in current U.S. GAAP, the Codification does not change U.S. GAAP, but is intended to make it easier to find and research U.S. GAAP applicable to a particular transaction or specific accounting issue. The Codification did not have a material impact on our consolidated financial statements.
Recognition and Presentation of Other-Than-Temporary Impairments
In April 2009, the FASB issued guidance regarding the recognition and presentation of other-than-temporary impairments. This guidance amends the other-than-temporary impairment guidance in U.S. GAAP for debt securities to make the guidance more operational and to improve the presentation and disclosure of other-than-temporary impairments on debt and equity securities in the financial statements. The guidance changes the amount of other-than-temporary impairment that is recognized in earnings when there are credit losses on a debt security for which management does not intend to sell and for which it is more-likely-than-not that the entity will not have to sell prior to recovery of the non-credit impairment. In those situations, the portion of the total impairment that is attributable to the credit loss would be recognized in earnings, and the remaining difference between the debt security’s amortized cost basis and its fair value would be included in other comprehensive income. The guidance was effective for interim and annual reporting periods ending after June 15, 2009, with early adoption permitted for periods ending after March 15, 2009. We adopted the FASB guidance on April 1, 2009 and it did not have a material impact on our consolidated financial statements.
93
Table of Contents
Determining Fair Value When the Volume and Level of Activity for the Asset or Liability Have Significantly Decreased and Identifying Transactions That Are Not Orderly
In April 2009, the FASB issued guidance regarding the determination of fair value when the volume and level of activity for the asset or liability have significantly decreased and identifying transactions that are not orderly. This guidance also provides additional guidance for estimating fair value when the volume and level of activity for the asset or liability have significantly decreased and for identifying circumstances that indicate a transaction is not orderly. The guidance was effective for interim and annual reporting periods ending after June 15, 2009, to be applied prospectively. We adopted the FASB guidance on April 1, 2009 and it did not have a material impact on our consolidated financial statements.
Interim Disclosures about Fair Value of Financial Instruments
In April 2009, the FASB issued guidance regarding interim disclosures about fair value of financial instruments which requires the disclosure about fair value of financial instruments in interim and annual financial statements. This guidance was effective for interim reporting periods ending after June 15, 2009. We adopted the guidance on April 1, 2009 and reflected the relevant required disclosures in the interim consolidated financial statements.
| ITEM 7A. | QUANTITATIVE AND QUALITATIVE DISCLOSURES ABOUT MARKET RISK |
We engage in an investment strategy that combines a fixed maturities investment portfolio and hedge fund portfolio that employ strategies to manage investment risk. We attempt to maintain adequate liquidity in our cash and fixed maturities investment portfolio to fund operations, pay reinsurance and insurance liabilities and claims and provide funding for unexpected events. We seek to manage our credit risk through industry and issuer diversification, and interest rate risk by monitoring the duration and structure of our investment portfolio relative to the duration and structure of our liability portfolio. We are exposed to potential loss from various market risks, primarily changes in interest rates, credit spreads and equity prices. Accordingly, earnings would be affected by these changes. We manage our market risk based on board-approved investment policies. With respect to our fixed maturities investment portfolio, our risk management strategy and investment policy is to invest in debt instruments of investment grade issuers and to limit the amount of credit exposure with respect to particular ratings categories and any one issuer. We select investments with characteristics such as duration, yield, currency and liquidity that are tailored to the cash flow characteristics of our property and casualty and life and annuity liabilities.
As of December 31, 2009, 96.6% of the securities held in our fixed maturities portfolios were rated Baa3/BBB- or above. Under our current fixed maturities investment guidelines, securities in our fixed maturities portfolio, when purchased, must have a minimum rating of Baa3/BBB-, or its equivalent, from at least one internationally recognized statistical rating organization. We allow two of our investment managers (managing approximately 1.8% of our invested assets by fair value at December 31, 2009) to follow an opportunistic strategy, allowing them to purchase securities below investment-grade; however no more than 10.0% of their holdings may be rated below B3/B-. In addition, a minimum weighted average credit quality rating of Aa2/AA, or its equivalent, must be maintained for our fixed maturities investment portfolio as a whole. At December 31, 2009, the impact on the fixed maturities investment portfolio from an immediate 100 basis point increase in market interest rates would have resulted in an estimated decrease in fair value of 4.0% or approximately $171.4 million, and the impact on the fixed maturities investment portfolio from an immediate 100 basis point decrease in market interest rates would have resulted in an estimated increase in fair value of 4.7% or approximately $199.4 million.
94
Table of Contents
With respect to our hedge fund portfolio we consistently and systematically monitor the strategies and funds in which we are invested. We focus on risk, as opposed to return, in the selection of each of our hedge fund portfolio investments. This causes us to select individual hedge funds that have exhibited attractive risk/reward characteristics and low correlation to other investments in the portfolio, as opposed to individual investments that have shown the highest return, but also higher volatility of return. We then combine the selected individual hedge funds into a portfolio of hedge funds. By combining investments that we believe have moderate volatility and low correlations, we aim to achieve a hedge fund portfolio that has overall lower volatility relative to investing in a common stock portfolio or a typical fund of hedge funds portfolio.
At December 31, 2009, the estimated impact on the hedge fund portfolio from an immediate 100 basis point increase in market interest rates would have resulted in an estimated decrease in market value of 1.3%, or approximately $4.0 million, and the impact on the hedge fund portfolio from an immediate 100 basis point decrease in market interest rates would have resulted in an estimated increase in market value of 1.3%, or approximately $4.0 million. Another method that attempts to measure portfolio risk is Value-at-Risk, or VaR. VaR is a statistical risk measure, calculating the level of potential losses that could be expected to be exceeded, over a specified holding period and at a given level of confidence, in normal market conditions, and is expressed as a percentage of the portfolio’s initial value. Since the VaR approach is based on historical positions and market data, VaR results should not be viewed as an absolute and predictive gauge of future financial performance or as a way for us to predict risk. At December 31, 2009, our hedge fund portfolio’s VaR was estimated to be 13.0% at the 99.0% level of confidence and with a three-month time horizon.
ITEM 8. FINANCIAL STATEMENTS AND SUPPLEMENTARY DATA
Information with respect to this item is set forth under Item 15.
ITEM 9. CHANGES IN AND DISAGREEMENTS WITH ACCOUNTANTS ON ACCOUNTING AND FINANCIAL DISCLOSURE
None.
ITEM 9A. CONTROLS AND PROCEDURES
Part A—Evaluation of Disclosure Controls and Procedures.
Our disclosure controls and procedures (as defined in Rule 13a-15(e) under the Exchange Act), which we refer to as disclosure controls, are controls and procedures that are designed with the objective of ensuring that information required to be disclosed in our reports filed under the Exchange Act, such as this Annual Report on Form 10-K, is recorded, processed, summarized and reported within the time periods specified in the SEC rules and forms. Disclosure controls are also designed with the objective of ensuring that such information is accumulated and communicated to our management, including the Chief Executive Officer and the Chief Financial Officer, as appropriate, to allow timely decisions regarding required disclosure. There are inherent limitations to the effectiveness of any control system. A control system, no matter how well conceived and operated, can provide only reasonable assurance that its objectives are met. No evaluation of controls can provide absolute assurance that all control issues and instances of fraud, if any, within our Company have been detected.
As of December 31, 2009, an evaluation was carried out under the supervision and with the participation of Max Capital’s management, including the Chief Executive Officer and Chief Financial Officer, of the effectiveness of the design and operation of our disclosure controls. Based upon that evaluation, the Chief Executive Officer and Chief Financial Officer concluded that the design and operation of these disclosure controls were effective to ensure that material information relating to our Company is made known to management, including the Chief Executive Officer and Chief Financial Officer, particularly during the periods when our periodic reports are being prepared.
95
Table of Contents
Part B—Internal Control Over Financial Reporting
Management is responsible for establishing and maintaining adequate internal control over financial reporting (as defined in Rule 13a-15(f) under the Exchange Act). Our company’s internal control system was designed to provide reasonable assurance regarding the reliability of financial reporting and the preparation of financial statements for external purposes in accordance with U.S. GAAP. There are inherent limitations to the effectiveness of any control system. A control system, no matter how well conceived and operated, can provide only reasonable assurance that its objectives are met. No evaluation of controls can provide absolute assurance that all control issues and instances of fraud, if any, within our company have been detected.
Management assessed the effectiveness of the Company’s internal control over financial reporting as of December 31, 2009. In making this assessment, management used the criteria set forth by the Committee of Sponsoring Organizations of the Treadway Commission (COSO) in Internal Control—Integrated Framework. Based on our assessment, we believe that, as of December 31, 2009, the Company’s internal control over financial reporting is effective based on those criteria.
The attestation report issued by our independent registered public accounting firm, KPMG, on our assessment of our internal control over financial reporting is included on page F-2.
Management evaluated whether there was a change in our company’s internal control over financial reporting during the three months ended December 31, 2009 that has materially affected, or is reasonably likely to materially affect, the company’s internal control over financial reporting. Based on our evaluation, we believe that there was no such change during the three months ended December 31, 2009.
None.
96
Table of Contents
ITEM 10. DIRECTORS AND EXECUTIVE OFFICERS OF THE REGISTRANT AND CORPORATE GOVERNANCE
The information required in response to this Item is contained under the captions “Proposal One—Election Of Directors Of The Company,” “Composition, Meetings and Committees of the Board of Directors” and “Section 16(a) Beneficial Ownership Reporting Compliance” in the Proxy Statement, to be filed on or about March 16, 2010, with the SEC pursuant to Regulation 14A. These portions of the Proxy Statement are hereby incorporated by reference herein.
We have adopted a written code of ethics, the “Max Capital Group Ltd. Code of Business Conduct and Ethics,” that applies to all our directors, officers and employees, including our principal executive officer, principal financial officer, principal accounting officer or controller and other executive officers identified pursuant to this Item 10 who perform similar functions, which we refer to as the Selected Officers. The code is posted on our website at http://www.maxcapgroup.com . We will disclose any material changes in or waivers from our code of ethics applicable to any Selected Officer on our website at http://www.maxcapgroup.com or by filing a Form 8-K.
ITEM 11. EXECUTIVE COMPENSATION
The information required in response to this Item is contained under the captions “Compensation Discussion and Analysis,” “Summary Compensation Table,” “Grants of Plan Based Awards in Fiscal Year 2009,” “Outstanding Equity Awards at 2009 Fiscal Year-End,” “Option Exercises and Shares Vested in Fiscal Year 2009,” “Pension Benefits,” “Non-Qualified Deferred Compensation as of December 31, 2009,” “Potential Payments Upon Termination or Change in Control,” “Director Compensation,” “Employment Agreements,” “2008 Incentive Plan,” “Compensation Committee Interlocks and Insider Participation” and “Compensation Committee Report” in the Proxy Statement. These portions of the Proxy Statement are hereby incorporated by reference herein.
ITEM 12. SECURITY OWNERSHIP OF CERTAIN BENEFICIAL OWNERS AND MANAGEMENT
The information required in response to this Item is contained under the captions “Security Ownership of Certain Beneficial Owners, Officers And Directors” and “Securities Authorized for Issuance Under Equity Compensation Plans” in the Proxy Statement. These portions of the Proxy Statement are hereby incorporated by reference herein.
ITEM 13. CERTAIN RELATIONSHIPS AND RELATED TRANSACTIONS, AND DIRECTOR INDEPENDENCE
The information required in response to this Item is contained under the captions “Certain Relationships and Related Transactions,” and “Composition, Meetings, and Committees of Board of Directors” in the Proxy Statement. These portions of the Proxy Statement are hereby incorporated by reference herein.
ITEM 14. PRINCIPAL ACCOUNTANT FEES AND SERVICES
The information required in response to this Item is contained under the caption “Principal Accountant Fees and Services” in the Proxy Statement. This portion of the Proxy Statement is hereby incorporated by reference herein.
97
Table of Contents
ITEM 15. EXHIBITS AND FINANCIAL STATEMENT SCHEDULES
| Page | ||||
| (a)(1) |
Financial Statements |
|||
| F-1 | ||||
| Consolidated Balance Sheets as of December 31, 2009 and 2008 | F-3 | |||
| F-4 | ||||
| F-5 | ||||
| Consolidated Statements of Cash Flows for the Years Ended December 31, 2009, 2008 and 2007 |
F-6 | |||
| Notes to Consolidated Financial Statements | F-7 | |||
| (a)(2) |
Financial Statement Schedules: |
|||
| Schedule II—Condensed Financial Information of Registrant | F-63 | |||
| Schedule III—Supplementary Insurance Information | F-65 | |||
| Schedule IV—Supplementary Reinsurance Information | F-66 | |||
98
Table of Contents
(a)(3) Exhibits
| Exhibit |
Description | |
| 3(i).1 | Memorandum of Association (incorporated by reference to Exhibit 3.1 of the Company’s Registration Statement (333-62006) filed with the SEC on July 6, 2001). | |
| 3(i).2 | Certificate of Incorporation of Max USA Holdings Ltd. (incorporated by reference to Exhibit 3.4 of the Company’s Registration Statement (333-145585) filed with the SEC on August 20, 2007). | |
| 3(ii).1 | Amended and Restated Bye-laws of Max Capital Group Ltd. (incorporated by reference to Exhibit 3.2 of the Company’s Quarterly Report on Form 10-Q for the quarter ended September 30, 2009). | |
| 3(ii).2 | Bylaws of Max USA Holdings Ltd. (incorporated by reference to Exhibit 3.4 of the Company’s Registration Statement (333-145585) filed with the SEC on August 20, 2007). | |
| 4.1 | Specimen Common Share Certificate (incorporated by reference to Exhibit 4.1 of the Company’s Quarterly Report on Form 10-Q for the quarter ended June 30, 2007). | |
| 4.2 | Form of Warrant (incorporated by reference to Exhibit 4.2 of the Company’s Registration Statement (333-62006) filed with the SEC on July 6, 2001). | |
| 4.3 | Form of Senior Debt Indenture (incorporated by reference to Exhibit 4.3 of the Company’s Registration Statement No. 333-145585) filed with the SEC on August 20, 2007). | |
| 4.4 | Form of Subordinated Debt Indenture (incorporated by reference to Exhibit 4.4 of the Company’s Registration Statement No. 333-145585) filed with the SEC on August 20, 2007). | |
| 4.5 | Form of Junior Subordinated Debt Indenture (incorporated by reference to Exhibit 4.5 of the Company’s Registration Statement No. 333-145585) filed with the SEC on August 20, 2007). | |
| 4.6 | Form of Senior Indenture (incorporated by reference to Exhibit 4.6 of the Company’s Registration Statement No. 333-145585) filed with the SEC on August 20, 2007). | |
| 4.7 | Form of Subordinated Indenture (incorporated by reference to Exhibit 4.7 of the Company’s Registration Statement No. 333-145585) filed with the SEC on August 20, 2007). | |
| 4.8 | Certificate of Trust (incorporated by reference to Exhibit 4.12 of the Company’s Registration Statement No. 333-145585) filed with the SEC on August 20, 2007). | |
| 4.9 | Declaration of Trust (incorporated by reference to Exhibit 4.13 of the Company’s Registration Statement No. 333-145585) filed with the SEC on August 20, 2007). | |
| 4.10 | Form of Amended and Restated Declaration of Trust (incorporated by reference to Exhibit 4.14 of the Company’s Registration Statement (333-145585) filed with the SEC on August 20, 2007). | |
| 4.11 | Trust Agreement (incorporated by reference to Exhibit 4.15 of the Company’s Registration Statement No. 333-145585) filed with the SEC on August 20, 2007). | |
| 4.12 | Form of Preferred Securities Guarantee Agreement (incorporated by reference to Exhibit 4.16 of the Company’s Registration Statement No. 333-145585) filed with the SEC on August 20, 2007). | |
99
Table of Contents
| Exhibit |
Description | |
| 4.13 | Max Capital Group Ltd. 2008 Stock Incentive Plan (incorporated by reference to Exhibit 4.2 of the Company’s Registration Statement (333-150660) filed with the SEC on May 6, 2008). | |
| 4.14 | Max Capital Group Ltd. Employee Stock Purchase Plan for U.S. Taxpayers (incorporated by reference to Exhibit 4.2 of the Company’s Registration Statement (333-151211) filed with the SEC on May 28, 2008). | |
| 4.15 | Max Capital Group Ltd. Employee Stock Purchase Plan for Non-U.S. Taxpayers (incorporated by reference to Exhibit 4.3 of the Company’s Registration Statement (333-151211) filed with the SEC on May 28, 2008). | |
| 4.16 | 2000 Stock Incentive Plan. (incorporated by reference to Exhibit 10.7 of the Company’s Registration Statement (333-62006) filed with the SEC on May 31, 2001). | |
| 4.17 | Amendment to the 2000 Stock Incentive Plan, approved in May 2002. (incorporated by reference to Exhibit 10.8 of the Company’s Annual Report on Form 10-K for the year ended December 31, 2002). | |
| 4.18 | Amendment to the 2000 Stock Incentive Plan, approved in April 2005. (incorporated by reference to Exhibit 10.7 of the Company’s Annual Report on Form 10-K for the year ended December 31, 2005). | |
| 10.1 | Shareholders’ Agreement, dated as of December 22, 1999, among Max Capital Group Ltd., Max Bermuda Ltd. and certain other signatories (incorporated by reference to Exhibit 10.1 of the Company’s Registration Statement (333-62006) filed with the SEC on May 31, 2001). | |
| 10.2 | Employment Agreement, effective as of November 13, 2006 and executed December 8, 2006, by and between Max Capital Group Ltd. and W. Marston Becker (incorporated by reference to Exhibit 10.1 of the Company’s Current Report on Form 8-K filed with the SEC on December 14, 2006). | |
| 10.3 | Employment Agreement, dated as of July 27, 2007, by and between Max Capital Group Ltd. and Peter A. Minton (incorporated by reference to Exhibit 10.1 of the Company’s Current Report on Form 8-K filed with the SEC on July 30, 2007). | |
| 10.4 | Employment Agreement, dated as of July 27, 2007, by and between Max Capital Group Ltd. and Joseph W. Roberts (incorporated by reference to Exhibit 10.2 of the Company’s Current Report on Form 8-K filed with the SEC on July 30, 2007). | |
| 10.5 | Employment Agreement, dated as of July 27, 2007, by and between Max Bermuda Ltd. and Angelo M. Guagliano (incorporated by reference to Exhibit 10.3 of the Company’s Current Report on Form 8-K filed with the SEC on July 30, 2007). | |
| 10.6 | Credit Agreement, dated as of August 7, 2007, among Max Bermuda Ltd. and Max Capital Group Ltd., as borrowers, various financial institutions as the lenders, ING Bank N.V., London Branch and Citibank, NA, as co-syndication agents, Bank of America, National Association, as fronting bank, as administrative agent, and as letter of credit administrator for the lenders and Banc of America Securities LLC, as sole lead arranger and book manager (incorporated by reference to Exhibit 10.1 of the Company’s Current Report on Form 8-K filed with the SEC on August 13, 2007). | |
100
Table of Contents
| Exhibit |
Description | |
| 10.7 | First Amendment Agreement, dated September 16, 2008 and effective September 23, 2008, to the Credit Agreement, dated as of August 7, 2007, among Max Bermuda Ltd. and Max Capital Group Ltd., as borrowers, various financial institutions as lenders, ING Bank N.V., London Branch and Citibank, N.A., as co-syndication agents, Bank of America, National Association, as fronting bank, as administrative agent, and as letter of credit administrator for the lenders and Banc of America Securities LLC, as sole lead arranger and book manager (incorporated by reference to Exhibit 10.1 of the Company’s Current Report on Form 8-K filed with the SEC on September 24, 2008). | |
| 10.8 | Second Amendment Agreement, dated October 1, 2008, to the Credit Agreement, dated as of August 7, 2007, among Max Bermuda Ltd. and Max Capital Group Ltd., as borrowers, various financial institutions as lenders, ING Bank N.V., London Branch and Citibank, N.A., as co-syndication agents, Bank of America, National Association, as fronting bank, as administrative agent, and as letter of credit administrator for the lenders and Banc of America Securities LLC, as sole lead arranger and book manager (incorporated by reference to Exhibit 10.1 of the Company’s Current Report on Form 8-K filed with the SEC on October 06, 2008). | |
| 10.9 | Credit Agreement, dated December 22, 2006, by and between Max Bermuda Ltd. as borrower and The Bank of Nova Scotia as the Lender (incorporated by reference to Exhibit 10.3 of the Company’s Current Report on Form 8-K filed with the SEC on December 22, 2006). | |
| 10.10 | Amendment No. 1 to Credit Agreement with The Bank of Nova Scotia (incorporated by reference to Exhibit 10.1 of the Company’s Current Report on Form 8-K filed with the SEC on December 21, 2007). | |
| 10.11 | Amendment No. 2 to Credit Agreement with The Bank of Nova Scotia (incorporated by reference to 10.1 the Company’s Current Report on From 8-K filed with the SEC on December 22, 2008). | |
| 10.12 | Amendment No. 3 to Credit Agreement with The Bank of Nova Scotia (incorporated by reference to 10.1 the Company’s Current Report on From 8-K filed with the SEC on December 21, 2009). | |
| 10.13 | Credit Facility Agreement, dated October 13, 2008, by and among Max Capital Group Ltd. as initial account party, applicant and guarantor, ING Bank N.V., London Branch, as agent, issuing bank and security trustee (incorporated by reference to Exhibit 10.1 of the Company’s Current Report on Form 8-K filed with the SEC on October 15, 2008). | |
| 10.14 | Investment Management Agreement dated as of May 1, 2000, between General Re-New England Asset Management, Inc. and Max Bermuda Ltd. (incorporated by reference to Exhibit 10.13 of the Company’s Registration Statement (333-62006) filed with the SEC on July 6, 2001). | |
| 10.15 | Purchase Agreement, dated April 11, 2007, by and between Max USA Holdings Ltd., Max Capital Group Ltd., as guarantor, and Citigroup Global Markets, Inc. as representative of the initial purchasers (incorporated by reference to Exhibit 10.1 of the Company’s Current Report on Form 8-K filed with the SEC on April 17, 2007). | |
| 10.16 | Indenture, dated April 15, 2007, among Max USA Holdings Ltd., as issuer, Max Capital Group Ltd., as guarantor, and The Bank of New York, as trustee (incorporated by reference to Exhibit 10.2 of the Company’s Current Report on Form 8-K filed with the SEC on April 17, 2007). | |
| 10.17 | Officer’s Certificate of Max USA Holdings Ltd., dated April 16, 2007 (incorporated by reference to Exhibit 10.3 of the Company’s Current Report on Form 8-K filed with the SEC on April 17, 2007). | |
101
Table of Contents
| Exhibit |
Description | |
| 10.18 | Indemnification Agreement (incorporated by reference to Exhibit 10.1 of the Company’s Registration Statement (333-145585) filed with the SEC on August 20, 2007). | |
| 10.19 | Forms of Employee Restricted Stock Agreements under the 2008 Stock Incentive Plan. | |
| 10.20 | Forms of Employee Restricted Stock Unit Agreements under the 2008 Stock Incentive Plan. | |
| 10.21 | Form of Option Agreement under the 2008 Stock Incentive Plan. | |
| 10.22 | Form of Director Restricted Stock Agreement under the 2008 Stock Incentive Plan (incorporated by reference to Exhibit 10.4 of the Company’s Registration Statement (333-150660) filed with the SEC on May 6, 2008). | |
| 10.23 | Form of Director Restricted Stock Unit Agreement under the 2008 Stock Incentive Plan (incorporated by reference to Exhibit 10.2 of the Company’s Quarterly Report of Form 10-Q for the quarter ended September 30, 2009). | |
| 10.24 | Form of Restricted Stock Award Agreement for W. Marston Becker (incorporated by reference to Exhibit 10.1 of the Company’s Current Report of Form 8-K filed with the SEC on February 23, 2009). | |
| 10.25 | Form of Option Award Agreement for W. Marston Becker (incorporated by reference to Exhibit 10.2 of the Company’s Current Report of Form 8-K filed with the SEC on February 23, 2009). | |
| 10.26 | Form of Restricted Stock Agreement under the 2000 Stock Incentive Plan (incorporated by reference to Exhibit 10.1 of the Company’s Quarterly Report of Form -10Q for the quarter ended March 31, 2008). | |
| 10.27 | Form of Restricted Stock Unit Agreement under the 2000 Stock Incentive Plan (incorporated by reference to Exhibit 10.2 of the Company’s Quarterly Report of Form -10Q for the quarter ended March 31, 2008). | |
| 10.28 | Form of Stock Option agreement under the 2000 Stock Incentive Plan (incorporated by reference to Exhibit 10.11 of the Company’s Annual Report for the year ended December 31, 2007). | |
| 10.29 | Model Director Restricted Stock Award Agreement under the 2000 Stock Incentive Plan (incorporated by reference to Exhibit 10.3 of the Company’s Quarterly Report for the quarter ended March 31, 2007). | |
| 10.30 | Insurance Management Agreement, dated as of May 10, 2001, and amendments among Max Re Managers Ltd., Max Re Capital Ltd., Bayerische Hypo-Und Vereinsbank AG and Grand Central Re Limited. | |
| 10.31 | Investment Management Agreement, dated as of June 26, 2003, by and between Asset Allocation & Management Company, L.L.C. and Max Re Ltd. | |
| 10.32 | Portfolio Management Agreement, dated June 24, 2003, by and between Conning Asset Management Company and Max Re Ltd. | |
| 10.33 | Investment Management Agreement, dated as of October 31, 2008, between Deutsche Investment Management Americas Inc. and Max Bermuda Ltd. | |
| 10.34 | Investment Management Agreement, dated as of April 8, 2009, by and between Wellington Management Company, LLP and Max Bermuda Ltd. | |
| 10.35 | Investment Management Agreement, dated as of July 20, 2009, and amendment by and between Lazard Asset Management LLC and Max Bermuda Ltd. | |
102
Table of Contents
| Exhibit |
Description | |
| 10.36 | Discretionary Investment Management Agreement, dated January 28, 2008, by and between Credit Agricole Asset Management (UK) Limited and Imagine Syndicate Management Limited. | |
| 10.37 | Discretionary Investment Management Agreement, dated June 5, 2009, by and between Max at Lloyd’s Ltd. and Deutsche Asset Management (UK) Limited. | |
| 12.1 | Computation of Ratio of Earnings to Fixed Charges | |
| 21.1 | Schedule of Group Companies. | |
| 23.1 | Consent of KPMG. | |
| 24.1 | Power of Attorney for officers and directors of Max Capital Group Ltd. (included on the signature page of this filing). | |
| 31.1 | Certification of the Chief Executive Officer of Max Capital Group Ltd. filed herewith pursuant to Section 302 of the Sarbanes-Oxley Act of 2002. | |
| 31.2 | Certification of the Chief Financial Officer of Max Capital Group Ltd. filed herewith pursuant to Section 302 of the Sarbanes-Oxley Act of 2002. | |
| 32.1 | Certification of the Chief Executive Officer of Max Capital Group Ltd. furnished herewith pursuant to Section 906 of the Sarbanes-Oxley Act of 2002. | |
| 32.2 | Certification of the Chief Financial Officer of Max Capital Group Ltd. furnished herewith pursuant to Section 906 of the Sarbanes-Oxley Act of 2002. | |
103
Table of Contents
SIGNATURES
Pursuant to the requirements of Section 13 or 15(d) of the Securities Exchange Act of 1934, the Registrant has duly caused this report to be signed on its behalf by the undersigned, thereunto duly authorized.
| MAX CAPITAL GROUP LTD. |
|
/s/ W. Marston Becker |
| W. Marston Becker |
| Chief Executive Officer |
February 16, 2010
104
Table of Contents
POWER OF ATTORNEY
Each person whose signature appears below hereby constitutes and appoints W. Marston Becker, his true and lawful attorney-in-fact and agent, with full power of substitution and re-substitution, for him and in his name, place and stead, in any and all capacities, to sign any or all amendments or supplements to this Form 10-K and to file the same with all exhibits thereto and other documents in connection therewith, with the SEC, granting unto said attorney-in-fact and agent full power and authority to do and perform each and every act and thing necessary or appropriate to be done with this Form 10-K and any amendments or supplements hereto, as fully to all intents and purposes as he might or could do in person, hereby ratifying and confirming all that said attorney-in-fact and agent, or his substitute or substitutes, may lawfully do or cause to be done by virtue hereof.
Pursuant to the requirements of the Securities Exchange Act of 1934, this report has been signed below by the following persons on behalf of the Registrant and in the capacities and on the dates indicated.
|
/s/ W. Marston Becker |
/s/ Joseph W. Roberts | |||
| W. Marston Becker Chief Executive Officer and Director (Principal executive officer) |
Joseph W. Roberts Executive Vice President and Chief Financial Officer (Principal financial and accounting officer) | |||
| Date: February 16, 2010 |
Date: February 16, 2010 | |||
| /s/ Gordon Cheesbrough | /s/ K. Bruce Connell | |||
| Gordon Cheesbrough Director |
K. Bruce Connell Director | |||
| Date: February 16, 2010 |
Date: February 16, 2010 | |||
| /s/ Willis T. King, Jr. | /s/ William Kronenberg III | |||
| Willis T. King, Jr. Director |
William Kronenberg III Director | |||
| Date: February 16, 2010 |
Date: February 16, 2010 | |||
| /s/ James H. MacNaughton | /s/ Peter A. Minton | |||
| James H. MacNaughton Director |
Peter A. Minton Director | |||
| Date: February 16, 2010 |
Date: February 16, 2010 | |||
| /s/ Steven M. Skala | /s/ Mario P. Torsiello | |||
| Steven M. Skala Director |
Mario P. Torsiello Director | |||
| Date: February 16, 2010 |
Date: February 16, 2010 | |||
| /s/ James L. Zech | ||||
| James L. Zech Director |
||||
| Date: February 16, 2010 |
||||
105
Table of Contents
REPORT OF INDEPENDENT REGISTERED PUBLIC ACCOUNTING FIRM
To the Board of Directors and Stockholders
Max Capital Group Ltd.:
We have audited the accompanying consolidated balance sheets of Max Capital Group Ltd. and subsidiaries as of December 31, 2009 and 2008, and the related consolidated statements of income and comprehensive income, changes in shareholders’ equity, and cash flows for each of the years in the three-year period ended December 31, 2009. In connection with our audits of the consolidated financial statements, we also have audited financial statement schedules II to IV. These consolidated financial statements and financial statement schedules are the responsibility of the Company’s management. Our responsibility is to express an opinion on these consolidated financial statements and financial statement schedules based on our audits.
We conducted our audits in accordance with the standards of the Public Company Accounting Oversight Board (United States). Those standards require that we plan and perform the audit to obtain reasonable assurance about whether the financial statements are free of material misstatement. An audit includes examining, on a test basis, evidence supporting the amounts and disclosures in the financial statements. An audit also includes assessing the accounting principles used and significant estimates made by management, as well as evaluating the overall financial statement presentation. We believe that our audits provide a reasonable basis for our opinion.
In our opinion, the consolidated financial statements referred to above present fairly, in all material respects, the financial position of Max Capital Group Ltd. and subsidiaries as of December 31, 2009 and 2008, and the results of their operations and their cash flows for each of the years in the three-year period ended December 31, 2009, in conformity with U.S. generally accepted accounting principles. Also in our opinion, the related financial statement schedules, when considered in relation to the basic consolidated financial statements taken as a whole, present fairly, in all material respects, the information set forth therein.
We also have audited, in accordance with the standards of the Public Company Accounting Oversight Board (United States), Max Capital Group Ltd.’s internal control over financial reporting as of December 31, 2009, based on the criteria established in Internal Control—Integrated Framework issued by the Committee of Sponsoring Organizations of the Treadway Commission (COSO), and our report dated February 16, 2010 expressed an unqualified opinion on the effectiveness of the Company’s internal control over financial reporting.
/s/ KPMG
Hamilton, Bermuda
February 16, 2010
F-1
Table of Contents
REPORT OF INDEPENDENT REGISTERED PUBLIC ACCOUNTING FIRM
To the Board of Directors and Stockholders
Max Capital Group Ltd.:
We have audited Max Capital Group Ltd.’s internal control over financial reporting as of December 31, 2009, based on the criteria established in Internal Control—Integrated Framework issued by the Committee of Sponsoring Organizations of the Treadway Commission (COSO). Max Capital Group Ltd.’s management is responsible for maintaining effective internal control over financial reporting and for its assessment of the effectiveness of internal control over financial reporting, included in the accompanying Form 10-K under Item 9A, “Controls and Procedures”. Our responsibility is to express an opinion on the Company’s internal control over financial reporting based on our audit.
We conducted our audit in accordance with the standards of the Public Company Accounting Oversight Board (United States). Those standards require that we plan and perform the audit to obtain reasonable assurance about whether effective internal control over financial reporting was maintained in all material respects. Our audit included obtaining an understanding of internal control over financial reporting, assessing the risk that a material weakness exists, and testing and evaluating the design and operating effectiveness of internal control based on the assessed risk. Our audit also included performing such other procedures as we considered necessary in the circumstances. We believe that our audit provides a reasonable basis for our opinion.
A company’s internal control over financial reporting is a process designed to provide reasonable assurance regarding the reliability of financial reporting and the preparation of financial statements for external purposes in accordance with generally accepted accounting principles. A company’s internal control over financial reporting includes those policies and procedures that (1) pertain to the maintenance of records that, in reasonable detail, accurately and fairly reflect the transactions and dispositions of the assets of the company; (2) provide reasonable assurance that transactions are recorded as necessary to permit preparation of financial statements in accordance with generally accepted accounting principles, and that receipts and expenditures of the company are being made only in accordance with authorizations of management and directors of the company; and (3) provide reasonable assurance regarding prevention or timely detection of unauthorized acquisition, use, or disposition of the company’s assets that could have a material effect on the financial statements.
Because of its inherent limitations, internal control over financial reporting may not prevent or detect misstatements. Also, projections of any evaluation of effectiveness to future periods are subject to the risk that controls may become inadequate because of changes in conditions, or that the degree of compliance with the policies or procedures may deteriorate.
In our opinion, Max Capital Group Ltd. maintained, in all material respects, effective internal control over financial reporting as of December 31, 2009, based on the criteria established in Internal Control—Integrated Framework issued by the Committee of Sponsoring Organizations of the Treadway Commission.
We also have audited, in accordance with the standards of the Public Company Accounting Oversight Board (United States), the consolidated balance sheets of Max Capital Group Ltd. as of December 31, 2009 and 2008, and the related consolidated statements of income and comprehensive income, changes in shareholders’ equity, and cash flows for each of the years in the three-year period ended December 31, 2009, and our report dated February 16, 2010 expressed an unqualified opinion on those consolidated financial statements.
/s/ KPMG
Hamilton, Bermuda
February 16, 2010
F-2
Table of Contents
Consolidated Balance Sheets
December 31, 2009 and 2008
(Expressed in thousands of U.S. Dollars,
except per share amounts)
| 2009 | 2008 | ||||||
| Assets |
|||||||
| Cash and cash equivalents |
$ | 702,278 | $ | 949,404 | |||
| Fixed maturities, trading, at fair value (amortized cost: 2009—$226,007; 2008—$60,127) |
228,696 | 61,820 | |||||
| Fixed maturities, available for sale, at fair value (amortized cost: 2009—$2,974,938; 2008—$3,607,062) |
3,007,356 | 3,592,039 | |||||
| Fixed maturities, held to maturity, at amortized cost (fair value: 2009—$1,033,551; 2008—$nil) |
1,005,947 | — | |||||
| Other investments, at fair value |
314,849 | 753,658 | |||||
| Accrued interest income |
57,215 | 52,882 | |||||
| Premiums receivable |
567,301 | 554,845 | |||||
| Losses and benefits recoverable from reinsurers |
1,001,373 | 846,622 | |||||
| Deferred acquisition costs |
65,648 | 51,337 | |||||
| Prepaid reinsurance premiums |
190,613 | 192,889 | |||||
| Trades pending settlement |
76,031 | 85,727 | |||||
| Other assets |
122,439 | 110,772 | |||||
| Total assets |
$ | 7,339,746 | $ | 7,251,995 | |||
| Liabilities |
|||||||
| Property and casualty losses |
$ | 3,178,094 | $ | 2,938,171 | |||
| Life and annuity benefits |
1,372,513 | 1,366,976 | |||||
| Deposit liabilities |
152,629 | 219,260 | |||||
| Funds withheld from reinsurers |
140,079 | 164,157 | |||||
| Unearned property and casualty premiums |
628,161 | 574,134 | |||||
| Reinsurance balances payable |
146,085 | 160,686 | |||||
| Accounts payable and accrued expenses |
67,088 | 81,916 | |||||
| Bank loans |
— | 375,000 | |||||
| Senior notes |
90,464 | 91,364 | |||||
| Total liabilities |
5,775,113 | 5,971,664 | |||||
| Shareholders’ equity |
|||||||
| Preferred shares (par value $1.00) 20,000,000 shares authorized; no shares issued or outstanding |
— | — | |||||
| Common shares (par value $1.00) 200,000,000 shares authorized; 55,867,125 (2008—55,805,790) shares issued and outstanding |
55,867 | 55,806 | |||||
| Additional paid-in capital |
752,309 | 763,391 | |||||
| Accumulated other comprehensive income (loss) |
25,431 | (45,399 | ) | ||||
| Retained earnings |
731,026 | 506,533 | |||||
| Total shareholders’ equity |
1,564,633 | 1,280,331 | |||||
| Total liabilities and shareholders’ equity |
$ | 7,339,746 | $ | 7,251,995 | |||
See accompanying notes to consolidated financial statements
F-3
Table of Contents
Consolidated Statements of Income and Comprehensive Income
Years Ended December 31, 2009, 2008 and 2007
(Expressed in thousands of U.S. Dollars
except per share amounts)
| 2009 | 2008 | 2007 | ||||||||||
| Revenues |
||||||||||||
| Gross premiums written |
$ | 1,375,001 | $ | 1,254,250 | $ | 1,078,286 | ||||||
| Reinsurance premiums ceded |
(480,481 | ) | (414,047 | ) | (281,696 | ) | ||||||
| Net premiums written |
$ | 894,520 | $ | 840,203 | $ | 796,590 | ||||||
| Earned premiums |
$ | 1,318,949 | $ | 1,170,248 | $ | 1,074,173 | ||||||
| Earned premiums ceded |
(484,593 | ) | (356,738 | ) | (256,268 | ) | ||||||
| Net premiums earned |
834,356 | 813,510 | 817,905 | |||||||||
| Net investment income |
169,741 | 181,624 | 188,206 | |||||||||
| Net realized and unrealized gains (losses) on investments |
81,765 | (234,965 | ) | 183,791 | ||||||||
| Total other-than-temporary impairment losses |
(5,315 | ) | (16,887 | ) | (1,087 | ) | ||||||
| Portion of loss recognized in other comprehensive income (loss), before taxes |
2,237 | — | — | |||||||||
| Net impairment losses recognized in earnings |
(3,078 | ) | (16,887 | ) | (1,087 | ) | ||||||
| Net realized gain on retirement of senior notes |
111 | 2,245 | — | |||||||||
| Other income |
2,903 | 1,458 | 745 | |||||||||
| Total revenues |
1,085,798 | 746,985 | 1,189,560 | |||||||||
| Losses and expenses |
||||||||||||
| Net losses and loss expenses |
493,599 | 393,745 | 330,394 | |||||||||
| Claims and policy benefits |
101,093 | 301,526 | 345,602 | |||||||||
| Acquisition costs |
96,874 | 52,379 | 61,360 | |||||||||
| Interest expense |
21,339 | 36,089 | 42,663 | |||||||||
| Net foreign exchange (gains) losses |
(5,772 | ) | 9,873 | 25 | ||||||||
| Merger and acquisition expenses |
(31,566 | ) | 2,944 | — | ||||||||
| General and administrative expenses |
153,995 | 124,515 | 106,689 | |||||||||
| Total losses and expenses |
829,562 | 921,071 | 886,733 | |||||||||
| Income (loss) before taxes |
256,236 | (174,086 | ) | 302,827 | ||||||||
| Income tax expense (benefit) |
10,021 | 1,232 | (422 | ) | ||||||||
| Net income (loss) |
246,215 | (175,318 | ) | 303,249 | ||||||||
| Change in net unrealized gains and losses on fixed maturities, net of tax |
50,544 | 9,882 | 369 | |||||||||
| Foreign currency translation adjustment |
20,286 | (34,940 | ) | 978 | ||||||||
| Comprehensive income (loss) |
$ | 317,045 | $ | (200,376 | ) | $ | 304,596 | |||||
| Basic earnings per share |
$ | 4.32 | $ | (3.10 | ) | $ | 5.06 | |||||
| Diluted earnings per share(1) |
$ | 4.26 | $ | (3.10 | ) | $ | 4.75 | |||||
| (1) | Diluted earnings per share calculations use weighted average common shares outstanding – basic when in a net loss position. |
See accompanying notes to consolidated financial statements
F-4
Table of Contents
MAX CAPITAL GROUP LTD.
Consolidated Statements of Changes in Shareholders’ Equity
Years Ended December 31, 2009, 2008 and 2007
(Expressed in thousands of U.S. Dollars,
except per share amounts)
| 2009 | 2008 | 2007 | ||||||||||
| Common shares |
||||||||||||
| Balance—beginning of year |
$ | 55,806 | $ | 57,515 | $ | 60,277 | ||||||
| Issuance of common shares, net |
1,604 | 2,439 | 1,527 | |||||||||
| Repurchase of shares |
(1,543 | ) | (4,148 | ) | (4,289 | ) | ||||||
| Balance—end of year |
55,867 | 55,806 | 57,515 | |||||||||
| Additional paid-in capital |
||||||||||||
| Balance—beginning of year |
763,391 | 844,455 | 933,292 | |||||||||
| Issuance of common shares, net |
789 | 4,379 | 3,449 | |||||||||
| Stock based compensation expense |
20,907 | 20,248 | 17,780 | |||||||||
| Repurchase of shares |
(32,778 | ) | (105,691 | ) | (110,066 | ) | ||||||
| Balance—end of year |
752,309 | 763,391 | 844,455 | |||||||||
| Accumulated other comprehensive income (loss) |
||||||||||||
| Balance—beginning of year |
(45,399 | ) | (20,341 | ) | (21,688 | ) | ||||||
| Holding gains (losses) on available for sale securities arising in year, net of tax |
51,563 | (5,327 | ) | (3,630 | ) | |||||||
| Net realized losses on available for sale securities included in net income, net of tax |
1,218 | 15,209 | 3,999 | |||||||||
| Portion of other-than-temporary impairment losses recognized in other comprehensive income, net of tax |
(2,237 | ) | — | — | ||||||||
| Currency translation adjustment |
20,286 | (34,940 | ) | 978 | ||||||||
| Balance—end of year |
25,431 | (45,399 | ) | (20,341 | ) | |||||||
| Retained earnings |
||||||||||||
| Balance—beginning of year |
506,533 | 702,265 | 418,180 | |||||||||
| Net income (loss) |
246,215 | (175,318 | ) | 303,249 | ||||||||
| Dividends paid |
(21,722 | ) | (20,414 | ) | (19,164 | ) | ||||||
| Balance—end of year |
731,026 | 506,533 | 702,265 | |||||||||
| Total shareholders’ equity |
$ | 1,564,633 | $ | 1,280,331 | $ | 1,583,894 | ||||||
See accompanying notes to consolidated financial statements
F-5
Table of Contents
Consolidated Statements of Cash Flows
Years Ended December 31, 2009, 2008 and 2007
(Expressed in thousands of U.S. Dollars,
except per share amounts)
| 2009 | 2008 | 2007 | ||||||||||
| Operating activities |
||||||||||||
| Net income (loss) |
$ | 246,215 | $ | (175,318 | ) | $ | 303,249 | |||||
| Adjustments to reconcile net income (loss) to net cash from operating activities: |
||||||||||||
| Stock based compensation |
20,907 | 20,248 | 17,780 | |||||||||
| Amortization of premium on fixed maturities |
3,921 | 5,095 | 5,146 | |||||||||
| Accretion of deposit liabilities |
2,907 | 4,507 | 4,607 | |||||||||
| Net realized and unrealized (gains) losses on investments |
(81,765 | ) | 234,965 | (183,791 | ) | |||||||
| Net impairment losses recognized in earnings |
3,078 | 16,887 | 1,087 | |||||||||
| Net realized gain on retirement of senior notes |
(111 | ) | (2,245 | ) | — | |||||||
| Changes in: |
||||||||||||
| Accrued interest income |
(4,206 | ) | (3,498 | ) | (10,178 | ) | ||||||
| Premiums receivable |
(7,551 | ) | (52,844 | ) | (42,076 | ) | ||||||
| Losses and benefits recoverable from reinsurers |
(145,863 | ) | (223,188 | ) | (37,102 | ) | ||||||
| Deferred acquisition costs |
(12,913 | ) | 2,934 | 4,877 | ||||||||
| Prepaid reinsurance premiums |
3,932 | (55,801 | ) | (25,698 | ) | |||||||
| Other assets |
(2,050 | ) | (3,006 | ) | (3,607 | ) | ||||||
| Property and casualty losses |
199,201 | 373,625 | (11,348 | ) | ||||||||
| Life and annuity benefits |
(21,070 | ) | 200,434 | 252,601 | ||||||||
| Funds withheld from reinsurers |
(24,079 | ) | (5,106 | ) | (85,460 | ) | ||||||
| Unearned property and casualty premiums |
44,490 | 84,563 | 4,128 | |||||||||
| Reinsurance balances payable |
(15,579 | ) | 46,934 | 19,715 | ||||||||
| Accounts payable and accrued expenses |
(16,312 | ) | 12,799 | 14,405 | ||||||||
| Cash from operating activities |
193,152 | 481,985 | 228,335 | |||||||||
| Investing activities |
||||||||||||
| Purchases of available for sale securities |
(1,212,911 | ) | (930,864 | ) | (1,459,379 | ) | ||||||
| Sales of available for sale securities |
281,495 | 421,425 | 428,522 | |||||||||
| Redemptions of available for sale securities |
625,434 | 511,787 | 466,988 | |||||||||
| Purchases of trading securities |
(195,151 | ) | (21,194 | ) | — | |||||||
| Sales of trading securities |
29,578 | 17,209 | — | |||||||||
| Redemptions of trading securities |
8,347 | 3,201 | — | |||||||||
| Purchases of held to maturity securities |
(33,647 | ) | — | — | ||||||||
| Net sales of other investments |
534,244 | 89,231 | 214,926 | |||||||||
| Acquisition of subsidiaries, net of cash acquired |
(8,198 | ) | 103,155 | (28,400 | ) | |||||||
| Cash from (used in) investing activities |
29,191 | 193,950 | (377,343 | ) | ||||||||
| Financing activities |
||||||||||||
| Net proceeds from issuance of common shares |
2,393 | 6,818 | 4,976 | |||||||||
| Repurchase of common shares |
(34,321 | ) | (109,839 | ) | (114,355 | ) | ||||||
| Net (repayment) proceeds from bank loans |
(375,000 | ) | 45,000 | 120,000 | ||||||||
| Net (repayment) proceeds from issuance of senior notes |
(811 | ) | (8,415 | ) | 99,497 | |||||||
| Dividends paid |
(21,722 | ) | (20,414 | ) | (19,164 | ) | ||||||
| Additions to deposit liabilities |
14,630 | 16,681 | 19,253 | |||||||||
| Payments of deposit liabilities |
(84,168 | ) | (23,000 | ) | (9,630 | ) | ||||||
| Cash (used in) from financing activities |
(498,999 | ) | (93,169 | ) | 100,577 | |||||||
| Effects of exchange rate changes on foreign currency cash |
29,530 | (31,018 | ) | 4,192 | ||||||||
| Net (decrease) increase in cash and cash equivalents |
(247,126 | ) | 551,748 | (44,239 | ) | |||||||
| Cash and cash equivalents, beginning of year |
949,404 | 397,656 | 441,895 | |||||||||
| Cash and cash equivalents, end of year |
$ | 702,278 | $ | 949,404 | $ | 397,656 | ||||||
| Supplemental Disclosure of Cash Flow Information |
||||||||||||
| Interest paid |
$ | 13,240 | $ | 21,416 | $ | 21,514 | ||||||
| Taxes paid |
$ | 609 | $ | 199 | $ | 1,879 | ||||||
See accompanying notes to consolidated financial statements
F-6
Table of Contents
Notes to Consolidated Financial Statements
December 31, 2009, 2008 and 2007
(Expressed in thousands of U.S. Dollars,
except per share amounts)
1. General
Max Capital Group Ltd. (“Max Capital” and, collectively with its subsidiaries, the “Company”), is a Bermuda headquartered global provider of specialty insurance and reinsurance products for the property and casualty market, with underwriting operations based in Bermuda, Ireland, the United States and the United Kingdom. The Company underwrites a diversified portfolio of risks and serves clients ranging from Fortune 1000 companies to small owner-operated businesses. The Company also provides reinsurance for the life and annuity market when attractive opportunities arise.
Max Capital was incorporated on July 8, 1999 under the laws of Bermuda. Max Capital’s principal operating subsidiary is Max Bermuda Ltd. (“Max Bermuda”). Max Bermuda is registered as a Class 4 insurer and long-term insurer under the insurance laws of Bermuda.
The Company’s non-Lloyd’s European activities are primarily conducted from Dublin, Ireland through Max Europe Holdings Limited and its two wholly-owned operating subsidiaries, Max Re Europe Limited (“Max Re Europe”) and Max Insurance Europe Limited (“Max Insurance Europe”). In November 2008, Max Capital completed the acquisition of Max UK Holdings Ltd. (“Max UK”) which, through Lloyd’s Syndicates 1400, 2525 and 2526 (the “Syndicates”), underwrites a diverse portfolio of specialty risks. Max UK’s operations are based primarily in London, England.
The Company’s U.S. activities are conducted through Max USA Holdings Ltd. (“Max USA”) and its operating subsidiaries Max Specialty Insurance Company (“Max Specialty”), a Delaware-domiciled excess and surplus insurance company and Max America Insurance Company (“Max America”), an Indiana-domiciled insurance company. Through Max America and Max Specialty, the Company is able to write both admitted and non-admitted business throughout the United States and Puerto Rico.
2. Summary of significant accounting policies
(a) Basis of presentation
The consolidated financial statements include the financial statements of Max Capital and all of its subsidiaries. All significant inter-company balances and transactions have been eliminated. The consolidated financial statements include the results of operations and cash flows of Max UK since the date of acquisition of November 6, 2008 and not any prior periods (including for comparative purposes), except with respect to the supplemental pro forma information included within Note 5. The Company’s attributable share of the transactions, assets and liabilities of Syndicates 1400, 2525 and 2526 have been included in the consolidated financial statements.
The accompanying consolidated financial statements are prepared in conformity with United States generally accepted accounting principles (“U.S. GAAP”), which require management to make estimates and assumptions that affect the reported amounts of assets and liabilities and disclosure of contingent assets and liabilities at the date of the financial statements and the reported amounts of revenues and expenses during the period. These estimates and assumptions are based on management’s best estimates and judgment. Management evaluates its estimates and assumptions on an ongoing basis using historical experience and other factors, including the current economic environment, which management believes to be reasonable under the circumstances. The Company adjusts such estimates and assumptions when facts and circumstances dictate. Illiquid credit
F-7
Table of Contents
MAX CAPITAL GROUP LTD.
Notes to Consolidated Financial Statements—(Continued)
December 31, 2009, 2008 and 2007
(Expressed in thousands of U.S. Dollars,
except per share amounts)
2. Summary of significant accounting policies—(Continued)
(a) Basis of presentation—(Continued)
markets, volatile investment and foreign currency markets have combined to increase the uncertainty inherent in such estimates and assumptions. As future events and their effects cannot be determined with precision, actual results could differ significantly from these estimates. Changes in those estimates resulting from continuing changes in the economic environment will be reflected in the financial statements in future periods.
Certain reclassifications have been made to the prior year reported amounts to conform to the current year presentation. These include the reclassification of other-than-temporary impairment losses to be presented separately from net realized gains and losses on investments and the reclassification of merger and acquisition expenses to be presented separately from general and administrative expenses in the consolidated statements of income and comprehensive income. These reclassifications had no impact on net income previously reported.
(b) Premium revenue recognition
Property and casualty
Premiums written are earned on a pro-rata basis over the period the coverage is provided. Reinsurance premiums are recorded at the inception of the policy and are estimated based upon information in underlying contracts and information provided by clients and/or brokers. Changes in reinsurance premium estimates are expected and may result in significant adjustments in any period. These estimates change over time as additional information regarding changes in underlying exposures insured is obtained. Any subsequent differences arising on such estimates are recorded as premiums written in the period they are determined. Insurance premiums are recorded at the inception of the policy and are earned on a pro-rata basis over the period of coverage. Unearned premiums represent the portion of premiums written which relate to the unexpired terms of policies in force. Premiums ceded are similarly pro-rated over the period the coverage is provided with the unearned portion being deferred as prepaid reinsurance premiums.
Certain contracts that the Company writes are retrospectively rated and additional premium is due should losses exceed pre-determined, contractual thresholds. These required additional premiums are based upon contractual terms and the only element of management judgment involved is with respect to the estimate of the amount of losses that the Company expects to be ceded. Additional premiums are recognized at the time loss thresholds specified in the contract are exceeded and are earned over the policy period. Changes in estimates of losses recorded on contracts with additional premium features will result in changes in additional premiums based on contractual terms.
Certain contracts that the Company writes, particularly the property and casualty catastrophe reinsurance risks, provide for reinstatement of coverage. Reinstatement premiums are the premiums for the restoration of the insurance or reinsurance limit of a contract to its full amount after a loss occurrence by the insured or reinsured. The Company accrues for reinstatement premiums resulting from losses recorded. Such accruals are based upon contractual terms and the only element of management judgment involved is with respect to the amount of losses recorded. Changes in estimates of losses
F-8
Table of Contents
MAX CAPITAL GROUP LTD.
Notes to Consolidated Financial Statements—(Continued)
December 31, 2009, 2008 and 2007
(Expressed in thousands of U.S. Dollars,
except per share amounts)
2. Summary of significant accounting policies—(Continued)
(b) Premium revenue recognition—(Continued)
recorded on contracts with reinstatement premium features will result in changes in reinstatement premiums based on contractual terms. Reinstatement premiums are recognized at the time losses are recorded and are earned on a pro-rata basis over the coverage period.
Life and annuity
The Company’s life and annuity reinsurance products focus on existing blocks of business and typically take the form of co-insurance structures, where the risk is generally reinsured on the same basis as that of the original policy. In a co-insurance transaction, the Company receives a percentage of the gross premium charged to the policyholder by the client, less an expense allowance granted to the client, as the primary insurer. The Company writes life and annuity reinsurance agreements with respect to individual and group disability, whole life, universal life, corporate owned life, term life, fixed annuities, annuities in payment and structured settlements.
Reinsurance premiums from traditional life and annuity policies with life contingencies are generally recognized as revenue when due from policyholders. Traditional life policies include those contracts with fixed and guaranteed premiums and benefits. Benefits and expenses are matched with such income to result in the recognition of profit over the life of the contracts.
Premiums from annuity contracts without life contingencies are reported as annuity deposits. Policy benefits and claims that are charged to expenses include benefit claims incurred in the period in excess of related policyholders’ account balances. The Company does not write any variable annuity reinsurance business.
Deposits
Short duration reinsurance contracts entered into by the Company that are not deemed to transfer significant underwriting and timing risk are accounted for as deposits, whereby liabilities are initially recorded at the same amount as assets received. An initial accretion rate is established based on actuarial estimates whereby the deposit liability is increased to the estimated amount payable over the term of the contract. This accretion charge is presented in the period as either interest expense, where the contract does not transfer underwriting risk, or losses, benefits and experience refunds where the contract does not transfer significant timing risk. Long duration contracts written by the Company that do not transfer significant mortality or morbidity risks are also accounted for as deposits. The Company periodically reassesses the amount of deposit liabilities and any changes to the estimated ultimate liability is recognized as an adjustment to earnings to reflect the cumulative effect since the inception of the contract and by an adjustment to the future accretion rate of the liability over the remaining estimated contract term.
(c) Investments
Investments in securities with fixed maturities are classified as either trading, available for sale or held to maturity. Trading securities are carried at fair value with any unrealized gains and losses included in net income and reported as net realized and unrealized gains
F-9
Table of Contents
MAX CAPITAL GROUP LTD.
Notes to Consolidated Financial Statements—(Continued)
December 31, 2009, 2008 and 2007
(Expressed in thousands of U.S. Dollars,
except per share amounts)
2. Summary of significant accounting policies—(Continued)
(c) Investments—(Continued)
and losses on investments. Available for sale securities are carried at fair value with any unrealized gains and losses included in accumulated other comprehensive income as a separate component of shareholders’ equity. Held to maturity securities, those securities which the Company has the intent to hold to maturity, are carried at amortized cost. The cost of fixed maturities is adjusted for amortization of premiums and discounts. Realized gains and losses on available for sale investments are recognized in net income, and reported as net realized and unrealized gains and losses on investments, using the specific identification method.
Other-than-temporary impairments in the value of fixed maturity investments, (“OTTI”), related to a credit loss is recognized in earnings, and the amount of the OTTI related to other factors (e.g. interest rates, market conditions, etc.) is recorded as a component of other comprehensive income. If no credit loss exists but either: (a) the Company has the intent to sell the debt security or (b) it is more likely than not that the Company will be required to sell the debt security before its anticipated recovery, the entire unrealized loss is recognized in earnings. In periods after the recognition of an OTTI on debt securities, the securities are accounted for as if they had been purchased on the measurement date of the OTTI at an amortized cost basis equal to the previous amortized cost basis less the OTTI recognized in earnings.
The Company reviews all debt securities in an unrealized loss position at the end of each quarter to identify any securities for which there is an intention to sell those securities after the quarter end. For those securities where there is such an intention, the OTTI charge (being the difference between the amortized cost and the fair value of the security) is recognized in net income. The Company reviews debt securities in an unrealized loss position to determine whether it is more likely than not that it will be required to sell those securities. The Company considers its liquidity and working capital needs and determines if it is not more likely than not that it will be required to sell any of the securities in an unrealized loss position. The Company also performs a review of debt securities which considers various indicators of potential credit losses. These indicators include the length of time and extent of the unrealized loss, any specific adverse conditions, historic and implied volatility of the security, failure of the issuer of the security to make scheduled interest payments, expected cash flow analysis, significant rating changes and recoveries or additional declines in fair value subsequent to the balance sheet date. The consideration of these indicators and the estimation of credit losses involve significant management judgment.
Investment income is recognized when earned and includes interest income together with amortization of premium and discount on fixed maturities.
Other investments represent a diversified portfolio of (i) limited partnerships and stock investments in trading entities that invest in a range of financial products including U.S. and non-U.S. securities and financial instruments and (ii) a reinsurance private equity investment. Investments in limited partnerships and trading entities are carried at fair value as discussed in Note 3 and Note 4. The change in fair value is included in net realized and unrealized gains and losses on investments and recognized in net income. Investments in reinsurance private equity investments where the Company has a meaningful ownership
F-10
Table of Contents
MAX CAPITAL GROUP LTD.
Notes to Consolidated Financial Statements—(Continued)
December 31, 2009, 2008 and 2007
(Expressed in thousands of U.S. Dollars,
except per share amounts)
2. Summary of significant accounting policies—(Continued)
(c) Investments—(Continued)
position and significant influence over operating and financial policies of the investee are carried under the equity method of accounting. Under this method, the investments are initially recorded at cost and adjusted periodically to recognize the Company’s proportionate share of income or loss and dividends from the investments. The Company believes this approximates fair value for these equity investments. The Company’s share of income or loss from these investments is included in net realized and unrealized gains and losses on investments and recognized in net income.
(d) Fee revenue recognition
Management and advisory fees are earned as the services generating the fees are performed.
(e) Losses and benefits
Property and casualty losses
The liability for losses, including loss adjustment expenses, represents estimates of the ultimate cost of all losses incurred but not paid as of the balance sheet date. In estimating reserves, the Company utilizes a variety of standard actuarial methods. Although these actuarial methods have been developed over time, assumptions about anticipated size of loss and loss emergence patterns are subject to fluctuations. Newly reported loss information from clients is the principal contributor to changes in the loss reserve estimates. These estimates, which generally involve actuarial projections, are based upon an assessment of known facts and circumstances, as well as estimates of future trends in claims severity and frequency, judicial theories of liability factors, including the actions of third parties, which are beyond the Company’s control.
The Company relies on data reported by clients when calculating reserves. The quality of the data varies from client to client. On a periodic basis, the clients’ loss data is analyzed by the Company’s actuarial and claims management teams to ascertain its quality and credibility. This process may involve comparisons with submission data and industry loss data, claims audits and inquiries about the methods of establishing case reserves associated with large industry events. There is often a time lag between reinsurance clients establishing case reserves and re-estimating their reserves, and notifying the Company of the new or revised case reserves. When determining reserves, the Company also considers historical data, industry loss trends, legal developments, changes in social attitudes and economic conditions, including the effects of inflation.
The Company believes the provision for outstanding losses and benefits will be adequate to cover the ultimate net cost of losses incurred to the balance sheet date but the provision is necessarily an estimate and may ultimately be settled for a significantly greater or lesser amount. These estimates are reviewed regularly and any adjustments to the estimates are recorded in the period they are determined.
Life and annuity benefits
The Company’s life and annuity reinsurance benefit and claim reserves are compiled on a contract-by-contract basis and are computed on a discounted basis using standard
F-11
Table of Contents
MAX CAPITAL GROUP LTD.
Notes to Consolidated Financial Statements—(Continued)
December 31, 2009, 2008 and 2007
(Expressed in thousands of U.S. Dollars,
except per share amounts)
2. Summary of significant accounting policies—(Continued)
(e) Losses and benefits—(Continued)
actuarial techniques and cash flow models. The Company establishes and reviews its life and annuity reinsurance reserves regularly based upon cash flow projection models utilizing data provided by clients and actuarial models. The Company establishes and maintains its life and annuity reinsurance reserves at a level that the Company estimates will, when taken together with future premium payments and investment income expected to be earned on associated premiums, be sufficient to support all future cash flow benefit and third party servicing obligations as they become payable.
Since the development of the life and annuity reinsurance reserves is based upon cash flow projection models, the Company must make estimates and assumptions based on cedant experience and industry mortality tables, longevity, expense and investment experience, including a provision for adverse deviation. The assumptions used to determine policy benefit reserves are best estimate assumptions that are determined at the inception of the contracts and are locked-in throughout the life of the contract unless a premium deficiency develops. The Company establishes these estimates based upon transaction specific historical experience, information provided by the ceding company and industry experience studies. Actual results could differ materially from these estimates. As the experience on the contracts emerges, the assumptions are reviewed by management. The Company determines whether actual and anticipated experience indicates that existing policy reserves, together with the present value of future gross premiums, are sufficient to cover the present value of future benefits, settlement and maintenance costs and to recover unamortized acquisition costs. If such a review produces reserves in excess of those currently held then the lock-in assumptions are revised and a life and annuity benefit is recognized at that time.
The assumptions used to determine claim reserves are best estimate assumptions and are reviewed no less than annually. The assumptions are locked unless they result in a material change. The Company establishes these assumptions based upon transaction specific historical experience, information provided by the ceding company and industry experience studies. Actual results could differ materially from these estimates.
Because of the many assumptions and estimates used in establishing reserves and the long-term nature of reinsurance contracts, the reserving process, while based on actuarial science, is inherently uncertain.
(f) Acquisition costs
Acquisition costs consist of commissions and fees paid to brokers and consultants and ceding commissions paid to the Company’s clients and are net of ceding commissions recovered by the Company from its reinsurers. Acquisition costs are amortized over the period in which the related premiums are earned or, for universal life reinsurance contracts and for deferred annuities, as a percentage of estimated gross profit. Deferred acquisition costs are regularly reviewed to determine if they are recoverable from future premium income, including investment income, by evaluating whether a loss is probable on the unexpired portion of policies in force. A premium deficiency loss is recognized when it is probable that expected future claims will exceed anticipated future premiums, reinsurance recoveries and anticipated investment income.
F-12
Table of Contents
MAX CAPITAL GROUP LTD.
Notes to Consolidated Financial Statements—(Continued)
December 31, 2009, 2008 and 2007
(Expressed in thousands of U.S. Dollars,
except per share amounts)
2. Summary of significant accounting policies—(Continued)
(g) Translation of foreign currencies
The reporting currency of the Company is the U.S. dollar. Assets and liabilities of foreign entities, whose functional currency is not the U.S. dollar, are translated at period end exchange rates. Revenue and expenses of such foreign entities are translated at average exchange rates during the year. The effect of the currency translation adjustments for foreign entities is included in accumulated other comprehensive income.
Other foreign currency assets and liabilities that are considered monetary items are translated at exchange rates in effect at the balance sheet date. Foreign currency revenues and expenses are translated at transaction date exchange rates. These exchange gains and losses are included in the determination of net income.
(h) Cash and cash equivalents
The Company considers all time deposits and money market instruments with an original maturity of ninety days or less as equivalent to cash.
(i) Earnings per share
Basic earnings per share is based on weighted average common shares outstanding and excludes any dilutive effects of warrants, options and convertible securities. Diluted earnings per share assumes the conversion of dilutive convertible securities and the exercise of all dilutive stock options and warrants using the treasury stock method.
(j) Goodwill and intangible assets
The Company does not amortize goodwill or identifiable intangible assets with indefinite lives, but rather re-evaluates on an annual basis at December 31, or whenever changes in circumstances warrant, the recoverability of the assets. If it is determined that an impairment exists, the Company adjusts the carrying value of the assets to fair value.
(k) Stock-based compensation
The Company measures and records compensation cost for all share-based payment awards (including employee stock options) at grant-date fair value. This includes consideration of expected forfeitures in determining share-based employee compensation expenses as well as the immediate expensing of share-based awards granted to retirement-eligible employees.
(l) Income taxes
Income taxes have been provided in accordance with ASC 740, Income Taxes, on those operations which are subject to income taxes. Deferred tax assets and liabilities result from temporary differences between the amounts recorded in the consolidated financial statements and the tax basis of the Company’s assets and liabilities, using enacted tax rates applicable to taxable income in the years in which those temporary differences are expected to be recovered or settled. Such temporary differences are primarily due to net operating loss carryforwards, and to the tax basis difference on unearned premium reserves, deferred compensation, net deferred policy acquisition costs, and net unrealized
F-13
Table of Contents
MAX CAPITAL GROUP LTD.
Notes to Consolidated Financial Statements—(Continued)
December 31, 2009, 2008 and 2007
(Expressed in thousands of U.S. Dollars,
except per share amounts)
2. Summary of significant accounting policies—(Continued)
(l) Income taxes—(Continued)
appreciation on investments. The effect on deferred tax assets and liabilities of a change in tax rates is recognized in income in the period that includes the enactment date. A valuation allowance against deferred tax assets is recorded if it is more likely than not that all, or some portion, of the benefits related to deferred tax assets will not be realized. The Company considers future taxable income and feasible tax planning strategies in assessing the need for a valuation allowance.
(m) Fair value of financial instruments
The fair values of financial instruments not disclosed elsewhere in the financial statements approximate their carrying value due to their short-term nature or because they earn or attract interest at market rates. Fair value estimates are made at a point in time, based on relevant market data as well as the best information available about the financial instrument. Fair value estimates for financial instruments for which no or limited observable market data is available are based on judgments regarding current economic conditions, liquidity discounts, currency, credit, and interest rate risks, loss experience and other factors. These estimates involve significant uncertainties and judgments and cannot be determined with precision. As a result, such calculated fair value estimates may not be realizable in a current sale or immediate settlement of the instrument. In addition, changes in the underlying assumptions used in the fair value measurement technique, including discount rates, liquidity risks, and estimates of future cash flows, could significantly affect these fair value estimates.
(n) Derivatives
The Company recognizes all derivatives as either assets or liabilities in the consolidated balance sheets and measures them at the fair value of the instrument. The Company participates in derivative instruments to mitigate financial risks, principally arising from investment holdings. For these instruments, changes in assets or liabilities measured at fair value are recorded within net realized and unrealized gains and losses on investments.
(o) Application of new accounting standards
ASU 2010-06, Fair Value Measurements and Disclosures (820)—Improving Disclosures about Fair Value Measurements
ASU 2010-06 requires additional disclosure, and clarifies existing disclosure requirements, about fair value measurements. The additional requirements include disclosure regarding the amounts and reasons for significant transfers in and out of Level 1 and 2 of the fair value hierarchy and also separate presentation of purchases, sales, issuances and settlements of items measured using significant unobservable inputs (i.e. Level 3). The guidance clarifies existing disclosure requirements regarding the inputs and valuation techniques used to measure fair value for measurements that fall in either Level 2 or Level 3 of the hierarchy. The requirements are effective for interim and annual reporting periods beginning after December 15, 2009 except for the disclosures about purchases, sales, issuances and settlements which is effective for fiscal years beginning after December 15, 2010 and for interim periods within those fiscal years. The guidance is not expected to have a material impact on the Company’s consolidated financial statements.
F-14
Table of Contents
MAX CAPITAL GROUP LTD.
Notes to Consolidated Financial Statements—(Continued)
December 31, 2009, 2008 and 2007
(Expressed in thousands of U.S. Dollars,
except per share amounts)
2. Summary of significant accounting policies—(Continued)
(o) Application of new accounting standards—(Continued)
ASU 2009-12, Fair Value Measurements and Disclosures (820)—Investments in Certain Entities That Calculate Net Asset Value per Share (or its Equivalent)
ASU 2009-12 expands the circumstances in which a practical expedient may be used to estimate fair value to include investments in foreign and other entities that have attributes of investment companies and report net asset value or its equivalent to their investors. The practical expedient cannot be used for investments that have a readily determinable fair value. The ASU sets forth disclosure requirements for investments within its scope. The amendments in ASU 2009-12 are effective for interim and annual periods ending after December 15, 2009 with early adoption permitted. The Company adopted this accounting standards update for the year ended December 31, 2009. It did not have a material impact on the Company’s consolidated financial statements.
ASU 2009-05, Fair Value Measurements and Disclosures (820)—Measuring Liabilities at Fair Value
ASU 2009-05 allows companies determining the fair value of a liability to use the perspective of an investor that holds the related obligation as an asset. The guidance was effective for interim and annual periods beginning after August 27, 2009 and applied to all fair value measurements of liabilities. This accounting standards update did not have a material impact on the Company’s consolidated financial statements.
ASU 2009-01—The FASB Accounting Standards Codification and Hierarchy of Generally Accepted Accounting Principles
On July 1, 2009, the FASB launched its Accounting Standards Codification (the “Codification”). The Codification became the sole source of authoritative U.S. GAAP for interim and annual periods ending after September 15, 2009. Other than resolving certain minor inconsistencies in current U.S. GAAP, the Codification does not change U.S. GAAP, but is intended to make it easier to find and research U.S. GAAP applicable to a particular transaction or specific accounting issue. The Codification did not have a material impact on the Company’s consolidated financial statements.
Recognition and Presentation of Other-Than-Temporary Impairments
In April 2009, the FASB issued guidance regarding the recognition and presentation of other-than-temporary impairments. This guidance amends the other-than-temporary impairment guidance in U.S. GAAP for debt securities to make the guidance more operational and to improve the presentation and disclosure of other-than-temporary impairments on debt and equity securities in the financial statements. The guidance changes the amount of other-than-temporary impairment that is recognized in earnings when there are credit losses on a debt security for which management does not intend to sell and for which it is more-likely-than-not that the entity will not have to sell prior to recovery of the non-credit impairment. In those situations, the portion of the total impairment that is attributable to the credit loss would be recognized in earnings, and the remaining difference between the debt security’s amortized cost basis and its fair value would be included in other comprehensive income. The guidance was effective for interim and annual reporting periods ending after June 15, 2009, with early adoption permitted for periods ending after
F-15
Table of Contents
MAX CAPITAL GROUP LTD.
Notes to Consolidated Financial Statements—(Continued)
December 31, 2009, 2008 and 2007
(Expressed in thousands of U.S. Dollars,
except per share amounts)
2. Summary of significant accounting policies—(Continued)
(o) Application of new accounting standards—(Continued)
March 15, 2009. The Company adopted the FASB guidance on April 1, 2009 and it did not have a material impact on the Company’s consolidated financial statements.
Determining Fair Value When the Volume and Level of Activity for the Asset or Liability Have Significantly Decreased and Identifying Transactions That Are Not Orderly
In April 2009, the FASB issued guidance regarding the determination of fair value when the volume and level of activity for the asset or liability have significantly decreased and identifying transactions that are not orderly. This guidance also provides additional guidance for estimating fair value when the volume and level of activity for the asset or liability have significantly decreased and for identifying circumstances that indicate a transaction is not orderly. The guidance was effective for interim and annual reporting periods ending after June 15, 2009, to be applied prospectively. The Company adopted the FASB guidance on April 1, 2009 and it did not have a material impact on the Company’s consolidated financial statements.
Interim Disclosures about Fair Value of Financial Instruments
In April 2009, the FASB issued guidance regarding interim disclosures about fair value of financial instruments which requires the disclosure about fair value of financial instruments in interim and annual financial statements. This guidance was effective for interim reporting periods ending after June 15, 2009. The Company adopted the guidance on April 1, 2009 and reflected the relevant required disclosures in the interim consolidated financial statements.
3. Investments
Transfer of Available for Sale Securities to Held to Maturity
The Company implemented a strategy in the third quarter of 2009 to hold certain fixed income securities to maturity. Because the Company has the intent to hold such securities to maturity, they have been reclassified from available for sale to held to maturity in the consolidated financial statements. As a result of this classification, the held to maturity portfolio is recorded at amortized cost in the consolidated balance sheet and is no longer recorded at fair value. The held to maturity portfolio is comprised principally of long duration government and corporate debt securities. The Company believes this held to maturity strategy is appropriate due to the relatively stable and predictable cash flows of the Company’s long-term liabilities. The fair value of those securities transferred was $952,703 on the date of reclassification, and this became the new cost base. The unrealized appreciation at the date of the transfer continues to be reported as a separate component of shareholders’ equity and is being amortized over the remaining lives of the securities as an adjustment to yield in a manner consistent with the amortization of any premium or discount. The unrealized appreciation on the date of transfer was $17,708 and $17,043 of this balance remains unamortized at December 31, 2009.
F-16
Table of Contents
MAX CAPITAL GROUP LTD.
Notes to Consolidated Financial Statements—(Continued)
December 31, 2009, 2008 and 2007
(Expressed in thousands of U.S. Dollars,
except per share amounts)
3. Investments—(Continued)
Fixed maturities—Available for Sale
The fair values and amortized cost of available for sale fixed maturities at December 31, 2009 and 2008 were as follows:
| Included in Accumulated Other Comprehensive Income (“AOCI”) |
|||||||||||||||||
| Gross Unrealized Losses | |||||||||||||||||
| December 31, 2009 |
Amortized Cost |
Unrealized Gain |
Non-OTTI Unrealized Loss |
OTTI Unrealized Loss |
Fair Value | ||||||||||||
| U.S. Government and Agencies |
$ | 411,596 | $ | 9,291 | $ | (2,756 | ) | $ | — | $ | 418,131 | ||||||
| Non-U.S. Government |
81,654 | 2,278 | (1,905 | ) | — | 82,027 | |||||||||||
| Corporate Securities |
1,246,815 | 36,070 | (10,373 | ) | (1,096 | ) | 1,271,416 | ||||||||||
| Municipal Securities |
83,780 | 1,366 | (1,488 | ) | — | 83,658 | |||||||||||
| Asset-Backed Securities |
113,531 | 1,168 | (13,982 | ) | (1,007 | ) | 99,710 | ||||||||||
| Residential Mortgage-Backed Securities(1) |
752,618 | 21,451 | (7,319 | ) | (3,651 | ) | 763,099 | ||||||||||
| Commercial Mortgage-Backed Securities |
284,944 | 14,552 | (10,181 | ) | — | 289,315 | |||||||||||
| $ | 2,974,938 | $ | 86,176 | $ | (48,004 | ) | $ | (5,754 | ) | $ | 3,007,356 | ||||||
| December 31, 2008 |
Amortized Cost |
Unrealized Gain |
Unrealized Loss |
Fair Value | |||||||||
| U.S. Government and Agencies |
$ | 362,391 | $ | 43,664 | $ | — | $ | 406,055 | |||||
| Non-U.S. Government |
610,057 | 52,648 | (1,912 | ) | 660,793 | ||||||||
| Corporate Securities |
1,464,566 | 20,908 | (59,037 | ) | 1,426,437 | ||||||||
| Municipal Securities |
47,842 | 1,232 | (477 | ) | 48,597 | ||||||||
| Asset-Backed Securities |
216,991 | 84 | (38,521 | ) | 178,554 | ||||||||
| Residential Mortgage-Backed Securities(1) |
717,531 | 13,575 | (31,719 | ) | 699,387 | ||||||||
| Commercial Mortgage-Backed Securities |
187,684 | 538 | (16,006 | ) | 172,216 | ||||||||
| $ | 3,607,062 | $ | 132,649 | $ | (147,672 | ) | $ | 3,592,039 | |||||
| (1) | Included within Residential Mortgage-Backed Securities are securities issued by U.S. Agencies with a fair value of $689,468 (2008—$573,745). |
The available for sale fixed maturities portfolio includes mortgage-backed and asset-backed securities and collateralized mortgage obligations. These types of securities have cash flows that are backed by the principal and interest payments of a group of underlying mortgages or other receivables. As a result of the increasing default rates of borrowers, there is a greater risk of defaults on mortgage-backed and asset-backed securities and collateralized mortgage obligations, especially those that are non-investment grade. These factors make the estimate of fair value more uncertain. Fair value estimates are obtained from multiple sources in an effort to mitigate some of the uncertainty surrounding the fair value estimates. Should it become necessary to liquidate these securities within a short period of time, the actual realized proceeds may be significantly different from the fair values estimated as at December 31, 2009.
F-17
Table of Contents
MAX CAPITAL GROUP LTD.
Notes to Consolidated Financial Statements—(Continued)
December 31, 2009, 2008 and 2007
(Expressed in thousands of U.S. Dollars,
except per share amounts)
3. Investments—(Continued)
As of December 31, 2009, the Company has performed a review of these securities for other-than-temporary impairments, which includes the consideration of relevant factors, including prepayment rates, subordination levels, default rates, credit ratings, weighted average life and cash flow testing. A discussion of the Company’s process for estimating other-than-temporary impairments is included under the heading “Other-Than-Temporary Impairment”.
The following table sets forth certain information regarding the investment ratings (provided by major rating agencies) of available for sale fixed maturities at December 31, 2009 and 2008.
| 2009 | 2008 | |||||||||
| Fair Value | % | Fair Value | % | |||||||
| U.S. Government and Agencies(1) |
$ | 1,107,599 | 36.8 | $ | 979,800 | 27.3 | ||||
| AAA and Non-U.S. Government |
648,163 | 21.6 | 1,524,501 | 42.4 | ||||||
| AA |
288,158 | 9.6 | 396,229 | 11.0 | ||||||
| A |
721,596 | 24.0 | 621,996 | 17.3 | ||||||
| BBB |
100,235 | 3.3 | 59,432 | 1.7 | ||||||
| BB |
34,781 | 1.2 | 4,161 | 0.1 | ||||||
| B or lower |
106,824 | 3.5 | 5,920 | 0.2 | ||||||
| $ | 3,007,356 | 100.0 | $ | 3,592,039 | 100.0 | |||||
| (1) | Included within U.S. Government and Agencies are U.S. Agency Mortgage Backed Securities with a fair value of $689,468 (2008—$573,745). |
As of December 31, 2009, the Company held insurance enhanced asset and mortgage-backed securities in the amount of $44,526, which represented approximately 0.8% of the Company’s total invested assets. These securities are guaranteed by MBIA Insurance Corporation ($18,246), National Public Finance Guarantee Corporation ($6,000), Ambac Financial Group ($5,446), Assured Guarantee Corp. ($4,826), Berkshire Hathaway Assurance Corporation ($3,909), Financial Guaranty Insurance Company ($3,785), and Financial Security Assurance, Inc. ($2,314).
As of December 31, 2008, the Company held insurance enhanced asset and mortgage-backed securities in the amount of $119,551, which represented approximately 2.2% of the Company’s total invested assets. These securities are guaranteed by MBIA Insurance Corporation ($40,094), Financial Security Assurance, Inc. ($33,968), Ambac Financial Group ($9,142), and Financial Guaranty Insurance Company ($36,347).
The Company did not have any significant investments in companies which guarantee securities at December 31, 2009 and 2008.
F-18
Table of Contents
MAX CAPITAL GROUP LTD.
Notes to Consolidated Financial Statements—(Continued)
December 31, 2009, 2008 and 2007
(Expressed in thousands of U.S. Dollars,
except per share amounts)
3. Investments—(Continued)
(b) The maturity distribution for available for sale fixed maturities held at December 31, 2009 was as follows:
| Amortized Cost |
Fair Value | |||||
| Within one year |
$ | 317,762 | $ | 322,599 | ||
| From one to five years |
973,938 | 1,001,493 | ||||
| From five to ten years |
401,641 | 411,965 | ||||
| More than ten years |
1,281,597 | 1,271,299 | ||||
| $ | 2,974,938 | $ | 3,007,356 | |||
Actual maturities could differ from expected contractual maturities because borrowers may have the right to call or prepay obligations, with or without call or prepayment penalties.
Fixed maturities—Held to Maturity
The fair values and amortized cost of held to maturity fixed maturities at December 31, 2009 were as follows:
| Gross Unrealized Losses | ||||||||||||||||
| Amortized Cost |
Unrealized Gain |
Non-OTTI Unrealized Loss |
OTTI Unrealized Loss |
Fair Value | ||||||||||||
| U.S. Government and Agencies |
$ | 14,050 | $ | — | $ | (515 | ) | $ | — | $ | 13,535 | |||||
| Non-U.S. Government |
573,250 | 11,034 | — | — | 584,284 | |||||||||||
| Corporate Securities |
418,647 | 17,085 | — | — | 435,732 | |||||||||||
| $ | 1,005,947 | $ | 28,119 | $ | (515 | ) | $ | — | $ | 1,033,551 | ||||||
The following table sets forth certain information regarding the investment ratings (provided by major rating agencies) of the Company’s held to maturity fixed maturities at December 31, 2009.
| Amortized Cost |
% | Fair Value | % | |||||||
| U.S. Government and Agencies |
$ | 14,050 | 1.4 | $ | 13,535 | 1.3 | ||||
| AAA |
717,954 | 71.4 | 734,595 | 71.1 | ||||||
| AA |
101,675 | 10.1 | 105,296 | 10.2 | ||||||
| A |
158,141 | 15.7 | 165,172 | 16.0 | ||||||
| BBB |
12,672 | 1.3 | 13,478 | 1.3 | ||||||
| BB |
— | — | — | — | ||||||
| B or lower |
1,455 | 0.1 | 1,475 | 0.1 | ||||||
| $ | 1,005,947 | 100.0 | $ | 1,033,551 | 100.0 | |||||
F-19
Table of Contents
MAX CAPITAL GROUP LTD.
Notes to Consolidated Financial Statements—(Continued)
December 31, 2009, 2008 and 2007
(Expressed in thousands of U.S. Dollars,
except per share amounts)
3. Investments—(Continued)
The maturity distribution for held to maturity fixed maturities held at December 31, 2009 was as follows:
| Amortized Cost |
Fair Value | |||||
| Within one year |
$ | 32,541 | $ | 32,782 | ||
| After one year through five years |
127,799 | 131,357 | ||||
| After five years through ten years |
141,876 | 147,792 | ||||
| More than ten years |
703,731 | 721,620 | ||||
| $ | 1,005,947 | $ | 1,033,551 | |||
Actual maturities could differ from expected contractual maturities because borrowers may have the right to call or prepay obligations, with or without call or prepayment penalties.
Investment Income
Investment income earned for the years ended December 31, 2009, 2008 and 2007 was as follows:
| 2009 | 2008 | 2007 | ||||||||||
| Interest earned on fixed maturities, cash and cash equivalents |
$ | 177,049 | $ | 188,568 | $ | 193,430 | ||||||
| Interest earned on funds withheld |
1,350 | 1,932 | 2,945 | |||||||||
| Amortization of premium on fixed maturities |
(3,921 | ) | (5,095 | ) | (5,146 | ) | ||||||
| Investment expenses |
(4,737 | ) | (3,781 | ) | (3,023 | ) | ||||||
| $ | 169,741 | $ | 181,624 | $ | 188,206 | |||||||
Net Realized and Unrealized Gains and Losses
(e) The net realized and unrealized gains and losses on investments for the years ended December 31, 2009, 2008 and 2007 were as follows:
| 2009 | 2008 | 2007 | ||||||||||
| Net realized gains and losses: |
||||||||||||
| Gross realized gains on available for sale securities |
$ | 12,007 | $ | 9,465 | $ | 11,643 | ||||||
| Gross realized losses on available for sale securities |
(10,122 | ) | (11,945 | ) | (14,573 | ) | ||||||
| Net realized and unrealized gains on trading securities |
2,590 | 508 | — | |||||||||
| Change in fair value of other investments |
76,514 | (232,993 | ) | 186,721 | ||||||||
| Change in fair value of derivatives |
776 | — | — | |||||||||
| Net realized and unrealized gains (losses) on investments |
$ | 81,765 | $ | (234,965 | ) | $ | 183,791 | |||||
| Net other-than-temporary impairment losses recognized in earnings |
$ | (3,078 | ) | $ | (16,887 | ) | $ | (1,087 | ) | |||
| Change in net unrealized gains and losses on available for sale fixed maturities(1) |
$ | 50,564 | $ | 9,109 | $ | 369 | ||||||
F-20
Table of Contents
MAX CAPITAL GROUP LTD.
Notes to Consolidated Financial Statements—(Continued)
December 31, 2009, 2008 and 2007
(Expressed in thousands of U.S. Dollars,
except per share amounts)
3. Investments—(Continued)
| (1) | Included in the 2009 amount is $3,123 comprising the change in net unrealized gains on available for sale securities prior to their reclassification to held to maturity. |
Included in net realized and unrealized gains on trading securities was $99 of net losses recognized on trading securities sold during the year ended December 31, 2009 (2008—net loss of $453).
For the year ended December 31, 2009, the change in fair value of derivatives of $776 relates to equity call options embedded in certain convertible fixed maturity securities. For the year ended December 31, 2008, included in gross realized gains on available for sale securities is a realized loss of $3,794 on a futures transaction that was initiated and fully settled in September 2008. This transaction was initiated as an economic hedge on a portion of the Company’s holdings of U.S. government securities.
Other-Than-Temporary Impairment
The Company endeavors to tailor the maturities of its fixed maturities portfolio to the expected timing of its loss and benefit payments. Due to fluctuations in interest rates, it is likely that over the period a security is held there will be periods, perhaps greater than twelve months, when the investment’s fair value is less than its cost, resulting in unrealized losses.
The Company was required to record, as of the beginning of the interim period of adoption, a cumulative effect adjustment to reclassify the non-credit component of a previously recognized OTTI from retained earnings to other comprehensive income (loss). To determine whether a cumulative effect adjustment was required, the Company reviewed OTTI it had recorded through realized losses on securities held at March 31, 2009, and estimated the portion related to credit losses (i.e., where the present value of cash flows expected to be collected are lower than the amortized cost basis of the security) and the portion related to all other non-credit factors. The Company estimated that all of the OTTI previously recorded through earnings related to specific credit losses and therefore no cumulative effect adjustment was required.
The Company has reviewed all debt securities in an unrealized loss position at the end of the period to identify any securities for which there is an intention to sell those securities after the period end. For those securities where there is such an intention, the OTTI charge (being the difference between the amortized cost and the fair value of the security) was recognized in net income. The Company has reviewed debt securities in an unrealized loss position to determine whether it is more likely than not that it will be required to sell those securities. The Company has considered its liquidity and working capital needs and determined that it is not more likely than not that it will be required to sell any of the securities in an unrealized loss position. The Company has also performed a review of debt securities which considers various indicators of potential credit losses. These indicators include the length of time and extent of the unrealized loss, any specific adverse conditions, historic and implied volatility of the security, failure of the issuer of the security to make scheduled interest payments, expected cash flow analysis, significant rating changes and recoveries or additional declines in fair value subsequent to the balance sheet date. The consideration of these indicators and the estimation of credit losses involve significant management judgment.
F-21
Table of Contents
MAX CAPITAL GROUP LTD.
Notes to Consolidated Financial Statements—(Continued)
December 31, 2009, 2008 and 2007
(Expressed in thousands of U.S. Dollars,
except per share amounts)
3. Investments—(Continued)
The Company recorded $3,078 of OTTI in earnings for the year ended December 31, 2009, of which $2,869 related to estimated credit losses.
The following methodology and significant inputs were used to determine the estimated credit losses during the year ended December 31, 2009:
| • | Corporate securities ($1,543)—the Company reviewed the business prospects, credit ratings and information received from investment managers and rating agencies for each security; |
| • | Mortgage backed securities ($703)—the Company utilized underlying data for each security provided by its investment managers in order to determine an expected recovery value for each security. The analysis provided by the investment managers includes expected cash flow projections under base case and stress case scenarios which modify expected default expectations, loss severities and prepayment assumptions. The significant inputs in the models include the expected default rates, delinquency rates, foreclosure costs, etc. The Company reviews the process used by each investment manager in developing their analysis, reviews the results of the analysis and then determines what the expected recovery values are for each security, which incorporates both base case and stress case scenarios; and |
| • | Asset backed securities ($623)—the Company utilized underlying data for each security provided by investment managers in order to determine an expected recovery value for each security. The analysis provided by the investment managers includes expected cash flow projections under base case and stress case scenarios which modify expected default expectations and loss severities and prepayment assumptions. The significant inputs in the models include the expected default rates, delinquency rates, foreclosure costs, etc. The Company reviews the process used by each investment manager in developing its analysis, reviews the results of the analysis and then determines what the expected recovery values are for each security, which incorporates both base case and stress case scenarios. |
F-22
Table of Contents
MAX CAPITAL GROUP LTD.
Notes to Consolidated Financial Statements—(Continued)
December 31, 2009, 2008 and 2007
(Expressed in thousands of U.S. Dollars,
except per share amounts)
3. Investments—(Continued)
Of the total holding of 1,495 (2008—1,333) securities in the available for sale portfolio, 400 (2008—614) had unrealized losses at December 31, 2009. Fixed maturities with unrealized losses and the duration such conditions have existed at December 31, 2009 and 2008 were as follows:
| Less Than 12 Months | 12 Months or Longer | Total | ||||||||||||||||
| December 31, 2009 |
Fair Value |
Unrealized Losses |
Fair Value |
Unrealized Losses |
Fair Value |
Unrealized Losses | ||||||||||||
| U.S. Government and Agencies |
$ | 122,515 | $ | 2,756 | $ | — | $ | — | $ | 122,515 | $ | 2,756 | ||||||
| Non-U.S. Government |
24,457 | 1,905 | — | — | 24,457 | 1,905 | ||||||||||||
| Corporate Securities |
334,212 | 11,469 | — | — | 334,212 | 11,469 | ||||||||||||
| Municipal Securities |
54,212 | 1,488 | — | — | 54,212 | 1,488 | ||||||||||||
| Asset Backed Securities |
61,499 | 14,254 | 1,805 | 735 | 63,304 | 14,989 | ||||||||||||
| Residential Mortgage-Backed Securities |
211,344 | 10,957 | 1,802 | 13 | 213,146 | 10,970 | ||||||||||||
| Commercial Mortgage-Backed Securities |
111,598 | 10,169 | 951 | 12 | 112,549 | 10,181 | ||||||||||||
| $ | 919,837 | $ | 52,998 | $ | 4,558 | $ | 760 | $ | 924,395 | $ | 53,758 | |||||||
|
Less Than 12 Months |
12 Months or Longer |
Total | ||||||||||||||||
| December 31, 2008 |
Fair Value |
Unrealized Losses |
Fair Value |
Unrealized Losses |
Fair Value |
Unrealized Losses | ||||||||||||
| U.S. Government and Agencies |
$ | — | $ | — | $ | — | $ | — | $ | — | $ | — | ||||||
| Non-U.S. Government |
44,103 | 1,912 | — | — | 44,103 | 1,912 | ||||||||||||
| Corporate Securities |
781,724 | 58,190 | 8,097 | 847 | 789,821 | 59,037 | ||||||||||||
| Municipal Securities |
12,569 | 477 | — | — | 12,569 | 477 | ||||||||||||
| Asset-Backed Securities |
169,628 | 38,215 | 1,540 | 306 | 171,168 | 38,521 | ||||||||||||
| Residential Mortgage-Backed Securities |
141,774 | 31,467 | 1,287 | 252 | 143,061 | 31,719 | ||||||||||||
| Commercial Mortgage-Backed Securities |
133,571 | 15,910 | 1,175 | 96 | 134,746 | 16,006 | ||||||||||||
| $ | 1,283,369 | $ | 146,171 | $ | 12,099 | $ | 1,501 | $ | 1,295,468 | $ | 147,672 | |||||||
F-23
Table of Contents
MAX CAPITAL GROUP LTD.
Notes to Consolidated Financial Statements—(Continued)
December 31, 2009, 2008 and 2007
(Expressed in thousands of U.S. Dollars,
except per share amounts)
3. Investments—(Continued)
The following table provides a roll-forward of the amount related to credit losses recognized in earnings for which a portion of an OTTI was recognized in accumulated other comprehensive income for the period ended December 31, 2009:
| (Expressed in thousands of U.S. Dollars) |
||||
| Beginning balance at April 1, 2009 |
$ | — | ||
| Credit losses remaining in retained earnings related to accounting standard adoption |
— | |||
| Addition for credit loss impairment recognized in the current period on securities not previously impaired |
2,869 | |||
| Reductions for securities sold during the period |
(1,339 | ) | ||
| Ending balance at December 31, 2009 |
$ | 1,530 | ||
Other investments
Other investments comprise the Company’s investment in hedge funds and the Company’s investment in Grand Central Re Limited (“Grand Central Re”), a private equity investment. Together, the hedge funds and the private equity investment are referred to as the Company’s “hedge fund portfolio.”
The distribution of the hedge fund portfolio by investment strategy as at December 31, 2009 and December 31, 2008 was:
| December 31, 2009 | December 31, 2008 | |||||||||||
| Fair Value | Allocation % | Fair Value | Allocation % | |||||||||
| Convertible arbitrage |
$ | — | — | % | $ | 10,650 | 1.4 | % | ||||
| Distressed securities |
62,897 | 20.0 | % | 115,900 | 15.4 | % | ||||||
| Diversified arbitrage |
34,503 | 10.9 | % | 46,034 | 6.1 | % | ||||||
| Emerging markets |
26,211 | 8.3 | % | 39,683 | 5.3 | % | ||||||
| Event-driven arbitrage |
41,724 | 13.3 | % | 75,205 | 9.9 | % | ||||||
| Fixed income arbitrage |
14,351 | 4.6 | % | 30,881 | 4.1 | % | ||||||
| Global macro |
34,299 | 10.9 | % | 87,304 | 11.6 | % | ||||||
| Long/short credit |
9,426 | 3.0 | % | 38,581 | 5.1 | % | ||||||
| Long/short equity |
85,901 | 27.3 | % | 290,224 | 38.5 | % | ||||||
| Opportunistic |
2,765 | 0.8 | % | 14,746 | 2.0 | % | ||||||
| Total hedge funds |
312,077 | 99.1 | % | 749,208 | 99.4 | % | ||||||
| Reinsurance private equity |
2,772 | 0.9 | % | 4,450 | 0.6 | % | ||||||
| Total other investments |
$ | 314,849 | 100.0 | % | $ | 753,658 | 100.0 | % | ||||
Cash and cash equivalent balances of $22,299 and $133,406 held within the hedge fund portfolio are excluded from the above table and are presented within cash and cash equivalents on the consolidated balance sheets at December 31, 2009 and 2008, respectively. Redemptions receivable of $79,145 and $98,066 held within the hedge fund portfolio are excluded from the above table and are presented within trades pending settlement on the consolidated balance sheets at December 31, 2009 and 2008, respectively.
F-24
Table of Contents
MAX CAPITAL GROUP LTD.
Notes to Consolidated Financial Statements—(Continued)
December 31, 2009, 2008 and 2007
(Expressed in thousands of U.S. Dollars,
except per share amounts)
3. Investments—(Continued)
As of December 31, 2009, the hedge fund portfolio employed nine strategies invested in 30 underlying funds. The Company is able to redeem the hedge funds on the same terms that the underlying funds can be redeemed.
Certain funds may have a lock-up period. A lock-up period refers to the initial amount of time an investor is contractually required to invest before having the ability to redeem. Funds that do provide for periodic redemptions may, depending on the funds’ governing documents, have the ability to deny or delay a redemption request, called a gate. The fund may implement this restriction because the aggregate amount of redemption requests as of a particular date exceeds a specified level, generally ranging from 15% to 25% of the fund’s net assets. The gate is a method for executing an orderly redemption process which allows for redemption requests to be executed in a timely manner to reduce the possibility of adversely affecting the remaining investors in the fund. Typically, the imposition of a gate delays a portion of the requested redemption, with the remaining portion settled in cash shortly after the redemption date.
Of the Company’s December 31, 2009 outstanding redemptions receivable of $79,145, none of which is gated, $64,014 was received in cash prior to February 12, 2010. The fair value of the Company’s holdings in funds with gates imposed as at December 31, 2009 is $41,820 (December 31, 2008—$42,666).
Certain funds may be allowed to invest a portion of their assets in illiquid securities, such as private equity or convertible debt. In such cases, a common mechanism used is a side-pocket, whereby the illiquid security is assigned to a separate memorandum capital account or designated account. Typically, the investor loses its redemption rights in the designated account. Only when the illiquid security is sold, or otherwise deemed liquid by the fund, may investors redeem their interest. As at December 31, 2009, the fair value of the hedge funds held in side-pockets is $99,837 (December 31, 2008—$113,382).
Further details regarding the redemption of the hedge fund portfolio at December 31, 2009 is as follows:
| Fair Value | Gated/ Side Investments(1) |
Investments without Gates or Side Pockets |
Redemption |
Redemption | |||||||||
| Convertible arbitrage |
$ | — | $ | — | $ | — | |||||||
| Distressed securities |
62,897 | 27,625 | 35,272 | Biannually(3) | 180 days | ||||||||
| Diversified arbitrage |
34,503 | 34,503 | — | ||||||||||
| Emerging markets |
26,211 | 26,211 | — | ||||||||||
| Event-driven arbitrage |
41,724 | 32,303 | 9,421 | Quarterly | 60 days | ||||||||
| Fixed income arbitrage |
14,351 | — | 14,351 | Monthly | 90 days | ||||||||
| Global macro |
34,299 | 3,780 | 30,519 | Monthly - Quarterly | 60 days | ||||||||
| Long/short credit |
9,426 | — | 9,426 | Quarterly | 56 days | ||||||||
| Long/short equity |
85,901 | 14,470 | 71,431 | Quarterly - Annually(4) | 30-90 days | ||||||||
| Opportunistic |
2,765 | 2,765 | — | ||||||||||
| Total hedge funds |
312,077 | 141,657 | 170,420 | ||||||||||
F-25
Table of Contents
MAX CAPITAL GROUP LTD.
Notes to Consolidated Financial Statements—(Continued)
December 31, 2009, 2008 and 2007
(Expressed in thousands of U.S. Dollars,
except per share amounts)
3. Investments—(Continued)
| (1) | For those investments which are restricted by gates or are invested in side pockets, the Company can not reasonably estimate at December 31, 2009 when it will be able to redeem the investment. |
| (2) | The redemption frequency and notice period apply to the investments which are not gated or invested in side pockets. |
| (3) | The next available redemption date is December 31, 2010 for investments totalling $29,012, and September 30, 2011 for the remaining $6,260. |
| (4) | For the funds with an annual redemption date, totalling $12,355, the next available redemption date is September 30, 2010. |
As of December 31, 2009, the Company had no unfunded commitments related to its hedge fund portfolio.
An increase in market volatility and an increase in volatility of hedge funds in general, as well as a decrease in market liquidity, could lead to a higher risk of a large decline in value of the hedge funds in any given time period.
Restricted cash
As at December 31, 2009, $224,382 of cash and cash equivalents (December 31, 2008—$ 449,763) were deposited, pledged or held in restricted accounts in favor of certain ceding companies, credit facility providers and regulatory authorities. Certain of these deposits can be substituted with fixed maturity securities at the Company’s option, subject to the counter party approval.
4. Fair Value of Financial Instruments
The fair value hierarchy, which is based on the quality of inputs used to measure fair value, gives the highest priority to unadjusted quoted prices in active markets for identical assets or liabilities (Level 1 measurements) and the lowest priority to unobservable inputs (Level 3 measurements). The three levels of the fair value hierarchy are described below:
Level 1—Quoted prices for identical instruments in active markets.
F-26
Table of Contents
MAX CAPITAL GROUP LTD.
Notes to Consolidated Financial Statements—(Continued)
December 31, 2009, 2008 and 2007
(Expressed in thousands of U.S. Dollars,
except per share amounts)
4. Fair Value of Financial Instruments—(Continued)
Level 2—Quoted prices for similar instruments in active markets; quoted prices for identical or similar instruments in markets that are not active; and model-derived valuations in which all significant inputs and significant value drivers are observable in active markets.
Level 3—Model derived valuations in which one or more significant inputs or significant value drivers are unobservable.
When the inputs used to measure fair value fall within different levels of the hierarchy, the level within which the fair value measurement is categorized is based on the lowest level input that is significant to the fair value measurement in its entirety. Thus, a Level 3 fair value measurement may include inputs that are observable (Level 1 and 2) and unobservable (Level 3).
The Company determines the existence of an active market based on its judgment as to whether transactions for the financial instrument occur in such market with sufficient frequency and volume to provide reliable pricing information.
Fair value prices for all securities in the fixed maturities portfolio are independently provided by both the investment custodian and the investment managers, which each utilize internationally recognized independent pricing services. The Company records the unadjusted price provided by the investment custodian and validates this price through a process which includes, but is not limited to: (i) comparison to the price provided by the investment manager, with significant differences investigated; (ii) quantitative analysis (e.g., comparing the quarterly return for each managed portfolio to its target benchmark, with significant differences identified and investigated); (iii) evaluation of methodologies used by external parties to calculate fair value; and (iv) comparing the price to the Company’s knowledge of the current investment market.
The independent pricing services used by the investment custodian and investment managers obtain actual transaction prices for securities that have quoted prices in active markets. Each pricing service has its own proprietary method for determining the fair value of securities that are not actively traded. In general, these methods involve the use of “matrix pricing” in which the independent pricing service uses observable market inputs including, but not limited to, reported trades, benchmark yields, broker/dealer quotes, interest rates, prepayment speeds, default rates and such other inputs as are available from market sources to determine a reasonable fair value. In addition, pricing services use valuation models, such as an Option Adjusted Spread model, to develop prepayment and interest rate scenarios.
The Option Adjusted Spread model is commonly used to estimate fair value for securities such as mortgage-backed and asset-backed securities. The ability to obtain quoted market prices is reduced in periods of decreasing liquidity, which generally increases the use of matrix pricing methods and generally increases the uncertainty surrounding the fair value estimates. This could result in the reclassification of a security between levels of the fair value hierarchy.
At December 31, 2009, the Company determined that U.S. government securities are classified as Level 1. Securities classified as Level 2 include mortgage-backed and asset-backed securities, corporate debt securities, U.S. government-sponsored agency securities, certain foreign government securities and all other fixed maturity securities.
F-27
Table of Contents
MAX CAPITAL GROUP LTD.
Notes to Consolidated Financial Statements—(Continued)
December 31, 2009, 2008 and 2007
(Expressed in thousands of U.S. Dollars,
except per share amounts)
4. Fair Value of Financial Instruments—(Continued)
Investments in hedge funds are carried at fair value. The change in fair value is included in net realized and unrealized gains on investments and recognized in net income. The units of account that are valued by the Company are its interests in the funds and not the underlying holdings of such funds. Thus, the inputs used by the Company to value its investments in each of the funds may differ from the inputs used to value the underlying holdings of such funds. These funds are stated at fair value which ordinarily will be the most recently reported net asset value as advised by the fund manager or administrator. The use of net asset value as an estimate of the fair value for investments in certain entities that calculate net asset value is a permitted practical expedient. Certain of the Company’s funds have either imposed a gate on redemptions, or have segregated a portion of the underlying assets into a side-pocket. The investments in these funds are classified as Level 3 in the fair value hierarchy as the Company can not reasonably estimate at December 31, 2009, the time period in which it will be able to redeem its investment. Certain hedge fund investments have a redemption notice period and frequency which is not considered to be in the near term; these investments are also classified as Level 3 in the hierarchy. The remaining hedge fund portfolio investments are classified as Level 2 in the fair value hierarchy as, at December 31, 2009, the Company can reasonably estimate when it will be able to redeem its investments at the net asset value, and the redemption period is considered to be in the near term.
The Company has ongoing due diligence processes with respect to funds and their managers. These processes are designed to assist the Company in assessing the quality of information provided by, or on behalf of, each fund and in determining whether such information continues to be reliable or whether further review is warranted. Certain funds do not provide full transparency of their underlying holdings; however, the Company obtains the audited financial statements for every fund annually, and regularly reviews and discusses the fund performance with the fund managers to corroborate the reasonableness of the reported net asset values. While reported net asset value is the primary input to the review, when the net asset value is deemed not to be indicative of fair value, the Company may incorporate adjustments to the reported net asset value and not use the permitted practical expedient on an investment by investment basis. Such adjustments may involve significant management judgment.
Based on the review process applied by management, the permitted practical expedient has not been applied to one hedge fund investment and a reduction of $700 was made to the net asset value reported by the fund manager as at December 31, 2009 (December 31, 2008—$2,000) to adjust the carrying value of the fund to the Company’s best estimate of fair value.
A review of fair value hierarchy classifications is conducted on a quarterly basis. Changes in the observability of valuation inputs may result in a reclassification for certain financial assets and liabilities. Reclassifications impacting Level 3 of the fair value hierarchy are reported as transfers in/out of the Level 3 category as of the beginning of the quarter in which the reclassifications occur. At December 31, 2009 $206,666 of other investments has been reclassified out of the Level 3 category into the Level 2 category in order to comply with the requirements of ASU 2009-12 “Fair Value Measurements and Disclosures”. The other investments transferred to Level 2 are hedge funds for which the Company can reasonably estimate when it will be able to redeem its investment, and the redemption could occur in the near term.
F-28
Table of Contents
MAX CAPITAL GROUP LTD.
Notes to Consolidated Financial Statements—(Continued)
December 31, 2009, 2008 and 2007
(Expressed in thousands of U.S. Dollars,
except per share amounts)
4. Fair Value of Financial Instruments—(Continued)
The following table presents the Company’s fair value hierarchy for those assets or liabilities measured at fair value on a recurring basis as of December 31, 2009 and 2008:
| 2009 |
Quoted Prices in Active Markets Level 1 |
Significant Other Observable Inputs Level 2 |
Significant Other Unobservable Inputs Level 3 |
Total | ||||||||
| U.S. Government and Agencies |
$ | 126,760 | $ | 398,667 | $ | — | $ | 525,427 | ||||
| Non-U.S. Government |
— | 82,027 | — | 82,027 | ||||||||
| Corporate Securities |
— | 1,375,999 | — | 1,375,999 | ||||||||
| Municipal Securities |
— | 83,658 | — | 83,658 | ||||||||
| Asset-Backed Securities |
— | 102,006 | — | 102,006 | ||||||||
| Residential Mortgage-Backed Securities |
— | 763,974 | — | 763,974 | ||||||||
| Commercial Mortgage-Backed Securities |
— | 302,961 | — | 302,961 | ||||||||
| Total fixed maturities |
126,760 | 3,109,292 | — | 3,236,052 | ||||||||
| Other investments |
— | 135,148 | 176,929 | 312,077 | ||||||||
| Derivative asset |
— | 3,224 | — | 3,224 | ||||||||
| $ | 126,760 | $ | 3,247,664 | $ | 176,929 | $ | 3,551,353 | |||||
| 2008 |
Quoted Prices in Active Markets Level 1 |
Significant Other Observable Inputs Level 2 |
Significant Other Unobservable Inputs Level 3 |
Total | ||||||||
| U.S. Government and Agencies |
$ | 129,147 | $ | 277,981 | $ | — | $ | 407,128 | ||||
| Non-U.S. Government |
— | 662,566 | — | 662,566 | ||||||||
| Corporate Securities |
— | 1,471,379 | — | 1,471,379 | ||||||||
| Municipal Securities |
— | 48,597 | — | 48,597 | ||||||||
| Asset-Backed Securities |
— | 178,554 | — | 178,554 | ||||||||
| Residential Mortgage-Backed Securities |
— | 713,419 | — | 713,419 | ||||||||
| Commercial Mortgage-Backed Securities |
— | 172,216 | — | 172,216 | ||||||||
| Total fixed maturities |
129,147 | 3,524,712 | — | 3,653,859 | ||||||||
| Other investments |
— | — | 749,208 | 749,208 | ||||||||
| $ | 129,147 | $ | 3,524,712 | $ | 749,208 | $ | 4,403,067 | |||||
The other investments above do not include a private equity investment of $2,772 and $4,450 at December 31, 2009 and December 31, 2008, respectively, in which the Company is deemed to have significant influence and as such is accounted for under the equity method.
F-29
Table of Contents
MAX CAPITAL GROUP LTD.
Notes to Consolidated Financial Statements—(Continued)
December 31, 2009, 2008 and 2007
(Expressed in thousands of U.S. Dollars,
except per share amounts)
4. Fair Value of Financial Instruments—(Continued)
The following table provides a summary of the changes in fair value of the Company’s Level 3 financial assets (and liabilities) for the years ended December 31, 2009 and 2008.
| Fair Value Measurements Using Significant Unobservable Inputs (Level 3) |
|||||||||||||||
| Fixed Maturities |
Other Investments |
Other Assets |
Total | ||||||||||||
| Beginning balance at January 1, 2009 |
$ | — | $ | 749,208 | $ | — | $ | 749,208 | |||||||
| Total gains or losses (realized/unrealized) |
|||||||||||||||
| Included in net income |
— | 71,846 | — | 71,846 | |||||||||||
| Included in other comprehensive income |
— | — | — | — | |||||||||||
| Purchases, issuances and settlements |
— | (437,459 | ) | — | (437,459 | ) | |||||||||
| Transfers in and/or out of Level 3 |
— | (206,666 | ) | — | (206,666 | ) | |||||||||
| Ending balance at December 31, 2009 |
$ | — | $ | 176,929 | $ | — | $ | 176,929 | |||||||
| The amount of total gains or losses for the year ended December 31, 2009 included in earnings attributable to the change in unrealized gains or losses relating to assets still held at December 31, 2009 |
$ | — | $ | 41,907 | $ | — | $ | 41,907 | |||||||
| Fair Value Measurements Using Significant Unobservable Inputs (Level 3) |
|||||||||||||||
| Fixed Maturities |
Other Investments |
Other Assets |
Total | ||||||||||||
| Beginning balance at January 1, 2008 |
$ | — | $ | 17,743 | $ | — | $ | 17,743 | |||||||
| Total gains or losses (realized/unrealized) |
|||||||||||||||
| Included in net income |
— | (89,284 | ) | (552 | ) | (89,836 | ) | ||||||||
| Included in other comprehensive income |
— | — | — | — | |||||||||||
| Purchases, issuances and settlements |
— | — | 552 | 552 | |||||||||||
| Transfers in and/or out of Level 3 |
— | 820,749 | — | 820,749 | |||||||||||
| Ending balance at December 31, 2008 |
$ | — | $ | 749,208 | $ | — | $ | 749,208 | |||||||
| The amount of total gains or losses for the year ended December 31, 2008 included in earnings attributable to the change in unrealized gains or losses relating to assets still held at December 31, 2008 |
$ | — | $ | (201,362 | ) | $ | — | $ | (201,362 | ) | |||||
F-30
Table of Contents
MAX CAPITAL GROUP LTD.
Notes to Consolidated Financial Statements—(Continued)
December 31, 2009, 2008 and 2007
(Expressed in thousands of U.S. Dollars,
except per share amounts)
5. Business Combinations
(a) Max UK
On November 6, 2008, the Company acquired 100% of the outstanding and issued common shares of Max UK. Max UK, through its subsidiaries, underwrites property, personal accident, financial institutions, professional liability, and employers’ and public liability lines of business. Max UK operates in the Lloyd’s market through the Syndicates. A wholly-owned subsidiary of Max UK, Max at Lloyd’s, is the managing agent for the Syndicates. The Company participates in the Syndicates’ results through two corporate members, both are wholly-owned subsidiaries of Max UK. These corporate members together represent 100% of the participation in Syndicate 1400, and together represent 2% and 36% of the participation in Syndicates 2525 and 2526, respectively.
The acquisition of Max UK provides the Company with direct access to the Lloyd’s market, valuable and experienced underwriting teams, and expands the Company’s product line and geographic diversification. These factors resulted in a purchase price greater than the fair value of the tangible net assets acquired and the recognition of goodwill and intangible assets.
The final purchase price paid by the Company was $22,607, representing the tangible net assets acquired of $6,296, intangible assets—syndicate capacity of $8,113, and goodwill of $8,198.
The fair value of Max UK net assets acquired and the allocation of the purchase price is summarized as follows:
| Total purchase price |
$ | 22,607 | ||||
| Assets acquired |
||||||
| Cash and investments |
$ | 208,860 | ||||
| Receivables |
75,777 | |||||
| Other assets |
20,695 | |||||
| Tangible assets acquired |
305,332 | |||||
| Intangible asset—Syndicate capacity |
8,113 | |||||
| Liabilities acquired |
||||||
| Net loss reserves |
231,642 | |||||
| Unearned premiums, net of expenses |
39,916 | |||||
| Other liabilities |
27,478 | |||||
| Liabilities acquired |
299,036 | |||||
| Excess purchase price—goodwill |
$ | 8,198 | ||||
Syndicate capacity represents the Company’s authorized premium income limit to write insurance business in the Lloyd’s market. The capacity is renewed annually at no cost to the Company, but may be freely purchased or sold, subject to Lloyd’s approval. The ability to write insurance business within the syndicate capacity is indefinite with the premium income limit being set annually by the Company, subject to Lloyd’s approval. Syndicate capacity is estimated to have an indefinite useful life and is not subject to amortization.
As a result of final negotiation and agreement in the year ended December 31, 2009, the final purchase price increased by $8,198 from the $14,409 estimated purchase price recorded by the Company at the time of acquisition.
F-31
Table of Contents
MAX CAPITAL GROUP LTD.
Notes to Consolidated Financial Statements—(Continued)
December 31, 2009, 2008 and 2007
(Expressed in thousands of U.S. Dollars,
except per share amounts)
5. Business Combinations—(Continued)
(a) Max UK—(Continued)
Supplemental Pro Forma Information
Operating results of Max UK have been included in the consolidated financial statements from November 6, 2008, the date of acquisition. The following selected unaudited pro forma information is provided to present a summary of the combined results of the Company and Max UK assuming the transaction had been effective January 1, 2007. The unaudited pro forma data is for informational purposes only and does not necessarily represent results that would have occurred if the transaction had taken place on the basis assumed above.
| (unaudited) | |||||||
| 2008 | 2007 | ||||||
| Gross premiums written |
$ | 1,365,601 | $ | 1,231,356 | |||
| Net premiums earned |
844,277 | 893,014 | |||||
| Total revenue |
788,197 | 1,280,711 | |||||
| Net (loss) income |
(171,726 | ) | 324,308 | ||||
| Basic earnings per share |
(3.04 | ) | 5.41 | ||||
| Diluted earnings per share |
(3.04 | ) | 5.08 | ||||
(b) Max America
On June 2, 2008, Max Specialty acquired 100% of the outstanding and issued common shares of Max America (formerly known as Commercial Guaranty Casualty Insurance Company), an Indiana-domiciled insurer. This transaction provides the Company with the ability to write admitted insurance business in all 50 U.S. states and the District of Columbia. In connection with the purchase, the Company acquired net assets with a fair value of $20,000 and recorded $12,000 of intangible assets. The intangible assets comprise insurance licenses and are included in other assets on the Company’s consolidated balance sheet.
At the date of acquisition, a party related to the seller (“the guarantor”) assumed all known, unknown and contingent liabilities of Max America relating to events occurring on or before the acquisition date. In addition, the guarantor entered into a reinsurance agreement to fully assume all outstanding loss reserves of Max America on the acquisition date. These loss reserves, and a reinsurance recoverable of the same amount, were recorded on the date of acquisition. To the extent the guarantor does not meet its obligation under these agreements, Max America remains liable for these liabilities.
(c) Max Specialty
On April 2, 2007, Max USA acquired 100% of the outstanding and issued common shares of Max Specialty, an inactive U.S.-domiciled excess and surplus lines insurer. This transaction, together with the incorporation of Max USA in December of 2006, provided the Company with a U.S.-based platform from which to provide eligible non-admitted excess and surplus lines insurance within the United States. The total purchase price was $41,915. Goodwill and intangible assets with indefinite lives arising from the acquisition of this U.S.-domiciled platform were $11,975 and $8,400 respectively, and are included in other assets on the Company’s consolidated balance sheet.
F-32
Table of Contents
MAX CAPITAL GROUP LTD.
Notes to Consolidated Financial Statements—(Continued)
December 31, 2009, 2008 and 2007
(Expressed in thousands of U.S. Dollars,
except per share amounts)
5. Business Combinations—(Continued)
(c) Max Specialty—(Continued)
At the date of acquisition, a party related to the seller (“the guarantor”) assumed all known, unknown and contingent liabilities of Max Specialty relating to events occurring on or before the acquisition date. In addition, the guarantor entered into a reinsurance agreement to fully assume all outstanding loss reserves of Max Specialty on the acquisition date. These loss reserves, and a reinsurance recoverable of the same amount, were recorded on the date of acquisition. To the extent the guarantor does not meet its obligation under these agreements, Max Specialty remains liable for these liabilities.
In addition to the loss reserves and related reinsurance recoverable, the assets and liabilities of Max Specialty and Max USA included fixed maturity securities on deposit with regulatory authorities of $10,087, cash and accrued interest of $9,913, tangible assets of $1,540 and insurance licenses of $8,400. These assets were recorded at their fair values on the date of acquisition, with the resulting excess purchase price being recorded as goodwill.
6. Goodwill and intangible assets
Goodwill and intangible assets are included within other assets on the consolidated balance sheets. As discussed in Note 5, the Company recorded $8,198 of goodwill on the determination of the final purchase price of the acquisition of Max UK in 2009. During the year ended December 31, 2008, the Company recorded intangible assets of $12,000 for insurance licenses, and $8,113 for syndicate capacity, on the acquisitions of Max America and Max UK, respectively. During the year ended December 31, 2007, the Company recorded goodwill of $11,975 and intangible assets for insurance licenses of $8,400 on the acquisition of Max Specialty. The goodwill and intangible assets were assessed for impairment as at December 31, 2009 and 2008, and no impairment was identified.
| Goodwill | Intangible assets with an indefinite life |
Intangible assets with a finite life |
Total | |||||||||
| Balance at December 31, 2007 |
$ | 11,975 | $ | 8,400 | $ | — | $ | 20,375 | ||||
| Additions during the year |
— | 20,113 | — | 20,113 | ||||||||
| Balance at December 31, 2008 |
$ | 11,975 | $ | 28,513 | $ | — | $ | 40,488 | ||||
| Additions during the year |
8,198 | — | — | 8,198 | ||||||||
| Balance at December 31, 2009 |
$ | 20,173 | $ | 28,513 | $ | — | $ | 48,686 | ||||
7. Property and casualty losses and loss adjustment expenses
The establishment of the provision for outstanding losses and loss adjustment expenses is based on known facts and interpretation of circumstances and is therefore a complex and dynamic process influenced by a large variety of factors. These factors include the Company’s experience with similar cases and historical trends involving claim payment patterns, pending levels of unpaid claims, product mix or concentration, claim severity and frequency patterns such as those caused by natural disasters, fires, or accidents, depending on the business assumed.
Other factors include the continually evolving and changing regulatory and legal environment, actuarial studies, professional experience and expertise of the Company’s
F-33
Table of Contents
MAX CAPITAL GROUP LTD.
Notes to Consolidated Financial Statements—(Continued)
December 31, 2009, 2008 and 2007
(Expressed in thousands of U.S. Dollars,
except per share amounts)
7. Property and casualty losses and loss adjustment expenses—(Continued)
management and independent adjusters retained to handle individual claims, the quality of the data used for projection purposes, existing claims management and settlement practices, the effect of inflationary trends on future claims settlement costs, court decisions, economic conditions and public attitudes. In addition, time can be a critical part of the provision determination, since the longer the time span between incidence of a loss and the payment or settlement of the claims, the more variable the ultimate settlement amount can be. Consequently, the establishment of the provision for outstanding losses and benefits relies on the judgment and opinion of a large number of individuals, on historical precedent and trends, on prevailing legal, economic, social and regulatory trends and on expectations as to future developments. The process of determining the provision necessarily involves risks that the actual results will deviate, perhaps substantially, from the best estimate made.
The summary of changes in outstanding property and casualty losses at December 31, 2009, 2008 and 2007 is as follows:
| 2009 | 2008 | 2007 | ||||||||||
| Gross balance at January 1 |
$ | 2,938,171 | $ | 2,333,877 | $ | 2,335,109 | ||||||
| Less: Reinsurance recoverables and deferred charges |
(810,898 | ) | (539,029 | ) | (495,547 | ) | ||||||
| Net balance at January 1 |
2,127,273 | 1,794,848 | 1,839,562 | |||||||||
| Net loss reserves acquired in purchase of Max UK |
— | 231,641 | — | |||||||||
| Incurred losses related to: |
||||||||||||
| Current year |
580,956 | 500,704 | 394,146 | |||||||||
| Prior years |
(87,357 | ) | (106,959 | ) | (63,752 | ) | ||||||
| Total incurred |
493,599 | 393,745 | 330,394 | |||||||||
| Paid losses related to: |
||||||||||||
| Current year |
(54,712 | ) | (62,663 | ) | (20,300 | ) | ||||||
| Prior years |
(368,537 | ) | (184,223 | ) | (361,702 | ) | ||||||
| Total paid |
(423,249 | ) | (246,886 | ) | (382,002 | ) | ||||||
| Foreign currency revaluation |
15,155 | (46,075 | ) | 6,894 | ||||||||
| Net balance at December 31 |
2,212,778 | 2,127,273 | 1,794,848 | |||||||||
| Plus: Reinsurance recoverables and deferred charges |
965,316 | 810,898 | 539,029 | |||||||||
| Gross balance at December 31 |
$ | 3,178,094 | $ | 2,938,171 | $ | 2,333,877 | ||||||
Year ended December 31, 2009
Incurred losses related to prior years of $(87,357) for the year ended December 31, 2009 comprise the following components:
| • | Net favorable development for the Company’s Bermuda/Dublin insurance segment of $41,334; $21,002 of which was recognized on professional liability and $7,059 on general casualty lines of business, primarily on the 2005 and prior years, and $13,273 on the short tail property and aviation lines of business from the 2008 and 2007 years; |
F-34
Table of Contents
MAX CAPITAL GROUP LTD.
Notes to Consolidated Financial Statements—(Continued)
December 31, 2009, 2008 and 2007
(Expressed in thousands of U.S. Dollars,
except per share amounts)
7. Property and casualty losses and loss adjustment expenses—(Continued)
| • | Net favorable development for the Bermuda/Dublin reinsurance segment of $31,985, excluding the development associated with changes in reinsurance premium estimates described below. The Company recorded net favorable development on long tail lines of business, including $10,530 from general casualty primarily on 2005 and prior years, $8,569 on professional liability primarily on 2006 and prior years, $7,942 on medical malpractice primarily on 2007 and prior years, and $3,331 on other long tail lines of business. The Company recorded net favorable development on short tail lines of business primarily on the 2008 and prior years, including $20,329 on property reinsurance, and $5,544 on other short tail lines, offset by adverse development of $24,260 on the marine and energy lines of business; |
| • | Net favorable development for the Max at Lloyd’s segment of $6,143, principally recognized on the professional liability line of business. This was partially offset by net adverse development of $1,127 in the U.S specialty segment; |
| • | Favorable development of $11,424 arising from reductions in reinsurance premium estimates of $10,894. Changes in premium estimates occur on prior year contracts each year as the Company receives additional information on the underlying exposures insured and the associated loss is recorded, at the original loss ratio, concurrently with the premium adjustment. The favorable development is offset by a decrease in net earned premium net of acquisition costs of $11,704; and |
| • | Premium adjustments on the Company’s insurance business resulted in adverse development of $2,402 which was offset by an increase in earned premium during the year. |
Year ended December 31, 2008
Incurred losses related to prior years of $(106,959) for the year ended December 31, 2008 comprise the following components:
| • | Net favorable development for the Company’s Bermuda/Dublin reinsurance segment of $56,384, excluding the development associated with final settlement of reserves and changes in reinsurance premium estimates described below. During the year ended December 31, 2008, a large number of contracts were adjusted to reflect either favorable or adverse development which has aggregated to produce net favorable development. Of the $56,384 of net favorable development, $47,690 was recognized on long tail lines of business on the 2006 and prior years, including $25,815 from professional liability business, principally on the 2005 and prior years. In addition, the Company had positive development of $15,129 on whole account where information from cedants is indicating better than expected results. Short tail business had $8,694 of net favorable development with $22,113 of the favorable development on property reinsurance, primarily from the 2007 year, offset by adverse development of $13,493 on marine and energy lines. This adverse development originated primarily from one marine contract which covered a number of separate individual risk losses at the end of 2007; |
| • | The final settlement of prior period reinsurance reserves on a number of contracts resulting in a net favorable development of $11,738 and net paid losses related to prior years of $32,194; |
F-35
Table of Contents
MAX CAPITAL GROUP LTD.
Notes to Consolidated Financial Statements—(Continued)
December 31, 2009, 2008 and 2007
(Expressed in thousands of U.S. Dollars,
except per share amounts)
7. Property and casualty losses and loss adjustment expenses—(Continued)
| • | Net favorable development of $17,025 arising from reductions in reinsurance premium estimates; |
| • | Net favorable development for the Company’s Bermuda/Dublin insurance segment of $22,644 arising from the re-estimation of liabilities principally relates to the property insurance line of business; and |
| • | Premium adjustments on the Company’s insurance business resulted in adverse development of $832 which was offset by an increase in earned premium during the year. |
Year ended December 31, 2007
Incurred losses related to prior years of $(63,752) for the year ended December 31, 2007 comprise the following components:
| • | The settlement of a large block of prior period reinsurance reserves resulting in a net favorable development of $15,200 and net paid losses related to prior years of $131,888; |
| • | Favorable development of $13,000 on one alternative risk reinsurance contract where reserves were released based on updated information received from a client. Due to contractual features requiring additional premiums and interest thereon in the event of additional losses in excess of pre-determined thresholds, an offsetting decrease in additional premium was recorded and earned in the amount of $15,208; |
| • | Adverse development of $20,031 on a marine reinsurance quota share contract that had losses in relation to the 2005 hurricanes. As a result of this development the contract has reached the aggregate limit; |
| • | Favorable development of $5,637 arising from changes in reinsurance premium estimates; |
| • | The net favorable loss development for the Company’s Bermuda/Dublin reinsurance segment of $41,123, excluding the development described above, arising from the re-estimation of liabilities is the result of the quarterly and annual actuarial review process. During the year ended December 31, 2007, a large number of contracts were adjusted to reflect either favorable or adverse development which has aggregated to produce net favorable development. There were no individual contracts or lines of business with significant development. Marine, medical malpractice, professional liability and workers compensation all had between $5,000 and $10,000 in favorable development, with most other lines of business having between $nil and $5,000 in favorable development; and |
| • | The net favorable loss development for the Company’s Bermuda/Dublin insurance segment of $8,823 arising from the re-estimation of liabilities principally relates to property contracts which had exposure to the 2005 hurricanes. |
F-36
Table of Contents
MAX CAPITAL GROUP LTD.
Notes to Consolidated Financial Statements—(Continued)
December 31, 2009, 2008 and 2007
(Expressed in thousands of U.S. Dollars,
except per share amounts)
7. Property and casualty losses and loss adjustment expenses —(Continued)
Included in deposit liabilities is $95,727 (2008—$159,185) related to reinsurance contracts that do not transfer sufficient risk to be accounted for as reinsurance.
8. Life and annuity benefits
The Company enters into long duration contracts that subject the Company to mortality, longevity and morbidity risks and which are accounted for as life and annuity premiums earned. Future life and annuity benefit reserves are established using appropriate assumptions for investment yields, mortality, morbidity, lapse and expenses, including a provision for adverse deviation. The Company establishes and reviews its life and annuity reinsurance reserves regularly based upon cash flow projection models utilizing data provided by clients and actuarial models. The Company establishes and maintains its life and annuity reinsurance reserves at a level that the Company estimates will, when taken together with future premium payments and investment income expected to be earned on associated premiums, be sufficient to support all future cash flow benefit and third party servicing obligations as they become payable. The assumptions used to determine policy benefit reserves are best estimate assumptions that are determined at the inception of the contracts and are locked-in throughout the life of the contract unless a premium deficiency develops. The Company establishes these estimates based upon transaction specific historical experience, information provided by the ceding company and industry experience studies. Actual results could differ materially from these estimates. As the experience on the contracts emerges, the assumptions are reviewed by management. The Company determines whether actual and anticipated experience indicates that existing policy reserves, together with the present value of future gross premiums, are sufficient to cover the present value of future benefits, settlement and maintenance costs and to recover unamortized acquisition costs. If such a review produces reserves in excess of those currently held then the lock-in assumptions are revised and a life and annuity benefit is recognized at that time. The average reserve valuation rate for the life and annuity benefit reserves is 5.0% and 5.0% as at December 31, 2009 and 2008, respectively.
The assumptions used to determine claim reserves are best estimate assumptions and are reviewed no less than annually. The assumptions are un-locked if they result in a material change. The Company establishes these assumptions based upon transaction specific historical experience, information provided by the ceding company and industry experience studies. Actual results could differ materially from these estimates.
Life and annuity benefits at December 31, 2009 and 2008 were as follows:
| 2009 | 2008 | |||||
| Life |
$ | 129,201 | $ | 131,652 | ||
| Annuities |
1,108,067 | 1,080,691 | ||||
| Accident and health |
135,245 | 154,633 | ||||
| $ | 1,372,513 | $ | 1,366,976 | |||
As at December 31, 2009 and 2008, the largest life and annuity benefits reserve for a single client were 36.0% and 37.0% of the total, respectively.
F-37
Table of Contents
MAX CAPITAL GROUP LTD.
Notes to Consolidated Financial Statements—(Continued)
December 31, 2009, 2008 and 2007
(Expressed in thousands of U.S. Dollars,
except per share amounts)
8. Life and annuity benefits—(Continued)
Losses recoverable relating to life and annuity contracts of $36,556 in 2009 (2008—$36,509) are included in losses and benefits recoverable from reinsurers in the accompanying consolidated balance sheets.
No annuities included in life and annuity benefits in the accompanying consolidated balance sheets are subject to discretionary withdrawal. Included in deposit liabilities at December 31, 2009 are annuities of $3,479 (2008—$4,062), which are subject to discretionary withdrawal. Deposit liabilities also include $44,307 (2008—$46,794) representing the account value of a universal life reinsurance contract.
9. Reinsurance
The Company utilizes quota share reinsurance and retrocession agreements principally to allow the Company to provide additional underwriting capacity to clients while reducing the net liability on the portfolio of risks. The Company also utilizes excess of loss reinsurance to protect against single large events, including natural catastrophes. The Company’s reinsurance and retrocession agreements provide for recovery of a portion of losses and benefits from reinsurers. Losses and benefits recoverable from reinsurers are recorded as assets. Losses and benefits expenses are net of losses and benefits recoveries of $241,208 in 2009 (2008—$222,973; 2007—$134,184) under these agreements.
At December 31, 2009, 83.6% of losses recoverable were with reinsurers rated “A” or above by A.M. Best Company and 5.3% are rated “A-”. Grand Central Re, a Bermuda domiciled reinsurance company in which Max Bermuda has a 7.5% equity investment, is the largest “NR—not rated” retrocessionaire and accounted for 10.1% of losses recoverable at December 31, 2009. As security for outstanding loss obligations, the Company retains funds from Grand Central Re amounting to 108.0% of its loss recoverable obligations. The remaining 1.0% of losses recoverable are with “B+” rated or lower reinsurers.
The effect of reinsurance and retrocessional activity on premiums written and earned for the years ended December 31, 2009, 2008 and 2007 was as follows:
| Property and |
Premiums written | Premiums earned | ||||||||||||||||||||||
| 2009 | 2008 | 2007 | 2009 | 2008 | 2007 | |||||||||||||||||||
| Direct |
$ | 759,567 | $ | 592,565 | $ | 431,169 | $ | 720,387 | $ | 501,915 | $ | 415,764 | ||||||||||||
| Assumed |
571,679 | 419,509 | 345,156 | 554,807 | 426,157 | 356,448 | ||||||||||||||||||
| Ceded |
(480,068 | ) | (413,523 | ) | (281,162 | ) | (484,180 | ) | (356,214 | ) | (255,734 | ) | ||||||||||||
| Net |
$ | 851,178 | $ | 598,551 | $ | 495,163 | $ | 791,014 | $ | 571,858 | $ | 516,478 | ||||||||||||
| Life and |
Premiums written | Premiums earned | ||||||||||||||||||||||
| 2009 | 2008 | 2007 | 2009 | 2008 | 2007 | |||||||||||||||||||
| Assumed |
$ | 43,755 | $ | 242,176 | $ | 301,961 | $ | 43,755 | $ | 242,176 | $ | 301,961 | ||||||||||||
| Ceded |
(413 | ) | (524 | ) | (534 | ) | (413 | ) | (524 | ) | (534 | ) | ||||||||||||
| Net |
$ | 43,342 | $ | 241,652 | $ | 301,427 | $ | 43,342 | $ | 241,652 | $ | 301,427 | ||||||||||||
| Total |
$ | 894,520 | $ | 840,203 | $ | 796,590 | $ | 834,356 | $ | 813,510 | $ | 817,905 | ||||||||||||
F-38
Table of Contents
MAX CAPITAL GROUP LTD.
Notes to Consolidated Financial Statements—(Continued)
December 31, 2009, 2008 and 2007
(Expressed in thousands of U.S. Dollars,
except per share amounts)
10. Derivative Instruments
The Company recognizes all derivative instruments as either assets or liabilities in the consolidated balance sheets and measures them at fair value. The Company participates from time to time in equity index derivative instruments to mitigate financial risks, principally arising from investment holdings. The Company also holds convertible bond securities within its available for sale fixed maturity portfolio.
As at December 31, 2009, the Company held $35,011 in fair value of convertible bond securities, including the fair value of the equity call options embedded therein. A convertible bond is a debt instrument that can be converted into a predetermined amount of the issuer’s equity at certain times prior to the bond maturity. The Company purchases convertible bond securities for their total return potential not the specific call option feature. The equity call option is an embedded derivative which is recorded at fair value with changes in fair value recognized in net realized and unrealized gains and losses on investments in the consolidated statements of income and comprehensive income. These derivative instruments are not designated as hedging instruments. The fair value of the embedded call options is estimated by determining the fair value of the convertible bond with and without the call option, the difference being the estimated fair value of the call option. The fair value of the convertible bond with the call option is determined using a matrix pricing methodology as described in Note 4. The fair value of the convertible bond without the call option is estimated using an option adjusted spread model using observable inputs for similar securities. The host instrument is classified within available for sale fixed maturity investments and the derivative asset within other assets in the consolidated balance sheets.
On April 23, 2009, the Company closed the derivative positions it had previously held in equity futures contracts denominated in U.S. dollars, Japanese yen, and Canadian dollars, for which the primary purpose was to manage the Company’s economic exposure to changes in the fair value of hedge fund redemptions requested but not yet received. These derivative instruments were not designated as hedging instruments. The Company records changes in the fair value of these instruments within net realized and unrealized gains and losses on investments in the consolidated statements of income and comprehensive income. These derivatives were exchange-traded and their fair value was measured based on the later of the final traded price or the mid-point of the last bid-ask spread on the measurement date. The fair value of these derivatives was included within other investments in the consolidated balance sheets.
The fair values of derivative instruments at December 31, 2009 were:
| Asset Derivatives | Liability Derivatives | |||||||||
| Derivatives not designated as hedging |
Balance Sheet Location |
Fair Value |
Balance Sheet Location |
Fair Value | ||||||
| Convertible bond equity call options |
Other assets | $ | 3,224 | — | $ | — | ||||
| Total derivatives |
$ | 3,224 | $ | — | ||||||
F-39
Table of Contents
MAX CAPITAL GROUP LTD.
Notes to Consolidated Financial Statements—(Continued)
December 31, 2009, 2008 and 2007
(Expressed in thousands of U.S. Dollars,
except per share amounts)
10. Derivative Instruments—(Continued)
The fair values of derivative instruments at December 31, 2008 were:
| Asset Derivatives | Liability Derivatives | |||||||||
| Derivatives not designated as |
Balance Sheet Location |
Fair Value |
Balance Sheet Location |
Fair Value | ||||||
| Equity futures contracts |
Other investments | $ | 15,770 | — | $ | — | ||||
| Total derivatives |
$ | 15,770 | $ | — | ||||||
The impact of derivative instruments on the consolidated statement of income and comprehensive income for the years ended December 31, 2009, 2008 and 2007 was as follows:
| Derivatives not designated as |
Location of Gain or (Loss) Recognized |
2009 Amount of Gain or (Loss) Recognized in Income on Derivative |
2008 Amount of Gain or (Loss) Recognized in Income on Derivative |
2007 Amount of Gain or (Loss) Recognized in Income on Derivative | ||||||||
| Convertible bond equity call options |
Net realized and unrealized gains and losses on investments | $ | 776 | $ | — | $ | — | |||||
| Equity futures contracts(1) |
Net realized and unrealized gains and losses on investments | 8,112 | 22,226 | — | ||||||||
| Hurricane index-linked contracts |
Other income | — | (664 | ) | — | |||||||
| Total derivatives |
$ | 8,888 | $ | 21,562 | $ | — | ||||||
| (1) | Gains recognized on the equity futures contracts in the years ended December 31, 2009 and December 31, 2008 are reported within the change in fair value of other investments. |
11. Bank Loans
In February 2003, the Company sold shares of its subsidiary, Max Diversified Strategies Ltd. (“Max Diversified”) to a third party financial institution (the “Bank”) for a fair value of $150,000 (the “notional amount”). Simultaneous with the sale, the Company entered into a total return swap with the Bank whereby the Company received the return earned on the Max Diversified shares in exchange for the payment of a variable rate of interest based on LIBOR plus a spread. The non-controlling interest in Max Diversified and the total return swap were recorded on a combined basis and accounted for as a financing transaction. The effect of combining the transactions resulted in the notional amount being presented as a bank loan (the “swap loan”).
The swap transaction contained provisions for earlier termination at the Company’s option or in the event that the Company failed to comply with certain covenants, including maintaining a minimum financial strength rating and a minimum Max Diversified net asset value.
On August 31, 2009, the Company entered into a termination agreement with the Bank in connection with the total return swap and the sale of Max Diversified shares to the Bank. On termination of the swap, the Company repurchased all of the remaining shares held by the Bank. The balance of the swap loan was $225,000 at December 31, 2008,
F-40
Table of Contents
MAX CAPITAL GROUP LTD.
Notes to Consolidated Financial Statements—(Continued)
December 31, 2009, 2008 and 2007
(Expressed in thousands of U.S. Dollars,
except per share amounts)
11. Bank Loans—(Continued)
$120,000 of which was repaid during the first quarter of 2009 and the remaining $105,000 was repaid during the third quarter of 2009.
At December 31, 2008 the net amount payable included in accounts payable under the total return swap was $14,896. Interest expense on the notional amount is included within interest expense on the consolidated statements of income and comprehensive income. For the years ended December 31, 2009, 2008 and 2007, the interest expense on the swap loan was $1,956, $11,472 and $15,886, respectively. Investment income earned on the invested proceeds of the swap loan for the years ended December 31, 2009, 2008 and 2007, was approximately $3,231, $11,340 and $12,601 respectively.
On April 3, 2007, the Company borrowed $50,000 under its revolving loan facility for the capitalization of Max USA. This loan renewed at intervals of one to six months at the Company’s option, at which time the interest rate was reset to LIBOR plus a premium based on the Company’s current debt rating. On April 9, 2009, this loan was repaid in full. On October 20, 2008, the Company borrowed an additional $100,000 under the revolving loan facility, at an interest rate of 4.63%. Proceeds of this loan were used in connection with the acquisition and capitalization of Max UK. This loan was repaid in full on April 20, 2009.
Interest expense in connection with these loans was $2,041, $3,029 and $2,591 for the years ended December 31, 2009, 2008 and 2007, respectively.
12. Senior notes
On April 16, 2007, Max USA privately issued $100,000 principal amount of 7.20% senior notes, due April 14, 2017 with interest payable on April 16 and October 16 of each year. The senior notes are Max USA’s senior unsecured obligations and rank equally in right of payment with all existing and future senior unsecured indebtedness of Max USA. The senior notes are fully and unconditionally guaranteed by Max Capital. The effective interest rate related to the senior notes, based on the net proceeds received, was approximately 7.27%. The net proceeds from the sale of the senior notes were $99,497, and they were used to repay a bank loan used to acquire and capitalize Max Specialty. On December 30, 2008, Max USA repurchased $8,456 principal amount of its senior notes for $6,173, recognizing a gain of $2,245, net of deferred issuance costs. On December 10, 2009, Max USA repurchased $915 principal amount of its senior notes for $801, recognizing a gain of $111, net of deferred issuance costs.
The fair value of the senior notes was $75,929 as of December 31, 2009, measured based on an independent pricing service using a matrix pricing methodology. Interest expense in connection with these senior notes was $6,641, $7,200 and $5,100 for the years ended December 31, 2009, 2008 and 2007, respectively.
13. Pension and deferred compensation plans
The Company provides pension benefits to eligible employees and their dependents through various defined contribution plans, which vary for each subsidiary. Under these plans, the Company and its employees each contribute a certain percentage of the employee’s gross salary into the plan each month. The Company’s contributions are immediately 100% vested. Pension expenses totaled $4,486 for the year ended December 31, 2009 (2008—$4,904; 2007—$2,626).
F-41
Table of Contents
MAX CAPITAL GROUP LTD.
Notes to Consolidated Financial Statements—(Continued)
December 31, 2009, 2008 and 2007
(Expressed in thousands of U.S. Dollars,
except per share amounts)
14. Shareholders’ equity
Common Shares
The holders of common shares are entitled to one vote per paid up share subject to certain provisions of the Company’s bye-laws that reduce the total voting power of any U.S. shareholder owning, directly or indirectly, beneficially or otherwise to less than 9.5% of total voting power of our capital stock unless waived by the board of directors.
Max Capital’s board of directors declared the following dividends during 2009:
| Date Declared |
Dividend per share | Dividend to be paid to shareholders of record on |
Payable on | ||||
| November 3, 2009 |
$ | 0.10 | November 16, 2009 | November 30, 2009 | |||
| August 4, 2009 |
$ | 0.10 | August 18, 2009 | September 1, 2009 | |||
| May 4, 2009 |
$ | 0.09 | May 18, 2009 | June 1, 2009 | |||
| February 10, 2009 |
$ | 0.09 | February 24, 2009 | March 10, 2009 | |||
During the year ended December 31, 2009, the Company repurchased 1,543,571 common shares at an average price of $22.24 per common share for a total amount of $34,321 including the costs incurred to effect the repurchases. At December 31, 2009, the remaining authorization under the Company’s share repurchase program was $35,515.
Warrants
In connection with the issuance of certain shares, the Company has issued warrants to purchase the Company’s common shares. The warrants may be exercised at any time up to their expiration dates, which range from March 31, 2010 to August 17, 2011. Warrants are issued with exercise prices approximating their fair value on the date of issuance.
Warrant related activity is as follows:
| Warrants Outstanding |
Warrants Exercisable |
Weighted Average Exercise Price |
Weighted Average Fair Value |
Range of Exercise Prices | ||||||||||
| Balance, December 31, 2007 |
7,730,974 | 7,730,974 | $ | 15.31 | $ | 5.76 | $ | 15.00-$18.00 | ||||||
| Warrants exercised |
(2,987,849 | ) | $ | 15.28 | $ | 5.76 | $ | 15.00-$18.00 | ||||||
| Warrants forfeited |
(8,000 | ) | $ | 15.63 | $ | 5.79 | $ | 15.00-$16.00 | ||||||
| Balance, December 31, 2008 |
4,735,125 | 4,735,125 | $ | 15.33 | $ | 5.75 | $ | 15.00-$18.00 | ||||||
| Warrants exercised |
(2,438,655 | ) | $ | 15.01 | $ | 5.90 | $ | 15.00-$16.00 | ||||||
| Balance, December 31, 2009 |
2,296,470 | 2,296,470 | $ | 15.67 | $ | 5.60 | $ | 15.00-$18.00 | ||||||
The warrants contain a “cashless exercise” provision which allows the warrant holder to surrender the warrants with notice of cashless exercise and receive a number of shares based on the market value of the Company’s shares. The cashless exercise provision will result in a lower number of shares being issued than the number of warrants exercised. The majority of warrants exercised during 2009 and 2008 were under the cashless exercise provision which resulted in 621,157 (2008—1,387,437) being issued for the exercise of 2,438,655 (2008—2,987,849) warrants.
F-42
Table of Contents
MAX CAPITAL GROUP LTD.
Notes to Consolidated Financial Statements—(Continued)
December 31, 2009, 2008 and 2007
(Expressed in thousands of U.S. Dollars,
except per share amounts)
15. Stock incentive plans
At the May 5, 2008 Annual General Meeting of shareholders, Max Capital’s shareholders approved the adoption of the 2008 Stock Incentive Plan (the “2008 Incentive Plan”) under which the Company may award, subject to certain restrictions, Incentive Stock Options (“ISOs”), Non-Qualified Stock Options (“NQSOs”), restricted stock, restricted stock units, share awards or other awards. Only eligible employees of the Company are entitled to ISOs, while NQSOs may be awarded to eligible employees, non-employee directors and consultants. The 2008 Incentive Plan is administered by the Compensation Committee of the board of directors (the “Committee”).
Prior to adoption of the 2008 Incentive Plan, the Company made awards of equity compensation under a Stock Incentive Plan approved by the shareholders in June 2000, and amended in each of May 2002 and April 2005 (the “2000 Incentive Plan,” and together with the 2008 Incentive Plan, the “Incentive Plans”). Effective upon the adoption of the 2008 Incentive Plan, unused shares from the 2000 Incentive Plan became unavailable for future awards and instead are used only to fulfill obligations from outstanding option, restricted stock unit awards or reload obligations pursuant to grants originally made under the 2000 Incentive Plan.
Options that have been granted under the 2000 Incentive Plan or that may be granted under the 2008 Incentive Plan have an exercise price equal to or greater than the fair market value of Max Capital’s common shares on the date of grant and have a maximum ten-year term. The fair value of awards granted under the Incentive Plans are measured as of the grant date and expensed ratably over the vesting period of the award. All awards provide for accelerated vesting upon a change in control of Max Capital, subject to certain conditions. Shares issued under the Incentive Plans are made available from authorized but unissued shares.
The Company has considered expected forfeitures and awards granted to retirement-eligible employees in the determination of stock-based compensation expense and they did not have a material effect on operating results during the year.
The Company granted 108,333, 32,725 and 101,081 stock options for the years ended December 31, 2009, 2008 and 2007, respectively. The fair value of options granted is estimated on the date of grant using the Black-Scholes option pricing method with the following weighted average assumptions:
| 2009 | 2008 | 2007 | |||||||
| Option valuation assumptions: |
|||||||||
| Expected option life |
7 years | 3 years | 7 years | ||||||
| Expected dividend yield |
2.32 | % | 1.78 | % | 1.48 | % | |||
| Expected volatility |
34.3 | % | 21.90 | % | 21.54 | % | |||
| Risk-free interest rate |
2.99 | % | 4.31 | % | 4.66 | % | |||
| Forfeiture rate |
0 | % | 0 | % | 0 | % |
The Company recognized $672, $580 and $2,886 of stock-based compensation expense related to stock option awards for the years ended December 31, 2009, 2008 and 2007, respectively. The Company did not capitalize any cost of stock-based option award compensation. As of December 31, 2009, the total compensation cost related to non-vested stock option awards not yet recognized was $624, which is expected to be recognized over a weighted average period of 1.0 years.
F-43
Table of Contents
MAX CAPITAL GROUP LTD.
Notes to Consolidated Financial Statements—(Continued)
December 31, 2009, 2008 and 2007
(Expressed in thousands of U.S. Dollars,
except per share amounts)
15. Stock incentive plans—(Continued)
Total intrinsic value of stock options exercised during the years ended December 31, 2009, 2008 and 2007 was $597, $2,358 and $5,000, respectively. The intrinsic value of stock options outstanding at December 31, 2009 is $4,943 (vested options—$4,504).
A summary of the 2000 Incentive Plan related activity follows:
| Awards Available for Grant |
Options Outstanding |
Options Exercisable |
Weighted Average Exercise Price |
Fair Value of Options |
Range of Exercise Prices | ||||||||||||
| Balance, December 31, 2006 |
2,141,390 | 2,551,333 | 1,692,204 | $ | 19.82 | $ | 5.85 | $ | 10.26-$36.26 | ||||||||
| Options granted |
(101,081 | ) | 101,081 | $ | 27.00 | $ | 6.00 | $ | 24.40-$32.82 | ||||||||
| Options exercised |
— | (466,665 | ) | $ | 15.01 | $ | 10.26-$19.48 | ||||||||||
| Restricted stock units granted |
(295,232 | ) | — | ||||||||||||||
| Restricted stock granted |
(707,439 | ) | — | ||||||||||||||
| Restricted stock forfeited |
19,690 | — | |||||||||||||||
| Balance, December 31, 2007 |
1,057,328 | 2,185,749 | 1,560,310 | $ | 21.18 | $ | 6.04 | $ | 10.95-$36.26 | ||||||||
| Options granted |
(32,725 | ) | 32,725 | $ | 24.62 | $ | 4.46 | $ | 23.24-$27.97 | ||||||||
| Options exercised |
— | (351,154 | ) | $ | 15.60 | $ | 11.50-$18.00 | ||||||||||
| Options forfeited |
— | (24,057 | ) | $ | 25.97 | $ | 11.19-$27.97 | ||||||||||
| Restricted stock units granted |
(148,527 | ) | — | ||||||||||||||
| Restricted stock granted |
(792,338 | ) | — | ||||||||||||||
| Restricted stock forfeited |
125,765 | — | |||||||||||||||
| Closure of 2000 Incentive Plan |
(209,503 | ) | — | ||||||||||||||
| Balance, December 31, 2008 |
— | 1,843,263 | 1,413,346 | $ | 22.24 | $ | 6.13 | $ | 10.95-$36.26 | ||||||||
| Options exercised |
— | (107,125 | ) | $ | 14.68 | $ | 4.94 | $ | 11.50-$16.00 | ||||||||
| Options forfeited |
— | (110,333 | ) | $ | 24.47 | $ | 7.14 | $ | 23.25-$24.49 | ||||||||
| Balance, December 31, 2009 |
— | 1,625,805 | 1,324,138 | $ | 22.58 | $ | 6.13 | $ | 10.95-$36.26 | ||||||||
F-44
Table of Contents
MAX CAPITAL GROUP LTD.
Notes to Consolidated Financial Statements—(Continued)
December 31, 2009, 2008 and 2007
(Expressed in thousands of U.S. Dollars,
except per share amounts)
15. Stock incentive plans—(Continued)
A summary of the 2008 Incentive Plan related activity follows:
| Awards Available for Grant |
Options Outstanding |
Options Exercisable |
Weighted Average Exercise Price |
Fair Value of Options |
Range of Exercise Prices | |||||||||||
| Balance, December 31, 2007 |
— | — | — | $ | — | $ | — | $ | — | |||||||
| Increase in shares available |
4,500,000 | — | ||||||||||||||
| Restricted stock granted |
(149,091 | ) | — | |||||||||||||
| Balance, December 31, 2008 |
4,350,909 | — | — | $ | — | $ | — | $ | — | |||||||
| Options granted |
(108,333 | ) | 108,333 | $ | 18.25 | $ | 6.01 | $ | 18.25 | |||||||
| Restricted stock issued |
(737,000 | ) | — | |||||||||||||
| Restricted stock forfeited |
33,955 | — | ||||||||||||||
| Restricted stock units granted |
(142,604 | ) | — | |||||||||||||
| Balance, December 31, 2009 |
3,396,927 | 108,333 | — | $ | 18.25 | $ | 6.01 | $ | 18.25 | |||||||
Restricted Stock Awards
Restricted stock and restricted stock units (“RSUs”) issued under the Incentive Plans have terms set by the Committee. These shares and RSUs contain certain restrictions relating to, among other things, vesting, forfeiture in the event of termination of employment and transferability. The dividends paid on the restricted stock are not forfeited by the employee if the employee’s employment terminated prior to vesting. Restricted stock awards are valued equal to the market price of the Company’s common stock on the date of grant. At the time of grant, the fair value of the shares and RSUs awarded is recorded as unearned stock grant compensation. The unearned compensation is charged to income over the vesting period. Generally, restricted stock awards vest after three or four years. Total compensation cost recognized for restricted stock awards recorded in general and administrative expenses was $19,927, $19,584 and $14,894 for the years ended December 31, 2009, 2008 and 2007, respectively.
F-45
Table of Contents
MAX CAPITAL GROUP LTD.
Notes to Consolidated Financial Statements—(Continued)
December 31, 2009, 2008 and 2007
(Expressed in thousands of U.S. Dollars,
except per share amounts)
15. Stock incentive plans—(Continued)
A summary of the Company’s non-vested restricted stock awards as of December 31, 2008, and changes during the year ended December 31, 2009, follows:
| Non-vested Restricted Stock |
Weighted-Average Grant-Date Fair Value |
Non-vested RSUs |
Weighted-Average Grant-Date Fair Value | |||||||||
| Balance, December 31, 2008 |
2,121,067 | $ | 25.59 | 347,759 | $ | 26.32 | ||||||
| Restricted stock awards granted |
737,000 | $ | 18.38 | 142,604 | $ | 18.40 | ||||||
| Restricted stock awards vested |
(535,227 | ) | $ | 24.96 | (83,849 | ) | $ | 25.30 | ||||
| Restricted stock awards forfeited |
(96,029 | ) | $ | 22.39 | — | — | ||||||
| Balance, December 31, 2009 |
2,226,811 | $ | 23.49 | 406,514 | $ | 23.75 | ||||||
The weighted average vesting period for non-vested restricted stock is 1.2 years and 1.4 years at December 31, 2009 and 2008, respectively. The weighted average vesting period for non-vested RSUs is 1.2 years and 1.3 years at December 31, 2009 and 2008, respectively.
Employee Stock Purchase Plan
On July 1, 2008, the Company introduced an employee stock purchase plan (or “ESPP”). The ESPP gives participating employees the right to purchase common shares of Max Capital through payroll deductions during consecutive “Subscription Periods.” The Subscription Periods run from January 1 to June 30, and from July 1 to December 31 each year. Annual purchases by participants are limited to the number of whole shares that can be purchased by an amount equal to ten percent of the participant’s compensation or $25, whichever is less. The amounts that have been collected from participants during a Subscription Period are used on the “Exercise Date” to purchase full shares of common shares. An Exercise Date is generally the last trading day of a Subscription Period. The number of shares purchased is equal to the total amount, as of the Exercise Date, that has been collected from the participants through payroll deductions for that Subscription Period, divided by the “Purchase Price,” rounded down to the next full share. The Purchase Price is calculated as the lower of (i) 85 percent of the fair market value of a common share on the first day of the Subscription Period, or (ii) 85 percent of the fair market value of a common share on the Exercise Date. Participants may withdraw from an offering before the Exercise Date and obtain a refund of the amounts withheld through payroll deductions. Pursuant to the provisions of the ESPP employees paid $822 to purchase 52,367 shares during 2009 and employees paid $424 to purchase 26,594 shares during 2008. The Company recorded an expense for ESPP of $308 and $84 for the years ended December 31, 2009 and 2008, respectively.
F-46
Table of Contents
MAX CAPITAL GROUP LTD.
Notes to Consolidated Financial Statements—(Continued)
December 31, 2009, 2008 and 2007
(Expressed in thousands of U.S. Dollars,
except per share amounts)
16. Taxation
Max Capital and Max Bermuda are incorporated in Bermuda, and pursuant to Bermuda law are not taxed on either income or capital gains. They have each received an assurance from the Bermuda Minister of Finance under the Exempted Undertaking Tax Protection Act, 1966 of Bermuda that if there is enacted in Bermuda any legislation imposing tax computed on profits or income, or computed on any capital asset, gain or appreciation, then the imposition of any such tax will not be applicable until March 2016. The Company’s subsidiaries that are based in the United States, Ireland and the United Kingdom are subject to the tax laws of those jurisdictions and the jurisdictions in which they operate. The tax years open to examination by national tax authorities are 2006 to the present for the U.S. subsidiaries, 2005 to the present for the Irish subsidiaries, and 2008 to the present for the U.K. subsidiaries.
For the years ended December 31, 2009, 2008 and 2007, the Company did not record any unrecognized tax benefits or expenses. The Company has not recorded any interest or penalties during the years ended December 31, 2009, 2008 and 2007 and has no uncertain tax positions as at December 31, 2009 and 2008.
The Company records income taxes based on the enacted tax laws and rates applicable in the relevant jurisdictions for each of the years ended December 31, 2009, 2008 and 2007. Interest and penalties related to uncertain tax positions, of which there have been none, would be recognized in income tax expense.
The components of income taxes attributable to operations for the years ended December 31, 2009, 2008 and 2007 were as follows:
| 2009 | 2008 | 2007 | ||||||||||
| Current expense: |
||||||||||||
| United States |
$ | 20 | $ | 57 | $ | — | ||||||
| Ireland |
2,018 | 292 | 1,442 | |||||||||
| United Kingdom |
1,078 | (281 | ) | — | ||||||||
| 3,116 | 68 | 1,442 | ||||||||||
| Deferred expense (benefit): |
||||||||||||
| United States |
— | 893 | (893 | ) | ||||||||
| Ireland |
(477 | ) | (10 | ) | (971 | ) | ||||||
| United Kingdom |
7,382 | 281 | — | |||||||||
| 6,905 | 1,164 | (1,864 | ) | |||||||||
| Income tax expense (benefit) on net income |
$ | 10,021 | $ | 1,232 | $ | (422 | ) | |||||
| Income tax expense (benefit) on net income |
$ | 10,021 | $ | 1,232 | $ | (422 | ) | |||||
| Income tax (benefit) expense on other comprehensive income |
(543 | ) | (999 | ) | 893 | |||||||
| Total income tax |
$ | 9,478 | $ | 233 | $ | 471 | ||||||
The expected tax provision computed on pre-tax income at the weighted average tax rate has been calculated as the sum of the pre-tax income in each jurisdiction multiplied by that jurisdiction’s applicable statutory tax rate. Statutory tax rates of 34%, 12.5% and 28.5%, have been used for the United States, Ireland and the United Kingdom, respectively. A
F-47
Table of Contents
MAX CAPITAL GROUP LTD.
Notes to Consolidated Financial Statements—(Continued)
December 31, 2009, 2008 and 2007
(Expressed in thousands of U.S. Dollars,
except per share amounts)
16. Taxation—(Continued)
reconciliation of the difference between the provision for income taxes and the expected tax provision at the weighted average tax rate follows:
| 2009 | 2008 | 2007 | ||||||||||
| Expected income tax (benefit) expense computed on pre-tax income at weighted average income tax rate |
$ | 11,032 | $ | (5,954 | ) | $ | (4,996 | ) | ||||
| Addition to (reduction in) income tax (benefit) expense resulting from: |
||||||||||||
| Valuation allowance on deferred tax assets |
1,889 | 5,881 | 4,680 | |||||||||
| Income tax expense (benefit) on intercompany transactions |
(5,150 | ) | 123 | (144 | ) | |||||||
| Prior year adjustment |
2,130 | 984 | (501 | ) | ||||||||
| Permanent differences |
120 | 198 | 539 | |||||||||
| Income tax expense (benefit) |
$ | 10,021 | $ | 1,232 | $ | (422 | ) | |||||
The tax effects of temporary differences that give rise to significant portions of the deferred tax provision are as follows:
| 2009 | 2008 | 2007 | ||||||||
| Deferred tax asset: |
||||||||||
| Net operating loss carryforward |
$ | 9,917 | $ | 9,332 | $ | 4,678 | ||||
| Deferred acquisition costs, net |
1,837 | 2,310 | 782 | |||||||
| Net unearned property and casualty premiums |
1,089 | 588 | 131 | |||||||
| Deferred compensation |
1,187 | 3,158 | 431 | |||||||
| Capitalized professional fees |
1,767 | 1,909 | 287 | |||||||
| Other |
949 | 911 | 5 | |||||||
| Gross deferred tax asset |
16,746 | 18,208 | 6,314 | |||||||
| Less valuation allowance |
12,449 | 10,561 | 4,680 | |||||||
| Deferred tax asset |
4,297 | 7,647 | 1,634 | |||||||
| Deferred tax liability: |
||||||||||
| Net unrealized gains on available for sale securities |
1,736 | 1,186 | 893 | |||||||
| Untaxed profits |
2,992 | — | — | |||||||
| Goodwill amortization |
1,565 | 726 | 277 | |||||||
| Other |
128 | 138 | 34 | |||||||
| Deferred tax liability |
6,421 | 2,050 | 1,204 | |||||||
| Net deferred tax (liability) asset |
$ | (2,124 | ) | $ | 5,597 | $ | 430 | |||
At December 31, 2009, 2008 and 2007, the Company has net operating loss carryforwards in its U.S. operating subsidiaries totaling $29,167, $14,607 and $13,726, respectively. Such net operating losses are currently available to offset future taxable income of the subsidiaries. Under applicable law, the U.S. net operating loss carryforwards expire between 2027 and 2029. At December 31, 2009 and 2008, the Company has net operating loss carryforwards in its U.K. operating subsidiaries totaling GBP nil and GBP 10,497 ($15,318), respectively. Under applicable law, the U.K. net operating loss carryforwards never expire.
F-48
Table of Contents
MAX CAPITAL GROUP LTD.
Notes to Consolidated Financial Statements—(Continued)
December 31, 2009, 2008 and 2007
(Expressed in thousands of U.S. Dollars,
except per share amounts)
16. Taxation—(Continued)
The Company has provided a valuation allowance to reduce certain deferred tax assets to an amount which management expects will more likely than not be realized. Adjustments to the valuation allowance are made when there is a change in management’s assessment of the amount of deferred tax assets that are realizable.
17. Related Parties
Grand Central Re Limited
In May 2001, the Company made an equity investment in Grand Central Re, a Bermuda domiciled reinsurance company managed by Max Managers Ltd. (“Max Managers”). The Company owns 7.5% of the ordinary shares of Grand Central Re. Max Bermuda entered into a quota share retrocession agreement with Grand Central Re, effective January 1, 2002, amending the quota share arrangement with Grand Central Re that commenced January 1, 2001. The 2002 quota share reinsurance agreement with Grand Central Re requires each of the Company and Grand Central Re to retrocede a portion of their respective gross premiums written from certain transactions to the other party in order to participate on a quota share basis. Max Bermuda did not cede any new business to Grand Central Re in 2009, 2008 or 2007.
The accompanying consolidated balance sheets and consolidated statements of income and comprehensive income include, or are net of, the following amounts related to the quota share retrocession agreement with Grand Central Re:
| 2009 | 2008 | 2007 | ||||||||||
| Balance Sheet |
||||||||||||
| Losses and benefits recoverable from reinsurers |
$ | 101,438 | $ | 106,203 | $ | 117,752 | ||||||
| Deposit liabilities |
15,429 | 26,273 | 28,292 | |||||||||
| Funds withheld from reinsurers |
109,626 | 137,014 | 141,206 | |||||||||
| Reinsurance balances payable |
26,385 | 24,603 | 23,025 | |||||||||
| 2009 | 2008 | 2007 | ||||||||||
| Income Statement |
||||||||||||
| Reinsurance premiums ceded |
$ | 1,933 | $ | 1,939 | $ | (387 | ) | |||||
| Earned premiums ceded |
1,933 | 1,939 | (387 | ) | ||||||||
| Other income |
800 | 800 | 800 | |||||||||
| Net losses and loss expenses |
(280 | ) | (1,307 | ) | (9,550 | ) | ||||||
| Claims and policy benefits |
4,072 | 953 | 2,601 | |||||||||
| Interest (benefit) expense |
1,861 | 9,178 | 13,919 | |||||||||
The variable quota share retrocession agreement with Grand Central Re is principally collateralized on a funds withheld basis. The rate of return on funds withheld is based on the average of two total return fixed maturity indices. The interest expense recognized by the Company will vary from period to period due to changes in the indices. The Company records the change in interest expense through the statement of income and comprehensive income on a monthly basis.
The Company believes that the terms of the insurance management and quota share retrocession agreements are comparable to the terms that the Company would expect to negotiate in similar transactions with unrelated parties.
F-49
Table of Contents
MAX CAPITAL GROUP LTD.
Notes to Consolidated Financial Statements—(Continued)
December 31, 2009, 2008 and 2007
(Expressed in thousands of U.S. Dollars,
except per share amounts)
17. Related Parties—(Continued)
Hedge Fund Managers
Alstra Capital Management, LLC (“Alstra”), an affiliate of Mr. Zack H. Bacon III, one of our directors until November 2, 2009, served as the investment advisor for Max Diversified from April 1, 2004 until January 31, 2009. Alstra received investment advisor fees of $667, $8,183 and $14,705 in 2009, 2008 and 2007, respectively. During the first quarter of 2009, the Company terminated its investment advisor agreement with Alstra, resulting in a termination fee of $1,992. The Company believes that the terms of its terminated investment advisor agreement were comparable to the terms that the Company would expect to negotiate in similar transactions with unrelated parties.
In addition, Moore Capital Management, LLC (“Moore Capital”), an affiliate of one of our significant shareholders, received aggregate management and incentive fees of $1,987, $2,802 and $6,930, respectively, in respect of Max Diversified’s assets invested in an underlying fund managed by Moore Capital during 2009, 2008 and 2007.
All investment fees incurred on the Company’s hedge funds are included in net realized and unrealized gains or losses on investments in the consolidated statements of income and comprehensive income.
18. Statutory requirements and dividend restrictions
Statutory capital and surplus for the Bermuda, Dublin and U.S operating subsidiaries of the Company for the years ended December 31, 2009 and 2008 is summarized below. The 2009 information provided is unaudited and preliminary as many regulatory returns are due later in 2010 for many jurisdictions in which the Company does business.
| Bermuda | Dublin | U.S. | ||||||||||||||||
| At December 31 |
2009 | 2008 | 2009 | 2008 | 2009 | 2008 | ||||||||||||
| Required statutory capital and surplus |
$ | 380,000 | $ | 296,246 | $ | 23,000 | $ | 21,043 | $ | 28,000 | $ | 13,829 | ||||||
| Actual statutory capital and surplus |
$ | 1,425,000 | $ | 1,221,065 | $ | 115,000 | $ | 73,917 | $ | 130,000 | $ | 147,581 | ||||||
Bermuda
Under the Bermuda Insurance Act, 1978 and related regulations, Max Bermuda is required to maintain certain levels of solvency and liquidity. The minimum statutory solvency margin required at December 31, 2009 was approximately $380,000. Actual statutory capital and surplus at December 31, 2009 was approximately $1,425,000. The principal difference between statutory capital and surplus and shareholders’ equity presented in accordance with U.S. GAAP is deferred acquisition costs, which are non-admitted assets for statutory purposes.
Max Bermuda is also required under its Class 4 license to maintain a minimum liquidity ratio whereby the value of its relevant assets is not less than 75% of the amount of its relevant liabilities for general business. Relevant assets include cash and cash equivalents, fixed maturities, other investments, accrued interest income, premiums receivable, losses recoverable from reinsurers and funds withheld. The relevant liabilities are total general business insurance reserves and total other liabilities, less sundry liabilities. As of December 31, 2009, the Company met the minimum liquidity ratio requirement.
F-50
Table of Contents
MAX CAPITAL GROUP LTD.
Notes to Consolidated Financial Statements—(Continued)
December 31, 2009, 2008 and 2007
(Expressed in thousands of U.S. Dollars,
except per share amounts)
18. Statutory requirements and dividend restrictions—(Continued)
Ireland
Under the Irish Insurance Acts 1909 to 2000, regulations made under those Acts, and regulations relating to insurance and reinsurance business made under the European Communities Act, 1972 and directions issued under those regulations, Max Insurance Europe Limited and Max Re Europe Limited are required to maintain technical reserves and a minimum solvency margin. As of December 31, 2009, Max Insurance Europe Limited and Max Re Europe Limited maintain sufficient technical reserves and met the minimum solvency margin requirement.
United States
Max Specialty and Max America file financial statements prepared in accordance with statutory accounting practices prescribed or permitted by U.S. insurance regulators. Statutory net income and statutory surplus, as reported to the insurance regulatory authorities, differ in certain respects from the amounts prepared in accordance with U.S. GAAP. The main differences between statutory net income and U.S. GAAP net income relate to deferred acquisition costs and deferred income taxes. In addition to deferred acquisition costs and deferred income tax assets, other differences between statutory surplus and U.S. GAAP shareholders’ equity are unrealized appreciation or decline in value of investments and non-admitted assets. As of December 31, 2009, Max Specialty and Max America maintain sufficient statutory surplus and met the minimum solvency margin requirements.
United Kingdom and Lloyds
The Company’s corporate members of Lloyd’s and the Syndicates are subject to regulation by the Council of Lloyd’s. The Syndicates are also subject to regulation by the U.K. Financial Services Authority under the Financial Services and Markets Act 2000. The Company’s corporate members are bound by the rules of the Society of Lloyd’s, which are prescribed by Byelaws and Requirements made by the Council of Lloyd’s under powers conferred by the Lloyd’s Act 1982. These rules prescribe the Company’s corporate members’ membership subscription, the level of their contribution to the Lloyd’s Central Fund and the assets they must deposit with Lloyd’s in support of their underwriting. The Council of Lloyd’s has broad powers to sanction breaches of its rules, including the power to restrict or prohibit a member’s participation on Lloyd’s syndicates.
The amount which the Company provides as Funds at Lloyd’s, (“FAL”) is not available for distribution to the Company for the payment of dividends. The Company’s corporate members may also be required to maintain funds under the control of Lloyd’s in excess of their capital requirements and such funds also may not be available for distribution to the Company for the payment of dividends. Lloyd’s sets the corporate members’ required capital annually based on the Syndicates’ business plans, rating environment, reserving environment together with input arising from Lloyd’s discussions with, inter alia, regulatory and rating agencies. Such FAL may comprise: cash, investments and undrawn letters of credit provided by various banks. The amounts of cash, investments and letters of credit at December 31, 2009 amount to GBP 63,623 ($102,878).
F-51
Table of Contents
MAX CAPITAL GROUP LTD.
Notes to Consolidated Financial Statements—(Continued)
December 31, 2009, 2008 and 2007
(Expressed in thousands of U.S. Dollars,
except per share amounts)
18. Statutory requirements and dividend restrictions—(Continued)
Dividends
The Company’s ability to pay dividends is dependent on the ability of the subsidiaries to pay dividends. The subsidiaries are subject to certain regulatory restrictions on the payment of dividends. The payment of such dividends is limited by applicable regulations and statutory requirements of Bermuda, Ireland, the United Kingdom and the United States. Max Bermuda, Max Insurance Europe Limited and Max Re Europe Limited are prohibited from declaring or paying a dividend if such payment would reduce their respective regulatory capital below the required minimum as required by law and regulatory practice. The laws of the domicile state of Delaware and Indiana govern the amount of dividends that may be paid by Max Specialty and Max America, respectively. Under Lloyd’s regulations, funds which are required to be held or retained by the Syndicates may not be paid as dividends. Max Bermuda and Max UK are also subject to certain restrictions under their respective credit facilities that affect their ability to pay dividends to the Company. The Company paid dividends of $0.38 per share in 2009 compared to $0.36 per share and $0.32 per share during 2008 and 2007, respectively.
19. Earnings per share
Basic earnings per share is based on weighted average common shares outstanding and excludes any dilutive effect of warrants, options and convertible securities. Diluted earnings per share assumes the conversion of dilutive convertible securities and the exercise of all dilutive stock warrants and options.
In the first quarter of 2009, the Company adopted a new accounting standard (in accordance with ASC 260-10-45) which requires share based compensation awards that qualify as participating securities to be included in basic earnings per share using the two-class method. A share based compensation award is considered a participating security if it receives non-forfeitable dividends. The pronouncement became effective for fiscal years beginning after December 15, 2008 and interim periods within those years. All prior-period earnings per share data presented are adjusted retroactively to conform to the pronouncement. The adoption resulted in no change to earnings per share as previously reported for the year ended December 31, 2008.
F-52
Table of Contents
MAX CAPITAL GROUP LTD.
Notes to Consolidated Financial Statements—(Continued)
December 31, 2009, 2008 and 2007
(Expressed in thousands of U.S. Dollars,
except per share amounts)
19. Earnings per share—(Continued)
The following table sets forth the computation of basic and diluted earnings per share for the years ended December 31, 2009, 2008 and 2007.
| 2009 | 2008 | 2007 | ||||||||
| Basic earnings per share: |
||||||||||
| Net income (loss) |
$ | 246,215 | $ | (175,318 | ) | $ | 303,249 | |||
| Weighted average common shares outstanding—basic |
57,006,908 | 56,565,588 | 59,892,414 | |||||||
| Basic earnings per share |
$ | 4.32 | $ | (3.10 | ) | $ | 5.06 | |||
| Diluted earnings per share: |
||||||||||
| Net income (loss) |
$ | 246,215 | $ | (175,318 | ) | $ | 303,249 | |||
| Weighted average common shares outstanding—basic |
57,006,908 | 56,565,588 | 59,892,414 | |||||||
| Conversion of warrants |
608,161 | — | 3,467,554 | |||||||
| Conversion of options |
150,669 | — | 479,264 | |||||||
| Conversion of employee stock purchase plan |
1,399 | — | — | |||||||
| Weighted average common shares outstanding—diluted |
57,767,137 | 56,565,588 | 63,839,232 | |||||||
| Diluted earnings per share |
$ | 4.26 | $ | (3.10 | ) | $ | 4.75 | |||
For the year ended December 31, 2008, the impact of the conversion of warrants of 1,580,940, and conversion of options of 314,145 was excluded from the computation of diluted earnings per share because the effect would have been anti-dilutive.
20. Commitments and contingencies
(a) Concentrations of credit risk
The Company’s portfolio of cash and fixed maturities is managed following prudent standards of diversification. Specific provisions limit the allowable holdings of a single issue and issuers. The Company believes that there are no significant concentrations of credit risk associated with its portfolio of cash and fixed maturities.
The Company’s portfolio of other investments is managed pursuant to guidelines that emphasize diversification and liquidity. Pursuant to these guidelines, the Company manages and monitors risk across a variety of investment funds and vehicles, markets and counterparties. The Company believes that there are no significant concentrations of credit risk associated with its other investments.
The Company’s investments are held by four different custodians. These custodians are all large financial institutions which are highly regulated. These institutions have controls over their investment processes which are certified annually. The largest concentration of cash and cash equivalents at a single custodian was $515,850 and $728,319 at December 31, 2009 and 2008, respectively. The largest concentration of fixed maturities investments, by fair value, at a single custodian was $3,028,468 and $2,574,511 at December 31, 2009 and 2008, respectively.
F-53
Table of Contents
MAX CAPITAL GROUP LTD.
Notes to Consolidated Financial Statements—(Continued)
December 31, 2009, 2008 and 2007
(Expressed in thousands of U.S. Dollars,
except per share amounts)
20. Commitments and contingencies—(Continued)
(a) Concentrations of credit risk—(Continued)
At December 31, 2009 and 2008, the Company’s largest premiums receivable balances from a single client were 28.3% and 27.1% of total premiums receivable, respectively. A contractual right to offset loss obligations against premiums receivable reduces the Company’s credit risk associated with premiums receivable.
For the years ended December 31, 2009, 2008 and 2007, brokered transactions accounted for the majority of the Company’s property and casualty gross premiums written. For the years ended December 31, 2009, 2008 and 2007, the top three independent producing intermediaries and brokerage firms accounted for 25%, 11% and 7%; 18%, 16% and 10%; and 22%, 13% and 12%, respectively, of property and casualty gross premiums written.
The Company’s life and annuity reinsurance segment generally writes a limited number of transactions in a year, with a potentially large variation in premium volume. As a result, the number of possible brokers used in a year is limited to the number of transactions written. During each of the years ended December 31, 2009, 2008 and 2007, the top independent producing intermediary and brokerage firm accounted for 95%, 27% and 30% of life and annuity gross premiums written, respectively.
(b) Lease commitments
The Company and its subsidiaries lease office space in the countries in which they operate under operating leases, which expire at various dates through 2012. Total rent expense for the years ended December 31, 2009, 2008 and 2007 was $5,245, $3,251 and $2,583, respectively. The rent and maintenance expense under operating leases will range from $1,483 to $6,103 per year over the next five years.
(c) Credit facilities
The Company has three credit facilities as of December 31, 2009. The Company entered into its primary credit facility on August 7, 2007 with Bank of America and various other financial institutions. The primary credit facility provides for a $450,000 five-year senior secured credit facility for letters of credit to be issued for the account of Max Bermuda and certain of its insurance subsidiaries and a $150,000 five-year unsecured senior credit facility for letters of credit to be issued for the account of Max Bermuda and certain of its insurance subsidiaries and loans to Max Bermuda and Max Capital. Subject to certain conditions and at the request of Max Bermuda, the aggregate commitments of the lenders under the primary credit facility may be increased up to a total of $800,000, provided that the unsecured commitments may not exceed 25% of the aggregate commitments under the primary credit facility.
On October 13, 2008 Max Capital entered into a credit facility agreement with ING. This credit facility was entered into as part of the Company’s acquisition of Max UK. This credit facility provides up to GBP 90,000 ($145,530) for the issuance of letters of credit to provide FAL to support Lloyd’s syndicate commitments of Max UK and its subsidiaries. The facility may be terminated by ING at any time after January 1, 2010, subject to a four year notice requirement for any outstanding letters of credit. Effective December 5, 2008, Max UK was substituted as account party under the facility with Max Capital acting as guarantor.
F-54
Table of Contents
MAX CAPITAL GROUP LTD.
Notes to Consolidated Financial Statements—(Continued)
December 31, 2009, 2008 and 2007
(Expressed in thousands of U.S. Dollars,
except per share amounts)
20. Commitments and contingencies—(Continued)
(c) Credit facilities—(Continued)
The third facility is Max Bermuda’s $75,000 letter of credit with The Bank of Nova Scotia. This facility was renewed in December 2009. Absent further renewals, this facility expires on December 17, 2010.
The following table provides a summary of the credit facilities and the amounts pledged as collateral for the issued and outstanding letters of credit as of December 31, 2009 and December 31, 2008:
| Credit Facilities | |||||||||||||||
| Bank of America Syndicate |
The Bank of Nova Scotia |
ING Bank N.V. |
Total | ING Bank N.V. -FAL facility(1) | |||||||||||
| Letter of credit facility capacity at: December 31, 2009(1) |
$ | 600,000 | $ | 75,000 | $ | — | $ | 675,000 | GBP | 90,000 | |||||
| December 31, 2008(1) |
$ | 600,000 | $ | 75,000 | $ | 20,000 | $ | 695,000 | GBP | 90,000 | |||||
| Unsecured loan outstanding at: December 31, 2009 |
$ | — | $ | — | $ | — | $ | — | GBP | — | |||||
| December 31, 2008 |
$ | 150,000 | $ | — | $ | — | $ | 150,000 | GBP | — | |||||
| Letters of credit issued and outstanding at: |
$ | 411,461 | $ | 49,794 | $ | — | $ | 461,255 | GBP | 63,614 | |||||
| December 31, 2008 |
$ | 437,211 | $ | 43,133 | $ | 10,000 | $ | 490,344 | GBP | 63,614 | |||||
| Cash and fixed maturities at fair value pledged as collateral at: December 31, 2009 |
$ | 498,121 | $ | 65,213 | $ | — | $ | 563,334 | GBP | 3,623 | |||||
| December 31, 2008 |
$ | 481,750 | $ | 51,717 | $ | 18,791 | $ | 552,258 | GBP | 3,614 | |||||
| (1) | Letter of credit capacity is reduced by the amount of unsecured loans outstanding. |
Each of the credit facilities requires that the Company and/or certain of its subsidiaries comply with covenants, including a minimum consolidated tangible net worth and restrictions on the payment of dividends. The Company was in compliance with all the covenants of each of its letter of credit facilities at December 31, 2009.
(d) Funds at Lloyd’s
The Company operates in the Lloyd’s market through two corporate members, both are wholly-owned subsidiaries of Max UK. These corporate members together represent 100% of the participation in Syndicate 1400, and together represent 2% and 36% of the participation in Syndicates 2525 and 2526, respectively. Lloyd’s sets the corporate members’ required capital annually based on the Syndicates’ business plans, rating environment, reserving environment together with input arising from Lloyd’s discussions with, inter alia, regulatory and rating agencies. Such capital, or FAL, may comprise: cash, investments and undrawn letters of credit provided by various banks. The amounts of cash, investments and letters of credit at December 31, 2009 and 2008 amount to GBP 63,623 ($102,878) and GBP 63,614 ($92,832), respectively.
F-55
Table of Contents
MAX CAPITAL GROUP LTD.
Notes to Consolidated Financial Statements—(Continued)
December 31, 2009, 2008 and 2007
(Expressed in thousands of U.S. Dollars,
except per share amounts)
21. Segment information
The Company operates in five segments: Bermuda/Dublin insurance, Bermuda/Dublin reinsurance, U.S. specialty, Max at Lloyd’s and life and annuity reinsurance. Within the Bermuda/Dublin insurance segment, the Company offers property and casualty excess of loss capacity on specific risks related to individual insureds. In the Bermuda/Dublin reinsurance segment, the Company offers property and casualty quota share and excess of loss capacity providing coverage for a portfolio of underlying risks written by the Company’s clients. The U.S. specialty segment offers property and casualty insurance coverage from offices in the United States on specific risks related to individual insureds. The Max at Lloyd’s segment offers property reinsurance, accident and health insurance and reinsurance, aviation insurance, financial institutions insurance and professional liability insurance coverage through the Syndicates. The life and annuity reinsurance segment offers reinsurance products focusing on existing blocks of life and annuity business, which take the form of co-insurance transactions whereby the risks are reinsured on the same basis as the original policies.
The Company also has a corporate function that manages the Company’s investment and financing activities.
Invested assets relating to the Bermuda/Dublin insurance, Bermuda/Dublin reinsurance and life and annuity segments are managed on an aggregated basis. Consequently, investment income on this consolidated portfolio and gains on other investments are not directly captured in any one of these segments. However, because of the longer duration of liabilities on casualty insurance and reinsurance business (as compared to property), and life and annuity reinsurance business, investment returns are important in evaluating the profitability of these segments. Accordingly, the Company allocates investment returns from the consolidated portfolio to each of these three segments. This is based on a notional allocation of invested assets from the consolidated portfolio using durations that are determined based on estimated cash flows into and out of each segment. The balance of investment returns from this consolidated portfolio is allocated to the corporate function for the purposes of segment reporting.
Each of the U.S. specialty and the Max at Lloyd’s segments has its own portfolio of fixed maturities investments; as a result the investment income earned by each of these portfolios is reported in its respective segment. The management of these portfolios, however, is handled on a consolidated basis together with the invested assets of the Bermuda/Dublin insurance, Bermuda/Dublin reinsurance and life and annuity segments.
F-56
Table of Contents
MAX CAPITAL GROUP LTD.
Notes to Consolidated Financial Statements—(Continued)
December 31, 2009, 2008 and 2007
(Expressed in thousands of U.S. Dollars,
except per share amounts)
21. Segment information—(Continued)
A summary of operations by segment for the years ended December 31, 2009, 2008 and 2007 were as follows:
| Property & Casualty | Life & Annuity |
|||||||||||||||||||||||||||||||
| 2009 |
Bermuda/ Dublin Insurance |
Bermuda/ Dublin Reinsurance |
U.S. Specialty |
Max at Lloyd’s |
Total | Reinsurance | Corporate | Con- solidated |
||||||||||||||||||||||||
| Revenues |
||||||||||||||||||||||||||||||||
| Gross premiums written |
$ | 427,767 | $ | 489,028 | $ | 285,478 | $ | 128,973 | $ | 1,331,246 | $ | 43,755 | $ | — | $ | 1,375,001 | ||||||||||||||||
| Reinsurance premiums ceded |
(212,083 | ) | (80,005 | ) | (155,096 | ) | (32,884 | ) | (480,068 | ) | (413 | ) | — | (480,481 | ) | |||||||||||||||||
| Net premiums written |
$ | 215,684 | $ | 409,023 | $ | 130,382 | $ | 96,089 | $ | 851,178 | $ | 43,342 | $ | — | $ | 894,520 | ||||||||||||||||
| Earned premiums |
$ | 417,090 | $ | 476,434 | $ | 256,670 | $ | 125,000 | $ | 1,275,194 | $ | 43,755 | $ | — | $ | 1,318,949 | ||||||||||||||||
| Earned premiums ceded |
(211,127 | ) | (88,578 | ) | (154,568 | ) | (29,907 | ) | (484,180 | ) | (413 | ) | — | (484,593 | ) | |||||||||||||||||
| Net premiums earned |
205,963 | 387,856 | 102,102 | 95,093 | 791,014 | 43,342 | — | 834,356 | ||||||||||||||||||||||||
| Net investment income |
22,875 | 40,220 | 5,987 | 4,388 | 73,470 | 50,993 | 45,278 | 169,741 | ||||||||||||||||||||||||
| Net realized and unrealized gains on investments |
4,430 | 10,540 | 232 | 2,590 | 17,792 | 37,338 | 26,635 | 81,765 | ||||||||||||||||||||||||
| Net impairment losses recognized in earnings |
— | — | — | — | — | — | (3,078 | ) | (3,078 | ) | ||||||||||||||||||||||
| Net realized gain on retirement of senior notes |
— | — | — | — | — | — | 111 | 111 | ||||||||||||||||||||||||
| Other income |
1,238 | 12 | 314 | 658 | 2,222 | (120 | ) | 801 | 2,903 | |||||||||||||||||||||||
| Total revenues |
234,506 | 438,628 | 108,635 | 102,729 | 884,498 | 131,553 | 69,747 | 1,085,798 | ||||||||||||||||||||||||
| Net losses and loss expenses |
132,355 | 254,474 | 62,812 | 43,958 | 493,599 | — | — | 493,599 | ||||||||||||||||||||||||
| Claims and policy benefits |
— | — | — | — | — | 101,093 | — | 101,093 | ||||||||||||||||||||||||
| Acquisition costs |
(1,233 | ) | 71,074 | 7,501 | 18,136 | 95,478 | 1,396 | — | 96,874 | |||||||||||||||||||||||
| Interest expense |
781 | 6,591 | — | — | 7,372 | 3,328 | 10,639 | 21,339 | ||||||||||||||||||||||||
| Net foreign exchange gains |
— | — | — | (5,055 | ) | (5,055 | ) | — | (717 | ) | (5,772 | ) | ||||||||||||||||||||
| Merger and acquisition expenses |
— | — | — | — | — | — | (31,566 | ) | (31,566 | ) | ||||||||||||||||||||||
| General and administrative expenses |
24,623 | 31,778 | 31,229 | 19,972 | 107,602 | 2,786 | 43,607 | 153,995 | ||||||||||||||||||||||||
| Total losses and expenses |
156,526 | 363,917 | 101,542 | 77,011 | 698,996 | 108,603 | 21,963 | 829,562 | ||||||||||||||||||||||||
| Income before taxes |
$ | 77,980 | $ | 74,711 | $ | 7,093 | $ | 25,718 | $ | 185,502 | $ | 22,950 | $ | 47,784 | $ | 256,236 | ||||||||||||||||
| Loss ratio * |
64.3 | % | 65.6 | % | 61.5 | % | 46.2 | % | 62.4 | % | *** | |||||||||||||||||||||
| Combined ratio ** |
75.6 | % | 92.1 | % | 99.5 | % | 86.3 | % | 88.1 | % | *** | |||||||||||||||||||||
| * | The loss ratio is calculated by dividing net losses and loss expenses by net premiums earned. |
| ** | The combined ratio is calculated by dividing the sum of net losses and loss expenses, acquisition costs and general and administrative expenses by net premiums earned. |
| *** | Loss ratio and combined ratio are not provided for life and annuity products as the Company believes these ratios are not appropriate measures for life and annuity underwriting. |
F-57
Table of Contents
MAX CAPITAL GROUP LTD.
Notes to Consolidated Financial Statements—(Continued)
December 31, 2009, 2008 and 2007
(Expressed in thousands of U.S. Dollars,
except per share amounts)
21. Segment information—(Continued)
| Property & Casualty | Life & Annuity |
|||||||||||||||||||||||||||||||
| 2008 |
Bermuda/ Dublin Insurance |
Bermuda/ Dublin Reinsurance |
U.S. Specialty |
Max at Lloyd’s (a) |
Total | Reinsurance | Corporate | Con- solidated |
||||||||||||||||||||||||
| Revenues |
||||||||||||||||||||||||||||||||
| Gross premiums written |
$ | 389,368 | $ | 419,509 | $ | 194,353 | $ | 8,844 | $ | 1,012,074 | $ | 242,176 | $ | — | $ | 1,254,250 | ||||||||||||||||
| Reinsurance premiums ceded |
(198,098 | ) | (92,421 | ) | (118,710 | ) | (4,294 | ) | (413,523 | ) | (524 | ) | — | (414,047 | ) | |||||||||||||||||
| Net premiums written |
$ | 191,270 | $ | 327,088 | $ | 75,643 | $ | 4,550 | $ | 598,551 | $ | 241,652 | $ | — | $ | 840,203 | ||||||||||||||||
| Earned premiums |
$ | 371,080 | $ | 426,157 | $ | 121,172 | $ | 9,663 | $ | 928,072 | $ | 242,176 | $ | — | $ | 1,170,248 | ||||||||||||||||
| Earned premiums ceded |
(189,125 | ) | (84,366 | ) | (77,374 | ) | (5,349 | ) | (356,214 | ) | (524 | ) | — | (356,738 | ) | |||||||||||||||||
| Net premiums earned |
181,955 | 341,791 | 43,798 | 4,314 | 571,858 | 241,652 | — | 813,510 | ||||||||||||||||||||||||
| Net investment income |
18,437 | 36,069 | 7,235 | 542 | 62,283 | 40,058 | 79,283 | 181,624 | ||||||||||||||||||||||||
| Net realized and unrealized gains (losses) on investments |
(23,499 | ) | (51,096 | ) | (523 | ) | 508 | (74,610 | ) | (100,921 | ) | (59,434 | ) | (234,965 | ) | |||||||||||||||||
| Net impairment losses recognized in earnings |
— | — | — | — | — | — | (16,887 | ) | (16,887 | ) | ||||||||||||||||||||||
| Net realized gain on retirement of senior notes |
— | — | — | — | — | — | 2,245 | 2,245 | ||||||||||||||||||||||||
| Other income |
1,112 | — | 303 | 160 | 1,575 | (117 | ) | 1,458 | ||||||||||||||||||||||||
| Total revenues |
178,005 | 326,764 | 50,813 | 5,524 | 561,106 | 180,789 | 5,090 | 746,985 | ||||||||||||||||||||||||
| Net losses and loss expenses |
142,150 | 218,749 | 30,376 | 2,470 | 393,745 | — | — | 393,745 | ||||||||||||||||||||||||
| Claims and policy benefits |
— | — | — | — | — | 301,526 | — | 301,526 | ||||||||||||||||||||||||
| Acquisition costs |
(2,810 | ) | 51,328 | 3,039 | 981 | 52,538 | (159 | ) | — | 52,379 | ||||||||||||||||||||||
| Interest expense |
— | 7,516 | — | — | 7,516 | 6,818 | 21,755 | 36,089 | ||||||||||||||||||||||||
| Net foreign exchange (gains) losses |
— | — | — | (382 | ) | (382 | ) | — | 10,255 | 9,873 | ||||||||||||||||||||||
| Merger and acquisition expenses |
— | — | — | — | — | — | 2,944 | 2,944 | ||||||||||||||||||||||||
| General and administrative expenses |
21,101 | 28,548 | 27,235 | 2,525 | 79,409 | 2,917 | 42,189 | 124,515 | ||||||||||||||||||||||||
| Total losses and expenses |
160,441 | 306,141 | 60,650 | 5,594 | 532,826 | 311,102 | 77,143 | 921,071 | ||||||||||||||||||||||||
| Income (loss) before taxes |
$ | 17,564 | $ | 20,623 | $ | (9,837 | ) | $ | (70 | ) | $ | 28,280 | $ | (130,313 | ) | $ | (72,053 | ) | $ | (174,086 | ) | |||||||||||
| Loss ratio * |
78.1 | % | 64.0 | % | 69.4 | % | 57.3 | % | 68.9 | % | * | ** | ||||||||||||||||||||
| Combined ratio ** |
88.2 | % | 87.4 | % | 138.5 | % | 138.5 | % | 91.9 | % | * | ** | ||||||||||||||||||||
| * | The loss ratio is calculated by dividing net losses and loss expenses by net premiums earned. |
| ** | The combined ratio is calculated by dividing the sum of net losses and loss expenses, acquisition costs and general and administrative expenses by net premiums earned. |
| *** | Loss ratio and combined ratio are not provided for life and annuity products as the Company believes these ratios are not appropriate measures for life and annuity underwriting. |
| (a) | The results of operations for the Max at Lloyd’s segment are consolidated only from November 6, 2008, the date Max at Lloyd’s was acquired. |
F-58
Table of Contents
MAX CAPITAL GROUP LTD.
Notes to Consolidated Financial Statements—(Continued)
December 31, 2009, 2008 and 2007
(Expressed in thousands of U.S. Dollars,
except per share amounts)
21. Segment information—(Continued)
| Property & Casualty | Life & Annuity |
|||||||||||||||||||||||||||
| 2007 |
Bermuda/ Dublin Insurance |
Bermuda/ Dublin Reinsurance |
U.S . Specialty |
Total(1) | Reinsurance | Corporate | Con- solidated |
|||||||||||||||||||||
| Revenues |
||||||||||||||||||||||||||||
| Gross premiums written |
$ | 382,926 | $ | 345,156 | $ | 48,243 | $ | 776,325 | $ | 301,961 | $ | — | $ | 1,078,286 | ||||||||||||||
| Reinsurance premiums ceded |
(201,987 | ) | (44,565 | ) | (34,610 | ) | (281,162 | ) | (534 | ) | — | (281,696 | ) | |||||||||||||||
| Net premiums written |
$ | 180,939 | $ | 300,591 | $ | 13,633 | $ | 495,163 | $ | 301,427 | $ | — | $ | 796,590 | ||||||||||||||
| Earned premiums |
$ | 398,776 | $ | 356,448 | $ | 16,988 | $ | 772,212 | $ | 301,961 | $ | — | $ | 1,074,173 | ||||||||||||||
| Earned premiums ceded |
(199,223 | ) | (43,501 | ) | (13,010 | ) | (255,734 | ) | (534 | ) | — | (256,268 | ) | |||||||||||||||
| Net premiums earned |
199,553 | 312,947 | 3,978 | 516,478 | 301,427 | — | 817,905 | |||||||||||||||||||||
| Net investment income |
16,160 | 41,025 | 5,974 | 63,159 | 33,936 | 91,111 | 188,206 | |||||||||||||||||||||
| Net realized and unrealized gains (losses) on investments |
14,271 | 53,021 | — | 67,292 | 60,713 | 55,786 | 183,791 | |||||||||||||||||||||
| Net impairment losses recognized in earnings |
— | — | — | — | — | (1,087 | ) | (1,087 | ) | |||||||||||||||||||
| Other income |
— | — | — | — | — | 745 | 745 | |||||||||||||||||||||
| Total revenues |
229,984 | 406,993 | 9,952 | 646,929 | 396,076 | 146,555 | 1,189,560 | |||||||||||||||||||||
| Net losses and loss expenses |
153,816 | 173,317 | 3,261 | 330,394 | — | — | 330,394 | |||||||||||||||||||||
| Claims and policy benefits |
— | — | — | — | 345,602 | — | 345,602 | |||||||||||||||||||||
| Acquisition costs |
(1,162 | ) | 60,910 | 376 | 60,124 | 1,236 | — | 61,360 | ||||||||||||||||||||
| Interest expense |
— | 11,890 | — | 11,890 | 6,864 | 23,909 | 42,663 | |||||||||||||||||||||
| Net foreign exchange losses |
— | — | — | — | — | 25 | 25 | |||||||||||||||||||||
| General and administrative expenses |
19,348 | 28,394 | 17,430 | 65,172 | 2,813 | 38,704 | 106,689 | |||||||||||||||||||||
| Total losses and expenses |
172,002 | 274,511 | 21,067 | 467,580 | 356,515 | 62,638 | 886,733 | |||||||||||||||||||||
| Income (loss) before taxes |
$ | 57,982 | $ | 132,482 | $ | (11,115 | ) | $ | 179,349 | $ | 39,561 | $ | 83,917 | $ | 302,827 | |||||||||||||
| Loss ratio * |
77.1 | % | 55.4 | % | 82.0 | % | 64.0 | % | * | ** | ||||||||||||||||||
| Combined ratio ** |
86.2 | % | 83.9 | % | n/a | 88.2 | % | * | ** | |||||||||||||||||||
| * | The loss ratio is calculated by dividing net losses and loss expenses by net premiums earned. |
| ** | The combined ratio is calculated by dividing the sum of net losses and loss expenses, acquisition costs and general and administrative expenses by net premiums earned. |
| *** | Loss ratio and combined ratio are not provided for life and annuity products as the Company believes these ratios are not appropriate measures for life and annuity underwriting. |
| (1) | Max at Lloyd’s segment not shown in 2007 as it was acquired in 2008. |
F-59
Table of Contents
MAX CAPITAL GROUP LTD.
Notes to Consolidated Financial Statements—(Continued)
December 31, 2009, 2008 and 2007
(Expressed in thousands of U.S. Dollars,
except per share amounts)
21. Segment information—(Continued)
The Company’s clients are located in three geographic regions: North America, Europe and the rest of the world.
Financial information relating to property and casualty gross premiums written and reinsurance premiums ceded by geographic region for the years ended December 31, 2009, 2008 and 2007 was as follows:
| 2009 | 2008 | 2007 | ||||||||||
| Gross premiums written—North America |
$ | 1,045,655 | $ | 819,277 | $ | 584,980 | ||||||
| Gross premiums written—Europe |
180,794 | 139,569 | 148,130 | |||||||||
| Gross premiums written—Rest of the world |
104,797 | 53,228 | 43,215 | |||||||||
| Reinsurance ceded—North America |
(393,057 | ) | (358,159 | ) | (227,208 | ) | ||||||
| Reinsurance ceded—Europe |
(68,503 | ) | (33,822 | ) | (47,095 | ) | ||||||
| Reinsurance ceded—Rest of the world |
(18,508 | ) | (21,542 | ) | (6,859 | ) | ||||||
| $ | 851,178 | $ | 598,551 | $ | 495,163 | |||||||
The largest client in each of the three years ended December 31, 2009, 2008 and 2007, accounted for 4.5%, 7.2% and 3.7%, of the Company’s property and casualty gross premiums written, respectively.
Financial information relating to life and annuity gross premiums written and reinsurance premiums ceded by geographic region for the years ended December 31, 2009, 2008 and 2007 was as follows:
| 2009 | 2008 | 2007 | ||||||||||
| Gross premiums written—North America |
$ | 43,755 | $ | 2,621 | $ | 2,700 | ||||||
| Gross premiums written—Europe |
— | 239,555 | 299,261 | |||||||||
| Reinsurance ceded—North America |
(413 | ) | (524 | ) | (534 | ) | ||||||
| Reinsurance ceded—Europe |
— | — | — | |||||||||
| $ | 43,342 | $ | 241,652 | $ | 301,427 | |||||||
The largest client in each of the three years ended December 31, 2009, 2008 and 2007, accounted for 95.0%, 72.2% and 68.9%, of the Company’s life and annuity gross premiums written, respectively. The gross premiums written for the year ended December 31, 2009 principally related to traditional life policies for clients based in the U.S. The gross premiums written for each of the two years ended December 31, 2008 and 2007 principally related to closed block pension annuities for clients based in Ireland.
22. Subsequent events
Subsequent events have been evaluated up to and including February 16, 2010, the date of issuance of these consolidated financial statements.
F-60
Table of Contents
MAX CAPITAL GROUP LTD.
Notes to Consolidated Financial Statements—(Continued)
December 31, 2009, 2008 and 2007
(Expressed in thousands of U.S. Dollars,
except per share amounts)
23. Quarterly financial results (unaudited)
| Quarter Ended | ||||||||||||||||
| 2009 |
March 31 | June 30 | September 30 | December 31 | ||||||||||||
| Revenues |
||||||||||||||||
| Gross premiums written |
$ | 434,273 | $ | 396,509 | $ | 265,886 | $ | 278,333 | ||||||||
| Net premiums earned |
$ | 190,282 | $ | 228,785 | $ | 208,016 | $ | 207,273 | ||||||||
| Net investment income |
40,488 | 41,755 | 42,830 | 44,668 | ||||||||||||
| Net realized and unrealized gains (losses) on investments |
18,441 | 21,472 | 24,528 | 17,325 | ||||||||||||
| Net impairment losses recognized in earnings |
— | (2,014 | ) | (139 | ) | (925 | ) | |||||||||
| Net realized gain on retirement of senior notes |
— | — | — | 111 | ||||||||||||
| Other income (expense) |
1,306 | 974 | 819 | (196 | ) | |||||||||||
| Total revenues |
250,517 | 290,972 | 276,054 | 268,256 | ||||||||||||
| Losses and expenses |
||||||||||||||||
| Net losses and loss expenses |
124,723 | 122,228 | 131,778 | 114,870 | ||||||||||||
| Claims and policy benefits |
14,332 | 55,407 | 14,378 | 16,976 | ||||||||||||
| Acquisition costs |
20,630 | 25,059 | 27,997 | 23,188 | ||||||||||||
| Interest expense |
3,939 | 4,744 | 5,971 | 6,685 | ||||||||||||
| Net foreign exchange (gains) losses |
(3,476 | ) | (3,404 | ) | 406 | 702 | ||||||||||
| Merger and acquisition expenses |
5,223 | 4,785 | (41,350 | ) | (224 | ) | ||||||||||
| General and administrative expenses |
39,060 | 36,105 | 40,372 | 38,458 | ||||||||||||
| Total losses and expenses |
204,431 | 244,924 | 179,552 | 200,655 | ||||||||||||
| Income (loss) before taxes |
$ | 46,086 | $ | 46,048 | $ | 96,502 | $ | 67,601 | ||||||||
| Income tax expense |
1,547 | 2,290 | 1,176 | 5,009 | ||||||||||||
| Net income (loss) |
$ | 44,539 | $ | 43,758 | $ | 95,326 | $ | 62,592 | ||||||||
| Basic earnings per share |
$ | 0.79 | $ | 0.77 | $ | 1.67 | $ | 1.10 | ||||||||
| Diluted earnings per share |
$ | 0.78 | $ | 0.76 | $ | 1.64 | $ | 1.08 | ||||||||
F-61
Table of Contents
MAX CAPITAL GROUP LTD.
Notes to Consolidated Financial Statements—(Continued)
December 31, 2009, 2008 and 2007
(Expressed in thousands of U.S. Dollars,
except per share amounts)
23. Quarterly financial results (unaudited) —(Continued)
| Quarter Ended | ||||||||||||||||
| 2008 |
March 31 | June 30 | September 30 | December 31 | ||||||||||||
| Revenues |
||||||||||||||||
| Gross premiums written |
$ | 306,634 | $ | 369,291 | $ | 206,260 | $ | 372,065 | ||||||||
| Net premiums earned |
$ | 135,812 | $ | 234,610 | $ | 141,589 | $ | 301,499 | ||||||||
| Net investment income |
49,626 | 42,507 | 45,265 | 44,226 | ||||||||||||
| Net realized and unrealized (losses) gains on investments |
(24,295 | ) | 40,800 | (162,549 | ) | (88,951 | ) | |||||||||
| Net impairment losses recognized in earnings |
— | (3,100 | ) | (13,757 | ) | — | ||||||||||
| Net realized gain on retirement of senior notes |
— | — | — | 2,245 | ||||||||||||
| Other income (expense) |
1,223 | 201 | (423 | ) | 457 | |||||||||||
| Total revenues |
162,366 | 315,018 | 10,125 | 259,476 | ||||||||||||
| Losses and expenses |
||||||||||||||||
| Net losses and loss expenses |
93,602 | 78,149 | 106,834 | 115,160 | ||||||||||||
| Claims and policy benefits |
14,955 | 108,220 | 14,000 | 164,351 | ||||||||||||
| Acquisition costs |
9,612 | 12,236 | 13,896 | 16,635 | ||||||||||||
| Interest expense |
11,957 | 4,089 | 4,501 | 15,542 | ||||||||||||
| Net foreign exchange losses |
12 | 1 | 1,971 | 7,889 | ||||||||||||
| Merger and acquisition expenses |
— | 3,988 | (500 | ) | (544 | ) | ||||||||||
| General and administrative expenses |
24,708 | 33,502 | 31,837 | 34,468 | ||||||||||||
| Total losses and expenses |
154,846 | 240,185 | 172,539 | 353,501 | ||||||||||||
| Income (loss) before taxes |
$ | 7,520 | $ | 74,833 | $ | (162,414 | ) | $ | (94,025 | ) | ||||||
| Income tax (benefit) expense |
(229 | ) | 630 | 773 | 58 | |||||||||||
| Net income (loss) |
$ | 7,749 | $ | 74,203 | $ | (163,187 | ) | $ | (94,083 | ) | ||||||
| Basic earnings per share |
$ | 0.14 | $ | 1.30 | $ | (2.89 | ) | $ | (1.67 | ) | ||||||
| Diluted earnings per share |
$ | 0.13 | $ | 1.26 | $ | (2.89 | ) | $ | (1.67 | ) | ||||||
F-62
Table of Contents
MAX CAPITAL GROUP LTD.
Condensed Financial Information of Registrant
Balance Sheet—Parent Company only
December 31, 2009 and 2008
(Expressed in thousands of U.S. Dollars, except per share amounts)
| 2009 | 2008 | ||||||
| Assets |
|||||||
| Cash and cash equivalents |
$ | 23,164 | $ | 16,856 | |||
| Investments in subsidiaries |
1,694,955 | 1,416,281 | |||||
| Due from affiliated companies |
— | 508 | |||||
| Other assets |
720 | 570 | |||||
| Total Assets |
$ | 1,718,839 | $ | 1,434,215 | |||
| Liabilities |
|||||||
| Bank loan |
— | 150,000 | |||||
| Due to affiliated companies |
149,915 | — | |||||
| Accounts payable and accrued expenses |
4,291 | 3,884 | |||||
| Total Liabilities |
154,206 | 153,884 | |||||
| Shareholders’ Equity |
|||||||
| Preferred shares (par value $1.00) 20,000,000 shares authorized; no shares issued or outstanding |
— | — | |||||
| Common shares (par value $1.00) 200,000,000 shares authorized; 55,867,125 shares issued and outstanding (2008—55,805,790) |
55,867 | 55,806 | |||||
| Addition paid-in capital |
752,309 | 763,391 | |||||
| Accumulated other comprehensive income (loss) |
25,431 | (45,399 | ) | ||||
| Retained earnings |
731,026 | 506,533 | |||||
| Total Shareholders’ Equity |
$ | 1,564,633 | $ | 1,280,331 | |||
| Total Liabilities and Shareholders’ Equity |
$ | 1,718,839 | $ | 1,434,215 | |||
See accompanying report of independent registered public accounting firm
MAX CAPITAL GROUP LTD.
Condensed Financial Information of Registrant
Statement of Income—Parent Company only
For the years ended December 31, 2009, 2008 and 2007
(Expressed in thousands of U.S. Dollars)
| 2009 | 2008 | 2007 | |||||||||
| Revenue |
|||||||||||
| Net investment income |
$ | 240,242 | $ | (146,148 | ) | $ | 318,105 | ||||
| Expenses |
|||||||||||
| Interest expense |
2,041 | 3,029 | 4,004 | ||||||||
| General and administrative expenses |
(8,014 | ) | 26,141 | 10,852 | |||||||
| Net Income (Loss) |
$ | 246,215 | $ | (175,318 | ) | $ | 303,249 | ||||
See accompanying report of independent registered public accounting firm
F-63
Table of Contents
SCHEDULE II—(Continued)
MAX CAPITAL GROUP LTD.
Condensed Financial Information of Registrant
Statement of Cash Flows—Parent Company only
For the years ended December 31, 2009, 2008 and 2007
(Expressed in thousands of U.S. Dollars)
| 2009 | 2008 | 2007 | ||||||||||
| Operating activities: |
||||||||||||
| Net income (loss) |
$ | 246,215 | $ | (175,318 | ) | $ | 303,249 | |||||
| Adjustments to reconcile net income to net cash provided by (used in) operating activities: |
||||||||||||
| Amortization of unearned stock based compensation |
20,907 | 20,248 | 17,780 | |||||||||
| Other assets |
(151 | ) | (39 | ) | (119 | ) | ||||||
| Accounts payable and accrued expenses |
407 | (1,230 | ) | 1,728 | ||||||||
| Due to (from) affiliated companies |
150,423 | (111,133 | ) | 138,667 | ||||||||
| Equity in net earnings of subsidiaries |
(240,144 | ) | 146,434 | (317,137 | ) | |||||||
| Net cash provided by (used in) operating activities |
177,657 | (121,038 | ) | 144,168 | ||||||||
| Investing activities: |
||||||||||||
| Investments in subsidiaries |
(20,199 | ) | (6,039 | ) | (70,000 | ) | ||||||
| Dividends received |
52,500 | 150,000 | — | |||||||||
| Net cash provided by (used in) investing activities |
32,301 | 143,961 | (70,000 | ) | ||||||||
| Financing Activities: |
||||||||||||
| Net proceeds from issuance of common shares |
2,393 | 6,818 | 4,976 | |||||||||
| Repurchase of common shares |
(34,321 | ) | (109,839 | ) | (114,355 | ) | ||||||
| (Repayment) proceeds from bank loan |
(150,000 | ) | 100,000 | 50,000 | ||||||||
| Dividends paid |
(21,722 | ) | (20,414 | ) | (19,163 | ) | ||||||
| Net cash used in financing activities |
(203,650 | ) | (23,435 | ) | (78,542 | ) | ||||||
| Increase (decrease) in cash and cash equivalents |
6,308 | (512 | ) | (4,374 | ) | |||||||
| Cash and cash equivalents, beginning of year |
16,856 | 17,368 | 21,742 | |||||||||
| Cash and cash equivalents, end of year |
$ | 23,164 | $ | 16,856 | $ | 17,368 | ||||||
See accompanying report of independent registered public accounting firm
F-64
Table of Contents
MAX CAPITAL GROUP LTD.
Supplementary Insurance Information
December 31, 2009, 2008 and 2007
(Expressed in thousands of U.S. Dollars)
Year ended December 31, 2009
| Deferred Acquisition Costs |
Reserve for Losses and Loss Expenses |
Unearned Premiums |
Net Premiums Earned |
Net Investment Income |
Losses and Loss Expense and Claims and Policy Benefits |
Amortization of Deferred Acquisition Costs |
Net Premiums Written |
Other Operating Expenses | |||||||||||||||||||||
| Bermuda/Dublin Insurance |
$ | (4,779 | ) | $ | 1,240,036 | $ | 182,973 | $ | 205,963 | $ | 22,875 | $ | 132,355 | $ | (1,233 | ) | $ | 215,684 | $ | 24,623 | |||||||||
| Bermuda/Dublin Reinsurance |
46,557 | 1,470,681 | 260,728 | 387,856 | 40,220 | 254,474 | 71,074 | 409,023 | 31,778 | ||||||||||||||||||||
| U.S. Specialty |
8,031 | 189,126 | 133,245 | 102,102 | 5,987 | 62,812 | 7,501 | 130,382 | 31,229 | ||||||||||||||||||||
| Max at Lloyd’s |
8,985 | 278,251 | 51,215 | 95,093 | 4,388 | 43,958 | 18,136 | 96,089 | 14,917 | ||||||||||||||||||||
| Life and Annuity Reinsurance |
6,854 | 1,372,513 | — | 43,342 | 50,993 | 101,093 | 1,396 | 43,342 | 2,786 | ||||||||||||||||||||
| Not allocated to segments |
— | — | — | — | 45,278 | — | — | — | 11,324 | ||||||||||||||||||||
| Total |
$ | 65,648 | $ | 4,550,607 | $ | 628,161 | $ | 834,356 | $ | 169,741 | $ | 594,692 | $ | 96,874 | $ | 894,520 | $ | 116,657 | |||||||||||
Year ended December 31, 2008
| Deferred Acquisition Costs |
Reserve for Losses and Loss Expenses |
Unearned Premiums |
Net Premiums Earned |
Net Investment Income |
Losses and Loss Expense and Claims and Policy Benefits |
Amortization of Deferred Acquisition Costs |
Net Premiums Written |
Other Operating Expenses | |||||||||||||||||||||
| Bermuda/Dublin Insurance |
$ | (4,664 | ) | $ | 1,073,754 | $ | 200,901 | $ | 181,955 | $ | 18,437 | $ | 142,150 | $ | (2,810 | ) | $ | 191,270 | $ | 21,101 | |||||||||
| Bermuda/Dublin Reinsurance |
35,674 | 1,472,428 | 215,626 | 341,791 | 36,069 | 218,749 | 51,328 | 327,088 | 28,548 | ||||||||||||||||||||
| U.S. Specialty |
1,424 | 118,058 | 104,436 | 43,798 | 7,235 | 30,376 | 3,039 | 75,643 | 27,235 | ||||||||||||||||||||
| Max at Lloyd’s |
9,566 | 273,931 | 53,171 | 4,314 | 542 | 2,470 | 981 | 4,550 | 2,143 | ||||||||||||||||||||
| Life and Annuity Reinsurance |
9,337 | 1,366,976 | — | 241,652 | 40,058 | 301,526 | (159 | ) | 241,652 | 2,917 | |||||||||||||||||||
| Not allocated to segments |
— | — | — | — | 79,283 | — | — | — | 55,388 | ||||||||||||||||||||
| Total |
$ | 51,337 | $ | 4,305,147 | $ | 574,134 | $ | 813,510 | $ | 181,624 | $ | 695,271 | $ | 52,379 | $ | 840,203 | $ | 137,332 | |||||||||||
Year ended December 31, 2007
| Deferred Acquisition Costs |
Reserve for Losses and Loss Expenses |
Unearned Premiums |
Net Premiums Earned |
Net Investment Income |
Losses and Loss Expense and Claims and Policy Benefits |
Amortization of Deferred Acquisition Costs |
Net Premiums Written |
Other Operating Expenses | |||||||||||||||||||||
| Bermuda/Dublin Insurance |
$ | (4,082 | ) | $ | 866,782 | $ | 184,189 | $ | 199,553 | $ | 16,160 | $ | 153,816 | $ | (1,162 | ) | $ | 180,939 | $ | 19,348 | |||||||||
| Bermuda/Dublin Reinsurance |
41,043 | 1,441,993 | 224,137 | 312,947 | 41,025 | 173,317 | 60,910 | 300,591 | 28,394 | ||||||||||||||||||||
| U.S. Specialty |
(381 | ) | 25,102 | 31,255 | 3,978 | 5,974 | 3,261 | 376 | 13,633 | 17,430 | |||||||||||||||||||
| Life and Annuity Reinsurance |
7,607 | 1,203,509 | — | 301,427 | 33,936 | 345,602 | 1,236 | 301,427 | 2,813 | ||||||||||||||||||||
| Not allocated to segments |
— | — | — | — | 91,111 | — | — | — | 38,729 | ||||||||||||||||||||
| Total |
$ | 44,187 | $ | 3,537,386 | $ | 439,581 | $ | 817,905 | $ | 188,206 | $ | 675,996 | $ | 61,360 | $ | 796,590 | $ | 106,714 | |||||||||||
See accompanying report of independent registered public accounting firm
F-65
Table of Contents
MAX CAPITAL GROUP LTD.
Reinsurance
December 31, 2009, 2008 and 2007
(Expressed in thousands of U.S. Dollars)
| Direct Gross Premium |
Ceded to Other Companies |
Assumed from Other Companies |
Net Amount |
Percentage of Amount Assumed to Net |
|||||||||||
| Year ended December 31, 2009 |
$ | 759,567 | $ | 480,481 | $ | 615,434 | $ | 894,520 | 69 | % | |||||
| Year ended December 31, 2008 |
$ | 592,565 | $ | 414,047 | $ | 661,685 | $ | 840,203 | 79 | % | |||||
| Year ended December 31, 2007 |
$ | 431,169 | $ | 281,696 | $ | 647,117 | $ | 796,590 | 81 | % | |||||
See accompanying report of independent registered public accounting firm
F-66