Attached files
| file | filename |
|---|---|
| 8-K - FORM 8-K - MERCURY SYSTEMS INC | d8k.htm |
 © 2010 Mercury Computer Systems, Inc. www.mc.com Cowen Aerospace & Defense Conference Mark Aslett – President & CEO Bob Hult – SVP, CFO February 11, 2010 Exhibit 99.1 |
 © 2010 Mercury Computer Systems, Inc. www.mc.com Forward-Looking Safe Harbor Statement This presentation contains certain forward-looking statements, as that term is defined
in the Private Securities Litigation Reform Act of 1995, including those
relating to anticipated fiscal 2010 business performance and beyond. You can identify these statements by our use of the words "may," "will," "should," "plans,"
"expects," "anticipates," "continue," "estimate," "project," "intend," and similar expressions. These forward-looking statements involve risks and uncertainties that could cause actual
results to differ materially from those projected or anticipated. Such risks and
uncertainties include, but are not limited to, general economic and business conditions, including unforeseen weakness in the Company's markets, effects of continued geopolitical unrest and regional
conflicts, competition, changes in technology and methods of marketing, delays
in completing engineering and manufacturing programs, changes in customer order patterns, changes in product mix, continued success in technological advances and delivering technological
innovations, continued funding of defense programs, the timing of such funding,
changes in the U.S. Government's interpretation of federal procurement rules and regulations, market acceptance of the Company's products, shortages in components, production delays due
to performance quality issues with outsourced components, the inability to fully
realize the expected benefits from acquisitions or delays in realizing such benefits, challenges in integrating acquired businesses and achieving anticipated synergies, and difficulties in retaining key customers. These risks and uncertainties also include such additional risk factors as are discussed in the Company's
recent filings with the U.S. Securities and Exchange Commission, including its Annual Report on Form 10-K for the year ended June 30, 2009. The Company cautions readers not to place undue reliance upon any such forward-looking statements, which speak only as of
the date made. The Company undertakes no obligation to update any
forward-looking statement to reflect events or circumstances after the date on which such statement is made. Use of Non-GAAP (Generally Accepted Accounting Principles) Financial Measures In addition to reporting financial results in accordance with generally accepted accounting
principles, or GAAP, the Company provides non-GAAP financial measures
adjusted to exclude certain specified charges, which the Company believes are useful to help investors better understand its past financial performance and prospects for the future. However, the
presentation of non-GAAP financial measures is not meant to be considered in
isolation or as a substitute for financial information provided in accordance with GAAP. Management believes these non-GAAP financial measures assist in providing a more complete
understanding of the Company's underlying operational results and trends, and
management uses these measures, along with their corresponding GAAP financial measures, to manage the Company's business, to evaluate its performance compared to prior periods and the
marketplace, and to establish operational goals. A reconciliation of GAAP to
non-GAAP financial measures discussed in this presentation is contained in the Company’s most recent earnings release, which can be found on our website at www.mc.com/mediacenter/pressreleaseslist.aspx. |
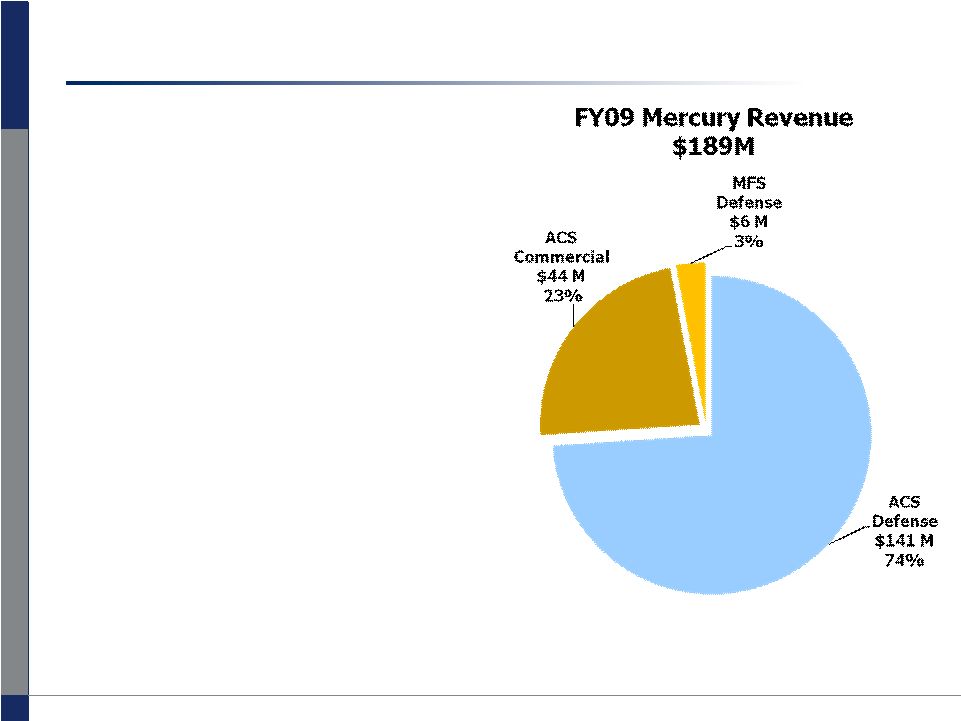 © 2010 Mercury Computer Systems, Inc. www.mc.com Mercury is a platform-independent, best-of-breed ISR systems and services company • Founded in 1981 • HQ in Massachusetts; R&D in MA, VA, AL • 513 employees • Leading provider of commercial high-performance signal, image and sensor processing • Focused on growing defense ISR market • FY2009 revenues of $189M • NASDAQ: MRCY 2 Note: $189M Total Revenue includes $2M interco eliminations |
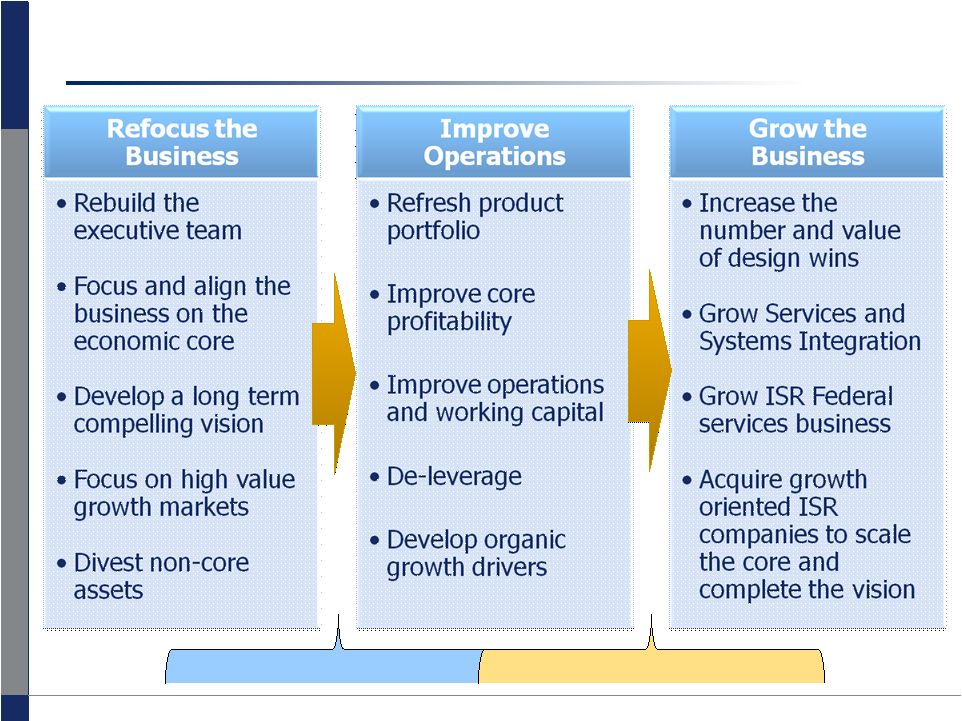 © 2010 Mercury Computer Systems, Inc. www.mc.com 3 Phases of Mercury's transformation 3 Overlapping Phases – Parallel Execution |
 © 2010 Mercury Computer Systems, Inc. www.mc.com 5 key business growth drivers 4 • Product Portfolio Refresh • Application Expansion • Platform Penetration • Customer Expansion • Expand Total Addressable Market to $3.5B • Increased System Content • Platform Penetration • Application Expansion • Expand Total Addressable Market to $30B Defense Electronics Market • Focus on Persistent ISR • Growth in Federal Services • Filed $100M Universal Shelf • Complementary ISR Businesses • Semiconductor Market Rebound |
 © 2010 Mercury Computer Systems, Inc. www.mc.com Success in semiconductor equipment – position controller for lithography Application Requirement: • Low-latency, deterministic processing for precision control in Stepper/Scanners Initial Deal: • $10M pre-production orders booked and partially shipped • Starting to receive production orders • Integrated platforms for production (immersion/EUV, new/upgrades) Advanced processing technology: • AdvancedTCA utilizing serial RapidIO 5 Total Opportunity Potential: ~$100M over 5 years Note: Potential is 5 year probable value based on customer-supplied information at time design win awarded. Actual program value may be higher or lower |
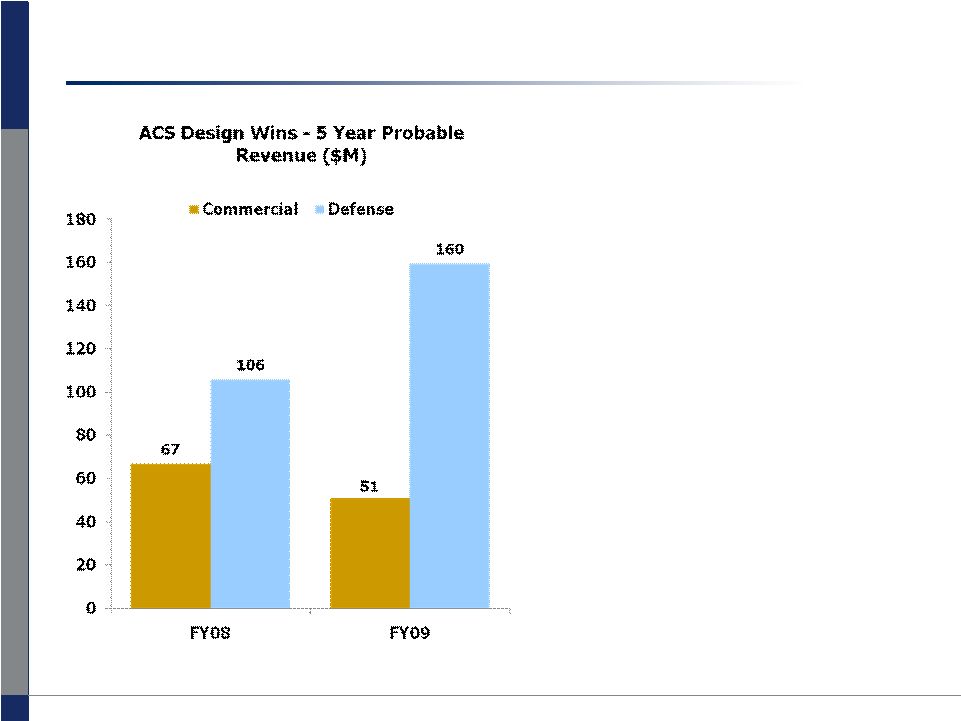 © 2010 Mercury Computer Systems, Inc. www.mc.com ACS 5-year design win value increased 22% overall in FY09 with 51% growth in defense 6 Defense Highlights • Aegis – Naval BMD, C4I • Missile Defense – Ground Radar • Argon – Naval SIGINT • Predator – Airborne Radar • JCREW – Ground SIGINT • Rivet Joint – Airborne SIGINT • Gorgon Stare – Airborne ISR • NASP – Airborne Sonar • Guardrail – Airborne SIGINT Commercial Highlights • KLA Tencor – Semiconductor • Hughes – Satellite Comms • Rapiscan – Baggage Scanning • L3 – Baggage Scanning • ASML – Semiconductor Note: Potential is 5 year probable value based on customer-supplied information at time design win awarded. Actual program value may be higher or lower |
 © 2010 Mercury Computer Systems, Inc. www.mc.com AEGIS BMD radar processing • Selected for BMD Radar – Most powerful deployed embedded computer for digital beam-forming – Extend to Radar Control System • Addressable market 60 ships out of 92 – Plan of Record for ship upgrade: 7 Total 5 year opportunity: $100M 2011 2012 2013 2014 2015 Total 6 6 6 6-8 6-8 30-34 • Additional 8 ships to be built • Upside with sales and additional ships in out years |
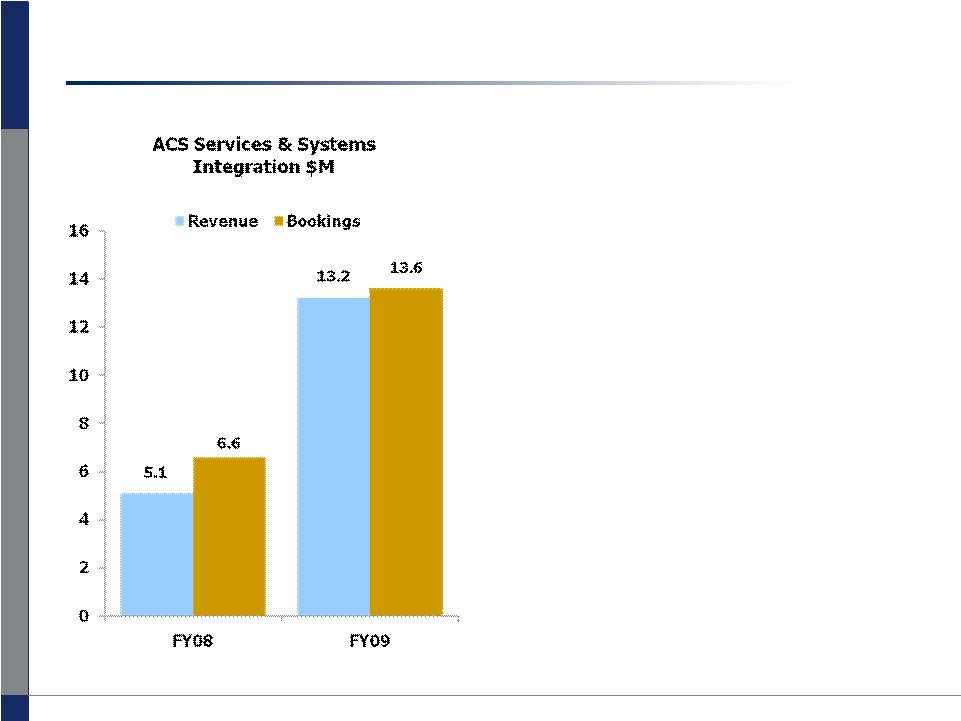 © 2010 Mercury Computer Systems, Inc. www.mc.com Services and Systems Integration drove significant revenue growth in its first full year of operation • Expand ACS total addressable market • From startup in FY08, FY09 bookings growth +106%, revenue growth +157% • FY09 proved the business model and potential • Enables substitute and 3 rd party technologies e.g. blade computing • Enables faster time to revenue on programs and increased deal sizes 8 |
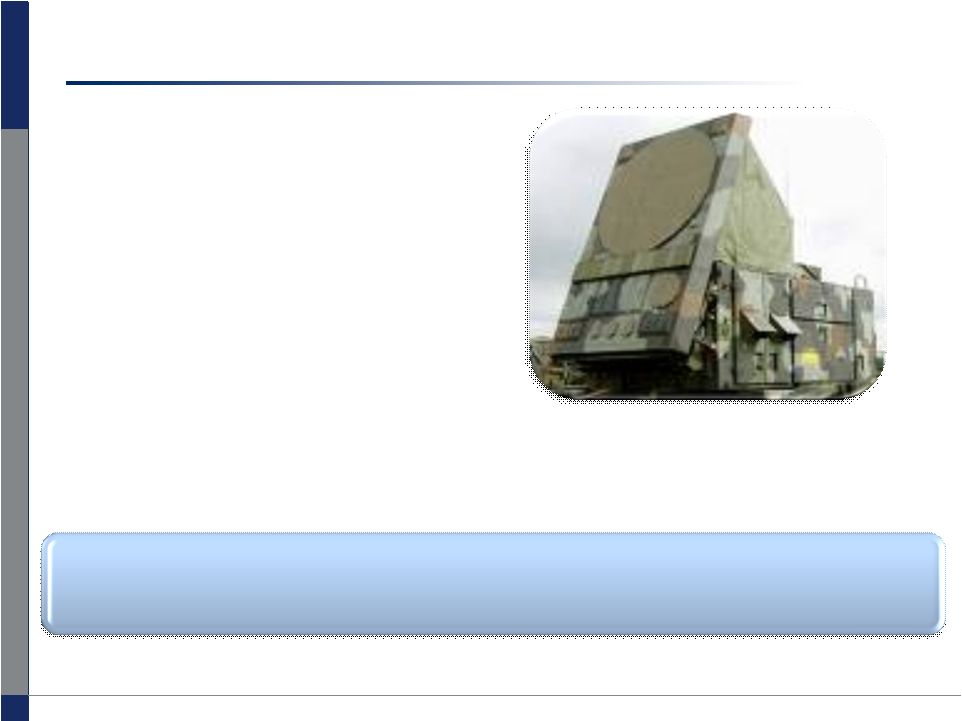 ©
2010 Mercury Computer Systems, Inc. www.mc.com Success in Services & System Integration – Radar Digital Processor Project Requirement: • Phased Array Radar for Ground Missile Defense (FMS) Initial Deal: • $12M engineering services and system integration • $6M production order (1 country) Advanced processing technology: • OpenVPX™ embedded computing 9 Future Opportunity Potential: $12M total production for next 2 countries; ~15-20 countries expected to follow Note: Potential is 5 year probable value based on customer-supplied information at time design win awarded. Actual program value may be higher or lower |
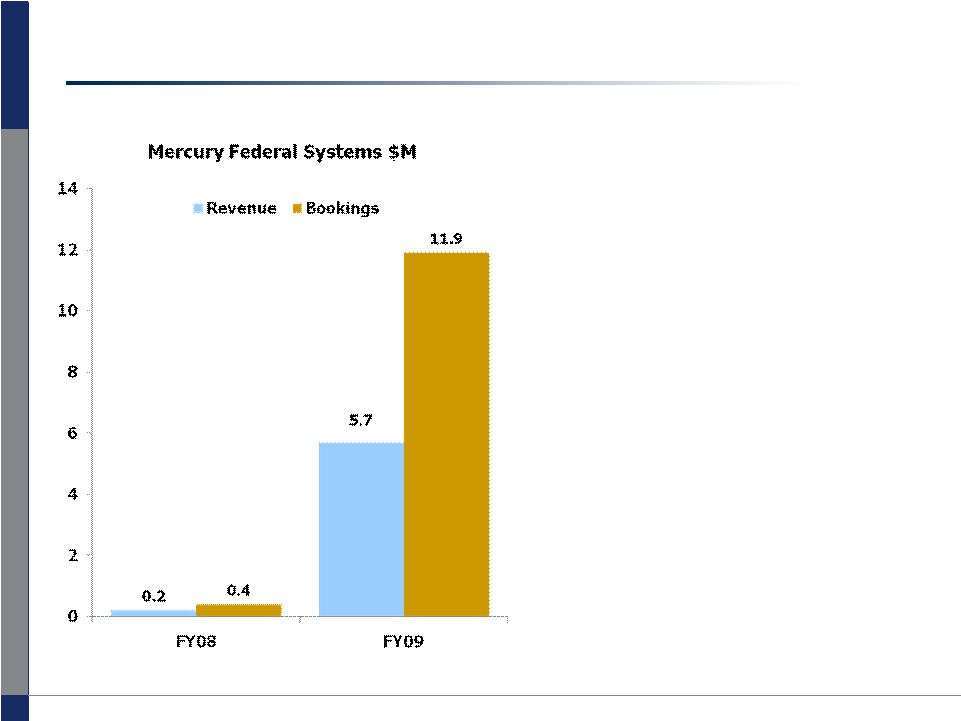 ©
2010 Mercury Computer Systems, Inc. www.mc.com • Strong revenue ($5.7M) and bookings ($11.9M) in FY09 • Concurrently, generating new opportunities for ACS • 8 active engagements; 3 direct prime contracts • Recognized by the DoD as advanced processing architects for next-gen airborne ISR systems Mercury Federal Systems (MFS) delivered significant first year bookings and revenue 10 |
 ©
2010 Mercury Computer Systems, Inc. www.mc.com MFS success story – Wide Area Airborne Surveillance Project Requirement: • Concurrent near real-time situational awareness for MQ-9 Reaper UAV (Gorgon Stare) Initial Deal: • $7M bookings • 1/2 hardware / software • 1/2 engineering services Advanced processing technology: • Embedded GPUs w/IO 11 Total Opportunity Potential: ~ $20M Note: Potential is 5 year probable value based on customer-supplied information at time design win awarded. Actual program value may be higher or lower |
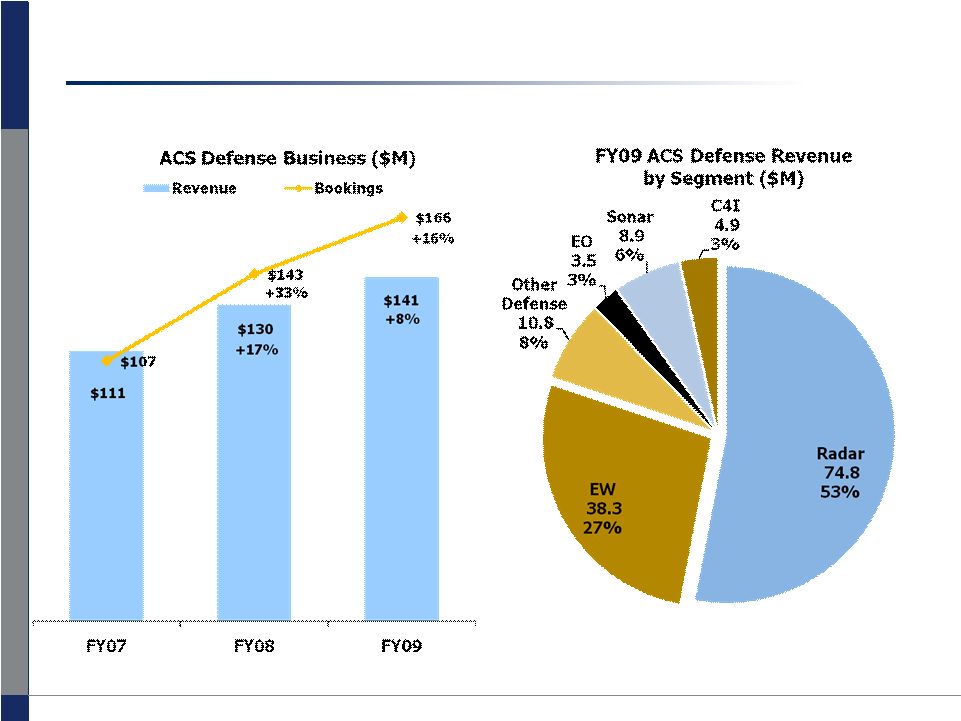 ©
2010 Mercury Computer Systems, Inc. www.mc.com Strength in ACS defense markets • Radar (32% CAGR FY07-09) and EW (9% CAGR) driving growth 12 |
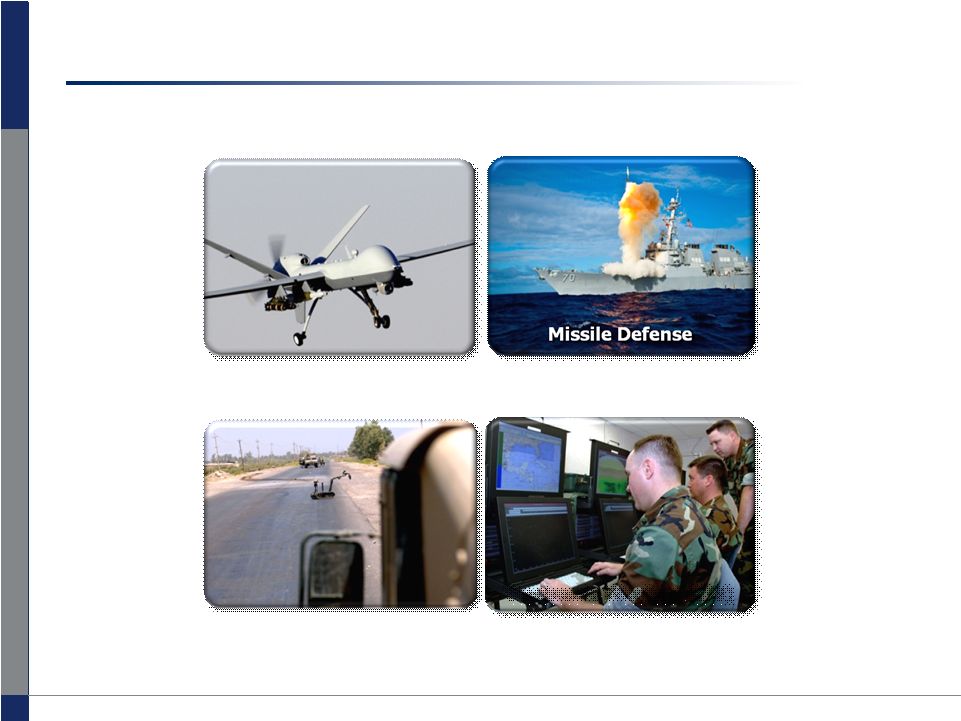 ©
2010 Mercury Computer Systems, Inc. www.mc.com Airborne ISR Airborne ISR Airborne ISR Key defense platforms and programs driving growth Representative Program List 13 Counter IED Counter IED Counter IED Electronic Warfare (EW) Electronic Warfare (EW) Global Hawk Predator/Reaper Rivet Joint Gorgon Stare F-16 F-35 JSF BAMS MESA P8-MMA MP-RTIP Aegis RDP - Ground Missile Defense Radar THAAD JCREW Software Defined Jammer Guardrail SSEE(F) CADF Deepwater |
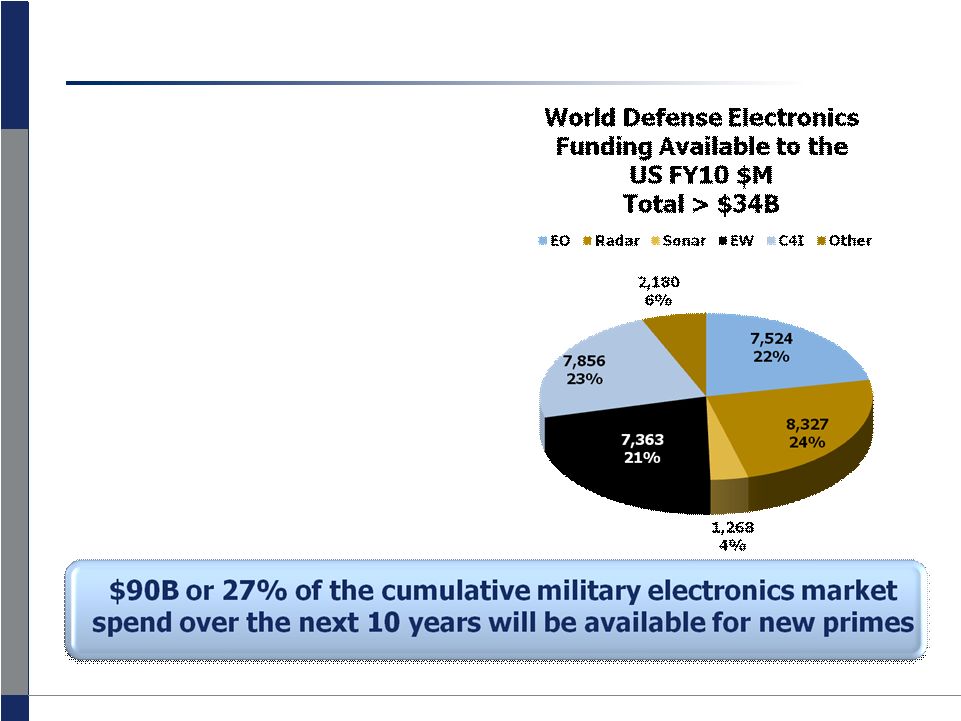 ©
2010 Mercury Computer Systems, Inc. www.mc.com Military electronics is a market sweet spot 14 • Retrofit and upgrades remain strong for legacy programs • Increased need for EW; intelligence, surveillance, reconnaissance assets • Networked nodal platforms, time to information • Next-gen onboard processing, exploitation and dissemination architecture critical Sources : The Military Electronics Briefing, 2008 Ed. , The TEAL Group, Frost & Sullivan, U.S C4ISR Market 2007 |
 ©
2010 Mercury Computer Systems, Inc. www.mc.com To the warfighter, time to information is critical to address the growing gap between: 15 What’s analyzed? What’s collected? 100GB per mission 100TB per mission Force Protection Mission Critical Real-time Forensics Last 18 hours Recent minutes For decision makers who need timely, actionable, and relevant information What’s actionable? ? |
   © 2010 Mercury Computer Systems, Inc. www.mc.com 16 Airborne ISR R&D costs Signal Processing / Systems Integration Platform Sensor Datalink Ground Station 10% 40% 30% 5% 15% 45% 10% 15% 10% 10% 5% 5% Datalink Platform Sensor Ground Station Application Acceleration/ Systems Integration Warfighter Terminals Warfighter Terminals Broadcast Provision Broadcast Provision Budget priorities being realigned to maintain technology edge Source: DoD Budget Request FY93 and FY2008 1993 2008 Mercury’s Opportunity Mercury’s Opportunity |
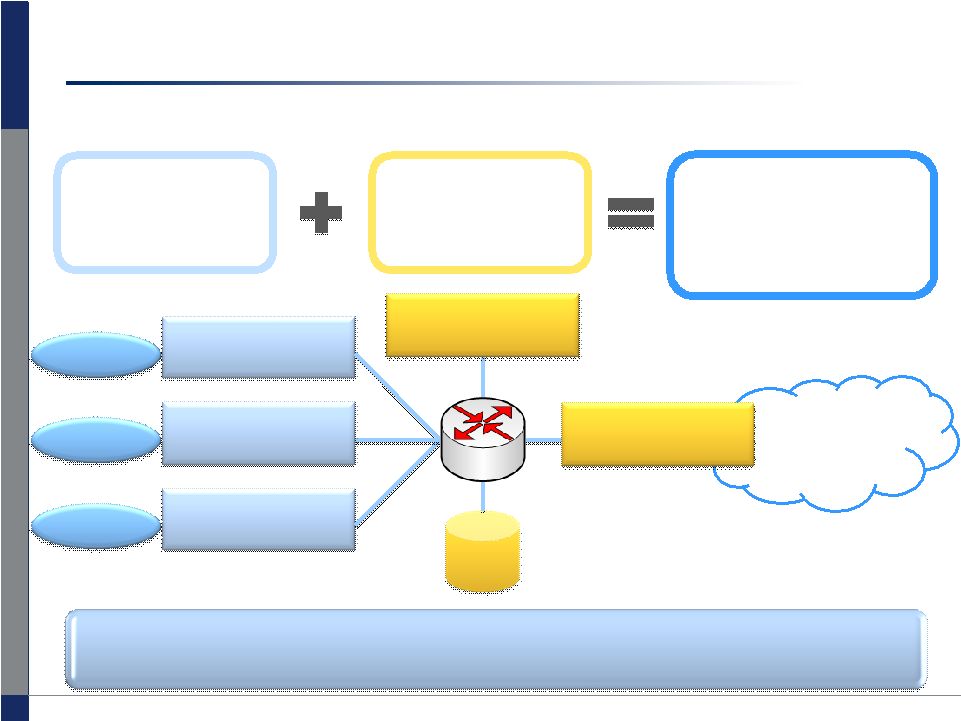     © 2010 Mercury Computer Systems, Inc. www.mc.com Mercury's new Converged Sensor Network™ (CSN™) vision for persistent ISR A revolutionary open architecture that combines 17 Global Information Grid Video Radar SIGINT SAN Signal Processing Signal Processing Image Processing Information Dissemination Data Exploitation Information Management Technologies Multi-Sensor Signal Processing Transformational Access to Information in the Tactical Edge Become the government’s trusted partner for next-generation ISR platform signal processing and computing |
 ©
2010 Mercury Computer Systems, Inc. www.mc.com Government/DoD frustration leads to defense procurement reform Today’s Model • Government frustrated with current model • Platform-centric approach • Proprietary closed system architectures • Significant cost overruns • Significant schedule slips Emerging Model • Best-of-breed model emerging • More commercial items • Open platform-independent architectures • QRC – rapid deployment, lower cost and risk • Likely to occur for signal processing and computing 18 Budget pressure and significant schedule slippage is leading to Defense procurement reforms that could benefit Mercury |
 ©
2010 Mercury Computer Systems, Inc. www.mc.com Positioned for growth • Focused on growing ISR market segment • Creating a platform-independent, best-of-breed ISR systems and services company • Unique capabilities in commercial high-performance embedded signal, image and sensor processing • Building government amenable business model in line with expected Defense procurement reform • Delivering strong organic growth in defense with robust target business model • Will pursue complementary ISR acquisitions to scale 19 |
 © 2010 Mercury Computer Systems, Inc. www.mc.com Financial Overview |
 ©
2010 Mercury Computer Systems, Inc. www.mc.com 21 FY07 – FY09: Restored profitability 21 Note: All historical income statement figures are as reported in the Company’s earnings press release at the end of the applicable fiscal year and have not been restated for operations that have been discontinued subsequent to that time. |
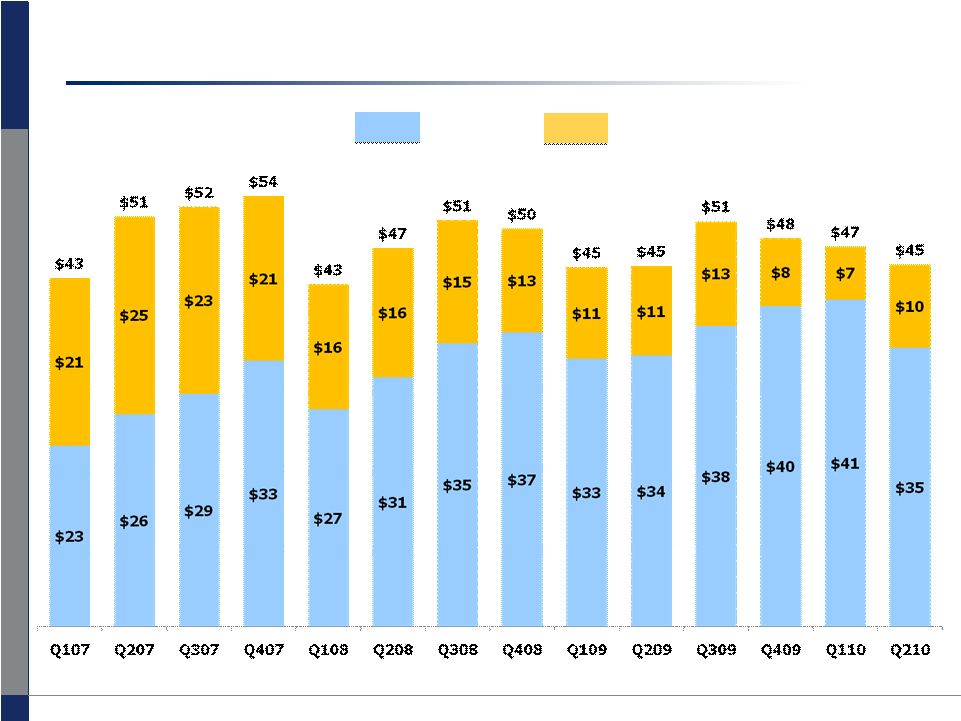 ©
2010 Mercury Computer Systems, Inc. www.mc.com 22 Strong defense revenue 22 Note: All historical figures adjusted for discontinued operations 14% Defense CAGR FY07 – FY09 Revenue ($M) Commercial Defense |
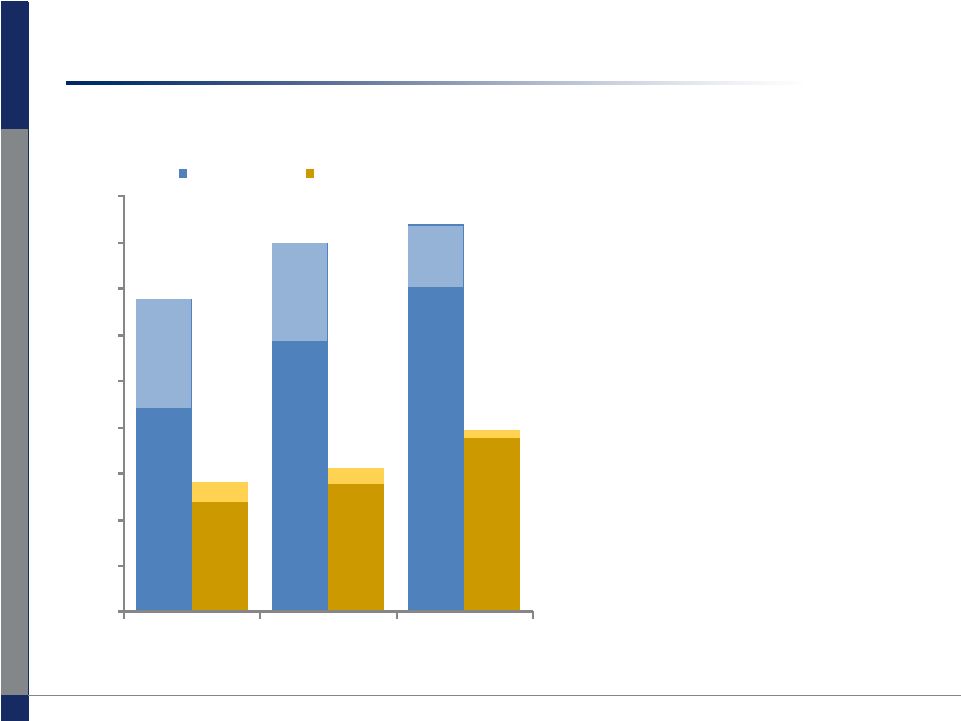 ©
2010 Mercury Computer Systems, Inc. www.mc.com Strong growth in bookings and backlog FY07-FY09: • Total Company – 11% Bookings CAGR – 18% Backlog CAGR • Defense – 28% Bookings CAGR – 28% Backlog CAGR 23 23 Note: Historical figures adjusted for discontinued operations Bookings Total Company $M Ending Backlog 170 199 210 70 78 98 0 25 50 75 100 125 150 175 200 225 FY07 FY08 FY09 Defense $107 Defense $145 Defense $174 Defense $58 Defense $67 Defense $94 |
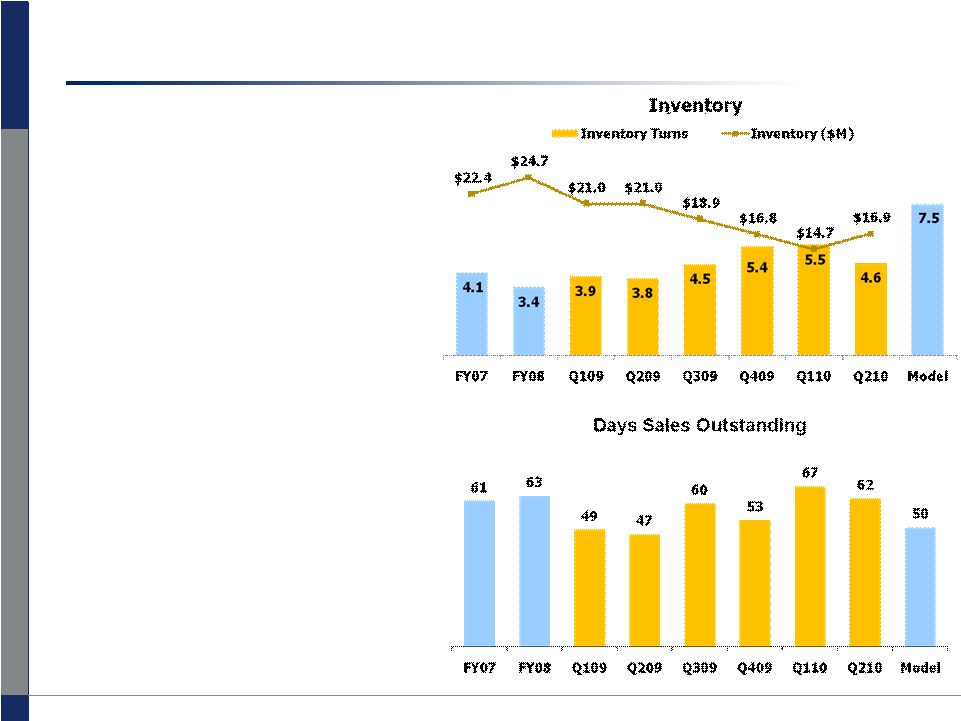 ©
2010 Mercury Computer Systems, Inc. www.mc.com Improved working capital efficiencies • Supply chain transformation - Operational efficiencies - Manufacturing lead times - Cost of quality - Competitive advantage for Mercury and customers - Inventory reduced $11.8M from Q3 FY08 to Q2 FY10 • Customer satisfaction - Blue chip customers - End-of-quarter shipment skew 24 24 |
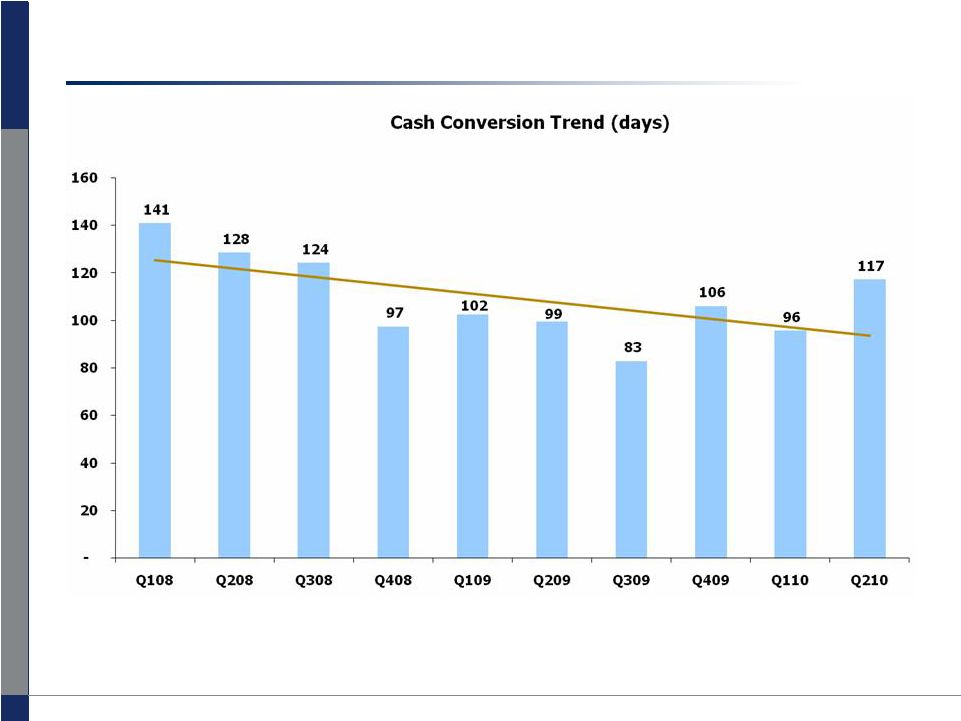 ©
2010 Mercury Computer Systems, Inc. www.mc.com Much improved cash conversion cycle 25 |
 ©
2010 Mercury Computer Systems, Inc. www.mc.com 26 Repaid debt and improved cash balance Note: ARS settlement at par ($50M) with UBS 6/30/10 Convertible Debt $125 |
  © 2010 Mercury Computer Systems, Inc. www.mc.com Strong and unencumbered balance sheet 27 • Generated $5M free cash flow in H1’10 • Zero cost ARS loan of $33M • $49M ARS balance repaid at par 6/30/10 • 22.9M diluted weighted average shares outstanding for the 3 months ending 12/31/09 Q2'10 ($M) Cash and Marketable Securities 97 Total Current Assets 153 Total Assets 227 Debt 33 Total Liabilities 73 Shareholders' Equity 154 |
 ©
2010 Mercury Computer Systems, Inc. www.mc.com 28 Robust target business model Notes: Target Business Model assumes organic growth. ACS /MFS approx 90%/10% revenue split Adj EBITDA adjusts for Depreciation 2-3% of revenue and Stock Based Comp 2-3% of
revenue Target Business Model |
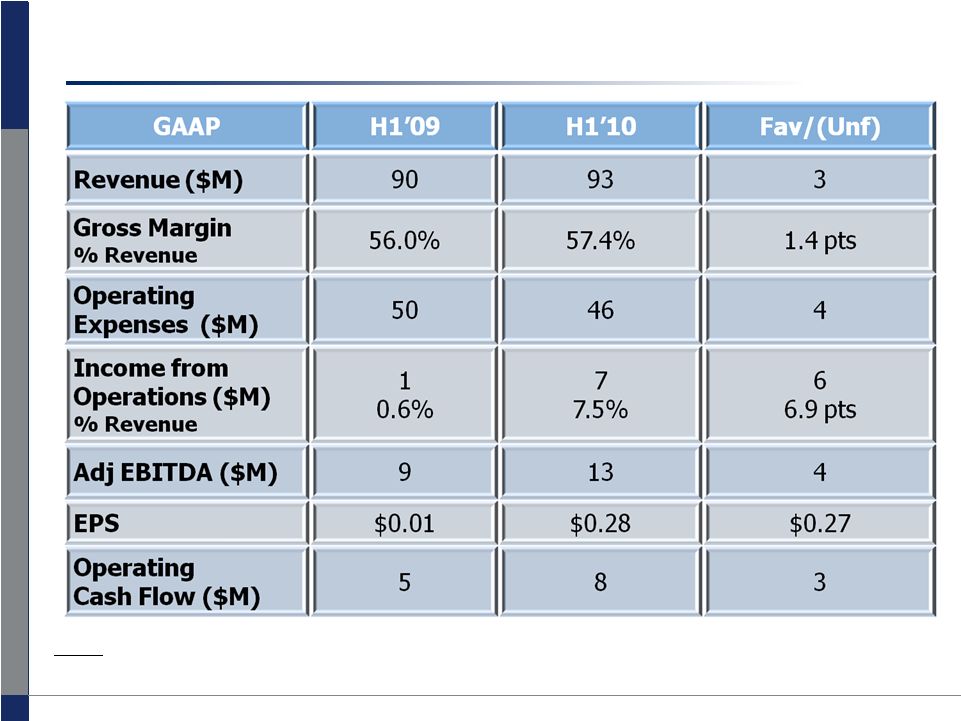 ©
2010 Mercury Computer Systems, Inc. www.mc.com 29 H1'10 prior year comparison (GAAP) 29 Notes: 1)All historical income statement figures have been restated for operations that have been
discontinued subsequent to that time. 2) Adj EBITDA is earnings before impairment
charges, interest, taxes, restructuring, stock compensation, amortization and depreciation. |
 ©
2010 Mercury Computer Systems, Inc. www.mc.com Last 10 quarter’s revenues and EPS exceeded or met the top end of guidance 30 2008 Q1 Q2 Q3 Q4 Reported Guidance Reported Guidance Reported Guidance Reported Guidance Revenue ($M) 49.2 48.0 52.6 51.0 56.5 53.0-55.0 55.2 53.0-56.0 EPS ($) 0.09 (0.08) 0.04 (0.05) 0.04 (0.04)- 0.00 0.01 (0.05)- 0.01 2009 Q1 Q2 Q3 Q4 Revenue ($M) 49.1 47.0-49.0 50.7 47.0- 49.0 50.6 48.0-50.0 48.4 46.0- 48.0 EPS ($) 0.07 (0.07)- (0.03) 0.03 (0.05)- 0.00 0.20 0.05-0.09 0.13 0.05- 0.08 2010 Q1 Q2 Q3 Q4 Revenue ($M) 47.4 43.0-45.0 45.2 40.0- 42.0 EPS ($) 0.19 0.03-0.08 0.08 (0.08)- (0.04) Note: Non-GAAP GAAP |
 ©
2010 Mercury Computer Systems, Inc. www.mc.com Q3’10 guidance ($M) 31 Quarter Ending March 31, 2010 Low High Revenues $41 $43 GAAP EPS ($0.15) ($0.11) Adj EBITDA ($1.1) $0.1 Note - Adj EBITDA Adjustments: Net Income (3.5) (2.5) Stock compensation 1.2 1.2 Interest Expense 0.1 0.1 Interest Income (0.1) (0.1) Taxes (0.6) (0.5) Amortization 0.4 0.4 Depreciation 1.4 1.4 Adj EBITDA (1.1) 0.1 |
 ©
2010 Mercury Computer Systems, Inc. www.mc.com Financial summary • Returned to profitability • 11% bookings and 18% backlog growth (CAGR) • Improved working capital efficiencies • Healthy cash flows from operations • Strong and unencumbered balance sheet • Robust target business model 17-18% Adj. EBITDA • $100M shelf registration effective 32 |
 ©
2010 Mercury Computer Systems, Inc. www.mc.com www.mc.com NASDAQ: MRCY Thank You 33 |
 © 2010 Mercury Computer Systems, Inc. www.mc.com Appendix |
 ©
2010 Mercury Computer Systems, Inc. www.mc.com 35 GAAP to Non-GAAP Reconciliation ($M) Notes: 1)FY07 – FY08 income statement figures are as reported in the Company’s earnings press release at the
end of the applicable fiscal period 2)FY09 income statement figures are restated for
discontinued operations as reported 3)GAAP related items: stock comp, amortization,
restructuring and adjustment to taxes Year Ended Year Ended Year Ended June 30, 2007 June 30, 2008 June 30, 2009 GAAP net income (loss) ($37.8) ($35.4) ($1.3) Adjustment to exclude stock-based compensation 10.6 10.4 4.6 Adjustment to exclude inventory write-down 0.0 0.8 0.0 Adjustment to exclude in-process research and development 3.1 0.0 0.0 Adjustment to exclude amortization of acquired intangible assets 7.2 7.3 2.4 Adjustment to exclude impairment of goodwill and long-lived assets 0.1 18.0 0.0 Adjustment to exclude restructuring 5.5 5.2 1.7 Adjustment to exclude gain on sale of long-lived assets 0.0 (3.2) 0.0 Adjustment for tax impact 5.2 0.2 (5.6) Non-GAAP net income (loss) ($6.2) $3.3 $1.8 Adjustment to exclude taxes and other income (expense) 7.8 2.8 0.2 Non-GAAP Income (loss) from operations ($14.0) $0.5 $1.6 GAAP net income (loss) ($37.8) ($35.4) ($1.3) Adjustment to exclude loss from disco ops, net of income taxes (8.9) (30.0) (20.3) Adjustment to exclude gain (loss) on sale of disco ops 0.0 (1.0) 11.1 GAAP net income (loss) from continuing operations ($28.9) ($4.4) $7.9 Adjustment to exclude GAAP related items (3) 3.1 Non-GAAP net income (loss) from continuing operations $11.0 Adjustment to exclude taxes and other income (expense) 5.4 Non-GAAP Income (loss) from continuing operations $16.4 Net income (loss) per share - Diluted - GAAP ($1.78) ($1.64) ($0.06) Net income (loss) per share - Diluted - Non-GAAP ($0.29) $0.15 $0.08 Net income (loss) per share - continuing operations - Diluted - GAAP ($1.36) ($0.21) $0.35 Net income (loss) per share - continuing operations - Diluted - Non-GAAP $0.49 Weighted average shares - Diluted - GAAP 21.2 21.6 22.4 Weighted average shares - Diluted - Non-GAAP 21.2 22.0 22.4 |
 ©
2010 Mercury Computer Systems, Inc. www.mc.com 36 Adjusted EBITDA Reconciliation ($M) Note: All historical income statement figures have been restated for operations that have been discontinued subsequent to that time. Half Year Ended Half Year Ended Dec 31, 2008 Dec 31, 2009 Income from Operations $0.5 $7.0 Other income / (expense) (0.4) 0.6 Income Tax Expense 0.0 1.3 Net income from continuing operations $0.1 $6.3 Stock-based compensation expense 3.5 2.0 Impairment 0.0 0.1 Interest Expense 1.8 0.2 Interest Income (1.7) (0.2) Income Tax Expense 0.0 1.2 Restructuring 0.5 0.3 Amortization of acquired intangible assets 1.5 0.9 Depreciation 2.9 2.5 Adj EBITDA $8.6 $13.3 |