Attached files
| file | filename |
|---|---|
| 8-K - FORM 8-K - LENNAR CORP /NEW/ | d8k.htm |
 Strategic
Overview February 2010 Exhibit 99.1 |
 This
presentation includes "forward-looking statements," as that term is defined in the Private Securities Litigation Reform Act of 1995. These forward-looking statements include
statements regarding our business, financial condition, results of operations, cash
flows, strategies and prospects. You can identify forward-looking statements
by the fact that these statements do not relate strictly to historical or current
matters. Rather, forward-looking statements relate to anticipated or expected events, activities, trends or results. Because forward-looking statements relate to matters that have not yet occurred, these statements are inherently subject to risks and uncertainties. Many factors could cause our actual activities or results to differ materially from the activities and results anticipated in
forward- looking statements. These factors include those described under the caption “Risk Factors” in our most recent Annual Report on Form 10-K filed with the Securities and Exchange Commission. We do not undertake any obligation to update forward-looking statements,
except as required by federal securities laws. Disclaimer Statement |
 2 Business Overview |
 3 Business Overview Housing Market Is Stabilizing The housing market has continued its road back to recovery as more confident homebuyers have taken advantage of increased affordability. While high unemployment and foreclosures will continue to present challenges, consumer sentiment has significantly improved as homebuyers have recognized that the residential housing market is stabilizing. The current administration recognizes the importance of stability in the housing market; the extension and expansion of the homebuyer tax credit will continue to support housing’s road to recovery. |
 4 Business Overview Operating Focus Stabilize Balance Sheet Invest in New Strategic Opportunities Rebuild Profitability in Core Business “Moving from defense to offense” Investing through Rialto to capitalize on distressed opportunities Creating value through the cycle Reduced construction costs per square foot from peak by over 25% Reduced number of floor plans from peak by 63% Reduced avg. floor plan size from peak by 300 sq. ft. Q4’09 sales incentives are at the lowest level since Q3’06 Ample liquidity – cash balance of $1.3B at Q4’09 . (excludes NOL carryback refund of approximately $320M, expected in early 2010) Extended debt maturities with senior notes issued in April ’09 Reduced maximum JV recourse debt exposure by 84% since . peak |
 5 Stabilize Balance Sheet |
 25% 30% 35% 40% 45% 50% 55% 60% 65% 70% 75% 1998 1999 2000 2001 2002 2003 2004 2005 2006 2007 2008 2009 $0 $100 $200 $300 $400 $500 $600 $700 $800 $900 $1,000 $1,100 Stabilize Balance Sheet Strong Cash Flow Generation and Low Leverage HB Debt / Total Capital Goal 35% - 45% Operating Cash Flow (Dollars in Millions) (1) Includes $647M deferred tax asset reserve (1) 6 |
 7 Stabilize Balance Sheet Senior Notes Maturities $250 $245 $350 $250 $500 $250 $400 Oct-10 Oct-11 2012 Mar-13 Sep-14 May-15 Apr-16 Jun-17 As of November 30, 2009 6.50% Senior Notes 5.95% Senior Notes 5.50% Senior Notes 5.60% Senior Notes 5.13% Senior Notes 5.95% Senior Notes 12.25% Senior Notes (Dollars in Millions) Senior Notes maturities extend over 8 years Weighted average interest rate of 6.9% |
 8 Stabilize Balance Sheet 2009 Capital Market Transactions Issued $400 million of senior unsecured notes due in 2017. Retired $448 million of senior notes and other debt. Raised $225 million of equity under the $275 million equity draw down program to provide additional financial flexibility and capital for new opportunities. |
 9 $3.2 $5.4 $2.0 $1.5 Stabilize Balance Sheet Aggressive Inventory Reduction (Dollars in Billions) $8.6* $3.5* Peak 2006 Q4 2009 *Excludes consolidated inventory not owned Inventory 59% Land, Land Under Development and Option Deposits Construction in Progress and Finished Homesites |
 10 Homesites Owned and Controlled Stabilize Balance Sheet Aggressive Inventory Management 345,000 104,000 Peak 2006 Q4 2009 70% Peak 2006 Q4 2009 Change Owned 106,000 83,000 -22% Optioned 134,000 7,000 -95% Controlled-JVs 105,000 14,000 -87% Total 345,000 104,000 -70% |
 11 270 214 116 62 Peak 2006 Q4 2007 Q4 2008 Q4 2009 Number of Joint Ventures Joint Venture Detail JVs with recourse debt 22 JVs with non-recourse debt 17 JVs without debt 23 JV total 62 Stabilize Balance Sheet Joint Venture Reduction Strategy Near Completion 77% We project to dissolve approximately 20 additional JVs by the end of 2010. The remaining JVs will be long-term strategic and performing JVs with no reason to dissolve. |
 12 $1,764 $288 Peak 2006 Q4 2009 Stabilize Balance Sheet Significant Reduction in JV Recourse Debt Exposure Maximum JV Recourse Debt Exposure (Dollars in Millions) 84% JVs with Recourse Debt At 11/30/09 Assets $1.3B Equity $0.5B |
 13 Rebuild Profitability in Core Business |
 14 Rebuild Profitability in Core Business Division Operating Focus Operating strategy for each homebuilding division: . Carefully manage asset base . Reposition product to target first-time and value-focused homebuyers . Reduce construction costs by re-bidding and re-tooling product . Reduce S,G&A expenses by restructuring operations Each homebuilding division is focused on generating positive cash flow and operating at profitable levels |
 3% -5% 0% 0% 2% 13% 13% 15% 17% 12% 12% 9% 2% 2% -1% 0% -3% -1% 1% 2% -10% -5% 0% 5% 10% 15% 20% 25% 30% Q1 '05 Q2 '05 Q3 '05 Q4 '05 Q1 '06 Q2 '06 Q3 '06 Q4 '06 Q1 '07 Q2 '07 Q3 '07 Q4 '07 Q1 '08 Q2 '08 Q3 '08 Q4 '08 Q1 '09 Q2 '09 Q3 '09 Q4 '09 (Pre-impairment Operating Margin%) Rebuild Profitability in Core Business Focus on Increasing Operating Margins 15 |
 17% 14% 14% 16% 18% 25% 25% 26% 27% 25% 24% 20% 14% 16% 14% 14% 12% 17% 16% 18% 0% 5% 10% 15% 20% 25% 30% Q1 '05 Q2 '05 Q3 '05 Q4 '05 Q1 '06 Q2 '06 Q3 '06 Q4 '06 Q1 '07 Q2 '07 Q3 '07 Q4 '07 Q1 '08 Q2 '08 Q3 '08 Q4 '08 Q1 '09 Q2 '09 Q3 '09 Q4 '09 (Pre-impairment GM%) Rebuild Profitability in Core Business Focus on Rebuilding Gross Margins 16 |
 17 S,G&A Expenses Associate Headcount Rebuild Profitability in Core Business Focus on S,G&A Reduction $484 $135 Peak 2006 Q4 2009 3,873 14,045 Peak 2006 Q4 2009 (Dollars in Millions) 72% 72% Number of homebuilding divisions has been reduced from 124 to 26. Each division’s S,G&A has been right-sized to today’s production levels and each
division can handle additional volume with little additional overhead.
|
 18 Invest in New Strategic Opportunities |
 19 Invest in New Strategic Opportunities “Moving from Defense to Offense” Finished Homesites Examples of recent purchases of well-located homesites that are immediately ready for production, expected to generate significantly above average gross margins, with minimal incremental overhead: Baltimore, MD 39 homesites @ $60K Raleigh, NC 31 homesites @ $35K Charlotte, NC 32 homesites @ $30K Goose Creek, SC 48 homesites @ $16K Charleston, SC 48 homesites @ $18K Homestead, FL 107 homesites @ $3K San Antonio, TX 59 homesites @ $13K San Francisco, CA 33 homesites @ $139K San Bernardino, CA 38 homesites @ $28K Corona, CA 80 homesites @ $89K |
 20 Invest in New Strategic Opportunities “Moving from Defense to Offense” Lennar options homesites Starwood acquired in TOUSA auction Option to purchase 1,408 finished homesites in 38 communities . located in Jacksonville, Tampa, Orlando, and SE Florida - over a . 24 month period Right of first offer on an additional 1,348 homesites – after . the initial 24 month period Flexible takedown schedule, with low upfront option deposit, . produces high IRR opportunity Deliveries to begin in late 2010 Gross margins are projected to exceed 20%, while leveraging . S,G&A in existing divisions Starwood is responsible for costs related to finishing homesites |
 21 Invest in New Strategic Opportunities “Moving from Defense to Offense” Newhall Land Development Re-emerged as a long-term strategic JV with Lennar as a 15% equity owner, in one of the nation’s most constrained, best positioned locations for homebuilding JV is structured for success: No bank debt Over $100M of cash No Lennar guarantees Investment is low risk with very high return potential |
 22 Rialto Capital Strategic Opportunity |
 What is
Rialto? Management team led by Jeff Krasnoff (former CEO of LNR Property Corporation) with 30 years of “down-cycle skills” Started in late 2007 to help recreate some of what we accomplished together in the past • Create additional income streams from investments and fees for managing investments • Generate new opportunities for Lennar and other investors • Potential to create an asset manager/operator that can be a leader in its field • Three main areas we are focused on today Legacy securities – (RMBS and CMBS) – PPIP Distressed portfolios of commercial and residential loans – beginning with FDIC portfolios Building long-term relationships with capital sources and creating new sources of income Rialto Capital Strategic Opportunity “Moving from Defense to Offense” 23 |
 Rialto and
Lennar have a long history of identifying opportunities, particularly in troubled markets, and responding with innovative strategies that have yielded strong results Rialto Capital Strategic Opportunity Rialto and Lennar 24 Rialto Team and Lennar – Long History of Innovation and Strong Results 1986 1984 1982 1970s 1954 1990 1988 1994 1992 1998 1996 2002 2000 2006 2004 2008 Early 1980s Recession Bank / S&L Failures S&L / Real Estate Led Recession Evolution of CMBS Market Asian Financial Crisis, Russian Debt Default & LTCM Bailout Evolution of European Real Estate CMBS / Structured Finance Market U.S. Residential Dislocation and Financial Crisis Lennar, founded in 1954, has taken advantage of many real estate cycles since its formation as a homebuilder and land acquirer / developer Mr. Krasnoff’s relationship with Lennar (as outside advisor) begins 1977 Lennar was one of the first to issue builder bonds to fill home mortgage void left by failing savings & loans Mr. Krasnoff and Mr. Miller co-found LNR Property Corporation Lennar’s Asset Management Division (led by Mr. Krasnoff and the predecessor organization to LNR) honed skills working with banks and savings & loans to turn around troubled assets Early pioneer in the development of the CMBS market and first buyers of non-investment grade mortgages coupled with special servicing Producing over half of Lennar earnings, LNR spun off as a separate NYSE-listed
company Formation of Lennar Land Partners Became industry leading buyer and special servicer
of non-investment grade CMBS (thru 2007). Worked out billions of dollars of non-performing loans Entered the European market to take advantage of significant transition from public to private ownership of real estate assets Raised $1.125 billion LNR Commercial Property Investment and $700 million LNR European Investors Funds to take advantage of skills in commercial property development in US and securities and structured debt in Europe Mr. Krasnoff founded Rialto to take advantage of turmoil in today’s residential market Lennar and Rialto Closed innovative Morgan Stanley / Lennar / Rialto $525 million land venture One of the first to invest in and workout large portfolios of distressed real estate assets (>$5 billion of
non- performing loans) One of the first to enter Japan to workout large portfolios of distressed real estate assets (>$8 billion of non-performing loans) Early pioneer of commercial CDOs and B-notes LNR / Lennar acquired one of the largest public land companies (Newhall Land and Farming) that led to the creation of LandSource LNR’s $4.2 billion “go-private” transaction Lennar acquired interest in Clayton Holdings, a loan servicer Legacy Securities PPIP Fund with Rialto as sub-advisor closed after being selected by US Treasury – Potential capacity subject to final closing of $4.4 billion dedicated to CMBS and RMBS |
 Rialto Capital
Strategic Opportunity LNR Property Corporation 25 LNR Property Corporation – From Spin-off to Private Company Spin-off Date October 31, 1997 Partner(s) Public Shareholders Closing Date Feb 3, 2005 Investment (Net asset BV at spin-off) $549mm Realized Value (equity value) $2.2bn Pretax “Profit” $1.7bn Gross Multiple 1,2 4.2x IRR 1,2 24% Spin-off Summary Take-Private Summary LNR’s businesses grew to over half of Lennar’s total earnings by 1997 and to allow both it and Lennar to continue to grow more effectively, LNR was spun off on October 31, 1997 with Stuart Miller as its Chairman and Jeff Krasnoff as its President LNR completed a run of seven successful years as a public company and was profitable every quarter Public vehicle enabled investors to participate in opportunistic real estate strategies built around the core competencies of adding value to properties, loans and securities ¹ Assumes no margin leverage on purchased shares. ² Based on initial book value of net assets contributed of $15.19 per share. Opening stock price was $25.75 with a stock trading range of $12.50 - $29.88 in the first year of trading. If using the opening stock price of $25.75, the results would be a 2.5x multiple with a 14.3%
IRR. Announced in August of 2004, LNR was one of the first major real estate company take-private transactions with affiliates of Cerberus Capital in a $4.2 billion transaction Mr. Krasnoff remained as LNR’s President and CEO after the privatization until July 2007, when he left and formed Rialto At LNR oversaw the management team’s monetization of properties, raising of two funds totaling $1.8 billion, refinancing of acquisition debt, expansion of the servicing platform into Europe and continued growth of its CMBS platform Investment Highlights Stock Performance $15.19 initial book value $63.10
sale value |
 Rialto Capital
Strategic Opportunity The Rialto Team 26 Rialto’s dedicated management team is comprised of specialists in turnarounds, workouts, capital markets, land / homebuilding and commercial properties Thekla B. Salzman Chief Financial Officer (Miami) 25 yrs. Experience (19 yrs. with Mr. Krasnoff) Eric Feder Loan Workout (Miami) 19 yrs. Experience (2 yrs. with Mr. Krasnoff) Anthony Seijas REO & Servicing (Miami) 18 yrs. Experience (13 yrs. with Mr. Krasnoff) Bill Landis Chief Investment Officer (New York) 20 yrs. Experience (4 yrs. with Mr. Krasnoff) Steven I. Engel Senior Workout Advisor (New York) 30 yrs. Experience (22 yrs. with Mr. Krasnoff) Jeff Krasnoff Chief Executive Officer 30+ yrs. Experience (Former President and CEO of LNR) Controller Treasurer Legal Lennar Resources Outsourced Services provided: accounting, finance, legal counsel, human resources and IT Asset Management Teams Doug Doughty Investor Relations 13 yrs. Experience (2 yrs. with Mr. Krasnoff) Services provided: deal sourcing, market intelligence, underwriting, development and construction and sales (value creation) Lennar Division Presidents and Field Associates |
        “Price-enablement” has begun $0.95 $0.40 Price under which selling assets creates insolvency “Bid-ask” spread creating “price- disabled” seller $0.95 $0.40 Seller is “price-enabled” Rialto pricing* (Accepted) Seller’s book value (Original par = $1) “Marked-to-market” Rialto pricing* (Turned down as too low) $0.80 Price-Enabling Events Government Seizures Equity Infusion “Good / Bad” Bank Tax Incentives Recapitalization Bankruptcy Price-Enabling Events Government Seizures Equity Infusion “Good / Bad” Bank Tax Incentives Recapitalization Bankruptcy Book value becomes less important (May be under new control or difference may be “bridged” by infusion of capital or other incentives) * Pricing assumptions based on current economic conditions with a continued decline in
home values. Recent government events have provided the catalyst for the creation of
“Price Enabled” sellers and the conditions for clearing distressed assets at
commercially reasonable prices Rialto Capital Strategic Opportunity The Time is Now 27 Additional Loss Seller is Willing to Take vs. Book Value |
 New investment and co-investment opportunities such as PPIP and distressed loan portfolios New fee streams and incentive/carried interest as part of Rialto managing investments for others Potential for strategic investments with crossover Rialto investors Opportunity to participate in the creation of an asset management/operating company (similar to what became LNR) New land and community opportunities coming out of distressed bank portfolios • Potential to be a buyer of homesites that may be contained in portfolios • Exposure to assets within portfolios, even if Rialto is not the winning bidder Fee opportunities for the management and development of foreclosed properties or other real estate Rialto Capital Strategic Opportunity What Does It Mean for Lennar? 28 |
 Private Capital $1.1 Billion UST Capital $1.1 Billion Senior Treasury Loan $2.2 Billion Lennar has committed $75 million to this investment Legacy RMBS & CMBS securities rated AAA prior to 1/1/09 Senior Secured Debt from US Treasury (UST) at Libor +100 bps 10-year maturity; subject to available cash-flow amortization schedule;
pre-payable at anytime Adds 700-800 bps to unlevered yields on a hold-to-maturity and 1100 to 1300 bps on a Year 3 to Year 5 sale at pricing comparable to original acquisition Preferred return to partners of 8% before any debt amortization US Treasury has implemented the PPIP program to co-invest with private capital to help clean up legacy securities held at financial institutions; Rialto is a sub-advisor for one of the 8 approved PPIP managers. AllianceBernstein PPIP team (with Rialto as sub-advisor) has raised its $1.1 billion from a variety of sources around the world and has requested additional capacity from UST Rialto Capital Strategic Opportunity The PPIP – Capital Structure 29 Leverage 1×
|
 Investment
Portfolio A Portfolio of Securities… …Backed by Collateral… …That Consists of Real Estate Rialto Capital Strategic Opportunity PPIP Investments in AAA Securities 30 |
 Rialto Capital
Strategic Opportunity PPIP - Focus on Top of the RMBS and CMBS Structure Typical RMBS Capital Structure Typical CMBS Capital Structure 14.5% 7.3% 30.0% 20.0% 11.6% Super Senior Subordinated Junior Mezzanine Losses Principal Repayments Losses Principal Repayments Subordinated Super Duper AM AJ 31 |
 Acquisition Dates 1991-1996 Partner(s) MSREF Lehman Disposition Dates Various Lennar Total Investment ownership 15-50% $165mm $684mm Realized Value $420mm $1.4bn Pretax “Profit” $255mm $716mm Gross Multiple 2.6x 2.1x IRR 62% NA Transaction Background Compelling Return Profile - Early 1990s Distressed Real Estate Portfolios Opportunity to capitalize on the real estate recession and S&L crisis of the late 1980s / early 1990s Principals capitalized on hands-on residential and commercial development and management expertise to establish one of the first for-profit workout operations Responsible for underwriting, acquiring and handling the workout and asset management for over $5 billion of distressed assets from 1991 to 1996 Operation founded by principals around this business eventually became independent public company - LNR Property Corporation Formerly the largest S&L in FL and oldest in U.S. Acquired a $1 billion portfolio consisting of 1,100 assets from the RTC investing $17.5 million for 25% of the equity with Morgan Stanley RE Fund in its very first investment Transaction Examples Transaction Results (1991-1992) Purchased an initial 10% interest for $30 million in a $2 billion portfolio consisting of 570 assets in 35 states with Lehman Brothers. Believed to be largest NPL portfolio sale in early 1990s. (1993) Investment Highlights 1 Figures reflect LNR’s returns; investor returns are not available. AmeriFirst investment yielded a 133% IRR and a 6.9x multiple ¹ Westinghouse investment yielded a 58% IRR and a 4.5x multiple ¹ Workouts included collecting full and discounted payoffs of mortgage loans, converting NPLs to performing loans, securitizing loans, foreclosures with subsequent leasing and sales of properties Utilizing securitization as one of its key resolution strategies, principals became CMBS pioneers and transformed due diligence and workout platforms into one of the most regarded non- investment grade securities investment and special servicing businesses Rialto Capital Strategic Opportunity Parallels to the Prior Cycle 32 |
      1990s: That Was
Then… From 1984 to 1992, 1,452 banks and S&L’s were taken over Bulk of this action taken after RTC was formed in 1989 RTC finished its job and was merged into FDIC in 1995 2008-2010: This Is Now Total assets held by failed banks was $266bn Number of Banks Assets Resolution RTC/FDIC clearing process cleaned the system and allowed for banks to lend again Institutional Risk Analytics rates 2,200 Banks “F”, forecasting over 1,000 will be seized during this cycle. The 2,200 represent $4.4 trillion in assets 1990s vs. Current Cycle Rialto Capital Strategic Opportunity Bank Seizures 33 From January 2008 to 2010 YTD, approximately 180 banks have been seized FDIC currently has over 500 banks on the watch list Total assets held by failed banks was approximately $250bn (excludes $307bn for Washington Mutual) FDIC has begun the process of clearing these assets through its Structured Loan Sales program |
 Rialto Capital
Strategic Opportunity FDIC Portfolio Ownership Structure 34 FDIC Debt: $627M (2) FDIC Structure FDIC contributes loans into an LLC and sells a 40% equity interest in the assets FDIC provides 50% nonrecourse financing in the form of purchase money notes at 0% interest rate – all cash flows go to repay notes until fully defeased An additional $22M funded for working capital reserves (plus $32M funded by the FDIC), which will be used to fund day-to-day expenses of managing the portfolio $10M guarantee for performance only in effect until termination of the venture Each 10 cents of resolution value over our 40 cent purchase price creates approximately $122 million of profit Total UPB: $3.05 Bn (1) Lennar/Rialto Equity: $243M Total Purchase Price: $1.22 Bn (40% of UPB) Sources Uses FDIC Equity: $365M Total KBW and Pentalpha Portfolios 1) UPB before accrued interest, late charges and property protection advances 2) Includes an $18 million FDIC guarantee fee, which is not included in the purchase price
of the portfolio of loans |
   Rialto Capital
Strategic Opportunity FDIC Portfolios 35 FDIC Portfolios – Resi and Commercial AD&C* Unpaid Principal Balance: # of Loans: Average Balance: Geography: $3.05bn ¹ ~5,500 $555K GA – 33% NV – 19% AZ – 11% FL – 9% Non-Performing: Collateral: 90% Residential: Partially Dev. Land: 25% Dwellings: 24% Raw Land: 10% Finished Homesites: 9% Commercial: Retail: 8% Office/Industrial: 7% Other: 6% Portfolio is comprised primarily of full recourse AD&C loans to developers and homebuilders, with many small loans to individual borrowers *Acquisition, development and construction 1 Excludes accrued interest, default interest, late charges and property protection advances Purchase Price: $1.22bn Equity: $243M CA – 7% WA – 3% OR – 3% TX – 2% Due Diligence/Underwriting Strategy Extensive due diligence process over the past four months, with over 30 underwriters working in tandem with local Lennar
personnel and other third party firms Process included detailed file reviews of loan documents, site
visits, market reviews, comparable sales, residual analyses, development costs, alternate property uses, independent appraisals, outstanding liens (including
property taxes), borrower evaluations, etc. Each loan evaluated (e.g., foreclosure, deed-in-lieu, short sale, discounted payoff, restructure, etc.) and estimated the likely timing and costs involved Once completed, all underwritings were reviewed through a number of ‘
round tables’, wherein each asset was presented by the underwriter to the broader Rialto team – adjustments were made accordingly Cash flows from this work were rolled up into a model taking into cash flow
waterfalls as outlined by the FDIC and discounted back at appropriate return levels to determine the appropriate bid prices |
                        Example of Creating
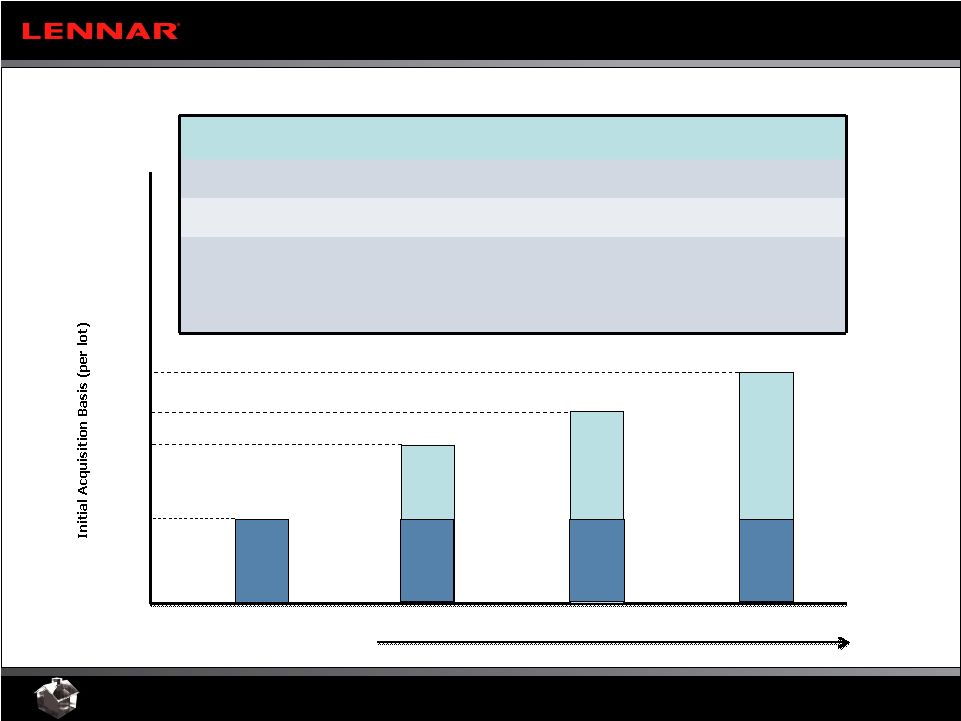
Value by Monetizing Assets Rialto Capital Strategic Opportunity FDIC Portfolios – Investment Process 36 Solution Discounted Payoff Foreclose + Liquidate Value Add Multiple (examples) ~1.3x – 2.0x ~1.75-2.5x ~2.0x – 3.0x IRR (examples) 30%+ ~25% ~20-25% Comments Borrower pays off loan at discount to par and greater than 1.0x multiple of purchase price; simplest workout option Go through foreclosure process; take back asset. Sell to a builder/developer/ investor often as is or in bulk. May hold until market conditions improve. Develop, redevelop and/or lease and then sell improved property $60K $20K Discounted Payoff Foreclose + Liquidate Value Add Timeline Shorter-Term Longer-Term Original Purchase Price $50K $40K |
 37 Rialto Capital Strategic Opportunity Conclusion Right Team, Right Time, Right Opportunity Cycle-tested team with significant workout experience (e.g., condos in 1980s, RTC in the
early 1990s, Japanese loan workouts in late 1990s, Europe in the early 2000s) Part of team selected by US Treasury as one of 8 PPIP fund managers. Recently completed $1.1B capital raise. Lennar committed to invest $75 million. Comprehensive GP platform – combines the down-cycle turnaround skills of the Rialto
management team directly with the deep operational infrastructure of Lennar and Clayton
Investment strategy requires local market knowledge and a large organization to process deal flow (Lennar has approximately 4,000 professionals throughout its national footprint,
Clayton has up to 1,400+ loan / asset specialists) Few firms have capabilities to underwrite certain targeted deal flow (ADC, CDD, etc.), likely resulting in less competition for acquisitions Strong deal sourcing capabilities by leveraging the Rialto and Lennar networks Lennar’s strategic investments in PPIP and FDIC portfolios are accretive transactions
helping to rebuild profitability |