Attached files
| file | filename |
|---|---|
| 8-K - POPULAR, INC. 8-K - POPULAR, INC. | a6169432.htm |

Investor Presentation Stern Agee-Financial Services Symposium February 9th, 2010 Exhibit 99.1

Forward Looking Statements Statements contained in this Presentation that are not based on current or historical fact are forward-looking in nature. Such forward-looking statements are based on current plans, estimates and expectations and are made pursuant to the Private Securities Litigation Reform Act of 1995. Forward-looking statements are based on known and unknown risks, assumptions, uncertainties and other factors. The Company's actual results, performance, or achievements may differ materially from any future results, performance, or achievements expressed or implied by such forward-looking statements. The Company undertakes no obligation to publicly update or revise any forward-looking statement. The financial information included in this presentation for the fourth quarter and year ended December 31, 2009 is based on preliminary unaudited data and is subject to change.
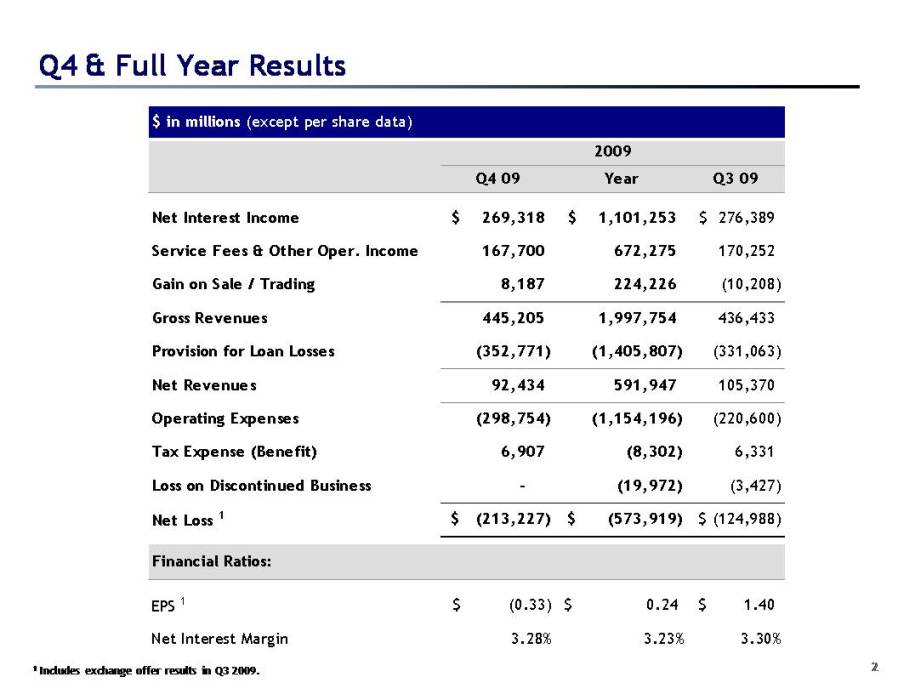
Q4 & Full Year Results 1 Includes exchange offer results in Q3 2009.
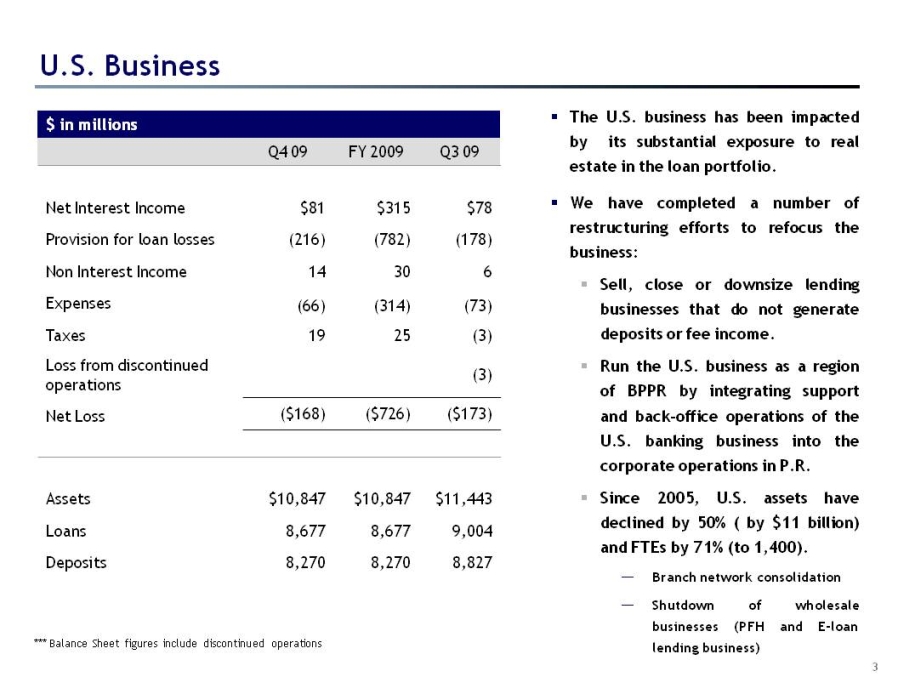
Q4 09 FY 2009 Q3 09 Net Interest Income $81 $315 $78 Provision for loan losses (216) (782) (178) Non Interest Income 14 30 6 Expenses (66) (314) (73) Taxes 19 25 (3) Loss from discontinued operations (3) Net Loss ($168) ($726) ($173) Assets $10,847 $10,847 $11,443 Loans 8,677 8,677 9,004 Deposits 8,270 8,270 8,827 The U.S. business has been impacted by its substantial exposure to real estate in the loan portfolio.We have completed a number of restructuring efforts to refocus the business:Sell, close or downsize lending businesses that do not generate deposits or fee income.Run the U.S. business as a region of BPPR by integrating support and back-office operations of the U.S. banking business into the corporate operations in P.R. Since 2005, U.S. assets have declined by 50% ( by $11 billion) and FTEs by 71% (to 1,400).Branch network consolidation Shutdown of wholesale businesses (PFH and E-loan lending business) *** Balance Sheet figures include discontinued operations
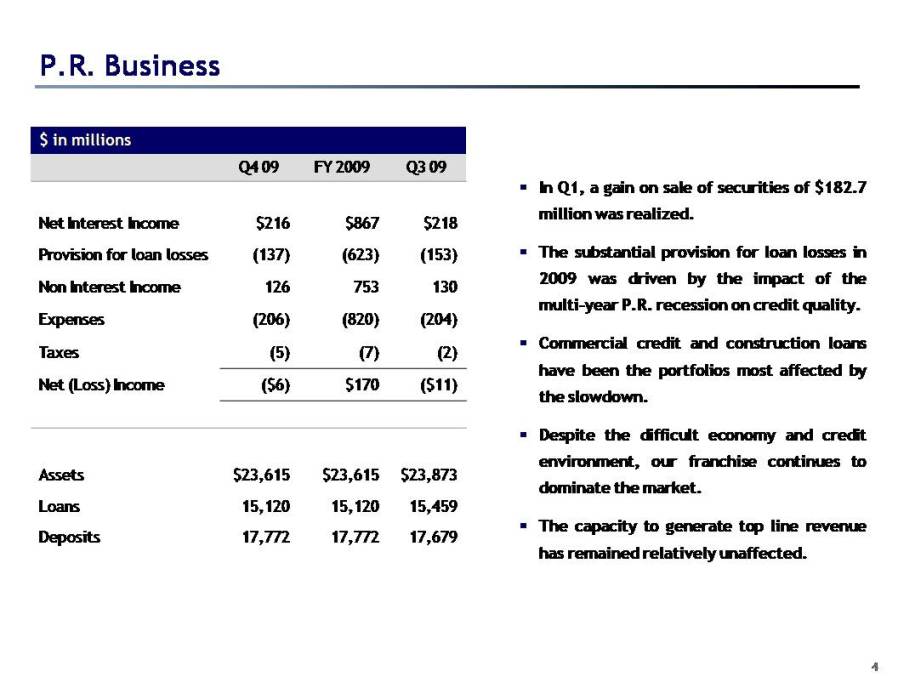
P.R. Business In Q1, a gain on sale of securities of $182.7 million was realized. The substantial provision for loan losses in 2009 was driven by the impact of the multi-year P.R. recession on credit quality. Commercial credit and construction loans have been the portfolios most affected by the slowdown. Despite the difficult economy and credit environment, our franchise continues to dominate the market. The capacity to generate top line revenue has remained relatively unaffected.
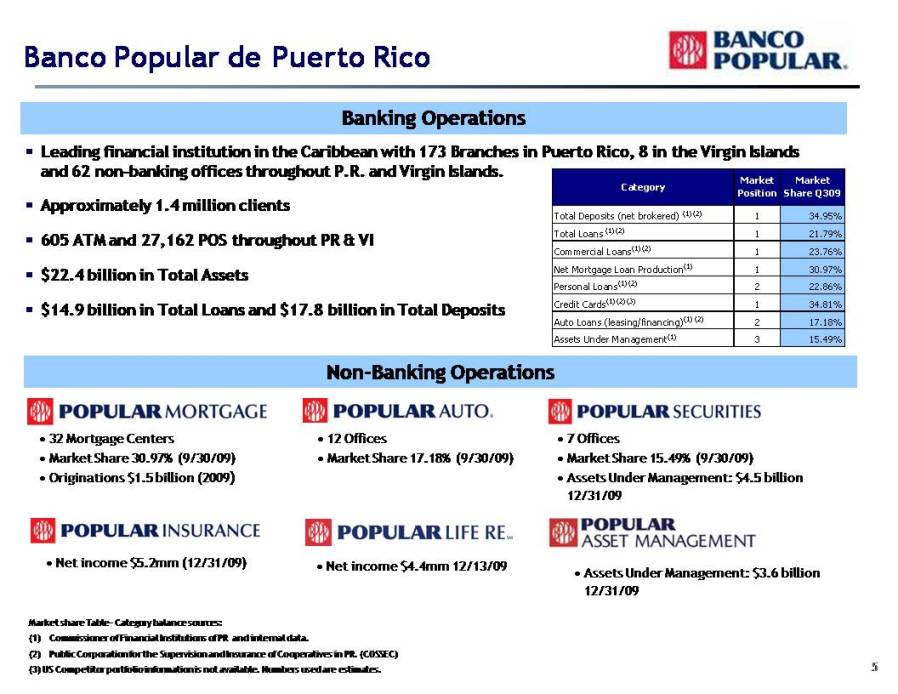
Banking Operations Non-Banking Operations Leading financial institution in the Caribbean with 173 Branches in Puerto Rico, 8 in the Virgin Islands and 62 non-banking offices throughout P.R. and Virgin Islands. Approximately 1.4 million clients 605 ATM and 27,162 POS throughout PR & VI $22.4 billion in Total Assets $14.9 billion in Total Loans and $17.8 billion in Total Deposits Net income $5.2mm (12/31/09) 7 OfficesMarket Share 15.49% (9/30/09) Assets Under Management: $4.5 billion 12/31/09 12 Offices Market Share 17.18% (9/30/09) 32 Mortgage Centers Market Share 30.97% (9/30/09) Originations $1.5 billion (2009) Banco Popular de Puerto Rico Net income $4.4mm 12/13/09 Assets Under Management: $3.6 billion 12/31/09 Market share Table- Category balance sources: Commissioner of Financial Institutions of PR and internal data. Public Corporation for the Supervision and Insurance of Cooperatives in PR. (COSSEC) (3) US Competitor portfolio information is not available. Numbers used are estimates.
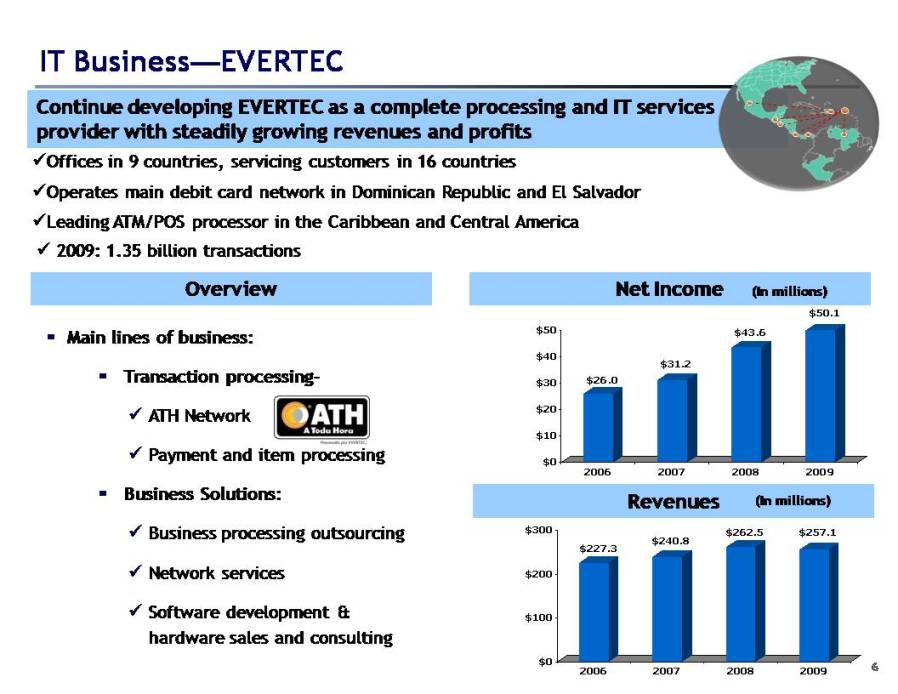
6 IT Business—EVERTEC Main lines of business: Transaction processing- ATH Network Payment and item processing Business Solutions: Business processing outsourcing Network services Software development & hardware sales and consulting Overview Continue developing EVERTEC as a complete processing and IT services provider with steadily growing revenues and profits Offices in 9 countries, servicing customers in 16 countries Operates main debit card network in Dominican Republic and El Salvador Leading ATM/POS processor in the Caribbean and Central America Revenues Net Income (In millions) (In millions) 2009: 1.35 billion transactions
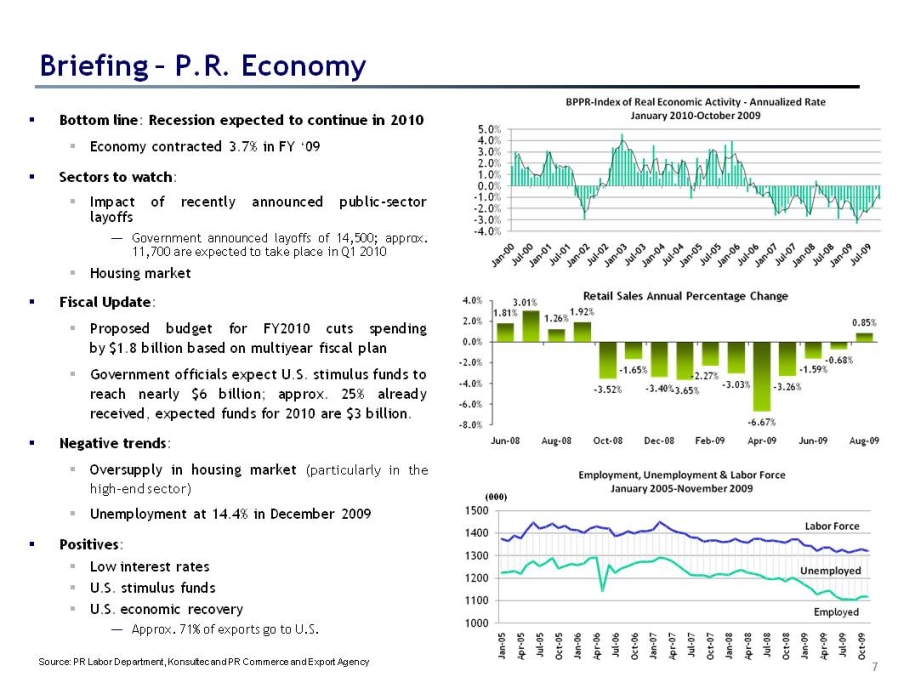
Briefing – P.R. Economy Bottom line: Recession expected to continue in 2010 Economy contracted 3.7% in FY ‘09 Sectors to watch: Impact of recently announced public-sector layoffs Government announced layoffs of 14,500; approx. 11,700 are expected to take place in Q1 2010 Housing market Fiscal Update: Proposed budget for FY2010 cuts spending by $1.8 billion based on multiyear fiscal plan Government officials expect U.S. stimulus funds to reach nearly $6 billion; approx. 25% already received, expected funds for 2010 are $3 billion. Negative trends: Oversupply in housing market (particularly in the high-end sector) Unemployment at 14.4% in December 2009 Positives: Low interest rates U.S. stimulus funds U.S. economic recovery Approx. 71% of exports go to U.S. % (000) Source: PR Labor Department, Konsultec and PR Commerce and Export Agency
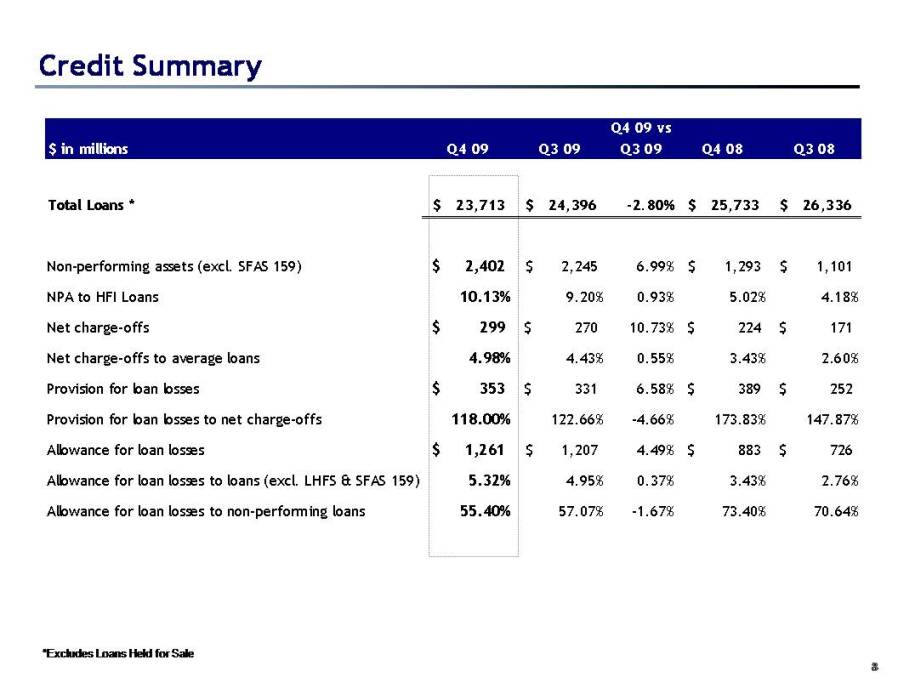
Credit Summary *Excludes Loans Held for Sale
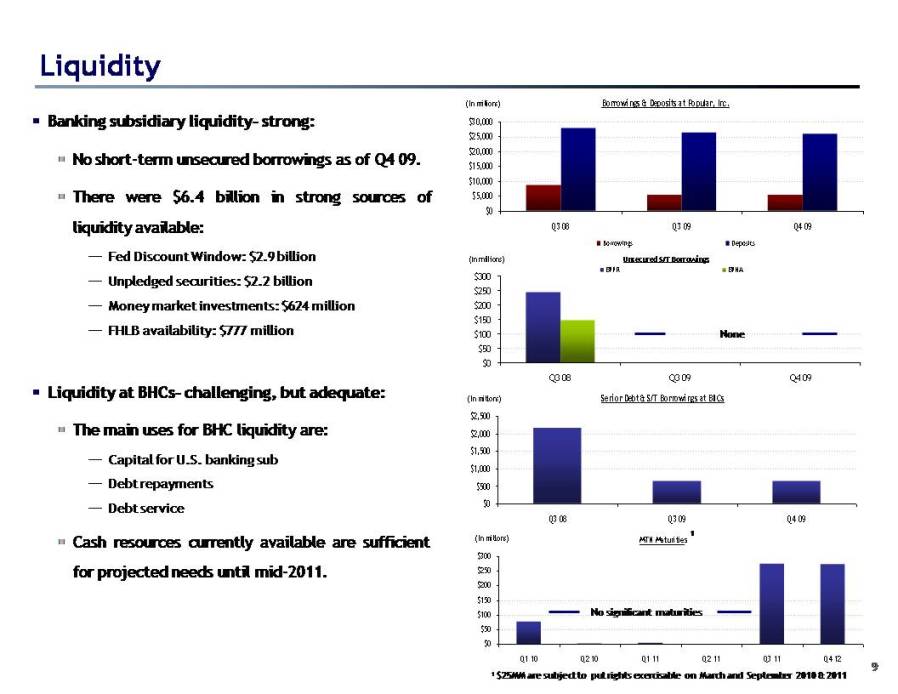
Liquidity Banking subsidiary liquidity- strong: No short-term unsecured borrowings as of Q4 09. There were $6.4 billion in strong sources of liquidity available: Fed Discount Window: $2.9 billion Unpledged securities: $2.2 billion Money market investments: $624 million FHLB availability: $777 million Liquidity at BHCs- challenging, but adequate: The main uses for BHC liquidity are: Capital for U.S. banking sub Debt repayments Debt service Cash resources currently available are sufficient for projected needs until mid-2011. 1 $25MM are subject to put rights exercisable on March and September 2010 & 2011 No significant maturities None 1
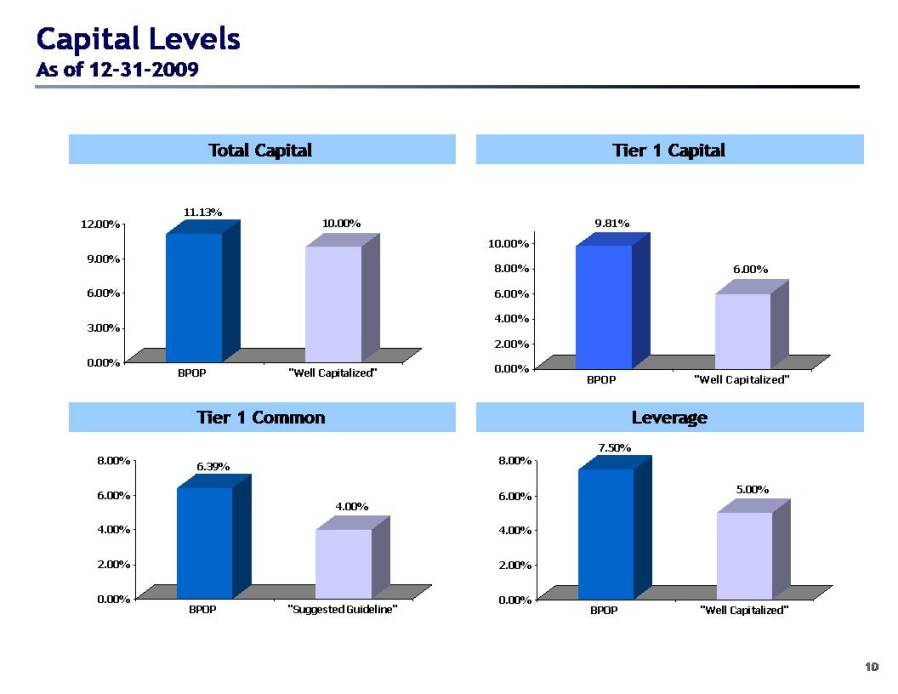
10 Capital Levels As of 12-31-2009 Tier 1 Capital Total Capital Tier 1 Common Leverage
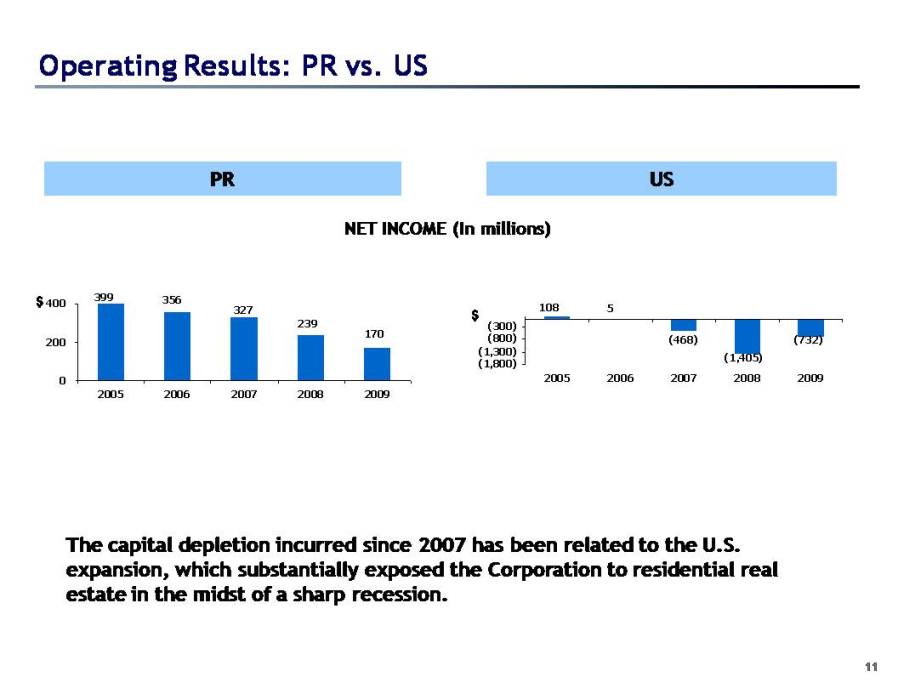
11 Operating Results: PR vs. US PR US NET INCOME (In millions) The capital depletion incurred since 2007 has been related to the U.S. expansion, which substantially exposed the Corporation to residential real estate in the midst of a sharp recession. $
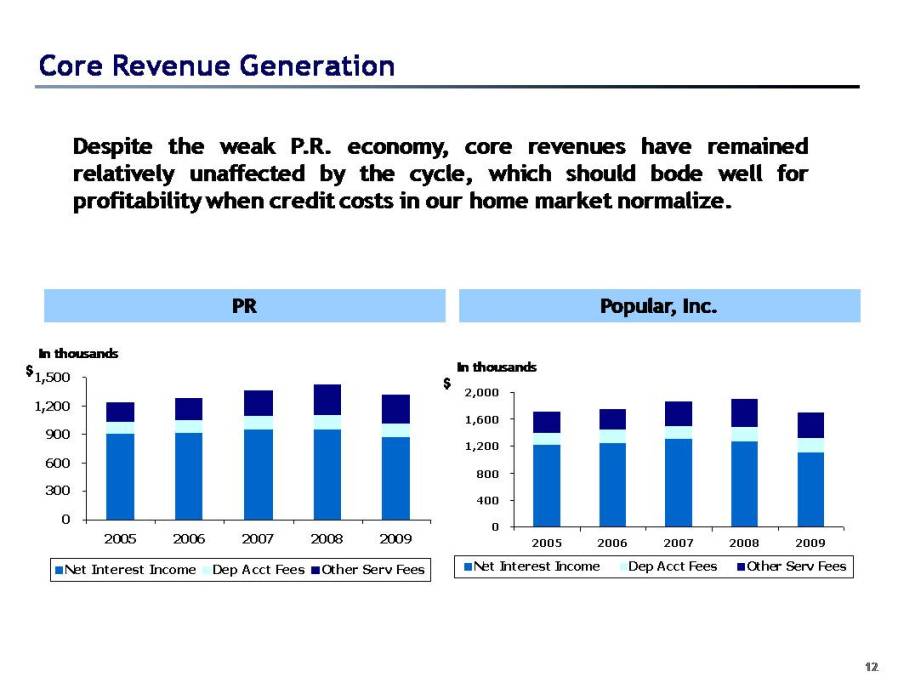
12 Core Revenue Generation Despite the weak P.R. economy, core revenues have remained relatively unaffected by the cycle, which should bode well for profitability when credit costs in our home market normalize. PR Popular, Inc. $ In thousands $ In thousands
13 Recap By 2006, the Corporation had substantial exposure to the real estate market in the U.S. and P.R., which exposed it to the decline in asset prices triggered by the real estate bust in the U.S. and a prolonged recession in P.R. High levels of loan loss provisioning and losses on asset sales related to the U.S. business led to cumulative losses of approximately $2.1 billion(1) between 2007-2009. Decisive action to dispose of and wind down noncore businesses in the mainland has reduced the U.S. portion of our business by 50%. Management’s current focus is managing through the credit cycle in the P.R. business and ensuring capital sufficiency. (1) $2.1 billion includes net losses 2007 to 2009 plus $262mm after-tax cumulative effect of adopting fair value option accounting (FAS 159) in 2008 related to PFH loans.