Attached files
Table of Contents
UNITED STATES SECURITIES AND
EXCHANGE COMMISSION
Washington, D.C. 20549
FORM 10-K
| x | ANNUAL REPORT PURSUANT TO SECTION 13 OR 15(d) OF THE SECURITIES EXCHANGE ACT OF 1934 |
For the fiscal year ended December 31, 2009
or
| ¨ | TRANSITION REPORT PURSUANT TO SECTION 13 OR 15(d) OF THE SECURITIES EXCHANGE ACT OF 1934 |
for the transition period from to
| Commission file number 001-14768 | I.R.S. Employer Identification Number 04-3466300 |
NSTAR
(Exact name of registrant as specified in its charter)
| Massachusetts | 800 Boylston Street, Boston, Massachusetts | |
| (State or other jurisdiction of incorporation or organization) | (Address of principal executive offices) | |
| 617-424-2000 | 02199 | |
| (Registrant’s telephone number, including area code) | (Zip code) | |
Securities registered pursuant to Section 12(b) of the Act:
| Title of each class |
Name of each exchange on which registered | |
| Common Shares, par value $1 per share | New York Stock Exchange |
Indicate by check mark if the registrant is a well-known seasoned issuer, as defined in Rule 405 of the Securities Act.
x Yes ¨ No
Indicate by check mark if the registrant is not required to file reports pursuant to Section 13 or Section 15(d) of the Act. ¨ Yes x No
Indicate by check mark whether the registrant (1) has filed all reports required to be filed by Section 13 or 15(d) of the Securities Exchange Act of 1934 during the preceding 12 months (or for such shorter period that the registrant was required to file such reports), and (2) has been subject to such filing requirements for the past 90 days.
x Yes ¨ No
Indicate by check mark whether the registrant has submitted electronically and posted on its corporate Web site, if any, every Interactive Data File required to be submitted and posted pursuant to Rule 405 of Regulation S-T during the preceding 12 months (or for such shorter period that the registrant was required to submit and post such files).
¨ Yes ¨ No
Indicate by check mark if disclosure of delinquent filers pursuant to Item 405 of Regulation S-K is not contained herein, and will not be contained, to the best of registrant’s knowledge, in definitive proxy or information statements incorporated by reference in Part III of this Form 10-K or any amendment to this Form 10-K. x
Indicate by check mark whether the registrant is a large accelerated filer, an accelerated filer, a non-accelerated filer, or a smaller reporting company, as defined in Rule 12b-2 of the Exchange Act.
| Large accelerated filer x Accelerated filer ¨ Non-accelerated filer ¨ Smaller reporting company ¨ |
Indicate by check mark whether the registrant is a shell company (as defined in Rule 12b-2 of the Act).
¨ Yes x No
The aggregate market value of the 106,808,376 shares of voting stock of the registrant held by non-affiliates of the registrant, computed as the average of the high and low market prices of the common shares as reported on the New York Stock Exchange consolidated transaction reporting system for NSTAR Common Shares as of the last business day of the registrant’s most recently completed second fiscal quarter: $3,396,506,000.
Indicate the number of shares outstanding of each of the registrant’s classes of common stock, as of the latest practicable date:
| Class |
Outstanding at February 5, 2010 | |
| Common Shares, par value $1 per share | 106,808,376 shares |
Documents Incorporated by Reference
Portions of NSTAR’s Definitive Proxy Statement relating to the Annual Meeting of Shareholders to be held on May 6, 2010 are to be filed with the SEC under Regulation 14A within 120 days after the end of NSTAR’s fiscal year and, upon such filing, to be incorporated by reference into Parts I and III of this Form 10-K.
Table of Contents
NSTAR
Index to Annual Report on Form 10-K
Year Ended December 31, 2009
1
Table of Contents
The following is a glossary of abbreviated names or acronyms frequently used throughout this report.
| NSTAR Companies |
||
| NSTAR |
NSTAR (Holding company), Company or NSTAR and its subsidiaries (as the context requires) | |
| NSTAR Electric |
NSTAR Electric Company | |
| NSTAR Gas |
NSTAR Gas Company | |
| NSTAR Electric & Gas |
NSTAR Electric & Gas Corporation | |
| MATEP |
Medical Area Total Energy Plant, Inc. | |
| AES |
Advanced Energy Systems, Inc. (Parent company of MATEP) | |
| NSTAR Com |
NSTAR Communications, Inc. | |
| Hopkinton |
Hopkinton LNG Corp. | |
| HEEC |
Harbor Electric Energy Company | |
| Unregulated operations |
Represents non-regulated operations of NSTAR Com and Hopkinton | |
| Discontinued operations |
Represents operations of MATEP | |
| Regulatory and Other Authorities |
||
| DOE |
U.S. Department of Energy | |
| DPU |
Massachusetts Department of Public Utilities | |
| FERC |
Federal Energy Regulatory Commission | |
| IRS |
U.S. Internal Revenue Service | |
| ISO-NE |
ISO (Independent System Operator) - New England Inc. | |
| Moody’s |
Moody’s Investors Service | |
| NRC |
U.S. Nuclear Regulatory Commission | |
| NYMEX |
New York Mercantile Exchange | |
| PCAOB |
Public Company Accounting Oversight Board (United States) | |
| SEC |
U.S. Securities and Exchange Commission | |
| S&P |
Standard & Poor’s | |
| Other |
||
| AFUDC |
Allowance for Funds Used During Construction | |
| AOCI |
Accumulated Other Comprehensive Income | |
| ARO |
Asset Retirement Obligation | |
| ARRA |
American Recovery and Reinvestment Act of 2009 | |
| ASC |
Financial Accounting Standards Board (U.S) Accounting Standards Codification | |
| BBtu |
Billions of British thermal units | |
| Bcf |
Billion cubic feet | |
| CAP |
IRS Compliance Assurance Process | |
| CGAC |
Cost of Gas Adjustment Clause | |
| CPSL |
Capital Projects Scheduling List | |
| CY |
Connecticut Yankee Atomic Power Company | |
| DSM |
Demand-Side Management | |
| EEI Index |
Edison Electric Institute Stock Index of U.S. Shareholder - Owned Electric Utilities | |
| EERF |
Energy Efficiency Reconciling Factor | |
| EPS |
Earnings Per Common Share | |
| FCA |
Forward Capacity Auction | |
| FCM |
Forward Capacity Market | |
| GAAP |
Accounting principles generally accepted in the United States of America | |
| GCA |
Massachusetts Green Communities Act of 2007 | |
| GWSA |
Massachusetts Global Warming Solutions Act | |
2
Table of Contents
| ISFSI |
Independent Spent Fuel Storage Installation | |
| kW |
Kilowatt (equal to one thousand watts) | |
| kWh |
Kilowatthour (the basic unit of electric energy equal to one kilowatt of power supplied for one hour) | |
| LDAC |
Local Distribution Adjustment Clause | |
| LNG |
Liquefied Natural Gas | |
| MD&A |
Management’s Discussion and Analysis of Financial Condition and Results of Operations | |
| MGP |
Manufactured Gas Plant | |
| MMbtu |
Millions of British thermal units | |
| MW |
Megawatts | |
| MWh |
Megawatthour (equal to one million watthours) | |
| MY |
Maine Yankee Atomic Power Company | |
| NEH |
New England Hydro-Transmission Electric Company, Inc. | |
| NHH |
New England Hydro-Transmission Corporation | |
| OATT |
Open Access Transmission Tariff | |
| PAM |
Pension and PBOP Rate Adjustment Mechanism | |
| PBOP |
Postretirement Benefit Obligation other than Pensions | |
| PPA |
Pension Protection Act of 2006 | |
| RMR |
Reliability Must Run | |
| ROE |
Return on Equity | |
| RTO |
Regional Transmission Organization | |
| SIP |
Simplified Incentive Plan | |
| SQI |
Service Quality Indicators | |
| SSCM |
Simplified Service Cost Method | |
| WRERA |
Worker, Retiree and Employer Recovery Act of 2008 | |
| YA |
Yankee Atomic Electric Company | |
| N/A |
Not applicable | |
3
Table of Contents
Cautionary Statement Regarding Forward-Looking Information
This Annual Report on Form 10-K contains statements that are considered forward-looking statements within the meaning of the Securities Act of 1933 and the Securities Exchange Act of 1934. These forward-looking statements may also be contained in other filings with the SEC, in press releases, and oral statements. You can identify these statements by the fact that they do not relate strictly to historical or current facts. They use words such as “anticipate,” “estimate,” “expect,” “project,” “intend,” “plan,” “believe,” and other words and terms of similar meaning in connection with any discussion of future operating or financial performance. These statements are based on the current expectations, estimates or projections of management and are not guarantees of future performance. Some or all of these forward-looking statements may not turn out to be what NSTAR expected. Actual results could differ materially from these statements. Therefore, no assurance can be given that the outcomes stated in such forward-looking statements and estimates will be achieved.
Examples of some important factors that could cause our actual results or outcomes to differ materially from those discussed in the forward-looking statements include, but are not limited to, the following:
| • | adverse financial market conditions including changes in interest rates and the availability and cost of capital |
| • | adverse economic conditions |
| • | changes to prevailing local, state, and federal governmental policies and regulatory actions (including those of the DPU and the FERC) with respect to allowed rates of return, rate structure, continued recovery of regulatory assets and energy costs, financings, municipalization, acquisition and disposition of assets, operation and construction of facilities, changes in tax laws and policies, and changes in, and compliance with, environmental and safety laws and policies |
| • | new governmental regulations or changes to existing regulations that impose additional operating requirements or liabilities |
| • | changes in available information and circumstances regarding legal issues and the resulting impact on our estimated litigation costs |
| • | weather conditions that directly influence the demand for electricity and natural gas |
| • | impact of continued cost control processes on operating results |
| • | ability to maintain current credit ratings |
| • | impact of uninsured losses |
| • | impact of adverse union contract negotiations |
| • | damage from major storms |
| • | impact of conservation measures and self-generation by our customers |
| • | changes in financial accounting and reporting standards |
| • | changes in hazardous waste site conditions and the cleanup technology |
| • | prices and availability of operating supplies |
| • | impact of terrorist acts and cyber-attacks, and |
| • | impact of service quality performance measures |
Any forward-looking statement speaks only as of the date of this filing and NSTAR undertakes no obligation to publicly update forward-looking statements, whether as a result of new information, future events, or otherwise. You are advised, however, to consult all further disclosures NSTAR makes in its filings to the SEC. Other factors in addition to those listed here could also adversely affect NSTAR. This Annual Report also describes material contingencies and critical accounting policies and estimates in the accompanying Item 1A, “Risk Factors,” Item 7, “Management’s Discussion and Analysis of Financial Condition and Results of Operations” and in the accompanying Notes to Consolidated Financial Statements and NSTAR encourages a review of these items.
4
Table of Contents
Part I
| Item 1. | Business |
(a) General Development of Business
NSTAR (or the Company) is a holding company engaged through its subsidiaries in the energy delivery business serving approximately 1.4 million customers in Massachusetts, including approximately 1.1 million electric distribution customers in 81 communities and approximately 300,000 natural gas distribution customers in 51 communities. Utility operations accounted for approximately 99% of consolidated operating revenues from continuing operations in 2009, 2008, and 2007. The remaining revenue is generated from its unregulated operations.
NSTAR’s utility operations derive their operating revenues primarily from electric and natural gas sales, distribution, and transmission services to customers. NSTAR’s earnings are impacted by fluctuations in unit sales of electric kWh and natural gas MMbtu, which directly determine the level of distribution revenues recognized. In accordance with the regulatory rate structure in which NSTAR operates, its recovery of energy and certain energy-related costs are fully reconciled with the level of energy revenues currently recorded and, therefore, do not have an impact on earnings. As a result of this rate structure, any variability in the cost of energy supply purchased will have an impact on the purchased power and transmission and cost of gas sold expenses, but will not affect the Company’s net income as the Company recognizes a corresponding change in revenues.
On December 21, 2009, NSTAR reached an agreement to sell Medical Area Total Energy Plant, Inc. (MATEP), NSTAR’s unregulated district energy operation in Boston’s Longwood Medical Area. MATEP provides chilled water, steam, and electricity to several hospitals, medical research and biotechnology centers, and teaching institutions, and is accounted for as a discontinued operation held for sale in the accompanying consolidated financial statements.
(b) Financial Information about Industry Segments
NSTAR’s principal operating segments or line of regulated utility businesses are electric and natural gas distribution operations that provide energy transmission and delivery services in 107 cities and towns in Massachusetts and its unregulated operations. Refer to Note M, “Segment and Related Information” of the accompanying Notes to Consolidated Financial Statements in Item 8, “Financial Statements and Supplementary Data” for specific financial information related to NSTAR’s electric utility, natural gas utility, and unregulated operations segments.
(c) Narrative Description of Business
Principal Products and Services
NSTAR Electric
NSTAR Electric supplies distribution and transmission electricity service at retail to an area of 1,702 square miles. The territory served is located in Massachusetts and includes the City of Boston and 80 surrounding cities and towns, including Cambridge, New Bedford, Plymouth, and the geographic area comprising Cape Cod and Martha’s Vineyard. The population of this area is approximately 2.4 million.
NSTAR Electric’s operating revenues and sales percentages by customer class for the years 2009, 2008, and 2007 consisted of the following:
| Revenues ($) | Retail Electric Sales (mWh) | |||||||||||||||||
| 2009 | 2008 | 2007 | 2009 | 2008 | 2007 | |||||||||||||
| Retail: |
||||||||||||||||||
| Commercial and industrial |
57 | % | 57 | % | 56 | % | 68 | % | 69 | % | 69 | % | ||||||
| Residential |
42 | % | 42 | % | 43 | % | 31 | % | 30 | % | 30 | % | ||||||
| Other |
1 | % | 1 | % | 1 | % | 1 | % | 1 | % | 1 | % | ||||||
5
Table of Contents
Regulated Electric Distribution Rates
Retail electric delivery rates are established by the DPU and are comprised of:
| • | a distribution charge, which includes a fixed customer charge and a demand and/or energy charge (to collect the costs of building and expanding the infrastructure to deliver power to its destination, as well as ongoing operating costs and certain DPU-approved safety and reliability programs costs), a Pension and PBOP Rate Adjustment Mechanism (PAM) to recover incremental pension and pension benefit costs, a reconciling rate adjustment mechanism to recover costs associated with the residential assistance adjustment clause, and an Energy Efficiency Reconciling Factor (EERF) to recover energy efficiency expenditures in addition to those charges recovered in the energy conservation charge; |
| • | a basic service charge represents the collection of energy costs, including costs related to charge-offs of uncollected energy costs, through DPU-approved rate mechanisms. Electric distribution companies in Massachusetts are required to obtain and resell power to retail customers through Basic Service for those who choose not to buy energy from a competitive energy supplier. Basic Service rates are reset every six months (every three months for large commercial and industrial customers). The price of Basic Service is intended to reflect the average competitive market price for electric power; |
| • | a transition charge represents the collection of costs primarily from previously held investments in generating plants and costs related to existing above-market power contracts, and contract costs related to long-term power contracts buy-outs; |
| • | a transmission charge represents the collection of costs of moving the electricity over high voltage lines from generating plants to substations located within NSTAR’s service area including costs allocated to NSTAR Electric by ISO-NE to maintain the wholesale electric market; |
| • | an energy conservation charge represents a legislatively-mandated charge to collect costs for demand-side management programs and energy efficiency programs; and |
| • | a renewable energy charge represents a legislatively-mandated charge to collect the costs to support the development and promotion of renewable energy projects. |
Rate Settlement Agreement
NSTAR Electric is currently operating under a DPU approved Rate Settlement Agreement (Rate Settlement Agreement) that expires December 31, 2012. From 2007 through 2012, the Rate Settlement Agreement establishes for NSTAR Electric, among other things, annual inflation-adjusted distribution rate adjustments that are generally offset by an equal and corresponding reduction in transition rates. Refer to the “Rate Settlement Agreement” section of the accompanying Item 7, “Management’s Discussion and Analysis of Financial Condition and Results of Operations,” for more details.
Massachusetts Regulatory Environment
The Secretary of Energy and Environmental Affairs oversees the Commonwealth Utilities Commission, consisting of three commissioners. The Commonwealth Utilities Commission leads the DPU, an agency that has jurisdiction over electric, natural gas, water, and transportation matters. Massachusetts has joined the Regional Greenhouse Gas Initiative, a multi-state group that supports implementation of programs to reduce the production of greenhouse gases by electric power plants.
In July 2008, the Massachusetts Legislature enacted the Green Communities Act (GCA)-energy policy legislation designed: (1) to substantially increase energy efficiency, (2) foster the development of renewable energy resources and (3) provide for a reduction of greenhouse gas emissions in Massachusetts. Refer to the “Massachusetts Regulatory Environment” section of the accompanying Item 7, “Management’s Discussion and Analysis of Financial Condition and Results of Operations,” for more details.
6
Table of Contents
Rate Decoupling
On July 16, 2008, the DPU issued an order to all Massachusetts’ electric and gas distribution utility companies that requires them to develop plans to decouple their rates/revenues from sales volumes. This action is intended to encourage utility companies to help their customers reduce energy consumption. Decoupling of rates will allow utility companies to carry out the mandates of the GCA and at the same time collect the adequate level of revenues to maintain the quality and reliability of electric and gas services. This order allows companies to file for recovery of lost base revenues caused by incremental energy efficiency spending until their decoupling rate plans are approved. Once decoupled rate plans are approved, revenues will be set at a level designed to recover the utility companies’ incurred costs plus a return on their investment. This revenue level will be reconciled with actual revenues received from decoupled rates on an annual basis and any over or under collection will be refunded to or recovered from customers in the subsequent year. NSTAR Electric and NSTAR Gas have not yet applied for decoupled rate structures. NSTAR Electric currently does not expect to file for fully decoupled electric rates until after the Rate Settlement Agreement expires in 2012. However, NSTAR Gas may file prior to that date.
Sources and Availability of Electric Power Supply
For Basic Service power supply, NSTAR Electric makes periodic market solicitations consistent with DPU regulations. NSTAR Electric enters into short-term power purchase agreements to meet its Basic Service supply obligation, ranging in term from three to twelve months. NSTAR Electric fully recovers its payments to suppliers through DPU-approved rates billed to customers.
The New England Forward Capacity Market (FCM) includes a locational price mechanism to establish separate zones for capacity when transmission constraints are found to exist. FCM allows load-serving entities such as NSTAR Electric to self-supply through contracted resources to meet its capacity obligations without participating in the Forward Capacity Auctions (FCAs). FCAs are auctions designed to procure capacity three or more years into the future with a one-year to five-year commitment period. FCM will begin on June 1, 2010. To date, three FCM auctions have taken place covering the 2010-2011, 2011-2012, and 2012-2013 time periods. NSTAR Electric expects these costs to be fully recoverable.
Market and Transmission Regulation
NSTAR Electric and most other New England electric utilities, generation owners, and marketers are parties to a series of agreements that provide for coordinated planning and operation of the region’s generation and transmission facilities and the rules by which they participate in the wholesale markets and acquire transmission services. Under these arrangements, ISO-New England, a non-profit corporation whose board of directors and staff are independent from all market participants, serves as the regional Transmission Operator (RTO) of the New England Transmission System. ISO-New England works to ensure the reliability of the system, administers the independent system operator tariff subject to FERC approval, oversees the efficient and competitive functioning of the regional wholesale power market and determines which costs of NSTAR’s major transmission facilities are regionalized throughout New England. NSTAR Electric is a New England Transmission Owner subject to FERC regulation and is a member of ISO-New England. Refer to the “FERC Transmission ROE” section of the accompanying Item 7, “Management’s Discussion and Analysis of Financial Condition and Results of Operations,” for more details.
Transmission Rates
Transmission revenues are based on formula rates that are approved by the FERC. Tariffs are set by FERC and primarily include the Regional Network Service (RNS) and Local Network Service (LNS) rate schedules. The RNS rate, administered by ISO-NE and billed to all New England transmission owners, is reset on June 1 of each year and recovers the revenue requirements associated with transmission facilities that benefit the New England
7
Table of Contents
region. The LNS rate, which NSTAR Electric administers, is reset annually and recovers the revenue requirements for local transmission facilities. The LNS rate calculation recovers total transmission revenue requirements net of revenues received from other sources, thereby ensuring that NSTAR Electric recovers all regional and local revenue requirements as prescribed in the tariffs.
Transmission Capital Improvements
NSTAR Electric continues to evaluate needs for transmission improvements throughout the NSTAR service area. ISO-New England transmission project upgrades maintain transmission system reliability, improve the economic performance of the system, and are fully coordinated with other power regions. Over the next five to ten years, ISO-New England transmission projects are expected to enhance the region’s ability to support a robust, competitive wholesale power market by reliably moving power from various internal and external sources to the region’s load centers.
Additional transmission plans have been developed to further reduce the dependence on certain generating units needed for reliability and the exposure to special load-shedding contingency procedures. At various times, generating units in New England have been in “must-run” situations to maintain area reliability. Transmission improvements placed in-service have reduced costs associated with Reliability Must Run Agreements and second-contingency and voltage-control payments.
The lower Southeastern Massachusetts (SEMA) Projects are examples in which transmission improvements have contributed to the reduction of energy supply costs; further improvements in lower SEMA will significantly reduce the need to commit generation for second-contingency protection. NSTAR Electric’s future lower SEMA Project consists of an expansion and upgrade of existing lines, equipment and substations, and construction of a new 22 mile, 345kV transmission line that will cross the Cape Cod Canal. The project is expected to be in-service in late 2012.
NSTAR Gas
NSTAR Gas distributes natural gas to approximately 300,000 customers in 51 communities in central and eastern Massachusetts covering 1,067 square miles and having an aggregate population of 1.2 million. Twenty-five of these communities are also served with electricity by NSTAR Electric. Some of the larger communities served by NSTAR Gas include the Hyde Park area of Boston, Cambridge, Dedham, Framingham, New Bedford, Plymouth, Somerville, and Worcester.
NSTAR Gas’ operating revenues and sales percentages by customer class for the years 2009, 2008, and 2007, consisted of the following:
| Revenues ($) | Retail Gas Sales (therms) | |||||||||||||||||
| 2009 | 2008 | 2007 | 2009 | 2008 | 2007 | |||||||||||||
| Gas Sales and Transportation: |
||||||||||||||||||
| Residential |
62 | % | 59 | % | 60 | % | 43 | % | 43 | % | 44 | % | ||||||
| Commercial and Industrial |
28 | % | 27 | % | 28 | % | 44 | % | 46 | % | 43 | % | ||||||
| Other |
5 | % | 4 | % | 4 | % | 6 | % | 6 | % | 6 | % | ||||||
| Off-System and Contract sales |
5 | % | 10 | % | 8 | % | 7 | % | 5 | % | 7 | % | ||||||
Gas Rates
NSTAR Gas generates revenues primarily through the sale and/or transportation of natural gas. Gas sales and transportation services are divided into two categories: firm, whereby NSTAR Gas must supply gas and/or transportation services to customers on demand; and interruptible, whereby NSTAR Gas may, generally during colder months, temporarily discontinue service to high volume commercial and industrial customers. Sales and transportation of gas to interruptible customers have no impact on NSTAR Gas’ operating income because a substantial portion of the margin for such service is returned to its firm customers as rate reductions.
8
Table of Contents
Retail gas delivery and supply rates are established by the DPU and are comprised of:
| • | a distribution charge consists of a fixed customer charge and a demand and/or energy charge that collects the costs of building and expanding the gas infrastructure to deliver gas supply to its customers’ destination. This also includes collection of ongoing operating costs; |
| • | a seasonal cost of gas adjustment clause (CGAC) represents the collection of gas supply costs, pipeline and storage capacity, costs related to charge-offs of uncollected energy costs and working capital related costs. The CGAC is reset every six months. In addition, NSTAR Gas is required to file interim changes to its CGAC factor when the actual costs of gas supply vary from projections by more than 5%; and |
| • | a local distribution adjustment clause (LDAC) primarily represents the collection of demand-side management costs, environmental costs, PAM related costs, and costs associated with the residential assistance adjustment clause. The LDAC is reset annually and provides for the recovery of certain costs applicable to both sales and transportation customers. |
NSTAR Gas purchases financial contracts based on NYMEX natural gas futures in order to reduce cash flow variability associated with the purchase price for approximately one-third of its natural gas purchases. This practice attempts to minimize the impact of fluctuations in prices to NSTAR’s firm gas customers. These financial contracts do not procure gas supply. All costs incurred or benefits realized when these contracts are settled are included in the CGAC.
Gas Supply, Transportation and Storage
NSTAR Gas maintains a flexible resource portfolio consisting of natural gas supply contracts, transportation contracts on interstate pipelines, market area storage and peaking services.
NSTAR Gas purchases transportation, storage, and balancing services from Tennessee Gas Pipeline Company and Algonquin Gas Transmission Company, as well as other upstream pipelines that bring gas from major producing regions in the U.S., Gulf of Mexico, and Canada to the final delivery points in the NSTAR Gas service area. NSTAR Gas purchases all of its natural gas supply from third-party vendors. Most of the flowing supplies are purchased under a firm portfolio management contract with a term of one year, which has a maximum quantity of 139,606 MMBtu/day. NSTAR Gas has one multiple year contract, which is used for the purchase of its 4,500 MMbtu/day of Canadian supplies.
In addition to the firm transportation and natural gas supplies mentioned above, NSTAR Gas utilizes contracts for underground storage and LNG facilities to meet its winter peaking demands. The LNG facilities, described below, are located within NSTAR Gas’ distribution system and are used to liquefy and store pipeline gas during the warmer months for vaporization and use during the heating season. During the summer injection season, excess pipeline capacity and supplies are used to deliver and store natural gas in market area underground storage facilities located in the New York and Pennsylvania region. Stored natural gas is withdrawn during the winter season to supplement flowing pipeline supplies in order to meet firm heating demand. NSTAR Gas has firm underground storage contracts and total storage capacity entitlements of approximately 9.3 Bcf.
A portion of the storage of natural gas supply for NSTAR Gas during the winter heating season is provided by Hopkinton, a wholly-owned subsidiary of NSTAR. The facilities consist of an LNG liquefaction and vaporization plant and three above-ground cryogenic storage tanks having an aggregate capacity of 3.5 Bcf of liquefied natural gas.
Based on information currently available regarding projected growth in demand and estimates of availability of future supplies of pipeline natural gas, NSTAR Gas believes that its present sources of natural gas supply are adequate to meet existing load and allow for future growth in sales.
9
Table of Contents
Franchises
Through their charters, which are unlimited in time, NSTAR Electric and NSTAR Gas have the right to engage in the business of delivering and selling electricity and natural gas within their respective service territories, and have powers incidental thereto and are entitled to all the rights and privileges of and subject to the duties imposed upon electric and natural gas companies under Massachusetts laws. The locations in public ways for electric transmission and distribution lines and gas distribution pipelines are obtained from municipal and other state authorities who, in granting these locations, act as agents for the state. In some cases the actions of these authorities are subject to appeal to the DPU. The rights to these locations are not limited in time and are subject to the action of these authorities and the legislature. Under Massachusetts law, no other entity may provide electric or gas delivery service to retail customers within NSTAR’s service territory without the written consent of NSTAR Electric and/or NSTAR Gas. This consent must be filed with the DPU and the municipality so affected.
Unregulated Operations
NSTAR’s unregulated operations include telecommunications and liquefied natural gas service. Telecommunications services are provided through NSTAR Com, which installs, owns, operates, and maintains a wholesale transport network for other telecommunications service providers in the metropolitan Boston area to deliver voice, video, data, and internet services to customers. Revenues earned from NSTAR’s unregulated operations accounted for less than 1% of consolidated operating revenues in 2009, 2008, and 2007.
Discontinued Operations
On December 21, 2009, NSTAR announced an agreement to sell its wholly-owned subsidiary, MATEP. MATEP provides chilled water, steam, and electricity under long-term contracts to several hospitals, medical research and biotechnology centers, and teaching institutions located in Boston’s Longwood Medical Area. Revenues earned by MATEP represented approximately 3% of total consolidated revenues in 2009, 2008, and 2007. Refer to Note B, “Discontinued Operations,” of the accompanying Notes to Consolidated Financial Statements in Item 8, “Financial Statements and Supplementary Data” of this Form 10-K.
Regulation
The Energy Policy Act of 2005 established the Public Utility Holding Company Act of 2005 (PUHCA 2005) that transferred certain regulatory oversight from the SEC to the FERC. NSTAR has been granted an exemption and waiver from certain provisions of PUHCA 2005.
NSTAR Gas, NSTAR Electric and NSTAR Electric’s wholly-owned regulated subsidiary, Harbor Electric Energy Company, operate primarily under the authority of the DPU, whose jurisdiction includes supervision over retail rates for distribution of electricity, natural gas, and financing and investing activities. In addition, the FERC has jurisdiction over various phases of NSTAR Electric and NSTAR Gas utility businesses, conditions under which natural gas is sold at wholesale, facilities used for the transmission or sale of that energy, certain issuances of short-term debt, and regulation of accounting.
These companies are also subject to various other state and municipal regulations with respect to environmental, employment, and general operating matters.
10
Table of Contents
Plant Expenditures and Financings
The most recent estimates of plant expenditures and long-term debt maturities for 2010 and the years 2011-2014 are as follows:
| (in millions) |
2010 | 2011-2014 | ||||
| Plant expenditures: |
||||||
| Electric |
$ | 317 | $ | 1,130 | ||
| Gas |
53 | 170 | ||||
| $ | 370 | $ | 1,300 | |||
| Long-term debt |
$ | 684 | $ | 935 | ||
In the five-year period 2010 through 2014, plant expenditures are forecasted to be used for system reliability and performance improvements, customers service enhancements, and capacity expansion in NSTAR’s service territory. Of the $317 million planned electric expenditures for 2010, approximately $90 million is for transmission system improvements. The amounts stated above exclude expenditures for NSTAR’s proposed transmission investment with Northeast Utilities and Hydro-Quebec as these costs will be incurred by an entity that will be created to hold those assets (further discussed in the “Proposed Transmission Investment” Section in Item 7, Management’s Discussion and Analysis of Financial Condition and Results of Operations).
Management continuously reviews its capital expenditure and financing programs. These programs and, therefore, the estimates included in this Form 10-K are subject to revision due to changes in regulatory requirements, operating requirements, environmental standards, availability and cost of capital, interest rates and other assumptions. Refer to the accompanying “Cautionary Statement Regarding Forward-Looking Information” preceding Item 1, “Business” and the “Liquidity, Commitments and Capital Resources” section of Item 7, “Management’s Discussion and Analysis of Financial Condition and Results of Operations.”
Seasonal Nature of Business
NSTAR Electric’s kilowatt-hour sales and revenues are typically higher in the winter and summer than in the spring and fall as sales tend to vary with weather conditions. NSTAR Gas’ sales are positively impacted by colder weather because a substantial portion of its customer base uses natural gas for space heating purposes. Refer to the accompanying “Selected Quarterly Consolidated Financial Data” section in Item 6, “Selected Consolidated Financial Data” for specific financial information by quarter for 2009 and 2008.
Competitive Conditions
As a rate regulated distribution and transmission utility company, NSTAR is not subject to a significantly competitive business environment. NSTAR Electric and NSTAR Gas have the exclusive right and privilege to engage in the business of delivering energy services within their granted territory. Under Massachusetts law, no other entity may provide electric or natural gas delivery service to retail customers within NSTAR’s service territory without the written consent of NSTAR Electric and/or NSTAR Gas. Refer to the accompanying “Franchises” section of this Item 1 and to Item 1A, “Risk Factors” for a further discussion of NSTAR’s rights and competitive pressures within its service territory.
Environmental Matters
NSTAR’s subsidiaries are subject to numerous federal, state and local standards with respect to the management of wastes and other environmental considerations. NSTAR subsidiaries face possible liabilities as a result of involvement in several multi-party disposal sites, state-regulated sites or third party claims associated with contamination remediation. NSTAR generally expects to have only a small percentage of the total potential
11
Table of Contents
liability for the majority of these sites. Noncompliance with certain standards can, in some cases, also result in the imposition of monetary civil penalties. Refer to the accompanying “Contingencies -Environmental Matters” section in Item 7, “Management’s Discussion and Analysis of Financial Condition and Results of Operations” and to Notes to Consolidated Financial Statements, Note O, “Commitments and Contingencies,” for more information.
Management believes that its facilities are in substantial compliance with currently applicable statutory and regulatory environmental requirements.
Number of Employees and Employee Relations
Excluding its discontinued operations subsidiary, MATEP, at December 31, 2009, NSTAR has approximately 3,000 employees, including approximately 2,100 who are represented by two labor unions covered by separate collective bargaining contracts.
Substantially all management, engineering, finance and support services are provided to the operating subsidiaries of NSTAR by NSTAR Electric & Gas. NSTAR has the following labor union contracts:
| Union |
Percent of Union to Total NSTAR Employees |
Supports | Contract Expiration Date | |||
| Local 369 of the Utility Workers of America (AFL-CIO) |
61% | Utility Operations | June 1, 2012 | |||
| Local 12004 of the United Steelworkers of America |
8% | Utility Operations | March 31, 2010 |
Management is currently in negotiations with Local 12004 regarding a new contract. Management believes it has satisfactory relations with its employees.
On December 21, 2009, NSTAR announced an agreement to sell its wholly-owned subsidiary, MATEP. MATEP has approximately 85 employees of whom 59 are represented by Local 877 of the International Union of Operating Engineers (AFL-CIO).
(d) Financial Information about Geographic Areas
NSTAR is a holding company engaged through its subsidiaries in the energy delivery business in Massachusetts. None of NSTAR’s subsidiaries have any foreign operations or export sales.
(e) Available Information
NSTAR files its Forms 10-K, 10-Q, and 8-K reports, proxy statements, and other information with the SEC. You may access materials free of charge NSTAR has filed with the SEC on NSTAR’s website at: www.nstar.com: Select “Investor Relations” and “Financial Information” or on the SEC’s website at www.sec.gov. Copies of NSTAR’s SEC filings may also be obtained free of charge by writing to NSTAR’s Investor Relations Department at the address on the cover of this Form 10-K or by calling 781-441-8338.
In addition, NSTAR’s Board of Trustees has several committees, including an Audit, Finance and Risk Management Committee, an Executive Personnel Committee and a Board Governance and Nominating Committee. The Board of Trustees also has a standing Executive Committee. The Board of Trustees has adopted the NSTAR Board of Trustees Guidelines on Significant Corporate Governance Issues, a Code of Ethics for the Principal Executive Officer, General Counsel, and Senior Financial Officers pursuant to Section 406 of the Sarbanes-Oxley Act of 2002, and a Code of Ethics and Business Conduct for Trustees, Officers and Employees
12
Table of Contents
(“Code of Conduct”). NSTAR intends to disclose any amendment to, and any waiver from, a provision of the Code of Ethics that applies to the Chief Executive Officer or Chief Financial Officer or any other executive officer and that relates to any element of the Code of Ethics definition enumerated in Item 406(b) of Regulation S-K, in a press release, on our website or on Form 8-K, within four business days following the date of such amendment or waiver. NSTAR’s Corporate Governance documents, including charters, guidelines and codes, and any amendments to such charters, guidelines and codes that are applicable to NSTAR’s executive officers, senior financial officers or trustees can be accessed free of charge on NSTAR’s website at: www.nstar.com: Select “Investor Relations” and “Company Information.”
The certifications of NSTAR’s Chief Executive Officer and Chief Financial Officer pursuant to Sections 302 and 906 of the Sarbanes-Oxley Act of 2002 are attached to this Annual Report on Form 10-K as Exhibits 31.1, 31.2, 32.1, and 32.2.
| Item 1A. | Risk Factors |
Our future performance is subject to a variety of risks, including those described below. If any of the following risks actually occur, our business could be harmed and the market price of our common shares could decline. In addition to the other information in this Annual Report on Form 10-K, shareholders or prospective investors should carefully consider the following risk factors.
Our electric and gas operations are highly regulated, and any adverse regulatory changes could have a significant impact on the Company’s results of operations and its financial position.
NSTAR’s electric and gas operations, including the rates charged, are regulated by the FERC and the DPU. In addition, NSTAR’s accounting policies are prescribed by GAAP, the FERC, and the DPU. Adverse regulatory changes could have a significant impact on the Company’s results of operations and its financial condition.
Potential municipalization or technological developments may adversely affect our regulated electricity and natural gas businesses.
Under Massachusetts law, no other entity may provide electric or gas delivery service to retail customers within NSTAR’s service territory without the written consent of NSTAR Electric and/or NSTAR Gas. Although not a trend, NSTAR’s operating utility companies could be exposed to municipalization risk, whereby a municipality could acquire the electric or natural gas delivery assets located in that city or town and take over the customer delivery service, thereby reducing NSTAR’s revenues. Any such action would require numerous legal and regulatory consents and approvals. Municipalization would require that NSTAR be compensated for its assets assumed. In addition, there is also the risk that technological developments could lead to distributed generation among NSTAR’s customer base reducing such customers’ use of NSTAR’s utility system.
Changes in environmental laws and regulations affecting our business could increase our costs or curtail our activities.
NSTAR and its subsidiaries are subject to a number of environmental laws and regulations that are currently in effect, including those related to the handling, disposal, and treatment of hazardous materials. Changes in compliance requirements or the interpretation by governmental authorities of existing requirements may impose additional costs, all of which could have an adverse impact on NSTAR’s results of operations.
The Company may be required to conduct environmental remediation activities for power generating sites and other potentially unidentified sites.
NSTAR is subject to actual or potential claims and lawsuits involving environmental remediation activities for power generating sites previously owned and other potentially unidentified sites. NSTAR divested all of its regulated generating assets under terms that generally require the buyer to assume all responsibility
for past and present environmental harm. Based on NSTAR’s current assessment of its environmental
13
Table of Contents
responsibilities, existing legal requirements and regulatory policies, NSTAR does not believe that its known environmental remediation responsibilities will have a material adverse effect on NSTAR’s results of operations, cash flows or financial position. However, discovery of currently unknown conditions at existing sites, identification of additional waste sites or changes in environmental regulation, could have a material adverse impact on NSTAR’s results of operations, cash flows or financial position.
NSTAR is subject to operational risk that could cause us to incur substantial costs and liabilities.
Our business, which involves the transmission and distribution of natural gas and electricity that is used as an energy source by our customers, is subject to various operational risks, including incidents that expose the Company to potential claims for property damages or personal injuries beyond the scope of NSTAR’s insurance coverage, and equipment failures that could result in performance below assumed levels. For example, operational performance below established target benchmark levels could cause NSTAR to incur penalties imposed by the DPU, up to a maximum of two and one-half percent of transmission and distribution revenues, under applicable Service Quality Indicators.
Increases in interest rates due to financial market conditions or changes in our credit ratings, could have an adverse impact on our access to capital markets at favorable rates, or at all, and could otherwise increase our costs of doing business.
NSTAR frequently accesses the capital markets to finance its working capital requirements, capital expenditures and to meet its long-term debt maturity obligations. Increased interest rates, or adverse changes in our credit ratings or further deterioration in the credit markets, would increase our cost of borrowing and other costs that could have an adverse impact on our results of operations and cash flows and ultimately have an adverse impact on the market price of our common shares. In addition, an adverse change in our credit ratings could increase borrowing costs, trigger requirements that we obtain additional security for performance, such as a letter of credit, related to our energy procurement agreements. Refer to the accompanying Item 7A, “Quantitative and Qualitative Disclosures About Market Risk,” for a further discussion.
Our electric and gas businesses are sensitive to variations in weather and have seasonal variations. In addition, severe storm-related disasters could adversely affect the Company.
Sales of electricity and natural gas to residential and commercial customers are influenced by temperature fluctuations. Significant fluctuations in heating or cooling degree days could have a material impact on energy sales for any given period. In addition, extremely severe storms, such as hurricanes and ice storms, could cause damage to our facilities that may require additional costs to repair and have a material adverse impact on the Company’s results of operations, cash flows or financial position. To the extent possible, NSTAR’s rate regulated subsidiaries would seek recovery of these costs through the regulatory process.
An economic downturn, increased costs of energy supply, and customers’ conservation efforts could adversely affect energy consumption and could adversely affect our results of operations.
Energy consumption is significantly impacted by the general level of economic activity and cost of energy supply. Economic downturns or periods of high energy supply costs typically lead to reductions in energy consumption and increased conservation measures. These conditions could adversely impact the level of energy sales and result in less demand for energy delivery. A recession or a prolonged lag of a subsequent recovery could have an adverse effect on NSTAR’s results of operations, cash flows or financial position.
The ability of NSTAR to maintain future cash dividends at the level currently paid to shareholders is dependent upon the ability of its subsidiaries to pay dividends to NSTAR.
As a holding company, NSTAR does not have any operating activity and therefore is substantially dependent on dividends from its subsidiaries and from external borrowings at variable rates of interest to provide the cash
14
Table of Contents
necessary for repayment of debt obligations, to pay administrative costs, to meet contractual obligations that may not be met by our subsidiaries and to pay common share dividends to NSTAR’s shareholders. Regulatory and other legal restrictions may limit our ability to transfer funds freely, either to or from our subsidiaries. These laws and regulations may hinder our ability to access funds that we may need to make payments on our obligations. As the Holding company’s sources of cash are limited to dividends from its subsidiaries and external borrowings, the ability to maintain future cash dividends at the level currently paid to shareholders will be dependent upon cash flows of NSTAR’s subsidiaries.
NSTAR’s subsidiaries do have certain limitations that could impact the payment of dividends to the Holding company. Refer to the “Sources of Additional Capital and Financial Covenant Requirements” section of the accompanying Item 7, “Management’s Discussion and Analysis of Financial Condition and Results of Operations” for more information.
Our electric and gas operations may be impacted if generation supply or its transportation or transmission availability is limited or unreliable.
Our electric and natural gas delivery businesses are reliant on transportation and transmission facilities that we do not own or control. Our ability to provide energy delivery services depends on the operations and facilities of third parties, including the independent system operator, electric generators that supply our customers’ energy requirements and natural gas pipeline operators from which we receive delivery of our natural gas supply. Should our ability to receive electric or natural gas supply be disrupted due either to operational issues or to inadequacy of transmission capacity, it could impact our ability to serve our customers. It could also force us to secure alternative supply at significantly higher costs.
Financial market performance and other changes may decrease the Company’s pension and postretirement benefit plans’ assets and could require additional funding beyond historic levels.
A sustained decline in the global financial markets may have a material adverse effect on the value of our pension and postretirement benefit plans’ assets. This situation may increase our benefit plans’ funding requirements.
| Item 1B. | Unresolved Staff Comments |
None
| Item 2. | Properties |
NSTAR Electric properties include an integrated system of transmission and distribution lines and substations, an interest in a jointly owned administration office building and other structures such as garages and service centers that are located in eastern Massachusetts. NSTAR’s high-voltage transmission lines are generally located on land either owned or subject to perpetual and exclusive easements in its favor. Its low-voltage distribution lines are located principally on public property under permits granted by municipal and other state authorities.
At December 31, 2009, NSTAR Electric’s primary and secondary transmission and distribution system consisted of approximately 21,980 circuit miles of overhead lines, approximately 13,020 circuit miles of underground lines, 256 substation facilities and approximately 1,173,500 active customer meters.
NSTAR Gas’ principal natural gas properties consist of distribution mains, services and meters necessary to maintain reliable service to customers. In addition, it shares an interest in a jointly owned administration office and service building, three district office buildings and owns several natural gas receiving and take stations. As of December 31, 2009, the gas system included approximately 3,130 miles of gas distribution lines, approximately 188,800 services and approximately 277,900 customer meters together with the necessary
15
Table of Contents
measuring and regulating equipment. In addition, Hopkinton owns a liquefaction and vaporization plant, a satellite vaporization plant and above ground cryogenic storage tanks having an aggregate storage capacity equivalent to 3.5 Bcf of natural gas.
NSTAR Com owns approximately 240 miles of fiber optic network that represents approximately 79,000 fiber miles of network.
Assets of discontinued operations held for sale primarily consist of district energy operations, a cogeneration facility located in the Longwood Medical Area of Boston. MATEP provides steam, chilled water and electricity to over 9 million square feet of medical and teaching facilities. NSTAR anticipates the final sale of MATEP towards the end of the first quarter or early second quarter of 2010.
| Item 3. | Legal Proceedings |
In the normal course of its business, NSTAR and its subsidiaries are involved in certain legal matters, including civil litigation. Management is unable to fully determine a range of reasonably possible court-ordered damages, settlement amounts, and related litigation costs (legal liabilities) that would be in excess of amounts accrued and amounts covered by insurance. Based on the information currently available, NSTAR does not believe that it is probable that any such legal liabilities will have a material impact on its consolidated financial position. However, it is reasonably possible that additional legal liabilities that may result from changes in circumstances could have a material impact on its results of operations, financial condition and cash flows.
| Item 4. | Submission of Matters to a Vote of Security Holders |
There were no matters submitted to a vote of security holders during the fourth quarter of 2009.
| Item 4A. | Executive Officers of Registrant |
Identification of Executive Officers
| Name of Officer |
Position and Business Experience |
Years in Current Position |
Years as an Officer |
Age at December 31, 2009 | ||||
| Thomas J. May |
Chairman, President and Chief Executive Officer and an NSTAR Trustee | 15 | 23 | 62 | ||||
| James J. Judge |
Senior Vice President and Chief Financial Officer | 14 | 14 | 53 | ||||
| Douglas S. Horan |
Senior Vice President - Strategy, Law and Policy, Secretary and General Counsel | 14 | 14 | 60 | ||||
| Joseph R. Nolan, Jr. |
Senior Vice President - Customer & Corporate Relations | 9 | 9 | 46 | ||||
| Werner J. Schweiger |
Senior Vice President - Operations | 8 | 8 | 50 | ||||
| Christine M. Carmody |
Senior Vice President - Human Resources Previously Vice President of Organizational Effectiveness for 2 years and Director, Learning and Performance for 3 years | 2 | 2 | 46 | ||||
| Robert J. Weafer, Jr. |
Vice President, Controller and Chief Accounting Officer | 21 | 21 | 62 | ||||
16
Table of Contents
PART II
| Item 5. | Market for the Registrant’s Common Equity, Related Stockholder Matters and Issuer Purchases of Equity Securities |
(a) Market Information and (c) Dividends
The NSTAR Common Shares, $1 par value, are listed on the New York Stock Exchange under the symbol “NST.” NSTAR’s Common Shares closing market prices at December 31, 2009 and 2008 were $36.80 and $36.49 per share, respectively.
The NSTAR Common Shares high and low market prices per common share as reported by the New York Stock Exchange composite transaction reporting system and dividends declared per common share for each of the quarters in 2009 and 2008 were as follows:
| 2009 | 2008 | |||||||||||||||||
| Market Prices | Dividends Declared |
Market Prices | Dividends Declared | |||||||||||||||
| High | Low | High | Low | |||||||||||||||
| First quarter |
$ | 36.80 | $ | 27.49 | $ | 0.375 | $ | 36.70 | $ | 29.36 | $ | 0.350 | ||||||
| Second quarter |
$ | 34.68 | $ | 28.54 | $ | 0.375 | $ | 35.36 | $ | 30.41 | $ | 0.350 | ||||||
| Third quarter |
$ | 32.91 | $ | 30.10 | $ | 0.375 | $ | 40.00 | $ | 31.17 | $ | 0.350 | ||||||
| Fourth quarter |
$ | 37.75 | $ | 30.76 | $ | 0.400 | $ | 36.94 | $ | 25.67 | $ | 0.375 | ||||||
NSTAR paid common share dividends to shareholders of $160.2 million and $149.5 million in 2009 and 2008, respectively.
(b) Holders
As of December 31, 2009, there were 19,566 registered holders of NSTAR Common Shares.
(d) Securities authorized for issuance under equity compensation plans
The following table provides information about NSTAR’s equity compensation plans as of December 31, 2009.
| Plan Category |
Number of securities to be issued upon exercise of outstanding options, warrants and rights |
Weighted average exercise price of outstanding options, warrants and rights |
Number of securities remaining available for future issuance under equity compensation plans | ||||||
| Equity compensation plans approved by shareholders |
2,855,535 | (1) | $ | 29.63 | (2) | 1,928,263 | |||
| Equity compensation plans not approved by shareholders |
N/A | N/A | N/A | ||||||
| Total |
2,855,535 | $ | 29.63 | 1,928,263 | |||||
| (1) | Includes 2,454,367 common shares to be issued upon the exercise of options and 401,168 common shares for distribution of deferred shares and performance units pursuant to the terms of our Incentive Plan |
| (2) | The weighted-average exercise price in Column (b) does not take into account deferred shares or performance units, which have no exercise price. |
17
Table of Contents
The NSTAR 2007 Long Term Incentive Plan (the 2007 Plan) permits a variety of stock and stock-based awards, including stock options, deferred stock awards, and performance share units granted to key employees. The aggregate number of common shares that are available for award under the 2007 Plan is 3.5 million. The Plan limits the terms of awards to ten years and prohibits the granting of awards beyond ten years after its effective date. In general, stock options and stock awards vest over a three-year period from date of grants. The Executive Personnel Committee (EPC) of the Board of Trustees approves stock-based awards for all executives and other key employees. However, the Chief Executive Officer’s (CEO) award must also be approved by the independent members of the Board of Trustees. The EPC and Board of Trustees established that the date of grant for annual stock-based awards under the Plan is the date each year on which the Board of Trustees approves the CEO’s stock award. This date is when all participants are notified of their awards. Options are granted at the full market price of the common shares on the date of grant.
(e) Purchases of equity securities
Common Shares of NSTAR issued under the NSTAR Dividend Reinvestment and Direct Common Shares Purchase Plan, the Long Term Incentive Plan and the NSTAR Savings Plan may consist of newly issued shares from the Company or shares purchased in the open market by the Company or an independent agent. During the three-month period ended December 31, 2009, the shares listed below were acquired in the open market.
| Total Number of Common Shares Purchased |
Average Price Paid Per Share | ||||
| October |
114,429 | $ | 31.36 | ||
| November |
128,765 | $ | 31.20 | ||
| December |
31,014 | $ | 35.86 | ||
| Total Fourth Quarter |
274,208 | $ | 31.79 | ||
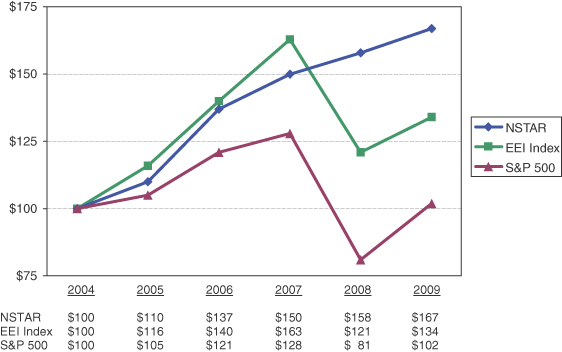
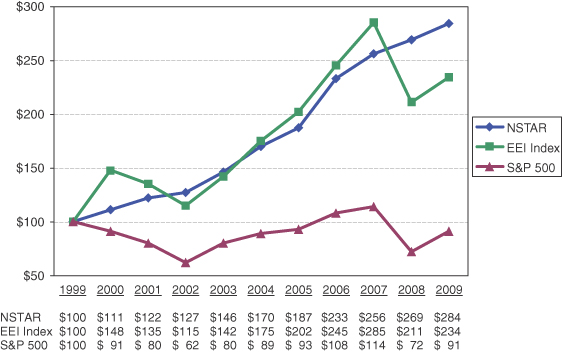
(f) Stock Performance Graphs
The following Stock Performance Graphs and related information shall not be deemed “soliciting material” or “as filed” with the SEC, nor shall such information be incorporated by reference into any future filing under the Securities Act of 1933 or Securities Exchange Act of 1934, each as amended, except to the extent that the Company specifically incorporates it by reference into such filing.
18
Table of Contents
The stock performance graph presentations set forth below compare cumulative five-year and ten-year shareholder returns with the Standard & Poor’s 500 Index (S&P 500) and the Edison Electric Institute Index (EEI Index), a recognized industry index of 58 investor-owned utility companies. Pursuant to the SEC’s regulations, the graphs below depict the investment of $100 at the commencement of the measurement periods, with dividends reinvested.
Five-Year Performance Graph
Ten-Year Performance Graph
19
Table of Contents
| Item 6. | Selected Consolidated Financial Data |
The following table summarizes five years of selected consolidated financial data.
| (in thousands, except per share data) |
2009 | 2008 | 2007 | 2006 | 2005 | ||||||||||
| Operating revenues (a) |
$ | 3,050,044 | $ | 3,208,321 | $ | 3,136,085 | $ | 3,441,505 | $ | 3,135,219 | |||||
| Net income: from continuing operations (b) |
$ | 244,015 | $ | 225,996 | $ | 213,056 | $ | 191,917 | $ | 192,209 | |||||
| Net income: from discontinued operations |
$ | 9,233 | $ | 11,551 | $ | 8,459 | $ | 14,857 | $ | 3,926 | |||||
| Net income: attributable to common shareholders |
$ | 253,248 | $ | 237,547 | $ | 221,515 | $ | 206,774 | $ | 196,135 | |||||
| Per common share: |
|||||||||||||||
| Basic earnings - |
|||||||||||||||
| Continuing operations |
$ | 2.28 | $ | 2.11 | $ | 1.99 | $ | 1.80 | $ | 1.80 | |||||
| Discontinued operations |
0.09 | 0.11 | 0.08 | 0.14 | 0.04 | ||||||||||
| Total earnings |
$ | 2.37 | $ | 2.22 | $ | 2.07 | $ | 1.94 | $ | 1.84 | |||||
| Diluted earnings - |
|||||||||||||||
| Continuing operations |
$ | 2.28 | $ | 2.11 | $ | 1.99 | $ | 1.79 | $ | 1.79 | |||||
| Discontinued operations |
0.09 | 0.11 | 0.08 | 0.14 | 0.04 | ||||||||||
| Total earnings |
$ | 2.37 | $ | 2.22 | $ | 2.07 | $ | 1.93 | $ | 1.83 | |||||
| Cash dividends declared (c) |
$ | 1.525 | $ | 1.425 | $ | 1.325 | $ | 1.535 | $ | 0.87 | |||||
| Assets from continuing operations |
$ | 7,976,929 | $ | 8,093,996 | $ | 7,588,570 | $ | 7,602,680 | $ | 7,480,285 | |||||
| Assets held for sale |
$ | 167,857 | $ | 175,493 | $ | 170,975 | $ | 166,715 | $ | 158,047 | |||||
| Long-term debt (a)(d) |
$ | 1,754,236 | $ | 1,928,708 | $ | 1,929,348 | $ | 1,631,474 | $ | 1,518,651 | |||||
| Transition property securitization (d) |
$ | 212,205 | $ | 331,209 | $ | 483,961 | $ | 637,217 | $ | 787,966 | |||||
| Preferred stock of subsidiary |
$ | 43,000 | $ | 43,000 | $ | 43,000 | $ | 43,000 | $ | 43,000 | |||||
| (a) | On December 21, 2009, NSTAR announced the sale of its wholly-owned subsidiary, MATEP. The assets of MATEP were considered to be held for sale as of December 21, 2009 and the subsidiary operations were classified as discontinued operations. Operating revenues and long-term debt amounts of MATEP have been excluded from the selected financial data presented. |
| (b) | Includes impact of preferred stock dividends of subsidiary to the noncontrolling interest |
| (c) | As a result of a change in NSTAR’s Board of Trustees’ meetings schedule in 2005, the fourth quarter dividend that typically would have been declared in December 2005, was approved on January 26, 2006 at $0.3025 per share, and therefore dividends declared during 2006 include the fourth quarter of 2005. The dividend payment schedule remained unchanged. |
| (d) | Excludes the current portion and debt obligation related to discontinued operations. |
Selected Quarterly Consolidated Financial Data (Unaudited) (a)
| (in thousands, except earnings per share) |
|||||||||||||||
| Operating Revenues (c) |
Operating Income (c) |
Net Income (d) |
Earnings Per Share (b) | ||||||||||||
| Basic | Diluted | ||||||||||||||
| 2009 |
|||||||||||||||
| First quarter |
$ | 908,638 | $ | 123,971 | $ | 61,036 | $ | 0.57 | $ | 0.57 | |||||
| Second quarter |
$ | 683,235 | $ | 114,495 | $ | 56,934 | $ | 0.53 | $ | 0.53 | |||||
| Third quarter |
$ | 745,626 | $ | 170,226 | $ | 87,638 | $ | 0.82 | $ | 0.82 | |||||
| Fourth quarter |
$ | 712,545 | $ | 107,410 | $ | 47,640 | $ | 0.45 | $ | 0.45 | |||||
| 2008 |
|||||||||||||||
| First quarter |
$ | 857,366 | $ | 122,081 | $ | 59,236 | $ | 0.55 | $ | 0.55 | |||||
| Second quarter |
$ | 711,774 | $ | 113,475 | $ | 50,369 | $ | 0.47 | $ | 0.47 | |||||
| Third quarter |
$ | 857,709 | $ | 170,949 | $ | 85,820 | $ | 0.80 | $ | 0.80 | |||||
| Fourth quarter |
$ | 781,472 | $ | 98,624 | $ | 42,122 | $ | 0.39 | $ | 0.39 | |||||
| (a) | This information has been provided in accordance with Regulation S-K, Item 302(a). |
| (b) | The sum of the quarters may not equal annual basic and diluted earnings per share due to rounding. |
20
Table of Contents
| (c) | On December 21, 2009, NSTAR announced an agreement to sell its wholly-owned subsidiary, MATEP. The results of operations of MATEP have been classified as discontinued operations as of December 31, 2009. Operating revenues and Operating income attributable to MATEP have been excluded from the selected data presented. |
| (d) | Net income attributable to common shareholders. |
| Item 7. | Management’s Discussion and Analysis of Financial Condition and Results of Operations (MD&A) |
Overview
NSTAR (or the Company) is a holding company engaged through its subsidiaries in the energy delivery business serving approximately 1.4 million customers in Massachusetts, including approximately 1.1 million electric distribution customers in 81 communities and approximately 300,000 natural gas distribution customers in 51 communities. NSTAR’s retail electric transmission and distribution utility subsidiaries are NSTAR Electric and NSTAR Gas, respectively. Harbor Electric Energy Company, a wholly-owned subsidiary of NSTAR Electric, provides distribution service and ongoing support to its only customer, the Massachusetts Water Resources Authority. NSTAR’s nonutility, unregulated operations include telecommunications operations (NSTAR Com) and a liquefied natural gas service company (Hopkinton). Utility operations accounted for approximately 99% of consolidated operating revenues of continuing operations in 2009, 2008, and 2007.
NSTAR consolidates three wholly-owned special purpose subsidiaries, BEC Funding LLC, BEC Funding II, LLC and CEC Funding, LLC. These entities were created to complete the sale of electric rate reduction certificates to a special purpose trust created by two Massachusetts state agencies. These financing transactions securitized the costs incurred related to the divestiture of generation assets and long-term power contracts.
NSTAR derives its operating revenues primarily from the sale of energy, distribution, transmission, and energy efficiency services to customers. NSTAR’s earnings are impacted by fluctuations in unit sales of electric kWh and natural gas MMbtu, which have an effect on the level of distribution and transmission revenues recognized. In accordance with the regulatory rate structure in which NSTAR operates, its recovery of energy costs are fully reconciled with the level of energy revenues currently recorded and, therefore, do not have an impact on earnings. As a result of this rate structure, any variability in the cost of energy supply purchased will have an impact on purchased power and transmission and cost of gas sold expenses, but will not affect the Company’s net income as the Company recognizes a corresponding change in revenues.
Discontinued Operations
On December 21, 2009, NSTAR announced an agreement to sell its wholly-owned subsidiary, Medical Area Total Energy Plant, Inc. (MATEP). MATEP provides steam, chilled water service, and electricity under long-term contracts to several hospitals, medical research and biotechnology centers, and teaching institutions in the Longwood Medical Area of Boston. The sale is at a price of approximately $320 million in cash and is subject to certain federal and local regulatory approvals. The purchase price is subject to certain closing adjustments related to changes in working capital, interest, and other adjustments. In connection with the sale, NSTAR will retire MATEP’s debt.
MATEP’s principal asset is a cogeneration plant that produces electricity, steam and chilled water, and a distribution system that delivers these products to its customers. MATEP has approximately 85 employees.
The sale is expected to close towards the end of the first quarter or early part of the second quarter of 2010. Net proceeds from the transaction are anticipated to be used to reduce NSTAR’s capitalization.
Critical Accounting Policies and Estimates
NSTAR’s discussion and analysis of its financial condition, results of operations and cash flows are based on the accompanying Consolidated Financial Statements, which have been prepared in accordance with GAAP. The
21
Table of Contents
preparation of these Consolidated Financial Statements required management to make estimates and judgments that affect the reported amount of assets and liabilities, revenues and expenses, and related disclosure of contingent assets and liabilities at the date of the Consolidated Financial Statements. Actual results may differ from these estimates under different assumptions or conditions.
Critical accounting policies and estimates are defined as those that require significant judgment and uncertainties, and potentially may result in materially different outcomes under different assumptions and conditions. The accounting policies and estimates that are most critical to the reported results of operations, cash flows and financial position are described below.
a. Revenue Recognition
Electric and gas revenues are based on rates approved by the DPU and the FERC. Revenues related to the sale, transmission and distribution of energy delivery service are generally recorded when service is rendered or energy is delivered to customers. However, the determination of the sales to individual customers is based on systematic meter readings throughout a month. Meters that are not read during a given month are estimated and trued-up to actual use in a future period. At the end of each month, aggregate amounts of energy delivered to customers since the date of their last meter reading are estimated and the corresponding unbilled revenue is recorded. Unbilled electric revenue is estimated each month based on daily territory load (customer energy requirements), estimated line losses and applicable customer rates. Unbilled natural gas revenues are estimated based on estimated purchased gas volumes, estimated gas losses and applicable customer rates. Accrued unbilled revenues recorded in the accompanying Consolidated Balance Sheets as of December 31, 2009 and 2008 were $67 million and $62 million, respectively.
The level of revenues is subject to seasonal weather conditions. Electric sales volumes are typically higher in the winter and summer than in the spring or fall. Gas sales volumes are impacted by colder weather since a substantial portion of NSTAR Gas’ customer base uses natural gas for heating purposes. As a result, NSTAR records a higher level of revenue during the seasonal periods mentioned above.
NSTAR’s nonutility revenues are recognized when services are rendered. Revenues are based, for the most part, on long-term contractual rates.
b. Regulatory Accounting
NSTAR follows accounting policies prescribed by GAAP, the FERC, and the DPU. In addition, NSTAR and its subsidiaries are subject to the accounting and reporting requirements of the SEC. As rate-regulated companies, NSTAR’s utility subsidiaries are subject to the application of an accounting standard for rate-regulated entities, ASC 980, Regulated Operations, that considers the effects of regulation resulting from differences in the timing of their recognition of certain revenues and expenses from those of other businesses and industries. NSTAR’s distribution and transmission businesses are subject to rate-regulation that is based on cost recovery and meets the criteria for application of ASC 980. This ratemaking process results in the recording of regulatory assets or a regulatory liability (including cost of removal) based on the probability of current and future cash flows. Regulatory assets represent incurred or accrued costs that have been deferred because they are probable of future recovery from customers. Regulatory liabilities may represent collections from customers that have been deferred because they will be expended in the future or they may relate to the future cost of removal of assets. (Refer to the accompanying “Asset Retirement Obligations and Cost of Removal” section of Item 7, “Management’s Discussion and Analysis of Financial Condition and Results of Operations.”) As of December 31, 2009 and 2008, NSTAR has recorded regulatory assets of $2.6 billion and $2.9 billion, and regulatory liabilities of $270 million and $265 million, respectively. NSTAR continuously reviews these regulatory assets to assess their ultimate recoverability within the approved regulatory guidelines. NSTAR expects to fully recover these regulatory assets in its rates. If future recovery of any deferred costs ceases to be probable, NSTAR would be required to charge such deferred amounts to earnings. Impairment risk associated with these assets relates to potentially adverse legislative, judicial or regulatory actions in the future.
22
Table of Contents
c. Pension and Other Postretirement Benefits
NSTAR’s annual pension and other postretirement benefits costs are dependent upon several factors and assumptions, such as but not limited to, employee demographics, plan design, the level of cash contributions made to the plans, the discount rate, the expected long-term rate of return on the plans’ assets and health care cost trends.
Changes in pension and PBOP assets and liabilities associated with these factors are not immediately recognized as pension and PBOP costs in the statements of income, but generally are recognized in future years over the remaining average service period of the plans’ participants. However, these factors could have a significant impact on pension and postretirement assets or liabilities recognized.
NSTAR’s Pension Plan and PBOP Plan assets, which partially consist of equity investments, have been affected by recent trends in the overall global equity markets. Fluctuations in the fair value of the Pension Plan and PBOP Plan assets impact the funded status, accounting costs, and cash funding requirements of these Plans. The earnings impact of increased Pension and PBOP costs is substantially mitigated by NSTAR’s DPU-approved pension and PBOP rate adjustment mechanism. Under the PAM, NSTAR recovers its pension and PBOP expense through a reconciling rate mechanism. The PAM removes the volatility in earnings that could result from fluctuations in market conditions and plan experience.
There were no significant changes to NSTAR’s pension and PBOP benefits in 2009, 2008, and 2007. As further described in Note H, “Pension and Other Postretirement Benefits,” in the accompanying Notes to the Consolidated Financial Statements, NSTAR’s discount rate for the Pension Plan obligation was 5.85% and 6.25% at December 31, 2009 and 2008, respectively. NSTAR’s discount rate for the PBOP obligation was 6.00% and 6.10% at December 31, 2009 and 2008, respectively. These discount rates align with market conditions and the anticipated cash flow characteristics of NSTAR’s pension and PBOP obligations. The expected long-term rate of return on both pension plan and PBOP assets for 2009 remained at 9.0%, the same as 2008 and 2007. Changes in these assumptions have an impact on reported pension and PBOP costs and obligations.
The following table reflects the projected benefit obligation and cost sensitivities associated with a change in certain actuarial assumptions by the indicated percentage for continuing operations. Each sensitivity below reflects an evaluation of the change based solely on a change in that assumption.
| (in thousands) |
||||||||||
| Actuarial Assumption |
Change in Assumption |
Impact on Projected Benefit Obligation Increase/(Decrease) |
Impact on 2009 Cost Increase/(Decrease) |
|||||||
| Pension: |
||||||||||
| Increase in discount rate |
50 basis points | $ | (61,772 | ) | $ | (6,060 | ) | |||
| Decrease in discount rate |
50 basis points | $ | 61,138 | $ | 5,427 | |||||
| Increase in expected long-term rate of return on plan assets |
50 basis points | N/A | $ | (3,481 | ) | |||||
| Decrease in expected long-term rate of return on plan assets |
50 basis points | N/A | $ | 3,481 | ||||||
| Actuarial Assumption |
||||||||||
| Other Postretirement Benefits: |
||||||||||
| Increase in discount rate |
50 basis points | $ | (42,144 | ) | $ | (3,032 | ) | |||
| Decrease in discount rate |
50 basis points | $ | 47,057 | $ | 3,436 | |||||
| Increase in expected long-term rate of return on plan assets |
50 basis points | N/A | $ | (1,063 | ) | |||||
| Decrease in expected long-term rate of return on plan assets |
50 basis points | N/A | $ | 1,063 | ||||||
23
Table of Contents
Management evaluates the appropriateness of the discount rate through the modeling of a bond portfolio that approximates the Plan liabilities. In determining the expected long-term rate of return on plan assets, NSTAR considers past performance and economic forecasts for the types of investments held by the Plan as well as the target allocation for the investments over a long-term period. The expected long-term rate of return on Plan assets could vary from actual year-to-year returns. The target allocation for investments may vary from the actual allocation at any particular time. During 2009, NSTAR contributed $125 million to the Pension Plans and $30 million to the PBOP Plan. In 2010 NSTAR expects to contribute $25 million to the Pension Plan and $35 million to the PBOP Plan.
The Pension Protection Act of 2006 (the PPA) generally requires employers with defined-benefit pension plans to make minimum contributions to fund any shortfall between the assets and liabilities of the plan (as defined by the PPA) over a period of seven years. On December 23, 2008, the Worker, Retiree and Employer Recovery Act of 2008 (WRERA) was enacted, providing relief to single employer pension plans with respect to contribution requirements for the 2009 and 2010 plan years. The Company is in compliance with the funding requirements of PPA and WRERA as of December 31, 2009.
d. Uncertain Tax Positions
Accounting for uncertain tax positions requires management to use judgment in assessing the potential exposure from tax positions taken that may be challenged by taxing authorities. Management is required to assess the possibility of alternative outcomes based upon all facts available at the reporting date. These estimates could differ significantly from the ultimate outcome. For additional information on uncertain tax positions and estimates used therein, refer to “Income Tax Matters” included in this section of this MD&A.
Investments in Yankee Companies
NSTAR Electric has an equity ownership of 14% in Connecticut Yankee Atomic Power Company (CY), 14% in Yankee Atomic Electric Company (YA), and 4% in Maine Yankee Atomic Power Company (MY), (collectively, the Yankee Companies). CY, YA, and MY plant sites have been decommissioned in accordance with NRC procedures. Amended licenses continue to apply to the ISFSI’s where spent nuclear fuel is stored at these sites. CY, YA, and MY remain responsible for the security and protection of the ISFSI and are required to maintain radiation monitoring programs at the sites.
Yankee Companies Spent Fuel Litigation
In October 2006, the U.S. Court of Federal Claims issued a judgment in a spent nuclear fuel litigation, in the amounts of $34.2 million, $32.9 million, and $75.8 million for CY, YA, and MY, respectively. This judgment in favor of these Yankee Companies relates to the alleged failure of the Department of Energy (DOE) to provide for a permanent facility to store spent nuclear fuel for years prior to 2001 for CY and YA, and prior to 2002 for MY (DOE Phase I Damages). NSTAR Electric’s portion of the Phase I judgments amounts to $4.8 million, $4.6 million, and $3 million, respectively. On July 1, 2009, the Yankee Companies filed for additional damages related to the alleged failure of the DOE to provide for a permanent facility to store spent nuclear fuel for the years from January 2002 through December 2008 for CY and YA, and from January 2003 through December 2008 for MY (DOE Phase II Damages). This phase of the spent nuclear fuel litigation specifies damages in the amounts of $135.4 million, $86.1 million, and $43 million for CY, YA, and MY, respectively. Claim amounts applicable to NSTAR Electric are $19 million, $12 million, and $1.7 million, respectively.
NSTAR cannot predict the ultimate outcome of these pending decisions for trial, appeal or the potential subsequent complaints. However, should the Yankee Companies ultimately prevail, NSTAR Electric’s share of the proceeds received would be refunded to its customers.
The accounting for decommissioning costs of nuclear power plants involves significant estimates related to costs to be incurred many years in the future. Changes in these estimates will not affect NSTAR’s results of operations or cash flows because these costs will be collected from customers through NSTAR Electric’s transition charge filings with the DPU.
24
Table of Contents
Derivative Instruments
Energy Contracts
NSTAR has determined that its electricity supply contracts qualify for, and NSTAR has elected, the normal purchases and sales exception. As a result, these agreements are not reflected on the accompanying Consolidated Balance Sheets. NSTAR has only one significant gas supply contract. This contract is essentially an all-requirements portfolio asset management contract that expires in October 2011. This contract contains market based pricing terms and, therefore, no financial statement adjustments to mark the contracts to market are required. Gas supply costs incurred related to the gas asset management contract were approximately $177 million, $259 million, and $224 million for the years ended December 31, 2009, 2008, and 2007, respectively, and have been recorded to Cost of gas sold on the accompanying Consolidated Statements of Income. Refer to the accompanying Item 7A “Quantitative and Qualitative Disclosures About Market Risk” for a further discussion.
Gas Hedging Agreements
In accordance with a DPU order, NSTAR Gas purchases financial contracts based upon NYMEX natural gas futures in order to reduce cash flow variability associated with the purchase price for approximately one-third of its natural gas purchases. This practice attempts to minimize the impact of fluctuations in prices to NSTAR’s firm gas customers. These financial contracts do not procure gas supply. These contracts qualify as derivative financial instruments. Accordingly, the fair value of these instruments is recognized on the accompanying Consolidated Balance Sheets as an asset or liability representing amounts due from or payable to the counterparties of NSTAR Gas, as if such contracts were settled as of the balance sheet date. All actual costs incurred or benefits realized are included in the CGAC of NSTAR Gas. As a result, NSTAR Gas records an offsetting regulatory asset or liability for the market price changes, in lieu of recording an adjustment to Other Comprehensive Income. Currently, these derivative contracts extend through April 2011. As of December 31, 2009 and 2008, NSTAR had recorded a liability and a corresponding regulatory asset of $1.7 million and $32.9 million, respectively, to reflect the fair value of these contracts. During the years ended December 31, 2009, 2008, and 2007, $47 million, $16 million, and $30 million, respectively, of these financial contracts were settled and were recognized as additional charges to Cost of gas sold on the accompanying Consolidated Statements of Income.
Asset Retirement Obligations and Cost of Removal
The fair value of a liability for an asset retirement obligation (ARO) is recorded in the period in which it is incurred. When the liability is initially recorded, the entity capitalizes the cost by increasing the carrying amount of the related long-lived asset. Over time, the liability is accreted to its present value each period, and the capitalized cost is depreciated over the useful life of the related asset. Upon settlement of the liability, an entity either settles the obligation for its recorded amount or incurs a gain or loss upon settlement.
The recognition of an ARO within NSTAR’s regulated utility businesses has no impact on its earnings. For its rate-regulated utilities, NSTAR establishes a regulatory asset to recognize future recoveries through depreciation rates for the recorded ARO. NSTAR has certain plant assets in which this condition exists and is related to both plant assets containing hazardous materials and legal requirements to undertake remediation efforts upon retirement.
At December 31, 2009 and 2008, NSTAR had recorded asset retirement cost liabilities of $30 million and $23 million, respectively, which approximates the current cost for NSTAR to meet its legal or contractual obligations to perform actions at some point after the retirement of an asset. This amount is included in Deferred credits and other liabilities: Other on the accompanying Consolidated Balance Sheets.
For NSTAR’s regulated utility businesses, the ultimate cost to remove utility plant from service (cost of removal) is recognized as a component of depreciation expense in accordance with approved regulatory treatment. As of December 31, 2009 and 2008, the estimated amount of the cost of removal included in regulatory liabilities was
25
Table of Contents
approximately $270 million and $265 million, respectively, based on the estimated cost of removal component in current depreciation rates. This represents the cumulative amounts collected from customers for cost of removal, but not yet expended.
New Accounting Standards Updates
Variable Interest Entities
Amended consolidation guidance applicable to variable interest entities will be effective for NSTAR beginning in fiscal year 2010. The Company does not anticipate that this authoritative guidance will have an effect on the Company’s existing contractual and business relationships and how they are reported in the consolidated financial statements.
Rate and Regulatory Proceedings
a. Rate Structures
Rate Settlement Agreement
NSTAR Electric is currently operating under a DPU-approved Rate Settlement Agreement (“Rate Settlement Agreement”) that expires December 31, 2012. From 2007 through 2012, the Rate Settlement Agreement establishes for NSTAR Electric, among other things, annual inflation-adjusted distribution rates that are generally offset by an equal and corresponding reduction in transition rates. The increase adjustment will be 1.32% effective January 1, 2010; and corresponding adjustments were 1.74%, 2.68%, and 2.64% effective January 1, 2009, 2008, and 2007, respectively. Uncollected transition charges as a result of the reductions in transition rates are deferred and collected through future rates with a carrying charge. The Rate Settlement Agreement implemented a 50% / 50% earnings sharing mechanism based on NSTAR Electric’s distribution return on equity (excluding incentives) should it exceed 12.5% or fall below 8.5%. Should the return on equity fall below 7.5%, NSTAR Electric may file a request for a general rate increase. NSTAR Electric did not exceed the 12.5%, or fall below the 8.5% distribution return on equity during 2009, 2008 or 2007.
Basic Service Rates
Electric distribution companies in Massachusetts are required to obtain and resell power to retail customers through Basic Service for those customers who choose not to buy energy from a competitive energy supplier. Basic Service rates are reset every six months (every three months for large commercial and industrial customers). The price of Basic Service is intended to reflect the average competitive market price for electric power. As of December 31, 2009, 2008, and 2007, customers of NSTAR Electric had approximately 43%, 45%, and 47%, respectively, of their load requirements provided through Basic Service. NSTAR Electric fully recovers its energy costs through DPU-approved rate mechanisms.
Firm Natural Gas Rates
In addition to delivery service rates, NSTAR Gas’ tariffs include a seasonal CGAC and a LDAC. The CGAC provides for the recovery of all gas supply costs from firm sales customers. The LDAC provides for the recovery of certain costs applicable to both sales and transportation customers. The CGAC is filed semi-annually for approval by the DPU. The LDAC is filed annually for approval. In addition, NSTAR Gas is required to file interim changes to its CGAC factor when the actual costs of gas supply vary from projections by more than 5%. Changes in the cost of gas supply have no impact on the Company’s earnings due to the CGAC and LDAC rate recovery mechanisms.
b. Service Quality Indicators
SQI are established performance benchmarks for certain identified measures of service quality relating to customer service and billing performance, safety and reliability and consumer division statistics performance for
26
Table of Contents
all Massachusetts utilities. NSTAR Electric and NSTAR Gas are required to report annually to the DPU concerning their performance as to each measure and are subject to maximum penalties of up to two and one-half percent of total transmission and distribution revenues should performance fail to meet the applicable benchmarks.
NSTAR monitors its service quality continuously to determine if a liability has been triggered. If it is probable that a liability has been incurred and is estimable, a liability is accrued. Annually, each NSTAR utility subsidiary makes a service quality performance filing with the DPU. Any settlement or rate order that would result in a different liability level from what has been accrued would be adjusted in the period that the DPU issues an order determining the amount of any such liability.
NSTAR Electric filed its 2007 Service Quality Reports with the DPU that demonstrated the Company achieved sufficient levels of service performance. On January 13, 2010, the DPU approved the 2007 Service Quality Report and agreed performance levels were sufficient. Therefore, no penalties were assessed.
Service Quality reports for both NSTAR Gas and NSTAR Electric for 2008 have been filed with the DPU. The NSTAR Gas report has been approved and the NSTAR Electric report is under review. Based on the reports filed, no penalties were assessable for the performance year.
NSTAR Electric and NSTAR Gas service quality performance levels for 2009 were not in a penalty situation and the final performance reports are anticipated to be filed during the first quarter of 2010.
c. Regulatory Matters
Massachusetts Regulatory Environment
On July 2, 2008, the Massachusetts Legislature passed the Green Communities Act (GCA) energy policy legislation designed to substantially increase energy efficiency and the development of renewable energy resources in Massachusetts. The GCA:
| • | Requires electric and natural gas distribution companies to file three-year energy efficiency investment plans to include fully reconciling funding mechanisms and incentives; |
| • | Requires utility distribution companies to undertake various Green programs, including the solicitation of bids for long-term renewable energy procurement contracts for which utilities would be allowed remuneration on certain Massachusetts-based contract commitments; |
| • | Establishes a “smart grid” pilot program; |
| • | Gives final approval to the State’s participation in the Regional Greenhouse Gas Initiative; |
| • | Increases Renewable Portfolio Standards and Alternative Energy Portfolio Standards for utilities and other electricity suppliers regarding the power that they purchase. Requirements to purchase power from new renewable resources will increase in increments of 1% per year from 4% in 2009 to 15% in 2020. Requirements to purchase from alternative portfolio resources will gradually increase from 1% in 2009 to 5% in 2020. Existing requirements to purchase 3.5% from waste to energy resources and 3.6% from vintage renewable resources are not expected to change. By 2020, NSTAR Electric anticipates purchasing 27.1% of its power under these mandates, as compared to a total of 12.1% in 2009; and |
| • | Modifies the service quality performance penalty provision (Refer to Note O, “Commitments and Contingencies,” of the accompanying Notes to Consolidated Financial Statements). |
The GCA allows for utilities to recover in rates the incremental costs associated with its various mandated programs.
On August 7, 2008, the Massachusetts Global Warming Solutions Act (GWSA) was enacted. The intention of the GWSA is to reduce greenhouse gas emissions in Massachusetts across multiple sectors of the economy, first by
27
Table of Contents
requiring the reporting of carbon dioxide and other greenhouse gas emissions and then requiring the gradual reduction of such greenhouse gas emissions by 80% of 1990 levels over a 40-year period beginning in 2010. Regulations setting forth specific detailed requirements under the GWSA started with the establishment of 1990 Baseline and 2020 Business as Usual Projection during 2009. By January 2011, the State is expected to adopt regulations establishing a desired level of declining emissions limits for resources that emit greenhouse gases. At this time, NSTAR cannot predict the effect of the GWSA on its future results of operations, financial position, or cash flows.
Long-Term Renewable Energy Contracts
In accordance with the requirements of the GCA, in January, 2010 NSTAR Electric along with other Massachusetts investor-owned utilities began to solicit bids for renewable energy and renewable energy certificates for approximately 1.5% of total annual load for between ten and 15 year periods. The evaluation of supplier bids will be weighted primarily towards price factors, but also by non-price factors such as reliability and financial stability. All contracts must be approved by the DPU.
Electric and Gas Rate Decoupling
On July 16, 2008, the DPU issued an order to all Massachusetts’ electric and gas distribution utility companies that requires them to develop plans to decouple their rates/revenues from sales volumes. This action is intended to encourage utility companies to help their customers reduce energy consumption. Decoupling of rates will allow utility companies to carry out the mandates of the GCA and at the same time collect the adequate level of revenues to maintain the quality and reliability of electric and gas services. This order allows companies to file for recovery of lost base revenues caused by incremental energy efficiency spending until their decoupling rate plans are approved. Once decoupled rate plans are approved, revenues will be set at a level designed to recover the utility companies’ incurred costs plus a return on their investment. This revenue level will be reconciled with actual revenues received from decoupled rates on an annual basis and any over or under collection will be refunded to or recovered from customers in the subsequent year.
This revenue adjustment mitigates the impact of lower sales resulting from incremental energy efficiency programs. NSTAR Electric currently does not expect to file for fully decoupled electric rates until after the Rate Settlement Agreement expires in 2012. However, NSTAR Gas may file prior to that date.
Regulatory Proceedings - DPU Safety and Reliability Programs (CPSL)
As part of the Rate Settlement Agreement, NSTAR Electric is allowed to recover incremental spending for the double pole inspection, replacement/restoration and transfer program and the underground electric safety program, which includes stray-voltage remediation and manhole inspections, repairs, and upgrades. Recovery of these Capital Program Scheduling List (CPSL) costs is subject to DPU review and approval. NSTAR Electric incurred incremental costs of $11 million, $13 million, and $15 million in 2006, 2007 and 2008, respectively. This includes incremental operations and maintenance and revenue requirements on capital investments. The final reconciliation of 2006 and 2007 CPSL costs recovery is currently under review by the DPU. The incremental costs for the year 2009 are currently under review by the Company and are estimated to be approximately $16 million. NSTAR awaits the results of the 2006 and 2007 filings from the DPU prior to submitting the final 2008 and 2009 CPSL cost recovery reconciliations with the DPU. NSTAR cannot predict the timing of a DPU order related to these pending filings. Should an adverse decision be issued which disallows a significant portion of CPSL cost recovery, it could have a material adverse impact to NSTAR’s results of operations, financial position, and cash flows.
Wholesale Power Cost Savings Initiatives
The Rate Settlement Agreement includes incentives to encourage NSTAR Electric to continue its efforts to advocate on behalf of customers at the FERC to mitigate wholesale electricity cost inefficiencies that would be
28
Table of Contents
borne by regional customers. As a result of its role in two RMR cases, NSTAR Electric had sought to collect $9.8 million annually for three years and began collecting some of these incentive revenues from its customers effective January 1, 2007, subject to final DPU approval. Through December 31, 2009, approximately $18.9 million had been collected from customers for the Wholesale Power Cost Savings Initiatives.
On November 30, 2009, DPU denied NSTAR Electric’s petition. NSTAR Electric must refund the $18.9 million already collected from customers. The DPU order had no impact on earnings as the Company did not reflect the amounts collected in revenues.
Basic Service Bad Debt Adder
On July 1, 2005, in response to a generic DPU order that required electric utilities in Massachusetts to recover the cost of the energy-related portion of bad debt costs in their Basic Service rates, NSTAR Electric increased its Basic Service rates and reduced its distribution rates for those bad debt costs. In furtherance of this generic DPU order, NSTAR Electric included a bad debt cost recovery mechanism as a component of its Rate Settlement Agreement. This recovery mechanism (bad debt adder) allows NSTAR Electric to recover its Basic Service bad debt costs on a fully reconciling basis. These rates were implemented, effective January 1, 2006, as part of NSTAR Electric’s Rate Settlement Agreement.
On February 7, 2007, NSTAR Electric filed its 2006 Basic Service reconciliation with the DPU proposing an adjustment related to the increase of its Basic Service bad debt charge-offs. This proposed rate adjustment was anticipated to be implemented effective July 1, 2007. On June 28, 2007, the DPU issued an order approving the implementation of a revised Basic Service rate. However, the DPU instructed NSTAR Electric to reduce distribution rates by the increase in its Basic Service bad debt charge-offs. Such action would result in a further reduction to distribution rates from the adjustment NSTAR Electric made when it implemented the Settlement Agreement. This adjustment to NSTAR Electric’s distribution rates would eliminate the fully reconciling nature of the Basic Service bad debt adder.
NSTAR Electric has not implemented the components of the June 28, 2007 DPU order. Implementation of this order would require NSTAR Electric to write-off a previously recorded regulatory asset related to its Basic Service bad debt costs. NSTAR Electric filed a Motion for Reconsideration of the DPU’s order on July 18, 2007. On December 14, 2007, the Motion for Reconsideration was granted and the DPU reopened the case to hear additional evidence. NSTAR Electric filed additional testimony in April 2008, an evidentiary hearing was held, and briefs were filed in June and early July 2008. NSTAR Electric believes its position is appropriate and that it is probable that it will ultimately prevail. However, in the event the DPU does not rule in its favor, NSTAR Electric intends to pursue all legal options. As of December 31, 2009, the potential impact to earnings of eliminating the bad debt adder would be approximately $20.8 million, pre-tax. NSTAR cannot predict the timing of this proceeding.
FERC Transmission ROE
Local Transmission Facilities
For participating New England Transmission Owners, including NSTAR Electric, a base ROE on transmission facilities of 11.14% has been approved by FERC. NSTAR earns this ROE on all local transmission facility investments.
Regional Transmission Facilities
The FERC authorized an ROE on NSTAR’s regional transmission facilities of 11.64%.
Additional Incentive Adders
Additional incentive adders are available and are decided on a case by case basis in accordance with the FERC’s most recent national transmission incentive rules. The FERC may grant a variety of financial incentives,
29
Table of Contents
including ROE basis point incentive adders for qualified investments made in new regional transmission facilities. This 100 basis point adder, when combined with the FERC’s approved ROEs described above, results in a 12.64% ROE for qualified regional investments. The incentive is intended to promote and accelerate investment in transmission projects that can significantly reduce congestion costs and enhance reliability in the region. NSTAR’s 345 kV Transmission Project completed in phases through December 2008, among others, has received this additional incentive adder.
Other
Energy Efficiency Plans
NSTAR Electric and NSTAR Gas are required to administer demand-side management energy efficiency programs. The GCA directs electric and gas distribution companies to develop three-year energy efficiency plans. The first three-year plan effective in 2010 is expected to lead to a significant expansion of energy efficiency activity in Massachusetts. Like the historical programs, the new three-year plans may include financial incentives based on energy efficiency program performance. In addition, the DPU has stated that it will permit distribution companies that do not yet have rate decoupling mechanisms in place to implement lost base revenue rate adjustment mechanisms that will partially offset reduced distribution rate revenues as a result of successful energy efficiency programs.
During 2009, NSTAR Electric incurred Energy Efficiency expenses of approximately $80.1 million, inclusive of program administrator incentives. NSTAR Electric has filed its 2010 Energy Efficiency Plan and anticipates that the program will amount to about $122 million in spending. The 2010 plan was approved by DPU on January 28, 2010.
During 2009, NSTAR Gas incurred Energy Efficiency expenses of approximately $8.2 million, inclusive of program administrator incentives. NSTAR Gas has filed its 2010 Energy Efficiency Plan and anticipates that the program will amount to about $16.4 million in spending, subject to DPU approval. The 2010 plan was approved by DPU on January 28, 2010.
American Recovery and Reinvestment Act of 2009 (ARRA)
The American Recovery and Reinvestment Act of 2009 (ARRA) provides resources for government-funded spending in several energy-related areas that have relevance to NSTAR, including energy efficiency, smart grid funding, renewable energy financing and transmission projects. These initiatives are largely directed through federal and state agencies and not-for-profit public agencies. NSTAR continues to evaluate the impact of this legislation on its business initiatives in these areas. Any action will require regulatory approval.
In August 2009, NSTAR Electric applied for Federal grants for its Smart Grid Programs. The requested funding represents 50% of the estimated total project costs. On October 27, 2009 and November 25, 2009, NSTAR Electric received notice from the U.S. Department of Energy (DOE) that it had been awarded grants of approximately $18 million for three projects related to distribution automation, smart metering and renewable energy inter-connections proposals. NSTAR Electric anticipates that most of the remaining costs not recovered through the grant process will be recovered from customers. These projects are anticipated to enhance information technology, communications and monitoring functions and improve reliability and efficiency on NSTAR Electric’s distribution network.
Proposed Transmission Investment
NSTAR, together with Northeast Utilities (NU) (collectively, the Petitioners), filed and received approval on a joint petition with the FERC for a declaratory judgment that would allow the Petitioners to enter into a bilateral transmission services agreement with Hydro Quebec (HQ) subsidiaries. Under this agreement, the Petitioners
30
Table of Contents
would sell 1,200 MW of firm transmission service over a new, participant-funded transmission tie line connecting New England with the HQ system in order for HQ to sell and deliver this same amount of firm power from the HQ system to interested parties in New England for a term of no less than twenty years. This project would provide a competitive source of clean power that is favorable in comparison to current alternatives and provides for an expansion of New England’s transmission system without raising regional transmission rates.
The Petitioners and HQ are negotiating:
| • | A joint development agreement for the design and construction of a 1,200 MW high-voltage direct current line over mostly existing rights-of-way in Northern New England to a point to be determined in Southern New Hampshire and are performing joint planning studies for this line; |
| • | A long-term bilateral transmission service agreement; and |
| • | A Power Purchase Agreement for HQ to sell up to 1,200 MW of firm power to NSTAR, NU and other interested New England entities for a period of no less than twenty years. |
The transmission service agreement must be approved by the FERC and the Power Purchase Agreement between HQ, NSTAR and other interested New England entities must be approved by their appropriate state regulatory agencies. NSTAR anticipates that, if approved by the FERC and the DPU, construction will commence in the 2011 timeframe and is targeted for completion in 2015. NSTAR’s portion of the construction funding is estimated to be approximately $225 million. NSTAR and NU will finance and own this transmission line, while HQ will reimburse NSTAR and NU for the total costs of this project, including an investment return to NSTAR and NU.
General Legal Matters
In the normal course of its business, NSTAR and its subsidiaries are involved in certain legal matters, including civil litigation. Management is unable to fully determine a range of reasonably possible court-ordered damages, settlement amounts, and related litigation costs (legal liabilities) that would be in excess of amounts accrued and amounts covered by insurance. Based on the information currently available, NSTAR does not believe that it is probable that any such legal liabilities will have a material impact on its consolidated financial position. However, it is reasonably possible that additional legal liabilities that may result from changes in circumstances could have a material impact on its results of operations, cash flows or financial condition.
Income Tax Matters
RCN Corporation (RCN) Share Abandonment Tax Treatment
On December 24, 2003, NSTAR exited its investment in RCN by formally abandoning its 11.6 million shares of RCN common stock. As a result of the RCN share abandonment, the Company claimed an ordinary loss on its 2003 tax return. In 2006, the IRS disallowed the classification of the deduction as an ordinary loss. NSTAR appealed this decision and is currently in negotiation with the IRS Appeals office.
Prior to 2007, it was NSTAR’s tax accounting policy not to recognize tax benefits associated with an uncertain tax position until it was probable that such tax benefit would ultimately be realized. NSTAR determined that it was less than probable that the tax deduction related to the abandonment of its RCN investment would ultimately be sustained. Accordingly, NSTAR accrued a tax reserve so as to not recognize the earnings benefit of this uncertain tax position.
As of January 1, 2007, the potential tax loss was approximately $39.6 million. NSTAR adopted an accounting standard regarding uncertain tax positions effective January 1, 2007 which established a tax accounting recognition standard of more-likely-than-not, which is a lower threshold than NSTAR’s previous tax benefit recognition policy. Upon the adoption of the standard, NSTAR recognized the entire amount plus interest as an increase to its January 1, 2007 retained earnings balance.
31
Table of Contents
Construction-related Costs - Simplified Service Cost Method (SSCM)
In 2004, NSTAR amended its 2002 Federal income tax return to change its method of tax accounting for certain construction-related overhead costs previously capitalized to plant under a methodology prior to SSCM. Under SSCM, certain costs which were previously capitalized for tax purposes are deducted in the year incurred. NSTAR claimed additional deductions related to the tax accounting method change in its 2002-2004 returns of $368.9 million. In 2005, NSTAR received formal notification from the IRS that the claim on its amended income tax return was denied. NSTAR did not receive the requested refund amount due.
In August 2005, the IRS issued a Revenue Ruling and Treasury Regulations related to the SSCM to curtail these levels of construction-related cost deductions by utilities and others. Under this Regulation, the SSCM is not available for the majority of NSTAR’s constructed property for the years 2005 and forward. NSTAR was required to make a cash tax payment to the IRS of $129.1 million in late 2006 representing the disallowed SSCM deductions taken for 2002-2004 even though the tax refund was never received. This payment will be fully refunded with interest to NSTAR, once this tax position is resolved. This refund has been recorded as a current income tax receivable on the accompanying Consolidated Balance Sheets.
IRS Appeals and Examinations
As of December 31, 2009, the 2001 through 2007 Federal and state tax years remain open (including the SSCM and RCN Share Abandonment matters) and returns for those years are at the IRS Office of Appeals.
NSTAR is negotiating with IRS Appeals in an attempt to settle all issues relating to years 2001 through 2007. To date, we have reached agreement on the SSCM issue with a closing agreement expected to be signed in the first quarter of 2010. Upon approval of the settlement by the U.S. Congress Joint Committee on Taxation, NSTAR expects receipt of the $129 million of its refundable income tax receivable, plus interest, by mid-2010. Potential settlement discussions related to the RCN matter are continuing, however, the timing of any final settlement is uncertain as well as whether an agreement can be reached at an amount that would be acceptable to NSTAR. If an agreement is reached, it is reasonably possible that a charge could be recognized. Such agreement would also require Joint Committee approval. In the event that NSTAR is unsuccessful in reaching a reasonable settlement agreement with the IRS Appeals, it will continue the current plan to litigate the RCN tax matter. This action would delay resolution of this tax matter beyond 2010.
The 2008 Federal income tax return has been examined under the IRS Compliance Assurance Process (CAP) and NSTAR has received a “no change” letter. The 2009 Federal income tax return is being reviewed under CAP. This program accelerates the examination of the return in an attempt to resolve issues before the tax return is filed. The outcome of any potential audit adjustments and the timing are uncertain.
2010 Earnings Outlook
Earnings per share are expected to be in the $2.45 to $2.55 range. This range excludes the anticipated gain on the pending MATEP sale. Major assumptions supporting NSTAR’s earnings guidance for the year 2010 are as follows:
| • | Performance-based rate adjustment effective January 1, 2010 of 1.32%. |
| • | Electric sales increase of about 2%, assuming a return to normal weather conditions and modestly improving economic conditions during the year. |
| • | An increase of about $15 million in operations and maintenance expense impacting net income |
| • | An increase of about $10 million in depreciation, amortization and property taxes. |
| • | Interest costs savings due to recent refinancing of long-term debt at lower interest rates. |
| • | Capital expenditures for the year of approximately $370 million, with about $90 million planned for various transmission projects. |
32
Table of Contents
Our expectations are based on our current assumptions described above, and are subject to risks and uncertainties (Refer to “Cautionary Statement Regarding Forward-Looking Information” preceding Item 1 “Business” and Item 1A, “Risk Factors” of this Form 10-K for more information).
Common Share Dividends
On November 19, 2009, NSTAR’s Board of Trustees declared a quarterly cash dividend of $0.40 per share for shareholders of record on January 8, 2010, payable February 1, 2010. NSTAR’s current annualized rate is $1.60 per share, a 6.7% increase over the previous rate of $1.50 per share. NSTAR expects that the growth rate of its common dividend will continue to be in-line with the growth rate of its earnings per share. All future dividend decisions are subject to quarterly dividend declarations based on the Company’s financial position and other relevant considerations at the time.
Results of Continuing Operations
The following section of MD&A compares the results of continuing operations for each of the three fiscal years ended December 31, 2009, 2008, and 2007 and should be read in conjunction with the accompanying Consolidated Financial Statements and the accompanying Notes to Consolidated Financial Statements included elsewhere in this report.
2009 compared to 2008
Executive Summary
NSTAR achieved earnings growth for 2009 during a very challenging year as a difficult economic climate and unfavorable weather conditions throughout the year negatively impacted its sales. NSTAR performance results in 2009 are as follows:
| • | EPS increased $0.15 from $2.22 to $2.37, a 6.8% increase |
| • | The Company’s common share dividend was increased in 2009 by 6.7% - the twelfth consecutive year the dividend rate has been increased |
| • | Cash flows from operations increased from $545 million to $637.7 million, or 17.0% |
| • | The total shareholder return (TSR) for 2009 was 5.6% |
| • | NSTAR is the only company in the EEI Index and Fortune 1000 with a positive annual TSR for thirteen consecutive years and no company in the S&P 500 had this record of achievement |
| • | NSTAR, NSTAR Electric, and NSTAR Gas each maintained their S&P overall credit ratings at “A+/A” levels with a stable outlook |
| • | NSTAR completed long-term debt financing transactions at favorable interest rates |
Earnings per common share were as follows:
| Years ended December 31, | |||||||||
| 2009 | 2008 | % Change | |||||||
| Basic and Diluted – Continuing operations |
$ | 2.28 | $ | 2.11 | 8.1 | ||||
| Basic and Diluted – Discontinued operations |
0.09 | 0.11 | (18.2 | ) | |||||
| Total |
$ | 2.37 | $ | 2.22 | 6.8 | ||||
Net income attributable to common shareholders was $253.2 million for 2009 compared to $237.5 million for 2008. Major factors on an after-tax basis that contributed to the $15.7 million, or 6.6%, increase include:
| • | Lower operations and maintenance expense primarily due to lower storm-related costs and lower labor costs ($6.0 million). Also contributing were lower liability claims, lower advertising costs, lower outside services, and lower administrative and other operating costs ($11.0 million) |
33
Table of Contents
| • | Lower net interest charges primarily due to decreases in short-term interest rates, increased interest income on income tax items and increased interest income on regulatory deferrals ($4.8 million) |
| • | Higher firm gas revenues ($1.3 million) |
| • | Higher transmission revenues as a result of increased transmission investment base ($4 million) |
| • | Higher circuit performance incentives ($0.9 million) |
| • | Increase in the cash surrender value of insurance policies ($3.0 million) |
These positive earnings factors were partially offset by:
| • | Lower electric distribution revenues due to a 3.1% decrease in sales offset by the annual inflation rate adjustment ($1.5 million) |
| • | Higher depreciation, amortization, and property tax expenses in 2009 primarily related to higher regulated electric and gas plant investment and higher municipal property tax rates ($8.4 million) |
| • | The absence of income from an environmental settlement that occurred during the first half of 2008 ($2.9 million) |
| • | The absence of a cumulative impact in 2008 of implementing the March 29, 2008 FERC ROE order ($2.4 million) |
Significant cash flow events during 2009 include the following:
| • | Cash flows from continuing operating activities provided approximately $611.2 million, an increase of $93.5 million, as compared to the same period in 2008. The increase is due to an increase in earnings driven primarily by decreased non-amortization related operations and maintenance costs ($30 million), lower income tax payments primarily related to higher bonus depreciation and higher pension and PBOP contributions made necessary by higher periodic cost ($33.2 million), and a decrease in accounts receivable balances resulting from lower relative energy supply costs ($60.3 million). These positive sources of cash were partially offset by a comparative under-collection of regulatory deferrals in 2009 ($25 million). |
| • | NSTAR invested approximately $375 million in capital projects to improve system reliability and capacity |
| • | NSTAR issued $350 million of 4.5% debentures and NSTAR Electric issued $100 million of 5.625% debentures with an effective rate of 4.97%. NSTAR paid approximately $160 million in common share dividends and retired approximately $156 million in long-term and securitized debt. |
Electric and Gas Sales
The following is a summary of retail electric and firm gas and transportation sales for the years indicated:
| Years ended December 31, | |||||||
| 2009 | 2008 | % Change Increase/(decrease) |
|||||
| Retail Electric Sales - MWH |
|||||||
| Residential |
6,462,562 | 6,560,573 | (1.5 | ) | |||
| Commercial, Industrial, and Other |
14,509,355 | 15,087,472 | (3.8 | ) | |||
| Total retail sales |
20,971,917 | 21,648,045 | (3.1 | ) | |||
34
Table of Contents
| Years ended December 31, | |||||||
| 2009 | 2008 | % Change Increase/(decrease) |
|||||
| Firm Gas Sales and Transportation - BBtu |
|||||||
| Residential |
21,021 | 20,763 | 1.2 | ||||
| Commercial and Industrial |
21,598 | 22,134 | (2.4 | ) | |||
| Municipal |
3,094 | 2,933 | 5.5 | ||||
| Total firm sales |
45,713 | 45,830 | (0.3 | ) | |||
NSTAR’s electric sales in 2009 decreased primarily due to a cooler summer during 2009 as compared to 2008. In addition, electric sales have been impacted by the downturn in the economy that has resulted in lost sales from commercial office and retail business vacancies, and by the impact of customer and NSTAR-sponsored conservation measures. The 0.3% decrease in firm gas and transportation sales is due to greater use of conservation measures or restrictions on the use of natural gas for all customer segments, and commercial and industrial customers relocating their businesses to less costly regions or closing due to difficult economic conditions. The reduction in sales resulted despite colder weather in the first quarter and near-normal weather in the fourth quarter of 2009.
Weather, higher fuel costs, conservation measures, and economic conditions affect sales to NSTAR’s residential and small commercial customers. Economic conditions, higher fuel costs, and conservation measures affect NSTAR’s large commercial and industrial customers. In terms of customer sector characteristics, industrial sales are less sensitive to weather than residential and commercial sales, which are influenced by temperature extremes. Refer to the “Electric Revenues” and “Gas Revenues” sections below for more detailed discussions.
NSTAR Electric’s retail peak demand for 2009 was 4,507 MW measured on August 18, 2009 which was 9% less than the all-time high peak demand of 4,959 MW reached on August 2, 2006.
Weather Conditions
NSTAR forecasts its electric and natural gas sales based on normal weather conditions. Actual results may vary from those projected due to actual weather conditions, energy conservation, and other factors. Refer to the “Cautionary Statement Regarding Forward-Looking Information” section preceding Item 1, “Business” of this Form 10-K.
The demand for electricity and natural gas is affected by weather. Weather impacts electric sales primarily during the summer and, to a greater extent, gas sales during the winter season in NSTAR’s service area. Customer heating or cooling usage may not directly correlate with historical levels or with the level of degree-days that occur (as further discussed below), particularly when weather patterns experienced are consistently colder or warmer. Also, NSTAR’s electric and gas businesses are sensitive to variations in daily weather, are highly influenced by New England’s seasonal weather variations, and are susceptible to severe storm-related incidents that could adversely affect the Company’s ability to provide energy.
Degree-days measure changes in daily mean temperature levels. A degree-day is a unit measuring how many degrees the outdoor daily mean temperature falls below (in the case of heating) or rises above (in the case of cooling) a base of 65 degrees. The comparative information below relates to heating and cooling degree-days for the years 2009 and 2008 and the number of heating and cooling degree-days in a “normal” year as presented by a 30-year average. NSTAR uses the “normal 30-year average” degree-days data to compare current temperature readings to a baseline or “normal” period, that is recalculated every ten years for the preceding 30 years (currently 1971-2000), as collected at the Worcester, Massachusetts airport and Boston’s Logan Airport for heating degree-day data and cooling degree-day data, respectively. As shown on the table below, weather conditions during the first three quarters of 2009 measured by heating degree-days were higher/colder for 2009
35
Table of Contents
as compared to 2008, favorably impacting gas revenues. The fourth quarter of 2009 was warmer than the same quarter in 2008, unfavorably impacting gas revenues. Weather conditions during the three summer months ended September 30, 2009 measured by cooling degree-days were 11.4% lower/cooler for 2009 as compared to 2008, unfavorably impacting electric revenues. Refer to the “Electric Revenues” and “Gas Revenues” sections below for more detailed discussions.
Heating Degree-Days
| Three Months Ended | |||||||||||||||
| March 31 | June 30 | Sept. 30 | Dec. 31 | Total | |||||||||||
| 2009 |
3,352 | 938 | 271 | 2,341 | 6,902 | ||||||||||
| 2008 |
3,186 | 874 | 134 | 2,414 | 6,608 | ||||||||||
| Normal 30-Year Average |
3,304 | 972 | 177 | 2,362 | 6,815 | ||||||||||
| Percentage that 2009 was (warmer) colder than 2008 |
5.2 | % | 7.3 | % | 102.2 | % | (3.0 | )% | 4.4 | % | |||||
| Percentage that 2009 was (warmer) colder than 30-year average |
1.5 | % | (3.5 | )% | 53.1 | % | (0.1 | )% | 1.3 | % | |||||
Cooling Degree-Days
| Three Months Ended | |||||||||||||
| March 31 |
June 30 |
Sept. 30 |
Dec. 31 |
Total |
|||||||||
| 2009 |
— | 79 | 512 | — | 591 | ||||||||
| 2008 |
— | 210 | 578 | 1 | 789 | ||||||||
| Normal 30-Year Average |
— | 176 | 593 | 8 | 777 | ||||||||
| Percentage that 2009 was (cooler) than 2008 |
— | (62.4 | )% | (11.4 | )% | n/m | (25 | )% | |||||
| Percentage that 2009 was (cooler) than 30-year average |
— | (55.1 | )% | (13.7 | )% | n/m | (24 | )% | |||||
| n/m- not meaningful |
|||||||||||||
Operating Revenues
Operating revenues for 2009 decreased 4.9% from 2008 as follows:
| Increase/(Decrease) | |||||||||||||
| (in millions) |
2009 | 2008 | Amount | Percent | |||||||||
| Electric revenues |
|||||||||||||
| Retail distribution and transmission |
$ | 1,057.0 | $ | 963.3 | $ | 93.7 | 9.7 | % | |||||
| Energy, transition, and other |
1,494.6 | 1,676.3 | (181.7 | ) | (10.8 | )% | |||||||
| Total retail electric revenues |
2,551.6 | 2,639.6 | (88.0 | ) | (3.3 | )% | |||||||
| Gas revenues |
|||||||||||||
| Firm and transportation |
146.8 | 144.9 | 1.9 | 1.3 | % | ||||||||
| Energy supply and other |
335.3 | 408.8 | (73.5 | ) | (18.0 | )% | |||||||
| Total gas revenues |
482.1 | 553.7 | (71.6 | ) | (12.9 | )% | |||||||
| Unregulated operations revenues |
16.3 | 15.0 | 1.3 | 8.7 | % | ||||||||
| Total operating revenues |
$ | 3,050.0 | $ | 3,208.3 | $ | (158.3 | ) | (4.9 | )% | ||||
Electric Revenues
NSTAR’s largest earnings sources are the revenues derived from distribution and transmission rates approved by the DPU and FERC. Electric retail distribution revenues primarily represent charges to customers for recovery of the Company’s capital investment, including a return component, and operation and maintenance costs related to its electric distribution infrastructure. The transmission revenue component represents charges to customers for the recovery of similar costs to move the electricity over high voltage lines from the generator to the Company’s distribution substations.
36
Table of Contents
The increase of $93.7 million, or 9.7%, in retail distribution and transmission revenues primarily reflects:
| • | Increased transmission revenues primarily due to the recovery of a higher transmission investment base ($45.2 million) and recovery of higher regional network service and other costs ($51 million) |
This increase was partially offset by:
| • | Decreased sales of 3.1% due to the impact of weather conditions, economic conditions, and customer conservation measures, partially offset by increased electric revenues resulting from the annual inflation rate adjustment ($2.5 million) |
Energy, transition, and other revenues primarily represent charges to customers for the recovery of costs incurred by the Company in order to acquire the energy supply on behalf of its customers and a transition charge for recovery of the Company’s prior investments in generating plants and the costs related to long-term power contracts. The energy revenues relate to customers being provided energy supply under Basic Service. These revenues are fully reconciled to the costs incurred and have no impact on NSTAR’s consolidated net income. Energy, transition, and other revenues also reflect revenues related to the Company’s ability to effectively reduce stranded costs (incentive entitlements), rental revenue from electric property, and annual cost reconciliation true-up adjustments. The $181.7 million decrease in energy, transition, and other revenues is primarily attributable to lower energy costs. Uncollected transition costs as a result of the reductions in transition rates are deferred and collected through future rates with a carrying charge.
Gas Revenues
Firm and transportation gas revenues primarily represent charges to customers for the Company’s recovery of costs of its capital investment in gas infrastructure, including a return component, and for the recovery of costs for the ongoing operation and maintenance of that infrastructure. The transportation revenue component represents charges to customers for the recovery of costs to move the natural gas over pipelines from gas suppliers to take stations located within the Company’s service area. The $1.9 million increase in firm and transportation revenues is primarily attributable to colder weather conditions in the first quarter partially offset by customers reduced usage as a result of economic concerns. These factors resulted in the decrease in sales volumes of 0.3%.
Energy supply and other gas revenues primarily represent charges to customers for the recovery of costs to the Company in order to acquire the natural gas in the marketplace and a charge for recovery of the Company’s gas supplier service costs. The energy supply and other revenues decrease of $73.5 million primarily reflects a decrease in the cost of gas supply. These revenues are fully reconciled with the cost currently recognized by the Company and, as a result, do not have an effect on NSTAR’s consolidated net income.
Unregulated Operations Revenues
Unregulated operating revenues are derived from NSTAR’s telecommunications operations. Unregulated operating revenues were $16.3 million through December 31, 2009 compared to $15.0 million in 2008, an increase of $1.3 million, or 8.7%. The increase in unregulated revenues is primarily the result of new contracts added over the past year.
Operating Expenses
Purchased power and transmission costs were $1,260.5 million in 2009 compared to $1,353.7 million in 2008, a decrease of $93.2 million, or 6.9%. The decrease in expense reflects NSTAR Electric’s lower sales of 3.1%, as well as lower Basic Service and other energy costs of $140.6 million. These decreases are partially offset by higher transmission costs of $47.4 million primarily due to an increase in regional network support costs. NSTAR Electric adjusts its rates to collect the costs related to energy supply from customers on a fully reconciling basis. Due to this rate adjustment mechanism, changes in the amount of energy supply expense have no impact on consolidated net income.
37
Table of Contents
Cost of gas sold, representing NSTAR Gas’ supply expense, was $297.9 million in 2009 compared to $372.4 million in 2008, a decrease of $74.5 million, or 20%. The decrease in cost reflects the slight 0.3% decrease in sales, as well as lower storage and supply costs due to the fluctuations in energy markets, partially offset by the higher settlement of cash flow hedging contracts during the current year that increased expenses by $31.3 million. NSTAR Gas adjusts its rates to collect costs related to gas supply from customers on a fully reconciling basis and therefore changes in the amount of energy supply expense have no impact on consolidated net income.
Operations and maintenance expense was $409.5 million in 2009 compared to $438.2 million in 2008, a decrease of $28.7 million, or 6.5%. The primary factors were lower liability claims cost ($6.1 million), lower labor and labor-related costs ($5.4 million), lower storm-related costs ($4.4 million), lower outside services and lower administrative and other operating costs ($11.9 million), and lower fuel costs due to declining prices ($2.1 million). In addition, there were lower pension and PBOP related PAM amortization costs ($5.8 million). Fluctuations in PAM amortization do not have an earnings impact as these costs are fully recovered through the pension adjustment mechanism. These factors are partially offset by higher bad debt expense of ($3.3 million).
Depreciation and amortization expense was $370.1 million in 2009 compared to $369.8 million in 2008, an increase of $0.3 million or less than 1%. The increase primarily reflects higher depreciable distribution and transmission plant in-service partially offset by completion of the 10-year amortization related to merger integration costs.
DSM and renewable energy programs expense was $89.0 million in 2009 compared to $73.3 million in 2008, an increase of $15.7 million, or 21.4%, which is consistent with the collection of conservation and renewable energy revenues. The increase reflects higher spending levels during 2009 required by the Green Communities Act (GCA). All costs are in accordance with program guidelines established by the DPU. DSM program costs are funded partially through proceeds from the Regional Greenhouse Gas Initiative and through NSTAR’s participation in the Forward Capacity Market. The remaining costs are collected from customers on a fully reconciling basis, plus a performance incentive.
Property and other taxes were $107.1 million in 2009 compared to $95.8 million in 2008, an increase of $11.3 million, or 11.8%, primarily reflecting higher overall property investments ($5.1 million) and higher municipal property tax rates ($6.3 million). NSTAR’s municipal property taxes are generally assessed based on net book value rather than assessed fair value.
Interest charges (income):
Long-term debt and transition property securitization certificate interest charges were $152.1 million in 2009 compared to $154.3 million in 2008, a decrease of $2.2 million, or 1.4%. The decrease in interest charges reflects:
| • | Lower interest costs of $8.6 million on transition property securitization debt attributable to scheduled principal pay downs |
This decrease was partially offset by:
| • | Higher interest costs of $4.6 million associated with NSTAR Electric’s February 2009 $100 million issuance of 5.625% debentures |
| • | Higher interest costs of $1.9 million associated with NSTAR’s November 2009 $350 million issuance of 4.5% debentures |
Interest income and other, net were $24.4 million of net interest income in 2009 compared to $18 million of net interest income in 2008, an increase of $6.4 million, or 35.6%, due to increased interest income of $4.7 million related to higher regulatory deferrals and higher interest income on income tax matters of $2.2 million.
38
Table of Contents
Short-term debt interest charges were $1.4 million in 2009 compared to $10.3 million in 2008, a decrease of $8.9 million, or 86.4%, due to the reduction of 198 basis points in the 2009 weighted average borrowing rate. The weighted average short-term interest rates including fees were 0.41% and 2.39% in 2009 and 2008, respectively. The average level of borrowed funds in 2009 was nearly the same as in 2008.
Other income (deductions):
Other income was approximately $9.2 million in 2009 compared to $13.3 million in 2008, a decrease of $4.1 million. The decrease relates primarily to the absence of a favorable environmental settlement in 2008 ($4.8 million), the absence of company-owned life insurance proceeds received in 2008 ($1.3 million) and lower interest income in 2009 ($1.7 million). These amounts are partially offset by increases in the cash surrender value of insurance policies that occurred in 2009 ($4.3 million).
Other deductions were approximately $3.7 million in 2009 compared to $5.0 million in 2008, a decrease of $1.3 million. The decrease in other deductions primarily reflects the absence of a $1.5 million decrease in the cash surrender value of life insurance policies that occurred in 2008.
Income tax expense:
Income tax expense was $146.9 million in 2009 compared to $140.7 million in 2008, an increase of $6.2 million, or 4.4%, primarily reflecting the higher pre-tax operating income in 2009.
2008 compared to 2007
Executive Summary
NSTAR achieved several positive performance results in 2008:
| • | EPS increased $0.15 from $2.07 to $2.22. This 7.2% increase reflects increased distribution revenues, higher transmission revenues, and lower interest costs |
| • | The Company’s common share dividend was increased in 2008 by 7.1% |
| • | NSTAR, NSTAR Electric, and NSTAR Gas each maintained their S&P overall credit ratings at “A” levels |
Earnings per common share were as follows:
| Years ended December 31, | ||||||||
| 2008 | 2007 | % Change | ||||||
| Basic and Diluted - Continuing operations |
$ | 2.11 | $ | 1.99 | 6.0 | |||
| Basic and Diluted - Discontinued operations |
0.11 | 0.08 | 37.5 | |||||
| Total |
$ | 2.22 | $ | 2.07 | 7.2 | |||
Net income attributable to common shareholders was $237.5 million for 2008 compared to $221.5 million for 2007. Major factors on an after tax basis that contributed to the $16.0 million, or 7.2%, increase include:
| • | Higher electric distribution revenues ($11.5 million) |
| • | Higher transmission revenues as a result of increased transmission investment base ($13.9 million) |
| • | Non-recurring cumulative impact of implementing the March 2008 FERC transmission order ($2.4 million) |
| • | Higher earnings from NSTAR’s unregulated businesses ($1.2 million) |
| • | Higher earnings from NSTAR’s discontinued operations ($3.1 million) |
39
Table of Contents
| • | Environmental insurance settlement ($2.9 million) |
| • | Lower net interest expense primarily as a result of decreased interest rates and increased interest income related to higher regulatory asset balances ($7.0 million) |
These positive earnings factors were partially offset by:
| • | Higher operations and maintenance expenses ($9.9 million) primarily relating to unplanned expenditures for litigation and claims ($3.0 million), and higher storm-related costs ($1.8 million). The remaining increase relates to higher labor costs including union contract negotiations that concluded in January 2009 |
| • | Higher depreciation and amortization and property tax expenses in 2008 related to higher depreciable electric and gas distribution plant in-service ($9.1 million) |
| • | Lower firm gas revenues due to lower sales of 1.4% ($1.8 million) |
| • | Absence of the 2007 recognition of interest income on certain tax matters ($3.0 million) |
Significant cash flow events during 2008 included the following:
| • | Cash flows from continuing operating activities provided approximately $517.7 million, an increase of $46.1 million as compared to the same period in 2007. The increase is due to an increase in operating income driven by increased electric distribution revenues, favorable changes in various working capital balances, and lower income tax payments. These items were offset by higher pension contributions ($70 million) during 2008 |
| • | NSTAR invested approximately $415 million in capital projects to improve capacity and reliability of continuing operations |
| • | NSTAR paid approximately $149.5 million in common share dividends and retired approximately $155.2 million in long-term and securitized debt |
| • | Short-term borrowings increased from $403.4 million to $582.9 million during 2008, an increase of $179.5 million |
Electric and Gas Sales
The following is a summary of retail electric and firm gas and transportation sales for the years indicated:
| Years ended December 31, | |||||||
| 2008 | 2007 | % Change Increase/(decrease) |
|||||
| Retail Electric Sales - MWH |
|||||||
| Residential |
6,560,573 | 6,598,282 | (0.6 | ) | |||
| Commercial, Industrial, and Other |
15,087,472 | 15,056,966 | 0.2 | ||||
| Total retail sales |
21,648,045 | 21,655,248 | 0.0 | ||||
| Years ended December 31, | |||||||
| 2008 | 2007 | % Change Increase/(decrease) |
|||||
| Firm Gas Sales and Transportation - BBtu |
|||||||
| Residential |
20,763 | 21,792 | (4.7 | ) | |||
| Commercial and Industrial |
22,134 | 21,788 | 1.6 | ||||
| Municipal |
2,933 | 2,885 | 1.7 | ||||
| Total firm sales |
45,830 | 46,465 | (1.4 | ) | |||
40
Table of Contents
NSTAR’s electric sales in 2008 were flat primarily due to the unfavorable weather conditions resulting from a cooler summer during 2008 as compared to 2007. In addition, electric sales were impacted by the downturn in the economy that resulted in lost sales from commercial office and retail business vacancies, and also by the impact of customer and NSTAR-sponsored conservation measures. The 1.4% decrease in firm gas and transportation sales was due to the milder winter weather that directly impacted residential sales offset by the shift of commercial and industrial customers converting to using natural gas from fuel oil. All gas customer segments were impacted by continued customer conservation efforts.
Weather, higher fuel costs, conservation measures, and economic conditions affected sales to NSTAR’s residential and small commercial customers. Economic conditions, higher fuel costs, and conservation measures affected NSTAR’s large commercial and industrial customers. Refer to the “Electric Revenues” and “Gas Revenues” sections below for more detailed discussions.
NSTAR Electric’s retail peak demand for 2008 was 4,379 MW measured on July 9, 2008. This was 11.7% less than the all-time high peak demand of 4,959 MW reached on August 2, 2006.
Weather Conditions
Weather conditions during the three months ended March 31, 2008 and June 30, 2008 measured by heating degree-days were 4.3% and 14.1% lower/warmer for 2008 as compared to 2007, unfavorably impacting gas revenues. Weather conditions during the three months ended September 30, 2008 measured by cooling degree-days were 10.4% lower/cooler for 2008 as compared to 2007, unfavorably impacting electric revenues. Refer to the “Electric Revenues” and “Gas Revenues” sections below for more detailed discussions.
Heating Degree-Days
| Three Months Ended | |||||||||||||||
| March 31 | June 30 | Sept. 30 | Dec. 31 | Total | |||||||||||
| 2008 |
3,186 | 874 | 134 | 2,414 | 6,608 | ||||||||||
| 2007 |
3,330 | 1,017 | 161 | 2,274 | 6,782 | ||||||||||
| Normal 30-Year Average |
3,339 | 972 | 177 | 2,362 | 6,850 | ||||||||||
| Percentage that 2008 was (warmer) colder than 2007 |
(4.3 | )% | (14.1 | )% | (16.8 | )% | 6.2 | % | (2.6 | )% | |||||
| Percentage that 2008 was (warmer) colder than 30-year average |
(4.6 | )% | (10.1 | )% | (24.3 | )% | 2.2 | % | (3.5 | )% | |||||
| Cooling Degree-Days
|
| ||||||||||||||
| Three Months Ended | |||||||||||||||
| March 31 | June 30 | Sept. 30 | Dec. 31 | Total | |||||||||||
| 2008 |
— | 210 | 578 | 1 | 789 | ||||||||||
| 2007 |
— | 231 | 645 | 31 | 907 | ||||||||||
| Normal 30-Year Average |
1 | 175 | 593 | 8 | 777 | ||||||||||
| Percentage that 2008 was (cooler) than 2007 |
n/m | (9.1 | )% | (10.4 | )% | n/m | (13.0 | )% | |||||||
| Percentage that 2008 was warmer (cooler) than 30-year average |
n/m | 20.0 | % | (2.5 | )% | n/m | 1.5 | % | |||||||
| n/m - not meaningful |
|||||||||||||||
41
Table of Contents
Operating Revenues
Operating revenues for 2008 increased 2.3% from 2007 as follows:
| Increase/(Decrease) | |||||||||||||
| (in millions) |
2008 | 2007 | Amount | Percent | |||||||||
| Electric revenues |
|||||||||||||
| Retail distribution and transmission |
$ | 963.3 | $ | 957.0 | $ | 6.3 | 0.7 | % | |||||
| Energy, transition, and other |
1,676.3 | 1,605.9 | 70.4 | 4.4 | % | ||||||||
| Total retail electric revenues |
2,639.6 | 2,562.9 | 76.7 | 3.0 | % | ||||||||
| Gas revenues |
|||||||||||||
| Firm and transportation |
144.9 | 152.0 | (7.1 | ) | (4.7 | )% | |||||||
| Energy supply and other |
408.8 | 408.4 | 0.4 | 0.1 | % | ||||||||
| Total gas revenues |
553.7 | 560.4 | (6.7 | ) | (1.2 | )% | |||||||
| Unregulated operations revenues |
15.0 | 12.8 | 2.2 | 17.2 | % | ||||||||
| Total operating revenues |
$ | 3,208.3 | $ | 3,136.1 | $ | 72.2 | 2.3 | % | |||||
Electric Revenues
NSTAR’s largest earnings sources are the revenues derived from distribution and transmission rates approved by the DPU and FERC. Electric retail distribution revenues primarily represent charges to customers for recovery of the Company’s capital investment, including a return component, and operation and maintenance costs related to its electric distribution infrastructure. The transmission revenue component represents charges to customers for the recovery of similar costs to move the electricity over high voltage lines from the generator to the Company’s substations.
The increase of $6.3 million, or 0.7%, in retail distribution and transmission revenues primarily reflected:
| • | Higher distribution revenues due to the impact of the annual inflation-adjustment to distribution rates. This annual inflation-adjustment was offset by an equal and corresponding reduction in transition rates ($18.9 million) |
| • | Increased transmission revenues was primarily due to increased transmission investment base ($25.8 million) |
These increases were partially offset by:
| • | Decreased transmission revenues related to lower forecasted reliability must-run (RMR) payments to energy generators ($38.4 million) that are fully recoverable from customers |
Energy, transition, and other revenues primarily represent charges to customers for the recovery of costs incurred by the Company in order to acquire the energy supply on behalf of its customers and a transition charge for recovery of the Company’s prior investments in generating plants and the costs related to long-term power contracts. The energy revenues relate to customers being provided energy supply under Basic Service. These revenues are fully reconciled to the costs incurred and have no impact on NSTAR’s consolidated net income. Energy, transition, and other revenues also reflect revenues related to the Company’s ability to effectively reduce stranded costs (incentive entitlements), rental revenue from electric property, and annual cost reconciliation true-up adjustments. The $70.4 million increase in energy, transition, and other revenues was primarily attributable to the increased recovery of energy supply costs. Uncollected transition charges as a result of the reductions in transition rates are being deferred and collected through future rates with a carrying charge.
42
Table of Contents
Gas Revenues
Firm and transportation gas revenues primarily represent charges to customers for the Company’s recovery of costs of its capital investment in gas infrastructure, including a return component, and for the recovery of costs for the ongoing operation and maintenance of that infrastructure. The transportation revenue component represents charges to customers for the recovery of costs to move the natural gas over pipelines from gas suppliers to take stations located within the Company’s service area. The $7.1 million decrease in firm and transportation revenues was primarily attributable to warmer winter weather conditions offset by customers converting to natural gas from alternate fuel sources as a result of higher energy price concerns. These factors resulted in the decrease in sales volumes of 1.4% through December 31, 2008.
Energy supply and other gas revenues primarily represent charges to customers for the recovery of costs to the Company in order to acquire the natural gas in the marketplace and a charge for recovery of the Company’s gas supplier service costs. The energy supply and other revenues increase of $0.4 million primarily reflects an increase in the cost of gas supply offset by the lower sales demand. These revenues are fully reconciled with the costs currently recognized by the Company and, as a result, do not have an effect on the Company’s earnings.
Unregulated Operations Revenues
Unregulated operating revenues are derived from NSTAR’s telecommunications operations. Unregulated revenues were $15.0 million in 2008 compared to $12.8 million in 2007, an increase of $2.2 million, or 17.2%. The increase in unregulated revenues was primarily the result of 2008 license fee revenue exceeding 2007 due to the value of new contracts added over 2008 exceeding those that elapsed in 2008.
Operating Expenses
Purchased power and transmission costs were $1,353.7 million in 2008 compared to $1,318.3 million in 2007, an increase of $35.4 million, or 2.7%. This increase in expense primarily reflects $34.8 million of higher transmission costs. NSTAR Electric adjusts its rates to collect the costs related to energy supply from customers on a fully reconciling basis. Due to this rate adjustment mechanism, changes in the amount of NSTAR Electric’s energy supply expense have no impact on earnings.
Cost of gas sold, representing NSTAR Gas’ supply expense, was $372.4 million in 2008 compared to $375.8 million in 2007, a decrease of $3.4 million, or 0.9%. The decrease in this cost primarily reflects the 1.4% decrease in firm gas sales and the lower settlement of hedging contracts during the current year that decreased expenses by $14.8 million, partly offset by higher costs of gas supply. NSTAR Gas maintains a flexible resource portfolio consisting of gas supply contracts, transportation contracts on interstate pipelines, market area storage, and peaking services. NSTAR Gas adjusts its rates to collect costs related to gas supply from customers on a fully reconciling basis and therefore changes in the amount of energy supply expenses have no impact on earnings.
Operations and maintenance expense was $438.2 million in 2008 compared to $427 million in 2007, an increase of $11.2 million, or 2.6%. This increase primarily relates to higher labor and labor related costs, higher than planned insurance and claims costs, higher advertising costs, and higher storm-related costs.
Depreciation and amortization expense was $369.8 million in 2008 compared to $360.2 million in 2007, an increase of $9.6 million or 2.7%. The increase primarily reflects higher depreciable distribution and transmission plant in-service. The increase in transmission plant is primarily related to the in-service of NSTAR’s 345 kV project in December 2008.
DSM and renewable energy programs expense was $73.3 million in 2008 compared to $70.9 million in 2007, an increase of $2.4 million, or 3.4%, which is consistent with the collection of conservation and renewable energy revenues. These costs are in accordance with program guidelines established by the DPU and are collected from customers on a fully reconciling basis plus an incentive return.
43
Table of Contents
Property and other taxes were $95.8 million in 2008 compared to $89.1 million in 2007, an increase of $6.7 million, or 7.5%, reflecting higher overall property investments and higher tax rates.
Interest charges (income):
Long-term debt and transition property securitization certificate interest charges were $154.3 million in 2008 compared to $147.5 million in 2007, an increase of $6.8 million, or 4.6%. The increase in interest charges reflects:
| • | $15.2 million in additional interest costs associated with NSTAR Electric’s $300 million Debentures issued in November 2007 |
This increase was partially offset by:
| • | Lower interest costs on transition property securitization debt of $8 million resulting from redemptions of these securities. Securitization interest represents interest on securitization certificates of BEC Funding, BEC Funding II, and CEC Funding, and is collateralized by the future income stream associated primarily with NSTAR Electric’s stranded costs |
Interest income and other, net were $18 million of net interest income in 2008 compared to $9.4 million of net interest income in 2007, an increase of $8.6 million, or 91.4%, due to increased interest income of $14.8 million related to higher regulated asset balances of uncollected transition charges that are deferred and will be collected through future rates. These amounts were offset by lower interest income on income tax matters of $4.5 million.
Short-term debt interest charges were $10.3 million in 2008 compared to $25.5 million in 2007, a decrease of $15.2 million, or 59.6%, due to the reduction of 294 basis points in the 2008 weighted average borrowing rate. The weighted average short-term interest rate including fees was 2.39% and 5.33% in 2008 and 2007, respectively. Also contributing to the lower costs in 2008 was an 8.6% reduction in the average level of borrowed funds as compared to 2007.
AFUDC decreased $2.1 million in 2008 due to lower short-term borrowing rates.
Other income (deductions):
Other income was approximately $13.3 million in 2008 compared to $14.2 million in 2007, a decrease of $0.9 million. The decrease reflects lower earnings from the Company’s equity investments and lower interest and dividend income. These factors were partially offset by proceeds of $4.8 million in 2008 resulting from an environmental site insurance settlement.
Other deductions was approximately $5 million in both 2008 and 2007.
Income tax expense:
Income tax expense was $140.7 million in 2008 compared to $129.2 million in 2007, an increase of $11.5 million, or 8.9%, primarily reflecting the higher pre-tax operating income in 2008.
Liquidity, Commitments and Capital Resources
Financial Market Impact
Ongoing volatility and uncertainty in the financial markets may adversely impact the availability of credit and the cost of credit to NSTAR and its subsidiary companies. However, during 2009, NSTAR was able to successfully access capital markets to issue long-term debt and also to facilitate short-term financing for working capital
44
Table of Contents
needs. NSTAR and its subsidiaries utilize the commercial paper market to meet their short-term cash requirements. NSTAR and NSTAR Electric currently have Revolving Credit Agreements in place through December 2012. These Credit Agreements serve as a liquidity backup to the commercial paper program. Short-term commercial paper debt obligations are commonly refinanced to long-term obligations with fixed-rate bonds or notes as needed or when interest rates are considered favorable. Refer to the accompanying Item 1A, Risk Factors, for a further discussion.
As a result of volatility in the financial markets and its impact on NSTAR’s Pension and PBOP Plan investments, NSTAR continues to evaluate the extent to which it may make additional cash contributions. Should NSTAR elect to increase its level of funding to these plans, NSTAR believes it has adequate access to capital resources to support its contributions.
Working Capital
NSTAR anticipates refinancing its current maturities of long-term debt obligations. NSTAR (Holding company) has a $500 million note due in February 2010. NSTAR Electric has a $125 million note due in May 2010. NSTAR and NSTAR Electric filed a joint Registration Statement on Form S-3 on October 9, 2009 in preparation for possible public debt offerings. On November 17, 2009, NSTAR issued $350 million in 4.50% Debentures due 2019 that was used to partially reduce short-term borrowings with the remainder invested on a short-term basis. The short-term borrowing capacity and short-term investments that resulted from the November 17, 2009 $350 million debenture issuance are expected to be utilized to help pay the $500 million note due in February 2010. On January 14, 2010, NSTAR Gas entered into a $125 million Bond Purchase Agreement with private investors on a 10-year First Mortgage Bond series at a coupon rate of 4.46%. Funding took place on January 28, 2010. NSTAR believes that it has adequate access to short-term credit markets to facilitate its working capital needs at favorable terms.
Capital Expenditures and Contractual Obligations
The most recent estimates of capital expenditures for 2010 and the years 2011-2014 are as follows:
| (in millions) |
2010 | 2011-2014 | ||||
| Plant expenditures: |
||||||
| Electric |
$ | 317 | $ | 1,130 | ||
| Gas |
53 | 170 | ||||
| $ | 370 | $ | 1,300 | |||
The amounts shown above exclude expenditures for NSTAR’s proposed transmission investment with Northeast Utilities and Hydro-Quebec as these costs will be incurred by an entity that will be created to hold these assets.
Management continuously reviews its capital expenditure and financing programs. These programs and the estimates included in this Form 10-K are subject to revision due to changes in regulatory requirements, operating requirements, environmental standards, availability and cost of capital, interest rates and other assumptions.
45
Table of Contents
In addition to plant expenditures, NSTAR enters into a variety of contractual obligations and other commitments in the course of ordinary business activities. The following table summarizes NSTAR’s significant contractual cash obligations as of December 31, 2009:
| (in millions) |
2010 | 2011 | 2012 | 2013 | 2014 | Years Thereafter |
Total | ||||||||||||||
| Long-term debt maturities |
$ | 626 | $ | 2 | $ | 402 | $ | 2 | $ | 317 | $ | 1,038 | $ | 2,387 | |||||||
| Interest obligations on long-term debt |
117 | 92 | 92 | 73 | 65 | 461 | 900 | ||||||||||||||
| Securitization obligations |
58 | 84 | 84 | 44 | — | — | 270 | ||||||||||||||
| Interest obligations on transition property securitization |
13 | 8 | 5 | 1 | — | — | 27 | ||||||||||||||
| Leases of property |
7 | 7 | 7 | 7 | 5 | 6 | 39 | ||||||||||||||
| Leases of capital equipment |
7 | 7 | 6 | 5 | 4 | 7 | 36 | ||||||||||||||
| Purchase obligations |
14 | 3 | 1 | — | — | — | 18 | ||||||||||||||
| Pension and PBOP obligations |
60 | 75 | 90 | 80 | 80 | — | 385 | ||||||||||||||
| Electric capacity obligations |
2 | 2 | 2 | 2 | 3 | 12 | 23 | ||||||||||||||
| Gas transportation & storage agreements |
66 | 70 | 55 | 35 | 31 | 139 | 396 | ||||||||||||||
| Decommissioning of nuclear generating units |
8 | 9 | 9 | 8 | 8 | 7 | 49 | ||||||||||||||
| Electric interconnection agreement |
3 | 3 | 3 | 3 | 3 | 45 | 60 | ||||||||||||||
| Purchase power buy-out obligations |
140 | 75 | 32 | 27 | 31 | 41 | 346 | ||||||||||||||
| Total obligations (a) |
$ | 1,121 | $ | 437 | $ | 788 | $ | 287 | $ | 547 | $ | 1,756 | $ | 4,936 | |||||||
| (a) | Management has not included its uncertain tax position liability as the timing of a payment, if any, cannot be reasonably estimated. As of December 31, 2009, $15 million has been recorded as an uncertain tax position liability. Refer to Note G, “Income Taxes,” in the accompanying Notes to the Consolidated Financial Statements. |
Transition property securitization payments reflect securities issued in 1999 by BEC Funding LLC, and in 2005, additional transition property securitization bonds issued through BEC Funding II, LLC and CEC Funding, LLC. These funding entities recover the principal and interest obligations for their transition property securitization bonds from customers of NSTAR Electric, through a component of NSTAR Electric’s transition charges and, as a result, these payment obligations do not affect NSTAR’s overall cash flow.
Purchase obligations relate to transmission and distribution equipment, computer software and equipment, and various supplies.
Management cannot estimate projected Pension and PBOP contributions beyond 2014. Refer to Note H, “Pension and Other Postretirement Benefits,” in the accompanying Notes to the Consolidated Financial Statements.
Electric capacity and gas transportation and storage obligations reflect obligations for purchased power and the cost of gas, respectively, and are fully recoverable. As a result, these payment obligations do not affect NSTAR’s results of operations.
Obligations related to the decommissioning of nuclear generating units are based on estimates from the Yankee Companies’ management and reflect the total remaining approximate cost for decommissioning and/or security or protection of the three units in which NSTAR Electric has equity investments. Decommissioning costs are fully recoverable from customers.
The electric interconnection agreement relates to a single interconnection with a municipal utility for additional capacity into NSTAR Electric’s service territory.
46
Table of Contents
The purchase power buy-out obligation relates to NSTAR Electric’s execution of several agreements to buy-out or restructure certain long-term purchase power contracts. NSTAR Electric fully recovers these payments through its transition charge. These amounts represent payments by NSTAR Electric for these agreements.
Current Cash Flow Activity
NSTAR’s primary uses of cash in 2009 included capital expenditures, dividend payments, long-term and securitized debt redemptions and contributions to the Pension and PBOP plans. NSTAR’s primary sources of cash in 2009 included cash from electric and gas operations and issuance of $450 million in long-term debt.
Operating Activities
The net cash provided by continuing operating activities was $611.2 million in 2009, as compared to $517.7 million in 2008, an increase of approximately $93.5 million primarily due to an increase in earnings driven by decreased operations and maintenance costs and lower income tax payments related to higher bonus depreciation partially offset by higher contributions to the pension and postretirement plans.
Investing Activities
The net cash used in investing activities of continuing operations in 2009 was $375.7 million, compared to $404.7 million in 2008. The majority of these expenditures were for system reliability improvements and capacity improvements in the NSTAR service territory. The decrease in plant expenditures was primarily due to the completion of NSTAR’s 345kV Transmission Project in 2008.
Financing Activities
Net cash used in financing activities of continuing operations in 2009 was $118.1 million compared to $135.1 million in 2008. Uses of cash primarily reflect long-term and securitized debt redemptions of $155.7 million in 2009 compared to $155.2 million in 2008 and dividend payments of $162.2 million in 2009 compared to $151.5 million in 2008. In addition, NSTAR’s short-term debt decreased by $241.9 million to $341 million at December 31, 2009 compared to $582.9 million at December 31, 2008. Sources of cash during 2009 included proceeds from NSTAR Electric’s issuance of $100 million in long-term debt and NSTAR’s issuance of $350 million in long-term debt.
Income Tax Payments
During 2009 and 2008, NSTAR made income tax payments of $91.3 million and $124.5 million, respectively. Lower required income tax payments are primarily attributable to benefits from bonus depreciation on assets placed in-service during the year and also tax benefits from pension contributions during 2009.
Refundable Income Tax
The refundable income tax of $129.1 million related to the SSCM will be fully refunded to NSTAR including interest. Subject to timely completion of IRS appeals discussions this amount is expected by June 2010. Refer to Note G, “Income Taxes,” in the accompanying Notes to the Consolidated Financial Statements for additional details
Long-Term Financing Activities
On February 13, 2009, NSTAR Electric sold, at a premium, $100 million of fixed rate (5.625%) Debentures due November 15, 2017 (effective rate of 4.976%). The Debentures form a single series and are fungible with NSTAR Electric’s 5.625% $300 million Debentures due November 15, 2017 issued on November 19, 2007.
47
Table of Contents
On November 17, 2009, NSTAR sold, at a discount, $350 million of fixed rate (4.50%) Debentures due November 15, 2019.
On January 14, 2010, NSTAR Gas entered into a $125 million Bond Purchase Agreement with a group of private investors for a 10 year, 4.46% series of First Mortgage Bonds. Funding took place on January 28, 2010.
Short-Term Financing Activities
NSTAR’s short-term debt decreased by $241.9 million to $341 million at December 31, 2009 compared to $582.9 million at December 31, 2008. The decrease resulted primarily from pay down of commercial paper with proceeds from long-term debt issuances.
The banking arrangements in place require NSTAR and its subsidiaries to make daily cash transfers to fund vendor checks that are presented for payment. These banking arrangements do not permit the right of offset among the Company’s subsidiaries’ cash accounts. In the event of a credit book balance in any one of the Company’s cash accounts resulting from uncleared checks, the Company will adjust its disbursement cash account accordingly. Changes in the balances of the disbursement cash accounts are reflected in financing activities in the accompanying Consolidated Statements of Cash Flows.
Sources of Additional Capital and Financial Covenant Requirements
With the exception of bond indemnity agreements, NSTAR has no financial guarantees, commitments, debt or lease agreements that would require a change in terms and conditions, such as acceleration of payment obligations, as a result of a change in its credit rating. However, in addition to the bond indemnity agreements, NSTAR’s subsidiaries could be required to provide additional security for energy supply contract performance obligations, such as a letter of credit for their pro-rata share of the remaining value of such contracts.
NSTAR and NSTAR Electric have no financial covenant requirements under their respective long-term debt arrangements. Pursuant to a revolving credit agreement, NSTAR Electric must maintain a total debt to capitalization ratio no greater than 65% at all times, excluding Transition Property Securitization Certificates and excluding accumulated other comprehensive loss from common equity. NSTAR Gas was in compliance with its financial covenant requirements including a minimum equity requirement, under its long-term debt arrangements at December 31, 2009 and 2008. NSTAR’s long-term debt other than its secured debt, issued by NSTAR Gas and MATEP, is unsecured.
NSTAR (Holding Company) currently has a $175 million revolving credit agreement that expires December 31, 2012. At December 31, 2009 and 2008, there were no amounts outstanding under the revolving credit agreement. This credit facility serves as a backup to NSTAR’s $175 million commercial paper program that, at December 31, 2009 and 2008, had zero and $175 million outstanding, respectively. Under the terms of the credit agreement, NSTAR is required to maintain a maximum total consolidated debt to total capitalization ratio of not greater than 65% at all times, excluding Transition Property Securitization Certificates, and excluding accumulated other comprehensive loss from common equity. Commitment fees must be paid on the total agreement amount. At December 31, 2009 and 2008, NSTAR was in full compliance with the aforementioned covenant as the ratios were 59.8% and 60.2%, respectively.
On April 6, 2009, the DPU approved NSTAR Electric’s new two-year financing plan to issue an additional $500 million in long-term debt securities. On October 9, 2009, in connection with this filing, NSTAR and NSTAR Electric filed an unlimited joint registration statement on Form S-3 with the SEC to issue debt securities from time to time in one or more series. NSTAR and NSTAR Electric may use the proceeds from the prospective issuance of these securities for the redemption or repayment of outstanding long-term debt and short-term debt balances and/or general working capital purposes.
48
Table of Contents
NSTAR Electric has approval from the FERC to issue short-term debt securities from time to time on or before October 22, 2010, with maturity dates no later than October 21, 2011, in amounts such that the aggregate principal does not exceed $655 million at any one time. NSTAR Electric has a five-year, $450 million revolving credit agreement that expires December 31, 2012. However, unless NSTAR Electric receives necessary approvals from the DPU, the credit agreement will expire 364 days from the date of the first draw under the agreement. At December 31, 2009 and 2008, there were no amounts outstanding under the revolving credit agreement. This credit facility serves as backup to NSTAR Electric’s $450 million commercial paper program that had $341 million and $354.6 million outstanding balances at December 31, 2009 and 2008, respectively. Under the terms of the revolving credit agreement, NSTAR Electric is required to maintain a consolidated maximum total debt to capitalization ratio of not greater than 65% at all times, excluding Transition Property Securitization Certificates, and excluding accumulated other comprehensive loss from common equity. At December 31, 2009 and 2008, NSTAR Electric was in full compliance with its covenants in connection with its short-term credit facilities, as the ratios were 46.5% and 47.6%, respectively.
NSTAR Gas has a $100 million line of credit. This line of credit is due to expire on December 10, 2010. As of December 31, 2009 and 2008, NSTAR Gas had zero and $53.3 million outstanding, respectively.
On November 9, 2009, NSTAR Gas received approval from the DPU to issue up to $125 million of long-term debt. On January 14, 2010, NSTAR Gas entered into a $125 million Bond Purchase Agreement with private investors on a 10-year First Mortgage Bond series at a coupon rate of 4.46%. Funding took place on January 28, 2010.
Historically, NSTAR and its subsidiaries have had a variety of external sources of financing available, as previously indicated, at favorable rates and terms to finance its external cash requirements. However, the availability of such financing at favorable rates and terms depends heavily upon prevailing market conditions and NSTAR’s or its subsidiaries’ financial condition and credit ratings.
NSTAR’s goal is to maintain a capital structure that preserves an appropriate balance between debt and equity. As of December 31, 2009, NSTAR’s subsidiaries could declare and pay dividends of up to approximately $1.3 billion of their total common equity (approximately $2.4 billion) to NSTAR and remain in compliance with debt covenants. Based on NSTAR’s key cash resources available as previously discussed, management believes its liquidity and capital resources are sufficient to meet its current and projected requirements.
Commitments and Contingencies
NSTAR is exposed to uncertain tax positions and regulatory matters as discussed in this MD&A under the caption “Critical Accounting Policies and Estimates,” and as disclosed in Note O, “Commitments and Contingencies,” in the accompanying Notes to the Consolidated Financial Statements.
Performance Assurances from Electricity and Gas Supply Agreements
Electric Agreements
NSTAR Electric continuously enters into power purchase agreements to meet its entire Basic Service supply obligations. NSTAR Electric’s power suppliers are either investment grade companies or are subsidiaries of larger companies with investment grade or better credit ratings that guaranty the supplier’s obligations. In accordance with NSTAR’s Internal Credit Policy, and to minimize NSTAR Electric risk in the event the supplier encounters financial difficulties or otherwise fails to perform, NSTAR Electric evaluates the supplier’s credit and NSTAR Electric’s potential exposure (on a supplier default), and when necessary obtains letters of credit or other acceptable financial security instruments. In addition, under these agreements, if a supplier (or its parent guarantor) fails to maintain an investment grade credit rating, it is required to provide additional financial security for performance of its obligations. These agreements also include a reciprocal provision, where in the
49
Table of Contents
event that NSTAR Electric is downgraded below investment grade, it would be required to provide additional security for performance, such as a letter of credit. In view of current volatility in the energy supply industry, NSTAR Electric is unable to determine whether its suppliers (or their parent guarantors) will become subject to financial difficulties, or whether these financial assurances and guarantees are sufficient. In the event the supplier (or its guarantor) does not provide the required additional financial security as required under the agreement, NSTAR Electric may then terminate the agreement and collect a liquidation payment from the defaulting supplier. In such event, NSTAR Electric may be required to secure alternative sources of supply at higher or lower prices (depending on prevailing market conditions) than provided under the terminated agreements.
Gas Agreements
NSTAR Gas continually evaluates the financial stability of current and prospective gas suppliers. Both parties are required to have and maintain investment grade credit ratings or financial assurances and guarantees that include both parental guarantees and letters of credit in place from the parent company of the supplier. The firm gas supply agreements allow either party to require financial assurance, or, if necessary, contract termination in the event that either party is downgraded below investment grade level and is unable to provide financial assurance acceptable to the other party. In addition, these agreements contain cross-default provisions that would allow NSTAR Gas and its counterparties to terminate and liquidate a gas hedge contract if either party is in default on other swap agreements with that same counterparty, or another unrelated agreement with that same counterparty in excess of stipulated threshold amounts.
Virtually all of NSTAR Gas’ firm gas supply agreements are short-term (one year or less) and utilize market-based, monthly indexed pricing mechanisms so the financial risk to the Company would be minimal if a supplier were to fail to perform. However, in the event that a firm supplier does fail to perform under its firm gas supply agreement, the Company would be entitled to any positive difference between the monthly supply price and the cost of replacement supplies. The cost of gas procured for firm gas sales customers is recovered through a cost of gas adjustment mechanism which is updated semi-annually. Under DPU regulations, interim adjustments to the cost of gas are required when the actual costs of gas supply vary from projections by more than 5%.
Financial and Performance Guarantees
On a limited basis, NSTAR and certain of its subsidiaries may enter into agreements providing financial assurance to third parties. Such agreements include letters of credit, surety bonds, and other guarantees.
At December 31, 2009, outstanding guarantees totaled $28.5 million as follows:
| (in thousands) |
|||
| Letter of Credit |
$ | 5,560 | |
| Surety Bonds |
17,727 | ||
| Other Guarantees |
5,203 | ||
| Total Guarantees |
$ | 28,490 | |
Letter of Credit
NSTAR has issued a $5.6 million letter of credit for the benefit of a third party, as trustee in connection with Advanced Energy System’s (AES) 6.924% Notes. The letter of credit is available if the subsidiary has insufficient funds to pay the debt service requirements. As of December 31, 2009, there have been no amounts drawn under its letter of credit. The letter of credit is to be cancelled and the related AES 6.924% Notes paid off at the time of the MATEP sale closing, which is anticipated towards the end of the first quarter or early second quarter of 2010.
50
Table of Contents
Surety Bonds
As of December 31, 2009, certain of NSTAR’s subsidiaries have purchased a total of $1.5 million of performance surety bonds for the purpose of obtaining licenses, permits and rights-of-way in various municipalities. In addition, NSTAR and certain of its subsidiaries have purchased approximately $16.2 million in workers’ compensation self-insurer bonds. These bonds support the guarantee by NSTAR and certain of its subsidiaries to the Commonwealth of Massachusetts, required as part of the Company’s workers’ compensation self-insurance program. NSTAR and certain of its subsidiaries have indemnity agreements to provide additional financial security to its bond company in the form of a contingent letter of credit to be triggered in the event of a downgrade in the future of NSTAR’s Senior Note rating to below BBB+ by S&P and/or to below Baa1 by Moody’s. These Indemnity Agreements cover both the performance surety bonds and workers’ compensation bonds.
Other
NSTAR and its subsidiaries have also issued $5.2 million of residual value guarantees related to its equity interest in the Hydro-Quebec transmission companies, NEH and NHH.
Management believes the likelihood that NSTAR would be required to perform or otherwise incur any significant losses associated with any of these guarantees is remote.
Contingencies
Environmental Matters
NSTAR subsidiaries face possible liabilities as a result of involvement in several multi-party disposal sites, state-regulated sites or third party claims associated with contamination remediation. NSTAR generally expects to have only a small percentage of the total potential liability for the majority of these sites. As of December 31, 2009 and 2008, NSTAR had liabilities of approximately $0.8 million for these environmental sites. This estimated recorded liability is based on an evaluation of all currently available facts with respect to these sites.
NSTAR Gas is participating in the assessment or remediation of certain former MGP sites and alleged MGP waste disposal sites to determine if and to what extent such sites have been contaminated and whether NSTAR Gas may be responsible to undertake remedial action. The DPU permits recovery of costs associated with MGP sites over a 7-year period, without carrying costs. As of December 31, 2009 and 2008, NSTAR had a liability of approximately $14 million and $13.3 million, respectively, as an estimate for site cleanup costs for several MGP sites for which NSTAR Gas was identified as a potentially responsible party. A corresponding regulatory asset was recorded that reflects the future rate recovery for these costs.
Estimates related to environmental remediation costs are reviewed and adjusted as further investigation and assignment of responsibility occurs and as either additional sites are identified or NSTAR’s responsibilities for such sites evolve or are resolved. NSTAR’s ultimate liability for future environmental remediation costs may vary from these estimates. Based on NSTAR’s current assessment of its environmental responsibilities, existing legal requirements, and regulatory policies, NSTAR does not believe that these environmental remediation costs will have a material adverse effect on NSTAR’s consolidated results of operations, financial position, or cash flows.
Fair Value of Financial Instruments
Carrying amounts and fair values of long-term indebtedness (excluding notes payable, including current maturities) as of December 31, 2009 and 2008 were as follows:
| 2009 | 2008 | |||||||||||
| (in thousands) |
Carrying Amount |
Fair Value | Carrying Amount |
Fair Value | ||||||||
| Long-term indebtedness of continuing operations (including current maturities) |
$ | 2,649,681 | $ | 2,755,110 | $ | 2,353,185 | $ | 2,392,600 | ||||
| Indebtedness of discontinued operations |
$ | 84,163 | $ | 85,290 | $ | 88,515 | $ | 82,360 | ||||
51
Table of Contents
As discussed in the following section, NSTAR’s exposure to financial market risk results primarily from fluctuations in interest rates.
| Item 7A. | Quantitative and Qualitative Disclosures About Market Risk |
Risk Management
NSTAR’s Energy Procurement Policy governs all energy-related transactions for its regulated electric and gas subsidiaries. This Policy is reviewed annually and is administered by NSTAR’s Risk Committee. The Committee is chaired by NSTAR’s chief executive officer and includes other senior officers. Items covered by this Policy and approved by the Committee are all new energy supply transactions, authorization limits, energy related derivative and hedging transactions, and counter-party credit profiles.
Commodity and Credit Risk
Although NSTAR has material energy commodity purchase contracts, any potential market risk, including counter-party credit risk, should not have an adverse impact on NSTAR’s results of operations, cash flows, or financial position. NSTAR’s electric and gas distribution subsidiaries have rate-making mechanisms that allow for the recovery of energy supply costs from those customers who make commodity purchases from NSTAR’s electric and gas subsidiaries rather than from the competitive market supplier. All energy supply costs incurred by NSTAR Electric and NSTAR Gas in providing energy to their retail customers are recovered on a fully reconciling basis.
In addition, NSTAR has minimal cash flow risk due to the short-term nature of these contracts and the rate-making mechanisms that permit recovery of these costs in a timely manner. The majority of NSTAR’s electric and gas commodity purchase contracts range in term from three to twelve months. NSTAR Electric has the ability to seek cost recovery and adjust its rates as frequently as every three months for its large commercial and industrial customers and every six months for its residential customers. NSTAR Gas has the ability to seek cost recovery as required if costs exceed 5% of the current projected cost recovery level. Both NSTAR Electric and NSTAR Gas earn a carrying charge on under-collected commodity balances that would mitigate any incremental short-term borrowings costs. NSTAR believes it is unlikely that it would be exposed to a liquidity risk resulting from significant market price increases based on the recovery mechanisms currently in place.
To mitigate the cash flow and cost variability related to the commodity price risk on approximately one-third of its natural gas purchases, NSTAR Gas purchases financial futures contracts on behalf of its customers. NSTAR Gas has a rate-making mechanism that provides for recovery of the actual settlement value of these contracts on a fully reconciling basis. Refer to the accompanying Notes to Consolidated Financial Statements, Note F, “Derivative Instruments - Hedging Agreements,” for a further discussion.
Interest Rate Risk
NSTAR believes its interest risk primarily relates to short-term debt obligations and anticipated future long-term debt financing requirements to fund its capital programs. These short-term debt obligations are typically refinanced with fixed-rate long-term notes as needed and when market interest rates are favorable. The Company is exposed to changes in interest rates primarily based on levels of short-term commercial paper outstanding. The weighted average interest rates, including fees for short-term indebtedness, were 0.4% and 2.4% for 2009 and 2008, respectively. On a long-term basis, NSTAR mitigates its interest rate risk through the issuance of mostly fixed rate debt of various maturities.
52
Table of Contents
| Item 8. | Financial Statements and Supplementary Data |
NSTAR
Consolidated Statements of Income
| Years ended December 31, | ||||||||||||
| 2009 | 2008 | 2007 | ||||||||||
| (in thousands, except per share amounts) | ||||||||||||
| Operating revenues: |
||||||||||||
| Electric |
$ | 2,551,581 | $ | 2,639,637 | $ | 2,562,850 | ||||||
| Gas |
482,136 | 553,680 | 560,478 | |||||||||
| Unregulated |
16,327 | 15,004 | 12,757 | |||||||||
| Total operating revenues |
3,050,044 | 3,208,321 | 3,136,085 | |||||||||
| Operating expenses: |
||||||||||||
| Purchased power and transmission |
1,260,510 | 1,353,747 | 1,318,327 | |||||||||
| Cost of gas sold |
297,864 | 372,389 | 375,839 | |||||||||
| Operations and maintenance |
409,459 | 438,175 | 427,018 | |||||||||
| Depreciation and amortization |
370,082 | 369,800 | 360,169 | |||||||||
| Demand side management and renewable energy programs |
88,954 | 73,269 | 70,877 | |||||||||
| Property and other taxes |
107,073 | 95,812 | 89,103 | |||||||||
| Total operating expenses |
2,533,942 | 2,703,192 | 2,641,333 | |||||||||
| Operating income |
516,102 | 505,129 | 494,752 | |||||||||
| Interest charges (income): |
||||||||||||
| Long-term debt |
132,599 | 126,187 | 111,236 | |||||||||
| Transition property securitization |
19,540 | 28,120 | 36,287 | |||||||||
| Interest income and other, net |
(24,368 | ) | (18,035 | ) | (9,396 | ) | ||||||
| Short-term debt |
1,373 | 10,259 | 25,525 | |||||||||
| AFUDC |
(508 | ) | (1,841 | ) | (3,881 | ) | ||||||
| Total interest charges |
128,636 | 144,690 | 159,771 | |||||||||
| Other income (deductions): |
||||||||||||
| Other income |
9,164 | 13,264 | 14,181 | |||||||||
| Other deductions |
(3,739 | ) | (5,002 | ) | (4,987 | ) | ||||||
| Total other income |
5,425 | 8,262 | 9,194 | |||||||||
| Income from continuing operations before income taxes |
392,891 | 368,701 | 344,175 | |||||||||
| Income taxes |
146,916 | 140,745 | 129,159 | |||||||||
| Net income from continuing operations |
245,975 | 227,956 | 215,016 | |||||||||
| Income from discontinued operations, net of tax |
10,150 | 11,551 | 8,459 | |||||||||
| Transaction costs on discontinued operations, net of tax |
917 | — | — | |||||||||
| Net income |
255,208 | 239,507 | 223,475 | |||||||||
| Preferred stock dividends of subsidiary to the noncontrolling interest |
1,960 | 1,960 | 1,960 | |||||||||
| Net income attributable to common shareholders |
$ | 253,248 | $ | 237,547 | $ | 221,515 | ||||||
| Weighted average common shares outstanding: |
||||||||||||
| Basic |
106,808 | 106,808 | 106,808 | |||||||||
| Diluted |
106,996 | 107,045 | 107,122 | |||||||||
| Earnings per common share - Basic and Diluted: |
||||||||||||
| Continuing operations |
$ | 2.28 | $ | 2.11 | $ | 1.99 | ||||||
| Discontinued operations |
0.09 | 0.11 | 0.08 | |||||||||
| Total earnings |
$ | 2.37 | $ | 2.22 | $ | 2.07 | ||||||
| Dividends declared per common share |
$ | 1.525 | $ | 1.425 | $ | 1.325 | ||||||
The accompanying notes are an integral part of the consolidated financial statements.
53
Table of Contents
NSTAR
Consolidated Statements of Comprehensive Income
| Years ended December 31, | ||||||||||||
| 2009 | 2008 | 2007 | ||||||||||
| (in thousands) | ||||||||||||
| Net income attributable to common shareholders |
$ | 253,248 | $ | 237,547 | $ | 221,515 | ||||||
| Other comprehensive loss from continuing operations, net: |
||||||||||||
| Pension and postretirement costs |
(1,032 | ) | (1,534 | ) | (504 | ) | ||||||
| Deferred income taxes benefit |
383 | 634 | 151 | |||||||||
| Total other comprehensive loss from continuing |
(649 | ) | (900 | ) | (353 | ) | ||||||
| Comprehensive income from continuing operations |
252,599 | 236,647 | 221,162 | |||||||||
| Other comprehensive loss from discontinued operations, net: |
||||||||||||
| Postretirement costs |
(251 | ) | (51 | ) | (363 | ) | ||||||
| Deferred income taxes benefit |
97 | 19 | 141 | |||||||||
| Total other comprehensive loss from discontinued |
(154 | ) | (32 | ) | (222 | ) | ||||||
| Comprehensive income |
$ | 252,445 | $ | 236,615 | $ | 220,940 | ||||||
The accompanying notes are an integral part of the consolidated financial statements.
NSTAR
Consolidated Statements of Retained Earnings
| Years ended December 31, | |||||||||
| 2009 | 2008 | 2007 | |||||||
| (in thousands) | |||||||||
| Balance at the beginning of the year, as previously reported |
$ | 876,271 | $ | 790,926 | $ | 664,323 | |||
| Adoption of accounting standard - Uncertain Tax Positions |
— | — | 46,610 | ||||||
| Adjusted balance at the beginning of the year |
876,271 | 790,926 | 710,933 | ||||||
| Add: |
|||||||||
| Net income attributable to common shareholders |
253,248 | 237,547 | 221,515 | ||||||
| Subtotal |
1,129,519 | 1,028,473 | 932,448 | ||||||
| Deduct: |
|||||||||
| Dividends declared: |
|||||||||
| Common shares |
162,883 | 152,202 | 141,522 | ||||||
| Balance at the end of the year |
$ | 966,636 | $ | 876,271 | $ | 790,926 | |||
The accompanying notes are an integral part of the consolidated financial statements.
54
Table of Contents
NSTAR
| December 31, | ||||||
| 2009 | 2008 | |||||
| (in thousands) | ||||||
| Assets | ||||||
| Current assets: |
||||||
| Cash and cash equivalents |
$ | 143,449 | $ | 12,384 | ||
| Accounts receivable, net of allowance of $32,545 and $32,859, respectively |
248,094 | 311,688 | ||||
| Accrued unbilled revenues |
67,159 | 61,892 | ||||
| Regulatory assets |
337,172 | 439,914 | ||||
| Inventory, at average cost |
59,307 | 87,983 | ||||
| Refundable income taxes |
129,120 | 129,120 | ||||
| Other |
39,069 | 32,501 | ||||
| Assets of discontinued operations held for sale |
167,857 | 175,493 | ||||
| Total current assets |
1,191,227 | 1,250,975 | ||||
| Utility plant: |
||||||
| Electric and gas plant in-service, at original cost |
6,031,853 | 5,694,537 | ||||
| Less: accumulated depreciation |
1,525,248 | 1,418,428 | ||||
| Net electric and gas plant in-service |
4,506,605 | 4,276,109 | ||||
| Construction work in progress |
68,582 | 122,385 | ||||
| Net utility plant |
4,575,187 | 4,398,494 | ||||
| Other property and investments: |
||||||
| Unregulated property in-service, at original cost, net |
18,571 | 20,877 | ||||
| Electric equity investments |
4,683 | 6,701 | ||||
| Other investments |
75,931 | 72,475 | ||||
| Total other property and investments |
99,185 | 100,053 | ||||
| Deferred debits: |
||||||
| Regulatory assets |
2,228,243 | 2,466,018 | ||||
| Other deferred debits |
50,944 | 53,949 | ||||
| Total deferred debits and other assets |
2,279,187 | 2,519,967 | ||||
| Total assets |
$ | 8,144,786 | $ | 8,269,489 | ||
The accompanying notes are an integral part of the consolidated financial statements.
55
Table of Contents
NSTAR
Consolidated Balance Sheets
| December 31, | ||||||||
| 2009 | 2008 | |||||||
| (in thousands) | ||||||||
| Liabilities and Capitalization | ||||||||
| Current liabilities: |
||||||||
| Long-term debt |
$ | 625,687 | $ | 688 | ||||
| Transition property securitization |
57,553 | 92,580 | ||||||
| Notes payable |
341,000 | 582,883 | ||||||
| Income taxes |
62,809 | 87,578 | ||||||
| Accounts payable |
245,720 | 280,164 | ||||||
| Power contract obligations |
132,128 | 155,815 | ||||||
| Accrued interest |
32,676 | 31,073 | ||||||
| Dividends payable |
43,050 | 40,380 | ||||||
| Accrued expenses |
20,337 | 19,251 | ||||||
| Other |
78,233 | 77,139 | ||||||
| Liabilities of discontinued operations held for sale |
89,956 | 93,888 | ||||||
| Total current liabilities |
1,729,149 | 1,461,439 | ||||||
| Deferred credits and other liabilities: |
||||||||
| Accumulated deferred income taxes |
1,230,992 | 1,155,702 | ||||||
| Unamortized investment tax credits |
16,795 | 18,437 | ||||||
| Power contract obligations |
214,684 | 345,993 | ||||||
| Pension and other postretirement liability |
625,476 | 743,572 | ||||||
| Regulatory liability - cost of removal |
269,603 | 264,959 | ||||||
| Other |
176,040 | 188,315 | ||||||
| Total deferred credits and other liabilities |
2,533,590 | 2,716,978 | ||||||
| Capitalization: |
||||||||
| Long-term debt liabilities: |
||||||||
| Long-term debt |
1,754,236 | 1,928,708 | ||||||
| Transition property securitization |
212,205 | 331,209 | ||||||
| Total long-term debt liabilities |
1,966,441 | 2,259,917 | ||||||
| Noncontrolling interest - preferred stock of subsidiary |
43,000 | 43,000 | ||||||
| Common equity: |
||||||||
| Common shares, par value $1 per share, 200,000,000 shares authorized, 106,808,376 issued and outstanding |
|
106,808 |
|
|
106,808 |
| ||
| Premium on common shares |
813,490 | 818,601 | ||||||
| Retained earnings |
966,636 | 876,271 | ||||||
| Accumulated other comprehensive loss |
(14,328 | ) | (13,525 | ) | ||||
| Total common equity |
1,872,606 | 1,788,155 | ||||||
| Total capitalization |
3,882,047 | 4,091,072 | ||||||
| Commitments and contingencies |
||||||||
| Total liabilities and capitalization |
$ | 8,144,786 | $ | 8,269,489 | ||||
The accompanying notes are an integral part of the consolidated financial statements.
56
Table of Contents
NSTAR
Consolidated Statements of Cash Flows
| Years ended December 31, | ||||||||||||
| 2009 | 2008 | 2007 | ||||||||||
| (in thousands) | ||||||||||||
| Operating activities: |
||||||||||||
| Net income |
$ | 255,208 | $ | 239,507 | $ | 223,475 | ||||||
| Less: Income from discontinued operations, net of tax |
10,150 | 11,551 | 8,459 | |||||||||
| Add: Transaction costs on discontinued operations, net of tax |
917 | — | — | |||||||||
| Adjustments to reconcile net income to net cash provided by (used in) operating activities: |
||||||||||||
| Depreciation and amortization |
370,082 | 369,800 | 360,169 | |||||||||
| Debt amortization |
5,608 | 6,261 | 6,183 | |||||||||
| Deferred income taxes |
59,962 | 8,737 | (5,155 | ) | ||||||||
| Noncash stock-based compensation |
8,495 | 9,773 | 8,910 | |||||||||
| Net changes in: |
||||||||||||
| Accounts receivable and accrued unbilled revenues |
56,683 | (3,624 | ) | (22,664 | ) | |||||||
| Inventory, at average cost |
28,676 | 27,808 | 6,184 | |||||||||
| Other current assets |
(6,009 | ) | (147,542 | ) | 1,687 | |||||||
| Accounts payable |
(9,832 | ) | (23,262 | ) | (1,665 | ) | ||||||
| Other current liabilities |
(20,471 | ) | (20,328 | ) | 101,802 | |||||||
| Regulatory assets |
(17,322 | ) | (17,815 | ) | 85,832 | |||||||
| Long-term power contract obligations |
(123,776 | ) | (113,965 | ) | (152,633 | ) | ||||||
| Net change from other miscellaneous operating activities |
13,099 | 193,865 | (132,054 | ) | ||||||||
| Cash provided by operating activities of continuing operations |
611,170 | 517,664 | 471,612 | |||||||||
| Cash provided by operating activities of discontinued operations |
26,576 | 27,384 | 21,115 | |||||||||
| Net cash provided by operating activities |
637,746 | 545,048 | 492,727 | |||||||||
| Investing activities: |
||||||||||||
| Plant expenditures (including AFUDC) |
(375,164 | ) | (414,986 | ) | (352,155 | ) | ||||||
| Proceeds from sale of properties |
2,074 | 2,175 | — | |||||||||
| Net change in other investment activities |
(2,595 | ) | 8,072 | (1,160 | ) | |||||||
| Cash used in investing activities of continuing operations |
(375,685 | ) | (404,739 | ) | (353,315 | ) | ||||||
| Cash used in investing activities of discontinued operations |
(3,971 | ) | (12,881 | ) | (4,290 | ) | ||||||
| Net cash used in investing activities |
(379,656 | ) | (417,620 | ) | (357,605 | ) | ||||||
| Financing activities: |
||||||||||||
| Long-term debt issuance |
450,000 | — | 300,000 | |||||||||
| Premium (discount) on issuance of long-term debt |
1,637 | — | (1,306 | ) | ||||||||
| Debt issuance costs |
(3,429 | ) | — | (2,301 | ) | |||||||
| Transition property securitization redemptions |
(154,031 | ) | (153,579 | ) | (151,932 | ) | ||||||
| Long-term debt redemptions |
(1,629 | ) | (1,582 | ) | (80,804 | ) | ||||||
| Net change in notes payable |
(241,883 | ) | 179,483 | (33,000 | ) | |||||||
| Common share dividends paid |
(160,213 | ) | (149,532 | ) | (138,851 | ) | ||||||
| Preferred stock dividends of subsidiary to the noncontrolling interest |
(1,960 | ) | (1,960 | ) | (1,960 | ) | ||||||
| Change in disbursement accounts |
1,475 | (1,963 | ) | 6,921 | ||||||||
| Cash received for exercise of equity compensation |
5,065 | 4,846 | 10,948 | |||||||||
| Cash used to settle equity compensation |
(13,616 | ) | (11,585 | ) | (23,247 | ) | ||||||
| Windfall tax effect of settlement of equity compensation |
464 | 744 | 2,538 | |||||||||
| Cash used in financing activities of continuing operations |
(118,120 | ) | (135,128 | ) | (112,994 | ) | ||||||
| Cash used in financing activities of discontinued operations |
(4,756 | ) | (4,437 | ) | (4,139 | ) | ||||||
| Net cash used in financing activities |
(122,876 | ) | (139,565 | ) | (117,133 | ) | ||||||
57
Table of Contents
NSTAR
Consolidated Statements of Cash Flows
(continued)
| Years ended December 31, | ||||||||||||
| 2009 | 2008 | 2007 | ||||||||||
| (in thousands) | ||||||||||||
| Net increase (decrease) in cash and cash equivalents |
135,214 | (12,137 | ) | 17,989 | ||||||||
| Adjustment for discontinued operations, net of dividends |
(4,149 | ) | 3,434 | (12,686 | ) | |||||||
| Cash and cash equivalents at the beginning of the year |
12,384 | 21,087 | 15,784 | |||||||||
| Cash and cash equivalents at the end of the year |
$ | 143,449 | $ | 12,384 | $ | 21,087 | ||||||
| Supplemental disclosures of cash flow information: |
||||||||||||
| Continuing operations - Cash paid during the year for: |
||||||||||||
| Interest, net of amounts capitalized |
$ | 141,586 | $ | 159,915 | $ | 171,432 | ||||||
| Income taxes |
$ | 91,281 | $ | 124,478 | $ | 151,619 | ||||||
| Continuing operations - Non-cash investing activity: |
||||||||||||
| Plant additions included in accounts payable |
$ | 26,841 | $ | 52,359 | $ | 47,369 | ||||||
| Discontinued operations - Cash paid during the year for interest |
$ | 6,369 | $ | 6,708 | $ | 7,068 | ||||||
The accompanying notes are an integral part of the consolidated financial statements.
58
Table of Contents
Notes to Consolidated Financial Statements
Note A. Business Organization and Summary of Significant Accounting Policies
1. About NSTAR
NSTAR (or the Company) is a holding company engaged through its subsidiaries in the energy delivery business serving approximately 1.4 million customers in Massachusetts, including approximately 1.1 million electric distribution customers in 81 communities and approximately 300,000 natural gas distribution customers in 51 communities. NSTAR’s retail electric and transmission and distribution utility subsidiaries are NSTAR Electric and NSTAR Gas, respectively. Harbor Electric Energy Company, a wholly-owned subsidiary of NSTAR Electric, provides distribution service and ongoing support to its only customer, the Massachusetts Water Resources Authority. NSTAR’s nonutility, unregulated operations include telecommunications operations (NSTAR Com) and a liquefied natural gas service company (Hopkinton). Utility operations accounted for approximately 99% of consolidated operating revenues in 2009, 2008, and 2007.
NSTAR consolidates three-wholly owned special purpose subsidiaries, BEC Funding LLC, BEC Funding II, LLC and CEC Funding, LLC. These entities were created to complete the sale of electric rate reduction certificates to a special purpose trust created by two Massachusetts state agencies. These financing transactions securitized the costs incurred related to the divestiture of generation assets and long-term power contracts.
2. Basis of Consolidation and Accounting
The accompanying Consolidated Financial Statements reflect the results of operations, comprehensive income, retained earnings, financial position and cash flows of NSTAR and its subsidiaries. All significant intercompany transactions have been eliminated in consolidation. Certain immaterial reclassifications have been made to prior year amounts to conform to the current year’s presentation.
NSTAR’s utility subsidiaries follow accounting policies prescribed by the FERC and the DPU. In addition, NSTAR and its subsidiaries are subject to the accounting and reporting requirements of the SEC. The accompanying Consolidated Financial Statements conform to accounting principles in conformity with GAAP. NSTAR’s utility subsidiaries are subject to the application of ASC 980, Regulated Operations that considers the effects of regulation resulting from differences in the timing of their recognition of certain revenues and expenses from those of other businesses and industries. The distribution and transmission businesses are subject to rate-regulation that is based on cost recovery and meets the criteria for application of ASC 980. Refer to Note E, “Regulatory Assets,” for more information.
3. Use of Estimates
The preparation of financial statements in conformity with GAAP requires management of NSTAR and its subsidiaries to make estimates and assumptions that affect the reported amounts of assets and liabilities and disclosures of contingent assets and liabilities at the date of the financial statements and the reported amounts of revenues and expenses during the reporting period. Actual results could differ from these estimates.
4. Revenues
Electric and gas revenues are based on authorized rates approved by the DPU and the FERC. Estimates of distribution and transition revenues for electricity and natural gas delivered to customers but not yet billed are accrued at the end of each accounting period.
Revenues for NSTAR’s nonutility subsidiaries are recognized when services are rendered. Revenues are based, for the most part, on long-term contractual rates.
59
Table of Contents
NSTAR records sales taxes collected from its customers on a net basis (excluded from operating revenues).
5. Utility Plant
Utility plant is stated at original cost. The cost of replacements of property units is capitalized. Maintenance and repairs are expensed as incurred. The original cost of property retired, net of salvage value, is charged to accumulated depreciation. The incurred related cost of removal is charged against the Deferred credits and other liabilities: Regulatory liability - cost of removal in the accompanying Consolidated Balance Sheets. The following is a summary of utility property and equipment, at cost, at December 31:
| (in thousands) |
2009 | 2008 | ||||
| Electric - |
||||||
| Distribution |
$ | 3,822,900 | $ | 3,640,778 | ||
| Transmission |
1,234,003 | 1,117,464 | ||||
| General |
199,839 | 212,556 | ||||
| Electric utility plant |
5,256,742 | 4,970,798 | ||||
| Gas - |
||||||
| Transmission and distribution |
676,526 | 631,321 | ||||
| General |
98,585 | 92,418 | ||||
| Gas utility plant |
775,111 | 723,739 | ||||
| Total utility plant in-service |
$ | 6,031,853 | $ | 5,694,537 | ||
6. Unregulated Property
Unregulated property is stated at cost or its net realizable value. The following is a summary of nonutility property, plant and equipment, at cost less accumulated depreciation, at December 31:
| (in thousands) |
2009 | 2008 | ||||||
| Land |
$ | 4,783 | $ | 4,783 | ||||
| Telecommunications equipment |
39,410 | 39,241 | ||||||
| Buildings and improvements |
3,464 | 3,464 | ||||||
| Less: accumulated depreciation |
(29,086 | ) | (26,611 | ) | ||||
| Total unregulated property, net |
$ | 18,571 | $ | 20,877 | ||||
7. Depreciation and Amortization
Depreciation of utility plant is computed on a straight-line basis using composite rates based on the estimated useful lives of the various classes of property. The composite rates are subject to the approval of the DPU and the FERC. The overall composite depreciation rates for utility property were 3.07%, 3.03%, and 3.03% in 2009, 2008, and 2007, respectively. The rates include a cost of removal component, which is collected from customers during the service life of the property. Depreciation and amortization expense of utility plant for 2009, 2008, and 2007 was $176.7 million, $168.8 million, and $159.3 million, respectively.
Depreciation and amortization of telecommunications equipment is computed on a straight-line basis over the estimated life of the asset, typically 15 years. Depreciation and amortization expense on telecommunications equipment was $2.5 million, $2.3 million, and $2.1 million, for 2009, 2008, and 2007, respectively.
8. Allowance for Borrowed Funds Used During Construction (AFUDC)
AFUDC represents the estimated costs to finance utility plant construction. In accordance with regulatory accounting, AFUDC is included as a cost of utility plant and a reduction of current interest charges. Although AFUDC is not a current source of cash income, the costs are recovered from customers over the service life of
60
Table of Contents
the related plant in the form of increased revenues collected as a result of higher depreciation expense. Average AFUDC rates in 2009, 2008, and 2007 were 0.50%, 2.38%, and 5.27%, respectively, and represented only the costs of short-term debt. The 2009 and 2008 rate decreases are directly related to decreases in short-term borrowing rates.
9. Cash and Cash Equivalents
Cash, cash equivalents and restricted cash at December 31, 2009 and 2008 are comprised of liquid securities with maturities of 90 days or less when purchased.
NSTAR’s banking arrangements provide for daily cash transfers to its disbursement accounts as vendor checks are presented for payment. These banking arrangements do not permit the right of offset amongst subsidiaries’ cash accounts. As a result, credit balances of certain subsidiary disbursement accounts in the amounts of $21.2 million and $19.7 million, respectively, at December 31, 2009 and 2008 are included in Current liabilities: Accounts payable on the accompanying Consolidated Balance Sheets. Changes in the balances of the disbursement accounts are reflected in financing activities in the accompanying Consolidated Statements of Cash Flows.
10. Use of Fair Value
NSTAR uses a fair value hierarchy that gives the highest priority to quoted prices in active markets, and is applicable to fair value measurements of derivative contracts and other instruments that are subject to mark-to-market accounting. Refer to Note L, “Fair Value,” for more information.
The fair value of financial instruments is estimated based on market trading information, where available. Absent published market values for an instrument or other assets, management uses observable market data to arrive at its estimates of fair value. For its long-term debt, management estimates are based in part on quotations from broker/dealers or interest rate information for similar instruments. The carrying amount of cash and temporary investments, accounts receivable, accounts payable, short-term borrowings and other current liabilities approximates fair value because of the short maturity and/or frequent repricing of those instruments.
In addition, the Company applies fair value recognition provisions to estimate the fair value of its stock-based compensation.
11. Income Taxes
Income tax expense includes the current tax obligation or benefit and the change in deferred income tax liability for the period. Deferred income taxes result from temporary differences between financial and tax bases of certain assets and liabilities. Income tax benefits associated with uncertain tax positions are recognized when the company determines that it is more-likely-than-not that the tax position will be ultimately sustained. Refer to Note G, “Income Taxes,” for more information.
12. Equity Method of Accounting
NSTAR uses the equity method of accounting for investments in corporate joint ventures in which it does not have a controlling interest. Under this method, it records as income or loss the proportionate share of the net earnings or losses of the joint ventures with a corresponding increase or decrease in the carrying value of the investment. The investment is reduced as cash dividends are received. NSTAR participates in several corporate joint ventures in which it has investments, principally its 14.5% equity investment in two companies that own and operate transmission facilities to import electricity from the Hydro-Quebec System in Canada, and its equity investments ranging from 4% to 14% in three regional nuclear facilities (CY, MY, and YA), all of which have been decommissioned in accordance with the federal NRC procedures.
61
Table of Contents
13. Interest Income and Other, Net
Major components of interest income and other, net were as follows:
| Years ended December 31, | ||||||||||||
| (in thousands) |
2009 | 2008 | 2007 | |||||||||
| Interest on regulatory assets, including transition deferral |
$ | 21,708 | $ | 17,012 | $ | 2,216 | ||||||
| Income tax deficiencies |
6,825 | 4,607 | 9,114 | |||||||||
| Other interest expense |
(4,165 | ) | (3,584 | ) | (1,934 | ) | ||||||
| Total interest income and other, net |
$ | 24,368 | $ | 18,035 | $ | 9,396 | ||||||
Other interest expense includes interest on life insurance policies, loan facility charges, and interest on customer deposits.
14. Other Income (Deductions)
Major components of other income were as follows:
| Years ended December 31, | |||||||||
| (in thousands) |
2009 | 2008 | 2007 | ||||||
| Equity earnings, dividends, and other investment income |
$ | 891 | $ | 820 | $ | 1,495 | |||
| Interest, dividend, and rental income |
5,258 | 6,612 | 9,226 | ||||||
| Environmental settlement proceeds |
— | 4,750 | — | ||||||
| Increase in cash surrender value of life insurance policies |
2,786 | — | 479 | ||||||
| Miscellaneous other income |
229 | 1,082 | 2,981 | ||||||
| Total other income |
$ | 9,164 | $ | 13,264 | $ | 14,181 | |||
Major components of other deductions were as follows:
| Years ended December 31, | ||||||||||||
| (in thousands) |
2009 | 2008 | 2007 | |||||||||
| Charitable contributions |
$ | (2,728 | ) | $ | (860 | ) | $ | (1,730 | ) | |||
| Decrease in cash surrender value of life insurance policies |
— | (1,486 | ) | — | ||||||||
| Miscellaneous other deductions |
(1,011 | ) | (2,656 | ) | (3,257 | ) | ||||||
| Total other deductions |
$ | (3,739 | ) | $ | (5,002 | ) | $ | (4,987 | ) | |||
15. Purchase and Sales Transactions with ISO-NE
NSTAR Electric has several remaining long-term power contracts that it sells through ISO-NE at daily market prices and the contracts are not used to satisfy its Basic Service energy requirements. NSTAR Electric is required by DPU to credit all proceeds from these energy sales back to its customers. NSTAR Electric may not execute new long-term energy supply agreements without approval of the DPU. During 2009, 2008, and 2007, NSTAR recorded the proceeds from the sales of these contracts as a reduction to Purchased power and transmission expense of $147.1 million, $251.9 million, and $212.8 million, respectively, on the accompanying Consolidated Statements of Income.
| 16. | New Accounting Standards Updates |
Variable Interest Entities
Amended consolidation guidance applicable to variable interest entities will be effective for NSTAR beginning in fiscal year 2010. The Company does not anticipate that this authoritative guidance will have an effect on the Company’s existing contractual and business relationships and how they are reported in the consolidated financial statements.
62
Table of Contents
| 17. | Subsequent Events |
Management has reviewed subsequent events and concluded that no material subsequent events have occurred that are not accounted for in the accompanying financial statements or disclosed in the accompanying notes.
Note B. Discontinued Operations
On December 21, 2009, NSTAR announced an agreement to sell its wholly-owned subsidiary, Medical Area Total Energy Plant, Inc. (MATEP). MATEP provides steam, chilled water service, and electricity under long-term contracts to several hospitals, medical research and biotechnology centers, and teaching institutions in the Longwood Medical Area of Boston. The sale is at a price of approximately $320 million in cash and is subject to certain federal and local regulatory approvals. The purchase price is subject to certain closing adjustments related to changes in working capital, interest, and other adjustments. In connection with the sale, NSTAR will retire MATEP’s debt.
MATEP’s principal asset is a cogeneration plant that produces electricity, steam and chilled water, and a distribution system that delivers these products to its customers. MATEP has approximately 85 employees.
The sale is expected to close towards the end of the first quarter or early part of the second quarter of 2010. Net proceeds from the transaction are anticipated to be used to reduce NSTAR’s capitalization.
The operating results of MATEP have been separately classified and reported as discontinued operations on the accompanying Consolidated Statements of Income. A summary of discontinued operations is as follows:
| Years ended December 31, | |||||||||
| (in thousands) |
2009 | 2008 | 2007 | ||||||
| Operating revenues |
$ | 116,887 | $ | 137,066 | $ | 125,699 | |||
| Operating expenses |
94,452 | 112,197 | 106,190 | ||||||
| Interest charges |
6,892 | 7,251 | 7,631 | ||||||
| Other income |
72 | 296 | 818 | ||||||
| Income taxes |
5,465 | 6,363 | 4,237 | ||||||
| Income from discontinued operations |
10,150 | 11,551 | 8,459 | ||||||
| Transaction costs from sale, net of tax |
917 | — | — | ||||||
| Net income from discontinued operations |
$ | 9,233 | $ | 11,551 | $ | 8,459 | |||
The results of operations for the year ended December 31, 2009 exclude depreciation and amortization expense of approximately $0.5 million incurred after December 21, 2009.
The components of assets and liabilities held for sale consisted of the following:
| December 31, | ||||||||
| (in thousands) |
2009 | 2008 | ||||||
| Cash, including restricted cash |
$ | 20,000 | $ | 19,181 | ||||
| Accounts receivable |
12,521 | 20,777 | ||||||
| Inventory and other current assets |
6,222 | 5,921 | ||||||
| Unregulated property, net |
118,762 | 118,795 | ||||||
| Deferred debits |
10,352 | 10,819 | ||||||
| Assets of discontinued operations held for sale |
$ | 167,857 | $ | 175,493 | ||||
| Accounts payable and other current liabilities (a) |
$ | 13,727 | $ | 22,674 | ||||
| Deferred credits: PBOP liability |
7,180 | 6,202 | ||||||
| Deferred credits: Other |
1,788 | 1,762 | ||||||
| Deferred tax asset (b) |
(16,902 | ) | (25,265 | ) | ||||
| Long-term debt, including current maturities |
84,163 | 88,515 | ||||||
| Liabilities of discontinued operations held for sale |
$ | 89,956 | $ | 93,888 | ||||
63
Table of Contents
| (a) | Other current liabilities exclude the current portion of long-term debt of $5.1 million and $4.8 million in 2009 and 2008, respectively. These amounts are included with the long-term debt amounts. |
| (b) | The deferred tax asset is shown as an offset to the liabilities of MATEP due to the presentation of a net deferred income tax liability on the accompanying Consolidated Balance Sheets at December 31, 2009 and 2008. |
The total assets and liabilities of MATEP have been classified as current assets and current liabilities of discontinued operations held for sale on the accompanying Consolidated Balance Sheets at December 31, 2009 and 2008.
Note C. Earnings Per Common Share
Basic EPS is calculated by dividing net income attributable to common shareholders, which includes a deduction for preferred dividends of a subsidiary, by the weighted average common shares outstanding during the respective period. Diluted EPS is similar to the computation of basic EPS except that the weighted average common shares are increased to include the impact of potential (nonvested) shares and stock options granted (stock-based compensation) in accordance with NSTAR’s Long Term Incentive Plan.
The following table summarizes the reconciling amounts between basic and diluted EPS:
| (in thousands, except per share amounts) |
2009 | 2008 | 2007 | ||||||
| Net income attributable to common shareholders |
$ | 253,248 | $ | 237,547 | $ | 221,515 | |||
| Earnings per common share - Basic and Diluted: |
|||||||||
| Continuing operations |
$ | 2.28 | $ | 2.11 | $ | 1.99 | |||
| Discontinued operations |
0.09 | 0.11 | 0.08 | ||||||
| Total earnings |
$ | 2.37 | $ | 2.22 | $ | 2.07 | |||
| Weighted average common shares outstanding for basic EPS |
106,808 | 106,808 | 106,808 | ||||||
| Effect of dilutive shares: |
|||||||||
| Weighted average dilutive potential common shares |
188 | 237 | 314 | ||||||
| Weighted average common shares outstanding for diluted EPS |
106,996 | 107,045 | 107,122 | ||||||
The following table summarizes potential common shares that are excluded from the calculation of diluted EPS as their effect would be anti-dilutive:
| (in thousands) |
2009 | 2008 | 2007 | |||
| Deferred shares |
199 | 97 | 151 | |||
| Stock options |
1,013 | 706 | 306 | |||
| Performance shares |
— | — | N/A |
Note D. Asset Retirement Obligations and Cost of Removal
The fair value of a liability for an asset retirement obligation (ARO) is recorded in the period in which it is incurred. When the liability is initially recorded, the entity capitalizes the cost by increasing the carrying amount of the related long-lived asset. Over time, the liability is accreted to its present value each period, and the capitalized cost is depreciated over the useful life of the related asset. Upon settlement of the liability, an entity either settles the obligation for its recorded amount or incurs a gain or loss upon settlement.
64
Table of Contents
The recognition of an ARO within NSTAR’s regulated utility businesses has no impact on its earnings. For its rate-regulated utilities, NSTAR establishes a regulatory asset to recognize future recoveries through depreciation rates for the recorded ARO. NSTAR has certain plant assets in which this condition exists and is related to both plant assets containing hazardous materials and legal requirements to undertake remediation efforts upon retirement.
At December 31, 2009 and 2008, NSTAR had a recorded asset retirement cost liability of $30 million and $23 million, respectively, which approximates the current cost for NSTAR to liquidate its legal or contractual obligations to perform actions at some point after the retirement of an asset. This amount is included in Deferred credits and other liabilities: Other on the accompanying Consolidated Balance Sheets.
For NSTAR’s regulated utility businesses, the ultimate cost to remove utility plant from service (cost of removal) is recognized as a component of depreciation expense in accordance with approved regulatory treatment. As of December 31, 2009 and 2008, the estimated amount of the cost of removal included in regulatory liabilities was approximately $270 million and $265 million, respectively, based on the estimated cost of removal component in current depreciation rates. This represents the cumulative amounts collected from customers for cost of removal, but not yet expended.
Note E. Regulatory Assets
Regulatory assets represent costs incurred that are probable of recovery from customers through future rates in accordance with agreements with regulators. These costs are expensed when the corresponding revenues are received in order to appropriately match revenues and expenses.
Regulatory assets consisted of the following:
| December 31, | ||||||||
| (in thousands) |
2009 | 2008 | ||||||
| Energy contracts (including Yankee units) |
$ | 346,812 | $ | 501,808 | ||||
| Goodwill |
598,060 | 618,220 | ||||||
| Securitized and other energy-related costs |
580,927 | 637,803 | ||||||
| Retiree benefit costs |
916,287 | 946,682 | ||||||
| Income taxes, net |
26,877 | 29,235 | ||||||
| Purchased energy costs over collection |
(90,692 | ) | (17,257 | ) | ||||
| Redemption premiums |
23,243 | 25,737 | ||||||
| Other |
163,901 | 163,704 | ||||||
| Total current and long-term regulatory assets |
$ | 2,565,415 | $ | 2,905,932 | ||||
Under the traditional revenue requirements model, electric and gas rates are based on the cost of providing energy delivery service. Under ASC 980, NSTAR Electric and NSTAR Gas follow accounting policies that are not applicable to other businesses and industries in general. ASC 980 requires companies to defer the recognition of certain costs when incurred if future rate recovery of these costs is probable. This is applicable to NSTAR’s electric and gas distribution and transmission operations.
Amortization expense recorded to Depreciation and amortization on the accompanying Consolidated Statements of Income on certain regulatory assets for 2009, 2008, and 2007 was $190.9 million, $198.7 million, and $198.8 million, respectively. The amortization of other regulatory assets is recorded to Purchased power and transmission expense on the accompanying Consolidated Statements of Income.
65
Table of Contents
Energy contracts
At December 31, 2009 and 2008, respectively, $296.6 million and $412.7 million represent the contract termination liability related to certain purchase power contract buy-out agreements that NSTAR Electric executed in 2004 and their future recovery through NSTAR Electric’s transition charges. Refer to Note N, “Contracts for the Purchase of Energy,” for further details. Since no cash outlay was incurred by NSTAR, NSTAR recognized this regulatory asset as a result of recording the contract termination liability. NSTAR does not earn a return on this regulatory asset. The contracts’ termination payments will occur over time and will be collected from customers through NSTAR’s transition charge over the same time period. The cost recovery period of these terminated contracts is through September, 2016.
In addition, the unamortized balance of the costs to decommission the CY, YA, and MY nuclear power plants was $48.5 million and $56.2 million at December 31, 2009 and 2008, respectively. All three nuclear units were notified by the NRC that their respective former plant sites were decommissioned in accordance with NRC procedures and regulations. NSTAR’s liability for CY decommissioning and its recovery ends at the earliest in 2015, for YA in 2014, and for MY in 2013. However, should the actual costs exceed current estimates, NSTAR could have an obligation beyond these periods that would be fully recoverable. These costs are recovered through NSTAR Electric’s transition charge. NSTAR does not earn a return on decommissioning costs, but a return is included in rates charged to NSTAR by these plants. Refer to Note O, “Commitments and Contingencies,” for further discussion.
The remaining balances at December 31, 2009 and 2008 of $1.7 million and $32.9 million, respectively, represent the recognition of the future recoverability of a derivative liability recorded related to contracts structured to hedge a portion of NSTAR Gas’ future supply purchases. NSTAR Gas does not earn a return on these balances. Refer to Note F, “Derivative Instruments,” for further details. Settled amounts would be refunded or collected from customers no later than 18 months from the settlement date.
Goodwill
The Company’s goodwill originated from the merger that created NSTAR in 1999. As a result of a rate order from the DPU approving the merger, the Company is recovering goodwill from its customers and, therefore, NSTAR has determined that this rate structure allows for amortization of goodwill over the collection period. Goodwill along with related deferred income taxes is being amortized over 40 years, through 2039, without a carrying charge.
Securitized and other energy-related costs
A portion of these energy-related regulatory assets are collateralized with the Transition Property Securitization Certificates held by NSTAR Electric’s subsidiaries, BEC Funding LLC, BEC Funding II, LLC and CEC Funding, LLC. The collateralized amounts at December 31, 2009 and 2008 were $281.1 million and $434 million, respectively. The certificates are non-recourse to NSTAR Electric.
Also included are other costs related to purchase power contract divestitures and certain costs related to NSTAR Electric’s former generation business that are recovered with a return through the transition charge and amounted to $276.2 million and $164.8 million at December 31, 2009 and 2008, respectively.
These cost recoveries primarily occur through September, 2016 for NSTAR Electric and are subject to adjustment by the DPU.
The remaining energy-related regulatory assets consist of other transition costs and other recoverable charges of $23.6 million and $39 million at December 31, 2009 and 2008, respectively.
66
Table of Contents
Retiree benefit costs
The retiree benefit regulatory asset at December 31, 2009 and 2008 is $916.3 million and $946.7 million, respectively. (Refer to Note H, “Pension and Other Postretirement Benefits,” for further details.) During 2009, the funded status of NSTAR’s Pension and PBOP plans improved. This change in funded status resulted in a decrease to the liability which was offset by a corresponding decrease in the retiree benefit costs regulatory asset. The remaining balance reflects the deferred pension and PBOP expenses. In accordance with the PAM, these amounts are amortized and collected from or returned to customers over three years. At December 31, 2009, a deferred under-recovery of costs amounted to $34 million compared to a deferred over-recovery of costs of $23.8 million at December 31, 2008. NSTAR recovers its qualified pension and PBOP expenses through this reconciling rate mechanism, thereby removing the volatility of these expenses from the consolidated financial statements. NSTAR earns a carrying charge on the excess cumulative contributions over what it recovers in rates. At December 31, 2009, this balance was $424.6 million of the retiree benefit regulatory asset under the PAM regulatory mechanism.
Income taxes, net
The principal holder of this regulatory asset is NSTAR Electric. This regulatory asset balance reflects deferred tax reserve deficiencies that are currently being recovered from customers and excludes a return component. Partially offsetting these amounts is a regulatory liability associated with unamortized investment tax credits relating to NSTAR Electric and NSTAR Gas.
Purchased energy costs
The purchased energy costs at December 31, 2009 and 2008 relate to deferred electric Basic Service and gas supply costs. Basic Service is the electricity that is supplied by NSTAR Electric when a customer has chosen not to receive service from a competitive supplier. The market price for Basic Service and gas supply costs may fluctuate based on the average market price for energy. Amounts incurred for Basic Service and cost of gas supply are recovered on a fully reconciling basis without a return. The over-collected position of purchased energy costs is presented as a reduction of regulatory assets rather than as a regulatory liability. This is because the amount of the over-collected Basic Service and CGAC positions is exceeded by regulatory assets that will be collected from the same classes of retail electric and gas customers that these over-collected Basic Service and CGAC positions will be returned to.
Redemption premiums
These amounts reflect the unamortized balance of redemption premiums on NSTAR Electric Debentures that are amortized and recovered over the life of the respective debentures pursuant to DPU approval. The decrease reflects the amortization of these redemption premiums. There is no return recognized on this balance.
Other
Amounts included consist of deferred transmission costs, other DPU costs, and merger-related costs. Deferred transmission costs represent the difference between the level of billed transmission revenues and the current period costs incurred to provide transmission-related services that will be recovered over a subsequent twelve-month period with carrying charges. The costs associated with a DPU-approved safety and reliability program and clean up costs related to former gas manufacturing sites that are recovered over a seven-year period without a return.
Note F. Derivative Instruments
Energy Contracts
NSTAR has determined that its electricity supply contracts qualify for, and NSTAR has elected, the normal purchases and sales exception. As a result, these agreements are not reflected on the accompanying Consolidated
67
Table of Contents
Balance Sheets. NSTAR has only one significant gas supply contract. This contract is an all-requirements portfolio asset management contract that expires in October, 2011. This contract contains market based pricing terms and therefore no financial statement adjustments are required. Gas supply costs incurred related to this contract were $177 million, $259 million, and $224 million for the years ended December 31, 2009, 2008, and 2007, respectively, and have been recorded to Cost of gas sold on the accompanying Consolidated Statements of Income. Refer to the accompanying Item 7A, “Quantitative and Qualitative Disclosures About Market Risk,” for a further discussion.
Gas Hedging Agreements
In accordance with a DPU order, NSTAR Gas purchases financial contracts based upon NYMEX natural gas futures in order to reduce cash flow variability associated with the purchase price for approximately one-third of its natural gas purchases. This practice attempts to minimize the impact of fluctuations in prices to NSTAR’s firm gas customers. These financial contracts do not procure gas supply. These contracts qualify as derivative financial instruments. Accordingly, the fair value of these instruments is recognized on the accompanying Consolidated Balance Sheets as an asset or liability representing amounts due from or payable to the counter parties of NSTAR Gas, as if such contracts were settled as of the balance sheet date. All actual costs incurred or benefits realized are included in the CGAC of NSTAR Gas. As a result, NSTAR Gas records a regulatory asset or liability for the market price changes, in lieu of recording an adjustment to Other Comprehensive Income. Currently, these derivative contracts extend through April 2011. As of December 31, 2009 and 2008, NSTAR had recorded a liability and a corresponding regulatory asset of $1.7 million and $32.9 million, respectively, to reflect the fair value of these contracts. During the years ended December 31, 2009, 2008, and 2007, $47 million, $16 million, and $30 million, respectively, of these financial contracts were settled and were recognized as additional charges to Cost of gas sold on the accompanying Consolidated Statements of Income.
Derivative Instruments and Hedging Activities
The following disclosures summarize the fair value of NSTAR Gas’ hedging agreements, the asset and liability positions of these hedging agreements and related settlements:
| December 31, | ||||||
| (in thousands) |
2009 | 2008 | ||||
| Gas Hedging Agreements |
||||||
| Consolidated Balance Sheet Account: |
||||||
| Current liabilities - power contract obligations |
$ | 1,604 | $ | 32,275 | ||
| Deferred credits and other liabilities - power contract obligations |
51 | 600 | ||||
| Total potential liability for derivative instruments |
$ | 1,655 | $ | 32,875 | ||
| Amount of Gain or (Loss) Recognized |
||||||||||||
| Years Ended December 31, | ||||||||||||
| Settlement of Gas Hedging Agreements |
2009 | 2008 | 2007 | |||||||||
| Consolidated Statement of Income Account: |
||||||||||||
| (Increase) decrease to Cost of gas sold |
$ | (46,988 | ) | $ | (15,661 | ) | $ | (30,427 | ) | |||
| Increase (decrease) to revenues reflecting recovery of or return of settlements to customers |
46,988 | 15,661 | 30,427 | |||||||||
| Net earnings impact |
$ | — | $ | — | $ | — | ||||||
As of December 31, 2009, these gas hedging agreements, representing fourteen individual contracts, hedged approximately 11,530 BBtu. The settlement of these contracts may have a short-term cash flow impact. Over the long-term any such effects are mitigated by a regulatory recovery mechanism for those costs.
68
Table of Contents
Potential counterparty credit risk is minimized by collateral requirements as specified in credit support agreements to the contracts that are based on the credit rating of the counterparty and the fair value exposure under each contract’s term. In the event of a downgrade in the credit rating of either party, these agreements may require that party to immediately collateralize, by either cash payment, letter of credit, or other qualifying security instrument, any exposure that exists for obligations in excess of specified threshold amounts.
NSTAR Gas is also subject to this credit risk-related contingent feature. Based on market conditions at the time of a downgrade, NSTAR Gas could be required to post collateral in an amount that could be equal to or less than the fair value of the liability at the time of the downgrade. As of December 31, 2009, NSTAR Gas has an A+ Standard & Poors Credit Issuer rating. Collateral obligations are required in the event of a downgrade below an A rating by Standard & Poors and/or if the fair value of the contract exceeds established credit thresholds. Based on NSTAR Gas’ liability position with its gas hedge contract counterparties as of December 31, 2009, should NSTAR Gas’ credit rating be downgraded the following collateral obligations would result:
| Credit Ratings Downgraded to: |
Level Below “A” Rating |
Incremental Obligations |
Cumulative Obligations | |||||
| (in thousands) |
||||||||
| A-/A3 |
1 | $ | — | $ | — | |||
| BBB+/Baa1 |
2 | — | — | |||||
| BBB/Baa2 |
3 | — | — | |||||
| BBB-/Baa3, or below investment grade |
4 | 1,655 | 1,655 | |||||
In addition, these agreements contain cross-default provisions that would allow NSTAR Gas and its counterparties to terminate and liquidate a gas hedge contract if either party is in default on other swap agreements with that same counterparty, or another unrelated agreement with that same counterparty in excess of stipulated threshold amounts.
Note G. Income Taxes
NSTAR recognizes deferred tax assets and liabilities for the future tax effects of temporary differences between the carrying amounts and the tax basis of assets and liabilities. Net regulatory assets of $27 million and $29.2 million and corresponding net increases in accumulated deferred income taxes were recorded as of December 31, 2009 and 2008, respectively. The regulatory assets represent the additional future revenues to be collected from customers for deferred income taxes.
69
Table of Contents
Accumulated deferred income taxes and unamortized investment tax credits consisted of the following:
| December 31, | ||||||
| (in thousands) |
2009 | 2008 | ||||
| Deferred tax liabilities: |
||||||
| Depreciation |
$ | 783,384 | $ | 703,889 | ||
| Goodwill |
234,589 | 242,497 | ||||
| Power contracts |
112,191 | 147,620 | ||||
| Purchased power |
95,465 | 88,039 | ||||
| Transition costs |
5,553 | 32,510 | ||||
| Pension expense |
114,634 | 98,229 | ||||
| Other |
63,501 | 64,265 | ||||
| Total deferred tax liabilities |
1,409,317 | 1,377,049 | ||||
| Deferred tax assets: |
||||||
| Postretirement benefits |
13,383 | 31,336 | ||||
| Other |
95,130 | 103,178 | ||||
| Total deferred tax assets |
108,513 | 134,514 | ||||
| Net accumulated deferred income taxes |
1,300,804 | 1,242,535 | ||||
| Accumulated unamortized investment tax credits |
16,795 | 18,437 | ||||
| Net deferred tax liabilities and investment tax credits |
$ | 1,317,599 | $ | 1,260,972 | ||
Investment tax credits are amortized over the estimated remaining lives of the property that generated the credits.
Components of income tax expense were as follows:
| (in thousands) |
2009 | 2008 | 2007 | |||||||||
| Continuing operations: |
||||||||||||
| Current income tax expense |
$ | 86,954 | $ | 132,008 | $ | 134,309 | ||||||
| Deferred income tax expense (benefit) |
61,604 | 10,400 | (3,465 | ) | ||||||||
| Investment tax credit amortization |
(1,642 | ) | (1,663 | ) | (1,685 | ) | ||||||
| Income taxes from continuing operations |
146,916 | 140,745 | 129,159 | |||||||||
| Discontinued operations: |
||||||||||||
| Current income tax (benefit) expense |
(3,588 | ) | 2,127 | 6,146 | ||||||||
| Deferred income tax expense (benefit) |
8,460 | 4,236 | (1,909 | ) | ||||||||
| Income taxes from discontinued operations |
4,872 | 6,363 | 4,237 | |||||||||
| Total income tax expense |
$ | 151,788 | $ | 147,108 | $ | 133,396 | ||||||
The effective income tax rates reflected in the accompanying consolidated financial statements and the reasons for their differences from the statutory federal income tax rate were as follows:
| 2009 | 2008 | 2007 | |||||||
| Statutory tax rate |
35 | % | 35 | % | 35 | % | |||
| State income tax, net of federal income tax benefit |
4 | 5 | 5 | ||||||
| Investment tax credits |
(1 | ) | (1 | ) | (1 | ) | |||
| Other |
— | (1 | ) | (1 | ) | ||||
| Effective tax rate |
38 | % | 38 | % | 38 | % | |||
Uncertain Tax Positions
NSTAR recognizes income tax benefits associated with uncertain tax positions when the company determines that it is more-likely-than-not that the tax position will be ultimately sustained.
70
Table of Contents
In 2007, upon the adoption, and in accordance with an accounting interpretation, NSTAR recognized the cumulative effect of approximately $46.6 million as an increase to its beginning retained earnings related to the deduction from the loss on the abandonment of NSTAR’s investment in the stock of RCN Corporation (RCN) and the deduction of construction-related costs. This adjustment consisted primarily of $39.6 million related to the net unrecognized benefit of the RCN share abandonment. This adjustment also included the reversal of previously accrued interest expense on the RCN deduction and interest income accrued on the deduction of construction-related costs, as discussed further in this Note, which combined netted to $7 million after tax. NSTAR’s assessment of the RCN tax position has consistently been that it is more-likely-than-not of prevailing.
The following is a reconciliation of the unrecognized tax benefits that have been recognized as uncertain tax position liabilities on the accompanying Consolidated Balance Sheets included in Deferred credits and other liabilities: Other:
| (in millions) |
2009 | 2008 | ||||
| Balance at beginning of year |
$ | 15 | $ | 15 | ||
| Changes for current year tax positions |
— | — | ||||
| Balance at end of year |
$ | 15 | $ | 15 | ||
As of December 31, 2009 and 2008, there were no unrecognized tax benefits of a permanent tax nature that if recognized would have an impact on the Company’s effective tax rate.
RCN Corporation (RCN) Share Abandonment Tax Treatment
On December 24, 2003, NSTAR exited its investment in RCN by formally abandoning its 11.6 million shares of RCN common stock. As a result of the RCN share abandonment, the Company claimed an ordinary loss on its 2003 tax return. In 2006, the IRS disallowed the classification of the deduction as an ordinary loss. NSTAR appealed this decision and is currently in negotiation with the IRS Appeals office.
Prior to 2007, it was NSTAR’s tax accounting policy not to recognize tax benefits associated with an uncertain tax position until it was probable that such tax benefit would ultimately be realized. NSTAR determined that it was less than probable that the tax deduction related to the abandonment of its RCN investment would ultimately be sustained. Accordingly, NSTAR accrued a tax reserve so as to not recognize the earnings benefit of this uncertain tax position.
As of January 1, 2007, the potential tax loss was approximately $39.6 million. NSTAR adopted an accounting standard regarding uncertain tax positions effective January 1, 2007 which established a tax accounting recognition standard of more-likely-than-not, which is a lower threshold than NSTAR’s previous tax benefit recognition policy. Upon the adoption of the standard, NSTAR recognized the entire $39.6 million amount plus interest as an increase to its January 1, 2007 retained earnings balance.
Construction-related Costs - Simplified Service Cost Method (SSCM)
In 2004, NSTAR amended its 2002 Federal income tax return to change its method of tax accounting for certain construction-related overhead costs previously capitalized to plant under a methodology prior to SSCM. Under SSCM, certain costs which were previously capitalized for tax purposes are deducted in the year incurred. NSTAR claimed additional deductions related to the tax accounting method change in its 2002-2004 returns of $368.9 million. In 2005, NSTAR received formal notification from the IRS that the claim on its amended income tax return was denied. NSTAR did not receive the requested refund amount due.
In August 2005, the IRS issued a Revenue Ruling and Treasury Regulations related to the SSCM to curtail these levels of construction-related cost deductions by utilities and others. Under this Regulation, the SSCM is not available for the majority of NSTAR’s constructed property for the years 2005 and forward. NSTAR was
71
Table of Contents
required to make a cash tax payment to the IRS of $129.1 million in late 2006 representing the disallowed SSCM deductions taken for 2002-2004 even though the tax refund was never received. This payment will be fully refunded with interest to NSTAR, once this tax position is resolved. This refund has been recorded as a current refundable income tax on the accompanying Consolidated Balance Sheets.
IRS Appeals and Examinations
As of December 31, 2009, the 2001 through 2007 federal and state tax years remain open (including the SSCM and RCN Share Abandonment matters) and all years are at the IRS Office of Appeals.
NSTAR is negotiating with IRS Appeals in an attempt to settle all issues relating to years 2001 through 2007. To date, we have reached agreement on the SSCM issue with a closing agreement expected to be signed in the first quarter of 2010. Upon approval of the settlement by the U.S. Congress Joint Committee on Taxation, NSTAR expects receipt of the $129 million of its refundable income tax receivable, plus interest, by mid-2010. Potential settlement discussions related to the RCN matter are continuing, however, the timing of any final settlement is uncertain as well as whether an agreement can be reached at an amount that would be acceptable to NSTAR. If an agreement is reached, it is reasonably possible that a charge could be recognized. Such agreement would also require Joint Committee approval. In the event that NSTAR is unsuccessful in reaching a reasonable settlement agreement with the IRS Appeals, it will continue the current plan to litigate the RCN tax matter. This action would delay resolution of this tax matter beyond 2010.
The 2008 Federal income tax return has been examined under the IRS Compliance Assurance Process (CAP) and NSTAR has received a “no change” letter. The 2009 Federal income tax return is being reviewed under CAP. This program accelerates the examination of the return in an attempt to resolve issues before the tax return is filed. The outcome of any potential audit adjustments and the timing are uncertain.
Interest on Tax Positions
NSTAR recognizes interest accrued related to uncertain tax positions in Interest charges: Interest income and other, net and related penalties, if applicable, in Other deductions, on the accompanying Consolidated Statements of Income. This accounting policy is consistent with the recognition of these items prior to the adoption of the accounting standard for uncertain tax positions. For the years ended December 31, 2009, 2008 and 2007, the amount of interest income recognized on the accompanying Consolidated Statements of Income was $6.8 million, $4.6 million, and $9.1 million, respectively, and the total amount of accrued interest receivable on the accompanying Consolidated Balance Sheets was $24.6 million and $17.8 million at December 31, 2009 and 2008, respectively. No penalties were recognized during 2009 and 2008.
In addition to its uncertain tax position liability, NSTAR has unrecognized benefits associated with interest on construction-related uncertain tax positions. These unrecognized benefits were $4 million and $9 million as of December 31, 2009 and 2008, respectively. As a result of the settlement agreement reached with IRS Appeals on SSCM, it is unlikely that additional benefits will be recognized on this issue. The agreement reached with the IRS is subject to approval by Joint Committee.
Note H. Pension and Other Postretirement Benefits
NSTAR accounts for its Pension and PBOP Plans in accordance with the provisions of an accounting standard that requires an employer with a defined benefit plan or other postretirement plan to recognize an asset or liability on its balance sheet for the funded status of its plan. The pension asset or liability is the difference between the fair value of the plan’s assets and the projected benefit obligation as of year-end. For other postretirement benefit plans, the asset or liability is the difference between the fair value of the plan’s assets and the accumulated postretirement benefit obligation as of year-end. As a result of NSTAR’s approved regulatory rate mechanism for recovery of pension and postretirement costs, NSTAR has recognized a regulatory asset for the majority of its pension and postretirement costs in lieu of taking a charge to AOCI.
72
Table of Contents
1. Pension
NSTAR provides a defined benefit retirement plan, the NSTAR Pension Plan (the Plan), that covers substantially all employees. Retirement benefits are based on various final average pay formulae. NSTAR also maintains a non-qualified supplemental retirement plan for certain management employees.
The Plans use December 31st for the measurement date to determine their projected benefit obligation and fair value of plan assets for the purposes of determining the Plans’ funded status and the net periodic benefit costs for the following year.
The following tables for NSTAR’s Pension benefit plans present the change in benefit obligation, change in the Plans’ assets, the funded status, the components of net periodic benefit cost and key assumptions used:
| Years Ended December 31, | ||||||||
| (in thousands) |
2009 | 2008 | ||||||
| Change in benefit obligation: |
||||||||
| Benefit obligation, beginning of the year |
$ | 1,068,392 | $ | 1,057,406 | ||||
| Service cost |
22,147 | 21,273 | ||||||
| Interest cost |
64,316 | 63,642 | ||||||
| Plan participants’ contributions |
19 | 24 | ||||||
| Actuarial loss/(gain) |
50,179 | (7,663 | ) | |||||
| Settlement payments |
(9,934 | ) | (11,669 | ) | ||||
| Benefits paid |
(54,215 | ) | (54,621 | ) | ||||
| Benefit obligation, end of the year |
$ | 1,140,904 | $ | 1,068,392 | ||||
| Years Ended December 31, | ||||||||
| (in thousands) |
2009 | 2008 | ||||||
| Change in Plan assets: |
||||||||
| Fair value of Plan assets, beginning of the year |
$ | 716,710 | $ | 1,049,378 | ||||
| Actual return on Plan assets, net |
82,108 | (338,990 | ) | |||||
| Employer contribution |
127,350 | 72,588 | ||||||
| Plan participants’ contributions |
19 | 24 | ||||||
| Settlement payments |
(9,934 | ) | (11,669 | ) | ||||
| Benefits paid |
(54,215 | ) | (54,621 | ) | ||||
| Fair value of Plan assets, end of the year |
$ | 862,038 | $ | 716,710 | ||||
| Funded status, end of year - under funded |
$ | (278,866 | ) | $ | (351,682 | ) | ||
Source of change in other comprehensive income:
| Years Ended December 31, |
||||||||
| (in thousands) |
2009 | 2008 | ||||||
| Net loss arising during period |
$ | (2,840 | ) | $ | (2,320 | ) | ||
| Amortization: |
||||||||
| Prior service cost |
35 | 1,005 | ||||||
| Actuarial loss |
1,337 | 872 | ||||||
| Total other comprehensive loss recognized during the year |
$ | (1,468 | ) | $ | (443 | ) | ||
The entire difference between the actual and expected return on Plan assets is reflected as a component of unrecognized actuarial net gain or loss.
73
Table of Contents
Amounts recognized in the accompanying Consolidated Balance Sheets consisted of:
| December 31, | ||||||||
| (in thousands) |
2009 | 2008 | ||||||
| Current liabilities - other |
$ | (2,500 | ) | $ | (2,500 | ) | ||
| Deferred credits and other liabilities - pension and other postretirement liability |
(276,366 | ) | (349,182 | ) | ||||
| $ | (278,866 | ) | $ | (351,682 | ) | |||
| Amounts not yet reflected in net periodic benefit cost and included in AOCI and regulatory asset: |
||||||||
| Prior service credit |
$ | 1,992 | $ | 2,698 | ||||
| Accumulated actuarial loss |
(660,840 | ) | (688,885 | ) | ||||
| Cumulative employer contributions in excess of net periodic benefit cost |
379,982 | 334,505 | ||||||
| Net unrecognized periodic pension benefit cost reflected on the accompanying Consolidated Balance Sheets |
$ | (278,866 | ) | $ | (351,682 | ) | ||
The estimated prior service credit and net actuarial loss that will be amortized from AOCI and regulatory assets into net periodic benefit cost in 2010 are $708,000 and $50.9 million, respectively.
The accumulated benefit obligation for the qualified pension plan as of December 31, 2009 and 2008 were $1,035.4 million and $969.6 million, respectively.
The projected benefit obligation, accumulated benefit obligation and fair value of plan assets for the non-qualified retirement plan were $49.2 million, $45 million, and $0, respectively, as of December 31, 2009 and were $46 million, $42.1 million, and $0, respectively, as of December 31, 2008.
Weighted average assumptions were as follows:
| 2009 | 2008 | 2007 | |||||||
| Discount rate at the end of the year |
5.85 | % | 6.25 | % | 6.25 | % | |||
| Expected return on Plan assets for the year |
9.0 | % | 9.0 | % | 9.0 | % | |||
| Rate of compensation increase at the end of the year |
4.0 | % | 4.0 | % | 4.0 | % |
The Plans’ discount rates are based on a rate modeling of a bond portfolio that approximates the Plan liabilities. The Plans’ expected long-term rates of return are based on past performance and economic forecasts for the types of investments held in the Plans as well as the target allocation of the investments over a long-term period. Actuarial assumptions also include an assumed rate for administrative expenses and investment expenses, which have averaged approximately 0.6% for 2009, 2008, and 2007.
Components of net periodic benefit cost were as follows:
| Years ended December 31, | ||||||||||||
| (in thousands) |
2009 | 2008 | 2007 | |||||||||
| Service cost |
$ | 22,147 | $ | 21,273 | $ | 21,530 | ||||||
| Interest cost |
64,316 | 63,642 | 62,154 | |||||||||
| Expected return on Plan assets |
(58,120 | ) | (86,278 | ) | (83,434 | ) | ||||||
| Amortization of prior service (credit) cost |
(706 | ) | 20 | 20 | ||||||||
| Recognized actuarial loss |
54,236 | 16,199 | 21,133 | |||||||||
| Net periodic benefit cost |
$ | 81,873 | $ | 14,856 | $ | 21,403 | ||||||
Employer contributions in 2009 of $125 million were made to the qualified plan and $2.4 million of contributions in the form of benefit payments to the non-qualified plan. NSTAR anticipates making contributions to its qualified Pension Plan in 2010 of approximately $25 million.
74
Table of Contents
The estimated benefit payments for the next 10 years are as follows:
| (in thousands) |
|||
| 2010 |
$ | 70,386 | |
| 2011 |
74,521 | ||
| 2012 |
78,362 | ||
| 2013 |
74,535 | ||
| 2014 |
75,907 | ||
| 2015 - 2019 |
398,583 | ||
| Total |
$ | 772,294 | |
2. Postretirement Benefits Other than Pension (PBOP)
NSTAR provides health care and other benefits to retired employees who meet certain age and years of service eligibility requirements. Under certain circumstances, eligible retirees are required to contribute to the costs of postretirement benefits. Postretirement benefits provided to employees of the discontinued operations of MATEP are not included in the following disclosures. The benefit obligation related to the discontinued operations amounted to $7.2 million and $6.2 million at December 31, 2009 and 2008, respectively.
NSTAR’s other postretirement benefits are not vested and the Company has the right to modify any benefit provision, including contribution requirements, with respect to any current or former employee, dependent or beneficiary.
NSTAR provides prescription drug benefits to retirees that are at least actuarially equivalent to the benefits provided under Medicare Part D. NSTAR receives subsidies to provide prescription drug programs for eligible former employees age 65 and over, in the form of direct tax-exempt cash payments. The subsidy reduces service cost and interest cost when it is recognized as a component of net periodic postretirement benefits cost, and it reduced NSTAR’s net periodic postretirement benefit cost by approximately $7.6 million and $12 million in 2009 and 2008, respectively. However, as a result of the PAM, these reductions do not have a material impact on reported earnings.
NSTAR’s PBOP plan uses December 31st for the measurement date to determine its benefit obligation and fair value of plan assets for the purposes of determining the plan’s funded status and the net periodic benefit costs for the following year.
The following tables for NSTAR’s PBOP plan presents the change in benefit obligation, change in the plan’s assets, the funded status, the components of net periodic benefit cost and key assumptions used for continuing operations:
| Years ended December 31, | ||||||||
| (in thousands) |
2009 | 2008 | ||||||
| Change in benefit obligation: |
||||||||
| Benefit obligation, beginning of the year |
$ | 622,808 | $ | 590,170 | ||||
| Service cost |
5,861 | 5,608 | ||||||
| Interest cost |
35,744 | 35,940 | ||||||
| Plan participants’ contributions |
2,578 | 2,839 | ||||||
| Actuarial (gain)/loss |
(5,634 | ) | 17,995 | |||||
| Benefits paid |
(31,752 | ) | (32,173 | ) | ||||
| Federal subsidy |
2,290 | 2,429 | ||||||
| Benefit obligation, end of the year |
$ | 631,895 | $ | 622,808 | ||||
75
Table of Contents
| Years ended December 31, | ||||||||
| (in thousands) |
2009 | 2008 | ||||||
| Change in the plan’s assets: |
||||||||
| Fair value of the plan’s assets, beginning of the year |
$ | 228,418 | $ | 360,188 | ||||
| Actual return on plan’s assets |
53,541 | (117,436 | ) | |||||
| Employer contribution |
30,000 | 15,000 | ||||||
| Plan participants’ contributions |
2,578 | 2,839 | ||||||
| Benefits paid |
(31,752 | ) | (32,173 | ) | ||||
| Fair value of the plan’s assets, end of the year |
$ | 282,785 | $ | 228,418 | ||||
The plan’s funded status was as follows:
| Years ended December 31, | ||||||||
| (in thousands) |
2009 | 2008 | ||||||
| Funded status, end of year - under funded |
$ | (349,110 | ) | $ | (394,390 | ) | ||
| Amounts recognized in the accompanying Consolidated Balance Sheet: |
||||||||
| Deferred credits - pension and other postretirement liabilities |
$ | (349,110 | ) | $ | (394,390 | ) | ||
| Years ended December 31, | ||||||||
| 2009 | 2008 | |||||||
| Amounts not yet reflected in net periodic benefit cost and included in AOCI and regulatory assets: |
||||||||
| Transition obligation |
$ | (2,443 | ) | $ | (3,254 | ) | ||
| Prior service credit |
9,088 | 10,560 | ||||||
| Accumulated actuarial loss |
(251,752 | ) | (312,196 | ) | ||||
| Cumulative net periodic benefit costs in excess of employee contributions |
(104,003 | ) | (89,500 | ) | ||||
| Net amount recognized in statement of financial position |
$ | (349,110 | ) | $ | (394,390 | ) | ||
Source of change in other comprehensive income:
| Years ended December 31, | ||||||||
| (in thousands) |
2009 | 2008 | ||||||
| Net loss arising during period |
$ | (41 | ) | $ | (1,237 | ) | ||
| Amortization: |
||||||||
| Transition obligation |
6 | 5 | ||||||
| Prior service credit |
15 | (105 | ) | |||||
| Actuarial loss |
205 | 195 | ||||||
| Total other comprehensive gain (loss) recognized during the year |
$ | 185 | $ | (1,142 | ) | |||
The estimated transition obligation, prior service credit and net actuarial loss that will be amortized from AOCI and regulatory assets into net periodic benefit costs in 2010 are $0.8 million, $1.5 million, and $19.2 million, respectively.
Weighted average assumptions were as follows:
| 2009 | 2008 | 2007 | |||||||
| Discount rate at the end of the year |
6.00 | % | 6.10 | % | 6.25 | % | |||
| Expected return on the plans’ assets for the year |
9.0 | % | 9.0 | % | 9.0 | % |
76
Table of Contents
For measurement purposes, an 8.0% weighted annual rate increase in per capita cost of covered medical claims was assumed for 2009. This rate is assumed to decrease gradually to 5% in 2015 and remain at that level thereafter. Dental claims are assumed to increase at a weighted annual rate of 4%.
A 1% change in the assumed health care cost trend rate would have the following effects:
| One-Percentage-Point | |||||||
| (in thousands) |
Increase | Decrease | |||||
| Effect on total service and interest cost components for 2009 |
$ | 6,633 | $ | (5,269 | ) | ||
| Effect on December 31, 2009 postretirement benefit obligation |
$ | 88,270 | $ | (72,046 | ) | ||
Components of net periodic benefit cost were as follows:
| Years ended December 31, | ||||||||||||
| (in thousands) |
2009 | 2008 | 2007 | |||||||||
| Service cost |
$ | 5,861 | $ | 5,608 | $ | 5,547 | ||||||
| Interest cost |
35,744 | 35,940 | 35,312 | |||||||||
| Expected return on plan’s assets |
(17,940 | ) | (28,482 | ) | (28,186 | ) | ||||||
| Amortization of prior service cost |
(1,472 | ) | (1,472 | ) | (1,472 | ) | ||||||
| Amortization of transition obligation |
811 | 811 | 812 | |||||||||
| Recognized actuarial loss |
19,209 | 8,776 | 10,952 | |||||||||
| Net periodic benefit cost |
$ | 42,213 | $ | 21,181 | $ | 22,965 | ||||||
NSTAR anticipates making contribution of approximately $35 million to its other postretirement benefit plan in 2010.
The estimated future cash flows for the years after 2009 are as follows:
| (in thousands) |
Gross estimated benefit payments |
Estimated expected cash inflows from Medicare subsidy | ||||
| 2010 |
$ | 32,245 | $ | 2,102 | ||
| 2011 |
34,041 | 2,231 | ||||
| 2012 |
35,109 | 2,399 | ||||
| 2013 |
36,570 | 2,543 | ||||
| 2014 |
37,876 | 2,693 | ||||
| 2015 - 2019 |
213,213 | 14,703 | ||||
| Total |
$ | 389,054 | $ | 26,671 | ||
3. Pension and PBOP Plan Assets
Investment objectives:
The primary investment goal of the Pension Plan is to achieve a total annualized return of 9% (before expenses) over the long-term. Risk is regularly evaluated, compared and benchmarked to plans with a similar investment strategy. The Plan also attempts to minimize risk by not having any single security or class of securities with a disproportionate impact on the Plan. NSTAR currently uses over 20 asset managers to manage its plans’ assets. As a guideline, assets are diversified by asset classes (Equity, Fixed Income, Real Estate, Alternative Investments) and within these classes (i.e., economic sector, industry), such that, for each asset manager:
| • | No more than 6% of an asset manager’s equity portfolio market value may be invested in one company |
| • | Each equity portfolio should be invested in at least 20 different companies in different industries |
77
Table of Contents
| • | No more than 50% of each equity portfolio’s market value may be invested in one industry sector, and |
| • | No more than 5% of a fixed income manager’s portfolio may be invested in the security of an issuer, except the U.S. Government and its agencies. |
The PBOP Plan’s primary investment goal is to earn returns comparable to peers and appropriate benchmarks.
Investment Valuation of Pension and PBOP Assets:
Investments stated at fair value as determined by quoted market prices for identical assets (Level 1) include:
| • | Shares of registered investment companies valued at fair value as determined by quoted market prices, based upon net asset value (NAV) |
| • | Domestic and foreign common equity securities and real estate investment trusts valued using quoted market prices of a national securities exchange |
| • | U.S. Government securities valued on an active trading market |
| • | Futures contracts valued at the last settlement price at the end of each day on the exchange upon which they are traded |
Investments stated at estimated fair value using significant observable inputs (Level 2) include:
| • | Interest bearing cash in an institutional short-term investment vehicle valued daily |
| • | Fixed income investments consisting of domestic and foreign corporate bonds, collateralized mortgage obligations and other securitized vehicles are valued on the basis of valuations furnished by a pricing service, which determines valuations using methods based on market transactions for comparable securities and various relationships between securities, which are generally recognized by institutional traders |
| • | Domestic preferred equity securities valued by a pricing service |
| • | Common/collective trusts valued at NAV without adjustment |
Investments valued at estimated fair value using significant unobservable inputs (Level 3) include:
| • | Hedge funds and limited partnerships valued at NAV without adjustment. |
| • | An immediate participation guarantee contract with an insurance company stated at contract value, which approximates fair value. |
Significant Investment Risks of Level 3 Investments:
Certain real estate limited partnerships have long-term lock-up provisions (7-10 years) that are intended to allow for an orderly investment and dissolution of the partnership as the underlying properties are sold. Certain hedge funds have instituted temporary redemption restrictions as of December 31, 2009. Others have monthly, quarterly or annual restraints on redemptions or may require advance notice for a redemption. Management does not believe that these liquidity restrictions impair the Plan’s ability to transact redemptions at NAV, which the Plans utilize for fair value for those investments.
The Pension Plan also had $59 million of unfunded investment commitments to real estate limited partnerships at December 31, 2009. These commitments must be fulfilled by June 2012.
78
Table of Contents
The fair value of NSTAR’s Pension Plan assets at December 31, 2009 by asset category, are as follows:
| (in millions) |
Total | Fair Value Measurements at December 31, 2009 |
||||||||||||||
| Active Market Prices (Level 1) |
Significant Observable Inputs (Level 2) |
Significant Unobservable Inputs (Level 3) |
||||||||||||||
| Asset category |
||||||||||||||||
| Equity securities (37% of total): |
||||||||||||||||
| Domestic – common and preferred |
$ | 71 | $ | 70 | $ | 1 | $ | — | ||||||||
| Foreign – common |
33 | 33 | — | — | ||||||||||||
| Common/collective trusts |
189 | — | 189 | — | ||||||||||||
| Hedge funds |
41 | — | — | 41 | ||||||||||||
| Total equity securities |
334 | 103 | 190 | 41 | ||||||||||||
| Fixed income securities (31% of total): |
||||||||||||||||
| Domestic and foreign corporate bonds |
88 | — | 88 | — | ||||||||||||
| Interest bearing cash |
27 | — | 27 | — | ||||||||||||
| Common/collective trusts |
86 | — | 86 | — | ||||||||||||
| Registered investment companies |
80 | 52 | 28 | — | ||||||||||||
| Guaranteed investment contract |
4 | — | — | 4 | ||||||||||||
| Total fixed income securities |
285 | 52 | 229 | 4 | ||||||||||||
| Real estate investments (9% of total): |
||||||||||||||||
| Real estate investment trusts |
1 | 1 | — | — | ||||||||||||
| Common/collective trusts |
7 | — | 7 | — | ||||||||||||
| Limited partnerships |
78 | — | — | 78 | ||||||||||||
| Hedge funds |
3 | — | — | 3 | ||||||||||||
| Total real estate |
89 | 1 | 7 | 81 | ||||||||||||
| Alternative investments (23% of total): |
||||||||||||||||
| Hedge funds |
215 | — | — | 215 | ||||||||||||
| Total alternative investments |
215 | — | — | 215 | ||||||||||||
| Total (prior to 401(h) allocation) |
923 | 156 | 426 | 341 | ||||||||||||
| Allocation of 401(h) account |
(61 | ) | (10 | ) | (28 | ) | (23 | ) | ||||||||
| Net assets of Pension Plan |
$ | 862 | $ | 146 | $ | 398 | $ | 318 | ||||||||
The assets of NSTAR’s Pension Plan include a 401(h) account that has been allocated to provide health and welfare postretirement benefits under the PBOP Plan. The Pension Plan 401(h) account is a subset of the Pension Plan assets and is not reflected as a component of the Pension Plan net assets.
The following reflects the weighted average asset allocation percentage of the fair value of the Pension Plan’s assets for each major type of asset as of December 31st as well as the targeted ranges:
| Asset Category |
Plan Assets | Target Ranges |
Typical Benchmark | ||||||||
| 2009 | 2008 | ||||||||||
| Equity securities |
37 | % | 29 | % | 20% - 40 | % | MSCI ACWI | ||||
| Debt securities |
31 | 28 | 20% - 40 | % | Barclays Aggregate | ||||||
| Real Estate |
9 | 20 | 10% - 20 | % | NCREIF Property Index | ||||||
| Alternative |
23 | 23 | 20% - 30 | % | HFRI Fund of Funds Composite Index | ||||||
| Total |
100 | % | 100 | % | |||||||
79
Table of Contents
| (in millions) |
Fair Value Measurements Using Significant Unobservable Inputs (Level 3) |
||||||||||||||
| Hedge Funds |
Limited Partnerships |
Guaranteed Investment Contract |
Total | ||||||||||||
| Beginning balance at December 31, 2008 |
$ | 289 | $ | 163 | $ | 4 | $ | 456 | |||||||
| Actual return on plan assets: |
|||||||||||||||
| Relating to assets still held at the reporting date |
74 | (34 | ) | — | 40 | ||||||||||
| Relating to assets sold during the period |
(17 | ) | (2 | ) | — | (19 | ) | ||||||||
| Purchases, sales, and settlements |
(87 | ) | (49 | ) | — | (136 | ) | ||||||||
| Transfers in and/or out of Level 3 |
— | — | — | — | |||||||||||
| Ending balance at December 31, 2009 |
$ | 259 | $ | 78 | $ | 4 | $ | 341 | |||||||
The fair values of NSTAR’s PBOP Plan assets at December 2009 by asset category, are as follows:
| (in millions) |
Total | Fair Value Measurements at December 31, 2009 | ||||||||||
| Active Market Prices (Level 1) |
Significant Observable Inputs (Level 2) |
Significant Unobservable Inputs (Level 3) | ||||||||||
| Asset Category |
||||||||||||
| Equity securities (50% of total): |
||||||||||||
| Foreign - common |
$ | 24 | $ | 24 | $ | — | $ | — | ||||
| Registered investment companies |
1 | 1 | — | — | ||||||||
| Common/collective trusts |
70 | — | 70 | — | ||||||||
| Limited partnerships |
16 | — | — | 16 | ||||||||
| Total equity securities |
111 | 25 | 70 | 16 | ||||||||
| Fixed income securities (34% of total): |
||||||||||||
| U.S. Government securities |
1 | 1 | — | — | ||||||||
| Interest bearing cash |
7 | — | 7 | — | ||||||||
| Common/collective trusts |
40 | — | 40 | — | ||||||||
| Domestic corporate bonds |
27 | — | 27 | — | ||||||||
| Asset backed securities |
2 | — | — | 2 | ||||||||
| Total fixed income securities |
77 | 1 | 74 | 2 | ||||||||
| Real estate investments (7% of total): |
||||||||||||
| Limited partnerships |
14 | — | — | 14 | ||||||||
| Total real estate |
14 | — | — | 14 | ||||||||
| Alternative investments (9% of total): |
||||||||||||
| Hedge funds |
20 | — | — | 20 | ||||||||
| Total alternative investments |
20 | — | — | 20 | ||||||||
| Total (prior to 401(h) allocation) |
$ | 222 | $ | 26 | $ | 144 | $ | 52 | ||||
| Allocation of 401(h) account |
61 | 10 | 28 | 23 | ||||||||
| Net assets of PBOP Plan |
$ | 283 | $ | 36 | $ | 172 | $ | 75 | ||||
80
Table of Contents
The following reflects the weighted average asset allocation percentages of the fair value of the PBOP Plan assets for each major type of assets as of December 31st as well as the targeted ranges:
| Asset Category |
Plan Assets | Target Ranges |
Typical Benchmark | ||||||||
| 2009 | 2008 | ||||||||||
| Equity securities |
50 | % | 38 | % | 40% - 60 | % | MSCI ACWI | ||||
| Debt securities |
34 | 29 | 25% - 35 | % | Barclays Aggregate | ||||||
| Real Estate |
7 | 16 | 5% - 15 | % | NCREIF Property Index | ||||||
| Alternative |
9 | 17 | 5% - 15 | % | HFRI Fund of Funds Composite Index | ||||||
| Total |
100 | % | 100 | % | |||||||
| (in millions) |
Fair Value Measurements Using Significant Unobservable Inputs (Level 3) |
||||||||||||||||||
| Hedge Funds |
Corporate Bonds |
Limited Partnerships |
Asset Backed Securities |
Total | |||||||||||||||
| Beginning balance at December 31, 2008 |
$ | 25 | $ | 1 | $ | 62 | $ | 1 | $ | 89 | |||||||||
| Actual return on plan assets: |
|||||||||||||||||||
| Relating to assets still held at the reporting date |
3 | — | 10 | — | 13 | ||||||||||||||
| Relating to assets sold during the period |
— | — | (1 | ) | — | (1 | ) | ||||||||||||
| Purchases, sales, and settlements |
(8 | ) | (1 | ) | (41 | ) | 1 | (49 | ) | ||||||||||
| Transfers in and/or out of Level 3 |
— | — | — | — | — | ||||||||||||||
| Ending balance at December 31, 2009 |
$ | 20 | $ | — | $ | 30 | $ | 2 | $ | 52 | |||||||||
4. Savings Plan
NSTAR also provides a defined contribution 401(k) plan for substantially all employees. Matching contributions (which are equal to 50% of the employees’ deferral up to 8% of eligible base and cash incentive compensation subject to statutory limits) included in the accompanying Consolidated Statements of Income amounted to $9.3 million, $9.4 million, and $8.9 million in 2009, 2008, and 2007, respectively. The election available to participants to reinvest dividends paid on the NSTAR Common Share Fund or receive the dividends in cash is subject to a freeze period beginning seven days prior to the date any dividend is paid. During this period, participants cannot change their election. NSTAR dividends are paid to this plan four times a year in February, May, August, and November.
Note I. Stock-Based Compensation
The NSTAR 2007 Long Term Incentive Plan (the 2007 Plan) permits a variety of stock and stock-based awards, including stock options, deferred stock awards, and performance share units granted to key employees. The aggregate number of common shares that are available for award under the 2007 Plan is 3.5 million. The Plan limits the terms of awards to ten years and prohibits the granting of awards beyond ten years after its effective date. In general, stock options and deferred shares vest over a three-year period from date of grants. Performance share units vest only at the end of a three year performance period if performance conditions are met. The Executive Personnel Committee (EPC) of the Board of Trustees approves stock-based awards for all executives and other key employees. However, the Chief Executive Officer’s (CEO) award must also be approved by the independent members of the Board of Trustees. The EPC and Board of Trustees established that the date of grant for annual stock-based awards under the Plan is the date each year on which the Board of Trustees approves the CEO’s stock award. This date is when all participants are notified of their awards. Options are granted at the full market price of the common shares on the date of grant. The aggregate remaining number of common shares available for award under the Plan as of December 31, 2009 is 1,928,263.
81
Table of Contents
Stock-based compensation activities of the Plans were as follows:
Stock Options:
| 2009 Activity |
2009 Weighted Average Exercise Price |
2008 Activity |
2008 Weighted Average Exercise Price | |||||||||
| Options outstanding at January 1 |
2,327,034 | $ | 28.71 | 2,234,202 | $ | 28.06 | ||||||
| Options granted |
352,000 | $ | 34.02 | 329,000 | $ | 32.45 | ||||||
| Options exercised |
(180,667 | ) | $ | 25.08 | (185,334 | ) | $ | 26.15 | ||||
| Options forfeited |
(44,000 | ) | $ | 34.67 | (50,834 | ) | $ | 33.82 | ||||
| Options outstanding at December 31 |
2,454,367 | $ | 29.63 | 2,327,034 | $ | 28.71 | ||||||
Summarized information regarding stock options outstanding at December 31, 2009:
| Exercise Prices |
Options Outstanding | Options Exercisable (Vested) | ||||||||||||||||||
| Number Outstanding |
Weighted Average Remaining Contractual Life (Years) |
Weighted Average Exercise Price |
Aggregate Intrinsic Value (000’s) |
Number Exercisable |
Weighted Average Remaining Contractual Life (Years) |
Weighted Average Exercise Price |
Aggregate Intrinsic Value (000’s) | |||||||||||||
| $22.19 |
4,200 | 0.40 | $ | 22.19 | $ | 61 | 4,200 | 0.40 | $ | 22.19 | $ | 61 | ||||||||
| $22.67 |
42,000 | 2.30 | $ | 22.67 | $ | 594 | 42,000 | 2.30 | $ | 22.67 | $ | 594 | ||||||||
| $21.60 |
267,000 | 3.33 | $ | 21.60 | $ | 4,058 | 267,000 | 3.33 | $ | 21.60 | $ | 4,058 | ||||||||
| $24.21 |
351,000 | 4.33 | $ | 24.21 | $ | 4,421 | 351,000 | 4.33 | $ | 24.21 | $ | 4,421 | ||||||||
| $29.60 |
414,667 | 5.44 | $ | 29.60 | $ | 2,986 | 414,667 | 5.44 | $ | 29.60 | $ | 2,986 | ||||||||
| $27.73 |
364,000 | 6.32 | $ | 27.73 | $ | 3,301 | 364,000 | 6.32 | $ | 27.73 | $ | 3,301 | ||||||||
| $36.89 |
380,500 | 7.34 | $ | 36.89 | — | 241,240 | 7.34 | $ | 36.89 | — | ||||||||||
| $32.45 |
293,000 | 8.08 | $ | 32.45 | $ | 1,275 | 72,570 | 8.08 | $ | 32.45 | $ | 316 | ||||||||
| $34.02 |
338,000 | 9.08 | $ | 34.02 | $ | 940 | — | — | — | — | ||||||||||
| 2,454,367 | 6.23 | $ | 29.63 | $ | 17,636 | 1,756,677 | 5.36 | $ | 27.85 | $ | 15,737 | |||||||||
There were 1,756,677, 1,567,304, and 1,287,092, stock options exercisable as of December 31, 2009, 2008, and 2007, respectively. As of December 31, 2009, 2008, and 2007, the associated weighted average exercise price of these exercisable options is $27.85, $26.59, and $22.38, respectively. The total intrinsic value (the market price of the common shares on the date exercised, less the option exercise prices) of options exercised during the years ended December 31, 2009, 2008, and 2007 was $1.4 million, $1.4 million, and $5.3 million, respectively.
The stock options granted in 2009, 2008 and 2007 have a grant date fair value of $3.64, $3.76, and $4.79, respectively. The fair value was estimated using the Black-Scholes option-pricing model that uses the assumptions in the table below. The expected option lives are based on the average historical time frame that options are expected to remain unexercised. Expected volatilities are based on the historical performance of NSTAR’s stock price. The risk-free interest rate is based on the U.S. Treasury Strip in effect on grant date. The fair values were computed using the following range of assumptions for NSTAR’s stock options for the years ended December 31:
| 2009 | 2008 | 2007 | |||||||
| Expected life (years) |
6.0 | 6.0 | 6.0 | ||||||
| Risk-free interest rate |
1.89 | % | 3.17 | % | 4.56 | % | |||
| Volatility |
20.0 | % | 16.4 | % | 14.6 | % | |||
| Dividends |
4.43 | % | 3.81 | % | 3.85 | % |
82
Table of Contents
Deferred Shares:
| 2009 Activity |
2009 Weighted Average Grant Date Fair Value Price |
2008 Activity |
2008 Weighted Average Grant Date Fair Value Price | |||||||||
| Nonvested deferred shares at January 1 |
463,213 | $ | 31.76 | 544,063 | $ | 31.39 | ||||||
| Deferred shares granted |
134,050 | $ | 34.02 | 125,250 | $ | 32.45 | ||||||
| Deferred shares vested |
(328,174 | ) | $ | 30.72 | (187,934 | ) | $ | 31.02 | ||||
| Deferred shares forfeited |
(10,067 | ) | $ | 34.17 | (18,166 | ) | $ | 33.06 | ||||
| Nonvested deferred shares at December 31 |
259,022 | $ | 34.15 | 463,213 | $ | 31.76 | ||||||
The fair value of deferred shares vested during 2009 and 2008 was $10.3 million and $6.2 million, respectively.
Performance Share Units:
| 2009 Activity |
Weighted Average Grant Date Fair Value Price |
2008 Activity |
Weighted Average Grant Date Fair Value Price | |||||||||
| Performance share units at January 1 |
67,137 | $ | 32.70 | — | $ | — | ||||||
| Performance share units granted |
78,750 | $ | 33.85 | 70,350 | $ | 32.70 | ||||||
| Performance share units vested |
— | $ | — | — | $ | — | ||||||
| Performance share units forfeited |
(3,741 | ) | $ | 33.47 | (3,213 | ) | $ | 32.70 | ||||
| Nonvested performance share units outstanding at December 31 |
142,146 | $ | 33.32 | 67,137 | $ | 32.70 | ||||||
Performance share unit awards under the 2007 Plan contain performance criteria that affect the number of shares that ultimately vest. Restrictions on performance share unit awards lapse after a three-year period contingent on achievement of certain earnings growth performance measures. These awards grant the right to receive, at the end of the performance period, a variable number of shares based on the level of NSTAR’s earnings growth and a total shareholder return that is compared to companies in the EEI Index. This variable range extends from 0% to 170% of the granted awards. The 2009 and 2008 performance awards grant date fair values were estimated to be $33.85 and $32.70, respectively for the targeted performance levels using a binomial option-pricing model.
Management evaluates the probability of meeting the performance criteria at each balance sheet date and related compensation cost is amortized over the performance period on a straight-line basis. If the performance is not achieved, no compensation cost is recognized and any previously recognized compensation cost is reversed. No performance share units vested during 2009.
Total Stock-Based Compensation
As of December 31, 2009, the total stock-based compensation cost related to nonvested stock options, deferred share awards and performance share units not yet recognized was $9 million. The remaining weighted average period over which total stock-based compensation will be recognized is 1.65 years.
Total stock-based compensation cost recognized in the accompanying Consolidated Statements of Income in 2009, 2008 and 2007 was $8.5 million, $9.7 million, and $8.9 million, respectively. Approximately $1.6 million, $1.9 million, and $1.7 million of costs related to stock options are included in the 2009, 2008 and 2007 stock-based compensation totals, respectively.
83
Table of Contents
2010 Awards
On January 28, 2010, NSTAR granted awards, under the terms of the 2007 Plan, of 289,000 stock options, 142,450 deferred shares, and 81,150 performance based share units to executives and senior managers.
Stock options, deferred shares and performance share units granted on January 28, 2010 have a grant date fair value of $4.87, $35.28 and $37.69, respectively. The grant date fair value of deferred shares and the exercise price of stock options are equal to the closing price of the Company’s common shares on January 28, 2010.
Note J. Capital Stock and Accumulated Other Comprehensive Income
NSTAR’s Board of Trustees declared dividends per common share of $1.525, $1.425, and $1.325 in 2009, 2008, and 2007, respectively.
Common Shares
Common share and accumulated other comprehensive income activity in 2009 and 2008 was as follows:
| (in thousands) |
Number of Shares |
Total Par Value |
Premium on Common Shares |
Accumulated Other Comprehensive Income |
|||||||||
| Balance at December 31, 2007 |
106,808 | $ | 106,808 | $ | 818,674 | $ | (12,593 | ) | |||||
| Continuing operations activities: |
|||||||||||||
| Equity compensation plans (Note I) |
— | — | (73 | ) | — | ||||||||
| Pension and postretirement benefit costs, net |
— | — | — | (900 | ) | ||||||||
| Total continuing operations activities |
— | — | (73 | ) | (900 | ) | |||||||
| Discontinued operations activity: |
|||||||||||||
| Postretirement benefit costs, net |
— | — | — | (32 | ) | ||||||||
| Total activity |
— | — | (73 | ) | (932 | ) | |||||||
| Balance at December 31, 2008 |
106,808 | 106,808 | 818,601 | (13,525 | ) | ||||||||
| Continuing operations activities: |
|||||||||||||
| Equity compensation plans (Note I) |
— | — | (5,111 | ) | — | ||||||||
| Pension and postretirement benefit costs, net |
— | — | — | (649 | ) | ||||||||
| Total continuing operations activities |
— | — | (5,111 | ) | (649 | ) | |||||||
| Discontinued operations activity: |
|||||||||||||
| Postretirement benefit costs, net |
— | — | — | (154 | ) | ||||||||
| Total activity |
— | — | (5,111 | ) | (803 | ) | |||||||
| Balance at December 31, 2009 |
106,808 | $ | 106,808 | $ | 813,490 | $ | (14,328 | ) | |||||
Cumulative Preferred Stock of Subsidiary
Non-mandatory redeemable series:
Par value $100 per share, 2,890,000 shares authorized and 430,000 shares issued and outstanding:
| (in thousands, except per share amounts) |
|||||||||||
| Series |
Current Shares Outstanding |
Redemption Price/ Share |
December 31, 2009 |
December 31, 2008 | |||||||
| 4.25% |
180,000 | $ | 103.625 | $ | 18,000 | $ | 18,000 | ||||
| 4.78% |
250,000 | $ | 102.80 | 25,000 | 25,000 | ||||||
| Total non-mandatory redeemable series |
$ | 43,000 | $ | 43,000 | |||||||
84
Table of Contents
NSTAR Electric has two outstanding series of non-mandatory redeemable preferred stock. Both series are part of a class of NSTAR Electric’s Cumulative Preferred Stock. Upon any liquidation of NSTAR Electric, holders of the Cumulative Preferred stock are entitled to receive the liquidation preference for their shares before any distribution to the holder of the common stock. The liquidation preference for each outstanding series of Cumulative Preferred Stock is equal to the par value ($100.00 per share), plus accrued and unpaid dividends.
Note K. Indebtedness
Long-Term Debt
NSTAR’s long-term debt consisted of the following:
| December 31, | ||||||||
| (in thousands) |
2009 | 2008 | ||||||
| Mortgage Bonds, collateralized by property of operating subsidiary: |
||||||||
| NSTAR Gas | ||||||||
| 7.04%, due September 2017 |
$ | 25,000 | $ | 25,000 | ||||
| 9.95%, due December 2020 |
25,000 | 25,000 | ||||||
| 7.11%, due December 2033 |
35,000 | 35,000 | ||||||
| NSTAR | ||||||||
| Notes: |
||||||||
| 8.0%, due February 2010 |
500,000 | 500,000 | ||||||
| Debentures: |
||||||||
| 4.50%, due November 2019 |
350,000 | — | ||||||
| NSTAR Electric | ||||||||
| Debentures: |
||||||||
| 7.80%, due May 2010 |
125,000 | 125,000 | ||||||
| 4.875%, due October 2012 |
400,000 | 400,000 | ||||||
| 4.875%, due April 2014 |
300,000 | 300,000 | ||||||
| 5.625%, due November 2017 |
400,000 | 300,000 | ||||||
| 5.75%, due March 2036 |
200,000 | 200,000 | ||||||
| Bonds: |
||||||||
| Massachusetts Industrial Finance Agency (MIFA) bonds |
||||||||
| 5.75%, due February 2014 |
15,000 | 15,000 | ||||||
| HEEC | ||||||||
| 7.375% Sewage facility revenue bonds, due through 2015 |
8,358 | 9,988 | ||||||
| Funding Companies | ||||||||
| Transition Property Securitization Certificates: |
||||||||
| 7.03%, due through March 2010 |
6,817 | 75,554 | ||||||
| 4.13%, due through September 2011 |
118,170 | 203,475 | ||||||
| 4.40%, due through September 2013 |
144,771 | 144,771 | ||||||
| 2,653,116 | 2,358,788 | |||||||
| Unamortized debt discount |
(7,528 | ) | (5,603 | ) | ||||
| Unamortized debt premium |
4,093 | — | ||||||
| Amounts due within one year |
(683,240 | ) | (93,268 | ) | ||||
| Total long-term debt |
$ | 1,966,441 | $ | 2,259,917 | ||||
The agreement to sell MATEP for approximately $320 million in cash allows NSTAR to retire MATEP’s outstanding long-term debt with a portion of the proceeds from sale. At December 31, 2009, $84.2 million net of
85
Table of Contents
unamortized debt discount was outstanding and not included in the table above. MATEP will continue to make required payments related to this debt in the period leading up to the sale closing date expected towards the end of the first quarter or early part of the second quarter of 2010.
Consistent with the recovery in utility rates, discounts, redemption premiums and related costs associated with the issuance and redemption of long-term debt of NSTAR Electric and NSTAR Gas are deferred and amortized as an addition to interest expense over the life of the original or replacement debt.
On August 9, 2007, NSTAR Electric received DPU approval to issue up to $400 million of long-term debt securities from time to time through December 31, 2008 and a registration statement on Form S-3 was filed with the SEC. On November 19, 2007, NSTAR Electric sold $300 million of ten-year fixed rate (5.625%) Debentures. On November 25, 2008, the DPU allowed NSTAR Electric to extend the period of its financing plan with additional time to issue the remaining $100 million in long-term debt securities to no later than December 31, 2009. On February 13, 2009, NSTAR Electric sold, at a premium, $100 million of fixed rate (5.625%) Debentures due November 15, 2017 (effective rate of 4.976%). The Debentures form a single series and are fungible with the Debentures issued on November 19, 2007. NSTAR Electric used the proceeds from the issuance of these securities to finance its capital expenditures, for repayment of short-term debt, and for general working capital purposes.
On April 6, 2009, the DPU approved NSTAR Electric’s new two-year financing plan to issue an additional $500 million in long-term debt securities. On October 9, 2009, in connection with this filing, NSTAR and NSTAR Electric filed a registration statement on Form S-3 with the SEC to issue debt securities from time to time in one or more series. On November 17, 2009, NSTAR sold, at a discount, $350 million of fixed rate (4.5%) Debentures due November 15, 2019. NSTAR used the proceeds from the issuance of these securities for the repayment of outstanding short-term debt balances and general working capital purposes.
The 5.75% tax-exempt unsecured MIFA bonds due 2014 are currently redeemable at par.
Sewage facility revenue bonds are tax-exempt, subject to annual mandatory sinking fund redemption requirements and mature through 2015. Scheduled redemptions of $1.65 million were made in 2009 and 2008. The interest rate of the bonds was 7.375% for both 2009 and 2008.
The Transition Property Securitization Certificates held by NSTAR Electric’s subsidiaries, BEC Funding LLC, BEC Funding II, LLC and CEC Funding, LLC (Funding companies), are each collaterized with separate securitized regulatory assets with combined balances of $281.1 million and $434 million as of December 31, 2009 and 2008, respectively. NSTAR Electric, as servicing agent for the Funding companies, collected $173.5 million and $179.9 million in 2009 and 2008, respectively. Funds collected from the companies’ respective customers are transferred to each Funding companies’ Trust on a daily basis. These Certificates are non-recourse to NSTAR Electric.
The aggregate principal amounts of NSTAR’s long-term debt (including securitization certificates and sinking fund requirements) due in the five years subsequent to 2009 are approximately $684 million in 2010, $86 million in 2011, $486 million in 2012, $46 million in 2013, $317 million in 2014 and $1.04 billion thereafter.
Financial Covenant Requirements and Lines of Credit
NSTAR and NSTAR Electric have no financial covenant requirements under their respective long-term debt arrangements. NSTAR Gas has financial covenant requirements including a minimum equity requirement under its long-term debt arrangements and was in compliance at December 31, 2009 and 2008. NSTAR’s long-term debt other than the secured debt of NSTAR Gas and the long-term debt of its discontinued operation subsidiary, MATEP, is unsecured.
NSTAR currently has a $175 million revolving credit agreement that expires December 31, 2012. At December 31, 2009 and 2008, there were no amounts outstanding under the revolving credit agreement. This credit facility serves as a backup to NSTAR’s $175 million commercial paper program that, at December 31,
86
Table of Contents
2009 and 2008, had zero and $175 million, respectively. Under the terms of the credit agreement, NSTAR is required to maintain a maximum total consolidated debt to total capitalization ratio of not greater than 65% at all times, excluding Transition Property Securitization Certificates, and excluding accumulated other comprehensive loss from common equity. Commitment fees must be paid on the total agreement amount. At December 31, 2009 and 2008, NSTAR was in full compliance with the aforementioned covenant as the ratios were 59.8% and 60.2%, respectively.
On April 6, 2009, the DPU approved NSTAR Electric’s new two-year financing plan to issue an additional $500 million in long-term debt securities. On October 9, 2009, in connection with this filing, NSTAR and NSTAR Electric filed a registration statement on Form S-3 with the SEC to issue debt securities from time to time in one or more series. NSTAR and NSTAR Electric may use the proceeds from the prospective issuance of these securities for the redemption or repayment of outstanding long-term debt and short-term debt balances and/or general working capital purposes.
NSTAR Electric has approval from the FERC to issue short-term debt securities from time to time on or before October 22, 2010, with maturity dates no later than October 21, 2011, in amounts such that the aggregate principal does not exceed $655 million at any one time. NSTAR Electric has a five-year, $450 million revolving credit agreement that expires December 31, 2012. However, unless NSTAR Electric receives necessary approvals from the DPU, the credit agreement will expire 364 days from the date of the first draw under the agreement. At December 31, 2009 and 2008, there were no amounts outstanding under the revolving credit agreement. This credit facility serves as backup to NSTAR Electric’s $450 million commercial paper program that had $341 million and $354.6 million outstanding balances at December 31, 2009 and 2008, respectively. Under the terms of the revolving credit agreement, NSTAR Electric is required to maintain a consolidated maximum total debt to capitalization ratio of not greater than 65% at all times, excluding Transition Property Securitization Certificates, and excluding accumulated other comprehensive loss from common equity. At December 31, 2009 and 2008, NSTAR Electric was in full compliance with its covenants in connection with its short-term credit facilities, as the ratios were 46.5% and 47.6%, respectively.
At December 31, 2009 and 2008, NSTAR Gas had a $100 million line of credit which is due to expire on December 10, 2010. As of December 31, 2009 and 2008, NSTAR Gas had zero and $53.3 million outstanding, respectively.
On November 9, 2009, NSTAR Gas received approval from the DPU to issue up to $125 million of long-term debt. On January 14, 2010, NSTAR Gas entered into a $125 million Bond Purchase Agreement with private investors on a 10-year First Mortgage Bond series at a coupon rate of 4.46%. Funding took place on January 28, 2010.
Historically, NSTAR and its subsidiaries have had a variety of external sources of financing available, as indicated above, at favorable rates and terms to finance its external cash requirements. However, the availability of such financing at favorable rates and terms depends heavily upon prevailing market conditions and NSTAR’s or its subsidiaries’ financial condition and credit ratings.
NSTAR’s goal is to maintain a capital structure that preserves an appropriate balance between debt and equity. Based on NSTAR’s key cash resources available as discussed above, management believes its liquidity and capital resources are sufficient to meet its current and projected requirements.
Interest rates on the outstanding short-term borrowings generally are money market rates and averaged 0.31% and 2.31% in 2009 and 2008, respectively. In aggregate, short-term borrowings totaled $341.0 million and $582.9 million at December 31, 2009 and 2008, respectively.
87
Table of Contents
Note L. Fair Value
Fair Value Measurements
NSTAR discloses fair value measurement pursuant to the application of an amended accounting standard that defines fair value, establishes a framework for measuring fair value in accordance with GAAP, and expands disclosures about fair value measurements. The Company prospectively adopted this new accounting guidance on January 1, 2008, with no impact to its results of operations, financial position, or cash flows.
NSTAR follows a fair value hierarchy that prioritizes the inputs used to determine fair value and requires the Company to classify assets and liabilities carried at fair value based on the observability of these inputs. The hierarchy gives the highest priority to unadjusted quoted prices in active markets for identical assets or liabilities and the lowest priority to unobservable inputs. The three levels of the fair value hierarchy are:
Level 1 - Unadjusted quoted prices available in active markets for identical assets or liabilities as of the reporting date. Financial assets utilizing Level 1 inputs include active exchange-traded equity securities.
Level 2 - Quoted prices available in active markets for similar assets or liabilities, quoted prices for identical or similar assets or liabilities in inactive markets, inputs other than quoted prices that are directly observable, and inputs derived principally from market data.
Level 3 - Unobservable inputs from objective sources. These inputs may be based on entity-specific inputs. Level 3 inputs include all inputs that do not meet the requirements of Level 1 or Level 2.
The following represents the fair value hierarchy of NSTAR’s financial assets and liabilities that were recognized at fair value on a recurring basis as of December 31, 2009. Financial assets and liabilities are classified based on the lowest level of input that is significant to the fair value measurement.
Recurring Fair Value Measures
| December 31, 2009 | |||||||||
| (in millions) |
Level 1 | Level 2 | Total | ||||||
| Assets: |
|||||||||
| Government Money Market Securities (a) |
$ | 147 | $ | — | $ | 147 | |||
| Deferred Compensation Assets (b) |
27 | — | 27 | ||||||
| Investments (b) |
12 | — | 12 | ||||||
| Total |
$ | 186 | $ | — | $ | 186 | |||
| Liabilities: |
|||||||||
| Gas Hedges (c) |
$ | — | $ | 2 | $ | 2 | |||
| Total |
$ | — | $ | 2 | $ | 2 | |||
| December 31, 2008 | |||||||||
| Level 1 | Level 2 | Total | |||||||
| Assets: |
|||||||||
| Government Money Market Securities (a) |
$ | 10 | $ | — | $ | 10 | |||
| Deferred Compensation Assets (b) |
27 | — | 27 | ||||||
| Investments (b) |
13 | — | 13 | ||||||
| Total |
$ | 50 | $ | — | $ | 50 | |||
| Liabilities: |
|||||||||
| Gas Hedges (c) |
$ | — | $ | 33 | $ | 33 | |||
| Total |
$ | — | $ | 33 | $ | 33 | |||
88
Table of Contents
| (a) - | Included in “Cash and cash equivalents” on the accompanying Consolidated Balance Sheets |
| (b) - | Included in “Other investments” on the accompanying Consolidated Balance Sheets |
| (c) - | Included in “Current liabilities: Power contract obligations” and “Deferred credits and other liabilities: Power contract obligations” on the accompanying Consolidated Balance Sheets |
Fair Value of Financial Instruments
The carrying amounts for cash and cash equivalents, net accounts receivable, other current assets, certain current liabilities, and notes payable as of December 31, 2009 and 2008, respectively, approximate fair value due to the short-term nature of these securities.
The fair values of long-term indebtedness (excluding notes payable) are based on the quoted market prices of similar issues. Carrying amounts and fair values as of December 31, 2009 and 2008 were as follows:
| (in thousands) |
2009 | 2008 | ||||||||||
| Carrying Amount |
Fair Value | Carrying Amount |
Fair Value | |||||||||
| Long-term indebtedness of continuing operations (including current maturities) |
$ | 2,649,681 | $ | 2,755,110 | $ | 2,353,185 | $ | 2,392,600 | ||||
| Indebtedness of discontinued operations |
$ | 84,163 | $ | 85,290 | $ | 88,515 | $ | 82,360 | ||||
Note M. Segment and Related Information
For the purpose of providing segment information, NSTAR’s principal operating segments, are its traditional core businesses of electric and natural gas retail transmission and distribution utilities that provide energy delivery services in 107 cities and towns in Massachusetts. The unregulated operating segment engages in business activities that include telecommunications and a liquefied natural gas service. Amounts related to discontinued operations have been excluded from the data presented. Amounts shown on the following table for 2009, 2008 and 2007 include the allocation of NSTAR’s (Holding Company) results of operations (primarily interest costs) and assets to each business segment, net of inter-company transactions that primarily consist of interest charges and investment assets, respectively. The allocation of Holding Company charges is based on an indirect allocation of the Holding Company’s investment relating to these various business segments.
89
Table of Contents
Financial data for the segments of continuing operations were as follows:
| (in thousands) |
2009 | 2008 | 2007 | ||||||
| Operating revenues |
|||||||||
| Electric utility operations |
$ | 2,551,581 | $ | 2,639,637 | $ | 2,562,850 | |||
| Gas utility operations |
482,136 | 553,680 | 560,478 | ||||||
| Unregulated operations |
16,327 | 15,004 | 12,757 | ||||||
| Consolidated total |
$ | 3,050,044 | $ | 3,208,321 | $ | 3,136,085 | |||
| Depreciation and amortization |
|||||||||
| Electric utility operations |
$ | 338,632 | $ | 339,236 | $ | 330,325 | |||
| Gas utility operations |
27,224 | 26,494 | 26,144 | ||||||
| Unregulated operations |
4,226 | 4,070 | 3,700 | ||||||
| Consolidated total |
$ | 370,082 | $ | 369,800 | $ | 360,169 | |||
| Equity income in investments accounted for by the equity method (a) |
|||||||||
| Electric utility operations |
$ | 891 | $ | 820 | $ | 1,495 | |||
| Interest charges |
|||||||||
| Electric utility operations |
$ | 113,895 | $ | 128,247 | $ | 137,693 | |||
| Gas utility operations |
14,475 | 16,170 | 21,676 | ||||||
| Unregulated operations |
266 | 273 | 402 | ||||||
| Consolidated total |
$ | 128,636 | $ | 144,690 | $ | 159,771 | |||
| Income tax expense |
|||||||||
| Electric utility operations |
$ | 131,475 | $ | 124,967 | $ | 117,432 | |||
| Gas utility operations |
12,043 | 11,946 | 9,547 | ||||||
| Unregulated operations |
3,398 | 3,832 | 2,180 | ||||||
| Consolidated total |
$ | 146,916 | $ | 140,745 | $ | 129,159 | |||
| Segment net income |
|||||||||
| Electric utility operations |
$ | 219,546 | $ | 201,220 | $ | 191,535 | |||
| Gas utility operations |
21,586 | 21,159 | 19,143 | ||||||
| Unregulated operations |
4,843 | 5,577 | 4,338 | ||||||
| Consolidated total |
$ | 245,975 | $ | 227,956 | $ | 215,016 | |||
| Expenditures for property |
|||||||||
| Electric utility operations |
$ | 319,461 | $ | 366,398 | $ | 320,234 | |||
| Gas utility operations |
54,332 | 46,399 | 30,647 | ||||||
| Unregulated operations |
1,371 | 2,189 | 1,274 | ||||||
| Consolidated total |
$ | 375,164 | $ | 414,986 | $ | 352,155 | |||
| Segment assets |
|||||||||
| Electric utility operations |
$ | 7,134,090 | $ | 7,216,520 | $ | 6,764,497 | |||
| Gas utility operations |
819,446 | 854,139 | 797,266 | ||||||
| Unregulated operations |
23,393 | 23,337 | 26,807 | ||||||
| Consolidated total |
$ | 7,976,929 | $ | 8,093,996 | $ | 7,588,570 | |||
| (a) | The equity income from equity investments is included in other income on the accompanying Consolidated Statements of Income. |
90
Table of Contents
Note N. Contracts for the Purchase of Energy
NSTAR Electric Purchase Power Agreements
As a Massachusetts distribution company, NSTAR Electric is required to obtain and resell power to retail customers through Basic Service for those who choose not to buy energy from a competitive energy supplier. Basic Service rates are reset every six months (every three months for large commercial and industrial customers). The price of Basic Service is intended to reflect the average competitive market price for power. For Basic Service power supply, NSTAR Electric makes periodic market solicitations consistent with DPU regulations. NSTAR Electric enters into short-term power purchase agreements to meet its Basic Service supply obligation, ranging in term from three to twelve months. NSTAR Electric fully recovers its payments to suppliers through DPU-approved rates billed to customers.
The Rate Settlement Agreement required NSTAR Electric to design a policy for the procurement of Basic Service supply for residential customers effective July 1, 2006, permitting NSTAR Electric to execute energy supply contracts for one, two and three-years procuring fifty, twenty-five and twenty-five percent, respectively, of its total energy load requirements for residential customers.
NSTAR Gas Firm Transportation and Storage Agreements
NSTAR Gas purchases transportation, storage, and balancing services from Tennessee Gas Pipeline Company and Algonquin Gas Transmission Company, as well as other upstream pipelines that transport gas from major producing regions in the U.S., Gulf of Mexico, and Canada to the final delivery points in the NSTAR Gas service area. NSTAR Gas purchases all of its natural gas supply from third-party vendors. Most of the supplies are purchased under a firm portfolio management contract with a term of one year, which has a maximum quantity of 139,606 MMBtu/day. NSTAR Gas has one multiple year contract, which is used for the purchase of its 4,500 Mmbtu/day of Canadian supplies.
NSTAR Gas has various contractual agreements covering the transportation of natural gas and underground natural gas storage facilities, which are recoverable from customers under the DPU-approved CGAC. Most contracts expire at various times from 2011 to 2017. One new 20-year contract was signed in 2009. NSTAR Gas’ firm contract demand charges associated with firm pipeline transportation and storage capacity contracts in 2009, 2008, and 2007 were approximately $54.4 million, $51.5 million, and $51.8 million, respectively. Refer to Note O, “Commitments and Contingencies,” “Energy Supply” section for NSTAR Gas’ firm contract demand charges at current rates under these contracts for the years after 2009.
Note O. Commitments and Contingencies
Service Quality Indicators
SQI are established performance benchmarks for certain identified measures of service quality relating to customer service and billing performance, safety and reliability and DPU Consumer Division statistics performance for all Massachusetts utilities. NSTAR Electric and NSTAR Gas are required to report annually to the DPU concerning their performance as to each measure and are subject to maximum penalties of up to two and one-half percent of total transmission and distribution revenues should performance fail to meet the applicable benchmarks.
NSTAR monitors its service quality continuously to determine if a liability has been triggered. If it is probable that a liability has been incurred and is estimable, a liability is accrued. Annually, each NSTAR utility subsidiary makes a service quality performance filing with the DPU. Any settlement or rate order that would result in a different liability level from what has been accrued would be adjusted in the period that the DPU issues an order determining the amount of any such liability.
91
Table of Contents
NSTAR Electric filed its 2007 Service Quality Reports with the DPU that demonstrated the Company achieved sufficient levels of service performance. On January 13, 2010 the DPU issued an order that approved the 2007 Service Quality Report that agreed performance levels were sufficient and no penalties were assessed.
Service Quality reports for both NSTAR Gas and NSTAR Electric for 2008 have been filed with the DPU. The NSTAR Gas report has been approved and the NSTAR Electric report is under review. Based on the reports no penalties were assessable for the performance year.
NSTAR Electric and NSTAR Gas service quality performance levels for 2009 were not in a penalty situation and the final performance reports are anticipated to be filed during the first quarter of 2010.
Contractual Commitments
Leases
NSTAR has leases for facilities and equipment, including agreements for use of transmission facilities of other providers. The estimated minimum rental commitments under non-cancellable operating leases for the years after 2009 are as follows:
| (in thousands) |
|||
| 2010 |
$ | 13,883 | |
| 2011 |
14,007 | ||
| 2012 |
13,130 | ||
| 2013 |
12,142 | ||
| 2014 |
8,755 | ||
| Years thereafter |
13,003 | ||
| Total lease commitments |
$ | 74,920 | |
The total expense for both leases and transmission agreements was $23.7 million in 2009, $26.7 million in 2008, and $24.7 million in 2007, net of capitalized expenses of $2.6 million in 2009, $2.6 million in 2008, and $2.4 million in 2007.
Transmission
As a member of ISO-NE, NSTAR Electric is subject to the terms and conditions of the ISO-NE tariff through February 1, 2012, as NSTAR Electric is obligated to remain a member through this period. NSTAR Electric must pay for regional network services through that period to support the pooled transmission facilities requirements of other New England transmission owners whose facilities are used by NSTAR Electric. These payments were $182.6 million, $134.6 million, and $130.2 million, in 2009, 2008, and 2007, respectively. NSTAR Electric must along with other transmission owners and market participants, fund a proportionate share of the RTO’s operating and capital expenditures.
Energy Commitments
NSTAR is currently recovering payments it is making to suppliers from its customers. NSTAR has financial and performance assurances and financial guarantees in place with those suppliers to protect NSTAR from risk in the unlikely event any of its suppliers encounter financial difficulties or fail to maintain an investment grade credit rating. This condition principally relates to NSTAR Electric’s energy supply contract to provide Basic Service to its customers. In connection with certain of these agreements, in the event NSTAR Electric should receive a credit rating below investment grade, it would be required to obtain certain financial commitments, including but not limited to, letters of credit. Refer to Note N, “Contracts for the Purchase of Energy” for a further discussion.
92
Table of Contents
The following represents NSTAR’s long-term energy related contractual commitments:
| (in millions) |
2010 | 2011 | 2012 | 2013 | 2014 | Years Thereafter |
Total | ||||||||||||||
| Electric capacity obligations |
$ | 2 | $ | 2 | $ | 2 | $ | 2 | $ | 3 | $ | 12 | $ | 23 | |||||||
| Gas transportation and storage obligations |
66 | 70 | 55 | 35 | 31 | 139 | 396 | ||||||||||||||
| Purchase power buy-out obligations |
140 | 75 | 32 | 27 | 31 | 41 | 346 | ||||||||||||||
| Electric interconnection agreement |
3 | 3 | 3 | 3 | 3 | 45 | 60 | ||||||||||||||
| $ | 211 | $ | 150 | $ | 92 | $ | 67 | $ | 68 | $ | 237 | $ | 825 | ||||||||
Electric capacity obligations represent remaining capacity costs of long-term contracts that reflect NSTAR Electric’s proportionate share of capital and fixed operating costs of certain generating units. These contracts expire in 2012 and 2019. In 2009 and 2008, these costs were attributed to 47.9 MW of capacity purchased. Energy costs are paid to generators based on a price per kWh actually received into NSTAR Electric’s distribution system and are in addition to the costs above.
Gas transportation and storage obligations represent agreements covering the transportation of natural gas and underground natural gas storage facilities that are recoverable from customers under the DPU-approved CGAC. These contracts expire at various times from 2011 through 2029.
Purchase power buy-out obligations represent the buy-out/restructuring agreements for contract termination costs that reduce the amount of above-market costs that NSTAR Electric will collect from its customers through its transition charges. These agreements require NSTAR Electric to make monthly payments through September, 2016.
The electric interconnection agreement relates to a single interconnection with a municipal utility for additional capacity into NSTAR Electric’s service territory.
Electric Equity Investments
NSTAR Electric has an equity investment of approximately 14.5% in two companies, NEH and NHH, that own and operate transmission facilities to import electricity from the Hydro-Quebec system in Canada. As an equity participant, NSTAR Electric is required to guarantee, in addition to its own share, the obligations of those participants who do not meet certain credit criteria. NEH and NHH have agreed to use their best efforts to limit their equity investment to 40% of their total capital during the time NEH and NHH have outstanding debt in their capital structure.
NSTAR Electric has an equity ownership of 14% in CY, 14% in YA, and 4% in MY, (collectively, the Yankee Companies). CY, YA and MY plant sites have been decommissioned in accordance with NRC procedures. Amended licenses continue to apply to the ISFSI’s where spent nuclear fuel is stored at these sites. CY, YA and MY remain responsible for the security and protection of the ISFSI and are required to maintain radiation monitoring programs at the sites.
The accounting for decommissioning and/or security or protection costs of these three decommissioned nuclear power plants involves estimates from Yankee Companies’ management and reflect total remaining costs of approximately $49 million to be incurred for CY, YA and MY. Changes in these estimates will not affect NSTAR’s results of operations or cash flows because these costs will be collected from customers through NSTAR Electric’s transition charge filings with the DPU.
Yankee Companies Spent Fuel Litigation
In October 2006, the U.S. Court of Federal Claims issued a judgment in a spent nuclear fuel litigation, of $34.2 million, $32.9 million, and $75.8 million for Connecticut Yankee Atomic Power Company (CY), Yankee Atomic Electric Company (YA), and Maine Yankee Atomic Power Company (MY), respectively. This judgment in favor
93
Table of Contents
of the Yankee Companies relates to the alleged failure of the Department of Energy (DOE) to provide for a permanent facility to store spent nuclear fuel for years prior to 2001 for CY and YA, and prior to 2002 for MY (DOE Phase I Damages). NSTAR Electric’s portion of the Phase I judgments amounts to $4.8 million, $4.6 million, and $3 million, respectively. On July 1, 2009, the Yankee Companies filed for additional damages related to the alleged failure of the DOE to provide for a permanent facility to store spent nuclear fuel for the years from January 2002 through December 2008 for CY and YA, and from January 2003 through December 2008 for MY (DOE Phase II Damages). This phase of the spent nuclear fuel litigation specifies damages in the amounts of $135.4 million, $86.1 million, and $43 million for CY, YA, and MY, respectively. Claim amounts applicable to NSTAR Electric are $19 million, $12 million, and $1.7 million, respectively.
NSTAR cannot predict the ultimate outcome of these pending decisions for trial, appeal or the potential subsequent complaints. However, should the Yankee Companies ultimately prevail, NSTAR Electric’s share of the proceeds received would be refunded to its customers.
Financial and Performance Guarantees
On a limited basis, NSTAR and certain of its subsidiaries may enter into agreements providing financial assurance to third parties. Such agreements include letters of credit, surety bonds, and other guarantees.
At December 31, 2009, outstanding guarantees totaled $28.5 million as follows:
| (in thousands) |
|||
| Letter of Credit |
$ | 5,560 | |
| Surety Bonds |
17,727 | ||
| Hydro-Quebec Guarantees |
5,203 | ||
| Total Guarantees |
$ | 28,490 | |
Letter of Credit
NSTAR has issued a $5.6 million letter of credit for the benefit of a third party, as trustee in connection with Advanced Energy System’s (AES) 6.924% Notes. The letter of credit is available if the subsidiary has insufficient funds to pay the debt service requirements. As of December 31, 2009, there have been no amounts drawn under its letter of credit. The letter of credit is to be cancelled and the related AES 6.924% Notes paid off at the time of the MATEP sale closing date expected towards the end of the first quarter or early part of the second quarter of 2010.
Surety Bonds
As of December 31, 2009, certain of NSTAR’s subsidiaries have purchased a total of $1.5 million of performance surety bonds for the purpose of obtaining licenses, permits and rights-of-way in various municipalities. In addition, NSTAR and certain of its subsidiaries have purchased approximately $16.2 million in workers’ compensation self-insurer bonds. These bonds support the guarantee by NSTAR and certain of its subsidiaries to the Commonwealth of Massachusetts, required as part of the Company’s workers’ compensation self-insurance program. NSTAR and certain of its subsidiaries have indemnity agreements to provide additional financial security to its bond company in the form of a contingent letter of credit to be triggered in the event of a downgrade in the future of NSTAR’s Senior Note rating to below BBB by S&P and/or to below Baa1 by Moody’s. These Indemnity Agreements cover both the performance surety bonds and workers’ compensation bonds.
Hydro-Quebec Guarantees
NSTAR Electric has issued approximately $5.2 million of residual value guarantees related to its equity interest in the Hydro-Quebec transmission companies, NEH and NHH.
94
Table of Contents
Management believes the likelihood that NSTAR would be required to perform or otherwise incur any significant losses associated with any of these guarantees is remote.
Environmental Matters
NSTAR subsidiaries face possible liabilities as a result of involvement in several multi-party disposal sites, state-regulated sites or third party claims associated with contamination remediation. NSTAR generally expects to have only a small percentage of the total potential liability for the majority of these sites. As of December 31, 2009 and 2008, NSTAR had liabilities of approximately $0.8 million for these environmental sites. This estimated recorded liability is based on an evaluation of all currently available facts with respect to these sites.
NSTAR Gas is participating in the assessment or remediation of certain former MGP sites and alleged MGP waste disposal sites to determine if and to what extent such sites have been contaminated and whether NSTAR Gas may be responsible to undertake remedial action. The DPU permits recovery of costs associated with MGP sites over a 7-year period, without carrying costs. As of December 31, 2009 and 2008, NSTAR had a liability of approximately $14 million and $13.3 million, respectively, as an estimate for site cleanup costs for several MGP sites for which NSTAR Gas was identified as a potentially responsible party. A corresponding regulatory asset was recorded that reflects the future rate recovery for these costs.
Estimates related to environmental remediation costs are reviewed and adjusted as further investigation and assignment of responsibility occurs and as either additional sites are identified or NSTAR’s responsibilities for such sites evolve or are resolved. NSTAR’s ultimate liability for future environmental remediation costs may vary from these estimates. Based on NSTAR’s current assessment of its environmental responsibilities, existing legal requirements, and regulatory policies, NSTAR does not believe that these environmental remediation costs will have a material adverse effect on NSTAR’s consolidated results of operations, financial position, or cash flows.
Regulatory and Legal Proceedings
DPU Rate Settlement Agreement
The DPU approved a seven-year Rate Settlement Agreement (Rate Settlement Agreement) between NSTAR, the AG, and several interveners. For 2006, the Rate Settlement Agreement required NSTAR Electric to lower its transition rates by $20 million, effective January 1, 2006, and by an additional $30 million, effective May 1, 2006, from what would otherwise have been billed in 2006. Effective May 1, 2006, NSTAR Electric increased its distribution rates by $30 million. Beginning January 1, 2007 and continuing through 2012, the Rate Settlement Agreement establishes annual inflation-adjusted distribution rate increases (SIP of 1.32%, 1.74%, 2.68%, and 2.64% effective January 1, 2010, 2009, 2008, and 2007, respectively). These increases are generally offset by an equal and corresponding reduction in transition rates. Uncollected transition charges as a result of the reductions in transition rates are deferred and collected through future rates with a carrying charge. The Rate Settlement Agreement implemented a 50% / 50% earnings sharing mechanism based on NSTAR Electric’s distribution return on equity (excluding incentives) should it exceed 12.5% or fall below 8.5%. Should the return on equity fall below 7.5%, NSTAR Electric may file a request for a general rate increase. NSTAR Electric did not exceed the 12.5%, or fall below the 8.5% distribution return on equity during 2009, 2008 or 2007.
Wholesale Power Cost Savings Initiatives
The Rate Settlement Agreement includes incentives to encourage NSTAR Electric to continue its efforts to advocate on behalf of customers at the FERC to mitigate wholesale electricity cost inefficiencies that would be borne by regional customers. As a result of its role in two RMR cases, NSTAR Electric had sought to collect $9.8 million annually for three years and began collecting some of these incentive revenues from its customers effective January 1, 2007, subject to final DPU approval. Through December 31, 2009, approximately $18.9 million had been collected from customers for the Wholesale Power Cost Savings Initiatives.
95
Table of Contents
On November 30, 2009, DPU denied NSTAR Electric’s petition. NSTAR Electric must refund the $18.9 million already collected from customers. The DPU order had no impact on earnings as the Company did not reflect the amounts collected in revenues.
DPU Safety and Reliability Programs (CPSL)
As part of the Rate Settlement Agreement, NSTAR Electric is allowed to recover incremental spending for the double pole inspection, replacement/restoration and transfer program and the underground electric safety program, which includes stray-voltage remediation and manhole inspections, repairs, and upgrades. Recovery of these Capital Program Scheduling List (CPSL) costs is subject to DPU review and approval. NSTAR Electric incurred incremental costs of $11 million, $13 million, and $15 million in 2006, 2007 and 2008, respectively. This includes incremental operations and maintenance and revenue requirements on capital investments. The final reconciliation of 2006 and 2007 CPSL costs recovery is currently under review by the DPU. The incremental costs for the year 2009 are currently under review by the Company and are estimated to be approximately $16 million. NSTAR awaits the results of the 2006 and 2007 filings from the DPU prior to submitting the final 2008 and 2009 CPSL cost recovery reconciliations with the DPU. NSTAR cannot predict the timing of a DPU order related to these pending filings. Should an adverse decision be issued which disallows a significant portion of CPSL cost recovery, it could have a material adverse impact to NSTAR’s results of operations, financial position, and cash flows.
Basic Service Bad Debt Adder
On July 1, 2005, in response to a generic DPU order that required electric utilities in Massachusetts to recover the energy-related portion of bad debt costs in their Basic Service rates, NSTAR Electric increased its Basic Service rates and reduced its distribution rates for those bad debt costs. In furtherance of this generic DPU order, NSTAR Electric included a bad debt cost recovery mechanism as a component of its Rate Settlement Agreement. This recovery mechanism (bad debt adder) allows NSTAR Electric to recover its Basic Service bad debt costs on a fully reconciling basis. These rates were implemented, effective January 1, 2006, as part of NSTAR Electric’s Rate Settlement Agreement.
On February 7, 2007, NSTAR Electric filed its 2006 Basic Service reconciliation with the DPU proposing an adjustment related to the increase of its Basic Service bad debt charge-offs. This proposed rate adjustment was anticipated to be implemented effective July 1, 2007. On June 28, 2007, the DPU issued an order approving the implementation of a revised Basic Service rate. However, the DPU instructed NSTAR Electric to reduce distribution rates by the increase in its Basic Service bad debt charge-offs. Such action would result in a further reduction to distribution rates from the adjustment NSTAR Electric made when it implemented the Settlement Agreement. This adjustment to NSTAR Electric’s distribution rates would eliminate the fully reconciling nature of the Basic Service bad debt adder.
NSTAR Electric has not implemented the directives of the June 28, 2007 DPU order. Implementation of this order would require NSTAR Electric to write-off a previously recorded regulatory asset related to its Basic Service bad debt costs. NSTAR Electric filed a Motion for Reconsideration of the DPU’s order on July 18, 2007. On December 14, 2007, the Motion for Reconsideration was granted and the DPU reopened the case to hear additional evidence. NSTAR Electric filed additional testimony in April 2008, an evidentiary hearing was held, and briefs were filed in June and early July 2008. NSTAR Electric believes its position is appropriate and that it is probable that it will ultimately prevail. However, in the event the DPU does not rule in its favor, NSTAR Electric intends to pursue all legal options. As of December 31, 2009, the potential impact to earnings of eliminating the bad debt adder would be approximately $20.8 million, pre-tax. NSTAR cannot predict the timing of this proceeding.
96
Table of Contents
Legal Matters
In the normal course of its business, NSTAR and its subsidiaries are involved in certain legal matters, including civil litigation. Management is unable to fully determine a range of reasonably possible court-ordered damages, settlement amounts, and related litigation costs (legal liabilities) that would be in excess of amounts accrued and amounts covered by insurance. Based on the information currently available, NSTAR does not believe that it is probable that any such legal liabilities will have a material impact on its consolidated financial position. However, it is reasonably possible that additional legal liabilities that may result from changes in circumstances could have a material impact on its results of operations, cash flows or financial condition.
97
Table of Contents
Report of Independent Registered Public Accounting Firm
To Shareholders and Trustees of NSTAR:
In our opinion, the consolidated financial statements listed in the index appearing under Item 15(a)(1) present fairly, in all material respects, the financial position of NSTAR and its subsidiaries (the Company) at December 31, 2009 and 2008, and the results of their operations and their cash flows for each of the three years in the period ended December 31, 2009 in conformity with accounting principles generally accepted in the United States of America. In addition, in our opinion, the financial statement schedules listed in the index appearing under Item 15(a)(2) present fairly, in all material respects, the information set forth therein when read in conjunction with the related consolidated financial statements. Also in our opinion, the Company maintained, in all material respects, effective internal control over financial reporting as of December 31, 2009, based on criteria established in Internal Control - Integrated Framework issued by the Committee of Sponsoring Organizations of the Treadway Commission (COSO). The Company’s management is responsible for these financial statements and financial statement schedules, for maintaining effective internal control over financial reporting and for its assessment of the effectiveness of internal control over financial reporting, included in Management’s Annual Report on Internal Control Over Financial Reporting appearing under Item 9A. Our responsibility is to express opinions on these financial statements, on the financial statement schedules, and on the Company’s internal control over financial reporting based on our integrated audits. We conducted our audits in accordance with the standards of the Public Company Accounting Oversight Board (United States). Those standards require that we plan and perform the audits to obtain reasonable assurance about whether the financial statements are free of material misstatement and whether effective internal control over financial reporting was maintained in all material respects. Our audits of the financial statements included examining, on a test basis, evidence supporting the amounts and disclosures in the financial statements, assessing the accounting principles used and significant estimates made by management, and evaluating the overall financial statement presentation. Our audit of internal control over financial reporting included obtaining an understanding of internal control over financial reporting, assessing the risk that a material weakness exists, and testing and evaluating the design and operating effectiveness of internal control based on the assessed risk. Our audits also included performing such other procedures as we considered necessary in the circumstances. We believe that our audits provide a reasonable basis for our opinions.
As discussed in Note G to the consolidated financial statements, the Company changed the manner in which it accounts for uncertain tax positions in 2007.
A company’s internal control over financial reporting is a process designed to provide reasonable assurance regarding the reliability of financial reporting and the preparation of financial statements for external purposes in accordance with generally accepted accounting principles. A company’s internal control over financial reporting includes those policies and procedures that (i) pertain to the maintenance of records that, in reasonable detail, accurately and fairly reflect the transactions and dispositions of the assets of the company; (ii) provide reasonable assurance that transactions are recorded as necessary to permit preparation of financial statements in accordance with generally accepted accounting principles, and that receipts and expenditures of the company are being made only in accordance with authorizations of management and directors of the company; and (iii) provide reasonable assurance regarding prevention or timely detection of unauthorized acquisition, use, or disposition of the company’s assets that could have a material effect on the financial statements.
Because of its inherent limitations, internal control over financial reporting may not prevent or detect misstatements. Also, projections of any evaluation of effectiveness to future periods are subject to the risk that controls may become inadequate because of changes in conditions, or that the degree of compliance with the policies or procedures may deteriorate.
/s/ PRICEWATERHOUSECOOPERS LLP
Boston, Massachusetts
February 5, 2010
98
Table of Contents
| Item 9. | Changes in and Disagreements with Accountants on Accounting and Financial Disclosure |
No event that would be described in response to this item 9 has occurred with respect to NSTAR or its subsidiaries.
| Item 9A. | Controls and Procedures |
Conclusion Regarding the Effectiveness of Disclosure Controls and Procedures
Under the supervision and with the participation of our management, including our principal executive officer and principal financial officer, we conducted an evaluation of our disclosure controls and procedures, as such term is defined under Rule 13a-15(e) promulgated under the Securities Exchange Act of 1934, as amended (the Exchange Act). Based on this evaluation, our principal executive officer and our principal financial officer concluded that our disclosure controls and procedures were effective as of the end of the period covered by this annual report.
NSTAR is continuously seeking to improve the efficiency and effectiveness of its operations and of its internal controls. This results in modifications to its processes throughout the Company. However, there has been no change in its internal control over financial reporting that occurred during the Company’s most recent fiscal quarter that has materially affected, or is reasonably likely to materially affect, the Company’s internal control over financial reporting.
Management’s Annual Report on Internal Control Over Financial Reporting
Management is responsible for establishing and maintaining adequate internal control over financial reporting, as such term is defined in the Exchange Act Rules 13a-15(f). A system of internal control over financial reporting is a process designed to provide reasonable assurance regarding the reliability of financial reporting and the preparation of financial statements for external purposes in accordance with generally accepted accounting principles.
Under the supervision and with the participation of management, including the principal executive officer and the principal financial officer, NSTAR management has evaluated the effectiveness of its internal control over financial reporting as of December 31, 2009 based on the criteria established in a report entitled “Internal Control - Integrated Framework issued by the Committee of Sponsoring Organizations of the Treadway Commission” and the Interpretive Guidance issued by the SEC in Release 34-55929. Based on this evaluation, NSTAR management has evaluated and concluded that NSTAR’s internal control over financial reporting was effective as of December 31, 2009.
PricewaterhouseCoopers LLP, the independent registered public accounting firm that audited the consolidated financial statements included in this Annual Report on Form 10-K, has also audited the effectiveness of our internal control over financial reporting as of December 31, 2009, as stated in their report which appears on page 98.
| Item 9B. | Other Information |
None
99
Table of Contents
Part III
The information required by Part III (Items 10(a), 11, 12, 13, and 14) will be included in NSTAR’s 2010 Proxy Statement (as specified below) to be filed in connection with the Annual Meeting of Shareholders to be held on May 6, 2010 and is incorporated herein by reference. NSTAR’s Proxy Statement will be filed with the Securities and Exchange Commission on or about March 12, 2010.
| Item 10. | Trustees, Executive Officers and Corporate Governance |
The information with respect to Trustees of NSTAR, information with respect to compliance with the reporting obligations under Section 16(a) of the Exchange Act, information concerning NSTAR’s code of ethics applicable to senior management, information on NSTAR’s compliance with corporate governance regulations, and information on NSTAR’s Board of Trustees’ Audit Committee, is incorporated herein by reference from disclosures contained in NSTAR’s Definitive Proxy Statement for the 2010 Annual Meeting of Shareholders to be held on May 6, 2010 under the captions “Information about the NSTAR Board, Nominees and Incumbent Trustees,” “Section 16(a) Beneficial Ownership Reporting Compliance,” and “Governance of the Company.” Information regarding NSTAR’s executive officers found in the section captioned “Executive Officers of the Registrant” in Item 4A of Part 1 of this Report is also incorporated herein by reference into this Item 10.
| Item 11. | Executive Compensation |
The information required by this Item is incorporated herein by reference from disclosures contained in NSTAR’s Definitive Proxy Statement for the 2010 Annual Meeting of Shareholders under the caption “Executive Compensation,” including NSTAR’s “Compensation Discussion and Analysis” and “Executive Personnel Committee Report.”
| Item 12. | Security Ownership of Certain Beneficial Owners and Management and Related Stockholder Matters |
Information regarding securities authorized for issuance under equity compensation plans located in Item 5, Section (d) of Part II hereof is also incorporated by reference into this Item 12. Other information required by this Item is incorporated herein by reference from disclosures contained in NSTAR’s Definitive Proxy Statement for the 2010 Annual Meeting of Shareholders under the captions “2009 Trustee Compensation,” “Beneficial Ownership Table,” and “Potential Payments Upon Termination or Change in Control.”
| Item 13. | Certain Relationships and Related Transactions, and Trustee Independence |
The information required by this Item is incorporated herein by reference from disclosures contained in NSTAR’s Definitive Proxy Statement for the 2010 Annual Meeting of Shareholders under the captions “Governance of the Company - Board Independence” and “NSTAR Policy on Related Persons Transactions.”
| Item 14. | Principal Accounting Fees and Services |
The information required by this Item is incorporated herein by reference from disclosures contained in NSTAR’s Definitive Proxy Statement for the 2010 Annual Meeting of Shareholders under the captions “Audit and Related Fees.”
100
Table of Contents
| Item 15. | Exhibits and Financial Statement Schedules |
(a) The following documents are filed as part of this Form 10-K:
| 1. | Financial Statements: |
| Page | ||
| Consolidated Statements of Income for the years ended December 31, 2009, 2008, and 2007 |
53 | |
| 54 | ||
| Consolidated Statements of Retained Earnings for the years ended December 31, 2009, 2008, and 2007 |
54 | |
| Consolidated Balance Sheets as of December 31, 2009 and 2008 |
55-56 | |
| Consolidated Statements of Cash Flows for the years ended December 31, 2009, 2008, and 2007 |
57-58 | |
| 59 | ||
| 20-21 | ||
| 98 | ||
| 2. Financial Statement Schedules: |
||
| 106 | ||
| 110 | ||
| 101 | ||
| Refer to the exhibits listing beginning below. |
||
Incorporated herein by reference unless designated otherwise:
| Exhibit 3 |
Articles of Incorporation and By-Laws | |
| 3.1 |
Declaration of Trust of NSTAR (dated as of April 20, 1999, as amended April 28, 2005 and April 30, 2009) (NSTAR Form 10-Q for the quarter ended September 30, 2009, File No. 001-14768) | |
| 3.2 |
Bylaws of NSTAR, dated as of April 20, 1999, as amended as of September 24, 2009 (NSTAR Form 8-K (Exhibit 3.2) dated September 24, 2009, File No. 001-14768) | |
| 3.3 |
NSTAR Electric Company, f.k.a. Boston Edison Company, Restated Articles of Organization (Form 10-Q for the quarter ended June 30, 1994, File No. 001-02301) | |
| 3.4 |
NSTAR Electric Company, f.k.a. Boston Edison Company, Bylaws dated April 19, 1977, as amended January 22, 1987, January 28, 1988, May 24, 1988, November 22, 1989, July 22, 1999, September 20, 1999, and January 2, 2007 (Form 10-K for the year ended December 31, 2007, File No. 001-02301) | |
| Exhibit 4 |
Instruments Defining the Rights of Security Holders, Including Indentures | |
| 4.1 |
Indenture dated as of January 12, 2000 between NSTAR and Bank One Trust Company N.A. (Exhibit 4.1 to NSTAR Registration Statement on Form S-3, File No. 333-94735) | |
101
Table of Contents
| 4.2 |
Votes of the Board of Trustees of NSTAR, dated January 27, 2000, supplementing the Indenture dated as of January 12, 2000 between NSTAR and Bank One Trust Company N. A. (NSTAR Form 10-K for the year ended December 31, 2002, File No. 001-14768) | |
| 4.3 |
Votes of the Board of Trustees of NSTAR, dated September 28, 2000 supplementing the Indenture dated as of January 12, 2000 between NSTAR and Bank One Trust Company N. A. (NSTAR Form 10-K for the year ended December 31, 2002, File No. 001-14768) | |
| 4.4 |
Indenture between Boston Edison Company and the Bank of New York (as successor to Bank of Montreal Trust Company) (Form 10-Q for the quarter ended September 30, 1988, File No. 001-02301) | |
| 4.5 |
Votes of the Pricing Committee of the Board of Directors of Boston Edison Company taken May 10, 1995 re 7.80% debentures due May 15, 2010 (Form 10-K for the year ended December 31, 1995, File No. 001-02301) | |
| 4.6 |
Votes of the Board of Directors of Boston Edison Company taken October 8, 2002 re $500 million aggregate principal amount of unsecured debentures ($400 million, 4.875% due in 2012 and $100 million, Floating rate due in 2005) (Form 8-K dated October 11, 2002, File No. 001-02301) | |
| 4.7 |
A Form of 4.875% Debenture Due April 15, 2014 (Boston Edison Company Form 8-K (Exh. 4.3) dated April 15, 2004, File No. 001-02301) | |
| 4.8 |
A Form of 5.75% Debenture Due March 15, 2036 (Boston Edison Company Form 8-K (Exh. 99.2) dated March 17, 2006, File No. 001-02301) | |
| 4.9 |
A Form of 5.625% Debenture Due November 15, 2017 (NSTAR Electric Company Form 8-K (Exh. 99.2) dated November 20, 2007 and February 13, 2009, File No. 001-02301) | |
| 4.10 |
A Form of 4.50% Debenture Due November 15, 2019 (NSTAR Form 8-K (Exhibit 99.2) dated November 16, 2009, File No. 001-14768) | |
| Management agrees to furnish to the Securities and Exchange Commission, upon request, a copy of any other agreements or instruments of NSTAR and its subsidiaries defining the rights of holders of any non-registered debt whose authorization does not exceed 10% of total assets. | ||
| Exhibit 10 |
Material Contracts | |
| Management, Executive Officers and Trustees Agreements | ||
| 10.1 |
NSTAR Excess Benefit Plan, effective August 25, 1999 (NSTAR Form 10-K/A for the year ended December 31, 1999, File No. 001-14768) | |
| 10.1.1 |
NSTAR Excess Benefit Plan, incorporating the NSTAR 409A Excess Benefit Plan, as amended and restated effective January 1, 2008, dated December 24, 2008 (NSTAR Form 10-K for the year-ended December 31, 2008, File No. 001-14768) | |
| 10.2 |
NSTAR Supplemental Executive Retirement Plan, effective August 25, 1999 (NSTAR Form 10-K/A for the year ended December 31, 1999, File No. 001-14768) | |
| 10.2.1 |
NSTAR Supplemental Executive Retirement Plan, incorporating the NSTAR 409A Supplemental Executive Retirement Plan, as amended and restated effective January 1, 2008, dated December 24, 2008 (NSTAR Form 10-K for the year-ended December 31, 2008, File No. 001-14768) | |
| 10.3 |
Special Supplemental Executive Retirement Agreement between Boston Edison Company and Thomas J. May dated March 13, 1999, regarding Key Executive Benefit Plan and Supplemental Executive Retirement Plan (NSTAR Form 10-K/A for the year ended December 31, 1999, File No. 001-14768) | |
102
Table of Contents
| 10.4 |
Executive Retirement Plan Agreement between NSTAR and Werner J. Schweiger dated as of February 25, 2002, regarding Supplemental Executive Retirement Plan (NSTAR Form 10-K for the year ended December 31, 2004, File No. 001-14768) | |
| 10.4.1 |
Executive Retirement Plan Agreement, as amended and restated effective January 1, 2008, between NSTAR and Werner J. Schweiger, in connection with Section 409A of the IRS Code of 1986, as amended, dated December 24, 2008 (NSTAR Form 10-K for the year-ended December 31, 2008, File No. 001-14768) | |
| 10.5 |
Amended and Restated Change in Control Agreement by and between NSTAR and Thomas J. May dated November 15, 2007 (NSTAR Form 10-K for the year ended December 31, 2007, File No. 001-14768) | |
| 10.6 |
NSTAR Deferred Compensation Plan, (Restated Effective August 25, 1999) (NSTAR Form 10-K/A for the year ended December 31, 1999, File No. 001-14768) | |
| 10.6.1 |
NSTAR Deferred Compensation Plan, incorporating the NSTAR 409A Deferred Compensation Plan, as amended and restated effective January 1, 2008, dated December 24, 2008 (NSTAR Form 10-K for the year-ended December 31, 2008, File No. 001-14768) | |
| 10.7 |
NSTAR 1997 Share Incentive Plan, as amended June 30, 1999 and assumed by NSTAR effective August 28, 2000 (NSTAR Form 10-K/A for the year ended December 31, 1999, File No. 001-14768) | |
| 10.7.1 |
NSTAR 1997 Share Incentive Plan, as amended January 24, 2002 (NSTAR Form 10-K for the year ended December 31, 2002, File No. 001-14768) | |
| 10.8 |
NSTAR 2007 Long Term Incentive Plan, effective May 3, 2007 (NSTAR Form 8-K dated May 3, 2007, File No. 001-14768) | |
| 10.8.1 |
Deferred Common Share/Dividend Equivalent Award, Stock Option Grant, Option Certificate and Performance Share Award/Dividend Equivalent Award Agreement Under the NSTAR 2007 Long Term Incentive Plan, by and between NSTAR and Thomas J. May, dated January 24, 2008 (NSTAR Form 10-K for the year ended December 31, 2007, File No. 001-14768) | |
| 10.8.2 |
Deferred Common Share/Dividend Equivalent Award, Stock Option Grant, Option Certificate and Performance Share Award/Dividend Equivalent Award Agreement Under the NSTAR 2007 Long Term Incentive Plan, by and between NSTAR and James J. Judge, dated January 24, 2008 (NSTAR Form 10-K for the year ended December 31, 2007, File No. 001-14768) | |
| 10.8.3 |
Deferred Common Share/Dividend Equivalent Award, Stock Option Grant, Option Certificate and Performance Share Award/Dividend Equivalent Award Agreement Under the NSTAR 2007 Long Term Incentive Plan, by and between NSTAR and Douglas S. Horan, dated January 24, 2008 (NSTAR Form 10-K for the year ended December 31, 2007, File No. 001-14768) | |
| 10.8.4 |
Deferred Common Share/Dividend Equivalent Award, Stock Option Grant, Option Certificate and Performance Share Award/Dividend Equivalent Award Agreement Under the NSTAR 2007 Long Term Incentive Plan, by and between NSTAR and Joseph R. Nolan, Jr., dated January 24, 2008 (NSTAR Form 10-K for the year ended December 31, 2007, File No. 001-14768) | |
| 10.8.5 |
Deferred Common Share/Dividend Equivalent Award, Stock Option Grant, Option Certificate and Performance Share Award/Dividend Equivalent Award Agreement Under the NSTAR 2007 Long Term Incentive Plan, by and between NSTAR and Werner J. Schweiger, dated January 24, 2008 (NSTAR Form 10-K for the year ended December 31, 2007, File No. 001-14768) | |
| 10.8.6 |
Deferred Common Share/Dividend Equivalent Award, Stock Option Grant, Option Certificate and Performance Share Award/Dividend Equivalent Award Agreement Under the NSTAR 2007 Long Term Incentive Plan by and between NSTAR and NSTAR’s other Senior Vice Presidents and Vice Presidents, dated January 24, 2008 (in form) (NSTAR Form 10-K for the year ended December 31, 2007, File No. 001-14768) | |
103
Table of Contents
| 10.9 |
Amended and Restated Change in Control Agreement by and between James J. Judge and NSTAR, dated November 15, 2007 (NSTAR Form 10-K for the year ended December 31, 2007, File No. 001-14768) | |
| 10.10 |
NSTAR Trustees’ Deferred Plan (Restated Effective August 25, 1999), dated October 20, 2000 (NSTAR Form 10-Q for the quarter ended September 30, 2000, File No. 001-14768) | |
| 10.10.1 |
NSTAR Trustees’ Deferred Plan, incorporating the 409A Trustees’ Deferred Plan, effective January 1, 2008, dated December 24, 2008 (NSTAR Form 10-K for the year-ended December 31, 2008, File No. 001-14768) | |
| 10.11 |
Master Trust Agreement between NSTAR and State Street Bank and Trust Company (Rabbi Trust), effective August 25, 1999 (NSTAR Form 10-Q for the quarter ended September 30, 2000, File No. 001-14768) | |
| 10.12 |
Amended and Restated Change in Control Agreement by and between Douglas S. Horan and NSTAR, dated November 15, 2007 (NSTAR Form 10-K for the year ended December 31, 2007, File No. 001-14768) | |
| 10.13 |
Amended and Restated Change in Control Agreement by and between Joseph R. Nolan, Jr. and NSTAR, dated November 15, 2007 (NSTAR Form 10-K for the year ended December 31, 2007, File No. 001-14768) | |
| 10.14 |
Amended and Restated Change in Control Agreement by and between Werner J. Schweiger and NSTAR, dated November 15, 2007 (NSTAR Form 10-K for the year ended December 31, 2007, File No. 001-14768) | |
| 10.15 |
Amended and Restated Change in Control Agreement by and between NSTAR’s other Senior Vice Presidents and NSTAR (in form), dated November 15, 2007 (NSTAR Form 10-K for the year ended December 31, 2007, File No. 001-14768) | |
| 10.16 |
Amended and Restated Change in Control Agreement between NSTAR’s Vice Presidents and NSTAR (in form), dated November 15, 2007 (NSTAR Form 10-K for the year ended December 31, 2007, File No. 001-14768) | |
| 10.17 |
Currently effective Change in Control Agreement between NSTAR’s Vice Presidents and NSTAR (in form) (filed herewith) | |
| 10.18 |
Amended and Restated NSTAR Annual Incentive Plan as of January 1, 2003 (NSTAR Form 10-K for the year ended December 31, 2004, File No. 001-14768) | |
| Power Purchase Agreements | ||
| 10.19 |
Amended and Restated Power Purchase Agreement (NEA A PPA), dated August 19, 2004, by and between NSTAR Electric and Northeast Energy Associates L.P. (NSTAR Form 10-K for the year ended December 31, 2005, File No. 001-14768) | |
| 10.20 |
Amended and Restated Power Purchase Agreement (NEA B PPA), dated August 19, 2004, by and between NSTAR Electric and Northeast Energy Associates L.P. (NSTAR Form 10-K for the year ended December 31, 2005, File No. 001-14768) | |
| 10.21 |
Amended and Restated Power Purchase Agreement (CECO 1 PPA), dated August 19, 2004, by and between NSTAR Electric and Northeast Energy Associates L.P. (NSTAR Form 10-K for the year ended December 31, 2005, File No. 001-14768) | |
| 10.22 |
Amended and Restated Power Purchase Agreement (CECO 2 PPA), dated August 19, 2004, by and between NSTAR Electric and Northeast Energy Associates L.P. (NSTAR Form 10-K for the year ended December 31, 2005, File No. 001-14768) | |
| 10.23 |
The Bellingham Execution Agreement, dated August 19, 2004 between NSTAR Electric and Northeast Energy Associates L.P. (NSTAR Form 10-K for the year ended December 31, 2005, File No. 001-14768) | |
104
Table of Contents
| 10.24 |
Purchase and Sale Agreement, dated June 23, 2004, between NSTAR Electric and Transcanada Energy Ltd. (Ocean State Power Contract) (NSTAR Form 10-K for the year ended December 31, 2005, File No. 001-14768) | |
| Transmission Agreements | ||
| 10.25 |
Second Restated NEPOOL Agreement among NSTAR Electric and various other electric utilities operating in New England, dated August 16, 2004 (NSTAR Form 10-K for the year ended December 31, 2005, File No. 001-14768) | |
| 10.26 |
Transmission Operating Agreement among NSTAR Electric and various other electric transmission providers in New England and ISO New England Inc., dated February 1, 2005 (NSTAR Form 10-K for the year ended December 31, 2005, File No. 001-14768) | |
| 10.27 |
Market Participants Service Agreement among NSTAR Electric, various other electric utilities operating in New England, NEPOOL and ISO New England Inc., dated February 1, 2005 (NSTAR Form 10-K for the year ended December 31, 2005, File No. 001-14768) | |
| 10.28 |
Rate Design and Funds Disbursement Agreement among NSTAR Electric and various other electric transmission providers in New England, dated February 1, 2005 (NSTAR Form 10-K for the year ended December 31, 2005, File No. 001-14768) | |
| 10.29 |
Participants Agreement among NSTAR Electric, various other electric utilities operating in New England, NEPOOL and ISO New England Inc., dated February 1, 2005 (NSTAR Form 10-K for the year ended December 31, 2006, File No. 001-14768) | |
| Exhibit 21 |
Subsidiaries of the Registrant | |
| 21.1 |
Incorporated herein by reference. (NSTAR Form 10-K for the year-ended December 31, 2008, File No. 001-14768) | |
| Exhibit 23 |
Consent of Independent Registered Public Accounting Firm | |
| 23.1 |
(filed herewith) | |
| Exhibit 31 |
Rule 13a – 15/15d-15(e) Certifications | |
| 31.1 |
Certification Statement of Chief Executive Officer of NSTAR pursuant to Section 302 of the Sarbanes-Oxley Act of 2002 (filed herewith) | |
| 31.2 |
Certification Statement of Chief Financial Officer of NSTAR pursuant to Section 302 of the Sarbanes-Oxley Act of 2002 (filed herewith) | |
| Exhibit 32 |
Section 1350 Certifications | |
| 32.1 |
Certification Statement of Chief Executive Officer of NSTAR pursuant to Section 906 of the Sarbanes-Oxley Act of 2002 (filed herewith) | |
| 32.2 |
Certification Statement of Chief Financial Officer of NSTAR pursuant to Section 906 of the Sarbanes-Oxley Act of 2002 (filed herewith) | |
| Exhibit 99 |
Additional Exhibits | |
| 99.1 |
Annual Reports on Form 11-K for certain employee savings plans for the years ended December 31, 2008, 2007, 2006, 2005, and 2004, as dated June 25, 2009, June 25, 2008, June 25, 2007, June 27, 2006, and June 28, 2005, ,respectively, (File No. 001-14768) | |
| 99.2 |
MDTE Order approving Rate Settlement Agreement dated December 31, 2005 (NSTAR Form 8-K for the event reported December 30, 2005, dated January 4, 2006, File No. 001-14768) | |
| 99.3 |
Amended NSTAR Board of Trustees Guidelines on Significant Corporate Governance Issues as of September 24, 2009 (NSTAR Form 8-K for the event reported and dated September 24, 2009, File No. 001-14768) | |
105
Table of Contents
CONDENSED HOLDING COMPANY FINANCIAL STATEMENTS
NSTAR (Holding Company)
Condensed Balance Sheets
| December 31, | ||||||||
| 2009 | 2008 | |||||||
| (in thousands) | ||||||||
| Assets | ||||||||
| Current assets: |
||||||||
| Cash and cash equivalents |
$ | 131,816 | $ | 399 | ||||
| Notes receivable - subsidiary companies |
132,100 | 93,350 | ||||||
| Net investment in discontinued operations |
79,102 | 82,652 | ||||||
| Other |
4,869 | 6,214 | ||||||
| Total current assets |
347,887 | 182,615 | ||||||
| Other assets: |
||||||||
| Receivable - subsidiary companies |
84,245 | 86,579 | ||||||
| Investment in subsidiaries |
2,330,520 | 2,232,717 | ||||||
| Other investments |
17,993 | 18,090 | ||||||
| Accumulated deferred income taxes |
4,868 | 4,906 | ||||||
| Other deferred debits |
2,839 | 793 | ||||||
| Total other assets |
2,440,465 | 2,343,085 | ||||||
| Total assets |
$ | 2,788,352 | $ | 2,525,700 | ||||
| Liabilities and Capitalization | ||||||||
| Current liabilities: |
||||||||
| Long-term debt |
$ | 500,000 | $ | — | ||||
| Notes payable |
— | 175,000 | ||||||
| Accrued interest |
17,445 | 15,563 | ||||||
| Dividends payable |
42,723 | 40,053 | ||||||
| Other |
1,361 | 181 | ||||||
| Total current liabilities |
561,529 | 230,797 | ||||||
| Other liabilities: |
||||||||
| Long-term debt |
347,094 | 499,754 | ||||||
| Other deferred credits |
7,123 | 6,994 | ||||||
| Total other liabilities |
354,217 | 506,748 | ||||||
| Common equity: |
||||||||
| Common shares |
106,808 | 106,808 | ||||||
| Premium on common shares |
813,490 | 818,601 | ||||||
| Retained earnings |
966,636 | 876,271 | ||||||
| Accumulated other comprehensive loss |
(14,328 | ) | (13,525 | ) | ||||
| Total common equity |
1,872,606 | 1,788,155 | ||||||
| Total liabilities and capitalization |
$ | 2,788,352 | $ | 2,525,700 | ||||
The accompanying notes are an integral part of the condensed financial statements.
106
Table of Contents
NSTAR (Holding Company)
Condensed Statements of Income and Comprehensive Income
| Years ended December 31, | ||||||||||||
| 2009 | 2008 | 2007 | ||||||||||
| (in thousands) | ||||||||||||
| Operating expenses |
||||||||||||
| Administrative, general and other |
$ | 4,958 | $ | 4,354 | $ | 4,242 | ||||||
| Operating loss |
(4,958 | ) | (4,354 | ) | (4,242 | ) | ||||||
| Other income |
456 | 2,247 | 691 | |||||||||
| Earnings from investments in subsidiaries |
268,776 | 252,551 | 242,292 | |||||||||
| Interest expense |
(43,386 | ) | (44,214 | ) | (46,561 | ) | ||||||
| Income before income taxes |
220,888 | 206,230 | 192,180 | |||||||||
| Income tax benefits |
23,127 | 19,766 | 20,877 | |||||||||
| Net income from continuing operations |
244,015 | 225,996 | 213,057 | |||||||||
| Earnings from discontinued operations, net of transaction costs |
9,233 | 11,551 | 8,458 | |||||||||
| Net income attributable to common shareholders |
253,248 | 237,547 | 221,515 | |||||||||
| Other comprehensive income from continuing operations, net: |
||||||||||||
| Pension and postretirement costs |
(1,032 | ) | (1,534 | ) | (504 | ) | ||||||
| Deferred income taxes benefit |
383 | 634 | 151 | |||||||||
| Comprehensive income from continuing operations |
252,599 | 236,647 | 221,162 | |||||||||
| Other comprehensive income from discontinued operations, net: |
||||||||||||
| Postretirement costs |
(251 | ) | (51 | ) | (363 | ) | ||||||
| Deferred income taxes benefit |
97 | 19 | 141 | |||||||||
| Comprehensive income |
$ | 252,445 | $ | 236,615 | $ | 220,940 | ||||||
The accompanying notes are an integral part of the condensed financial statements.
107
Table of Contents
NSTAR (Holding Company)
Condensed Statements of Cash Flows
| Years ended December 31, | ||||||||||||
| 2009 | 2008 | 2007 | ||||||||||
| (in thousands) | ||||||||||||
| Cash flows from operating activities: |
||||||||||||
| Cash provided by operating activities of continuing operations |
$ | 162,735 | $ | 68,917 | $ | 206,218 | ||||||
| Cash provided by (used in) operating activities of discontinued operations |
3,550 | 1,949 | (8,044 | ) | ||||||||
| Net cash provided by operating activities |
166,285 | 70,866 | 198,174 | |||||||||
| Cash flows from investing activities: |
||||||||||||
| Net change in notes receivable |
(38,750 | ) | (92,050 | ) | 600 | |||||||
| Investments |
60 | 5,285 | (469 | ) | ||||||||
| Net cash (used in) provided by investing activities |
(38,690 | ) | (86,765 | ) | 131 | |||||||
| Cash flows from financing activities: |
||||||||||||
| Long-term debt issuance, net of discount |
347,122 | — | — | |||||||||
| Net change in notes payable |
(175,000 | ) | 171,000 | (49,500 | ) | |||||||
| Dividends paid |
(160,213 | ) | (149,532 | ) | (138,851 | ) | ||||||
| Cash received for exercise of equity options |
5,065 | 4,846 | 10,948 | |||||||||
| Cash used to settle equity compensation |
(13,616 | ) | (11,585 | ) | (23,247 | ) | ||||||
| Windfall tax effect of settlement of equity compensation |
464 | 744 | 2,538 | |||||||||
| Net cash provided by (used in) financing activities |
3,822 | 15,473 | (198,112 | ) | ||||||||
| Net increase (decrease) in cash and cash equivalents |
131,417 | (426 | ) | 193 | ||||||||
| Cash and cash equivalents at the beginning of the year |
399 | 825 | 632 | |||||||||
| Cash and cash equivalents at the end of the year |
$ | 131,816 | $ | 399 | $ | 825 | ||||||
The accompanying notes are an integral part of the condensed financial statements.
108
Table of Contents
NSTAR (Holding Company)
Notes to Condensed Financial Statements
1. Basis of Presentation
NSTAR (Holding Company) on a stand alone basis has accounted for its wholly-owned subsidiaries using the equity method basis of accounting. These financial statements are presented on a condensed basis. Additional disclosures relating to the Holding Company financial statements are included under the accompanying NSTAR Notes to Consolidated Financial Statements, and are incorporated herein by reference.
2. Use of Estimates
The preparation of condensed financial statements in conformity with GAAP requires estimates and assumptions that affect the reported amounts of assets and liabilities and disclosures of contingent assets and liabilities at the date of the financial statements and the reported amounts of income and expenses during the period. Actual results could differ from these estimates.
3. Notes Payable
NSTAR (Holding Company) currently has a $175 million revolving credit agreement that expires December 31, 2012. At December 31, 2009 and 2008, there were no amounts outstanding under the revolving credit agreement. This credit facility serves as a back up to NSTAR’s $175 million commercial paper program that, at December 31, 2009 and 2008, had zero and $175 million outstanding, respectively. Under the terms of the credit agreement, NSTAR is required to maintain a maximum total consolidated debt to total capitalization ratio and was in compliance with this ratio at December 31, 2009 and 2008. Commitment fees must be paid on the total agreement amount.
4. Long-Term Debt
NSTAR (Holding Company) had $500 million of 8% Notes outstanding as of December 31, 2009 and 2008. These Notes will mature and are due in February 2010. On November 17, 2009, NSTAR sold, at a discount, $350 million of fixed rate (4.5%) Debentures due November 15, 2019. NSTAR used the proceeds from the issuance of these securities for the repayment of outstanding short-term debt balances and general working capital purposes.
Refer to Note K of the NSTAR Consolidated Financial Statements for a description and details of the Holding Company long-term debt.
5. Equity Transactions
NSTAR (Holding Company) received $170.6 million, $85.6 million, and $208.3 million, of cash dividends from subsidiaries during 2009, 2008, and 2007, respectively. NSTAR also received returned capital of $6.7 million, $5.7 million, and $3.9 million, from subsidiaries during 2009, 2008, and 2007, respectively.
6. Commitments, Contingencies and Guarantees
Refer to Note O of the NSTAR Consolidated Financial Statements for a description of any material commitments, contingencies or guarantees of the Holding Company.
7. Discontinued Operations
On December 21, 2009, NSTAR, through its wholly-owned subsidiary Advanced Energy Systems, Inc. (“AES”), entered into an agreement to sell all of the outstanding shares of AES’ wholly owned subsidiary, Medical Area Total Energy Plant, Inc. (“MATEP”) for approximately $320 million, pending necessary regulatory approvals. In connection with the transaction, NSTAR will repay MATEP’s outstanding debt. The purchase price is subject to certain closing adjustments related to changes in working capital, interest, and other adjustments prior to the closing, which is anticipated towards the end of the first quarter or early part of the second quarter of 2010.
109
Table of Contents
VALUATION AND QUALIFYING ACCOUNTS
FOR THE YEARS ENDED DECEMBER 31, 2009, 2008 and 2007
(in thousands)
| Additions | Balance At End of Year | ||||||||||||||
| Description |
Balance at Beginning of Year |
Provisions Charged to Operations |
Recoveries | Deductions Accounts Written Off |
|||||||||||
| Allowance for Doubtful Accounts |
|||||||||||||||
| Year Ended December 31, 2009 |
$ | 32,859 | $ | 40,620 | $ | 5,222 | $ | 46,156 | $ | 32,545 | |||||
| Year Ended December 31, 2008 |
$ | 29,426 | $ | 37,074 | $ | 4,442 | $ | 38,083 | $ | 32,859 | |||||
| Year Ended December 31, 2007 |
$ | 27,240 | $ | 36,490 | $ | 4,780 | $ | 39,084 | $ | 29,426 | |||||
110
Table of Contents
| FORM 10-K | NSTAR | DECEMBER 31, 2009 |
Pursuant to the requirements of Section 13 or 15(d) of the Securities Exchange Act of 1934, the registrant has duly caused this report to be signed on its behalf by the undersigned, thereunto duly authorized.
| NSTAR | ||||||
| (Registrant) | ||||||
| Date: February 5, 2010 | By: | /s/ R. J. WEAFER, JR. | ||||
| Robert J. Weafer, Jr. | ||||||
| Vice President, Controller and Chief Accounting Officer | ||||||
Pursuant to the requirements of the Securities Exchange Act of 1934, this report has been signed below by the following persons on behalf of the registrant and in the capacities indicated as of the 5th day of February 2010.
| Signature |
Title | |
| /s/ THOMAS J. MAY Thomas J. May |
Chairman, President, Chief Executive Officer and Trustee | |
| /s/ JAMES J. JUDGE James J. Judge |
Senior Vice President and Chief Financial Officer | |
| /s/ G. L. COUNTRYMAN Gary L. Countryman |
Trustee | |
| /s/ THOMAS G. DIGNAN, JR. Thomas G. Dignan, Jr. |
Trustee | |
| /s/ JAMES S. DISTASIO James S. DiStasio |
Trustee | |
| /s/ CHARLES K. GIFFORD Charles K. Gifford |
Trustee | |
| /s/ MATINA S. HORNER Matina S. Horner |
Trustee | |
| /s/ PAUL A. LA CAMERA Paul A. La Camera |
Trustee | |
| /s/ SHERRY H. PENNEY Sherry H. Penney |
Trustee | |
| /s/ WILLIAM C. VAN FAASEN William C. Van Faasen |
Trustee | |
| /s/ G. L. WILSON Gerald L. Wilson |
Trustee | |
111