Attached files
Table of Contents
UNITED STATES
SECURITIES AND EXCHANGE COMMISSION
Washington, D.C. 20549
FORM 10-K
| x | ANNUAL REPORT PURSUANT TO SECTION 13 OR 15(d) OF THE SECURITIES EXCHANGE ACT OF 1934 |
For the fiscal year ended December 31, 2009
OR
| ¨ | TRANSITION REPORT PURSUANT TO SECTION 13 OR 15(d) OF THE SECURITIES EXCHANGE ACT OF 1934 |
For the Transition period from to
Commission file number 1-08951
M.D.C. HOLDINGS, INC.
(Exact name of Registrant as specified in its charter)
| Delaware | 84-0622967 | |
| (State or other jurisdiction of incorporation or organization) |
(I.R.S. Employer Identification No.) | |
| 4350 South Monaco Street, Suite 500 Denver, Colorado |
80237 | |
| (Address of principal executive offices) | (Zip code) | |
(303) 773-1100
(Registrant’s telephone number, including area code)
Securities registered pursuant to Section 12(b) of the Act:
| Title of each class |
Name of each exchange on which registered | |
| Common Stock, $.01 par value | New York Stock Exchange | |
| 7% Senior Notes due December 2012 | New York Stock Exchange | |
| 5 1/2% Senior Notes due May 2013 | New York Stock Exchange | |
| 5 3/8% Senior Notes due December 2014 | New York Stock Exchange | |
| 5 3/8% Senior Notes due July 2015 | New York Stock Exchange | |
| 5 5/8% Senior Notes due January 2020 | New York Stock Exchange |
Securities registered pursuant to Section 12(g) of the Act: None
Indicate by check mark if the Registrant is a well-known seasoned issuer, as defined in Rule 405 of the Securities Act. Yes x No ¨
Indicate by check mark if the Registrant is not required to file reports pursuant to Section 13 or Section 15(d) of the Exchange Act. Yes ¨ No x
Indicate by check mark whether the Registrant (1) has filed all reports required to be filed by Section 13 or 15(d) of the Securities Exchange Act of 1934 during the preceding 12 months (or for such shorter period that the Registrant was required to file such reports) and (2) has been subject to such filing requirements for the past 90 days. Yes x No ¨
Indicate by check mark whether the registrant has submitted electronically and posted on its corporate Web site, if any, every Interactive Data File required to be submitted and posted pursuant to Rule 405 of Regulation S-T (§232.405 of this chapter) during the preceding 12 months (or for such shorter period that the registrant was required to submit and post such files). Yes ¨ No ¨
Indicate by check mark if disclosure of delinquent filers pursuant to Item 405 of Regulation S-K is not contained herein, and will not be contained, to the best of Registrant’s knowledge, in definitive proxy or information statements incorporated by reference in Part III of this Form 10-K or any amendment to this Form 10-K. x
Indicate by check mark whether the Registrant is a large accelerated filer, an accelerated filer, non-accelerated filer, or a smaller reporting company. See definition of “large accelerated filer,” “accelerated filer,” and “smaller reporting company” in Rule 12b-2 of the Exchange Act.
| Large Accelerated Filer |
x |
Accelerated Filer |
¨ | |||||||
| Non-Accelerated Filer |
¨ |
(Do not check if a smaller reporting company) | Smaller Reporting Company |
¨ | ||||||
Indicated by check mark whether the Registrant is a shell company (as defined in Rule 12b-2 of the Exchange Act). Yes ¨ No x
As of June 30, 2009, the aggregate market value of the Registrants’ common stock held by non-affiliates of the Registrants was $1.1 billion based on the closing sales price of $30.11 per share as reported on the New York Stock Exchange.
As of December 31, 2009, the number of shares outstanding of Registrant’s common stock was 47,069,561.
DOCUMENTS INCORPORATED BY REFERENCE
Portions of part III of this Form 10-K are incorporated by reference from the Registrant’s 2010 definitive proxy statement to be filed with the Securities and Exchange Commission no later than 120 days after the end of the Registrant’s fiscal year.
Table of Contents
FORM 10-K
FOR THE YEAR ENDED DECEMBER 31, 2009
TABLE OF CONTENTS
| Page No. | ||||||
| PART I | ||||||
| ITEM 1. | 1 | |||||
| 1 | ||||||
| 2 | ||||||
| 2 | ||||||
| 2 | ||||||
| ITEM 1A. | 12 | |||||
| ITEM 1B. | 21 | |||||
| ITEM 2. | 21 | |||||
| ITEM 3. | 21 | |||||
| ITEM 4. | 22 | |||||
| PART II |
||||||
| ITEM 5. | 23 | |||||
| ITEM 6. | 24 | |||||
| ITEM 7. | Management’s Discussion and Analysis of Financial Condition |
28 | ||||
| ITEM 7A. | 80 | |||||
| ITEM 8. | F-1 | |||||
| ITEM 9. | Changes in and Disagreements With Accountants on Accounting |
83 | ||||
| ITEM 9A. | 83 | |||||
| ITEM 9B. | 85 | |||||
| PART III |
||||||
| ITEM 10. |
85 | |||||
| ITEM 11. |
85 | |||||
| ITEM 12. |
Security Ownership of Certain Beneficial Owners and Management |
86 | ||||
| ITEM 13. |
Certain Relationships and Related Transactions, and Director Independence |
86 | ||||
| ITEM 14. |
86 | |||||
| PART IV |
||||||
| ITEM 15. |
87 | |||||
| SIGNATURES | 93 | |||||
(i)
Table of Contents
M.D.C. HOLDINGS, INC.
FORM 10-K
PART I
Forward-Looking Statements.
Certain statements in this Annual Report on Form 10-K, the Company’s Annual Report to Shareowners, as well as statements made by us in periodic press releases, oral statements made by our officials in the course of presentations about the Company and conference calls in connection with quarterly earnings releases, constitute “forward-looking statements” within the meaning of the Private Securities Litigation Reform Act of 1995. These forward-looking statements include statements regarding our business, financial condition, results of operation, cash flows, strategies and prospects. Although we believe that the expectations reflected in the forward-looking statements contained in this Annual Report on Form 10-K are reasonable, we cannot guarantee future results. These statements involve known and unknown risks, uncertainties and other factors that may cause the actual results, performance or achievements of the Company to be materially different from those expressed or implied by the forward-looking statements. These factors include those described under the caption “Risk Factors Relating to our Business” in Item 1A of this Annual Report on Form 10-K. We undertake no obligation to publicly update any forward-looking statements, whether as a result of new information, future events or otherwise. However, any further disclosures made on related subjects in subsequent reports on Forms 10-K, 10-Q and 8-K should be consulted.
| Item 1. | Business. |
| (a) | General Development of Business |
M.D.C. Holdings, Inc. is a Delaware corporation. We refer to M.D.C. Holdings, Inc. as the “Company,” “MDC,” “we” or “our” in this Annual Report on Form 10-K, and these designations include our subsidiaries unless we state otherwise. We have two primary operations, homebuilding and financial services. Our homebuilding operations consist of wholly-owned subsidiary companies that generally purchase finished lots for the construction and sale of single-family detached homes to first-time and first-time move-up homebuyers under the name “Richmond American Homes.” Our homebuilding operations are comprised of many homebuilding subdivisions that we consider to be our operating segments. Homebuilding subdivisions in a given market are aggregated into reportable segments as follows: (1) West (Arizona, California and Nevada); (2) Mountain (Colorado and Utah); (3) East (Maryland, Virginia, which includes Virginia and West Virginia, and Delaware Valley, which includes Pennsylvania, Delaware and New Jersey); and (4) Other Homebuilding (Florida and Illinois, although we began our exit of the Illinois market during the 2008 third quarter).
Our Financial Services and Other segment consists of HomeAmerican Mortgage Corporation (“HomeAmerican”), which originates mortgage loans primarily for our homebuyers, American Home Insurance Agency, Inc. (“American Home Insurance”), which offers third-party insurance products to our homebuyers, and American Home Title and Escrow Company (“American Home Title”), which provides title agency services to the Company and our homebuyers in Colorado, Florida, Maryland, Nevada and Virginia. This segment also includes Allegiant Insurance Company, Inc., A Risk Retention Group (“Allegiant”), which provides to its customers, primarily many of our homebuilding subsidiaries and certain subcontractors of these homebuilding subsidiaries, general liability coverage for construction work performed associated with closed homes, and StarAmerican Insurance Ltd. (“StarAmerican”), a Hawaii corporation and a wholly-owned subsidiary of MDC. StarAmerican has agreed to re-insure: (1) all claims pursuant to two policies issued to the Company by a third-party; and (2) pursuant to agreements beginning in June 2004, all Allegiant claims in excess of $50,000 per occurrence, up to $3.0 million per occurrence, subject to various aggregate limits, not to exceed $18.0 million per year through June 30, 2009. Effective July 1, 2009, StarAmerican re-insures Allegiant for all claims in excess of $50,000 per occurrence, up to $3.0 million per occurrence, subject to various aggregate limits, not to exceed $6.0 million per year.
- 1 -
Table of Contents
| (b) | Available Information |
We file annual, quarterly and current reports, proxy statements and other information with the Securities and Exchange Commission (“SEC”). Anyone seeking information about our business can receive copies of our 2009 Annual Report on Form 10-K, Annual Report to Shareholders, Quarterly Reports on Form 10-Q, Current Reports on Form 8-K, all amendments to those reports and other documents filed with the SEC at the public reference section of the SEC at 100 F Street, NE, Room 1580, Washington, D.C. 20549. These documents also may be obtained, free of charge, by: contacting our Investor Relations office at (720) 773-1100; writing to M.D.C. Holdings, Inc., Investor Relations, 4350 South Monaco Street, Suite 400, Denver, Colorado 80237; or accessing our website at www.richmondamerican.com. We make our Annual Report on Form 10-K, Quarterly Reports on Form 10-Q, Current Reports on Form 8-K and amendments to those reports filed or furnished pursuant to Section 13(a) or 15(d) of the Securities Exchange Act of 1934, available on our website as soon as reasonably practicable after we file or furnish the materials electronically with the SEC. To obtain any of this information, go to www.richmondamerican.com, select “Investors,” “Financial Reports” and “SEC Filings.” Our website also includes our: (1) Corporate Governance Guidelines; (2) Corporate Code of Conduct; (3) Rules for Senior Financial Officers; (4) Audit Committee Procedures for Handling Confidential Complaints; and (5) charters for the Audit, Compensation and Nominating and Corporate Governance Committees. These materials may be obtained, free of charge, at our website, http://ir.richmondamerican.com (select “Corporate Governance”).
| (c) | Financial Information About Industry Segments |
Note 4 to the Consolidated Financial Statements contains information regarding our reportable segments for each of the years ended December 31, 2009, 2008 and 2007.
| (d) | Narrative Description of Business |
Our business consists of two primary operations, homebuilding and financial services. We build and sell primarily single-family detached homes, that are designed and built to meet local customer preferences. We are the general contractor for all of our projects and retain subcontractors for land development and home construction. The base selling prices for our homes closed during 2009 ranged primarily from approximately $160,000 to $450,000. We build a variety of home styles in each of our markets, targeting generally first-time and first-time move-up homebuyers. Also, we build a limited number of homes for the second-time move-up and luxury homebuyers.
Our financial services include subsidiary businesses, which primarily provide mortgage financing, title insurance and homeowner insurance for our homebuyers.
- 2 -
Table of Contents
Homebuilding Operations.
Our homebuilding subsidiaries sell and close homes in geographically diverse markets. Our home sales revenue for the years ended December 31, 2009, 2008 and 2007 is set forth in the table below for each market within our homebuilding segments (dollars in thousands).
| Total Homes Sales Revenue | Percent of Total | |||||||||||||||||
| 2009 | 2008 | 2007 | 2009 | 2008 | 2007 | |||||||||||||
| Arizona |
$ | 151,175 | $ | 284,279 | $ | 702,418 | 18% | 21% | 26% | |||||||||
| California |
122,309 | 253,400 | 588,562 | 15% | 19% | 21% | ||||||||||||
| Nevada |
104,844 | 193,640 | 385,751 | 12% | 14% | 14% | ||||||||||||
| West |
378,328 | 731,319 | 1,676,731 | 45% | 54% | 61% | ||||||||||||
| Colorado |
178,827 | 202,882 | 284,419 | 21% | 15% | 10% | ||||||||||||
| Utah |
66,035 | 89,500 | 255,273 | 8% | 6% | 9% | ||||||||||||
| Mountain |
244,862 | 292,382 | 539,692 | 29% | 21% | 19% | ||||||||||||
| Delaware Valley |
24,966 | 36,986 | 80,057 | 3% | 2% | 3% | ||||||||||||
| Maryland |
59,504 | 89,504 | 149,917 | 7% | 7% | 6% | ||||||||||||
| Virginia |
91,602 | 116,867 | 167,194 | 11% | 9% | 6% | ||||||||||||
| East |
176,072 | 243,357 | 397,168 | 21% | 18% | 15% | ||||||||||||
| Florida |
45,896 | 80,132 | 129,880 | 5% | 6% | 5% | ||||||||||||
| Illinois |
6,887 | 25,742 | 39,126 | 1% | 2% | 1% | ||||||||||||
| Texas |
- | - | 3,369 | 0% | 0% | 0% | ||||||||||||
| Other Homebuilding |
52,783 | 105,874 | 172,375 | 6% | 8% | 6% | ||||||||||||
| Intercompany adjustments |
(14,991 | ) | (14,784 | ) | (19,985 | ) | -1% | -1% | -1% | |||||||||
| Total |
$ | 837,054 | $ | 1,358,148 | $ | 2,765,981 | 100% | 100% | 100% | |||||||||
Economies of Scale. We believe that, notwithstanding the substantial reduction in the size of our homebuilding business, our scale of operations has afforded us benefits such as:
| • | the ability to sustain operations in most of our markets (although we may choose not to do so); |
| • | the ability to negotiate volume contracts with material suppliers and subcontractors; |
| • | access to affordable insurance coverage; and |
| • | access to lower cost capital. |
Operating Divisions. In our homebuilding segments, our primary functions include land acquisition and development, home construction, purchasing, sales and marketing, and customer service. Operating decisions are made on a subdivision-by-subdivision basis under the oversight of our Chief Operating Decision Makers (“CODMs”), defined as our Chief Executive Officer, Chief Operating Officer and Chief Financial Officer. Generally, each operating division consists of a division president land procurement, sales, construction, customer service, finance, purchasing, and office staff. The Company’s organizational structure (i.e. the grouping and reporting of subdivisions and divisions) changes based upon the current needs of the Company. At December 31, 2009 and December 31, 2008, we had 9 and 10 homebuilding operating divisions, respectively. Officers of our divisions generally receive performance-related bonuses based upon achieving targeted financial and operational results in their respective operating divisions.
Corporate Management. We manage our homebuilding business primarily through members of senior management in our Corporate segment and our Asset Management Committees (“AMCs”). Each AMC is comprised of the COO and two of the Company’s corporate officers or employees. One of the AMCs reviews and approves all
- 3 -
Table of Contents
subdivision acquisition transactions in accordance with land resource allocation decisions made by the CODMs. Land acquisition transactions may not proceed without approval by that AMC and/or our CODMs. Generally, the role of our senior management team and/or AMC includes:
| • | review and approval of division business plans and budgets; |
| • | oversight of land and home inventory levels; |
| • | review of major personnel decisions; and |
| • | review of capital allocation decisions. |
Additionally, our corporate executives and corporate and national departments generally are responsible for establishing and monitoring compliance with our policies and procedures. Among other things, the corporate office has primary responsibility for:
| • | asset management and capital allocation; |
| • | treasury; |
| • | risk management; |
| • | merchandising and marketing; |
| • | purchasing; |
| • | accounting, tax and internal audit functions; |
| • | legal matters; |
| • | human resources and payroll; |
| • | information technology; and |
| • | training and development. |
Housing. Generally, we build single-family detached homes in a number of standardized series, designed to provide variety in the size and style of homes for our potential homebuyers. Within each series, we build several different floor plans offering standard and optional features (such as upgraded appliances, cabinetry, flooring, etc.). Differences in sales prices of similar models from market-to-market depend primarily upon different costs (e.g. land acquisition costs), homebuyer demand, home prices offered by our competitors, market conditions impacting our sub-markets such as home foreclosure levels, location, optional features and design specifications. The series of homes offered at a particular location is based on perceived customer preferences, lot size, area demographics and, in certain cases, the requirements of major land sellers and local municipalities.
We seek to maintain limited levels of inventories of unsold homes in our markets. Unsold homes in various stages of completion allow us to meet the immediate and near-term demands of prospective homebuyers. In our efforts to mitigate the risk of carrying excess inventory, we have developed procedures through which we attempt to control the number of our unsold homes under construction and the number of homes in inventory due to home order cancellations. The table below shows the stage of construction for our unsold homes completed or under construction, number of sold homes under construction and model homes (in units).
| December 31, 2009 |
December 31, 2008 |
December 31, 2007 | ||||
| Unsold Homes Under Construction - Final |
41 | 451 | 515 | |||
| Unsold Homes Under Construction - Frame |
389 | 329 | 656 | |||
| Unsold Homes Under Construction - Foundation |
109 | 41 | 229 | |||
| Total Unsold Homes Under Construction |
539 | 821 | 1,400 | |||
| Sold Homes Under Construction |
570 | 409 | 1,350 | |||
| Model Homes |
212 | 387 | 730 | |||
| Homes Completed or Under Construction |
1,321 | 1,617 | 3,480 | |||
- 4 -
Table of Contents
Land Acquisition and Development. We acquire our lots with the intention of constructing and selling homes on the acquired land. Generally, we purchase finished lots using option contracts, in phases or in bulk for cash. On a limited basis, we acquire entitled land for development into finished lots when we believe that the risk is justified. In making land purchases, we consider a number of factors, including projected rates of return, estimated Home Gross Margins (defined as home sales revenue less home cost of sales as a percent of home sales revenue), sales prices of the homes to be built, population and employment growth patterns, proximity to developed areas, estimated costs of development, estimated levels of competition and demographic trends. Generally, we acquire finished lots and land for development only in areas that will have, among other things, available building permits, utilities and suitable zoning. We attempt to maintain a supply of finished lots sufficient to enable us to start homes promptly after a contract for a home sale is executed. See “Forward-Looking Statements” above.
In our option contracts, we generally obtain the right to purchase lots in consideration for an option deposit in the form of cash or letters of credit. In the event we elect not to purchase the lots within a specified period of time, we may be required to forfeit the option deposit. Our option contracts generally do not contain provisions requiring our specific performance. During the years ended December 31, 2009, 2008 and 2007, we wrote-off lot option deposits and pre-acquisition costs of $2.9 million, $6.7 million and $23.4 million, respectively, which have been included in other operating expenses in the Consolidated Statements of Operations. At December 31, 2009, we had the right to acquire 2,584 lots under option contracts, with non-refundable cash and letters of credit option deposits of $7.7 million and $2.1 million at risk.
From time to time, we may own or have the right under option contracts to acquire undeveloped parcels of real estate that we intend to develop into finished lots. We develop our land in phases in order to limit our risk in a particular subdivision and to efficiently employ available resources. Building permits and utilities are available and zoning is suitable for the current intended use of substantially all of our undeveloped land. When developed, these lots generally will be used in our homebuilding activities. See “Forward-Looking Statements” above.
The table below shows the carrying value of land and land under development, by homebuilding segment, at December 31, 2009, 2008 and 2007 (in thousands).
| December 31, | |||||||||
| 2009 | 2008 | 2007 | |||||||
| West |
$ | 97,220 | $ | 58,244 | $ | 226,621 | |||
| Mountain |
121,499 | 129,327 | 225,732 | ||||||
| East |
35,572 | 46,928 | 100,349 | ||||||
| Other Homebuilding |
8,569 | 7,072 | 21,383 | ||||||
| Total |
$ | 262,860 | $ | 241,571 | $ | 574,085 | |||
- 5 -
Table of Contents
The table below shows the number of lots owned and controlled under option (excluding lots in housing completed or under construction), by homebuilding segment, at December 31, 2009, 2008 and 2007 (in units).
| December 31, | ||||||
| 2009 | 2008 | 2007 | ||||
| Lots Owned |
||||||
| West |
2,622 | 3,408 | 6,009 | |||
| Mountain |
3,059 | 3,239 | 3,855 | |||
| East |
423 | 532 | 822 | |||
| Other Homebuilding |
279 | 398 | 829 | |||
| Total |
6,383 | 7,577 | 11,515 | |||
| Lots Controlled Under Option |
||||||
| West |
663 | 716 | 673 | |||
| Mountain |
654 | 184 | 262 | |||
| East |
767 | 987 | 2,196 | |||
| Other Homebuilding |
500 | 471 | 484 | |||
| Total |
2,584 | 2,358 | 3,615 | |||
| Total Lots Owned and Controlled |
8,967 | 9,935 | 15,130 | |||
The table below shows the amount of non-refundable option deposits (in thousands).
| December 31, | |||||||||
| 2009 | 2008 | 2007 | |||||||
| Cash |
7,654 | $ | 5,145 | $ | 6,292 | ||||
| Letters of Credit |
2,134 | 4,358 | 6,547 | ||||||
| Total Non-refundable Option Deposits |
$ | 9,788 | $ | 9,503 | $ | 12,839 | |||
Labor and Raw Materials. For the most part, materials used in our homebuilding operations are standard items carried by major suppliers. We generally contract for our materials and labor at a fixed price for the anticipated construction period of our homes. This allows us to mitigate the risks associated with increases in building materials and labor costs between the time construction begins on a home and the time it is closed. Increases in the cost of building materials and subcontracted labor may reduce Home Gross Margins to the extent that market conditions prevent the recovery of increased costs through higher home sales prices. From time to time and to varying degrees, we may experience shortages in the availability of building materials and/or labor in each of our markets. These shortages and delays may result in delays in the delivery of homes under construction, reduced Home Gross Margins, or both. See “Forward-Looking Statements” above.
Warranty. Our homes are sold with limited third-party warranties that generally provide for ten years of structural coverage (“structural warranty”), two years of coverage for plumbing, electrical, heating, ventilation and air conditioning systems, and one year of coverage for workmanship and materials. Under our agreement with the issuer of the third-party warranties, we are responsible for performing all of the work for the first two years of the warranty coverage, and substantially all of the work required to be performed during years three through ten of the warranties. As a result, warranty reserves are established as homes close on a house-by-house basis in an amount estimated to be adequate to cover expected costs of materials and outside labor during warranty periods. Reserves for warranty-related work are determined based upon historical experience with respect to similar home styles and geographical areas. Certain factors are considered in determining the per-house reserve amount, including: (1) trends in the historical warranty payment levels, including the historical amount paid as a percent of home construction costs;
- 6 -
Table of Contents
(2) the historical range of amounts paid per house; (3) any warranty expenditures included in (1) and (2) not considered to be normal and recurring; (4) improvements in quality control and construction techniques expected to impact future warranty expenditures; and (5) expertise of division personnel.
Seasonal Nature of Business. Prior to 2007, we experienced noticeable seasonality and quarter-to-quarter variability in homebuilding activity levels. In general, the number of homes closed and associated home sales revenue increased during the third and fourth quarters, compared with the first and second quarters. We believe that this seasonality reflected the historical tendency of homebuyers to purchase new homes in the spring with closings scheduled in the fall or winter, as well as the scheduling of construction to accommodate seasonal weather conditions in certain markets. During 2009, 2008 and 2007, this seasonality pattern was not as apparent in our financial or operating results. However, the extent to which our historical seasonality pattern contributed to actual 2009 and 2008 home sales and closing levels is unknown, and there can be no assurances that this seasonality pattern will be apparent in future reporting periods.
Backlog. At December 31, 2009 and 2008, homes under contract but not yet delivered (“Backlog”) totaled 826 and 533, respectively, with an estimated sales value of $265 million and $173 million, respectively. Our Cancellation Rates (as defined below) were 24% and 45% for the years ended December 31, 2009 and 2008, respectively. We define our home order “Cancellation Rate” as the approximate number of cancelled home order contracts during a reporting period as a percent of total home order contracts received during such reporting period. We anticipate that homes in Backlog at December 31, 2009 will close during 2010 under their existing home order contracts or through the replacement of an existing contract with a new home order contract. The estimated Backlog sales value at December 31, 2009 may be impacted by, among other things, subsequent home order cancellations and incentives provided after contract but prior to closing. See “Forward-Looking Statements” above.
The table below discloses our Backlog for the years ended December 31, 2009 and 2008 for each market within our homebuilding segments (dollars in thousands).
| December 31, | Increase (Decrease) | |||||||||||
| 2009 | 2008 | Amount | % | |||||||||
| Backlog (Units) |
||||||||||||
| Arizona |
103 | 158 | (55 | ) | -35% | |||||||
| California |
76 | 49 | 27 | 55% | ||||||||
| Nevada |
88 | 53 | 35 | 66% | ||||||||
| West |
267 | 260 | 7 | 3% | ||||||||
| Colorado |
207 | 72 | 135 | 188% | ||||||||
| Utah |
94 | 42 | 52 | 124% | ||||||||
| Mountain |
301 | 114 | 187 | 164% | ||||||||
| Delaware Valley |
23 | 27 | (4 | ) | -15% | |||||||
| Maryland |
103 | 58 | 45 | 78% | ||||||||
| Virginia |
73 | 36 | 37 | 103% | ||||||||
| East |
199 | 121 | 78 | 64% | ||||||||
| Florida |
59 | 35 | 24 | 69% | ||||||||
| Illinois |
- | 3 | (3 | ) | -100% | |||||||
| Other Homebuilding |
59 | 38 | 21 | 55% | ||||||||
| Total |
826 | 533 | 293 | 55% | ||||||||
| Estimated Backlog Sales Value |
$ | 265,000 | $ | 173,000 | $ | 92,000 | 53% | |||||
| Estimated Average Sales Price in Backlog |
$ | 320.8 | $ | 324.6 | $ | (3.8 | ) | -1% | ||||
- 7 -
Table of Contents
Our December 31, 2009 Backlog increased by 293 units from December 31, 2008, primarily attributable to our Mountain and Other Homebuilding segments. Contributing to the improvement were significant efforts to increase traffic in our active subdivisions and generate sales through various advertising and sales promotions. This included a Company initiated sales program during the 2009 third quarter that focused on offering low mortgage interest rates. Also contributing to the increased Backlog was the impending expiration of the federal homebuyer tax credit, which was subsequently revised to expire for homes sold by April 30, 2010 and closed by June 30, 2010. The estimated backlog sales value increased at December 31, 2009, compared with 2008, due to the 55% increase in the number of homes in Backlog.
Customer Service and Quality Control. Our homebuilding divisions are responsible for pre-closing quality control inspections and responding to customers’ post-closing needs. We have a product service and quality control program, focused on making improvements in our customers’ complete home buying and homeownership experience.
Marketing and Sales. We evaluate our marketing and sales programs and initiatives in order to attract homebuyers in a cost effective manner. To communicate our Richmond American Homes brand and sales promotions, we have a centralized in-house advertising and marketing department that generally oversees the communication of the Company’s brand and promotion efforts. The main objective of this department is to direct potential homebuyers to our sales offices, Home Galleries and Homebuyer Resource Centers through our richmondamerican.com website and various advertising outlets. In addition, our in-house corporate communications team manages our public relations and employee communications, and maintains our website.
To complement our marketing efforts, our in-house merchandising team furnishes our model homes and sales offices with the objective of providing a consistent presentation in developing our Richmond American Homes brand.
Our home sales strategy is directed at communicating the inherent value of our homes to our prospective homebuyers and distinguishing our product and pricing (including incentives) from our competitors or other home buying opportunities. In the sales process, we negotiate the terms of a home sales contract with a prospective homebuyer, including base sales price, any options and upgrades (such as upgraded appliances, cabinetry, flooring, etc.), and any home sales incentives. Our incentives generally come in the form of: (1) discounts on the sales price of the home; (2) homebuyer closing cost assistance paid by Richmond American Homes to a third-party; (3) mortgage loan origination fees paid by Richmond American Homes to HomeAmerican; and (4) interest rate buydowns by HomeAmerican in mortgage loan originations offered to our homebuyers. The combination of incentives offered to prospective homebuyers may vary from subdivision-to-subdivision and from home-to-home, and may be revised during the home closing process based upon homebuyer preferences or upon changes in market conditions, such as changes in our competitors’ pricing. Additionally, our home sales strategy also includes deploying capital to build limited supplies of new, more affordable inventory with the requirement that the construction of these homes stops at drywall. This allows our potential homebuyers to have the opportunity to personalize the homes with upgrades from one of our Home Galleries or design centers. We believe that this strategy will help us to turn our inventories more quickly while we maintain Home Gross Margins similar to those received for a build-to-order home. See “Forward-Looking Statements” above.
Home Gallery and Design Center. Another important part of our marketing presentation takes place in our design centers, which are located in most of our homebuilding markets. Homebuyers are able to customize certain features of their homes by selecting from a variety of options and upgrades. Our Home Gallery concept provides sales support and customized options for prospective homebuyers to personalize their new homes. These retail locations also serve as a resource to homebuyers who are interested in purchasing a new home from us. Prospective homebuyers can receive individualized attention from a trained team of new home specialists, resulting in a more focused, efficient home search.
- 8 -
Table of Contents
Competition. The homebuilding industry is fragmented and highly competitive. The competitive nature of our business is described in more detail in “Risk Factors—Risks Relating to our Business—Increased competition levels in the homebuilding and mortgage lending industries could result in lower net home orders, closings and decreases in the average selling prices of sold and closed homes, which could have a negative impact on our home sales revenue and results of operations.”
Regulation. Our homebuilding operations are subject to compliance with applicable laws and regulations, which are described in more detail in “Risk Factors—Risks Relating to our Business—Our business is subject to numerous federal, local, state laws and regulations concerning land development, construction of homes, sales, mortgage lending, environmental and other aspects of our business. These laws and regulations could give rise to additional liabilities or expenditures, or restrictions on our business.”
Performance Bonds and Letters of Credit. We are often required to obtain performance bonds and/or letters of credit in support of our obligations primarily for land development and subdivision improvements, homeowner association dues and start-up expenses, warranty work, contractor license fees and earnest money deposits. At December 31, 2009 and December 31, 2008, we had outstanding performance bonds totaling $118.4 million and $172.3 million, respectively, and letters of credit totaling $21.4 million and $37.4 million, respectively, including $4.2 million and $9.1 million, respectively, issued by HomeAmerican. In the event performance bonds or letters of credit issued by third-parties are called, our indemnity obligations could require us to reimburse the issuer of the performance bond or letter of credit. See “Forward-Looking Statements” above.
In certain states, we are restricted from using earnest money deposits (“Deposits”) for general purposes, unless we take measures to release state imposed restrictions on the Deposits received from homebuyers in conjunction with home sales, which may include posting blanket security bonds. In this regard, at December 31, 2009 and 2008, we had $4.5 million and $4.5 million, respectively, outstanding in blanket security bonds used to release restrictions on certain Deposits. Additionally, we had $0.5 million and $0.7 million in restricted cash related to Deposits at December 31, 2009 and 2008, respectively. We monitor the amount of Deposits we hold in certain states to confirm that our blanket security bonds exceed the amount of the Deposits.
Financial Services and Other Segment.
Mortgage Lending Operations.
General. HomeAmerican is a full-service mortgage lender and the principal originator of mortgage loans for our homebuyers. HomeAmerican has a centralized loan processing center where it originates mortgage loans primarily for our homebuyers. HomeAmerican also brokers mortgage loans for origination by outside lending institutions for our homebuyers.
HomeAmerican is authorized to originate Federal Housing Administration-insured (“FHA”), Veterans Administration-guaranteed (“VA”), Federal National Mortgage Association (“Fannie Mae”), Federal Home Loan Mortgage Corporation (“Freddie Mac”) (together “the government sponsored entities”) and other private investor mortgage loans. HomeAmerican also is an authorized loan servicer for Fannie Mae and Freddie Mac and, as such, is subject to the rules and regulations of these entities.
Effective November 12, 2008, we began to use HomeAmerican’s mortgage repurchase facility, in addition to Company generated funds, to finance the origination of mortgage loans until they are sold. Prior to November 12, 2008, we used HomeAmerican’s secured warehouse line of credit and Company generated funds to finance the origination of mortgage loans until they were sold. HomeAmerican generally sells originated mortgage loans to third-party purchasers on either a bulk or flow basis. Mortgage loans sold on a bulk basis generally include the sale of a
- 9 -
Table of Contents
package of substantially similar originated mortgage loans, while sales of mortgage loans on a flow basis generally are completed as HomeAmerican originates each loan. Mortgage loans sold to third-party purchasers generally include HomeAmerican’s representations and warranties with respect to certain borrower payment defaults, credit quality issues and/or misrepresentations made by us or our homebuyers. Substantially all of the mortgage loans originated by HomeAmerican are sold to third-party purchasers within 45 days of origination.
Concurrent with the sale of mortgage loans to third-party purchasers, HomeAmerican generally sells the rights to service those loans. HomeAmerican’s portfolio of mortgage loan servicing for others at December 31, 2009 and December 31, 2008 consisted of 574 and 659 mortgage loans, respectively, with an unpaid principal balance of approximately $81.3 million and $89.7 million, respectively, and did not contribute significantly to our results of operations.
The following table sets forth the percent of mortgage loans sold to Bank of America (formerly known as Countrywide), Wells Fargo Funding, Inc. and Chase Manhattan Mortgage Corporation during the years ended December 31, 2009, 2008 and 2007.
| Year Ended December 31, | ||||||
| 2009 | 2008 | 2007 | ||||
| Wells Fargo Funding, Inc. |
45% | 59% | 23% | |||
| Bank of America |
34% | 23% | 51% | |||
| Chase Manhattan Mortgage Corporation |
18% | 13% | 2% | |||
Pipeline. HomeAmerican’s mortgage loans in process that had not closed (the “Pipeline”) at December 31, 2009 and December 31, 2008 had an aggregate principal balance of approximately $63.5 million and $29.7 million, respectively, of which $51.7 million and $25.2 million, respectively, were under interest rate lock commitments (“IRLC”) at an average interest rate of 4.65% and 4.96%, respectively. In addition, HomeAmerican had $62.3 million and $68.6 million of mortgage loans held-for-sale at December 31, 2009 and 2008, respectively. HomeAmerican uses forward sales of mortgage-backed securities and commitments to sell whole loans to hedge the interest rate risk inherent in the IRLC and its loan inventory held-for-sale. See “Forward-Looking Statements” above.
Forward Sales Commitments. HomeAmerican is exposed to market risks related to fluctuations in interest rates due to its mortgage loan inventory. Derivative instruments used in the normal course of business by HomeAmerican include forward sales of mortgage-backed securities, commitments to sell whole loans and commitments to originate mortgage loans. HomeAmerican utilizes forward mortgage securities contracts to manage the price risk due to fluctuations in interest rates on our mortgage loans owned and the IRLC. Such contracts are the only significant financial derivative instruments used by us and generally are settled within 60 days of origination. Due to this economic hedging activity, we believe the market risk associated with HomeAmerican’s mortgages is limited. Reported gains on sales of mortgage loans may vary significantly from period to period depending on the volatility in the interest rate market. See “Forward-Looking Statements” above.
Competition. The mortgage industry is fragmented and highly competitive. The competitive nature of our business is described in more detail in “Risk Factors—Risks Relating to our Business—Increased competition levels in the homebuilding and mortgage lending industries could result in lower net home orders, closings and decreases in the average selling prices of sold and closed homes, which could have a negative impact on our home sales revenue and results of operations.”
Regulation. Our mortgage lending operations are subject to compliance with applicable laws and regulations, which are described in more detail in “Risk Factors—Risks Relating to our Business—Our business is subject to numerous federal, local, state laws and regulations concerning land development, construction of homes, sales,
- 10 -
Table of Contents
mortgage lending, environmental and other aspects of our business. These laws and regulations could give rise to additional liabilities or expenditures, or restrictions on our business.”
Insurance Operations.
Our insurance operations consist of three business divisions: (1) Allegiant; (2) StarAmerican; and (3) American Home Insurance.
Allegiant and StarAmerican were formed to provide insurance coverage of homebuilding risks for which we believed insurance coverage was either too difficult or too expensive to obtain. Allegiant was organized as a risk retention group under the Federal Liability Risk Retention Act of 1981. Allegiant, which began operations in June of 2004, is licensed as a Class 3 Stock Insurance Company by the Division of Insurance of the State of Hawaii and is subject primarily to the regulations of its state of incorporation. Allegiant generates revenue by providing to its customers, primarily certain subcontractors of MDC’s homebuilding subsidiaries, general liability coverage during the construction of the Company’s homes and for work performed in completed subdivisions. Allegiant seeks to provide to its customers coverage and insurance rates that are competitive with other insurers.
StarAmerican is a single parent captive insurance company licensed by the Division of Insurance of the State of Hawaii and is a wholly owned subsidiary of MDC. Pursuant to agreements beginning in June 2004, StarAmerican re-insures Allegiant for all claims in excess of $50,000 per occurrence up to $3.0 million per occurrence, subject to various aggregate limits, which do not exceed $18.0 million per year. Effective July 1, 2009, StarAmerican re-insures Allegiant for all claims in excess of $50,000 per occurrence, up to $3.0 million per occurrence, subject to various aggregate limits, not to exceed $6.0 million per year.
Allegiant and StarAmerican incur expenses for losses and loss adjustments based on actuarial studies that include known facts and interpretations of circumstances, including the Company’s experience with similar insurance cases and historical trends involving insurance claim payment patterns, pending levels of unpaid insurance claims, mix or concentration of home styles, claim severity, claim frequency patterns such as those caused by natural disasters, fires, or accidents, depending on the business conducted, and changing regulatory and legal environments.
Regulations. Allegiant and StarAmerican are licensed in the State of Hawaii and, therefore, are subject to regulation by the Hawaii Insurance Division. This regulation includes restrictions and oversight regarding: types of insurance provided; investment options; required capital and surplus; financial and information reporting; use of auditors, actuaries and other service providers; periodic examinations; and other operational items. As insurance companies organized under Hawaii’s insurance laws, Allegiant and StarAmerican are subject to fewer regulations than non-captive insurance companies. As a risk retention group, Allegiant also is registered in other states where certain MDC subsidiaries do business. Allegiant must pay premium taxes and may be required to comply with certain financial and information reporting requirements of the insurance departments in these additional states.
American Home Insurance is an insurance agency, which provides homebuyers with personal property and casualty insurance products in the same markets as our homebuilding subsidiaries.
Title Operations.
American Home Title provides title agency services to us and our homebuyers in Colorado, Florida, Maryland, Nevada and Virginia.
- 11 -
Table of Contents
Employees.
The table below summarizes the approximate number of employees for our homebuilding, Financial Services and Other and Corporate segments at December 31, 2009 and 2008.
| December 31, | ||||
| 2009 | 2008 | |||
| Homebuilding segments |
721 | 932 | ||
| Financial Services and Other |
98 | 102 | ||
| Corporate |
270 | 241 | ||
| Consolidated |
1,089 | 1,275 | ||
| Item 1A. | Risk Factors. |
The homebuilding industry is undergoing a significant downturn, and its duration and ultimate severity are uncertain. A continuation or further deterioration in industry conditions or in the broader economic conditions could have additional adverse effects on our business and financial results.
The downturn in the homebuilding industry is in its fourth year, and it has become one of the most severe housing downturns in U.S. history. The significant declines in the demand for new homes, the significant oversupply of homes on the market and the significant reductions in the availability of financing for homebuyers that have marked the downturn are continuing. We have experienced uncertainty and continued low demand for new homes which negatively impacted our financial and operating results during the year ending December 31, 2009. It is not clear when these trends will reverse or when we will return to profitability.
Our ability to respond to the downturn has been limited by adverse industry and economic conditions. The significant amount of home mortgage foreclosures has increased supply and driven down prices, making the purchase of a foreclosed home an attractive alternative to purchasing a new home. Homebuilders have responded with significant concessions, further adding to the price declines. With the decline in the values of homes and in the inability of some homeowners to make their mortgage payments, the credit markets have been significantly disrupted, putting strains on many households and businesses. In the face of these conditions, the overall economy has weakened significantly, with high unemployment levels and substantially reduced consumer spending and confidence. As a result, demand for new homes remains at historically low levels.
If the downturn in the homebuilding and mortgage lending industries continues or intensifies, or if the national economy weakens further and the recession continues or intensifies, we could continue to experience declines in the market value of our inventory and demand for our homes, which could have a significant negative impact on our Home Gross Margins (which means our home sales revenue less home cost of sales as a percentage of home sales revenue) and financial and operating results. Additionally, if energy costs should increase, demand for our homes could be adversely impacted (because we are primarily a suburban residential builder), and the cost of building homes may increase, both of which could have a significant negative impact on our Home Gross Margins and financial and operating results. Also, while the United States government took steps during 2009 to provide tax incentives for homebuyers which contributed to the higher levels of new home orders during 2009, compared with 2008, the impact from the expiration of these incentives during 2010 is unknown and could result in declines in orders for new homes which would have a negative impact on our financial and operating results.
Additionally, as a result of the difficult economic environment, we may be subject to increased counterparty risks whereby third-parties, which may include, among others, banks under our homebuilding line of credit and mortgage
- 12 -
Table of Contents
repurchase facility, may not be willing or able to perform on obligations to us. To the extent a third-party is unable to meet its obligations to us, our financial position, results of operations and/or cash flows could be negatively impacted.
These challenging conditions are complex and interrelated. We cannot predict their duration or ultimate severity. Nor can we provide assurance that our responses to the homebuilding downturn or the government’s attempts to address the troubles in the overall economy will be successful.
Increased competition levels in the homebuilding and mortgage lending industries could result in lower net home orders, closings and decreases in the average selling prices of sold and closed homes, which could have a negative impact on our home sales revenue and results of operations.
The homebuilding industry is fragmented and highly competitive. Our homebuilding subsidiaries compete with numerous public and private homebuilders, including a number that are substantially larger and have greater financial resources than we do. Our homebuilding subsidiaries also compete with subdivision developers and land development companies, some of which are themselves homebuilders or affiliates of homebuilders. Homebuilders compete for customers, land, building materials, subcontractor labor and desirable financing. Competition for home orders primarily is based upon price, home style, financing available to prospective homebuyers, location of property, quality of homes built, customer service and general reputation in the community, and may vary market-by-market and/or submarket-by-submarket. Additionally, competition within the homebuilding industry can be impacted through an excess supply of new and existing homes available for sale resulting from a number of factors including, among other things, increases in speculative homes available for sale and increases in home foreclosures. Increased competition, including lower home sales prices offered by our competitors as experienced during 2009, can cause us to decrease our home sales prices and/or increase home sales incentives in an effort to generate new home sales and maintain homes in Backlog (homes under contract but not yet delivered) until they close. These competitive pressures are likely to continue for some time and could affect our ability to maintain existing home sales prices and require that we provide additional incentives, which would negatively impact our future financial and operating results.
Through our mortgage lending subsidiary, HomeAmerican, we also compete with numerous banks, thrifts and other mortgage bankers and brokers, many of which are larger and may have greater financial resources than we do. Competitive factors include pricing, mortgage loan terms, underwriting criteria and customer service. To the extent that we are unable to adequately compete with other companies that originate mortgage loans, total revenue and the results of operations from our Financial Services and Other segment may be negatively impacted.
Further decline in the market value of our homes or carrying value of our land would have a negative impact on our results of operations and financial position.
Our homebuilding subsidiaries acquire land for the replacement of land inventory and/or expansion within our current markets and may, from time to time, purchase land for expansion into new markets. The fair value of our land and land under development and housing completed or under construction inventory depends on market conditions. Factors that can impact our determination of the fair value of our inventory primarily include home sales prices, levels of home sales incentives and home construction costs. Our home sales prices and/or levels of home sales incentives can be impacted by, among other things, decreased demand for new homes, decreased home prices offered by our competitors, home foreclosure levels, decreased ability of our homebuyers to obtain suitable mortgage loan financing and continued high levels of home order cancellations. Additionally, our home construction costs can be impacted by, among other things, shortages of subcontractor labor and changes in costs associated with subcontracted labor, building materials and other resources. If we are required to decrease home sales prices and/or increase incentives in an effort to generate new home sales, maintain homes in Backlog until they close or remain competitive with the home sales prices offered by our competitors, or if our home construction costs increase, we may not be able to recover the carrying costs of our inventory when our homebuilding subsidiaries build and sell homes. Under such
- 13 -
Table of Contents
circumstances, we would be required to record additional impairments of our inventory. Additionally, due to the uncertainty in the homebuilding and mortgage lending industries and the overall United States economy, it is reasonably possible for us to experience declines in the market value of our homes and, as a result, additional inventory impairments could be recorded in future reporting periods. Any such additional inventory impairments would have a negative impact on our financial position and results of operations in the future reporting period in which they were recorded.
Our strategies in responding to the adverse conditions in the homebuilding industry and overall recession in the U.S. economy have had limited success, and the continued implementation of these and other strategies may not be successful.
While we have been successful in generating positive operating cash flow and have increased new home orders during 2009, compared with 2008, we continue to monitor and modify our strategies in responding to the current economic environment and the effectiveness of these strategies in future reporting periods is unknown. To the extent they are not successful, our financial and operating results may be adversely impacted.
Increases in our Cancellation Rate could have a negative impact on our Home Gross Margins and home sales revenue.
Home order cancellations can result from a number of factors, including declines, and/or slow appreciation, in the market value of homes, increases in the supply of homes available to be purchased, increased competition, higher mortgage interest rates, homebuyers’ inability to sell their existing homes, homebuyers’ inability to obtain suitable financing, including providing sufficient down payments, and adverse changes in economic conditions. Increased levels of home order cancellations would have a negative impact on our home sales revenue and financial and operating results in future reporting periods.
If land is not available at reasonable prices, our homes sales revenue and results of operations could be negatively impacted and/or we could be required to scale back our operations in a given market.
Our operations depend on our homebuilding subsidiaries’ ability to obtain land for the development of our residential communities at reasonable prices and with terms that meet our underwriting criteria. Our ability to obtain land for new residential communities may be adversely affected by changes in the general availability of land, the willingness of land sellers to sell land at reasonable prices given the deterioration in market conditions, competition for available land, availability of financing to acquire land, zoning, regulations that limit housing density, and other market conditions. If the supply of land, and especially finished lots, appropriate for development of residential communities continues to be limited because of these factors, or for any other reason, the number of homes that our homebuilding subsidiaries build and sell may continue to decline. Additionally, the ability of our homebuilding subsidiaries to open new subdivisions could be impacted if we elect not to purchase lots under option contracts. To the extent that we are unable to timely purchase land or enter into new contracts for the purchase of land at reasonable prices, due to the lag time between the time we acquire land and the time we begin selling homes, our home sales revenue and results of operations could be negatively impacted and/or we could be required to scale back our operations in a given market.
If mortgage interest rates rise or if mortgage financing otherwise becomes less affordable, it could adversely affect our sales and business, and the duration and ultimate severity of the effects are uncertain.
During the last three fiscal years, the mortgage lending industry has experienced significant instability, beginning with increased defaults on subprime loans and other nonconforming loans and compounded by expectations of increasing interest payment requirements and further defaults. This in turn resulted in a decline in the market value of
- 14 -
Table of Contents
many mortgage loans and related securities. Lenders, regulators and others questioned the adequacy of lending standards and other credit requirements for several loan products and programs offered in prior years. Credit requirements tightened, and investor demand for mortgage loans and mortgage-backed securities declined. The deterioration in credit quality has caused almost all lenders to eliminate subprime mortgages and most other loan products that are not eligible for sale to Fannie Mae or Freddie Mac or loans that do not meet FHA and VA requirements. Fewer loan products, tighter loan qualifications and a reduced willingness of lenders to make loans in turn have made it more difficult for many buyers to finance the purchase of our homes. These factors have served to reduce the pool of qualified homebuyers and made it more difficult to sell to first-time and move-up buyers which have long made up a substantial part of our customers. These reductions in demand have adversely affected our business and financial results, and the duration and severity of the effects are uncertain.
We believe that the liquidity provided by Fannie Mae and Freddie Mac to the mortgage industry has been very important to the housing market. These entities have required substantial injections of capital from the federal government and may require additional government support in the future. Any reduction in the availability of the financing provided by these institutions could adversely affect interest rates, mortgage availability and our sales of new homes and mortgage loans.
We believe that the purchases of mortgage-backed securities by the Federal Reserve System (the Fed) have helped to keep mortgage interest rates low during much of fiscal 2009. The Fed has announced its intention to end these purchases in early 2010. This action will likely lead to higher mortgage interest rates which would adversely impact our sales of homes.
Because of the decline in the availability of other mortgage products, FHA and VA mortgage financing support has become a more important factor in marketing our homes. The American Housing Rescue and Foreclosure Prevention Act of 2008, however, increased a buyer’s down payment requirement for FHA insured loans. In addition, increased demands on the FHA have resulted in a reduction of its cash reserves. These factors or further increases in down payment requirements or limitations or restrictions on the availability of FHA and VA financing support could adversely affect interest rates, mortgage availability and our sales of new homes and mortgage loans.
In February 2009, the American Recovery and Reinvestment Act of 2009 was enacted into law. This legislation included a federal tax credit for qualified first-time homebuyers purchasing a principal residence on or after January 1, 2009 and before December 1, 2009. In November 2009, this credit was expanded to be available to more homebuyers and extended until June 2010. Our sales in future periods may be adversely affected when this tax credit expires.
Even if potential customers do not need financing, changes in the availability of mortgage products may make it harder for them to sell their current homes to potential buyers who need financing.
If interest rates increase, the costs of owning a home will be affected and could result in further reductions in the demand for our homes. Similarly, potential changes to the tax code with respect to deduction of home mortgage interest payments or other changes may decrease affordability of homeownership.
In addition, the recently proposed Restoring American Financial Stability Act of 2009 contains provisions that require companies that sell products like mortgage-backed securities to retain at least 10% of the credit risk of the underlying assets. If this or other attempts to impose more risk on mortgage securitizers are enacted, the pricing and availability of mortgage products our customers rely on to purchase our homes may be adversely affected. Similarly, to the extent any future legislation attempts to enact credit risk retention requirements on mortgage originators, the risk profile of our financial services business and its support of our homebuilding business could be adversely affected.
- 15 -
Table of Contents
We have financial needs that we meet through the capital markets, including the debt and secondary mortgage markets, and continued disruptions in these markets could have an adverse impact on our results of operations, financial position and/or cash flows.
We have financial needs that we meet through the capital markets, including the debt and secondary mortgage markets. Reduced investor demand for mortgage loans and mortgage-backed securities in the secondary mortgage markets and increased investor yield requirements for those loans and securities and the exit of third-party purchasers from the secondary market may have an adverse impact on our results of operations, financial position and/or cash flows. In addition, the sources and terms and conditions of warehouse financing and mortgage repurchase arrangements and other lending arrangements for the mortgage lending industry are changing. These changes can impact, among other things, availability of capital, terms and structures for debt and line of credit agreements, collateral requirements and collateral advance rates. Additionally, while certain governmental organizations and other mortgage industry participants have taken steps to ease the downturn in the credit and capital markets, the on-going impact of their efforts, if any, on the homebuilding and mortgage lending industries is unknown.
In addition, the pricing matrix and the availability of advances and letters of credit under our homebuilding line of credit are dependent upon our credit ratings and leverage ratio, as defined. While we currently have an investment grade credit rating from all three major ratings agencies, the lowering of any or all of these credit ratings could have an adverse impact on the cost of advances, letters of credit and unused commitment fees under our homebuilding line of credit. Lower credit ratings for MDC also could subject this line of credit to a borrowing base structure, which could limit our ability to obtain additional advances and issuances of letters of credit under this line. Under certain circumstances, these limitations could have an adverse impact on our results of operations, financial position and/or cash flows.
In the ordinary course of business, we are required to obtain performance bonds, the unavailability of which could adversely affect our results of operations and/or cash flows.
As is customary in the homebuilding industry, we often are required to provide surety bonds to secure our performance under construction contracts, development agreements and other arrangements. Our ability to obtain surety bonds primarily depends upon our credit rating, capitalization, working capital, past performance, management expertise and certain external factors, including the overall capacity of the surety market and the underwriting practices of surety bond issuers. The ability to obtain surety bonds also can be impacted by the willingness of insurance companies to issue performance bonds. If we were unable to obtain surety bonds when required, our results of operations and/or cash flows could be adversely impacted.
Further uncertainty in the mortgage lending industry, including repurchase requirements associated with HomeAmerican’s sale of mortgage loans, could negatively impact our results of operations.
We are subject to risks associated with mortgage loans, including, among others, previously originated and sold Alt-A (as defined below), and sub-prime mortgage loans (as defined below), second mortgage loans, high loan-to-value mortgage loans and jumbo mortgage loans (mortgage loans with principal balances that exceed various thresholds in our markets). These risks may include, among other things, compliance with mortgage loan underwriting criteria and the associated homebuyers’ performance, which could require HomeAmerican to repurchase certain of those mortgage loans or provide indemnification. Repurchased mortgage loans could have a substantial impact on HomeAmerican’s results of operations, liquidity and cash flow as the existence of a defect that necessitated repurchase may require additional effort and expense incurred by HomeAmerican to cure the defect, the passage of time in order to cure or reduce the impact of an identified defect, a discounted sale of the repurchased loan due to the existence of a defect or, in the event that the loan has a defect and is non-performing, foreclosure and re-sale of the subject property.
- 16 -
Table of Contents
Additionally, during 2006 and 2005, HomeAmerican originated a significant number of second mortgage loans and Alt-A loans. However, subsequent to 2006, in response to the reduced liquidity in the mortgage lending industry, we tightened our mortgage loan underwriting criteria by discontinuing Alt-A mortgage loans, second mortgage loans, sub-prime mortgage loans and Non-Agency (defined as not being FHA, VA FNMA and FHLMC eligible) mortgage loans with combined-loan-to-values in excess of 95%. We define “Alt-A” loans as loans that would otherwise qualify as prime loans except that they do not comply in all ways with the documentation standards of the government sponsored enterprise guidelines. We define “sub-prime” mortgage loans as non-government insured mortgage loans that have Fair, Isaac & Company (FICO) scores less than or equal to 620. In the event we experience a significant increase in the number of Alt-A mortgage loans originated prior to 2008 that we are required to repurchase, our results of operations and cash flows would be adversely impacted.
Our homebuilding and financial services operations have concentration risks that could impact our results of operations.
We conduct a significant portion of our business in the Arizona, Colorado and Nevada markets and have generated a disproportionate amount of our revenue in these markets. If we experience a slowdown in our operations within these markets, our results of operations and financial position in future reporting periods will continue to be negatively impacted.
There are a limited number of third-party purchasers of mortgage loans and, at any given point in time, our business may be impacted adversely if one of them was no longer able or willing to purchase mortgage loans originated by HomeAmerican. Our operations could be impacted adversely due to reduced competition and having fewer bidders for originated mortgage loans we sell, which could result in us receiving a lower price for such originated mortgage loans.
Our business is subject to numerous federal, local and state laws and regulations concerning land development, construction of homes, sales, mortgage lending, environmental and other aspects of our business. These laws and regulations could give rise to additional liabilities or expenditures, or restrictions on our business.
Our operations are subject to continuing compliance requirements mandated by applicable federal, state and local statutes, ordinances, rules and regulations, including zoning and land use ordinances, building, plumbing and electrical codes, contractors’ licensing laws, state insurance laws, federal and state human resources laws and regulations and health and safety laws and regulations (including, but not limited to, those of the Occupational Safety & Health Administration). Various localities in which we operate have imposed (or may impose in the future) fees on developers to fund schools, road improvements and low and moderate-income housing.
From time to time, various municipalities in which our homebuilding subsidiaries operate restrict or place moratoria on the availability of utilities, including water and sewer taps. Additionally, certain jurisdictions in which our homebuilding subsidiaries operate have proposed or enacted “slow growth” or “no growth” initiatives and other measures that may restrict the number of building permits available in any given year. These initiatives or other slow or no growth measures could reduce our ability to open new subdivisions and build and sell homes in the affected markets and may create additional costs and administration requirements, which in turn could negatively impact our future home sales and results of operations. Although future conditions or governmental actions may impact our ability to obtain necessary permits or water and sewer taps, we currently believe that we have, or can obtain, water and sewer taps and building permits for our homebuilding subsidiaries’ land inventory and land held for development.
Our homebuilding operations also are affected by environmental laws and regulations pertaining to availability of water, municipal sewage treatment capacity, stormwater discharges, land use, hazardous waste disposal, dust controls, building materials, population density and preservation of endangered species, natural terrain and vegetation.
- 17 -
Table of Contents
Due to these considerations, our homebuilding subsidiaries generally obtain an environmental site assessment for parcels of land that they acquire. The particular environmental laws and regulations that apply to any given homebuilding project vary greatly according to a particular site’s location, the site’s environmental conditions and the present and former uses. These environmental laws may result in project delays, cause us to incur substantial compliance and other costs and/or prohibit or severely restrict homebuilding activity in certain environmentally sensitive locations.
We also are subject to rules and regulations with respect to originating, processing, selling and servicing mortgage loans, which, among other things: prohibit discrimination and establish underwriting guidelines; provide for audits and inspections; require appraisals and/or credit reports on prospective borrowers and disclosure of certain information concerning credit and settlement costs; establish maximum loan amounts; prohibit predatory lending practices; and regulate the referral of business to affiliated entities. The turmoil caused by the increasing number of defaults in subprime and other mortgages has encouraged consumer lawsuits and the investigation of financial services industry practices by governmental authorities. These investigations could include the examination of consumer lending practices, sales of mortgages to financial institutions and other investors and the practices in the financial services segments of homebuilding companies. New rules and regulations or revised interpretations of existing rules and regulations applicable to our mortgage lending operations could result in more stringent compliance standards, which may substantially increase costs of compliance. Additionally, potential changes to regulations, including but not limited to Real Estate Settlement Procedures Act (RESPA) could have a significant impact on the ability of our affiliated businesses to provide services to Richmond American Homes customers, which could have a significant negative impact on our financial and operating results.
Product liability litigation and warranty claims that arise in the ordinary course of business may be costly.
As a homebuilder, we are subject to construction defect and home warranty claims, as well as claims associated with the sale and financing of our homes arising in the ordinary course of business. These types of claims can be costly. The costs of insuring against construction defect and product liability claims can be high and the amount of coverage offered by insurance companies may be limited. If we are not able to obtain adequate insurance against these claims, we may incur additional expenses that would have a negative impact on our results of operations in future reporting periods. Additionally, changes in the facts and circumstances of our pending litigation matters could have a material impact on our results of operations and cash flows in future reporting periods.
Litigation has been filed by homeowners in West Virginia against us and various subcontractors alleging a failure to install functional passive radon mitigation systems in their homes. The court has entered judgment by default in favor of these homeowners. See “Business—Legal Proceedings.”
Our income tax provision and other tax liabilities may be insufficient if taxing authorities are successful in asserting tax positions that are contrary to our position.
From time to time, we are audited by various federal, state and local authorities regarding income tax matters. Significant judgment is required to determine our provision for income taxes and our liabilities for federal, state, local and other income taxes. Our current audits are in various stages of completion; however, no outcome for a particular audit can be determined with certainty prior to the conclusion of the audit, appeal and, in some cases, litigation process. Although we believe our approach to determining the appropriate tax treatment is supportable, it is possible that the final tax authority will take a tax position that is materially different than that which is reflected in our income tax provision or benefit and other tax liabilities. As each audit is completed, adjustments, if any, are recorded in our Consolidated Financial Statements in the period determined. Such differences could have a material adverse effect on our income tax provision or benefit, or other tax liabilities, in the reporting period in which such determination is made and, consequently, on our results of operations, financial position and/or cash flows for such period.
- 18 -
Table of Contents
The homebuilding industry is cyclical and affected by changes in general economic, real estate or other business conditions that could adversely affect our business or financial results.
The homebuilding industry is cyclical and is significantly affected by changes in industry conditions, as well as in general and local economic conditions, such as:
| • | employment levels; |
| • | availability of financing for homebuyers; |
| • | interest rates; |
| • | consumer confidence; |
| • | levels of new and existing homes for sale; |
| • | demographic trends; and |
| • | housing demand. |
These may occur on a national scale, like the current downturn, or may affect some of the regions or markets in which we operate more than others. When adverse conditions affect any of our larger markets, they could have a proportionately greater impact on us than on some other homebuilding companies.
An oversupply of alternatives to new homes, including foreclosed homes, homes held for sale by investors and speculators, other existing homes, and rental properties, can also reduce our ability to sell new homes and depress new home prices and reduce our margins on the sales of new homes. High levels of foreclosures not only contribute to additional inventory available for sale, but also reduce appraisal valuations for new homes, potentially resulting in lower sales prices.
Continued military deployments in the Middle East and other overseas regions, terrorist attacks, other acts of violence or threats to national security, and any corresponding response by the United States or others, or related domestic or international instability, may adversely affect general economic conditions or cause a slowdown of the economy.
As a result of the foregoing matters, potential customers may be less willing or able to buy our homes. In the future, our pricing strategies may continue to be limited by market conditions. We may be unable to change the mix of our home offerings, reduce the costs of the homes we build or offer more affordable homes to maintain our margins or satisfactorily address changing market conditions in other ways. In addition, cancellations of home sales contracts in backlog may increase as homebuyers choose to not honor their contracts.
Our financial services business is closely related to our homebuilding business, as it originates mortgage loans principally to purchasers of the homes we build. A decrease in the demand for our homes because of the foregoing matters may also adversely affect the financial results of this segment of our business. An increase in the default rate on the mortgages we originate may adversely affect our ability to sell the mortgages or the pricing we receive upon the sale of mortgages or may increase our potential exposure regarding those mortgage loan sales. Because of the uncertainties inherent to these matters, actual future obligations could differ significantly from our currently estimated amounts.
Because of the seasonal nature of our business, our quarterly operating results can fluctuate.
Prior to 2007, we experienced noticeable seasonality and quarter-to-quarter variability in homebuilding activity levels. In general, the number of homes closed and associated home sales revenue increased during the third and fourth quarters, compared with the first and second quarters. We believe that this seasonality reflected the historical tendency of homebuyers to purchase new homes in the spring with closings scheduled in the fall or winter, as well as
- 19 -
Table of Contents
the scheduling of construction to accommodate seasonal weather conditions in certain markets. During 2009, 2008 and 2007, this seasonality pattern was not as apparent in our financial or operating results. However, the extent to which our historical seasonality pattern contributed to actual 2009 and 2008 home sales and closing levels is unknown, and there can be no assurances that this seasonality pattern will be apparent in future reporting periods.
Supply shortages and other risks related to the demand for skilled labor and building materials could increase costs and delay deliveries.
The residential construction industry experiences labor and material shortages from time to time, including: work stoppages; labor disputes and shortages in qualified trades people, insulation, drywall, concrete, steel and lumber; lack of availability of adequate utility infrastructure and services; our need to rely on local subcontractors who may not be adequately capitalized or insured; and shortages, delays in availability, or fluctuations in prices, of building materials. These labor and material shortages can be more severe during periods of strong demand for housing or during periods in which the markets where we operate experience natural disasters that have a significant impact on existing residential and commercial structures. Additionally, we could experience labor shortages as a result of subcontractors going out of business during this recession. Any of these circumstances could give rise to delays in the start or completion of our residential communities, increase the cost of developing one or more of our residential communities and increase the construction cost of our homes. To the extent that market conditions prevent the recovery of increased costs, including, among other things, subcontracted labor, finished lots, building materials, and other resources, through higher selling prices, our Home Gross Margins and results of operations could be affected negatively.
Increased costs of lumber, framing, concrete, steel and other building materials could cause increases in construction costs and construction delays. We generally are unable to pass on increases in construction costs to customers who have already entered into sales contracts, as those sales contracts generally fix the price of the homes at the time the contracts are signed, which may be well in advance of the construction of the home. Sustained increases in construction costs may, over time, erode our Home Gross Margins, particularly if pricing competition restricts our ability to pass on any additional costs of materials or labor, thereby decreasing our Home Gross Margins.
Natural disasters could cause an increase in home construction costs, as well as delays, and could negatively impact our results of operations.
The climates and geology of many of the markets in which we operate, including California and Florida, present increased risks of natural disasters. To the extent that hurricanes, severe storms, earthquakes, droughts, floods, heavy or prolonged precipitation, wildfires or other natural disasters or similar events occur, the financial and operating results of our business may be negatively impacted.
We are dependent on the services of key employees, and the loss of their services could hurt our business.
Our future success depends, in part, on our ability to attract, train and retain skilled personnel. If we are unable to retain our key employees or attract, train and retain other skilled personnel in the future, it could have an adverse impact on our financial and operating results.
The interests of certain controlling shareholders may be adverse to investors.
Larry A. Mizel, David D. Mandarich and other of our affiliates beneficially own, directly or indirectly, in the aggregate, approximately 25% of our outstanding common stock. To the extent they and their affiliates vote their shares in the same manner, their combined stock ownership may effectively give them the power to influence the
- 20 -
Table of Contents
election of members of our board of directors and other matters reserved for our shareholders. Circumstances may occur in which the interest of these shareholders could be in conflict with your interests. In addition, such persons may have an interest in pursuing transactions that, in their judgment, enhance the value of their equity investment in us, even though such transactions may involve risks to you.
| Item 1B. | Unresolved Staff Comments. |
None
| Item 2. | Properties. |
Our corporate office is located at 4350 South Monaco Street, Denver, Colorado 80237, where we lease office space in a 144,000 square foot office building. Our homebuilding divisions and, in some markets, other MDC subsidiaries, including HomeAmerican, American Home Insurance and American Home Title, lease additional office space. The table below outlines the number of office facilities that are leased and the approximate square footage leased in each market at December 31, 2009. We are satisfied with the suitability and capacity of our office locations.
| Number of Leased Facilities |
Total Square Footage Leased | |||
| Arizona |
3 | 52,000 | ||
| California |
4 | 48,000 | ||
| Colorado |
5 | 230,000 | ||
| Delaware Valley |
1 | 2,000 | ||
| Florida |
2 | 21,000 | ||
| Maryland |
2 | 13,000 | ||
| Nevada |
2 | 25,000 | ||
| Utah |
2 | 19,000 | ||
| Virginia |
3 | 25,000 | ||
| Totals |
24 | 435,000 | ||
| Item 3. | Legal Proceedings. |
Because of the nature of the homebuilding business, we and certain of our subsidiaries and affiliates have been named as defendants in various claims, complaints and other legal actions arising in the ordinary course of business, including product liability claims and claims associated with the sale and financing of our homes. In the opinion of management, the outcome of these matters will not have a material adverse effect upon our financial condition, results of operations or cash flows.
Litigation has been filed by homeowners in West Virginia against MDC, its subsidiary Richmond American Homes of West Virginia, Inc. (“RAH West Virginia”) and various subcontractors alleging a failure to install functional passive radon mitigation systems in their homes. The plaintiffs seek compensatory and punitive damages and medical monitoring costs for alleged negligent construction, failure to warn, breach of warranty or contract, breach of implied warranty of habitability, fraud, and intentional and negligent infliction of emotional distress based upon alleged exposure to radon gas. The litigation consists of the following actions:
Joy, et al. v. Richmond American Homes of West Virginia, Inc., et al., No. 08-C-204, Circuit Court of Jefferson County, West Virginia (“Joy”). This action was filed on May 16, 2008, by sixty-six plaintiffs from sixteen households. The Company and RAH West Virginia have answered and asserted claims against the subcontractors for contractual and implied indemnity and contribution. The action is currently set for trial in April 2010.
- 21 -
Table of Contents
Bauer, et al. v. Richmond American Homes of West Virginia, Inc., et al., No. 08-C-431, Circuit Court of Jefferson County, West Virginia (“Bauer”). This action was filed on October 24, 2008, by eighty-six plaintiffs from twenty-one households. This action has been consolidated for discovery and pre-trial proceedings with the Joy action.
Saliba, et al. v. Richmond American Homes of West Virginia, Inc., et al., No. 08-C-447, Circuit Court, Jefferson County, West Virginia (“Saliba”). This action was filed on November 7, 2008, by thirty-five plaintiffs from nine households. This action has been consolidated for discovery and pre-trial proceedings with the Joy action.
By orders dated November 4 and 18, 2009, the court granted the plaintiffs’ motion for default judgment against the Company and RAH West Virginia, motion to strike the defendants’ answers and motion for sanctions. The damages are to be determined in a subsequent jury trial. The damages trial in the Joy case has been scheduled for April 2010. At this time, MDC and RAH West Virginia are unsure whether the court’s action pertains to only the Joy case or also to the Bauer and Saliba cases.
On December 4, 2009, the court entered an order amending its prior order, which had restricted the parties from making statements elaborating on the facts or theories of the cases. The amended order now permits disclosures required by or in accordance with law.
On December 7, 2009, MDC and RAH West Virginia filed with the West Virginia Supreme Court of Appeals a motion seeking to stay the proceedings and a petition for writ of prohibition to vacate the default judgment. On January 15, 2010, the West Virginia Supreme Court of Appeals entered an order agreeing to consider the request to vacate the default judgment. The hearing to consider this request is set to occur on March 31, 2010. Pursuant to the rules of the Supreme Court, the underlying proceedings in the Circuit Court have been stayed pending the hearing by the Supreme Court.
MDC and RAH West Virginia believe that they have meritorious defenses to each of the lawsuits and intend to vigorously defend the actions.
We can give no assurance as to the final outcomes of these cases, or whether they would have a material adverse effect on our financial condition, results of operations or cash flows.
| Item 4. | Submission of Matters to a Vote of Security Holders. |
No meetings of the Company’s stockholders were held during the fourth quarter of 2009.
- 22 -
Table of Contents
PART II
| Item 5. | Market for Registrant’s Common Equity, Related Stockholder Matters and Issuer Purchases of Equity Securities. |
At December 31, 2009, MDC had 719 shareowners of record. The shares of MDC common stock are traded on the New York Stock Exchange. The following table sets forth, for the periods indicated, the closing price ranges of MDC’s common stock.
| Three Months Ended | ||||||||||||
| March 31 | June 30 | September 30 | December 31 | |||||||||
| 2009 |
||||||||||||
| High |
$ | 35.47 | $ | 36.55 | $ | 38.65 | $ | 37.89 | ||||
| Low |
$ | 23.38 | $ | 28.59 | $ | 27.19 | $ | 28.50 | ||||
| 2008 |
||||||||||||
| High |
$ | 46.94 | $ | 46.02 | $ | 43.66 | $ | 37.61 | ||||
| Low |
$ | 31.34 | $ | 38.31 | $ | 34.75 | $ | 22.74 | ||||
The following table sets forth the cash dividends declared and paid in 2009 and 2008 (dollars in thousands, except per share amounts).
| Date of Declaration | Date of Payment | Dividend per Share |
Total Dividends Paid | |||||||
| 2009 |
||||||||||
| First quarter |
January 26, 2009 | February 25, 2009 | $ | 0.25 | $ | 11,595 | ||||
| Second quarter |
April 27, 2009 | May 27, 2009 | 0.25 | 11,842 | ||||||
| Third quarter |
July 20, 2009 | August 19, 2009 | 0.25 | 11,743 | ||||||
| Fourth quarter |
October 26, 2009 | November 24, 2009 | 0.25 | 11,745 | ||||||
| $ | 1.00 | $ | 46,925 | |||||||
| 2008 |
||||||||||
| First quarter |
January 29, 2008 | February 26, 2008 | $ | 0.25 | $ | 11,517 | ||||
| Second quarter |
April 29, 2008 | May 28, 2008 | 0.25 | 11,587 | ||||||
| Third quarter |
July 28, 2008 | August 26, 2008 | 0.25 | 11,631 | ||||||
| Fourth quarter |
October 28, 2008 | November 26, 2008 | 0.25 | 11,656 | ||||||
| $ | 1.00 | $ | 46,391 | |||||||
In connection with the declaration and payment of dividends, we are required to comply with certain covenants contained in our unsecured revolving line of credit agreement (as amended on December 22, 2008), which has a total commitment of $100 million. Pursuant to the terms of this amended agreement, dividends may be declared or paid by us if we are in compliance with certain stockholders’ equity and debt coverage tests. As a result, we had a permitted dividend capacity of approximately $183 million pursuant to the most restrictive of these covenants.
On January 25, 2010, MDC’s board of directors declared a quarterly cash dividend of twenty five cents ($0.25) per share. The dividend will be paid on February 24, 2010 to shareowners of record on February 10, 2010.
There were no shares of MDC common stock repurchased during the years ended December 31, 2009, 2008 or 2007. At December 31, 2009, we were authorized to repurchase up to 4,000,000 shares of our common stock.
- 23 -
Table of Contents
Performance Graph
Set forth below is a graph comparing the yearly change in the cumulative total return of MDC’s common stock with the cumulative total return of the Standard & Poor’s 500 Stock Index and with that of a peer group of other homebuilders over the five-year period ending on December 31, 2009.
It is assumed in the graph that $100 was invested (1) in the Company’s common stock; (2) in the stocks of the companies in the Standard & Poor’s 500 Stock Index; and (3) in the stocks of the peer group companies, just prior to the commencement of the period and that all dividends received within a quarter were reinvested in that quarter. The peer group index is composed of the following companies: Beazer Homes USA, Inc., D.R. Horton, Inc., Hovnanian Enterprises, Inc., KB Home, Lennar Corporation, M/I Homes, Inc., Meritage Homes Corporation, NVR, Inc., Pulte Homes, Inc., The Ryland Group, Inc., Standard Pacific Corp. and Toll Brothers, Inc.
The stock price performance shown on the following graph is not indicative of future price performance.
COMPARISON OF CUMULATIVE TOTAL RETURN OF MDC COMMON STOCK, THE S&P 500 STOCK INDEX AND A SELECTED PEER GROUP
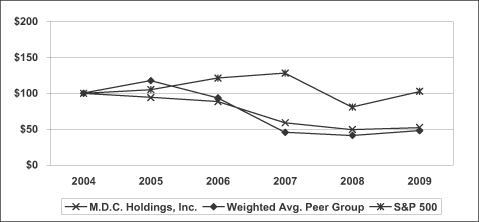
| Item 6. | Selected Financial and Other Data. |
The data in these tables and related footnotes should be read in conjunction with “Management’s Discussion and Analysis of Financial Condition and Results of Operations” and the Company’s Consolidated Financial Statements (in thousands, except per share and unit amounts).
- 24 -
Table of Contents
SELECTED FINANCIAL DATA
| Year Ended December 31, | ||||||||||||||||||
| 2009 | 2008 | 2007 | 2006 | 2005 | ||||||||||||||
| INCOME STATEMENT DATA |
||||||||||||||||||
| Home sales revenue |
$ | 837,054 | $ | 1,358,148 | $ | 2,765,981 | $ | 4,650,556 | $ | 4,792,700 | ||||||||
| Total revenue |
$ | 898,303 | $ | 1,458,108 | $ | 2,885,659 | $ | 4,793,569 | $ | 4,887,767 | ||||||||
| Home cost of sales |
$ | 686,854 | $ | 1,184,865 | $ | 2,380,427 | $ | 3,619,656 | $ | 3,436,035 | ||||||||
| Asset impairments |
$ | 30,986 | $ | 298,155 | $ | 726,621 | $ | 112,027 | $ | - | ||||||||
| General and administrative expenses |
$ | 162,485 | $ | 191,574 | $ | 283,346 | $ | 389,170 | $ | 387,031 | ||||||||
| (Loss) income before income taxes(1) |
$ | (107,335 | ) | $ | (382,135 | ) | $ | (756,464 | ) | $ | 333,137 | $ | 808,763 | |||||
| Net income (loss)(2)(3) |
$ | 24,679 | $ | (380,545 | ) | $ | (636,940 | ) | $ | 214,253 | $ | 505,723 | ||||||
| Basic earnings (loss) per common share |
$ | 0.52 | $ | (8.25 | ) | $ | (13.94 | ) | $ | 4.77 | $ | 11.48 | ||||||
| Diluted earnings (loss) per common share |
$ | 0.52 | $ | (8.25 | ) | $ | (13.94 | ) | $ | 4.66 | $ | 10.99 | ||||||
| Dividends declared per share |
$ | 1.00 | $ | 1.00 | $ | 1.00 | $ | 1.00 | $ | 0.76 | ||||||||
| (1) | Loss before income taxes for the years ended December 31, 2009 and 2008 includes the impact of recording to interest expense $38.1 million and $18.0 million, respectively, of interest incurred on our senior notes that could not be capitalized as a result of the significant decrease in inventory levels that are actively being developed. |
| (2) | Net income for the year ended December 31, 2009 includes the income tax benefit of being able to carry back $142.6 million of net operating losses due to the expanded NOL carryback provisions contained in the Worker, Homeownership, and Business Assistance Act of 2009, signed into law on November 6, 2009. |
| (3) | Net loss for the years ended December 31, 2008 and 2007 includes the impact of recording a valuation allowance of $134.3 million and $160.0 million, respectively, against our deferred tax assets. |
| December 31, | |||||||||||||||
| 2009 | 2008 | 2007 | 2006 | 2005 | |||||||||||
| BALANCE SHEET DATA |
|||||||||||||||
| Assets |
|||||||||||||||
| Cash and cash equivalents |
$ | 1,234,252 | $ | 1,304,728 | $ | 1,004,763 | $ | 507,947 | $ | 214,531 | |||||
| Marketable securities |
327,944 | 54,864 | - | - | - | ||||||||||
| Housing completed or under construction |
260,324 | 415,500 | 902,221 | 1,178,671 | 1,320,106 | ||||||||||
| Land and land under development(4) |
262,860 | 241,571 | 574,085 | 1,575,158 | 1,677,948 | ||||||||||
| Total assets |
2,429,308 | 2,474,938 | 3,012,764 | 3,909,875 | 3,859,850 | ||||||||||
| Debt and Lines of Credit |
|||||||||||||||
| Senior notes |
$ | 997,991 | $ | 997,527 | $ | 997,091 | $ | 996,682 | $ | 996,297 | |||||
| Homebuilding line of credit |
- | - | - | - | - | ||||||||||
| Mortgage repurchase facility |
29,115 | 34,873 | - | - | - | ||||||||||
| Mortgage line of credit |
- | - | 70,147 | 130,467 | 156,532 | ||||||||||
| Total debt and lines of credit |
$ | 1,027,106 | $ | 1,032,400 | $ | 1,067,238 | $ | 1,127,149 | $ | 1,152,829 | |||||
| Stockholders’ Equity |
$ | 1,073,146 | $ | 1,080,920 | $ | 1,476,013 | $ | 2,161,882 | $ | 1,952,109 | |||||
| Stockholders’ Equity per Outstanding Share |
$ | 22.82 | $ | 23.16 | $ | 32.05 | $ | 47.87 | $ | 43.74 | |||||
- 25 -
Table of Contents
| (4) | During 2009, the Company reclassified $19.7 million of assets that were previously included in related party assets on the Consolidated Balance Sheet and have included them in land and land under development. Accordingly, the Company has corrected an immaterial error and reclassified the balance at December 31, 2008 and 2007 so that the prior period balances conform with the current year’s presentation. See Note 9 to the Consolidated Financial Statements for additional information. |
| Year Ended December 31, | ||||||||||||||||||||
| 2009 | 2008 | 2007 | 2006 | 2005 | ||||||||||||||||
| OPERATING DATA |
||||||||||||||||||||
| Homes closed (units) |
3,013 | 4,488 | 8,195 | 13,123 | 15,307 | |||||||||||||||
| Average selling price per home closed |
$ | 277.8 | $ | 302.6 | $ | 337.5 | $ | 354.4 | $ | 313.1 | ||||||||||
| Orders for homes, net (units) |
3,306 | 3,074 | 6,504 | 10,229 | 15,334 | |||||||||||||||
| Homes in Backlog at period end (units) |
826 | 533 | 1,947 | 3,638 | 6,532 | |||||||||||||||
| Estimated Backlog sales value at period end |
$ | 265,000 | $ | 173,000 | $ | 650,000 | $ | 1,300,000 | $ | 2,440,000 | ||||||||||
| Estimated average selling price of homes in Backlog |
$ | 320.8 | $ | 324.6 | $ | 333.8 | $ | 357.3 | $ | 373.5 | ||||||||||
| Active subdivisions at year-end |
133 | 191 | 278 | 306 | 292 | |||||||||||||||
| Cash Flows From |
||||||||||||||||||||
| Operating activities |
$ | 202,454 | $ | 479,511 | $ | 592,583 | $ | 363,048 | $ | (424,929 | ) | |||||||||
| Investing activities(5) |
$ | (224,992 | ) | $ | (113,439 | ) | $ | (1,447 | ) | $ | (10,221 | ) | $ | (22,889 | ) | |||||
| Financing activities |
$ | (47,938 | ) | $ | (66,107 | ) | $ | (94,320 | ) | $ | (59,411 | ) | $ | 261,390 | ||||||
| (5) | Investing activities during the years ended December 31, 2009 and 2008 include the purchase of $273.1 million and $54.9 million in marketable securities, net of maturities. During the years ended December 31, 2009 and 2008, investing activities included the receipt of $56.0 million and use of $58.1 million associated with The Reserve Primary Fund and The Reserve U.S. Government Fund. |
Seasonality and Variability in Quarterly Results
We generally experience noticeable seasonality and quarter-to-quarter variability in homebuilding activity levels. In general, the number of homes closed and associated home sales revenue increase during the third and fourth quarters, compared with the first and second quarters. We believe that this seasonality reflects the historical tendency of homebuyers to purchase new homes in the spring with closings scheduled in the fall or winter, as well as the scheduling of construction to accommodate seasonal weather conditions in certain markets. The following table reflects our unaudited summarized quarterly consolidated financial and operational information for each of the twelve months ended December 31, 2009 and 2008 (in thousands, except per share and unit amounts). See “Forward-Looking Statements” above.
| Quarter | ||||||||||||||||
| Fourth | Third | Second | First | |||||||||||||
| 2009 |
||||||||||||||||
| Home sales revenue |
$ | 297,702 | $ | 186,816 | $ | 185,554 | $ | 166,982 | ||||||||
| Total revenue |
$ | 323,879 | $ | 203,226 | $ | 195,266 | $ | 175,932 | ||||||||
| Asset impairments |
$ | 13,977 | $ | 1,197 | $ | 1,243 | $ | 14,569 | ||||||||
| General and administrative expenses |
$ | 40,504 | $ | 45,800 | $ | 37,800 | $ | 38,381 | ||||||||
| Loss before income taxes |
$ | (15,381 | ) | $ | (31,818 | ) | $ | (19,063 | ) | $ | (41,073 | ) | ||||
| Net income (loss)(6) |
$ | 127,162 | $ | (32,048 | ) | $ | (29,582 | ) | $ | (40,853 | ) | |||||
| Orders for homes, net (units) |
637 | 1,016 | 977 | 676 | ||||||||||||
| Homes closed (units) |
1,109 | 659 | 665 | 580 | ||||||||||||
| Homes in Backlog at period end (units) |
826 | 1,298 | 941 | 629 | ||||||||||||
| Estimated Backlog sales value at period end |
$ | 265,000 | $ | 383,000 | $ | 295,000 | $ | 196,000 | ||||||||
| Earnings (loss) per share |
||||||||||||||||
| Basic |
$ | 2.71 | $ | (0.69 | ) | $ | (0.64 | ) | $ | (0.88 | ) | |||||
| Diluted |
$ | 2.68 | $ | (0.69 | ) | $ | (0.64 | ) | $ | (0.88 | ) | |||||
- 26 -
Table of Contents
| (6) | Net income for the quarter ended December 31, 2009 includes the income tax benefit of being able to carry back $142.6 million of net operating losses due to the expanded NOL carryback provisions contained in the Worker, Homeownership, and Business Assistance Act of 2009, signed into law on November 6, 2009. |
| Quarter | ||||||||||||||||
| Fourth | Third | Second | First | |||||||||||||
| 2008 |
||||||||||||||||
| Home sales revenue |
$ | 283,519 | $ | 336,744 | $ | 382,093 | $ | 355,792 | ||||||||
| Total revenue |
$ | 296,208 | $ | 362,701 | $ | 403,421 | $ | 395,778 | ||||||||
| Asset impairments |
$ | 59,657 | $ | 95,388 | $ | 88,278 | $ | 54,832 | ||||||||
| General and administrative expenses(7) |
$ | 46,454 | $ | 50,010 | $ | 43,922 | $ | 51,188 | ||||||||
| Loss before income taxes(8) |
$ | (86,395 | ) | $ | (116,974 | ) | $ | (101,540 | ) | $ | (77,226 | ) | ||||
| Net loss |
$ | (89,028 | ) | $ | (117,971 | ) | $ | (100,726 | ) | $ | (72,820 | ) | ||||
| Orders for homes, net (units) |
350 | 667 | 959 | 1,098 | ||||||||||||
| Homes closed (units) |
944 | 1,116 | 1,292 | 1,136 | ||||||||||||
| Homes in Backlog at period end (units) |
533 | 1,127 | 1,576 | 1,909 | ||||||||||||
| Estimated Backlog sales value at period end |
$ | 173,000 | $ | 364,000 | $ | 522,000 | $ | 623,000 | ||||||||
| Loss per share |
||||||||||||||||
| Basic |
$ | (1.92 | ) | $ | (2.55 | ) | $ | (2.18 | ) | $ | (1.58 | ) | ||||
| Diluted |
$ | (1.92 | ) | $ | (2.55 | ) | $ | (2.18 | ) | $ | (1.58 | ) | ||||
| (7) | During the 2008 second quarter, we recorded adjustments to reduce general and administrative expenses by $7.1 million: (i) to decrease legal expenses as a result of resolving construction defect claims, the costs of which are now expected to be paid by third-party insurance carriers; and (ii) to reduce warranty reserves that were established through general and administrative expenses during previous reporting periods. |
| (8) | The Company incurred $10.7 million and $7.3 million of interest during the three months ended September 30 and December 31, 2008, respectively, that could not be capitalized and, as such, was recorded to interest expense in the Consolidated Statements of Operations. See Note 16 to the Consolidated Financial Statements. |
- 27 -
Table of Contents
| Item 7. | Management’s Discussion and Analysis of Financial Condition and Results of Operations. |
The following discussion should be read in conjunction with, and is qualified in its entirety by, the Consolidated Financial Statements and Notes thereto included elsewhere in this Annual Report on Form 10-K. This item contains forward-looking statements that involve risks and uncertainties. Actual results may differ materially from those indicated in such forward-looking statements. Factors that may cause such a difference include, but are not limited to, those discussed in “Item 1A, Risk Factors Relating to our Business.”
EXECUTIVE SUMMARY
During the year ended December 31, 2009, our homebuilding operations experienced improved net orders for homes in each homebuilding segment and an increased number of homes in Backlog (as defined below), compared to the year ended December 31, 2008. Contributing to the increase in net sales in the 2009 were sales programs, which focused on offering low mortgage interest rates and what was an impending expiration of the federal homebuyer tax credit. Despite these results, the homebuilding and mortgage lending sectors of the economy continued to be extremely challenged during 2009. The recession in the United States economy, high unemployment levels, high levels of distressed foreclosures and elevated resale home inventories, together with strong competition for new home sales, all impacted our financial and operating results during the year ended December 31, 2009. Additionally, despite the increased affordability of new housing products, low interest rates and the availability of various federal and local tax credits or incentives, economic conditions continued to create uncertainty in the timing, strength and sustainability of any recovery in the new home sales market. As a result of these conditions, we continued to experience downward pressure on the average selling prices of our closed homes and homes in Backlog from December 31, 2008 and declines in home closing levels for each of our homebuilding segments during the year ended December 31, 2009. We believe that stability in the credit and capital markets and an eventual renewal of confidence in the United States and global economy will play a major role in any turnaround in the homebuilding and mortgage lending industries. While the United States government has responded by taking steps in an attempt to stabilize the banking system and financial markets, the future impact of these measures and other legislation or proposed legislation on the financial markets, and the timing of a turnaround in the homebuilding industry, remains unclear. See “Forward-Looking Statements” above.
We incurred losses from operations for the year ended December 31, 2009, although at lower levels than during 2008. We incurred losses from operations of $81.1 million and $399.6 million during the years ended December 31, 2009 and 2008, respectively. Negatively impacting the financial results during 2009 and 2008 were asset impairments of $31.0 million and $298.2 million, respectively. Positively impacting our results were adjustments to reduce our warranty reserves of $27.8 million and $17.5 million, respectively. We had net income of $24.7 million during the year ended December 31, 2009 and net loss of $380.5 million during the year ended December 31, 2008. Our net income during 2009 was benefited because we were able to carry back $142.6 million of net operating losses due to the expanded NOL carryback provisions contained in the Worker, Homeownership, and Business Assistance Act of 2009, signed into law on November 6, 2009. These expanded NOL carryback provisions allowed us to carry back our 2009 tax losses to prior years. Absent the new legislation, these 2009 tax losses would have been carried forward to offset future taxable income.
Local and national initiatives have created and will create further regulatory challenges for our Company, including additional consumer protection regulations, more building code requirements, and further environmental regulations, all of which may have a significant impact on our Company.
- 28 -
Table of Contents
Recognizing the challenges presented by the sustained downturn in the homebuilding and mortgage lending businesses during 2009, our management focused on the following:
| • | Managing our inventory levels by selling finished spec and model homes and deploying capital to build limited supplies of new, more affordable inventory generally with the requirement that the construction of these homes stops at drywall; |
| • | Purchasing or entering into option contracts to purchase land in order to replenish our land inventory; |
| • | Strengthening our sales and marketing organization with training, new hires and special sales promotions, in an effort to improve sales velocity; |
| • | Continuing to execute on our Company-wide multi-year initiative focused on streamlining our processes and business practices for increased efficiency and to seek standardized business practices nationwide; |
| • | Selling land to third parties because we believed the best use of the asset was to sell it in its current condition; |
| • | Focusing on re-designing our home floor plans in an effort to produce housing that is smaller and more affordable to the customer and more cost-effective for the Company to build; and |
| • | Reducing our general and administrative expenses and sales and marketing expenses, which resulted in continued declines in our general and administrative expenses during the year ended December 31, 2009. |
CRITICAL ACCOUNTING ESTIMATES AND POLICIES
The preparation of financial statements in conformity with accounting policies generally accepted in the United States of America requires management to make estimates and assumptions that affect the reported amounts of assets and liabilities at the date of the consolidated financial statements and the reported amounts of revenue and expenses during the reporting period. Management bases its estimates and judgments on historical experience and on various other factors that are believed to be reasonable under the circumstances, the results of which form the basis for making judgments about the carrying value of assets and liabilities that are not readily apparent from other sources. Management evaluates such estimates and judgments on an on-going basis and makes adjustments as deemed necessary. Actual results could differ from these estimates using different estimates and assumptions, or if conditions are significantly different in the future. See “Forward-Looking Statements” above.
Listed below are those estimates and policies that we believe are critical and require the use of complex judgment in their application. Our critical accounting estimates and policies are as follows and should be read in conjunction with the Notes to our Consolidated Financial Statements.
Homebuilding Inventory Valuation (Held-for-Development). Our homebuilding inventories accounted for on a held-for-development basis include assets associated with subdivisions in which we intend to construct and sell homes on the land. The inventory in our held-for-development subdivisions also includes assets associated with model and speculative homes. Homebuilding inventories that are accounted for as held-for-development are carried at cost unless events and circumstances indicate that the carrying value of the underlying subdivision may not be recoverable. We determine impairments on a subdivision level basis as each such subdivision represents the lowest level of identifiable cash flows. In making this determination, we review, among other things, the following for each subdivision:
| • | actual and trending “Operating Profit” (which is defined as home sales revenue less home cost of sales and all direct incremental costs associated with the home closing) for homes closed in the: (1) prior two completed fiscal quarters on an individual basis; (2) current fiscal quarter; (3) last six months; and (4) last twelve months; |
| • | estimated future undiscounted cash flows and Operating Profit; |
- 29 -
Table of Contents
| • | forecasted Operating Profit for homes in Backlog; |
| • | actual and trending net and gross home orders; |
| • | base sales price and home sales incentive information for homes that: (1) closed in the prior two completed fiscal quarters; (2) closed in the current fiscal quarter; (3) are in Backlog as of the end of the current fiscal quarter; and (4) are forecasted to close over the remaining life of the subdivision; |
| • | market information for each sub-market, including competition levels, home foreclosure levels and the size and style of homes currently being offered for sale; and |
| • | known or probable events indicating that the carrying value may not be recoverable. |
On a quarterly basis, if events or circumstances indicate that the carrying value of our held-for-development inventory may not be recoverable, such assets are reviewed for impairment by comparing the undiscounted estimated future cash flows from an individual subdivision to its carrying value. The evaluation for the recoverability of the carrying value of the assets for each individual subdivision can be impacted significantly by the following:
| • | estimates of future base selling prices; |
| • | estimates of future home sales incentives; and |
| • | estimates of future home construction and land development costs. |
These estimates are dependent on specific market or sub-market conditions for each subdivision. While we consider available information to determine what we believe to be our best estimates as of the end of a reporting period, these estimates are subject to change in future reporting periods as facts and circumstances change. Local market-specific conditions that may impact these estimates for a subdivision include:
| • | historical subdivision results, and actual and trending Operating Profit, base selling prices and home sales incentives; |
| • | forecasted Operating Profit for homes in Backlog; |
| • | the intensity of competition within a market or sub-market, including publicly available home sales prices and home sales incentives offered by our competitors; |
| • | increased levels of home foreclosures; |
| • | the current sales pace for active subdivisions; |
| • | subdivision specific attributes, such as location, availability of lots in the sub-market, desirability and uniqueness of subdivision location and the size and style of homes currently being offered; |
| • | potential for alternative home styles to respond to local market conditions; |
| • | changes by management in the sales strategy of a given subdivision; and |
| • | current local market economic and demographic conditions and related trends and forecasts. |
These and other local market-specific conditions that may be present are considered by personnel in our homebuilding divisions as they prepare or update the forecasted assumptions for each subdivision. Quantitative and qualitative factors other than home sales prices could significantly impact the potential for future impairments. The sales objectives can differ among subdivisions, even within a given sub-market. For example, facts and circumstances in a given subdivision may lead us to price our homes with the objective of yielding a higher sales absorption pace, while facts and circumstances in another subdivision may lead us to price our homes to minimize deterioration in our Home Gross Margins, even though this could result in a slower sales absorption pace. Furthermore, the key assumptions included in our estimated future undiscounted cash flows may be interrelated. For example, a decrease in
- 30 -
Table of Contents
estimated base sales price or an increase in home sales incentives may result in a corresponding increase in sales absorption pace. Additionally, a decrease in the average sales price of homes to be sold and closed in future reporting periods for one subdivision that has not been generating what management believes to be an adequate sales absorption pace may impact the estimated cash flow assumptions of a nearby subdivision. Changes in our key assumptions, including estimated construction and land development costs, absorption pace, selling strategies or discount rates could materially impact future cash flow and fair value estimates. Due to the number of possible scenarios that would result from various changes in these factors, we do not believe it is possible to develop a sensitivity analysis with a level of precision that would be meaningful to an investor.
If the undiscounted future cash flows of a subdivision are less than its carrying value, the carrying value of the subdivision is written down to its then estimated fair value. For subdivisions that continue to be held-for-development, the carrying value is not written up for increases in the estimated fair value of such subdivisions in subsequent reporting periods.
Management determines the estimated fair value of each held-for-development subdivision by determining the present value of the estimated future cash flows at discount rates that are commensurate with the risk of the subdivision under evaluation. The estimated future cash flows are the same for both our recoverability and fair value assessments. Factors we consider when determining the discount rate to be used for each subdivision include, among others:
| • | the number of lots in a given subdivision; |
| • | the amount of future land development costs to be incurred; |
| • | risks associated with the home construction process, including the stage of completion for the entire subdivision and the number of owned lots under construction; |
| • | market risks, including volatility in home prices and risks associated with markets with high average selling prices of homes; and |
| • | the estimated remaining lifespan of the subdivision. |
During the years ended December 31, 2009, 2008 and 2007, discount rates used in our estimated discounted cash flow assessments ranged from 10% to 21%. For our held-for-development inventory, we recorded $21.0 million, $174.5 million and $515.6 million of impairments to our land and land under development during the years ended December 31, 2009, 2008 and 2007, respectively, and $8.4 million, $82.6 million and $169.9 million of impairments to our housing completed or under construction during the years ended December 31, 2009, 2008 and 2007, respectively. We allocate the impairments recorded between housing completed or under construction and land and land under development for each impaired subdivision based upon the status of construction of a home on each lot (i.e. if the lot is in housing completed or under construction, the impairment for that lot is recorded against housing completed or under construction). The allocation of impairment is the same with respect to each lot in a given subdivision. These impairments, together with impairments of our held-for-sale inventory and intangible and other assets, are presented as a separate line item in the Consolidated Statements of Operations. Changes in management’s estimates, particularly the timing and amount of the estimated future cash inflows and outflows, forecasted average selling prices of homes to be sold and closed and the present value discount rate used in the fair value calculation, can materially affect any impairment calculation. Because our forecasted cash flows are impacted significantly by changes in market conditions, it is reasonably possible that actual results could differ significantly from those estimates.
Homebuilding Inventory Valuation (Held-for-Sale). We record land held-for-sale at the lower of its carrying value or fair value less costs to sell. The classification of land as held-for-sale is based on the following criteria:
| • | management, having the authority to approve the action, commits to a plan to sell the asset; |
- 31 -
Table of Contents
| • | the asset is available for immediate sale in its present condition, subject only to terms that are usual and customary for sales of such assets; |
| • | an active program to locate a buyer and other actions required to complete the plan to sell the asset have been initiated; |
| • | the sale of the asset is probable, and transfer of the asset is expected to qualify for recognition as a completed sale, within one year; |
| • | the asset is being actively marketed for sale at a price that is reasonable in relation to its current fair value; and |
| • | actions required to complete the plan indicate that it is unlikely that significant changes to the plan will be made or that the plan will be withdrawn. |
Additionally, in certain circumstances, management will re-evaluate the best use of an asset that is currently being accounted for as held-for-development. In such situations, management will review, among other things: (1) average sales prices for homes that have closed, are in Backlog and forecasted for future sales; (2) current market conditions, including competition levels, estimated levels of competition in future reporting periods and home foreclosure levels; (3) estimated land development costs that have yet to be incurred; and (4) the total number of lots owned in each subdivision and surrounding areas. If, based upon this evaluation, management believes that the best use of the asset is the sale of the asset in its current condition, all or portions of the subdivision will be accounted for as held-for-sale, assuming all of the foregoing held-for-sale criteria have been met at the end of the applicable reporting period.
In performing the impairment evaluation for land accounted for on a held-for-sale basis, management considers, among other things, prices for land in recent comparable sale transactions, internal market analysis studies, which include the estimated price a willing buyer would pay for the land (other than in a forced liquidation) and recent bona fide offers received from outside third-parties. If the estimated fair value less cost to sell an asset is less than the current carrying value, the asset is written down to its estimated fair value less cost to sell. We monitor the fair value of held-for-sale assets on a periodic basis through the disposition date. Subsequent increases in the fair value less cost to sell of a held-for-sale asset, if any, are recognized as a decrease to impairments in our Consolidated Statements of Operations during such subsequent period, but not in excess of the cumulative impairment that was recorded previously while it was a held-for-sale asset.
Warranty Costs. Our homes are sold with limited third-party warranties. Warranty reserves are established as homes close on a house-by-house basis in an amount estimated to be adequate to cover expected costs of materials and outside labor during warranty periods. Reserves are determined based upon historical experience with respect to similar home designs and geographical areas. Certain factors are considered in determining the per-house reserve amount, including: (1) trends in the historical warranty payment levels, including the historical amount paid as a percent of home construction costs; (2) the historical range of amounts paid per house; (3) any warranty expenditures included in (1) and (2) not considered to be normal and recurring; (4) improvements in quality control and construction techniques expected to impact future warranty expenditures; and (5) expertise of division personnel. Accordingly, the process of determining our warranty reserve balances necessarily requires estimates associated with various assumptions, each of which can positively or negatively impact the warranty reserve balances. We generally evaluate the per-home reserve percentages monthly and make adjustments, as appropriate, on a division-by-division basis as facts and circumstances change with respect to the factors outlined above.
Warranty payments are tracked on a house-by-house basis and are charged against the warranty reserve established for the house. Payments incurred after the close of a home are monitored to determine their nature and, to the extent they are warranty-related payments, they are recorded against the warranty reserve. To the extent this evaluation determines that the payments made are related to completion of a home or land development, the payments
- 32 -
Table of Contents
are recorded against our land development and home construction accruals. Additional reserves are established for known, unusual warranty-related expenditures not covered by the general warranty reserves. Warranty reserves not utilized for a particular house are evaluated on a monthly basis for reasonableness in the aggregate on both a market-by-market and consolidated basis. Warranty payments for an individual house may exceed the related reserve. Payments in excess of the reserve are evaluated on a monthly basis in the aggregate to determine if an adjustment to the warranty reserve should be recorded, which could result in a corresponding adjustment to home cost of sales.
Generally, warranty reserves are reviewed monthly, using historical data and other relevant information, to determine the reasonableness and adequacy of both the aggregate reserve and the per unit reserve amount originally included in home cost of sales, as well as the timing of any reversals of the original reserve. We continue to evaluate the adequacy of the warranty reserves and, based on historical results, believe that our existing estimation process is materially accurate and do not anticipate the process to change materially in the future. However, our warranty reserve can be impacted by significant changes in the warranty payment patterns on previously closed homes. During the years ended December 31, 2009 and 2008, we experienced declines in the amount of warranty payments incurred. Accordingly, during the years ended December 31, 2009 and 2008, we recorded adjustments to reduce our warranty reserves for previously closed homes by $22.6 million and $14.0 million, respectively, reflecting decreases in the warranty payment experience. Because our warranty reserves can be impacted by a significant number of factors, we do not believe it is possible to develop a sensitivity analysis with a level of precision that would be meaningful to an investor. However, it is at least reasonably possible that changes to our assumptions could have a material impact on our warranty reserves balance.
Insurance Reserves. We record expenses and liabilities for losses and loss adjustment expenses for claims associated with: (1) insurance policies issued by StarAmerican and Allegiant; (2) self-insurance; and (3) deductible amounts under the Company’s insurance policies. The establishment of the provisions for outstanding losses and loss adjustment expenses is based on actuarial studies that include known facts and interpretation of circumstances, including our experience with similar cases and historical trends involving claim payment patterns, pending levels of unpaid claims, product mix or concentration, claim severity, frequency patterns (such as those caused by natural disasters), fires or accidents, depending on the business conducted and changing regulatory and legal environments. The process of determining our insurance reserve balances necessarily requires estimates associated with various assumptions, each of which can positively or negatively impact our insurance reserve balances. Accordingly, we do not believe it is possible to develop a sensitivity analysis with a level of precision that would be meaningful to an investor. However, it is possible that changes in the claim rate or the average cost per claim used to estimate the self-insured reserves could have a material impact on our insurance reserve balances.
Litigation Reserves. In the normal course of business, the Company is a defendant in claims primarily relating to construction defects, product liability and personal injury claims. These claims seek relief from the Company under various theories, including breach of implied and express warranty, negligence, strict liability, misrepresentation and violation of consumer protection statutes. We have accrued for losses that may be incurred with respect to legal claims based upon information provided by our legal counsel, including counsel’s on-going evaluation of the merits of the claims and defenses. Due to uncertainties in the estimation process, actual results could vary from those accruals and could have a material impact on our results of operations. At December 31, 2009 and 2008, we had legal accruals of $14.5 million and $7.6 million, respectively. We continue to evaluate litigation reserves and, based on historical results, believe that our existing estimation process is accurate and do not anticipate the process to change materially in the future. Additionally, because our litigation reserves can be impacted by a significant number of factors, we do not believe it is possible to develop a sensitivity analysis with a level of precision that would be meaningful to an investor.
Income Taxes—Valuation Allowance. A valuation allowance is recorded against a deferred tax asset if, based on the weight of available evidence, it is more-likely-than-not (a likelihood of more than 50%) that some portion, or all,
- 33 -
Table of Contents
of the deferred tax asset will not be realized. The realization of a deferred tax asset ultimately depends on the existence of sufficient taxable income in either the carryback or carryforward periods under tax law (generally 2 and 20 years, respectively). The four sources of taxable income to be considered in determining whether a valuation allowance is required include:
| • | future reversals of existing taxable temporary differences; |
| • | taxable income in prior carryback years; |
| • | tax planning strategies; and |
| • | future taxable income exclusive of reversing temporary differences and carryforwards. |
Determining whether a valuation allowance for deferred tax assets is necessary requires an analysis of both positive and negative evidence regarding realization of the deferred tax assets. Examples of positive evidence may include:
| • | a strong earnings history exclusive of the loss that created the deductible temporary differences, coupled with evidence indicating that the loss is the result of an aberration rather than a continuing condition; |
| • | an excess of appreciated asset value over the tax basis of a company’s net assets in an amount sufficient to realize the deferred tax asset; and |
| • | existing Backlog that will produce sufficient taxable income to realize the deferred tax asset based on existing sales prices and cost structures. |
Examples of negative evidence may include:
| • | the existence of “cumulative losses” (defined as a pre-tax cumulative loss for the current and previous two years); |
| • | an expectation of being in a cumulative loss position in a future reporting period; |
| • | a carryback or carryforward period that is so brief that it would limit the realization of tax benefits; |
| • | a history of operating loss or tax credit carryforwards expiring unused; and |
| • | unsettled circumstances that, if unfavorably resolved, would adversely affect future operations and profit levels on a continuing basis. |
The weight given to the potential effect of negative and positive evidence should be commensurate with the extent to which it can be objectively verified. A company must use judgment in considering the relative impact of positive and negative evidence. At December 31, 2009 and 2008, we had a full valuation allowance of $208.1 million and $294.3 million, respectively, recorded against our net deferred tax asset, primarily due to our experiencing a three-year cumulative operating loss as of December 31, 2009 and 2008. The decrease in our valuation allowance during 2009 resulted from the expanded NOL carryback provisions contained in the Worker, Homeownership, and Business Assistance Act of 2009, enacted on November 6, 2009. These expanded NOL carryback provisions allowed us to carry back our 2009 tax losses to prior years. Absent the new legislation, these 2009 tax losses would have been carried forward to offset future taxable income.
Future adjustments to our deferred tax asset valuation allowance will be determined based upon changes in the expected realization of our net deferred tax assets. In the future, our valuation allowance may be impacted by, among other things:
| • | additional inventory impairments; |
| • | additional pre-tax operating losses; or |
| • | the utilization of tax planning strategies that could accelerate the realization of certain deferred tax assets (for example, funding certain accrued liabilities such as employee vacation accruals or pension liabilities). |
- 34 -
Table of Contents
Because our valuation allowance can be impacted by any one or a combination of the foregoing factors, we do not believe it is possible to develop a sensitivity analysis associated with potential adjustments to the valuation allowance on our deferred tax assets. Additionally, due to the considerable estimates utilized in establishing the valuation allowance and the potential for changes in facts and circumstances in future reporting periods, it is possible that we will be required to either increase or decrease our valuation allowance in future reporting periods.
Income Taxes Reserves. Accounting literature for income tax reserves provides guidance for the recognition and measurement in financial statements for uncertain tax positions taken or expected to be taken in a tax return.
The evaluation of a tax position is a two-step process, the first step being recognition. We determine whether it is more-likely-than-not that a tax position will be sustained upon tax examination, including resolution of any related appeals or litigation, based on the technical merits of the position. The technical merits of a tax position derive from both statutory and judicial authority (legislation and statutes, legislative intent, regulations, rulings, and case law) and their applicability to the facts and circumstances of the tax position. If a tax position does not meet the more-likely-than-not recognition threshold, the benefit of that position is not recognized in the financial statements.
The second step is measurement. A tax position that meets the more-likely-than-not recognition threshold is measured to determine the amount of benefit to recognize in the financial statements. The tax position is measured as the largest amount of benefit that is greater than 50 percent likely of being realized upon ultimate resolution with a taxing authority.
Revenue Recognition. In the process of selling homes, we negotiate the terms of a home sales contract with a prospective homebuyer, including base sales price, any options and upgrades (such as upgraded appliance, cabinetry, flooring, etc.), and any home sales incentives. Our home sales incentives generally come in the form of: (1) discounts on the sales price of the home (“Sales Price Incentives”); (2) homebuyer closing cost assistance paid by Richmond American Homes to a third-party (“Closing Cost Incentives”); and (3) mortgage loan origination fees paid by Richmond American Homes to HomeAmerican (“Mortgage Loan Origination Fees”). The combination of home sales incentives offered to prospective homebuyers may vary from subdivision-to-subdivision and from home-to-home, and may be revised during the home closing process based upon homebuyer preferences or upon changes in market conditions, such as changes in our competitors’ pricing. Revenue from a home closing includes the base sales price and any purchased options and upgrades and is reduced for any Sales Price Incentives or Mortgage Loan Origination Fees.
We recognize revenue from home closings and land sales when: (1) the closing has occurred; (2) title has passed to the buyer; (3) possession and other attributes of ownership have been transferred to the buyer; (4) we are not obligated to perform significant additional activities after closing and delivery; and (5) the buyer demonstrates a commitment to pay for the property through an adequate initial and continuing investment. The buyer’s initial investment shall include: (1) cash paid as a down payment; (2) the buyer’s notes supported by irrevocable letters of credit; (3) payments made by the buyer to third-parties to reduce existing indebtedness on the property; and (4) other amounts paid by the buyer that are part of the sales value of the property.
We utilize the installment method of accounting for home closings if all of the following criteria are present: (1) HomeAmerican originates the mortgage loan; (2) HomeAmerican has not sold the mortgage loan, or loans, as of the end of the pertinent reporting period; and (3) the homebuyer’s down payment does not meet the initial or continuing investment requirement. Accordingly, the corresponding Operating Profit is deferred by recording a reduction to home sales revenue in the Consolidated Statements of Operations, and the deferral is subsequently recognized at the time HomeAmerican sells the homebuyer’s mortgage loan, or loans, to a third-party purchaser. In the event the Operating Profit is a loss, we recognize such loss at the time the home is closed.
- 35 -
Table of Contents
Our mortgage loans generally are sold to third-party purchasers with anti-fraud, warranty and limited early payment default provisions. Accordingly, a sale of a homebuyer mortgage loan has occurred when the following criteria have been met: (1) the payment from the third-party purchaser is not subject to future subordination; (2) we have transferred all the usual risks and rewards of ownership that is in substance a sale; and (3) we do not have a substantial continuing involvement with the mortgage loan. Factors that we consider in assessing whether a sale of a mortgage loan has occurred include, among other things: (1) the recourse, if any, to HomeAmerican for credit and interest rate risk; (2) the right or obligation, if any, of HomeAmerican to repurchase the loan; and (3) the control HomeAmerican retains, or is perceived to retain, over the administration of the loan post-closing.
Revenue from the sale of mortgage loan servicing is recognized upon the exchange of consideration for the mortgage loans and related servicing rights between the Company and the third-party. Prior to January 1, 2008, we deferred the application and origination fees, net of costs, and recognized them as revenue, along with the associated gains or losses on the sale of the mortgage loans and related servicing rights, when the mortgage loans were sold to third-party purchasers. The revenue recognized was reduced by the estimated fair value of any related guarantee provisions provided to the third-party purchaser, which was determined by the amount at which the liability could be bought in a current transaction between willing parties. The fair value of the guarantee provisions was recognized in revenue when the Company was released from its obligation under the terms of the loan sale agreements.
In February 2007, the FASB issued ASC Topic 825 “Financial Instruments” (“ASC 825”) which permits entities to choose to measure many financial instruments and certain other items at fair value that are not currently required to be measured at fair value. Once a company chooses to report an item at fair value, changes in fair value would be reported in earnings at each reporting date. On January 1, 2008, we elected to measure mortgage loans held-for-sale originated on or after January 1, 2008 at fair value. Using fair value allows an offset of the changes in fair values of the loans and the derivative instruments used to economically hedge them without the burden of complying with the requirements for hedge accounting. We adopted ASC 825 during the 2008 first quarter, and it did not have a material impact on our financial position, results of operations or cash flows upon adoption.
Home Cost of Sales. Home cost of sales includes the specific construction costs of each home and all applicable land acquisition, land development and related costs, both incurred and estimated to be incurred, warranty costs and finance and closing costs, including Closing Cost Incentives. We use the specific identification method for the purpose of accumulating home construction costs and allocate costs to each lot within a subdivision associated with land acquisition and land development based upon relative market value of the lots prior to home construction. Lots within a subdivision typically have comparable market values, and we therefore generally allocate costs equally to each lot within a subdivision. We record all home cost of sales when a home is closed on a house-by-house basis.
When a home is closed, we generally have not yet paid and recorded all costs necessary to complete the construction of the home and certain land development costs. At the time of a home closing, we compare the home construction budgets to actual recorded costs to determine the additional estimated costs remaining to be paid on each closed home. For amounts not incurred or paid as of the time of closing a home, we record an estimated accrual associated with certain home construction and land development costs. Generally, these accruals are established based upon contracted work that has yet to be paid, open work orders not paid at the time of home closing, punch list items identified during the course of the homebuyer’s final walkthrough of the home, as well as land completion costs more likely than not to be incurred, and represent estimates believed to be adequate to cover the expected remaining home construction and land development costs. We monitor the adequacy of these accruals on a house-by-house basis and in the aggregate on both a market-by-market and consolidated basis. At December 31, 2009 and 2008, we had $21.2 million and $22.9 million, respectively, of land development and home construction accruals for closed homes. Actual results could differ from such estimates.
- 36 -
Table of Contents
We may offer to pay all or a portion of a homebuyer’s closing costs as an incentive. Closing Cost Incentives represent expenses that, over and above the price of the home, the Company and the homebuyer normally incur to complete the recording of the sales transaction. These costs may include items payable to third-parties such as mortgage loan origination fees, discount points, appraisal fees, document preparation fees, insurance premiums, title search and insurance fees, as well as government recording and transfer charges. We record Closing Cost Incentives at the time a home is closed and present them as a component of home cost of sales in the Consolidated Statements of Operations.
Mortgage Loan Loss Reserves. In the normal course of business, we establish reserves for potential losses associated with HomeAmerican’s loan sale agreements pursuant to which mortgage loans are sold to third-parties. These reserves are created to address repurchase and indemnity claims by third-party purchasers of the mortgage loans, which claims arise primarily out of allegations of homebuyer fraud at the time of origination of the loan. These reserves are based upon, among other matters: (1) pending claims received from third-party purchasers associated with previously sold mortgage loans; (2) a current assessment of the potential exposure associated with future claims of homebuyer fraud in mortgage loans originated in prior period loans; and (3) historical loss experience. As noted in reports in the mortgage loan industry during 2009, mortgage performance continued to deteriorate as evidenced by year-over-year increases in delinquency rates. Additionally, foreclosures and foreclosures in process have increased substantially. Similarly, HomeAmerican has experienced an increase in the number and magnitude of claims to repurchase previously sold mortgage loans. Accordingly, we increased our estimated mortgage loan loss reserve by $9.7 million during the year ended December 31, 2009 and made $1.2 million in payments associated with HomeAmerican’s mortgage loan loss reserve. Mortgage loan loss reserves are reflected as a component of accrued liabilities in the Consolidated Balance Sheets, and the associated expenses are included as a component of general and administrative expenses in the Consolidated Statements of Operations.
Stock-Based Compensation. Accounting for share-based payment awards, generally grants of stock options and restricted stock can require significant judgment in estimating the fair value of the share-based payment awards and related compensation. Stock-based compensation expense was $15.1 million, $14.6 million and $12.5 million for the years ended December 31, 2009, 2008 and 2007, respectively, and was recorded to general and administrative expenses in the Consolidated Statements of Operations. See Note 15 to the Consolidated Financial Statements for a further discussion on share-based payment awards.
Determining the appropriate fair value model and calculating the fair value of share-based payment awards requires judgment, including estimating stock price volatility, annual forfeiture rates and the expected life of an award. We estimated the fair value for stock options granted during the twelve months ended December 31, 2009, 2008 and 2007 using the Black-Scholes option pricing model. The Black-Scholes option pricing model calculates the estimated fair value of stock options based upon the following inputs: (1) closing price of the Company’s common stock on the measurement date (generally the date of grant); (2) exercise price; (3) expected stock option life; (4) expected volatility; (5) risk-free interest rate; and (6) expected dividend yield rate. The expected life of employee stock options represents the period for which the stock options are expected to remain outstanding and is derived primarily from historical exercise patterns. The expected volatility is based on the historical volatility in the price of our common stock over the most recent period commensurate with the estimated expected life of our employee stock options, adjusted for the impact of unusual fluctuations not reasonably expected to recur and other relevant factors. The risk-free interest rate assumption is determined based upon observed interest rates appropriate for the expected term of our employee stock options. The expected dividend yield assumption is based on our historical dividend payouts. We determine the estimated fair value of the share-based payment awards on the date they were granted. The fair values of previously granted share-based payment awards are not adjusted as subsequent changes in the foregoing assumptions occur; for example, an increase or decrease in the price of the Company’s common stock. However, changes in the foregoing inputs, particularly the price of the Company’s common stock, expected stock option life and expected volatility, significantly change the estimated fair value of future grants of stock options.
- 37 -
Table of Contents
An annual forfeiture rate is estimated at the time of grant, and revised if necessary, in subsequent periods if the actual forfeiture rate differs from our estimate. We estimated the annual forfeiture rate generally to be 10% to 25% for share-based payment awards granted to Non-Executives (as defined in Note 15 to our Consolidated Financial Statements) and 0% for share-based payment awards granted to Executives and Directors (as defined in Note 15 to our Consolidated Financial Statements), based on the terms of their awards, as well as historical forfeiture experience.
Segment Reporting. The application of segment reporting requires significant judgment in determining our operating segments. Operating segments are defined as a component of an enterprise for which discrete financial information is available and is reviewed regularly by the chief operating decision-maker, or decision-making group, to evaluate performance and make operating decisions. We have identified our chief operating decision-makers as three key executives—the Chief Executive Officer, Chief Operating Officer and Chief Financial Officer.
We have identified each homebuilding subdivision as an operating segment as each homebuilding subdivision engages in business activities from which it earns revenue, primarily from the sale of single-family detached homes, generally to first-time and first-time move-up homebuyers. Subdivisions in the reportable segments noted below have been aggregated because they are similar in the following regards: (1) economic characteristics; (2) housing products; (3) class of homebuyer; (4) regulatory environments; and (5) methods used to manage the construction and sale of homes. In making the determination of whether or not our markets demonstrate similar economic characteristics, we review, among other things, actual and trending Home Gross Margins (as defined below) for homes closed within each market and forecasted Home Gross Margins. Accordingly, we may be required to reclassify our reportable segments if markets that currently are being aggregated do not continue to demonstrate similar economic characteristics.
Our homebuilding reportable segments are as follows:
| • | West (Arizona, California and Nevada); |
| • | Mountain (Colorado and Utah); |
| • | East (Delaware Valley, Virginia and Maryland); and |
| • | Other Homebuilding (Florida and Illinois) |
During 2009, we changed the composition of our reportable segments by reclassifying the Delaware Valley market from the Other Homebuilding segment to the East segment. This resulted primarily from a change in the internal reporting structure of the Company. As a result, we have restated all prior period financial and operating measures of the Delaware Valley market to the East segment in order to conform to the current year’s presentation.
Land Option Contracts. In the normal course of business, we enter into lot option purchase contracts, generally through a deposit of cash or letter of credit, for the right to purchase land or lots at a future point in time with predetermined terms. Option deposits and pre-acquisition costs we incur related to our lot option purchase contracts are capitalized if all of the of the following conditions have been met: (1) the costs are directly identifiable with the specific property; (2) the costs would be capitalized if the property were already acquired; and (3) acquisition of the property is probable, meaning we are actively seeking and have the ability to acquire the property and there is no indication that the property is not available for sale. We also consider the following when determining if the acquisition of the property is probable: (1) changes in market conditions subsequent to contracting for the purchase of the land; (2) current contract terms, including per lot price and required purchase dates; and (3) our current land position in the given market or sub-market. Option deposits and capitalized pre-acquisition costs are expensed to general and administrative expense in the Consolidated Statements of Operations when we believe it is no longer probable that we will acquire the lots under option. We expensed $2.9 million, $6.7 million and $23.4 million for the years ended December 31, 2009, 2008 and 2007, respectively, related to the write-off of option deposits and capitalized pre-acquisition costs. At December 31, 2009, we had the right to acquire 2,584 lots under option contracts, with non-refundable cash and letters of credit option deposits of $7.7 million and $2.1 million at risk, respectively.
- 38 -
Table of Contents
Our obligation with respect to option contracts generally is limited to forfeiture of the related non-refundable cash deposits and/or letters of credit. At December 31, 2009, the total purchase price for lots under option was $178 million. Certain of these contracts could create a variable interest, with the land seller being the variable interest entity (“VIE”) and, as such, could require us to consolidate the assets and liabilities of the VIE. We have evaluated all lot option purchase contracts that were executed or had significant modifications during 2009, and considered: (1) what investments were at risk; (2) contractual obligations to perform; (3) expected changes in market prices of land over a given period; and (4) annual risk free interest rates. Based on these evaluations, we determined that our interests in these VIEs did not result in significant variable interests or require us to consolidate the VIEs. Due to the nature of the assumptions used in our evaluation process, it is possible that our evaluation of lot option contracts that we may execute in the future could result in MDC being identified as the primary beneficiary, which could result in our consolidation of a VIE.
Since we own no equity interest in any of the unaffiliated VIEs certain assumptions about the assets and liabilities of such entities are required. In most cases, the fair values of the assets of the evaluated VIEs have been assumed to be the remaining contractual purchase price of the land or lots we are purchasing.
We periodically enter into lot option arrangements with third-parties that will purchase or have purchased property at our direction that we may later acquire. We evaluate these transactions to determine if we should record an asset and liability at the time we enter into the lot option contract. Accounting literature provides guidance on identifying and accounting for product financing arrangements, which include: (1) land that is contracted to be purchased by a third-party that simultaneously contracts to sell to the Company; (2) requirements to purchase land at specified prices; and (3) additional purchase price payments to be made that are adjusted, as necessary, to cover substantially all fluctuation in costs incurred by the third-party. Factors considered when evaluating if a lot option contract is a product financing arrangement include: (1) amount of deposit at risk; (2) loss of anticipated future operating income associated with selling homes; (3) unreimbursed commitments to incur costs associated with lots; and (4) the uniqueness or location of the lots. Based on these evaluations at December 31, 2009 and 2008, we recorded $0.8 million and $3.4 million to other assets and accrued liabilities in the Consolidated Balance Sheets, respectively.
- 39 -
Table of Contents
KEY HOMEBUILDING MEASURES AND RESULTS OF OPERATIONS
2009 COMPARED WITH 2008
Homebuilding Operating Activities
The table below sets forth information relating to orders for homes (dollars in thousands).
| Year Ended December 31, | Increase (Decrease) | |||||||||||
| 2009 | 2008 | Amount | % | |||||||||
| Orders For Homes, net (Units) |
||||||||||||
| Arizona |
723 | 879 | (156 | ) | -18% | |||||||
| California |
320 | 436 | (116 | ) | -27% | |||||||
| Nevada |
556 | 537 | 19 | 4% | ||||||||
| West |
1,599 | 1,852 | (253 | ) | -14% | |||||||
| Colorado |
700 | 435 | 265 | 61% | ||||||||
| Utah |
282 | 132 | 150 | 114% | ||||||||
| Mountain |
982 | 567 | 415 | 73% | ||||||||
| Delaware Valley |
56 | 61 | (5 | ) | -8% | |||||||
| Maryland |
185 | 124 | 61 | 49% | ||||||||
| Virginia |
227 | 193 | 34 | 18% | ||||||||
| East |
468 | 378 | 90 | 24% | ||||||||
| Florida |
238 | 246 | (8 | ) | -3% | |||||||
| Illinois |
19 | 31 | (12 | ) | -39% | |||||||
| Other Homebuilding |
257 | 277 | (20 | ) | -7% | |||||||
| Total |
3,306 | 3,074 | 232 | 8% | ||||||||
| Estimated Value of Orders for Homes, net |
$ | 935,000 | $ | 885,000 | $ | 50,000 | 6% | |||||
| Estimated Average Selling Price of Orders for Homes, net |
$ | 282.8 | $ | 287.9 | $ | (5.1 | ) | -2% | ||||
Orders for Homes. Net orders for homes increased during the year ended December 31, 2009 due to improvements in our Mountain and East segments and in the Nevada market of the West segment. The improvement was due in part to continued declines in our Cancellation Rate (as defined below) during 2009 and a Company initiated sales program which focused on offering low mortgage interest rates and homebuyer use of the federal homebuyer tax credit. These improvements partially were offset by declines in the net orders for home in the Arizona and California markets of the West segment and in each market of our Other Homebuilding segment.
- 40 -
Table of Contents
Homes Closed. The following table sets forth homes closed for each market within our homebuilding segments (in units).
| Year Ended December 31, | Increase (Decrease) | ||||||||
| 2009 | 2008 | Amount | % | ||||||
| Arizona |
778 | 1,313 | (535 | ) | -41% | ||||
| California |
293 | 590 | (297 | ) | -50% | ||||
| Nevada |
521 | 791 | (270 | ) | -34% | ||||
| West |
1,592 | 2,694 | (1,102 | ) | -41% | ||||
| Colorado |
565 | 576 | (11 | ) | -2% | ||||
| Utah |
230 | 268 | (38 | ) | -14% | ||||
| Mountain |
795 | 844 | (49 | ) | -6% | ||||
| Delaware Valley |
60 | 91 | (31 | ) | -34% | ||||
| Maryland |
140 | 192 | (52 | ) | -27% | ||||
| Virginia |
190 | 257 | (67 | ) | -26% | ||||
| East |
390 | 540 | (150 | ) | -28% | ||||
| Florida |
214 | 336 | (122 | ) | -36% | ||||
| Illinois |
22 | 74 | (52 | ) | -70% | ||||
| Other Homebuilding |
236 | 410 | (174 | ) | -42% | ||||
| Total |
3,013 | 4,488 | (1,475 | ) | -33% | ||||
Our home closings decreased during the year ended December 31, 2009 for most markets within our homebuilding segments, most notably within the West segment where our homebuilding activity has been concentrated. Factors contributing to the lower home closing levels included, among other things: (1) high levels of competition for new home orders driven by builders that cut new home sales prices; (2) difficulty confronted by homebuyers in qualifying for mortgage loans or providing sufficient down payments for mortgage loans for which they qualified; (3) high levels of home foreclosures, which contributed to an excess supply of homes available to be purchased; and (4) prospective homebuyers experiencing difficulty in selling their existing homes in this competitive environment.
Home Gross Margins. We define “Home Gross Margins” to mean home sales revenue less home cost of sales as a percent of home sales revenue. The following table sets forth our Home Gross Margins by reportable segment.
| Year Ended December 31, | Increase (Decrease) | |||||
| 2009 | 2008 | |||||
| West |
23.5% | 15.2% | 8.3% | |||
| Mountain |
11.8% | 7.0% | 4.8% | |||
| East |
14.8% | 11.9% | 2.9% | |||
| Other Homebuilding |
12.0% | 12.2% | -0.2% | |||
| Total |
17.9% | 12.8% | 5.1% | |||
Home Gross Margins can be impacted positively or negatively in a reporting period by adjustments in our warranty reserves. During the years ended December 31, 2009 and 2008, we experienced warranty adjustments in most of our homebuilding segments. These adjustments resulted primarily from a significant downward trend in the amount of warranty payments incurred on our previously closed homes. Because our warranty reserve balance at each period end is generally determined based upon historical warranty payment patterns, the foregoing downward trend in
- 41 -
Table of Contents
warranty payments impacted the Company’s warranty reserves during 2009 and 2008. Additionally, the warranty adjustments during 2009 were impacted as we reached a settlement of a construction defect claim in the Nevada market of the West segment. As a result of this settlement, the costs of which have been paid by insurance providers, the Company released $5.6 million of warranty reserves that were established during previous reporting periods specific for these construction defect claims.
The following table sets forth the warranty adjustments we recorded to home cost of sales during the years ended December 31, 2009 and 2008 by reportable segment (in thousands).
| Year Ended December 31, | ||||||||
| 2009 | 2008 | |||||||
| (Decrease) Increase to Home Cost of Sales |
||||||||
| West |
$ | (24,291 | ) | $ | (16,871 | ) | ||
| Mountain |
185 | 2,822 | ||||||
| East |
(2,965 | ) | 38 | |||||
| Other Homebuilding |
(712 | ) | - | |||||
| Total |
$ | (27,783 | ) | $ | (14,011 | ) | ||
The following table sets forth our Home Gross Margins excluding warranty adjustments.
| Year Ended December 31, | Increase (Decrease) | |||||
| 2009 | 2008 | |||||
| West |
17.1% | 12.9% | 4.2% | |||
| Mountain |
11.9% | 8.0% | 3.9% | |||
| East |
13.1% | 11.9% | 1.2% | |||
| Other |
10.7% | 12.2% | -1.5% | |||
| Consolidated |
14.6% | 11.7% | 2.9% | |||
Also impacting Home Gross Margins in each of our homebuilding segments were changes in the lot cost per closed home, home costs of construction per closed home and changes in the average selling prices of closed homes. In our West segment, Home Gross Margins during the year ended December 31, 2009 were also impacted positively by a reduction of $20,300 in lot cost per closed home, primarily attributable to significant inventory impairments recorded during 2008 and a decrease of $18,300 per closed home in home cost of construction. These items partially were offset by the impact of decreases of $43,400, $21,900 and $11,500 in the average selling prices of closed homes for Nevada, Arizona and California, respectively. Home Gross Margins in our Mountain segment increased during the year ended December 31, 2009 as we experienced a reduction of $21,700 in the lot cost per closed home attributable to significant inventory impairments recorded during 2008 and a decrease of $20,400 in home cost of construction per closed home. These improvements were offset partially by declines of $45,900 and $35,600 in the average selling prices of closed homes in the Utah and Colorado markets. Also partially offsetting the improvement in Home Gross Margins in the Mountain segment was an increase in warranty reserves, primarily attributable to certain construction defect claims in each market of this segment.
Home Gross Margins in our East segment were impacted positively during the year ended December 31, 2009, primarily by a reduction of $17,000 in the lot cost per closed home attributable to inventory impairments recorded during 2008. For our Other Homebuilding segment, Home Gross Margins decreased, primarily due to a $24,000 decline in the average selling price of closed homes for the Florida market of this segment.
Future Home Gross Margins may be impacted negatively by, among other things: (1) a weaker economic environment, including an increase in the severity and duration of the recession in the United States, as well as homebuyers’ reluctance to purchase new homes based on concerns about job security; (2) continued and/or increases
- 42 -
Table of Contents
in home foreclosure levels; (3) on-going tightening of mortgage loan origination requirements; (4) increased competition and increases in the level of home order cancellations, which could affect our ability to maintain existing home prices and/or home sales incentive levels; (5) deterioration in the demand for new homes in our markets; (6) fluctuating energy costs, including oil and gasoline; (7) increases in the costs of subcontracted labor, finished lots, building materials, and other resources, to the extent that market conditions prevent the recovery of increased costs through higher selling prices; (8) increases in interest expense included in home cost of sales; (9) increases in the costs of finished lots; (10) changes in our warranty payment experiences and/or increases in warranty expenses or litigation expenses associated with construction defect claims; and (11) other general risk factors. See “Forward-Looking Statements” below.
The following table sets forth a reconciliation of our home cost of sales as reported to home cost of sale excluding warranty which is used in the calculation of Home Gross Margins excluding warranty adjustments by reportable segment.
| Home Sales Revenue - As reported |
Home Cost of Sales - As reported |
Warranty Adjustments |
Home Cost of Sales - Excluding Warrant Adjustments |
Home Gross Margins - Excluding Warranty Adjustments(1) | ||||||||||||||
| Year Ended December 31, 2009 |
||||||||||||||||||
| West |
$ | 378,328 | $ | 289,381 | $ | (24,291 | ) | $ | 313,672 | 17.1% | ||||||||
| Mountain |
244,862 | 215,989 | 185 | 215,804 | 11.9% | |||||||||||||
| East |
176,072 | 150,033 | (2,965 | ) | 152,998 | 13.1% | ||||||||||||
| Other |
52,783 | 46,442 | (712 | ) | 47,154 | 10.7% | ||||||||||||
| Intercompany adjustments |
(14,991 | ) | (14,991 | ) | - | (14,991 | ) | N/A | ||||||||||
| Consolidated |
$ | 837,054 | $ | 686,854 | $ | (27,783 | ) | $ | 714,637 | 14.6% | ||||||||
| Year Ended December 31, 2008 |
||||||||||||||||||
| West |
$ | 731,319 | $ | 620,329 | $ | (16,871 | ) | $ | 637,200 | 12.9% | ||||||||
| Mountain |
292,382 | 271,845 | 2,822 | 269,023 | 8.0% | |||||||||||||
| East |
243,357 | 214,501 | 38 | 214,463 | 11.9% | |||||||||||||
| Other |
105,874 | 92,974 | - | 92,974 | 12.2% | |||||||||||||
| Intercompany adjustments |
(14,784 | ) | (14,784 | ) | - | (14,784 | ) | N/A | ||||||||||
| Consolidated |
$ | 1,358,148 | $ | 1,184,865 | $ | (14,011 | ) | $ | 1,198,876 | 11.7% | ||||||||
| (1) | Home Gross Margins excluding the impact of warranty adjustments is a non-GAAP financial measure. We believe this information is meaningful as it isolates the impact that warranty adjustment has on our Home Gross Margins. |
- 43 -
Table of Contents
Backlog. The following table sets forth information relating to Backlog within each market of our homebuilding segments.
| December 31, | Increase (Decrease) | |||||||||||
| 2009 | 2008 | Amount | % | |||||||||
| Arizona |
103 | 158 | (55 | ) | -35% | |||||||
| California |
76 | 49 | 27 | 55% | ||||||||
| Nevada |
88 | 53 | 35 | 66% | ||||||||
| West |
267 | 260 | 7 | 3% | ||||||||
| Colorado |
207 | 72 | 135 | 188% | ||||||||
| Utah |
94 | 42 | 52 | 124% | ||||||||
| Mountain |
301 | 114 | 187 | 164% | ||||||||
| Delaware Valley |
23 | 27 | (4 | ) | -15% | |||||||
| Maryland |
103 | 58 | 45 | 78% | ||||||||
| Virginia |
73 | 36 | 37 | 103% | ||||||||
| East |
199 | 121 | 78 | 64% | ||||||||
| Florida |
59 | 35 | 24 | 69% | ||||||||
| Illinois |
- | 3 | (3 | ) | -100% | |||||||
| Other Homebuilding |
59 | 38 | 21 | 55% | ||||||||
| Total |
826 | 533 | 293 | 55% | ||||||||
| Backlog Estimated Sales Value |
$ | 265,000 | $ | 173,000 | $ | 92,000 | 53% | |||||
| Estimated Average Selling Price of Homes in Backlog |
$ | 320.8 | $ | 324.6 | $ | (3.8 | ) | -1% | ||||
We define “Backlog” as homes under contract but not yet delivered. Backlog in our Mountain, East and Other Homebuilding segments increased from December 31, 2008, primarily because of increased levels of net orders for homes for the year ended December 31, 2009 compared with 2008. Our December 31, 2009 Backlog increased by 293 units from December 31, 2008, primarily attributable to our Mountain and Other Homebuilding segments. Contributing to the improvement were significant efforts to increase traffic in our active subdivisions and generate sales through various advertising and sales promotions. This included a Company initiated sales program during the 2009 third quarter which focused on offering low mortgage interest rates. Also contributing to the increased Backlog was the then scheduled expiration of the federal homebuyer tax credit, which was subsequently revised to expire for homes sold by April 30, 2010 and closed by June 30, 2010.
The estimated Backlog sales value also increased from $173 million at December 31, 2008 to $265 million at December 31, 2009, due to the 55% increase in the number of homes in Backlog.
- 44 -
Table of Contents
Cancellation Rate. We define our home order “Cancellation Rate” as the approximate number of cancelled home purchase contracts during a reporting period as a percentage of total home purchase contracts received during such reporting period. The following tables set forth our Cancellation Rate by segment.
| Year Ended December 31, | Increase (Decrease) | |||||
| 2009 | 2008 | |||||
| Homebuilding |
||||||
| West |
21% | 42% | -21% | |||
| Mountain |
25% | 49% | -24% | |||
| East |
28% | 48% | -20% | |||
| Other Homebuilding |
25% | 48% | -23% | |||
| Consolidated |
24% | 45% | -21% | |||
The Cancellation Rates in each of our segments decreased during the year ended December 31, 2009. We believe that the Cancellation Rates in each homebuilding segment were lower due to a decline in the number of cancelled home orders by homebuyers who had difficulty in qualifying for mortgage loan financing, who were not able to sell their existing home or who had uncertainty in making a purchase of a new home.
Active Subdivisions. The following table displays the number of our active subdivisions for each market within our homebuilding segments. We define an active subdivision as a subdivision that has more than five homes available to be sold and closed and has sold at least five homes.
| Year Ended December 31, | Increase (Decrease) | ||||||||
| 2009 | 2008 | Amount | % | ||||||
| Arizona |
28 | 44 | (16 | ) | -36% | ||||
| California |
3 | 18 | (15 | ) | -83% | ||||
| Nevada |
18 | 24 | (6 | ) | -25% | ||||
| West |
49 | 86 | (37 | ) | -43% | ||||
| Colorado |
42 | 49 | (7 | ) | -14% | ||||
| Utah |
16 | 22 | (6 | ) | -27% | ||||
| Mountain |
58 | 71 | (13 | ) | -18% | ||||
| Delaware Valley |
1 | 3 | (2 | ) | -67% | ||||
| Maryland |
8 | 11 | (3 | ) | -27% | ||||
| Virginia |
7 | 12 | (5 | ) | -42% | ||||
| East |
16 | 26 | (10 | ) | -38% | ||||
| Florida |
10 | 7 | 3 | 43% | |||||
| Illinois |
- | 1 | (1 | ) | -100% | ||||
| Other Homebuilding |
10 | 8 | 2 | 25% | |||||
| Total |
133 | 191 | (58 | ) | -30% | ||||
Our active subdivisions have decreased for most of our homebuilding segments from December 31, 2008 as the Company closed out a number of subdivisions through the sale and closing of homes. Additionally, few subdivisions have been opened as we limited our asset acquisitions during much of the 2009 year.
- 45 -
Table of Contents
Average Selling Prices Per Home Closed. The average selling price for our closed homes includes the base sales price, any purchased options and upgrades, reduced by any Sales Price Incentives (defined as discounts on the sales price of a home) or Mortgage Loan Origination Fees (defined as mortgage loan origination fees paid by Richmond American Homes to HomeAmerican). The following tables set forth our average selling prices per home closed, by market (dollars in thousands).
| Year Ended December 31, | Increase (Decrease) | |||||||||||
| 2009 | 2008 | Amount | % | |||||||||
| Arizona |
$ | 194.3 | $ | 216.2 | $ | (21.9 | ) | -10% | ||||
| California |
417.5 | 429.0 | (11.5 | ) | -3% | |||||||
| Colorado |
316.5 | 352.1 | (35.6 | ) | -10% | |||||||
| Delaware Valley |
416.1 | 406.4 | 9.7 | 2% | ||||||||
| Florida |
214.5 | 238.5 | (24.0 | ) | -10% | |||||||
| Illinois |
313.0 | 347.9 | (34.9 | ) | -10% | |||||||
| Maryland |
425.0 | 466.0 | (41.0 | ) | -9% | |||||||
| Nevada |
201.2 | 244.6 | (43.4 | ) | -18% | |||||||
| Utah |
287.1 | 333.0 | (45.9 | ) | -14% | |||||||
| Virginia |
482.8 | 454.3 | 28.5 | 6% | ||||||||
| Total |
$ | 277.8 | $ | 302.6 | $ | (24.8 | ) | -8% | ||||
The average selling price of homes closed during the year ended December 31, 2009 decreased in most of our markets. These declines resulted in part from increased levels of incentives, reduced sales prices in response to continued low demand for new homes, increased levels of competition in these markets and change in product mix as we closed smaller homes in certain markets, particularly California, Florida and Colorado. We experienced an increase in the average selling price of closed homes in our Virginia and Delaware Valley markets during 2009, primarily related to changes in the size and style of our single-family detached homes that were closed during this period.
Inventory. Our inventory consists of land and land under development and housing completed or under construction. Land and land under development on our Consolidated Balance Sheets primarily includes land acquisition costs and land development costs associated with subdivisions for which we have the intent to construct and sell homes. Also, we include land that is accounted for as held-for-sale as a component of land and land under development in our Consolidated Balance Sheets. Housing completed or under construction in our Consolidated Balance Sheets primarily includes: (1) land costs transferred from land and land under development; (2) hard costs associated with the construction of a house; (3) overhead costs, which include real property taxes, engineering and permit fees; (4) capitalized interest; and (5) certain indirect fees.
- 46 -
Table of Contents
The following table shows the carrying value of land and land under development for each market within our homebuilding segments (dollars in thousands) and it includes $3.5 million that is held-for-sale, primarily in our Illinois market.
| December 31, | Increase (Decrease) | |||||||||||
| 2009 | 2008 | Amount | % | |||||||||
| Arizona |
$ | 32,839 | $ | 22,388 | $ | 10,451 | 47% | |||||
| California |
36,790 | 3,124 | 33,666 | 1078% | ||||||||
| Nevada |
27,591 | 32,732 | (5,141 | ) | -16% | |||||||
| West |
97,220 | 58,244 | 38,976 | 67% | ||||||||
| Colorado |
97,406 | 103,626 | (6,220 | ) | -6% | |||||||
| Utah |
24,093 | 25,701 | (1,608 | ) | -6% | |||||||
| Mountain |
121,499 | 129,327 | (7,828 | ) | -6% | |||||||
| Delaware Valley |
2,909 | 3,755 | (846 | ) | -23% | |||||||
| Maryland |
6,592 | 11,701 | (5,109 | ) | -44% | |||||||
| Virginia |
26,071 | 31,472 | (5,401 | ) | -17% | |||||||
| East |
35,572 | 46,928 | (11,356 | ) | -24% | |||||||
| Florida |
5,329 | 3,924 | 1,405 | 36% | ||||||||
| Illinois |
3,240 | 3,148 | 92 | 3% | ||||||||
| Other Homebuilding |
8,569 | 7,072 | 1,497 | 21% | ||||||||
| Total |
$ | 262,860 | $ | 241,571 | $ | 21,289 | 9% | |||||
The following table shows the carrying value of housing completed or under construction for each market within our homebuilding segments (dollars in thousands).
| December 31, | Increase (Decrease) | |||||||||||
| 2009 | 2008 | Amount | % | |||||||||
| Arizona |
$ | 30,838 | $ | 64,088 | $ | (33,250 | ) | -52% | ||||
| California |
23,890 | 63,820 | (39,930 | ) | -63% | |||||||
| Nevada |
23,714 | 38,033 | (14,319 | ) | -38% | |||||||
| West |
78,442 | 165,941 | (87,499 | ) | -53% | |||||||
| Colorado |
85,537 | 104,497 | (18,960 | ) | -18% | |||||||
| Utah |
19,239 | 33,078 | (13,839 | ) | -42% | |||||||
| Mountain |
104,776 | 137,575 | (32,799 | ) | -24% | |||||||
| Delaware Valley |
3,907 | 13,202 | (9,295 | ) | -70% | |||||||
| Maryland |
26,729 | 29,944 | (3,215 | ) | -11% | |||||||
| Virginia |
29,739 | 41,127 | (11,388 | ) | -28% | |||||||
| East |
60,375 | 84,273 | (23,898 | ) | -28% | |||||||
| Florida |
16,731 | 20,911 | (4,180 | ) | -20% | |||||||
| Illinois |
- | 6,800 | (6,800 | ) | -100% | |||||||
| Other Homebuilding |
16,731 | 27,711 | (10,980 | ) | -40% | |||||||
| Total |
$ | 260,324 | $ | 415,500 | $ | (155,176 | ) | -37% | ||||
- 47 -
Table of Contents
The tables below show the total number of lots owned (excluding homes completed or under construction) and lots controlled under option agreements for each market within our homebuilding segments (in units).
| December 31, | Increase (Decrease) | ||||||||
| 2009 | 2008 | Amount | % | ||||||
| Lots Owned |
|||||||||
| Arizona |
1,075 | 1,458 | (383 | ) | -26% | ||||
| California |
581 | 839 | (258 | ) | -31% | ||||
| Nevada |
966 | 1,111 | (145 | ) | -13% | ||||
| West |
2,622 | 3,408 | (786 | ) | -23% | ||||
| Colorado |
2,514 | 2,597 | (83 | ) | -3% | ||||
| Utah |
545 | 642 | (97 | ) | -15% | ||||
| Mountain |
3,059 | 3,239 | (180 | ) | -6% | ||||
| Delaware Valley |
82 | 115 | (33 | ) | -29% | ||||
| Maryland |
100 | 176 | (76 | ) | -43% | ||||
| Virginia |
241 | 241 | - | 0% | |||||
| East |
423 | 532 | (109 | ) | -20% | ||||
| Florida |
138 | 257 | (119 | ) | -46% | ||||
| Illinois |
141 | 141 | - | 0% | |||||
| Other Homebuilding |
279 | 398 | (119 | ) | -30% | ||||
| Total |
6,383 | 7,577 | (1,194 | ) | -16% | ||||
| December 31, | Increase (Decrease) | ||||||||
| 2009 | 2008 | Amount | % | ||||||
| Lots Controlled Under Option |
|||||||||
| Arizona |
328 | 472 | (144 | ) | -31% | ||||
| California |
113 | 149 | (36 | ) | -24% | ||||
| Nevada |
222 | 95 | 127 | 134% | |||||
| West |
663 | 716 | (53 | ) | -7% | ||||
| Colorado |
537 | 184 | 353 | 192% | |||||
| Utah |
117 | - | 117 | 100% | |||||
| Mountain |
654 | 184 | 470 | 255% | |||||
| Delaware Valley |
- | 40 | (40 | ) | -100% | ||||
| Maryland |
575 | 355 | 220 | 62% | |||||
| Virginia |
192 | 592 | (400 | ) | -68% | ||||
| East |
767 | 987 | (220 | ) | -22% | ||||
| Florida |
500 | 471 | 29 | 6% | |||||
| Illinois |
- | - | - | 0% | |||||
| Other Homebuilding |
500 | 471 | 29 | 6% | |||||
| Total |
2,584 | 2,358 | 226 | 10% | |||||
| Total Lots Owned and Controlled |
8,967 | 9,935 | (968 | ) | -10% | ||||
During the year ended December 31, 2009, our total number of lots owned (excluding homes completed or under construction) decreased 16% from December 31, 2008, primarily due to the transfer of lots from land to homes completed or under construction and the sale of approximately 1,550 lots, primarily in our West and Other
- 48 -
Table of Contents
Homebuilding segments. These items partially were offset by the purchase of lots in a limited number of subdivisions, primarily in our Arizona and Colorado markets. Despite the impact of recording $18.0 million of impairments on our land inventory during the year ended December 31, 2009 and the transfer of lots to work in process, we increased our land and land under development by $24.3 million since December 31, 2008, primarily due to the purchase of approximately 3,200 lots during the year. The acquisition of lots during 2009 relates to approximately 140 new subdivisions that have or we expect will become active. Additionally, our housing completed and under construction decreased by $155.2 million, primarily due to the sale and closing of 3,013 homes during 2009.
Our total number of lots under option increased in each of our homebuilding segments, except for the East segment, where our lots under option decreased 22% from December 31, 2008. The increase in each segment resulted from entering into lot option agreements that we believe meet our underwriting criteria within each market of this segment. This increase was partially offset by a combination of: (1) exercising our right to purchase lots under existing option contracts; and (2) in a limited number of cases, exercising our right to terminate several lot option contracts that no longer met our underwriting criteria.
The table below shows the amount of non-refundable option deposits (in thousands).
| December 31, | ||||||
| 2009 | 2008 | |||||
| Cash |
$ | 7,654 | $ | 5,145 | ||
| Letters of Credit |
2,134 | 4,358 | ||||
| Total Non-refundable Option Deposits |
$ | 9,788 | $ | 9,503 | ||
During the year ended December 31, 2009, non-refundable option deposits increased, primarily due to increasing the number of lots under option agreement in Colorado, Utah and Maryland.
The table below shows the stage of construction for our homes completed or under construction, number of sold homes under construction and model homes (in units).
| December 31, 2009 |
December 31, 2008 |
December 31, 2007 | ||||
| Unsold Homes Under Construction - Final |
41 | 451 | 515 | |||
| Unsold Homes Under Construction - Frame |
389 | 329 | 656 | |||
| Unsold Homes Under Construction - Foundation |
109 | 41 | 229 | |||
| Total Unsold Homes Under Construction |
539 | 821 | 1,400 | |||
| Sold Homes Under Construction |
570 | 409 | 1,350 | |||
| Model Homes |
212 | 387 | 730 | |||
| Homes Completed or Under Construction |
1,321 | 1,617 | 3,480 | |||
During the year ended December 31, 2009, we reduced the number of final unsold homes under construction through the sale and closing of homes as we focused on reducing our finished spec home levels. Additionally, we increased our unsold homes under construction at the framing and foundation stages as we implemented an initiative to build spec homes on which construction is stopped at drywall. We believe this initiative will shorten the time between the sale and closing of a home and will still allow a homebuyer to personalize their home with design center and option upgrades they desire to have.
- 49 -
Table of Contents
Results of Operations—The following discussion compares results for the year ended December 31, 2009 with the year ended December 31, 2008.
Home Sales Revenue. Home sales revenue from a home closing includes the base sales price and any purchased options and upgrades and is reduced for any Sales Price Incentives or Mortgage Loan Origination Fees. The table below summarizes home sales revenue by reportable segment (dollars in thousands).
| Year Ended December 31, | Increase (Decrease) | |||||||||||||
| 2009 | 2008 | Amount | % | |||||||||||
| Homebuilding |
||||||||||||||
| West |
$ | 378,328 | $ | 731,319 | $ | (352,991 | ) | -48% | ||||||
| Mountain |
244,862 | 292,382 | (47,520 | ) | -16% | |||||||||
| East |
176,072 | 243,357 | (67,285 | ) | -28% | |||||||||
| Other Homebuilding |
52,783 | 105,874 | (53,091 | ) | -50% | |||||||||
| Total Homebuilding |
852,045 | 1,372,932 | (520,887 | ) | -38% | |||||||||
| Intercompany adjustments |
(14,991 | ) | (14,784 | ) | (207 | ) | -1% | |||||||
| Consolidated |
$ | 837,054 | $ | 1,358,148 | $ | (521,094 | ) | -38% | ||||||
Home sales revenue during the year ended December 31, 2009 in our West segment decreased $353.0 million due to closing 1,102 fewer homes and $53.8 million due to lower average selling prices of closed homes for each market within this segment. In our Mountain segment, home sales revenue during 2009 was lower by $47.5 million due to closing 49 fewer homes and $30.5 million due to decreases in the average selling prices of closed homes in each market of this segment. Home sales revenue during the year ended December 31, 2009 in our East segment decreased by $67.3 million due to closing 150 fewer homes. In our Other Homebuilding segment, home sales revenue during the year ended December 31, 2009 was lower by $53.1 million due to closing 174 fewer homes and $8.2 million due to decreases in the average selling prices for each market within this segment.
Land Sales. Land sales revenue was $30.7 million and $60.1 million during the years ended December 31, 2009 and 2008, respectively. Land sales revenue during 2009 primarily resulted from our sale of approximately 1,550 lots, primarily in our West and Other Homebuilding segments. The decrease in land sales revenue resulted from the decline in the number of land parcels we have to sell, compared to the 2008 period when we were actively looking to sell significantly more land. Land sales revenue during 2008 resulted from the sale of approximately 1,800 lots, primarily in our West segment. This revenue primarily resulted from the decision that the best economic value to the Company of the lots was to sell them in their current condition, as opposed to retaining the lots to build and sell homes on.
Other Revenue. Gains on the sale of mortgage loans primarily represent revenue earned by HomeAmerican from the sale of HomeAmerican’s originated mortgage loans to third-parties. Our broker origination fees primarily represent fees that HomeAmerican earns upon brokering a mortgage loan for a home closing. Insurance premiums collected by StarAmerican and Allegiant from our homebuilding subcontractors in connection with the construction of homes primarily comprise insurance revenue. Title and other revenue primarily consist of forfeiture of homebuyer deposits on home sales contracts and revenue associated with our American Home Title operations. The table below sets forth the components of other revenue (dollars in thousands).
| Year Ended December 31, | Increase (Decrease) | |||||||||||
| 2009 | 2008 | Amount | % | |||||||||
| Gains on sales of mortgage loans, net |
$ | 20,251 | $ | 21,662 | $ | (1,411 | ) | -7% | ||||
| Broker origination fees |
304 | 1,853 | (1,549 | ) | -84% | |||||||
| Insurance revenue |
6,115 | 8,673 | (2,558 | ) | -29% | |||||||
| Title and other revenue |
3,849 | 7,722 | (3,873 | ) | -50% | |||||||
| Total other revenue |
$ | 30,519 | $ | 39,910 | $ | (9,391 | ) | -24% | ||||
- 50 -
Table of Contents
Other revenue was lower during the year ended December 31, 2009, primarily resulting from decreases in the following: (1) title and other revenue, due to a $2.3 million decline in forfeited homebuyer deposits and fewer home closings for our American Home Title operations; (2) gains on sales of mortgage loans, net, and broker origination fees, as we originated and sold fewer mortgage loans in connection with closing fewer homes during 2009, partially offset by a 1,900 basis point increase in our Capture Rate; and (3) insurance revenue, as we collected fewer insurance premiums from our homebuilding subcontractors as a result of the decline in home construction levels during 2009.
Home Cost of Sales. Home cost of sales primarily includes land acquisition, land development and related costs (both incurred and estimated to be incurred), warranty costs and finance and closing costs, including Closing Cost Incentives. Home cost of sales excludes expenses associated with commissions, amortization of deferred marketing costs and inventory impairment charges. However, while inventory impairment charges recorded during a reporting period do not impact home cost of sales, they do impact future home cost of sales as they lower the lot cost basis of the impaired inventory.
The table below sets forth the home cost of sales by reportable segment (dollars in thousands).
| Year Ended December 31, | Increase (Decrease) | |||||||||||||
| 2009 | 2008 | Amount | % | |||||||||||
| Homebuilding |
||||||||||||||
| West |
$ | 289,381 | $ | 620,329 | $ | (330,948 | ) | -53% | ||||||
| Mountain |
215,989 | 271,845 | (55,856 | ) | -21% | |||||||||
| East |
150,033 | 214,501 | (64,468 | ) | -30% | |||||||||
| Other Homebuilding |
46,442 | 92,974 | (46,532 | ) | -50% | |||||||||
| Total Homebuilding |
701,845 | 1,199,649 | (497,804 | ) | -41% | |||||||||
| Intercompany adjustments |
(14,991 | ) | (14,784 | ) | (207 | ) | 1% | |||||||
| Consolidated |
$ | 686,854 | $ | 1,184,865 | $ | (498,011 | ) | -42% | ||||||
During the year ended December 31, 2009, the decrease in our consolidated home cost of sales resulted primarily from the following: (1) $389 million associated with closing fewer homes in each of our homebuilding segments; and (2) $109 million from decreases in the construction cost of closed homes and decreases in lot costs per closed home. The decline in lot costs per closed home primarily was attributable to inventory impairments recorded during 2008 and 2009, which lowered the lot cost basis of our inventory.
The decrease in our West segment during the year ended December 31, 2009 primarily resulted from the following decreases: (1) $254 million resulting from closing 1,102 fewer homes; (2) $32 million associated with a decrease in the lot cost per closed home, primarily resulting from inventory impairments recorded during 2008, which lowered the lot cost basis of our inventory; (3) $29 million associated with a decrease in home construction cost per closed home; and (4) $7 million associated with adjustments to reduce our warranty reserves.
In our Mountain segment, the decline during the year ended December 31, 2009, primarily resulted from the following: (1) $17 million associated with a decrease in the lot cost per closed home resulting from inventory impairments recorded during 2008, which lowered the lot cost basis of our inventory; (2) closing 49 fewer homes, which resulted in a $16 million decrease to home cost of sales; (3) $16 million associated with a decrease in home construction cost per closed home; and (4) $3 million associated with increases in our warranty reserves during 2008, which did not occur in 2009.
In our East segment, the decline during the year ended December 31, 2009, primarily resulted from the following: (1) closing 150 fewer homes, which resulted in a $60 million decrease to home cost of sales; (2) $7 million associated with a decrease in the lot cost per closed home resulting from inventory impairments recorded during 2008,
- 51 -
Table of Contents
which lowered the lot cost basis of our inventory; and (3) $3 million associated with adjustments to reduce our warranty reserves. These items partially were offset by an increase in the home cost of construction per closed home, resulting in a $6 million increase to home cost of sales.
The decrease in our Other Homebuilding segment during the year ended December 31, 2009, primarily resulted from: (1) closing 174 fewer homes, which resulted in a $39 million decrease to home cost of sales; and (2) lower home construction costs per closed home, which resulted in a $6 million decrease in home cost of sales.
Land Cost of Sales. Land cost of sales was $25.0 million and $53.8 million during the years ended December 31, 2009 and 2008, respectively. Land cost of sales during 2009 primarily relates to the sale of approximately 1,550 lots primarily in our West and Other Homebuilding segments. The decrease in land cost of sales resulted from the decline in the number of land parcels we have to sell, compared to the 2008 period when we were actively looking to sell significantly more land. Land cost of sales during 2008 related to the sale of approximately 1,800 lots, primarily in our West segment.
Asset Impairments. The following table sets forth asset impairments recorded by reportable segment (in thousands).
| Year Ended December 31, | Increase (Decrease) |
||||||||||
| 2009 | 2008 | ||||||||||
| Land and Land Under Development (Held-for-Development) |
|||||||||||
| West |
$ | 10,133 | $ | 81,686 | $ | (71,553 | ) | ||||
| Mountain |
8,913 | 66,606 | (57,693 | ) | |||||||
| East |
1,600 | 23,678 | (22,078 | ) | |||||||
| Other Homebuilding |
376 | 2,543 | (2,167 | ) | |||||||
| Subtotal |
21,022 | 174,513 | (153,491 | ) | |||||||
| Housing Completed or Under Construction (Held-for-Development) |
|||||||||||
| West |
5,379 | 48,437 | (43,058 | ) | |||||||
| Mountain |
1,646 | 16,514 | (14,868 | ) | |||||||
| East |
875 | 11,895 | (11,020 | ) | |||||||
| Other Homebuilding |
537 | 5,796 | (5,259 | ) | |||||||
| Subtotal |
8,437 | 82,642 | (74,205 | ) | |||||||
| Land and Land Under Development (Held-for-Sale) |
|||||||||||
| West |
(557 | ) | 21,846 | (22,403 | ) | ||||||
| Mountain |
- | 150 | (150 | ) | |||||||
| East |
- | 1,270 | (1,270 | ) | |||||||
| Other Homebuilding |
234 | 6,315 | (6,081 | ) | |||||||
| Subtotal |
(323 | ) | 29,581 | (29,904 | ) | ||||||
| Other asset impairments |
1,850 | 11,419 | (9,569 | ) | |||||||
| Consolidated Asset Impairments |
$ | 30,986 | $ | 298,155 | $ | (267,169 | ) | ||||
The $29.5 million impairment of our held-for-development inventories during the year ended December 31, 2009, related to communities in each homebuilding segment and, most notably in our West and Mountain segments. The impairments resulted primarily from declines in the average selling price of homes in each community, resulting from an effort to generate new home sales. The impairments in the West segment were concentrated in the Nevada market and resulted from a decrease in the average selling prices of closed homes during 2009, compared with 2008, in response to increased levels of competition in this market and continued high levels of home foreclosures. The impairments in the East and Other Homebuilding segments primarily resulted from lower forecasted average selling prices for communities that are in the close-out phase.
- 52 -
Table of Contents
The impairment of our held-for-sale inventory during the years ended December 31, 2009 and 2008, primarily resulted from decreases in the fair market values of new homes being sold, as this has caused corresponding declines in the fair market values of land available for sale.
During the year ended December 31, 2009, the other asset impairments primarily related to a $1.0 million impairment of the Company’s related party asset. This impairment resulted from a decline in the estimated cash flows from such asset, resulting in an other-than-temporary-impairment. See Note 9 to our Consolidated Financial Statements.
The following table sets forth the inventory impairments (excluding intangible and other assets) that were recorded on a quarterly basis during 2009 and 2008, as well as the fair value of those inventories and the number of lots and subdivisions at the period end to which the impairments relate (dollars in thousands).
| Inventory Impairments | Fair Value of Impaired Inventory at Quarter End |
Number of Lots Impaired During the Quarter |
Number of Subdivisions Impaired During the Quarter | ||||||||||||||
| Three Months Ended |
Held-for- Development |
Held-for-Sale | Total Inventory Impairments |
||||||||||||||
| March 31, 2009 |
$ | 14,355 | $ | - | $ | 14,355 | $ | 38,602 | 719 | 46 | |||||||
| June 30, 2009 |
1,725 | (557 | ) | 1,168 | 2,978 | 53 | 2 | ||||||||||
| September 30, 2009 |
1,103 | - | 1,103 | 4,172 | 61 | 3 | |||||||||||
| December 31, 2009 |
12,276 | 234 | 12,510 | 29,536 | 336 | 10 | |||||||||||
| Consolidated |
$ | 29,459 | $ | (323 | ) | $ | 29,136 | ||||||||||
| March 31, 2008 |
$ | 47,570 | $ | 6,096 | $ | 53,666 | $ | 218,526 | 2,628 | 94 | |||||||
| June 30, 2008 |
72,024 | 13,198 | 85,222 | 240,372 | 3,501 | 110 | |||||||||||
| September 30, 2008 |
83,340 | 7,480 | 90,820 | 213,498 | 3,474 | 151 | |||||||||||
| December 31, 2008 |
54,221 | 2,807 | 57,028 | 165,656 | 2,177 | 132 | |||||||||||
| Consolidated |
$ | 257,155 | $ | 29,581 | $ | 286,736 | |||||||||||
Marketing Expenses. Marketing expenses primarily include advertising, amortization of deferred marketing costs, model home expenses, compensation related expenses and other selling costs. The following table summarizes our marketing expenses by reportable segment (in thousands).
| Year Ended December 31, | Increase (Decrease) | |||||||||||
| 2009 | 2008 | Amount | % | |||||||||
| Homebuilding |
||||||||||||
| West |
$ | 17,234 | $ | 43,760 | $ | (26,526 | ) | -61% | ||||
| Mountain |
9,810 | 13,059 | (3,249 | ) | -25% | |||||||
| East |
6,818 | 10,442 | (3,624 | ) | -35% | |||||||
| Other Homebuilding |
2,509 | 4,621 | (2,112 | ) | -46% | |||||||
| Consolidated |
$ | 36,371 | $ | 71,882 | $ | (35,511 | ) | -49% | ||||
The $35.5 million decrease in total marketing expenses during the year ended December 31, 2009 primarily resulted from decreases of: (1) $14.4 million in amortization of deferred marketing costs resulting from closing 1,475 fewer homes; (2) $8.3 million in employee compensation and other employee-related benefit costs; (3) $6.9 million in sales office and showroom expenses resulting from fewer active subdivisions and model homes; and (4) $4.8 million in advertising expenses as we continued to reduce our overall advertising costs during this period of lower homebuilding activity. The decrease in marketing expense during the year ended December 31, 2009 was most notable in our West segment, which primarily resulted from the following: (1) a decrease of $12.8 million in amortization of deferred marketing from closing 1,102 fewer homes during 2009; (2) a $5.6 million decrease in
- 53 -
Table of Contents
employee compensation and other employee-related benefit costs due to a significant decline in sales and marketing personnel in this segment; (3) $3.9 million in sales office and showroom expenses resulting from a 63% decline in the number of model homes at December 31, 2009, compared with December 31, 2008, and a 43% decline in active subdivisions in this segment; and (4) $3.2 million in advertising expense.
Commission Expenses. Commission expenses primarily include direct incremental commissions paid for closed homes. The following table summarizes our commission expenses by reportable segment (in thousands).
| Year Ended December 31, | Increase (Decrease) | |||||||||||
| 2009 | 2008 | Amount | % | |||||||||
| Homebuilding |
||||||||||||
| West |
$ | 13,443 | $ | 25,671 | $ | (12,228 | ) | -48% | ||||
| Mountain |
8,846 | 11,338 | (2,492 | ) | -22% | |||||||
| East |
6,614 | 8,900 | (2,286 | ) | -26% | |||||||
| Other Homebuilding |
2,099 | 4,386 | (2,287 | ) | -52% | |||||||
| Consolidated |
$ | 31,002 | $ | 50,295 | $ | (19,293 | ) | -38% | ||||
Commission expenses within all of our homebuilding segments decreased during the year ended December 31, 2009, primarily resulting from declines in commission fees paid to both in-house and outside brokers for each segment due to closing 1,475 fewer homes and at a reduced average selling price.
General and Administrative Expenses. The following table summarizes our general and administrative expenses by reportable segment (in thousands).
| Year Ended December 31, | Increase (Decrease) | |||||||||||
| 2009 | 2008 | Amount | % | |||||||||
| Homebuilding |
||||||||||||
| West |
$ | 26,419 | $ | 48,771 | $ | (22,352 | ) | -46% | ||||
| Mountain |
15,905 | 20,808 | (4,903 | ) | -24% | |||||||
| East |
19,905 | 21,829 | (1,924 | ) | -9% | |||||||
| Other Homebuilding |
4,055 | 7,503 | (3,448 | ) | -46% | |||||||
| Total Homebuilding |
66,284 | 98,911 | (32,627 | ) | -33% | |||||||
| Financial Services and Other |
24,207 | 25,790 | (1,583 | ) | -6% | |||||||
| Corporate |
71,994 | 66,873 | 5,121 | 8% | ||||||||
| Consolidated |
$ | 162,485 | $ | 191,574 | $ | (29,089 | ) | -15% | ||||
The decrease in general and administrative expenses during the year ended December 31, 2009 was most notable within the West segment and primarily resulted from the following decreases: (1) $12.5 million in employee compensation and other employee-related benefit costs due to a decline in headcount from December 31, 2008; (2) $3.6 million of inter-company supervisory fees (“Supervisory Fees”) charged by the Corporate segment; (3) $3.0 million in office-related expenses, primarily rent; and (4) $4.2 million in other general and administrative expenses, primarily depreciation expense, restructuring expenses and homeowner association dues. These declines were offset partially by an increase of $1.0 million in professional and legal expenses. Professional and legal expenses were lower in 2008 due to the resolution of construction defect claims that were ultimately paid by third party insurance providers. Also partially offsetting the decline in general and administrative expenses was the impact of a $1.9 million benefit to reduce the 2008 general and administrative expense without a corresponding benefit during 2009. The benefit during the 2008 period resulted from a reduction in warranty reserves during 2008 that were established through general and administrative expenses during previous reporting periods. See Note 4 to our Consolidated Financial Statements regarding Supervisory Fees.
- 54 -
Table of Contents
In our Mountain segment, general and administrative expenses were lower during the year ended December 31, 2009 primarily due to a $2.7 million decrease in employee compensation and other employee-related benefit costs, as we decreased our headcount during 2009, a decrease of $2.0 million in Supervisory Fees and a $0.8 million decrease in office-related expenses, primarily rent. These items partially were offset by expensing $1.0 million of prepaids that were incurred to fund the operating activities of a metropolitan district in one of the Colorado subdivisions.
General and administrative expenses decreased during the year ended December 31, 2009 in our East segment, primarily due to a $3.4 million decline in employee compensation and other employee-related benefit costs, as we lowered our headcount from December 31, 2008 in this segment, and a $1.4 million decrease in Supervisory Fees. These declines were offset partially by a $4.0 million increase in professional and legal expenses. resulting in part from an increase in legal reserves associated with construction defect claims. In our Other Homebuilding segment, general and administrative expenses were lower during the year ended December 31, 2009, primarily resulting from the following decreases: (1) $1.8 million in other general and administrative expenses, primarily restructuring expenses, legal fees and depreciation expenses; (2) $0.6 million in employee compensation and other employee-related benefit costs, as we lowered our headcount during 2009 in this segment; (3) $0.6 million in Supervisory Fees; and (4) $0.5 million in office-related expenses.
In our Financial Services and Other segment, general and administrative expenses were lower during the year ended December 31, 2009 due to the following decreases: (1) $4.9 million in insurance related expenses, primarily associated with the insurance reserves associated with StarAmerican and Allegiant; (2) $2.9 million decrease in employee compensation and other employee-related benefit costs as we lowered our headcount from December 31, 2008 in this segment; and (3) $0.5 million in office-related expenses, primarily rent. These items partially were offset by a $7.5 million increase associated with expenses for mortgage loan loss reserves. In the normal course of business, we establish reserves for potential losses associated with HomeAmerican’s loan sale agreements pursuant to which mortgage loans are sold to third-parties. These reserves are created to address repurchase and indemnity claims by third-party purchasers of the mortgage loans, which claims arise primarily out of allegations of homebuyer fraud at the time of origination of the loan. These reserves are based upon, among other matters: (1) pending claims received from third-party purchasers associated with previously sold mortgage loans; (2) a current assessment of the potential exposure associated with future claims of homebuyer fraud in mortgage loans originated in prior period loans; and (3) historical loss experience. As noted in reports in the mortgage loan industry during 2009, mortgage performance continued to deteriorate, as evidenced by significant year-over-year increases in delinquency rates. Additionally, foreclosures and foreclosures in process have increased substantially. Similarly, HomeAmerican has experienced an increase in the number and magnitude of claims to repurchase previously sold mortgage loans.
In our Corporate segment, general and administrative expenses increased during the year ended December 31, 2009, primarily resulting from a $7.6 million decrease in Supervisory Fees received from the Company’s other segments and a $0.9 million increase in finance costs associated with the reduction of the Homebuilding Line Commitment. These items partially were offset by a $0.9 million decrease in employee compensation and other employee-related benefit costs and a $0.5 million decrease in office related expenses.
Other Operating Expenses. Other operating expenses were $5.6 million and $7.1 million during the year ended December 31, 2009 and 2008, respectively. The decrease resulted from a $3.8 million decline in write-offs of pre-acquisition costs and deposits on lot option contracts that we elected not to exercise. This decline partially was offset by a $2.7 million valuation allowance recorded against other receivables.
Related Party Expenses. Related party expenses increased to $1.0 million for the year ended December 31, 2009 from $18,000 for the year ended December 31, 2008. The increase in the 2009 expense is the result of MDC pledging to make a contribution to the MDC/Richmond American Homes Foundation (the “Foundation”). We committed to contributing $1.0 million in cash for 2009 to the Foundation, which will be paid during 2010 in fulfillment of our 2009 commitment.
- 55 -
Table of Contents
The Foundation is a nonprofit organization operated exclusively for charitable, educational and other purposes beneficial to social welfare within the meaning of section 501(c)(3) of the Internal Revenue Code (“I.R.C.”). Certain directors and officers of the Company are the trustees and/or officers of the Foundation.
Other Income (Expense). Other income (expense) primarily includes interest income on our cash, cash equivalents and marketable securities, interest expense primarily on our senior notes, and gain or loss on the sale of other assets. During the year ended December 31, 2009, we expensed $38.1 million of interest that was incurred on our senior notes that could not be capitalized, compared with the $18.0 million during 2008. Interest income decreased to $12.2 million during the year ended December 31, 2009, compared with $35.8 million during 2008. This decline primarily resulted from lower interest rates on our cash, cash equivalents and marketable securities, which more than offset the increases in our average cash balances during 2009.
(Loss) Income Before Income Taxes. The table below summarizes our (loss) income before income taxes by segment (dollars in thousands).
| Year Ended December 31, | Change | |||||||||||||
| 2009 | 2008 | Amount | % | |||||||||||
| Homebuilding |
||||||||||||||
| West |
$ | 19,144 | $ | (157,103 | ) | $ | 176,247 | 112% | ||||||
| Mountain |
(15,686 | ) | (112,251 | ) | 96,565 | 86% | ||||||||
| East |
(9,789 | ) | (50,596 | ) | 40,807 | 81% | ||||||||
| Other Homebuilding |
(4,691 | ) | (18,725 | ) | 14,034 | 75% | ||||||||
| Total Homebuilding |
(11,022 | ) | (338,675 | ) | 327,653 | 97% | ||||||||
| Financial Services and Other |
5,953 | 11,678 | (5,725 | ) | -49% | |||||||||
| Corporate |
(102,266 | ) | (55,138 | ) | (47,128 | ) | -85% | |||||||
| Consolidated |
$ | (107,335 | ) | $ | (382,135 | ) | $ | 274,800 | 72% | |||||
In our West segment, we reported income before income taxes of $19.1 million during the year ended December 31, 2009, compared to a $157.1 million loss before income taxes during 2008. This improvement was primarily due to a $137.0 million decrease in inventory impairments, a combined decrease of $61.1 million in general and administrative, commission and sales and marketing expenses and an 830 basis point increase in Home Gross Margins. These improvements partially were offset by closing 1,102 fewer homes. In our Mountain segment, the loss before income taxes during the year ended December 31, 2009 decreased due to the following: (1) a decrease of $72.7 million in inventory impairments; (2) a combined decrease of $10.6 million associated with general and administrative, commission and sales and marketing expenses; and (3) a 480 basis point increase in Home Gross Margins. Partially offsetting these items was the impact of closing 49 fewer homes.
In our East segment, our loss before income taxes during the year ended December 31, 2009 was lower primarily due to the following: (1) a $34.4 million decrease in inventory impairments; (2) a combined decrease of $7.8 million general and administrative, commission and sales and marketing expenses; and (3) a 290 basis point increase in Home Gross Margins. These improvements partially were offset by closing 150 fewer homes.
In our Other Homebuilding segment, the loss before income taxes during the year ended December 31, 2009 was lower primarily due to the following: (1) a $13.5 million decrease in inventory impairments; and (2) a combined decrease of $7.9 million in general and administrative, commission and sales and marketing expenses. These improvements partially were offset by closing 174 fewer homes.
In our Financial Services and Other segment, income before income taxes decreased during the year ended December 31, 2009, compared with 2008, primarily resulting from: (1) a combined decrease of $5.5 million in gains
- 56 -
Table of Contents
on sales of mortgage loans, broker origination fees and insurance revenue; and (2) a $1.8 million decrease in interest income for this segment. These improvements were partially offset by a $1.6 million decrease in general and administrative expenses.
Loss before income taxes in our Corporate segment during the year ended December 31, 2009 was higher primarily due to: (1) a $20.1 million increase in interest expense on our Senior Notes; (2) a $21.3 million decrease in interest income; and (3) a $5.1 million increase in general and administrative expenses.
Income Taxes. Our overall effective income tax rates were 123.0% and 0.4% for the years ended December 31, 2009 and 2008, respectively. The change in our effective tax rate during 2009 was primarily attributable to the carryback of $142.6 million of tax effected net operating losses due to the expanded NOL carryback provisions contained in the Worker, Homeownership, and Business Assistance Act of 2009, enacted on November 6, 2009. These expanded NOL carryback provisions allowed us to carry back our 2009 tax losses to prior years. Absent the new legislation, these 2009 tax losses would have been carried forward to offset future taxable income. This was partially offset by a $9.7 million income tax expense related to an IRS examination of our 2008 net operating loss carryback to 2006. The $9.7 million income tax expense resulted from a 2006 alternative minimum tax liability associated with our 2008 net operating loss carryback, which should have been recorded during 2008.
KEY HOMEBUILDING MEASURES AND RESULTS OF OPERATIONS
2008 COMPARED WITH 2007
Homebuilding Operating Activities.
Orders for Homes. The table below sets forth information relating to orders for homes (dollars in thousands).
| Year Ended December 31, | Increase (Decrease) | |||||||||||
| 2008 | 2007 | Amount | % | |||||||||
| Orders For Homes, net (Units) |
||||||||||||
| Arizona |
879 | 1,889 | (1,010 | ) | -53% | |||||||
| California |
436 | 912 | (476 | ) | -52% | |||||||
| Nevada |
537 | 1,282 | (745 | ) | -58% | |||||||
| West |
1,852 | 4,083 | (2,231 | ) | -55% | |||||||
| Colorado |
435 | 778 | (343 | ) | -44% | |||||||
| Utah |
132 | 426 | (294 | ) | -69% | |||||||
| Mountain |
567 | 1,204 | (637 | ) | -53% | |||||||
| Delaware Valley |
61 | 116 | (55 | ) | -47% | |||||||
| Maryland |
124 | 227 | (103 | ) | -45% | |||||||
| Virginia |
193 | 308 | (115 | ) | -37% | |||||||
| East |
378 | 651 | (273 | ) | -42% | |||||||
| Florida |
246 | 424 | (178 | ) | -42% | |||||||
| Illinois |
31 | 128 | (97 | ) | -76% | |||||||
| Texas |
- | 14 | (14 | ) | -100% | |||||||
| Other Homebuilding |
277 | 566 | (289 | ) | -51% | |||||||
| Total |
3,074 | 6,504 | (3,430 | ) | -53% | |||||||
| Estimated Value of Orders for Homes, net |
$ | 885,000 | $ | 2,107,000 | $ | (1,222,000 | ) | -58% | ||||
| Estimated Average Selling Price of Orders for Homes, net |
$ | 287.9 | $ | 324.0 | $ | (36.1 | ) | -11% | ||||
- 57 -
Table of Contents
Each of our homebuilding segments experienced declines in net home orders during the year ended December 31, 2008 and most notably within the West segment, where most of our homebuilding activity has been concentrated. Net home orders during 2008 for each of our markets were impacted adversely by the downturn in the homebuilding and mortgage lending industries, the volatility in the banking system and financial markets during 2008 and the reality of a recession in the United States economy, due to, among other things, on-going homebuyer concerns about the decline in the market value of homes over the past two years, reduced availability of credit for homebuyers caused by tightened mortgage loan underwriting criteria, an overall reduction in liquidity in the mortgage industry, significant declines in consumer confidence, an overall weakening economy, including declines in overall economic activity, fear of and actual job losses, and heightened concerns regarding the affordability of homes. We also believe that our net home orders during the twelve months ended December 31, 2008 were impacted negatively by our decision not to offer down payment assistance programs to our prospective homebuyers. These programs were offered by many of our competitors throughout much of 2008 until the October 2008 effective date of federal legislation prohibiting these programs. Additionally, net home orders in our Mountain segment declined significantly, particularly in our Utah market, as this market experienced a greater decline in demand for new homes during 2008 than our other homebuilding segments. Also contributing to the decrease during 2008 was the impact of a 31% decline in the overall number of our active subdivisions from December 31, 2007, which was particularly significant in the markets of our Other Homebuilding, West and East segments, where our active subdivisions decreased by 68%, 41% and 30%, respectively, from those at December 31, 2007.
Homes Closed. The following table sets forth homes closed for each market within our homebuilding segments (in units).
| Year Ended December 31, | Increase (Decrease) | ||||||||
| 2008 | 2007 | Amount | % | ||||||
| Arizona |
1,313 | 2,801 | (1,488 | ) | -53% | ||||
| California |
590 | 1,136 | (546 | ) | -48% | ||||
| Nevada |
791 | 1,290 | (499 | ) | -39% | ||||
| West |
2,694 | 5,227 | (2,533 | ) | -48% | ||||
| Colorado |
576 | 818 | (242 | ) | -30% | ||||
| Utah |
268 | 713 | (445 | ) | -62% | ||||
| Mountain |
844 | 1,531 | (687 | ) | -45% | ||||
| Delaware Valley |
91 | 178 | (87 | ) | -49% | ||||
| Maryland |
192 | 288 | (96 | ) | -33% | ||||
| Virginia |
257 | 344 | (87 | ) | -25% | ||||
| East |
540 | 810 | (270 | ) | -33% | ||||
| Florida |
336 | 496 | (160 | ) | -32% | ||||
| Illinois |
74 | 105 | (31 | ) | -30% | ||||
| Texas |
- | 26 | (26 | ) | -100% | ||||
| Other Homebuilding |
410 | 627 | (217 | ) | -35% | ||||
| Total |
4,488 | 8,195 | (3,707 | ) | -45% | ||||
Our home closings were down during the year ended December 31, 2008 for each market within our homebuilding segments, most notably within the West and Mountain segments where our homebuilding activity has been concentrated. Additionally, our Utah market of the Mountain segment experienced a greater decline in demand for new homes during 2008 than our other homebuilding segments. Factors that contributed to the market decline in each of our homebuilding segments have been outlined in the section above, “Orders for Homes.”
- 58 -
Table of Contents
Home Gross Margins. The following table sets forth our Home Gross Margins by reportable segment.
| Year Ended December 31, | ||||||
| 2008 | 2007 | (Decrease) | ||||
| West |
15.2% | 12.6% | 2.6% | |||
| Mountain |
7.0% | 16.8% | -9.8% | |||
| East |
11.9% | 17.0% | -5.1% | |||
| Other Homebuilding |
12.2% | 9.4% | 2.8% | |||
| Total |
12.8% | 13.9% | 1.1% | |||
Home Gross Margins can be impacted positively or negatively by a number of factors, including: (1) changes in the average selling prices of closed homes; (2) changes in the home construction costs per closed home; (3) lot cost per closed home; (4) adjustments in our warranty reserves and land development accruals; and (5) closing homes which were previously impaired.
The following table sets forth the warranty adjustments we recorded to home cost of sales during the years ended December 31, 2008 and 2007 by reportable segment (in thousands).
| Year Ended December 31, | ||||||||
| 2008 | 2007 | |||||||
| (Decrease) Increase to Home Cost of Sales | ||||||||
| West |
$ | (16,871 | ) | $ | 4,461 | |||
| Mountain |
2,822 | 1,805 | ||||||
| East |
38 | (151 | ) | |||||
| Other Homebuilding |
- | 18 | ||||||
| Total |
$ | (14,011 | ) | $ | 6,133 | |||
Home Gross Margins can be impacted positively or negatively in a reporting period by adjustments in our warranty reserves. In our West segment, during the year ended December 31, 2008, we recorded adjustments to reduce our warranty reserve. These adjustments resulted primarily from a downward trend in the amount of warranty payments incurred on our previously closed homes. Because our warranty reserve balance at each period end is generally determined based upon historical warranty payment patterns, the foregoing downward trend in warranty payments impacted the Company’s warranty reserves during the year ended December 31, 2008. In our Mountain segment for the year ended December 31, 2008, we experienced adjustments to increase our warranty reserve, primarily resulting from increases in estimated payments for a structural related warranty issue in one of our Colorado subdivisions. During the year ended December 31, 2007, we experienced adjustments in most of our homebuilding segments and most notably in our West and Mountain segment. These increases primarily resulted from increases in the trend of warranty payments incurred during 2007 for homes closed prior to 2007.
Also contributing to the increase in Home Gross Margins for the West segment were decreases in our land development accruals of approximately $10.8 million, primarily resulting from the release of obligations under performance bonds associated with subdivisions that no longer had homes to close. These positive adjustments were offset by the impact of decreases in the base selling prices of our homes and increases in Sales Price Incentives offered to our homebuyers during the year ended December 31, 2008.
Home Gross Margins in our Mountain segment decreased during the year ended December 31, 2008. This was caused by increases in home construction costs per closed home, primarily resulting from changes in the size and style of homes that were closed during 2008. Also contributing to the decline in Home Gross Margins were decreases in the average selling prices of homes closed in the Utah market of this segment and an increase in interest expense in home cost of sales. Home Gross Margins in our East segment were impacted negatively by lower average selling prices of homes closed, primarily due to significantly higher Sales Price Incentives offered to our homebuyers.
- 59 -
Table of Contents
Also impacting Home Gross Margins during the years ended December 31, 2008 and 2007, was the impact of closing homes which were previously impaired as inventory impairments result in a lower lot cost basis and are not included in home cost of sales when initially recorded. For our West, East, Other Homebuilding and Mountain segments during the year ended December 31, 2008, we closed homes in subdivisions for which we recorded $192.7 million, $22.7 million, $21.8 million and $12.3 million, respectively, of inventory impairments. For our West, East, Other Homebuilding and Mountain segments during the year ended December 31, 2007, we closed homes in subdivisions for which we recorded $99.8 million, $9.4 million, $8.6 million and $3.8 million, respectively, of inventory impairments.
Additionally, we capitalize interest incurred on our senior notes and Homebuilding Line to our held-for-development homebuilding inventories during the period of active development and through the completion of construction. During the year ended December 31, 2008, interest expense included in home cost of sales as a percent of home sales revenue increased to 4.0%, compared with 2.0% during 2007. This increase resulted from the decline in our inventory levels during 2008 and 2007, during which time the amount of homebuilding and corporate interest incurred was approximately the same each quarter. As a consequence, our active held-for-development inventory was burdened with an increased level of capitalized interest.
Our Home Gross Margins also can be impacted materially by the deferral of Operating Profits for homes that close and do not meet all the criteria necessary for revenue recognition. However, due to the decrease during 2008 in the number of mortgage loan originations that were interest only or had the homebuyer providing less than a 5% initial investment, as well as an increase in the origination of government mortgage loans, the impact of deferring Operating Profits during the years ended December 31, 2009 and 2008 were not material. Home Gross Margins for the year ended December 31, 2007 were impacted positively by recognizing $23.1 million in Operating Profits that had been deferred as of December 31, 2006 and recognized to home sales revenue during 2007.
Backlog. The following table sets forth information relating to Backlog within each market of our homebuilding segments.
| December 31, | Increase (Decrease) | |||||||||||
| 2008 | 2007 | Amount | % | |||||||||
| Arizona |
158 | 592 | (434 | ) | -73% | |||||||
| California |
49 | 203 | (154 | ) | -76% | |||||||
| Nevada |
53 | 307 | (254 | ) | -83% | |||||||
| West |
260 | 1,102 | (842 | ) | -76% | |||||||
| Colorado |
72 | 213 | (141 | ) | -66% | |||||||
| Utah |
42 | 178 | (136 | ) | -76% | |||||||
| Mountain |
114 | 391 | (277 | ) | -71% | |||||||
| Delaware Valley |
27 | 57 | (30 | ) | -53% | |||||||
| Maryland |
58 | 126 | (68 | ) | -54% | |||||||
| Virginia |
36 | 100 | (64 | ) | -64% | |||||||
| East |
121 | 283 | (162 | ) | -57% | |||||||
| Florida |
35 | 125 | (90 | ) | -72% | |||||||
| Illinois |
3 | 46 | (43 | ) | -93% | |||||||
| Other Homebuilding |
38 | 171 | (133 | ) | -78% | |||||||
| Total |
533 | 1,947 | (1,414 | ) | -73% | |||||||
| Backlog Estimated Sales Value |
$ | 173,000 | $ | 650,000 | $ | (477,000 | ) | -73% | ||||
| Estimated Average Selling Price of Homes in Backlog |
$ | 324.6 | $ | 333.8 | $ | (9.2 | ) | -3% | ||||
- 60 -
Table of Contents
The average selling price of homes that we closed during the year ending December 31, 2008 decreased in most of our markets, primarily resulting from increased levels of home sales incentives and reduced sales prices in response to lower demand for new homes, increased levels of competition, increased home foreclosure levels and new home affordability issues resulting from the overall tightening of mortgage loan origination requirements. We experienced an increase in average selling price in our Colorado market during the year ended December 31 2008, primarily related to changes in the size and style of our single-family detached homes that were closed during this period.
Cancellation Rate. The following tables set forth our Cancellation Rate by segment.
| Year Ended December 31, | Increase (Decrease) | |||||
| 2008 | 2007 | |||||
| Homebuilding |
||||||
| West |
42% | 48% | -6% | |||
| Mountain |
49% | 48% | 1% | |||
| East |
48% | 47% | 1% | |||
| Other Homebuilding |
48% | 47% | 1% | |||
| Consolidated |
45% | 48% | -3% | |||
Our consolidated Cancellation Rate during the year ended December 31, 2008 decreased to 45% from 48% during 2007. This decline resulted from a decrease in the Cancellation Rate in our West segment, primarily due to a decrease in the number of contingent home orders received and the impact of mortgage loan origination requirements, which were tightened beginning in the second half of 2007.
Active Subdivisions. The following table displays the number of our active subdivisions for each market within our homebuilding segments.
| Year Ended December 31, | Increase (Decrease) | ||||||||
| 2008 | 2007 | Amount | % | ||||||
| Arizona |
44 | 66 | (22 | ) | -33% | ||||
| California |
18 | 41 | (23 | ) | -56% | ||||
| Nevada |
24 | 39 | (15 | ) | -38% | ||||
| West |
86 | 146 | (60 | ) | -41% | ||||
| Colorado |
49 | 47 | 2 | 4% | |||||
| Utah |
22 | 23 | (1 | ) | -4% | ||||
| Mountain |
71 | 70 | 1 | 1% | |||||
| Delaware Valley |
3 | 4 | (1 | ) | -25% | ||||
| Maryland |
11 | 15 | (4 | ) | -27% | ||||
| Virginia |
12 | 18 | (6 | ) | -33% | ||||
| East |
26 | 37 | (11 | ) | -30% | ||||
| Florida |
7 | 20 | (13 | ) | -65% | ||||
| Illinois |
1 | 5 | (4 | ) | -80% | ||||
| Other Homebuilding |
8 | 25 | (17 | ) | -68% | ||||
| Total |
191 | 278 | (87 | ) | -31% | ||||
Active subdivisions decreased in most markets of our homebuilding segments during the year ended December 31, 2008, primarily due to our on-going efforts to manage our cash outflows through, among other things, limiting our purchase of new lots in each of our homebuilding segments during the homebuilding downcycle.
- 61 -
Table of Contents
Average Selling Prices Per Home Closed. The following tables set forth our average selling prices per home closed, by market (dollars in thousands).
| Year Ended December 31, | Increase (Decrease) | |||||||||||
| 2008 | 2007 | Amount | % | |||||||||
| Arizona |
$ | 216.2 | $ | 247.4 | $ | (31.2 | ) | -13% | ||||
| California |
429.0 | 516.5 | (87.5 | ) | -17% | |||||||
| Colorado |
352.1 | 346.3 | 5.8 | 2% | ||||||||
| Delaware Valley |
406.4 | 448.8 | (42.4 | ) | -9% | |||||||
| Florida |
238.5 | 261.5 | (23.0 | ) | -9% | |||||||
| Illinois |
347.9 | 372.4 | (24.5 | ) | -7% | |||||||
| Maryland |
466.0 | 515.2 | (49.2 | ) | -10% | |||||||
| Nevada |
244.6 | 296.2 | (51.6 | ) | -17% | |||||||
| Texas |
N/A | 129.6 | N/A | N/A | ||||||||
| Utah |
333.0 | 355.5 | (22.5 | ) | -6% | |||||||
| Virginia |
454.3 | 480.4 | (26.1 | ) | -5% | |||||||
| Total |
$ | 302.6 | $ | 337.5 | $ | (34.9 | ) | -10% | ||||
The average selling price of homes that we closed during the year ending December 31, 2008 decreased in most of our markets, primarily resulting from increased levels of home sales incentives and reduced sales prices in response to lower demand for new homes, increased levels of competition, increased home foreclosure levels and new home affordability issues resulting from tighter mortgage loan origination requirements during 2008. We experienced an increase in average selling price in our Colorado market during the year ended December 31 2008, primarily related to changes in the size and style of our single-family detached homes that were closed during this period.
Results of Operations—The following discussion compares results for the year ended December 31, 2008 with the year ended December 31, 2007.
Home Sales Revenue. The table below summarizes home sales revenue by reportable segment (dollars in thousands).
| Year Ended December 31, | Increase (Decrease) | |||||||||||||
| 2008 | 2007 | Amount | % | |||||||||||
| Homebuilding |
||||||||||||||
| West |
$ | 731,319 | $ | 1,676,731 | $ | (945,412 | ) | -56% | ||||||
| Mountain |
292,382 | 539,692 | (247,310 | ) | -46% | |||||||||
| East |
243,357 | 397,168 | (153,811 | ) | -39% | |||||||||
| Other Homebuilding |
105,874 | 172,375 | (66,501 | ) | -39% | |||||||||
| Total Homebuilding |
1,372,932 | 2,785,966 | (1,413,034 | ) | -51% | |||||||||
| Intercompany adjustments |
(14,784 | ) | (19,985 | ) | 5,201 | -26% | ||||||||
| Consolidated |
$ | 1,358,148 | $ | 2,765,981 | $ | (1,407,833 | ) | -51% | ||||||
The decrease in home sales revenue in our West segment during the year ended December 31, 2008 primarily resulted from closing 2,533 fewer homes as well as decreases in the average selling prices for homes closed in each market within this segment. Home sales revenue in our Mountain segment decreased during the year ended December 31, 2008 due to closing 687 fewer homes and decreases in the average selling prices of closed homes during 2008 in Utah. The decline in home sales revenue in our East segment during the year ended December 31, 2008 primarily resulted from lower average selling prices of closed homes in each market within this segment and closing 270 fewer homes. Home sales revenue in our Other Homebuilding segment decreased during the year ended December 31, 2008 primarily due to closing 217 fewer homes and lower average selling prices for homes closed for each market within this segment.
- 62 -
Table of Contents
Land Sales Revenue. Land sales revenue was $60.1 million during the year ended December 31, 2008, compared with $50.1 million for the year ended December 31, 2007. Land sales revenue during 2008 resulted from the sale of approximately 1,800 lots, primarily in our West segment. This revenue primarily resulted from our deciding that the best economic value to the Company of these lots was to sell them in their current condition as opposed to holding the lots and eventually building and selling homes on them. Land sales revenue during 2007 primarily related to the sale of nearly 2,000 lots in more than 20 subdivisions located primarily in California, Arizona, Nevada and Utah.
Other Revenue. The table below sets forth the components of other revenue (dollars in thousands).
| Year Ended December 31, | Increase (Decrease) | |||||||||||
| 2008 | 2007 | Amount | % | |||||||||
| Gains on sales of mortgage loans, net |
$ | 21,662 | $ | 30,682 | $ | (9,020 | ) | -29% | ||||
| Broker origination fees. |
1,853 | 7,014 | (5,161 | ) | -74% | |||||||
| Insurance revenue |
8,673 | 17,241 | (8,568 | ) | -50% | |||||||
| Title and other revenue |
7,722 | 14,611 | (6,889 | ) | -47% | |||||||
| Total other revenue |
$ | 39,910 | $ | 69,548 | $ | (29,638 | ) | -43% | ||||
Other revenue was lower during the year ended December 31, 2008, primarily resulting from decreases in the following: (1) gains on sales of mortgage loans, net and broker origination fees, as we originated and sold fewer mortgage loans in connection with closing fewer homes during 2008; (2) insurance revenue, as we collected fewer insurance premiums from our homebuilding subcontractors as a result of the decline in home construction levels during 2008; and (3) title and other revenue, due to a decline in forfeited homebuyer deposits.
Home Cost of Sales. The table below sets forth the home cost of sales by reportable segment (dollars in thousands).
| Year Ended December 31, | Increase (Decrease) | |||||||||||||
| 2008 | 2007 | Amount | % | |||||||||||
| Homebuilding |
||||||||||||||
| West |
$ | 620,329 | $ | 1,465,437 | $ | (845,108 | ) | -58% | ||||||
| Mountain |
271,845 | 449,219 | (177,374 | ) | -39% | |||||||||
| East |
214,501 | 329,630 | (115,129 | ) | -35% | |||||||||
| Other Homebuilding |
92,974 | 156,126 | (63,152 | ) | -40% | |||||||||
| Total Homebuilding |
1,199,649 | 2,400,412 | (1,200,763 | ) | -50% | |||||||||
| Intercompany adjustments |
(14,784 | ) | (19,985 | ) | 5,201 | -26% | ||||||||
| Consolidated |
$ | 1,184,865 | $ | 2,380,427 | $ | (1,195,562 | ) | -50% | ||||||
During the year ended December 31, 2008, the decrease in our consolidated home cost of sales resulted primarily from the following decreases: (1) $1.1 billion associated with closing 3,707 fewer homes in all of our homebuilding segments; (2) $156 million from decreases in lot costs per closed home, primarily attributable to inventory impairments recorded during 2007 and 2008, which lowered the lot cost basis of our inventory; and (3) $20.8 million associated with warranty reserve adjustments. These items partially were offset by the following increases: (1) $28.0 million in home construction costs per closed homes, primarily resulting from changes in the size and style of closed homes; (2) $18 million in interest in cost of sales; and (3) a decrease in financing costs per closed home resulting in a $6 million reduction to home cost of sales.
The decrease in our West segment during the year ended December 31, 2008 primarily resulted from the following decreases: (1) $710 million resulting from closing 2,533 fewer homes; (2) $130 million associated with a
- 63 -
Table of Contents
decrease in the lot cost per closed home, primarily resulting from inventory impairments recorded during 2007 and 2008, which lowered the lot cost basis of our inventory; and (3) $21 million associated with adjustments to reduce our warranty reserves. These items partially were offset by the following: (1) an increase in interest in cost of sales per closed home resulting in a $9 million increase in home cost of sales; and (2) an increase in financing costs per closed home resulting in a $5 million reduction to home cost of sales. In our Mountain segment, the decline during the year ended December 31, 2008, primarily resulted from the following: (1) closing 687 fewer homes, which resulted in a $202 million decrease to home cost of sales; and (2) a $5 million decrease associated with a lower lot cost per closed home resulting from inventory impairments recorded during 2007 and 2008, which lowered the lot cost basis of our inventory. These items partially were offset by an increase in interest in cost of sales per closed home resulting in an $8 million increase in home cost of sales.
In our East segment, the decline in home cost of sales during the year ended December 31, 2008, primarily resulted from the following: (1) closing 270 fewer homes, which resulted in a $110 million decrease to home cost of sales; and (2) a $10 million decrease associated with a lower lot cost per closed home resulting from inventory impairments recorded during 2007 and 2008, which lowered the lot cost basis of our inventory. These items partially were offset by an increase in interest in cost of sales per closed home resulting in a $4 million increase in home cost of sales. The decrease in our Other Homebuilding segment during the year ended December 31, 2008, primarily resulted from: (1) closing 217 fewer homes, which resulted in a $54 million decrease to home cost of sales; and (2) a $13 million decrease associated with a lower lot cost per closed home resulting from inventory impairments recorded during 2007 and 2008, which lowered the lot cost basis of our inventory. These items partially were offset by an increase in interest in cost of sales per closed home resulting in a $2 million increase in home cost of sales
Land Cost of Sales. Land cost of sales was $53.8 million during the year ended December 31, 2008 and primarily related to the sale and closing of approximately 1,800 lots, primarily in our West segment. Land cost of sales during the year ended December 31, 2007 was $59.5 million and primarily related to the sale of nearly 2,000 lots in more than 20 subdivisions located primarily in California, Arizona, Nevada and Utah.
- 64 -
Table of Contents
Asset Impairments. The following table sets forth asset impairments recorded by reportable segment (in thousands).
| Year Ended December 31, | Increase (Decrease) |
|||||||||
| 2008 | 2007 | |||||||||
| Land and Land Under Development (Held-for-Development) |
||||||||||
| West |
$ | 81,686 | $ | 419,471 | $ | (337,785 | ) | |||
| Mountain |
66,606 | 24,194 | 42,412 | |||||||
| East |
23,678 | 37,719 | (14,041 | ) | ||||||
| Other Homebuilding |
2,543 | 34,170 | (31,627 | ) | ||||||
| Subtotal |
174,513 | 515,554 | (341,041 | ) | ||||||
| Housing Completed or Under Construction (Held-for-Development) |
||||||||||
| West |
48,437 | 135,081 | (86,644 | ) | ||||||
| Mountain |
16,514 | 5,912 | 10,602 | |||||||
| East |
11,895 | 16,177 | (4,282 | ) | ||||||
| Other Homebuilding |
5,796 | 12,722 | (6,926 | ) | ||||||
| Subtotal |
82,642 | 169,892 | (87,250 | ) | ||||||
| Land and Land Under Development (Held-for-Sale) |
||||||||||
| West |
21,846 | 26,942 | (5,096 | ) | ||||||
| Mountain |
150 | - | 150 | |||||||
| East |
1,270 | - | 1,270 | |||||||
| Other Homebuilding |
6,315 | 13,765 | (7,450 | ) | ||||||
| Subtotal |
29,581 | 40,707 | (11,126 | ) | ||||||
| Other asset impairments |
11,419 | 468 | 10,951 | |||||||
| Consolidated Asset Impairments |
$ | 298,155 | $ | 726,621 | $ | (428,466 | ) | |||
The impairments of our held-for-development inventories incurred during the year ended December 31, 2008, primarily resulted from decreases in home sales prices and/or increases in Sales Price Incentives offered as a result of: (1) lower home sales prices offered by our competitors; (2) efforts to maintain homes in Backlog; (3) high levels of home foreclosures; (4) affordability issues for new homes as homebuyers experienced difficulty in qualifying for mortgage loans; and (5) efforts to stimulate new home orders in order to sell and close the remaining homes in subdivisions that were in the close-out phase. Additionally, during the 2008 third quarter, we increased the discount rates used in our estimated discounted cash flow assessments from a range of 10% to 18% to a range of 13% to 21%. This change resulted from increased risks and uncertainties in the homebuilding industries due to, among other things, the on-going deterioration in the market value of land and homes as well as homebuyers’ inability to qualify for mortgage loans. The impairments of our held-for-development inventories were increased by approximately $14 million as a result of the increase in our estimated discount rates.
The impairments of held-for-development inventories in the Mountain and West segments were significantly higher than impairments recorded in our other homebuilding segments, primarily resulting from: (1) competition within the sub-markets of these segments appearing to be more pronounced than in the other homebuilding segments and, as a result, we generally experienced more significant reductions in our average selling prices of homes within these segments; and (2) the fact that the total homebuilding inventories for the Mountain and West segments comprised 39% and 35%, respectively, of our consolidated homebuilding inventories at December 31, 2008. We also believe that buyers of our homes in the West segment were largely comprised of entry level homebuyers, compared with a wider range of homebuyers in the other homebuilding segments and, as such, their ability to obtain suitable mortgage loan financing was impacted more adversely by the decreased availability of mortgage loan products, which contributed to the relatively higher impairments in this segment. Also contributing to the impairments in the Mountain
- 65 -
Table of Contents
segment was a more pronounced decline in demand for new homes in recent quarters, particularly in our Utah market, which experienced a greater decline in demand for new homes during 2008 than have our other homebuilding segments.
During the year ended December 31, 2008 and 2007, we recorded impairments of $29.6 million and $40.7 million, respectively, on our held-for-sale inventory, primarily in the West segment. The 2008 impairments primarily resulted from decreases in the fair market values of new homes being sold, as this has caused corresponding declines in the fair market values of land available for sale. Also contributing to these impairments was the decision that the best economic value to the Company of these lots was to sell them as opposed to holding the lots and eventually building and selling homes on them. The decrease in the impairments of our held-for-sale inventory during 2008 primarily resulted from lower exposure to impairments of held-for-sale assets as we closed on the sale of a significant number of lots during 2007 and early 2008.
Additionally, during the year ended December 31, 2008, we incurred $11.4 million of impairments associated with intangible and other assets. These impairments primarily related to deferred marketing costs, such as certain selling costs associated with model homes that were abandoned during the year either because of a determination that the best use of the asset was to sell it in its current condition or because of changing home styles in a subdivision, which resulted in certain model homes no longer being used for the sale of new homes.
The following table sets forth the inventory impairments (excluding intangible and other assets) that were recorded on a quarterly basis during 2008 and 2007, as well as the fair value of those inventories and the number of lots and subdivisions at the period end to which the impairments relate (dollars in thousands).
| Three Months Ended |
Inventory Impairments | Fair Value of Impaired Inventory at Quarter End |
Number of Lots Impaired During the Quarter |
Number of Subdivisions Impaired During the Quarter | ||||||||||||
| Held-for- Development |
Held-for-Sale | Total Inventory Impairments |
||||||||||||||
| March 31, 2008 |
$ | 47,570 | $ | 6,096 | $ | 53,666 | $ | 218,526 | 2,628 | 94 | ||||||
| June 30, 2008 |
72,024 | 13,198 | 85,222 | 240,372 | 3,501 | 110 | ||||||||||
| September 30, 2008 |
83,340 | 7,480 | 90,820 | 213,498 | 3,474 | 151 | ||||||||||
| December 31, 2008 |
54,221 | 2,807 | 57,028 | 165,656 | 2,177 | 132 | ||||||||||
| Consolidated |
$ | 257,155 | $ | 29,581 | $ | 286,736 | ||||||||||
| March 31, 2007 |
$ | 136,422 | $ | 5,000 | $ | 141,422 | $ | 381,117 | 3,284 | 52 | ||||||
| June 30, 2007 |
158,642 | 2,408 | 161,050 | 448,372 | 4,427 | 83 | ||||||||||
| September 30, 2007 |
242,782 | 6,168 | 248,950 | 873,038 | 7,074 | 132 | ||||||||||
| December 31, 2007 |
147,600 | 27,131 | 174,731 | 397,045 | 4,891 | 153 | ||||||||||
| Consolidated |
$ | 685,446 | $ | 40,707 | $ | 726,153 | ||||||||||
Marketing Expenses. The following table summarizes our marketing expenses by reportable segment (in thousands).
| Year Ended December 31, | Increase (Decrease) | |||||||||||
| 2008 | 2007 | Amount | % | |||||||||
| Homebuilding |
||||||||||||
| West |
$ | 43,760 | $ | 70,539 | $ | (26,779 | ) | -38% | ||||
| Mountain |
13,059 | 21,019 | (7,960 | ) | -38% | |||||||
| East |
10,442 | 16,162 | (5,720 | ) | -35% | |||||||
| Other Homebuilding |
4,621 | 9,368 | (4,747 | ) | -51% | |||||||
| Total Homebuilding |
$ | 71,882 | $ | 117,088 | $ | (45,206 | ) | -39% | ||||
- 66 -
Table of Contents
The lower marketing expenses for each of our homebuilding segments primarily resulted from decreases of: (1) $22.5 million in advertising expenses during the year ended December 31, 2008, as we continued to reduce our overall advertising costs in response to the decreased levels of home orders and closings, as well as having fewer active subdivisions during 2008; (2) $8.9 million in sales office expenses during 2008, in connection with having fewer model homes at December 31, 2008; and (3) $9.6 million of amortization of deferred marketing costs as a result of closing fewer homes during the year ended December 31, 2008.
Commission Expenses. The following table summarizes our commission expenses by reportable segment (in thousands).
| Year Ended December 31, | Increase (Decrease) | |||||||||||
| 2008 | 2007 | Amount | % | |||||||||
| Homebuilding |
||||||||||||
| West |
$ | 25,671 | $ | 59,890 | $ | (34,219 | ) | -57% | ||||
| Mountain |
11,338 | 18,925 | (7,587 | ) | -40% | |||||||
| East |
8,900 | 12,064 | (3,164 | ) | -26% | |||||||
| Other Homebuilding |
4,386 | 7,072 | (2,686 | ) | -38% | |||||||
| Total Homebuilding |
$ | 50,295 | $ | 97,951 | $ | (47,656 | ) | -49% | ||||
Commission expenses within all of our homebuilding segments decreased during the year ended December 31, 2008, primarily resulting from declines in commission fees paid to both in-house and outside brokers for each segment due to closing fewer homes and the declines in the average selling price of closed homes.
General and Administrative Expenses. The following table summarizes our general and administrative expenses by reportable segment (in thousands).
| Year Ended December 31, | Increase (Decrease) | |||||||||||
| 2008 | 2007 | Amount | % | |||||||||
| Homebuilding |
||||||||||||
| West |
$ | 48,771 | $ | 109,312 | $ | (60,541 | ) | -55% | ||||
| Mountain |
20,808 | 32,371 | (11,563 | ) | -36% | |||||||
| East |
21,829 | 29,141 | (7,312 | ) | -25% | |||||||
| Other Homebuilding |
7,503 | 16,262 | (8,759 | ) | -54% | |||||||
| Total Homebuilding |
98,911 | 187,086 | (88,175 | ) | -47% | |||||||
| Financial Services and Other |
25,790 | 40,445 | (14,655 | ) | -36% | |||||||
| Corporate |
66,873 | 55,815 | 11,058 | 20% | ||||||||
| Consolidated |
$ | 191,574 | $ | 283,346 | $ | (91,772 | ) | -32% | ||||
General and administrative expenses for each of our homebuilding segments decreased during the year ended December 31, 2008. These reduced expenses resulted from various cost saving initiatives associated with right-sizing our operations in response to the reduced levels of homebuilding activity in each of our markets. We consolidated certain homebuilding divisions and reduced employee headcount as of December 2008 from December 2007 by 53%, 40%, 27% and 43% in our West, Mountain, East and Other Homebuilding segments, respectively. Through these efforts, we have reduced our homebuilding divisions to 10 as of December 31, 2008 from 12 at December 31, 2007, allowing us to consolidate office space in many of our markets throughout 2007 and into 2008.
The decrease in general and administrative expenses during the year ended December 31, 2008 for the homebuilding segments was most notable within the West segment, primarily resulting from the following: (1) a $22.5 million decrease in employee compensation and other employee-related benefit costs; (2) a $13.2 million
- 67 -
Table of Contents
decrease in Supervisory Fees; (3) an $8.5 million decrease in office-related expenses and depreciation resulting from fewer office facilities being occupied as we consolidated our homebuilding divisions; (4) a $4.8 million decrease in legal expenses as a result of resolving construction defect claims; (5) a $4.8 million decrease in other expenses, primarily relating to reductions in warranty reserves that were established through general and administrative expenses during previous reporting periods; and (6) a $3.7 million decrease in restructuring related expenses as we exited more office facilities during 2007 than in 2008 during our efforts to consolidate homebuilding divisions.
The decline in general and administrative expenses during the year ended December 31, 2008 in our Mountain segment primarily resulted from decreases of: (1) $7.4 million in employee compensation and other employee-related benefit costs; (2) $1.8 million in Supervisory Fees; and (3) $1.1 million in office-related expenses and depreciation resulting from fewer office facilities being occupied as we consolidated our homebuilding divisions.
The decline in general and administrative expenses during the year ended December 31, 2008 in our East segment primarily resulted from decreases of: (1) $3.8 million in employee compensation and other employee-related benefit costs; (2) $2.0 million in Supervisory Fees; (3) $1.2 in restructuring related expenses as we exited more office facilities during 2007 than in 2008 during our efforts to consolidate homebuilding divisions; and (4) $0.6 million in office-related expenses and depreciation resulting from fewer office facilities being occupied as we consolidated our homebuilding division. These items partially were offset by a $1.3 million increase in legal reserves, primarily associated with construction defect claims.
The decline in general and administrative expenses during the year ended December 31, 2008 in our Other Homebuilding segment was due in part to: (1) a $3.2 million decrease in employee compensation and other employee-related benefit costs; (2) a $1.5 million decrease in Supervisory Fees; and (3) $1.0 million office-related expenses and depreciation resulting from fewer office facilities being occupied as we consolidated our homebuilding division.
In our Financial Services and Other segment, general and administrative expenses declined during the year ended December 31, 2008, primarily resulting from the following decreases: (1) $7.6 million in compensation-related costs, as we reduced our employee headcount for this segment by 44% from December, 2007; (2) $2.0 million of losses associated with repurchased mortgage loans; (3) $2.8 million, primarily associated with our incurred but not reported insurance reserves as the number of homes closed decreased during 2008; and (4) $1.2 million in office-related expenses, as we reduced the number of office facilities we occupied since December 2007.
In our Corporate segment, general and administrative expenses increased during the year ended December 31, 2008, primarily resulting from the following: (1) a decline of $18.3 million in Supervisory Fees received from our other segments; (2) a $1.9 million increase associated with execution of revised employment agreements for our Chief Executive Officer and Chief Operating Officer; and (3) a $1.7 million increase associated with the write-off of certain capitalized costs associated with the amendment to our Homebuilding Line. These items partially were offset by the following decreases: (1) $5.4 million in employee compensation and other employee-related benefit costs as we reduced our employee headcount for this segment by 18% from December, 2007; (2) $3.9 million in travel-related and entertainment expenses; and (3) $2.4 million in office-related and depreciation expenses.
Other Operating Expenses. Other operating expenses were $7.1 million and $23.4 million during the year ended December 31, 2008 and 2007, respectively. The decrease resulted from declines in write-offs of pre-acquisition costs and deposits on lot option contracts that we elected not to exercise.
Related Party Expenses. Related party expenses decreased from $1.4 million for the year ended December 31, 2007 to $18,000 for the year ended December 31, 2008. The decrease in the 2008 expense is the result of MDC not pledging to make a contribution to the Foundation. We committed to contributing $1.0 million in the form of MDC
- 68 -
Table of Contents
common stock for 2007 to the Foundation for which we contributed 26,932 shares of MDC common stock to the Foundation in fulfillment of our 2007 commitment. Also contributing to the decrease was the result of the resignation during 2007 of a Director who had provided monthly services to the Company.
Other Income (Expense). Other income (expense) was $17.5 million and $47.6 million during the years ended December 31, 2008 and 2007, respectively. The decrease resulted from a $16.7 million increase in interest expense, a $10.2 million decrease in gain on sale of other assets and a $3.1 million decline in interest income. Interest expense was increased during 2008 as we expensed $18.0 million of interest incurred on our senior notes that could not be capitalized. During 2008, other income (expense) was lower as we recorded a $10.3 million gain on the sale of two aircraft during 2007. Additionally, interest income was lower resulting from the impact of lower interest rates on our cash and cash equivalent balances. This was partially offset by increases in our average cash balance during 2008 resulting from our on-going efforts to limit inventory acquisitions during the current homebuilding down cycle. Our cash and cash equivalents consisted of funds in liquid, cash equivalents.
(Loss)/Income Before Income Taxes. The table below summarizes our (loss)/income before income taxes by reportable segment (dollars in thousands).
| Year Ended December 31, | Change | |||||||||||||
| 2008 | 2007 | Amount | % | |||||||||||
| Homebuilding |
||||||||||||||
| West |
$ | (157,103 | ) | $ | (621,774 | ) | $ | 464,671 | 75% | |||||
| Mountain |
(112,251 | ) | (11,395 | ) | (100,856 | ) | -885% | |||||||
| East |
(50,596 | ) | (43,990 | ) | (6,606 | ) | -15% | |||||||
| Other Homebuilding |
(18,725 | ) | (87,009 | ) | 68,284 | 78% | ||||||||
| Total Homebuilding |
(338,675 | ) | (764,168 | ) | 425,493 | 56% | ||||||||
| Financial Services and Other |
11,678 | 23,062 | (11,384 | ) | -49% | |||||||||
| Corporate |
(55,138 | ) | (15,358 | ) | (39,780 | ) | -259% | |||||||
| Consolidated |
$ | (382,135 | ) | $ | (756,464 | ) | $ | 374,329 | 49% | |||||
The results of operations for all of our homebuilding segments and our Financial Services and Other segment during the year ended December 31, 2008 were affected adversely by a weaker United States and global economies, homebuyers’ reluctance to purchase new homes based on concerns associated with unemployment levels, uncertainty as to the severity and duration of the recession in the United States economy, the absence of liquidity in the financial services market, and a decline in homebuyer demand for new homes. These economic conditions continued to have a significant negative impact on our homebuilding operations during 2008 through: (1) increases in competition for new home orders driven by other builders that cut new home sales prices and/or offered down payment assistance programs to their prospective homebuyers; (2) continued high levels of home sales incentives and, in many cases, increased home sales incentives offered to stimulate new home orders and maintain previous home orders in Backlog (as defined below) until they close; (3) high levels of home foreclosures, which contributed to an excess supply of homes available to be purchased; (4) prospective homebuyers experiencing increased difficulty in selling their existing homes in this increasingly competitive environment; and (5) reduced affordability of homes, partially due to the increased difficulty confronted by homebuyers in trying to qualify for mortgage loans or provide sufficient down payments for mortgage loans for which they qualify.
In our West segment, the loss before income taxes during the year ended December 31, 2008 was lower, primarily due to a $429.5 million decrease in inventory impairments, a combined decrease of $121.5 million in general and administrative, commission and sales and marketing expenses, and a 260 basis point increase in Home Gross Margins, partially offset by the impact of closing 2,533 fewer homes. In our Mountain segment, our loss before income taxes during the year ended December 31, 2008 increased primarily due to the following: (1) a $53.2 million
- 69 -
Table of Contents
increase in inventory impairments; (2) a decrease in Home Gross Margins of 980 basis points; and (3) the impact of closing 687 fewer homes. Partially offsetting these items was a combined decrease in general and administrative, commission and sales and marketing expenses of $27.1 million.
Loss before income taxes in our East segment decreased during the year ended December 31, 2008, primarily due to a 510 basis point decrease in Home Gross Margins and closing 270 fewer homes, partially offset by a decrease of $19.6 million in inventory impairments and a combined decrease of $16.2 million in general and administrative, commissions and sales and marketing expenses. In our Other Homebuilding segment, the decrease in loss before income taxes for the year ended December 31, 2008 primarily resulted from a $46.0 million decrease in inventory impairments and a combined decrease of $16.2 million in general and administrative expenses, commissions and sales and marketing expenses. These items partially were offset by the impact of closing 217 fewer homes.
Income before income taxes in our Financial Services and Other segment was lower during the year ended December 31, 2008, primarily resulting from realizing lower gains on sales of mortgage loans, as the dollar volumes of mortgage loan originations and mortgage loans sold declined in conjunction with building and closing fewer homes. Additionally, we experienced decreases in insurance revenue due to lower insurance premiums collected from our homebuilding subcontractors as a result of the decline in home construction levels. These items were offset partially by reductions in general and administrative expenses for this segment. Loss before income taxes in our Corporate segment was higher during the year ended December 31, 2008 due to a decrease in Supervisory Fees charged to the Company’s other segments, and expensing $18.0 million of interest incurred during 2008 on our senior notes that could not be capitalized.
Income Taxes. Our overall effective income tax rates were 0.4% and 15.8% for the years ended December 31, 2008 and 2007, respectively. The decreases in the effective tax rates during the year ended December 31, 2008, resulted primarily from an increase of $134.3 million in the deferred tax asset valuation allowance due to changes in the tax deductions that were ultimately realized during 2008 through federal or state carrybacks or through reversals of existing taxable temporary differences.
Other Operating Results—2009 Compared With 2008 (dollars in thousands).
HomeAmerican Operating Activities. The following table sets forth information relating to mortgage loans originated by our HomeAmerican operations, mortgage loans brokered and our Capture Rate (dollars in thousands). The “Capture Rate” is defined as the number of mortgage loans originated by HomeAmerican for our homebuyers as a percent of total Company home closings.
| Year Ended December 31, | Increase (Decrease) | |||||||||||
| 2009 | 2008 | Amount | % | |||||||||
| Principal amount of mortgage loans originated |
$ | 633,171 | $ | 749,310 | $ | (116,139 | ) | -15% | ||||
| Principal amount of mortgage loans brokered |
$ | 33,152 | $ | 170,898 | $ | (137,746 | ) | -81% | ||||
| Capture Rate |
85% | 66% | 19% | |||||||||
| Including brokered loans |
89% | 79% | 10% | |||||||||
| Mortgage product (% of mortgage loans originated) |
||||||||||||
| Fixed rate |
99% | 97% | 2% | |||||||||
| Adjustable rate - interest only |
0% | 1% | -1% | |||||||||
| Adjustable rate - other |
1% | 2% | -1% | |||||||||
| Prime loans(1) |
29% | 48% | -19% | |||||||||
| Alt A loans(2) |
0% | 0% | 0% | |||||||||
| Government loans(3) |
71% | 52% | 19% | |||||||||
| (1) | Prime loans are defined as loans with Fair, Isaac & Company (“FICO”) scores greater than 620 and which comply with the documentation standards of the government sponsored enterprise guidelines. |
- 70 -
Table of Contents
| (2) | Alt-A loans are defined as loans that would otherwise qualify as prime loans except that they do not comply with the documentation standards of the government sponsored enterprise guidelines. |
| (3) | Government loans are loans either insured by the FHA or guaranteed by the VA. |
The principal amount of mortgage loans originated and brokered decreased during the year ended December 31, 2009, primarily due to the Company closing 33% fewer homes and a 8% decrease in the average selling price of closed homes. These items partially were offset by increases in the Capture Rate during 2009.
Interest Activity. We capitalize interest on our senior notes and Homebuilding Line during the period of active development and through the completion of construction of our homebuilding inventories. As a result of the decrease in inventory levels during 2009 and 2008 that were actively being developed, we incurred $38.1 million and $18.0 million of interest during the years ended December 31, 2009 and 2008, respectively, that could not be capitalized. For a reconciliation of interest incurred, capitalized and expensed, see Note 16 to our Consolidated Financial Statements.
Other Operating Results—2008 Compared With 2007 (dollars in thousands).
HomeAmerican Operating Activities. The following table sets forth information relating to our HomeAmerican operations.
| Year Ended December 31, | Increase (Decrease) | |||||||||||
| 2008 | 2007 | Amount | % | |||||||||
| Principal amount of mortgage loans originated |
$ | 749,310 | $ | 1,233,948 | $ | (484,638 | ) | -39% | ||||
| Principal amount of mortgage loans brokered |
$ | 170,898 | $ | 511,806 | $ | (340,908 | ) | -67% | ||||
| Capture Rate |
66% | 55% | 11% | |||||||||
| Including brokered loans |
79% | 74% | 5% | |||||||||
| Mortgage product (% of mortgage loans originated) |
||||||||||||
| Fixed rate |
97% | 82% | 15% | |||||||||
| Adjustable rate - interest only |
1% | 16% | -15% | |||||||||
| Adjustable rate - other |
2% | 2% | 0% | |||||||||
| Prime loans |
48% | 78% | -30% | |||||||||
| Alt A loans |
0% | 10% | -10% | |||||||||
| Government loans |
52% | 12% | 40% | |||||||||
The principal amount of mortgage loans originated and brokered decreased during the year ended December 31, 2008, primarily due to the Company closing 45% fewer homes, partially offset by increases in the 2008 Capture Rate.
Fixed rate mortgage loans as a percentage of the total mortgage loans HomeAmerican originated increased during the year ended December 31, 2008, due in part to: (1) a decrease in the difference in interest rates for adjustable rate mortgage loans and fixed rate mortgage loans, making fixed rate loans more attractive for our homebuyers; and (2) a reduced demand by third-party purchasers for non-conforming mortgage loans. In response to reduced liquidity in the mortgage lending industry, we tightened our mortgage loan underwriting criteria by: (1) discontinuing the origination of Alt-A second mortgage loans and Non-Agency (defined as not being FNMA and FHLMC eligible) mortgage loans with combined-loan-to-values in excess of 95% during the second half of 2007; and (2) requiring larger down payments from homebuyers in communities where the market values of homes have been declining. As a result, during 2008, HomeAmerican originated fewer high loan-to-value mortgage loans and loans with related second mortgages and did not originate sub-prime and Alt-A mortgage loan products.
Additionally, during the year ended December 31, 2008, for mortgage loan originations where the homebuyer has not provided at least a 20% down payment, the Company experienced a significant shift from the origination of
- 71 -
Table of Contents
Prime loans to government loans. This shift primarily resulted from premiums for FHA mortgage loans being less expensive than mortgage insurance associated with prime loans.
Interest Activity. As a result of the decrease in inventory levels during 2008 that were actively being developed, we incurred $18.0 million of interest during the year ended December 31, 2008 that could not be capitalized. We capitalized all interest incurred on our Senior Notes during the year ended December 31, 2007.
LIQUIDITY AND CAPITAL RESOURCES
We use our liquidity and capital resources to (1) support our operations, including the purchase of land, land development and construction of homes; (2) provide working capital; and (3) provide mortgage loans for our homebuyers. Liquidity, which includes our balances of cash and cash equivalents, marketable securities, unsettled trades and capital resources, is currently being generated internally through cash flows from operations and from external sources, primarily our senior notes, line of credit and Mortgage Repurchase Facility (as defined below). Additionally, we have an existing effective shelf registration statement which after the issuance of $250 million of senior notes in January 2010, allows us to issue equity, debt or hybrid securities up to $750 million.
In January 2010, we completed a public offering of $250 million principal amount of 5.625% senior notes due February 2020 (the “Notes”). The Notes, which pay interest February and August of each year, are general unsecured obligations of MDC and rank equally and ratably with our other general unsecured and unsubordinated indebtedness. In addition, the Notes are fully guaranteed on an unsecured basis, jointly and severally, by most of our homebuilding subsidiaries. We received proceeds of $242.3 million, net of discounts and issuance costs of $6.1 million and $1.6 million, respectively. The Company will use the proceeds of the offering for general corporate purposes.
In response to the difficult conditions described in the Executive Summary section of this Item 2, we remained focused on our balance sheet and cash flow as evidenced by our generation of $202.5 million in cash from operations during the year ended December 31, 2009, which contributed to our December 31, 2009 cash, cash equivalent and marketable securities balances increasing to $1.6 billion from $1.4 billion at December 31, 2008. With respect to our current liquidity, we plan to manage our cash and investments so that we will be ready to redeploy our cash back into homebuilding through acquisition of land when we perceive the demand for new housing is recovering. It continues to be unclear, however, when such a recovery will occur and how rapidly homebuilding activities will resume.
Capital Resources.
Our capital structure is a combination of (1) permanent financing, represented by stockholders’ equity; (2) long-term financing, represented by our publicly traded 7% senior notes due 2012, 5 1/2% senior notes due 2013, 5 3/8% medium-term senior notes due 2014 and 2015, 5 5/8% senior notes due 2020 and our homebuilding line of credit (the “Homebuilding Line”); and (3) our Mortgage Repurchase Facility. We continue to monitor and evaluate the adequacy of our Homebuilding Line and Mortgage Repurchase Facility. As further discussed below, during 2009 the amount of the Commitment (as defined below) on our Homebuilding Line was reduced from $800 million at December 31, 2008 to $100 million. We believe the amount of our Commitment, as of December 31, 2009, is appropriate given the needs for financing in the current and foreseeable future market. Because of our current balance of cash, cash equivalents, marketable securities, unsettled trades and available capacity under our Homebuilding Line and Mortgage Repurchase Facility, we believe that our current capital resources are adequate to satisfy our near-term capital requirements. Additionally, we believe that we can meet our long-term capital needs (including meeting future payments on our senior notes as they become due) from operations and external financing sources, assuming that no significant adverse changes in our business or capital and credit markets occur as a result of the various risk factors described in Item 1A Risk Factors. See “Forward-Looking Statements” below.
- 72 -
Table of Contents
Lines of Credit and Notes Payable.
Our homebuilding line of credit is an unsecured revolving line of credit with a group of lenders for support of our homebuilding segments, which has a maturity date of March 21, 2011. Effective September 16, 2009, we reduced the aggregate commitment under the Homebuilding Line from $800 million to $100 million (the “Commitment”) and the aggregate sublimit for letters of credit was reduced from $300 million to $100 million. The Commitment and sublimit for letters of credit were reduced as we believe that we did not need the full borrowing capacity of the Homebuilding Line to meet our liquidity needs and that we will be able to fund our homebuilding operations through our existing cash and investment resources. Additionally, as a result of the reduction in our Commitment, our capacity to borrow under the Homebuilding Line has decreased from approximately $539 million at December 31, 2008 to $83.3 million at December 31, 2009.
Interest rates for borrowings on the Homebuilding Line, if any, are determined by reference to an applicable London Interbank Offered Rate (“LIBOR”) or to an alternate base rate, each with a margin that is determined based on changes in our credit rating and leverage ratio. Additionally, we incur costs associated with unused commitment fees pursuant to the terms of the Homebuilding Line. At December 31, 2009 and 2008, there were no borrowings under the Homebuilding Line and there were $16.7 million and $26.6 million, respectively, in letters of credit outstanding as of such dates. The outstanding letters of credit reduce the amount that is available to be borrowed under the Commitment. However, the outstanding letters of credit do not impact the calculation of our borrowing capacity under the permitted leverage ratio. Additionally, while our borrowing capacity may be reduced under the permitted leverage ratio, this reduction does not impact our ability to issue letters of credit, up to the limits specified in the Homebuilding Line.
In connection with the declaration and payment of dividends, we are required to comply with certain covenants contained in our Homebuilding Line. Pursuant to the terms of Homebuilding Line, we are permitted to pay dividends, except if we are in a scheduled reduction, or term out, under the Homebuilding Line, if we are in default under the Homebuilding Line or if paying a dividend would result in a failure to meet the Consolidated Tangible Net Worth Test, the Leverage Test or the Cash Flow/Liquidity Test.
General. The agreements for our Homebuilding Line and Mortgage Repurchase Facility and the indentures for our senior notes require compliance with certain representations, warranties and covenants. We believe that we are in compliance with these requirements, and we are not aware of any covenant violations. The agreements containing these representations, warranties and covenants for the Homebuilding Line and Mortgage Repurchase Facility and the indentures for our senior notes are on file with the Securities and Exchange Commission and are listed as Exhibits in Part IV of this Annual Report on Form 10-K.
The table below sets forth the actual results of the financial covenant requirements and calculations under our Homebuilding Line at December 31, 2009.
| Covenant Test | Covenant Results | |||||
| Leverage test - Permitted Leverage Ratio (maximum) |
50.0% | 32.5% | ||||
| Interest Coverage Test - Interest Coverage Ratio (minimum) |
2.0 : 1.0 | 0.6 : 1.0 | ||||
| Consolidated Tangible Net Worth Test (minimum) |
$ | 852,000,000 | $ | 1,035,000,000 | ||
| Consolidated Tangible Net Worth Floor (minimum) |
$ | 652,000,000 | $ | 1,035,000,000 | ||
| Cash Flow Test (minimum) |
1.5 : 1.0 | 4.1 : 1.0 | ||||
| Liquidity Test (minimum) |
$ | 500,000,000 | $ | 821,000 | ||
The financial covenants contained in the Homebuilding Line agreement include a leverage test. A failure to satisfy the leverage test would not result in a default, but would initiate a scheduled reduction in the amount of the
- 73 -
Table of Contents
Commitment. Under the Homebuilding Line, our maximum permitted leverage ratio will vary between 50% and 55% depending on the results of our Interest Coverage Test (as defined in the Homebuilding Line) and our actual leverage ratio is not to exceed the maximum permitted leverage ratio. If our Interest Coverage Ratio (as defined in the Homebuilding Line) is below 2.0 to 1.0, the maximum permitted leverage ratio will decrease. However, in no event will the maximum permitted leverage ratio decrease below 50%. Additionally, if the Interest Coverage Ratio falls below 1.5 to 1.0, then we are required to pass the cash flow/liquidity test. Our Interest Coverage Ratio was 0.6 to 1.0 at December 31, 2009, and, as a result, our maximum permitted leverage ratio (as defined in its Homebuilding Line agreement) was 50% as of December 31, 2009.
Our Homebuilding Line agreement covenants also include a consolidated tangible net worth test. Under this test, our Consolidated Tangible Net Worth (as defined) must not be less than: (1) $850 million; plus (2) 50% of consolidated net income, as defined, earned by the Company and the Guarantors (as defined) after September 30, 2008; plus (3) 50% of the net proceeds or other consideration received by the Company for the issuance of capital stock after September 30, 2008; minus (4) the lesser of (A) the aggregate amount paid by the Company after September 30, 2008 to repurchase its common stock and (B) $300 million. Failure to satisfy this covenant test would not result in a default, but would result in a scheduled reduction in the amount of the Commitment.
In addition to the foregoing covenants, the Homebuilding Line agreement specifies that Consolidated Tangible Net Worth must not be less than the sum of: (1) $650 million; (2) 50% of the quarterly consolidated net income of Borrower and the Guarantors earned after September 30, 2008; and (3) 50% of the net proceeds or other consideration received for the issuance of capital stock after September 30, 2008. Failure to satisfy this covenant could result in a termination of the facility.
The Homebuilding line also contains a cash flow/liquidity test. Under this test, if the Company fails to maintain for any fiscal quarter ending on and after December 31, 2008 an Interest Coverage Ratio (as defined) equal to or greater than 1.5 to 1.0 for the period of four consecutive fiscal quarters, then as of the end of such fiscal quarter and as of the end of all fiscal quarters thereafter until the Interest Coverage Ratio is greater than or equal to 1.5 to 1.0, the Company would have to maintain either (1) a ratio of (A) Adjusted Cash Flow From Operations (as defined) to (B) Consolidated Interest Incurred (as defined) of greater than or equal to 1.5 to 1.0 or (2) a sum of (A) Borrowing Base Availability (as defined) plus (B) Unrestricted Cash (as defined which includes, among other things, cash, cash equivalents, marketable securities and unsettled trades), to the extent such Unrestricted Cash is not included in calculating Borrowing Base Availability, less (C) principal payments due on Consolidated Indebtedness (as defined) within the next succeeding four fiscal quarters, equal to or greater than $500 million. Our compliance with the cash flow/liquidity test would be measured on a quarterly basis and failure to satisfy this test would not result in a default but would result in a scheduled reduction in the amount of the facility.
Additionally, pursuant to the Homebuilding Line, should there be a defaulting lender, the Company is required to: (i) prepay swing line loans or cash collateralize the defaulting lender’s share of the swing line loans and (ii) cash collateralize the defaulting lender’s share of the outstanding facility letters of credit.
We believe that we are in compliance with the covenants under the Homebuilding Line agreement, and we are not aware of any covenant violations under that agreement.
Our senior notes are not secured and, while the senior notes indentures contain some restrictions on secured debt and other transactions, they do not contain financial covenants. The indenture governing our new 2020 Senior Notes also contains a change of control provision. Our senior notes are fully and unconditionally guaranteed on an unsecured basis, jointly and severally, by most of our homebuilding segment subsidiaries.
- 74 -
Table of Contents
Mortgage Lending. As of December 31, 2009, HomeAmerican has a Master Repurchase Agreement (the “Mortgage Repurchase Facility”) with U.S. Bank National Association (“USBNA”) and the other banks that are parties to the Mortgage Repurchase Facility (the “Buyers”). The Mortgage Repurchase Facility provides liquidity to HomeAmerican by providing for the sale of eligible mortgage loans to USBNA (as agent for the Buyers) with an agreement by HomeAmerican to repurchase the mortgage loans at a future date. Until such mortgage loans are transferred back to HomeAmerican, the documents relating to such loans are held by USBNA, as agent for the Buyers and as custodian, pursuant to the Custody Agreement (“Custody Agreement”), dated as of November 12, 2008, by and between HomeAmerican and USBNA. The Mortgage Repurchase Facility has a maximum aggregate commitment of $70 million and includes an accordion feature that permits the maximum aggregate commitment to be increased to $150 million, subject to the availability of additional commitments. The Mortgage Repurchase Facility expires on October 28, 2010. At December 31, 2009 and 2008, we had $29.1 million and $34.9 million, respectively, of mortgage loans that we are obligated to repurchase under our Mortgage Repurchase Facility. Mortgage loans that we are obligated to repurchase under the Mortgage Repurchase Facility are accounted for as a debt financing arrangement and are reported as mortgage repurchase facility on the Consolidated Balance Sheets. Advances under the Mortgage Repurchase Facility carry a Pricing Rate based on the LIBOR Rate plus the LIBOR Margin or, at HomeAmerican’s option, a Balance Funded Rate (the foregoing terms are defined in the Mortgage Repurchase Facility).
The Mortgage Repurchase Facility contains various representations, warranties and affirmative and negative covenants customary for agreements of this type. The negative covenants include, among others, (i) an Adjusted Tangible Net Worth requirement, (ii) an Adjusted Tangible Net Worth Ratio, (iii) an Adjusted Net Income requirement, and (iv) a minimum Liquidity requirement (the foregoing terms are defined in the Mortgage Repurchase Facility). Adjusted Tangible Net Worth means the sum of (a) all assets of HomeAmerican less (b) the sum of (i) all Debt and all Contingent Indebtedness of HomeAmerican, (ii) all assets of HomeAmerican that would be classified as intangible assets under generally accepted accounting principles, and (iii) receivables from Affiliates. HomeAmerican’s Adjusted Tangible Net Worth Ratio is the ratio of HomeAmerican’s total liabilities (excluding permitted letters of credit) to the Adjusted Tangible Net Worth. HomeAmerican’s Adjusted Net Income is a rolling twelve consecutive months of net income for HomeAmerican. HomeAmerican’s Liquidity is defined as its unrestricted cash and Cash Equivalents plus the amount by which the aggregate Purchase Price of all Purchased Mortgage Loans at such time exceeds the aggregate Purchase Price outstanding for all Open Transactions at such time (the foregoing terms are defined in the Mortgage Repurchase Facility).
Failure to meet the foregoing negative covenants would constitute an event of default. In the event of default, USBNA may at its option, declare the Repurchase Date for any or all Transactions to be deemed immediately to occur. Upon such event of default and if USBNA exercises its right to terminate any Transactions, then (a) HomeAmerican’s obligation to repurchase all Purchased Loans in such Transactions will become immediately due and payable; (b) the Repurchase Price shall be increased by the aggregate amount obtained by daily multiplication of (i) the greater of the Pricing Rate for such Transactions and the Default Pricing Rate by (ii) the Purchase Price for the Transactions as of the Repurchase Date, (c) all Income paid after the event of default will be retained by USBNA and applied to the aggregate unpaid Repurchase Price owed by HomeAmerican and (d) HomeAmerican shall deliver any documents relating to Purchased Loans subject to such Transactions to USBNA. Upon the occurrence of default, USBNA may (a) sell any or all Purchased Loans subject to such Transactions on a servicing released or servicing retained basis and apply the proceeds to the unpaid amounts owed by HomeAmerican, (b) give HomeAmerican credit for such Purchased Loans in an amount equal to the Market Value and apply such credit to the unpaid amounts owed by HomeAmerican, (c) replace HomeAmerican as Servicer, (d) exercise its right under the Mortgage Repurchase Facility with respect to the Income Account and Escrow Account, and (e) with notice to HomeAmerican, declare the Termination Date to have occurred. The foregoing terms are defined in the Mortgage Repurchase Facility.
- 75 -
Table of Contents
The table below sets forth the actual results of the covenant calculations and covenant requirements under the Mortgage Repurchase Facility at December 31, 2009.
| Covenant Test | Covenant Results | |||||
| Adjusted Tangible Net Worth (minimum) |
$ | 18,000,000 | $ | 24,601,000 | ||
| Adjusted Tangible Net Worth Ratio (maximum) |
8.0 : 1.0 | 1.7 : 1.0 | ||||
| Adjusted Net Income (minimum) |
$ | 1 | $ | 6,030,000 | ||
| Liquidity Test (minimum) |
$ | 8,000,000 | $ | 30,842,000 | ||
The Mortgage Repurchase Facility replaced HomeAmerican’s Fourth Amended and Restated Warehousing Credit Agreement, dated as of September 5, 2006, as amended on November 2, 2007 and May 23, 2008, with USBNA and the other banks that were parties to that facility.
MDC Common Stock Repurchase Program.
At December 31, 2009, we were authorized to repurchase up to 4,000,000 shares of our common stock. We did not repurchase any shares of our common stock during the year ended December 31, 2009.
Consolidated Cash Flow.
Year Ended December 31, 2009. We generated $202.5 million of cash from operating activities during the year ended December 31, 2009, primarily resulting from: (1) $21.4 million due to collecting a significant portion of our 2008 income tax receivable; (2) $115.7 million by reducing our inventory levels, which primarily resulted from closing 3,013 homes; and (3) decreasing our home sales and other receivables and mortgage loans-held-for-sale by a combined $16.3 million. These items partially were offset by a $37.5 million decrease in accrued liabilities.
We used $225.0 million in cash from investing activities during the year ended December 31, 2009, primarily attributable to purchasing $389.7 million of marketable securities and $8.0 million on purchases of property and equipment relating to our new enterprise resource planning system. Our purchases of marketable securities were made seeking greater returns on certain securities whose original maturities to the Company were longer than three months. These items partially were offset by the $116.7 million of marketable securities that matured during the year ended December 31, 2009, and $56.0 million of settlements associated with our investments in The Reserve’s Primary and Government money market funds.
We used $47.9 million of cash from financing activities during the year ended December 31, 2009, primarily resulting from $46.9 million of dividend payments and a net payment on our mortgage repurchase facility of $5.8 million. These items partially were offset by cash proceeds of $3.6 million from the exercise of stock options.
Year Ended December 31, 2008. We generated $479.5 million in cash from operating activities during the year ended December 31, 2008, primarily resulting from: (1) declines in our inventory levels through the sale of homes and land and limiting our new land purchases, the result of which was an increase to our cash of $538.7 million; and (2) decreasing our mortgage loans held-for-sale by $31.5 million as we originated fewer mortgage loans as a result of closing fewer homes at the end of the 2008 period, compared with the 2007 period. Also contributing to the cash flows from operating activities was $128.5 million of income before non-cash charges of $509.1 million. Our non-cash charges primarily relate to: (1) asset impairments; (2) deferred income taxes, including a valuation allowance; (3) depreciation and amortization; (4) losses on sales of assets; (5) write-offs of land option deposits and pre-acquisition costs; and (6) stock-based compensation expense. These cash increases partially were offset by a $113.4 million reduction in our accounts payable and accrued liabilities, primarily relating to the payment of
- 76 -
Table of Contents
homebuilding construction payables and accrued compensation and related expenses. Also reducing our cash provided by operating activities was the impact of a $73.7 million increase in our income tax receivable primarily resulting from our anticipated 2008 net operating loss carryback, partially offset by receipt in January 2008 of our 2007 net operating loss carryback. Additionally, we made a deposit with the Internal Revenue Service (“IRS”) of approximately $35.6 million, which contributed to the $50.0 million of cash used from prepaid expenses and other assets, net. The deposit related to the IRS examination of our 2004 and 2005 federal income tax returns and was made to limit the interest charge on any potential audit adjustments.
During the year ended December 31, 2008, we used $113.4 million relating to investing activities, primarily due to the purchase of $94.8 million of marketable securities, partially offset by the maturity of $39.9 million of our marketable securities. These investments were made seeking greater returns on securities whose original maturities to the Company were longer than three months. During 2008, we had $115.1 million of unsettled trades with The Reserve Primary Fund and The Reserve U.S. Government Fund, of which $57.1 million was settled prior to December 31, 2008.
During the twelve months ended December 31, 2008, we used $66.1 million in cash from financing activities. This cash usage primarily resulted from $35.3 million in net payments on our Mortgage Line and Mortgage Repurchase Facility and $46.4 million in dividend payments, partially offset by cash proceeds of $12.0 million from the exercise of stock options.
Year Ended December 31, 2007. We generated $592.6 million in cash from operating activities for the year ended December 31, 2007. We generated $533.1 million from a reduction in homebuilding inventories through: the construction, sale and closing of homes in the ordinary course of business; the sale of land resulting from a deterioration in the new home sales market that led us to the conclusion that the best use of certain assets was to sell them in their current condition; and the implementation of additional operating procedures intended to more closely control cash outflows associated with land purchases, land development and home construction costs, and tighter processes for approving new home starts. Additionally, we generated $206.3 million in cash from a reduction in our mortgage loans held in inventory and home sales and other receivables from December 31, 2006. The decline in mortgage loans held in inventory primarily was due to originating a higher volume of mortgage loans during the 2006 fourth quarter, compared with the 2007 fourth quarter, and the strategy of selling a majority of all Non-Agency mortgage loans faster after the closing of the home in 2007. Offsetting these cash proceeds was the use of $118.7 million to reduce accounts payable and accrued liabilities, primarily related to the payment of employee bonuses and homebuilding construction payables. Additionally, we used $154.3 million in cash to reduce income taxes payable, primarily to establish an income taxes receivable balance as a result of our 2007 net operating loss carryback and in connection with paying our 2006 tax obligations.
During the year ended December 31, 2007, we used $1.4 million in cash from investing activities. This cash usage primarily resulted from the purchase of a new aircraft offset by proceeds from the sale of two other aircraft.
During the twelve months ended December 31, 2007, we used $94.3 million in cash from financing activities. This cash usage primarily resulted from $60.3 million in net payments on our Mortgage Line and $45.8 million in dividend payments, partially offset by cash proceeds of $11.2 million from the exercise of stock options.
Off-Balance Sheet Arrangements.
In the ordinary course of business, we enter into lot option purchase contracts in order to procure lots for the construction of homes. Lot option contracts enable us to control lot positions with a minimal capital investment, which substantially reduces the risks associated with land ownership and development. At December 31, 2009, we had non-refundable deposits of $7.7 million in the form of cash and $2.1 million in the form of letters of credit to
- 77 -
Table of Contents
secure option contracts to purchase lots. In limited circumstances, in the event that we exercise our right to purchase the lots or land under option, in addition to our purchase price, our obligation may also include certain costs we are required to reimburse the seller. At December 31, 2009, the total purchase price for lots under option was approximately $178 million.
At December 31, 2009, we had outstanding performance bonds and letters of credit totaling approximately $118.4 million and $21.4 million, respectively, including $4.2 million in letters of credit issued by HomeAmerican, with the remaining issued by third-parties, to secure our performance under various contracts. We estimate that the costs to complete land development under our outstanding performance bonds and letters of credit are less than $20 million and we expect that the obligations secured by these performance bonds and letters of credit generally will be performed in the ordinary course of business and in accordance with the applicable contractual terms. To the extent that the obligations are performed, the related performance bonds and letters of credit should be released and we should not have any continuing obligations. However, in the event any such performance bonds or letters of credit issued by third parties are called, our indemnity obligations could require us to reimburse the issuer of the performance bond or letter of credit.
We have made no material guarantees with respect to third-party obligations.
Contractual Obligations.
The table below summarizes our known contractual obligations at December 31, 2009.
| Payments due by Period (in thousands) | |||||||||||||||
| Total | Less than 1 Year |
1 - 3 Years | 4 - 5 Years | After 5 Years | |||||||||||
| Long-term debt |
$ | 997,991 | $ | - | $ | 149,460 | $ | 598,744 | $ | 249,787 | |||||
| Interest on long-term debt |
252,188 | 56,625 | 113,250 | 68,875 | 13,438 | ||||||||||
| Purchase commitments |
2,103 | 2,103 | - | - | - | ||||||||||
| Operating leases |
25,838 | 5,958 | 8,147 | 6,768 | 4,965 | ||||||||||
| Total(1)(2)(3) |
$ | 1,278,120 | $ | 64,686 | $ | 270,857 | $ | 674,387 | $ | 268,190 | |||||
| (1) | We estimate that we have approximately $20 million of costs we expect to incur to complete land development under our outstanding performance bonds. |
| (2) | Pursuant to the employment agreements with two of our executive officers of the Company, we have accrued at December 31, 2009 the present value of the expected annual retirement benefits of $17.8 million. These estimated liabilities have been excluded from the table above as the payment date is variable based upon the date of the retirement of the named executives. |
| (3) | The table above excludes $29.1 million of mortgage loans that we are obligated to repurchase under our Mortgage Repurchase Facility. Additionally, there were outstanding performance bonds and letters of credit totaling approximately $118.4 million and $21.4 million, respectively, at December 31, 2009, which have been excluded from the table above. |
- 78 -
Table of Contents
IMPACT OF INFLATION AND CHANGING PRICES
We do not believe that inflation is a significant immediate risk. We continue to believe that deflation and deterioration in asset values as well as recovery from the recession and unemployment are the factors that will shape our business during the near term. Real estate and residential housing prices are affected by a number of factors, including the uncertainty of potential homebuyers regarding their employment circumstances, stability of the United States and global economies, inflation or deflation, interest rate changes, competition, and the supply of new and existing homes to be purchased. Uncertainty in the stability of the United States and global economies and volatility in the banking system and financial markets can, and has, caused potential homebuyers to refrain from committing to make significant purchases, including the purchase of new homes. In the event we experience additional volatility in the banking system and financial markets in future reporting periods, our ability to sell new homes to potential homebuyers will be impacted negatively. See “Forward-Looking Statements” below.
Inflation can cause increases in the price of land, raw materials and subcontracted labor. Unless these increased costs are recovered through higher sales prices, Home Gross Margins would decrease. Also, deflation can cause the market value of our land and constructed homes to decline, which could negatively impact our results of operations. If interest rates increase, construction and financing costs, as well as the cost of borrowings, could also increase, which can result in lower Home Gross Margins. Increases in home mortgage interest rates make it more difficult for our customers to qualify for home mortgage loans, potentially decreasing home sales revenue. Increases in interest rates also may affect adversely the volume of mortgage loan originations. Increases in competition and the supply of unsold new and existing homes have had an adverse effect on our ability to generate new home orders and maintain home orders in Backlog, and have had a negative impact on our Home Gross Margins and results from operations. Additionally, because we are primarily a suburban residential builder, if our country experiences increased energy costs and/or on-going inflationary pressures, demand for our homes could be impacted adversely and the cost of building homes may increase, both of which could have a significant negative impact on our Home Gross Margins and financial and operational results.
The volatility of interest rates could have an adverse effect on our future operations and liquidity. Derivative instruments utilized in the normal course of business by HomeAmerican include forward sales securities commitments, private investor sales commitments and commitments to originate mortgage loans. We utilize these commitments to manage the price risk on fluctuations in interest rates on our mortgage loans held in inventory and commitments to originate mortgage loans. Such contracts are the only significant financial derivative instruments we utilize.
ISSUANCE OF STATEMENTS OF FINANCIAL ACCOUNTING STANDARDS
In June 2009, the FASB issued SFAS No. 167, “Amendments to FASB Interpretation No. 46(R)” (“SFAS 167”). SFAS 167, which is incorporated in Accounting Standards Codification (“ASC”) Topic 810, “Consolidation,” requires a qualitative approach to identifying a controlling financial interest in a variable interest entity (“VIE”), and requires ongoing assessment of whether an entity is a VIE and whether an interest in a VIE makes the holder the primary beneficiary of the VIE. SFAS 167 is effective for the Company’s fiscal year beginning January 1, 2010. The Company is currently reviewing the effect of SFAS 167 on its consolidated financial statements.
In June 2009, the FASB issued SFAS No. 168, “The FASB Accounting Standards Codification and the Hierarchy of Generally Accepted Accounting Principles” (“SFAS 168”). SFAS 168, which is incorporated in ASC Topic 105, “Generally Accepted Accounting Principles,” identifies the ASC as the authoritative source of generally accepted accounting principles in the United States. Rules and interpretive releases of the SEC under federal securities laws are also sources of authoritative GAAP for SEC registrants. The Company adopted SFAS No. 168 in 2009 third quarter.
- 79 -
Table of Contents
In June 2009, the FASB issued SFAS No. 166, “Accounting for Transfers of Financial Assets an amendment of FASB Statement No. 140” (“SFAS 166”). SFAS 166, which is incorporated in ASC 860 “Transfers and Servicing,” removes the concept of a qualifying special-purpose entity and removes an exception from applying ASC 810 “Consolidation,” to qualifying special-purpose entities. SFAS 166 determines whether a transferor and all of the entities included in the transferor’s financial statements being presented have surrendered control over transferred financial assets. That determination must consider the transferor’s continuing involvement in the transferred financial asset, including all arrangements or agreements made contemporaneously with, or in contemplation of, the transfer, even if they were not entered into at the time of the transfer. SFAS 166 modifies the financial-components approach and limits the circumstances in which a financial asset, or portion of a financial asset, should be derecognized when the transferor has not transferred the entire original financial asset to an entity that is not consolidated with the transferor in the financial statements being presented and/or when the transferor has continuing involvement with the transferred financial asset.
SFAS 166 defines the term participating interest to establish specific conditions for reporting a transfer of a portion of a financial asset as a sale. If the transfer does not meet those conditions, a transferor should account for the transfer as a sale only if it transfers an entire financial asset or a group of entire financial assets and surrenders control over the entire transferred asset(s). If a transfer of financial assets does not meet the requirements for sale accounting, the securitized mortgage loans should continue to be classified as loans in the transferor’s statement of financial position. SFAS 166 requires that a transferor recognize and initially measure at fair value all assets obtained (including a transferor’s beneficial interest) and liabilities incurred as a result of a transfer of financial assets accounted for as a sale.
SFAS 166 shall be effective as of the beginning of each reporting entity’s first annual reporting period that begins after November 15, 2009, for interim periods within that first annual reporting period, and for interim and annual reporting periods thereafter. Earlier application is prohibited. The recognition and measurement provisions of SFAS 166 shall be applied to transfers that occur on or after the effective date. The Company is currently evaluating the impact that SFAS 166 may have on its financial position, results of operations and cash flows.
In August 2009, the FASB issued Accounting Standards Update No. 2009-5, “Fair Value Measurements and Disclosures (Topic 820)—Measuring Liabilities at Fair Value,” (“ASU 2009-5”), which amends ASC 820 to provide additional guidance to clarify the measurement of liabilities at fair value in the absence of observable market information. ASU 2009-5 is effective for the Company beginning October 1, 2009. The adoption of ASU 2009-5 did not have a material impact on our consolidated financial position, results of operations and cash flows.
| Item 7A. | Quantitative and Qualitative Disclosures About Market Risk. |
Investment Risk. Our cash and investment policy and strategy is to achieve an appropriate investment return while preserving principal and managing risk. Accordingly, our cash and cash equivalents are invested primarily in funds in highly liquid investments with an original maturity of three months or less and our marketable securities are invested in short-term securities (original maturities to the Company of less than 1 year) and long-term securities (original maturities to the Company of greater than 1 year). Our cash and cash equivalents include, among others, investments such as commercial paper, U.S. Treasuries, money market funds and time deposits. Our marketable securities consist of both fixed rate and floating rate interest earning securities, primarily: (1) debt securities, which may include, among others, United States government and government agency debt, corporate debt and bankers’ acceptances; and (2) deposit securities which may include, among others, certificates of deposit and time deposits. Additionally, we have $100 million of investments held in a mutual fund, which invests predominately in fixed income securities.
- 80 -
Table of Contents
Fixed rate securities may have their fair market value adversely impacted due to a rise in interest rates, while floating rate securities may produce less income than predicted if interest rates fall. Our debt securities are recorded at amortized cost as we currently have the intent and ability to hold them until maturity. Therefore, interest rate movements generally do not affect the valuation of our debt securities. However, changes in the overall level of interest rates affect the interest income that is generated from our cash, cash equivalents and marketable securities. Accordingly, our debt securities are only written down to fair value when there is an other-than-temporary impairment, i.e. when we do not believe we will collect the contract amounts due to the Company. As of December 31, 2009, we had $109.7 million of investments whose amortized costs were less than the estimated fair value of the securities by $1.3 million.
We are exposed to market risks related to fluctuations in interest rates on mortgage loans held-for-sale and debt. Derivative instruments utilized in the normal course of business by HomeAmerican include forward sales securities commitments, private investor sales commitments and commitments to originate mortgage loans. We utilize these commitments to manage the price risk on fluctuations in interest rates on our mortgage loans owned and commitments to originate mortgage loans. Such contracts are the only significant financial derivative instruments utilized by MDC. HomeAmerican’s mortgage loans in process that had not closed at December 31, 2009 had an aggregate principal balance of approximately $63.5 million, of which $51.7 million were under interest rate lock commitments at an average interest rate of 4.65%. In addition, HomeAmerican had $62.3 million of mortgage loans held-for-sale at December 31, 2009.
HomeAmerican provides mortgage loans that generally are sold forward and subsequently delivered to a third-party purchaser within approximately 45 days. Forward commitments are used for non-trading purposes to sell mortgage loans and hedge price risk due to fluctuations in interest rates on rate-locked mortgage loans in process that have not closed. Due to this economic hedging philosophy, the market risk associated with these mortgages is limited. During 2007, we did not designate our derivatives as hedging instruments and recorded our forward sales commitments and locked pipeline as free standing derivatives, and applied the lower-of-cost-or-market method to account for mortgage loan inventory. The effect of not designating the derivatives as hedging instruments did not materially impact our results of operations for 2007. For the years ended December 31, 2009 and 2008, upon adopting the fair value option for our mortgage loans held-for-sale, we attempted to achieve a matching of the changes in the fair value of our derivatives with the changes in fair values of the loans we were hedging without having to designate our derivatives as hedging instruments. For forward sales commitments, as well as commitments to originate mortgage loans that are still outstanding at the end of a reporting period, we now record the fair value of the derivatives in the Consolidated Statements of Operations with an offset to either derivative assets or liabilities, depending on the nature of the change. For commitments to originate mortgage loans that were converted to closed loans during 2008, we record the change in fair value of the associated lock at the time of closing as an adjustment to the cost basis in the underlying loan.
We utilize our Homebuilding Line, Mortgage Repurchase Facility and long-term debt in our financing strategy. For fixed rate debt, changes in interest rates generally affect the fair value of the debt instrument, but not our earnings or cash flows. Conversely, for variable rate debt, changes in interest rates generally do not impact the fair value of the debt instrument, but may affect our future earnings and cash flows. We do not have an obligation to prepay fixed rate debt prior to maturity and, as a result, interest rate risk and changes in fair value should not have a significant impact on the fixed rate debt until we would be required to refinance such debt. See “Forward-Looking Statements” above.
- 81 -
Table of Contents
At December 31, 2009, we had $29.1 million of mortgage loans that we are obligated to repurchase under our Mortgage Repurchase Facility. Mortgage loans that we are obligated to repurchase under the Mortgage Repurchase Facility are accounted for as a debt financing arrangement and are reported under mortgage repurchase facility in the Consolidated Balance Sheets. We may borrow on a short-term basis from banks under our Homebuilding Line, which bears interest at the prevailing market rates. Long-term debt outstanding under our senior notes, their maturities and estimated fair value at December 31, 2009 are as follows (dollars in thousands).
| Maturities through December 31, | Total | Estimated Fair Value | ||||||||||||||||||||||
| 2010 | 2011 | 2012 | 2013 | 2014 | Thereafter | |||||||||||||||||||
| Fixed Rate Debt |
$ | - | $ | - | $ | 149,460 | $ | 349,642 | $ | 249,102 | $ | 249,787 | $ | 997,991 | $ | 998,900 | ||||||||
| Average Interest Rate |
- | - | 7.30% | 5.74% | 5.55% | 5.50% | 5.87% | |||||||||||||||||
- 82 -
Table of Contents
| Item 8. | Consolidated Financial Statements. |
M.D.C. HOLDINGS, INC.
INDEX TO CONSOLIDATED FINANCIAL STATEMENTS
| Page | ||
| Consolidated Financial Statements |
||
| F-2 | ||
| Consolidated Balance Sheets at December 31, 2009 and December 31, 2008 |
F-3 | |
| F-4 | ||
| F-5 | ||
| F-8 | ||
| F-9 | ||
F-1
Table of Contents
Report of Independent Registered Public Accounting Firm
The Board of Directors and Shareholders of
M.D.C Holdings, Inc.
We have audited the accompanying consolidated balance sheets of M.D.C. Holdings, Inc. (the “Company”) as of December 31, 2009 and 2008, and the related consolidated statements of operations, stockholders’ equity, and cash flows for each of the three years in the period ended December 31, 2009. These financial statements are the responsibility of the Company’s management. Our responsibility is to express an opinion on these financial statements based on our audits.
We conducted our audits in accordance with the standards of the Public Company Accounting Oversight Board (United States). Those standards require that we plan and perform the audit to obtain reasonable assurance about whether the financial statements are free of material misstatement. An audit includes examining, on a test basis, evidence supporting the amounts and disclosures in the financial statements. An audit also includes assessing the accounting principles used and significant estimates made by management, as well as evaluating the overall financial statement presentation. We believe that our audits provide a reasonable basis for our opinion.
In our opinion, the financial statements referred to above present fairly, in all material respects, the consolidated financial position of M.D.C. Holdings, Inc. at December 31, 2009 and 2008, and the consolidated results of its operations and its cash flows for each of the three years in the period ended December 31, 2009, in conformity with U.S. generally accepted accounting principles.
We also have audited, in accordance with the standards of the Public Company Accounting Oversight Board (United States), M.D.C. Holdings, Inc.’s internal control over financial reporting as of December 31, 2009, based on criteria established in Internal Control—Integrated Framework issued by the Committee of Sponsoring Organizations of the Treadway Commission and our report dated February 5, 2010 expressed an unqualified opinion thereon.
/s/ Ernst & Young LLP
Denver, Colorado
February 5, 2010
F-2
Table of Contents
Consolidated Balance Sheets
(In thousands, except share and per share amounts)
| December 31, | ||||||||
| 2009 | 2008 | |||||||
| Assets |
||||||||
| Cash and cash equivalents |
$ | 1,234,252 | $ | 1,304,728 | ||||
| Marketable securities |
327,944 | 54,864 | ||||||
| Unsettled trades |
1,645 | 57,687 | ||||||
| Restricted cash |
476 | 670 | ||||||
| Receivables |
||||||||
| Home sales receivables |
10,056 | 17,104 | ||||||
| Income taxes receivable |
145,144 | 170,753 | ||||||
| Other receivables |
5,844 | 16,697 | ||||||
| Mortgage loans held-for-sale, net |
62,315 | 68,604 | ||||||
| Inventories, net |
||||||||
| Housing completed or under construction |
260,324 | 415,500 | ||||||
| Land and land under development |
262,860 | 241,571 | ||||||
| Property and equipment, net |
38,421 | 38,343 | ||||||
| Deferred tax asset, net of valuation allowance of $208,144 and $294,269 at December 31, 2009 and 2008, respectively |
- | - | ||||||
| Related party assets |
7,856 | 8,878 | ||||||
| Prepaid expenses and other assets, net |
72,171 | 79,539 | ||||||
| Total Assets |
$ | 2,429,308 | $ | 2,474,938 | ||||
| Liabilities |
||||||||
| Accounts payable |
$ | 36,087 | $ | 28,793 | ||||
| Accrued liabilities |
291,969 | 332,825 | ||||||
| Related party liabilities |
1,000 | - | ||||||
| Mortgage repurchase facility |
29,115 | 34,873 | ||||||
| Senior notes, net |
997,991 | 997,527 | ||||||
| Total Liabilities |
1,356,162 | 1,394,018 | ||||||
| Commitments and Contingencies |
||||||||
| Stockholders’ Equity |
||||||||
| Preferred stock, $0.01 par value; 25,000,000 shares authorized; none issued or outstanding |
- | - | ||||||
| Common stock, $0.01 par value; 250,000,000 shares authorized; 47,070,000 and 47,017,000 issued and outstanding, respectively, at December 31, 2009 and 46,715,000 and 46,666,000 issued and outstanding, respectively, at December 31, 2008 |
471 | 467 | ||||||
| Additional paid-in-capital |
802,675 | 788,207 | ||||||
| Retained earnings |
270,659 | 292,905 | ||||||
| Accumulated other comprehensive loss |
- | - | ||||||
| Treasury stock, at cost; 53,000 and 49,000 shares at December 31, 2009 and December 31, 2008, respectively |
(659 | ) | (659 | ) | ||||
| Total Stockholders’ Equity |
1,073,146 | 1,080,920 | ||||||
| Total Liabilities and Stockholders’ Equity |
$ | 2,429,308 | $ | 2,474,938 | ||||
The accompanying Notes are an integral part of these Consolidated Financial Statements.
F-3
Table of Contents
Consolidated Statements of Operations
(In thousands, except per share amounts)
| Year Ended December 31, | ||||||||||||
| 2009 | 2008 | 2007 | ||||||||||
| Revenue |
||||||||||||
| Home sales revenue |
$ | 837,054 | $ | 1,358,148 | $ | 2,765,981 | ||||||
| Land sales revenue |
30,730 | 60,050 | 50,130 | |||||||||
| Other revenue |
30,519 | 39,910 | 69,548 | |||||||||
| Total revenue |
898,303 | 1,458,108 | 2,885,659 | |||||||||
| Costs and expenses |
||||||||||||
| Home cost of sales |
686,854 | 1,184,865 | 2,380,427 | |||||||||
| Land cost of sales |
25,038 | 53,847 | 59,529 | |||||||||
| Asset impairments |
30,986 | 298,155 | 726,621 | |||||||||
| Marketing expenses |
36,371 | 71,882 | 117,088 | |||||||||
| Commission expenses |
31,002 | 50,295 | 97,951 | |||||||||
| General and administrative expenses |
162,485 | 191,574 | 283,346 | |||||||||
| Other operating expenses |
5,643 | 7,115 | 23,369 | |||||||||
| Related party expenses |
1,018 | 18 | 1,382 | |||||||||
| Total operating costs and expenses |
979,397 | 1,857,751 | 3,689,713 | |||||||||
| Loss from operations |
(81,094 | ) | (399,643 | ) | (804,054 | ) | ||||||
| Other income (expense) |
||||||||||||
| Interest income |
12,157 | 35,788 | 38,903 | |||||||||
| Interest expense |
(38,582 | ) | (18,318 | ) | (1,581 | ) | ||||||
| Gain on sale of other assets |
184 | 38 | 10,268 | |||||||||
| Loss before income taxes |
(107,335 | ) | (382,135 | ) | (756,464 | ) | ||||||
| Benefit from income taxes, net |
132,014 | 1,590 | 119,524 | |||||||||
| NET INCOME (LOSS) |
$ | 24,679 | $ | (380,545 | ) | $ | (636,940 | ) | ||||
| EARNINGS (LOSS) PER SHARE |
||||||||||||
| Basic |
$ | 0.52 | $ | (8.25 | ) | $ | (13.94 | ) | ||||
| Diluted |
$ | 0.52 | $ | (8.25 | ) | $ | (13.94 | ) | ||||
| DIVIDENDS DECLARED PER SHARE |
$ | 1.00 | $ | 1.00 | $ | 1.00 | ||||||
The accompanying Notes are an integral part of these Consolidated Financial Statements.
F-4
Table of Contents
Consolidated Statements of Stockholders’ Equity
(In thousands, except share amounts)
| Additional Paid-in- Capital |
Retained Earnings |
Accumulated Other Comprehensive Loss |
Total | |||||||||||||||||||||||||
| Common Stock | Treasury Stock | |||||||||||||||||||||||||||
| Shares | Amount | Shares | Amount | |||||||||||||||||||||||||
| Balances at December 31, 2006 |
45,179,000 | $ | 452 | $ | 760,831 | $ | 1,402,261 | $ | (1,003 | ) | (14,000 | ) | $ | (659 | ) | $ | 2,161,882 | |||||||||||
| Comprehensive loss |
||||||||||||||||||||||||||||
| Net loss |
- | - | - | (636,940 | ) | - | - | - | (636,940 | ) | ||||||||||||||||||
| Minimum pension liability adjustment, net of income taxes of $(413) |
- | - | - | - | 334 | - | - | 334 | ||||||||||||||||||||
| Total comprehensive loss |
(636,606 | ) | ||||||||||||||||||||||||||
| Adoption of FIN 48 |
- | - | - | 293 | - | - | - | 293 | ||||||||||||||||||||
| Shares issued upon exercise of stock options and awards of restricted stock |
905,000 | 9 | 16,308 | - | - | - | - | 16,317 | ||||||||||||||||||||
| Tax benefit of non-qualified stock options exercised |
- | - | 567 | - | - | - | - | 567 | ||||||||||||||||||||
| Cash dividends paid |
- | - | - | (45,773 | ) | - | - | - | (45,773 | ) | ||||||||||||||||||
| Stock-based compensation expense |
- | - | 12,466 | - | - | - | - | 12,466 | ||||||||||||||||||||
| Forfeitures of restricted stock |
- | - | - | - | - | (17,000 | ) | - | - | |||||||||||||||||||
| Reversal of tax benefits on non-qualified stock options exercised in previous years |
- | - | (33,133 | ) | - | - | - | - | (33,133 | ) | ||||||||||||||||||
| Balances at December 31, 2007 |
46,084,000 | 461 | 757,039 | 719,841 | (669 | ) | (31,000 | ) | (659 | ) | 1,476,013 | |||||||||||||||||
The accompanying Notes are an integral part of these Consolidated Financial Statements.
F-5
Table of Contents
M.D.C. HOLDINGS, INC.
Consolidated Statements of Stockholders’ Equity
(In thousands, except share amounts)
| Additional Paid-in- Capital |
Retained Earnings |
Accumulated Other Comprehensive Loss |
Total | ||||||||||||||||||
| Common Stock | Treasury Stock | ||||||||||||||||||||
| Shares | Amount | Shares | Amount | ||||||||||||||||||
| Balances at December 31, 2007 |
46,084,000 | 461 | 757,039 | 719,841 | (669 | ) | (31,000 | ) | (659 | ) | 1,476,013 | ||||||||||
| Net loss |
- | - | - | (380,545 | ) | - | - | - | (380,545 | ) | |||||||||||
| Amendment to Executive employment agreements |
- | - | - | - | 669 | - | - | 669 | |||||||||||||
| Total comprehensive loss |
(379,876 | ) | |||||||||||||||||||
| Shares issued upon exercise of stock options and awards of restricted stock |
631,000 | 6 | 12,991 | - | - | - | - | 12,997 | |||||||||||||
| Tax benefit of non-qualified stock options exercised |
- | - | 3,561 | - | - | - | - | 3,561 | |||||||||||||
| Cash dividends paid |
- | - | - | (46,391 | ) | - | - | - | (46,391 | ) | |||||||||||
| Stock-based compensation expense |
- | - | 14,616 | - | - | - | - | 14,616 | |||||||||||||
| Forfeitures of restricted stock |
- | - | - | - | - | (18,000 | ) | - | - | ||||||||||||
| Balances at December 31, 2008 |
46,715,000 | 467 | 788,207 | 292,905 | - | (49,000 | ) | (659 | ) | 1,080,920 | |||||||||||
The accompanying Notes are an integral part of these Consolidated Financial Statements.
F-6
Table of Contents
M.D.C. HOLDINGS, INC.
Consolidated Statements of Stockholders’ Equity
(In thousands, except share amounts)
| Additional Paid-in- Capital |
Retained Earnings |
Accumulated Other Comprehensive Loss |
Total | ||||||||||||||||||||||||
| Common Stock | Treasury Stock | ||||||||||||||||||||||||||
| Shares | Amount | Shares | Amount | ||||||||||||||||||||||||
| Balances at December 31, 2008 |
46,715,000 | 467 | 788,207 | 292,905 | - | (49,000 | ) | (659 | ) | 1,080,920 | |||||||||||||||||
| Net income |
- | - | - | 24,679 | - | - | - | 24,679 | |||||||||||||||||||
| Shares issued upon exercise of stock options and awards of restricted stock |
355,000 | 4 | 3,619 | - | - | - | - | 3,623 | |||||||||||||||||||
| Tax benefit of non-qualified stock options exercised |
- | - | (4,250 | ) | - | - | - | - | (4,250 | ) | |||||||||||||||||
| Cash dividends paid |
- | - | - | (46,925 | ) | - | - | - | (46,925 | ) | |||||||||||||||||
| Stock-based compensation expense |
- | - | 15,099 | - | - | - | - | 15,099 | |||||||||||||||||||
| Forfeitures of restricted stock |
- | - | - | - | - | (4,000 | ) | - | - | ||||||||||||||||||
| Balances at December 31, 2009 |
47,070,000 | $ | 471 | $ | 802,675 | $ | 270,659 | $ | - | (53,000 | ) | $ | (659 | ) | $ | 1,073,146 | |||||||||||
The accompanying Notes are an integral part of these Consolidated Financial Statements.
F-7
Table of Contents
Consolidated Statements of Cash Flows
(In thousands)
| Year Ended December 31, | ||||||||||||
| 2009 | 2008 | 2007 | ||||||||||
| Operating Activities |
||||||||||||
| Net income (loss) |
$ | 24,679 | $ | (380,545 | ) | $ | (636,940 | ) | ||||
| Adjustments to reconcile net income (loss) to net cash provided by operating activities |
||||||||||||
| Asset impairments |
30,986 | 298,155 | 726,621 | |||||||||
| Deferred tax asset, net of valuation allowance |
- | 160,565 | (35,685 | ) | ||||||||
| Amortization of deferred marketing costs |
9,055 | 23,502 | 33,075 | |||||||||
| Write-offs of land option deposits and pre-acquisition costs |
2,948 | 6,838 | 22,872 | |||||||||
| Depreciation and amortization of long-lived assets |
5,402 | 9,208 | 14,267 | |||||||||
| Stock-based compensation expense |
15,099 | 14,616 | 12,466 | |||||||||
| Excess tax benefits from stock-based compensation |
(1,122 | ) | (3,561 | ) | (567 | ) | ||||||
| Non-cash related party expenses |
- | - | 1,000 | |||||||||
| Gain on sale of assets, net |
(5,492 | ) | (6,241 | ) | (869 | ) | ||||||
| Other non-cash expenses |
7,930 | 5,970 | 2,406 | |||||||||
| Net changes in assets and liabilities |
||||||||||||
| Restricted cash |
194 | 1,228 | 743 | |||||||||
| Home sales and other receivables |
9,986 | 16,642 | 93,492 | |||||||||
| Income taxes receivable |
21,359 | (73,677 | ) | (154,274 | ) | |||||||
| Mortgage loans held-for-sale, net |
6,289 | 31,540 | 112,759 | |||||||||
| Housing completed or under construction |
146,505 | 404,079 | 106,558 | |||||||||
| Land and land under development |
(30,843 | ) | 134,623 | 426,535 | ||||||||
| Prepaid expenses and other assets, net |
(10,331 | ) | (50,034 | ) | (13,142 | ) | ||||||
| Accounts payable |
7,294 | (43,139 | ) | (99,073 | ) | |||||||
| Accrued liabilities |
(37,484 | ) | (70,258 | ) | (19,661 | ) | ||||||
| Net cash provided by operating activities |
202,454 | 479,511 | 592,583 | |||||||||
| Investing Activities |
||||||||||||
| Purchase of held-to-maturity debt securities |
(289,741 | ) | (94,767 | ) | - | |||||||
| Maturity of held-to-maturity debt securities |
116,661 | 39,903 | - | |||||||||
| Purchase of available-for-sale equity securities |
(100,000 | ) | - | - | ||||||||
| Unsettled trades (see Note 1) |
- | (115,135 | ) | - | ||||||||
| Settlement of unsettled trades |
56,042 | 57,074 | - | |||||||||
| Sale of property and equipment |
- | - | 25,577 | |||||||||
| Purchase of property and equipment |
(7,954 | ) | (514 | ) | (27,024 | ) | ||||||
| Net cash used in investing activities |
(224,992 | ) | (113,439 | ) | (1,447 | ) | ||||||
| Financing Activities |
||||||||||||
| Lines of credit - advances |
- | 125,754 | 698,174 | |||||||||
| Lines of credit - payments |
- | (195,901 | ) | (758,494 | ) | |||||||
| Advances on mortgage repurchase facility |
134,112 | 34,873 | - | |||||||||
| Payments on mortgage repurchase facility |
(139,870 | ) | - | - | ||||||||
| Dividend payments |
(46,925 | ) | (46,391 | ) | (45,773 | ) | ||||||
| Proceeds from exercise of stock options |
3,623 | 11,997 | 11,206 | |||||||||
| Excess tax benefits from stock-based compensation |
1,122 | 3,561 | 567 | |||||||||
| Net cash used in financing activities |
(47,938 | ) | (66,107 | ) | (94,320 | ) | ||||||
| Net (decrease) increase in cash and cash equivalents |
(70,476 | ) | 299,965 | 496,816 | ||||||||
| Cash and cash equivalents |
||||||||||||
| Beginning of year |
1,304,728 | 1,004,763 | 507,947 | |||||||||
| End of year |
$ | 1,234,252 | $ | 1,304,728 | $ | 1,004,763 | ||||||
The accompanying Notes are an integral part of these Consolidated Financial Statements.
F-8
Table of Contents
Notes to Consolidated Financial Statements
| 1. | Summary of Significant Accounting Policies |
Principles of Consolidation. The Consolidated Financial Statements of M.D.C. Holdings, Inc. (“MDC” or the “Company”, which, unless otherwise indicated, refers to M.D.C. Holdings, Inc. and its subsidiaries) include the accounts of MDC and its wholly owned subsidiaries. All intercompany balances and transactions have been eliminated in consolidation.
Description of Business. The Company’s homebuilding segments, through separate subsidiaries, have operations in Arizona, California, Colorado, Delaware Valley (which includes Pennsylvania, Delaware and New Jersey), Florida, Illinois (although the Company began to exit the Illinois market during the 2008 third quarter), Maryland, Nevada, Utah and Virginia (which includes Virginia and West Virginia). The primary functions of the Company’s homebuilding segments include land acquisition and development, home construction, purchasing, marketing, merchandising, sales and customer service. The Company builds and sells primarily single-family detached homes which are designed and built to meet local customer preferences. The Company is the general contractor for all of its projects and retains subcontractors for site development and home construction.
The Company’s Financial Services and Other segment consists of HomeAmerican Mortgage Corporation (“HomeAmerican”), which originates mortgage loans primarily for the Company’s homebuyers, American Home Insurance Agency, Inc. (“American Home Insurance”), which offers third-party insurance products to the Company’s homebuyers, and American Home Title and Escrow Company (“American Home Title”), which provides title agency services to the Company’s homebuyers in Colorado, Delaware, Florida, Illinois, Nevada, Maryland, Virginia and West Virginia. This segment also includes Allegiant Insurance Company, Inc., A Risk Retention Group (“Allegiant”), which provides to its customers, primarily many of the Company’s homebuilding subsidiaries and certain subcontractors of these homebuilding subsidiaries, general liability coverage for construction work performed associated with closed homes, and StarAmerican Insurance Ltd. (“StarAmerican”), a Hawaii corporation and a wholly-owned subsidiary of MDC. StarAmerican has agreed to re-insure: (1) all claims pursuant to two policies issued to the Company by a third-party; and (2) pursuant to agreements beginning in June 2004, all Allegiant claims in excess of $50,000 per occurrence, up to $3.0 million per occurrence, subject to various aggregate limits, not to exceed $18.0 million per year. Effective July 1, 2009, StarAmerican re-insures Allegiant for all claims in excess of $50,000 per occurrence, up to $3.0 million per occurrence, subject to various aggregate limits, not to exceed $6.0 million per year.
Presentation. The Company’s balance sheet presentation is unclassified due to the fact that certain assets and liabilities have both short and long-term characteristics. The Company has evaluated subsequent events through February 5, 2010, the date the Consolidated Financial Statements were filed with the SEC.
Use of Accounting Estimates. The preparation of financial statements in conformity with accounting principles generally accepted in the United States requires management to make estimates and assumptions that affect the reported amounts of assets and liabilities and disclosure of contingent assets and liabilities at the date of the financial statements and the reported amounts of revenues and expenses during the reporting period. Actual results could differ from those estimates.
Concentration of Credit Risk. To date, the Company’s home sales revenue has been generated largely from home closings in its Arizona, California, Colorado and Nevada markets. The Company conducts a significant portion of its business in these markets and generates a disproportionate amount of home sales revenue in these markets. New home sales and home price appreciation has declined since 2007 in each of these markets. Continued slowdown within these markets could have a material adverse impact on the Company’s financial position and results of operations.
F- 9
Table of Contents
M.D.C. HOLDINGS, INC.
Notes to Consolidated Financial Statements (Continued)
The following table discloses the percent of home sales revenue generated by each of these markets during the years ended December 31, 2009, 2008 and 2007.
| Year Ended December 31, | ||||||
| 2009 | 2008 | 2007 | ||||
| Arizona |
18% | 21% | 26% | |||
| California |
15% | 19% | 21% | |||
| Nevada |
12% | 14% | 14% | |||
| Colorado |
21% | 15% | 10% | |||
| Total |
66% | 69% | 71% | |||
Historically, a substantial portion of mortgage loans originated by the Company had been sold to Countrywide Home Loans, Inc. and its affiliates (“Countrywide”). The following table sets forth the percent of mortgage loans sold to Bank of America (formerly known as Countrywide), Wells Fargo Funding, Inc. and Chase Manhattan Mortgage Corporation during the years ended December 31, 2009, 2008 and 2007.
| Year Ended December 31, | ||||||
| 2009 | 2008 | 2007 | ||||
| Wells Fargo Funding, Inc. |
45% | 59% | 23% | |||
| Bank of America |
34% | 23% | 51% | |||
| Chase Manhattan Mortgage Corporation |
18% | 13% | 2% | |||
Cash and Cash Equivalents. The Company periodically invests funds in highly liquid investments with an original maturity of three months or less, such as commercial paper, money market funds and time deposits, which are included in cash and cash equivalents in the Consolidated Balance Sheets and Consolidated Statements of Cash Flows. At December 31, 2009 and 2008, the Company had $5.0 million and $20.0 million, respectively, of time deposits included in cash and cash equivalents.
Marketable Securities. The Company’s marketable securities consist of both fixed rate and floating rate interest earning securities, primarily: (1) debt securities, which may include, among others, United States government and government agency debt, corporate debt and bankers’ acceptances; and (2) deposit securities which may include, among others, certificates of deposit and time deposits. The Company classifies its debt securities as held-to-maturity as it has both the ability and intent to hold these investments until their maturity date. Accordingly, the Company’s debt securities are reported at amortized cost in the Consolidated Balance Sheets. The Company’s marketable securities also include $100 million of investments held in a mutual fund, which invests predominately in fixed income securities. The Company’s equity securities are recorded at fair value.
Restricted Cash. The Company receives cash earnest money deposits (“Deposits”) from customers for the sale of a home. In certain states the Company is restricted from using Deposits for general purposes, unless it takes measures to release state imposed restrictions on the Deposits received from homebuyers in conjunction with home sales, which may include posting blanket security bonds. At December 31, 2009 and 2008, we had $4.5 million and $4.5 million outstanding in blanket security bonds used to release restrictions on certain Deposits. The Company had $0.5 million and $0.7 million in restricted cash related to Deposits at December 31, 2009 and 2008, respectively.
F-10
Table of Contents
M.D.C. HOLDINGS, INC.
Notes to Consolidated Financial Statements (Continued)
Unsettled Trades. On September 16, 2008, the Company delivered a timely redemption request to The Reserve Funds to redeem its investment in The Reserve’s Primary money market fund. The Reserve announced on September 16, 2008 that all Primary Fund redemption requests received before 3:00 p.m. that day would be redeemed at $1.00 per share. Despite representations by The Reserve that the redemptions would be paid the same day as the redemption request, the amounts due to the Company were not distributed to the Company upon request of redemption. Accordingly, at December 31, 2009 and 2008, the Company has presented the amounts due from The Reserve as unsettled trades on the Consolidated Balance Sheets and has presented the settlement of its redemption request as a source of cash from investing activities in the Company’s Consolidated Statements of Cash Flows. At December 31, 2009, the Company had $1.6 million of unsettled trades, net of allowance, with The Reserve Primary Fund which was subsequently collected in January 2010.
Home Sales Receivables. Home sales receivables primarily consist of cash to be received from title companies or outside brokers associated with closed homes. Generally, the Company will receive cash from title companies and outside brokers within a few days of the home being closed.
Mortgage Loans Held-for-Sale, Net. Mortgage loans held-for-sale are recorded at fair value based on quoted market prices and estimated market prices received from an outside third-party. Using fair value allows an offset of the changes in fair values of the mortgage loans and the derivative instruments used to hedge them without the burden of complying with the requirements for hedge accounting.
Held-for-Development Inventories. The Company’s held-for-development inventories are included as a component of housing completed or under construction and land and land under development in the Consolidated Balance Sheets. The Company’s inventories accounted for on a held-for-development basis include inventory associated with subdivisions where the Company intends to construct and sell homes on the land. The Company’s held-for-development subdivisions also include inventories associated with model and speculative homes. Components of housing completed or under construction primarily include: (1) land costs transferred from land and land under development; (2) hard costs associated with the construction of a house; (3) overhead costs, which include real property taxes, engineering fees and permits and fees; (4) capitalized interest; and (5) indirect fees. Land costs are transferred from land and land under development to housing completed or under construction at the point in time that the Company begins construction of a home on an owned lot. Costs capitalized to land and land under development primarily include: (1) land costs; (2) development costs for the land; (3) entitlement costs; and (4) title insurance, taxes and closing costs directly related to the purchase of the land parcel.
Homebuilding inventories that are accounted for as held-for-development are carried at cost unless events and circumstances indicate that the carrying value of the underlying subdivision may not be recoverable. The Company determines impairments on a subdivision level basis as each such subdivision represents the lowest level of identifiable cash flows. In making this determination, the Company reviews, among other things, the following for each subdivision:
| • | actual and trending “Operating Profit” (which is defined as home sales revenue less home cost of sales and all direct incremental costs associated with the home closing) for homes closed in the: (1) prior two completed fiscal quarters on an individual basis; (2) current fiscal quarter; (3) last six months; and (4) last twelve months; |
| • | estimated future undiscounted cash flows and Operating Profit; |
| • | forecasted Operating Profit for homes in Backlog; |
F-11
Table of Contents
M.D.C. HOLDINGS, INC.
Notes to Consolidated Financial Statements (Continued)
| • | actual and trending net and gross home orders; |
| • | base sales price and home sales incentive information for homes that (1) closed in the prior two completed fiscal quarters; (2) closed in the current fiscal quarter; (3) are in Backlog as of the end of the current fiscal quarter; and (4) are forecasted to close over the remaining life of the subdivision; |
| • | market information for each sub-market, including competition levels, foreclosure levels and the size and style of homes currently being offered for sale; and |
| • | known or probable events indicating that the carrying value may not be recoverable. |
If events or circumstances indicate that the carrying value of the Company’s held-for-development inventory may not be recoverable, assets are reviewed for impairment by comparing the undiscounted estimated future cash flows from an individual subdivision to its carrying value. If the undiscounted future cash flows are less than the subdivision’s carrying value, the carrying value of the subdivision is written down to its then estimated fair value. For subdivisions that continue to be held-for-development, the carrying value is not written up for increases in the estimated fair value of such subdivision in subsequent reporting periods. The Company determines the estimated fair value of each held-for-development subdivision by determining the present value of the estimated future cash flows at discount rates that are commensurate with the risk of the subdivision under evaluation. For the year ended December 31, 2007 and for the 2008 first and second quarters, discount rates used in the Company’s estimated discounted cash flow assessments ranged from 10% to 18%. During the 2008 third quarter, and continuing through December 31, 2009, the discount rates used in the Company’s estimated discounted cash flows ranged from 13% to 21%. This change resulted from the Company’s perception of increased risks and uncertainties in the homebuilding industry due to, among other things, the on-going deterioration in the market value of land and homes as well as homebuyers’ inability to qualify for mortgage loans. Impairments on held-for-development inventory, together with impairments of the Company’s held-for-sale inventory and intangible and other assets, are presented as a separate line in the Consolidated Statements of Operations.
Held-for-Sale Inventories. The Company’s held-for-sale inventories are included as a component of land and land under development in the Consolidated Balance Sheets, and include inventory associated with subdivisions for which the Company intends to sell the land in its current condition. The classification of land as held-for-sale is based on the following criteria: (1) management, having the authority to approve the action, commits to a plan to sell the asset; (2) the asset is available for immediate sale in its present condition, subject only to terms that are usual and customary for sales of such assets; (3) an active program to locate a buyer and other actions required to complete the plan to sell the asset have been initiated; (4) the sale of the asset is probable, and transfer of the asset is expected to qualify for recognition as a completed sale, within one year; (5) the asset is being actively marketed for sale at a price that is reasonable in relation to its current fair value; and (6) actions required to complete the plan indicate that it is unlikely that significant changes to the plan will be made or that the plan will be withdrawn.
In certain circumstances, the Company will re-evaluate the best use of an asset that is currently being accounted for as held-for-development. In such situations, the Company will review, among other things: (1) average sales prices for homes that have closed, are in Backlog and forecasted for future sales; (2) current market conditions, including competition levels, estimated levels of competition in future reporting periods and home foreclosure levels; (3) estimated development costs that have yet to be incurred; and (4) the total number of lots owned in each subdivision and surrounding areas. If, based upon this evaluation, the Company believes that the best use of the asset is the sale of the inventory in its current condition, all or portions of the subdivision will be accounted for as held-for-sale, assuming all of the foregoing held-for-sale criteria have been met at the end of the applicable reporting period.
F-12
Table of Contents
M.D.C. HOLDINGS, INC.
Notes to Consolidated Financial Statements (Continued)
The Company records land held-for-sale at the lower of its carrying value or fair value less costs to sell. In performing the fair value less cost to sell evaluation for land, the Company considers, among other things, prices for land in recent comparable sale transactions, internal developed market analysis studies, which include the estimated price a willing buyer would pay for the land (other than in a forced liquidation) and recent bona fide offers received from outside third-parties. If the estimated fair value less cost to sell held-for-sale inventory is less than the current carrying value, the inventory is written down to its estimated fair value less cost to sell. The Company monitors the fair value of held-for-sale inventories on a periodic basis through the disposition date. A subsequent increase in the fair value less cost to sell of held-for-sale inventories, if any, is recognized as a decrease to asset impairments in the Consolidated Statements of Operations during such subsequent period, but not in excess of the cumulative impairment that was previously recorded. The Company had held-for-sale inventory of $3.5 million and $12.1 million at December 31, 2009 and 2008, respectively.
Asset Impairments. The following tables set forth, by reportable segment, the asset impairments recorded during the twelve months ended December 31, 2009, 2008 and 2007 (in thousands).
| Year Ended December 31, | ||||||||||
| 2009 | 2008 | 2007 | ||||||||
| Land and Land Under Development (Held-for-Development) |
||||||||||
| West |
$ | 10,133 | $ | 81,686 | $ | 419,471 | ||||
| Mountain |
8,913 | 66,606 | 24,194 | |||||||
| East |
1,600 | 23,678 | 37,719 | |||||||
| Other Homebuilding |
376 | 2,543 | 34,170 | |||||||
| Subtotal |
21,022 | 174,513 | 515,554 | |||||||
| Housing Completed or Under Construction (Held-for-Development) |
||||||||||
| West |
5,379 | 48,437 | 135,081 | |||||||
| Mountain |
1,646 | 16,514 | 5,912 | |||||||
| East |
875 | 11,895 | 16,177 | |||||||
| Other Homebuilding |
537 | 5,796 | 12,722 | |||||||
| Subtotal |
8,437 | 82,642 | 169,892 | |||||||
| Land and Land Under Development (Held-for-Sale) |
||||||||||
| West |
(557 | ) | 21,846 | 26,942 | ||||||
| Mountain |
- | 150 | - | |||||||
| East |
- | 1,270 | - | |||||||
| Other Homebuilding |
234 | 6,315 | 13,765 | |||||||
| Subtotal |
(323 | ) | 29,581 | 40,707 | ||||||
| Other asset impairments |
1,850 | 11,419 | 468 | |||||||
| Consolidated Asset Impairments |
$ | 30,986 | $ | 298,155 | $ | 726,621 | ||||
The $29.5 million impairment of the Company’s held-for-development inventories during the year ended December 31, 2009, related to communities in each homebuilding segment and, most notably in the Company’s West and Mountain segments. The impairments resulted primarily from declines in the average selling price of homes in each of the 60 communities that were impaired during 2009 resulting from an effort to generate new home sales. The impairments in the West segment were concentrated in the Nevada market and resulted from decreases in the average
F-13
Table of Contents
M.D.C. HOLDINGS, INC.
Notes to Consolidated Financial Statements (Continued)
selling prices of closed homes during 2009, compared with 2008, in response to increased levels of competition in this market and continued high levels of home foreclosures. The impairments in the East and Other Homebuilding segments primarily resulted from lower forecasted average selling prices for communities that are in the close-out phase.
The impairment of the Company’s held-for-sale inventory during the years ended December 31, 2009 and 2008, primarily resulted from decreases in the fair market values of new homes being sold, as this has caused corresponding declines in the fair market values of land available for sale.
The impairments of the Company’s held-for-development inventories incurred during the years ended December 31, 2008 and 2007, primarily resulted from decreases in home sales prices and/or increases in discounts on the sales price of the home (“Sales Price Incentives”) offered as a result of: (1) lower home sales prices currently being offered by the Company’s competitors; (2) efforts to maintain homes in Backlog; (3) continued high levels of home foreclosures; (4) affordability issues for new homes as homebuyers have been experiencing difficulty in qualifying for mortgage loans; and (5) efforts to stimulate new home orders in order to sell and close the remaining homes in subdivisions that are in the close-out phase.
During the year ended December 31, 2008, the impairments of held-for-development inventories in the West and Mountain segments were significantly higher than impairments recorded in the Company’s other homebuilding segments, primarily resulting from: (1) competition within the sub-markets of these segments appearing to be more pronounced than in the other homebuilding segments and, as a result, the Company generally experienced more significant reductions in its average selling prices of homes within these segments; and (2) the fact that the total homebuilding inventories for the Mountain and West segments comprised 39% and 35%, respectively, of the Company’s consolidated homebuilding inventories at December 31, 2008. The Company also believes that buyers of its homes in the West segment are largely comprised of entry level homebuyers, compared with a wider range of homebuyers in the other homebuilding segments and, as such, their ability to obtain suitable mortgage loan financing has been impacted more adversely by the decreased availability of mortgage loan products, which contributed to the relatively higher impairments in this segment. Also contributing to the impairments in the Mountain segment was a more pronounced decline in demand for new homes in recent quarters, particularly in our Utah market, as this market has experienced a greater decline in demand for new homes during 2008 than in other homebuilding segments.
During the year ended December 31, 2007, the impairment of held-for-development inventories in the West segment were significantly higher than impairments recorded in other homebuilding segments. This primarily resulted from the following: (1) the fact that the Company’s owned lots and active subdivisions in the West segment comprised nearly 53% of the consolidated owned lots and 53% of the active subdivisions at December 31, 2007, resulting in approximately 48% of the Company’s total inventory being concentrated in the West segment at December 31, 2007; (2) competition within the sub-markets of the West segment appeared to be more pronounced than in the other homebuilding segments and, as a result, the Company saw home price reductions offered by its competitors; and (3) the market value of homes in Arizona, California and Nevada appreciated more significantly than in other segments during 2004 and 2005, from a larger number of investors purchasing homes on a speculative basis, resulting in values of homes in these markets being susceptible to greater declines, due in part from the exit of investors. Consequently, a majority of the active subdivisions within each market of our West segment was impaired during 2007.
The impairment of the Company’s held-for-sale inventory during the years ended December 31, 2008 and 2007 primarily resulted from decreases in the fair market values of new homes being sold, as this has caused corresponding
F-14
Table of Contents
M.D.C. HOLDINGS, INC.
Notes to Consolidated Financial Statements (Continued)
declines in the fair market values of land available for sale. Also contributing to these impairments were decisions that the best use of these assets was to sell them in their then current condition.
During the year ended December 31, 2009, the other asset impairments primarily relate to a $1.0 million impairment of the Company’s related party asset. This impairment resulted from a decline in the estimated cash flows from such asset, resulting in an other-than-temporary-impairment. See Note 9 to the Consolidated Financial Statements.
Additionally, during the year ended December 31, 2008, the Company incurred $11.4 million of impairments associated with intangible and other assets. These impairments primarily related to deferred marketing costs, such as certain selling costs associated with model homes that were abandoned during the year either because of a determination that the best use of the asset was to sell it in its current condition or because of changing home styles in a subdivision, which resulted in certain model homes no longer being used for the sale of new homes.
The following table sets forth the current carrying value of the Company’s inventory that was impaired during the three months ended December 31, 2009. Accordingly, these carrying values represent the fair value of such inventory at December 31, 2009.
| Land and Land Under Development (Held-for- Development) |
Housing Completed or Under Construction (Held-for- Development) |
Land and Land Under Development (Held-for-Sale) |
Total Fair Value of Impaired Inventory | |||||||||
| West |
$ | - | $ | 3,556 | $ | - | $ | 3,556 | ||||
| Mountain |
13,560 | 12,035 | - | 25,595 | ||||||||
| East |
- | - | - | - | ||||||||
| Other Homebuilding |
- | - | 385 | 385 | ||||||||
| Consolidated |
$ | 13,560 | $ | 15,591 | $ | 385 | $ | 29,536 | ||||
Property and Equipment, Net. Property and equipment is carried at cost less accumulated depreciation and amortization. Depreciation and amortization are computed using the straight-line method over the estimated useful lives of the related assets, which range from two to 20 years. Depreciation and amortization expense for property and equipment was $5.2 million, $8.8 million and $12.5 million for the years ended December 31, 2009, 2008 and 2007, respectively. Accumulated depreciation and amortization at December 31, 2009 and 2008 was $20.9 million and $26.0 million, respectively. Additionally, during 2007, the Company sold two aircraft, which resulted in gains of $10.3 million.
Deferred Tax Asset, net. Deferred tax assets and liabilities are recognized based on the difference between the carrying amounts of assets and liabilities in the financial statements and their respective tax bases. Deferred tax assets and liabilities are measured using current enacted tax rates in effect in the years in which those temporary differences are expected to reverse. Deferred tax assets should be reduced by a valuation allowance if, based on the weight of available evidence, it is more likely than not that some portion or all of the deferred tax assets will not be realized. At December 31, 2009 and 2008, based upon current facts and circumstances, the Company recorded a valuation allowance against its deferred tax assets of $208.1 million and $294.3 million, respectively. The decrease in the Company’s valuation allowance was primarily due to the impact from being able to carry back $142.6 million of net
F-15
Table of Contents
M.D.C. HOLDINGS, INC.
Notes to Consolidated Financial Statements (Continued)
operating losses due to the expanded NOL carryback provisions contained in the Worker, Homeownership, and Business Assistance Act of 2009, enacted on November 6, 2009. These expanded NOL carryback provisions allowed the Company to carry back our 2009 tax losses to prior years. Absent the new legislation, these 2009 tax losses would have been carried forward to offset any future tax income.
Prepaid Expenses and Other Assets, Net. The following table sets forth the information relating to prepaid expenses and other assets, net (in thousands).
| December 31, | ||||||
| 2009 | 2008 | |||||
| Deferred marketing costs |
$ | 12,652 | $ | 13,825 | ||
| IRS Deposit |
35,562 | 35,562 | ||||
| Prepaid expenses |
6,436 | 11,602 | ||||
| Land option deposits |
8,387 | 5,951 | ||||
| Deferred debt issue costs, net |
3,903 | 4,731 | ||||
| Other |
5,231 | 7,868 | ||||
| Total |
$ | 72,171 | $ | 79,539 | ||
Deferred Marketing Costs. Certain marketing costs related to model homes and sales offices are capitalized as they are: (1) reasonably expected to be recovered from the sale of the project; and (2) incurred for (A) tangible assets that are used directly throughout the selling period to aid in the sale of the project or (B) services that have been performed to obtain regulatory approval of sales. Capitalized deferred marketing costs are included in prepaid and other assets in the Consolidated Balance Sheets and are amortized to marketing expense as the homes in the related subdivision are closed. The Company amortizes all capitalized marketing costs on a straight line basis over the estimated number of homes to be closed in a subdivision. All other marketing costs are expensed as incurred.
IRS Deposit. During 2008, the Company made a deposit with the Internal Revenue Service (“IRS”) of approximately $35.6 million related to the IRS examination of its 2004 and 2005 federal income tax returns. The deposit was made to limit the interest charge on any potential audit adjustments. See Note 18 to the Consolidated Financial Statements regarding subsequent events associated with the foregoing IRS examination.
Land Option Deposits. Land option deposits primarily include refundable and non-refundable deposits related to the Company’s lot option purchase contracts and are capitalized if all of the following conditions have been met: (1) the costs are directly identifiable with the specific property; (2) the costs would be capitalized if the property were already acquired; and (3) acquisition of the property is probable in that the Company is actively seeking and has the ability to acquire the property and there is no indication that the property is not available for sale. Land option deposits are expensed to general and administrative expense in the Consolidated Statements of Operations when the Company believes it is no longer probable that the lots under option will be acquired. The Company expensed to other operating expense in the Consolidated Statement of Operations $2.9 million, $6.7 million and $23.4 million in land option deposits and pre-acquisition costs for the years ended December 31, 2009, 2008 and 2007, respectively.
Variable Interest Entities. In the normal course of business, the Company enters into lot option purchase contracts (“Option Contracts”), generally through a deposit of cash or letter of credit, for the right to purchase land or lots at a future point in time with predetermined terms. The Company’s obligation with respect to Option Contracts
F-16
Table of Contents
M.D.C. HOLDINGS, INC.
Notes to Consolidated Financial Statements (Continued)
generally is limited to forfeiture of the related non-refundable cash deposits and/or letters of credit, which totaled approximately $7.7 million and $2.1 million, respectively, at December 31, 2009. At December 31, 2009, the Company had the right to acquire 2,584 lots under Option Contracts.
Certain Options Contracts create a variable interest, with the land seller being a variable interest entity (“VIE”). A VIE is created when: (1) the equity investment at risk in the entity is not sufficient to permit the entity to finance its activities without additional subordinated financial support provided by other parties, including the equity holders; (2) the entity’s equity holders as a group (a) lack direct or indirect ability to make decisions about the entity, (b) are not obligated to absorb expected losses of the entity or (c) do not have the right to receive expected residual returns of the entity; or (3) the entity’s equity holders have voting rights that are not proportionate to their economic interest, and the activities of the entity involve or are conducted on behalf of an investor with disproportionately fewer voting rights. If an entity is deemed to be a VIE, the enterprise that is deemed to absorb a majority of the expected losses, receive a majority of the entity’s expected residual returns, or both, is considered the primary beneficiary and must consolidate the VIE. Expected losses and residual returns for VIEs are calculated based on the probability of estimated future cash flow.
The Company has evaluated all Option Contracts that were executed or had significant modifications during 2009 and 2008. Based on these evaluations, the Company’s interests in these VIEs did not result in significant variable interests or require MDC to consolidate the VIEs as MDC’s interests did not qualify it as the primary beneficiary of the expected residual returns or losses.
The Company periodically enters into Option Contracts with third-parties that will purchase or have purchased property at the direction of the Company. The Company evaluates these transactions to determine if they are a product financing arrangement. Option Contracts are considered to be a product financing arrangement if: (1) land that is contracted to be purchased by a third-party that simultaneously contracts to sell to the Company; (2) requirements to purchase land at specified prices; and (3) additional purchase price payments to be made that are adjusted, as necessary, to cover substantially all fluctuation in costs incurred by the third-party. At December 31, 2009 and 2008, the Company recorded $0.8 million and $3.4 million to other assets for Option Contracts that were considered to be product financing arrangements.
Warranty Reserves. The Company’s homes are sold with limited third-party warranties that generally provide for ten years of structural coverage (“structural warranty”), two years of coverage for plumbing, electrical, heating, ventilation and air conditioning systems, and one year of coverage for workmanship and materials. Under MDC’s agreement with the issuer of the third-party warranties, the Company is responsible for performing all of the work for the first two years of the warranty coverage and substantially all of the cost of the work required to be performed during years three through ten of the warranties. As a result, warranty reserves are established as homes close on a house-by-house basis in an amount estimated to be adequate to cover expected costs of materials and outside labor during warranty periods. Reserves are determined based upon historical experience with respect to similar home styles and geographical areas. Certain factors are considered in determining the per-house reserve amount, including: (1) trends in the historical warranty payment levels, including the historical amount paid as a percent of home construction costs; (2) the historical range of amounts paid per house; (3) any warranty expenditures included in (1) and (2) not considered to be normal and recurring; (4) improvements in quality control and construction techniques expected to impact future warranty expenditures; and (5) expertise of division personnel.
Warranty payments are tracked on a house-by-house basis and are recorded against the warranty reserve established for the house. Payments incurred after the close of a home are monitored to determine their nature and, to
F-17
Table of Contents
M.D.C. HOLDINGS, INC.
Notes to Consolidated Financial Statements (Continued)
the extent they are warranty-related payments, they are recorded against the warranty reserve. To the extent this evaluation determines that the payments made are related to completion of a home or land development, the payments are then recorded against the land development and home construction accruals. Additional reserves are established for known, unusual warranty-related expenditures not covered by the general and structural warranty reserves. Warranty reserves not utilized for a particular house are evaluated on a monthly basis for reasonableness in the aggregate on both a market-by-market and consolidated basis. Warranty payments for an individual house may exceed the related reserve. Payments in excess of the reserve are evaluated on a monthly basis in the aggregate to determine if an adjustment to the warranty reserve should be recorded, which could result in a corresponding adjustment to home cost of sales.
Generally, warranty reserves are reviewed monthly, using historical data and other relevant information, to determine the reasonableness and adequacy of both the reserve and the per-unit reserve amount originally included in home cost of sales, as well as the timing of the reversal of any excess reserve. Warranty reserves are included in accrued liabilities in the Consolidated Balance Sheets.
The following table summarizes the warranty reserve activity for the years ended December 31, 2009, 2008 and 2007 (in thousands).
| Year Ended December 31, | ||||||||||||
| 2009 | 2008 | 2007 | ||||||||||
| Warranty reserve balance at beginning of year |
$ | 89,318 | $ | 109,118 | $ | 102,033 | ||||||
| Warranty expense provisions |
7,188 | 12,077 | 27,118 | |||||||||
| Warranty cash payments |
(9,701 | ) | (14,419 | ) | (26,166 | ) | ||||||
| Warranty reserve adjustments |
(27,783 | ) | (17,458 | ) | 6,133 | |||||||
| Warranty reserve balance at end of year |
$ | 59,022 | $ | 89,318 | $ | 109,118 | ||||||
During 2008 and 2009, the Company experienced downward trends in the amount of warranty payments incurred on its previously closed homes. Because the Company’s warranty reserve balance at each period end is generally determined based upon historical warranty payment patterns, the downward trend in warranty payments has impacted the Company’s warranty reserves during 2009 and 2008. As a result of the decline in warranty payments incurred on previously closed homes, the Company recorded adjustments during the year ended December 31, 2009 of $22.6 million to reduce its warranty reserves for previously closed homes. Additionally, during the 2009 third quarter, the Company reached a settlement of a construction defect claim in the Nevada market of the West segment. As a result of this settlement, the costs of which have been paid by insurance providers, the Company released $5.6 million of warranty reserves that were established during previous reporting periods for these construction defect claims. These reductions in the warranty reserves were slightly offset by adjustments to increase the reserve by $0.4 million associated with warranty related issues specific to a limited number of subdivisions, primarily in the Company’s West and Mountain segments. Each of the foregoing warranty reserve adjustments were recorded as a reduction to home cost of sales in the Consolidated Statements of Operations.
During the year ended December 31, 2008, the Company recorded adjustments to decrease its warranty reserve totaling $17.5 million. This decrease primarily resulted from adjustments totaling $14.0 million to reduce its warranty reserve due to the downward trend in warranty payments incurred during 2008. Additionally, the Company recorded an additional $3.5 million decrease to its warranty reserve for non-warranty related items that had increased the
F-18
Table of Contents
M.D.C. HOLDINGS, INC.
Notes to Consolidated Financial Statements (Continued)
warranty reserve during previous reporting periods. As such, this adjustment did not impact the Company’s home cost of sales, but resulted in a reduction to the Company’s homebuilding general and administrative expenses during the year ended December 31, 2008.
Insurance Reserves. The Company records expenses and liabilities for losses and loss adjustment expenses for claims associated with: (1) insurance policies and re-insurance agreements issued by StarAmerican and Allegiant; (2) self-insurance, including workers compensation; and (3) deductible amounts under the Company’s insurance policies. The establishment of the provisions for outstanding losses and loss adjustment expenses is based on actuarial studies that include known facts and interpretations of circumstances, including the Company’s experience with similar cases and historical trends involving claim payment patterns, pending levels of unpaid claims, product mix or concentration, claim severity, frequency patterns such as those caused by natural disasters, fires, or accidents, depending on the business conducted, and changing regulatory and legal environments.
The following table summarizes the insurance reserve activity for the years ended December 31, 2009, 2008 and 2007 (in thousands).
| Year Ended December 31, | ||||||||||||
| 2009 | 2008 | 2007 | ||||||||||
| Insurance reserve balance at beginning of year |
$ | 59,171 | $ | 57,475 | $ | 50,854 | ||||||
| Insurance expense provisions |
3,771 | 5,780 | 10,729 | |||||||||
| Insurance cash payments |
(6,213 | ) | (4,302 | ) | (4,080 | ) | ||||||
| Insurance reserve adjustments |
(5,123 | ) | 218 | (28 | ) | |||||||
| Insurance reserve balance at end of year |
$ | 51,606 | $ | 59,171 | $ | 57,475 | ||||||
Insurance expenses have decreased each of the years ended December 31, 2009, 2008 and 2007 primarily resulting from a decline in the number of homes closed. The $5.1 million adjustment to reduce insurance reserves during 2009 primarily resulted from a reduction in the Company’s incurred but not reported insurance reserves associated with StarAmerican and Allegiant.
Mortgage Loan Loss Reserves. In the normal course of business, the Company establishes reserves for potential losses associated with HomeAmerican’s loan sale agreements pursuant to which mortgage loans are sold to third-parties. These reserves are created to address repurchase and indemnity claims by third-party purchasers of the mortgage loans, which claims arise primarily out of allegations of homebuyer fraud at the time of origination of the loan. These reserves are based upon, among other matters: (1) pending claims received from third-party purchasers associated with previously sold mortgage loans; (2) a current assessment of the potential exposure associated with future claims of homebuyer fraud in mortgage loans originated in prior period loans; and (3) historical loss experience. As noted in reports in the mortgage loan industry during 2009, mortgage performance continued to deteriorate as evidenced by year-over-year increases in delinquency rates. Additionally, foreclosures and foreclosures in process have increased substantially. Similarly, HomeAmerican has experienced an increase in the number and magnitude of claims to repurchase previously sold mortgage loans. Accordingly, the Company increased its estimated mortgage loan loss reserve by $9.7 million during the year ended December 31, 2009 and made $1.2 million in payments associated with its mortgage loan loss reserve. The Company’s mortgage loan loss reserves are reflected as a component of accrued liabilities in the Consolidated Balance Sheets, and the associated expenses are included as a component of general and administrative expenses in the Consolidated Statements of Operations.
F-19
Table of Contents
M.D.C. HOLDINGS, INC.
Notes to Consolidated Financial Statements (Continued)
Litigation Reserves. The Company and certain of its subsidiaries have been named as defendants in various cases, further described in Note 12 to the Consolidated Financial Statements, arising in the normal course of business. The Company reserves for estimated exposure with respect to these cases based upon currently available information on each case. Due to uncertainties in the estimation process, actual results may differ from those estimates. At December 31, 2009 and 2008, the Company had legal reserves of $14.5 million and $7.6 million, respectively.
Revenue Recognition for Homebuilding Segments. In the process of selling our homes, the Company negotiates the terms of a home sales contract with a prospective homebuyer, including base sales price, any options and upgrades (such as upgraded appliance, cabinetry, flooring, etc.), and any home sales incentive. The Company’s home sales incentives generally come in the form of: (1) Sales Price Incentives; (2) homebuyer closing cost assistance paid by Richmond to a third-party (“Closing Cost Incentives”); and (3) mortgage loan origination fees paid by Richmond to HomeAmerican (“Mortgage Loan Origination Fees”). The combination of home sales incentives offered to prospective homebuyers may vary from subdivision-to-subdivision and from home-to-home, and may be revised during the home closing process based upon homebuyer preferences or upon changes in market conditions, such as changes in our competitors’ pricing. Revenue from a home closing includes the base sales price and any purchased options and upgrades and is reduced for any Sales Price Incentives or Mortgage Loan Origination Fees.
Revenue from home closings and land sales is recognized when the closing has occurred, title has passed, adequate initial and continuing investment by the buyer is received, possession and other attributes of ownership have been transferred to the buyer and the Company is not obligated to perform significant additional activities after closing and delivery. If the buyer has provided sufficient initial and continuing investment, and all other revenue recognition criteria have been met, revenue is recognized on the date of closing.
The Company utilizes the installment method of accounting for home closings if all of the following criteria are present: (1) HomeAmerican originates the mortgage loan; (2) HomeAmerican has not sold the mortgage loan, or loans, as of the end of the pertinent reporting period; and (3) the homebuyer’s down payment does not meet the initial or continuing investment criteria. Accordingly, the corresponding Operating Profit is deferred, by recording a reduction to home sales revenue in the Consolidated Statements of Operations, and the deferral is subsequently recognized at the time HomeAmerican sells the homebuyer’s mortgage loan, or loans, to a third-party purchaser. In the event the Operating Profit is a loss, the Company recognizes such loss at the time the home is closed. The Company’s deferral of Operating Profit associated with homes that closed for which the initial or continuing investment criteria were not met was immaterial at December 31, 2009 and 2008.
Revenue Recognition for HomeAmerican. The Company’s mortgage loans generally are sold to third-party purchasers with anti-fraud, warranty and limited early payment default provisions. Sale of a mortgage loan has occurred when the following criteria have been met: (1) the payment from the third-party purchaser is not subject to future subordination; (2) the Company has transferred all the usual risks and rewards of ownership that is in substance a sale; and (3) the Company does not have a substantial continuing involvement with the mortgage loan. Revenue from the sale of mortgage loan servicing is recognized upon the exchange of consideration for the mortgage loans and related servicing rights between the Company and the third-party purchaser. Prior to January 1, 2008, the Company deferred the application and origination fees, net of costs, and recognized them as revenue, along with the associated gains or losses on the sale of the mortgage loans and related servicing rights, when the mortgage loans were sold to third-party purchasers. The revenue recognized was reduced by the estimated fair value of any related guarantee provisions provided to the third-party purchaser, which was determined by the amount at which the liability could be bought in a current transaction between willing parties. The fair value of the guarantee provisions was recognized in revenue when the Company was released from its obligation under the terms of the loan sale agreements.
F-20
Table of Contents
M.D.C. HOLDINGS, INC.
Notes to Consolidated Financial Statements (Continued)
On January 1, 2008, the Company elected to measure mortgage loans held-for-sale originated on or after January 1, 2008 at fair value. Accordingly, changes in fair value are reported in earnings at each reporting date. Using fair value allows an offset of the changes in fair values of the loans and the derivative instruments used to economically hedge them without the burden of complying with the requirements for hedge accounting. The impact of recording changes in fair value to earnings did not have a material impact on the Company’s financial position, results of operations or cash flows upon adoption. Gains on sales of mortgage loans, net, were $20.3 million, $21.7 million and $30.7 million for the years ended December 31, 2009, 2008 and 2007, respectively.
Home Cost of Sales. Home cost of sales includes the specific construction costs of each home and all applicable land acquisition, land development and related costs, both incurred and estimated to be incurred, warranty costs and finance and closing costs, including Closing Cost Incentives. The Company uses the specific identification method for the purpose of accumulating home construction costs and allocates costs to each lot within a subdivision associated with land acquisition and land development based upon relative market value of the lots prior to home construction. Lots within a subdivision typically have comparable market values, and the Company therefore generally allocates costs equally to each lot within a subdivision. The Company records all home cost of sales when a home is closed on a house-by-house basis.
When a home is closed, the Company generally has not yet paid and recorded all costs necessary to complete the construction of the home and certain land development costs. At the time of a home closing, the Company compares the home construction budgets to actual recorded costs to determine the additional costs remaining to be paid on each closed home. For amounts not incurred or paid as of the time of closing a home, the Company records an estimated accrual associated with certain home construction and land development costs. Generally, these accruals are established based upon contracted work which has yet to be paid, open work orders not paid at the time of home closing, punch list items identified during the course of the homebuyer’s final walkthrough of the home, as well as land completion costs more likely than not to be incurred, and represent estimates believed to be adequate to cover the expected remaining home construction and land development costs. The Company monitors the adequacy of these accruals on a house-by-house basis and in the aggregate on both a market-by-market and consolidated basis. At December 31, 2009 and 2008, the Company had $21.2 million and $22.9 million, respectively, of land development and home construction accruals for closed homes. Actual results could differ from such estimates.
The Company may offer to pay all or a portion of a homebuyer’s closing costs as an incentive. Closing Cost Incentives represent expenses that, over and above the price of the home, the Company and the homebuyer normally incur to complete the sales transaction. These costs may include items payable to third-parties such as mortgage loan origination fees, discount points, appraisal fees, document preparation fees, insurance premiums, title search and insurance fees, as well as government recording and transfer charges. The Company records Closing Cost Incentives at the time a home is closed and presents them as a component of home cost of sales in the Consolidated Statements of Operations.
Stock-Based Compensation Expense. Stock-based compensation expense for all share-based payment awards is based on the grant date fair value. The grant date fair value for stock option awards is estimated using the Black-Scholes option pricing model and the grant date fair value for restricted stock awards is based upon the closing price of the Company’s common stock on the date of grant. The Company recognizes these compensation costs net of estimated forfeitures and recognizes stock-based compensation expense for only those awards expected to vest on a straight-line basis over the requisite service period of the award, which is currently the vesting term of up to seven years.
F-21
Table of Contents
M.D.C. HOLDINGS, INC.
Notes to Consolidated Financial Statements (Continued)
An annual forfeiture rate is estimated at the time of grant, and revised, if necessary, in subsequent periods if the actual forfeiture rate differs from our estimate. The Company estimated the annual forfeiture rate generally to be 10% to 25% for share-based payment awards granted to Non-Executives (as defined in Note 15 to the Consolidated Financial Statements) and 0% for share-based payment awards granted to Executives and Directors (as defined in Note 15 to the Consolidated Financial Statements), based on the terms of their awards, as well as historical forfeiture experience.
Derivative Financial Instruments. The Company utilizes certain derivative instruments in the normal course of business, which primarily include commitments to originate mortgage loans (interest rate lock commitments or locked pipeline) and forward sales of mortgage-backed securities commitments, both of which typically are short-term in nature. Forward sales securities commitments and private investor sales commitments are utilized to hedge changes in fair value of mortgage loan inventory and commitments to originate mortgage loans. At December, 2009, the Company had $51.7 million in interest rate lock commitments and $65.0 million in forward sales of mortgage-backed securities.
The Company records its mortgage loans held-for-sale at fair value to achieve matching of the changes in the fair value of its derivative instruments with the changes in fair values of the loans it is hedging, without having to designate its derivatives as hedging instruments. For forward sales commitments, as well as commitments to originate mortgage loans that are still outstanding at the end of a reporting period, the Company records the fair value of the derivatives in other revenue in the Consolidated Statements of Operations with an offset to either prepaid and other assets or accrued liabilities in the Consolidated Balance Sheets, depending on the nature of the change. The changes in fair value of the Company’s derivatives were not material during the year ended December 31, 2009 or 2008. During 2007, the Company did not designate its derivatives as hedging instruments and recorded its forward sales commitments and its locked pipeline as free standing derivatives and applied the lower-of-cost-or-market method to account for mortgage loan inventory.
Advertising Expenses. The Company expenses advertising costs as incurred. Advertising expenses were $8.0 million, $14.1 million and $36.6 million for the years ended December 31, 2009, 2008 and 2007, respectively.
F-22
Table of Contents
M.D.C. HOLDINGS, INC.
Notes to Consolidated Financial Statements (Continued)
Earnings (Loss) Per Common Share. For purposes of calculating earnings (loss) per share (“EPS”), a company that has participating security holders (for example, unvested restricted stock that has nonforfeitable dividend rights) is required to utilize the two-class method for calculating earnings per share. The two-class method is an allocation of earnings between the holders of common stock and a company’s participating security holders. Under the two-class method, earnings for the reporting period are allocated between common shareholders and other security holders, based on their respective rights to receive distributed earnings (i.e. dividends) and undistributed earnings (i.e. net income or loss). Currently, the Company has one class of security and has participating security holders which consist of shareholders of unvested restricted stock. The basic and diluted EPS calculations are shown below (in thousands, except per share amounts).
| Year Ended December 31, | ||||||||||||
| 2009 | 2008 | 2007 | ||||||||||
| Basic and Diluted Earnings (Loss) Per Common Share |
||||||||||||
| Net income (loss) |
$ | 24,679 | $ | (380,545 | ) | $ | (636,940 | ) | ||||
| Less: distributed and undistributed earnings allocated to participating securities |
(393 | ) | (259 | ) | (60 | ) | ||||||
| Net income (loss) attributable to common stockholders |
$ | 24,286 | $ | (380,804 | ) | $ | (637,000 | ) | ||||
| Basic weighted-average shares outstanding |
46,537 | 46,159 | 45,687 | |||||||||
| Unvested restricted stock and stock options, net |
382 | - | - | |||||||||
| Dilutive weighted-average shares outstanding |
46,919 | 46,159 | 45,687 | |||||||||
| Basic Earnings (Loss) Per Common Share |
$ | 0.52 | $ | (8.25 | ) | $ | (13.94 | ) | ||||
| Dilutive Earnings (Loss) Per Common Share |
$ | 0.52 | $ | (8.25 | ) | $ | (13.94 | ) | ||||
Diluted EPS includes the dilutive effect of common stock equivalents and is computed using the weighted-average number of common stock and common stock equivalents outstanding during the reporting period. Common stock equivalents include stock options and unvested restricted stock. Diluted EPS for the years ending December 31, 2008 and 2007 excluded common stock equivalents because the effect of their inclusion would be anti-dilutive, or would decrease the reported loss per share. Using the treasury stock method, the weighted-average common stock equivalents excluded from diluted EPS were 0.5 million shares and 0.8 million shares during the years ended December 31, 2008 and 2007, respectively.
Recent Statements of Financial Accounting Standards. In June 2009, the FASB issued SFAS No. 167, “Amendments to FASB Interpretation No. 46(R)” (“SFAS 167”). SFAS 167, which is incorporated in Accounting Standards Codification (“ASC”) Topic 810, “Consolidation,” requires a qualitative approach to identifying a controlling financial interest in a variable interest entity (“VIE”), and requires ongoing assessment of whether an entity is a VIE and whether an interest in a VIE makes the holder the primary beneficiary of the VIE. SFAS 167 is effective for the Company’s fiscal year beginning January 1, 2010. The Company is currently reviewing the effect of SFAS 167 on its consolidated financial statements.
In June 2009, the FASB issued SFAS No. 168, “The FASB Accounting Standards Codification and the Hierarchy of Generally Accepted Accounting Principles” (“SFAS 168”). SFAS 168, which is incorporated in ASC
F-23
Table of Contents
M.D.C. HOLDINGS, INC.
Notes to Consolidated Financial Statements (Continued)
Topic 105, “Generally Accepted Accounting Principles,” identifies the ASC as the authoritative source of generally accepted accounting principles in the United States. Rules and interpretive releases of the SEC under federal securities laws are also sources of authoritative GAAP for SEC registrants. The Company adopted SFAS No. 168 in 2009 third quarter.
In June 2009, the FASB issued SFAS No. 166, “Accounting for Transfers of Financial Assets an amendment of FASB Statement No. 140” (“SFAS 166”). SFAS 166, which is incorporated in ASC 860 “Transfers and Servicing,” removes the concept of a qualifying special-purpose entity and removes an exception from applying ASC 810 “Consolidation,” to qualifying special-purpose entities. SFAS 166 determines whether a transferor and all of the entities included in the transferor’s financial statements being presented have surrendered control over transferred financial assets. That determination must consider the transferor’s continuing involvement in the transferred financial asset, including all arrangements or agreements made contemporaneously with, or in contemplation of, the transfer, even if they were not entered into at the time of the transfer. SFAS 166 modifies the financial-components approach and limits the circumstances in which a financial asset, or portion of a financial asset, should be derecognized when the transferor has not transferred the entire original financial asset to an entity that is not consolidated with the transferor in the financial statements being presented and/or when the transferor has continuing involvement with the transferred financial asset.
SFAS 166 defines the term participating interest to establish specific conditions for reporting a transfer of a portion of a financial asset as a sale. If the transfer does not meet those conditions, a transferor should account for the transfer as a sale only if it transfers an entire financial asset or a group of entire financial assets and surrenders control over the entire transferred asset(s). If a transfer of financial assets does not meet the requirements for sale accounting, the securitized mortgage loans should continue to be classified as loans in the transferor’s statement of financial position. SFAS 166 requires that a transferor recognize and initially measure at fair value all assets obtained (including a transferor’s beneficial interest) and liabilities incurred as a result of a transfer of financial assets accounted for as a sale.
SFAS 166 shall be effective as of the beginning of each reporting entity’s first annual reporting period that begins after November 15, 2009, for interim periods within that first annual reporting period, and for interim and annual reporting periods thereafter. Earlier application is prohibited. The recognition and measurement provisions of SFAS 166 shall be applied to transfers that occur on or after the effective date. The Company is currently evaluating the impact that SFAS 166 may have on its financial position, results of operations and cash flows.
In August 2009, the FASB issued Accounting Standards Update No. 2009-5, “Fair Value Measurements and Disclosures (Topic 820)—Measuring Liabilities at Fair Value,” (“ASU 2009-5”), which amends ASC 820 to provide additional guidance to clarify the measurement of liabilities at fair value in the absence of observable market information. ASU 2009-5 is effective for the Company beginning October 1, 2009. The adoption of ASU 2009-5 did not have a material impact on the Company’s consolidated financial position, results of operations and cash flows.
| 2. | Reclassification |
As further discussed in Note 9 to the Consolidated Financial Statement, during 2009 the Company corrected an immaterial error in the accounting for its related party asset and, as such, has reclassified $19.7 million to inventory as of December 31, 2008.
Certain other prior year balances have been reclassified to conform to the current year’s presentation.
F-24
Table of Contents
M.D.C. HOLDINGS, INC.
Notes to Consolidated Financial Statements (Continued)
| 3. | Supplemental Disclosure of Cash Flow Information |
The table below sets forth supplemental disclosures of cash and non-cash financing activities (in thousands).
| Year Ended December 31, | |||||||||||
| 2009 | 2008 | 2007 | |||||||||
| Cash paid during the year for |
|||||||||||
| Interest, net of interest capitalized |
$ | 39,381 | $ | 18,356 | $ | 2,042 | |||||
| Income taxes |
$ | 15,216 | $ | 100 | $ | 10,466 | |||||
| Non-cash investing and financing activities |
|||||||||||
| Tax benefit of non-qualified stock options exercised, net of (reversals) of tax benefits of non-qualified stock options exercised in previous years |
$ | (4,250 | ) | $ | 3,561 | $ | (32,566 | ) | |||
| Accrual for purchase of property, plant and equipment |
$ | - | $ | 3,078 | $ | - | |||||
| Land acquisition financing arrangement |
$ | - | $ | 3,424 | $ | - | |||||
| Acquisition of community development district bonds |
$ | - | $ | - | $ | 8,878 | |||||
| 4. | Information on Business Segments |
The Company’s operating segments are defined as a component of an enterprise for which discrete financial information is available and is reviewed regularly by the chief operating decision-maker, or decision-making group, to evaluate performance and make operating decisions. The Company has identified its chief operating decision-makers (“CODMs”) as three key executives—the Chief Executive Officer, Chief Operating Officer and Chief Financial Officer.
The Company has identified each homebuilding subdivision as an operating segment as each homebuilding subdivision engages in business activities from which it earns revenue primarily from the sale of single-family detached homes, generally to first-time and first-time move-up homebuyers. Subdivisions in the reportable segments noted below have been aggregated because they are similar in the following regards: (1) economic characteristics; (2) housing products; (3) class of homebuyer; (4) regulatory environments; and (5) methods used to construct and sell homes. The Company’s homebuilding reportable segments are as follows:
| • | West (Arizona, California and Nevada) |
| • | Mountain (Colorado and Utah) |
| • | East (Delaware Valley, Virginia and Maryland) |
| • | Other Homebuilding (Florida, Illinois and Texas) |
During the 2009 first quarter, the Company changed the composition of its reportable segments by reclassifying the Delaware Valley market from the Other Homebuilding segment to the East segment. This reclassification resulted primarily from a change in the internal reporting structure of the Company. The Company has restated all prior period financial and operating measures of the Delaware Valley market to the East segment as a result of this reclassification in order to conform to the current year’s presentation.
The Company’s Financial Services and Other reportable segment consists of the operations of the following operating segments: (1) HomeAmerican Mortgage Corporation (“HomeAmerican”); (2) Allegiant; (3) StarAmerican; (4) American Home Insurance Agency, Inc.; and (5) American Home Title and Escrow Company. These operating segments have been aggregated into one reportable segment because they do not individually exceed 10 percent of: (1) consolidated revenue; (2) the greater of (A) the combined reported profit of all operating segments that did not
F-25
Table of Contents
M.D.C. HOLDINGS, INC.
Notes to Consolidated Financial Statements (Continued)
report a loss or (B) the positive value of the combined reported loss of all operating segments that reported losses; or (3) consolidated assets. The Company’s Corporate reportable segment incurs general and administrative expenses that are not identifiable specifically to another operating segment, earns interest income on its cash, cash equivalents and marketable securities, and incurs interest expense on its senior notes.
The following table summarizes revenue for each of the Company’s six reportable segments (in thousands). Inter-company adjustments noted in the revenue table below relate to Mortgage Loan Origination fees paid by the Company’s homebuilding subsidiaries to HomeAmerican on behalf of homebuyers.
| Year Ended December 31, | ||||||||||||
| 2009 | 2008 | 2007 | ||||||||||
| Revenue |
||||||||||||
| Homebuilding |
||||||||||||
| West |
$ | 407,157 | $ | 785,451 | $ | 1,725,589 | ||||||
| Mountain |
247,337 | 298,441 | 549,662 | |||||||||
| East |
176,386 | 245,245 | 398,882 | |||||||||
| Other Homebuilding |
54,086 | 109,431 | 173,207 | |||||||||
| Total Homebuilding |
884,966 | 1,438,568 | 2,847,340 | |||||||||
| Financial Services and Other |
28,318 | 33,681 | 55,543 | |||||||||
| Corporate |
10 | 643 | 2,761 | |||||||||
| Intercompany adjustments |
(14,991 | ) | (14,784 | ) | (19,985 | ) | ||||||
| Consolidated |
$ | 898,303 | $ | 1,458,108 | $ | 2,885,659 | ||||||
The following table summarizes (loss) income before income taxes for each of the Company’s six reportable segments (in thousands). Inter-company supervisory fees (“Supervisory Fees”), which are included in (loss) income before income taxes for each reportable segment in the table below, are charged by the Company’s Corporate segment to the homebuilding segments and the Financial Services and Other segment. Supervisory Fees represent costs incurred by the Company’s Corporate segment associated with certain resources that support the Company’s other reportable segments. Transfers, if any, between operating segments are recorded at cost.
| Year Ended December 31, | ||||||||||||
| 2009 | 2008 | 2007 | ||||||||||
| (Loss) Income Before Income Taxes |
||||||||||||
| Homebuilding |
||||||||||||
| West |
$ | 19,144 | $ | (157,103 | ) | $ | (621,774 | ) | ||||
| Mountain |
(15,686 | ) | (112,251 | ) | (11,395 | ) | ||||||
| East |
(9,789 | ) | (50,596 | ) | (43,990 | ) | ||||||
| Other Homebuilding |
(4,691 | ) | (18,725 | ) | (87,009 | ) | ||||||
| Total Homebuilding |
(11,022 | ) | (338,675 | ) | (764,168 | ) | ||||||
| Financial Services and Other |
5,953 | 11,678 | 23,062 | |||||||||
| Corporate |
(102,266 | ) | (55,138 | ) | (15,358 | ) | ||||||
| Consolidated |
$ | (107,335 | ) | $ | (382,135 | ) | $ | (756,464 | ) | |||
F-26
Table of Contents
M.D.C. HOLDINGS, INC.
Notes to Consolidated Financial Statements (Continued)
The following table summarizes total assets for each of the Company’s six reportable segments (in thousands). Inter-company adjustments noted in the table below relate to loans from the Company’s Financial Services and Other segment to its Corporate segment. The assets in the Company’s Corporate segment primarily include cash, cash equivalents and marketable securities.
| December 31, | ||||||||
| 2009 | 2008 | |||||||
| Homebuilding |
||||||||
| West |
$ | 190,204 | $ | 255,652 | ||||
| Mountain |
237,702 | 279,343 | ||||||
| East |
112,964 | 151,367 | ||||||
| Other Homebuilding |
26,778 | 38,179 | ||||||
| Total Homebuilding |
567,648 | 724,541 | ||||||
| Financial Services and Other |
133,957 | 139,569 | ||||||
| Corporate |
1,773,660 | 1,656,785 | ||||||
| Intercompany adjustments |
(45,957 | ) | (45,957 | ) | ||||
| Consolidated |
$ | 2,429,308 | $ | 2,474,938 | ||||
The following table summarizes depreciation and amortization of long-lived assets and amortization of deferred marketing costs for each of the Company’s six reportable segments (in thousands).
| Year Ended December 31, | |||||||||
| 2009 | 2008 | 2007 | |||||||
| Homebuilding |
|||||||||
| West |
$ | 5,753 | $ | 20,455 | $ | 28,362 | |||
| Mountain |
2,638 | 3,008 | 4,733 | ||||||
| East |
1,995 | 3,179 | 3,777 | ||||||
| Other Homebuilding |
405 | 1,549 | 4,951 | ||||||
| Total Homebuilding |
10,791 | 28,191 | 41,823 | ||||||
| Financial Services and Other |
758 | 1,030 | 462 | ||||||
| Corporate |
2,908 | 3,489 | 5,057 | ||||||
| Consolidated |
$ | 14,457 | $ | 32,710 | $ | 47,342 | |||
| 5. | Mortgage Loans Held-for-Sale, Net |
The following table sets forth the information relating to mortgage loans held-for-sale, net (in thousands).
| December 31, | ||||||
| 2009 | 2008 | |||||
| Mortgage loans |
||||||
| FHA |
$ | 27,831 | $ | 29,157 | ||
| Conventional |
19,624 | 24,988 | ||||
| FHA and VA |
14,860 | 14,459 | ||||
| Consolidated |
$ | 62,315 | $ | 68,604 | ||
F-27
Table of Contents
M.D.C. HOLDINGS, INC.
Notes to Consolidated Financial Statements (Continued)
Mortgage loans held-for-sale consist primarily of loans collateralized by first mortgages and deeds of trust due over periods of up to 40 years. The weighted-average effective yield on mortgage loans held in inventory was approximately 4.9% and 5.6% at December 31, 2009 and 2008, respectively.
| 6. | Supplemental Balance Sheet Information |
The following table sets forth information relating to accrued liabilities (in thousands).
| December 31, | ||||||
| 2009 | 2008 | |||||
| Accrued liabilities |
||||||
| FIN 48 income tax liability |
$ | 60,226 | $ | 63,404 | ||
| Warranty reserves |
59,022 | 89,318 | ||||
| Insurance reserves |
51,606 | 59,171 | ||||
| Land development and home construction accruals |
21,236 | 22,941 | ||||
| Accrued compensation and related expenses |
20,297 | 22,245 | ||||
| Accrued executive deferred compensation |
17,782 | 15,254 | ||||
| Legal reserves |
14,489 | 7,575 | ||||
| Accrued interest payable |
12,023 | 12,822 | ||||
| Loan loss reserves |
9,641 | 1,142 | ||||
| Customer and escrow deposits |
5,524 | 4,820 | ||||
| Other accrued liabilities |
20,123 | 34,133 | ||||
| Total accrued liabilities |
$ | 291,969 | $ | 332,825 | ||
| 7. | Deferred Compensation Retirement Plans |
During 2008, the Company entered into amended and restated employment agreements with Larry A. Mizel, Chairman of the Board and Chief Executive Officer, and David D. Mandarich, President and Chief Operating Officer. The modifications to the employment agreements included, among other things, a conversion of the annual retirement benefit from a salary based formula to a fixed amount. The annual retirement benefit in which Mr. Mizel and Mr. Mandarich currently are fully vested is $700,000 and $581,000, respectively. Under the provisions of the employment agreements, the annual retirement benefit will be increased to $1,000,000 for Mr. Mizel and $881,000 for Mr. Mandarich on December 31, 2010 and will be increased by an additional $333,333 with the completion of each succeeding two-year term up to an amount not to exceed $2,000,000 for Mr. Mizel and $1,881,000 for Mr. Mandarich. However, the annual retirement benefit will increase to $2,000,000 for Mr. Mizel and $1,881,000 for Mr. Mandarich prior to that date in the event of: (1) the executive’s death or total disability; (2) a termination by the Company without cause; or (3) the executive’s election to terminate his employment in the event of a change in control or material change in his employment.
The Company has accrued for the present value of the expected future retirement benefits to be paid to Mr. Mizel and Mr. Mandarich pursuant to their employment agreements with the Company. The Company’s accrued liabilities for the deferred compensation retirement plans are included as accrued executive deferred compensation in Note 6 to the Consolidated Financial Statements. The Company estimates the present value of the future retirement benefits based upon discount rates of high quality AA corporate bonds with a similar maturity as the estimated period of retirement benefits. During the years ended December 31, 2009 and 2008, the discount rates used in the Company’s
F-28
Table of Contents
M.D.C. HOLDINGS, INC.
Notes to Consolidated Financial Statements (Continued)
present value calculation were 5.75% and 6.0%, respectively. During the year ended December 31, 2009, the Company accrued $2.5 million of expense associated with the deferred compensation components of Mr. Mizel’s and Mr. Mandarich’s employment agreements. During the year ended December 31, 2008, the Company accrued $3.4 million, which included $1.9 million as a result of the modifications to the employment agreements. During the year ended December 31, 2007, the Company accrued $1.2 million associated with the employment agreements.
The Company sponsors a Section 401(k) defined contribution plan that is available to all of the Company’s eligible employees. For 2009, the Company made matching contributions on behalf of each participant in an amount equal to 50% of the first 4% of compensation the participant elected to defer and was funded with cash. During 2008 the matching contribution was an annual contribution funded with cash. However, prior to 2008 the matching contributions were annual contributions funded with a combination of cash and shares of MDC common stock. The matching contribution expense recognized by the Company for the years ending December 31, 2009, 2008 and 2007 was $0.5 million, $0.2 million and $0.6 million, respectively.
| 8. | Income Taxes |
The Company’s (benefit from) provision for income taxes for the years ended December 31, 2009, 2008 and 2007 consisted of the following (in thousands):
| Year Ended December 31, | ||||||||||||
| 2009 | 2008 | 2007 | ||||||||||
| Current tax (benefit) expense |
||||||||||||
| Federal |
$ | (132,014 | ) | $ | (154,931 | ) | $ | (78,385 | ) | |||
| State |
- | (7,224 | ) | (5,454 | ) | |||||||
| Total current |
(132,014 | ) | (162,155 | ) | (83,839 | ) | ||||||
| Deferred tax (benefit) expense |
||||||||||||
| Federal |
- | 155,066 | (25,358 | ) | ||||||||
| State |
- | 5,499 | (10,327 | ) | ||||||||
| Total deferred |
- | 160,565 | (35,685 | ) | ||||||||
| (Benefit from) provision for income taxes |
$ | (132,014 | ) | $ | (1,590 | ) | $ | (119,524 | ) | |||
The (benefit from) provision for income taxes differs from the amount that would be computed by applying the statutory federal income tax rate of 35% to income before income taxes as a result of the following (dollars in thousands).
| Year Ended December 31, | ||||||||||||
| 2009 | 2008 | 2007 | ||||||||||
| Tax (benefit) expense computed at federal statutory rate |
$ | (37,567 | ) | $ | (133,747 | ) | $ | (264,762 | ) | |||
| State income tax (benefit) expense, net of federal benefit |
(3,757 | ) | (11,846 | ) | (23,450 | ) | ||||||
| Permanent differences |
(2,720 | ) | 7,734 | 4,143 | ||||||||
| Change in state tax rate on temporary differences |
(2,795 | ) | - | - | ||||||||
| Liability for unrecognized tax benefits |
950 | 2,000 | 4,545 | |||||||||
| Change in valuation allowance |
(86,125 | ) | 134,269 | 160,000 | ||||||||
| (Benefit from) provision for income taxes |
$ | (132,014 | ) | $ | (1,590 | ) | $ | (119,524 | ) | |||
| Effective tax rate |
123.0% | 0.4% | 15.8% | |||||||||
F-29
Table of Contents
M.D.C. HOLDINGS, INC.
Notes to Consolidated Financial Statements (Continued)
During 2009, the Company generated a federal net operating loss which was carried back to the 2004 and 2005 tax years in accordance with the provisions contained in the newly enacted Worker, Homeownership, and Business Assistance Act of 2009, resulting in an approximate $142.6 million benefit from income taxes and expected federal income tax refund. Additionally, during 2009, the Company recorded a $9.7 million provision for income taxes related to an examination of the Company’s 2008 net operating loss carryback to 2006. The $9.7 million provision for income tax resulted from a 2006 alternative minimum tax liability associated with the Company’s 2008 net operating loss carryback, which should have been recorded during 2008. Finally, during 2009, the Company recorded a $1.0 million increase in its provision for income taxes, representing an increase in its liability for unrecognized tax benefits. This increase primarily related to additional interest and penalty accruals established for uncertain tax positions.
Deferred income taxes reflect the net tax effects of temporary differences between the carrying amounts of the assets and liabilities for financial reporting purposes and the amounts used for income tax purposes. The tax effects of significant temporary differences that give rise to the net deferred tax asset are as follows (in thousands).
| December 31, | ||||||||
| 2009 | 2008 | |||||||
| Deferred tax assets |
||||||||
| Asset impairment charges |
$ | 87,121 | $ | 197,670 | ||||
| State net operating loss carryforward |
41,845 | 22,426 | ||||||
| Warranty, litigation and other reserves |
38,789 | 45,619 | ||||||
| Stock-based compensation expense |
17,510 | 13,758 | ||||||
| Alternative minimum tax credit carryforward |
9,679 | - | ||||||
| Accrued liabilities |
7,921 | 9,661 | ||||||
| Inventory, additional costs capitalized for tax purposes |
7,317 | 5,951 | ||||||
| Federal net operating loss carryforward |
5,716 | 5,638 | ||||||
| Property, equipment and other assets, net |
2,622 | 3,826 | ||||||
| Charitable contribution on carryforward |
934 | 542 | ||||||
| Deferred revenue |
321 | 792 | ||||||
| Total deferred tax assets |
219,775 | 305,883 | ||||||
| Valuation allowance |
(208,144 | ) | (294,269 | ) | ||||
| Total deferred tax assets, net of valuation allowance |
11,631 | 11,614 | ||||||
| Deferred tax liabilities |
||||||||
| Deferred revenue |
5,820 | 6,024 | ||||||
| Accrued liabilities |
926 | 709 | ||||||
| Inventory, additional costs capitalized for financial statement purposes |
681 | 722 | ||||||
| Other, net |
4,204 | 4,159 | ||||||
| Total deferred tax liabilities |
11,631 | 11,614 | ||||||
| Net deferred tax asset |
$ | - | $ | - | ||||
At December 31, 2009, the Company had $41.8 million in tax effected state net operating loss carryforwards. These operating loss carryforwards, if unused, will begin to expire in 2012. Additionally, the Company had
F-30
Table of Contents
M.D.C. HOLDINGS, INC.
Notes to Consolidated Financial Statements (Continued)
$5.7 million in tax effected federal net operating loss carryforwards. These operating loss carryforwards, if unused, will expire in 2028.
The change in the Company’s valuation allowance between December 31, 2009 and 2008 was impacted by the ability to carry back $142.6 million of tax effected net operating losses due to the expanded NOL carryback provisions contained in the Worker, Homeownership, and Business Assistance Act of 2009, enacted on November 6, 2009. These expanded NOL carryback provisions allowed the Company to carry back its 2009 tax losses to prior years. Absent the new legislation, these 2009 tax losses would have been carried forward to offset any future taxable income. The Company’s future realization of its deferred tax assets ultimately depends on the existence of sufficient taxable income in the carryforward periods under the tax laws. The Company will continue analyzing, in subsequent reporting periods, the positive and negative evidence in determining the expected realization of its deferred tax assets.
The following table summarizes the Company’s liability associated with unrecognized tax benefits for the years ended December 31, 2009, 2008 and 2007 (in thousands):
| Year Ended December 31, | ||||||||||||
| 2009 | 2008 | 2007 | ||||||||||
| Gross unrecognized tax benefits at beginning of year |
$ | 59,129 | $ | 55,060 | $ | 18,739 | ||||||
| Increases related to prior year tax positions |
209 | 5,725 | 35,413 | |||||||||
| Decreases related to prior year tax positions |
(649 | ) | (893 | ) | (233 | ) | ||||||
| Increases related to current year tax positions |
1,085 | 362 | 1,824 | |||||||||
| Decreases related to current year tax positions |
(715 | ) | (630 | ) | - | |||||||
| Settlements with taxing authorities |
(6,222 | ) | - | - | ||||||||
| Lapse of applicable statute of limitations |
- | (495 | ) | (683 | ) | |||||||
| Gross unrecognized tax benefits at end of year |
$ | 52,837 | $ | 59,129 | $ | 55,060 | ||||||
The decrease in liabilities for unrecognized tax benefits from $59.1 million at December 31, 2008 to $52.8 million at December 31, 2009 is due primarily to an Arizona income tax settlement for tax years through 2006 and payments made to California related to various amended return filings. The Company has included the gross unrecognized tax benefits as a component of accrued liabilities in the Consolidated Balance Sheets.
The total liabilities associated with unrecognized tax benefits that, if recognized, would impact the effective tax rates were $7.6 million, $11.6 million and $13.6 million at December 31, 2009, 2008 and 2007, respectively.
The Company accrues interest and penalties associated with unrecognized tax benefits in income tax expense in the Consolidated Statements of Operations, and the corresponding liability in accrued liabilities in the Consolidated Balance Sheets. The expense for interest and penalties reflected in the Consolidated Statements of Operations for the year ended December 31, 2009 and 2008 was approximately $0.8 million and $1.9 million (interest net of related tax benefits), respectively. The corresponding liabilities in the Consolidated Balance Sheets were $12.5 million and $11.7 million at December 31, 2009 and 2008, respectively.
The Company has taken positions in certain taxing jurisdictions for which it is reasonably possible that the total amounts of unrecognized tax benefits may decrease within the next twelve months. The possible decrease could result from the finalization of the Company’s federal and various state income tax audits. The Company’s federal income tax audit concerns various deductions taken in its 2004 and 2005 federal income tax returns, while various state
F-31
Table of Contents
M.D.C. HOLDINGS, INC.
Notes to Consolidated Financial Statements (Continued)
income tax audits primarily are concerned with apportionment-related issues. The estimated range of the reasonably possible decrease is $40 million to $50 million.
In January 2010, the Company reached a settlement with the IRS on the audit of its 2004 and 2005 federal income tax returns, which settlement is subject to review by the Joint Committee on Taxation. The settlement is expected to result in a decrease of approximately $35 million in the Company’s gross unrecognized tax benefits. The settlement is also expected to result in an increase of approximately $13 million to additional paid-in-capital in the Company’s Consolidated Statements of Stockholders’ Equity and an income tax benefit of approximately $1 million in the Company’s Consolidated Statement of Operations. Finally, since the Company made a deposit of $35.6 million with the IRS during 2008 related to this audit, the settlement is expected to result in an increase of approximately $12 million to cash in the Company’s Consolidated Balance Sheets.
The Company and its subsidiaries file income tax returns in the U.S. federal jurisdiction and various state jurisdictions. The Company is subject to U.S. federal income tax examination for calendar tax years ending 2004 through 2009. Additionally, the Company is subject to various state income tax examinations for the 2001 through 2009 calendar tax years. The Company currently is under state income tax examination in the states of California, Virginia and Utah for various tax years.
| 9. | Related Party Transactions |
During 2007, the Company entered into a transaction (the “Transaction”) with the Villages at Castle Rock Metropolitan District No. 6 (the “District”). The District is a quasi-municipal corporation and political subdivision of the State of Colorado. The Board of Directors of the District currently is comprised of employees of MDC Holdings, Inc. (the “Company”). The District was formed to provide funding for certain land development costs associated with the construction of homes in the Company’s Cobblestone subdivision. Pursuant to the terms of the Transaction, the District sold to the Company approximately $22.5 million in Limited Tax General Obligation Capital Appreciation Bonds Series 2007 (the “2007 Bonds”) and a $1.6 million Limited Tax General Obligation Subordinate Bond (the “Subordinate Bond”) in exchange for title to approximately $28.6 million in land development improvements to the District. Because the sale of the inventory did not qualify for revenue recognition, at December 31, 2007, the Company reclassified $28.6 million out of inventory and recorded it as a related party asset on the Consolidated Balance Sheet.
During the year ended December 31, 2009, the Company determined that, as of December 2007, the Company should have recorded the 2007 Bonds and Subordinate Bond at their estimated fair value. The Company determined the estimated the fair value of the 2007 Bonds and Subordinate Bond based upon discounted cash flows was $8.9 million as of December 2007. The Company reviewed the impact of this error on the prior periods in accordance with SEC Staff Accounting Bulletin No. 108, “Materiality,” and determined that the error was not material to the prior periods. However, the Company has corrected the December 2008 Consolidated Balance Sheet by increasing land and land under development and decreased related party asset by $19.7 million and by recording a $0.4 million increase to home cost of sales associated with homes that closed during 2008.
At December 31, 2009, the Company updated its evaluation of the estimated fair value of the 2007 Bonds and Subordinate Bond. Through this evaluation, the Company determined there was a decrease in the estimated cash flows from such assets and, as a result, recorded a $1.0 million other-than-temporary-impairment associated with the 2007 Bonds.
F-32
Table of Contents
M.D.C. HOLDINGS, INC.
Notes to Consolidated Financial Statements (Continued)
During 2009, the Company committed to contribute $1.0 million in cash to the MDC/Richmond American Homes Foundation (the “Foundation”), a Delaware non-profit corporation that was incorporated on September 30, 1999. During 2007, the Company committed to contribute $1.0 million to the Foundation in the form of shares of MDC common stock. During the year ended December 31, 2008, the Company did not make a contribution to the Foundation.
The Foundation is a non-profit organization operated exclusively for charitable, educational and other purposes beneficial to social welfare within the meaning of Section 501(c)(3) of the Internal Revenue Code. The following Directors, former Director and/or officers of the Company are the trustees of the Foundation at December 31, 2009, all of whom serve without compensation:
| Name |
Title | |
| Larry A. Mizel |
Trustee, President and Assistant Secretary | |
| Steven J. Borick |
Trustee | |
| Gilbert Goldstein |
Trustee | |
| David D. Mandarich |
Trustee | |
| 10. | Lines of Credit |
Homebuilding. The Company’s homebuilding line of credit (“Homebuilding Line”) is an unsecured revolving line of credit with a group of lenders for support of our homebuilding segments which has a maturity date of March 21, 2011. Effective September 16, 2009, the aggregate commitment under the Homebuilding Line was reduced from $800 million to $100 million (the “Commitment”) and the aggregate sublimit for letters of credit was reduced from $300 million to $100 million. The Commitment and sublimit for letters of credit were reduced as the Company believes that it does not need the full borrowing capacity of the Homebuilding Line to meet its liquidity needs and that it will be able to fund its homebuilding operations through its existing cash and investment resources.
Interest rates for borrowings on the Homebuilding Line, if any, are determined by reference to an applicable London Interbank Offered Rate (“LIBOR”) or to an alternate base rate, each with a margin that is determined based on changes in our credit rating and leverage ratio. At December 31, 2009 and 2008, there were no borrowings under the Homebuilding Line and there were $16.7 million and $26.6 million, respectively, in letters of credit outstanding as of such dates. The outstanding letters of credit reduce the amount that is available to be borrowed under the Commitment. However, the outstanding letters of credit do not impact the calculation of the Company’s borrowing capacity under the permitted leverage ratio. Additionally, while the Company’s borrowing capacity may be reduced under the permitted leverage ratio, this reduction does not impact its ability to issue letters of credit up to the limits specified in the Homebuilding Line.
Mortgage Lending. As of December 31, 2009 HomeAmerican had, and continues to have, a Master Repurchase Agreement (the “Mortgage Repurchase Facility”) with U.S. Bank National Association (“USBNA”) and the other banks that are parties to the Mortgage Repurchase Facility (the “Buyers”). The Mortgage Repurchase Facility provides liquidity to HomeAmerican by providing for the sale of eligible mortgage loans to USBNA (as agent for the Buyers) with an agreement by HomeAmerican to repurchase the mortgage loans at a future date. Until such mortgage loans are transferred back to HomeAmerican, the documents relating to such loans are held by USBNA, as agent for the Buyers and as custodian, pursuant to the Custody Agreement (“Custody Agreement”), dated as of November 12, 2008, by and between HomeAmerican and USBNA. The Mortgage Repurchase Facility has a maximum aggregate commitment of
F-33
Table of Contents
M.D.C. HOLDINGS, INC.
Notes to Consolidated Financial Statements (Continued)
$70 million and includes an accordion feature that permits the maximum aggregate commitment to be increased to $150 million, subject to the availability of additional commitments. The Mortgage Repurchase Facility expires on October 28, 2010. Advances under the Mortgage Repurchase Facility carry a Pricing Rate based on the LIBOR Rate plus the LIBOR Margin or, at HomeAmerican’s option, a Balance Funded Rate (the foregoing terms are defined in the Mortgage Repurchase Facility). At December 31, 2009 and 2008, the Company had $29.1 million and $34.9 million, respectively, of mortgage loans that it was obligated to repurchase under the Mortgage Repurchase Facility.
The Mortgage Repurchase Facility is accounted for as a debt financing arrangement. Accordingly, at December 31, 2009 and 2008, amounts advanced under the Mortgage Repurchase Facility, which were used to finance mortgage loan originations, have been reported under the mortgage repurchase facility in the Consolidated Balance Sheets.
The Mortgage Repurchase Facility replaced HomeAmerican’s Fourth Amended and Restated Warehousing Credit Agreement, dated as of September 5, 2006, as amended on November 2, 2007 and May 23, 2008, with USBNA and the other banks that were parties to that facility.
General. The agreements for the Company’s Homebuilding Line and Mortgage Repurchase Facility require compliance with certain representations, warranties and covenants. The Company believes that it is in compliance with these representations, warranties and covenants and the Company is not aware of any covenant violations.
The Homebuilding Line agreement covenants include a consolidated tangible net worth test. Under this test, the Company’s Consolidated Tangible Net Worth (as defined) must not be less than: (1) $850 million; plus (2) 50% of consolidated net income, as defined, earned by the Company and the Guarantors (as defined) after September 30, 2008; plus (3) 50% of the net proceeds or other consideration received by the Company for the issuance of capital stock after September 30, 2008; minus (4) the lesser of (A) the aggregate amount paid by the Company after September 30, 2008 to repurchase its common stock and (B) $300 million. Failure to satisfy this covenant test would not result in a default, but would result in a scheduled reduction in the amount of the Commitment.
In addition to the foregoing covenants, the Homebuilding Line agreement specifies that Consolidated Tangible Net Worth must not be less than the sum of: (1) $650 million; (2) 50% of the quarterly consolidated net income of Borrower and the Guarantors earned after September 30, 2008; and (3) 50% of the net proceeds or other consideration received for the issuance of capital stock after September 30, 2008. Failure to satisfy this covenant could result in a termination of the facility.
The Homebuilding line also contains a cash flow/liquidity test. Under this test, if the Company fails to maintain for any fiscal quarter ending on and after December 31, 2008 an Interest Coverage Ratio (as defined) equal to or greater than 1.5 to 1.0 for the period of four consecutive fiscal quarters, then as of the end of such fiscal quarter and as of the end of all fiscal quarters thereafter until the Interest Coverage Ratio is greater than or equal to 1.5 to 1.0, the Company would have to maintain either (1) a ratio of (A) Adjusted Cash Flow From Operations (as defined) to (B) Consolidated Interest Incurred (as defined) of greater than or equal to 1.5 to 1.0 or (2) a sum of (A) Borrowing Base Availability (as defined) plus (B) Unrestricted Cash (as defined which includes, among other things, cash, cash equivalents, marketable securities and unsettled trades), to the extent such Unrestricted Cash is not included in calculating Borrowing Base Availability, less (C) principal payments due on Consolidated Indebtedness (as defined) within the next succeeding four fiscal quarters, equal to or greater than $500 million. The Company’s compliance with the cash flow/liquidity test would be measured on a quarterly basis and failure to satisfy this test would not result in a default but would result in a scheduled reduction in the amount of the facility.
F-34
Table of Contents
M.D.C. HOLDINGS, INC.
Notes to Consolidated Financial Statements (Continued)
Additionally, pursuant to the Homebuilding Line, should there be a defaulting lender, the Company is required to: (i) prepay swing line loans or cash collateralize the defaulting lender’s share of the swing line loans and (ii) cash collateralize the defaulting lender’s share of the outstanding facility letters of credit.
The Mortgage Repurchase Facility contains various representations, warranties and affirmative and negative covenants customary for agreements of this type. The negative covenants include, among others, (i) an Adjusted Tangible Net Worth (as defined) requirement, (ii) a minimum Adjusted Tangible Net Worth Ratio, (iii) an Adjusted Net Income requirement, and (iv) a minimum Liquidity (as defined) requirement (the foregoing terms are defined in the Mortgage Repurchase Facility). Adjusted Tangible Net Worth means the sum of (a) all assets of HomeAmerican less (b) the sum of (i) all Debt and all Contingent Indebtedness of HomeAmerican, (ii) all assets of HomeAmerican that would be classified as intangible assets under generally accepted accounting principles, and (iii) receivables from Affiliates. HomeAmerican’s Adjusted Tangible Net Worth Ratio is the ratio of HomeAmerican’s total liabilities (excluding permitted letters of credit) to the Adjusted Tangible Net Worth. HomeAmerican’s Adjusted Net Income is a rolling twelve consecutive months of net income for HomeAmerican. HomeAmerican’s Liquidity is defined as its unrestricted cash and Cash Equivalents plus the amount by which the aggregate Purchase Price of all Purchased Mortgage Loans at such time exceeds the aggregate Purchase Price outstanding for all Open Transactions at such time (the foregoing terms are defined in the Mortgage Repurchase Facility).
Failure to meet the foregoing negative covenants would constitute an event of default. In the event of default, USBNA may, at its option, declare the Repurchase Date for any or all Transactions to be deemed immediately to occur. Upon such event of default, and if USBNA exercises its right to terminate any Transactions, then (a) HomeAmerican’s obligation to repurchase all Purchased Loans in such Transactions will become immediately due and payable; (b) the Repurchase Price shall be increased by the aggregate amount obtained by daily multiplication of (i) the greater of the Pricing Rate for such Transactions and the Default Pricing Rate by (ii) the Purchase Price for the Transactions as of the Repurchase Date, (c) all Income paid after the event of default will be retained by USBNA and applied to the aggregate unpaid Repurchase Price owed by HomeAmerican and (d) HomeAmerican shall deliver any documents relating to Purchased Loans subject to such Transactions to USBNA. Upon the occurrence of default, USBNA may (a) sell any or all Purchased Loans subject to such Transactions on a servicing released or servicing retained basis and apply the proceeds to the unpaid amounts owed by HomeAmerican, (b) give HomeAmerican credit for such Purchased Loans in an amount equal to the Market Value and apply such credit to the unpaid amounts owed by HomeAmerican, (c) replace HomeAmerican as Servicer, (d) exercise its right under the Mortgage Repurchase Facility with respect to the Income Account and Escrow Account, and (e) with notice to HomeAmerican, declare the Termination Date to have occurred. The foregoing terms are defined in the Mortgage Repurchase Facility.
| 11. | Senior Notes |
In December 2002, the Company completed a public offering of $150 million principal amount of 7% senior notes due December 2012 (the “7% Senior Notes”) at a discount, with an effective yield of 7.30%. Interest is due and payable on June 1 and December 15 of each year until maturity. The Company is not required to make any principal payments and the 7% Senior Notes are fully due in December 2012. The 7% Senior Notes are guaranteed by certain of the Company’s subsidiaries and may be redeemed, at the election of the Company, in whole at any time or in part from time to time, at a redemption price equal to the greater of (1) 100% of their principal amount; or (2) the present value of the remaining scheduled payments on the notes being redeemed on the redemption date discounted on a semiannual basis at the Treasury Rate plus 0.45%, plus, in each case, accrued and unpaid interest.
F-35
Table of Contents
M.D.C. HOLDINGS, INC.
Notes to Consolidated Financial Statements (Continued)
In May 2003, the Company completed a public offering of $150 million principal amount of 5 1/2% senior notes due May 2013 (the “5 1/2% Senior Notes”) at a discount, with an effective yield of 5.74%. In December 2003, the Company issued an additional $200 million principal amount of 5 1/2% Senior Notes at a premium, with an effective yield of 5.57%. The 5 1/2% Senior Notes have interest due and payable on May 15 and November 15 of each year until maturity. The Company is not required to make any principal payments and the 5 1/ 2% Senior Notes are fully due in May 2013. The 5 1/ 2% Senior Notes are guaranteed by certain of the Company’s subsidiaries and may be redeemed, at the election of the Company, in whole at any time or in part from time to time, at a redemption price equal to the greater of (1) 100% of their principal amount; or (2) the present value of the remaining scheduled payments on the notes being redeemed on the redemption date discounted on a semiannual basis at the Treasury Rate plus 0.30%, plus, in each case, accrued and unpaid interest.
In December 2004, the Company completed a public offering of $250 million principal amount of 5 3/ 8% medium-term senior notes due December 2014 (the “5 3/ 8% Medium-Term Senior Notes”) at a discount, with an effective yield of 5.55%. The 5 3/ 8 % Medium-Term Senior Notes have interest due and payable on June 15 and December 15 of each year until maturity. The Company is not required to make any principal payments until the 5 3/8% Medium-Term Senior Notes are fully due in December 2014. The 5 3/8% Medium-Term Senior Notes are guaranteed by certain of the Company’s subsidiaries and may be redeemed, at the election of the Company, in whole at any time or in part from time to time, at a redemption price equal to the greater of (1) 100% of their principal amount; or (2) the present value of the remaining scheduled payments on the notes being redeemed on the redemption date discounted on a semiannual basis at the Treasury Rate plus 0.20%, plus, in each case, accrued and unpaid interest.
In July 2005, the Company completed a public offering of $250 million principal amount of 5 3/8% medium-term senior notes due July 2015 (the “2015 Medium-Term Senior Notes”) at a discount, with an effective yield of 5.50%. The 2015 Medium-Term Senior Notes have interest due and payable on January 1 and July 1 of each year until maturity. The Company is not required to make any principal payments until the 2015 Medium-Term Senior Notes are fully due in July 2015. The 2015 Medium-Term Senior Notes are guaranteed by certain of the Company’s subsidiaries and may be redeemed, at the election of the Company, in whole at any time or in part from time to time, at a redemption price equal to the greater of (1) 100% of their principal amount; or (2) the present value of the remaining scheduled payments on the notes being redeemed discounted on a semiannual basis at the Treasury Rate plus 0.25%, plus, in each case, accrued and unpaid interest.
In January 2010, the Company issued $250 million of 5 5/8% senior notes as more fully described in Note 18 to the Consolidated Financial Statements.
The Company’s total debt obligations relating to senior notes at December 31, 2009 and 2008 are as follows (in thousands).
| December 31, | ||||||
| 2009 | 2008 | |||||
| 7% Senior Notes due 2012 |
$ | 149,460 | $ | 149,282 | ||
| 5 1/2% Senior Notes due 2013 |
349,642 | 349,543 | ||||
| 5 3/8% Medium-Term Senior Notes due 2014 |
249,102 | 248,947 | ||||
| 5 3/8% Medium-Term Senior Notes due 2015 |
249,787 | 249,755 | ||||
| Total Senior Notes, net |
$ | 997,991 | $ | 997,527 | ||
F-36
Table of Contents
M.D.C. HOLDINGS, INC.
Notes to Consolidated Financial Statements (Continued)
The Company’s senior notes are not secured and, while the senior notes indentures contain some restrictions on secured debt and other transactions, they do not contain financial covenants. The senior notes are fully and unconditionally guaranteed on an unsecured basis, jointly and severally, by most of the Company’s homebuilding segment subsidiaries. The Company believes that it is in compliance with these representations, warranties and covenants, and the Company is not aware of any covenant violations.
| 12. | Commitments and Contingencies |
Legal Reserves. Litigation has been filed by homeowners in West Virginia against MDC, its subsidiary Richmond American Homes of West Virginia, Inc. (“RAH West Virginia”) and various subcontractors alleging a failure to install functional passive radon mitigation systems in their homes. The plaintiffs seek compensatory and punitive damages and medical monitoring costs for alleged negligent construction, failure to warn, breach of warranty or contract, breach of implied warranty of habitability, fraud, and intentional and negligent infliction of emotional distress based upon alleged exposure to radon gas. The litigation consists of the following actions:
Joy, et al. v. Richmond American Homes of West Virginia, Inc., et al., No. 08-C-204, Circuit Court of Jefferson County, West Virginia (“Joy”). This action was filed on May 16, 2008, by sixty-six plaintiffs from sixteen households. The Company and RAH West Virginia have answered and asserted claims against the subcontractors for contractual and implied indemnity and contribution. The action is currently set for trial in April 2010.
Bauer, et al. v. Richmond American Homes of West Virginia, Inc., et al., No. 08-C-431, Circuit Court of Jefferson County, West Virginia (“Bauer”). This action was filed on October 24, 2008, by eighty-six plaintiffs from twenty-one households. This action has been consolidated for discovery and pre-trial proceedings with the Joy action.
Saliba, et al. v. Richmond American Homes of West Virginia, Inc., et al., No. 08-C-447, Circuit Court, Jefferson County, West Virginia (“Saliba”). This action was filed on November 7, 2008, by thirty-five plaintiffs from nine households. This action has been consolidated for discovery and pre-trial proceedings with the Joy action.
By orders dated November 4 and 18, 2009, the court granted the plaintiffs’ motion for default judgment against the Company and RAH West Virginia, motion to strike the defendants’ answers and motion for sanctions. The damages are to be determined in a subsequent jury trial. The damages trial in the Joy case has been scheduled for April 2010. At this time, MDC and RAH West Virginia are unsure whether the court’s action pertains to only the Joy case or also to the Bauer and Saliba cases.
On December 4, 2009, the court entered an order amending its prior order, which had restricted the parties from making statements elaborating on the facts or theories of the cases. The amended order now permits disclosures required by or in accordance with law.
On December 7, 2009, MDC and RAH West Virginia filed with the West Virginia Supreme Court of Appeals a motion seeking to stay the proceedings and a petition for writ of prohibition to vacate the default judgment. On January 15, 2010, the West Virginia Supreme Court of Appeals entered an order agreeing to consider the request to vacate the default judgment. The hearing to consider this request is set to occur on March 31, 2010. Pursuant to the rules of the Supreme Court, the underlying proceedings in the Circuit Court have been stayed pending the hearing by the Supreme Court.
F-37
Table of Contents
M.D.C. HOLDINGS, INC.
Notes to Consolidated Financial Statements (Continued)
MDC and RAH West Virginia believe that they have meritorious defenses to each of the lawsuits and intend to vigorously defend the actions.
Additionally, in the normal course of business, the Company is a defendant in claims primarily relating to construction defects, product liability and personal injury claims. These claims seek relief from the Company under various theories, including breach of implied and express warranty, negligence, strict liability, misrepresentation and violation of consumer protection statutes. The Company has accrued for losses that may be incurred with respect to legal claims based upon information provided to it by its legal counsel, including counsels’ on-going evaluation of the merits of the claims and defenses. Due to uncertainties in the estimation process, actual results could vary from those accruals. At December 31, 2009 and 2008, the Company had legal accruals of $14.5 million and $7.6 million, respectively.
Mortgage Loan Loss Reserves. In the normal course of business, the Company establishes reserves for potential losses associated with HomeAmerican’s loan sale agreements pursuant to which mortgage loans are sold to third-parties. These reserves are created to address repurchase and indemnity claims by third-party purchasers of the mortgage loans, which claims arise primarily out of allegations of homebuyer fraud at the time of origination of the loan. These reserves are based upon, among other matters: (1) pending claims received from third-party purchasers associated with previously sold mortgage loans; (2) a current assessment of the potential exposure associated with future claims of homebuyer fraud in mortgage loans originated in prior periods loans; and (3) historical loss experience. During 2009, mortgage performance continued to deteriorate as evidenced by year-over-year increases in delinquency rates. Additionally, foreclosures and foreclosures in process have increased substantially. Similarly, HomeAmerican has experienced an increase in the number and magnitude of claims to repurchase previously sold mortgage loans. Accordingly, the Company increased its estimated mortgage loan loss reserve by $9.7 million during the year ended December 31, 2009 and made $1.2 million in payments associated with its mortgage loan loss reserve. The Company’s total expenses and cash payments were not material during the years ended December 31, 2008 and 2007. The Company’s mortgage loan reserves are reflected as a component of accrued liabilities in the Consolidated Balance Sheets, and the associated expenses are included as a component of general and administrative expenses in the Consolidated Statements of Operations.
Bonds and Letters of Credit. The Company often is required to obtain bonds and letters of credit in support of its obligations for land development and subdivision improvements, homeowner association dues and start-up expenses, warranty work, contractor license fees and earnest money deposits. At December 31, 2009, the Company had issued and outstanding performance bonds and letters of credit totaling $118.4 million and $21.4 million, respectively, including $4.2 million in letters of credit issued by HomeAmerican. In the event any such bonds or letters of credit issued by third parties are called, MDC could be obligated to reimburse the issuer of the bond or letter of credit.
Risks and Uncertainties. The Company is subject to risks and uncertainties common to the homebuilding industry, including (1) cyclical markets sensitive to changes in general and local economic conditions; (2) volatility of interest rates, which affects homebuilding demand and may affect credit availability; (3) seasonal nature of the business due to weather-related factors; (4) significant fluctuations in the price of building materials, land and subcontract labor; (5) counter-party non-performance risk associated with performance bonds; (6) competition; (7) the availability and cost of performance bonds and insurance covering risks associated with the Company’s business; (8) slow growth initiatives; (9) building moratoria; (10) governmental regulation, including the interpretation of tax, labor and environmental laws; and (11) changes in consumer confidence and preferences.
F-38
Table of Contents
M.D.C. HOLDINGS, INC.
Notes to Consolidated Financial Statements (Continued)
To reduce exposure to fluctuations in interest rates, HomeAmerican makes commitments to originate (buy) and sell mortgage loans and mortgage-backed securities. The Company had $51.7 million in mortgage loans under interest rate lock commitments at an average interest rate of 4.65%. In addition, the Company had $62.3 million and $68.6 million of mortgage loans held-for-sale at December 31, 2009 and 2008, respectively.
Operating Leases. The Company has non-cancelable operating leases primarily associated with its office facilities. Rent expense under cancelable and non-cancelable operating leases totaled $9.8 million, $13.1 million and $21.3 million in 2009, 2008 and 2007, respectively. The table below shows the future minimum payments under non-cancelable operating leases at December 31, 2009 (in thousands)
| 2010 |
$ | 5,958 | |
| 2011 |
4,159 | ||
| 2012 |
3,988 | ||
| 2013 |
3,874 | ||
| 2014 |
2,894 | ||
| Thereafter |
4,965 | ||
| Total |
$ | 25,838 | |
| 13. | Stockholders’ Equity |
Common Stock Repurchase Program. At December 31, 2009, the Company was authorized to repurchase up to 4,000,000 shares of its common stock. The Company did not repurchase any shares of its common stock during the years ended December 31, 2009, 2008 or 2007. At December 31, 2009 and 2008, the Company held 53,000 and 49,000 shares of treasury stock with average costs of $12.48 and $13.45 per share, respectively.
| 14. | Equity Incentive Plans |
A summary of the Company’s equity incentive plans follows.
Effective March 2001, the Company adopted the M.D.C. Holdings, Inc. 2001 Equity Incentive Plan (the “Equity Incentive Plan”). A total of 10,204,769 shares of MDC common stock are reserved for issuance under the Equity Incentive Plan, of which 4,916,644 and 3,680,115 were available for grant as of December 31, 2009 and 2008, respectively. The Equity Incentive Plan provides for the grant of non-qualified stock options, incentive stock options, stock appreciation rights, restricted stock, stock units and other stock grants to employees of the Company. Stock options granted under the Equity Incentive Plan have an exercise price that is at least equal to the fair market value of the Company’s common stock on the date the stock option is granted. Non-qualified option awards generally vest over periods of up to seven years and expire in ten years. Restricted stock awards are granted with vesting terms of up to five years and in some circumstances, have additional transferability restrictions for two years after vesting. During the years ended December 31, 2009 and 2008, the Company granted options to purchase 523,333 and 843,894 shares of MDC common stock, respectively, and awarded 166,941 and 74,907 shares of restricted stock, respectively, under the Equity Incentive Plan, which vest over periods up to five years. In 2007, the Company granted options to purchase 460,000 shares of MDC common stock, and awarded 276,165 shares of restricted stock under the Equity Incentive Plan, which vest over periods up to five years. The Equity Incentive Plan will terminate on March 26, 2011. Stock option grants and restricted stock awards outstanding at the time of the plan termination may continue to be exercised, or become free of restrictions, in accordance with their terms.
F-39
Table of Contents
M.D.C. HOLDINGS, INC.
Notes to Consolidated Financial Statements (Continued)
Director Equity Incentive Plan. Effective March 2001, the Company adopted the M.D.C. Holdings, Inc. Stock Option Plan for Non-Employee Directors (the “Director Stock Option Plan”). Under the Director Stock Option Plan, non-employee directors of the Company are granted non-qualified stock options. At December 31, 2009, a total of 1,854,526 shares of MDC common stock are reserved for issuance under the Director Stock Option Plan, of which 400,367 and 381,774 were available for grant as of December 31, 2009 and 2008, respectively. Pursuant to the Director Stock Option Plan, on October 1 of each year, each non-employee director of the Company is granted options to purchase 25,000 shares of MDC common stock. Each option granted under the Director Stock Option Plan vests immediately and expires ten years from the date of grant. The option exercise price must be equal to the fair market value (as defined in the plan) of the Company’s common stock on the date of grant of the option. In October 2003, the Director Stock Option Plan, which was approved by the shareowners on May 21, 2001, was amended to terminate on May 21, 2011. Stock options outstanding at the time of plan termination may continue to be exercised in accordance with their terms.
| 15. | Stock-Based Compensation |
Determining Fair Value of Share-Based Payment Awards. The Company examines its historical pattern of option exercises in an effort to determine if there are any discernable activity patterns based on certain employee and non-employee populations. Based upon this evaluation, the Company identified three distinct populations: (1) executives consisting of the Company’s Chief Executive Officer, Chief Operating Officer, Chief Financial Officer and General Counsel (collectively, the “Executives”); (2) Non-Executive employees (“Non-Executives”); and (3) non-employee members of the Company’s board of directors (“Directors”). Accordingly, during 2009, 2008 and 2007, the Company used separate Black-Scholes option pricing model assumptions for each of the aforementioned employee and non-employee populations. The fair values for stock options granted for the years ended December 31, 2009, 2008 and 2007 were estimated using the Black-Scholes option pricing model with the following weighted-average assumptions.
| Year Ended December 31, | ||||||
| 2009 | 2008 | 2007 | ||||
| Weighted-average expected lives of options |
6.9 yrs. | 6.6 yrs. | 7.5 yrs. | |||
| Expected volatility |
43.8% | 40.8% | 38.1% | |||
| Risk free interest rate |
2.1% | 2.4% | 4.1% | |||
| Dividend yield rate |
3.2% | 3.0% | 2.6% | |||
Based on calculations using the Black-Scholes option pricing model, the weighted-average grant date fair values of stock options granted during 2009, 2008 and 2007 were $10.87, $10.42 and $12.98, respectively.
The expected life of employee stock options represents the weighted-average period for which the stock options are expected to remain outstanding and are derived primarily from historical exercise patterns. The expected volatility is based on the historical volatility in the price of the Company’s common stock over the most recent period commensurate with the estimated expected life of the Company’s stock options, adjusted for the impact of unusual fluctuations not reasonably expected to recur and other relevant factors. The risk-free interest rate assumption is determined based upon observed interest rates appropriate for the expected term of the Company’s employee stock options. The dividend yield assumption is based on the Company’s history of dividend payouts.
An annual forfeiture rate is estimated at the time of grant for all share-based payment awards, and revised, if necessary, in subsequent periods if the actual forfeiture rate differs from the Company’s estimate. The Company
F-40
Table of Contents
M.D.C. HOLDINGS, INC.
Notes to Consolidated Financial Statements (Continued)
estimated the annual forfeiture rate to be approximately 10% to 25% for share-based payment awards granted to Non-Executives. Prior to 2008, the Company estimated the annual forfeiture rate to be 0% for share-based payment awards granted to its Executives based on the terms of their awards, as well as historical forfeiture experience. During the 2008 first quarter and based on the terms of the agreement between the Company and its former CFO, which was filed with the SEC on April 11, 2008, the Company revised its estimated forfeitures associated with share-based awards granted to its then CFO. As a result, during the year ended December 31, 2008, the Company reversed approximately $1.4 million of stock-based compensation expense recorded in previous periods for share-based payment awards that are no longer expected to vest. The Company continues to use an estimated forfeiture rate of 0% for share-based payment awards granted to Executives and Directors, based on the terms of their awards.
Stock Option Award Activity. Stock option activity under the Company’s option plans at December 31, 2009 and changes during the year ended December 31, 2009 were as follows.
| Number of Shares |
Weighted- Average Exercise Price |
Weighted- Average Remaining Contractual Life (in years) |
Aggregate Intrinsic Value (in thousands) | ||||||||
| Outstanding at December 31, 2008 |
5,212,891 | $ | 42.21 | ||||||||
| Granted - at fair market value |
493,333 | $ | 31.45 | ||||||||
| Granted - above fair market value |
180,000 | $ | 34.14 | ||||||||
| Exercised |
(187,424 | ) | $ | 19.33 | |||||||
| Cancelled |
(201,431 | ) | $ | 48.50 | |||||||
| Outstanding at December 31, 2009 |
5,497,369 | $ | 41.53 | 5.99 | $ | 13,117 | |||||
In April 2008, the Company cancelled 267,230 stock option awards granted to Non-Executives that were outstanding and out-of-the-money on April 29, 2008. Concurrently, the Company granted new stock option awards that had exercise prices equal to the fair market value of the Company’s common stock on April 29, 2008. The impact to the Company’s Consolidated Statements of Operations for the year ended December 31, 2008 as a result of this modification was not material.
The following table summarizes information associated with stock options granted to Executives, Non-Executives and Directors that are vested at December 31, 2009, as well as stock options granted but unvested at December 31, 2009 that the Company expects will vest in future reporting periods.
| Vested and Expected to Vest at December 31, 2009 | ||||||||||
| Number of Shares |
Weighted- Average Exercise Price |
Weighted- Average Remaining Contractual Life (in years) |
Aggregate Intrinsic Value (in thousands) | |||||||
| Executives |
4,200,913 | $ | 40.67 | |||||||
| Directors |
891,162 | $ | 46.65 | |||||||
| Non-Executives |
308,906 | $ | 40.11 | |||||||
| Total |
5,400,981 | $ | 41.63 | 5.95 | $ | 13,025 | ||||
F-41
Table of Contents
M.D.C. HOLDINGS, INC.
Notes to Consolidated Financial Statements (Continued)
The following table summarizes information associated with stock options granted to Executives, Non-Executives and Directors that are exercisable at December 31, 2009.
| Exercisable at December 31, 2009 | ||||||||||
| Number of Shares |
Weighted- Average Exercise Price |
Weighted- Average Remaining Contractual Life (in years) |
Aggregate Intrinsic Value (in thousands) | |||||||
| Executives |
2,181,391 | $ | 38.55 | |||||||
| Directors |
891,162 | $ | 46.65 | |||||||
| Non-Executives |
191,099 | $ | 42.70 | |||||||
| Total |
3,263,652 | $ | 41.00 | 4.68 | $ | 12,467 | ||||
The aggregate intrinsic values in the tables above represent the total pre-tax intrinsic values (the difference between the closing price of MDC’s common stock on the last trading day of fiscal 2009 and the exercise price, multiplied by the number of in-the-money stock option shares) that would have been received by the option holders had all outstanding stock options been exercised on December 31, 2009. The total intrinsic value of options exercised during the year ended December 31, 2009, 2008 and 2007 was $2.8 million, $10.1 million and $18.0 million, respectively.
The following table summarizes information associated with outstanding and exercisable stock options at December 31, 2009.
| Options Outstanding | Options Exercisable | |||||||||||
| Range of Exercise Price |
Number Outstanding |
Weighted- Average Remaining Contractual Life (in years) |
Weighted- Average Exercise Price |
Number Exercisable |
Weighted- Average Exercise Price | |||||||
| $ 15.84 - $ 23.77 |
1,096,287 | 2.30 | $ | 19.63 | 1,091,287 | $ | 19.62 | |||||
| $ 23.78 - $ 39.61 |
1,556,786 | 9.22 | $ | 32.96 | 289,703 | $ | 34.52 | |||||
| $ 39.62 - $ 47.53 |
1,334,796 | 5.49 | $ | 43.93 | 965,962 | $ | 44.15 | |||||
| $ 47.54 - $ 63.38 |
892,500 | 6.06 | $ | 60.41 | 484,500 | $ | 60.39 | |||||
| $ 63.39 - $ 71.30 |
492,000 | 5.30 | $ | 67.17 | 307,200 | $ | 67.21 | |||||
| $ 71.31 - $ 78.89 |
125,000 | 5.76 | $ | 78.89 | 125,000 | $ | 78.89 | |||||
| Total |
5,497,369 | 5.99 | $ | 41.53 | 3,263,652 | $ | 41.00 | |||||
Total stock-based compensation expense relating to stock options granted by the Company was $11.3 million, $11.1 million and $11.3 million for the years ended December 31, 2009, 2008 and 2007, respectively. As of December 31, 2009, $25.5 million of total unrecognized compensation cost related to stock options is expected to be recognized as an expense by the Company in the future over a weighted-average period of approximately 3 years.
The Company received cash proceeds from the exercise of stock options of $3.6 million, $12.0 million and $11.2 million during the years ended December 31, 2009, 2008 and 2007, respectively. The tax benefit realized for stock options exercised during the years ended December 31, 2009, 2008 and 2007, net of the reversal of tax benefits of stock options exercised in previous years, was $(4.3) million, $3.6 million and $(32.6) million, respectively. The Company will issue previously unissued shares and/or treasury stock upon the exercise of stock options.
F-42
Table of Contents
M.D.C. HOLDINGS, INC.
Notes to Consolidated Financial Statements (Continued)
Restricted and Unrestricted Stock Award Activity. Non-vested restricted stock awards at December 31, 2008 and changes during the year ended December 31, 2009 were as follows.
| Number of Shares |
Weighted- Average Grant Date Fair Value | |||||
| Non-vested at December 31, 2008 |
284,593 | $ | 39.40 | |||
| Granted |
166,941 | $ | 33.18 | |||
| Vested |
(28,538 | ) | $ | 39.99 | ||
| Forfeited |
(2,134 | ) | $ | 48.85 | ||
| Non-vested at December 31, 2009 |
420,862 | $ | 36.84 | |||
Total stock-based compensation expense relating to restricted stock and unrestricted stock awards was $3.8 million, $3.5 million and $1.2 million for the years ended December 31, 2009, 2008 and 2007, respectively. At December 31, 2009, there was $10.6 million of unrecognized stock-based compensation expense related to non-vested restricted stock awards that is expected to be recognized as an expense by the Company in the future over a weighted-average period of approximately 4 years. The total intrinsic value of restricted stock awards which vested during each of the years ended December 31, 2009, 2008 and 2007 was $13.1 million, $6.5 million and $1.7 million, respectively.
| 16. | Interest Activity |
| 16. | Interest Activity |
The Company capitalizes interest on its senior notes and Homebuilding Line associated with its “qualifying assets.” The Company has determined that inventory is a qualifying asset during the period of active development and through the completion of construction of a home. When construction of a home is complete, such home is no longer considered to be a qualifying asset and interest is no longer capitalized on that home. The Company’s qualifying assets have decreased during 2008 and 2009 as a result of the decrease in inventory levels. As a result, the Company expensed $38.1 million and $18.0 million of interest that was incurred during the years ended December 31, 2009 and 2008, respectively, that could not be capitalized. All interest incurred during the year ended December 31, 2007 was capitalized. Interest incurred on the senior notes or Homebuilding Line that is not capitalized and interest expense on the Mortgage Repurchase Facility are included in other income (expense) in the Consolidated Statements of Operations. Interest activity is shown below (in thousands).
| Year Ended December 31, | ||||||||||||
| 2009 | 2008 | 2007 | ||||||||||
| Total Interest Incurred |
||||||||||||
| Corporate and homebuilding segments |
$ | 57,941 | $ | 57,841 | $ | 57,791 | ||||||
| Financial Services and Other |
451 | 329 | 1,581 | |||||||||
| Total interest incurred |
$ | 58,392 | $ | 58,170 | $ | 59,372 | ||||||
| Total Interest Capitalized |
||||||||||||
| Interest capitalized, beginning of year |
$ | 39,239 | $ | 53,487 | $ | 50,655 | ||||||
| Interest capitalized, net of interest expense |
19,810 | 39,852 | 57,791 | |||||||||
| Previously capitalized interest included in home cost of sales |
(30,710 | ) | (54,100 | ) | (54,959 | ) | ||||||
| Interest capitalized, end of year |
$ | 28,339 | $ | 39,239 | $ | 53,487 | ||||||
F-43
Table of Contents
M.D.C. HOLDINGS, INC.
Notes to Consolidated Financial Statements (Continued)
| 17. | Disclosures About Fair Value of Financial Instruments |
In September 2006, the FASB issued ASC 820 “Fair Value Measurements and Disclosures” (“ASC 820”), which defines fair value, establishes guidelines for measuring fair value and expands disclosures regarding fair value measurements. ASC 820 does not require any new fair value measurements, but rather eliminates inconsistencies in guidance found in certain preceding accounting pronouncements. The Company adopted ASC 820 for financial and non-financial instruments during the 2008 and 2009 first quarters, respectively. Although the adoption of ASC 820 did not materially impact its financial condition, results of operations, or cash flow, the Company now is required to provide additional disclosures as part of its financial statements as set forth below.
ASC 820 establishes a three-tier fair value hierarchy, which prioritizes the inputs used in measuring fair value. These tiers include: Level 1, defined as observable inputs such as quoted prices in active markets; Level 2, defined as inputs other than quoted prices in active markets that are either directly or indirectly observable; and Level 3, defined as unobservable inputs for which little or no market data exists, therefore requiring an entity to develop its own assumptions.
The following methods and assumptions were used to estimate the fair value of each class of financial instruments.
Cash and Cash Equivalents. For cash and cash equivalents, the fair value approximates carrying value.
Marketable securities. The Company’s marketable securities consist of both fixed rate and floating rate interest earning securities, primarily: (1) debt securities, which may include, among others, United States government and government agency debt, corporate debt and bankers’ acceptances; and (2) deposit securities, which may include, among others, certificates of deposit and time deposits. The Company classifies its debt securities as held-to-maturity as it has both the ability and intent to hold these investments until their maturity date. Accordingly, the Company’s debt securities are reported at amortized cost in the Consolidated Balance Sheets. The Company’s marketable securities also include $100 million of investments held in a mutual fund, which invests predominately in fixed income securities. The Company’s equity securities are recorded at fair value. The following table shows the Company’s carrying value of its marketable securities at December 31, 2009, by both security type and maturity date as well as the estimated fair value for each security type (in thousands). The fair value of the Company’s marketable securities are based upon Level 1 fair value inputs.
| December 31, 2009 | ||||||
| Recorded Amount |
Estimated Fair Value | |||||
| Debt securities - maturity 1 to 5 years |
$ | 160,765 | $ | 159,752 | ||
| Available for sale equity securities |
100,000 | 100,000 | ||||
| Debt securities - maturity less than 1 year |
64,679 | 64,844 | ||||
| Deposit securities - maturity 1 to 3 years |
2,500 | 2,558 | ||||
| Total marketable securities |
$ | 327,944 | $ | 327,154 | ||
The following table sets forth the Company’s debt securities that were in an unrealized loss position as of December 31, 2009. Because the Company has the intent and ability to hold these securities to maturity and ultimately expects to receive the contractual amounts due to it, the Company has concluded that the decrease in fair
F-44
Table of Contents
M.D.C. HOLDINGS, INC.
Notes to Consolidated Financial Statements (Continued)
value of these securities is not indicative of an other-than-temporary-impairment. Accordingly, the Company has continued to record each of these securities at its amortized cost.
| December 31, 2009 | ||||||
| Recorded Amount |
Estimated Fair Value | |||||
| Debt securities - maturity 1 to 5 years |
$ | 109,677 | $ | 108,385 | ||
At December 31, 2008, the Company’s marketable securities consisted of $30.0 million, $10.0 million and $14.9 million of time deposits, certificate of deposits and government agency debt, respectively, whose contractual maturities are less than 181 days. For marketable securities at December 31, 2008, the fair value approximates carrying value.
Mortgage Loans Held-for-Sale, Net. As of December 31, 2009, the primary components of the Company’s mortgage loans held-for-sale that are measured at fair value on a recurring basis are: (1) mortgage loans held-for-sale under commitments to sell; and (2) mortgage loans held-for-sale not under commitments to sell. At December 31, 2009 and December 31, 2008, the Company had $42.8 million and $47.0 million, respectively, in mortgage loans held-for-sale under commitments to sell for which fair value was based upon a Level 2 input being the quoted market prices for those mortgage loans. At December 31, 2009 and 2008, the Company had $19.4 million and $21.6 million, respectively, of mortgage loans held-for-sale that were not under commitments to sell and, as such, their fair value was based upon Level 2 fair value inputs, primarily estimated market price received from an outside party.
Inventories. The Company’s assets measured at fair value on a nonrecurring basis are those assets for which the Company has recorded impairments during the current period and primarily relate to the Company’s housing completed or under construction and land and land under development. The Company determines the estimated fair value of each held-for-development subdivision by determining the present value of the estimated future cash flows at discount rates that are commensurate with the risk of the subdivision under evaluation. These estimates are dependent on specific market or sub-market conditions for each subdivision. Local market-specific conditions that may impact these estimates for a subdivision include, among other things: (1) forecasted base selling prices and home sales incentives; (2) estimated land development costs and home cost of construction; (3) the current sales pace for active subdivisions; (4) changes by management in the sales strategy of a given subdivision; and (5) the intensity of competition within a market or sub-market, including publicly available home sales prices and home sales incentives offered by our competitors. The discount rates used in the Company’s estimated discounted cash flows at December 31, 2009 ranged from 13% to 21%. Accordingly, the carrying values of our impaired inventory at December 31, 2009 represent their fair value, which are based upon Level 3 fair value inputs.
The following table sets forth the current carrying value of the Company’s inventory that was impaired during the three months ended December 31, 2009. Accordingly, these carrying values represent the fair value of such inventory at December 31, 2009.
| Land and Land Under Development (Held-for- Development) |
Housing Completed or Under Construction (Held-for- Development) |
Land and Land Under Development (Held-for-Sale) |
Total Fair Value of Impaired Inventory | |||||||||
| West |
$ | - | $ | 3,556 | $ | - | $ | 3,556 | ||||
| Mountain |
13,560 | 12,035 | - | 25,595 | ||||||||
| East |
- | - | - | - | ||||||||
| Other Homebuilding |
- | - | 385 | 385 | ||||||||
| Consolidated |
$ | 13,560 | $ | 15,591 | $ | 385 | $ | 29,536 | ||||
F-45
Table of Contents
M.D.C. HOLDINGS, INC.
Notes to Consolidated Financial Statements (Continued)
Related Party Asset. The Company’s related party assets are debt security bonds that it acquired from a quasi-municipal corporation in the state of Colorado (see Note 9 to the Consolidated Financial Statements). The Company has estimated the fair value of the related party assets based upon discounted cash flows as the Company does not believe there is a readily available market for such assets. The Company used a 15% discount rate in determining the present value of the estimated future cash flows from the servicing of the bonds. The estimated cash flows from the servicing of the bonds are ultimately based upon the Company’s estimated cash flows associated with the building, selling and closing homes in one of its Colorado subdivisions. Accordingly, the estimated fair values of these assets are based upon Level 3 cash flow inputs. Based upon this evaluation, the Company estimated the fair value of its related party assets to be $7.9 million and it recorded a $1.0 million other-than-temporary impairment during the year ended December 31, 2009.
Lines of Credit. The Company’s lines of credit are at floating rates or at fixed rates that approximate current market rates and have relatively short-term maturities. The fair value approximates carrying value.
Senior Notes. The estimated fair values of the senior notes in the following table are considered to be Level 2 fair value inputs pursuant to ASC 820 and are an estimated fair value of the bonds when compared with bonds in the homebuilding sector (in thousands).
| December 31, 2009 | December 31, 2008 | |||||||||||
| Recorded Amount |
Estimated Fair Value |
Recorded Amount |
Estimated Fair Value | |||||||||
| 7% Senior Notes due 2012 |
$ | 149,460 | $ | 161,550 | $ | 149,282 | $ | 153,438 | ||||
| 5 1/2% Senior Notes due 2013 |
$ | 349,642 | $ | 360,500 | $ | 349,543 | $ | 336,726 | ||||
| 5 3/8% Medium Term Senior Notes due 2014 |
$ | 249,102 | $ | 240,050 | $ | 248,947 | $ | 236,625 | ||||
| 5 3/8% Medium Term Senior Notes due 2015 |
$ | 249,787 | $ | 236,800 | $ | 249,755 | $ | 235,004 | ||||
18. Subsequent Events
In January 2010, the Company completed a public offering of $250 million principal amount of 5.625% senior notes due February 2020 (the “Notes”). The Notes, which pay interest February and August of each year, are general unsecured obligations of MDC and rank equally and ratably with its other general unsecured and unsubordinated indebtedness. In addition, the Notes are fully guaranteed on an unsecured basis, jointly and severally, by most of the Company’s homebuilding subsidiaries. The Company received proceeds of $242.3 million, net of discounts and issuance costs of $6.1 million and $1.6 million, respectively. The Company will use the proceeds of the offering for general corporate purposes.
In January 2010, the Company reached a settlement with the IRS on the audit of its 2004 and 2005 federal income tax returns, which settlement is subject to review by the Joint Committee on Taxation. The settlement is expected to result in a decrease of approximately $35 million in the Company’s gross unrecognized tax benefits. The settlement is also expected to result in an increase of approximately $13 million to additional paid-in-capital in the Company’s Consolidated Statements of Stockholders’ Equity and an income tax benefit of approximately $1 million in the Company’s Consolidated Statement of Operations. Finally, since the Company made a deposit of $35.6 million with the IRS during 2008 related to this audit, the settlement is expected to result in an increase of approximately $12 million to cash in the Company’s Consolidated Balance Sheets.
F-46
Table of Contents
M.D.C. HOLDINGS, INC.
Notes to Consolidated Financial Statements (Continued)
19. Supplemental Guarantor Information
The Company’s senior notes and Homebuilding Line are fully and unconditionally guaranteed on an unsecured basis, jointly and severally, by the following subsidiaries (collectively, the “Guarantor Subsidiaries”), which are 100%-owned subsidiaries of the Company.
| • | M.D.C. Land Corporation |
| • | RAH of Florida, Inc. |
| • | Richmond American Construction, Inc. |
| • | Richmond American Homes of Arizona, Inc. |
| • | Richmond American Homes of Colorado, Inc. |
| • | Richmond American Homes of Delaware, Inc. |
| • | Richmond American Homes of Florida, LP |
| • | Richmond American Homes of Illinois, Inc. |
| • | Richmond American Homes of Maryland, Inc. |
| • | Richmond American Homes of Nevada, Inc. |
| • | Richmond American Homes of New Jersey, Inc. |
| • | Richmond American Homes of Pennsylvania, Inc. |
| • | Richmond American Homes of Utah, Inc. |
| • | Richmond American Homes of Virginia, Inc. |
| • | Richmond American Homes of West Virginia, Inc. |
Subsidiaries that do not guarantee the Company’s senior notes and Homebuilding Line (collectively, the “Non-Guarantor Subsidiaries”) include:
| • | American Home Insurance |
| • | American Home Title |
| • | HomeAmerican |
| • | StarAmerican |
| • | Allegiant |
| • | RAH of Texas, LP (as of January 2007) |
| • | RAH Texas Holdings, LLC (as of January 2007) |
| • | Richmond American Homes of Texas, Inc. (as of January 2007) |
The Company has determined that separate, full financial statements of the Guarantor Subsidiaries would not be material to investors and, accordingly, supplemental financial information for the Guarantor Subsidiaries is presented.
During 2009, the Company reclassified $19.7 million of assets that were previously included in related party assets on the Consolidated Balance Sheet and have included them in land and land under development. Accordingly, the Company has corrected an immaterial error and reclassified the balance at December 31, 2008 and 2007 so that the prior period balances conform with the current year’s presentation. See Note 9 to the Consolidated Financial Statements for additional information.
F-47
Table of Contents
M.D.C. HOLDINGS, INC.
Notes to Consolidated Financial Statements (Continued)
M.D.C. Holdings, Inc.
Supplemental Condensed Combining Balance Sheet
December 31, 2009
(In thousands)
| MDC | Guarantor Subsidiaries |
Non- Guarantor Subsidiaries |
Eliminating Entries |
Consolidated MDC | ||||||||||||||
| ASSETS |
||||||||||||||||||
| Cash and cash equivalents |
$ | 1,210,123 | $ | 3,258 | $ | 20,871 | $ | - | $ | 1,234,252 | ||||||||
| Marketable securities |
327,944 | - | - | - | 327,944 | |||||||||||||
| Unsettled trades, net |
1,645 | - | - | - | 1,645 | |||||||||||||
| Restricted cash |
- | 476 | - | - | 476 | |||||||||||||
| Home sales and other receivables |
137,688 | 24,740 | 44,573 | (45,957 | ) | 161,044 | ||||||||||||
| Mortgage loans held-for-sale, net |
- | - | 62,315 | - | 62,315 | |||||||||||||
| Inventories, net |
||||||||||||||||||
| Housing completed or under construction |
- | 260,324 | - | - | 260,324 | |||||||||||||
| Land and land under development |
- | 262,860 | - | - | 262,860 | |||||||||||||
| Investment in subsidiaries |
90,413 | - | - | (90,413 | ) | - | ||||||||||||
| Other assets, net |
85,476 | 29,629 | 3,343 | - | 118,448 | |||||||||||||
| Total Assets |
$ | 1,853,289 | $ | 581,287 | $ | 131,102 | $ | (136,370 | ) | $ | 2,429,308 | |||||||
| LIABILITIES |
||||||||||||||||||
| Accounts payable and related party liabilities |
$ | 48,331 | $ | 34,017 | $ | 696 | $ | (45,957 | ) | $ | 37,087 | |||||||
| Accrued liabilities |
133,226 | 95,705 | 63,038 | - | 291,969 | |||||||||||||
| Advances and notes payable to parent and subsidiaries |
(399,405 | ) | 410,285 | (10,880 | ) | - | - | |||||||||||
| Mortgage repurchase facility |
- | - | 29,115 | - | 29,115 | |||||||||||||
| Senior notes, net |
997,991 | - | - | - | 997,991 | |||||||||||||
| Total Liabilities |
780,143 | 540,007 | 81,969 | (45,957 | ) | 1,356,162 | ||||||||||||
| STOCKHOLDERS’ EQUITY |
1,073,146 | 41,280 | 49,133 | (90,413 | ) | 1,073,146 | ||||||||||||
| Total Liabilities and Stockholders’ Equity |
$ | 1,853,289 | $ | 581,287 | $ | 131,102 | $ | (136,370 | ) | $ | 2,429,308 | |||||||
F-48
Table of Contents
M.D.C. HOLDINGS, INC.
Notes to Consolidated Financial Statements (Continued)
M.D.C. Holdings, Inc.
Supplemental Condensed Combining Balance Sheet
December 31, 2008
(In thousands)
| MDC | Guarantor Subsidiaries |
Non- Guarantor Subsidiaries |
Eliminating Entries |
Consolidated MDC | ||||||||||||||
| ASSETS |
||||||||||||||||||
| Cash and cash equivalents |
$ | 1,279,684 | $ | 3,536 | $ | 21,508 | $ | - | $ | 1,304,728 | ||||||||
| Marketable securities |
54,864 | - | - | 54,864 | ||||||||||||||
| Unsettled trades, net |
57,687 | - | - | 57,687 | ||||||||||||||
| Restricted cash |
- | 670 | - | - | 670 | |||||||||||||
| Home sales and other receivables |
176,522 | 30,100 | 43,889 | (45,957 | ) | 204,554 | ||||||||||||
| Mortgage loans held-for-sale, net |
- | - | 68,604 | - | 68,604 | |||||||||||||
| Inventories, net |
||||||||||||||||||
| Housing completed or under construction |
- | 415,500 | - | - | 415,500 | |||||||||||||
| Land and land under development |
- | 241,571 | - | - | 241,571 | |||||||||||||
| Investment in subsidiaries |
77,617 | - | - | (77,617 | ) | - | ||||||||||||
| Other assets, net |
88,710 | 34,586 | 3,464 | - | 126,760 | |||||||||||||
| Total Assets |
$ | 1,735,084 | $ | 725,963 | $ | 137,465 | $ | (123,574 | ) | $ | 2,474,938 | |||||||
| LIABILITIES |
||||||||||||||||||
| Accounts payable and related party liabilities |
$ | 46,794 | $ | 27,397 | $ | 559 | $ | (45,957 | ) | $ | 28,793 | |||||||
| Accrued liabilities |
135,417 | 136,759 | 60,649 | - | 332,825 | |||||||||||||
| Advances and notes payable to parent and subsidiaries |
(525,574 | ) | 531,631 | (6,057 | ) | - | - | |||||||||||
| Mortgage repurchase facility |
- | - | 34,873 | - | 34,873 | |||||||||||||
| Senior notes, net |
997,527 | - | - | - | 997,527 | |||||||||||||
| Total Liabilities |
654,164 | 695,787 | 90,024 | (45,957 | ) | 1,394,018 | ||||||||||||
| STOCKHOLDERS’ EQUITY |
1,080,920 | 30,176 | 47,441 | (77,617 | ) | 1,080,920 | ||||||||||||
| Total Liabilities and Stockholders’ Equity |
$ | 1,735,084 | $ | 725,963 | $ | 137,465 | $ | (123,574 | ) | $ | 2,474,938 | |||||||
F-49
Table of Contents
M.D.C. HOLDINGS, INC.
Notes to Consolidated Financial Statements (Continued)
M.D.C. Holdings, Inc.
Supplemental Condensed Combining Statements of Operations
Year Ended December 31, 2009
(In thousands)
| MDC | Guarantor Subsidiaries |
Non- Guarantor Subsidiaries |
Eliminating Entries |
Consolidated MDC |
||||||||||||||||
| REVENUE |
||||||||||||||||||||
| Home sales revenue |
$ | - | $ | 852,045 | $ | - | $ | (14,991 | ) | $ | 837,054 | |||||||||
| Land sales and other revenue |
10 | 32,915 | 28,324 | - | 61,249 | |||||||||||||||
| Equity in (loss) income of subsidiaries |
5,995 | - | - | (5,995 | ) | - | ||||||||||||||
| Total Revenue |
6,005 | 884,960 | 28,324 | (20,986 | ) | 898,303 | ||||||||||||||
| COSTS AND EXPENSES |
||||||||||||||||||||
| Home cost of sales |
- | 701,855 | (10 | ) | (14,991 | ) | 686,854 | |||||||||||||
| Asset impairments |
1,023 | 29,963 | - | - | 30,986 | |||||||||||||||
| Marketing and commission expenses |
- | 67,373 | - | - | 67,373 | |||||||||||||||
| General and administrative expenses |
71,993 | 71,976 | 24,159 | - | 168,128 | |||||||||||||||
| Other expenses |
1,018 | 25,038 | - | - | 26,056 | |||||||||||||||
| Total Operating Costs and Expenses |
74,034 | 896,205 | 24,149 | (14,991 | ) | 979,397 | ||||||||||||||
| (Loss) income from Operations |
(68,029 | ) | (11,245 | ) | 4,175 | (5,995 | ) | (81,094 | ) | |||||||||||
| Other income (expense) |
(28,242 | ) | 158 | 1,843 | - | (26,241 | ) | |||||||||||||
| (Loss) income before income taxes |
(96,271 | ) | (11,087 | ) | 6,018 | (5,995 | ) | (107,335 | ) | |||||||||||
| Benefit from (provision for) income taxes |
120,950 | 13,639 | (2,575 | ) | - | 132,014 | ||||||||||||||
| NET (LOSS) INCOME |
$ | 24,679 | $ | 2,552 | $ | 3,443 | $ | (5,995 | ) | $ | 24,679 | |||||||||
F-50
Table of Contents
M.D.C. HOLDINGS, INC.
Notes to Consolidated Financial Statements (Continued)
M.D.C. Holdings, Inc.
Supplemental Condensed Combining Statements of Operations
Year Ended December 31, 2008
(In thousands)
| MDC | Guarantor Subsidiaries |
Non- Guarantor Subsidiaries |
Eliminating Entries |
Consolidated MDC |
||||||||||||||||
| REVENUE |
||||||||||||||||||||
| Home sales revenue |
$ | - | $ | 1,372,932 | $ | - | $ | (14,784 | ) | $ | 1,358,148 | |||||||||
| Land sales and other revenue |
642 | 65,636 | 33,682 | - | 99,960 | |||||||||||||||
| Equity in (loss) income of subsidiaries |
(330,009 | ) | - | - | 330,009 | - | ||||||||||||||
| Total Revenue |
(329,367 | ) | 1,438,568 | 33,682 | 315,225 | 1,458,108 | ||||||||||||||
| COSTS AND EXPENSES |
||||||||||||||||||||
| Home cost of sales |
- | 1,199,786 | (137 | ) | (14,784 | ) | 1,184,865 | |||||||||||||
| Asset impairments |
1,383 | 296,772 | - | - | 298,155 | |||||||||||||||
| Marketing and commission expenses |
- | 122,177 | - | - | 122,177 | |||||||||||||||
| General and administrative expenses |
66,873 | 99,094 | 25,607 | - | 191,574 | |||||||||||||||
| Other expenses |
392 | 60,588 | - | - | 60,980 | |||||||||||||||
| Total Operating Costs and Expenses |
68,648 | 1,778,417 | 25,470 | (14,784 | ) | 1,857,751 | ||||||||||||||
| (Loss) income from Operations |
(398,015 | ) | (339,849 | ) | 8,212 | 330,009 | (399,643 | ) | ||||||||||||
| Other income (expense) |
12,868 | 854 | 3,786 | - | 17,508 | |||||||||||||||
| (Loss) income before income taxes |
(385,147 | ) | (338,995 | ) | 11,998 | 330,009 | (382,135 | ) | ||||||||||||
| Benefit from (provision for) income taxes |
4,602 | 1,423 | (4,435 | ) | - | 1,590 | ||||||||||||||
| NET (LOSS) INCOME |
$ | (380,545 | ) | $ | (337,572 | ) | $ | 7,563 | $ | 330,009 | $ | (380,545 | ) | |||||||
F-51
Table of Contents
M.D.C. HOLDINGS, INC.
Notes to Consolidated Financial Statements (Continued)
M.D.C. Holdings, Inc.
Supplemental Condensed Combining Statements of Operations
Year Ended December 31, 2007
(In thousands)
| MDC | Guarantor Subsidiaries |
Non- Guarantor Subsidiaries |
Eliminating Entries |
Consolidated MDC |
||||||||||||||||
| REVENUE |
||||||||||||||||||||
| Home sales revenue |
$ | - | $ | 2,782,597 | $ | 3,369 | $ | (19,985 | ) | $ | 2,765,981 | |||||||||
| Land sales and other revenue |
2,747 | 61,096 | 55,835 | - | 119,678 | |||||||||||||||
| Equity in (loss) income of subsidiaries |
(628,508 | ) | - | - | 628,508 | - | ||||||||||||||
| Total Revenue |
(625,761 | ) | 2,843,693 | 59,204 | 608,523 | 2,885,659 | ||||||||||||||
| COSTS AND EXPENSES |
||||||||||||||||||||
| Home cost of sales |
- | 2,397,124 | 3,288 | (19,985 | ) | 2,380,427 | ||||||||||||||
| Asset impairments |
- | 726,621 | - | - | 726,621 | |||||||||||||||
| Marketing and commission expenses |
- | 214,682 | 357 | - | 215,039 | |||||||||||||||
| General and administrative expenses |
55,815 | 186,369 | 41,162 | - | 283,346 | |||||||||||||||
| Other expenses |
1,382 | 82,673 | 225 | - | 84,280 | |||||||||||||||
| Total Operating Costs and Expenses |
57,197 | 3,607,469 | 45,032 | (19,985 | ) | 3,689,713 | ||||||||||||||
| (Loss) income from Operations |
(682,958 | ) | (763,776 | ) | 14,172 | 628,508 | (804,054 | ) | ||||||||||||
| Other income (expense) |
39,091 | 543 | 7,956 | - | 47,590 | |||||||||||||||
| (Loss) income before income taxes |
(643,867 | ) | (763,233 | ) | 22,128 | 628,508 | (756,464 | ) | ||||||||||||
| Benefit from (provision for) income taxes |
6,927 | 120,591 | (7,994 | ) | - | 119,524 | ||||||||||||||
| NET (LOSS) INCOME |
$ | (636,940 | ) | $ | (642,642 | ) | $ | 14,134 | $ | 628,508 | $ | (636,940 | ) | |||||||
F-52
Table of Contents
M.D.C. HOLDINGS, INC.
Notes to Consolidated Financial Statements (Continued)
M.D.C. Holdings, Inc.
Supplemental Condensed Combining Statements of Cash Flows
Year Ended December 31, 2009
(In thousands)
| MDC | Guarantor Subsidiaries |
Non- Guarantor Subsidiaries |
Eliminating Entries |
Consolidated MDC |
||||||||||||||||
| Net cash provided by operating activities |
$ | 81,228 | $ | 115,031 | $ | 11,698 | $ | (5,503 | ) | $ | 202,454 | |||||||||
| Net cash used in investing activities |
(224,947 | ) | (45 | ) | - | - | (224,992 | ) | ||||||||||||
| Financing activities |
||||||||||||||||||||
| Payments from (advances to) subsidiaries |
116,338 | (115,264 | ) | (6,577 | ) | 5,503 | - | |||||||||||||
| Mortgage repurchase facility |
- | - | (5,758 | ) | - | (5,758 | ) | |||||||||||||
| Dividend payments |
(46,925 | ) | - | - | - | (46,925 | ) | |||||||||||||
| Proceeds from exercise of stock options |
3,623 | - | - | - | 3,623 | |||||||||||||||
| Excess tax benefit from stock-based compensation |
1,122 | - | - | - | 1,122 | |||||||||||||||
| Net cash provided by (used in) financing activities |
74,158 | (115,264 | ) | (12,335 | ) | 5,503 | (47,938 | ) | ||||||||||||
| Net decrease in cash and cash equivalents |
(69,561 | ) | (278 | ) | (637 | ) | - | (70,476 | ) | |||||||||||
| Cash and cash equivalents |
||||||||||||||||||||
| Beginning of period |
1,279,684 | 3,536 | 21,508 | - | 1,304,728 | |||||||||||||||
| End of period |
$ | 1,210,123 | $ | 3,258 | $ | 20,871 | $ | - | $ | 1,234,252 | ||||||||||
F-53
Table of Contents
M.D.C. HOLDINGS, INC.
Notes to Consolidated Financial Statements (Continued)
M.D.C. Holdings, Inc.
Supplemental Condensed Combining Statements of Cash Flows
Year Ended December 31, 2008
(In thousands)
| MDC | Guarantor Subsidiaries |
Non- Guarantor Subsidiaries |
Eliminating Entries |
Consolidated MDC |
||||||||||||||||
| Net cash (used in) provided by operating activities |
$ | (431,399 | ) | $ | 535,702 | $ | 45,200 | $ | 330,008 | $ | 479,511 | |||||||||
| Net cash used in investing activities |
(113,180 | ) | (253 | ) | (6 | ) | - | (113,439 | ) | |||||||||||
| Financing activities |
||||||||||||||||||||
| Payments from (advances to) subsidiaries |
874,321 | (535,018 | ) | (9,295 | ) | (330,008 | ) | - | ||||||||||||
| Lines of credits |
||||||||||||||||||||
| Advances |
- | - | 125,754 | - | 125,754 | |||||||||||||||
| Principal payments |
- | - | (195,901 | ) | - | (195,901 | ) | |||||||||||||
| Mortgage repurchase facility |
- | - | 34,873 | - | 34,873 | |||||||||||||||
| Dividend payments |
(46,391 | ) | - | - | - | (46,391 | ) | |||||||||||||
| Proceeds from exercise of stock options |
11,997 | - | - | - | 11,997 | |||||||||||||||
| Excess tax benefit from stock-based compensation |
3,561 | - | - | - | 3,561 | |||||||||||||||
| Net cash provided by (used in) financing activities |
843,488 | (535,018 | ) | (44,569 | ) | (330,008 | ) | (66,107 | ) | |||||||||||
| Net increase in cash and cash equivalents |
298,909 | 431 | 625 | - | 299,965 | |||||||||||||||
| Cash and cash equivalents |
||||||||||||||||||||
| Beginning of period |
980,775 | 3,105 | 20,883 | - | 1,004,763 | |||||||||||||||
| End of period |
$ | 1,279,684 | $ | 3,536 | $ | 21,508 | $ | - | $ | 1,304,728 | ||||||||||
F-54
Table of Contents
M.D.C. HOLDINGS, INC.
Notes to Consolidated Financial Statements (Continued)
M.D.C. Holdings, Inc.
Supplemental Condensed Combining Statements of Cash Flows
Year Ended December 31, 2007
(In thousands)
| MDC | Guarantor Subsidiaries |
Non- Guarantor Subsidiaries |
Eliminating Entries |
Consolidated MDC |
||||||||||||||||
| Net cash (used in) provided by operating activities |
$ | (504,134 | ) | $ | 576,083 | $ | 122,755 | $ | 397,879 | $ | 592,583 | |||||||||
| Net cash used in investing activities |
2,158 | (1,346 | ) | (2,259 | ) | - | (1,447 | ) | ||||||||||||
| Financing activities |
||||||||||||||||||||
| Payments from (advances to) subsidiaries |
1,032,069 | (578,032 | ) | (56,158 | ) | (397,879 | ) | - | ||||||||||||
| Lines of credits |
||||||||||||||||||||
| Advances |
160,448 | - | 537,726 | - | 698,174 | |||||||||||||||
| Principal payments |
(160,448 | ) | - | (598,046 | ) | - | (758,494 | ) | ||||||||||||
| Dividend payments |
(45,773 | ) | - | - | - | (45,773 | ) | |||||||||||||
| Proceeds from exercise of stock options |
11,206 | - | - | - | 11,206 | |||||||||||||||
| Excess tax benefit from stock-based compensation |
567 | - | - | - | 567 | |||||||||||||||
| Net cash provided by (used in) financing activities |
998,069 | (578,032 | ) | (116,478 | ) | (397,879 | ) | (94,320 | ) | |||||||||||
| Net increase (decrease) in cash and cash equivalents |
496,093 | (3,295 | ) | 4,018 | - | 496,816 | ||||||||||||||
| Cash and cash equivalents |
||||||||||||||||||||
| Beginning of period |
484,682 | 6,400 | 16,865 | - | 507,947 | |||||||||||||||
| End of period |
$ | 980,775 | $ | 3,105 | $ | 20,883 | $ | - | $ | 1,004,763 | ||||||||||
F-55
Table of Contents
| Item 9. | Changes in and Disagreements with Accountants on Accounting and Financial Disclosure. |
None.
| Item 9A. | Controls and Procedures. |
Conclusion Regarding the Effectiveness of Disclosure Controls and Procedures
An evaluation of the effectiveness of the design and operation of the Company’s disclosure controls and procedures was performed under the supervision, and with the participation, of the Company’s management, including the chief executive officer and the chief financial officer. Based on that evaluation, the Company’s management, including the chief executive officer and chief financial officer, concluded that the Company’s disclosure controls and procedures were effective as of the end of the period covered by this report.
Management’s Report on Internal Control Over Financial Reporting
Management is responsible for establishing and maintaining adequate internal control over financial reporting. Under the supervision and with the participation of our management, including the chief executive officer and the chief financial officer, we conducted an evaluation of the effectiveness of our internal control over financial reporting based on the framework in Internal Control—Integrated Framework issued by the Committee of Sponsoring Organizations of the Treadway Commission. Based on our evaluation under the framework in Internal Control—Integrated Framework, management concluded that our internal control over financial reporting was effective at December 31, 2009.
Ernst & Young LLP, the independent registered public accounting firm that audited the consolidated financial statements included in this annual report on Form 10-K, has issued an attestation report on the Company’s internal control over financial reporting, which is included herein.
Changes in Internal Control over Financial Reporting
There were no changes in our internal control over financial reporting that occurred during the fourth quarter that have materially affected, or are reasonably likely to materially affect, our internal control over financial reporting.
- 83 -
Table of Contents
Report of Independent Registered Public Accounting Firm
The Board of Directors and Shareholders of
M.D.C Holdings, Inc.
We have audited M.D.C. Holdings, Inc.’s (the “Company”) internal control over financial reporting as of December 31, 2009, based on criteria established in Internal Control—Integrated Framework issued by the Committee of Sponsoring Organizations of the Treadway Commission (the COSO criteria). The Company’s management is responsible for maintaining effective internal control over financial reporting, and for its assessment of the effectiveness of internal control over financial reporting included in the accompanying Managements Report on Internal Control Over Financial Reporting. Our responsibility is to express an opinion on the Company’s internal control over financial reporting based on our audit.
We conducted our audit in accordance with the standards of the Public Company Accounting Oversight Board (United States). Those standards require that we plan and perform the audit to obtain reasonable assurance about whether effective internal control over financial reporting was maintained in all material respects. Our audit included obtaining an understanding of internal control over financial reporting, assessing the risk that a material weakness exists, testing and evaluating the design and operating effectiveness of internal control based on the assessed risk, and performing such other procedures as we considered necessary in the circumstances. We believe that our audit provides a reasonable basis for our opinion.
A company’s internal control over financial reporting is a process designed to provide reasonable assurance regarding the reliability of financial reporting and the preparation of financial statements for external purposes in accordance with generally accepted accounting principles. A company’s internal control over financial reporting includes those policies and procedures that (1) pertain to the maintenance of records that, in reasonable detail, accurately and fairly reflect the transactions and dispositions of the assets of the company; (2) provide reasonable assurance that transactions are recorded as necessary to permit preparation of financial statements in accordance with generally accepted accounting principles, and that receipts and expenditures of the company are being made only in accordance with authorizations of management and directors of the company; and (3) provide reasonable assurance regarding prevention or timely detection of unauthorized acquisition, use, or disposition of the company’s assets that could have a material effect on the financial statements.
Because of its inherent limitations, internal control over financial reporting may not prevent or detect misstatements. Also, projections of any evaluation of effectiveness to future periods are subject to the risk that controls may become inadequate because of changes in conditions, or that the degree of compliance with the policies or procedures may deteriorate.
In our opinion, M.D.C. Holdings, Inc. maintained, in all material respects, effective internal control over financial reporting as of December 31, 2009, based on the COSO criteria.
We also have audited, in accordance with the standards of the Public Company Accounting Oversight Board (United States), the consolidated balance sheets of M.D.C. Holdings, Inc. as of December 31, 2009 and 2008, and the related consolidated statements of operations, stockholders’ equity, and cash flows for each of the three years in the period ended December 31, 2009, and our report dated February 5, 2010 expressed an unqualified opinion thereon.
/s/ Ernst & Young LLP
Denver, Colorado
February 5, 2010
- 84 -
Table of Contents
| Item 9B. | Other Information. |
In January 2010, the Company completed a public offering of $250 million principal amount of 5.625% senior notes due February 2020 (the “Notes”). The Notes, which pay interest February and August of each year, are general unsecured obligations of MDC and rank equally and ratably with its other general unsecured and unsubordinated indebtedness. In addition, the Notes are fully guaranteed on an unsecured basis, jointly and severally, by most of the Company’s homebuilding subsidiaries. The Company received proceeds of $242.3 million, net of discounts and issuance costs of $6.1 million and $1.6 million, respectively. The Company will use the proceeds of the offering for general corporate purposes.
In January 2010, the Company reached a settlement with the IRS on the audit of its 2004 and 2005 federal income tax returns, which settlement is subject to review by the Joint Committee on Taxation. Settlement documents are expected to be executed by the IRS following review by the Joint Committee on Taxation. Under the terms of the settlement, an adjustment disallowing $49 million of deductions will be made to the 2005 federal income tax return. The settlement is expected to result in a decrease of approximately $35 million in the Company’s gross unrecognized tax benefits. The settlement is also expected to result in an increase of approximately $13 million to additional paid-in-capital in the Company’s Consolidated Statements of Stockholders’ Equity and an income tax benefit of approximately $1 million in the Company’s Consolidated Statement of Operations. Finally, since the Company made a deposit of $35.6 million with the IRS during 2008 related to this audit, the settlement is expected to result in an increase of approximately $12 million to cash in the Company’s Consolidated Balance Sheets.
PART III
| Item 10. | Directors, Executive Officers and Corporate Governance. |
Information not disclosed below that is required with respect to directors, executive officers, filings under Section 16(a) of the Exchange Act and corporate governance is incorporated herein by reference, when filed, from the Company’s proxy statement (the “Proxy Statement”) for the Annual Meeting of Shareowners to be held on or about April 26, 2010, to be filed with the Securities and Exchange Commission pursuant to Regulation 14A under the Securities and Exchange Act of 1934, as amended (the “Exchange Act”).
We will provide to any shareowner or other person without charge, upon request, a copy of our Corporate Code of Conduct, Corporate Governance Guidelines, code of ethics applicable to our chief executive officer and senior financial officers and the charters for our Audit Committee, Compensation Committee and Corporate Governance/Nominating Committee. You may obtain these documents on our website at http://www.richmondamerican.com, under our Investor Relations section or by contacting our Investor Relations department at 303-977-3451. Our intention is to post on our website any amendments to or waivers from our code of ethics applicable to our chief executive officer and senior financial officers if such disclosure is required.
Pursuant to Section 303A.12(a) of the New York Stock Exchange Listed Company Manual, the Company submitted the Annual CEO Certification to the NYSE on May 4, 2009. The Company also filed with the Securities and Exchange Commission the certifications required under Section 302 of the Sarbanes-Oxley Act as exhibits to its Annual Reports on Form 10-K for the years ended December 31, 2009 and 2008.
| Item 11. | Executive Compensation. |
Information required to be set forth hereunder is incorporated by reference, when filed, from the Company’s Proxy Statement.
- 85 -
Table of Contents
| Item 12. | Security Ownership of Certain Beneficial Owners and Management and Related Stockholder Matters. |
The following table provides information at December 31, 2009 with respect to the shares of MDC common stock that may be issued under existing equity compensation plans, all of which have been approved by the shareowners.
| Common Shares to be Issued Upon Exercise of Outstanding Options |
Weighted- Average Exercise Price of Outstanding Options |
Common Shares Remaining Available for Future Issuance Under Equity Compensation Plans | |||||
| Equity Incentive Plan |
4,606,207 | $ | 40.54 | 4,916,644 | |||
| Director Stock Option Plan |
891,162 | $ | 46.65 | 400,367 | |||
| Total equity compensation plans approved by shareowners |
5,497,369 | $ | 41.53 | 5,317,011 | |||
Additionally, the Company has 1,000,000 shares of its common stock available for issuance under its Executive Officer Performance-Based Plan with respect to the return on stockholders’ equity goal, as described in Article IV of the plan.
Please refer to the discussion of the Company’s equity incentive plans in Note 14 to the Company’s Consolidated Financial Statements for a description of the plans and the types of grants, in addition to options, that may be made under the plans. The referenced discussion also describes the formula by which the number of securities available for issuance under the current plans automatically increases.
Other information required to be set forth hereunder has been omitted and will be incorporated by reference, when filed, from the Company’s Proxy Statement.
| Item 13. | Certain Relationships and Related Transactions, and Director Independence. |
Information required to be set forth hereunder is incorporated by reference, when filed, from the Company’s Proxy Statement.
| Item 14. | Principal Accountant Fees and Services. |
Information required to be set forth hereunder is incorporated by reference, when filed, from the Company’s Proxy Statement.
- 86 -
Table of Contents
PART IV
| Item 15. | Exhibits, Financial Statement Schedules. |
(a)(1) Financial Statements.
The following Consolidated Financial Statements of the Company and its subsidiaries are included in Part II, Item 8.
| Page | ||
| M.D.C. Holdings, Inc. and Subsidiaries |
||
| Report of Independent Registered Public Accounting Firm |
F-2 | |
| Consolidated Balance Sheets at December 31, 2009 and December 31, 2008 |
F-3 | |
| Consolidated Statements of Operations for each of the Three Years in the Period Ended December 31, 2009 |
F-4 | |
| Consolidated Statements of Stockholders’ Equity for each of the Three Years in the Period Ended December 31, 2009 |
F-5 | |
| Consolidated Statements of Cash Flows for each of the Three Years in the Period Ended December 31, 2009 |
F-8 | |
| Notes to Consolidated Financial Statements |
F-9 |
(a)(2) Financial Statement Schedules.
All schedules are omitted because they are not applicable, not material, not required or the required information is included in the applicable Consolidated Financial Statements or notes thereto.
(a)(3) Exhibits.
| INDEX TO EXHIBITS | ||||
| Exhibit |
Description | |||
| 3.1 | Certificate of Amendment to the Certificate of Incorporation of M.D.C. Holdings, Inc. (hereinafter sometimes referred to as “MDC”, the “Company” or the “Registrant”), filed with the Delaware Secretary of State on April 27, 2006, and Certificate of Incorporation, dated May 17, 1985, as amended (incorporated by reference to Exhibit 3.1 of the Company’s Quarterly Report on Form 10-Q dated March 31, 2006). * | |||
| 3.2 | Form of Bylaws of MDC, as amended (incorporated by reference to Exhibit 3.2(b) of the Company’s Quarterly Report on Form 10-Q dated June 30, 1987). * | |||
| 3.3 | Form of Amendment to the Bylaws of MDC regarding indemnification adopted by its board of directors and effective as of March 20, 1987 (incorporated by reference to Exhibit 3.2(a) of the Company’s Quarterly Report on Form 10-Q dated June 30, 1987). * | |||
| 4.1 | Indenture dated as of December 3, 2002, by and among MDC and U.S. Bank National Association (incorporated by reference to Exhibit 4.2 of the Company’s Form S-3/A filed September 1, 2004). * | |||
- 87 -
Table of Contents
| Exhibit |
Description | |||
| 4.2 | Form of Supplemental Indenture dated as of December 3, 2002, by and among MDC, the Guarantors party thereto and U.S. Bank National Association (including without limitation the form of 7.0% Senior Notes due 2012 and form of Guarantee appended to such Supplemental Indenture) (incorporated by reference to Exhibit 4.3 of the Company’s Current Report on Form 8-K filed December 3, 2002). * | |||
| 4.3 | Form of Supplemental Indenture dated as of May 19, 2003, by and among MDC, the Guarantors party thereto and U.S. Bank National Association (including without limitation the form of 5.5% Senior Notes due 2013 and form of Guarantee appended to such Supplemental Indenture) (incorporated by reference to Exhibit 4.3 of the Company’s Current Report on Form 8-K filed May 19, 2003). * | |||
| 4.4 | Second Supplemental Indenture (7.0% Senior Notes Due 2012), dated as of September 29, 2003, by and among MDC, U.S. Bank National Association, as Trustee, and Richmond American Homes of Florida, LP, a Colorado limited partnership and a wholly owned subsidiary of the Company, as Additional Guarantor, including the Guaranty signed by the Additional Guarantor (incorporated by reference to Exhibit 4.1 of the Company’s Quarterly Report on Form 10-Q dated September 30, 2003). * | |||
| 4.5 | Second Supplemental Indenture (5.5% Senior Notes Due 2013), dated as of September 29, 2003, by and among MDC, U.S. Bank National Association, as Trustee, and Richmond American Homes of Florida, LP, a Colorado limited partnership and a wholly owned subsidiary of the Company, as Additional Guarantor, including the Guaranty signed by the Additional Guarantor (incorporated by reference to Exhibit 4.2 of the Company’s Quarterly Report on Form 10-Q dated September 30, 2003). * | |||
| 4.6 | Third Supplemental Indenture (7.0% Senior Notes Due 2012), dated as of February 12, 2004, by and among MDC, U.S. Bank National Association, as Trustee, and the following wholly owned subsidiaries of the Company: Richmond American Homes of Delaware, Inc., a Colorado corporation, Richmond American Homes of Illinois, Inc., a Colorado corporation, Richmond American Homes of New Jersey, Inc., a Colorado corporation, and Richmond American Homes of Pennsylvania, Inc., a Colorado corporation, as Additional Guarantors, including the Guaranty signed by the Additional Guarantors (incorporated by reference to Exhibit 4.6 of the Company’s Annual Report on Form 10-K dated December 31, 2003). * | |||
| 4.7 | Third Supplemental Indenture (5.5% Senior Notes Due 2013), dated as of February 12, 2004, by and among MDC, U.S. Bank National Association, as Trustee, and the following wholly owned subsidiaries of the Company: Richmond American Homes of Delaware, Inc., a Colorado corporation, Richmond American Homes of Illinois, Inc., a Colorado corporation, Richmond American Homes of New Jersey, Inc., a Colorado corporation, and Richmond American Homes of Pennsylvania, Inc., a Colorado corporation, as Additional Guarantors, including the Guaranty signed by the Additional Guarantors (incorporated by reference to Exhibit 4.7 of the Company’s Annual Report on Form 10-K dated December 31, 2003). * | |||
| 4.8 | Supplemental Indenture, dated as of October 6, 2004, by and among MDC, the Guarantors party thereto and U.S. Bank National Association, as Trustee, with respect to MDC’s Medium-Term Senior Notes (incorporated by reference to Exhibit 10.3 of the Company’s Current Report on Form 8-K filed October 7, 2004). * | |||
| 4.9 | Pricing Supplement No. 1, dated December 6, 2004, with respect to MDC’s 5.375% Medium-Term Senior Notes due 2014 (incorporated by reference to the Company’s Rule 424(b)(2) filing on December 8, 2004). * | |||
| 4.10 | Pricing Supplement No. 2, dated June 28, 2005, with respect to MDC’s 5.375% Medium-Term Senior Notes due July 1, 2015 (incorporated by reference to the Company’s Rule 424(b)(2) filing on June 29, 2005). * | |||
- 88 -
Table of Contents
| Exhibit |
Description | |||
| 4.11 | Amendment No. 1 dated as of July 20, 2005 to Supplemental Indenture dated as of October 6, 2004, with respect to MDC’s Medium-Term Senior Notes (incorporated by reference to Exhibit 10.2 of the Company’s Current Report on Form 8-K filed July 20, 2005). * | |||
| 4.12 | Amendment No. 2 dated as of January 9, 2006 to Supplemental Indenture dated as of October 6, 2004, with respect to MDC’s Medium-Term Senior Notes (incorporated by reference to Exhibit 10.2 of the Company’s Current Report on Form 8-K filed January 9, 2006). * | |||
| 4.13 | Supplemental indenture dated as of January 15, 2010, among the Company, the guarantors named therein and U.S. Bank National Association, as Trustee (incorporated by reference to Exhibit 4.1 of the Company’s Current Report on Form 8-K filed January 15, 2010). * | |||
| 10.1 | Second Amended and Restated Credit Agreement dated as of March 22, 2006, among MDC as Borrower and the Lenders party thereto and JPMorgan Chase Bank, N.A. as Administrative Agent, including form of Amended and Restated Guaranty and form of Promissory Note (incorporated by reference to Exhibit 10.1 of the Company’s Current Report on Form 8-K filed March 24, 2006). * | |||
| 10.2 | First Amendment to Second Amended and Restated Credit Agreement, dated as of October 24, 2007 (incorporated by reference to Exhibit 10.1 of the Company’s Current Report on Form 8-K filed October 24, 2007). * | |||
| 10.3 | Second Amendment to Second Amended and Restated Credit Agreement, dated as of January 24, 2008 (incorporated by reference to Exhibit 10.1 of the Company’s Current Report on Form 8-K filed January 25, 2008). * | |||
| 10.4 | Third Amendment to Second Amended and Restated Credit Agreement, dated as of December 22, 2008 (incorporated by reference to Exhibit 10.1 of the Company’s Current Report on Form 8-K filed December 23, 2008). * | |||
| 10.5 | Master Repurchase Agreement among HomeAmerican Mortgage Corporation, U.S. Bank National Association as Agent, and the other Buyers party thereto, dated as of November 12, 2008 (incorporated by reference to Exhibit 10.1 to the Company’s Form 8-K filed November 17, 2008). * | |||
| 10.6 | First Amendment to Master Repurchase Agreement between HomeAmerican Mortgage Corporation, as Seller, and U.S. Bank National Association, as Agent and Buyer, dated as of October 29, 2009 (incorporated by reference to Exhibit 10.3 of the Company’s Quarterly Report on Form 10-Q dated September 30, 2009). * | |||
| 10.7 | Custody Agreement by and between HomeAmerican Mortgage Corporation and U.S. Bank National Association as Agent and Custodian, dated as of November 12, 2008 (incorporated by reference to Exhibit 10.2 to the Company’s Form 8-K filed November 17, 2008). * | |||
| 10.8 | M.D.C. Holdings, Inc. 2001 Equity Incentive Plan Effective March 26, 2001 (incorporated by reference to Exhibit B of the Company’s Proxy Statement dated March 31, 2001 relating to the 2001 Annual Meeting of Stockholders). * | |||
| 10.9 | First Amendment to M.D.C. Holdings, Inc. 2001 Equity Incentive Plan, effective April 28, 2003 (incorporated by reference to Exhibit 10.2 of the Company’s Quarterly Report on Form 10-Q dated March 31, 2003). * | |||
| 10.10 | Second Amendment to M.D.C. Holdings, Inc. 2001 Equity Incentive Plan, effective April 29, 2008 (incorporated by reference to Exhibit 10.2 to the Company’s Form 8-K filed May 1, 2008). * | |||
- 89 -
Table of Contents
| Exhibit |
Description | |||
| 10.11 | Third Amendment to M.D.C. Holdings, Inc. 2001 Equity Incentive Plan, effective April 29, 2008 (incorporated by reference to Exhibit 10.3 to the Company’s Form 8-K filed May 1, 2008). * | |||
| 10.12 | Fourth Amendment to M.D.C. Holdings, Inc. 2001 Equity Incentive Plan, dated December 31, 2008 (incorporated by reference to Exhibit 10.11 of the Company’s Annual Report on Form 10-K dated December 31, 2008). * | |||
| 10.13 | Form of Non-Qualified Stock Option Certificate (2001 Equity Incentive Plan) (incorporated by reference to Exhibit 10.10 of the Company’s Annual Report on Form 10-K dated December 31, 2004). * | |||
| 10.14 | Form of Restricted Stock Agreement (2001 Equity Incentive Plan) (incorporated by reference to Exhibit 10.11 of the Company’s Annual Report on Form 10-K dated December 31, 2004). * | |||
| 10.15 | M.D.C. Holdings, Inc. Stock Option Plan for Non-Employee Directors Effective March 26, 2001 (incorporated by reference to Exhibit C of the Company’s Proxy Statement dated March 31, 2001 relating to the 2001 Annual Meeting of Stockholders). * | |||
| 10.16 | First Amendment to M.D.C. Holdings, Inc. Stock Option Plan for Non-Employee Directors, October 20, 2003 (incorporated by reference to Exhibit 10.13 of the Company’s Annual Report on Form 10-K dated December 31, 2004). * | |||
| 10.17 | Second Amendment to M.D.C. Holdings, Inc. Stock Option Plan for Non-Employee Directors, dated December 16, 2008 (incorporated by reference to Exhibit 10.16 of the Company’s Annual Report on Form 10-K dated December 31, 2008). * | |||
| 10.18 | Form of Non-Qualified Stock Option Agreement (Stock Option Plan for Non-Employee Directors) (incorporated by reference to Exhibit 10.14 of the Company’s Annual Report on Form 10-K dated December 31, 2004). * | |||
| 10.19 | Form of Indemnification Agreement entered into between the Company and members of its Board of Directors (incorporated by reference to Exhibit 10.1 of the Company’s Current Report on Form 8-K filed October 26, 2006).* | |||
| 10.20 | Form of Indemnification Agreement entered into between the Company and certain of its officers (incorporated by reference to Exhibit 10.2 of the Company’s Current Report on Form 8-K filed October 26, 2006).* | |||
| 10.21 | M.D.C. Holdings, Inc. Amended Executive Officer Performance-Based Compensation Plan, approved April 29, 2008 (incorporated by reference to Exhibit 10.1 to the Company’s Form 8-K filed May 1, 2008). * | |||
| 10.22 | First Amendment to the M.D.C. Holdings, Inc. Amended Executive Officer Performance-Based Compensation Plan, dated December 31, 2008 (incorporated by reference to Exhibit 10.21 of the Company’s Annual Report on Form 10-K dated December 31, 2008).* | |||
| 10.23 | Employment Agreement, Larry A. Mizel, amended and restated as of August 1, 2008 (incorporated by reference to Exhibit 10.1 of the Company’s Current Report on Form 8-K filed September 26, 2008). * | |||
| 10.24 | Employment Agreement, David D. Mandarich, amended and restated as of August 1, 2008 (incorporated by reference to Exhibit 10.1 of the Company’s Current Report on Form 8-K filed September 26, 2008). * | |||
| 10.25 | Employment offer letter by the Company to Christopher M. Anderson, dated June 13, 2008 (incorporated by reference to Exhibit 10.6 of the Company’s Quarterly Report on Form 10-Q filed July 31, 2008). * | |||
- 90 -
Table of Contents
| Exhibit |
Description | |||
| 10.26 | Lease Agreement among MDC, Richmond American Homes of Colorado, Inc. and Larry A. Mizel, August 2, 2007 (incorporated by reference to Exhibit 10.4 of the Company’s Quarterly Report on Form 10-Q dated June 30, 2007). * | |||
| 10.27 | Lease Agreement among MDC, Richmond American Homes of Colorado, Inc. and David D. Mandarich, August 2, 2007 (incorporated by reference to Exhibit 10.5 of the Company’s Quarterly Report on Form 10-Q dated June 30, 2007). * | |||
| 10.28 | Change in Control and Separation Agreement between the Company and Christopher M. Anderson, dated as of July 14, 2008 (incorporated by reference to Exhibit 10.7 of the Company’s Quarterly Report on Form 10-Q filed July 31, 2008). * | |||
| 10.29 | Change in Control and Separation Agreement between the Company and Michael Touff, dated as of July 30, 2008 (incorporated by reference to Exhibit 10.8 of the Company’s Quarterly Report on Form 10-Q filed July 31, 2008). * | |||
| 10.30 | Form of Change in Control Agreement between the Company and certain employees of M.D.C. Holdings, Inc. (incorporated by reference to Exhibit 10.3 of the Company’s Current Report on Form 8-K filed March 27, 1998). * | |||
| 10.31 | Independent Contractor Agreement between Mizel Design and Decorating Company and the Company effective as of January 1, 2005 (incorporated by reference to Exhibit 10.26 of the Company’s Annual Report on Form 10-K dated December 31, 2004). * | |||
| 10.32 | M.D.C. Holdings, Inc. 401(k) Savings Plan, Amended and Restated effective January 1, 2008, executed October 29, 2008 (incorporated by reference to Exhibit 10.6 of the Company’s Quarterly Report on Form 10-Q filed October 31, 2008). * | |||
| 10.33 | First Amendment to the M.D.C. Holdings, Inc. 401(k) Savings Plan, executed December 23, 2009. | |||
| 10.34 | Purchase Agreement dated as of December 6, 2004, among MDC and Citigroup Global Markets Inc., J.P. Morgan Securities Inc., Wachovia Capital Markets, LLC, Banc of America Securities LLC and BNP Paribas Securities Corp. (incorporated by reference to Exhibit 10.1 of the Company’s Current Report on Form 8-K filed December 14, 2004). * | |||
| 10.35 | Purchase Agreement dated as of June 28, 2005, among MDC and Citigroup Global Markets Inc., J.P. Morgan Securities Inc., Wachovia Capital Markets, LLC, Banc of America Securities LLC, BNP Paribas Securities Corp., Comerica Securities, Inc., Credit Suisse First Boston LLC, KeyBanc Capital Markets, Greenwich Capital Markets, Inc. and SunTrust Capital Markets, Inc. (incorporated by reference to Exhibit 10.1 of the Company’s Current Report on Form 8-K filed July 7, 2005). * | |||
| 10.36 | Distribution Agreement, dated October 6, 2004, between the Registrant, certain of its subsidiaries and Banc of America Securities LLC, BNP Paribas Securities Corp., Citigroup Global Markets Inc., Comerica Securities, Credit Suisse First Boston LLC, Deutsche Bank Securities Inc., Greenwich Capital Markets, Inc., J.P. Morgan Securities Inc., McDonald Investments Inc., Merrill Lynch, Pierce, Fenner & Smith Incorporated, SunTrust Robinson Humphrey Capital Markets, UBS Securities LLC and Wachovia Capital Markets, LLC (incorporated by reference to Exhibit 10.1 of the Company’s Current Report on Form 8-K filed October 7, 2004). * | |||
- 91 -
Table of Contents
| Exhibit |
Description | |||
| 10.37 | Amendment No. 1 to Distribution Agreement, dated as of July 20, 2005, among MDC, certain of its subsidiaries and Banc of America Securities LLC, BNP Paribas Securities Corp., Citigroup Global Markets Inc., Comerica Securities, Credit Suisse First Boston LLC, Deutsche Bank Securities Inc., Greenwich Capital Markets, Inc., J.P. Morgan Securities Inc., McDonald Investments Inc., Merrill Lynch, Pierce, Fenner & Smith Incorporated, SunTrust Capital Markets, Inc., UBS Securities LLC and Wachovia Capital Markets, LLC (incorporated by reference to Exhibit 10.1 of the Company’s Current Report on Form 8-K filed July 20, 2005). * | |||
| 10.38 | Amended and Restated Distribution Agreement, dated as of January 9, 2006, among the Registrant, certain of its subsidiaries and Banc of America Securities LLC, BNP Paribas Securities Corp., Citigroup Global Markets Inc., Comerica Securities, Credit Suisse First Boston LLC, Deutsche Bank Securities Inc., Greenwich Capital Markets, Inc., J.P. Morgan Securities Inc., McDonald Investments Inc., Merrill Lynch, Pierce, Fenner & Smith Incorporated, SunTrust Capital Markets, Inc., UBS Securities LLC and Wachovia Capital Markets, LLC (incorporated by reference to Exhibit 10.1 of the Company’s Current Report on Form 8-K filed January 9, 2006). * | |||
| 10.39 | Sub-Sublease agreement between MDC and CVentures, Inc., executed July 25, 2005 (incorporated by reference to Exhibit 10.1 of the Company’s Current Report on Form 8-K filed July 27, 2005). * | |||
| 10.40 | First Amendment to Sub-Sublease agreement between MDC and CVentures, Inc., executed on March 28, 2006 (incorporated by reference to Exhibit 10.1 of the Company’s Current Report on Form 8-K filed March 29, 2006). * | |||
| 12 | Ratio of Earnings to Fixed Charges Schedule. | |||
| 21 | Subsidiaries of the Company. | |||
| 23 | Consent of Ernst & Young LLP. | |||
| 31.1 | Certification of Chief Executive Officer required by 17 CFR 240.13a-14(a), pursuant to Section 302 of the Sarbanes-Oxley Act of 2002. | |||
| 31.2 | Certification of Chief Financial Officer required by 17 CFR 240.13a-14(a), pursuant to Section 302 of the Sarbanes-Oxley Act of 2002. | |||
| 32.1 | Certification of Chief Executive Officer required by 17 CFR 240.13a-14(b), pursuant to Section 906 of the Sarbanes-Oxley Act of 2002. | |||
| 32.2 | Certification of Chief Financial Officer required by 17 CFR 240.13a-14(b), pursuant to Section 906 of the Sarbanes-Oxley Act of 2002. | |||
| * | Incorporated by reference. |
- 92 -
Table of Contents
Pursuant to the requirements of Section 13 or 15(d) of the Securities Exchange Act of 1934, the Registrant has duly caused this report to be signed on this 5th day of February, 2010 on its behalf by the undersigned, thereunto duly authorized.
| M.D.C. HOLDINGS, INC. (Registrant) | ||
| By: |
/s/ Larry A. Mizel | |
| Larry A. Mizel | ||
| Chief Executive Officer | ||
| By: |
/s/ Christopher M. Anderson | |
| Christopher M. Anderson | ||
| Senior Vice President, Chief Financial Officer and Principal Accounting Officer | ||
POWER OF ATTORNEY
KNOW ALL MEN BY THESE PRESENTS, that the undersigned officers and/or directors of the Registrant, by virtue of their signatures to this report, appearing below, hereby constitute and appoint Larry A. Mizel, David D. Mandarich and Christopher M. Anderson, or any one of them, with full power of substitution, as attorneys-in-fact in their names, places and steads to execute any and all amendments to this report in the capacities set forth opposite their names and hereby ratify all that said attorneys-in-fact do by virtue hereof.
Pursuant to the requirements of the Securities Exchange Act of 1934, this report has been signed below by the following persons on behalf of the Registrant and in the capacities and on the dates indicated.
| Signature |
Title |
Date | ||
| /s/ Larry A. Mizel Larry A. Mizel |
Chairman of the Board of Directors and Chief Executive Officer |
February 5, 2010 | ||
| /s/ David D. Mandarich David D. Mandarich |
Director, President and Chief Operating Officer |
February 5, 2010 | ||
| /s/ Steven J. Borick Steven J. Borick |
Director | February 5, 2010 | ||
| /s/ William B. Kemper William B. Kemper |
Director | February 5, 2010 | ||
| /s/ Herbert T. Buchwald Herbert T. Buchwald |
Director | February 5, 2010 | ||
| /s/ David E. Blackford David E. Blackford |
Director | February 5, 2010 | ||
| /s/ Michael A. Berman Michael A. Berman |
Director | February 5, 2010 | ||
| /s/ David Siegel David Siegel |
Director | February 5, 2010 | ||
(A Majority of the Board of Directors)
- 93 -
Table of Contents
| INDEX TO EXHIBITS | ||
| Exhibit |
Description | |
| 3.1 | Certificate of Amendment to the Certificate of Incorporation of M.D.C. Holdings, Inc. (hereinafter sometimes referred to as “MDC”, the “Company” or the “Registrant”), filed with the Delaware Secretary of State on April 27, 2006, and Certificate of Incorporation, dated May 17, 1985, as amended (incorporated by reference to Exhibit 3.1 of the Company’s Quarterly Report on Form 10-Q dated March 31, 2006). * | |
| 3.2 | Form of Bylaws of MDC, as amended (incorporated by reference to Exhibit 3.2(b) of the Company’s Quarterly Report on Form 10-Q dated June 30, 1987). * | |
| 3.3 | Form of Amendment to the Bylaws of MDC regarding indemnification adopted by its board of directors and effective as of March 20, 1987 (incorporated by reference to Exhibit 3.2(a) of the Company’s Quarterly Report on Form 10-Q dated June 30, 1987). * | |
| 4.1 | Indenture dated as of December 3, 2002, by and among MDC and U.S. Bank National Association (incorporated by reference to Exhibit 4.2 of the Company’s Form S-3/A filed September 1, 2004). * | |
| 4.2 | Form of Supplemental Indenture dated as of December 3, 2002, by and among MDC, the Guarantors party thereto and U.S. Bank National Association (including without limitation the form of 7.0% Senior Notes due 2012 and form of Guarantee appended to such Supplemental Indenture) (incorporated by reference to Exhibit 4.3 of the Company’s Current Report on Form 8-K filed December 3, 2002). * | |
| 4.3 | Form of Supplemental Indenture dated as of May 19, 2003, by and among MDC, the Guarantors party thereto and U.S. Bank National Association (including without limitation the form of 5.5% Senior Notes due 2013 and form of Guarantee appended to such Supplemental Indenture) (incorporated by reference to Exhibit 4.3 of the Company’s Current Report on Form 8-K filed May 19, 2003). * | |
| 4.4 | Second Supplemental Indenture (7.0% Senior Notes Due 2012), dated as of September 29, 2003, by and among MDC, U.S. Bank National Association, as Trustee, and Richmond American Homes of Florida, LP, a Colorado limited partnership and a wholly owned subsidiary of the Company, as Additional Guarantor, including the Guaranty signed by the Additional Guarantor (incorporated by reference to Exhibit 4.1 of the Company’s Quarterly Report on Form 10-Q dated September 30, 2003). * | |
| 4.5 | Second Supplemental Indenture (5.5% Senior Notes Due 2013), dated as of September 29, 2003, by and among MDC, U.S. Bank National Association, as Trustee, and Richmond American Homes of Florida, LP, a Colorado limited partnership and a wholly owned subsidiary of the Company, as Additional Guarantor, including the Guaranty signed by the Additional Guarantor (incorporated by reference to Exhibit 4.2 of the Company’s Quarterly Report on Form 10-Q dated September 30, 2003). * | |
| 4.6 | Third Supplemental Indenture (7.0% Senior Notes Due 2012), dated as of February 12, 2004, by and among MDC, U.S. Bank National Association, as Trustee, and the following wholly owned subsidiaries of the Company: Richmond American Homes of Delaware, Inc., a Colorado corporation, Richmond American Homes of Illinois, Inc., a Colorado corporation, Richmond American Homes of New Jersey, Inc., a Colorado corporation, and Richmond American Homes of Pennsylvania, Inc., a Colorado corporation, as Additional Guarantors, including the Guaranty signed by the Additional Guarantors (incorporated by reference to Exhibit 4.6 of the Company’s Annual Report on Form 10-K dated December 31, 2003). * | |
- 1 -
Table of Contents
| Exhibit |
Description | |
| 4.7 | Third Supplemental Indenture (5.5% Senior Notes Due 2013), dated as of February 12, 2004, by and among MDC, U.S. Bank National Association, as Trustee, and the following wholly owned subsidiaries of the Company: Richmond American Homes of Delaware, Inc., a Colorado corporation, Richmond American Homes of Illinois, Inc., a Colorado corporation, Richmond American Homes of New Jersey, Inc., a Colorado corporation, and Richmond American Homes of Pennsylvania, Inc., a Colorado corporation, as Additional Guarantors, including the Guaranty signed by the Additional Guarantors (incorporated by reference to Exhibit 4.7 of the Company’s Annual Report on Form 10-K dated December 31, 2003). * | |
| 4.8 | Supplemental Indenture, dated as of October 6, 2004, by and among MDC, the Guarantors party thereto and U.S. Bank National Association, as Trustee, with respect to MDC’s Medium-Term Senior Notes (incorporated by reference to Exhibit 10.3 of the Company’s Current Report on Form 8-K filed October 7, 2004). * | |
| 4.9 | Pricing Supplement No. 1, dated December 6, 2004, with respect to MDC’s 5.375% Medium-Term Senior Notes due 2014 (incorporated by reference to the Company’s Rule 424(b)(2) filing on December 8, 2004). * | |
| 4.10 | Pricing Supplement No. 2, dated June 28, 2005, with respect to MDC’s 5.375% Medium-Term Senior Notes due July 1, 2015 (incorporated by reference to the Company’s Rule 424(b)(2) filing on June 29, 2005). * | |
| 4.11 | Amendment No. 1 dated as of July 20, 2005 to Supplemental Indenture dated as of October 6, 2004, with respect to MDC’s Medium-Term Senior Notes (incorporated by reference to Exhibit 10.2 of the Company’s Current Report on Form 8-K filed July 20, 2005). * | |
| 4.12 | Amendment No. 2 dated as of January 9, 2006 to Supplemental Indenture dated as of October 6, 2004, with respect to MDC’s Medium-Term Senior Notes (incorporated by reference to Exhibit 10.2 of the Company’s Current Report on Form 8-K filed January 9, 2006). * | |
| 4.13 | Supplemental indenture dated as of January 15, 2010, among the Company, the guarantors named therein and U.S. Bank National Association, as Trustee (incorporated by reference to Exhibit 4.1 of the Company’s Current Report on Form 8-K filed January 15, 2010). * | |
| 10.1 | Second Amended and Restated Credit Agreement dated as of March 22, 2006, among MDC as Borrower and the Lenders party thereto and JPMorgan Chase Bank, N.A. as Administrative Agent, including form of Amended and Restated Guaranty and form of Promissory Note (incorporated by reference to Exhibit 10.1 of the Company’s Current Report on Form 8-K filed March 24, 2006). * | |
| 10.2 | First Amendment to Second Amended and Restated Credit Agreement, dated as of October 24, 2007 (incorporated by reference to Exhibit 10.1 of the Company’s Current Report on Form 8-K filed October 24, 2007). * | |
| 10.3 | Second Amendment to Second Amended and Restated Credit Agreement, dated as of January 24, 2008 (incorporated by reference to Exhibit 10.1 of the Company’s Current Report on Form 8-K filed January 25, 2008). * | |
| 10.4 | Third Amendment to Second Amended and Restated Credit Agreement, dated as of December 22, 2008 (incorporated by reference to Exhibit 10.1 of the Company’s Current Report on Form 8-K filed December 23, 2008). * | |
| 10.5 | Master Repurchase Agreement among HomeAmerican Mortgage Corporation, U.S. Bank National Association as Agent, and the other Buyers party thereto, dated as of November 12, 2008 (incorporated by reference to Exhibit 10.1 to the Company’s Form 8-K filed November 17, 2008). * | |
- 2 -
Table of Contents
| Exhibit |
Description | |
| 10.6 | First Amendment to Master Repurchase Agreement between HomeAmerican Mortgage Corporation, as Seller, and U.S. Bank National Association, as Agent and Buyer, dated as of October 29, 2009 (incorporated by reference to Exhibit 10.3 of the Company’s Quarterly Report on Form 10-Q dated September 30, 2009). * | |
| 10.7 | Custody Agreement by and between HomeAmerican Mortgage Corporation and U.S. Bank National Association as Agent and Custodian, dated as of November 12, 2008 (incorporated by reference to Exhibit 10.2 to the Company’s Form 8-K filed November 17, 2008). * | |
| 10.8 | M.D.C. Holdings, Inc. 2001 Equity Incentive Plan Effective March 26, 2001 (incorporated by reference to Exhibit B of the Company’s Proxy Statement dated March 31, 2001 relating to the 2001 Annual Meeting of Stockholders). * | |
| 10.9 | First Amendment to M.D.C. Holdings, Inc. 2001 Equity Incentive Plan, effective April 28, 2003 (incorporated by reference to Exhibit 10.2 of the Company’s Quarterly Report on Form 10-Q dated March 31, 2003). * | |
| 10.10 | Second Amendment to M.D.C. Holdings, Inc. 2001 Equity Incentive Plan, effective April 29, 2008 (incorporated by reference to Exhibit 10.2 to the Company’s Form 8-K filed May 1, 2008). * | |
| 10.11 | Third Amendment to M.D.C. Holdings, Inc. 2001 Equity Incentive Plan, effective April 29, 2008 (incorporated by reference to Exhibit 10.3 to the Company’s Form 8-K filed May 1, 2008). * | |
| 10.12 | Fourth Amendment to M.D.C. Holdings, Inc. 2001 Equity Incentive Plan, dated December 31, 2008 (incorporated by reference to Exhibit 10.11 of the Company’s Annual Report on Form 10-K dated December 31, 2008). * | |
| 10.13 | Form of Non-Qualified Stock Option Certificate (2001 Equity Incentive Plan) (incorporated by reference to Exhibit 10.10 of the Company’s Annual Report on Form 10-K dated December 31, 2004). * | |
| 10.14 | Form of Restricted Stock Agreement (2001 Equity Incentive Plan) (incorporated by reference to Exhibit 10.11 of the Company’s Annual Report on Form 10-K dated December 31, 2004). * | |
| 10.15 | M.D.C. Holdings, Inc. Stock Option Plan for Non-Employee Directors Effective March 26, 2001 (incorporated by reference to Exhibit C of the Company’s Proxy Statement dated March 31, 2001 relating to the 2001 Annual Meeting of Stockholders). * | |
| 10.16 | First Amendment to M.D.C. Holdings, Inc. Stock Option Plan for Non-Employee Directors, October 20, 2003 (incorporated by reference to Exhibit 10.13 of the Company’s Annual Report on Form 10-K dated December 31, 2004). * | |
| 10.17 | Second Amendment to M.D.C. Holdings, Inc. Stock Option Plan for Non-Employee Directors, dated December 16, 2008 (incorporated by reference to Exhibit 10.16 of the Company’s Annual Report on Form 10-K dated December 31, 2008). * | |
| 10.18 | Form of Non-Qualified Stock Option Agreement (Stock Option Plan for Non-Employee Directors) (incorporated by reference to Exhibit 10.14 of the Company’s Annual Report on Form 10-K dated December 31, 2004). * | |
| 10.19 | Form of Indemnification Agreement entered into between the Company and members of its Board of Directors (incorporated by reference to Exhibit 10.1 of the Company’s Current Report on Form 8-K filed October 26, 2006).* | |
| 10.20 | Form of Indemnification Agreement entered into between the Company and certain of its officers (incorporated by reference to Exhibit 10.2 of the Company’s Current Report on Form 8-K filed October 26, 2006).* | |
- 3 -
Table of Contents
| Exhibit |
Description | |
| 10.21 | M.D.C. Holdings, Inc. Amended Executive Officer Performance-Based Compensation Plan, approved April 29, 2008 (incorporated by reference to Exhibit 10.1 to the Company’s Form 8-K filed May 1, 2008). * | |
| 10.22 | First Amendment to the M.D.C. Holdings, Inc. Amended Executive Officer Performance-Based Compensation Plan, dated December 31, 2008 (incorporated by reference to Exhibit 10.21 of the Company’s Annual Report on Form 10-K dated December 31, 2008).* | |
| 10.23 | Employment Agreement, Larry A. Mizel, amended and restated as of August 1, 2008 (incorporated by reference to Exhibit 10.1 of the Company’s Current Report on Form 8-K filed September 26, 2008). * | |
| 10.24 | Employment Agreement, David D. Mandarich, amended and restated as of August 1, 2008 (incorporated by reference to Exhibit 10.1 of the Company’s Current Report on Form 8-K filed September 26, 2008). * | |
| 10.25 | Employment offer letter by the Company to Christopher M. Anderson, dated June 13, 2008 (incorporated by reference to Exhibit 10.6 of the Company’s Quarterly Report on Form 10-Q filed July 31, 2008). * | |
| 10.26 | Lease Agreement among MDC, Richmond American Homes of Colorado, Inc. and Larry A. Mizel, August 2, 2007 (incorporated by reference to Exhibit 10.4 of the Company’s Quarterly Report on Form 10-Q dated June 30, 2007). * | |
| 10.27 | Lease Agreement among MDC, Richmond American Homes of Colorado, Inc. and David D. Mandarich, August 2, 2007 (incorporated by reference to Exhibit 10.5 of the Company’s Quarterly Report on Form 10-Q dated June 30, 2007). * | |
| 10.28 | Change in Control and Separation Agreement between the Company and Christopher M. Anderson, dated as of July 14, 2008 (incorporated by reference to Exhibit 10.7 of the Company’s Quarterly Report on Form 10-Q filed July 31, 2008). * | |
| 10.29 | Change in Control and Separation Agreement between the Company and Michael Touff, dated as of July 30, 2008 (incorporated by reference to Exhibit 10.8 of the Company’s Quarterly Report on Form 10-Q filed July 31, 2008). * | |
| 10.30 | Form of Change in Control Agreement between the Company and certain employees of M.D.C. Holdings, Inc. (incorporated by reference to Exhibit 10.3 of the Company’s Current Report on Form 8-K filed March 27, 1998). * | |
| 10.31 | Independent Contractor Agreement between Mizel Design and Decorating Company and the Company effective as of January 1, 2005 (incorporated by reference to Exhibit 10.26 of the Company’s Annual Report on Form 10-K dated December 31, 2004). * | |
| 10.32 | M.D.C. Holdings, Inc. 401(k) Savings Plan, Amended and Restated effective January 1, 2008, executed October 29, 2008 (incorporated by reference to Exhibit 10.6 of the Company’s Quarterly Report on Form 10-Q filed October 31, 2008). * | |
| 10.33 | First Amendment to the M.D.C. Holdings, Inc. 401(k) Savings Plan, executed December 23, 2009. | |
| 10.34 | Purchase Agreement dated as of December 6, 2004, among MDC and Citigroup Global Markets Inc., J.P. Morgan Securities Inc., Wachovia Capital Markets, LLC, Banc of America Securities LLC and BNP Paribas Securities Corp. (incorporated by reference to Exhibit 10.1 of the Company’s Current Report on Form 8-K filed December 14, 2004). * | |
- 4 -
Table of Contents
| Exhibit |
Description | |
| 10.35 | Purchase Agreement dated as of June 28, 2005, among MDC and Citigroup Global Markets Inc., J.P. Morgan Securities Inc., Wachovia Capital Markets, LLC, Banc of America Securities LLC, BNP Paribas Securities Corp., Comerica Securities, Inc., Credit Suisse First Boston LLC, KeyBanc Capital Markets, Greenwich Capital Markets, Inc. and SunTrust Capital Markets, Inc. (incorporated by reference to Exhibit 10.1 of the Company’s Current Report on Form 8-K filed July 7, 2005). * | |
| 10.36 | Distribution Agreement, dated October 6, 2004, between the Registrant, certain of its subsidiaries and Banc of America Securities LLC, BNP Paribas Securities Corp., Citigroup Global Markets Inc., Comerica Securities, Credit Suisse First Boston LLC, Deutsche Bank Securities Inc., Greenwich Capital Markets, Inc., J.P. Morgan Securities Inc., McDonald Investments Inc., Merrill Lynch, Pierce, Fenner & Smith Incorporated, SunTrust Robinson Humphrey Capital Markets, UBS Securities LLC and Wachovia Capital Markets, LLC (incorporated by reference to Exhibit 10.1 of the Company’s Current Report on Form 8-K filed October 7, 2004). * | |
| 10.37 | Amendment No. 1 to Distribution Agreement, dated as of July 20, 2005, among MDC, certain of its subsidiaries and Banc of America Securities LLC, BNP Paribas Securities Corp., Citigroup Global Markets Inc., Comerica Securities, Credit Suisse First Boston LLC, Deutsche Bank Securities Inc., Greenwich Capital Markets, Inc., J.P. Morgan Securities Inc., McDonald Investments Inc., Merrill Lynch, Pierce, Fenner & Smith Incorporated, SunTrust Capital Markets, Inc., UBS Securities LLC and Wachovia Capital Markets, LLC (incorporated by reference to Exhibit 10.1 of the Company’s Current Report on Form 8-K filed July 20, 2005). * | |
| 10.38 | Amended and Restated Distribution Agreement, dated as of January 9, 2006, among the Registrant, certain of its subsidiaries and Banc of America Securities LLC, BNP Paribas Securities Corp., Citigroup Global Markets Inc., Comerica Securities, Credit Suisse First Boston LLC, Deutsche Bank Securities Inc., Greenwich Capital Markets, Inc., J.P. Morgan Securities Inc., McDonald Investments Inc., Merrill Lynch, Pierce, Fenner & Smith Incorporated, SunTrust Capital Markets, Inc., UBS Securities LLC and Wachovia Capital Markets, LLC (incorporated by reference to Exhibit 10.1 of the Company’s Current Report on Form 8-K filed January 9, 2006). * | |
| 10.39 | Sub-Sublease agreement between MDC and CVentures, Inc., executed July 25, 2005 (incorporated by reference to Exhibit 10.1 of the Company’s Current Report on Form 8-K filed July 27, 2005). * | |
| 10.40 | First Amendment to Sub-Sublease agreement between MDC and CVentures, Inc., executed on March 28, 2006 (incorporated by reference to Exhibit 10.1 of the Company’s Current Report on Form 8-K filed March 29, 2006). * | |
| 12 | Ratio of Earnings to Fixed Charges Schedule. | |
| 21 | Subsidiaries of the Company. | |
| 23 | Consent of Ernst & Young LLP. | |
| 31.1 | Certification of Chief Executive Officer required by 17 CFR 240.13a-14(a), pursuant to Section 302 of the Sarbanes-Oxley Act of 2002. | |
| 31.2 | Certification of Chief Financial Officer required by 17 CFR 240.13a-14(a), pursuant to Section 302 of the Sarbanes-Oxley Act of 2002. | |
| 32.1 | Certification of Chief Executive Officer required by 17 CFR 240.13a-14(b), pursuant to Section 906 of the Sarbanes-Oxley Act of 2002. | |
| 32.2 | Certification of Chief Financial Officer required by 17 CFR 240.13a-14(b), pursuant to Section 906 of the Sarbanes-Oxley Act of 2002. | |
| * | Incorporated by reference. |
- 5 -