Attached files
| file | filename |
|---|---|
| 8-K - ASTORIA FINANCIAL CORP | v173329_8k.htm |

Investor Presentation
Fourth Quarter Ended
December 31, 2009
www.astoriafederal.com
LONG ISLAND’S PREMIER COMMUNITY BANK
1
Forward Looking Statement
This presentation may contain a number of forward-looking statements within the meaning of Section 27A of the Securities Act of 1933, as amended, and Section 21E of the Securities Exchange Act of 1934, as
amended. Forward-looking statements are based on various assumptions and analyses made by us in light of our management’s experience and perception of historical trends, current conditions and expected future developments, as well
as other factors we believe are appropriate under the circumstances. These statements are not guarantees of future performance and are subject to risks, uncertainties and other factors (many of which are beyond our control) that could cause
actual results to differ materially from future results expressed or implied by such forward-looking statements. These factors include, without limitation, the following: the timing and occurrence or non-occurrence of events may be subject
to circumstances beyond our control; there may be increases in competitive pressure among financial institutions or from non-financial institutions; changes in the interest rate environment may reduce interest margins or affect the value of our
investments; changes in deposit flows, loan demand or real estate values may adversely affect our business; changes in accounting principles, policies or guidelines may cause our financial condition to be perceived differently; general economic conditions,
either nationally or locally in some or all areas in which we do business, or conditions in the real estate or securities markets or the banking industry may be less favorable than we currently anticipate; legislative or regulatory changes may adversely
affect our business; applicable technological changes may be more difficult or expensive than we anticipate; success or consummation of new business initiatives may be more difficult or expensive than we anticipate; or litigation or matters before regulatory
agencies, whether currently existing or commencing in the future, may be determined adverse to us or may delay occurrence or non-occurrence of events longer than we anticipate. We assume no obligation to update any forward-looking statements
to reflect events or circumstances after the date of this document.
2
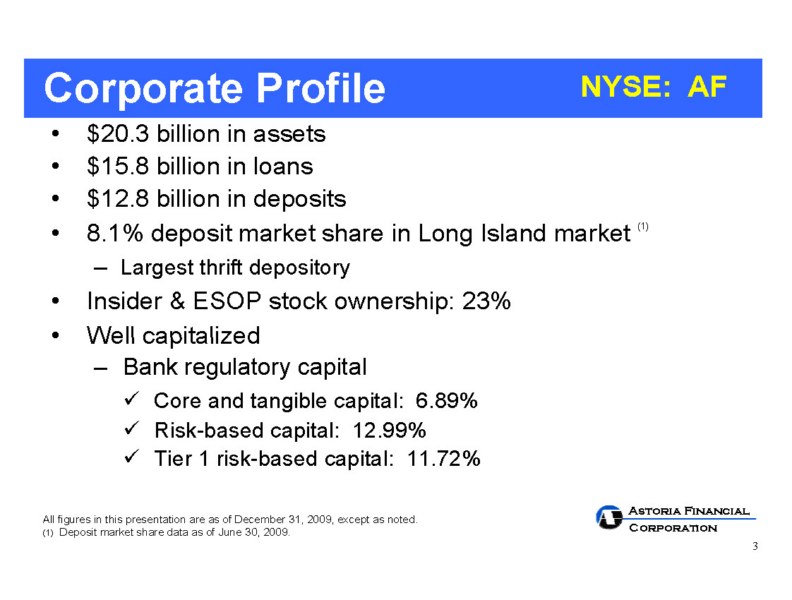
NYSE: AF
Corporate Profile
$20.3 billion in assets
$15.8 billion in loans
$12.8 billion in deposits
8.1% deposit market share in Long Island market (1)
– Largest thrift depository
Insider & ESOP stock ownership: 23%
Well capitalized
–
Bank regulatory capital
Core and tangible capital: 6.89%
Risk-based capital: 12.99%
Tier 1 risk-based capital: 11.72%
All figures in this presentation are as of December 31, 2009, except as noted.
(1) Deposit market share data as of June 30, 2009.
3

EFFICIENCY
MORTGAGE LENDING
• Portfolio lender,
• 1-4 Family, Multi-Family and CRE
expertise
• Solid asset quality
RETAIL BANKING
•
Premier community bank on
Long
Island
•
Dominant deposit market share
•
#1 thrift depository in core market
Same Simple Business Model
NOT A MTGE. BANKER
4

$11.9 billion portfolio
•
Primarily 5/1 and 7/1 jumbo prime hybrid ARMs
•
No sub-prime, payment option or negative amortization ARM lending
•
2009 Originations of $3.6 billion
(1), average loan amount for portfolio = $715,000
•
Weighted Average LTV for 2009 portfolio production = 58% at origination
•
Weighted Average LTV on total 1-4 family loan portfolio
< 62%(2)
$6.3 billion, or 53%, of portfolio originated in 2007, 2008, 2009; Weighted Average LTV = 59%(2)
$5.6 billion, or 47%, of portfolio originated 2006 and earlier; Weighted Average LTV = 64%(2)
Multiple delivery channels provide flexibility & efficiency
•
Retail
• Commissioned brokers covering 17 states(3)
• Third party originators – correspondents covering 18 states(3)
Secondary marketing capability
•
Sale of 30 year fixed-rate conforming loans
Geographically diversified portfolio
• Reduces lending concentrations
1-4 Family Mortgage Lending
(1) Includes loans originated for sale.
(2) Based on current principal balances and original appraised values.
(3) All loans underwritten to Astoria’s stringent standards. Includes Washington, D.C.
5

$3.4 billion in
portfolio
Weighted average coupon at December 31, 2009: 6.03%(1)
Weighted average LTV < 61%(2)
Average loan < $1 million
Approximately 70% of multi-family portfolio is subject to rent control or rent stabilization
Limit originations in current economic environment
Multi-family/Commercial Real Estate Portfolio
(1) Excludes non-performing loans
(2) Based on current principal balances and original appraised values.
6
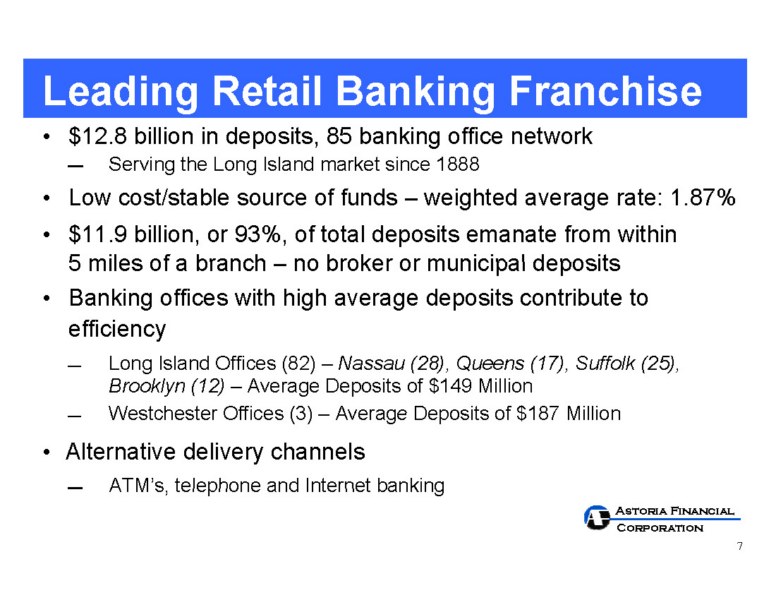
• $12.8 billion in deposits, 85 banking office network
Serving the Long Island market since 1888
• Low cost/stable source of funds – weighted
average rate: 1.87%
• $11.9 billion, or 93%, of total deposits emanate
from within
5 miles of a branch – no broker or municipal deposits
• Banking offices with high average deposits contribute
to efficiency
Long Island Offices (82) – Nassau (28), Queens (17), Suffolk (25), Brooklyn (12) – Average Deposits of $149 Million
Westchester Offices (3) – Average Deposits of $187 Million
• Alternative delivery channels
ATM’s, telephone and Internet banking
Leading Retail Banking Franchise
7

Organic growth vs. de-novo branching
Differentiation from competition
– Maintain pricing discipline
– Pro-active sales culture – PEAK Process
– Focus on customer service – High customer satisfaction
– Community involvement – Support
over 575 local
organizations and not-for-profit agencies in our
markets
Astoria Federal is an integral part of the fabric of the communities we serve
Retail Banking Philosophy
8
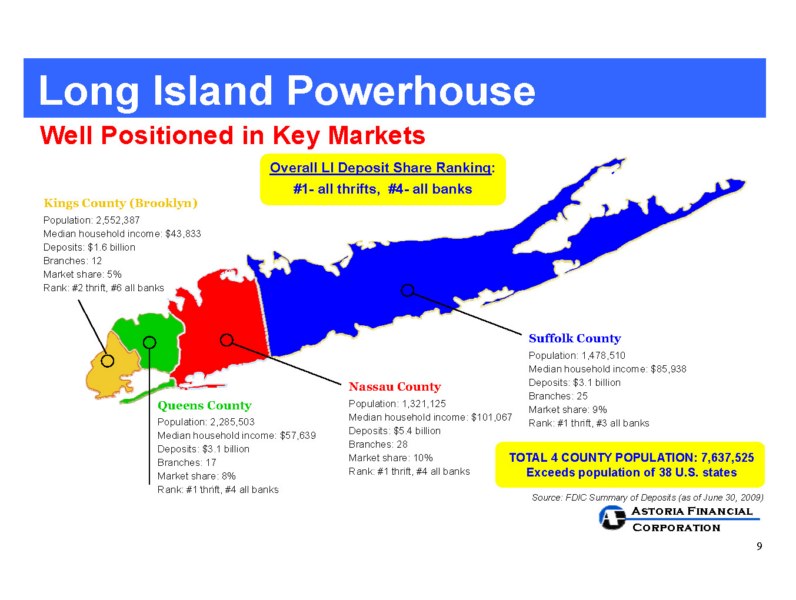
TOTAL 4 COUNTY POPULATION: 7,637,525
Exceeds population of 38 U.S. states
Source: FDIC Summary of Deposits (as of June 30, 2009)
Kings County (Brooklyn)
Population: 2,552,387
Median household income: $43,833
Deposits: $1.6 billion
Branches: 12
Market share: 5%
Rank: #2 thrift, #6 all banks
Queens County
Population: 2,285,503
Median household income: $57,639
Deposits: $3.1 billion
Branches: 17
Market share: 8%
Rank: #1 thrift, #4 all banks
Nassau County
Population: 1,321,125
Median household income: $101,067
Deposits: $5.4 billion
Branches: 28
Market share: 10%
Rank: #1 thrift, #4 all banks
Suffolk County
Population: 1,478,510
Median household income: $85,938
Deposits: $3.1 billion
Branches: 25
Market share: 9%
Rank: #1 thrift, #3 all banks
Long Island Powerhouse
Well Positioned in Key Markets
Overall LI Deposit Share Ranking:
#1- all thrifts, #4- all banks
9
Brooklyn, Queens, Nassau and Suffolk
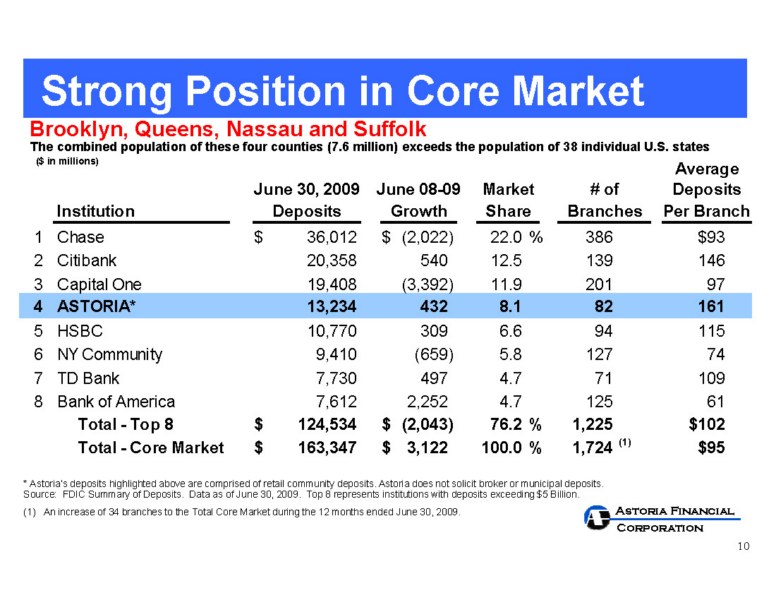
* Astoria’s deposits highlighted above are comprised of retail community deposits. Astoria does not solicit broker or municipal deposits.
Source: FDIC Summary of Deposits. Data as of June 30, 2009. Top 8 represents institutions with deposits exceeding $5 Billion.
The combined population of these four counties (7.6 million) exceeds the population of 38 individual U.S. states
Strong Position in Core Market
(1) An increase of 34 branches to the Total Core Market during the 12 months ended June 30, 2009.
($ in millions)
Average
June 08-09
Market
Deposits
Institution
Growth
Share
Per Branch
1
Chase
$
36,012
$
(2,022)
22.0
%
386
$93
2
Citibank
20,358
540
12.5
139
146
3
Capital One
19,408
(3,392)
11.9
201
97
4
ASTORIA*
13,234
432
8.1
82
161
5
HSBC
10,770
309
6.6
94
115
6
NY Community
9,410
(659)
5.8
127
74
7
TD Bank
7,730
497
4.7
71
109
8
Bank of America
7,612
2,252
4.7
125
61
Total - Top 8
$
124,534
$
(2,043)
76.2
%
1,225
$102
Total - Core Market
$
163,347
$
3,122
100.0
%
1,724
(1)
$95
Deposits
Branches
# of
June 30, 2009
10
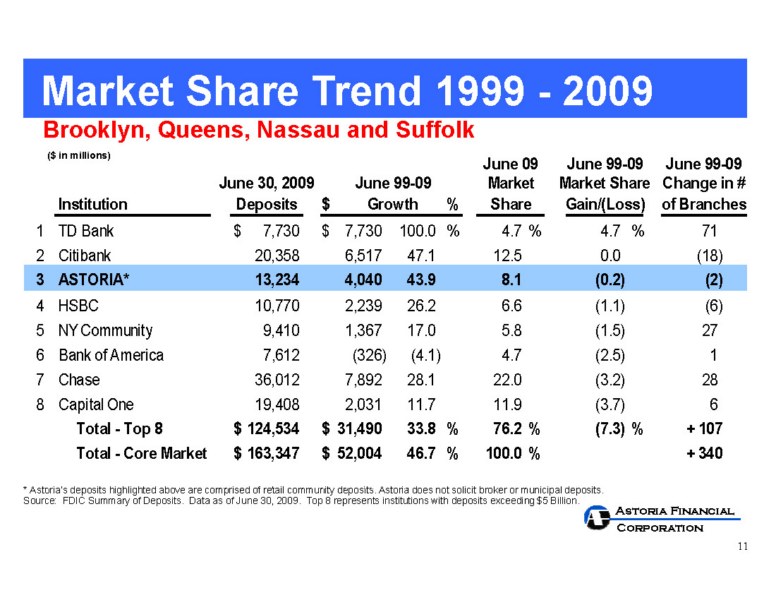
Brooklyn, Queens, Nassau and Suffolk
Market Share Trend 1999 - 2009
($ in millions)
* Astoria’s deposits highlighted above are comprised of retail community deposits. Astoria does not solicit broker or municipal deposits.
Source: FDIC Summary of Deposits. Data as of June 30, 2009. Top 8 represents institutions with deposits exceeding $5 Billion.
June 09
June 99-09
June 99-09
June 30, 2009
June 99-09
Market
Market Share
Change in #
Institution
Deposits
$
Growth
%
Share
Gain/(Loss)
of Branches
1
TD Bank
$
7,730
$
7,730
100.0
%
4.7
%
4.7
%
71
2
Citibank
20,358
6,517
47.1
12.5
0.0
(18)
3
ASTORIA*
13,234
4,040
43.9
8.1
(0.2)
(2)
4
HSBC
10,770
2,239
26.2
6.6
(1.1)
(6)
5
NY Community
9,410
1,367
17.0
5.8
(1.5)
27
6
Bank of America
7,612
(326)
(4.1)
4.7
(2.5)
1
7
Chase
36,012
7,892
28.1
22.0
(3.2)
28
8
Capital One
19,408
2,031
11.7
11.9
(3.7)
6
Total - Top 8
$
124,534
$
31,490
33.8
%
76.2
%
(7.3)
%
+ 107
Total - Core Market
$
163,347
$
52,004
46.7
%
100.0
%
+ 340
11
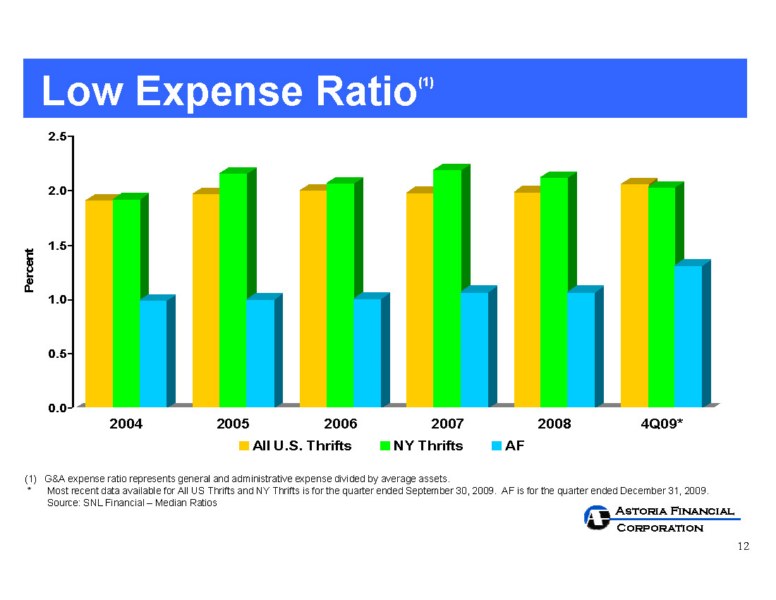
(1) G&A expense ratio represents general and administrative expense divided by average assets.
* Most recent data available for All US Thrifts and NY Thrifts
is for the quarter ended September 30, 2009. AF is for the quarter ended December 31, 2009.
Source: SNL Financial – Median Ratios
Low Expense Ratio(1)
0.0
0.5
1.0
1.5
2.0
2.5
2004
2005
2006
2007
2008
4Q09*
All U.S. Thrifts
NY Thrifts
AF
12
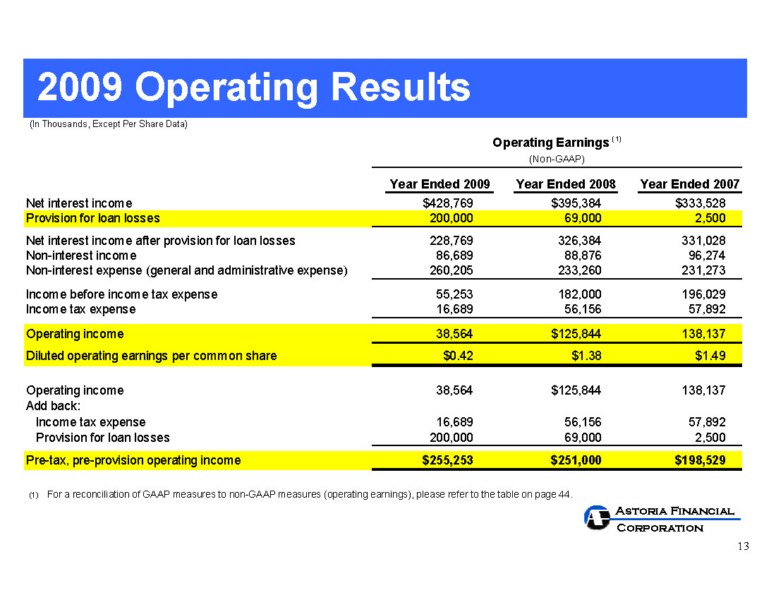
2009 Operating Results
(1) For a reconciliation of GAAP measures to non-GAAP measures (operating earnings), please refer to the table on page 44.
(In Thousands, Except Per Share Data)
Net interest income
$428,769
$395,384
$333,528
Provision for loan losses
200,000
69,000
2,500
Net interest income after provision for loan losses
228,769
326,384
331,028
Non-interest income
86,689
88,876
96,274
Non-interest expense (general and administrative expense)
260,205
233,260
231,273
Income before income tax expense
55,253
182,000
196,029
Income tax expense
16,689
56,156
57,892
Operating income
38,564
$125,844
138,137
Diluted operating earnings per common share
$0.42
$1.38
$1.49
Operating income
38,564
$125,844
138,137
Add back:
Income tax expense
16,689
56,156
57,892
Provision for loan losses
200,000
69,000
2,500
Pre-tax, pre-provision operating income
$255,253
$251,000
$198,529
Year Ended 2007
Operating Earnings
(1)
(Non-GAAP)
Year Ended 2008
Year Ended 2009
13
• Credit quality
• Margin expansion
• Capital
Current Focus
14
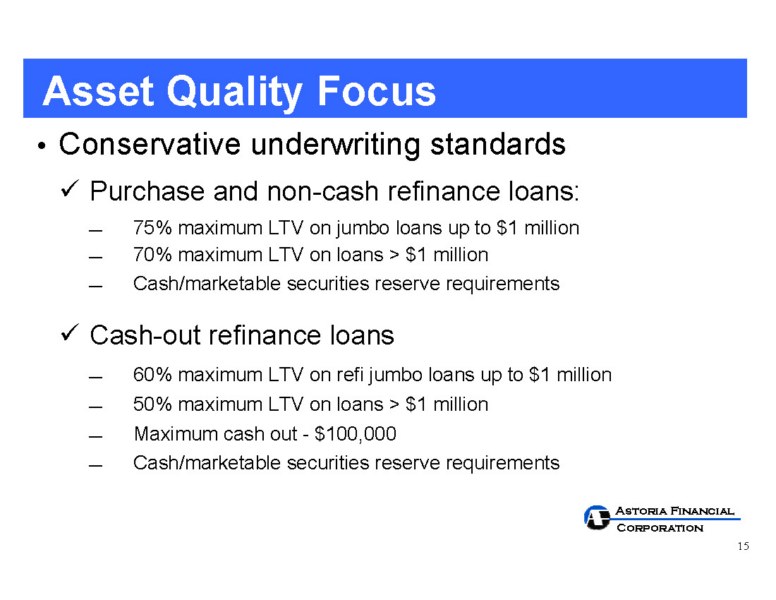
• Conservative underwriting standards
Purchase and non-cash refinance loans:
75% maximum LTV on jumbo loans up to $1 million
70% maximum LTV on loans > $1 million
Cash/marketable securities reserve requirements
Cash-out refinance loans
60% maximum LTV on refi jumbo loans up to $1 million
50% maximum LTV on loans > $1 million
Maximum cash out - $100,000
Cash/marketable securities reserve requirements
Asset Quality Focus
15

• Limited credit risk
Conservative underwriting,
top quality loans, low LTVs
No sub-prime, payment option or negative amortization ARM lending
Non-performing loans: $408.6 million or 2.02% of total assets
Includes $57.2 million of troubled debt restructurings (“TDR”)
Includes $228.5 million of non-performing one-to-four family loans which, at 6 months delinquent and annually thereafter, were reviewed and adjusted, as needed, to estimated fair value less estimated
selling costs
No geographic concentration of NPLs
Net charge-offs to average loans outstanding: 77 basis points YTD
• Top quality MBS portfolio
97% GSE/agency, balance ‘AAA’ rated
CMOs, seasoned collateral, well structured with minimal extension risk
Average life 1.9 years
Asset Quality Focus
16
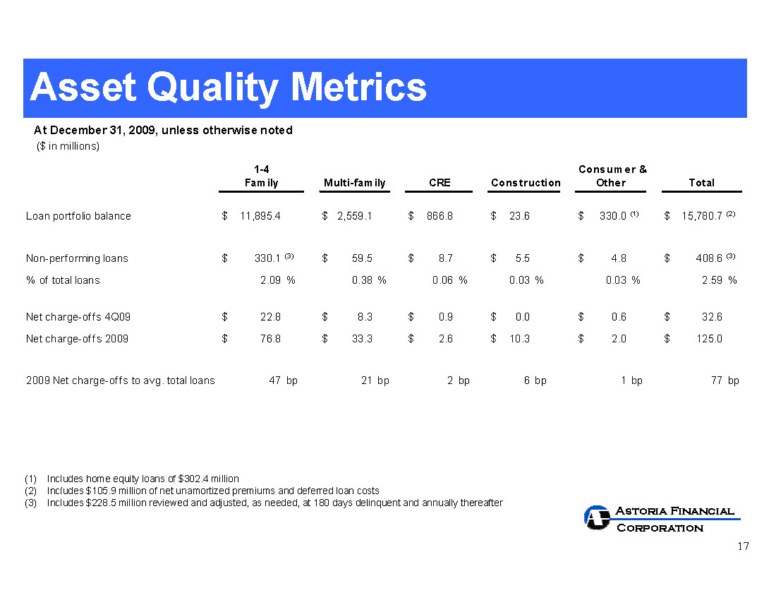
Asset Quality Metrics
At December 31, 2009, unless otherwise noted
($ in millions)
Includes home equity loans of $302.4 million
Includes $105.9 million of net unamortized premiums and deferred loan costs
Includes $228.5 million reviewed and adjusted, as needed, at 180 days delinquent and annually thereafter
Consumer &
Multi-family
Construction
Loan portfolio balance
$
11,895.4
$
2,559.1
$
866.8
$
23.6
$
330.0
(1)
$
15,780.7
(2)
Non-performing loans
$
330.1
(3)
$
59.5
$
8.7
$
5.5
$
4.8
$
408.6
(3)
% of total loans
2.09
%
0.38
%
0.06
%
0.03
%
0.03
%
2.59
%
Net charge-offs 4Q09
$
22.8
$
8.3
$
0.9
$
0.0
$
0.6
$
32.6
Net charge-offs 2009
$
76.8
$
33.3
$
2.6
$
10.3
$
2.0
$
125.0
2009 Net charge-offs to avg. total loans
47
bp
21
bp
2
bp
6
bp
1
bp
77
bp
Other
1-4
Family
Total
CRE
17
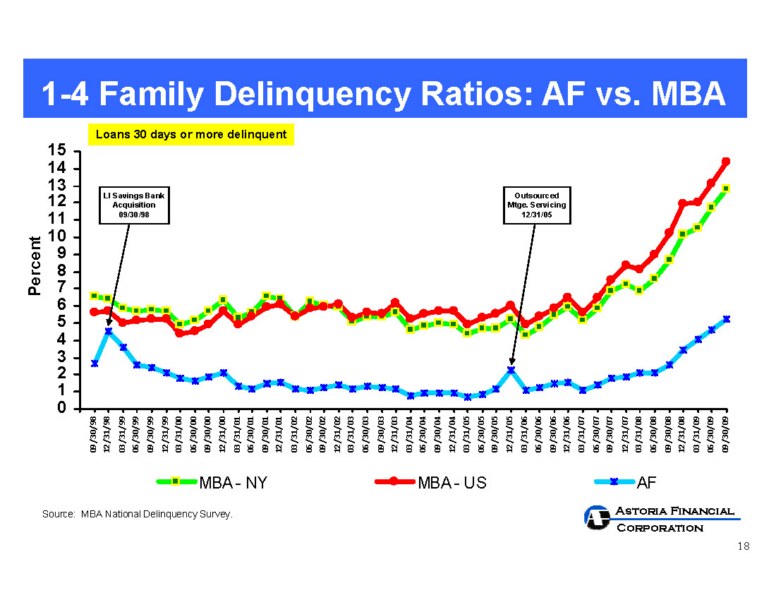
Source: MBA National Delinquency Survey.
1-4 Family Delinquency Ratios: AF vs. MBA
Outsourced
Mtge. Servicing
12/31/05
LI Savings Bank
Acquisition
09/30/98
Loans 30 days or more delinquent
0
1
2
3
4
5
6
7
8
9
10
11
12
13
14
15
MBA - NY
MBA - US
AF
18
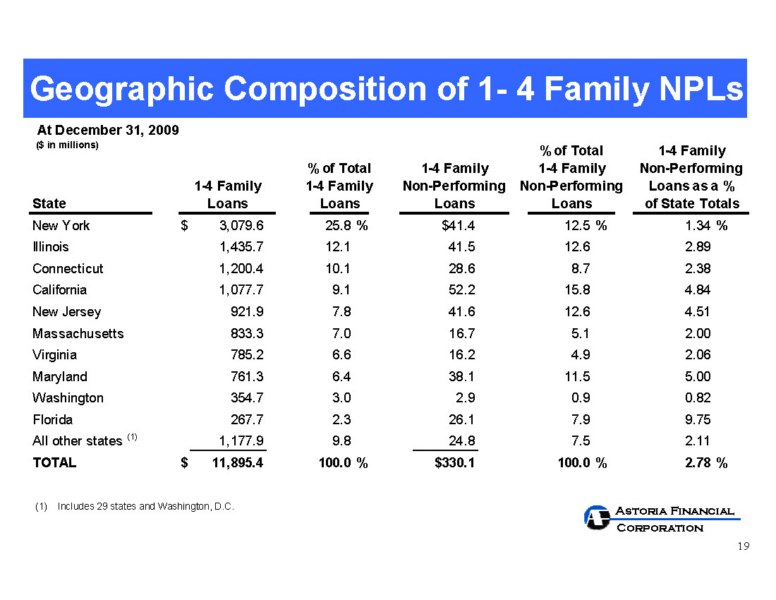
Geographic Composition of 1- 4 Family NPLs
($ in millions)
At December 31, 2009
Includes 29 states and Washington, D.C.
% of Total
% of Total
1-4 Family
1-4 Family
Non-Performing
1-4 Family
Non-Performing
Non-Performing
Loans as a %
State
Loans
Loans
Loans
of State Totals
New York
$
3,079.6
25.8
%
$41.4
12.5
%
1.34
%
Illinois
1,435.7
12.1
41.5
12.6
2.89
Connecticut
1,200.4
10.1
28.6
8.7
2.38
California
1,077.7
9.1
52.2
15.8
4.84
New Jersey
921.9
7.8
41.6
12.6
4.51
Massachusetts
833.3
7.0
16.7
5.1
2.00
Virginia
785.2
6.6
16.2
4.9
2.06
Maryland
761.3
6.4
38.1
11.5
5.00
Washington
354.7
3.0
2.9
0.9
0.82
Florida
267.7
2.3
26.1
7.9
9.75
All other states
(1)
1,177.9
9.8
24.8
7.5
2.11
TOTAL
$
11,895.4
100.0
%
$330.1
100.0
%
2.78
%
1-4 Family
Loans
1-4 Family
19
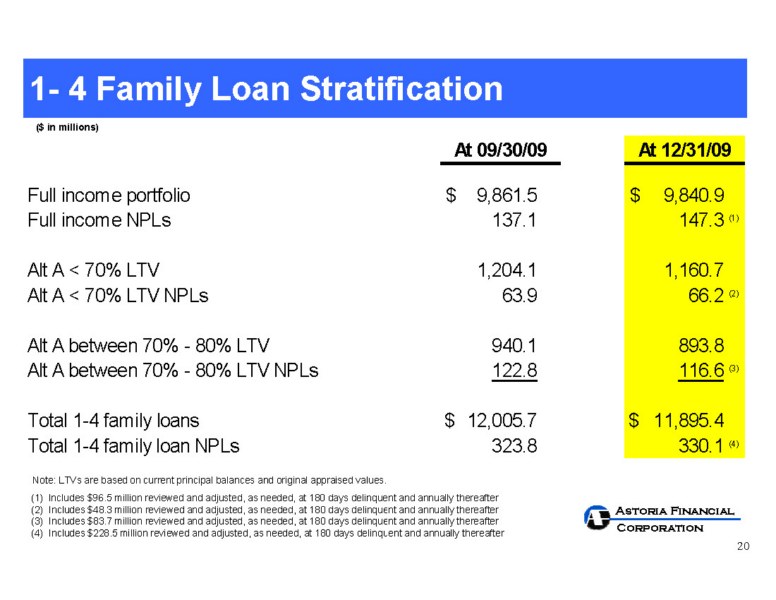
1- 4 Family Loan Stratification
Note: LTVs are based on current principal balances and original appraised values.
(1) Includes $96.5 million reviewed and adjusted, as needed, at 180 days delinquent and annually thereafter
Includes $48.3 million reviewed and adjusted, as needed, at 180 days delinquent and annually thereafter
Includes $83.7 million reviewed and adjusted, as needed, at 180 days delinquent and annually thereafter
Includes $228.5 million reviewed and adjusted, as needed, at 180 days delinquent and annually thereafter
($ in millions)
Full income portfolio
$
9,861.5
$
9,840.9
Full income NPLs
137.1
147.3
(1)
Alt A < 70% LTV
1,204.1
1,160.7
Alt A < 70% LTV NPLs
63.9
66.2
(2)
Alt A between 70% - 80% LTV
940.1
893.8
Alt A between 70% - 80% LTV NPLs
122.8
116.6
(3)
Total 1-4 family loans
$
12,005.7
$
11,895.4
Total 1-4 family loan NPLs
323.8
330.1
(4)
At 09/30/09
At 12/31/09
20
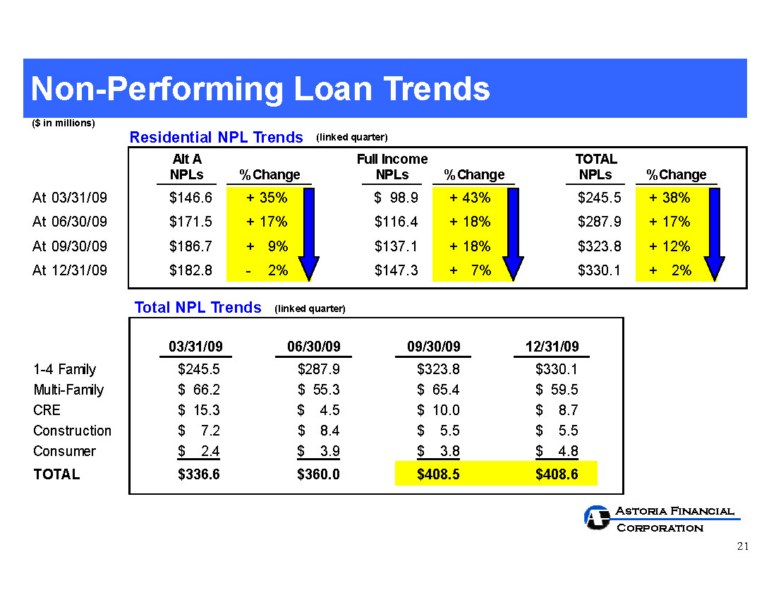
Non-Performing Loan Trends
($ in millions)
Residential NPL Trends
(linked quarter)
Total NPL Trends
(linked quarter)
Alt A
Full Income
TOTAL
NPLs
NPLs
NPLs
At 03/31/09
$146.6
+ 35%
$ 98.9
+ 43%
$245.5
+ 38%
At 06/30/09
$171.5
+ 17%
$116.4
+ 18%
$287.9
+ 17%
At 09/30/09
$186.7
+ 9%
$137.1
+ 18%
$323.8
+ 12%
At 12/31/09
$182.8
- 2%
$147.3
+ 7%
$330.1
+ 2%
% Change
% Change
% Change
1-4 Family
$245.5
$287.9
$323.8
$330.1
Multi-Family
$ 66.2
$ 55.3
$ 65.4
$ 59.5
CRE
$ 15.3
$ 4.5
$ 10.0
$ 8.7
Construction
$ 7.2
$ 8.4
$ 5.5
$ 5.5
Consumer
$ 2.4
$ 3.9
$ 3.8
$ 4.8
TOTAL
$336.6
$360.0
$408.5
$408.6
03/31/09
06/30/09
09/30/09
12/31/09
21
• Credit quality
• Margin expansion
• Capital
Current Focus
22
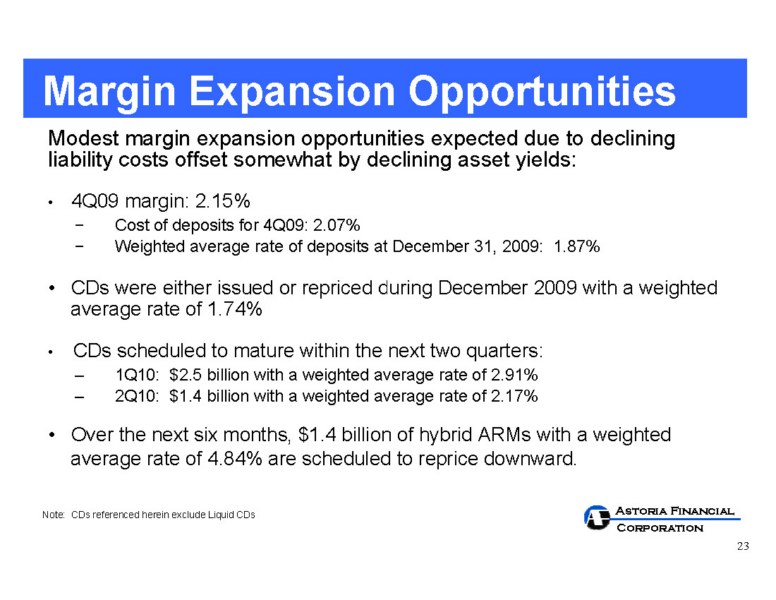
Modest margin expansion opportunities expected due to declining liability costs offset somewhat by declining asset yields:
4Q09 margin: 2.15%
Cost of deposits for 4Q09: 2.07%
Weighted average rate of deposits at December 31, 2009: 1.87%
CDs were either issued or repriced during December 2009 with a weighted average rate of 1.74%
CDs scheduled to mature within the next two quarters:
1Q10: $2.5 billion with a weighted average rate of 2.91%
2Q10: $1.4 billion with a weighted average rate of 2.17%
Over the next six months, $1.4 billion of hybrid ARMs with a weighted average rate of 4.84% are scheduled to reprice downward.
Margin Expansion Opportunities
Note: CDs referenced herein exclude Liquid CDs
23

• Credit quality
• Margin
expansion
• Capital
Current Focus
24
4Q09 annualized pre-tax, pre-provision operating income of $246 million(1)
Remain profitable throughout 2010
High levels of bank regulatory capital
° At December 31, 2009:
Core and tangible capital: 6.89%
Risk-based capital: 12.99%
Tier 1 risk-based capital: 11.72%
Internal Capital Generation
(1) For a reconciliation of GAAP measures to non-GAAP measures, please refer to the table on page 43.
25
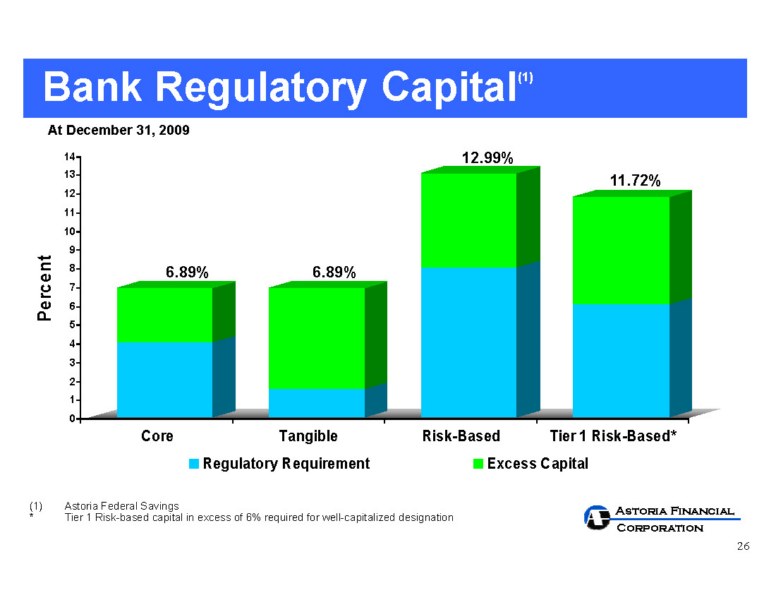
6.89%
6.89%
Bank Regulatory Capital(1)
12.99%
Astoria Federal Savings
* Tier 1 Risk-based
capital in excess of 6% required for well-capitalized designation
At December 31, 2009
11.72%
0
1
2
3
4
5
6
7
8
9
10
11
12
13
14
Core
Tangible
Risk-Based
Tier 1 Risk-Based*
Regulatory Requirement
Excess Capital
26

• Positive
Credit Trends
- Credit costs appear to be stabilizing
- Positive credit trends suggest future credit
cost improvement
• Positive Margin Trends
- Modest increases expected in the first half of 2010
- Liability costs declining more rapidly than asset yields
• Capital Adequacy
- Remain profitable in 2010
- Maintain high levels of bank regulatory capital
Future Outlook
27

www.astoriafederal.com
LONG ISLAND’S PREMIER COMMUNITY BANK
Addendum
28
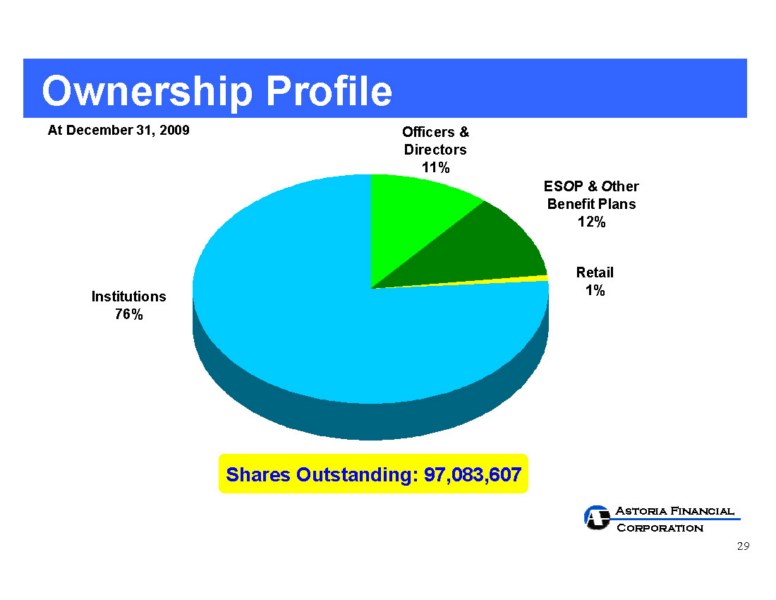
At December 31, 2009
Shares Outstanding: 97,083,607
Ownership Profile
ESOP & Other
Benefit Plans
12%
Officers &
Directors
11%
Retail
1%
Institutions
76%
29
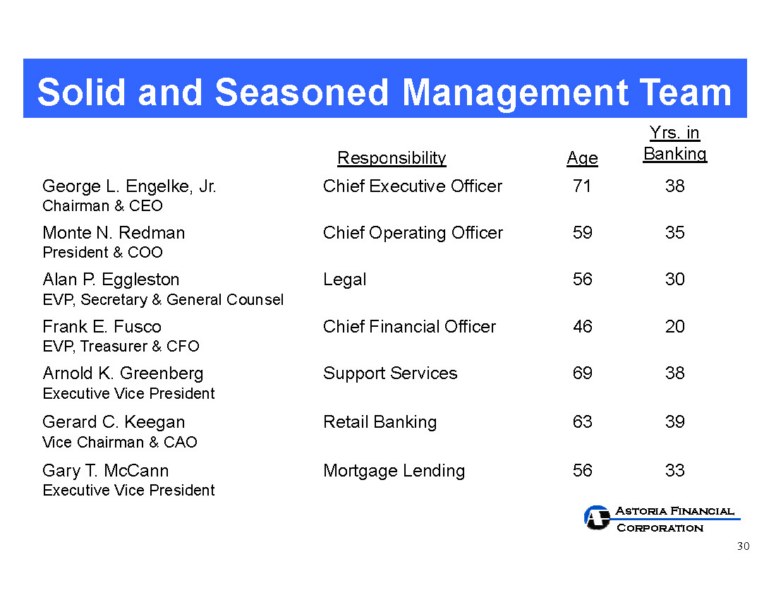
Responsibility
Age
Yrs. in Banking
George L. Engelke, Jr.
Chairman & CEO
Chief Executive Officer
71
38
Monte N. Redman
President & COO
Chief Operating Officer
59
35
Alan P. Eggleston
EVP, Secretary & General Counsel
Legal
56
30
Frank E. Fusco
EVP, Treasurer & CFO
Chief Financial Officer
46
20
Arnold K. Greenberg
Executive Vice President
Support Services
69
38
Gerard C. Keegan
Vice Chairman & CAO
Retail Banking
63
39
Gary T. McCann
Executive Vice President
Mortgage Lending
56
33
Solid and Seasoned Management Team
30
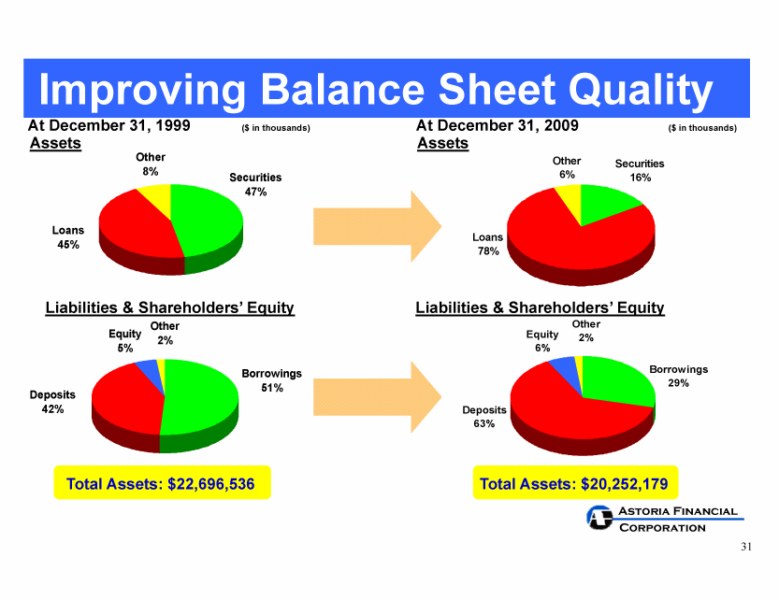
Total Assets: $22,696,536
At December 31, 1999
Assets
Assets
Liabilities & Shareholders’ Equity
Liabilities & Shareholders’ Equity
Total Assets: $20,252,179
At December 31, 2009
Improving Balance Sheet Quality
($ in thousands)
($ in thousands)
Other
8%
Loans
45%
Securities
47%
Loans
78%
Securities
16%
Other
6%
Equity
6%
Borrowings
29%
Deposits
63%
Other
2%
Borrowings
51%
Deposits
42%
Equity
5%
Other
2%
31
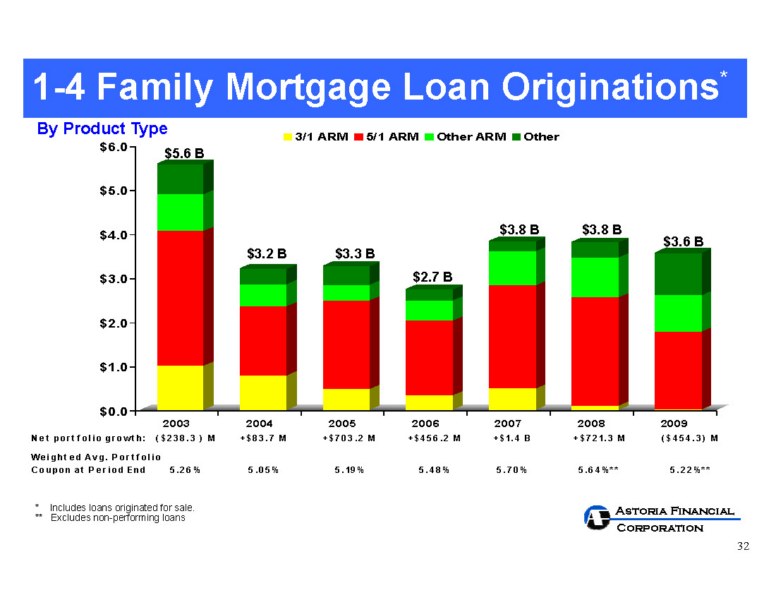
By Product Type
$3.2 B
$3.3 B
$2.7 B
$3.8 B
1-4 Family Mortgage Loan Originations*
32
Other
Other ARM
5/1 ARM
3/1 ARM
2009
2008
2007
2006
2005
2004
2003
$6.0
$5.0
$4.0
$3.0
$2.0
$1.0
$0.0
* Includes loans originated for sale.
** Excludes non-performing loans
$5.6 B
$3.6 B
$3.8 B
Net portfolio growth:
($238.3 ) M
+$83.7 M
+$703.2 M
+$456.2 M
+$1.4 B
+$721.3 M
($454.3) M
Weighted Avg. Portfolio
Coupon at Period End
5.26%
5.05%
5.19%
5.48%
5.70%
5.64%**
5.22%**
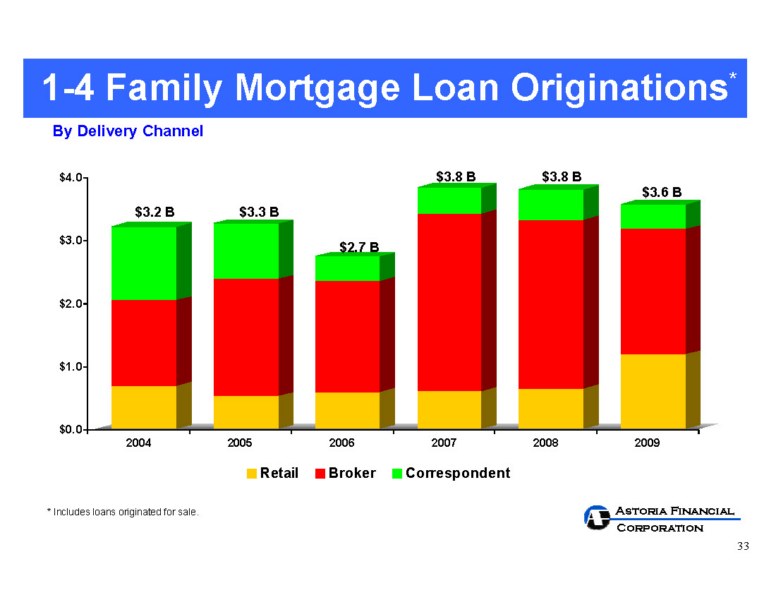
By Delivery Channel
$3.2 B
$3.3 B
$2.7 B
1-4 Family Mortgage Loan Originations*
$3.8 B
$3.8 B
$3.6 B
* Includes loans originated for sale.
$0.0
$1.0
$2.0
$3.0
$4.0
2004
2005
2006
2007
2008
2009
Retail
Broker
Correspondent
33
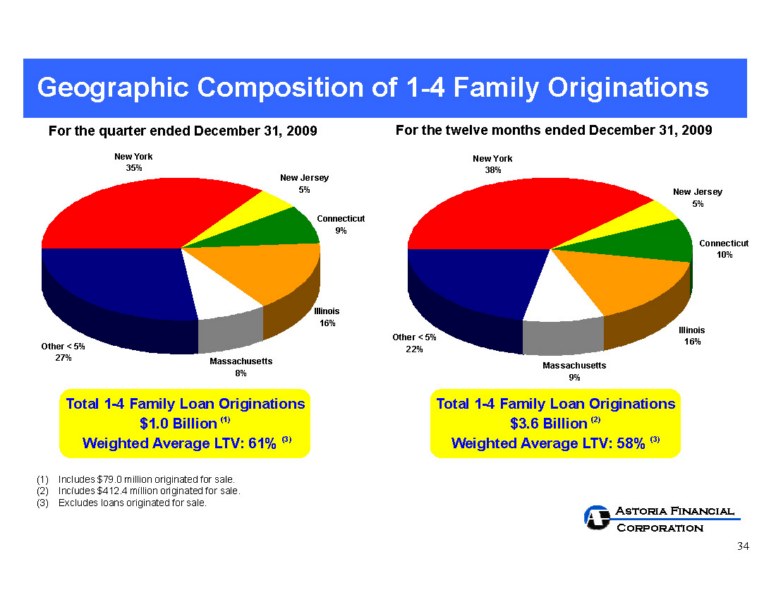
Geographic Composition of 1-4 Family Originations
Total 1-4 Family Loan Originations
$3.6 Billion (2)
Weighted Average LTV: 58% (3)
For the twelve months ended December 31, 2009
For the quarter ended December 31, 2009
Includes $79.0 million originated for sale.
Includes $412.4 million originated for sale.
Excludes loans originated for sale.
Total 1-4 Family Loan Originations
$1.0 Billion (1)
Weighted Average LTV: 61% (3)
Massachusetts
8%
Other < 5%
27%
New York
35%
Illinois
16%
Connecticut
9%
New Jersey
5%
Massachusetts
9%
Other < 5%
22%
New York
38%
Illinois
16%
Connecticut
10%
New Jersey
5%
34
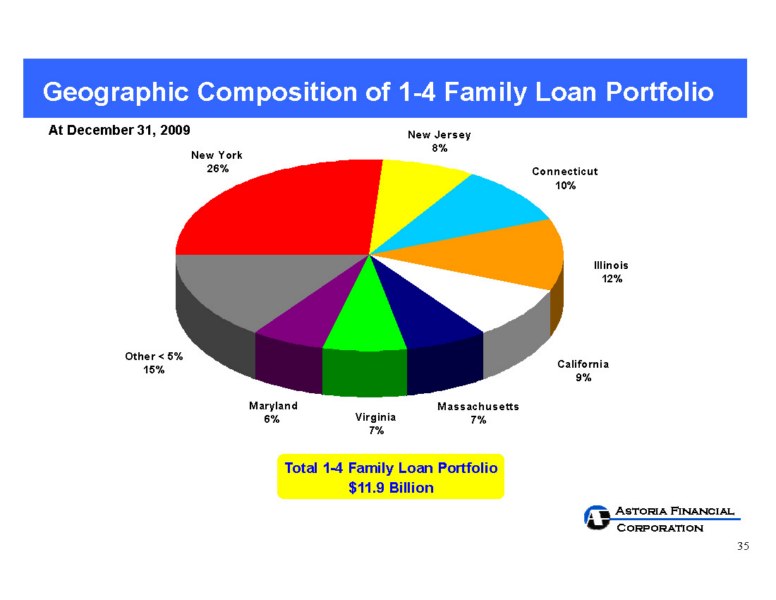
Geographic Composition of 1-4 Family Loan Portfolio
At December 31, 2009
Total 1-4 Family Loan Portfolio
$11.9 Billion
California
9%
Virginia
7%
New York
26%
Connecticut
10%
Maryland
6%
Illinois
12%
New Jersey
8%
Massachusetts
7%
Other < 5%
15%
35
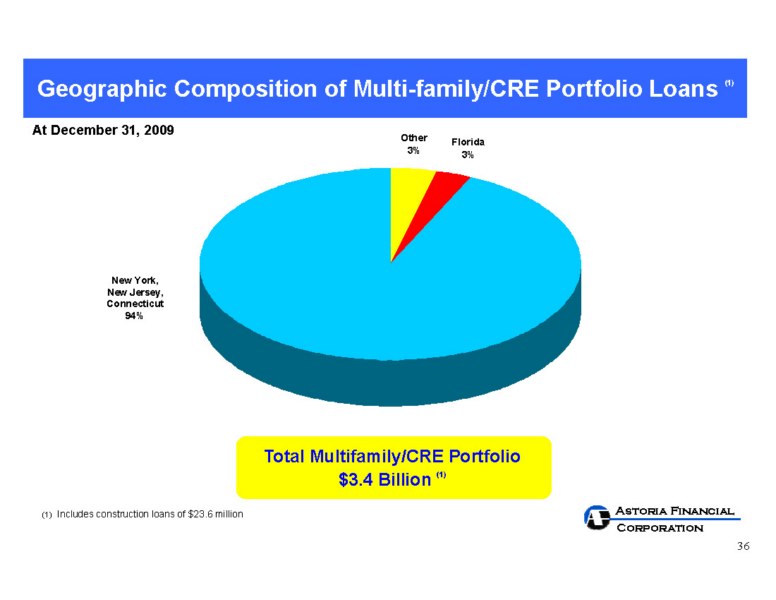
At December 31, 2009
Total Multifamily/CRE Portfolio
$3.4 Billion (1)
New York,
New Jersey,
Connecticut
94%
Geographic Composition of Multi-family/CRE Portfolio Loans (1)
(1) Includes construction loans of $23.6 million
Florida
3%
Other
3%
36
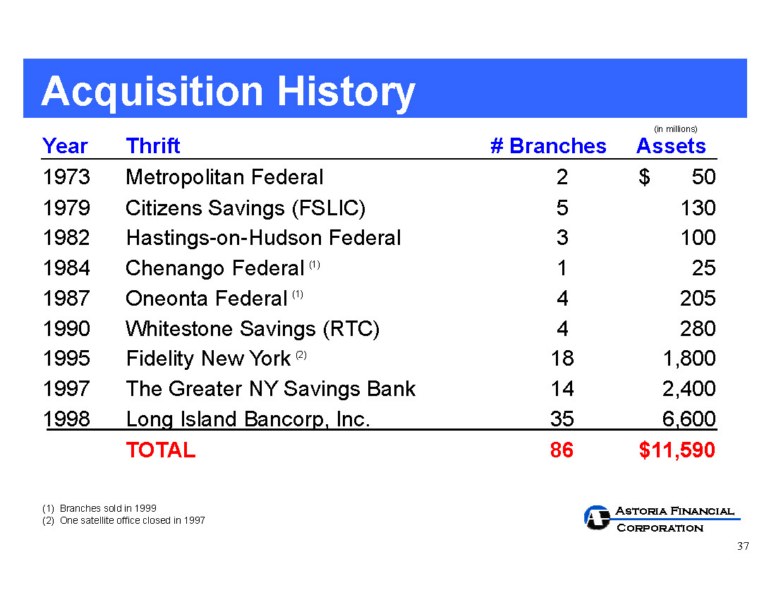
(1) Branches sold in 1999
(2) One satellite office closed in 1997
Year
Thrift
# Branches
Assets
1973
Metropolitan Federal
2
$ 50
1979
Citizens Savings (FSLIC)
5
130
1982
Hastings-on-Hudson Federal
3
100
1984
Chenango Federal (1)
1
25
1987
Oneonta Federal (1)
4
205
1990
Whitestone Savings (RTC)
4
280
1995
Fidelity New York (2)
18
1,800
1997
The Greater NY Savings Bank
14
2,400
1998
Long Island Bancorp, Inc.
35
6,600
TOTAL
86
$11,590
(in millions)
Acquisition History
37
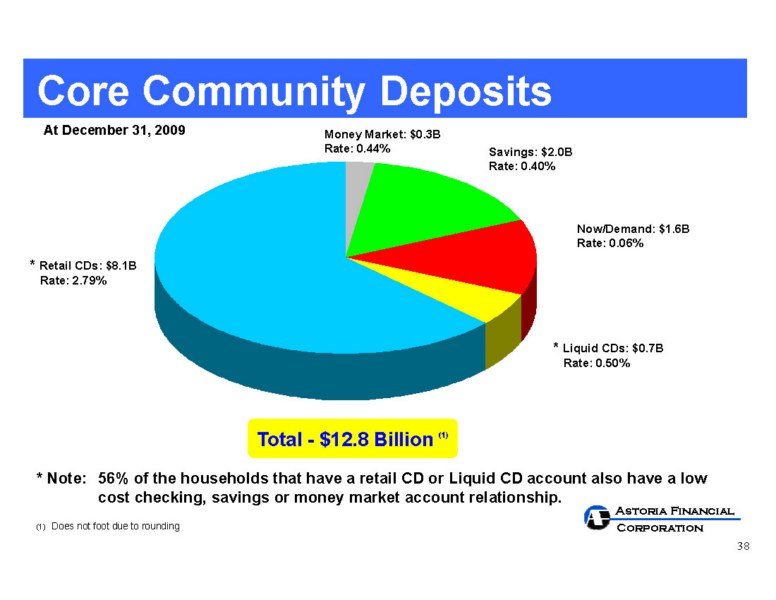
* Note: 56% of the households that have a retail CD or
Liquid CD account also have a low cost checking, savings or money market account relationship.
At December 31, 2009
Total - $12.8 Billion (1)
* Retail CDs: $8.1B
Rate: 2.79%
Money Market: $0.3B
Rate: 0.44%
Savings: $2.0B
Rate: 0.40%
* Liquid CDs: $0.7B
Rate: 0.50%
Now/Demand: $1.6B
Rate: 0.06%
Core Community Deposits
(1) Does not foot due to rounding
Retail CD's
47%
38
Performance based on
Enthusiasm, A
ctions and Knowledge
“Sales Oriented and Service Obsessed”
A “needs” based approach to sales rather than “product” based approach
Highly interactive
program – daily and weekly meetings create a focus that is shared throughout the branch network
Incentives for strong
performance, both individual and team
Sales – PEAK Process
39
Key Findings
: Favorably Positioned Against Competitors
•
74% of Astoria customers are highly satisfied
•
72% of Astoria customers are highly likely to recommend
Astoria to friend/family member
• Astoria customers are 25% more likely
to net increase their
deposit relationship than are competitor customers
• Satisfaction with the branch is by far the strongest
driver of overall satisfaction – 83% of Astoria customers are
highly satisfied with quality of branch service
Customer Satisfaction
40
• Education First
Supports lifelong learning, promotes savings and provides meaningful financial solutions to improve the way our customers live
• Neighborhood Outreach
Supports local organizations that enrich the communities within our market area
Over 575 community-based organizations and not-for-profit agencies supported in our markets
• Results/Recognition
Seven consecutive “Outstanding” Community Reinvestment Act ratings
by OTS
Astoria Federal is an integral part of the fabric of the communities we serve
Community Involvement
Key Initiatives
41

ARM
-
Adjustable Rate Mortgage
CMO
-
Collateralized Mortgage Obligation
CRE
-
Commercial Real Estate
ESOP
-
Employee Stock Ownership Plan
G&A
-
General and Administrative Expense
GAAP
-
Generally Accepted Accounting Principles
GSE
-
Government Sponsored Enterprise
LTV
-
Loan-To-Value Ratio
MBA
-
Mortgage Bankers Association
MBS
-
Mortgage-Backed Securities
NPL
-
Non-Performing Loan
OTS
-
Office of Thrift Supervision
Glossary
42
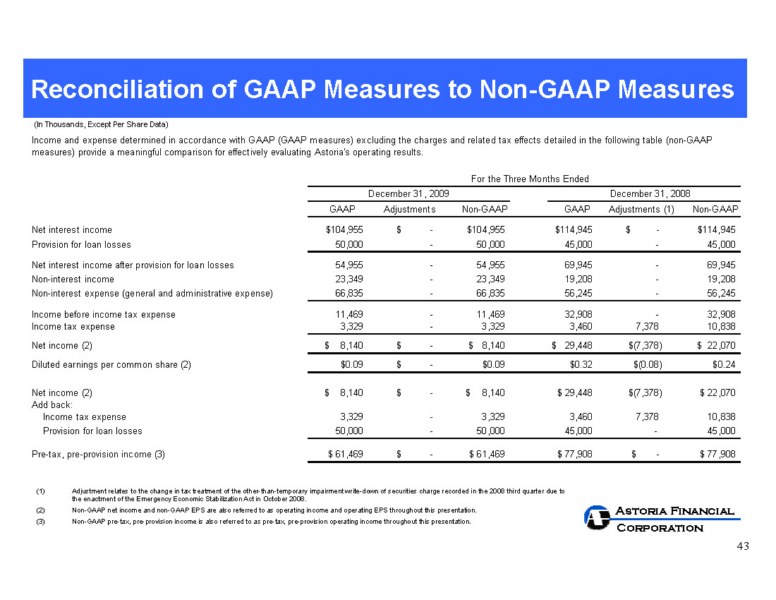
Reconciliation of GAAP Measures to Non-GAAP Measures
Adjustment relates to the change in tax treatment of the other-than-temporary impairment write-down of securities charge recorded in the 2008 third quarter due to the enactment of the Emergency Economic Stabilization
Act in October 2008.
Non-GAAP net income and non-GAAP EPS are also referred to as operating income and operating EPS throughout this presentation.
Non-GAAP pre-tax, pre-provision income is also referred to as pre-tax, pre-provision operating income throughout this presentation.
(In Thousands, Except Per Share Data)
GAAP
Non-GAAP
GAAP
Non-GAAP
Net interest income
$104,955
$ -
$104,955
$114,945
$ -
$114,945
Provision for loan losses
50,000
-
50,000
45,000
-
45,000
Net interest income after provision for loan losses
54,955
-
54,955
69,945
-
69,945
Non-interest income
23,349
-
23,349
19,208
-
19,208
Non-interest expense (general and administrative expense)
66,835
-
66,835
56,245
-
56,245
Income before income tax expense
11,469
-
11,469
32,908
-
32,908
Income tax expense
3,329
-
3,329
3,460
7,378
10,838
Net income (2)
$ 8,140
$ -
$ 8,140
$ 29,448
$(7,378)
$ 22,070
Diluted earnings per common share (2)
$0.09
$ -
$0.09
$0.32
$(0.08)
$0.24
Net income (2)
$ 8,140
$ -
$ 8,140
$ 29,448
$(7,378)
$ 22,070
Add back:
Income tax expense
3,329
-
3,329
3,460
7,378
10,838
Provision for loan losses
50,000
-
50,000
45,000
-
45,000
Pre-tax, pre-provision income (3)
$ 61,469
$ -
$ 61,469
$ 77,908
$ -
$ 77,908
Income and expense determined in accordance with GAAP (GAAP measures) excluding the charges and related tax effects detailed in the following table (non-GAAP
measures) provide a meaningful comparison for effectively evaluating Astoria's operating results.
December 31, 2009
Adjustments
Adjustments (1)
December 31, 2008
For the Three Months Ended
43

Reconciliation of GAAP Measures to Non-GAAP Measures
Non-interest income adjustment relates to the $1.6 million lower of cost or market write-down of premises and equipment held-for-sale recorded in the 2009 second quarter and the $5.3 million other-than-temporary
impairment write-down of securities charge recorded in the 2009 first quarter and non-interest expense adjustment relates to the federal deposit insurance special assessment recorded in the 2009 second quarter.
Non-GAAP net income and non-GAAP EPS are also referred to as operating income and operating EPS throughout this presentation.
Non-GAAP pre-tax, pre-provision income is also referred to as pre-tax, pre-provision operating income throughout this presentation.
Adjustments relate to the other-than-temporary impairment write-down of securities charge recorded in the 2008 third quarter and subsequent tax adjustment recorded in the 2008 fourth quarter as a result of
tax changes due to the enactment of the Emergency Economic Stabilization Act in October 2008.
Adjustments relate to the other-than-temporary impairment write-down of securities charge recorded in the 2007 fourth quarter.
(In Thousands, Except Per Share Data)
`
GAAP
Non-GAAP
GAAP
Non-GAAP
GAAP
Non-GAAP
Net interest income
$428,769
$ -
$428,769
$395,384
$ -
$395,384
$333,528
$ -
$333,528
Provision for loan losses
200,000
-
200,000
69,000
-
69,000
2,500
-
2,500
Net interest income after provision for loan losses
228,769
-
228,769
326,384
-
326,384
331,028
-
331,028
Non-interest income
79,801
6,888
86,689
11,180
77,696
88,876
75,790
20,484
96,274
Non-interest expense (general and administrative expense)
270,056
(9,851)
260,205
233,260
-
233,260
231,273
-
231,273
Income before income tax expense
38,514
16,739
55,253
104,304
77,696
182,000
175,545
20,484
196,029
Income tax expense
10,830
5,859
16,689
28,962
27,194
56,156
50,723
7,169
57,892
Net income (2)
$ 27,684
$ 10,880
$ 38,564
$75,342
$ 50,502
$ 125,844
$124,822
$ 13,315
$138,137
Diluted earnings per common share (2)
$0.30
$0.12
$0.42
$0.82
$0.56
$1.38
$1.35
$0.14
$1.49
Net income (2)
$ 27,684
$ 10,880
$ 38,564
$ 75,342
$ 50,502
$125,844
$124,822
$ 13,315
$138,137
Add back:
Income tax expense
10,830
5,859
16,689
28,962
27,194
56,156
50,723
7,169
57,892
Provision for loan losses
200,000
-
200,000
69,000
-
69,000
2,500
-
2,500
Pre-tax, pre-provision income (3)
$238,514
$ 16,739
$255,253
$ 173,304
$ 77,696
$251,000
$ 178,045
$ 20,484
$198,529
Income and expense determined in accordance with GAAP (GAAP measures) excluding the charges and related tax effects detailed in the following table (non-GAAP measures) provide
a meaningful comparison for effectively evaluating Astoria's operating results.
Adjustments (5)
December 31, 2008
December 31, 2007
For the Twelve Months Ended
December 31, 2009
Adjustments (1)
Adjustments (4)
44

Contact Information
Web site:
www.astoriafederal.com
Email:
ir@astoriafederal.com
Telephone:
(516) 327-7869
Address:
Astoria Financial Corporation
Attn: Investor Relations
One Astoria Federal Plaza
Lake Success, NY 11042
45