Attached files
| file | filename |
|---|---|
| 8-K - FORM 8-K - Ally Financial Inc. | v173082_8k.htm |
| EX-99.1 - EXHIBIT 99.1 - Ally Financial Inc. | v173082_ex99-1.htm |
 Preliminary
2009 Fourth Quarter Results
February 4, 2010
9:00 AM EST
Contact GMAC Investor Relations at (866) 710-4623 or investor.relations@gmacfs.com
 Forward-Looking Statements
In the presentation that follows and related comments by GMAC Inc. (“GMAC”) management, the use of the words “expect,” “anticipate,”
Forward-Looking Statements
In the presentation that follows and related comments by GMAC Inc. (“GMAC”) management, the use of the words “expect,” “anticipate,”
“estimate,” “forecast,”
“initiative,” “objective,” “plan,” “goal,” “project,” “outlook,” “priorities,” “target,” “explore,” “positions,”
“intend,” “evaluate,”
“pursue,” “seek,” “may,” “would,” “could,” “should,” “believe,” “potential,” “continue,” or similar expressions is intended
to identify forward-
looking statements. All statements herein and in related management comments, other than statements of historical fact, including without
limitation, statements about future events and financial performance, are forward-looking statements
that involve certain risks and
uncertainties. While these statements represent our current judgment on what the future may hold, and we believe these judgments are
reasonable, these statements are not guarantees of any events or financial results, and
GMAC’s actual results may differ materially due to
numerous important factors that are described in the most recent reports on SEC Forms 10-K and 10-Q for GMAC, each of which may be
revised or supplemented in subsequent reports on SEC Forms 10-Q
and 8-K. Such factors include, among others, the following: uncertainty of
GMAC's ability to enter into transactions or execute strategic alternatives to realize the value of its Residential Capital, LLC (“ResCap”)
operations; our inability
to repay our outstanding obligations to the U.S. Department of the Treasury, or to do so in a timely fashion and without
disruption to our business; our inability to successfully accommodate the additional risk exposure relating to providing wholesale and
retail
financing to Chrysler dealers and customers and the resulting impact to our financial stability; uncertainty related to Chrysler’s and GM’s recent
exits from bankruptcy; uncertainty related to the new financing arrangement between GMAC
and Chrysler; securing low cost funding for
GMAC and ResCap and maintaining the mutually beneficial relationship between GMAC and GM, and GMAC and Chrysler; our ability to
maintain an appropriate level of debt and capital; the profitability and financial
condition of GM and Chrysler; our ability to realize the
anticipated benefits associated with our recent conversion to a bank holding company, and the increased regulation and restrictions that we
are now subject to; continued challenges in the residential
mortgage and capital markets; the potential for deterioration in the residual value of
off-lease vehicles; the continuing negative impact on ResCap of the decline in the U.S. housing market; changes in U.S. government-
sponsored mortgage programs or
disruptions in the markets in which our mortgage subsidiaries operate; disruptions in the market in which we
fund GMAC’s and ResCap’s operations, with resulting negative impact on our liquidity; changes in our accounting assumptions that may
require
or that result from changes in the accounting rules or their application, which could result in an impact on earnings; changes in the
credit ratings of ResCap, GMAC, Chrysler or GM; changes in economic conditions, currency exchange rates or political stability
in the markets
in which we operate; and changes in the existing or the adoption of new laws, regulations, policies or other activities of governments, agencies
and similar organizations. Investors are cautioned not to place undue reliance
on forward-looking statements. GMAC undertakes no obligation
to update publicly or otherwise revise any forward-looking statements except where expressly required by law. A reconciliation of certain non-
GAAP financial measures included within this presentation
is provided in the supplemental charts.
Use of the term “loans” describes products associated with direct and indirect lending activities of GMAC’s global operations. The specific
products include retail installment sales
contracts, loans, lines of credit, leases or other financing products. The term “originate” refers to
GMAC’s purchase, acquisition or direct origination of various “loan” products.
2
 GMAC: Overview
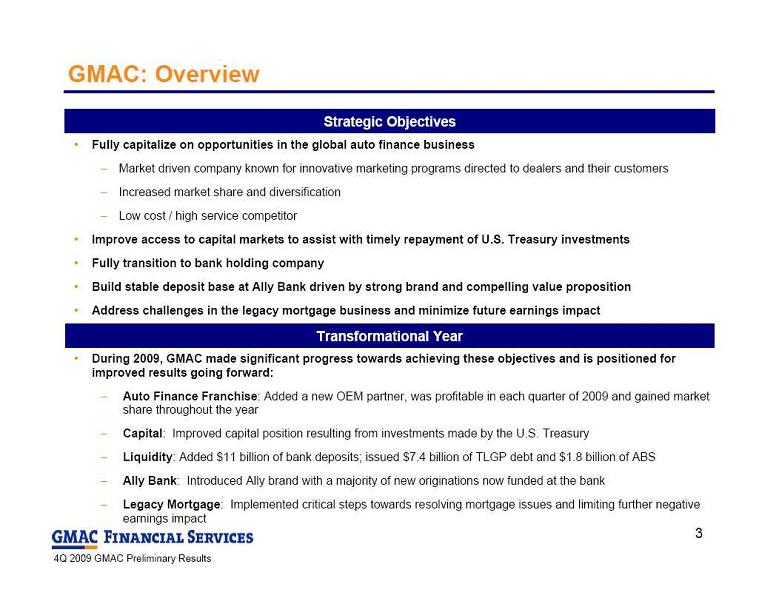
During 2009, GMAC made significant progress towards achieving these objectives and is positioned for
GMAC: Overview
During 2009, GMAC made significant progress towards achieving these objectives and is positioned for
improved results going forward:
Auto Finance Franchise: Added a new OEM partner, was profitable in each quarter of 2009 and
gained market
share throughout the year
Capital: Improved capital position resulting from investments made by the U.S. Treasury
Liquidity: Added $11 billion of bank deposits; issued $7.4 billion of TLGP debt and $1.8 billion of ABS
Ally Bank: Introduced Ally brand with a majority of new originations now funded at the bank
Legacy Mortgage: Implemented critical steps towards resolving mortgage issues and limiting further negative
earnings impact
Transformational Year
Strategic Objectives
Fully capitalize on opportunities in the global auto finance business
Market driven company known for innovative marketing programs directed to dealers and their customers
Increased market share and diversification
Low cost / high service competitor
Improve access to capital markets to assist with timely repayment of U.S. Treasury investments
Fully transition to bank holding company
Build stable deposit base at Ally Bank driven by strong brand and compelling value proposition
Address challenges in the legacy mortgage business and minimize future earnings impact
3
 Fourth quarter results impacted by the following significant items:
GMAC: Fourth Quarter 2009 Highlights
Key Statistics
($ millions)
4Q 09
3Q 09
4Q 08
(1)
3Q 09
4Q 08
Net financing revenue
603
$
571
$
(426)
$
32
$
1,029
$
Provision for loan losses
(2)
3,432
$
682
$
1,251
$
2,750
$
2,181
$
Net (loss) income from continuing operations
(3,866)
$
(575)
$
7,705
$
(3,291)
$
(11,571)
$
Net (loss) income
(3)
(4,953)
$
(767)
$
7,462
$
(4,186)
$
(12,415)
$
Total assets
172,306
$
178,254
$
189,476
$
(5,948)
$
(17,170)
$
Tier 1 capital ratio
14.1%
14.4%
N/A
-0.3%
N/A
(1) Includes approximately $11.5 billion of pre-tax income recognized from 4Q 08 bond exchange
(2) $2.4 billion of provision results from strategic mortgage actions taken in 4Q 09
(3) Net loss in 4Q 09 negatively impacted by $1.0 billion of tax valuation allowance
Increase/(Decrease) vs.
Significant Pre-Tax Items in 4Q 09
($ millions)
4Q 09
Losses related to strategic mortgage actions
(3,282)
$
Repurchase reserve expense
(573)
Amortization of bond exchange discount
(308)
Legacy Nuvell subprime portfolio provision
(262)
Mortgage MSR marks due to model updates
(122)
International Auto loss on wind-down operations
(118)
Pre-Tax Impact
(4,665)
$
4
Fourth quarter results impacted by the following significant items:
GMAC: Fourth Quarter 2009 Highlights
Key Statistics
($ millions)
4Q 09
3Q 09
4Q 08
(1)
3Q 09
4Q 08
Net financing revenue
603
$
571
$
(426)
$
32
$
1,029
$
Provision for loan losses
(2)
3,432
$
682
$
1,251
$
2,750
$
2,181
$
Net (loss) income from continuing operations
(3,866)
$
(575)
$
7,705
$
(3,291)
$
(11,571)
$
Net (loss) income
(3)
(4,953)
$
(767)
$
7,462
$
(4,186)
$
(12,415)
$
Total assets
172,306
$
178,254
$
189,476
$
(5,948)
$
(17,170)
$
Tier 1 capital ratio
14.1%
14.4%
N/A
-0.3%
N/A
(1) Includes approximately $11.5 billion of pre-tax income recognized from 4Q 08 bond exchange
(2) $2.4 billion of provision results from strategic mortgage actions taken in 4Q 09
(3) Net loss in 4Q 09 negatively impacted by $1.0 billion of tax valuation allowance
Increase/(Decrease) vs.
Significant Pre-Tax Items in 4Q 09
($ millions)
4Q 09
Losses related to strategic mortgage actions
(3,282)
$
Repurchase reserve expense
(573)
Amortization of bond exchange discount
(308)
Legacy Nuvell subprime portfolio provision
(262)
Mortgage MSR marks due to model updates
(122)
International Auto loss on wind-down operations
(118)
Pre-Tax Impact
(4,665)
$
4
 GMAC: Revised Segment Reporting View
GMAC implemented a Funds Transfer Pricing (“FTP”) methodology in the fourth quarter to further align with
GMAC: Revised Segment Reporting View
GMAC implemented a Funds Transfer Pricing (“FTP”) methodology in the fourth quarter to further align with
industry and bank holding company best practices
Revised segment results reflect the central management of interest rate risk
Insulates the business segments from interest rate volatility, enabling them to focus on customers through loan
originations and servicing
Assigns charge rates and credit rates to classes of assets and liabilities, respectively
Matching duration allocates interest income and interest expense to each segment
Captures net impact of FTP methodology in the Corporate and Other results
Majority of auto and mortgage segments affected as the following items moved to Corporate and Other
Cash and investment securities (excluding Insurance)
Intercompany lending
Secured and unsecured debt
Deposits
Derivative activity
($ millions)
Revised
View
Legacy
View
Revised
View
Legacy
View
North American Automotive Finance
369
$
323
$
1,752
$
1,215
$
International Automotive Finance
(146)
(138)
(101)
(82)
Insurance
86
86
329
329
Global Automotive Services
309
271
1,980
1,462
Mortgage Operations
(4,011)
(4,047)
(7,301)
(7,483)
Corporate and Other
(767)
(693)
(2,617)
(1,917)
GMAC Consolidated
(4,469)
$
(4,469)
$
(7,938)
$
(7,938)
$
4Q 09
Pre-Tax Results from Continuing Operations
Full Year 09
5
 GMAC: Results by Segment
(1) Corporate and Other includes Commercial Finance, equity investments, amortization of original issue discount from GMAC bond exchange and net impact from
GMAC: Results by Segment
(1) Corporate and Other includes Commercial Finance, equity investments, amortization of original issue discount from GMAC bond exchange and net impact from
ALM activities
(2) See slide 23 for a detailed listing of businesses classified as discontinued operations
(3) Net loss in 4Q 09 negatively impacted by $1.0 billion of tax valuation allowance
Global Automotive Services: Core business provided another solid quarter
of results, offset by wind down
costs of certain international operations
Mortgage Operations: Strategic fourth quarter actions reduce future
risk of negative earnings impact from
legacy assets
Corporate and Other: Primarily includes net impact from asset/liability
management (“ALM”) and FTP, as
well as amortization of original issue discount from the 2008 bond exchanges
Includes:
OID Exp.: $(308)
Treasury: $(349)
CFG/Other: $(110)
($ millions)
4Q 09
3Q 09
4Q 08
3Q 09
4Q 08
North American Automotive Finance
369
$
272
$
(405)
$
97
$
774
$
International Automotive Finance
(146)
40
(74)
(186)
(72)
Insurance
86
108
133
(22)
(47)
Global Automotive Services
309
420
(346)
(111)
655
Mortgage Operations
(4,011)
(673)
(790)
(3,338)
(3,221)
Corporate and Other
(1)
(767)
(614)
8,751
(153)
(9,518)
Pre-Tax (loss) income from continuing operations
(4,469)
(867)
7,615
(3,602)
(12,084)
Income tax benefit from continuing operations
(603)
(292)
(90)
(311)
(513)
Discontinued operations
(2)
(1,087)
(192)
(243)
(895)
(844)
Net income (loss)
(3)
(4,953)
$
(767)
$
7,462
$
(4,186)
$
(12,415)
$
Increase/(Decrease) vs.
6
 Global Automotive Services: Highlights
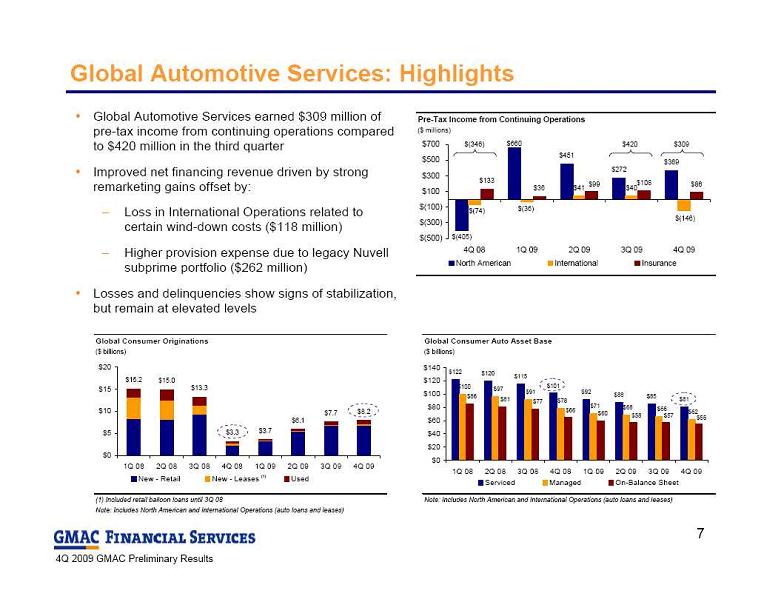
Global Automotive Services earned $309 million of
Global Automotive Services: Highlights
Global Automotive Services earned $309 million of
pre-tax income from continuing operations compared
to $420 million in the third quarter
Improved net financing revenue driven by strong
remarketing gains offset by:
Loss in International Operations related to
certain wind-down costs ($118 million)
Higher provision expense due to legacy Nuvell
subprime portfolio ($262 million)
Losses and delinquencies show signs of stabilization,
but remain at elevated levels
$420
$309
$(346)
(1)
Pre-Tax Income from Continuing Operations
($ millions)
$660
$451
$272
$369
$41
$40
$(146)
$133
$36
$108
$86
$(405)
$(36)
$(74)
$99
$(500)
$(300)
$(100)
$100
$300
$500
$700
4Q 08
1Q 09
2Q 09
3Q 09
4Q 09
North American
International
Insurance
Global Consumer Originations
Global Consumer Auto Asset Base
($ billions)
($ billions)
(1) Included retail balloon loans until 3Q 08
Note: Includes North American and International Operations (auto loans and leases)
Note: Includes North American and International Operations (auto loans and leases)
$122
$120
$115
$101
$92
$88
$85
$81
$100
$97
$91
$78
$71
$68
$66
$62
$86
$81
$77
$66
$60
$58
$57
$55
$0
$20
$40
$60
$80
$100
$120
$140
1Q 08
2Q 08
3Q 08
4Q 08
1Q 09
2Q 09
3Q 09
4Q 09
Serviced
Managed
On-Balance Sheet
$15.2
$15.0
$13.3
$3.3
$3.7
$6.1
$7.7
$8.2
$0
$5
$10
$15
$20
1Q 08
2Q 08
3Q 08
4Q 08
1Q 09
2Q 09
3Q 09
4Q 09
New - Retail
New - Leases
Used
Total
7
 North American Automotive Finance: Highlights
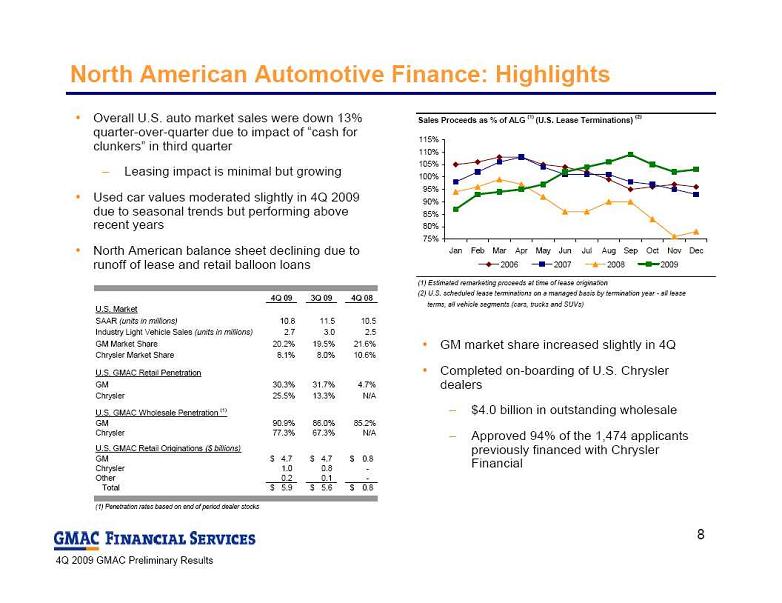
Overall U.S. auto market sales were down 13%
North American Automotive Finance: Highlights
Overall U.S. auto market sales were down 13%
quarter-over-quarter due to impact of “cash for
clunkers” in third quarter
Leasing impact is minimal but growing
Used car values moderated slightly in 4Q 2009
due to seasonal trends but performing above
recent years
North American balance sheet declining due to
runoff of lease and retail balloon loans
GM market share increased slightly in 4Q
Completed on-boarding of U.S. Chrysler
dealers
$4.0 billion in outstanding wholesale
Approved 94% of the 1,474 applicants
previously financed with Chrysler
Financial
Sales Proceeds as % of ALG
(1)
(U.S. Lease Terminations)
(2)
(1) Estimated remarketing proceeds at time of lease origination
(2) U.S. scheduled lease terminations on a managed basis by termination year - all lease
terms, all vehicle segments (cars, trucks and SUVs)
75%
80%
85%
90%
95%
100%
105%
110%
115%
Jan
Feb
Mar
Apr
May
Jun
Jul
Aug
Sep
Oct
Nov
Dec
2006
2007
2008
2009
4Q 09
3Q 09
4Q 08
U.S. Market
SAAR
(units in millions)
10.8
11.5
10.5
Industry Light Vehicle Sales
(units in millions)
2.7
3.0
2.5
GM Market Share
20.2%
19.5%
21.6%
Chrysler Market Share
8.1%
8.0%
10.6%
U.S. GMAC Retail Penetration
GM
30.3%
31.7%
4.7%
Chrysler
25.5%
13.3%
N/A
U.S. GMAC Wholesale Penetration
(1)
GM
90.9%
86.0%
85.2%
Chrysler
77.3%
67.3%
N/A
U.S. GMAC Retail Originations
($ billions)
GM
4.7
$
4.7
$
0.8
$
Chrysler
1.0
0.8
-
Other
0.2
0.1
-
Total
5.9
$
5.6
$
0.8
$
(1) Penetration rates based on end of period dealer stocks
8
 North American Automotive Finance: Condensed Income Statement
($ millions)
4Q 09
3Q 09
4Q 08
3Q 09
4Q 08
Total financing revenue and other interest income
2,064
$
2,182
$
2,581
$
(118)
$
(517)
$
Interest expense
534
556
767
(22)
(233)
Depreciation expense on operating lease assets
(1)
700
843
1,281
(143)
(581)
Impairment of investment in operating leases
-
-
384
-
(384)
Net financing revenue
830
783
149
47
681
Servicing fees
55
57
71
(2)
(16)
Gain (loss) on automotive loans, net
83
(13)
168
96
(85)
Other income
93
34
98
59
(5)
Total other revenue
231
78
337
153
(106)
Total net revenue
1,061
861
486
200
575
Provision for loan losses
(2)(3)
340
122
443
218
(103)
Noninterest expense
352
467
448
(115)
(96)
Income (loss) from cont. ops before income tax expense (benefit)
369
272
(405)
97
774
Income tax expense (benefit) from continuing operations
216
(26)
(36)
242
252
Net income (loss) from continuing operations
153
$
298
$
(369)
$
(145)
$
522
$
Notable Items - Pre-Tax
($ millions)
4Q 09
3Q 09
4Q 08
3Q 09
4Q 08
(1) Remarketing gain (loss)
191
$
162
$
(143)
$
29
$
334
$
(2) Nuvell provision
(262)
(81)
(116)
(181)
(146)
(3) SmartBuy (balloon loan) provision
49
6
(185)
43
234
Increase/(Decrease) vs.
Increase/(Decrease) vs.
9
North American Automotive Finance: Condensed Income Statement
($ millions)
4Q 09
3Q 09
4Q 08
3Q 09
4Q 08
Total financing revenue and other interest income
2,064
$
2,182
$
2,581
$
(118)
$
(517)
$
Interest expense
534
556
767
(22)
(233)
Depreciation expense on operating lease assets
(1)
700
843
1,281
(143)
(581)
Impairment of investment in operating leases
-
-
384
-
(384)
Net financing revenue
830
783
149
47
681
Servicing fees
55
57
71
(2)
(16)
Gain (loss) on automotive loans, net
83
(13)
168
96
(85)
Other income
93
34
98
59
(5)
Total other revenue
231
78
337
153
(106)
Total net revenue
1,061
861
486
200
575
Provision for loan losses
(2)(3)
340
122
443
218
(103)
Noninterest expense
352
467
448
(115)
(96)
Income (loss) from cont. ops before income tax expense (benefit)
369
272
(405)
97
774
Income tax expense (benefit) from continuing operations
216
(26)
(36)
242
252
Net income (loss) from continuing operations
153
$
298
$
(369)
$
(145)
$
522
$
Notable Items - Pre-Tax
($ millions)
4Q 09
3Q 09
4Q 08
3Q 09
4Q 08
(1) Remarketing gain (loss)
191
$
162
$
(143)
$
29
$
334
$
(2) Nuvell provision
(262)
(81)
(116)
(181)
(146)
(3) SmartBuy (balloon loan) provision
49
6
(185)
43
234
Increase/(Decrease) vs.
Increase/(Decrease) vs.
9
 International Automotive Finance: Highlights
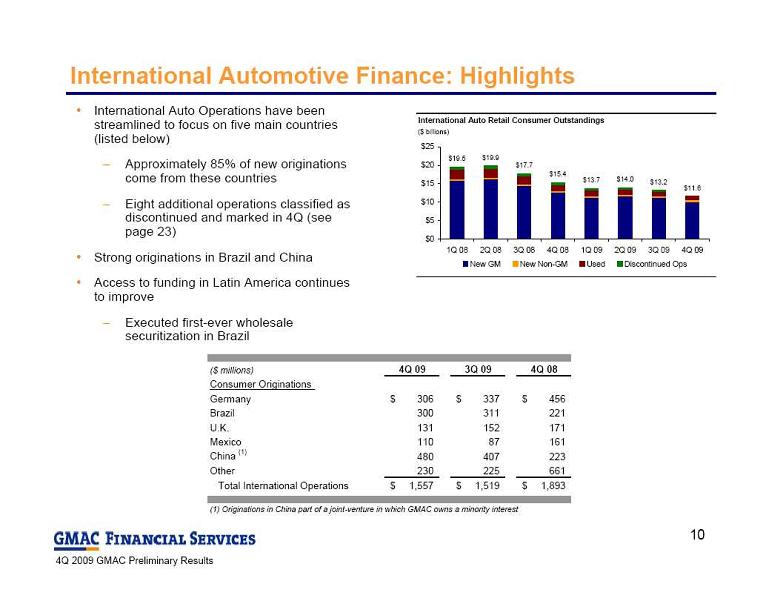
International Auto Operations have been
International Automotive Finance: Highlights
International Auto Operations have been
streamlined to focus on five main countries
(listed below)
Approximately 85% of new originations
come from these countries
Eight additional operations classified as
discontinued and marked in 4Q (see
page 23)
Strong originations in Brazil and China
Access to funding in Latin America continues
to improve
Executed first-ever wholesale
securitization in Brazil
International Auto Retail Consumer Outstandings
($ billions)
$19.5
$19.9
$17.7
$15.4
$13.7
$14.0
$13.2
$11.6
$0
$5
$10
$15
$20
$25
1Q 08
2Q 08
3Q 08
4Q 08
1Q 09
2Q 09
3Q 09
4Q 09
New GM
New Non-GM
Used
Discontinued Ops
($ millions)
4Q 09
3Q 09
4Q 08
Consumer Originations
Germany
306
$
337
$
456
$
Brazil
300
311
221
U.K.
131
152
171
Mexico
110
87
161
China
(1)
480
407
223
Other
230
225
661
Total International Operations
1,557
$
1,519
$
1,893
$
(1) Originations in China part of a joint-venture in which GMAC owns a minority interest
10
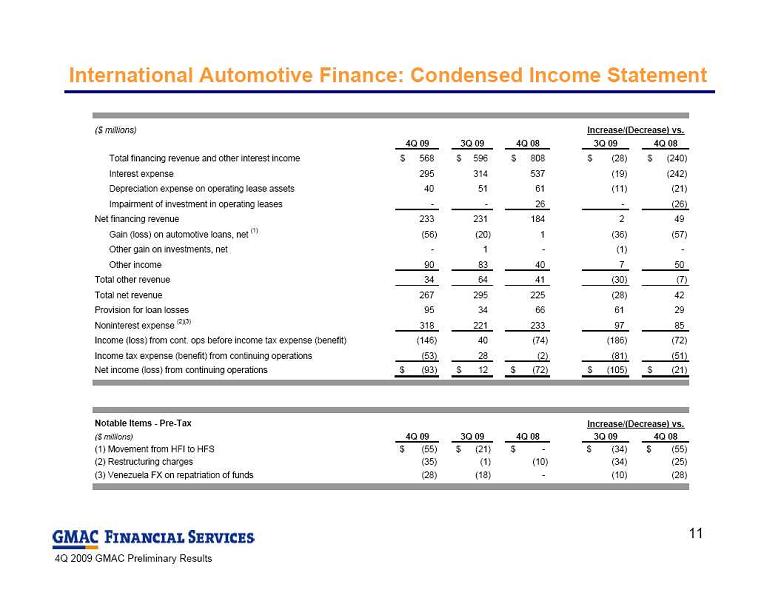 International Automotive Finance: Condensed Income Statement
($ millions)
4Q 09
3Q 09
4Q 08
3Q 09
4Q 08
Total financing revenue and other interest income
568
$
596
$
808
$
(28)
$
(240)
$
Interest expense
295
314
537
(19)
(242)
Depreciation expense on operating lease assets
40
51
61
(11)
(21)
Impairment of investment in operating leases
-
-
26
-
(26)
Net financing revenue
233
231
184
2
49
Gain (loss) on automotive loans, net
(1)
(56)
(20)
1
(36)
(57)
Other gain on investments, net
-
1
-
(1)
-
Other income
90
83
40
7
50
Total other revenue
34
64
41
(30)
(7)
Total net revenue
267
295
225
(28)
42
Provision for loan losses
95
34
66
61
29
Noninterest expense
(2)(3)
318
221
233
97
85
Income (loss) from cont. ops before income tax expense (benefit)
(146)
40
(74)
(186)
(72)
Income tax expense (benefit) from continuing operations
(53)
28
(2)
(81)
(51)
Net income (loss) from continuing operations
(93)
$
12
$
(72)
$
(105)
$
(21)
$
Notable Items - Pre-Tax
($ millions)
4Q 09
3Q 09
4Q 08
3Q 09
4Q 08
(1) Movement from HFI to HFS
(55)
$
(21)
$
-
$
(34)
$
(55)
$
(2) Restructuring charges
(35)
(1)
(10)
(34)
(25)
(3) Venezuela FX on repatriation of funds
(28)
(18)
-
(10)
(28)
Increase/(Decrease) vs.
Increase/(Decrease) vs.
11
International Automotive Finance: Condensed Income Statement
($ millions)
4Q 09
3Q 09
4Q 08
3Q 09
4Q 08
Total financing revenue and other interest income
568
$
596
$
808
$
(28)
$
(240)
$
Interest expense
295
314
537
(19)
(242)
Depreciation expense on operating lease assets
40
51
61
(11)
(21)
Impairment of investment in operating leases
-
-
26
-
(26)
Net financing revenue
233
231
184
2
49
Gain (loss) on automotive loans, net
(1)
(56)
(20)
1
(36)
(57)
Other gain on investments, net
-
1
-
(1)
-
Other income
90
83
40
7
50
Total other revenue
34
64
41
(30)
(7)
Total net revenue
267
295
225
(28)
42
Provision for loan losses
95
34
66
61
29
Noninterest expense
(2)(3)
318
221
233
97
85
Income (loss) from cont. ops before income tax expense (benefit)
(146)
40
(74)
(186)
(72)
Income tax expense (benefit) from continuing operations
(53)
28
(2)
(81)
(51)
Net income (loss) from continuing operations
(93)
$
12
$
(72)
$
(105)
$
(21)
$
Notable Items - Pre-Tax
($ millions)
4Q 09
3Q 09
4Q 08
3Q 09
4Q 08
(1) Movement from HFI to HFS
(55)
$
(21)
$
-
$
(34)
$
(55)
$
(2) Restructuring charges
(35)
(1)
(10)
(34)
(25)
(3) Venezuela FX on repatriation of funds
(28)
(18)
-
(10)
(28)
Increase/(Decrease) vs.
Increase/(Decrease) vs.
11
 Delinquency trends in the core auto portfolio have stabilized over the past three quarters
Our legacy subprime Nuvell portfolio is contributing approximately 38% of North American delinquent
Delinquency trends in the core auto portfolio have stabilized over the past three quarters
Our legacy subprime Nuvell portfolio is contributing approximately 38% of North American delinquent
balances
$4 billion portfolio is expected to run off to approximately $2 billion by the end of 2010
Global Automotive Finance: Consumer Delinquency Trends
Global Delinquencies - Managed
Retail Contract Amount
$ Amount of Contracts Greater than 30 Days Past Due (millions)
Global Delinquencies - Excluding Nuvell
$ Amount of Contracts Greater than 30 Days Past Due (millions)
$1,672
$1,727
$1,621
$1,415
$1,804
$1,757
2.74%
3.31%
2.82%
3.27%
3.46%
3.48%
$1,000
$1,200
$1,400
$1,600
$1,800
$2,000
$2,200
3Q 08
4Q 08
1Q 09
2Q 09
3Q 09
4Q 09
0.00%
0.50%
1.00%
1.50%
2.00%
2.50%
3.00%
3.50%
4.00%
4.50%
Delinquent Contract $
% of Retail Contract $ Outstanding
$1,153
$1,270
$1,290
$1,189
$1,430
$1,460
2.62%
2.80%
2.91%
2.66%
2.96%
2.54%
$600
$800
$1,000
$1,200
$1,400
$1,600
3Q 08
4Q 08
1Q 09
2Q 09
3Q 09
4Q 09
0.00%
0.50%
1.00%
1.50%
2.00%
2.50%
3.00%
3.50%
Delinquent Contract $
% of Retail Contract $ Outstanding
Loans > 30 Days Past Due
North
America
Europe
Asia
Pacific
Latin
America
Global
4Q 09
3.92%
1.02%
1.03%
4.68%
3.48%
4Q 08
3.77%
1.32%
1.98%
3.93%
3.31%
Year-over-Year Change
+15 bps
-30 bps
-95 bps
+75 bps
+17 bps
12
 Global Automotive Finance: Consumer Loss Trends
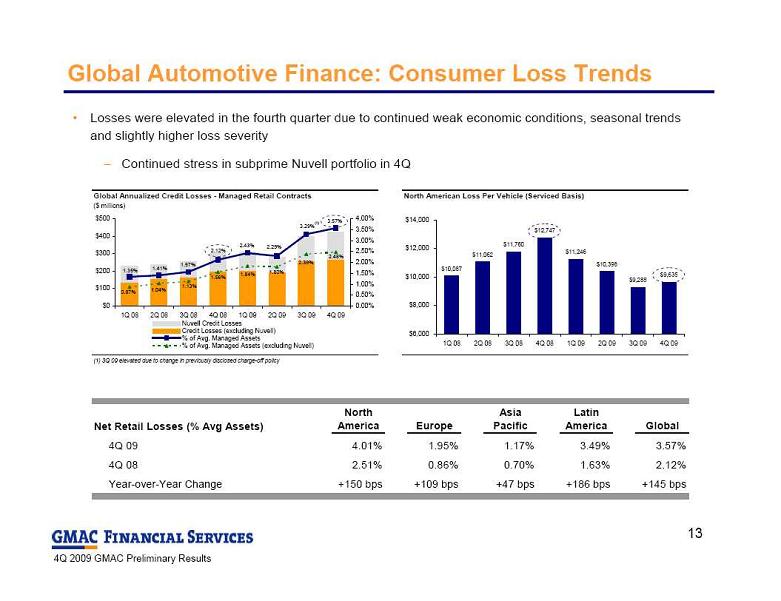
Losses were elevated in the fourth quarter due to continued weak economic conditions, seasonal trends
Global Automotive Finance: Consumer Loss Trends
Losses were elevated in the fourth quarter due to continued weak economic conditions, seasonal trends
and slightly higher loss severity
Continued stress in subprime Nuvell portfolio in 4Q
Global Annualized Credit Losses - Managed Retail Contracts
North American Loss Per Vehicle (Serviced Basis)
($ millions)
(1) 3Q 09 elevated due to change in previously disclosed charge-off policy
1.80%
1.84%
1.56%
1.13%
1.04%
0.87%
2.39%
2.48%
1.35%
1.41%
1.57%
2.12%
2.43%
2.29%
3.29%
3.57%
$0
$100
$200
$300
$400
$500
1Q 08
2Q 08
3Q 08
4Q 08
1Q 09
2Q 09
3Q 09
4Q 09
0.00%
0.50%
1.00%
1.50%
2.00%
2.50%
3.00%
3.50%
4.00%
Nuvell Credit Losses
Credit Losses (excluding Nuvell)
% of Avg. Managed Assets
% of Avg. Managed Assets (excluding Nuvell)
Delinquent
Contracts
Delinquencies
as a % of
Managed
Contracts
$10,087
$11,062
$11,760
$12,747
$11,246
$10,398
$9,288
$9,635
$6,000
$8,000
$10,000
$12,000
$14,000
1Q 08
2Q 08
3Q 08
4Q 08
1Q 09
2Q 09
3Q 09
4Q 09
(1)
Net Retail Losses (% Avg Assets)
North
America
Europe
Asia
Pacific
Latin
America
Global
4Q 09
4.01%
1.95%
1.17%
3.49%
3.57%
4Q 08
2.51%
0.86%
0.70%
1.63%
2.12%
Year-over-Year Change
+150 bps
+109 bps
+47 bps
+186 bps
+145 bps
13
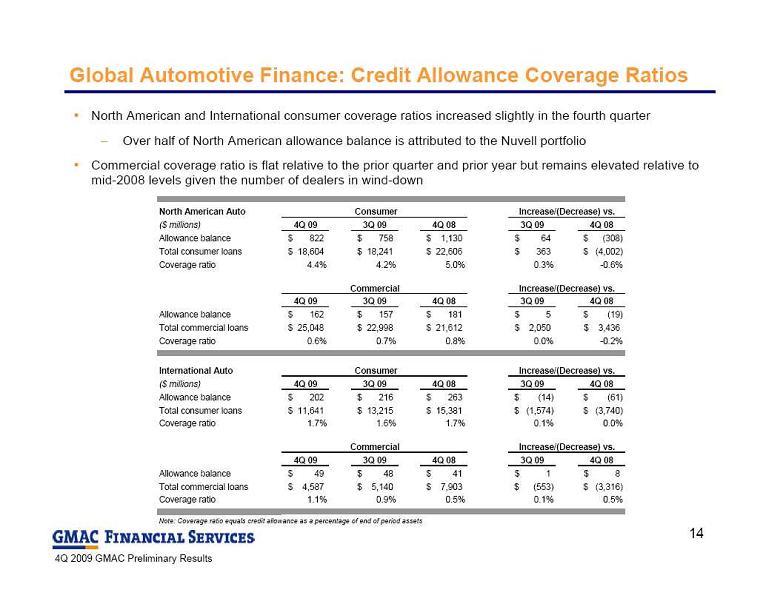 Global Automotive Finance: Credit Allowance Coverage Ratios
North American and International consumer coverage ratios increased slightly in the fourth quarter
Over half of North American allowance balance is attributed to the Nuvell portfolio
Commercial coverage ratio is flat relative to the prior quarter and prior year but remains elevated relative to
Global Automotive Finance: Credit Allowance Coverage Ratios
North American and International consumer coverage ratios increased slightly in the fourth quarter
Over half of North American allowance balance is attributed to the Nuvell portfolio
Commercial coverage ratio is flat relative to the prior quarter and prior year but remains elevated relative to
mid-2008 levels given the number of dealers
in wind-down
North American Auto
Consumer
($ millions)
4Q 09
3Q 09
4Q 08
3Q 09
4Q 08
Allowance balance
822
$
758
$
1,130
$
64
$
(308)
$
Total consumer loans
18,604
$
18,241
$
22,606
$
363
$
(4,002)
$
Coverage ratio
4.4%
4.2%
5.0%
0.3%
-0.6%
Commercial
4Q 09
3Q 09
4Q 08
3Q 09
4Q 08
Allowance balance
162
$
157
$
181
$
5
$
(19)
$
Total commercial loans
25,048
$
22,998
$
21,612
$
2,050
$
3,436
$
Coverage ratio
0.6%
0.7%
0.8%
0.0%
-0.2%
International Auto
Consumer
($ millions)
4Q 09
3Q 09
4Q 08
3Q 09
4Q 08
Allowance balance
202
$
216
$
263
$
(14)
$
(61)
$
Total consumer loans
11,641
$
13,215
$
15,381
$
(1,574)
$
(3,740)
$
Coverage ratio
1.7%
1.6%
1.7%
0.1%
0.0%
Commercial
4Q 09
3Q 09
4Q 08
3Q 09
4Q 08
Allowance balance
49
$
48
$
41
$
1
$
8
$
Total commercial loans
4,587
$
5,140
$
7,903
$
(553)
$
(3,316)
$
Coverage ratio
1.1%
0.9%
0.5%
0.1%
0.5%
Note: Coverage ratio equals credit allowance as a percentage of end of period assets
Increase/(Decrease) vs.
Increase/(Decrease) vs.
Increase/(Decrease) vs.
Increase/(Decrease) vs.
14
 Insurance: Condensed Income Statement and Highlights
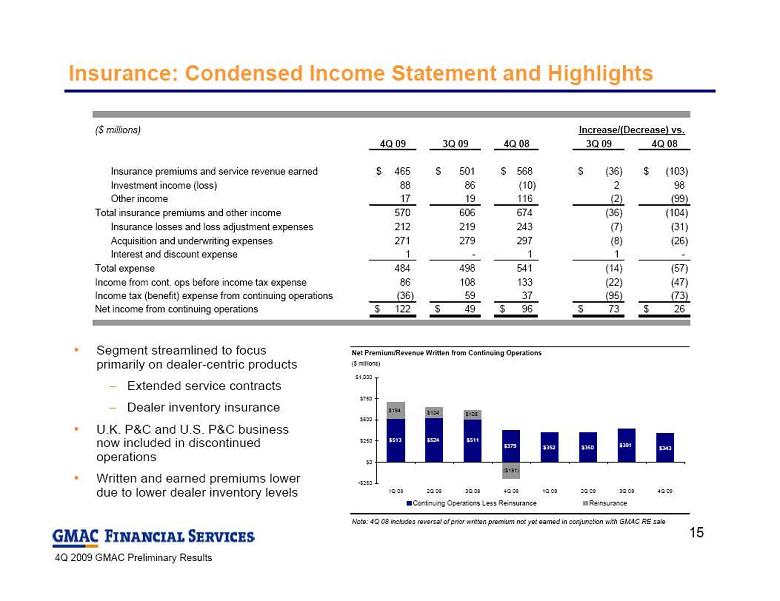
Segment streamlined to focus
Insurance: Condensed Income Statement and Highlights
Segment streamlined to focus
primarily on dealer-centric products
Extended service contracts
Dealer inventory insurance
U.K. P&C and U.S. P&C business
now included in discontinued
operations
Written and earned premiums lower
due to lower dealer inventory levels
($ millions)
4Q 09
3Q 09
4Q 08
3Q 09
4Q 08
Insurance premiums and service revenue earned
465
$
501
$
568
$
(36)
$
(103)
$
Investment income (loss)
88
86
(10)
2
98
Other income
17
19
116
(2)
(99)
Total insurance premiums and other income
570
606
674
(36)
(104)
Insurance losses and loss adjustment expenses
212
219
243
(7)
(31)
Acquisition and underwriting expenses
271
279
297
(8)
(26)
Interest and discount expense
1
-
1
1
-
Total expense
484
498
541
(14)
(57)
Income from cont. ops before income tax expense
86
108
133
(22)
(47)
Income tax (benefit) expense from continuing operations
(36)
59
37
(95)
(73)
Net income from continuing operations
122
$
49
$
96
$
73
$
26
$
Increase/(Decrease) vs.
Net Premium/Revenue Written from Continuing Operations
($ millions)
Note: 4Q 08 includes reversal of prior written premium not yet earned in conjunction with GMAC RE sale
$524
$379
$391
$194
$124
$105
($191)
$513
$511
$352
$350
$343
-$250
$0
$250
$500
$750
$1,000
1Q 08
2Q 08
3Q 08
4Q 08
1Q 09
2Q 09
3Q 09
4Q 09
Continuing Operations Less Reinsurance
Reinsurance
15
 Mortgage Operations: Highlights
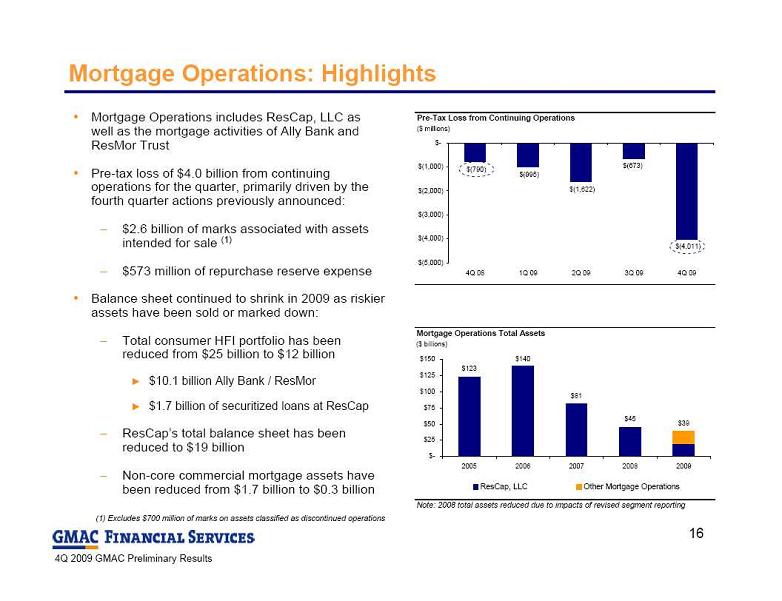
Mortgage Operations includes ResCap, LLC as
Mortgage Operations: Highlights
Mortgage Operations includes ResCap, LLC as
well as the mortgage activities of Ally Bank and
ResMor Trust
Pre-tax loss of $4.0 billion from continuing
operations for the quarter, primarily driven by the
fourth quarter actions previously announced:
$2.6 billion of marks associated with assets
intended for sale (1)
$573 million of repurchase reserve expense
Balance sheet continued to shrink in 2009 as riskier
assets have been sold or marked down:
Total consumer HFI portfolio has been
reduced from $25 billion to $12 billion
$10.1 billion Ally Bank / ResMor
$1.7 billion of securitized loans at ResCap
ResCap’s total balance sheet has been
reduced to $19 billion
Non-core commercial mortgage assets have
been reduced from $1.7 billion to $0.3 billion
(1) Excludes $700 million of marks on assets classified as discontinued operations
Pre-Tax Loss from Continuing Operations
($ millions)
$(790)
$(995)
$(1,622)
$(4,011)
$(673)
$(5,000)
$(4,000)
$(3,000)
$(2,000)
$(1,000)
$-
4Q 08
1Q 09
2Q 09
3Q 09
4Q 09
Mortgage Operations Total Assets
($ billions)
Note: 2008 total assets reduced due to impacts of revised segment reporting
$123
$140
$81
$45
$39
$-
$25
$50
$75
$100
$125
$150
2005
2006
2007
2008
2009
ResCap, LLC
Other Mortgage Operations
16
 Mortgage Operations: Highlights
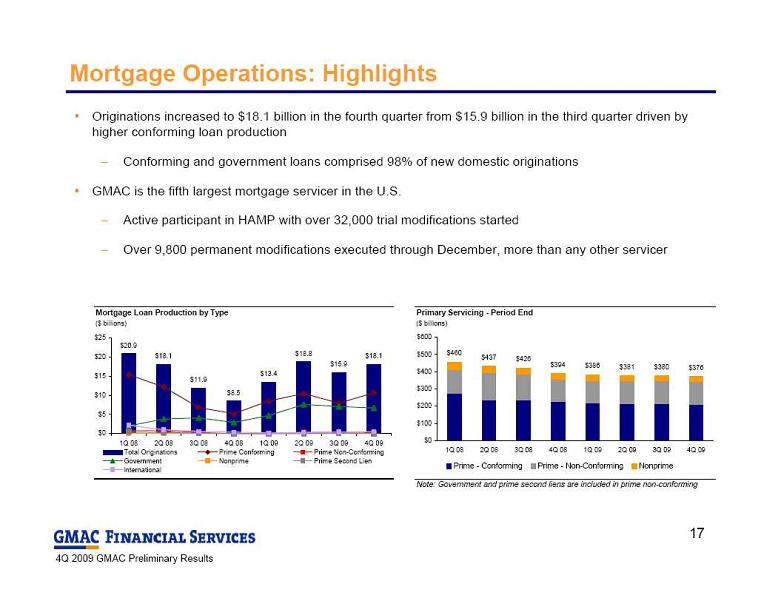
Originations increased to $18.1 billion in the fourth quarter from $15.9 billion in the third quarter driven by
Mortgage Operations: Highlights
Originations increased to $18.1 billion in the fourth quarter from $15.9 billion in the third quarter driven by
higher conforming loan production
Conforming and government loans comprised 98% of new domestic originations
GMAC is the fifth largest mortgage servicer in the U.S.
Active participant in HAMP with over 32,000 trial modifications started
Over 9,800 permanent modifications executed through December, more than any other servicer
Mortgage Loan Production by Type
($ billions)
$20.9
$18.1
$11.9
$8.5
$13.4
$18.8
$15.9
$18.1
$0
$5
$10
$15
$20
$25
1Q 08
2Q 08
3Q 08
4Q 08
1Q 09
2Q 09
3Q 09
4Q 09
Total Originations
Prime Conforming
Prime Non-Conforming
Government
Nonprime
Prime Second Lien
International
Primary Servicing - Period End
($ billions)
Note: Government and prime second liens are included in prime non-conforming
$460
$437
$426
$394
$386
$381
$380
$376
$0
$100
$200
$300
$400
$500
$600
1Q 08
2Q 08
3Q 08
4Q 08
1Q 09
2Q 09
3Q 09
4Q 09
Prime - Conforming
Prime - Non-Conforming
Nonprime
TTL
17
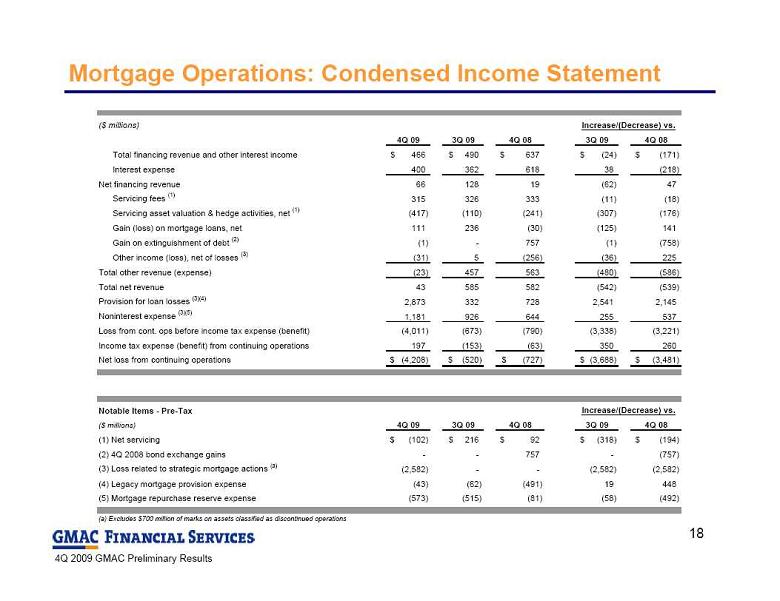 Mortgage Operations: Condensed Income Statement
($ millions)
4Q 09
3Q 09
4Q 08
3Q 09
4Q 08
Total financing revenue and other interest income
466
$
490
$
637
$
(24)
$
(171)
$
Interest expense
400
362
618
38
(218)
Net financing revenue
66
128
19
(62)
47
Servicing fees
(1)
315
326
333
(11)
(18)
Servicing asset valuation & hedge activities, net
(1)
(417)
(110)
(241)
(307)
(176)
Gain (loss) on mortgage loans, net
111
236
(30)
(125)
141
Gain on extinguishment of debt
(2)
(1)
-
757
(1)
(758)
Other income (loss), net of losses
(3)
(31)
5
(256)
(36)
225
Total other revenue (expense)
(23)
457
563
(480)
(586)
Total net revenue
43
585
582
(542)
(539)
Provision for loan losses
(3)(4)
2,873
332
728
2,541
2,145
Noninterest expense
(3)(5)
1,181
926
644
255
537
Loss from cont. ops before income tax expense (benefit)
(4,011)
(673)
(790)
(3,338)
(3,221)
Income tax expense (benefit) from continuing operations
197
(153)
(63)
350
260
Net loss from continuing operations
(4,208)
$
(520)
$
(727)
$
(3,688)
$
(3,481)
$
Notable Items - Pre-Tax
($ millions)
4Q 09
3Q 09
4Q 08
3Q 09
4Q 08
(1) Net servicing
(102)
$
216
$
92
$
(318)
$
(194)
$
(2) 4Q 2008 bond exchange gains
-
-
757
-
(757)
(3) Loss related to strategic mortgage actions
(a)
(2,582)
-
-
(2,582)
(2,582)
(4) Legacy mortgage provision expense
(43)
(62)
(491)
19
448
(5) Mortgage repurchase reserve expense
(573)
(515)
(81)
(58)
(492)
(a) Excludes $700 million of marks on assets classified as discontinued operations
Increase/(Decrease) vs.
Increase/(Decrease) vs.
18
Mortgage Operations: Condensed Income Statement
($ millions)
4Q 09
3Q 09
4Q 08
3Q 09
4Q 08
Total financing revenue and other interest income
466
$
490
$
637
$
(24)
$
(171)
$
Interest expense
400
362
618
38
(218)
Net financing revenue
66
128
19
(62)
47
Servicing fees
(1)
315
326
333
(11)
(18)
Servicing asset valuation & hedge activities, net
(1)
(417)
(110)
(241)
(307)
(176)
Gain (loss) on mortgage loans, net
111
236
(30)
(125)
141
Gain on extinguishment of debt
(2)
(1)
-
757
(1)
(758)
Other income (loss), net of losses
(3)
(31)
5
(256)
(36)
225
Total other revenue (expense)
(23)
457
563
(480)
(586)
Total net revenue
43
585
582
(542)
(539)
Provision for loan losses
(3)(4)
2,873
332
728
2,541
2,145
Noninterest expense
(3)(5)
1,181
926
644
255
537
Loss from cont. ops before income tax expense (benefit)
(4,011)
(673)
(790)
(3,338)
(3,221)
Income tax expense (benefit) from continuing operations
197
(153)
(63)
350
260
Net loss from continuing operations
(4,208)
$
(520)
$
(727)
$
(3,688)
$
(3,481)
$
Notable Items - Pre-Tax
($ millions)
4Q 09
3Q 09
4Q 08
3Q 09
4Q 08
(1) Net servicing
(102)
$
216
$
92
$
(318)
$
(194)
$
(2) 4Q 2008 bond exchange gains
-
-
757
-
(757)
(3) Loss related to strategic mortgage actions
(a)
(2,582)
-
-
(2,582)
(2,582)
(4) Legacy mortgage provision expense
(43)
(62)
(491)
19
448
(5) Mortgage repurchase reserve expense
(573)
(515)
(81)
(58)
(492)
(a) Excludes $700 million of marks on assets classified as discontinued operations
Increase/(Decrease) vs.
Increase/(Decrease) vs.
18
 Mortgage Operations: Credit Allowance Coverage Ratios
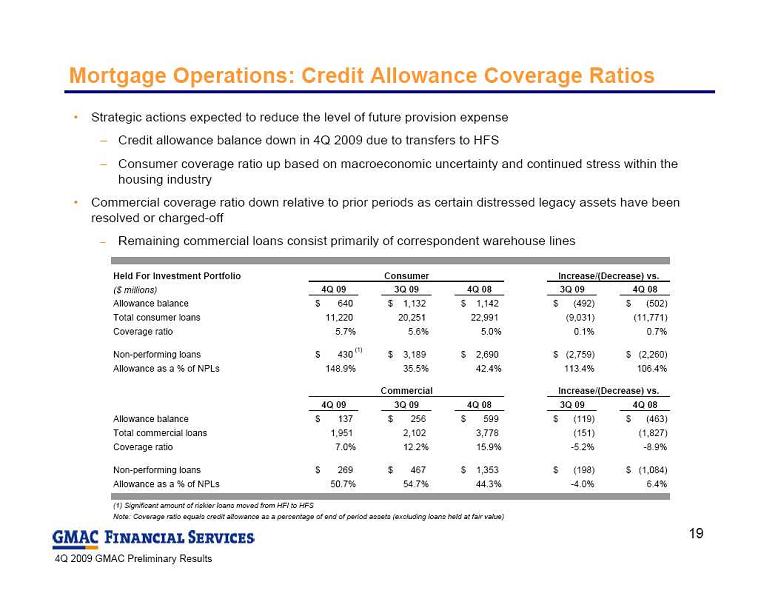
Strategic actions expected to reduce the level of future provision expense
Credit allowance balance down in 4Q 2009 due to transfers to HFS
Consumer coverage ratio up based on macroeconomic uncertainty and continued stress within the
Mortgage Operations: Credit Allowance Coverage Ratios
Strategic actions expected to reduce the level of future provision expense
Credit allowance balance down in 4Q 2009 due to transfers to HFS
Consumer coverage ratio up based on macroeconomic uncertainty and continued stress within the
housing industry
Commercial coverage ratio down relative to prior periods as certain distressed legacy assets have been
resolved or charged-off
Remaining commercial loans consist primarily of correspondent warehouse lines
Held For Investment Portfolio
Consumer
($ millions)
4Q 09
3Q 09
4Q 08
3Q 09
4Q 08
Allowance balance
640
$
1,132
$
1,142
$
(492)
$
(502)
$
Total consumer loans
11,220
20,251
22,991
(9,031)
(11,771)
Coverage ratio
5.7%
5.6%
5.0%
0.1%
0.7%
Non-performing loans
430
$
3,189
$
2,690
$
(2,759)
$
(2,260)
$
Allowance as a % of NPLs
148.9%
35.5%
42.4%
113.4%
106.4%
Commercial
4Q 09
3Q 09
4Q 08
3Q 09
4Q 08
Allowance balance
137
$
256
$
599
$
(119)
$
(463)
$
Total commercial loans
1,951
2,102
3,778
(151)
(1,827)
Coverage ratio
7.0%
12.2%
15.9%
-5.2%
-8.9%
Non-performing loans
269
$
467
$
1,353
$
(198)
$
(1,084)
$
Allowance as a % of NPLs
50.7%
54.7%
44.3%
-4.0%
6.4%
(1) Significant amount of riskier loans moved from HFI to HFS
Note: Coverage ratio equals credit allowance as a percentage of end of period assets (excluding loans held at fair value)
Increase/(Decrease) vs.
Increase/(Decrease) vs.
(1)
19
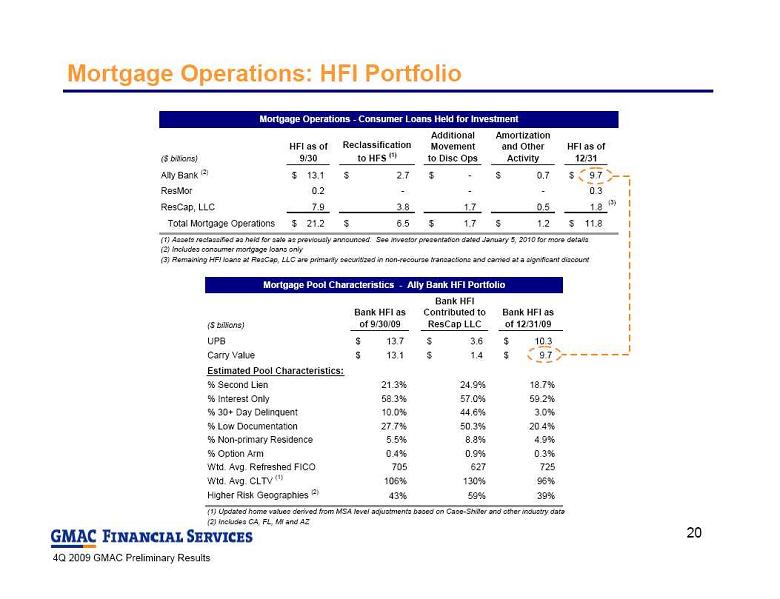 Mortgage Operations: HFI Portfolio
($ billions)
HFI as of
9/30
Reclassification
to HFS
(1)
Additional
Movement
to Disc Ops
Amortization
and Other
Activity
HFI as of
12/31
Ally Bank
(2)
13.1
$
2.7
$
-
$
0.7
$
9.7
$
ResMor
0.2
-
-
-
0.3
ResCap, LLC
7.9
3.8
1.7
0.5
1.8
Total Mortgage Operations
21.2
$
6.5
$
1.7
$
1.2
$
11.8
$
(1) Assets reclassified as held for sale as previously announced. See investor presentation dated January 5, 2010 for more details
(2) Includes consumer mortgage loans only
(3) Remaining HFI loans at ResCap, LLC are primarily securitized in non-recourse transactions and carried at a significant discount
Mortgage Operations - Consumer Loans Held for Investment
(3)
($ billions)
Bank HFI as
of 9/30/09
Bank HFI
Contributed to
ResCap LLC
Bank HFI as
of 12/31/09
UPB
13.7
$
3.6
$
10.3
$
Carry Value
13.1
$
1.4
$
9.7
$
Estimated Pool Characteristics:
% Second Lien
21.3%
24.9%
18.7%
% Interest Only
58.3%
57.0%
59.2%
% 30+ Day Delinquent
10.0%
44.6%
3.0%
% Low Documentation
27.7%
50.3%
20.4%
% Non-primary Residence
5.5%
8.8%
4.9%
% Option Arm
0.4%
0.9%
0.3%
Wtd. Avg. Refreshed FICO
705
627
725
Wtd. Avg. CLTV
(1)
106%
130%
96%
Higher Risk Geographies
(2)
43%
59%
39%
(1) Updated home values derived from MSA level adjustments based on Case-Shiller and other industry data
(2) Includes CA, FL, MI and AZ
Mortgage Pool Characteristics - Ally Bank HFI Portfolio
20
Mortgage Operations: HFI Portfolio
($ billions)
HFI as of
9/30
Reclassification
to HFS
(1)
Additional
Movement
to Disc Ops
Amortization
and Other
Activity
HFI as of
12/31
Ally Bank
(2)
13.1
$
2.7
$
-
$
0.7
$
9.7
$
ResMor
0.2
-
-
-
0.3
ResCap, LLC
7.9
3.8
1.7
0.5
1.8
Total Mortgage Operations
21.2
$
6.5
$
1.7
$
1.2
$
11.8
$
(1) Assets reclassified as held for sale as previously announced. See investor presentation dated January 5, 2010 for more details
(2) Includes consumer mortgage loans only
(3) Remaining HFI loans at ResCap, LLC are primarily securitized in non-recourse transactions and carried at a significant discount
Mortgage Operations - Consumer Loans Held for Investment
(3)
($ billions)
Bank HFI as
of 9/30/09
Bank HFI
Contributed to
ResCap LLC
Bank HFI as
of 12/31/09
UPB
13.7
$
3.6
$
10.3
$
Carry Value
13.1
$
1.4
$
9.7
$
Estimated Pool Characteristics:
% Second Lien
21.3%
24.9%
18.7%
% Interest Only
58.3%
57.0%
59.2%
% 30+ Day Delinquent
10.0%
44.6%
3.0%
% Low Documentation
27.7%
50.3%
20.4%
% Non-primary Residence
5.5%
8.8%
4.9%
% Option Arm
0.4%
0.9%
0.3%
Wtd. Avg. Refreshed FICO
705
627
725
Wtd. Avg. CLTV
(1)
106%
130%
96%
Higher Risk Geographies
(2)
43%
59%
39%
(1) Updated home values derived from MSA level adjustments based on Case-Shiller and other industry data
(2) Includes CA, FL, MI and AZ
Mortgage Pool Characteristics - Ally Bank HFI Portfolio
20
 ResCap, LLC: Balance Sheet Analysis
$12.0 billion
Cash, accounting and
ResCap, LLC: Balance Sheet Analysis
$12.0 billion
Cash, accounting and
other less value sensitive assets
$7.3 billion
Assets carried at
fair or net realizable value
Cash and Cash Equivalents
0.8
$
Accounts Receivable (Servicing Advances, etc)
2.5
Securitized Assets
(1)
5.8
Derivatives and Derivative Collateral
1.6
Restricted Cash
0.7
Other Assets
0.6
Mortgage Servicing Rights
2.5
Real Estate Owned
0.2
AFS and Trading Securities
0.2
Certain International Lending Receivables and Securities
0.2
Certain Domestic Lending Receivables and Other Assets
(2)
0.2
International Assets Held for Sale
0.5
Other Held for Sale Assets
(3)
3.5
Total ResCap, LLC Assets
19.3
$
(1) Includes (a) $1.7 billion of securitized assets classified as HFI and carried at a significant discount, (b) $1.9
billion of HFS assets related to off-balance sheet securitizations where ResCap has the option, but not the
obligation, to repurchase certain loans and (c) $2.1 billion of securitized international assets that have been
reclassified under SFAS 144 to assets of operations held for sale
(2) Includes construction loans, model home loans and other assets
(3) Includes $1.4 billion of selected Ally loans, which were contributed to ResCap and $1.5 billion of legacy
ResCap domestic loans
ResCap, LLC Balance Sheet Analysis
as of December 31, 2009
21
 Corporate and Other: Condensed Income Statement
Note: Corporate and Other includes Commercial Finance, equity investments, amortization of original issue discount from GMAC bond exchange and net impact from
Corporate and Other: Condensed Income Statement
Note: Corporate and Other includes Commercial Finance, equity investments, amortization of original issue discount from GMAC bond exchange and net impact from
ALM activities
($ millions)
4Q 09
3Q 09
4Q 08
3Q 09
4Q 08
Net financing loss
(1)(5)
(576)
$
(619)
$
(836)
$
43
$
260
$
Gain on mortgage and automotive loans, net
8
-
-
8
8
Gain (loss) on extinguishment of debt
(2)
(2)
10
10,707
(12)
(10,709)
Other income, net of losses
143
271
(980)
(128)
1,123
Total other revenue
149
281
9,727
(132)
(9,578)
Total net revenue (loss)
(427)
(338)
8,891
(89)
(9,318)
Provision for loan losses
(3)(4)
124
194
14
(70)
110
Noninterest expense
216
82
126
134
90
Income (loss) from cont. ops before income tax expense
(767)
(614)
8,751
(153)
(9,518)
Income tax benefit from cont. ops
(927)
(200)
(26)
(727)
(901)
Net income (loss) from continuing operations
160
$
(414)
$
8,777
$
574
$
(8,617)
$
Notable Items - Pre-Tax
($ millions)
4Q 09
3Q 09
4Q 08
3Q 09
4Q 08
(1) Amortization of bond exchange discount
(308)
$
(309)
$
-
$
1
(308)
$
(2) 4Q 2008 bond exchange gains
-
-
10,707
-
(10,707)
(3) Commercial Finance provision
(114)
(34)
(14)
(80)
(100)
(4) Resort Finance provision
(9)
(161)
-
152
(9)
(5) Net Impact of FTP Allocations
(349)
(361)
(883)
12
534
Increase/(Decrease) vs.
Increase/(Decrease) vs.
22
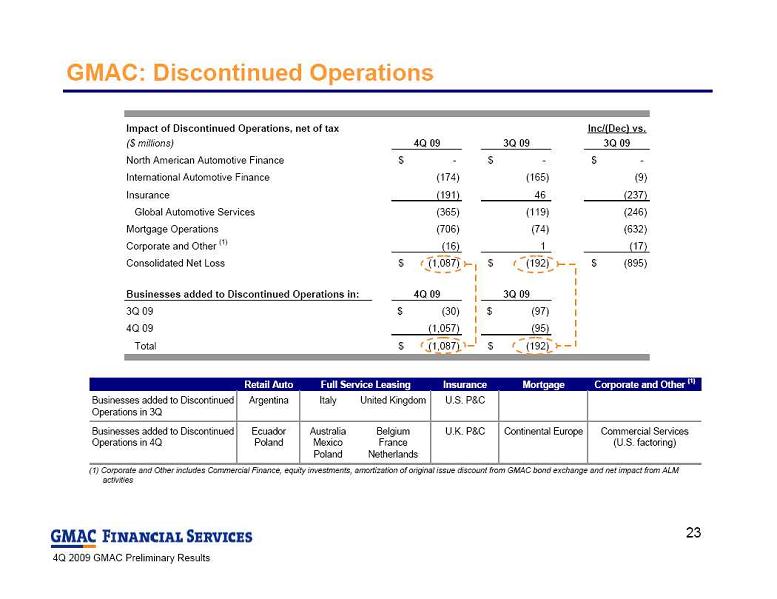 GMAC: Discontinued Operations
(1) Corporate and Other includes Commercial Finance, equity investments, amortization of original issue discount from GMAC bond exchange and net impact from ALM
GMAC: Discontinued Operations
(1) Corporate and Other includes Commercial Finance, equity investments, amortization of original issue discount from GMAC bond exchange and net impact from ALM
activities
Impact of Discontinued Operations, net of tax
Inc/(Dec) vs.
($ millions)
4Q 09
3Q 09
3Q 09
North American Automotive Finance
-
$
-
$
-
$
International Automotive Finance
(174)
(165)
(9)
Insurance
(191)
46
(237)
Global Automotive Services
(365)
(119)
(246)
Mortgage Operations
(706)
(74)
(632)
Corporate and Other
(1)
(16)
1
(17)
Consolidated Net Loss
(1,087)
$
(192)
$
(895)
$
Businesses added to Discontinued Operations in:
4Q 09
3Q 09
3Q 09
(30)
$
(97)
$
4Q 09
(1,057)
(95)
Total
(1,087)
$
(192)
$
Retail Auto
Insurance
Mortgage
Corporate and Other
(1)
Businesses added to Discontinued
Operations in 3Q
Argentina
Italy
United Kingdom
U.S. P&C
Businesses added to Discontinued
Operations in 4Q
Ecuador
Poland
Australia
Mexico
Poland
Belgium
France
Netherlands
U.K. P&C
Continental Europe
Commercial Services
(U.S. factoring)
Full Service Leasing
23
 (1) Includes TLGP issuance of $2.9B in 4Q 2009
(2) Excludes any non-cash changes
(3) GMAC Consolidated includes Insurance, ResCap, and Ally Bank
(4) Includes approximately $5.1 billion and $5.2 billion of overnight funds on deposit at Ally Bank from GMAC Inc. as of 12/31/09 and 9/30/09, respectively
(5) ResCap, LLC legal entity information. Does not include Ally Bank
Note: Numbers may not foot due to rounding
GMAC: Liquidity
Parent company available
(1) Includes TLGP issuance of $2.9B in 4Q 2009
(2) Excludes any non-cash changes
(3) GMAC Consolidated includes Insurance, ResCap, and Ally Bank
(4) Includes approximately $5.1 billion and $5.2 billion of overnight funds on deposit at Ally Bank from GMAC Inc. as of 12/31/09 and 9/30/09, respectively
(5) ResCap, LLC legal entity information. Does not include Ally Bank
Note: Numbers may not foot due to rounding
GMAC: Liquidity
Parent company available
liquidity grew to $31.4 billion
$12.5 billion of this liquidity
is available based on
current collateral
$8.9 billion of available
cash liquidity
Recent ratings upgrades
(1) Includes approximately $5.1 billion and $5.2 billion of overnight funds on deposit at Ally Bank from GMAC Inc.
as of 12/31/09 and 9/30/09, respectively
(2) Capacity is subject to availability of incremental collateral
Note: Numbers may not foot due to rounding
GMAC ex.
GMAC
Ins., ResCap,
Ally
($ billions)
Consolidated
(3)
Ally Bank
(4)
Insurance
ResCap, LLC
(5)
Bank
Cash & Cash Equivalents (9/30/09)
$14.2
$8.3
$0.1
$0.9
$5.0
Net Increase (Decrease) in Unsecured Debt
(1)
1.2
1.2
Issuance of Trust Preferred (TRUP) and Preferred Securities (MCP) to U.S. Treasury
3.8
3.8
Change in Assets net of On-Balance Sheet securitizations
(2)
(7.3)
(2.3)
(0.1)
(4.9)
Net Redemption of Investment Securities
1.3
0.6
0.2
0.5
Mortgage Loan Sale
(1.5)
1.5
Internal Capital Contributions
(2.8)
0.6
2.2
Increase (Decrease) in Deposits
2.7
1.1
1.6
Other
(1.1)
0.6
(0.2)
(0.6)
(0.9)
Cash & Cash Equivalents (12/31/09)
$14.8
$8.9
$0.1
$0.8
$4.9
Net Change in Cash & Cash Equivalents in 4Q
$0.6
$0.6
$0.0
($0.1)
($0.1)
Parent Company Available Liquidity to Support Asset Generation
($ billions)
12/31/09
9/30/09
% Change
Cash and Cash Equivalents
(1)
8.9
$
8.3
$
8%
Unencumbered Securities
0.4
0.2
100%
Current Secured Committed Unused Capacity
3.1
1.0
210%
Current Unsecured Committed Unused Capacity
0.1
0.1
0%
Total Current Available Liquidity
12.5
9.6
31%
Potential Secured Committed Unused Capacity
(2)
9.5
8.3
14%
Potential Unsecured Committed Unused Capacity
(2)
-
-
-
Whole Loan Forward Flow Agreements
(2)
9.4
12.3
-24%
Total Available Liquidity
31.4
$
30.2
$
4%
24
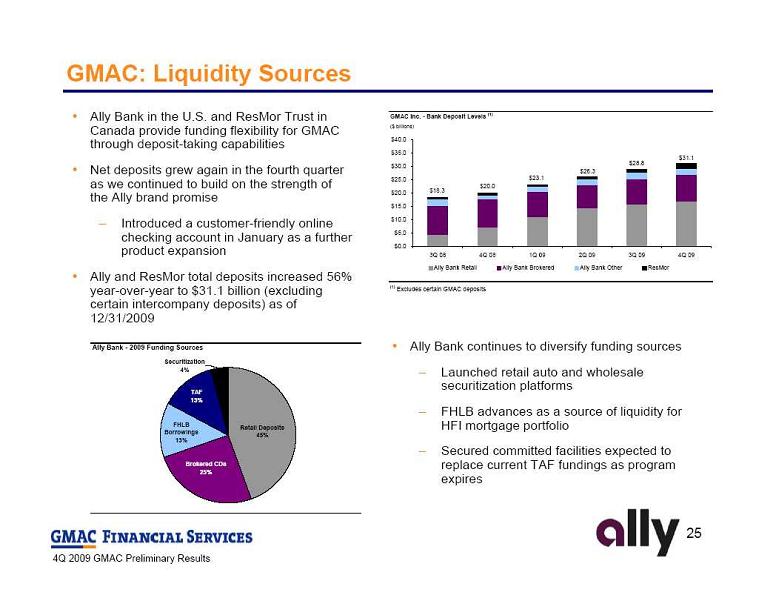 Ally Bank in the U.S. and ResMor Trust in
Canada provide funding flexibility for GMAC
through deposit-taking capabilities
Net deposits grew again in the fourth quarter
as we continued to build on the strength of
the Ally brand promise
Introduced a customer-friendly online
checking account in January as a further
product expansion
Ally and ResMor total deposits increased 56%
year-over-year to $31.1 billion (excluding
certain intercompany deposits) as of
12/31/2009
GMAC: Liquidity Sources
Ally Bank continues to diversify funding sources
Launched retail auto and wholesale
securitization platforms
FHLB advances as a source of liquidity for
HFI mortgage portfolio
Secured committed facilities expected to
replace current TAF fundings as program
expires
GMAC Inc. - Bank Deposit Levels
(1)
($ billions)
(1)
Excludes certain GMAC deposits
$18.3
$20.0
$23.1
$26.3
$28.8
$31.1
$0.0
$5.0
$10.0
$15.0
$20.0
$25.0
$30.0
$35.0
$40.0
3Q 08
4Q 08
1Q 09
2Q 09
3Q 09
4Q 09
Ally Bank Retail
Ally Bank Brokered
Ally Bank Other
ResMor
Ally Bank - 2009 Funding Sources
FHLB
Borrowings
13%
Retail Deposits
45%
Brokered CDs
25%
TAF
13%
Securitization
4%
25
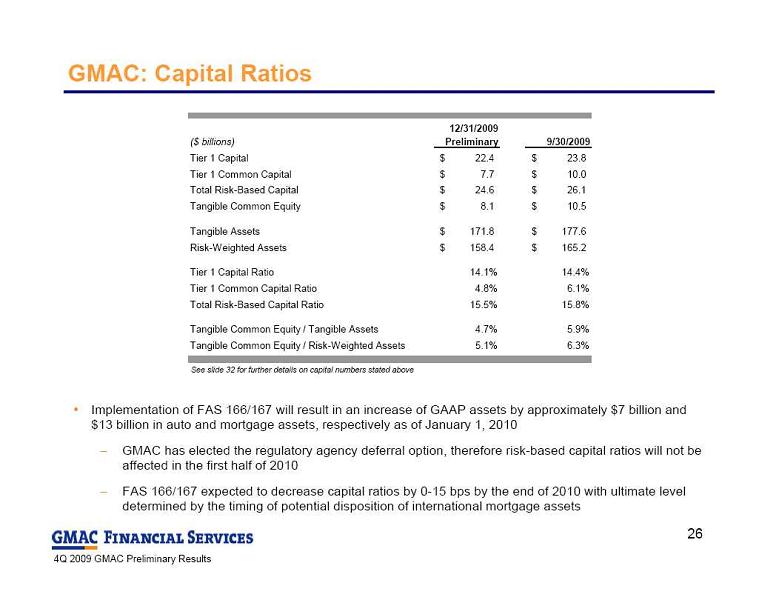 GMAC: Capital Ratios
See slide 32 for further details on capital numbers stated above
Implementation of FAS 166/167 will result in an increase of GAAP assets by approximately $7 billion and
GMAC: Capital Ratios
See slide 32 for further details on capital numbers stated above
Implementation of FAS 166/167 will result in an increase of GAAP assets by approximately $7 billion and
$13 billion in auto and mortgage assets, respectively as of January 1, 2010
GMAC has elected the regulatory agency deferral option, therefore risk-based capital ratios will not be
affected in the first half of 2010
FAS 166/167 expected to decrease capital ratios by 0-15 bps by the end of 2010 with ultimate level
determined by the timing of potential disposition of international mortgage assets
($ billions)
12/31/2009
Preliminary
9/30/2009
Tier 1 Capital
22.4
$
23.8
$
Tier 1 Common Capital
7.7
$
10.0
$
Total Risk-Based Capital
24.6
$
26.1
$
Tangible Common Equity
8.1
$
10.5
$
Tangible Assets
171.8
$
177.6
$
Risk-Weighted Assets
158.4
$
165.2
$
Tier 1 Capital Ratio
14.1%
14.4%
Tier 1 Common Capital Ratio
4.8%
6.1%
Total Risk-Based Capital Ratio
15.5%
15.8%
Tangible Common Equity / Tangible Assets
4.7%
5.9%
Tangible Common Equity / Risk-Weighted Assets
5.1%
6.3%
26
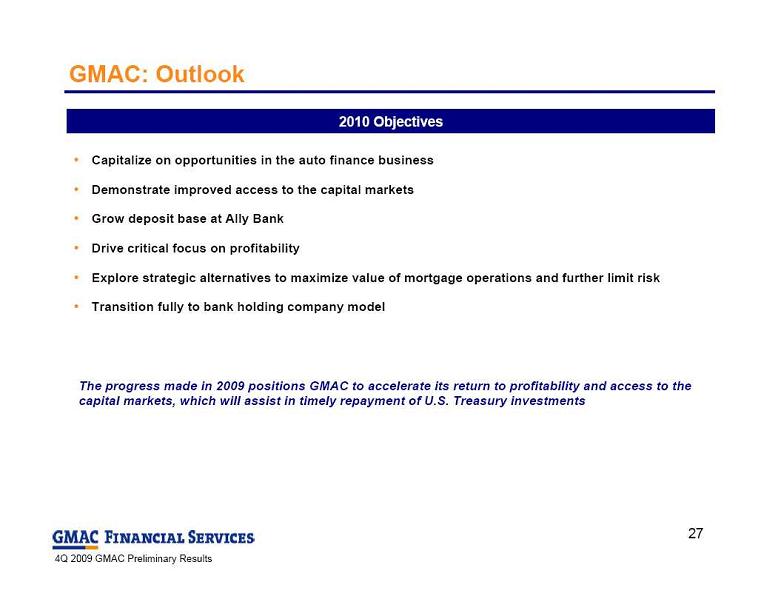 GMAC: Outlook
2010 Objectives
Capitalize on opportunities in the auto finance business
Demonstrate improved access to the capital markets
Grow deposit base at Ally Bank
Drive critical focus on profitability
Explore strategic alternatives to maximize value of mortgage operations and further limit risk
Transition fully to bank holding company model
The progress made in 2009 positions GMAC to accelerate its return to profitability and access to the
GMAC: Outlook
2010 Objectives
Capitalize on opportunities in the auto finance business
Demonstrate improved access to the capital markets
Grow deposit base at Ally Bank
Drive critical focus on profitability
Explore strategic alternatives to maximize value of mortgage operations and further limit risk
Transition fully to bank holding company model
The progress made in 2009 positions GMAC to accelerate its return to profitability and access to the
capital markets, which will assist in timely repayment of U.S. Treasury investments
27
 Supplemental Charts
28
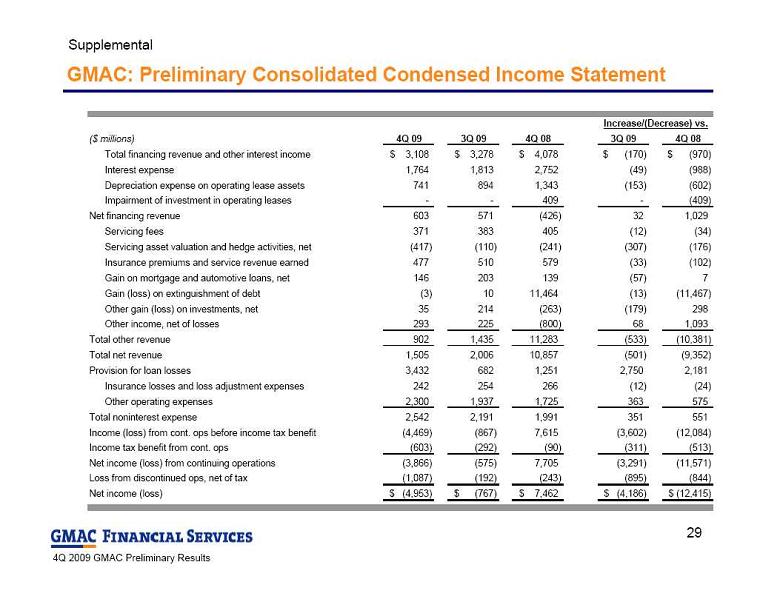 GMAC: Preliminary Consolidated Condensed Income Statement
Supplemental
($ millions)
4Q 09
3Q 09
4Q 08
3Q 09
4Q 08
Total financing revenue and other interest income
3,108
$
3,278
$
4,078
$
(170)
$
(970)
$
Interest expense
1,764
1,813
2,752
(49)
(988)
Depreciation expense on operating lease assets
741
894
1,343
(153)
(602)
Impairment of investment in operating leases
-
-
409
-
(409)
Net financing revenue
603
571
(426)
32
1,029
Servicing fees
371
383
405
(12)
(34)
Servicing asset valuation and hedge activities, net
(417)
(110)
(241)
(307)
(176)
Insurance premiums and service revenue earned
477
510
579
(33)
(102)
Gain on mortgage and automotive loans, net
146
203
139
(57)
7
Gain (loss) on extinguishment of debt
(3)
10
11,464
(13)
(11,467)
Other gain (loss) on investments, net
35
214
(263)
(179)
298
Other income, net of losses
293
225
(800)
68
1,093
Total other revenue
902
1,435
11,283
(533)
(10,381)
Total net revenue
1,505
2,006
10,857
(501)
(9,352)
Provision for loan losses
3,432
682
1,251
2,750
2,181
Insurance losses and loss adjustment expenses
242
254
266
(12)
(24)
Other operating expenses
2,300
1,937
1,725
363
575
Total noninterest expense
2,542
2,191
1,991
351
551
Income (loss) from cont. ops before income tax benefit
(4,469)
(867)
7,615
(3,602)
(12,084)
Income tax benefit from cont. ops
(603)
(292)
(90)
(311)
(513)
Net income (loss) from continuing operations
(3,866)
(575)
7,705
(3,291)
(11,571)
Loss from discontinued ops, net of tax
(1,087)
(192)
(243)
(895)
(844)
Net income (loss)
(4,953)
$
(767)
$
7,462
$
(4,186)
$
(12,415)
$
Increase/(Decrease) vs.
29
GMAC: Preliminary Consolidated Condensed Income Statement
Supplemental
($ millions)
4Q 09
3Q 09
4Q 08
3Q 09
4Q 08
Total financing revenue and other interest income
3,108
$
3,278
$
4,078
$
(170)
$
(970)
$
Interest expense
1,764
1,813
2,752
(49)
(988)
Depreciation expense on operating lease assets
741
894
1,343
(153)
(602)
Impairment of investment in operating leases
-
-
409
-
(409)
Net financing revenue
603
571
(426)
32
1,029
Servicing fees
371
383
405
(12)
(34)
Servicing asset valuation and hedge activities, net
(417)
(110)
(241)
(307)
(176)
Insurance premiums and service revenue earned
477
510
579
(33)
(102)
Gain on mortgage and automotive loans, net
146
203
139
(57)
7
Gain (loss) on extinguishment of debt
(3)
10
11,464
(13)
(11,467)
Other gain (loss) on investments, net
35
214
(263)
(179)
298
Other income, net of losses
293
225
(800)
68
1,093
Total other revenue
902
1,435
11,283
(533)
(10,381)
Total net revenue
1,505
2,006
10,857
(501)
(9,352)
Provision for loan losses
3,432
682
1,251
2,750
2,181
Insurance losses and loss adjustment expenses
242
254
266
(12)
(24)
Other operating expenses
2,300
1,937
1,725
363
575
Total noninterest expense
2,542
2,191
1,991
351
551
Income (loss) from cont. ops before income tax benefit
(4,469)
(867)
7,615
(3,602)
(12,084)
Income tax benefit from cont. ops
(603)
(292)
(90)
(311)
(513)
Net income (loss) from continuing operations
(3,866)
(575)
7,705
(3,291)
(11,571)
Loss from discontinued ops, net of tax
(1,087)
(192)
(243)
(895)
(844)
Net income (loss)
(4,953)
$
(767)
$
7,462
$
(4,186)
$
(12,415)
$
Increase/(Decrease) vs.
29
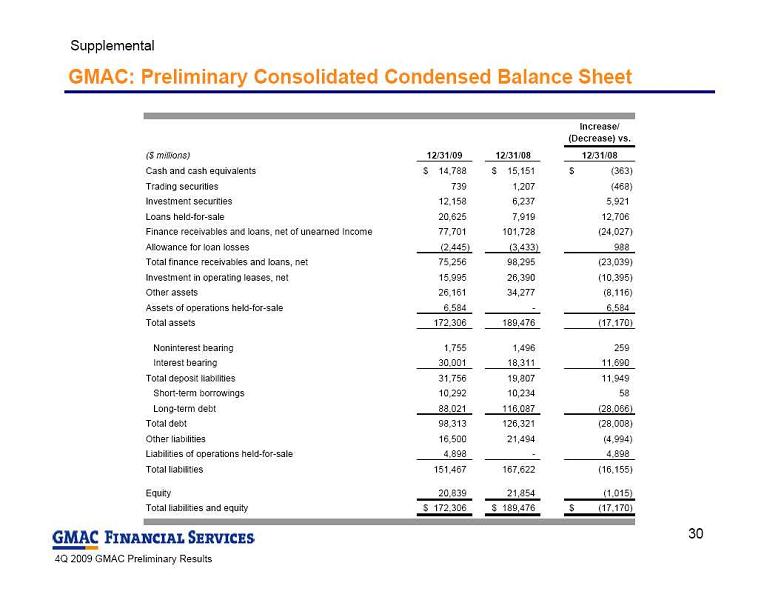 GMAC: Preliminary Consolidated Condensed Balance Sheet
Supplemental
Increase/
(Decrease) vs.
($ millions)
12/31/09
12/31/08
12/31/08
Cash and cash equivalents
14,788
$
15,151
$
(363)
$
Trading securities
739
1,207
(468)
Investment securities
12,158
6,237
5,921
Loans held-for-sale
20,625
7,919
12,706
Finance receivables and loans, net of unearned Income
77,701
101,728
(24,027)
Allowance for loan losses
(2,445)
(3,433)
988
Total finance receivables and loans, net
75,256
98,295
(23,039)
Investment in operating leases, net
15,995
26,390
(10,395)
Other assets
26,161
34,277
(8,116)
Assets of operations held-for-sale
6,584
-
6,584
Total assets
172,306
189,476
(17,170)
Noninterest bearing
1,755
1,496
259
Interest bearing
30,001
18,311
11,690
Total deposit liabilities
31,756
19,807
11,949
Short-term borrowings
10,292
10,234
58
Long-term debt
88,021
116,087
(28,066)
Total debt
98,313
126,321
(28,008)
Other liabilities
16,500
21,494
(4,994)
Liabilities of operations held-for-sale
4,898
-
4,898
Total liabilities
151,467
167,622
(16,155)
Equity
20,839
21,854
(1,015)
Total liabilities and equity
172,306
$
189,476
$
(17,170)
$
30
GMAC: Preliminary Consolidated Condensed Balance Sheet
Supplemental
Increase/
(Decrease) vs.
($ millions)
12/31/09
12/31/08
12/31/08
Cash and cash equivalents
14,788
$
15,151
$
(363)
$
Trading securities
739
1,207
(468)
Investment securities
12,158
6,237
5,921
Loans held-for-sale
20,625
7,919
12,706
Finance receivables and loans, net of unearned Income
77,701
101,728
(24,027)
Allowance for loan losses
(2,445)
(3,433)
988
Total finance receivables and loans, net
75,256
98,295
(23,039)
Investment in operating leases, net
15,995
26,390
(10,395)
Other assets
26,161
34,277
(8,116)
Assets of operations held-for-sale
6,584
-
6,584
Total assets
172,306
189,476
(17,170)
Noninterest bearing
1,755
1,496
259
Interest bearing
30,001
18,311
11,690
Total deposit liabilities
31,756
19,807
11,949
Short-term borrowings
10,292
10,234
58
Long-term debt
88,021
116,087
(28,066)
Total debt
98,313
126,321
(28,008)
Other liabilities
16,500
21,494
(4,994)
Liabilities of operations held-for-sale
4,898
-
4,898
Total liabilities
151,467
167,622
(16,155)
Equity
20,839
21,854
(1,015)
Total liabilities and equity
172,306
$
189,476
$
(17,170)
$
30
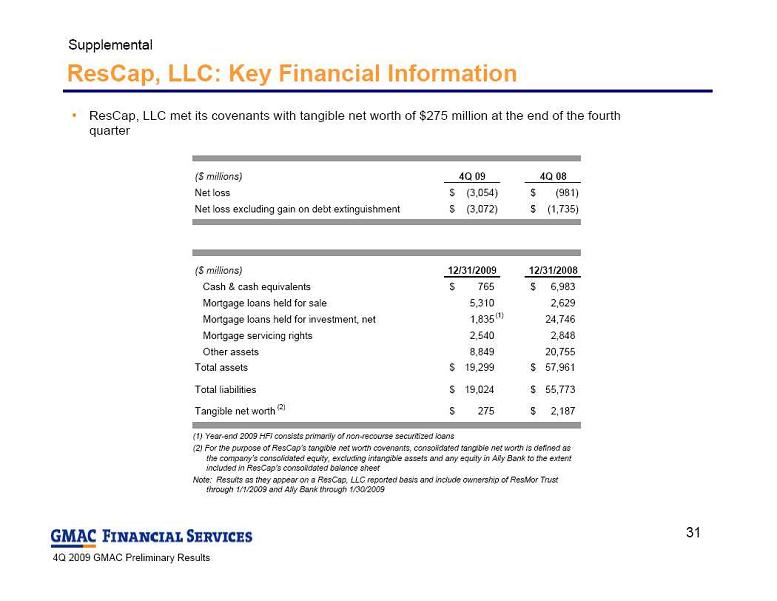 ResCap, LLC: Key Financial Information
ResCap, LLC met its covenants with tangible net worth of $275 million at the end of the fourth
ResCap, LLC: Key Financial Information
ResCap, LLC met its covenants with tangible net worth of $275 million at the end of the fourth
quarter
(1) Year-end 2009 HFI consists primarily of non-recourse securitized loans
(2) For the purpose of ResCap’s tangible net worth covenants, consolidated tangible net worth is defined as
the company’s consolidated equity, excluding intangible assets and any equity in Ally
Bank to the extent
included in ResCap’s consolidated balance sheet
Note: Results as they appear on a ResCap, LLC reported basis and include ownership of ResMor Trust
through 1/1/2009 and Ally Bank through 1/30/2009
Supplemental
($ millions)
4Q 09
4Q 08
Net loss
(3,054)
$
(981)
$
Net loss excluding gain on debt extinguishment
(3,072)
$
(1,735)
$
($ millions)
12/31/2009
12/31/2008
Cash & cash equivalents
765
$
6,983
$
Mortgage loans held for sale
5,310
2,629
Mortgage loans held for investment, net
1,835
24,746
Mortgage servicing rights
2,540
2,848
Other assets
8,849
20,755
Total assets
19,299
$
57,961
$
Total liabilities
19,024
$
55,773
$
Tangible net worth
(2)
275
$
2,187
$
(1)
31
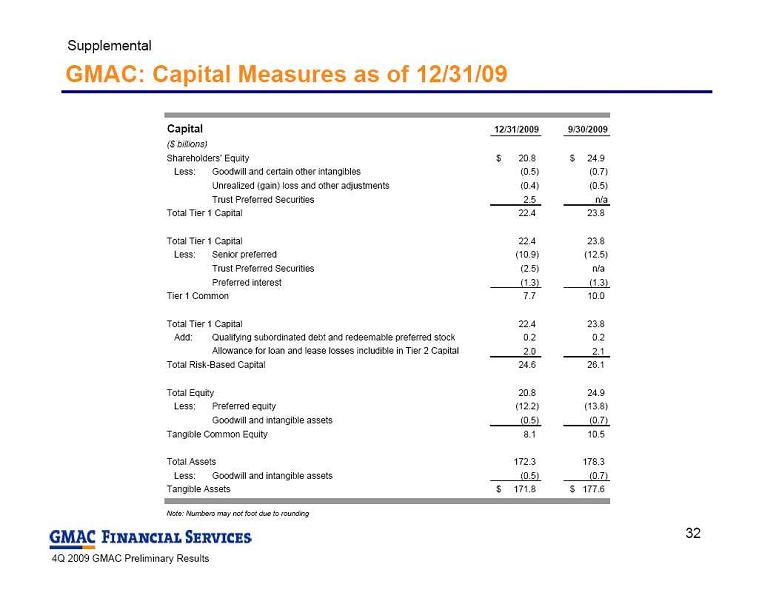 GMAC: Capital Measures as of 12/31/09
Supplemental
Capital
12/31/2009
9/30/2009
Shareholders’ Equity
20.8
$
24.9
$
Less:
Goodwill and certain other intangibles
(0.5)
(0.7)
Unrealized (gain) loss and other adjustments
(0.4)
(0.5)
Trust Preferred Securities
2.5
n/a
Total Tier 1 Capital
22.4
23.8
Total Tier 1 Capital
22.4
23.8
Less:
Senior preferred
(10.9)
(12.5)
Trust Preferred Securities
(2.5)
n/a
Preferred interest
(1.3)
(1.3)
Tier 1 Common
7.7
10.0
Total Tier 1 Capital
22.4
23.8
Add:
Qualifying subordinated debt and redeemable preferred stock
0.2
0.2
Allowance for loan and lease losses includible in Tier 2 Capital
2.0
2.1
Total Risk-Based Capital
24.6
26.1
Total Equity
20.8
24.9
Less:
Preferred equity
(12.2)
(13.8)
Goodwill and intangible assets
(0.5)
(0.7)
Tangible Common Equity
8.1
10.5
Total Assets
172.3
178.3
Less:
Goodwill and intangible assets
(0.5)
(0.7)
Tangible Assets
171.8
$
177.6
$
Note: Numbers may not foot due to rounding
($ billions)
32
GMAC: Capital Measures as of 12/31/09
Supplemental
Capital
12/31/2009
9/30/2009
Shareholders’ Equity
20.8
$
24.9
$
Less:
Goodwill and certain other intangibles
(0.5)
(0.7)
Unrealized (gain) loss and other adjustments
(0.4)
(0.5)
Trust Preferred Securities
2.5
n/a
Total Tier 1 Capital
22.4
23.8
Total Tier 1 Capital
22.4
23.8
Less:
Senior preferred
(10.9)
(12.5)
Trust Preferred Securities
(2.5)
n/a
Preferred interest
(1.3)
(1.3)
Tier 1 Common
7.7
10.0
Total Tier 1 Capital
22.4
23.8
Add:
Qualifying subordinated debt and redeemable preferred stock
0.2
0.2
Allowance for loan and lease losses includible in Tier 2 Capital
2.0
2.1
Total Risk-Based Capital
24.6
26.1
Total Equity
20.8
24.9
Less:
Preferred equity
(12.2)
(13.8)
Goodwill and intangible assets
(0.5)
(0.7)
Tangible Common Equity
8.1
10.5
Total Assets
172.3
178.3
Less:
Goodwill and intangible assets
(0.5)
(0.7)
Tangible Assets
171.8
$
177.6
$
Note: Numbers may not foot due to rounding
($ billions)
32
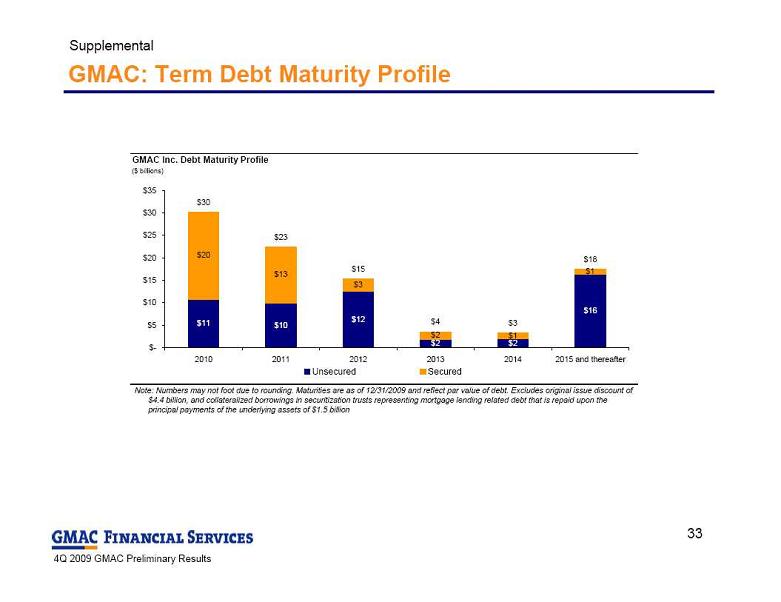 GMAC: Term Debt Maturity Profile
Supplemental
Note: Numbers may not foot due to rounding. Maturities are as of 12/31/2009 and reflect par value of debt. Excludes original issue discount of
GMAC: Term Debt Maturity Profile
Supplemental
Note: Numbers may not foot due to rounding. Maturities are as of 12/31/2009 and reflect par value of debt. Excludes original issue discount of
$4.4 billion, and collateralized borrowings in securitization
trusts representing mortgage lending related debt that is repaid upon the
principal payments of the underlying assets of $1.5 billion
GMAC Inc. Debt Maturity Profile
($ billions)
$11
$10
$12
$2
$2
$16
$20
$13
$3
$2
$1
$1
$30
$23
$15
$4
$3
$18
$-
$5
$10
$15
$20
$25
$30
$35
2010
2011
2012
2013
2014
2015 and thereafter
Unsecured
Secured
Total
33
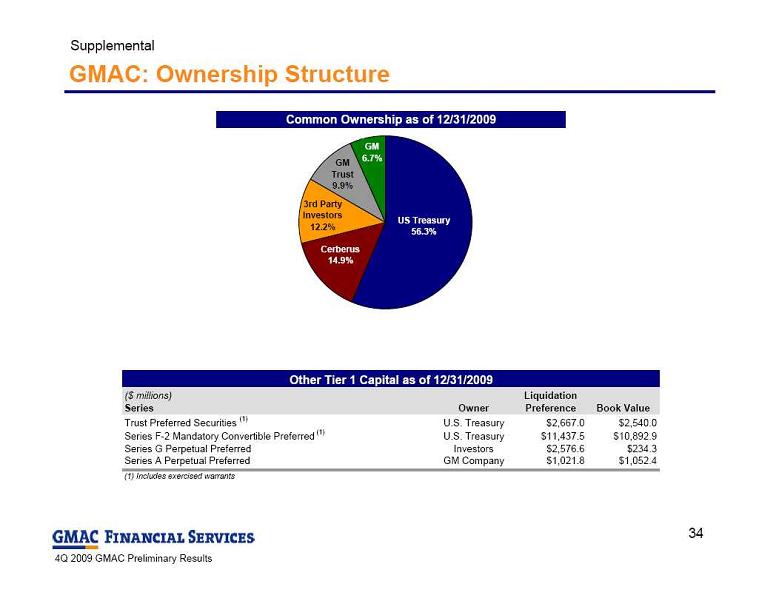 GMAC: Ownership Structure
Supplemental
Common Ownership as of 12/31/2009
US Treasury
56.3%
Cerberus
14.9%
3rd Party
Investors
12.2%
GM
Trust
9.9%
GM
6.7%
($ millions)
Series
Owner
Liquidation
Preference
Book Value
Trust Preferred Securities
(1)
U.S. Treasury
$2,667.0
$2,540.0
Series F-2 Mandatory Convertible Preferred
(1)
U.S. Treasury
$11,437.5
$10,892.9
Series G Perpetual Preferred
Investors
$2,576.6
$234.3
Series A Perpetual Preferred
GM Company
$1,021.8
$1,052.4
(1) Includes exercised warrants
Other Tier 1 Capital as of 12/31/2009
34
GMAC: Ownership Structure
Supplemental
Common Ownership as of 12/31/2009
US Treasury
56.3%
Cerberus
14.9%
3rd Party
Investors
12.2%
GM
Trust
9.9%
GM
6.7%
($ millions)
Series
Owner
Liquidation
Preference
Book Value
Trust Preferred Securities
(1)
U.S. Treasury
$2,667.0
$2,540.0
Series F-2 Mandatory Convertible Preferred
(1)
U.S. Treasury
$11,437.5
$10,892.9
Series G Perpetual Preferred
Investors
$2,576.6
$234.3
Series A Perpetual Preferred
GM Company
$1,021.8
$1,052.4
(1) Includes exercised warrants
Other Tier 1 Capital as of 12/31/2009
34