Attached files
| file | filename |
|---|---|
| 8-K - FORM 8-K - ANDEAVOR | d70888e8vk.htm |
Exhibit
99.1

| Credit Suisse Energy Summit February 2010 |

| This Presentation includes forward-looking statements within the meaning of the Private Securities Litigation Reform Act of 1995. These statements relate to, among other things, projections of refining margins, cash flows and capital expenditures. We have used the words "anticipate", "believe", "could", "estimate", "expect", "intend", "may", "plan", "predict", "project", "should", "will" and similar terms and phrases to identify forward-looking statements in this Presentation. Although we believe the assumptions upon which these forward-looking statements are based are reasonable, any of these assumptions could prove to be inaccurate and the forward-looking statements based on these assumptions could be incorrect. Our operations involve risks and uncertainties, many of which are outside our control, and any one of which, or a combination of which, could materially affect our results of operations and whether the forward-looking statements ultimately prove to be correct. Actual results and trends in the future may differ materially from those suggested or implied by the forward-looking statements depending on a variety of factors which are described in greater detail in our filings with the SEC. All future written and oral forward-looking statements attributable to us or persons acting on our behalf are expressly qualified in their entirety by the previous statements. We undertake no obligation to update any information contained herein or to publicly release the results of any revisions to any forward-looking statements that may be made to reflect events or circumstances that occur, or that we become aware of, after the date of this Presentation. Forward Looking Statements 2 |

| 3 4Q 2009 Results 2009 Accomplishments Current Supply/Demand Fundamentals 2010 & 3-Year Plan Agenda |

| Financial Summary 4 * 4Q 2009 results excludes $43 million goodwill impairment |

| 5 4Q 2009 Results 2009 Accomplishments Agenda |

| 6 Source: Platts * 4Q 2009 results excludes $43 million goodwill impairment 2009, Another Year of Volatility (CHART) $0.37/shr $(0.33)/shr $0.24/shr $(0.99)/shr* 1Q09 2Q09 3Q09 4Q09 1Q10 West Coast 3-2-1 ($/bbl) Tesoro EPS |
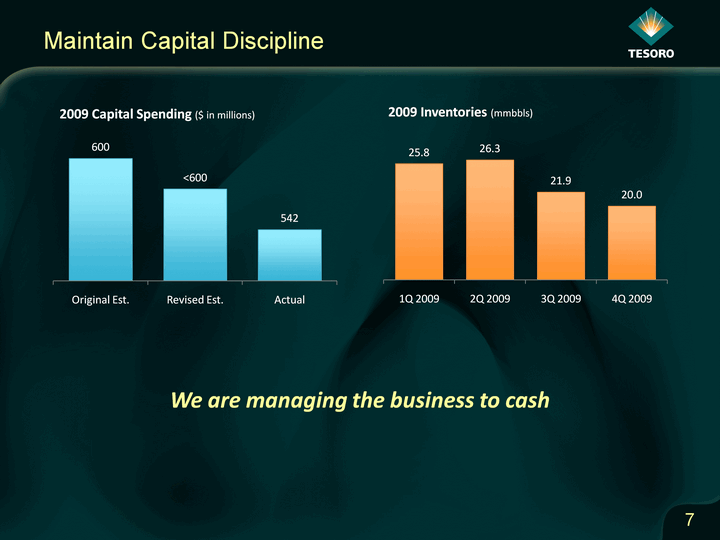
| Maintain Capital Discipline 7 7 We are managing the business to cash |

| 8 Margin Capture Initiatives 2009 Incremental EBITDA Over 2008 ($ in million) 2009 Incremental EBITDA Over 2008 ($ in million) 2009 Incremental EBITDA Over 2008 ($ in million) Non-Capital Improvements YE 2008 Est. Actual Crude and Feedstocks $ 110 $ 170 Product Realizations / Optimization 40 100 Transportation Savings 60 30 Production and Yields 55 70 Capital Capital 2008 Capital Program 105 55 2009 Incremental EBITDA $ 370 $ 425 Surpassed our initial expectations by $55 million |
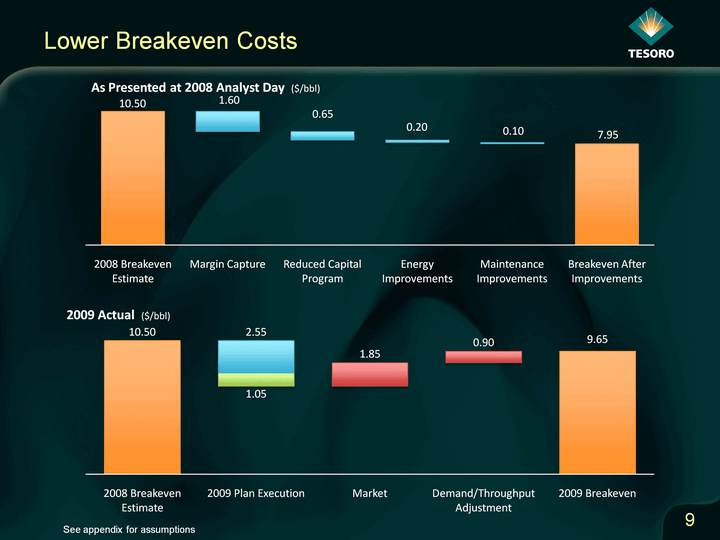
| 9 Lower Breakeven Costs (CHART) As Presented at 2008 Analyst Day ($/bbl) (CHART) 2009 Actual ($/bbl) See appendix for assumptions |

| 10 4Q 2009 Results 2009 Accomplishments Current Supply/Demand Fundamentals Agenda |

| Guessing At US Demand 11 11 We lost 5-6yrs worth of demand growth Source: DOE |

| Refining Supply Is Adjusting 12 Supply is being rationalized in specific markets Hurricane impact Recent Refinery Rationalization Recent Refinery Rationalization Region Capacity (mbpd) East Coast US , Canada, Caribbean 735 Northwest Europe 340 Japan 265 Western US 82 Total Capacity 1,422 78% Utilization Source: DOE |

| The West Coast Supply Picture 13 Tesoro and Valero represent almost 25% of PADD5 refining capacity 25% of PADD5 refining capacity 25% of PADD5 refining capacity Seasonally high gasoline inventories: Winter vs summer-grade gasoline CARB 4 Specification (Jan 1, 2010) Inventory builds ahead of turnarounds Inclement January weather in California Source: DOE |

| 14 Mixed West Coast Economic Indicators Near-Term Long-Term Positive Indicators Heavy TARs in Mar-AprRecent low crude importsHistorical Jan-Mar trends:Demand increaseMargin expansion West Coast import structure has not changedNo mass transit systemsCoastal home values appear to have troughed Negative Indicators Current excess clean product inventoriesWeak product demand levelsHigh unemployment High unemploymentCAFE standards |

| 15 4Q 2009 Results 2009 Accomplishments Current Supply/Demand Fundamentals 2010 & 3-Year Plan Agenda |
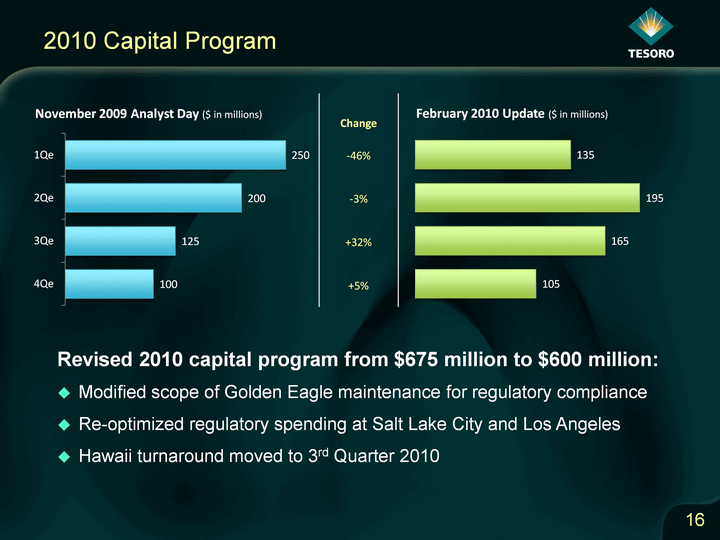
| 2010 Capital Program 16 16 16 Change -46% -3% +32% +5% Revised 2010 capital program from $675 million to $600 million: Modified scope of Golden Eagle maintenance for regulatory compliance Re-optimized regulatory spending at Salt Lake City and Los Angeles Hawaii turnaround moved to 3rd Quarter 2010 |

| 2010 Improvements 17 Change from 2009 ($/bbl) See appendix for assumptions |

| 18 2011-2013 Energy and Maintenance Improvements (CHART) Energy Expense Versus 2008 ($ in millions) Maintenance Expense Versus 2008 ($ in millions) We expect to exceed our original energy and maintenance expense initiatives, with $100 million in decreased expenses from 2008 to 2013 See appendix for assumptions |
| Quick Hit Capital Projects: $300 million in 3 years 19 Quick Execution, High Return Focused on High Probability, Return Areas 300 Projects Under Evaluation 50% of projects under $500,000 Only 10% over $5 million Designed to become self-funding after the first year |

| Building On Our Base, TSO 2013 20 See appendix for assumptions 2013 Tesoro Index $9.00/bbl Change from 2009 ($/bbl) |
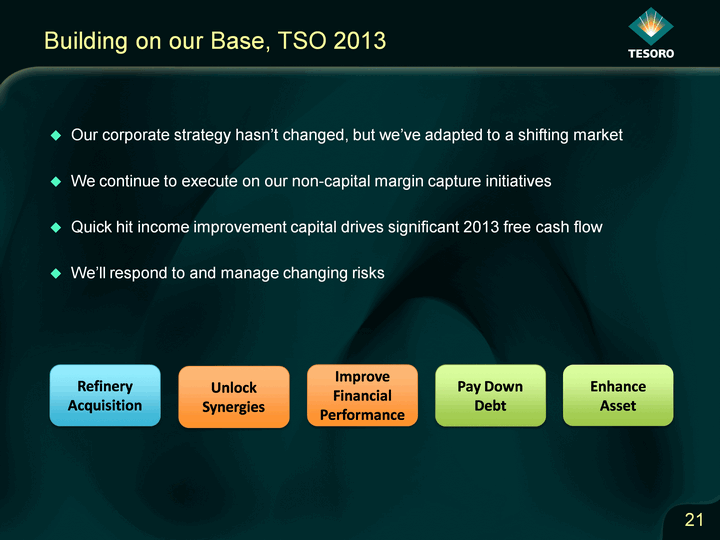
| 21 Building on our Base, TSO 2013 Our corporate strategy hasn't changed, but we've adapted to a shifting market We continue to execute on our non-capital margin capture initiatives Quick hit income improvement capital drives significant 2013 free cash flow We'll respond to and manage changing risks Refinery Acquisition Improve Financial Performance Enhance Asset Unlock Synergies Pay Down Debt |

| Appendix |

| 2010 Commodity Forecast: Tesoro Index: $9.20/bbl Henry Hub Natural Gas Forward Strip: $5.76/Mmbtu* Cash Breakeven, Quick Hit Capital: All values during 2010-2013 assume constant throughput, energy prices Energy and Maintenance Efficiencies: 2008-2013 values assume constant 2010 natural gas pricing Energy improvements show up in opex for purchased energy, and COGS for internally produced fuel Assumptions 23 *As of October 30, 2009 |

| 24 Supplemental Financial and Operational Info California Region 2007 2007 2007 2007 2007 2008 2008 2008 2008 2008 2009 2009 2009 1Q 2Q 3Q 4Q Year 1Q 2Q 3Q 4Q Year 1Q 2Q 3Q Throughput (mbpd) Throughput (mbpd) Heavy Crude 71 119 168 174 133 157 144 188 166 164 164 173 147 Light Crude 37 82 83 82 72 83 82 66 61 73 60 57 63 Other Feedstocks 3 17 21 18 17 19 24 19 24 21 24 21 25 Total Throughput Total Throughput 111 218 272 274 222 259 250 273 251 258 248 251 235 Yield (mbpd) Yield (mbpd) Gasoline & Blendstocks 42 128 156 157 121 144 129 135 127 133 133 140 140 Jet Fuel - 8 18 17 11 18 20 19 15 18 16 20 17 Diesel 29 56 61 65 53 61 68 83 76 72 61 50 47 Heavy Oils, Resid & Other 43 43 54 51 49 52 53 59 52 54 59 65 53 Total Yield Total Yield 114 235 289 290 234 275 270 296 270 277 269 275 257 Gross Refining Margin Gross Refining Margin 209 514 277 317 1,317 240 318 458 316 1,332 336 185 250 Refining Margin ($/bbl) Refining Margin ($/bbl) Gross 20.82 25.96 11.07 12.60 16.33 10.18 13.98 18.22 13.66 14.08 15.08 8.09 11.54 Manufacturing Costs before Depreciation & Amortization 9.37 6.90 6.12 7.01 6.94 7.22 7.87 7.47 6.13 7.18 7.04 6.12 7.02 |

| 25 Supplemental Financial and Operational Info Pacific Northwest Region 2007 2007 2007 2007 2007 2008 2008 2008 2008 2008 2009 2009 1Q 2Q 3Q 4Q Year 1Q 2Q 3Q 4Q Year 1Q 2Q 3Q Throughput (mbpd) Throughput (mbpd) Heavy Crude 11 8 11 14 11 12 13 1 - 7 - - - Light Crude 148 177 169 160 163 143 153 148 128 143 106 129 145 Other Feedstocks 12 9 5 6 8 5 9 13 10 9 7 10 10 Total Throughput Total Throughput 171 194 185 180 182 160 175 162 138 159 113 139 155 Yield (mbpd) Yield (mbpd) Gasoline & Blendstocks 74 85 75 74 77 61 69 67 56 63 50 64 69 Jet Fuel 29 33 37 33 33 31 31 35 30 32 22 22 33 Diesel 30 37 31 35 33 28 36 32 25 30 21 23 26 Heavy Oils, Resid & Other 43 47 47 45 46 44 45 34 31 39 24 34 32 Total Yield Total Yield 176 202 190 187 189 164 181 168 142 164 117 143 160 Gross Refining Margin Gross Refining Margin 196 341 86 107 730 29 138 205 24 396 83 123 129 Refining Margin ($/bbl) Refining Margin ($/bbl) Gross 12.79 19.26 5.01 6.42 10.94 2.03 8.63 13.76 1.83 6.82 8.17 9.70 9.08 Manufacturing Costs before Depreciation & Amortization 2.94 2.65 2.84 3.55 2.99 4.25 3.79 3.79 4.19 3.99 4.75 3.72 3.04 |

| 26 Supplemental Financial and Operational Info Mid-Pacific 2007 2007 2007 2007 2007 2008 2008 2008 2008 2008 2009 2009 2009 1Q 2Q 3Q 4Q Year 1Q 2Q 3Q 4Q Year 1Q 2Q 3Q Throughput (mbpd) Throughput (mbpd) Heavy Crude 17 13 13 15 15 7 27 32 20 21 17 13 15 Light Crude 66 74 68 59 66 60 44 40 46 48 56 53 51 Other Feedstocks - - - - - - - - - - - - - Total Throughput Total Throughput 83 87 81 74 81 67 71 72 66 69 73 66 66 Yield (mbpd) Yield (mbpd) Gasoline & Blendstocks 22 21 18 16 19 16 16 16 15 16 17 16 16 Jet Fuel 25 24 23 20 23 18 19 18 18 18 18 17 19 Diesel 14 16 14 11 14 10 11 11 11 11 11 10 12 Heavy Oils, Resid & Other 24 27 28 28 27 25 27 28 24 26 29 24 20 Total Yield Total Yield 85 88 83 75 83 69 73 73 68 71 75 67 67 Gross Refining Margin Gross Refining Margin 30 54 2 (51) 35 (9) (41) 80 140 170 56 15 7 Refining Margin ($/bbl) Refining Margin ($/bbl) Gross 3.94 6.78 0.32 (7.42) 1.18 (1.49) (6.33) 12.15 23.14 6.72 8.53 2.52 1.05 Manufacturing Costs before Depreciation & Amortization 2.07 1.90 2.12 2.90 2.23 3.08 3.15 3.45 3.52 3.30 2.76 3.21 3.26 |

| 27 Supplemental Financial and Operational Info Mid-Continent 2007 2007 2007 2007 2007 2008 2008 2008 2008 2008 2009 2009 2009 1Q 2Q 3Q 4Q Year 1Q 2Q 3Q 4Q Year 1Q 2Q 3Q Throughput (mbpd) Throughput (mbpd) Heavy Crude 97 108 111 107 106 104 109 110 97 105 98 104 102 Light Crude 3 5 5 4 4 3 5 5 3 4 3 5 6 Other Feedstocks - - - - - - - - - - - - - Total Throughput Total Throughput 100 113 116 111 110 107 114 115 100 109 101 109 108 Yield (mbpd) Yield (mbpd) Gasoline & Blendstocks 54 65 67 66 63 62 66 65 58 63 58 66 64 Jet Fuel 9 10 10 12 10 9 12 10 9 10 8 8 10 Diesel 30 31 31 26 29 29 30 32 29 30 28 28 28 Heavy Oils, Resid & Other 10 11 12 11 11 12 10 11 9 10 11 10 10 Total Yield Total Yield 103 117 120 115 113 112 118 118 105 113 105 112 112 Gross Refining Margin Gross Refining Margin 129 272 185 115 701 92 143 213 155 603 111 111 115 Refining Margin ($/bbl) Refining Margin ($/bbl) Gross 14.42 26.52 17.41 11.27 17.51 9.44 13.86 20.10 16.82 15.12 12.17 11.29 11.50 Manufacturing Costs before Depreciation & Amortization 3.35 2.84 2.81 3.32 3.07 3.57 3.59 3.12 3.50 3.44 3.63 3.20 3.37 |

| 28 Supplemental Financial and Operational Info Total Refining 2007 2007 2007 2007 2007 2008 2008 2008 2008 2008 2009 2009 2009 1Q 2Q 3Q 4Q Year 1Q 2Q 3Q 4Q Year 1Q 2Q 3Q Throughput (mbpd) Throughput (mbpd) Heavy Crude 99 140 192 203 159 176 184 221 186 192 181 186 162 Light Crude 348 441 431 408 407 390 388 364 332 369 320 343 361 Other Feedstocks 18 31 31 28 29 27 38 37 37 34 34 36 41 Total Throughput Total Throughput 465 612 654 639 595 593 610 622 555 595 535 565 564 Yield (mbpd) Yield (mbpd) Gasoline & Blendstocks 192 299 316 313 280 283 280 283 256 275 258 286 289 Jet Fuel 63 75 88 82 77 76 82 82 72 78 64 67 79 Diesel 103 140 137 137 129 128 145 158 141 143 121 111 113 Heavy Oils, Resid & Other 120 128 141 135 133 133 135 132 116 129 123 133 115 Total Yield Total Yield 478 642 682 667 619 620 642 655 585 625 566 597 596 Gross Refining Margin Gross Refining Margin 565 1,168 543 486 2,762 353 561 955 637 2,506 585 438 498 Refining Margin ($/bbl) Refining Margin ($/bbl) Gross 13.50 20.98 9.02 8.28 12.73 6.54 10.10 16.69 12.47 11.50 12.14 8.52 9.59 Manufacturing Costs before Depreciation & Amortization 4.41 4.09 4.10 4.92 4.37 5.29 5.35 5.24 4.86 5.19 5.33 4.63 4.79 |

| 29 Supplemental Financial and Operational Info Refined Product Sales 2007 2007 2007 2007 2007 2008 2008 2008 2008 2008 2009 2009 2009 1Q 2Q 3Q 4Q Year 1Q 2Q 3Q 4Q Year 1Q 2Q 3Q Refined Product Sales (mpbd) Refined Product Sales (mpbd) Refined Product Sales (mpbd) Gasoline & Blendstocks Gasoline & Blendstocks 252 326 347 349 319 330 334 327 313 326 307 317 309 Jet Fuel Jet Fuel 89 91 101 102 96 97 92 94 86 92 77 79 92 Diesel Diesel 114 138 145 127 131 123 151 164 136 144 120 123 129 Heavy Oils, Resid & Other Heavy Oils, Resid & Other 86 99 98 106 97 94 104 97 81 94 85 88 81 Total Refined Product Sales Total Refined Product Sales Total Refined Product Sales 541 654 691 684 643 644 681 682 616 656 589 607 611 Refined Product Sales Margin ($/bbl) Refined Product Sales Margin ($/bbl) Refined Product Sales Margin ($/bbl) Average Sales Price 75.80 90.92 88.68 99.47 89.47 106.01 135.73 131.21 71.24 112.06 56.40 69.63 83.71 Average Costs of Sales 64.13 72.05 80.65 92.20 78.14 99.41 125.19 117.83 63.36 102.37 46.00 61.80 76.47 Refined Product Sales Margin Refined Product Sales Margin Refined Product Sales Margin 11.67 18.87 8.03 7.27 11.33 6.60 10.54 13.38 7.88 9.69 10.40 7.83 7.24 |

| 30 Supplemental Financial and Operational Info 2007 2007 2007 2007 2007 2008 2008 2008 2008 2008 2009 2009 1Q 2Q 3Q 4Q Year 1Q 2Q 3Q 4Q Year 1Q 2Q 3Q Number of Branded Stations Number of Branded Stations Number of Branded Stations Tesoro - Operated Tesoro - Operated 194 453 449 449 449 444 437 391 389 389 389 388 387 Jobber/Dealer Jobber/Dealer 270 438 453 462 462 495 496 492 490 490 490 490 479 Total Stations Total Stations Total Stations 464 891 902 911 911 939 933 883 879 879 879 878 866 Avg. Number of Branded Stations Avg. Number of Branded Stations Avg. Number of Branded Stations Tesoro - Operated Tesoro - Operated 194 353 451 449 362 446 440 414 390 422 389 388 388 Jobber/Dealer Jobber/Dealer 268 361 446 457 384 475 497 495 491 489 490 490 483 Total Average Retail Stations Total Average Retail Stations Total Average Retail Stations 462 714 897 906 746 921 937 909 881 911 879 878 871 Fuel Sales (millions of gallons) Fuel Sales (millions of gallons) Fuel Sales (millions of gallons) Tesoro - Operated 57 187 311 301 856 287 270 258 257 1,072 250 263 262 Jobber/Dealer 47 57 71 67 242 62 73 76 71 282 66 80 83 Sales Volume - Total Stations Sales Volume - Total Stations Sales Volume - Total Stations 104 244 382 368 1,098 349 343 334 328 1,354 316 343 345 |

| 31 Supplemental Financial and Operational Info 2007 2007 2007 2007 2007 2008 2008 2008 2008 2008 2009 2009 1Q 2Q 3Q 4Q Year 1Q 2Q 3Q 4Q Year 1Q 2Q 3Q Average Fuel Sales Per Month Per Station (thousands of gallons) Average Fuel Sales Per Month Per Station (thousands of gallons) Tesoro - Operated 98 176 230 223 197 215 205 208 219 212 214 226 225 Jobber/Dealer 58 53 53 49 53 44 49 51 49 48 45 54 57 Total Stations Total Stations 75 114 142 135 123 126 122 123 123 124 120 130 132 Retail Fuel Margin ($/gallon) Retail Fuel Margin ($/gallon) 0.11 0.15 0.16 0.15 0.15 0.12 0.12 0.30 0.32 0.21 0.11 0.16 0.28 Retail Merchandise Margin (in millions) Retail Merchandise Margin (in millions) $8 $13 $17 $14 $52 $13 $15 16 13 57 11 14 14 Retail Merchandise Margin % Retail Merchandise Margin % 26 25 27 25 26 25 26 27 25 26 24 25 25 Other Non-Fuel Margin (in millions) Other Non-Fuel Margin (in millions) $0 $4 $6 $7 $17 $5 $5 $6 $5 $21 $6 $6 $7 |

| 32 Supplemental Financial and Operational Info 2007 2007 2007 2007 2007 2008 2008 2008 2008 2008 2009 2009 1Q 2Q 3Q 4Q Year 1Q 2Q 3Q 4Q Year 1Q 2Q 3Q Capital Expenditures Refining Capital Expenditures Refining California 89 131 148 173 541 132 86 71 102 391 44 60 57 Pacific Northwest 30 26 16 24 96 14 11 13 15 53 10 15 18 Mid-Pacific 3 3 8 19 33 4 5 2 2 13 3 1 3 Mid-Continent 9 16 10 15 50 15 21 33 35 104 14 12 13 Total Refining Total Refining 131 176 182 231 720 165 123 119 154 561 71 88 91 Retail Retail 1 1 1 7 10 1 5 4 10 20 5 4 1 Corporate Corporate 8 12 12 27 59 9 8 7 14 38 12 15 4 Total Capital Expenditures 140 189 195 265 789 175 136 130 178 619 88 107 96 Deferred Turnaround Expense 66 40 15 22 143 34 42 7 22 105 19 66 13 Total Capital Investment 206 229 210 287 932 209 178 137 200 724 107 173 109 |
