Attached files
| file | filename |
|---|---|
| EX-31.2 - Measurement Specialties Inc | v172776_ex31-2.htm |
| EX-32.1 - Measurement Specialties Inc | v172776_ex32-1.htm |
| EX-31.1 - Measurement Specialties Inc | v172776_ex31-1.htm |
SECURITIES
AND EXCHANGE COMMISSION
WASHINGTON,
D.C. 20549
FORM
10-Q
(MARK
ONE)
x
QUARTERLY REPORT PURSUANT
TO SECTION 13 or 15 (d) OF THE SECURITIES
EXCHANGE ACT OF 1934
FOR
THE FISCAL QUARTERLY PERIOD ENDED DECEMBER 31, 2009
OR
o
TRANSITION REPORT
PURSUANT TO SECTION 13 or 15 (d) OF THE SECURITIES
EXCHANGE
ACT OF 1934
COMMISSION
FILE NUMBER: 1-11906
MEASUREMENT
SPECIALTIES, INC.
(EXACT
NAME OF REGISTRANT AS SPECIFIED IN ITS CHARTER)
|
New Jersey
|
22-2378738
|
|
|
(STATE
OR OTHER JURISDICTION OF
INCORPORATION
OR ORGANIZATION)
|
(I.R.S.
EMPLOYER
IDENTIFICATION
NO. )
|
1000 LUCAS WAY, HAMPTON, VA
23666
(ADDRESS
OF PRINCIPAL EXECUTIVE OFFICES)
(757)
766-1500
(REGISTRANT’S
TELEPHONE NUMBER, INCLUDING AREA CODE)
Indicate
by check mark whether the registrant (1) has filed all reports required to
be filed by Section 13 or 15(d) of the Securities Exchange Act of 1934
during the preceding 12 months (or for such shorter period that the registrant
was required to file such reports), and (2) has been subject to such filing
requirements for the past 90 days. Yes x
No o .
Indicate
by check mark whether the registrant is a large accelerated filer, an
accelerated filer, a non-accelerated filer, or a smaller reporting company. See
definition of “large accelerated filer,” “accelerated filer” and “smaller
reporting company” in Rule 12b-2 of the Securities Exchange Act of 1934. (Check
one):
|
Large
accelerated filer o
|
Accelerated
filer x
|
Non-accelerated
filer o
|
Smaller
reporting company o
|
|
(Do
not check if a smaller reporting
company)
|
|||
Indicate
by check mark whether the registrant is a shell company (as defined in Rule
12b-2 of the Securities Exchange Act of 1934). Yes o
No x
.
Indicate
the number of shares outstanding of each of the issuer’s classes of stock, as of
the latest practicable date: At January 29, 2010, the number of
shares outstanding of the Registrant’s common stock was
14,514,457.
MEASUREMENT
SPECIALTIES, INC.
FORM
10-Q
TABLE OF
CONTENTS
DECEMBER
31, 2009
|
PART
I.
|
FINANCIAL
INFORMATION
|
3
|
|
|
ITEM
1.
|
FINANCIAL
STATEMENTS
|
3
|
|
|
CONDENSED
CONSOLIDATED STATEMENTS OF OPERATIONS (UNAUDITED)
|
3
|
||
|
CONDENSED
CONSOLIDATED BALANCE SHEETS (UNAUDITED)
|
4
|
||
|
CONDENSED
CONSOLIDATED STATEMENTS OF SHAREHOLDERS’ EQUITY AND COMPREHENSIVE INCOME
(UNAUDITED)
|
6
|
||
|
CONDENSED
CONSOLIDATED STATEMENTS OF CASH FLOWS (UNAUDITED)
|
7
|
||
|
NOTES
TO CONDENSED CONSOLIDATED FINANCIAL STATEMENTS (UNAUDITED)
|
8
|
||
|
ITEM
2.
|
MANAGEMENT’S
DISCUSSION AND ANALYSIS OF FINANCIAL CONDITION AND RESULTS OF
OPERATIONS
|
21
|
|
|
ITEM
3.
|
QUANTITATIVE
AND QUALITATIVE DISCLOSURES ABOUT MARKET RISK
|
33
|
|
|
ITEM
4.
|
CONTROLS
AND PROCEDURES
|
34
|
|
|
PART
II.
|
OTHER
INFORMATION
|
35
|
|
|
ITEM
1.
|
LEGAL
PROCEEDINGS
|
35
|
|
|
ITEM
1A.
|
RISK
FACTORS
|
35
|
|
|
ITEM
6.
|
EXHIBITS
|
35
|
|
|
SIGNATURES
|
36
|
||
2
ITEM
1. FINANCIAL STATEMENTS
MEASUREMENT
SPECIALTIES, INC. AND SUBSIDIARIES
CONDENSED CONSOLIDATED STATEMENTS OF
OPERATIONS
(UNAUDITED)
|
Three
Months Ended
December
31,
|
Nine
Months Ended
December
31,
|
|||||||||||||||
|
(Amounts
in thousands, except per share amounts)
|
2009
|
2008
|
2009
|
2008
|
||||||||||||
|
Net
sales
|
$ | 54,755 | $ | 43,299 | $ | 148,583 | $ | 161,184 | ||||||||
|
Cost
of goods sold
|
32,795 | 24,379 | 92,472 | 91,987 | ||||||||||||
|
Gross
profit
|
21,960 | 18,920 | 56,111 | 69,197 | ||||||||||||
|
Selling,
general, and administrative expenses
|
17,713 | 16,866 | 51,513 | 54,963 | ||||||||||||
|
Operating
income
|
4,247 | 2,054 | 4,598 | 14,234 | ||||||||||||
|
Interest
expense, net
|
905 | 675 | 3,092 | 2,187 | ||||||||||||
|
Foreign
currency exchange loss (gain)
|
(64 | ) | 351 | (1,037 | ) | 684 | ||||||||||
|
Other
expense (income)
|
52 | 161 | 79 | (193 | ) | |||||||||||
|
Income
from continuing operations, before income taxes
|
3,354 | 867 | 2,464 | 11,556 | ||||||||||||
|
Income
tax expense (benefit) from continuing operations
|
(28 | ) | (115 | ) | 280 | 2,830 | ||||||||||
|
Income
from continuing operations, net of income taxes
|
3,382 | 982 | 2,184 | 8,726 | ||||||||||||
|
Loss
from discontinued operations, net of income taxes
|
(16 | ) | - | (142 | ) | - | ||||||||||
|
Net
income
|
3,366 | 982 | 2,042 | 8,726 | ||||||||||||
|
Less: Net
income attributable to noncontrolling interest
|
118 | 106 | 328 | 276 | ||||||||||||
|
Net
income attributable to Measurement Specialties, Inc.
("MEAS")
|
$ | 3,248 | $ | 876 | $ | 1,714 | $ | 8,450 | ||||||||
|
Amounts
attributable to MEAS common shareholders:
|
||||||||||||||||
|
Income
from continuing operations, net of income taxes
|
$ | 3,264 | $ | 876 | $ | 1,856 | $ | 8,450 | ||||||||
|
Loss
from discontinued operations attributable to MEAS
|
(16 | ) | - | (142 | ) | - | ||||||||||
|
Net
income
|
$ | 3,248 | $ | 876 | $ | 1,714 | $ | 8,450 | ||||||||
|
Earnings
per common share - Basic:
|
||||||||||||||||
|
Income
from continuing operations, net of income taxes
|
$ | 0.22 | $ | 0.06 | $ | 0.13 | $ | 0.58 | ||||||||
|
Loss
from discontinued operations attributable to MEAS
|
- | - | (0.01 | ) | - | |||||||||||
|
Net
income - Basic
|
$ | 0.22 | $ | 0.06 | $ | 0.12 | $ | 0.58 | ||||||||
|
Earnings
per common share - Diluted:
|
||||||||||||||||
|
Income
from continuing operations, net of income taxes
|
$ | 0.22 | $ | 0.06 | $ | 0.13 | $ | 0.58 | ||||||||
|
Loss
from discontinued operations attributable to MEAS
|
- | - | (0.01 | ) | - | |||||||||||
|
Net
income - Diluted
|
$ | 0.22 | $ | 0.06 | $ | 0.12 | $ | 0.58 | ||||||||
|
Weighted
average shares outstanding - Basic
|
14,504 | 14,464 | 14,492 | 14,461 | ||||||||||||
|
Weighted
average shares outstanding - Diluted
|
14,686 | 14,536 | 14,629 | 14,545 | ||||||||||||
See
accompanying notes to condensed consolidated financial statements.
3
CONSENSED
CONSOLIDATED BALANCE SHEETS
(UNAUDITED)
|
(Amounts
in thousands)
|
December
31, 2009
|
March
31, 2009
|
||||||
|
ASSETS
|
||||||||
|
Current
assets:
|
||||||||
|
Cash
and cash equivalents
|
$ | 26,303 | $ | 23,483 | ||||
|
Accounts
receivable trade, net of allowance for doubtful accounts of $710 and $898,
respectively
|
28,934 | 28,830 | ||||||
|
Inventories,
net
|
43,043 | 45,384 | ||||||
|
Deferred
income taxes, net
|
933 | 2,067 | ||||||
|
Prepaid
expenses and other current assets
|
3,797 | 3,968 | ||||||
|
Other
receivables
|
1,019 | 458 | ||||||
|
Due
from joint venture partner
|
776 | 1,824 | ||||||
|
Promissory
note receivable
|
- | 283 | ||||||
|
Income
taxes receivable
|
2,580 | - | ||||||
|
Total
current assets
|
107,385 | 106,297 | ||||||
|
Property,
plant and equipment, net
|
45,351 | 46,875 | ||||||
|
Goodwill
|
100,142 | 99,176 | ||||||
|
Acquired
intangible assets, net
|
25,627 | 27,478 | ||||||
|
Deferred
income taxes, net
|
1,560 | 2,985 | ||||||
|
Other
assets
|
1,376 | 1,319 | ||||||
|
Total
assets
|
$ | 281,441 | $ | 284,130 | ||||
See
accompanying notes to condensed consolidated financial
statements.
4
CONDENSED
CONSOLIDATED BALANCE SHEETS
(UNAUDITED)
|
(Amounts
in thousands, except share amounts)
|
December
31, 2009
|
March
31, 2009
|
||||||
|
LIABILITIES AND SHAREHOLDERS' EQUITY
|
||||||||
|
Current
liabilities:
|
||||||||
|
Current
portion of promissory notes payable
|
$ | 2,408 | $ | 2,176 | ||||
|
Current
portion of long-term debt
|
2,471 | 2,356 | ||||||
|
Current
portion of capital lease obligations
|
305 | 797 | ||||||
|
Accounts
payable
|
17,166 | 15,381 | ||||||
|
Accrued
expenses
|
5,103 | 3,041 | ||||||
|
Accrued
compensation
|
5,937 | 5,656 | ||||||
|
Income
taxes payable
|
- | 1,838 | ||||||
|
Other
current liabilities
|
4,117 | 3,394 | ||||||
|
Total
current liabilities
|
37,507 | 34,639 | ||||||
|
Revolver
|
63,547 | 71,407 | ||||||
|
Promissory
notes payable, net of current portion
|
4,817 | 4,352 | ||||||
|
Long-term
debt, net of current portion
|
6,948 | 12,769 | ||||||
|
Capital
lease obligations, net of current portion
|
143 | 250 | ||||||
|
Other
liabilities
|
1,117 | 1,085 | ||||||
|
Total
liabilities
|
114,079 | 124,502 | ||||||
|
Equity:
|
||||||||
|
Measurement
Specialties, Inc. ("MEAS") shareholders' equity:
|
||||||||
|
Serial
preferred stock; 221,756 shares authorized; none
outstanding
|
- | - | ||||||
|
Common
stock, no par; 25,000,000 shares authorized; 14,509,957 and 14,483,622
shares issued and outstanding, respectively
|
- | - | ||||||
|
Additional
paid-in capital
|
84,279 | 81,948 | ||||||
|
Retained
earnings
|
68,932 | 67,218 | ||||||
|
Accumulated
other comprehensive income
|
12,150 | 8,110 | ||||||
|
Total
MEAS shareholders' equity
|
165,361 | 157,276 | ||||||
|
Noncontrolling
interest
|
2,001 | 2,352 | ||||||
|
Total
equity
|
167,362 | 159,628 | ||||||
|
Total
liabilities and shareholders' equity
|
$ | 281,441 | $ | 284,130 | ||||
See
accompanying notes to condensed consolidated financial
statements.
5
MEASUREMENT
SPECIALTIES, INC. AND SUBSIDIARIES
CONDENSED
CONSOLIDATED STATEMENTS OF SHAREHOLDERS’ EQUITY
AND
COMPREHENSIVE INCOME
FOR
THE NINE MONTHS ENDED DECEMBER 31, 2009 AND 2008
(UNAUDITED)
|
Accumulated
|
||||||||||||||||||||||||||||
|
Shares
of
|
Additional
|
Other
|
||||||||||||||||||||||||||
|
Common
|
Paid-in
|
Retained
|
Comprehensive
|
Noncontrolling
|
Comprehensive
|
|||||||||||||||||||||||
|
(Dollars
in thousands)
|
Stock
|
Capital
|
Earnings
|
Income
|
Interest
|
Total
|
Income
|
|||||||||||||||||||||
|
Balance, March
31, 2008
|
14,440,848 | $ | 78,720 | $ | 61,939 | $ | 15,130 | $ | 1,953 | $ | 157,742 | |||||||||||||||||
|
Comprehensive
income:
|
||||||||||||||||||||||||||||
|
Net
income
|
- | 8,450 | - | 276 | 8,726 | $ | 8,726 | |||||||||||||||||||||
|
Currency
translation adjustment
|
- | - | (3,544 | ) | 334 | (3,210 | ) | (3,210 | ) | |||||||||||||||||||
|
Comprehensive
income
|
$ | 5,516 | ||||||||||||||||||||||||||
|
Non-cash
equity based compensation
|
2,251 | - | - | - | 2,251 | |||||||||||||||||||||||
|
Amounts
from exercise of stock options
|
36,590 | 276 | - | - | - | 276 | ||||||||||||||||||||||
|
Balance, December
31, 2008
|
14,477,438 | $ | 81,247 | $ | 70,389 | $ | 11,586 | $ | 2,563 | $ | 165,785 | |||||||||||||||||
|
Balance, March
31, 2009
|
14,483,622 | $ | 81,948 | $ | 67,218 | $ | 8,110 | $ | 2,352 | $ | 159,628 | |||||||||||||||||
|
Comprehensive
income:
|
||||||||||||||||||||||||||||
|
Net
income
|
- | 1,714 | - | 328 | 2,042 | $ | 2,042 | |||||||||||||||||||||
|
Currency
translation adjustment
|
- | - | 4,040 | 136 | 4,176 | 4,176 | ||||||||||||||||||||||
|
Comprehensive
income
|
$ | 6,218 | ||||||||||||||||||||||||||
|
Non-cash
equity based compensation
|
2,275 | - | - | - | 2,275 | |||||||||||||||||||||||
|
Noncontrolling
interest distributions
|
- | - | - | (815 | ) | (815 | ) | |||||||||||||||||||||
|
Amounts
from exercise of stock options
|
26,335 | 56 | - | - | - | 56 | ||||||||||||||||||||||
|
Balance, December
31, 2009
|
14,509,957 | $ | 84,279 | $ | 68,932 | $ | 12,150 | $ | 2,001 | $ | 167,362 | |||||||||||||||||
See
accompanying notes to condensed consolidated financial
statements.
6
MEASUREMENT
SPECIALTIES, INC. AND SUBSIDIARIES
CONDENSED
CONSOLIDATED STATEMENTS OF CASH FLOWS
(UNAUDITED)
|
Nine
Months Ended December 31,
|
||||||||
|
(Amounts
in thousands)
|
2009
|
2008
|
||||||
|
Cash
flows from operating activities:
|
||||||||
|
Net
income
|
$ | 2,042 | $ | 8,726 | ||||
|
Less: Loss
from discontinued operations
|
(142 | ) | - | |||||
|
Income
from continuing operations
|
2,184 | 8,726 | ||||||
|
Adjustments
to reconcile net income (loss) to net cash provided by operating
activities from continuing operations:
|
||||||||
|
Depreciation
and amortization
|
10,835 | 9,588 | ||||||
|
Loss
on sale of assets
|
64 | 117 | ||||||
|
Non-cash
equity based compensation
|
2,275 | 2,251 | ||||||
|
Deferred
income taxes
|
619 | (1,532 | ) | |||||
|
Net
change in operating assets and liabilities:
|
||||||||
|
Accounts
receivable, trade
|
834 | 13,216 | ||||||
|
Inventories
|
3,768 | (7,402 | ) | |||||
|
Prepaid
expenses, other current assets and other receivables
|
(204 | ) | (26 | ) | ||||
|
Other
assets
|
1,126 | 783 | ||||||
|
Accounts
payable
|
193 | (7,599 | ) | |||||
|
Accrued
expenses, accrued compensation, other current and other
liabilities
|
3,027 | (1,654 | ) | |||||
|
Income
taxes payable and income taxes receivable
|
(2,836 | ) | 1,166 | |||||
|
Net
cash provided by operating activities from continuing
operations
|
21,885 | 17,634 | ||||||
|
Cash
flows from investing activities from continuing
operations:
|
||||||||
|
Purchases
of property and equipment
|
(3,683 | ) | (11,334 | ) | ||||
|
Proceeds
from sale of assets
|
74 | 6 | ||||||
|
Acquisition
of business, net of cash acquired
|
(100 | ) | - | |||||
|
Net
cash used in investing activities from continuing
operations
|
(3,709 | ) | (11,328 | ) | ||||
|
Cash
flows from financing activities from continuing
operations:
|
||||||||
|
Repayments
of long-term debt
|
(5,801 | ) | (2,439 | ) | ||||
|
Borrowings
of short-term debt, revolver and notes payable
|
- | 2,500 | ||||||
|
Repayments
of short-term debt, revolver, capital leases and notes
payable
|
(8,549 | ) | (4,487 | ) | ||||
|
Payment
of deferred financing costs
|
(832 | ) | - | |||||
|
Noncontrolling
interest distributions
|
(815 | ) | - | |||||
|
Proceeds
from exercise of options and employee stock purchase plan
|
56 | 276 | ||||||
|
Net
cash used in financing activities from continuing
operations
|
(15,941 | ) | (4,150 | ) | ||||
|
Net
cash provided by investing activities of discontinued
operations
|
141 | 540 | ||||||
|
Net
cash provided by discontinued operations
|
141 | 540 | ||||||
|
Net
change in cash and cash equivalents
|
2,376 | 2,696 | ||||||
|
Effect
of exchange rate changes on cash
|
444 | (1,064 | ) | |||||
|
Cash,
beginning of year
|
23,483 | 21,565 | ||||||
|
Cash,
end of period
|
$ | 26,303 | $ | 23,197 | ||||
|
Supplemental
Cash Flow Information:
|
||||||||
|
Cash
paid or received during the period for:
|
||||||||
|
Interest
paid
|
$ | 2,938 | $ | 2,119 | ||||
|
Income
taxes paid
|
3,821 | 1,715 | ||||||
|
Income
taxes refunded
|
2,384 | - | ||||||
See
accompanying notes to condensed consolidated financial
statements.
7
NOTES
TO CONDENSED CONSOLIDATED FINANCIAL STATEMENTS
FOR
THE THREE AND NINE MONTHS ENDED DECEMBER 31, 2009 AND 2008
(UNAUDITED)
(Amounts
in thousands, except share and per share amounts)
1.
DESCRIPTION OF BUSINESS AND BASIS OF PRESENTATION:
Interim Financial
Statements: The information presented as of December 31, 2009
and for the three and nine month periods ended December 31, 2009 and 2008 is
unaudited, and reflects all adjustments (consisting only of normal recurring
adjustments) which Measurement Specialties, Inc. (the “Company” or “MEAS”)
considers necessary for the fair presentation of the Company’s financial
position as of December 31, 2009, the results of its operations for the three
and nine month periods ended December 31, 2009 and 2008, and cash flows for the
nine month periods ended December 31, 2009 and 2008. The Company’s March 31,
2009 balance sheet information was derived from the audited consolidated
financial statements for the year ended March 31, 2009, which are included as
part of the Company’s Annual Report on Form 10-K.
The
condensed consolidated financial statements included herein have been prepared
in accordance with U.S. generally accepted accounting principles (“U.S. GAAP”)
and the instructions to Form 10-Q and Regulation S-X. Accordingly, certain
information and footnote disclosures normally included in financial statements
prepared in accordance with U.S. generally accepted accounting principles have
been condensed or omitted. These condensed consolidated financial statements
should be read in conjunction with the Company’s audited consolidated financial
statements for the year ended March 31, 2009, which are included as part of the
Company’s Annual Report on Form 10-K.
The
Company has evaluated subsequent events for potential recognition and/or
disclosure through February 3, 2010, the date the condensed consolidated
financial statements included in this Quarterly Report on Form 10-Q were
issued.
Description of
Business: The Company is a leader in the design, development
and manufacture of sensors and sensor-based systems for original equipment
manufacturers and end users, based on a broad portfolio of proprietary
technology. The Company is a multi-national corporation with twelve primary
manufacturing facilities strategically located in the United States, China,
France, Ireland, Germany and Switzerland, enabling the Company to produce and
market world-wide a broad range of sensors that use advanced technologies to
measure precise ranges of physical characteristics. These sensors are used for
automotive, medical, consumer, military/aerospace, and industrial applications.
The Company’s sensor products include pressure sensors and transducers,
linear/rotary position sensors, piezoelectric polymer film sensors, custom
microstructures, load cells, accelerometers, optical sensors, humidity and
temperature sensors. The Company's advanced technologies include
piezo-resistive silicon sensors, application-specific integrated circuits,
micro-electromechanical systems (“MEMS”), piezoelectric polymers, foil strain
gauges, force balance systems, fluid capacitive devices, linear and rotational
variable differential transformers, electromagnetic displacement sensors,
hygroscopic capacitive sensors, ultrasonic sensors, optical sensors, negative
thermal coefficient (“NTC”) ceramic sensors and mechanical
resonators.
2.
SUMMARY OF SIGNIFICANT ACCOUNTING POLICIES:
As part
of the transition to Financial Accounting Standards Board (“FASB”) Accounting
Standards Codification (“AS Codification”), plain English references to the
corresponding accounting policies are provided, rather than specific numeric AS
Codification references. The AS Codification identifies the sources
of accounting principles and the framework for selecting the principles to be
used in the preparation of financial statements of nongovernmental entities that
are presented in conformity with U.S. GAAP. The AS Codification is effective for
financial statements issued for interim and annual periods ending after
September 15, 2009. There was no impact on our financial position,
results of operations or cash flows upon the adoption of the AS
Codification.
Principles of
Consolidation: The condensed consolidated financial statements
include the accounts of the Company, its wholly owned subsidiaries, and its
joint venture in Japan. All significant intercompany balances and transactions
have been eliminated in consolidation.
In
accordance with accounting principles for consolidation of entities whose equity
holders do not possess the characteristics of a controlling financial interest
or whose equity investment at risk is not considered sufficient to finance its
activities without additional subordinated financial support for which the
Company is the primary beneficiary, commonly referred to as variable interest
entities or “VIEs”, the Company consolidates its joint venture in Japan, its one
VIE for which the Company is the primary beneficiary. With the purchase of YSI
Temperature in April 2006, the Company acquired a 50 percent ownership interest
in Nikisso-THERM (“NT”), a joint venture in Japan. This joint venture is
included in the condensed consolidated financial statements of the Company for
the periods ended December 31, 2009 and 2008, and at December 31, 2009 and March
31, 2009. Noncontrolling interests recorded in the condensed
consolidated financial statements represent the ownership interest in NT not
owned by the Company. The presentation of certain prior year
information for minority interest in the condensed consolidated statements of
operations, condensed consolidated balance sheets, condensed consolidated
statements of shareholders’ equity and condensed consolidated statements of cash
flows have been reclassified to noncontrolling interests.
8
In
accordance with the disclosure requirements of accounting policies for VIEs of
public reporting companies, the nature of the Company’s involvement with NT is
not as a sponsor of a qualifying special purpose entity (QSPE) for the transfer
of financial assets. NT is a self-sustaining manufacturer and
distributor of temperature based sensor systems in Asian markets. The
assets of NT are for the operations of the joint venture and the VIE
relationship does not expose the Company to risks not considered normal business
risks. The carrying amount and classification of the VIE’s assets and
liabilities included in the condensed consolidated statement of financial
position are as follows at December 31, 2009 and March 31, 2009:
|
December
31,
|
March
31,
|
|||||||
|
2009
|
2009
|
|||||||
|
Assets:
|
||||||||
|
Cash
|
$ | 1,304 | $ | 1,206 | ||||
|
Accounts
receivable
|
1,342 | 1,176 | ||||||
|
Inventory
|
712 | 660 | ||||||
|
Other
assets
|
426 | 456 | ||||||
|
Due
from joint venture partner
|
776 | 1,824 | ||||||
|
Property
and equipment
|
159 | 203 | ||||||
| 4,719 | 5,525 | |||||||
|
Liabilities:
|
||||||||
|
Accounts
payable
|
313 | 194 | ||||||
|
Accrued
expenses
|
97 | 195 | ||||||
|
Income
tax payable
|
184 | 276 | ||||||
|
Other
liabilities
|
123 | 156 | ||||||
| $ | 717 | $ | 821 | |||||
Use of Estimates: The
preparation of the condensed consolidated financial statements, in accordance
with U.S. GAAP, requires management to make estimates and assumptions which
affect the reported amounts of assets and liabilities and the disclosure of
contingent assets and liabilities at the date of the financial statements and
revenues and expenses during the reporting period. Significant items subject to
such estimates and assumptions include the useful lives of fixed assets,
carrying amount and analysis of recoverability of property, plant and equipment,
acquired intangibles, goodwill, deferred tax assets, valuation allowances for
receivables, inventories, income tax uncertainties and other contingencies, and
stock based compensation. Actual results could differ from those
estimates.
Recently Adopted Accounting
Standards: In December 2007, the FASB issued new accounting
principles for acquisition accounting and noncontrolling interests, which
require most identifiable assets, liabilities, noncontrolling interests, and
goodwill acquired in a business combination to be recorded at “full fair value”
and require noncontrolling interests (previously referred to as minority
interests) to be reported as a component of equity, which changes the accounting
for transactions with noncontrolling interest holders. These
principles are effective April 1, 2009. The Company will apply the new
acquisition accounting principles to business combinations occurring after March
31, 2009. The accounting for contingent consideration under the new acquisition
accounting principles requires the measurement of contingencies at the fair
value on the acquisition date. Contingent consideration can be either a
liability or equity based. Subsequent changes to the fair value of the
contingent consideration (liability) are recognized in earnings, not to
goodwill, and equity classified contingent consideration amounts are not
re-measured. The adoption of the new accounting principles for
acquisition accounting and noncontrolling interests did not have a material
impact on the Company’s results of operations and financial
position.
In
February 2008, the FASB issued new accounting standards for leases, which
removed fair value measurement requirements for certain leasing
transactions. In February 2008, the FASB also delayed the effective
date for fair value measurements for nonfinancial assets and nonfinancial
liabilities, except for items that are recognized or disclosed at fair value in
the financial statements on a recurring basis (at least annually), to fiscal
years beginning after November 2008. The adoption of the fair value
measurements requirements for non-financial assets and liabilities did not have
any impact on the Company’s results of operations and financial
position.
In April
2008, the FASB issued new guidelines for determining the useful life of
intangible assets, which amends the factors that should be considered in
developing renewal or extension assumptions used to determine the useful life of
a recognized intangible asset. The intent of the new guidelines for determining
the useful life of intangible assets is to improve the consistency between the
useful life of a recognized intangible asset and the period of expected cash
flows used to measure the fair value of the asset. The new guidelines for
determining the useful life of intangible assets shall be applied prospectively
to all intangible assets acquired after March 31, 2009. The adoption
of these guidelines did not have any impact on the Company’s results of
operations and financial condition.
9
Recently Issued Accounting
Pronouncements: New disclosure requirements for employer
postretirement benefit plan assets were issued on December 30, 2008 and are
effective for fiscal years ending after December 15, 2009. The new
disclosure requirements for employer postretirement benefit plans clarify an
employer’s disclosures about plan assets of a defined benefit pension or other
postretirement plan. The new requirements also prescribe expanded
disclosures regarding investment allocation decisions, categories of plan
assets, inputs, and valuation techniques used to measure fair value, the effect
of Level 3 inputs on changes in plan assets and significant concentrations of
risk. The Company will adopt the new postretirement plan disclosure
requirements at March 31, 2010 and does not expect the adoption of the new
disclosure requirements to have a material impact on the Company’s results of
operations and financial condition.
In June
2009, the FASB issued new accounting principles for VIEs which, among other
things, established a qualitative approach for the determination of the primary
beneficiary of a VIE. An enterprise is required to consolidate a VIE
if it has both the power to direct activities of the VIE that most significantly
impact the entity’s economic performance and the obligation to absorb the losses
of the VIE or the right to receive the benefits of the VIE. These
principles improve financial reporting by enterprises involved with VIEs and
address constituent concerns about the application of certain key provisions,
including those in which the accounting and disclosures an enterprise’s
involvement in a variable interest entity, as well as address significant
diversity in practice in the approaches and methodology used to calculate a
VIE’s variability. These new accounting principles related to VIEs
are effective as of the beginning of the annual reporting period that begins
after November 15, 2009, for interim periods within that annual reporting
period, and for interim and annual reporting periods thereafter. Earlier
application is prohibited. The Company is evaluating the potential
impact of the adoption of the new accounting principles related to VIEs on the
Company’s results of operations and financial condition.
3. NON-CASH
EQUITY BASED COMPENSATION AND PER SHARE INFORMATION
Non-cash
equity-based compensation expense for the three months ended December 31, 2009
and 2008 was $865 and $727, respectively, and for the nine months ended December
31, 2009 and 2008 was $2,275 and $2,251, respectively. The estimated fair value
of stock options granted during the three and nine months ended December 31,
2009 approximated $14 and $2,488, respectively, net of expected forfeitures and
is being recognized over their respective vesting periods. During the three and
nine months ended December 31, 2009, the Company recognized $10 and $748,
respectively, of expense related to these options.
The
Company has four equity-based compensation plans for which options are currently
outstanding. These plans are administered by the compensation
committee of the Board of Directors, which approves grants to individuals
eligible to receive awards and determines the number of shares and/or options
subject to each award, the terms, conditions, performance measures, and other
provisions of the award. The Chief Executive Officer can also grant individual
awards up to certain limits as approved by the compensation committee. Awards
are generally granted based on the individual’s performance. Terms for stock
option awards include pricing based on the closing price of the Company’s common
stock on the award date, and generally vest over three to five year requisite
service periods using a graded vesting schedule or subject to performance
targets established by the compensation committee. Shares issued under stock
option plans are newly issued common stock. Readers should refer to Note 14 of
the consolidated financial statements in the Company’s Annual Report on Form
10-K for the fiscal year ended March 31, 2009 for additional information related
to the four equity based compensation plans under which options are currently
outstanding.
During
the three and nine months ended December 31, 2009, the Company granted a total
of 3,000 and 714,218 stock options from the 2008 Equity Incentive Plan (the
“2008 Plan”). The 2008 Plan permits the granting of incentive stock options,
non-qualified stock options, and restricted stock units. Subject to
certain adjustments, the maximum number of shares of common stock that may be
issued under the 2008 Plan in connection with awards is 1,400,000
shares. With the adoption of the 2008 Plan, no further options may be
granted under the Company’s other option plans.
The
Company uses the Black-Scholes-Merton option pricing model to estimate the fair
value of equity-based awards with the following assumptions for the indicated
period.
|
Three
Months Ended December 31,
|
Nine
Months Ended December 31,
|
|||||||||||||||
|
2009
|
2008
|
2009
|
2008
|
|||||||||||||
|
Dividend
yield
|
- | - | - | - | ||||||||||||
|
Expected
volatility
|
64.0 | % | 48.9 | % | 62.9 | % | 47.6 | % | ||||||||
|
Risk
free interest rate
|
1.9 | % | 1.5 | % | 2.1 | % | 1.6 | % | ||||||||
|
Expected
term after vesting (in years)
|
2.0 | 2.0 | 2.0 | 2.0 | ||||||||||||
|
Weighted-average
grant-date fair value
|
$ | 4.58 | $ | 1.98 | $ | 3.48 | $ | 1.96 | ||||||||
The
assumptions above are based on multiple factors, including historical exercise
patterns of employees with respect to exercise and post-vesting employment
termination behaviors, expected future exercise patterns for these employees and
the historical volatility of our stock price and the stock prices of companies
in our peer group (Standard Industrial Classification or “SIC” Code 3823). The
expected term of options granted is derived using company-specific, historical
exercise information and represents the period of time that options granted are
expected to be outstanding. The risk-free interest rate for periods within the
contractual life of the option is based on the U.S. Treasury yield curve in
effect at the time of grant.
10
During
the nine months ended December 31, 2009, 13,275 stock options were exercised
yielding $21 in cash proceeds and no tax benefit recognized as additional
paid-in capital. At December 31, 2009, there was $2,815 of
unrecognized compensation cost adjusted for estimated forfeitures related to
share-based payments, which is expected to be recognized over a weighted-average
period of approximately 1.29 years.
Per Share
Information: Basic and
diluted per share calculations are based on net income (loss) attributable to
MEAS. Basic per share information is computed based on the weighted
average common shares outstanding during each period. Diluted per share
information additionally considers the shares that may be issued upon exercise
or conversion of stock options, less the shares that may be repurchased with the
funds received from their exercise. Outstanding awards relating to
approximately 2,533,537 and 2,327,725 weighted shares were excluded from the
calculation for the three and nine months ended December 31, 2009, respectively,
and approximately 1,940,376 and 1,860,916 weighted shares were excluded from the
calculation for the three and nine months ended December 31, 2008, respectively,
as the impact of including such awards in the calculation of diluted earnings
per share would have had an anti-dilutive effect.
The
computation of the basic and diluted net income per common share is as
follows:
|
Net
income
(Loss)
(Numerator)
|
Weighted
Average Shares
in thousands
(Denominator)
|
Per-Share
Amount
|
||||||||||
|
Three
Months Ended December 31, 2009
|
||||||||||||
|
Basic
per share information
|
$ | 3,248 | 14,504 | $ | 0.22 | |||||||
|
Effect
of dilutive securities
|
- | 182 | - | |||||||||
|
Diluted
per-share information
|
$ | 3,248 | 14,686 | $ | 0.22 | |||||||
|
Three
Months Ended December 31, 2008
|
||||||||||||
|
Basic
per share information
|
$ | 876 | 14,464 | $ | 0.06 | |||||||
|
Effect
of dilutive securities
|
- | 72 | - | |||||||||
|
Diluted
per-share information
|
$ | 876 | 14,536 | $ | 0.06 | |||||||
|
Nine
Months Ended December 31, 2009
|
||||||||||||
|
Basic
per share information
|
$ | 1,714 | 14,492 | $ | 0.12 | |||||||
|
Effect
of dilutive securities
|
- | 137 | - | |||||||||
|
Diluted
per-share information
|
$ | 1,714 | 14,629 | $ | 0.12 | |||||||
|
Nine
Months Ended December 31, 2008
|
||||||||||||
|
Basic
per share information
|
$ | 8,450 | 14,461 | $ | 0.58 | |||||||
|
Effect
of dilutive securities
|
- | 84 | - | |||||||||
|
Diluted
per-share information
|
$ | 8,450 | 14,545 | $ | 0.58 | |||||||
4.
INVENTORIES
Inventories
and inventory reserves for slow-moving, obsolete and lower of cost or market
exposures at December 31, 2009 and March 31, 2009 are summarized as
follows:
|
December 31, 2009
|
March 31, 2009
|
|||||||
|
Raw
Materials
|
$ | 24,642 | $ | 22,270 | ||||
|
Work-in-Process
|
7,174 | 4,622 | ||||||
|
Finished
Goods
|
14,908 | 21,981 | ||||||
| 46,724 | 48,873 | |||||||
|
Inventory
Reserves
|
(3,681 | ) | (3,489 | ) | ||||
| $ | 43,043 | $ | 45,384 | |||||
5.
PROPERTY, PLANT AND EQUIPMENT
Property,
plant and equipment are stated at cost. Equipment under capital leases is stated
at the present value of minimum lease payments. Property, plant and
equipment are summarized as follows:
11
|
December
31, 2009
|
March
31, 2009
|
|||||||
|
Production
equipment & tooling
|
$ | 49,680 | $ | 45,894 | ||||
|
Building
and leasehold improvements
|
24,335 | 24,301 | ||||||
|
Furniture
and equipment
|
14,228 | 13,663 | ||||||
|
Construction-in-progress
|
1,083 | 1,122 | ||||||
|
Total
|
89,326 | 84,980 | ||||||
|
Less:
accumulated depreciation and amortization
|
(43,975 | ) | (38,105 | ) | ||||
| $ | 45,351 | $ | 46,875 | |||||
Total
depreciation was $2,165 and $1,756 for the three months ended December 31, 2009
and 2008, respectively. Total depreciation was $6,221 and $5,610 for
the nine months ended December 31, 2009 and 2008,
respectively. Property and equipment included $448 and $1,047 in
capital leases at December 31, 2009 and March 31, 2009,
respectively.
6.
ACQUISITIONS AND ACQUIRED INTANGIBLES
Acquisitions: As
part of its growth strategy, the Company has consummated fourteen acquisitions
since June 2004 with total purchase price exceeding $167,000, of which two
acquisitions were made during each fiscal year ending March 31, 2009 and
2008. All of these acquisitions have been accounted for as purchases
and have resulted in the recognition of goodwill in the Company’s condensed
consolidated financial statements. This goodwill arises because the purchase
prices for these businesses reflect a number of factors, including the future
earnings and cash flow potential of these businesses, and other factors at which
similar businesses have been purchased by other acquirers, the competitive
nature of the process by which the Company acquired the business, and the
complementary strategic fit and resulting synergies these businesses bring to
existing operations.
Goodwill
balances presented in the condensed consolidated balance sheets of foreign
acquisitions are translated at the exchange rate in effect at each balance sheet
date; however, opening balance sheets used to calculate goodwill and acquired
intangible assets are based on purchase date exchange rates, except for earn-out
payments, which are recorded at the exchange rates in effect on the date the
earn-out is accrued. The following table shows the roll-forward of
goodwill reflected in the financial statements resulting from the Company’s
acquisition activities for the nine months ended December 31, 2009:
|
Balance
March 31, 2009
|
$ | 99,176 | ||
|
Attributable
to 2009 acquisitions
|
(5 | ) | ||
|
Effect
of foreign currency translation
|
971 | |||
|
Balance
December 31, 2009
|
$ | 100,142 |
The
following briefly describes the Company’s acquisitions from the beginning of
fiscal 2008 forward.
Visyx: Effective
November 20, 2007, the Company acquired certain assets of Visyx Technologies,
Inc. (Visyx”) based in Sunnyvale, California for $1,624 ($1,400 at close, $100
held-back to cover certain expenses, and $124 in acquisition costs). The Seller
has the potential to receive up to an additional $2,000 in the form of a
contingent payment based on successful commercialization of specified sensors
prior to December 31, 2011, and an additional $9,000 earn-out based on a
percentage of sales through calendar year 2011. If these earn-out contingencies
are resolved and meet established conditions, these amounts will be recorded as
an additional element of the cost of the acquisition. The resolution
of these contingencies is not determinable at this time, and accordingly, the
Company’s purchase price allocation for Visyx is subject to earn-out
payments. Visyx has a range of sensors that measure fluid properties,
including density, viscosity and dielectric constant, for use in heavy truck/off
road engines and transmissions, compressors/turbines, refrigeration and air
conditioning. The Company’s final purchase price allocation, except
for earn-out contingencies, related to the Visyx acquisition is as
follows:
|
Assets:
|
||||
|
Accounts
receivable
|
$
|
12
|
||
|
Inventory
|
10
|
|||
|
Acquired
intangible assets
|
1,528
|
|||
|
Goodwill
|
74
|
|||
|
Total
Purchase Price
|
$
|
1,624
|
||
Intersema: Effective
December 28, 2007, the Company completed the acquisition of all of the capital
stock of Intersema Microsystems S.A. (“Intersema”), a sensor company
headquartered in Bevaix, Switzerland, for $40,160 ($31,249 in cash at closing,
$8,708 in unsecured Promissory Notes (“Intersema Notes”), and $203 in
acquisition costs). The Intersema Notes bear interest of 4.5% per annum and are
payable in four equal annual installments beginning December 28, 2008. The
selling shareholders had the potential to receive up to an additional 20,000
Swiss francs or approximately $18,946 (based on December 31, 2008 exchange
rates) tied to calendar 2009 earnings growth objectives. The
established conditions of the contingencies were not met, and no amounts were
recorded as an additional element of the cost of the acquisition. Intersema is a
designer and manufacturer of pressure sensors and modules with low pressure,
harsh media and ultra-small package configurations for use in barometric and
sub-sea depth measurement markets. The transaction was financed with borrowings
under the Company’s Amended Credit Facility (See Note 8). The
Company’s final purchase price allocation related to the Intersema acquisition
is as follows:
12
|
Assets:
|
||||
|
Cash
|
$
|
10,542
|
||
|
Accounts
receivable
|
1,162
|
|||
|
Inventory
|
3,770
|
|||
|
Other
assets
|
619
|
|||
|
Property
and equipment
|
1,811
|
|||
|
Acquired
intangible assets
|
13,773
|
|||
|
Goodwill
|
13,851
|
|||
|
45,528
|
||||
|
Liabilities:
|
||||
|
Accounts
payable
|
832
|
|||
|
Accrued
expenses
|
1,119
|
|||
|
Deferred
income taxes
|
3,417
|
|||
|
5,368
|
||||
|
Total
Purchase Price
|
$
|
40,160
|
||
Atexis: On
January 30, 2009, the Company consummated the acquisition of all of the capital
stock of RIT SARL (“Atexis”), a sensor company headquartered in Fontenay,
France, for €4,096. The total purchase price in U.S. dollars based on
the January 30, 2009 exchange rate was approximately $5,359 ($5,152 in cash at
close and $207 in acquisition costs). The selling shareholders have the
potential to receive up to an additional €2,000 tied to sales growth objectives
through calendar 2010, and if the contingencies are resolved and established
conditions are met, these amounts will be recorded as an additional element of
the cost of the acquisition. The resolution of these contingencies is
not determinable at this time, and accordingly, the Company’s purchase price
allocation for Atexis is subject to earn-out payments. Atexis designs
and manufactures temperature sensors and probes utilizing NTC, Platinum (Pt) and
thermo-couples technologies through wholly-owned subsidiaries in France and
China. The transaction was partially financed with borrowings under
the Company’s Amended Credit Facility (See Note 8). The
Company’s final purchase price allocation, except for earn-out contingencies,
related to the Atexis acquisition is as follows:
|
Assets:
|
||||
|
Cash
|
$ | 110 | ||
|
Accounts
receivable
|
2,268 | |||
|
Inventory
|
2,613 | |||
|
Other
assets
|
270 | |||
|
Property
and equipment
|
1,532 | |||
|
Acquired
intangible assets
|
1,610 | |||
|
Goodwill
|
1,524 | |||
| 9,927 | ||||
|
Liabilities:
|
||||
|
Accounts
payable
|
1,384 | |||
|
Accrued
expenses and other liabilities
|
2,292 | |||
|
Deferred
income taxes
|
892 | |||
| 4,568 | ||||
|
Total
Purchase Price
|
$ | 5,359 | ||
FGP: On
January 30, 2009, the Company consummated the acquisition of all of the capital
stock of FGP Instrumentation, GS Sensors and ALS (collectively “FGP”), sensor
companies located in Les Clayes-sous-Bois and Druex, France for
€6,112. The total purchase price in U.S. dollars based on the January
30, 2009 exchange rate was approximately $7,998 ($4,711 in cash at close,
discharge of certain liabilities totaling $3,059 and $228 in acquisition costs).
The selling shareholders had the potential to receive up to an additional €1,400
tied to sales growth objectives. The established conditions of the
contingencies were not met, and no amounts were recorded as an additional
element of the cost of the acquisition. FGP is a designer and
manufacturer of custom force, pressure and vibration sensors for aerospace and
test and measurement markets. The transaction was partially financed
with borrowings under the Company’s Amended Credit Facility (See Note
8). The Company’s final purchase price allocation related to
the FGP acquisition is as follows:
13
|
Assets:
|
||||
|
Cash
|
$ | 980 | ||
|
Accounts
receivable
|
1,678 | |||
|
Inventory
|
1,807 | |||
|
Other
assets
|
85 | |||
|
Property
and equipment
|
789 | |||
|
Deferred
income taxes
|
351 | |||
|
Acquired
intangible assets
|
1,900 | |||
|
Goodwill
|
3,723 | |||
| 11,313 | ||||
|
Liabilities:
|
||||
|
Accounts
payable
|
1,100 | |||
|
Accrued
expenses and other liabilities
|
1,472 | |||
|
Deferred
income taxes
|
743 | |||
| 3,315 | ||||
|
Total
Purchase Price
|
$ | 7,998 | ||
Acquired
Intangibles: In connection with all acquisitions, the Company
acquired certain identifiable intangible assets, including customer
relationships, proprietary technology, patents, trade-names, order backlogs and
covenants-not-to-compete. The gross amounts and accumulated amortization, along
with the weighted-average amortizable lives, are as follows:
|
December
31, 2009
|
March
31, 2009
|
|||||||||||||||||||||||||||
|
Weighted-
Average Life
in
years
|
Gross Amount
|
Accumulated
Amortization
|
Net
|
Gross Amount
|
Accumulated
Amortization
|
Net
|
||||||||||||||||||||||
|
Amortizable
intangible assets:
|
||||||||||||||||||||||||||||
|
Customer
relationships
|
9 | $ | 29,381 | $ | (11,746 | ) | $ | 17,635 | $ | 27,627 | $ | (8,794 | ) | $ | 18,833 | |||||||||||||
|
Patents
|
16 | 4,244 | (1,251 | ) | 2,993 | 3,984 | (895 | ) | 3,089 | |||||||||||||||||||
|
Tradenames
|
3 | 2,137 | (1,959 | ) | 178 | 2,000 | (1,478 | ) | 522 | |||||||||||||||||||
|
Backlog
|
1 | 2,884 | (2,884 | ) | - | 2,732 | (2,556 | ) | 176 | |||||||||||||||||||
|
Covenants-not-to-compete
|
3 | 1,018 | (970 | ) | 48 | 1,008 | (932 | ) | 76 | |||||||||||||||||||
|
Proprietary
technology
|
13 | 6,176 | (1,403 | ) | 4,773 | 5,763 | (981 | ) | 4,782 | |||||||||||||||||||
| $ | 45,840 | $ | (20,213 | ) | $ | 25,627 | $ | 43,114 | $ | (15,636 | ) | $ | 27,478 | |||||||||||||||
Amortization
expense for acquired intangible assets for the three months ended December 31,
2009 and 2008 was $1,465 and $1,255, respectively. Amortization
expense for the nine months ended December 31, 2009 and 2008 was $4,614 and
$3,978, respectively. Estimated annual amortization expense is as
follows:
|
Amortization
|
||||
|
Year
|
Expense
|
|||
|
2010
|
$ | 4,422 | ||
|
2011
|
3,879 | |||
|
2012
|
3,385 | |||
|
2013
|
2,436 | |||
|
2014
|
2,231 | |||
|
Thereafter
|
9,274 | |||
| $ | 25,627 | |||
Pro forma
Financial Data: The following represents the Company’s pro
forma consolidated net income attributable to MEAS for the three and nine months
ended December 31, 2008, based on final purchase accounting information assuming
the Atexis and FGP acquisitions occurred as of April 1, 2008, giving effect to
purchase accounting adjustments. The pro forma data is for informational
purposes only and may not necessarily reflect results of operations had all the
acquired companies been operated as part of the Company since April 1,
2008.
|
Three
Months Ended
December
31, 2008
|
Nine Months Ended
December
31, 2008
|
|||||||
|
Net
sales
|
$ | 48,829 | $ | 178,205 | ||||
|
Net
income attributable to MEAS
|
$ | 1,106 | $ | 8,643 | ||||
|
Net
income attributable to MEAS per common share:
|
||||||||
|
Basic
|
$ | 0.08 | $ | 0.60 | ||||
|
Diluted
|
$ | 0.08 | $ | 0.59 | ||||
14
7.
FINANCIAL INSTRUMENTS:
Fair
Value of Financial Instruments
Effective
April 1, 2009, the Company adopted a new accounting standard related to fair
values, which defines fair value, establishes a framework for measuring fair
value and expands disclosures about fair value measurements. Fair
value is an exit price, representing the amount that would be received to sell
an asset or paid to transfer a liability in an orderly transaction between
market participants. As such, fair value is a market-based
measurement that should be determined based on assumptions that market
participants would use in pricing an asset and liability. As a basis
for considering such assumptions, the principles establish a fair value
hierarchy that prioritizes the inputs used to measure fair value. The
hierarchy gives the highest priority to unadjusted quoted prices in active
markets for identical assets or liabilities (level 1 measurements) and the
lowest priority to unobservable inputs (level 3 measurements). The
three levels of the fair value hierarchy are as follows:
Level 1 -
Quoted prices in active markets for identical assets or
liabilities;
Level 2 -
Quoted prices for similar instruments in active markets; quoted prices for
identical or similar instruments in markets that are not active;
and
Level 3 -
Unobservable inputs in which there is little or no market data which require the
reporting entity to develop its own assumptions.
For cash
and cash equivalents, accounts receivable, notes receivable and other
receivables, prepaid and other assets (current and long-term), accounts payable,
and accrued expenses and other liabilities (non-derivatives, current and
long-term), the carrying amounts approximate fair value because of the short
maturity of these instruments. Foreign currency contracts are
recorded at fair value. Financial assets and liabilities are
classified in their entirety based on the lowest level of input that is
significant to the fair value measurement. The Company's assessment
of the significance of a particular input to the fair value measurement requires
judgment, and may affect the valuation of fair value of assets and liabilities
and their placement within the fair value hierarchy levels. The fair value
of the Company’s cash and cash equivalents was determined using Level 1
measurements in the fair value hierarchy. The fair value of the
Company’s foreign currency contracts was based on Level 2 measurements in the
fair value hierarchy. The fair value of the foreign currency
contracts is based on forward exchange rates relative to current exchange rates
which were obtained from independent financial institutions reflecting market
quotes.
For
promissory notes payable, deferred acquisition payments and capital lease
obligation, the fair value is determined as the present value of expected future
cash flows discounted at the current interest rate, which approximates rates
currently offered by lending institutions for loans of similar terms to
companies with comparable credit risk. These are considered Level 2
inputs.
For
long-term debt and the revolver, the fair value of the Company’s long-term debt
is estimated by discounting future cash flows of each instrument at rates
currently offered to the Company for similar debt instruments of comparable
maturities by the Company’s lenders. These are considered Level 2
inputs. The fair value of long-term debt and the revolver
approximates carrying value due to the variable interest nature of the
debt.
Derivative
Instruments and Risk Management
The
Company is exposed to market risks from changes in interest rates, commodities,
credit and foreign currency exchange rates, which could impact its results of
operations and financial condition. The Company attempts to address its exposure
to these risks through its normal operating and financing activities. In
addition, the Company’s relatively broad-based business activities help to
reduce the impact that volatility in any particular area or related areas may
have on its operating results as a whole.
Interest
Rate Risk: Under our term and revolving credit facilities, we are
exposed to a certain level of interest rate risk. Interest on the principal
amount of our borrowings under our revolving credit facility and term loan
accrue at a rate based on either a LIBOR rate plus a LIBOR margin or at an
Indexed (prime based) Rate plus an Index Margin. The LIBOR or Index Rate is at
our election. Our results will be adversely affected by any increase in interest
rates. We do not currently hedge this interest rate exposure.
Foreign
Currency Exchange Rate Risk: Foreign currency exchange rate risk
arises from the Company’s investments in subsidiaries owned and operated in
foreign countries, as well as from transactions with customers in countries
outside the U.S. and transactions denominated in currencies other than the
applicable functional currency.
The
effect of a change in currency exchange rates on the Company’s net investment in
international subsidiaries is reflected in the “accumulated other comprehensive
income” component of shareholders’ equity. The Company does not hedge
the Company’s net investment in subsidiaries owned and operated in countries
outside the U.S.
15
Although
the Company has a U.S. dollar functional currency for reporting purposes, it has
manufacturing sites throughout the world and a large portion of its sales are
generated in foreign currencies. A substantial portion of our revenues are
priced in U.S. dollars, and most of our costs and expenses are priced in U.S.
dollars, with the remaining priced in Chinese renminbi, Euros, Swiss francs and
Japanese yen. Sales by subsidiaries operating outside of the United States are
translated into U.S. dollars using exchange rates effective during the
respective period. As a result, the Company is exposed to movements in the
exchange rates of various currencies against the U.S. dollar. Accordingly, the
competitiveness of our products relative to products produced locally (in
foreign markets) may be affected by the performance of the U.S. dollar compared
with that of our foreign customers’ currencies. Refer to Note 11, Segment
Information, for details concerning annual net sales invoiced from our
facilities within the U.S. and outside of the U.S., as well as long-lived
assets. Therefore, both positive and negative movements in currency
exchange rates against the U.S. dollar will continue to affect the reported
amount of sales, profit, and assets and liabilities in the Company’s condensed
consolidated financial statements.
The value
of the renminbi (“RMB”) relative to the U.S. dollar was stable during the first
nine months of fiscal 2010, but appreciated 2.5% and 9.0% in fiscal years 2009
and 2008, respectively. The Chinese government no longer pegs the RMB to the
U.S. dollar, but established a currency policy letting the renminbi trade in a
narrow band against a basket of currencies. The Company has more expenses in RMB
than sales (i.e., short RMB position), and as such, if the U.S. dollar weakens
relative to the RMB, our operating profits will decrease. We continue to
consider various alternatives to hedge this exposure, and we are attempting to
manage this exposure through, among other things, forward purchase
contracts, pricing and monitoring balance sheet exposures for payables and
receivables.
Fluctuations
in the value of the Hong Kong dollar have not been significant since October 17,
1983, when the Hong Kong government tied the value of the Hong Kong dollar to
that of the U.S. dollar. However, there can be no assurance that the value of
the Hong Kong dollar will continue to be tied to that of the U.S.
dollar.
The
Company’s French and German subsidiaries have more sales in Euro than expenses
in Euro and the Company’s Swiss subsidiary has more expenses in Swiss franc than
sales in Swiss franc, and as such, if the U.S. dollar weakens relative to the
Euro and Swiss franc, our operating profits increase in France and Germany, but
decrease in Switzerland.
The
Company has a number of foreign currency exchange contracts in Europe in an
attempt to hedge the Company’s exposure to the Euro. The Euro/U.S. dollar
currency contracts have notional amounts totaling $1,380 with exercise dates
through June 2010 at an average exchange rate of $1.47 (Euro to U.S. dollar
conversion rate). Since these derivatives are not designated as hedges for
accounting purposes, changes in their fair value are recorded in results of
operations, not in other comprehensive income.
To manage
our exposure to potential foreign currency transaction and translation risks, we
may purchase additional foreign currency exchange forward contracts, currency
options, or other derivative instruments, provided such instruments may be
obtained at suitable prices.
Fair
values of derivative instruments not designated as hedging
instruments:
|
December
31,
|
March
31,
|
||||||||
|
2009
|
2009
|
Balance
sheet location
|
|||||||
|
Financial
position:
|
|||||||||
|
Foreign
currency exchange contracts - Euro/US dollar
|
$ | 38 | $ | 105 |
Other
assets
|
||||
|
Foreign
currency exchange contracts - RMB
|
$ | - | $ | (143 | ) |
Other
liabilities
|
|||
|
Foreign
currency exchange contracts - Japanese yen
|
$ | - | $ | 115 |
Other
assets
|
||||
The
effect of derivative instruments not designated as hedging instruments on the
statements of operations and cash flows for the three and nine months ended
December 31, 2009 and 2008 is as follows:
16
|
Three
Months Ended
December
31,
|
Nine
Months Ended
December
31,
|
||||||||||||||||
|
2009
|
2008
|
2009
|
2008
|
Location
of gain or loss
|
|||||||||||||
|
Results
of operations:
|
|||||||||||||||||
|
Foreign
currency exchange contracts - Euro
|
$ | (87 | ) | $ | (167 | ) | $ | (24 | ) | $ | (111 | ) |
Foreign
currency exchange (gain) loss
|
||||
|
Foreign
currency exchange contracts - RMB
|
- | 121 | 18 | 195 |
Foreign
currency exchange (gain) loss
|
||||||||||||
|
Foreign
currency exchange contracts - Japanese yen
|
76 | - | (232 | ) | - |
Foreign
currency exchange (gain) loss
|
|||||||||||
|
Total
|
$ | (11 | ) | $ | (46 | ) | $ | (238 | ) | $ | 84 | ||||||
|
Nine
Months Ended
December
31,
|
|||||||||
|
2009
|
2008
|
Location of
gain or loss
|
|||||||
|
Cash
flows from operating activities: Source (Use) -
|
|||||||||
|
Foreign
currency exchange contracts - Euro
|
$ | 224 | $ | (55 | ) |
Prepaid
expenses, other current assets and other receivables
|
|||
|
Foreign
currency exchange contracts - RMB
|
(125 | ) | (726 | ) |
Accrued
expenses, accrued compensation, other current and other
liabilities
|
||||
|
Foreign
currency exchange contracts - Japense yen
|
107 | - |
Prepaid
expenses, other current assets and other receivables
|
||||||
|
Total
|
$ | 206 | $ | (781 | ) | ||||
8.
LONG-TERM DEBT:
LONG-TERM
DEBT
To
support the financing of acquisitions, effective April 1, 2006, the Company
entered into an Amended and Restated Credit Agreement (“Amended and Restated
Credit Facility”) with General Electric Capital Corporation (“GE”) as
agent which, among other things, increased the Company’s existing credit
facility from $35,000 to $75,000, consisting of a $55,000 revolving credit
facility and a $20,000 term loan, and lowered the applicable London Inter-bank
Offered Rate (“LIBOR”) or Index Margin from 4.50% and 2.75%, respectively, to
LIBOR and Index Margins of 2.75% and 1.0%, respectively. To support the
financing of the acquisition of Intersema (See Note 6), the Company entered
into an Amended Credit Agreement (“Amended Credit Facility”) with four
banks, with GE as agent, effective December 10, 2007 which, among other
things, increased the Company’s existing revolving credit facility from $55,000
to $121,000 and lowered the applicable LIBOR or Index Margin from 2.75% and
1.0%, respectively, to LIBOR and Index Margins of 2.00% and 0.25%, respectively.
Interest accrues on the principal amount of the borrowings at a rate based on
either LIBOR plus a LIBOR margin, or at the election of the borrower, at an
Index Rate (prime based rate) plus an Index Margin. The applicable margins may
be adjusted quarterly based on a change in specified financial ratios.
Borrowings under the credit facility are subject to certain financial covenants
and restrictions on indebtedness, dividend payments, repurchase of Company
common stock, financial guarantees, annual capital expenditures, and other
related items. The borrowing availability of the revolving credit facility is
not based on any borrowing base requirements, but borrowings are limited by
certain financial covenants. The term loan portion of our credit
facility was not changed with the Amended Credit Facility. The term loan is
payable in $500 quarterly installments plus interest through March 1, 2011, with
a final term payment and the revolver payable on April 3, 2011. The Company has
provided a security interest in substantially all of the Company’s U.S. based
assets as collateral for the Amended Credit Facility.
On April
27, 2009, the Company entered into an amendment (the “Amendment”) to the Amended
Credit Facility whereby the Company proactively negotiated a reduction of its
debt covenant requirements, as a result of the decline in our sales and
profitability resulting from the impact of the global recession. The
Amendment provides the Company with additional flexibility under its minimum
earnings before interest, tax, depreciation and amortization (“EBITDA”)
covenant, total leverage ratio covenant, fixed charge ratio covenant and maximum
capital expenditure covenant included in its senior credit facility. Under the
terms of the Amendment, the principal amount available under the Company’s
revolver has been reduced from $121,000 to $90,000. The Amendment increased the
interest rate by between 1.50% and 2.25%, increased the Index Margin and LIBOR
Margin (which vary based on the Company’s debt to EBITDA leverage ratio), and
also increased the commitment fee on the unused balance to 0.5% per
annum. As part of the Amendment, the Company paid $832 in amendment
fees, which were capitalized as deferred financing costs. Pursuant to
the Amendment, the Company is prohibited from consummating any business
acquisitions without lender approval during the covenant relief period, which
ends March 31, 2010. The Company is presently in compliance with
applicable financial covenants at December 31, 2009.
The
Company’s debt covenant requirements for December 31, 2009 and March 31, 2010
are as follows:
17
|
Amended
Financial Covenant Requirements
|
||||||||
|
December
31, 2009
|
March
31, 2010
|
|||||||
|
Minimum
Adjusted Earnings Before Income Taxes, Stock
Options, Depreciation, and Amortization ("Adjusted
EBITDA")
|
$ | 19,100 | $ | 24,750 | ||||
|
Minimum
Adjusted Fixed Charge Coverage Ratio for the last twelve
months
|
1.15 | 1.20 | ||||||
|
Maximum
Adjusted Capital Expenditures for the last twelve months
|
$ | 7,978 | $ | 8,758 | ||||
|
Maximum
Adjusted Total Leverage Ratio
|
4.25 | 3.25 | ||||||
Adjusted
EBITDA for covenant purposes is the Company’s earnings before interest, income
taxes, stock options, depreciation and amortization for the last twelve months,
in addition to the last twelve months of Adjusted EBITDA for acquisitions and
certain adjustments approved by our lender. Adjusted fixed charge
coverage ratio is Adjusted EBITDA less adjusted capital expenditures divided by
fixed charges. Fixed charges are the last twelve months of interest,
taxes paid, and the last twelve months of payments of long-term debt, notes
payable and capital leases. Adjusted capital expenditures represent
purchases of plant, property and equipment during the last twelve
months. Total leverage ratio is total debt less cash maintained in
U.S. bank accounts which are subject to blocked account agreements with lenders
divided by the last twelve months of Adjusted EBITDA. All of the
aforementioned financial covenants are subject to various adjustments, many of
which are detailed in the amended credit agreement and subsequent amendments to
the credit agreement previously filed with the Securities Exchange Commission,
as well as other adjustments approved by the lender. These
adjustments include such items as excluding capital expenditures associated with
the new China facility from adjusted capital expenditures, and adjustments to
Adjusted EBITDA for certain items such as litigation settlement costs, severance
costs and other items considered non-recurring in nature.
As of
December 31, 2009, the Company utilized the LIBOR based rate for the term loan
and for $59,500 of the revolving credit facility under the Amended Credit
Facility. The weighted average interest rate applicable to borrowings under the
revolving credit facility was approximately 4.4% at December 31, 2009. As of
December 31, 2009, the outstanding borrowings on the revolving credit facility,
which is classified as long-term debt, were $63,547, and the Company had an
additional $26,453 available under the revolving credit facility. The Company’s
borrowing capacity is limited by financial covenant ratios, including earnings
ratios, and as such, our borrowing capacity is subject to change.
China Credit
Facility: On November 3, 2009, the Company’s subsidiary in
China (“MEAS China”) entered into a two year credit facility agreement (the
“China Credit Facility”) with China Merchants Bank Co. Ltd
(“CMB”). The China Credit facility permits MEAS China to borrow
up to RMB 68 million (approximately $10 million). Specific
covenants include customary limitations, compliance with laws and regulations,
use of proceeds for operational purposes, and timely payment of interest and
principal. MEAS China has pledged its Shenzhen facility to CMB as
collateral. The interest rate will be based on the London Inter-bank
Offered Rate (“LIBOR”) plus a LIBOR spread, depending on the term of the loan
when drawn. The purpose of the China Credit Facility is primarily to
provide additional flexibility in funding operations of MEAS
China. At December 31, 2009, there were no outstanding borrowings
against the China Credit Facility and MEAS China could borrow approximately $10
million.
Promissory
Notes: In connection with the acquisition of Intersema, the
Company issued 10,000 Swiss franc unsecured promissory notes (“Intersema
Notes”). At December 31, 2009, the Intersema Notes totaled $7,225, of
which $2,408 was classified as current. The Intersema Notes are payable in four
equal annual installments on January 15, and bear an interest rate of 4.5% per
year.
Long-Term Debt
and Promissory Notes: Below is a summary of the long-term debt
and promissory notes outstanding at December 31, 2009 and March 31,
2009:
18
|
December
31,
|
March
31,
|
|||||||
|
2009
|
2009
|
|||||||
|
Prime
or LIBOR plus 4.50% or 3.00% five-year term loan with a final installment
due on April 3, 2011
|
$ | 8,500 | $ | 14,000 | ||||
|
Governmental
loans from French agencies at no interest and payable based on R&D
expenditures
|
508 | 517 | ||||||
|
Term
credit facility with six banks at an interest rate of 4% payable through
2010
|
411 | 608 | ||||||
| 9,419 | 15,125 | |||||||
|
Less
current portion of long-term debt
|
2,471 | 2,356 | ||||||
| $ | 6,948 | $ | 12,769 | |||||
|
4.5%
promissory note payable in four equal annual installments through January
15, 2012
|
$ | 7,225 | $ | 6,528 | ||||
|
Less
current portion of promissory notes payable
|
2,408 | 2,176 | ||||||
| $ | 4,817 | $ | 4,352 | |||||
The
annual principal payments of long-term debt, promissory notes and revolver as of
December 31, 2009 are as follows:
|
Year
ended
December 31,
|
Term
|
Other
|
Subtotal
|
Notes
|
Revolver
|
Total
|
||||||||||||||||||
|
2010
|
$ | 2,000 | $ | 471 | $ | 2,471 | $ | 2,408 | $ | - | $ | 4,879 | ||||||||||||
|
2011
|
6,500 | 267 | 6,767 | 2,408 | 63,547 | 72,722 | ||||||||||||||||||
|
2012
|
- | 176 | 176 | 2,409 | - | 2,585 | ||||||||||||||||||
|
2013
|
- | 5 | 5 | - | - | 5 | ||||||||||||||||||
|
Total
|
$ | 8,500 | $ | 919 | $ | 9,419 | $ | 7,225 | $ | 63,547 | $ | 80,191 | ||||||||||||
9. INCOME
TAXES:
Income
tax expense for interim reporting is based on an estimated overall effective tax
rate (“ETR”) for the entire fiscal year, in addition to any discrete tax
adjustments. The overall estimated effective tax rate is based on expectations
and other estimates and involves complex domestic and foreign tax issues, which
the Company monitors closely, but which are subject to change.
During
the second quarter of fiscal 2010, the Company received notification of approval
from the local Chinese tax authority for certain research and development
(“R&D”) deductions. The income tax benefit of approximately $266
associated with this R&D deduction was reflected as a favorable discrete tax
adjustment during the quarter ended September 30, 2009.
During
the second quarter of fiscal 2010, the Company received approval from the Swiss
tax authority for a five year tax holiday effective in fiscal
2010. The Company’s tax rate in Switzerland was reduced to
approximately 13% from 22%. In accordance with accounting principles
for income taxes, the Company revalued the Company’s Swiss net deferred tax
liabilities at the lower tax rate, resulting in a discrete non-cash income tax
credit of $650 recorded during the quarter ended September 30,
2009.
The
Company has previously considered undistributed earnings of its foreign
subsidiaries to be indefinitely reinvested outside of the U.S. and, accordingly,
no U.S. deferred taxes had been recorded with respect to such earnings. However,
as part of the Company’s ongoing evaluation of various tax planning and
repatriation strategies, the Company has elected to distribute $7,500 of
earnings for its Irish subsidiary, MEAS Ireland, and recorded a deferred tax
liability and corresponding discrete income tax expense for $1,100 during the
quarter ended September 30, 2009.
10.
COMMITMENTS AND CONTINGENCIES:
Litigation: There currently are no material pending legal proceedings. From
time to time, the Company is subject to legal proceedings and claims in the
ordinary course of business. The Company currently is not aware of any such
legal proceedings or claims that the Company believes will have, individually or
in the aggregate, a material adverse effect on the Company’s business, financial
condition, or operating results.
19
Contingency: Exports
of technology necessary to develop and manufacture certain of the Company’s
products are subject to U.S. export control laws and similar laws of other
jurisdictions, and the Company may be subject to adverse regulatory
consequences, including government oversight of facilities and export
transactions, monetary penalties and other sanctions for violations of these
laws. All exports of technology necessary to develop and manufacture the
Company’s products are subject to U.S. export control laws. In certain
instances, these regulations may prohibit the Company from developing or
manufacturing certain of its products for specific end applications outside the
United States. In late May 2009, the Company became aware that certain of its
piezo products when designed or modified for use with or incorporation into a
defense article are subject the International Traffic in Arms Regulations
("ITAR") administered by the United States Department of State. Certain
technical data relating to the design of the products may have been exported to
China without authorization from the U.S. Department of State. As required
by the ITAR, the Company conducted a thorough investigation into the
matter. Based on the investigation, the
Company filed in December 2009 a final voluntary disclosure with the
U.S. Department of State relating to that matter, as well as to exports and
re-exports of other ITAR-controlled technical data and/or products to Canada,
India, Ireland, France, Germany, Italy, Israel, Japan, the Netherlands, South
Korea, Spain and the United Kingdom. In the course of the investigation,
the Company also became aware that certain of its products may have been
exported from France without authorization from the relevant French
authorities. The Company is currently investigating this matter
thoroughly. In addition, the Company has taken steps to mitigate the
impact of potential violations, and we are in the process of strengthening our
export-related controls and procedures. The U.S. Department of State and
other regulatory authorities encourage voluntary disclosures and generally
afford parties mitigating credit under such circumstances. The Company
nevertheless could be subject to potential regulatory consequences related to
these possible violations ranging from a no-action letter, government oversight
of facilities and export transactions, monetary penalties, and in extreme cases,
debarment from government contracting, denial of export privileges and/or
criminal penalties. It is not possible at this time to predict the
precise timing or probable outcome of any potential regulatory consequences
related to these possible violations.
Acquisition Earn-Outs and Contingent
Payments: In
connection with the Visyx acquisition, the Company has a contingent payment
obligation of approximately $2,000 based on the commercialization of certain
sensors, and sales performance based earn-outs totaling $9,000. In connection
with the Atexis acquisition, the selling shareholders have the potential to
receive up to an additional €2,000 tied to sales growth thresholds through
calendar 2010. Contingent earn-out obligations for Intersema and FGP
acquisitions based on calendar 2009 sales objectives were not met. No
amounts related to the above acquisition earn-outs were accrued at December 31,
2009 since the contingencies were not determinable or
achieved.
11.
SEGMENT INFORMATION:
Geographic
information for revenues based on country from which invoiced, and long-lived
assets based on country of location, which includes property, plant and
equipment, but excludes intangible assets and goodwill, net of related
depreciation and amortization follows:
|
For
the three months ended December 31,
|
For
the nine months ended December 31,
|
|||||||||||||||
|
2009
|
2008
|
2009
|
2008
|
|||||||||||||
|
Net
Sales:
|
||||||||||||||||
|
United
States
|
$ | 18,431 | $ | 22,880 | $ | 54,942 | $ | 73,884 | ||||||||
|
France
|
9,323 | 5,411 | 26,068 | 20,727 | ||||||||||||
|
Germany
|
4,195 | 3,271 | 10,310 | 12,755 | ||||||||||||
|
Ireland
|
5,957 | 2,570 | 13,297 | 9,559 | ||||||||||||
|
Switzerland
|
2,750 | 2,430 | 7,963 | 10,774 | ||||||||||||
|
China
|
14,099 | 6,737 | 36,003 | 33,485 | ||||||||||||
|
Total:
|
$ | 54,755 | $ | 43,299 | $ | 148,583 | $ | 161,184 | ||||||||
|
Long
Lived Assets:
|
December
31, 2009
|
March
31, 2009
|
||||||||||||||
|
United
States
|
$ | 6,908 | $ | 7,754 | ||||||||||||
|
France
|
8,354 | 7,860 | ||||||||||||||
|
Germany
|
2,442 | 2,253 | ||||||||||||||
|
Ireland
|
3,487 | 3,434 | ||||||||||||||
|
Switzerland
|
1,871 | 1,918 | ||||||||||||||
|
China
|
22,289 | 23,656 | ||||||||||||||
|
Total:
|
$ | 45,351 | $ | 46,875 | ||||||||||||
At
December 31, 2009, approximately $5,382 of the Company’s cash is maintained in
China, which is subject to certain restrictions on the transfer to another
country because of currency control regulations.
12.
DISCONTINUED OPERATIONS:
Effective
December 1, 2005, the Company completed the sale to Fervent Group Limited
(“FGL”) of its Consumer Products segment, including its Cayman Island
subsidiary, Measurement Limited. FGL is a company controlled by the owners of
River Display Limited, the Company’s long time partner and primary supplier of
consumer products in Shenzhen, China. Under the terms of the agreement, the
Company could have earned an additional $5,000 if certain performance criteria
(sales and margin targets) were met within the first year. The Company recorded
$2,156 of the earn-out in fiscal year 2007, because a portion of the earn-out
targets were met. The related receivable was included in the condensed
consolidated balance sheet as current portion of promissory note receivable and
any cash collections were included as net cash provided by investing activities
of discontinued operations in the condensed consolidated statement of cash
flows. At March 31, 2009, the gross promissory notes receivable related to the
earn-out of the Consumer business totaled $283, representing the last payment
which was due on December 31, 2008. The Company negotiated a
settlement with FGL and collected all but approximately $142 of the final
payment. The uncollected portion of the note receivable was written
off as an expense from discontinued operations during the nine months ended
December 31, 2009.
20
(Amounts
in thousands, except per share data)
INFORMATION
RELATING TO FORWARD-LOOKING STATEMENTS
This
report includes forward-looking statements within the meaning of Section 21E of
the Securities Exchange Act of 1934, as amended. Certain information included or
incorporated by reference in this Quarterly Report, in press releases, written
statements or other documents filed with or furnished to the Securities and
Exchange Commission (“SEC”), or in our communications and discussions through
webcasts, phone calls, conference calls and other presentations and meetings,
may be deemed to be “forward-looking statements” within the meaning of the
federal securities laws. All statements other than statements of historical fact
are statements that could be deemed forward-looking statements, including
statements regarding: projections of revenue, margins, expenses, tax provisions
(or reversals of tax provisions), earnings or losses from operations, cash
flows, synergies or other financial items; plans, strategies and objectives of
management for future operations, including statements relating to potential
acquisitions, executive compensation and purchase commitments; developments,
performance or industry or market rankings relating to products or services;
future economic conditions or performance; future compliance with debt
covenants; the outcome of outstanding claims or legal proceedings; assumptions
underlying any of the foregoing; and any other statements that address
activities, events or developments that Measurement Specialties, Inc. (“MEAS”,
the “Company,” “we,” “us,” “our”) intends, expects, projects, believes or
anticipates will or may occur in the future. Forward-looking statements may be
characterized by terminology such as “forecast,” “believe,” “anticipate,”
“should,” “would,” “intend,” “plan,” “will,” “expects,” “estimates,” “projects,”
“positioned,” “strategy,” and similar expressions. These statements are based on
assumptions and assessments made by our management in light of their experience
and perception of historical trends, current conditions, expected future
developments and other factors they believe to be appropriate.
Any such
forward-looking statements are not guarantees of future performance and involve
a number of risks and uncertainties, many of which are beyond our control.
Actual results, developments and business decisions may differ materially from
those envisaged by such forward-looking statements. These forward-looking
statements speak only as of the date of the report, press release, statement,
document, webcast or oral discussion in which they are made. Factors that might
cause actual results to differ materially from the expected results described in
or underlying our forward-looking statements include:
|
·
|
Conditions
in the general economy, including risks associated with the current
financial crisis and worldwide economic conditions and reduced demand for
products that incorporate our
products;
|
|
·
|
Conditions
in the credit markets, including our ability to raise additional funds or
refinance our existing credit
facility;
|
|
·
|
Competitive
factors, such as price pressures and the potential emergence of rival
technologies;
|
|
·
|
Interruptions
of suppliers’ operations or the refusal of our suppliers to provide us
with component materials, particularly in light of the current economic
conditions and potential for suppliers to
fail;
|
|
·
|
Timely
development, market acceptance and warranty performance of new
products;
|
|
·
|
Changes
in product mix, costs and yields;
|
|
·
|
Uncertainties
related to doing business in Europe and
China;
|
|
·
|
Fluctuations
in foreign currency exchange and interest
rates;
|
|
·
|
Legislative
initiatives, including tax legislation and other changes in the Company’s
tax position;
|
|
·
|
Legal
proceedings;
|
|
·
|
Compliance
with export control laws and
regulations;
|
|
·
|
Compliance
with debt covenants, including events beyond our
control;
|
|
·
|
Adverse
developments in the automotive industry and other markets served by us;
and
|
|
·
|
The
risk factors listed from time to time in the reports we file with the SEC,
including those described under “Item 1A. Risk Factors” in our Annual
Report on Form 10-K.
|
21
This list
is not exhaustive. Except as required under federal securities laws and the
rules and regulations promulgated by the SEC, we do not have any intention or
obligation to update publicly any forward-looking statements after the filing of
this Quarterly Report on Form 10-Q, whether as a result of new information,
future events, changes in assumptions or otherwise.
OVERVIEW
Measurement
Specialties, Inc. is a global leader in the design, development and manufacture
of sensors and sensor-based systems for original equipment manufacturers and end
users, based on a broad portfolio of proprietary technology. The Company is a
multi-national corporation with twelve primary manufacturing facilities
strategically located in the United States, China, France, Ireland, Germany and
Switzerland, enabling the Company to produce and market world-wide a broad range
of sensors that use advanced technologies to measure precise ranges of physical
characteristics. These sensors are used for automotive, medical, consumer,
military/aerospace, and industrial applications. The Company’s sensor products
include pressure sensors and transducers, linear/rotary position sensors,
piezoelectric polymer film sensors, custom microstructures, load cells,
accelerometers, optical sensors, humidity and temperature sensors. The
Company's advanced technologies include piezo-resistive silicon sensors,
application-specific integrated circuits, micro-electromechanical systems,
piezoelectric polymers, foil strain gauges, force balance systems, fluid
capacitive devices, linear and rotational variable differential transformers,
electromagnetic displacement sensors, hygroscopic capacitive sensors, ultrasonic
sensors, optical sensors, negative thermal coefficient ceramic sensors and
mechanical resonators.
Effective
December 1, 2005, we completed the sale of our Consumer business, including our
Cayman Island subsidiary, Measurement Limited (“ML”), to Fervent Group Limited
(“FGL”). FGL is a company controlled by the owners of River Display Limited, our
long time partner and primary supplier of consumer products in Shenzhen, China.
Accordingly, the related financial statements for the Consumer segment are
reported as discontinued operations. All comparisons in Management’s Discussion
and Analysis for each of the periods ended December 31, 2009, and 2008, exclude
the results of these discontinued operations except as otherwise
noted.
EXECUTIVE
SUMMARY
The
Company remains focused on creating long-term shareholder value. To
accomplish this goal, we continue to execute measures we believe will result in
higher sales performance in excess of the overall market and generation of
positive earnings before interest, tax, depreciation and amortization
(“EBITDA”). We have implemented aggressive actions not only to
proactively address the economic recession, but to position the Company for
future growth in sales and profitability, all of which we ultimately expect to
translate to enhanced shareholder value.
We have
taken decisive action, including aligning our labor workforce with the latest
projected sale volumes. We have lowered costs through reductions in
headcount, extended management salary reductions and eliminated the Company’s
management bonus program, as well as curtailed capital expenditures and
implemented other cost control measures.
We have
taken several additional critical steps to better position the Company not only
to weather the recession but to capitalize on opportunities as the economy
improves. To that end, we currently have one of the strongest product
development pipelines in the history of the Company, which we expect to lay the
foundation for future sales growth. Research and development will
continue to play a key role in our efforts to maintain product innovations for
new sales and to improve profitability. Consistent with our strategy to expand
our product portfolio, global footprint and additional opportunities for cost
synergies, we are integrating the acquisitions of Atexis and FGP (the “2009
Acquisitions”).
There are
a number of trends that we expect to have material effects on the Company in the
future, including global economic conditions with the resulting impact on sales,
profitability, capital spending, changes in foreign currency exchange rates
relative to the U.S. dollar, changes in debt levels and interest rates, and
shifts in our overall effective tax rate.
Our
visibility with respect to future sales remains very limited. Current
market indicators are mixed, but there are signs of improvement. It
is unclear whether the recent increase in sales and bookings is a result of the
end of the recession and an overall sustainable increase in global economies
(across most market verticals), or due to inventory replenishment as a result of
aggressive destocking efforts taken by most companies during the early phases of
the global recession. There continue to be indications that global
demand will not quickly recover. Such lower demand levels are
anticipated to continue to adversely impact the Company’s sales and
profitability. In particular, the Company’s automotive and heavy
truck, housing and industrial businesses are likely to be the most impacted with
medical technologies less affected. In future periods, we expect the
sensor market will continue to perform well relative to the overall economy as a
result of the increase in sensor content in various products across most end
markets in the U.S., Europe and Asia.
Current
sales and profitability trends are encouraging. As detailed in the
graph below, the Company posted this quarter the third consecutive quarter with
higher net sales and the second consecutive quarter with higher Adjusted EBITDA
on trailing quarter-to-quarter comparison.
22
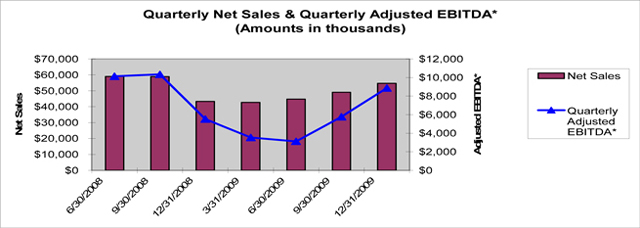
Adjusted
EBITDA is a non-GAAP financial measure that is not in accordance with, or an
alternative to, measures prepared in accordance with GAAP. The
Company believes certain financial measures which meet the definition of
non-GAAP financial measures provide important supplemental
information. The Company considers Adjusted EBITDA an important
financial measure because it provides a financial measure of the quality of the
Company’s earnings from a cash flow perspective (prior to taking into account
the effects of changes in working capital and purchases of property and
equipment). Adjusted EBITDA is used by management in addition to and
in conjunction with the results presented in accordance with
GAAP. Additionally, quarterly Adjusted EBITDA provides the current
run-rate for trending purposes rather than a trailing twelve month historical
amount. The following table details quarterly net sales and also
provides a Non-GAAP Reconciliation of quarterly Adjusted EBITDA to the
applicable GAAP financial measures.
|
Quarter
Ended
|
Net Sales
|
Quarterly
Adjusted
EBITDA*
|
Income (Loss)
from
Continuing
Operations
|
Interest
|
Foreign
Currency
Exchange Loss
(Gain)
|
Depreciation
and
Amortization
|
Income
Taxes
|
Share-based
Compensation
|
Other*
|
||||||||||||||||||||||
|
6/30/2008
|
$ | 58,998 | $ | 10,133 | $ | 3,855 | $ | 706 | $ | (63 | ) | $ | 3,337 | $ | 1,500 | $ | 798 | ||||||||||||||
|
9/30/2008
|
$ | 58,888 | $ | 10,332 | $ | 3,718 | $ | 806 | $ | 396 | $ | 3,240 | $ | 1,446 | $ | 726 | |||||||||||||||
|
12/31/2008
|
$ | 43,299 | $ | 5,525 | $ | 876 | $ | 675 | $ | 351 | $ | 3,011 | $ | (115 | ) | $ | 727 | ||||||||||||||
|
3/31/2009
|
$ | 42,758 | $ | 3,530 | $ | (3,170 | ) | $ | 894 | $ | 87 | $ | 3,622 | $ | 1,406 | $ | 691 | ||||||||||||||
|
6/30/2009
|
$ | 44,741 | $ | 3,118 | $ | (1,477 | ) | $ | 1,168 | $ | (536 | ) | $ | 3,730 | $ | (367 | ) | $ | 600 | ||||||||||||
|
9/30/2009
|
$ | 49,087 | $ | 5,767 | $ | 68 | $ | 1,018 | $ | (437 | ) | $ | 3,475 | $ | 675 | $ | 810 | $ | 158 | ||||||||||||
|
12/31/2009
|
$ | 54,755 | $ | 8,872 | $ | 3,264 | $ | 905 | $ | (64 | ) | $ | 3,630 | $ | (28 | ) | $ | 865 | $ | 300 | |||||||||||
* -
Adjusted EBITDA = Income from Continuing Operations before Interest, Foreign
Currency Exchange Loss (Gain), Income Taxes, Share-based Compensation
and Other. Other represents legal fees incurred related to the
International Traffic in Arms Regulations ("ITAR").
Net sales
for the quarter ended December 31, 2009 were higher than the quarter ended
December 31, 2008, but the increase in sales was not large enough to return to
prerecession level of sales generated during the first and second quarter last
fiscal year. The continued increase in sales leads us to
believe we may have seen the worst of the recession. We believe sales
bottomed out during our fourth quarter of fiscal 2009, and the continued
increases in bookings and backlog are encouraging trends, which if sustained,
should translate to continued improvements in future sales
performance. However, economic conditions continue to be challenging
and there is uncertainty as to the strength of the economic recovery with, among
other factors, high unemployment, tight credit markets and weaknesses in the
housing and automotive markets. Accordingly, cost cutting and
strengthening our business still remain primary objectives. Our cash
generation and cost cutting initiatives are working, in spite of the continued
impact of the economic recession.
Since we
cannot provide definitive sales guidance, it is also challenging to provide
guidance for gross margins. Within this context, we expect our gross
margins during fiscal 2010 to range from approximately 37% to 42%,
primarily reflecting the impact of a more stable product sales mix and assuming
stability in the value of the Chinese renminbi (“RMB”) relative to the U.S.
dollar. Gross margins for certain periods could be outside this
expected range due to certain factors within that particular
quarter. Gross margins have trended down over the past several years,
largely due to unfavorable product sales mix (both in terms of organic growth
and acquired sales) and the impact of the increase in the value of the RMB
relative to the U.S. dollar. However, our gross margins improved
slightly in fiscal 2009 as compared to the prior year because of the decrease in
the proportionate amount of lower grossing product mix, especially with sales to
the automotive market. Our sales to the automotive market are usually
characterized as higher volumes but carry lower gross margins than our
average. Since the Company’s China operations have more costs than
sales denominated in RMB (short RMB position), increases in the RMB relative to
the U.S. dollar have resulted in margin erosion. However, over the
past several months, the RMB has stabilized relative to the U.S. dollar, and
this trend is expected to continue during fiscal 2010. Finally, as
with all manufacturers, our gross margins are sensitive to the overall volume of
business (i.e., economies of scale) in that certain costs are fixed, and since
our overall level of business declined in fiscal 2009, especially during the
second half, our gross margins and overall level of profits decreased
accordingly. We expect continued downward pressures on our gross
margins given our expectation that global demand will not quickly recover, which
will result in additional unfavorable overhead absorption.
23
Total
selling, general and administrative expense (“Total SG&A”) as a percent of
net sales increased in fiscal 2009 as compared to prior years, reflecting the
drop in sales and the increase in Total SG&A expenses due to SG&A
expenses related to acquisitions. Historically, we have been
successful in leveraging our SG&A expense, growing SG&A expense more
slowly than our sales growth in fiscal 2009, but the global economic recession
adversely impacted our SG&A leverage. As a percent of sales, Total SG&A
for 2009 increased to 35.4%, as compared to 29.5% and 32.5% in fiscal years 2008
and 2007, respectively. We are expecting an overall decrease in SG&A due to
various cost control measures, which are expected to be partially offset by
continued investment in R&D costs for new programs that are not yet
generating sales (such as our new fluid property sensor), higher costs
associated with recent acquisitions, and certain costs directly related to the
recession. These costs include such costs as amendment fees charged
by our lenders and related professional fees, as discussed in further detail in
Note 8 to the Condensed Consolidated Financial Statements filed in this
quarterly report on Form 10-Q, as well as bad debt expenses due to uncollectible
trade receivables. Additionally, as financial results improve,
the Company may reinstate certain compensation programs which were cut as part
of our efforts to proactively address the global economic recession, such as the
401(k) match, and the Company is planning to reinstate salaries to pre-reduction
levels effective April 1, 2010. Since sales declined relative to the
prior year, we are not expecting improvements in SG&A as a percentage of
sales. The Company does not expect to make any acquisitions during
fiscal 2010.
Amortization
of acquired intangible assets and deferred financing costs increased
dramatically from fiscal 2008 to fiscal 2009, associated with the acquisitions
of Intersema and Visyx (the “2008 Acquisitions”) and the 2009 Acquisitions.
Amortization is disproportionately loaded more in the initial years of the
acquisition, and therefore amortization expense is higher in the quarters
immediately following a transaction, and declines in later years based on how
various intangible assets are valued and amortized. Even with the acquisitions
of Atexis and FGP completed toward the end of fiscal 2009, amortization is
expected to decrease in fiscal 2010 as compared to fiscal 2009.
In
addition to the margin exposure as a result of the depreciation of the U.S.
dollar due to our higher level of costs than sales denominated in RMB, the
Company also has foreign currency exchange exposures related to balance sheet
accounts. When foreign currency exchange rates fluctuate, there is a resulting
revaluation of assets and liabilities denominated and accounted for in foreign
currencies. Foreign currency exchange (“fx”) losses or gains due to the
revaluation of local subsidiary balance sheet accounts with realized and
unrealized fx transactions increased sharply in recent years, because of, among
other factors, volatility of foreign currency exchange rates. For example, our
Swiss company, Intersema, which uses the Swiss franc as its functional currency,
holds cash denominated in foreign currencies (U.S. dollar and Euro). As the
Swiss franc appreciates against the U.S. dollar and/or Euro, the cash balances
held in those denominations are devalued when stated in terms of Swiss francs.
These fx transaction gains and losses are reflected in our “Foreign Currency
Exchange Gain or Loss.” Aside from cash, our foreign entities generally hold
receivables in foreign currencies, as well as payables. In fiscal 2009 and 2008,
we posted a net expense of $771 and $618, respectively, in realized and
unrealized foreign exchange losses associated with the revaluation of foreign
assets held by foreign entities. The Company’s operations outside of the U.S.
have expanded over the years, including with the 2009 Acquisitions which
increased our operations in France and China. We would expect to see
continued fx losses or gains associated with volatility of foreign currency
exchange rates.
On
average the U.S. dollar weakened relative to the RMB, but appreciated against
the Euro and Swiss franc during fiscal 2009. The Company has used
foreign currency contracts to hedge some of this exposure. The
Company has not hedged all of this exposure, but has accepted the exposure to
exchange rate movements without using derivative financial instruments to manage
this risk under hedge accounting. Therefore, both positive and
negative movements in currency exchange rates relative to the U.S. dollar will
continue to affect the reported amounts of sales, profits, and assets and
liabilities in the Company’s consolidated financial statements.
Our
overall effective tax rate will continue to fluctuate as a result of the
allocation of earnings among various taxing jurisdictions with varying tax
rates. We expect a decrease in our 2010 overall effective tax rate as
compared to last year, excluding discrete items. The decrease in the
estimated overall effective tax rate mainly reflects the shift of taxable
earnings to tax jurisdictions with lower tax rates and favorable tax deductions
in China. The overall shift in profits and losses was a higher
proportion of profits to those jurisdictions with lower tax rates and a higher
proportion of losses to jurisdictions with higher tax rates. The
overall estimated effective tax rate is based on expectations and other
estimates and involves complex domestic and foreign tax issues, which the
Company monitors closely, but are subject to change.
In
January 2010, the Company received notification from the Chinese authorities
that the Company’s subsidiary in China, MEAS China, was on the 2009 Approved
High Technology Enterprise list. In order to obtain final High New
Technology Enterprise (“HNTE”) status, MEAS China must obtain local governmental
registration and certification, which is expected before May
2010. HNTE status is expected to decrease the tax rate for MEAS China
from 18% to 15%.
The
Company expects to continue investing in various capital projects in fiscal
2010, and capital spending in 2010 is expected to approximate
$7,000. This level is lower than fiscal 2009, because capital
spending in 2009 included the completion of the new China facility, as well as
reductions related to various cost control measures.
24
RESULTS
OF OPERATIONS
THREE
MONTHS ENDED DECEMBER 31, 2009 COMPARED TO THREE MONTHS ENDED DECEMBER 31,
2008
THE FOLLOWING TABLE SETS FORTH
CERTAIN ITEMS FROM OPERATIONS IN OUR CONDENSED CONSOLIDATED FINANCIAL STATEMENTS
OF OPERATIONS FOR THE THREE MONTHS ENDED DECEMBER 31, 2009 AND 2008,
RESPECTIVELY:
|
Three Months Ended
December 31,
|
Percent
|
|||||||||||||||
|
2009
|
2008
|
Change
|
Change
|
|||||||||||||
|
Net
sales
|
$ | 54,755 | $ | 43,299 | $ | 11,456 | 26.5 | |||||||||
|
Cost
of goods sold
|
32,795 | 24,379 | 8,416 | 34.5 | ||||||||||||
|
Gross
profit
|
21,960 | 18,920 | 3,040 | 16.1 | ||||||||||||
|
Operating
expenses:
|
||||||||||||||||
|
Selling,
general, and administrative
|
15,383 | 14,884 | 499 | 3.4 | ||||||||||||
|
Non-cash
equity based compensation
|
865 | 727 | 138 | 19.0 | ||||||||||||
|
Amortization
of acquired intangibles
|
1,465 | 1,255 | 210 | 16.7 | ||||||||||||
|
Total
selling, general and administrative expenses
|
17,713 | 16,866 | 847 | 5.0 | ||||||||||||
|
Operating
income (loss)
|
4,247 | 2,054 | 2,193 | 106.8 | ||||||||||||
|
Interest
expense, net
|
905 | 675 | 230 | 34.1 | ||||||||||||
|
Foreign
currency exchange loss (gain)
|
(64 | ) | 351 | (415 | ) | (118.2 | ) | |||||||||
|
Other
expense
|
52 | 161 | (109 | ) | (67.7 | ) | ||||||||||
|
Income
before income taxes
|
3,354 | 867 | 2,487 | 286.9 | ||||||||||||
|
Income
tax benefit from continuing operations
|
(28 | ) | (115 | ) | 87 | (75.7 | ) | |||||||||
|
Income
from continuing operations, net of income taxes
|
3,382 | 982 | 2,400 | 244.4 | ||||||||||||
|
Less: Net
income attributable to noncontrolling interest
|
118 | 106 | 12 | 11.3 | ||||||||||||
|
Income
from continuing operations attributable to MEAS
|
$ | 3,264 | $ | 876 | $ | 2,388 | 272.6 | |||||||||
Net
Sales: Net
sales increased to $54,755
for the quarter ended December 31, 2009 from $43,299 for the quarter ended
December 31, 2008, an increase of 26.5% or $11,456. Organic
sales, defined as net sales excluding sales attributed to 2009 Acquisitions of
$4,042, increased $7,414 or 17%. Sales increases were in all primary
sensor product lines, with the largest increases in pressure, temperature and
humidity. The overall increase in sales is due to the improvement in
overall global economic conditions, as well as new sales from broader product
adoptions and new
programs.
The
global recession in 2008-2009 has been one of the worst recessions in decades,
and the overall impact of the recession was not evident until the third quarter
of fiscal 2009. Sales during the third quarter last year reflected
decreases in all sectors, driven largely by sharp reductions in sales to
passenger and non-passenger vehicle customers in U.S., Europe and
Asia.
Gross
Margin: Gross margin (gross profit as a percent of net sales)
declined to approximately 40.1% for the quarter ended
December 31, 2009 from approximately 43.7% during the quarter ended December 31,
2008. The decrease in margin is mainly due to lower volumes of production and
sales and the resulting decrease in leverage and overhead absorption, as well as
a less favorable product sales mix, partially offset by certain cost control
measures. As with all manufacturers, our gross margins are sensitive to overall
volume of business in that certain costs are fixed, and when volumes decline,
our margins are lower. The decrease in production volumes mainly
reflects the decrease due to the alignment of production levels to match lower
sales volumes. The less favorable product sales mix is largely
associated with higher proportion of sales of lower gross margin products. This
would include higher level of sales to the automotive market, which generally
carries a lower gross margin than our overall average. Sales to the automotive
market during the third quarter this year were higher than the same period last
year, because of the especially sharp reductions in sales to automotive market
last year due to the impact of the recession. Since the average
RMB/U.S. dollar exchange rate for the three months ended December 31, 2009 was
relatively stable, there was no significant impact on our
margins.
On a
continuing basis, our gross margin may vary due to product mix, sales volume,
availability of raw materials, foreign currency exchange rates, and other
factors.
Selling,
General and Administrative: Overall,
total selling, general and administrative (“total SG&A”) expenses increased
$847 or 5.0% to $17,713. Organic
SG&A expenses, defined as total SG&A expenses excluding SG&A
expenses associated with the 2009 Acquisitions of $1,616, decreased $769 to
$16,884 for the three months ended December 31, 2009. The decrease in
organic SG&A costs mainly reflects the positive impact of certain cost
control measures, partially offset by the increase in costs due to the increase
sales. A portion of our total SG&A expenses are variable in
nature and fluctuate with sales. In direct response to the global
economic recession, management implemented several cost control initiatives,
including reductions in headcount, management salaries, and the elimination of
the Company’s management bonus
program.
Total
SG&A expenses as a percent of net sales decreased to 32.3% from 39%. The decrease in
operating expenses as a percent of net sales is due to costs increasing at a
lower rate than net sales.
25
Non-cash
equity based compensation: Non-cash equity based compensation
increased $138 to $865 from $727 for the three
months ended December 31, 2009 as compared to the three months ended December
31, 2008. The increase in non-cash equity based compensation is mainly due to
the timing of the annual grant of stock options. This fiscal year the
annual stock option grant was in July, as compared to November last
year. Total compensation cost related to share based payments not yet
recognized totaled $2,815 at December 31, 2009, which is expected to be
recognized over a weighted average period of approximately 1.29
years.
Amortization
of acquired intangibles and deferred financing costs: Amortization
of acquired intangible assets and deferred financing costs increased $210 to $1,465 for the three months
ended December 31, 2009 as compared to $1,255 for the three months ended
December 31, 2008. The increase in amortization expense is mainly due
to higher amortization expense associated with the 2009
Acquisitions. Amortization expense for intangible assets is higher
during the first years after an acquisition because, among other things, the
order back-log is fully amortized during the initial
year. Amortization of acquired intangibles and deferred financing
costs is expected to decline in future periods, based on the weighted average
useful lives used for amortization of intangible
assets.
Interest
expense, net: Interest
expense increased $230 to
$905 for the three months
ended December 31, 2009 from $675 during the three months ended December 31,
2008. The increase in interest expense is primarily because prior year interest
expense was lower since the Company capitalized interest costs incurred on a
portion of its debt during the construction of the China facility, and no such
amounts were capitalized during the current year. Also contributing
to the increase in interest expense are the increases in average total
outstanding debt and average interest rates. Average total
outstanding debt increased to $73,993 during the three months ended December 31,
2009 from $71,426 during the three months ended December 31,
2008. Interest rates went to approximately 4.5% this year from about
4.4% last year. The overall increase in outstanding debt is due to
financing the 2009
Acquisitions.
Foreign
Currency Exchange Gain: The increase in foreign currency
exchange gain mainly reflects the increase in the gain associated with the
changes in the value of the U.S. dollar relative to the Euro, and the decrease
in foreign currency exchange losses associated with the value of the RMB
relative to the U.S. dollar. Over the past few years, the Company has
had foreign currency exchange losses due to the appreciation of the RMB relative
to the U.S. dollar, but during the three months ended December 31, 2009, the
value of the RMB relative to the U.S. dollar remained relatively stable as
compared to the same period last year, and as such, there was a significant
decrease in the related foreign currency exchange loss. The higher
foreign currency exchange gain is the result of the favorable fluctuation of the
value of the U.S. dollar relative to the Euro from September 30, 2009 to
December 31, 2009. The value of the U.S. dollar relative to the Euro
was moderately stable during the three months ended December 31,
2008. The Company continues to be impacted by volatility in foreign
currency exchange rates, including the impact of the fluctuation of the U.S.
dollar relative to the Euro and Swiss franc, as well as the appreciation of the
RMB relative to the U.S.
dollar.
Income
Taxes: Income
tax benefit decreased to $28 for the three months ended
December 31, 2009, as compared to an income tax benefit of $115 for the three
months ended December 31, 2008. The fluctuation is primarily due to
the generation of higher profits before taxes during the current quarter, and
the generation in certain tax jurisdictions of losses before taxes during the
corresponding period last
year.
The
overall effective tax rate (income tax benefit divided by income from continuing
operations before income taxes) for the quarter ended December 31, 2009 was
approximately 1%, as compared to 13% for the quarter ended December 31,
2008. Income tax expense or benefit during interim periods is based
on an estimated effective tax rate (“estimated ETR”). During the
third quarter of fiscal 2010, the Company revised the estimated ETR without
discrete adjustments from a negative 7% to approximately 5%, because of improved
economic conditions. The change in the estimated ETR resulted in a
year to date cumulative adjustment during the third quarter. The
estimated ETR without discrete items for fiscal 2010 is approximately 5%, as
compared to the 26.5% estimated ETR without discrete items during the third
quarter of fiscal 2009. The decrease in the estimated ETR mainly
reflects the impact of the global economic situation with the shift of taxable
earnings to tax jurisdictions with lower tax rates and favorable tax deductions
in China. The overall shift in profits and losses was a higher
proportion of profits to those jurisdictions with lower tax rates and a higher
proportion of losses to jurisdictions with higher tax rates. The
overall estimated ETR is based on expectations and other estimates and involves
complex domestic and foreign tax issues, which the Company monitors closely, but
are subject to change.
NINE
MONTHS ENDED DECEMBER 31, 2009 COMPARED TO NINE MONTHS ENDED DECEMBER 31,
2008
THE FOLLOWING TABLE SETS FORTH
CERTAIN ITEMS FROM OPERATIONS IN OUR CONDENSED CONSOLIDATED FINANCIAL STATEMENTS
OF OPERATIONS FOR THE NINE MONTHS ENDED DECEMBER 31, 2009 AND 2008,
RESPECTIVELY:
26
|
Nine Months Ended
December 31,
|
Percent
|
|||||||||||||||
|
2009
|
2008
|
Change
|
Change
|
|||||||||||||
|
Net
sales
|
$ | 148,583 | $ | 161,184 | $ | (12,601 | ) | (7.8 | ) | |||||||
|
Cost
of goods sold
|
92,472 | 91,987 | 485 | 0.5 | ||||||||||||
|
Gross
profit
|
56,111 | 69,197 | (13,086 | ) | (18.9 | ) | ||||||||||
|
Operating
expenses:
|
||||||||||||||||
|
Selling,
general, and administrative
|
44,624 | 48,734 | (4,110 | ) | (8.4 | ) | ||||||||||
|
Non-cash
equity based compensation
|
2,275 | 2,251 | 24 | 1.1 | ||||||||||||
|
Amortization
of acquired intangibles and deferred financing costs
|
4,614 | 3,978 | 636 | 16.0 | ||||||||||||
|
Total
selling, general and administrative expenses
|
51,513 | 54,963 | (3,450 | ) | (6.3 | ) | ||||||||||
|
Operating
income
|
4,598 | 14,234 | (9,636 | ) | (67.7 | ) | ||||||||||
|
Interest
expense, net
|
3,092 | 2,187 | 905 | 41.4 | ||||||||||||
|
Foreign
currency exchange loss (gain)
|
(1,037 | ) | 684 | (1,721 | ) | (251.6 | ) | |||||||||
|
Other
expense (income)
|
79 | (193 | ) | 272 | (140.9 | ) | ||||||||||
|
Income
(loss) before income taxes
|
2,464 | 11,556 | (9,092 | ) | (78.7 | ) | ||||||||||
|
Income
tax expense from continuing operations
|
280 | 2,830 | (2,550 | ) | (90.1 | ) | ||||||||||
|
Income
from continuing operations, net of income taxes
|
2,184 | 8,726 | (6,542 | ) | (75.0 | ) | ||||||||||
|
Less: Net
income attributable to noncontrolling interest
|
328 | 276 | 52 | 18.8 | ||||||||||||
|
Income
from continuing operations attributable to MEAS
|
$ | 1,856 | $ | 8,450 | $ | (6,594 | ) | (78.0 | ) | |||||||
Net
Sales: Net
sales decreased to $148,583 for the nine months ended December 31, 2009 from
$161,184 for the nine months ended December 31, 2008, a decrease of $12,601 or
7.8%. The overall decrease in sales is due to the global economic
recession. Organic sales, defined as net sales excluding sales
attributed to 2009 Acquisitions of $11,919, declined $24,520 or
15.2%.
The
global recession in 2008-2009 was one of the worst recessions in decades, and
there is continued economic pressure in many areas of the global
economy. The decrease in sales due to the overall impact of the
recession was not evident in the first half of fiscal 2009, but became more
evident in the third quarter of fiscal 2009. Accordingly, comparisons
of the first nine months of fiscal 2010 to the first nine months of fiscal 2009
show significant decreases. Decreases in fiscal 2009 sales were in
all sectors, driven largely by sharp reductions in sales to passenger and
non-passenger vehicle customers in U.S., Europe and Asia.
Gross
Margin: Gross margin (gross profit as a percent of net sales)
declined to approximately 37.8% for the nine months ended December 31, 2009 from
42.9% during the nine months ended December 31, 2008. The decrease in margin is
mainly due to lower volumes and the resulting decrease in leverage and overhead
absorption, partially offset by certain cost control measures. As with all
manufacturers, our gross margins are sensitive to overall volume of business in
that certain costs are fixed. Since our overall level of business
declined relative to the same period last year, our gross margins and overall
level of profits decreased accordingly. The decrease in production
volumes not only reflects the decrease due to the alignment of production levels
to match lower sales volumes, but also the consumption of inventory built-up as
part of the China facility move. Since the average RMB/U.S.
dollar exchange rate for the nine months ended December 31, 2009 was
relatively stable as compared to the same period last year, there was no
significant impact on our margins.
On a
continuing basis, our gross margin may vary due to product mix, sales volume,
availability of raw materials, foreign currency exchange rates, and other
factors.
Selling, General
and Administrative: Overall, total selling,
general and administrative (“total SG&A”) expenses decreased $3,450 or 6.3%
to $51,513, largely due to cost reductions and the decrease in
sales. Organic SG&A costs, defined as total SG&A costs
excluding SG&A costs associated with the 2009 Acquisitions of $4,816,
decreased $8,266 to $48,251 for the nine months ended December 31,
2009. In direct response to the global economic recession, management
implemented several cost control initiatives, including reductions in headcount,
management salaries, and the elimination of the Company’s management bonus
program. Additionally, SG&A declined because of the decrease in
sales, since a portion of our total SG&A costs are variable and fluctuate
with sales. Total SG&A expenses as a percent of net sales
increased slightly to 34.7% from 34.1%. The increase in operating expenses as a
percent of net sales is due to costs decreasing at a lower rate than net
sales.
Non-cash equity
based compensation: Non-cash equity based compensation
increased $24 to $2,275 from $2,251 for the nine months ended December 31, 2009
as compared to the nine months ended December 31, 2008. The increase in non-cash
equity based compensation is mainly due to the higher valuation of non-cash
equity based compensation and the ratable (i.e., higher expense recognition
during the beginning) recognition of equity based compensation. The
increase in the valuation of non-cash equity based compensation is primarily the
result of the increase in the Company’s stock price, higher
volatility and quantity of options issued with the annual grants in 2010
relative to the annual grant in fiscal 2009. Additionally, this fiscal year the
annual stock option grant was in July, as compared to November last
year. Total compensation cost related to share based payments not yet
recognized totaled $2,815 at December 31, 2009, which is expected to be
recognized over a weighted average period of approximately 1.29
years.
27
Amortization of
acquired intangibles and deferred financing costs: Amortization of
acquired intangible assets and deferred financing costs increased $636 to $4,614
for the nine months ended December 31, 2009 as compared to $3,978 for the nine
months ended December 31, 2008. The increase in amortization expense
is due to higher amortization expense associated with the 2009 Acquisitions and
the write-off of certain deferred financing costs. Amortization
expense for intangible assets is higher during the first years after an
acquisition because, among other things, the order back-log is fully amortized
during the initial year. Additionally, during the three months ended
June 30, 2009, the Company expensed approximately $190 in deferred financing
costs due to the amendment to the credit facility which resulted in a reduction
in the principal amount of availability under the revolving credit
facility. Amortization of acquired intangibles and deferred financing
costs for fiscal 2010 is expected to decline relative to the prior
year.
Interest expense,
net: Interest expense
increased $905 to $3,092 for the nine months ended December 31, 2009 from $2,187
during the nine months ended December 31, 2008. The increase in interest expense
is primarily because prior year interest expense was lower since the Company
capitalized interest costs incurred on a portion of its debt during the
construction of the China facility, and no such amounts were capitalized during
the current year. Also contributing to the increase in interest
expense was the increase in average total debt outstanding. Average
total outstanding debt increased to $78,569 during the nine months ended
December 31, 2009 from an average amount outstanding of $72,913 during the nine
months ended December 31, 2008. Interest rates remained unchanged from last year
to this year at about 4.8%. Overall borrowings increased
to finance 2009 Acquisitions.
Foreign Currency
Exchange Gain: The increase in foreign currency exchange gain
mainly reflects the increase in the gain associated with the changes in the
value of the U.S. dollar relative to the Euro, and the decrease in foreign
currency exchange losses associated with the value of the RMB relative to the
U.S. dollar. Over the past few years, the Company has had foreign
currency exchange losses due to the appreciation of the RMB relative to the U.S.
dollar, but during the nine months ended December 31, 2009, the value of the RMB
relative to the U.S. dollar remained relatively stable as compared to the same
period last year, and as such, there was a significant decrease in the related
foreign currency exchange loss. The higher foreign currency exchange
gain is the result of the depreciation of the value of the U.S. dollar relative
to the Euro from March 31, 2009 to December 31, 2009. The Company
continues to be impacted by volatility in foreign currency exchange rates,
including the impact of the fluctuation of the U.S. dollar relative to the Euro
and Swiss franc, as well as the appreciation of the RMB relative to the U.S.
dollar.
Other expense
(income): Other expense (income)
consists of various non-operating items. Other expense (income)
fluctuated to an expense of $79 for the nine months ended December 31, 2009 from
income of $193 for the nine months ended December 31, 2008, mainly due to the
income recognized for the $500 of Chinese incentives for foreign investments
provided to the Company last year, which was partially offset by other
non-operating expense items.
Income
Taxes: Income tax expense
during the nine months ending December 31, 2009 decreased to $280, as compared
to $2,830 for the first nine months ended December 31, 2008. The
fluctuation of income tax expense is mainly due to the decrease in profit before
taxes, as well as the impact of a number of discrete tax
adjustments.
The
overall effective tax rate (income tax expense divided by income from continuing
operations before income taxes) for the quarter ended December 31, 2009 was
approximately 11%, as compared to 24% for the quarter ended December 31,
2008. Income tax expense during interim periods is based on an
estimated ETR. The fiscal 2010 estimated ETR without discrete items
is approximately 5% as compared to 26.5% last year. The decrease in
the estimated ETR was due to, among other things, changing economic conditions
and the shifting of expected profits and losses before taxes between tax
jurisdictions with differing tax rates. The overall estimated ETR is
based on expectations and other estimates and involves complex domestic and
foreign tax issues, which the Company monitors closely, but are subject to
change.
In July
2009, the Company received notification of approval from the local Chinese tax
authority for certain research and development (“R&D”)
deductions. The income tax benefit of approximately $266 associated
with this R&D deduction is reflected as a favorable discrete tax adjustment
during the quarter ended September 30, 2009.
During
the second quarter of fiscal 2010, the Company received approval from the Swiss
tax authority for a five year tax holiday effective in fiscal
2010. The Company’s tax rate in Switzerland was reduced to
approximately 13% from 22%. In accordance with accounting principles
for income taxes, the Company revalued the Company’s Swiss net deferred tax
liabilities at the lower tax rate, resulting in a discrete non-cash income tax
credit of $650 recorded during the quarter ended September 30,
2009.
The
Company has previously considered undistributed earnings of its foreign
subsidiaries to be indefinitely reinvested outside of the U.S. and, accordingly,
no U.S. deferred taxes had been recorded with respect to such earnings. However,
the Company elected to distribute $7,500 of undistributed earnings from its
Irish subsidiary, MEAS Ireland, and recorded a deferred tax liability and
corresponding discrete income tax expense for $1,100 during the quarter ended
September 30, 2009.
LIQUIDITY
AND CAPITAL RESOURCES
Cash
balances totaled $26,303 at December 31, 2009, an increase of $2,820 as compared
to March 31, 2009, reflecting, among other factors, the Company’s ability to
generate positive operating cash flows, which was partially offset by
approximately $14,350 in payments to reduce debt and $3,683 of cash used for
purchases of property and equipment. Cash balances may decline as the Company
continues to pay down debt and fund capital additions, as well as due to the
overall impact of the global recession.
The
following schedule compares the primary categories of the consolidated statement
of cash flows:
28
|
Nine months ended December 31,
|
||||||||||||
|
2009
|
2008
|
Change
|
||||||||||
|
Net
cash provided by operating activities from continuing
operations
|
$ | 21,885 | $ | 17,634 | $ | 4,251 | ||||||
|
Net
cash used in investing activities from continuing
operations
|
(3,709 | ) | (11,328 | ) | 7,619 | |||||||
|
Net
cash used in financing activities from continuing
operations
|
(15,941 | ) | (4,150 | ) | (11,791 | ) | ||||||
|
Net
cash provided by discontinued operations
|
141 | 540 | (399 | ) | ||||||||
|
Effect
of exchange rate changes on cash
|
444 | (1,064 | ) | 1,508 | ||||||||
|
Net
change in cash and cash equivalents from continuing
operations
|
$ | 2,820 | $ | 1,632 | $ | 1,188 | ||||||
In spite
of the global economic recession, the Company was able to generate positive
operating cash flows, as a result of implementing initiatives to improve
operating cash flows through working capital management and various cost control
measures. Cash flows from operating working capital (changes in trade
accounts receivables, inventory, and accounts payable) fluctuated from a use of
cash flows of $1,785 last year to a source of cash flows of $4,795 during the
current period. The single largest driver of current year operating
cash flows was from inventory consumption. Inventory balances
decreased as compared to last year because of the utilization of inventory
built-up for the planned China facility move, as well as the reduction of
inventory due to the decrease in projected sales. As compared to last
year, the change in accounts receivables decreased to $834 from $13,216,
reflecting the overall decline in sales due to the recession. Other
items impacting operating cash flows include continued efforts to maintain
strong collections of trade receivables, as well as the impact of income taxes
and accrued expenses. The increase in accrued expenses is due in
large part to the increase in accrued interest payable resulting from the higher
interest expense. The fluctuation in the income taxes payable and
income receivable reflects, among other things, the collection of certain
research tax credits and the swing from income tax expense to income tax benefit
in certain tax jurisdictions as a consequence of the change from a profit before
taxes to a loss before taxes during the current year.
Net cash
used in investing activities was $3,709 as compared to $11,328 last year. The
prior year capital spending levels were higher due to the construction of the
new China facility, and the lower level of capital spending during the current
year reflects the impact of cost control measures.
Net cash
used in financing activities totaled $15,941 for the nine months ended December
31, 2009, as compared to $4,150 used in financing activities during the same
period last year. The increase in debt payments reflects the
Company’s efforts to reduce debt levels.
The
effect of exchange rate changes on cash is the translation decrease or increase
in cash balances due to the fluctuation of foreign currency exchange
rates. For example, €1,000 is translated to $1,320 based on March 31,
2009 exchange rates, but the same €1,000 is translated to $1,434 using exchange
rates at December 31, 2009. The current year impact of exchange rate
changes is primarily due to the depreciation of the U.S. dollar relative to the
Euro and the relative stability of the RMB relative to the U.S.
dollar.
Long-Term
Debt: To support the financing of acquisitions, effective
April 1, 2006, the Company entered into an Amended and Restated Credit Agreement
(“Amended and Restated Credit Facility”) with General Electric Capital
Corporation (“GE”) as agent which, among other things, increased the
Company’s existing credit facility from $35,000 to $75,000, consisting of a
$55,000 revolving credit facility and a $20,000 term loan, and lowered the
applicable London Inter-bank Offered Rate (“LIBOR”) or Index Margin from 4.50%
and 2.75%, respectively, to LIBOR and Index Margins of 2.75% and 1.0%,
respectively. To support the financing of the acquisition of Intersema (See Note
6), the Company entered into an Amended Credit Agreement (“Amended
Credit Facility”) with four banks, with GE as agent, effective December 10,
2007 which, among other things, increased the Company’s existing revolving
credit facility from $55,000 to $121,000 and lowered the applicable LIBOR or
Index Margin from 2.75% and 1.0%, respectively, to LIBOR and Index Margins of
2.00% and 0.25%, respectively. Interest accrues on the principal amount of the
borrowings at a rate based on either LIBOR plus a LIBOR margin, or at the
election of the borrower, at an Index Rate (prime based rate) plus an Index
Margin. The applicable margins may be adjusted quarterly based on a change in
specified financial ratios. Borrowings under the line are subject to certain
financial covenants and restrictions on indebtedness, dividend payments,
repurchase of Company common stock, financial guarantees, annual capital
expenditures, and other related items. The borrowing availability of the
revolving credit facility is not based on any borrowing base requirements, but
borrowings are limited by certain financial covenants. The term loan
portion of our credit facility was not changed with the Amended Credit Facility.
The term loan is payable in $500 quarterly installments plus interest through
March 1, 2011, with a final term payment and the revolver payable on April 3,
2011. The Company has provided a security interest in substantially all of the
Company’s U.S. based assets as collateral for the Amended Credit
Facility.
29
On April
27, 2009, the Company entered into an amendment (the “Amendment”) to the Amended
Credit Facility whereby the Company proactively negotiated a reduction of our
debt covenant requirements, as a result of the decline in our sales and
profitability resulting from the impact of the global recession. The
Amendment provides the Company with additional flexibility under its minimum
EBITDA covenant, total leverage ratio covenant, fixed charge ratio covenant and
maximum capital expenditure covenant included in its senior credit facility.
Under the terms of the Amendment, the principal amount available under the
Company’s revolver has been reduced from $121,000 to $90,000. The Amendment
increased the interest rate by between 1.50% and 2.25%, increased the Index
Margin and LIBOR Margin (which vary based on the Company’s debt to EBITDA
leverage ratio), and also increased the commitment fee on the unused balance to
0.5% per annum. As part of the Amendment, the Company paid $832 in
amendment fees, which were capitalized as deferred financing
costs. Pursuant to the Amendment, the Company is prohibited from
consummating any business acquisitions without lender approval during the
covenant relief period, which ends March 31, 2010. Management
believes the Company will be in compliance with the revised debt covenants, but
there can be no assurance that these reductions will be sufficient if the
recession is longer or worse than we expect. The Company is presently
in compliance with applicable financial covenants at December 31,
2009.
The
Company’s debt covenant requirements for December 31, 2009 and the next quarter
are as follows:
|
Amended Financial Covenant Requirements
|
||||||||
|
December 31, 2009
|
March 31, 2010
|
|||||||
|
Minimum
Adjusted Earnings Before Income Taxes, Stock
Options, Depreciation, and Amortization ("Adjusted
EBITDA")
|
$ | 19,100 | $ | 24,750 | ||||
|
Minimum
Adjusted Fixed Charge Coverage Ratio for the last twelve
months
|
1.15 | 1.20 | ||||||
|
Maximum
Adjusted Capital Expenditures for the last twelve months
|
$ | 7,978 | $ | 8,758 | ||||
|
Maximum
Adjusted Total Leverage Ratio
|
4.25 | 3.25 | ||||||
Adjusted
EBITDA for debt covenant purposes is the Company’s earnings before interest,
income taxes, stock options, depreciation and amortization for last twelve
months, in addition to the last twelve months of Adjusted EBITDA for
acquisitions and certain adjustments approved by our lender. Adjusted
fixed charge coverage ratio is Adjusted EBITDA less adjusted capital
expenditures divided by fixed charges. Fixed charges are the last
twelve months of interest, taxes paid, and the last twelve months of payments of
long-term debt, notes payable and capital leases. Adjusted capital
expenditures represent purchases of plant, property and equipment during the
last twelve months. Total leverage ratio is total debt less cash
maintained in U.S. bank accounts which are subject to blocked account agreements
with lenders divided by the last twelve months of Adjusted
EBITDA. All of the aforementioned financial covenants are subject to
various adjustments, many of which are detailed in the amended credit agreement
and subsequent amendments to the credit agreement previously filed with the
Securities Exchange Commission, as well as other adjustments approved by the
lender. These adjustments include such items as excluding capital
expenditures associated with the new China facility from capital expenditures,
and adjustments to Adjusted EBITDA for certain items such litigation settlement
costs, severance costs and other items considered non-recurring in
nature.
As of
December 31, 2009, the Company utilized the LIBOR based rate for the term loan
and for $59,500 of the revolving credit facility under the Amended Credit
Facility. The weighted average interest rate applicable to borrowings under the
revolving credit facility was approximately 4.4% at December 31, 2009. As of
December 31, 2009, the outstanding borrowings on the revolving credit facility,
which is classified as long-term debt, were $63,547, and the Company had an
additional $26,453 available under the revolving credit facility. The Company’s
borrowing capacity is limited by financial covenant ratios, including earnings
ratios, and as such, our borrowing capacity is subject to
change.
China Credit
Facility: On November 3, 2009, the Company’s subsidiary in
China (“MEAS China”) entered into a two year credit facility agreement (the
“China Credit Facility”) with China Merchants Bank Co. Ltd
(“CMB”). The China Credit facility permits MEAS China to borrow
up to RMB 68 million (approximately $10 million). Specific
covenants include customary limitations, compliance with laws and regulations,
use of proceeds for operational purposes, and timely payment of interest and
principal. MEAS China has pledged its Shenzhen facility to CMB as
collateral. The interest rate will be based on the LIBO plus a LIBOR
spread, depending on the term of the loan when drawn. The purpose of
the China Credit Facility is primarily to provide additional flexibility in
funding operations of MEAS China. At December 31, 2009, there were no
outstanding borrowings against the China Credit Facility and MEAS China could
borrow approximately $10 million.
Promissory
Notes: In connection with the acquisition of Intersema, the
Company issued Swiss franc denominated unsecured promissory notes (“Intersema
Notes”) totaling 10,000 Swiss francs. At December 31, 2009, the
unpaid balance of the Intersema Notes totaled $7,225, of which $2,408 is
classified as current. The Intersema Notes are payable in four equal annual
installments on January 15 and bear an interest rate of 4.5% per
year.
LIQUIDITY: Management
assesses the Company’s liquidity in terms of available cash, our ability to
generate cash and our ability to borrow to fund operating, investing and
financing activities. The Company continues to generate cash from operating
activities, and the Company remains in a positive financial position with
availability under existing credit facilities. The Company will
continue to have cash requirements to support working capital needs, capital
expenditures, earn-outs related to acquisitions, and to pay interest and service
debt. We believe the Company’s financial position, generation of cash
and the existing credit facility, in addition to the potential to refinance or
obtain additional financing will be sufficient to meet funding of day-to-day and
material short and long-term commitments for the foreseeable
future.
30
At
December 31, 2009, we had approximately $26,303 of available cash and
approximately $27,000 of borrowing capacity, after considering the limitations
set on the Company’s total leverage under the under the revolving credit
facility. This cash balance includes cash of $5,382 in China, which
is subject to certain restrictions on the transfer to another country
because of currency control regulations. The Company’s cash balances
are generated and held in numerous locations throughout the world, including
substantial amounts held outside the United States. The Company utilizes a
variety of tax planning and financing strategies in an effort to ensure that its
worldwide cash is available in the locations in which it is needed. Wherever
possible, cash management is centralized and intra-company financing is used to
provide working capital to the Company’s operations. Most of the cash balances
held outside the United States could be repatriated to the United States, but,
under current law, would potentially be subject to United States federal income
taxes, less applicable foreign tax credits. Repatriation of some foreign
balances is restricted or prohibited by local laws. Where local restrictions
prevent an efficient intra-company transfer of funds, the Company’s intent is
that cash balances would remain in the foreign country and it would meet United
States liquidity needs through ongoing cash flows, external borrowings, or
both.
Since the
Company’s primary credit facility matures on April 3, 2011, the Company has had
preliminary discussions with potential lenders about entering into a new credit
agreement. Based on these discussions and a number of other factors,
including current credit market conditions and the improving financial results
of the Company, the Company is planning to begin negotiations with several
lenders about a new credit facility in the first part of fiscal 2011, with the
objective of refinancing our primary credit facility before April 3,
2011. The Company cannot provide assurance that it will be able to
refinance its primary credit facility on commercially acceptable terms or at
all.
ACCUMULATED
OTHER COMPREHENSIVE INCOME: Accumulated other comprehensive income
primarily consists of foreign currency translation adjustments, which relate to
the Company’s European and Asian operations and the effects of changes in the
exchange rates of the U.S. dollar relative to the Euro, Chinese RMB, Hong Kong
dollar, Japanese Yen and Swiss franc.
APPLICATION
OF CRITICAL ACCOUNTING POLICIES: The preparation of financial
statements in accordance with U.S. generally accepted accounting principles
requires management to make estimates and assumptions that affect the reported
amounts of assets and liabilities, the disclosure of contingent assets and
liabilities at the date of the financial statements and the reported amounts of
revenues and expenses during the reporting period. These estimates and
assumptions may require significant judgment about matters that are inherently
uncertain, and future events are likely to occur that may require management to
change them. Accordingly, management regularly reviews these estimates
and assumptions based on historical experience, changes in the business
environment and other factors that management believes to be reasonable under
the circumstances. Management discusses the development, selection and
disclosures concerning critical accounting policies with the Audit Committee of
its Board of Directors. There have been no significant changes to the
Application of Critical Accounting Policies disclosure contained in the
Company’s Annual Report on Form 10-K for the year ended March 31,
2009.
NEW
ACCOUNTING PRONOUNCEMENTS: In December 2007, the FASB issued new accounting
principles for acquisition accounting and noncontrolling interests, which
require most identifiable assets, liabilities, noncontrolling interests, and
goodwill acquired in a business combination to be recorded at “full fair value”
and require noncontrolling interests (previously referred to as minority
interests) to be reported as a component of equity, which changes the accounting
for transactions with noncontrolling interest holders. These principles are
effective April 1, 2009. The Company will apply the new acquisition
accounting principles to business combinations occurring after March 31, 2009.
The accounting for contingent consideration under the new acquisition accounting
standards requires the measurement of contingencies at the fair value on the
acquisition date. Contingent consideration can be either a liability or equity
based. Subsequent changes to the fair value of the contingent consideration
(liability) are recognized in earnings, not to goodwill, and equity classified
contingent consideration amounts are not re-measured. The adoption of
the new standards for acquisition accounting and noncontrolling interests did
not have a material impact on the Company’s results of operations and financial
position.
In
February 2008, the FASB issued new accounting standards for leases, which
removed fair value measurement requirements for certain leasing
transactions. In February 2008, the FASB also delayed the effective
date for fair value measurements for nonfinancial assets and nonfinancial
liabilities, except for items that are recognized or disclosed at fair value in
the financial statements on a recurring basis (at least annually), to fiscal
years beginning after November 2008. On April 1, 2009, the Company
adopted the previously deferred provisions of accounting for fair value
measurements for non-financial assets and liabilities. The adoption
of these guidelines did not have any impact on the Company’s results of
operations and financial condition.
In April
2008, the FASB issued new guidelines for determining the useful life of
intangible assets, which amends the factors that should be considered in
developing renewal or extension assumptions used to determine the useful life of
a recognized intangible asset. The intent of the new accounting
standards for determining the useful life of intangible assets is to improve the
consistency between the useful life of a recognized intangible asset and the
period of expected cash flows used to measure the fair value of the asset. The
new guidelines shall be applied for the Company prospectively to all intangible
assets acquired after March 31, 2009. The adoption of these guidelines did not
any impact on the Company’s results of operations and financial
condition.
In May
2008, the FASB issued the Accounting Standards Codification (“AS
Codification”). The AS Codification identifies the sources of
accounting principles and the framework for selecting the principles to be used
in the preparation of financial statements of nongovernmental entities that are
presented in conformity with U.S. GAAP and is effective for financial statements
issued for interim and annual periods ending after September 15,
2009. As part of the implementation of the AS Codification, plain
English references are provided to the corresponding accounting policies, rather
than specific numeric AS Codification references. There was no impact
on our financial position, results of operations or cash flow upon the adoption
of this standard.
31
On
December 30, 2008, the FASB issued new disclosure requirements for employer
postretirement benefit plan assets effective for fiscal years ending after
December 15, 2009. The new disclosure requirements clarify an
employer’s disclosures about plan assets of a defined benefit pension or other
postretirement plan. The new requirements also prescribe expanded
disclosures regarding investment allocation decisions, categories of plan
assets, inputs, and valuation techniques used to measure fair value, the effect
of Level 3 inputs on changes in plan assets and significant concentrations of
risk. The Company will adopt the new disclosure requirements at March 31,
2010 and the adoption of the new disclosure requirements will not have a
material impact on the Company’s results of operations and financial
condition.
In June
2009, the FASB issued new accounting principles for VIEs which, among other
things, established a qualitative approach for the determination of the primary
beneficiary of a VIE. An enterprise is required to consolidate a VIE
if it has both the power to direct activities of the VIE that most significantly
impact the entity’s economic performance and the obligation to absorb the losses
of the VIE or the right to receive the benefits of the VIE. These
principles improve financial reporting by enterprises involved with VIEs and
address constituent concerns about the application of certain key provisions,
including those in which the accounting and disclosures an enterprise’s
involvement in a variable interest entity as well as address significant
diversity in practice in the approaches and methodology used to calculate a
VIE’s variability. These new accounting principles related to
VIEs are effective as of the beginning of the annual reporting period that
begins after November 15, 2009, for interim periods within that annual reporting
period, and for interim and annual reporting periods thereafter. Earlier
application is prohibited. The Company is evaluating the potential
impact of the adoption of the new accounting principles related to VIEs on the
Company’s results of operations and financial condition.
DIVIDENDS: We have not declared
cash dividends on our common equity. Additionally, the payment of dividends is
prohibited under our Amended Credit Facility. We intend to retain earnings to
support our growth strategy and we do not anticipate paying cash dividends in
the foreseeable future.
At
present, there are no material restrictions on the ability of our Hong Kong and
European subsidiaries to transfer funds to us in the form of cash dividends,
loans, advances, or purchases of materials, products, or services. Chinese laws
and regulations, including currency exchange controls, however, restrict
distribution and repatriation of dividends by our China subsidiary.
SEASONALITY: As a whole, there is no
material seasonality in our sales. However, general economic conditions have had
a material impact on our business and quarterly financial results, and certain
end-use markets experience certain seasonality. For example, European sales are
often lower in summer months and OEM sales are often stronger immediately
preceding and following the introduction of new products.
INFLATION: We
compete on the basis of product design, features, and value. Accordingly, our
prices generally have kept pace with inflation, notwithstanding that inflation
in the countries where our subsidiaries are located has been consistently higher
than inflation in the United States. Increases in labor costs have not had a
significant impact on our business because most of our employees are in China,
where prevailing labor costs are low.
OFF
BALANCE SHEET ARRANGEMENTS: We do not have any financial partnerships
with unconsolidated entities, such as entities often referred to as structured
finance, special purpose entities or variable interest entities which are often
established for the purpose of facilitating off-balance sheet arrangements or
other contractually narrow or limited purposes. Accordingly, we are not exposed
to any financing, liquidity, market or credit risk that could arise if we had
such relationships.
The
Company has acquired and divested of certain assets, including the acquisition
of businesses and the sale of the Consumer business. In connection with these
acquisitions and divestitures, the Company often provides representations,
warranties and/or indemnities to cover various risks and unknown liabilities,
such as claims for damages arising out of the use of products or relating to
intellectual property matters, commercial disputes, environmental matters or tax
matters. The Company cannot estimate the potential liability from such
representations, warranties and indemnities because they relate to unknown
conditions. However, the Company does not believe that the liabilities relating
to these representations, warranties and indemnities will have a material
adverse effect on the Company’s financial position, results of operations or
liquidity.
32
|
Contractual Obligations:
|
Payment due by period
|
|||||||||||||||||||
|
Total
|
1 year
|
2-3 years
|
4-5 years
|
> 5 years
|
||||||||||||||||
|
Long-term
debt obligations
|
$ | 80,191 | $ | 4,879 | $ | 75,307 | $ | 5 | $ | - | ||||||||||
|
Interest
obligation on long-term debt
|
6,965 | 3,532 | 3,433 | - | - | |||||||||||||||
|
Capital
lease obligations
|
448 | 305 | 143 | - | - | |||||||||||||||
|
Operating
lease obligations *
|
22,869 | 3,460 | 5,746 | 5,114 | 8,549 | |||||||||||||||
|
Other
long-term obligations**
|
698 | 570 | 128 | - | - | |||||||||||||||
|
Total
|
$ | 111,171 | $ | 12,746 | $ | 84,757 | $ | 5,119 | $ | 8,549 | ||||||||||
**Other
long-term obligations on the Company’s balance sheet under GAAP primarily
consist of obligations under warranty polices and tax liabilities, but exclude
earn-out contingencies associated with acquisitions since the satisfaction of
the contingencies is not determinable or achieved at December 31, 2009. The
timing of cash flows associated with these obligations is based upon
management’s estimate over the terms of these arrangements and are largely based
on historical experience.
ITEM
3. QUANTITATIVE AND QUALITATIVE DISCLOSURES ABOUT MARKET RISK
The
Company is exposed to market risk from changes in interest rates, foreign
currency exchange rates, commodity and credit risk, which could impact its
results of operations and financial condition. The Company attempts to address
its exposure to these risks through its normal operating and financing
activities. In addition, the Company’s broad-based business activities help to
reduce the impact that volatility in any particular area or related areas may
have on its operating earnings as a whole.
Interest
Rate Risk: Under our term and revolving credit facilities, we are
exposed to a certain level of interest rate risk. Interest on the principal
amount of our borrowings under our revolving credit facility and term loan
accrue at a rate based on either a LIBOR rate plus a LIBOR margin or at an
Indexed (prime based) Rate plus an Index Margin. The LIBOR or Index Rate is at
our election. Our results will be adversely affected by any increase in interest
rates. For example, based on the $72,047 of total debt outstanding under
these facilities at December 31, 2009, an annual interest rate increase of
100 basis points would increase interest expense and decrease our pre-tax
profitability by $720. We do not currently hedge this interest rate
exposure.
Commodity
Risk: The Company uses a wide range of commodities in our products,
including steel, non-ferrous metals and petroleum based products, as well as
other commodities required for the manufacture of our sensor
products. Changes in the pricing of commodities directly affect our
results of operations and financial condition. We attempt to pass
increases in commodity costs to our customers, and we do not currently hedge
such commodity price exposures.
Credit
Risk: Financial instruments that potentially subject the Company to
significant concentrations of credit risk consist of cash and temporary
investments, foreign currency forward contracts and trade accounts receivable.
The Company is exposed to credit losses in the event of nonperformance by
counter parties to its financial instruments. The Company places cash and
temporary investments with various high-quality financial institutions
throughout the world, and exposure is limited at any one institution. Although
the Company does not obtain collateral or other security to secure these
obligations, it does periodically monitor the third-party depository
institutions that hold our cash and cash equivalents. Our emphasis is primarily
on safety and liquidity of principal and secondarily on maximizing yield on
those funds. In addition, concentrations of credit risk arising from trade
accounts receivable are limited due to the diversity of the Company’s customers.
The Company performs ongoing credit evaluations of its customers’ financial
conditions and the Company does not obtain collateral, insurance or other
security. Notwithstanding these efforts, the current distress in the
global economy may increase the difficulty in collecting accounts
receivable.
Foreign
Currency Exchange Rate Risk: Foreign currency exchange rate risk
arises from the Company’s investments in subsidiaries owned and operated in
foreign countries, as well as from transactions with customers in countries
outside the United States. The effect of a change in currency exchange rates on
the Company’s net investment in international subsidiaries is reflected in the
“accumulated other comprehensive income” component of stockholders’ equity. A
10% appreciation in major currencies relative to the U.S. dollar at December 31,
2009 would result in a reduction of stockholders’ equity of approximately
$11,157 .
Although
the Company has a U.S. dollar functional currency for reporting purposes, it has
manufacturing sites throughout the world and a large portion of its sales are
generated in foreign currencies. A substantial portion of our revenues are
priced in U.S. dollars, and most of our costs and expenses are priced in U.S.
dollars, with the remaining priced in Chinese renminbi, Euros, Swiss francs and
Japanese yen. Sales by subsidiaries operating outside of the United States are
translated into U.S. dollars using exchange rates effective during the
respective period. As a result, the Company is exposed to movements in the
exchange rates of various currencies against the United States dollar.
Accordingly, the competitiveness of our products relative to products produced
locally (in foreign markets) may be affected by the performance of the U.S.
dollar compared with that of our foreign customers’ currencies. Refer to Item 1,
Business, Foreign Operations set forth in our Annual Report on Form 10-K for the
year ended March 31, 2009 for details concerning annual net sales invoiced from
our facilities within the U.S. and outside of the U.S. and as a percentage of
total net sales for the last three years, as well as net assets and the related
functional currencies. Therefore, both positive and negative
movements in currency exchange rates against the U.S. dollar will continue to
affect the reported amount of sales, profit, and assets and liabilities in the
Company’s consolidated financial statements.
33
The
renminbi did not appreciate during the first nine months of fiscal 2010, but
appreciated by 2.5% and 9.0% during 2009 and 2008, respectively. The Chinese
government no longer pegs the renminbi to the US dollar, but established a
currency policy letting the renminbi trade in a narrow band against a basket of
currencies. The Company has more expenses in renminbi than sales (i.e., short
renminbi position), and as such, when the U.S. dollar weakens relative to the
renminbi, our operating profits decrease. Based on our net exposure of renminbi
to U.S. dollars for the fiscal year ended March 31, 2009 and forecast
information for fiscal 2010, we estimate a negative operating income impact of
approximately $183 for every 1% appreciation in renminbi against the U.S. dollar
(assuming no price increases passed to customers, and no associated cost
increases or currency hedging). We continue to consider various alternatives to
hedge this exposure, and we are attempting to manage this exposure through,
among other things, forward purchase contracts, pricing and monitoring
balance sheet exposures for payables and receivables.
Fluctuations
in the value of the Hong Kong dollar have not been significant since October 17,
1983, when the Hong Kong government tied the value of the Hong Kong dollar to
that of the U.S. dollar. However, there can be no assurance that the value of
the Hong Kong dollar will continue to be tied to that of the U.S.
dollar.
The
Company’s French and Germany subsidiaries have more sales in Euro than expenses
in Euro and the Company’s Swiss subsidiary has more expenses in Swiss franc than
sales in Swiss francs, and as such, if the U.S. dollar weakens relative to the
Euro and Swiss franc, our operating profits increase in France and Germany but
decline in Switzerland. Based on the net exposures of Euros and Swiss francs to
the U.S. dollars for the fiscal year ended March 31, 2009, we estimate a
positive operating income impact of $55 in Euros and a positive income impact of
less than $1 for every 1% appreciation in the Euro and Swiss franc,
respectively, relative to the U.S. dollar (assuming no price increases passed to
customers, and associated cost increases or currency hedging).
The
Company has a number of foreign currency exchange contracts in Europe in an
attempt to hedge the Company’s exposure to the Euro. The Euro/U.S. dollar
currency contracts have gross notional amounts totaling $1,380 with exercise
dates through June 2010 at an average exchange rate of $1.47 (Euro to U.S.
dollar conversion rate). Since these derivatives are not designated
as hedges for accounting purposes, changes in their fair value are recorded in
results of operations, not in other comprehensive income.
To manage
our exposure to potential foreign currency transaction and translation risks, we
may purchase additional foreign currency exchange forward contracts, currency
options, or other derivative instruments, provided such instruments may be
obtained at suitable prices.
ITEM
4. CONTROLS AND PROCEDURES.
(a) Evaluation of Disclosure
Controls and Procedures
The
Company’s Chief Executive Officer and Chief Financial Officer with the
participation of management evaluated the effectiveness of our disclosure
controls and procedures as of December 31, 2009. The term “disclosure controls
and procedures,” as defined in Rules 13a-15(e) and 15d-15(e) under the
Securities Exchange Act of 1934, as amended (the “Exchange Act”), means controls
and other procedures of a company that are designed to ensure that information
required to be disclosed by the company in the reports that it files or submits
under the Exchange Act is recorded, processed, summarized and reported, within
the time periods specified in the SEC’s rules and forms. Disclosure controls and
procedures include, without limitation, controls and procedures designed to
ensure that information required to be disclosed by a company in the reports
that it files or submits under the Exchange Act is accumulated and communicated
to the company’s management, including its principal executive and principal
financial officers, as appropriate to allow timely decisions regarding required
disclosure. Management recognizes that any controls and procedures, no matter
how well designed and operated, can provide only reasonable assurance of
achieving their objectives and management necessarily applies its judgment in
evaluating the cost-benefit relationship of possible controls and procedures.
Based on the evaluation of our disclosure controls and procedures as of December
31, 2009, our Chief Executive Officer and Chief Financial Officer concluded
that, as of such date, our disclosure controls and procedures were
effective.
(b) Changes in Internal
Control Over Financial Reporting
During
the fiscal quarter ended December 31, 2009, management did not identify any
changes in the Company’s internal control over financial reporting that have
materially affected, or are reasonably likely to materially affect, the
Company’s internal control over financial reporting.
Management’s
evaluation of our controls and procedures as of December 31, 2009 excluded the
evaluation of internal controls for the Company’s joint venture in Japan,
Nikisso-THERM (“NT”), and the Company’s recent acquisitions of RIT SARL
(“Atexis”) and FGP Instrumentation, GS Sensors and ALS (collectively “FGP”)
during 2009. NT is an entity consolidated pursuant to accounting
rules for consolidation of variable interest entities. The Company does not have
the ability to dictate or modify the controls of NT, and the Company does not
have the ability, in practice, to assess those controls. Management expects to
implement the Company’s internal controls over financial reporting for Atexis
and FGP within one year from the acquisition date.
34
PART
II. OTHER INFORMATION
ITEM
1. LEGAL PROCEEDINGS
Pending
Matters: From time to time, the Company is subject to legal
proceedings and claims in the ordinary course of business. The Company currently
is not aware of any legal proceedings or claims that the Company believes will
have, individually or in the aggregate, a material adverse effect on the
Company’s business, financial condition, or operating results.
ITEM
1A. RISK FACTORS
While we
attempt to identify, manage and mitigate risks and uncertainties associated with
our business to the extent practical under the circumstances, some level of risk
and uncertainty will always be present. Item 1A of our Annual Report
on Form 10-K for the year ended March 31, 2009 describes some of the risks and
uncertainties associated with our business. These risks and
uncertainties have the potential to materially affect our results of operations
and our financial condition. We do not believe that there have been
any material changes to the risk factors previously disclosed in our Annual
report on Form 10-K for the year ended March 31, 2009.
ITEM
6. EXHIBITS
See
Exhibit Index.
35
SIGNATURES
Pursuant
to the requirements of the Securities Exchange Act of 1934, the registrant has
duly caused this report to be signed on its behalf by the undersigned thereunto
duly authorized.
|
Measurement
Specialties, Inc.
(Registrant)
|
||
|
Date: February
3, 2010
|
By:
|
/s/
Frank D. Guidone
|
|
Frank
D. Guidone
President,
Chief Executive Officer
(Principal
Executive Officer)
|
||
|
Date: February
3, 2010
|
By:
|
/s/
Mark Thomson
|
|
Mark
Thomson
Chief
Financial Officer
(Principal
Financial
Officer)
|
||
36
EXHIBIT
INDEX
|
EXHIBIT
NUMBER
|
DESCRIPTION
|
|
|
31.1
|
Certification
of Frank D. Guidone required by Rule 13a-14(a) or Rule
15d-14(a)
|
|
|
31.2
|
Certification
of Mark Thomson required by Rule 13a-14(a) or Rule
15d-14(a)
|
|
|
32.1
|
Certification
of Frank D. Guidone and Mark Thomson required by Rule 13a-14(b) or Rule
15d-14(b) and Section 906 of the Sarbanes-Oxley Act of 2002, 18 U.S.C.
Section 1350
|
37