Attached files
| file | filename |
|---|---|
| 8-K - FORM 8-K - JONES LANG LASALLE INC | d8k.htm |
| EX-99.1 - PRESS RELEASE - JONES LANG LASALLE INC | dex991.htm |
EXHIBIT 99.2
Exhibit 99.2
Supplemental Information Fourth Quarter 2009 Earnings Call

Market & Financial Overview
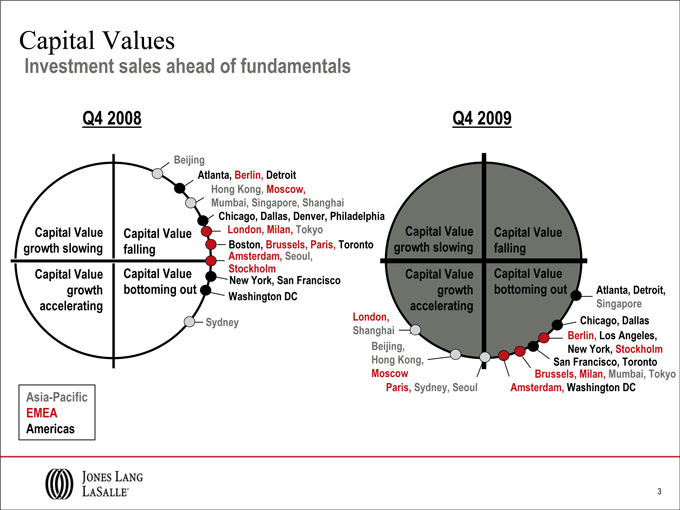
Capital Values
Investment sales ahead of fundamentals
Q4 2008
Beijing
Atlanta, Berlin, Detroit Hong Kong, Moscow, Mumbai, Singapore, Shanghai
Chicago, Dallas, Denver, Philadelphia
London, Milan, Tokyo
Boston, Brussels, Paris, Toronto Amsterdam, Seoul, Stockholm New York, San Francisco Washington DC
Sydney
Capital Value growth slowing
Capital Value growth accelerating
Capital Value falling Capital Value bottoming out
Asia-Pacific EMEA Americas
Q4 2009
Capital Value growth slowing Capital Value growth accelerating
Capital Value falling Capital Value bottoming out
London, Shanghai Beijing, Hong Kong, Moscow
Paris, Sydney, Seoul
Atlanta, Detroit, Singapore Chicago, Dallas Berlin, Los Angeles, New York, Stockholm
San Francisco, Toronto Brussels, Milan, Mumbai, Tokyo Amsterdam, Washington DC
3
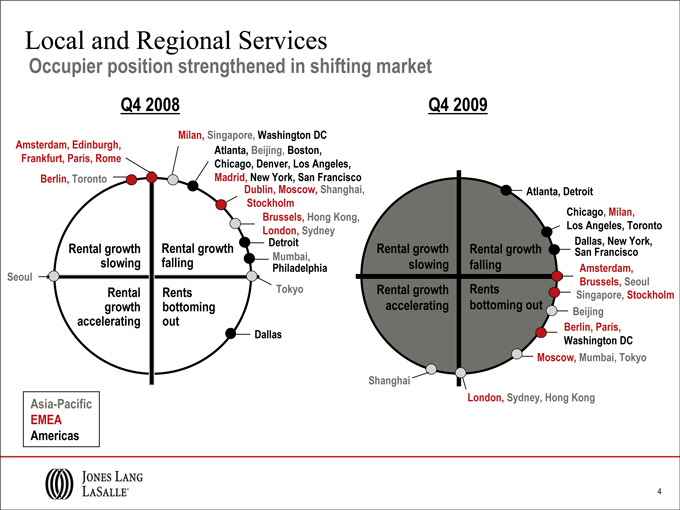
Local and Regional Services
Occupier position strengthened in shifting market
Q4 2008
Amsterdam, Edinburgh, Frankfurt, Paris, Rome Berlin, Toronto
Milan, Singapore, Washington DC Atlanta, Beijing, Boston, Chicago, Denver, Los Angeles, Madrid, New York, San Francisco Dublin, Moscow, Shanghai,
Stockholm
Brussels, Hong Kong, London, Sydney Detroit Mumbai, Philadelphia Tokyo
Dallas
Seoul
Rental growth slowing
Rental growth accelerating
Rental growth falling
Rents bottoming out
Asia-Pacific EMEA Americas
Q4 2009
Rental growth slowing Rental growth accelerating
Rental growth falling Rents bottoming out
Atlanta, Detroit
Chicago, Milan, Los Angeles, Toronto
Dallas, San Francisco New York, Amsterdam, Brussels, Seoul Singapore, Stockholm Beijing
Berlin, Paris, Washington DC
Moscow, Mumbai, Tokyo
London, Sydney, Hong Kong
Shanghai
4
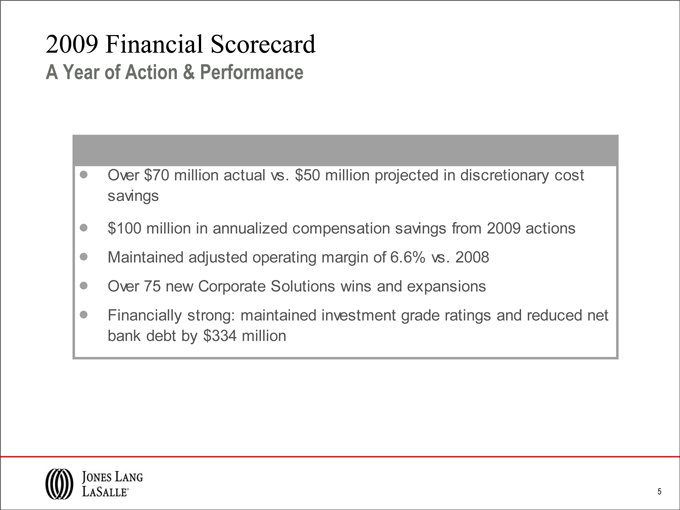
2009 Financial Scorecard
A Year of Action & Performance
Over $70 million actual vs. $50 million projected in discretionary cost savings
$100 million in annualized compensation savings from 2009 actions
Maintained adjusted operating margin of 6.6% vs. 2008
Over 75 new Corporate Solutions wins and expansions
Financially strong: maintained investment grade ratings and reduced net bank debt by $334 million
5
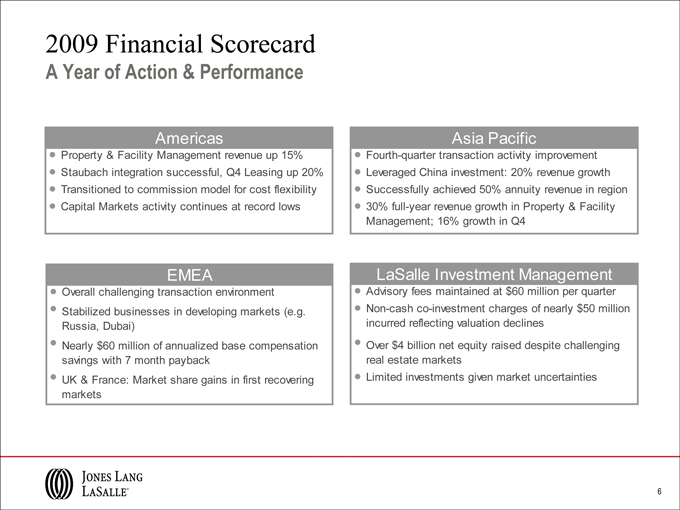
2009 Financial Scorecard
A Year of Action & Performance
Americas
Property & Facility Management revenue up 15%
Staubach integration successful, Q4 Leasing up 20%
Transitioned to commission model for cost flexibility
Capital Markets activity continues at record lows
EMEA
Overall challenging transaction environment
Stabilized businesses in developing markets (e.g. Russia, Dubai)
Nearly $60 million of annualized base compensation savings with 7 month payback
UK & France: Market share gains in first recovering markets
Asia Pacific
Fourth-quarter transaction activity improvement
Leveraged China investment: 20% revenue growth
Successfully achieved 50% annuity revenue in region
30% full-year revenue growth in Property & Facility Management; 16% growth in Q4
LaSalle Investment Management
Advisory fees maintained at $60 million per quarter
Non-cash co-investment charges of nearly $50 million incurred reflecting valuation declines
Over $4 billion net equity raised despite challenging real estate markets
Limited investments given market uncertainties
6
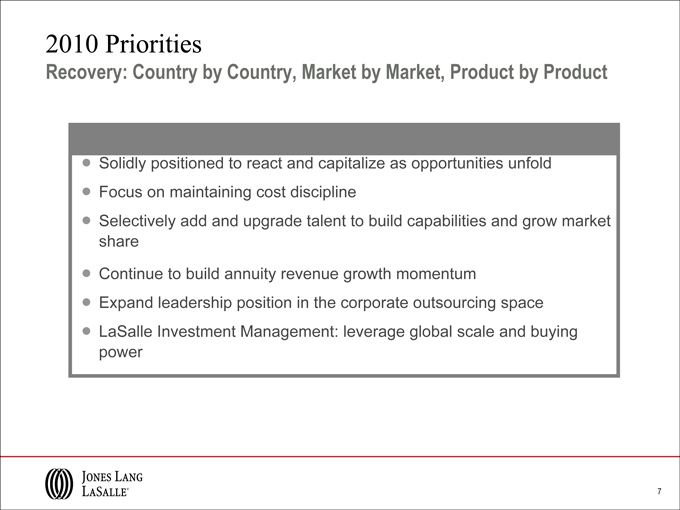
2010 Priorities
Recovery: Country by Country, Market by Market, Product by Product
Solidly positioned to react and capitalize as opportunities unfold
Focus on maintaining cost discipline
Selectively add and upgrade talent to build capabilities and grow market share
Continue to build annuity revenue growth momentum
Expand leadership position in the corporate outsourcing space
LaSalle Investment Management: leverage global scale and buying power
7
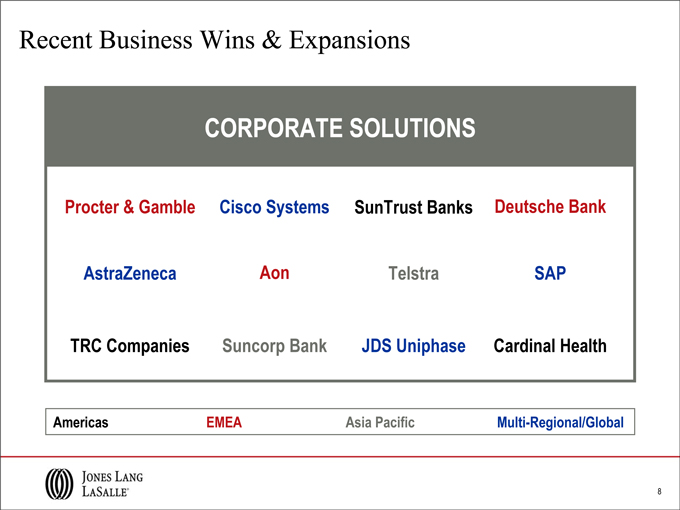
Recent Business Wins & Expansions
CORPORATE SOLUTIONS
Procter & Gamble
Cisco Systems
SunTrust Banks
Deutsche Bank
AstraZeneca Aon Telstra SAP TRC Companies Suncorp Bank JDS Uniphase Cardinal Health
Americas EMEA Asia Pacific Multi-Regional/Global
8
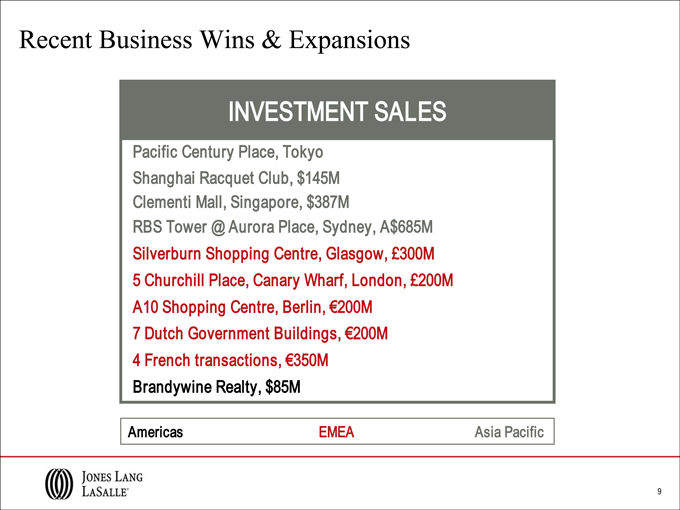
Recent Business Wins & Expansions
INVESTMENT SALES
Pacific Century Place, Tokyo Shanghai Racquet Club, $145M Clementi Mall, Singapore, $387M
RBS Tower @ Aurora Place, Sydney, $ 685M Silverburn Shopping Centre, Glasgow, £300M
5 Churchill Place, Canary Wharf, London, £200M
A10 Shopping Centre, Berlin, €200M
7 Dutch Government Buildings, €200M
4 French transactions, €350M
Brandywine Realty, $85M
Americas EMEA Asia Pacific
9
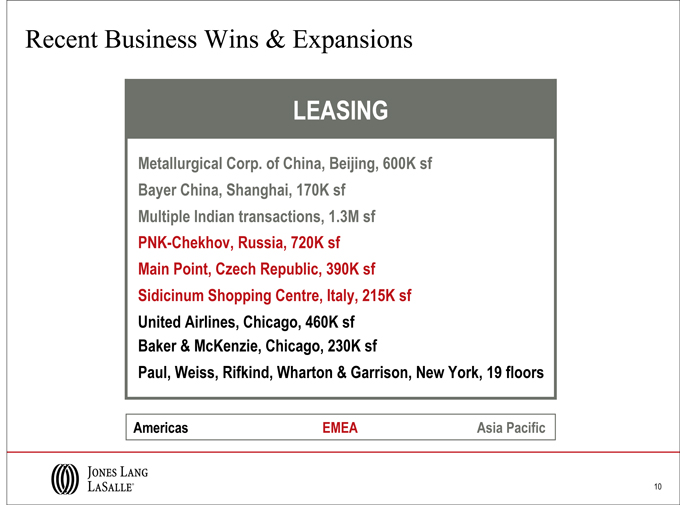
Recent Business Wins & Expansions
LEASING
Metallurgical Corp. of China, Beijing, 600K sf Bayer China, Shanghai, 170K sf Multiple Indian transactions, 1.3M sf PNK-Chekhov, Russia, 720K sf Main Point, Czech Republic, 390K sf Sidicinum Shopping Centre, Italy, 215K sf United Airlines, Chicago, 460K sf Baker & McKenzie, Chicago, 230K sf
Paul, Weiss, Rifkind, Wharton & Garrison, New York, 19 floors
Americas EMEA Asia Pacific
10
Fourth Quarter Financial Information
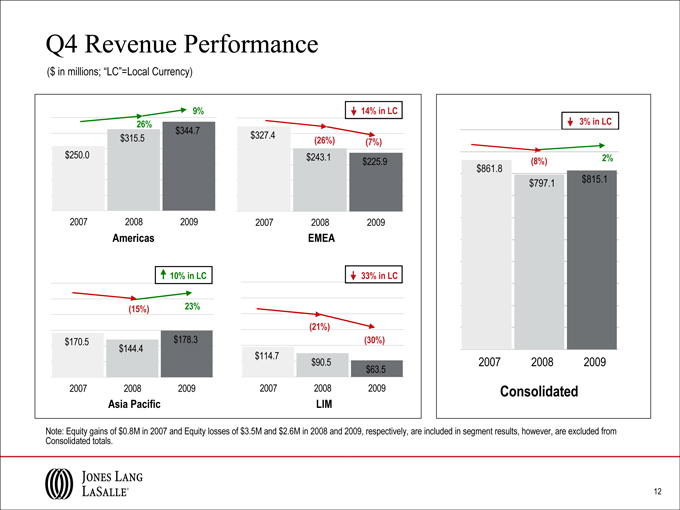
Q4 Revenue Performance
($ in millions; “LC”=Local Currency)
9% 14% in LC
26% $344.7
$315.5 $327.4(26%)(7%)
$250.0 $243.1 $225.9
2007 2008 2009 2007 2008 2009
Americas EMEA
10% in LC 33% in LC
(15%) 23%
(21%)
$170.5 $178.3(30%)
$144.4
$114.7 $90.5
$63.5
2007 2008 2009 2007 2008 2009
Asia Pacific LIM
3% in LC
(8%) 2%
$861.8
$797.1 $815.1
2007 2008 2009
Consolidated
Note: Equity gains of $0.8M in 2007 and Equity losses of $3.5M and $2.6M in 2008 and 2009, respectively, are included in segment results, however, are excluded from Consolidated totals.
12
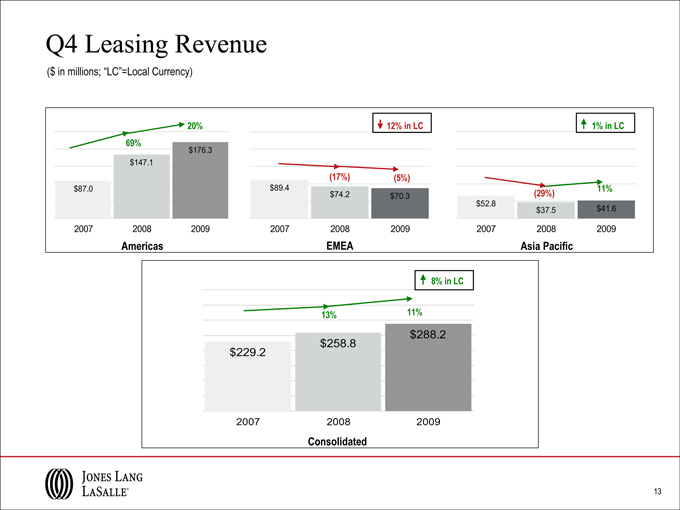
Q4 Leasing Revenue
($ in millions; “LC”=Local Currency)
20% 12% in LC 1% in LC
69%
$176.3
$147.1
(17%)(5%)
$87.0 $89.4 11%
$74.2 $70.3(29%)
$52.8 $37.5 $41.6
2007 2008 2009 2007 2008 2009 2007 2008 2009
Americas EMEA Asia Pacific
8% in LC
13% 11%
$288.2
$258.8
$229.2
2007 2008 2009
Consolidated
13
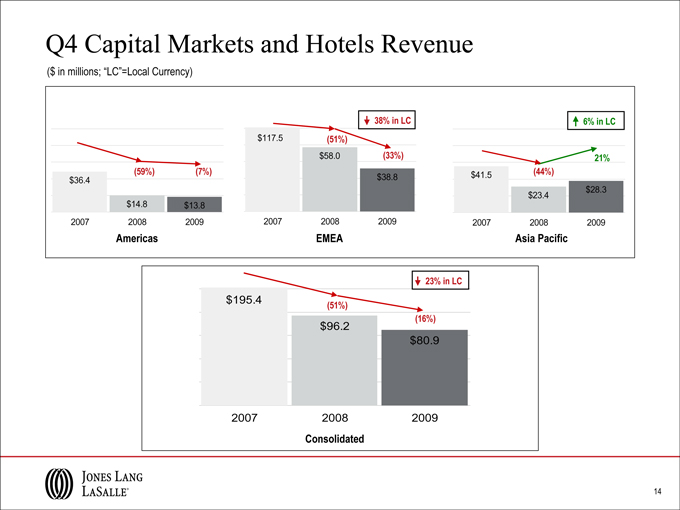
Q4 Capital Markets and Hotels Revenue
($ in millions; “LC”=Local Currency)
38% in LC 6% in LC
$117.5(51%)
$58.0(33%) 21%
(59%)(7%) $38.8 $41.5(44%)
$36.4
$23.4 $28.3
$14.8 $13.8
2007 2008 2009 2007 2008 2009 2007 2008 2009
Americas EMEA Asia Pacific
23% in LC
$195.4(51%)
(16%)
$96.2
$80.9
2007 2008 2009
Consolidated
14
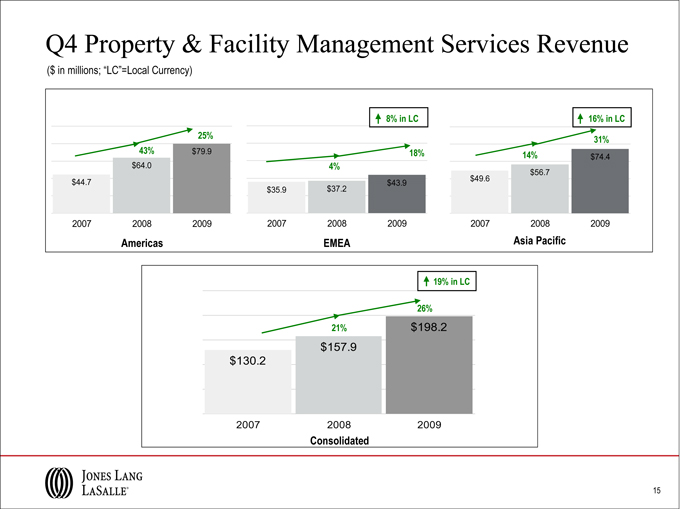
Q4 Property & Facility Management Services Revenue
($ in millions; “LC”=Local Currency)
8% in LC 16% in LC
25% 31%
43% $79.9 18% 14% $74.4
$64.0 4% $56.7
$44.7 $43.9 $49.6
$35.9 $37.2
2007 2008 2009 2007 2008 2009 2007 2008 2009
Americas EMEA Asia Pacific
19% in LC
26%
21% $198.2
$157.9
$130.2
2007 2008 2009
Consolidated
15
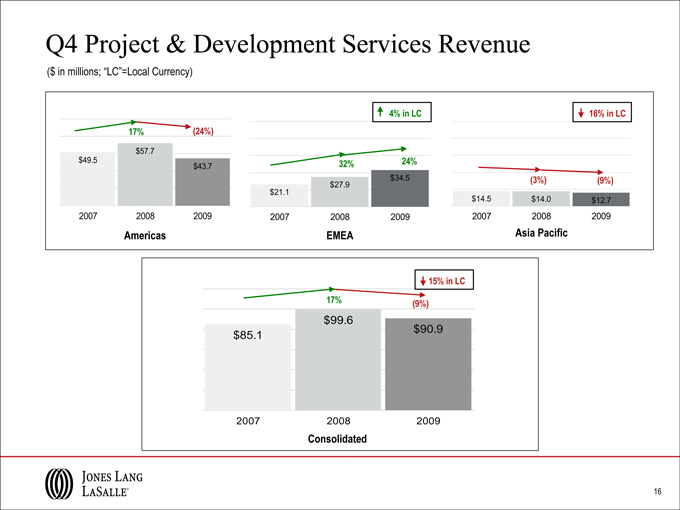
Q4 Project & Development Services Revenue
($ in millions; “LC”=Local Currency)
4% in LC 16% in LC
17%(24%)
$57.7
$49.5 $43.7 32% 24%
$27.9 $34.5(3%)(9%)
$21.1
$14.5 $14.0 $12.7
2007 2008 2009 2007 2008 2009 2007 2008 2009
Americas EMEA Asia Pacific
15% in LC
17%(9%)
$99.6
$85.1 $90.9
2007 2008 2009
Consolidated
16
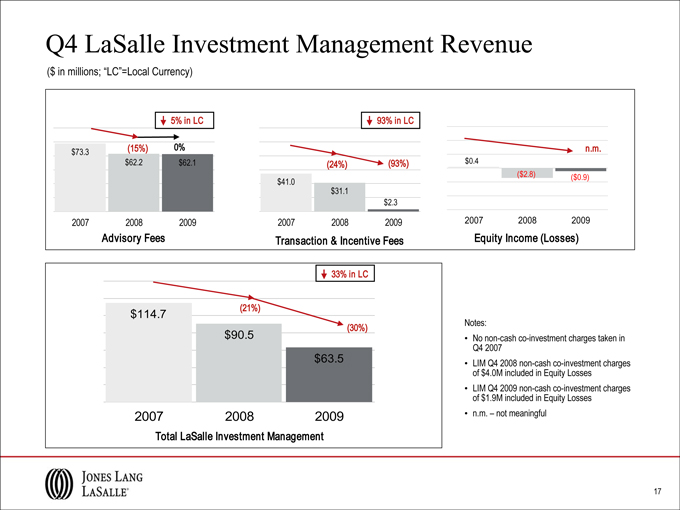
Q4 LaSalle Investment Management Revenue
($ in millions; “LC”=Local Currency)
5% in LC
(15%) 0%
$73.3
$62.2 $62.1
2007 2008 2009
Advisory Fees
93% in LC
(24%)(93%)
$41.0
$31.1
$2.3
2007 2008 2009
Transaction & Incentive Fees
n.m.
$0.4
($2.8)($0.9)
2007 2008 2009
Equity Losses
33% in LC
$114.7(21%)
$90.5(30%)
$63.5
2007 2008 2009
Total LaSalle Investment Management
Notes:
No non-cash co-investment charges taken in Q4 2007
LIM Q4 2008 non-cash co-investment charges of $4.0M included in Equity Income (Losses)
LIM Q4 2009 non-cash co-investment charges of $1.9M included in Equity Losses • n.m. – not meaningful
17

Full Year Financial Information
18
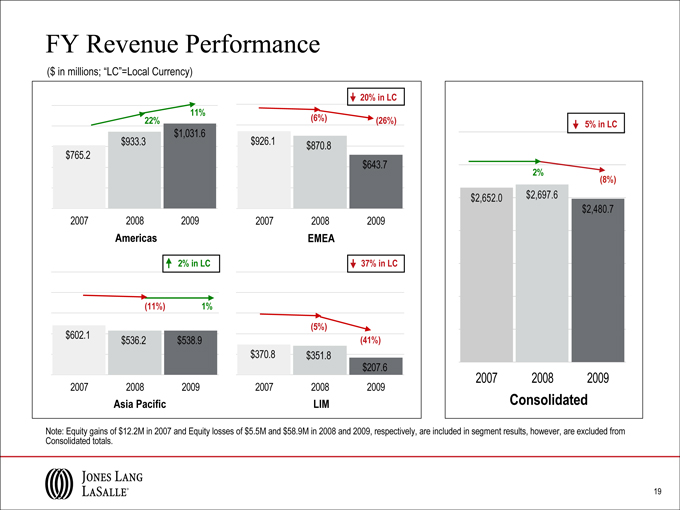
FY Revenue Performance
($ in millions; “LC”=Local Currency)
20% in LC
11%
22%(6%)(26%)
$1,031.6
$933.3 $926.1 $870.8
$765.2
$643.7
2007 2008 2009 2007 2008 2009
Americas EMEA
2% in LC 37% in LC
(11%) 1%
(5%)
$602.1 $536.2 $538.9(41%)
$370.8 $351.8
$207.6
2007 2008 2009 2007 2008 2009
Asia Pacific LIM
5% in LC
2%
(8%)
$2,652.0 $2,697.6
$2,480.7
2007 2008 2009
Consolidated
Note: Equity gains of $12.2M in 2007 and Equity losses of $5.5M and $58.9M in 2008 and 2009, respectively, are included in segment results, however, are excluded from Consolidated totals.
19
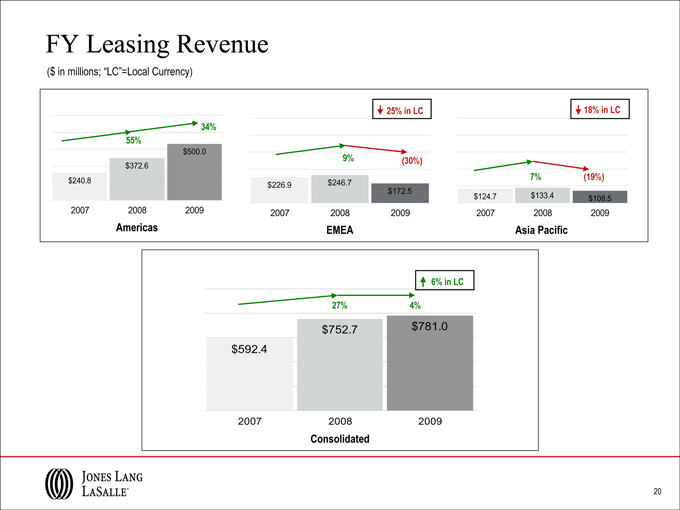
FY Leasing Revenue
($ in millions; “LC”=Local Currency)
25% in LC 18% in LC
34%
55%
$500.0
$372.6 9%(30%)
$240.8 $246.7 7%(19%)
$226.9
$172.5 $124.7 $133.4 $108.5
2007 2008 2009 2007 2008 2009 2007 2008 2009
Americas EMEA Asia Pacific
6% in LC
27% 4%
$752.7 $781.0
$592.4
2007 2008 2009
Consolidated
20
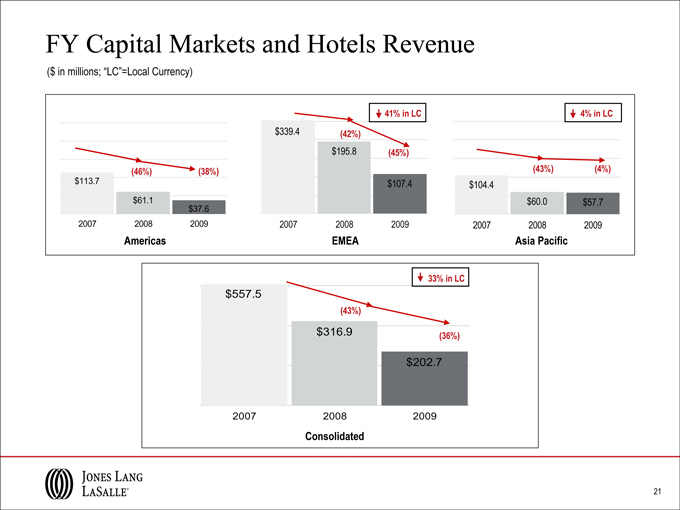
FY Capital Markets and Hotels Revenue
($ in millions; “LC”=Local Currency)
41% in LC 4% in LC
$339.4(42%)
$195.8(45%)
(46%)(38%)(43%)(4%)
| $113.7 |
|
$107.4 $104.4 |
| $61.1 |
|
$60.0 $57.7 |
$37.6
2007 2008 2009 2007 2008 2009 2007 2008 2009
Americas EMEA Asia Pacific
33% in LC
$557.5
(43%)
$316.9(36%)
$202.7
2007 2008 2009
Consolidated
21
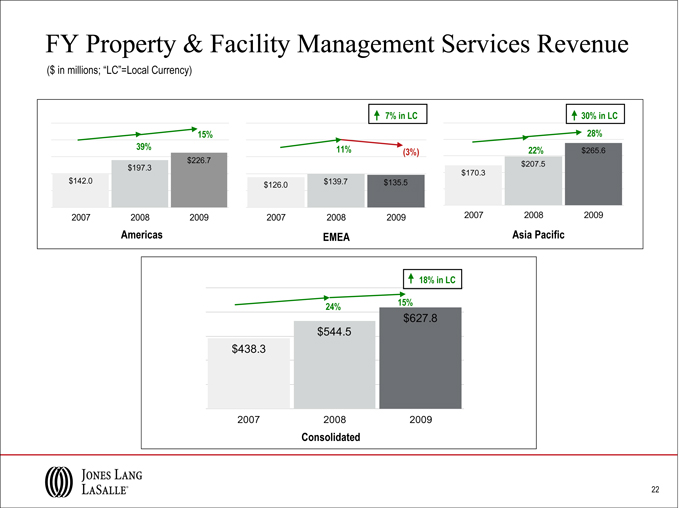
FY Property & Facility Management Services Revenue
($ in millions; “LC”=Local Currency)
7% in LC 30% in LC
15% 28%
39% 11%(3%) 22% $265.6
$226.7 $207.5
$197.3 $170.3
$142.0 $126.0 $139.7 $135.5
2007 2008 2009 2007 2008 2009 2007 2008 2009
Americas EMEA Asia Pacific
18% in LC
24%
15%
$627.8
$544.5
$438.3
2007 2008 2009
Consolidated
22
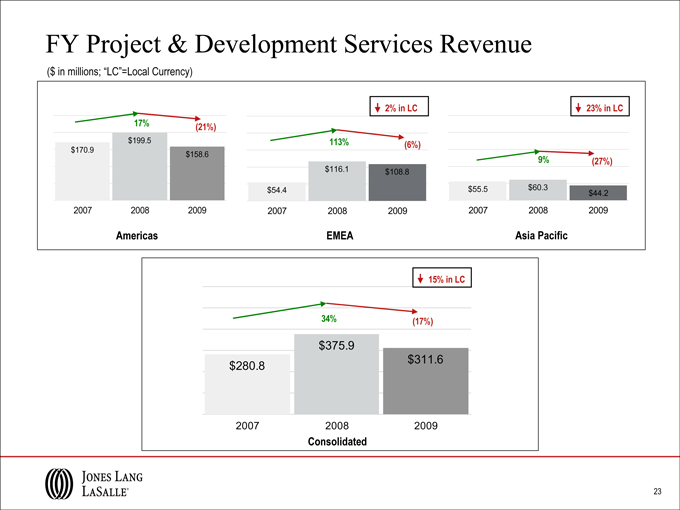
FY Project & Development Services Revenue
($ in millions; “LC”=Local Currency)
2% in LC 23% in LC
17%(21%)
$199.5 113%(6%)
$170.9 $158.6
9%(27%)
$116.1 $108.8
$54.4 $55.5 $60.3 $44.2
2007 2008 2009 2007 2008 2009 2007 2008 2009
Americas EMEA Asia Pacific
15% in LC
34%(17%)
$375.9
$280.8 $311.6
2007 2008 2009
Consolidated
23
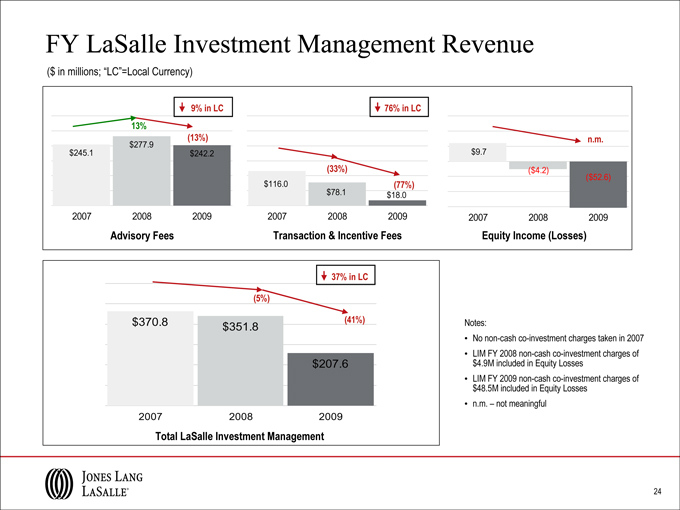
FY LaSalle Investment Management Revenue
($ in millions; “LC”=Local Currency)
9% in LC 76% in LC
13%
$277.9(13%) n.m.
$245.1 $242.2 $9.7
(33%)($4.2)
($52.6)
$116.0(77%)
$78.1 $18.0
2007 2008 2009 2007 2008 2009 2007 2008 2009
Advisory Fees Transaction & Incentive Fees Equity Losses
37% in LC
(5%)
$370.8 $351.8(41%)
$207.6
2007 2008 2009
Total LaSalle Investment Management
Notes:
No non-cash co-investment Impairment charges taken in 2007
LIM FY 2008 non-cash co-investment charges of $4.9M included in Equity Income (Losses)
LIM FY 2009 non-cash co-investment charges of $48.5M included in Equity Losses • n.m. – not meaningful
24
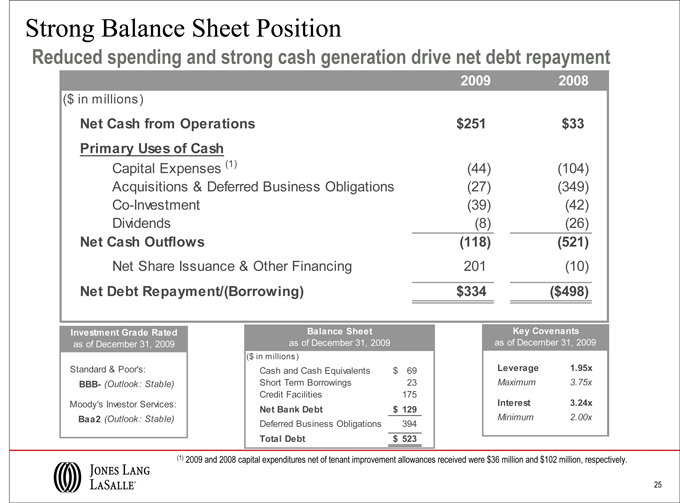
Strong Balance Sheet Position
Reduced spending and strong cash generation drive net debt repayment
2009 2008
($ in millions)
Net Cash from Operations $251 $33
Primary Uses of Cash
Capital Expenses (1) (44) (104)
Acquisitions & Deferred Business Obligations (27) (349)
Co-Investment (39) (42)
Dividends (8) (26)
Net Cash Outflows (118) (521)
Net Share Issuance & Other Financing 201 (10)
Net Debt Repayment/(Borrowing) $334 ($498)
Standard & Poor’s: Investment Grade Rated as of December 31, 2009
BBB- (Outlook: Stable)
Moody’s Investor Services:
Baa2 (Outlook: Stable)
Balance Sheet as of December 31, 2009
($ in millions)
Cash and Cash Equivalents $ 69
Short Term Borrowings 23
Credit Facilities 175
Net Bank Debt $ 129
Deferred Business Obligations 394
Total Debt $ 523
Key Covenants as of December 31, 2009
Leverage 1.95x
Maximum 3.75x
Interest 3.24x
Minimum 2.00x
(1) 2009 and 2008 capital expenditures net of tenant improvement allowances received were $36 million and $102 million, respectively.
25

Appendix
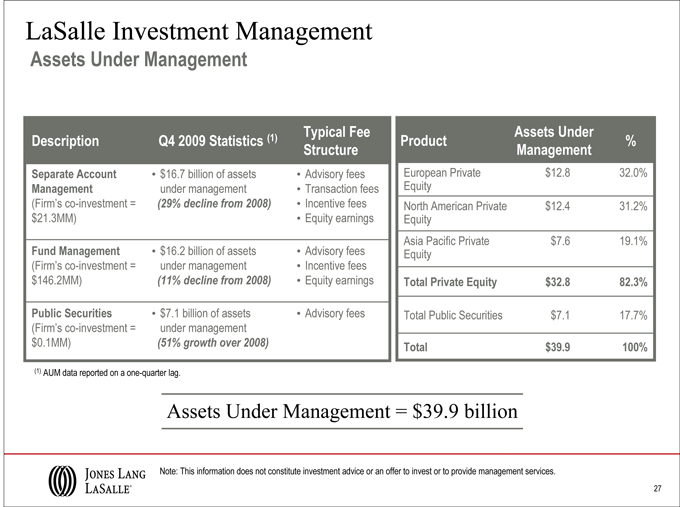
LaSalle Investment Management
Assets Under Management
Description Q4 2009 Statistics (1) Typical Fee
Structure
Separate Account • $16.7 billion of assets • Advisory fees
Management under management • Transaction fees
(Firm’s co-investment =(29% decline from 2008) • Incentive fees
$21.3MM) • Equity earnings
Fund Management • $16.2 billion of assets • Advisory fees
(Firm’s co-investment = under management • Incentive fees
$146.2MM)(11% decline from 2008) • Equity earnings
Public Securities • $7.1 billion of assets • Advisory fees
(Firm’s co-investment = under management
$0.1MM)(51% growth over 2008)
Assets Under
Product%
Management
European Private $12.8 32.0%
Equity
North American Private $12.4 31.2%
Equity
Asia Pacific Private $7.6 19.1%
Equity
Total Private Equity $32.8 82.3%
Total Public Securities $7.1 17.7%
Total $39.9 100%
(1) AUM data reported on a one-quarter lag.
Assets Under Management = $39.9 billion
Note: This information does not constitute investment advice or an offer to invest or to provide management services.
27
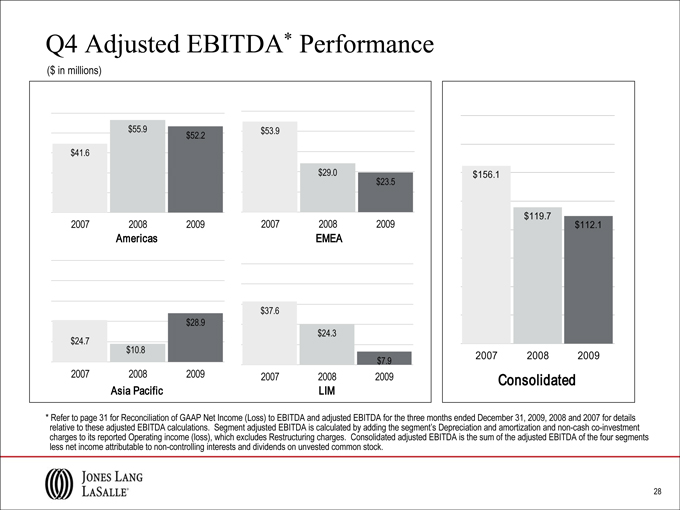
Q4 Adjusted EBITDA* Performance
($ in millions)
$55.9 $53.9
$52.2
$41.6
$29.0
$23.5
2007 2008 2009 2007 2008 2009
Americas EMEA
$37.6
$28.9
$24.3
$24.7
$10.8
$7.9
2007 2008 2009 2007 2008 2009
Asia Pacific LIM
$156.1
$119.7
$112.1
2007 2008 2009
Consolidated
* Refer to page 31 for Reconciliation of GAAP Net Income (Loss) to EBITDA and adjusted EBITDA for the three months ended December 31, 2009, 2008 and 2007 for details relative to these adjusted EBITDA calculations. Segment adjusted EBITDA is calculated by adding the segment’s Depreciation and amortization and non-cash co-investment charges to its reported Operating income (loss), which excludes Restructuring charges. Consolidated adjusted EBITDA is the sum of the adjusted EBITDA of the four segments less net income attributable to non-controlling interests and dividends on unvested common stock.
28
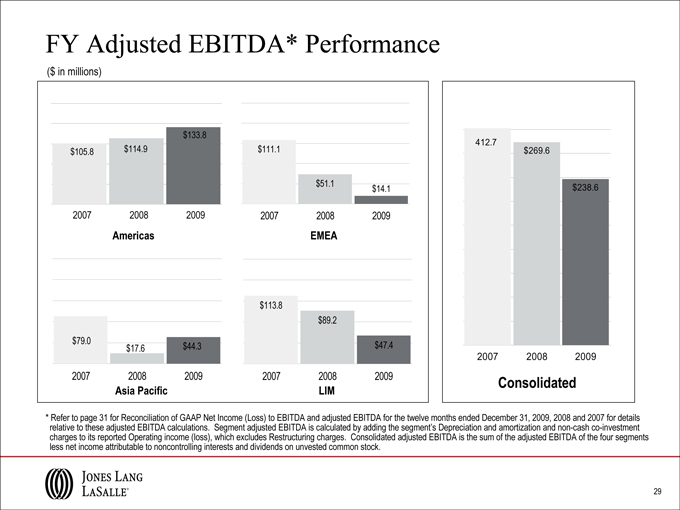
FY Adjusted EBITDA* Performance
($ in millions)
$133.8
$105.8 $114.9 $111.1
$51.1 $14.1
2007 2008 2009 2007 2008 2009
Americas EMEA
$113.8
$89.2
$79.0 $17.6 $44.3 $47.4
2007 2008 2009 2007 2008 2009
Asia Pacific LIM
412.7
$269.6
$238.6
2007 2008 2009
Consolidated
* Refer to page 31 for Reconciliation of GAAP Net Income (Loss) to EBITDA and adjusted EBITDA for the twelve months ended December 31, 2009, 2008 and 2007 for details relative to these adjusted EBITDA calculations. Segment adjusted EBITDA is calculated by adding the segment’s Depreciation and amortization and non-cash co-investment charges to its reported Operating income (loss), which excludes Restructuring charges. Consolidated adjusted EBITDA is the sum of the adjusted EBITDA of the four segments less net income attributable to noncontrolling interests and dividends on unvested common stock.
29
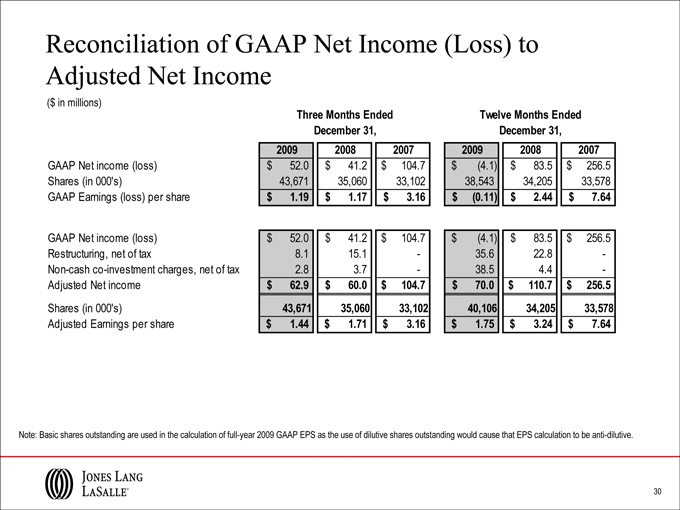
Reconciliation of GAAP Net Income (Loss) to Adjusted Net Income
($ in millions)
Three Months Ended Twelve Months Ended
December 31, December 31,
2009 2008 2007 2009 2008 2007
GAAP Net income (loss) $ 52.0 $ 41.2 $ 104.7 $(4.1) $ 83.5 $ 256.5
Shares (in 000’s) 43,671 35,060 33,102 38,543 34,205 33,578
GAAP Earnings (loss) per share $ 1.19 $ 1.17 $ 3.16 $(0.11) $ 2.44 $ 7.64
GAAP Net income (loss) $ 52.0 $ 41.2 $ 104.7 $(4.1) $ 83.5 $ 256.5
Restructuring, net of tax 8.1 15.1—35.6 22.8 -
Non-cash co-investment charges, net of tax 2.8 3.7—38.5 4.4 -
Adjusted Net income $ 62.9 $ 60.0 $ 104.7 $ 70.0 $ 110.7 $ 256.5
Shares (in 000’s) 43,671 35,060 33,102 40,106 34,205 33,578
Adjusted Earnings per share $ 1.44 $ 1.71 $ 3.16 $ 1.75 $ 3.24 $ 7.64
Note: Basic shares outstanding are used in the calculation of full-year 2009 GAAP EPS as the use of dilutive shares outstanding would cause that EPS calculation to be anti-dilutive.
30
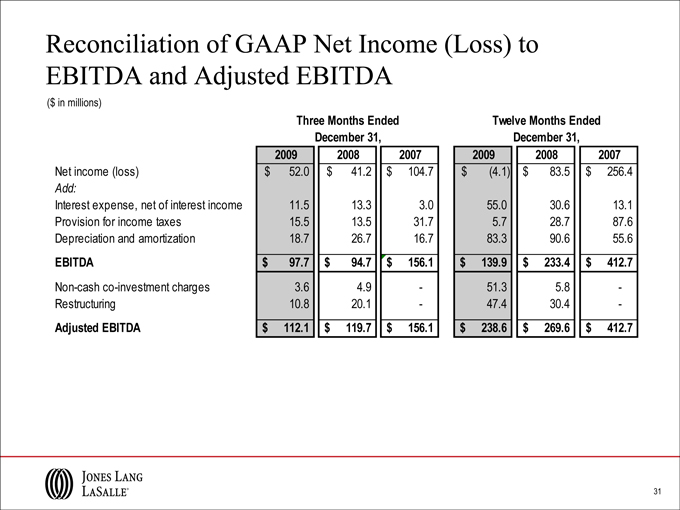
Reconciliation of GAAP Net Income (Loss) to EBITDA and Adjusted EBITDA
($ in millions)
Three Months Ended Twelve Months Ended
December 31, December 31,
2009 2008 2007 2009 2008 2007
Net income (loss) $ 52.0 $ 41.2 $ 104.7 $(4.1) $ 83.5 $ 256.4
Add:
Interest expense, net of interest income 11.5 13.3 3.0 55.0 30.6 13.1
Provision for income taxes 15.5 13.5 31.7 5.7 28.7 87.6
Depreciation and amortization 18.7 26.7 16.7 83.3 90.6 55.6
EBITDA $ 97.7 $ 94.7 $ 156.1 $ 139.9 $ 233.4 $ 412.7
Non-cash co-investment charges 3.6 4.9—51.3 5.8 -
Restructuring 10.8 20.1—47.4 30.4 -
Adjusted EBITDA $ 112.1 $ 119.7 $ 156.1 $ 238.6 $ 269.6 $ 412.7
31