Attached files
| file | filename |
|---|---|
| 8-K - BOK FINANCIAL 8-K 2-2-2010 - BOK FINANCIAL CORP | form8k.htm |

© 2009
BOK Financial Corporation.
Morgan
Stanley Financial Services Conference
February
2 - 3, 2010

© 2009
BOK Financial Corporation.
12/31/08 12/31/09 Change*
BOK
Financial ($
in thousands)
Strategy Produced Strong Results Despite The Recession
Strategy Produced Strong Results Despite The Recession
2
• Annualized
where appropriate
• Market cap as
of 1/26/10

© 2009
BOK Financial Corporation.
Consistent
Strategies
Proven to Deliver Solid Results
Proven to Deliver Solid Results
ü Utilize a decision
making framework based on long-term economic benefit
ü Develop long-term
relationships with commercial customers
ü Deliver diverse
fee-based services in a personalized responsive manner
ü Originate quality
loans while maintaining a consistent mix in the portfolio
ü Build the franchise
through deliberate branching and disciplined acquisition
strategies
strategies
ü Prudently manage
risk and control expenses in relation to revenue growth
ü Actively pursue
talent acquisition
3
© 2009
BOK Financial Corporation.
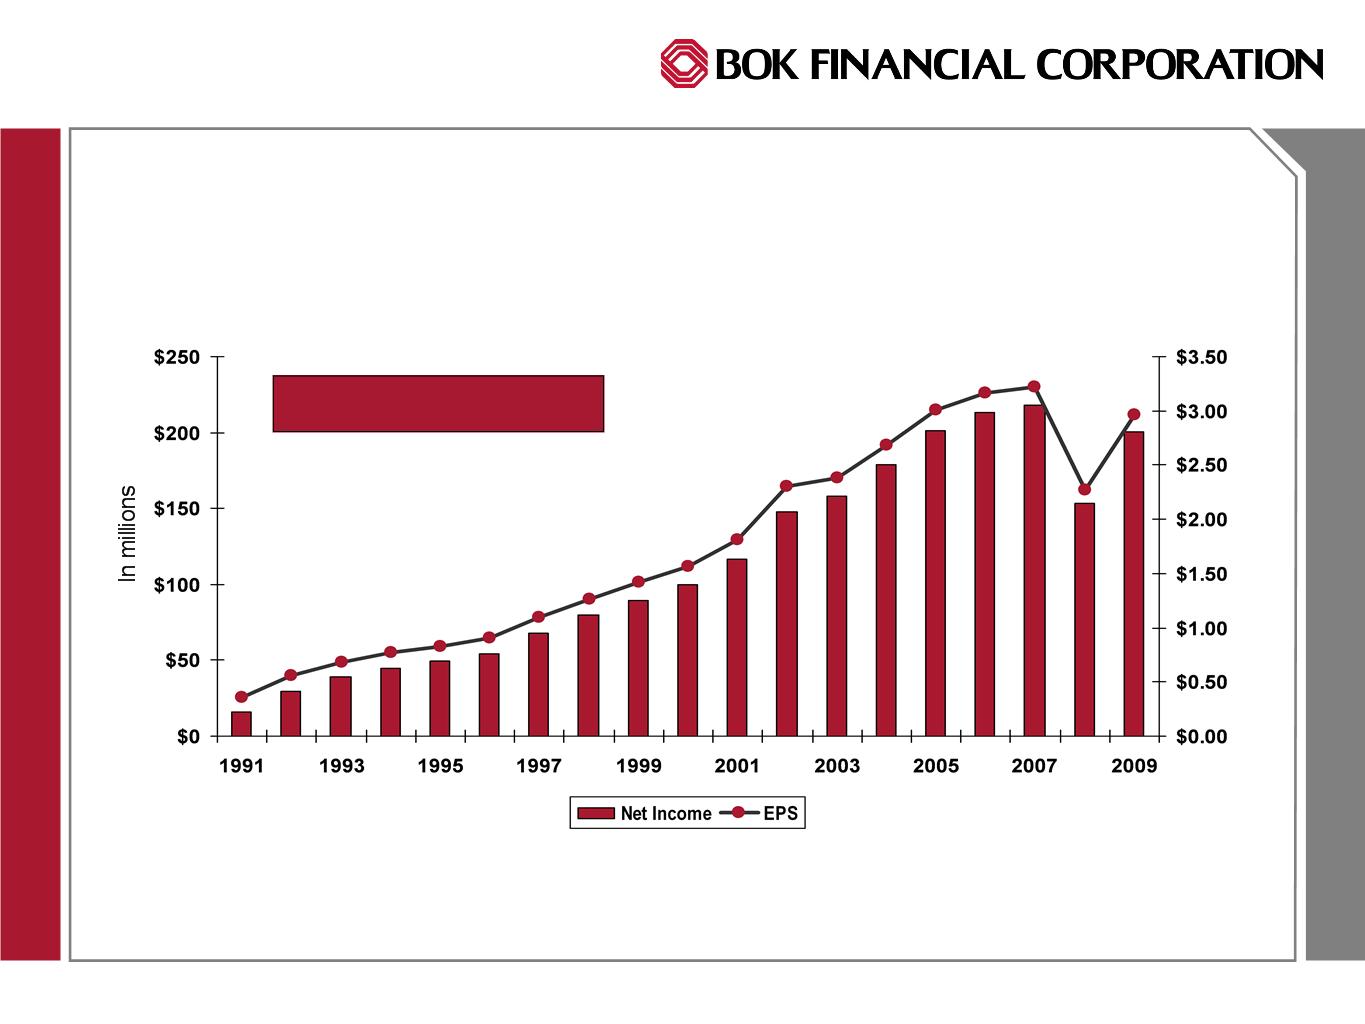
Earnings
History
Profitable Through All Cycles
Profitable Through All Cycles
Source: SNL
Financial
EPS
have been restated for stock dividends and for a 2-for-1 split
EPS
CAGR 12%
4
© 2009
BOK Financial Corporation.
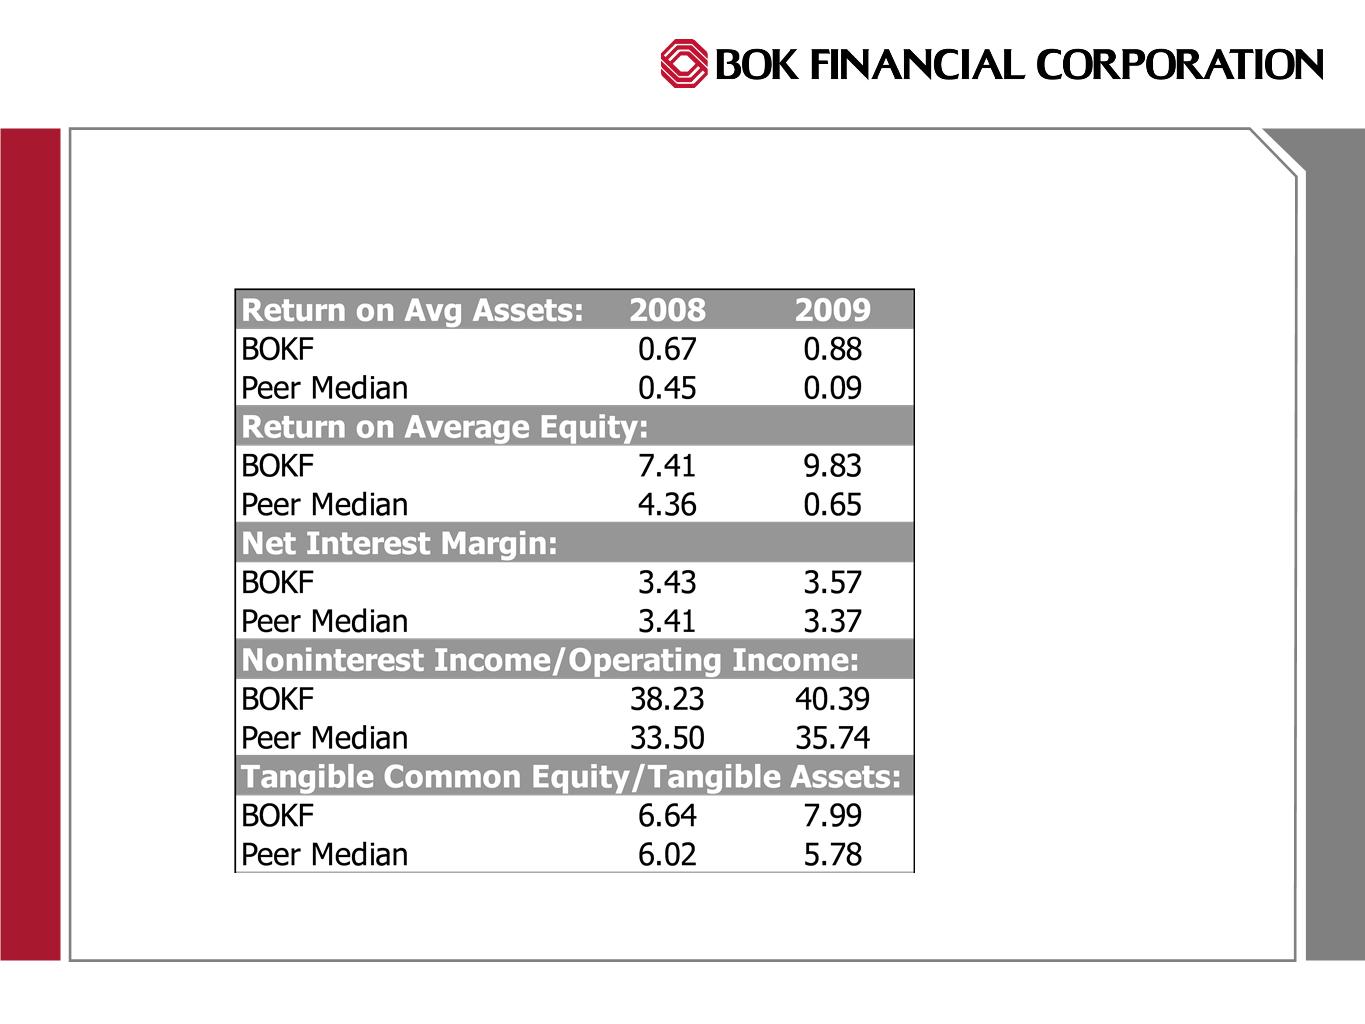
Peer
Analysis
A Standout Among Peers
A Standout Among Peers
5
Note: Peers
are defined as 20 US publicly traded banks, 10 immediately larger and 10
immediately smaller as
measured by total assets at 12/31/09. Two peers had not reported when this presentation was prepared.
measured by total assets at 12/31/09. Two peers had not reported when this presentation was prepared.

© 2009
BOK Financial Corporation.
2009
Results
6
© 2009
BOK Financial Corporation.
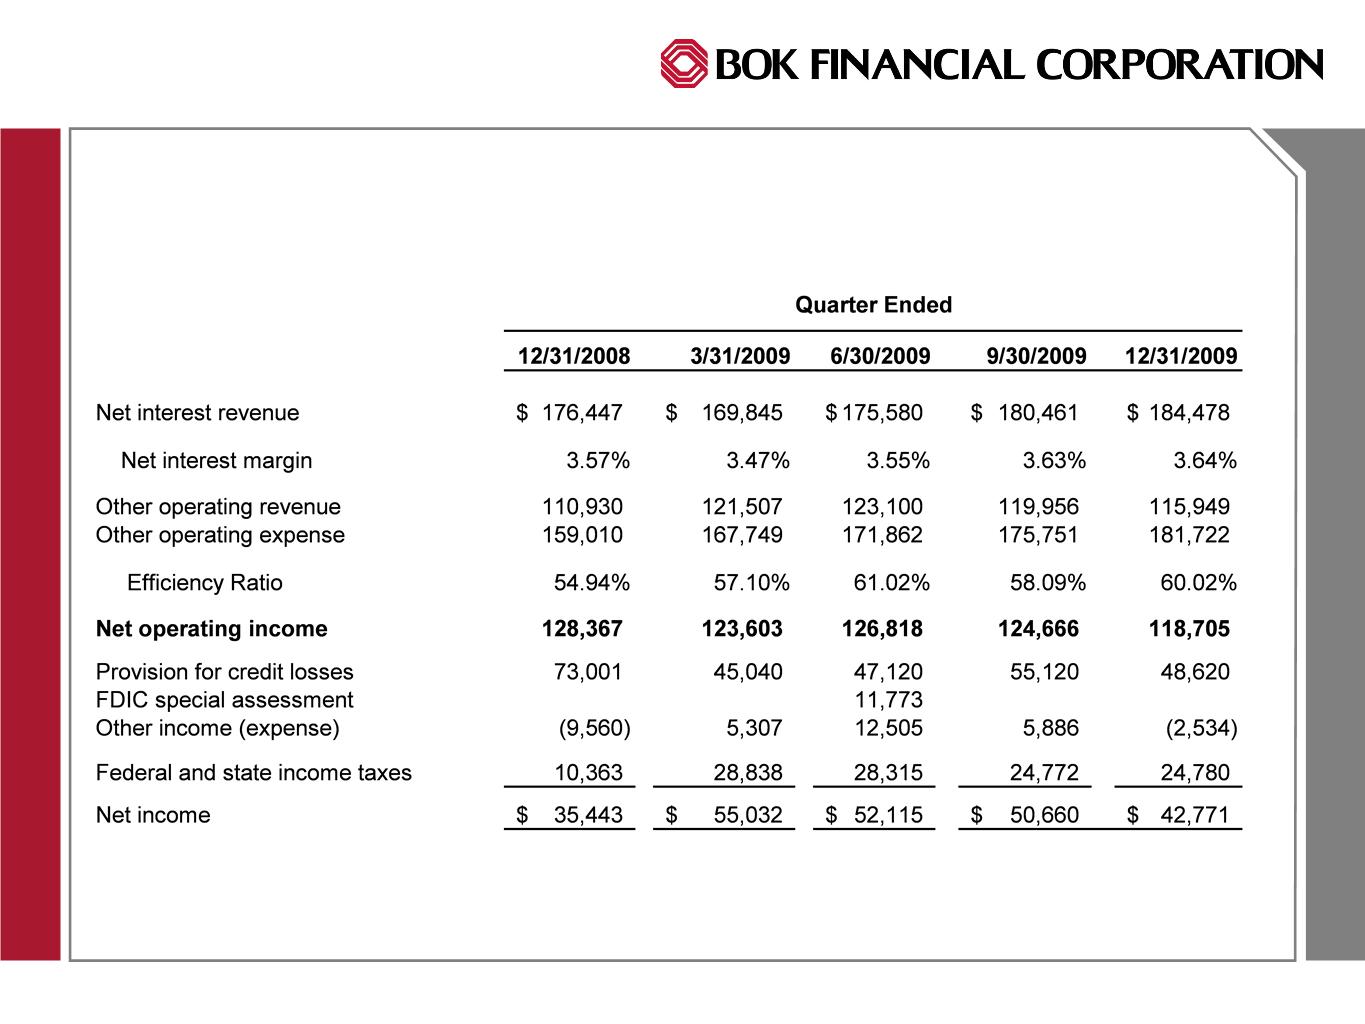
Quarterly
Results (in
000s)
Nearly $500 Million in Pre-tax Pre-Provision Income in 2009
Nearly $500 Million in Pre-tax Pre-Provision Income in 2009
7
Note: Other
includes gains/losses on securities including OTTI and changes in the value of
MSRs and
related hedge
related hedge
© 2009
BOK Financial Corporation.
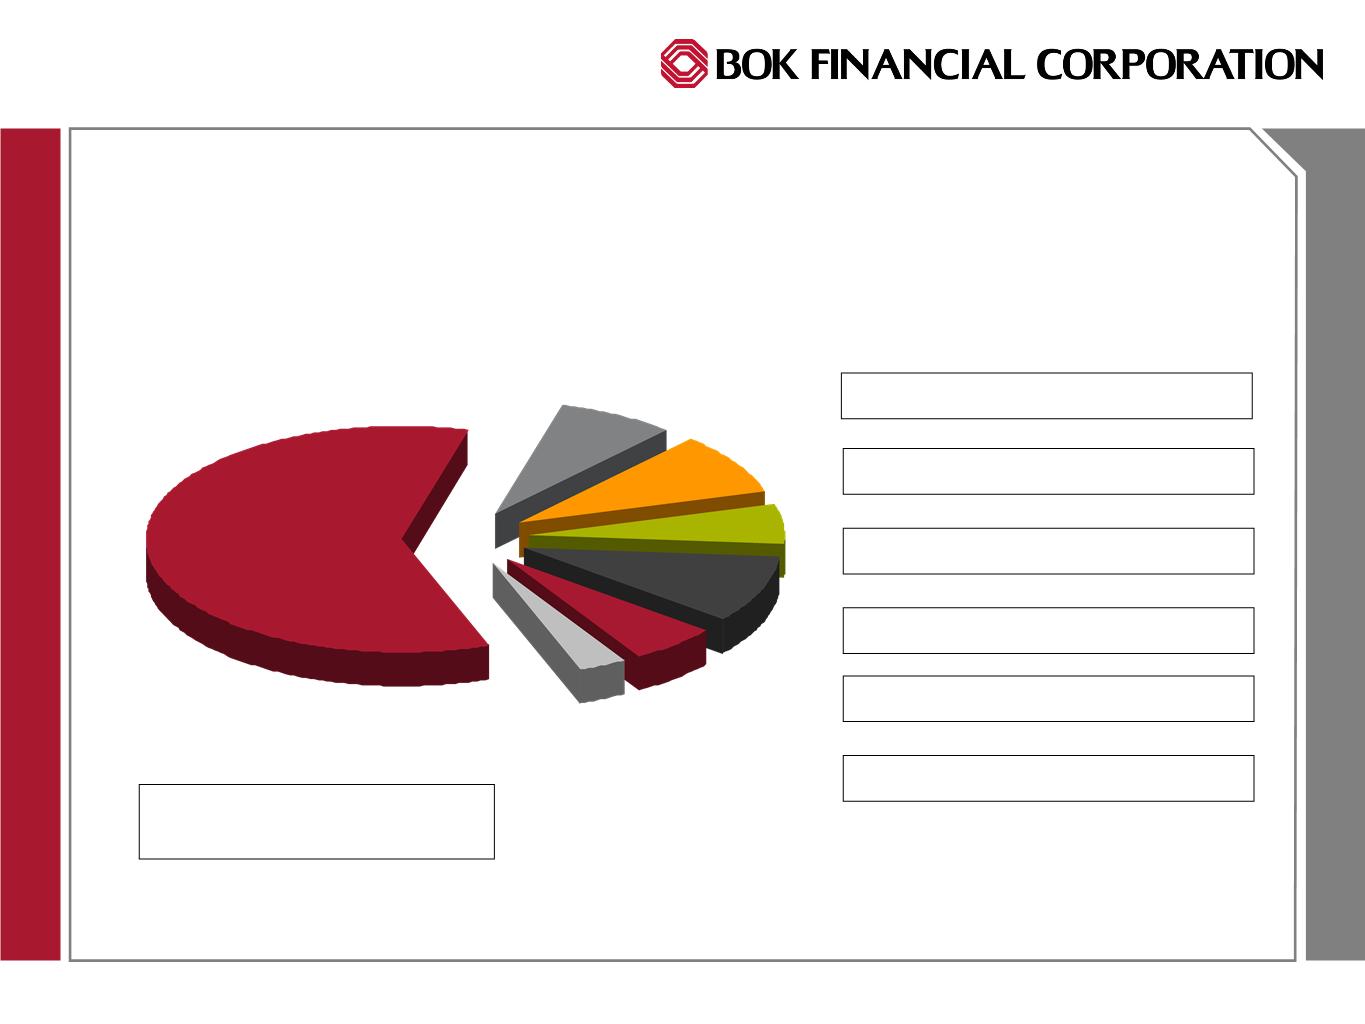
Components
of Revenue
Fee Revenue Consistently Represents At Least 40% of Total Revenue
Fee Revenue Consistently Represents At Least 40% of Total Revenue
8
Net
Interest Revenue =
59% of Total Revenue
59% of Total Revenue
Deposit
Service Charges 10%
Transaction
Card 9%
Brokerage
& Trading 8%
Mortgage
Banking 5%
Other 4%
Trust
Fees 5%
© 2009
BOK Financial Corporation.
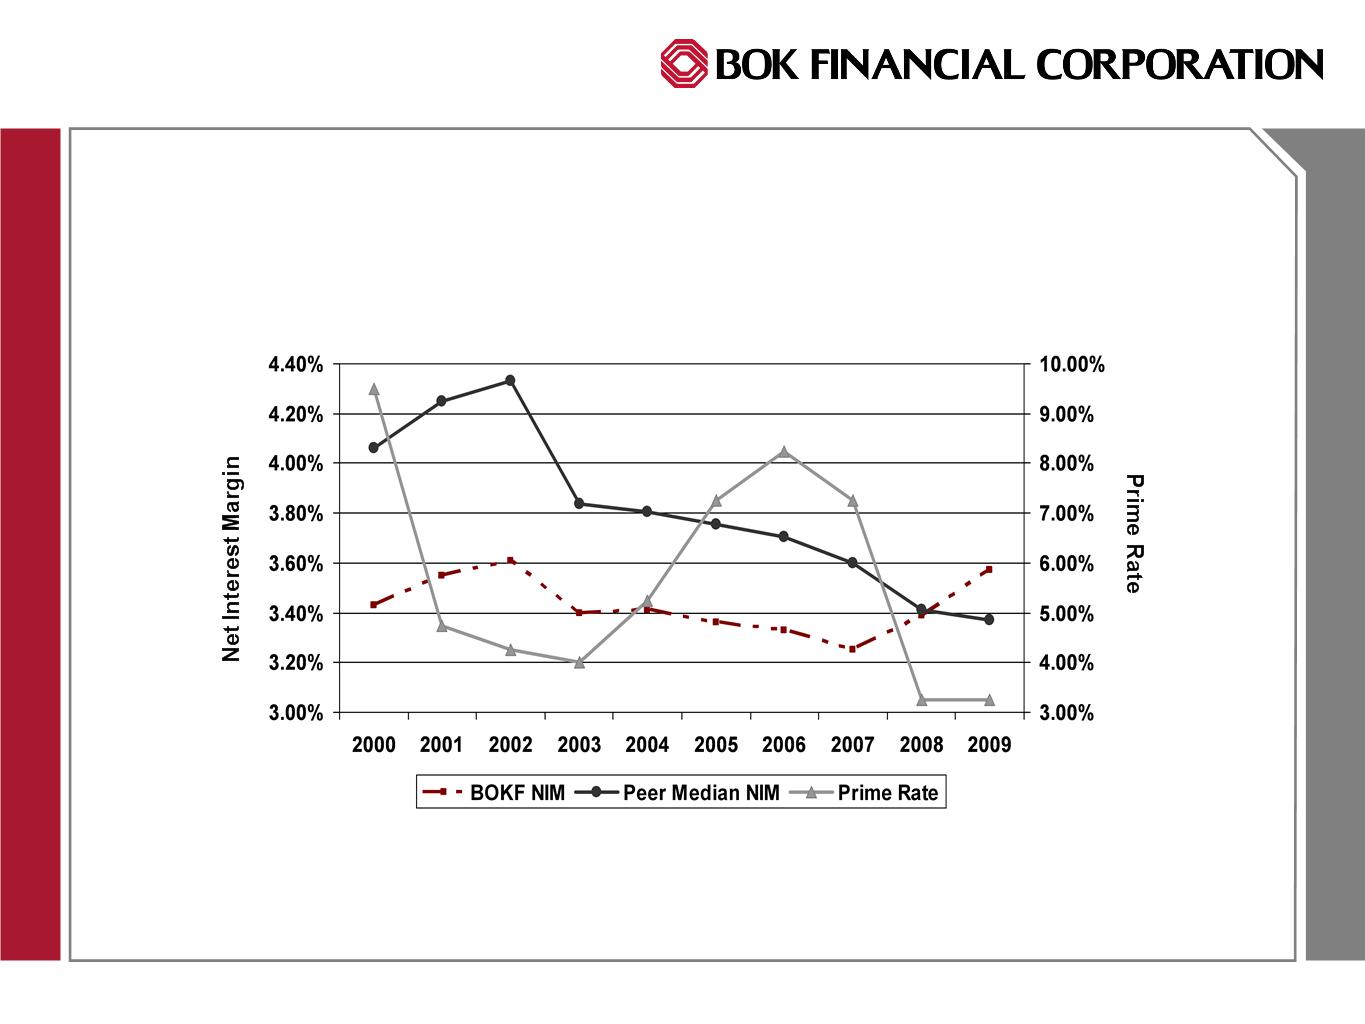
9
Net
Interest Margin
More Stable Through Economic Cycles
More Stable Through Economic Cycles
Source:
SNL data as of 1/27/10. Two
peers had not reported when this presentation was
prepared.
© 2009
BOK Financial Corporation.
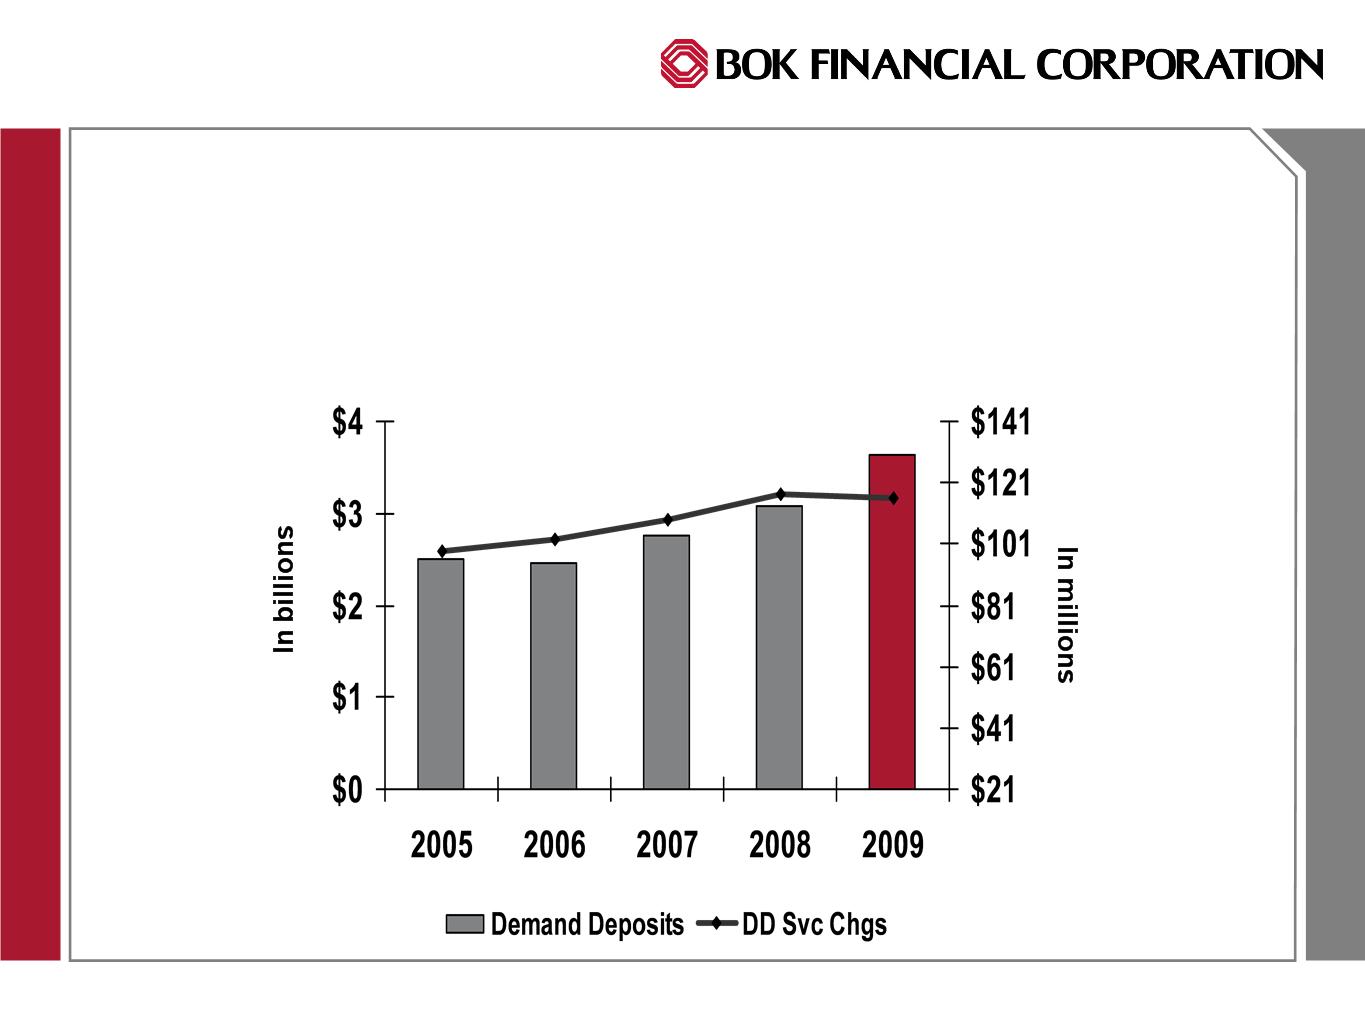
Service
Charges
Likely to Decrease Due to Changes in Regulation
Likely to Decrease Due to Changes in Regulation
Demand
Deposits and Fee Income
10

© 2009
BOK Financial Corporation.
11
Transaction
Card Revenue
Consistent Solid Contributor
Consistent Solid Contributor

© 2009
BOK Financial Corporation.
12
Brokerage
& Trading Revenue
Tremendous Growth in Investment Banking & Trading Fees
Tremendous Growth in Investment Banking & Trading Fees

© 2009
BOK Financial Corporation.
Mortgage
Originations
46% of Production In Regional Markets
46% of Production In Regional Markets
13

© 2009
BOK Financial Corporation.
Trust
Revenue
$30B in Trust Assets
$30B in Trust Assets
14
© 2009
BOK Financial Corporation.
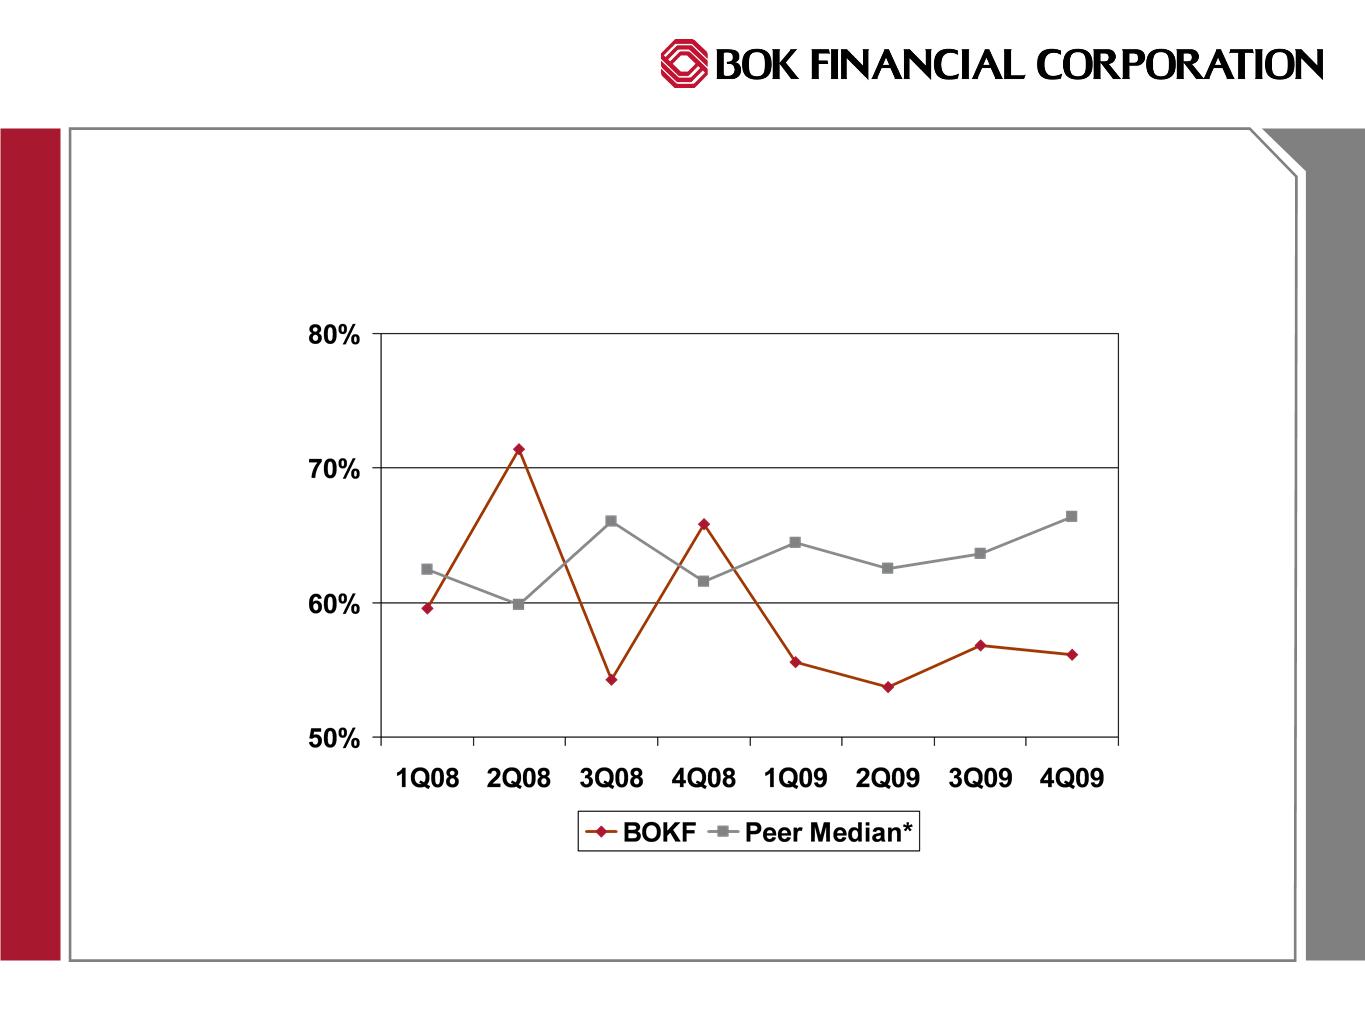
Efficiency
Ratio
15
* For purposes of this
comparison, peers are defined as the subset of the peer group of 20 with
fee
revenue over 35% of total revenue; Source: SNL as of 1/27/10. Two peers had not yet reported.
revenue over 35% of total revenue; Source: SNL as of 1/27/10. Two peers had not yet reported.

© 2009
BOK Financial Corporation.
Earning
Assets
16
© 2009
BOK Financial Corporation.
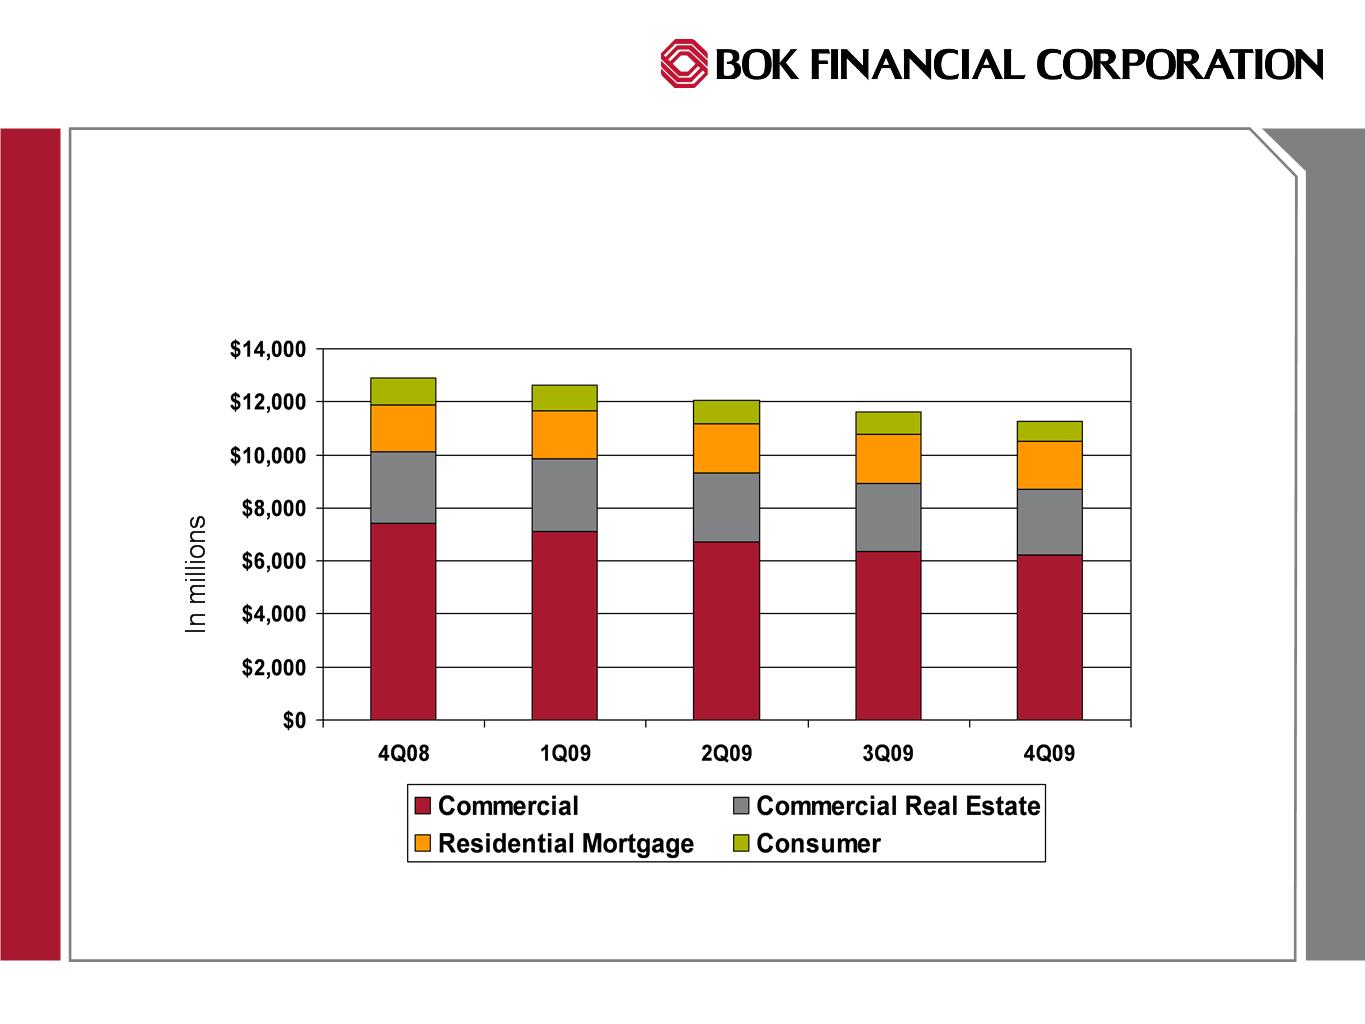
Loan
Trends
Consistent Portfolio Mix
Consistent Portfolio Mix
7%
17
55%
22%
16%
57%
21%
14%
8%
56%
22%
14%
8%
56%
22%
15%
7%
7%
55%
22%
16%
© 2009
BOK Financial Corporation.
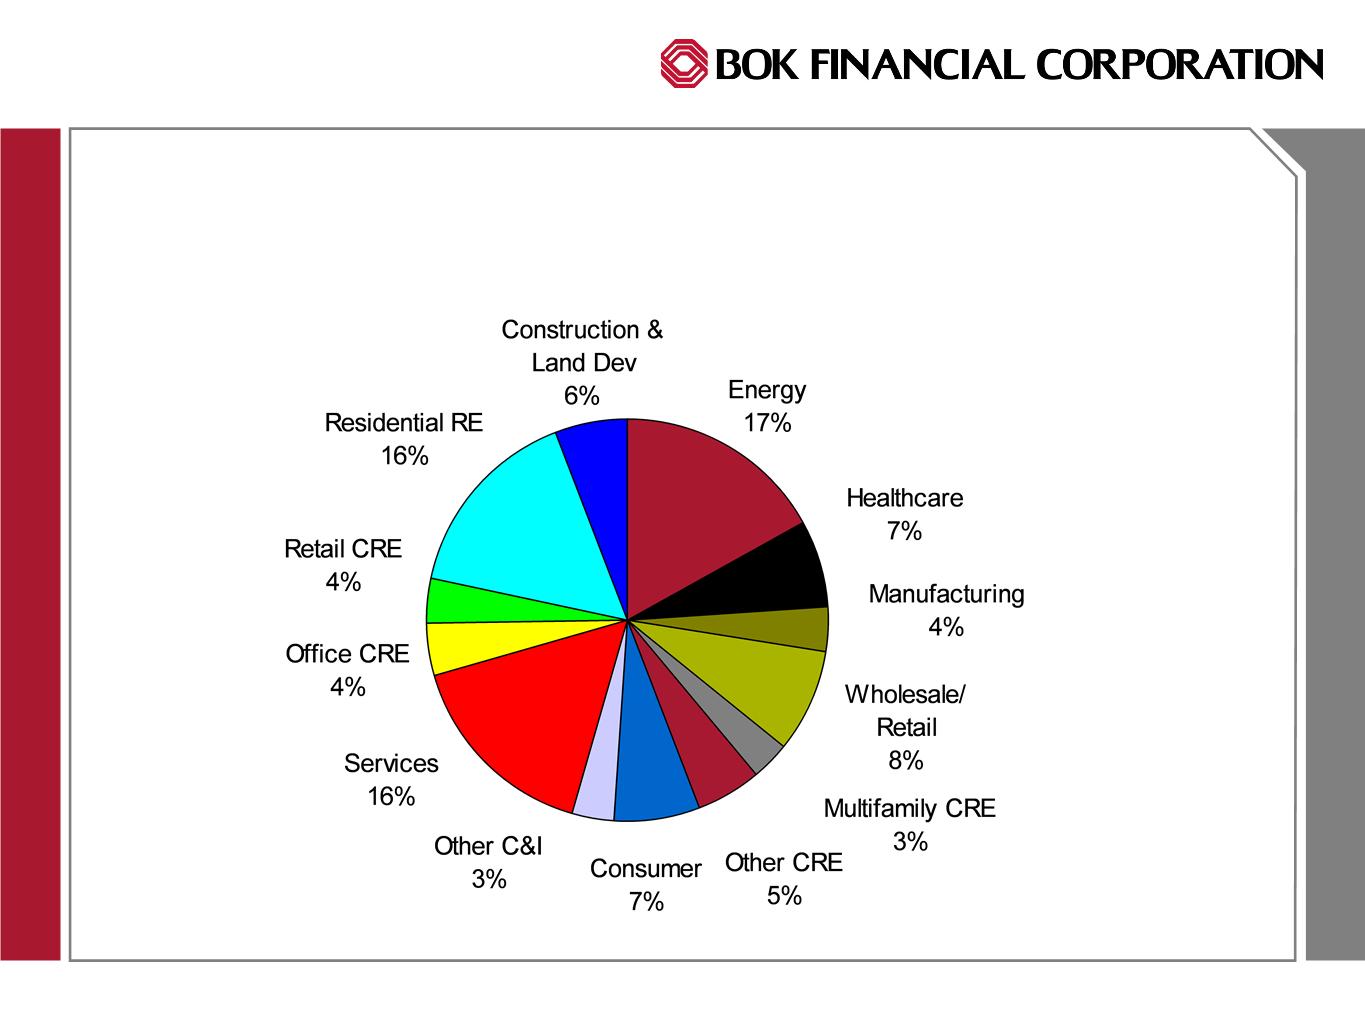
$11.2
Billion Loan
Portfolio
Diversified by Sector and Geography
Diversified by Sector and Geography
18

© 2009
BOK Financial Corporation.
Energy
Portfolio
Core Competency
Core Competency
19
© 2009
BOK Financial Corporation.
CRE
by Market
75% of Exposure is in Stable Markets
75% of Exposure is in Stable Markets
20
Market $ in
000s % of
Total
Oklahoma 820,578 33
Texas 735,338
30
New
Mexico 305,061
12
Colorado 239,
970
10
Arizona 227,249 9
Arkansas 132,
436 5
Kansas 30,802 1
© 2009
BOK Financial Corporation.
Additional
Loan Detail in
millions
Permanent Mortgage
Loans $1,303
Home
Equity Loans 490
Total
Residential Mortgage $1,793
Consumer Loans $455
Indirect Auto
Loans 332
Total
Consumer Loans $787
Off-Balance Sheet
Obligations
Related
to CRA Loans Sold with Recourse $331
21
© 2009
BOK Financial Corporation.
22
$ in
millions
© 2009
BOK Financial Corporation.
Other
Than Temporary Impairment on Debt
Securities
Securities
Summary
($ in millions)
Amortized cost of
private issue MBS $961
Amortized cost of
securities rated AAA
182
Amortized cost of
securities rated >investment grade and 190
Amortized cost of
securities rated < investment
grade
by at least one rating agency
589
OTTI
charges against earnings in 2009 26.4
23

© 2009
BOK Financial Corporation.
Asset
Quality
24
© 2009
BOK Financial Corporation.
Nonperforming
Assets
Reduce Level But Maximize Total Return
Reduce Level But Maximize Total Return
25

© 2009
BOK Financial Corporation.
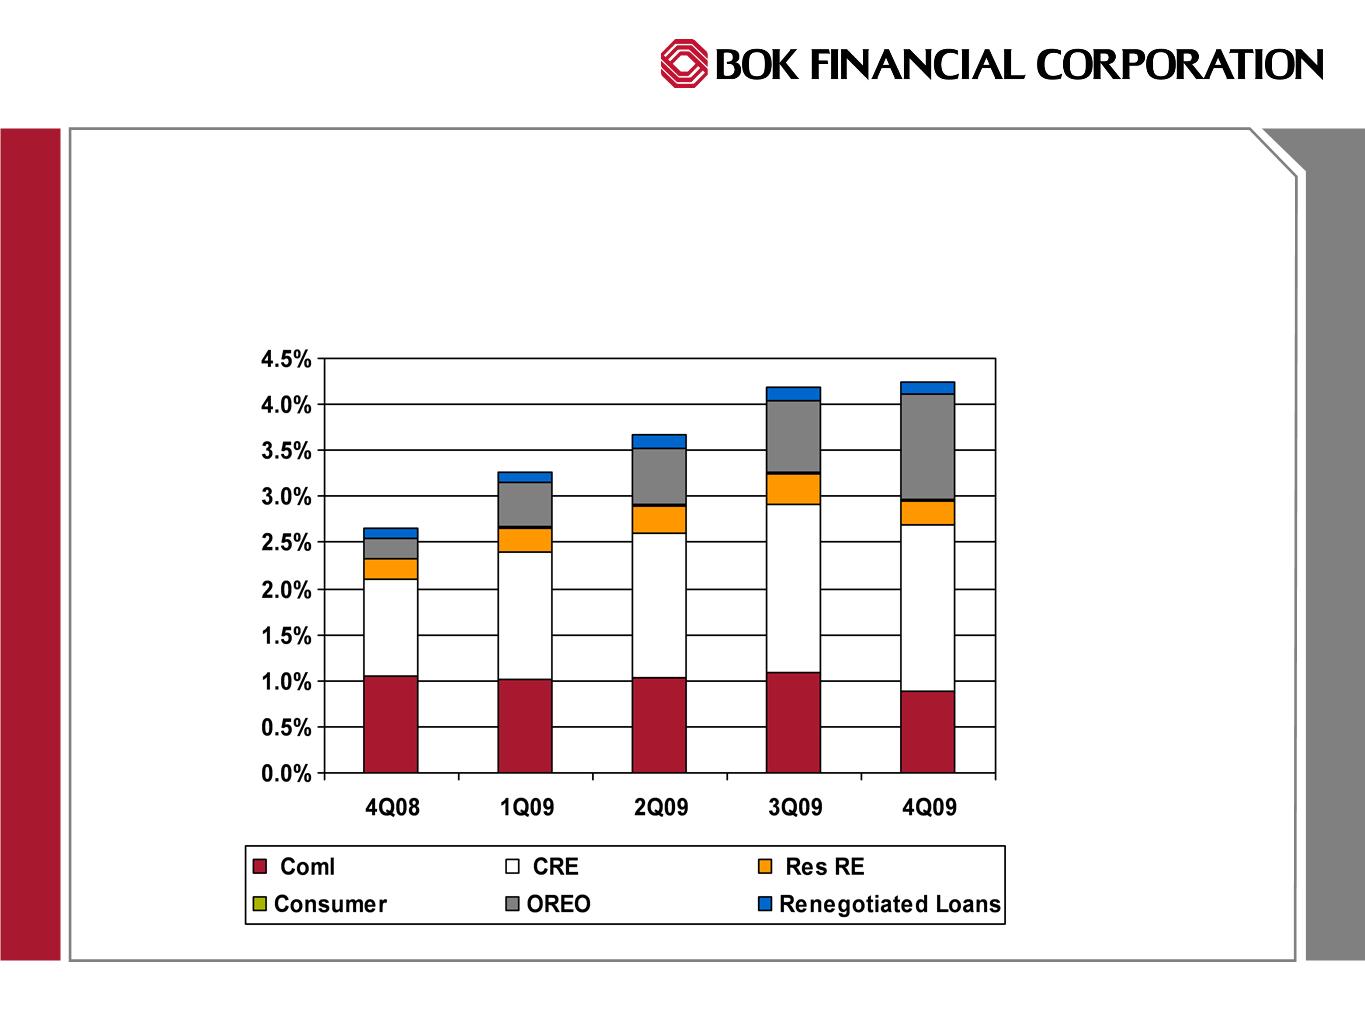
Nonperforming
Assets / Loans & OREO
26
Source:
SNL; Two peers had not reported when this presentation was
prepared.
© 2009
BOK Financial Corporation.
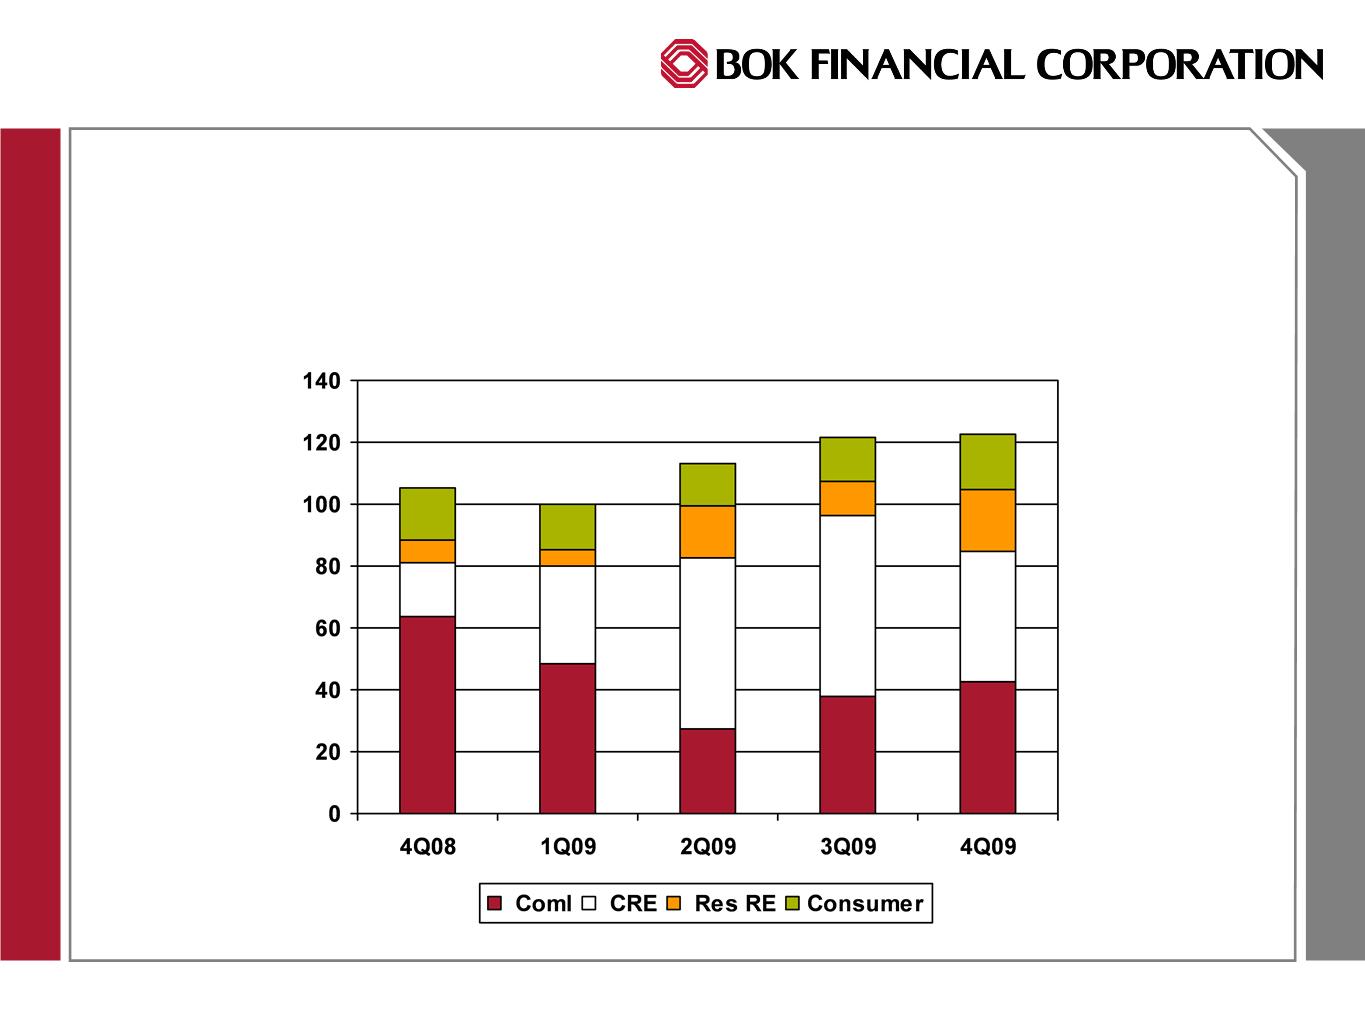
Net Charge-Offs in Basis Points
CRE Charge-offs Decreased in 4Q
27

© 2009
BOK Financial Corporation.
Net
Charge-offs as a % of Average Loans
(annualized)
Consistently Lower Than the Peer Median
Consistently Lower Than the Peer Median
* 62% of
2Q08 charge-offs consisted of a $26 million charge related to one energy
company
28
Source:
SNL; Two peers had not reported when this presentation was
prepared.

© 2009
BOK Financial Corporation.
Other
Real Estate Owned $ in
millions
OREO & Related Expenses Likely to Remain Elevated
OREO & Related Expenses Likely to Remain Elevated
29

© 2009
BOK Financial Corporation.
Liquidity
and Capital
30
© 2009
BOK Financial Corporation.
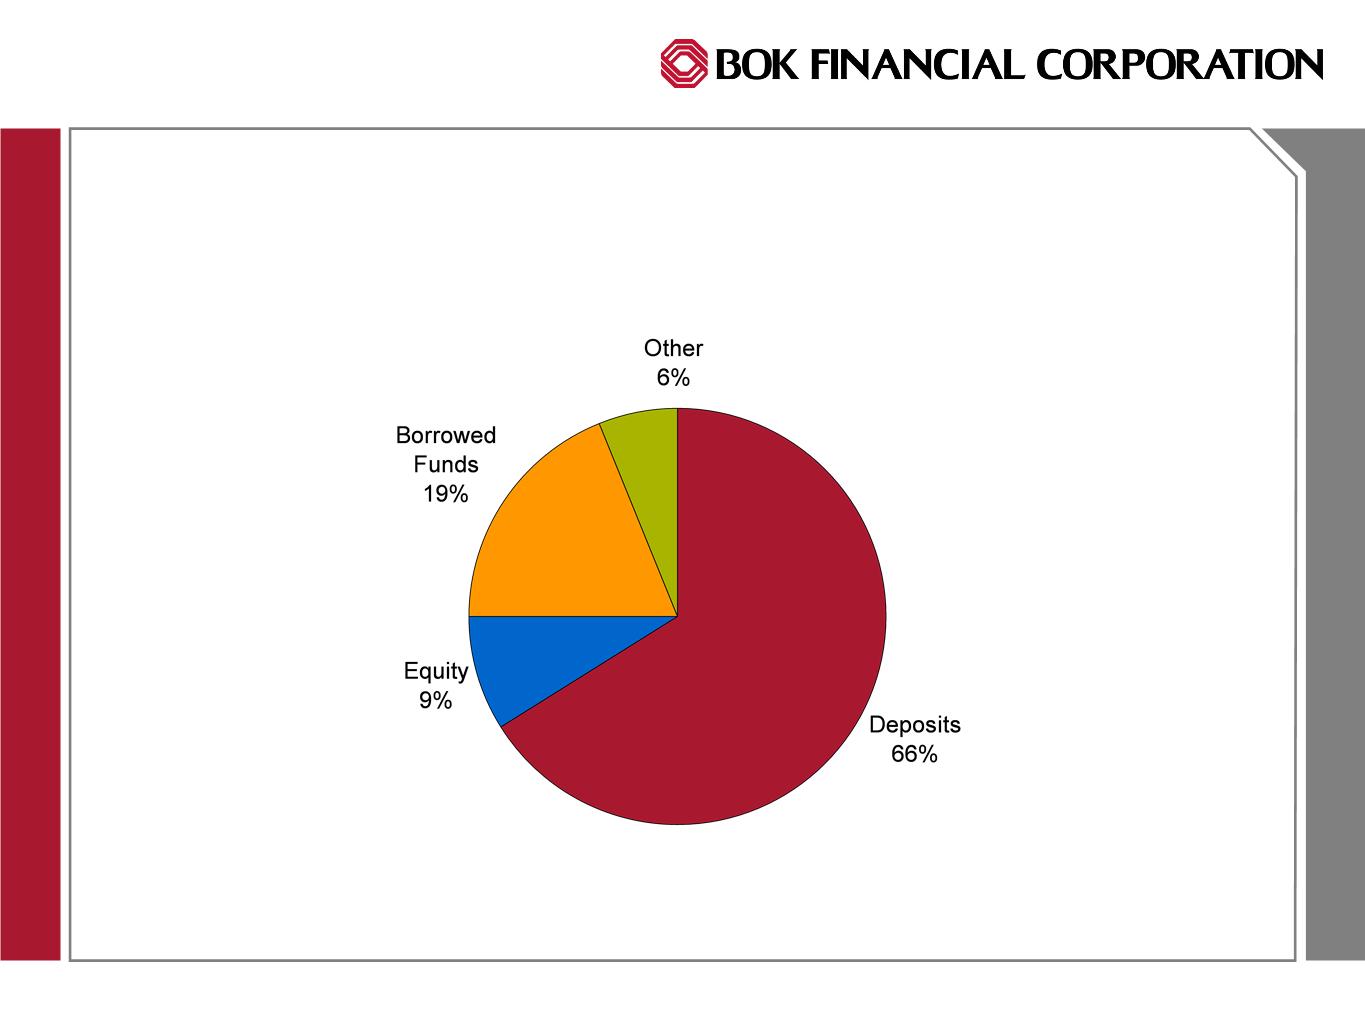
Funding
Sources
Diverse Sources By Type and Region
Diverse Sources By Type and Region
31
© 2009
BOK Financial Corporation.
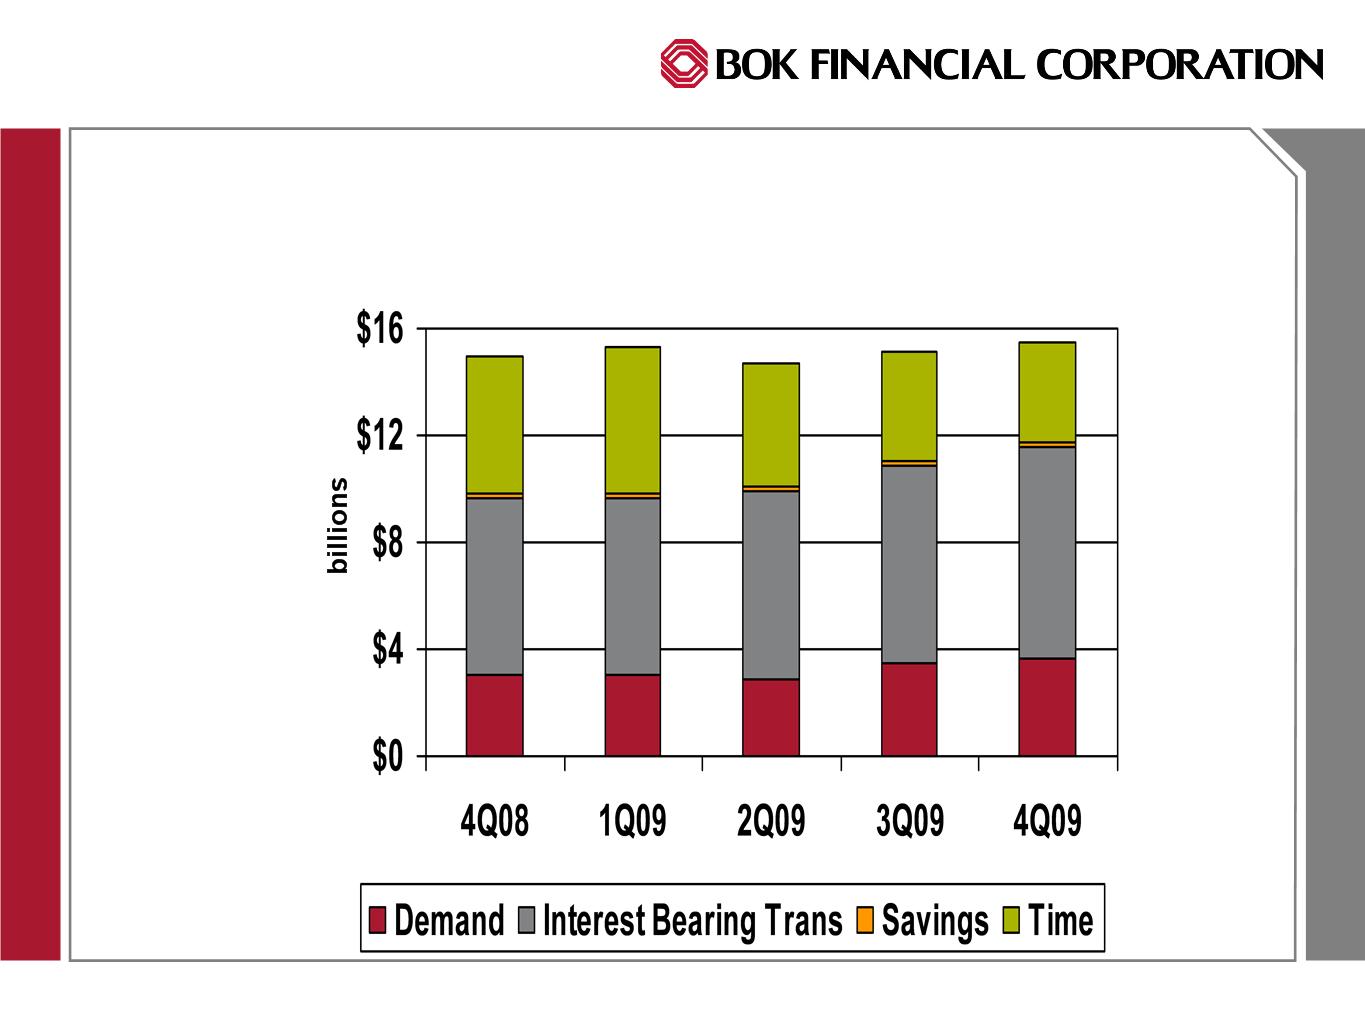
Deposits
Dominated by Core Deposit Relationships
Dominated by Core Deposit Relationships
32
© 2009
BOK Financial Corporation.
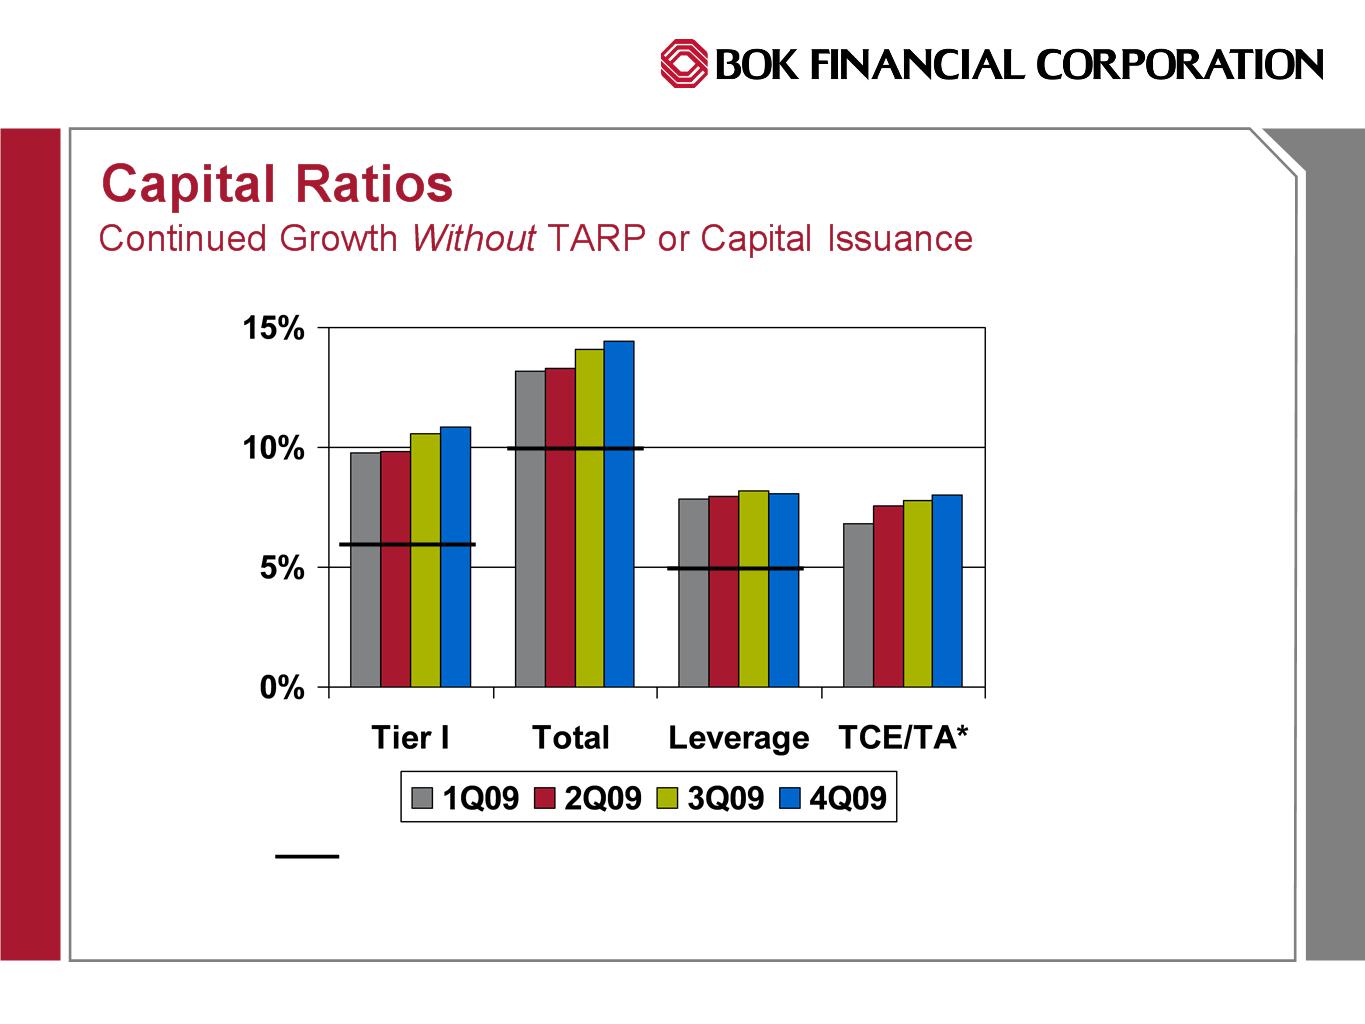
33
Well
capitalized level as defined by regulators
* Tangible
common equity ratio is a non-GAAP measure of capital strength based on equity as
defined by GAAP
minus intangible assets and equity that does not benefit common shareholders. BOKF did not participate in TARP
minus intangible assets and equity that does not benefit common shareholders. BOKF did not participate in TARP

© 2009
BOK Financial Corporation.
Well
Positioned to Take Advantage of
Opportunities
Opportunities
34

© 2009
BOK Financial Corporation.
Current
Focus
ü Aggressively
address credit quality
ü Renew
the focus on profitable loan growth
ü Employ
team based selling and other initiatives to generate
additional fee revenue
additional fee revenue
ü Retain
and grow deposits
ü Secure
the savings from expense control initiatives
completed in 2009
completed in 2009
ü Seek
opportunistic acquisitions within our footprint through
the FDIC and other channels
the FDIC and other channels
35

© 2009
BOK Financial Corporation.
How
We Are Different
ü Balanced
strategy with long term focus successfully creates
shareholder value through varying economic cycles
shareholder value through varying economic cycles
ü Diversified
mix of fee revenue
ü Strong
core earnings
ü Diversified
loan portfolio with consistent mix
ü Attractive
footprint
ü Excess
capital to fund opportunistic acquisitions within our
footprint
footprint
ü Outstanding
talent throughout the organization
36

© 2009
BOK Financial Corporation.
Forward-Looking
Statements
This
presentation contains forward-looking statements that are
based on management’s
beliefs, assumptions, current expectations, estimates, and projections about BOK Financial
Corporation, the financial services industry, and the economy generally. Words such as
“anticipates”, “believes”, “estimates”, “expects”, “forecasts”, “plans”, “projects”, variations of
such words, and similar expressions are intended to identify such forward-looking
statements. Management judgments relating to, and discussion of the provision and
allowance for credit losses involve judgments as to future events and are inherently forward-
looking
statements. Assessments
that BOK Financial’s acquisitions and other growth
endeavors will be profitable are necessary statements of belief as to the outcome of future
events, based in part on information provided by others which BOKF has not independently
verified. These statements are not guarantees of future performance and involve certain
risks, uncertainties, and assumptions which are difficult to predict with regard to timing,
extent, likelihood and degree of occurrence. Therefore, actual results and outcomes may
materially differ from what is expressed, implied or forecasted in such forward-looking
statements. Internal and external factors that might cause such a difference include, but are
not
limited to, (1) the ability to fully realize expected cost savings from
mergers within the
expected time frames, (2) the ability of other companies on which BOKF relies to provide
goods and services in a timely and accurate manner, (3) changes in interest rates and
interest rate relationships, (4) demand for products and services, (5) the degree of
competition by traditional and non-traditional competitors, (6) changes in banking regulations,
tax laws, prices, levies, and assessments, (7) the impact of technological advances, and (8)
trends in customer behavior as well as their ability to repay loans. BOK Financial
Corporation and its affiliates undertake no obligation to update, amend, or clarify forward-
looking statements, whether as a result of new information, future events, or otherwise.
37

© 2009
BOK Financial Corporation.
Steven
E. Nell, EVP & Chief Financial Officer
Steven
G. Bradshaw, SEVP
Q
& A
38