Attached files
| file | filename |
|---|---|
| 8-K - 8-K - SOUTH STATE Corp | a10-2814_18k.htm |
| EX-99.1 - EX-99.1 - SOUTH STATE Corp | a10-2814_1ex99d1.htm |
Exhibit 99.2
|
|
FDIC – Assisted Transaction of: January 29, 2010 Cornelia, GA |
|
|
Forward-Looking Statements Statements contained in this presentation, which are not historical facts, are forward-looking statements. In addition, SCBT Financial Corporation (SCBT) through its senior management or directors may from time to time make forward-looking public statements concerning matters herein. Such forward-looking statements are necessary estimates reflecting the best judgment of SCBT’s senior management or directors based upon current information and involve a number of risks and uncertainties. Certain factors which could affect the accuracy of such forward-looking statements are identified in the public filings made by SCBT with the Securities and Exchange Commission, and forward-looking statements contained in this presentation or in other public statements of SCBT or its senior management or directors should be considered in light of those factors. There can be no assurance that such factors or other factors will not affect the accuracy of such forward-looking statements. |
|
|
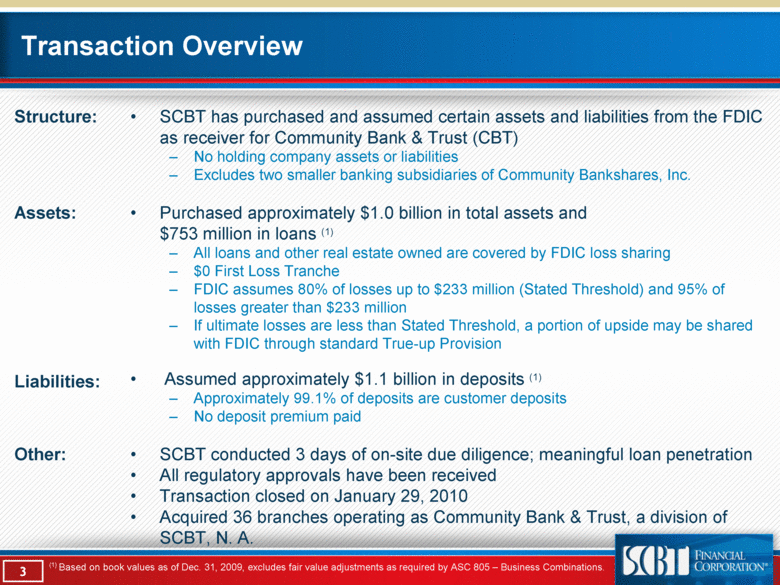
Transaction Overview SCBT has purchased and assumed certain assets and liabilities from the FDIC as receiver for Community Bank & Trust (CBT) No holding company assets or liabilities Excludes two smaller banking subsidiaries of Community Bankshares, Inc. Purchased approximately $1.0 billion in total assets and $753 million in loans (1) All loans and other real estate owned are covered by FDIC loss sharing $0 First Loss Tranche FDIC assumes 80% of losses up to $233 million (Stated Threshold) and 95% of losses greater than $233 million If ultimate losses are less than Stated Threshold, a portion of upside may be shared with FDIC through standard True-up Provision Assumed approximately $1.1 billion in deposits (1) Approximately 99.1% of deposits are customer deposits No deposit premium paid SCBT conducted 3 days of on-site due diligence; meaningful loan penetration All regulatory approvals have been received Transaction closed on January 29, 2010 Acquired 36 branches operating as Community Bank & Trust, a division of SCBT, N. A. Structure: Assets: Liabilities: Other: (1) Based on book values as of Dec. 31, 2009, excludes fair value adjustments as required by ASC 805 – Business Combinations. |
|
|
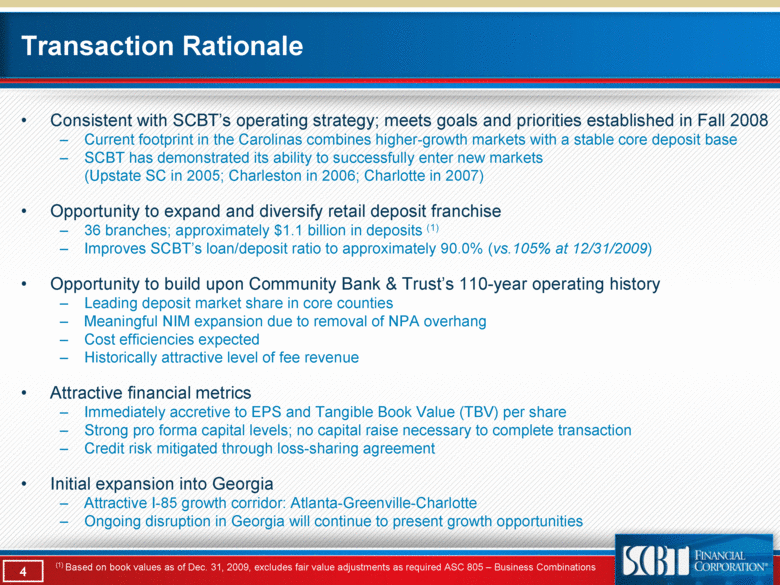
Transaction Rationale Consistent with SCBT’s operating strategy; meets goals and priorities established in Fall 2008 Current footprint in the Carolinas combines higher-growth markets with a stable core deposit base SCBT has demonstrated its ability to successfully enter new markets (Upstate SC in 2005; Charleston in 2006; Charlotte in 2007) Opportunity to expand and diversify retail deposit franchise 36 branches; approximately $1.1 billion in deposits (1) Improves SCBT’s loan/deposit ratio to approximately 90.0% (vs.105% at 12/31/2009) Opportunity to build upon Community Bank & Trust’s 110-year operating history Leading deposit market share in core counties Meaningful NIM expansion due to removal of NPA overhang Cost efficiencies expected Historically attractive level of fee revenue Attractive financial metrics Immediately accretive to EPS and Tangible Book Value (TBV) per share Strong pro forma capital levels; no capital raise necessary to complete transaction Credit risk mitigated through loss-sharing agreement Initial expansion into Georgia Attractive I-85 growth corridor: Atlanta-Greenville-Charlotte Ongoing disruption in Georgia will continue to present growth opportunities (1) Based on book values as of Dec. 31, 2009, excludes fair value adjustments as required ASC 805 – Business Combinations |
|
|
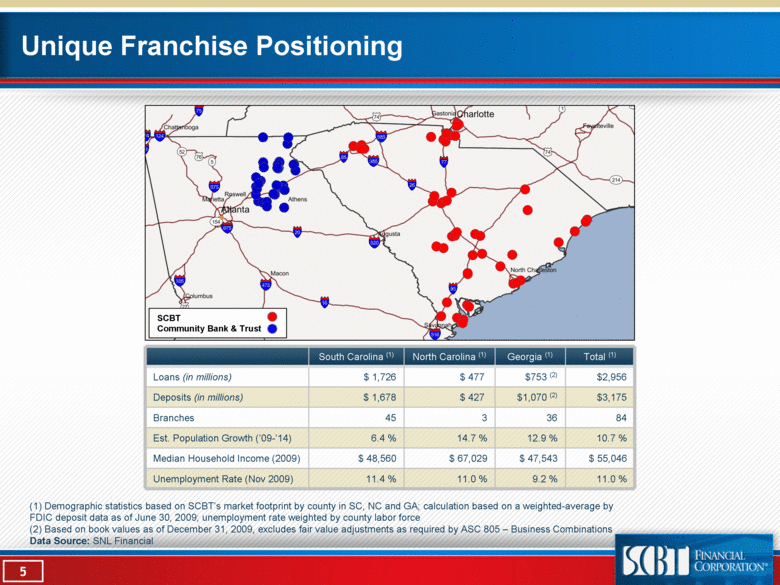
Unique Franchise Positioning (1) Demographic statistics based on SCBT’s market footprint by county in SC, NC and GA; calculation based on a weighted-average by FDIC deposit data as of June 30, 2009; unemployment rate weighted by county labor force (2) Based on book values as of December 31, 2009, excludes fair value adjustments as required by ASC 805 – Business Combinations Data Source: SNL Financial $ 55,046 $ 47,543 $ 67,029 $ 48,560 Median Household Income (2009) 11.4 % 6.4 % 45 $ 1,678 $ 1,726 South Carolina (1) North Carolina (1) Georgia (1) Total (1) Loans (in millions) $ 477 $753 (2) $2,956 Deposits (in millions) $ 427 $1,070 (2) $3,175 Branches 3 36 84 Est. Population Growth (’09-’14) 14.7 % 12.9 % 10.7 % Unemployment Rate (Nov 2009) 11.0 % 9.2 % 11.0 % SCBT Community Bank & Trust |
|
|
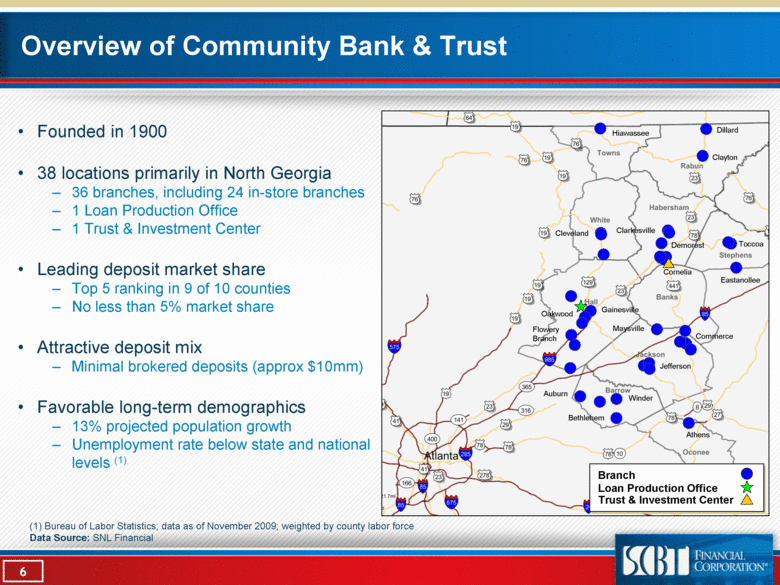
Overview of Community Bank & Trust Founded in 1900 38 locations primarily in North Georgia 36 branches, including 24 in-store branches 1 Loan Production Office 1 Trust & Investment Center Leading deposit market share Top 5 ranking in 9 of 10 counties No less than 5% market share Attractive deposit mix Minimal brokered deposits (approx $10mm) Favorable long-term demographics 13% projected population growth Unemployment rate below state and national levels (1) (1) Bureau of Labor Statistics; data as of November 2009; weighted by county labor force Data Source: SNL Financial Cornelia Demorest Clarkesville Commerce Toccoa Jefferson Gainesville Flowery Branch Oakwood Clayton Dillard Winder Auburn Bethlehem Athens Hiawassee Cleveland Eastanollee Maysville Branch Loan Production Office Trust & Investment Center |
|
|
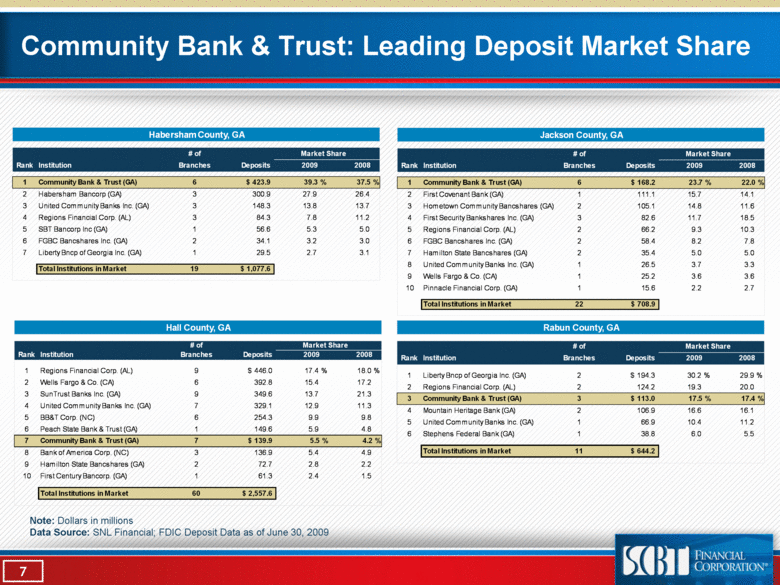
Community Bank & Trust: Leading Deposit Market Share Note: Dollars in millions Data Source: SNL Financial; FDIC Deposit Data as of June 30, 2009 Habersham County, GA # of Market Share Rank Institution Branches Deposits 2009 2008 1 Community Bank & Trust (GA) 6 $ 423.9 39.3 % 37.5 % 2 Habersham Bancorp (GA) 3 300.9 27.9 26.4 3 United Community Banks Inc. (GA) 3 148.3 13.8 13.7 4 Regions Financial Corp. (AL) 3 84.3 7.8 11.2 5 SBT Bancorp Inc (GA) 1 56.6 5.3 5.0 6 FGBC Bancshares Inc. (GA) 2 34.1 3.2 3.0 7 Liberty Bncp of Georgia Inc. (GA) 1 29.5 2.7 3.1 Total Institutions in Market 19 $ 1,077.6 Hall County, GA # of Market Share Rank Institution Branches Deposits 2009 2008 1 Regions Financial Corp. (AL) 9 $ 446.0 17.4 % 18.0 % 2 Wells Fargo & Co. (CA) 6 392.8 15.4 17.2 3 SunTrust Banks Inc. (GA) 9 349.6 13.7 21.3 4 United Community Banks Inc. (GA) 7 329.1 12.9 11.3 5 BB&T Corp. (NC) 6 254.3 9.9 9.8 6 Peach State Bank & Trust (GA) 1 149.6 5.9 4.8 7 Community Bank & Trust (GA) 7 $ 139.9 5.5 % 4.2 % 8 Bank of America Corp. (NC) 3 136.9 5.4 4.9 9 Hamilton State Bancshares (GA) 2 72.7 2.8 2.2 10 First Century Bancorp. (GA) 1 61.3 2.4 1.5 Total Institutions in Market 60 $ 2,557.6 Jackson County, GA # of Market Share Rank Institution Branches Deposits 2009 2008 1 Community Bank & Trust (GA) 6 $ 168.2 23.7 % 22.0 % 2 First Covenant Bank (GA) 1 111.1 15.7 14.1 3 Hometown Community Bancshares (GA) 2 105.1 14.8 11.6 4 First Security Bankshares Inc. (GA) 3 82.6 11.7 18.5 5 Regions Financial Corp. (AL) 2 66.2 9.3 10.3 6 FGBC Bancshares Inc. (GA) 2 58.4 8.2 7.8 7 Hamilton State Bancshares (GA) 2 35.4 5.0 5.0 8 United Community Banks Inc. (GA) 1 26.5 3.7 3.3 9 Wells Fargo & Co. (CA) 1 25.2 3.6 3.6 10 Pinnacle Financial Corp. (GA) 1 15.6 2.2 2.7 Total Institutions in Market 22 $ 708.9 Rabun County, GA # of Market Share Rank Institution Branches Deposits 2009 2008 1 Liberty Bncp of Georgia Inc. (GA) 2 $ 194.3 30.2 % 29.9 % 2 Regions Financial Corp. (AL) 2 124.2 19.3 20.0 3 Community Bank & Trust (GA) 3 $ 113.0 17.5 % 17.4 % 4 Mountain Heritage Bank (GA) 2 106.9 16.6 16.1 5 United Community Banks Inc. (GA) 1 66.9 10.4 11.2 6 Stephens Federal Bank (GA) 1 38.8 6.0 5.5 Total Institutions in Market 11 $ 644.2 |
|
|
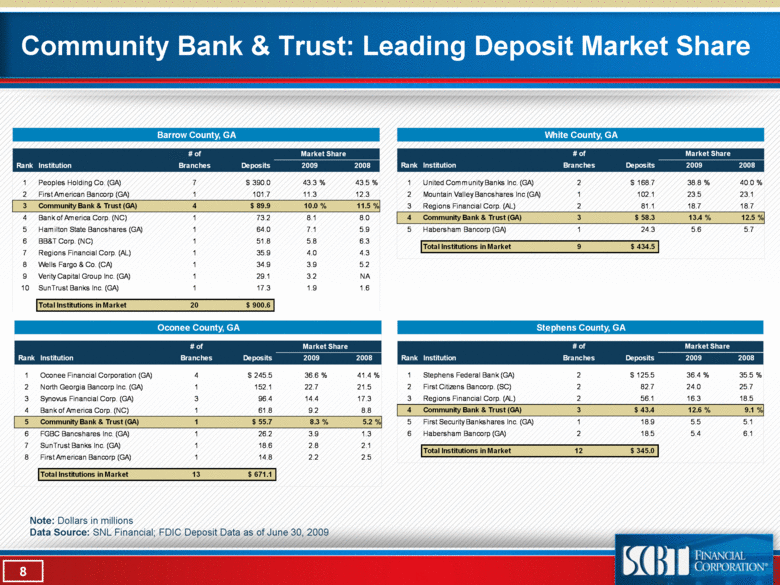
Community Bank & Trust: Leading Deposit Market Share Note: Dollars in millions Data Source: SNL Financial; FDIC Deposit Data as of June 30, 2009 Barrow County, GA # of Market Share Rank Institution Branches Deposits 2009 2008 1 Peoples Holding Co. (GA) 7 $ 390.0 43.3 % 43.5 % 2 First American Bancorp (GA) 1 101.7 11.3 12.3 3 Community Bank & Trust (GA) 4 $ 89.9 10.0 % 11.5 % 4 Bank of America Corp. (NC) 1 73.2 8.1 8.0 5 Hamilton State Bancshares (GA) 1 64.0 7.1 5.9 6 BB&T Corp. (NC) 1 51.8 5.8 6.3 7 Regions Financial Corp. (AL) 1 35.9 4.0 4.3 8 Wells Fargo & Co. (CA) 1 34.9 3.9 5.2 9 Verity Capital Group Inc. (GA) 1 29.1 3.2 NA 10 SunTrust Banks Inc. (GA) 1 17.3 1.9 1.6 Total Institutions in Market 20 $ 900.6 Oconee County, GA # of Market Share Rank Institution Branches Deposits 2009 2008 1 Oconee Financial Corporation (GA) 4 $ 245.5 36.6 % 41.4 % 2 North Georgia Bancorp Inc. (GA) 1 152.1 22.7 21.5 3 Synovus Financial Corp. (GA) 3 96.4 14.4 17.3 4 Bank of America Corp. (NC) 1 61.8 9.2 8.8 5 Community Bank & Trust (GA) 1 $ 55.7 8.3 % 5.2 % 6 FGBC Bancshares Inc. (GA) 1 26.2 3.9 1.3 7 SunTrust Banks Inc. (GA) 1 18.6 2.8 2.1 8 First American Bancorp (GA) 1 14.8 2.2 2.5 Total Institutions in Market 13 $ 671.1 White County, GA # of Market Share Rank Institution Branches Deposits 2009 2008 1 United Community Banks Inc. (GA) 2 $ 168.7 38.8 % 40.0 % 2 Mountain Valley Bancshares Inc (GA) 1 102.1 23.5 23.1 3 Regions Financial Corp. (AL) 2 81.1 18.7 18.7 4 Community Bank & Trust (GA) 3 $ 58.3 13.4 % 12.5 % 5 Habersham Bancorp (GA) 1 24.3 5.6 5.7 Total Institutions in Market 9 $ 434.5 Stephens County, GA # of Market Share Rank Institution Branches Deposits 2009 2008 1 Stephens Federal Bank (GA) 2 $ 125.5 36.4 % 35.5 % 2 First Citizens Bancorp. (SC) 2 82.7 24.0 25.7 3 Regions Financial Corp. (AL) 2 56.1 16.3 18.5 4 Community Bank & Trust (GA) 3 $ 43.4 12.6 % 9.1 % 5 First Security Bankshares Inc. (GA) 1 18.9 5.5 5.1 6 Habersham Bancorp (GA) 2 18.5 5.4 6.1 Total Institutions in Market 12 $ 345.0 |
|
|
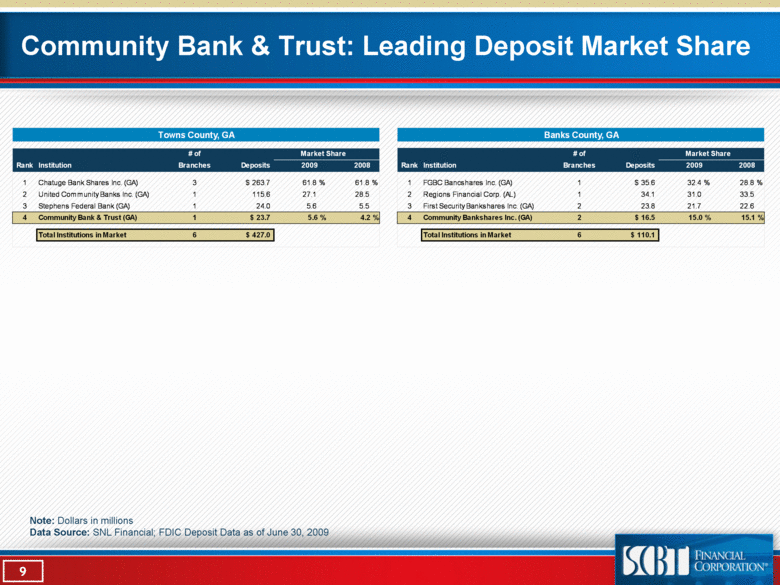
Community Bank & Trust: Leading Deposit Market Share Note: Dollars in millions Data Source: SNL Financial; FDIC Deposit Data as of June 30, 2009 Towns County, GA # of Market Share Rank Institution Branches Deposits 2009 2008 1 Chatuge Bank Shares Inc. (GA) 3 $ 263.7 61.8 % 61.8 % 2 United Community Banks Inc. (GA) 1 115.6 27.1 28.5 3 Stephens Federal Bank (GA) 1 24.0 5.6 5.5 4 Community Bank & Trust (GA) 1 $ 23.7 5.6 % 4.2 % Total Institutions in Market 6 $ 427.0 Banks County, GA # of Market Share Rank Institution Branches Deposits 2009 2008 1 FGBC Bancshares Inc. (GA) 1 $ 35.6 32.4 % 28.8 % 2 Regions Financial Corp. (AL) 1 34.1 31.0 33.5 3 First Security Bankshares Inc. (GA) 2 23.8 21.7 22.6 4 Community Bankshares Inc. (GA) 2 $ 16.5 15.0 % 15.1 % Total Institutions in Market 6 $ 110.1 |
|
|
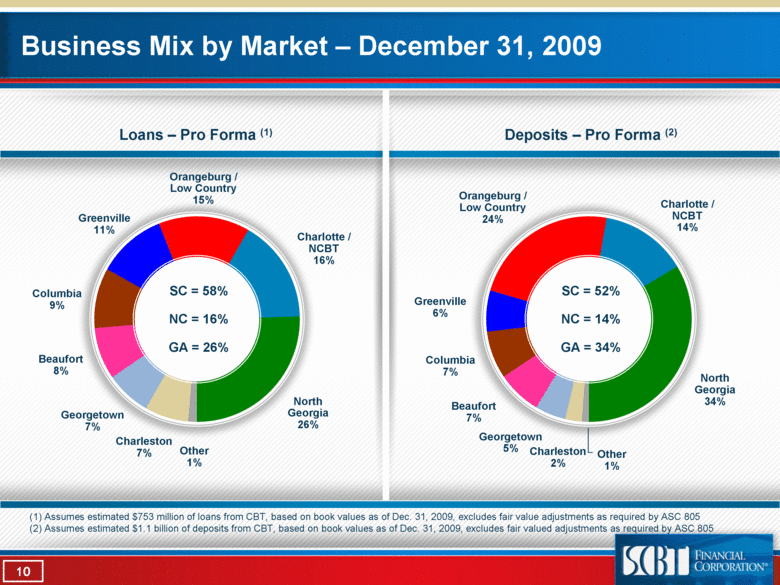
Business Mix by Market – December 31, 2009 Loans – Pro Forma (1) Deposits – Pro Forma (2) Greenville 6% Charlotte / NCBT 14% Orangeburg / Low Country 24% Other 1% Georgetown 5% Charleston 2% Beaufort 7% Columbia 7% Greenville 11% Charlotte / NCBT 16% Orangeburg / Low Country 15% Other 1% Georgetown 7% Charleston 7% Columbia 9% Beaufort 8% North Georgia 26% North Georgia 34% (1) Assumes estimated $753 million of loans from CBT, based on book values as of Dec. 31, 2009, excludes fair value adjustments as required by ASC 805 (2) Assumes estimated $1.1 billion of deposits from CBT, based on book values as of Dec. 31, 2009, excludes fair valued adjustments as required by ASC 805 SC = 58% NC = 16% GA = 26% SC = 52% NC = 14% GA = 34% |
|
|
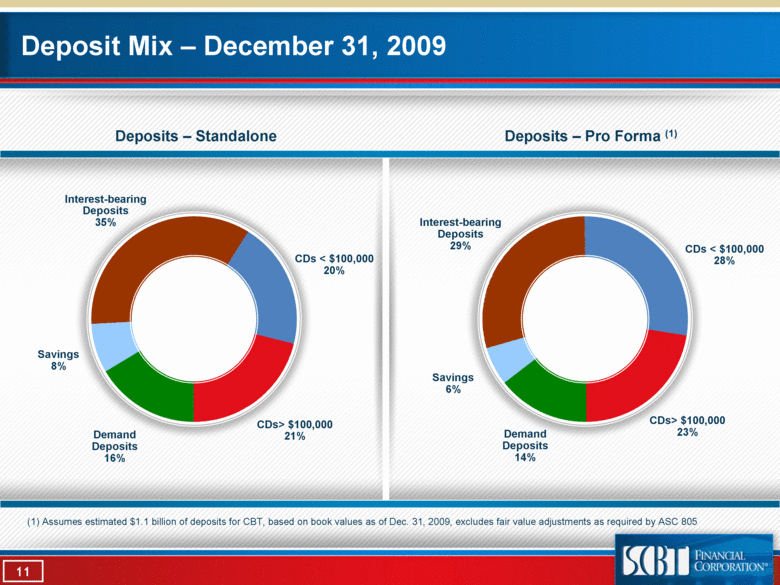
Deposit Mix – December 31, 2009 CDs < $100,000 20% CDs> $100,000 21% Demand Deposits 16% Savings 8% Interest-bearing Deposits 35% Deposits – Standalone Deposits – Pro Forma (1) CDs < $100,000 28% CDs> $100,000 23% Demand Deposits 14% Savings 6% Interest-bearing Deposits 29% (1) Assumes estimated $1.1 billion of deposits for CBT, based on book values as of Dec. 31, 2009, excludes fair value adjustments as required by ASC 805 |
|
|
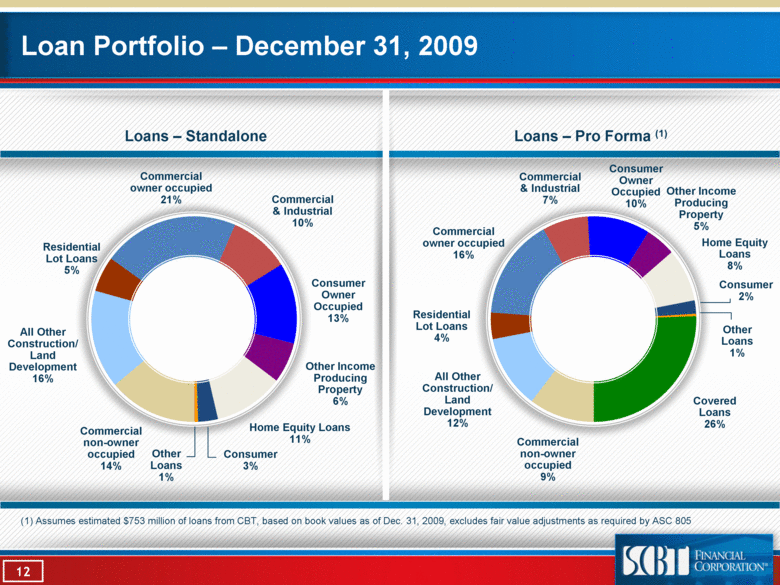
Loan Portfolio – December 31, 2009 Loans – Standalone Loans – Pro Forma (1) Commercial owner occupied 21% Commercial & Industrial 10% Consumer Owner Occupied 13% Other Income Producing Property 6% Home Equity Loans 11% Consumer 3% Other Loans 1% Commercial non-owner occupied 14% All Other Construction/ Land Development 16% Residential Lot Loans 5% Commercial owner occupied 16% Commercial & Industrial 7% Consumer Owner Occupied 10% Other Income Producing Property 5% Home Equity Loans 8% Consumer 2% Other Loans 1% Commercial non-owner occupied 9% All Other Construction/ Land Development 12% Residential Lot Loans 4% (1) Assumes estimated $753 million of loans from CBT, based on book values as of Dec. 31, 2009, excludes fair value adjustments as required by ASC 805 Covered Loans 26% |
|
|
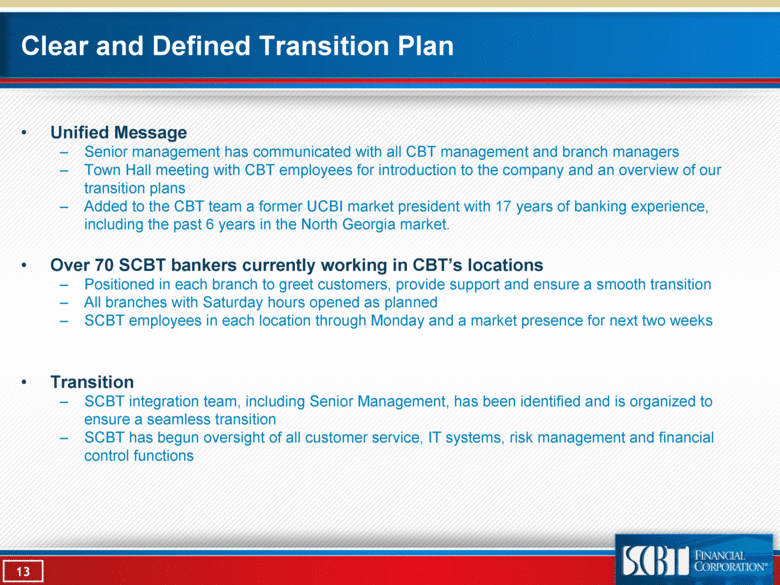
Clear and Defined Transition Plan Unified Message Senior management has communicated with all CBT management and branch managers Town Hall meeting with CBT employees for introduction to the company and an overview of our transition plans Added to the CBT team a former UCBI market president with 17 years of banking experience, including the past 6 years in the North Georgia market. Over 70 SCBT bankers currently working in CBT’s locations Positioned in each branch to greet customers, provide support and ensure a smooth transition All branches with Saturday hours opened as planned SCBT employees in each location through Monday and a market presence for next two weeks Transition SCBT integration team, including Senior Management, has been identified and is organized to ensure a seamless transition SCBT has begun oversight of all customer service, IT systems, risk management and financial control functions |
|
|
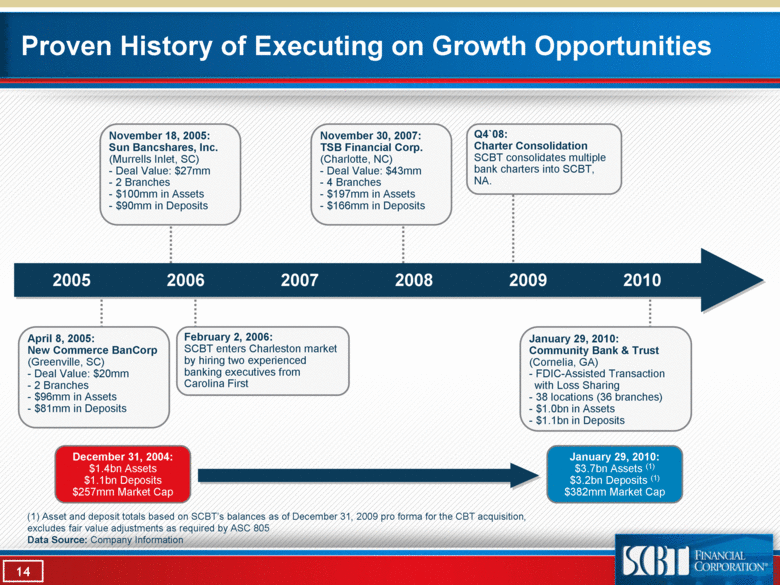
Proven History of Executing on Growth Opportunities April 8, 2005: New Commerce BanCorp (Greenville, SC) - Deal Value: $20mm - 2 Branches - $96mm in Assets - $81mm in Deposits February 2, 2006: SCBT enters Charleston market by hiring two experienced banking executives from Carolina First January 29, 2010: Community Bank & Trust (Cornelia, GA) - FDIC-Assisted Transaction with Loss Sharing - 38 locations (36 branches) - $1.0bn in Assets - $1.1bn in Deposits November 18, 2005: Sun Bancshares, Inc. (Murrells Inlet, SC) - Deal Value: $27mm - 2 Branches - $100mm in Assets - $90mm in Deposits November 30, 2007: TSB Financial Corp. (Charlotte, NC) - Deal Value: $43mm - 4 Branches - $197mm in Assets - $166mm in Deposits Q4`08: Charter Consolidation SCBT consolidates multiple bank charters into SCBT, NA. 2007 2005 2008 2009 2006 2010 December 31, 2004: $1.4bn Assets $1.1bn Deposits $257mm Market Cap January 29, 2010: $3.7bn Assets (1) $3.2bn Deposits (1) $382mm Market Cap (1) Asset and deposit totals based on SCBT’s balances as of December 31, 2009 pro forma for the CBT acquisition, excludes fair value adjustments as required by ASC 805 Data Source: Company Information |
|
|
|
|
|
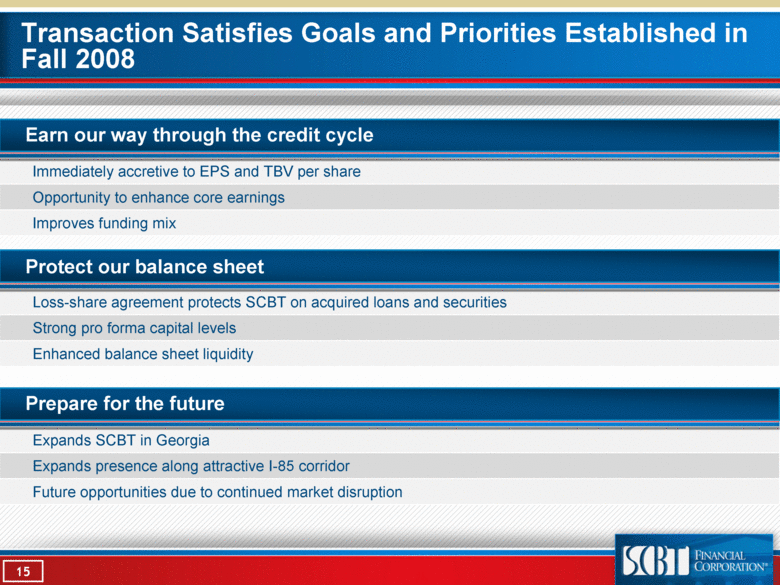
Transaction Satisfies Goals and Priorities Established in Fall 2008 Immediately accretive to EPS and TBV per share Opportunity to enhance core earnings Improves funding mix Earn our way through the credit cycle Loss-share agreement protects SCBT on acquired loans and securities Strong pro forma capital levels Enhanced balance sheet liquidity Protect our balance sheet Expands SCBT in Georgia Expands presence along attractive I-85 corridor Future opportunities due to continued market disruption Prepare for the future |
|
|
Investor Contacts Robert R. Hill, Jr. Chief Executive Officer 803-765-4629 or robert.hill@scbtonline.com John C. Pollok Senior Executive Vice President and Chief Operating Officer 803-765-4628 or john.pollok@scbtonline.com 520 Gervais Street Columbia, South Carolina 29201 800-277-2175 www.scbtonline.com |

