Attached files
| file | filename |
|---|---|
| 8-K - FORM 8-K - MALVERN FEDERAL BANCORP INC | t67025_8k.htm |
| EX-99.1 - EXHIBIT 99.1 - MALVERN FEDERAL BANCORP INC | ex99-1.htm |
|
|
|
 |
MALVERN Annual Meeting January 28, 2010
|
|
|
|
 |
MALVERN Forward-Looking Statements Certain comments in
this presentation contain certain forward looking statements (as defined
in the Securities Exchange Act of 1934 and the regulations hereunder).
Forward looking statements are not historical facts but instead represent
only the beliefs, expectations or opinions of Malvern Federal Bancorp,
Inc. and its management regarding future events, many of which, by their
nature, are inherently uncertain. Forward looking statements may be
identified by the use of such words as: "believe", "expect", "anticipate",
"intend", "plan", "estimate", or words of similar meaning, or future or
conditional terms such as "will", "would", "should", "could", "may",
"likely", "probably", or "possibly." Forward looking statements include,
but are not limited to, financial projections and estimates and their
underlying assumptions; statements regarding plans, objectives and
expectations with respect to future operations, products and services; and
statements regarding future performance. Such statements are subject to
certain risks, uncertainties and assumption, many of which are difficult
to predict and generally are beyond the control of Malvern Federal
Bancorp, Inc. and its management, that could cause actual results to
differ materially from those expressed in, or implied or projected by,
forward looking statements. The following factors, among others, could
cause actual results to differ materially from the anticipated results or
other expectations expressed in the forward looking statements: (1)
economic and competitive conditions which could affect the volume of loan
originations, deposit flows and real estate values; (2) the levels of
non-interest income and expense and the amount of loan losses; (3)
competitive pressure among depository institutions increasing
significantly; (4) changes in the interest rate environment causing
reduced interest margins; (5) general economic conditions, either
nationally or in the markets in which Malvern Federal Bancorp, Inc. is or
will be doing business, being less favorable than expected;(6) political
and social unrest, including acts of war or terrorism; or (7) legislation
or changes in regulatory requirements adversely affecting the business in
which Malvern Federal Bancorp, Inc. is engaged. Malvern Federal Bancorp,
Inc. undertakes no obligation to update these forward looking statements
to reflect events or circumstances that occur after the date on which such
statements were made. As used in this report, unless the context otherwise
requires, the terms "we," "our," "us," or the "Company" refer to Malvern
Federal Bancorp, Inc., a Federal corporation, and the term the "Bank"
refers to Malvern Federal Savings Bank, a federally chartered savings bank
and wholly owned subsidiary of the Company. In addition, unless the
context otherwise requires, references to the operations of the Company
include the operations of the Bank. 2
|
|
|
|
 |
MALVERN Company Overview
|
|
|
|
 |
MALVERN Overview of Malvern Federal Bancorp, Inc. o
Malvern Federal Savings Bank, a federally chartered savings bank organized
in 1887, is the wholly owned subsidiary of Malvern Federal Bancorp, Inc. o
On May 19, 2008, Malvern Federal Savings Bank completed its reorganization
into the mutual holding company form by completing its initial IPO raising
$26.5 million. o Malvern Federal Bancorp trades on the NASDAQ National
Market under the symbol MLVF. o Malvern Federal conducts its business from
its headquarters and seven financial centers located throughout Chester
County, Pennsylvania. We plan to expand into Concordville, located in
Delaware County, in 2010 when we open our proposed eighth full-service
financial center. o As of September 30, 2009, we had $691.6 million in
total assets, $593.6 million in net loans, $516.5 million in deposits and
$69.8 million in shareholders' equity. 4
|
|
|
|
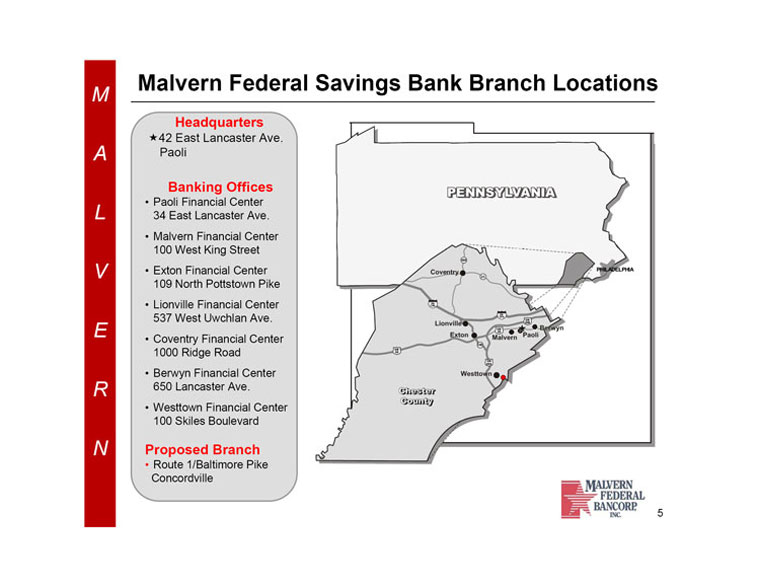 |
MALVERN Malvern Federal Savings Bank Branch Locations
Headquarters * 42 East Lancaster Ave. Paoli Banking Offices o Paoli
Financial Center 34 East Lancaster Ave. o Malvern Financial Center 100
West King Street o Exton Financial Center 109 North Pottstown Pike o
Lionville Financial Center 537 West Uwchlan Ave. o Coventry Financial
Center 1000 Ridge Road o Berwyn Financial Center 650 Lancaster Ave. o
Westtown Financial Center 100 Skiles Boulevard Proposed Branch o Route
1/Baltimore Pike Concordville 5
|
|
|
|
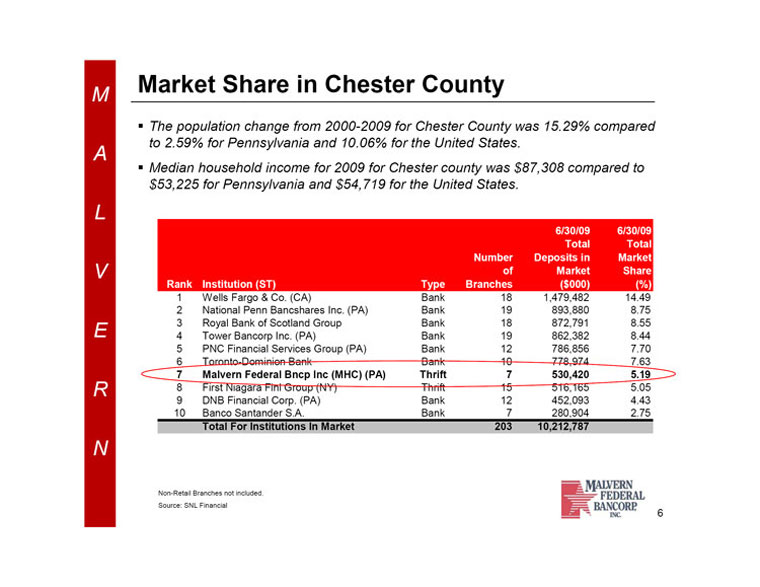 |
MALVERN Market Share in Chester County o The population
change from 2000-2009 for Chester County was 15.29% compared to 2.59% for
Pennsylvania and 10.06% for the United States. o Median household income
for 2009 for Chester county was $87,308 compared to $53,225 for
Pennsylvania and $54,719 for the United States. 6/30/09 6/30/09 Total
Total Number Deposits in Market of Market Share Rank Institution (ST) Type
Branches ($000) (%) 1 Wells Fargo & Co. (CA) Bank 18 1,479,482 14.49 2
National Penn Bancshares Inc. (PA) Bank 19 893,880 8.75 3 Royal Bank of
Scotland Group Bank 18 872,791 8.55 4 Tower Bancorp Inc. (PA) Bank 19
862,382 8.44 5 PNC Financial Services Group (PA) Bank 12 786,856 7.70 6
Toronto-Dominion Bank Bank 10 778,974 7.63 7 Malvern Federal Bncp Inc
(MHC) (PA) Thrift 7 530,420 5.19 8 First Niagara Finl Group (NY) Thrift 15
516,165 5.05 9 DNB Financial Corp. (PA) Bank 12 452,093 4.43 10 Banco
Santander S.A. Bank 7 280,904 2.75 Total For Institutions In Market 203
10,212,787 Non-Retail Branches not included. Source: SNL Financial 6
|
|
|
|
 |
MALVERN 2009 Highlights o Solid Capital Base with
10.10% Equity to Assets as of 9/30/09 o Increased Deposit Market Share in
Chester County o Deposit Growth of 13.9% since 2008 o Improved Deposit
Composition o Expense Controls in Place o Expansion in Noninterest Income
as a Percentage of Operating Revenue 7
|
|
|
|
 |
MALVERN Financial Highlights
|
|
|
|
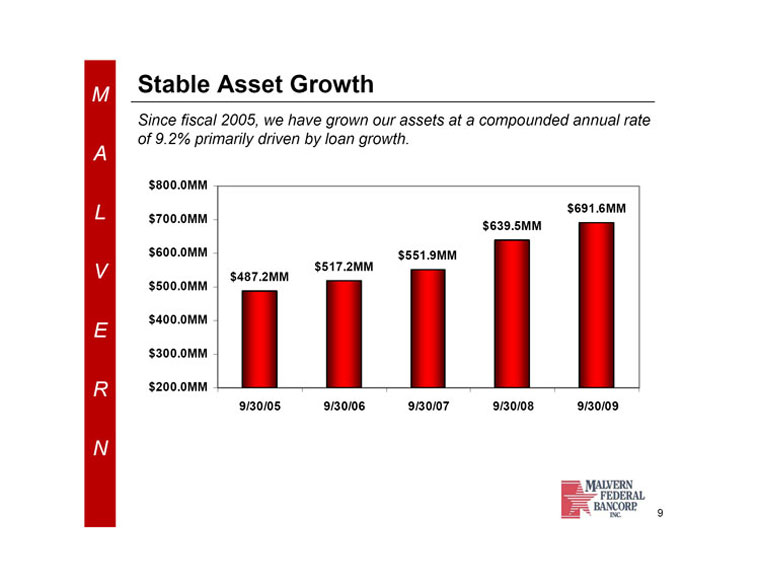 |
MALVERN Stable Asset Growth Since fiscal 2005, we have
grown our assets at a compounded annual rate of 9.2% primarily driven by
loan growth. $800.0MM $700.0MM $600.0MM $500.0MM $487.2MM $517.2MM
$551.9MM $639.5MM $691.6MM $400.0MM $300.0MM $200.0MM 9/30/05 9/30/06
9/30/07 9/30/08 9/30/09 9
|
|
|
|
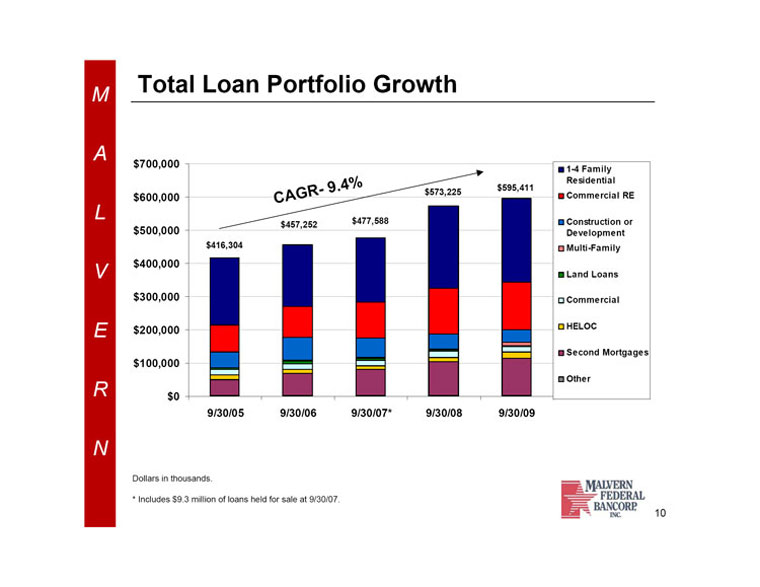 |
MALVERN Total Loan Portfolio Growth $700,000 o 1-4
Family Residential $600,000 CAGR- 9.4% o Commercial RE o Construction or
$500,000 Development o Multi-Family $400,000 $416,304 $457,252 $477,588
$573,225 $595,411 o Land Loans o Commercial $300,000 o HELOC o Second
Mortgages $200,000 o Other $100,000 $0 9/30/05 9/30/06 9/30/07* 9/30/08
9/30/09 Dollars in thousands. * Includes $9.3 million of loans held for
sale at 9/30/07. 10
|
|
|
|
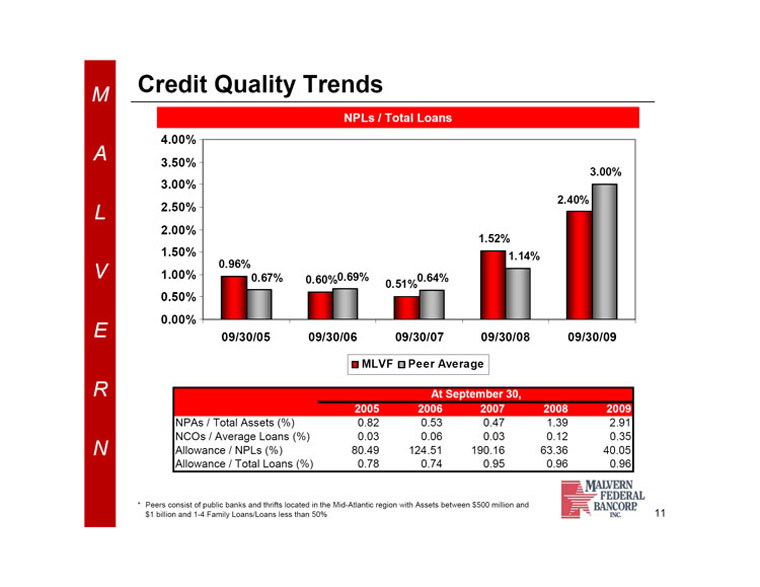 |
MALVERN Credit Quality Trends NPLs / Total Loans 4.00%
3.50% 3.00% 2.50% 2.00% 1.50% 1.00% 0.50% 0.00% 0.96% 0.67% 0.60% 0.69%
0.51% 0.64% 1.52% 1.14% 2.40% 3.00% 09/30/05 09/30/06 09/30/07 09/30/08
09/30/09 MLVF Peer Average At September 30,
-------------------------------------------- 2005 2006 2007 2008 2009 NPAs
/ Total Assets (%) 0.82 0.53 0.47 1.39 2.91 NCOs / Average Loans (%) 0.03
0.06 0.03 0.12 0.35 Allowance / NPLs (%) 80.49 124.51 190.16 63.36 40.05
Allowance / Total Loans (%) 0.78 0.74 0.95 0.96 0.96
--------------------------------------------------------------------------------
* Peers consist of public banks and thrifts located in the Mid-Atlantic
region with Assets between $500 million and $1 billion and 1-4 Family
Loans/Loans less than 50% 11
|
|
|
|
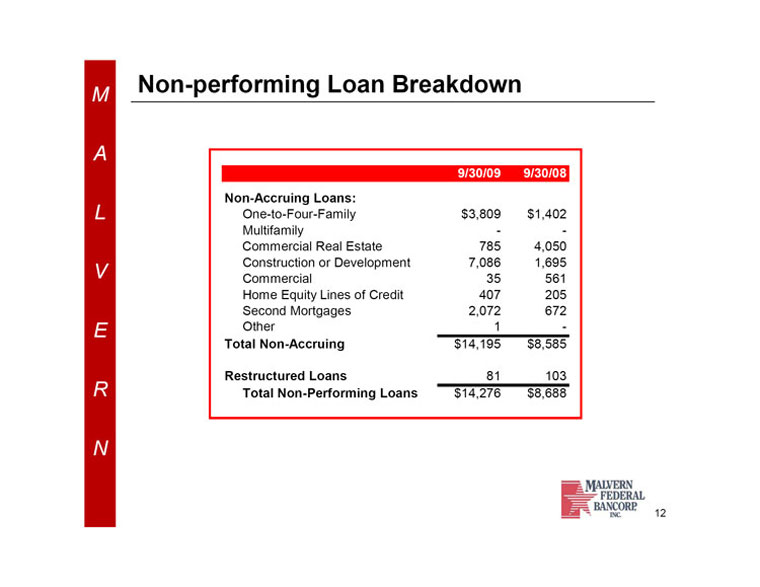 |
MALVERN Non-performing Loan Breakdown 9/30/09 9/30/08
Non-Accruing Loans: One-to-Four-Family $ 3,809 $ 1,402 Multifamily - -
Commercial Real Estate 785 4,050 Construction or Development 7,086 1,695
Commercial 35 561 Home Equity Lines of Credit 407 205 Second Mortgages
2,072 672 Other 1 -- Total Non-Accruing $14,195 $ 8,585 Restructured Loans
81 103 Total Non-Performing Loans $14,276 $ 8,688 12
|
|
|
|
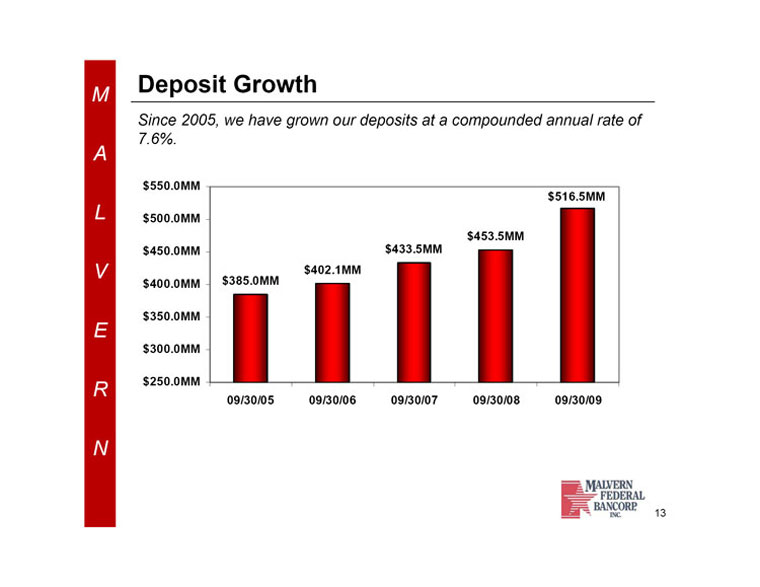 |
MALVERN Deposit Growth Since 2005, we have grown our
deposits at a compounded annual rate of 7.6%. $550.0MM $516.5MM $500.0MM
$453.5MM $450.0MM $433.5MM $402.1MM $400.0MM $385.0MM $350.0MM $300.0MM
$250.0MM 09/30/05 09/30/06 09/30/07 09/30/08 09/30/09 13
|
|
|
|
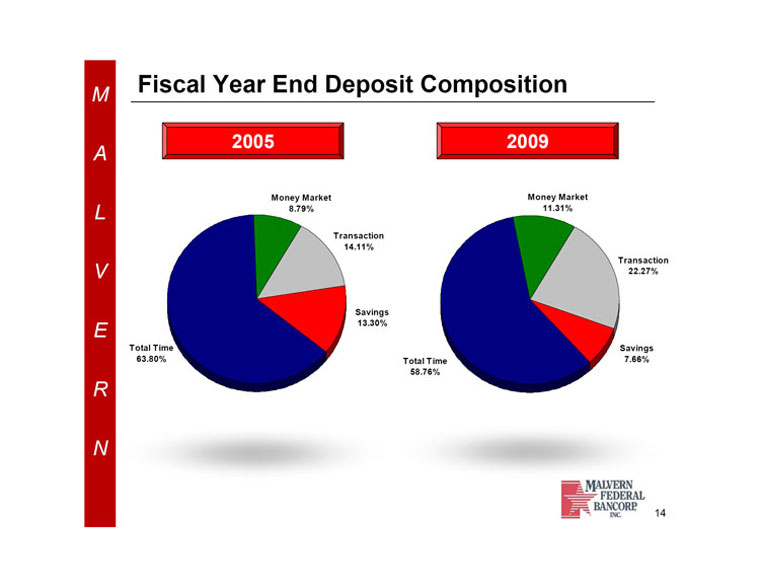 |
MALVERN Fiscal Year End Deposit Composition 2005 2009
Money Market 8.79% Money Market 11.31% Transaction 14.11% Transaction
22.27% Savings 13.30% Savings 7.66% Total Time 63.80% Total Time 58.76% 14
|
|
|
|
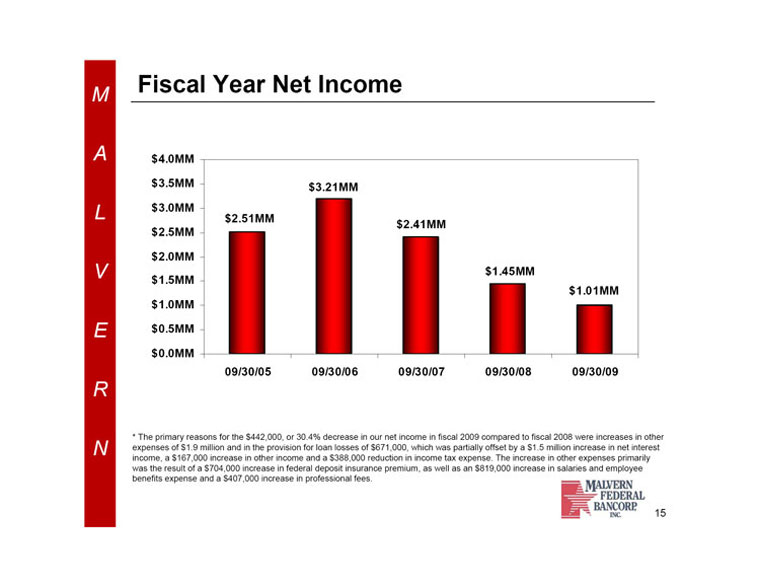 |
MALVERN Fiscal Year Net Income $4.0MM $2.51MM $3.21MM
$2.41MM $1.45MM $1.01MM $3.5MM $3.0MM $2.5MM $2.0MM $1.5MM $1.0MM $0.5MM
$0.0MM 09/30/05 09/30/06 09/30/07 09/30/08 09/30/09 * The primary reasons
for the $442,000, or 30.4% decrease in our net income in fiscal 2009
compared to fiscal 2008 were increases in other expenses of $1.9 million
and in the provision for loan losses of $671,000, which was partially
offset by a $1.5 million increase in net interest income, a $167,000
increase in other income and a $388,000 reduction in income tax expense.
The increase in other expenses primarily was the result of a $704,000
increase in federal deposit insurance premium, as well as an $819,000
increase in salaries and employee benefits expense and a $407,000 increase
in professional fees. 15
|
|
|
|
 |
MALVERN Net Income o Factors contributing to the
decrease in net income for fiscal year 2009: o A one time charge of
$320,000 for the FDIC special assessment, which was fully expensed in the
fiscal year ended September 30, 2009. o $532,000 in other real estate
owned expense. o A loss on the sale of other real estate owned of
$225,000, which decreased other income. o $671,000 increase in provision
for loan losses. 16
|
|
|
|
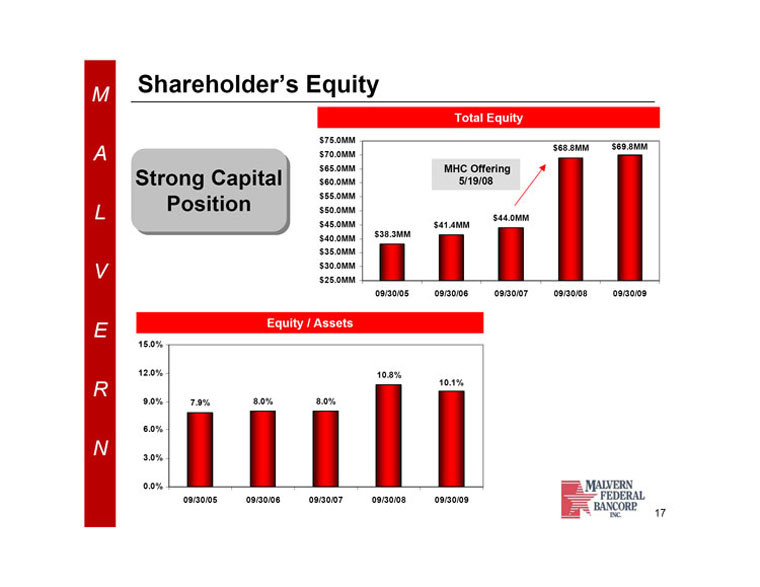 |
MALVERN Shareholder's Equity
----------------------------------------------------------------------------
-------------------------------------------------------- Total Equity
-------------------------------------------------------- $75.0MM $68.8MM
$69.8MM $70.0MM MHC Offering $65.0MM 5/19/08 Strong Capital $60.0MM
Position $55.0MM $50.0MM $44.0MM $45.0MM $41.4MM $40.0MM $38.3MM $35.0MM
$30.0MM $25.0MM 09/30/05 09/30/06 09/30/07 09/30/08 09/30/09 Equity /
Assets ------------------------------------------------------------ 15.0%
12.0% 10.8% 10.1% 9.0% 7.9% 8.0% 8.0% 6.0% 3.0% 0.0% 09/30/05 09/30/06
09/30/07 09/30/08 09/30/09 17
|
|
|
|
 |
MALVERN
--------------------------------------------------------------------------------
Market Statistics
--------------------------------------------------------------------------------
|
|
|
|
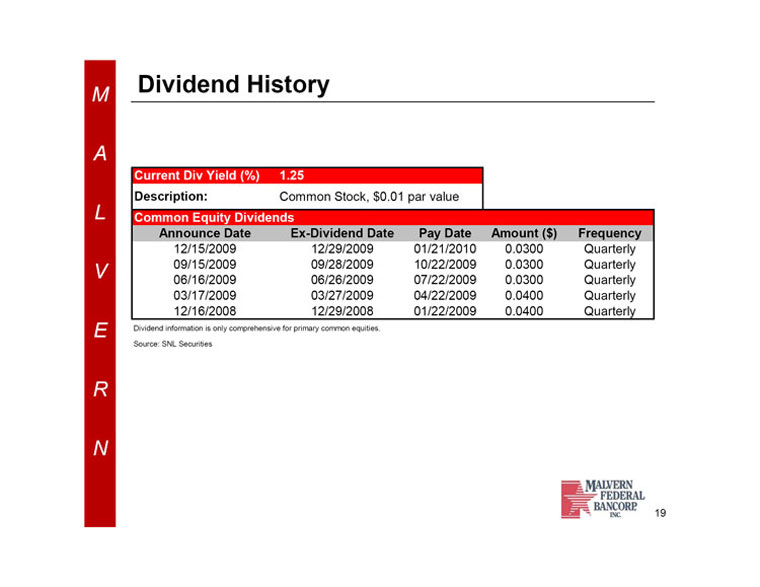 |
MALVERN Dividend History Current Div Yield (%) 1.25
Description: Common Stock, $0.01 par value Common Equity Dividends
Announce Date Ex-Dividend Date Pay Date Amount ($) Frequency 12/15/2009
12/29/2009 01/21/2010 0.0300 Quarterly 09/15/2009 09/28/2009 10/22/2009
0.0300 Quarterly 06/16/2009 06/26/2009 07/22/2009 0.0300 Quarterly
03/17/2009 03/27/2009 04/22/2009 0.0400 Quarterly 12/16/2008 12/29/2008
01/22/2009 0.0400 Quarterly Dividend information is only comprehensive for
primary common equities. Source: SNL Securities 19
|
|
|
|
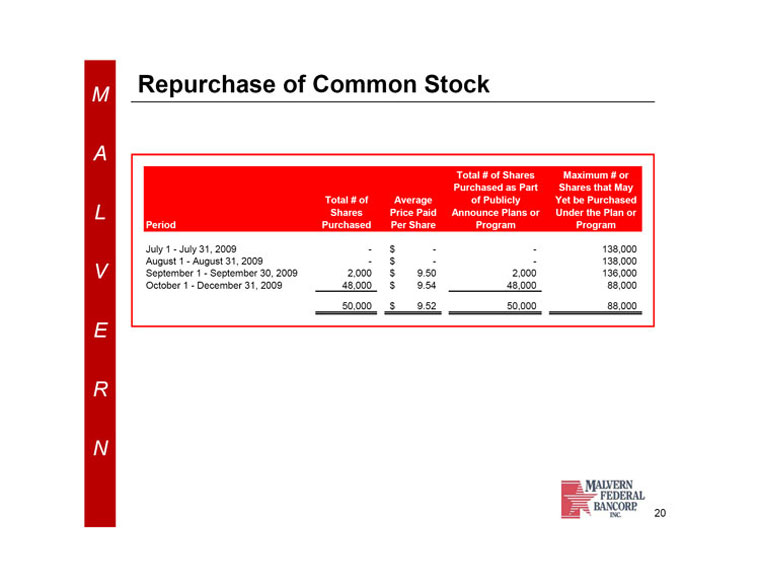 |
MALVERN Repurchase of Common Stock Total # of Shares
Maximum # or Purchased as Part Shares that May Total # of Average of
Publicly Yet be Purchased Shares Price Paid Announce Plans or Under the
Plan or Period Purchased Per Share Program Program July 1 - July 31, 2009
-- $ -- -- 138,000 August 1 - August 31, 2009 -- $ -- -- 138,000 September
1 - September 30, 2009 2,000 $ 9.50 2,000 136,000 October 1 - December 31,
2009 48,000 $ 9.54 48,000 88,000 50,000 $ 9.52 50,000 88,000 20
|
|
|
|
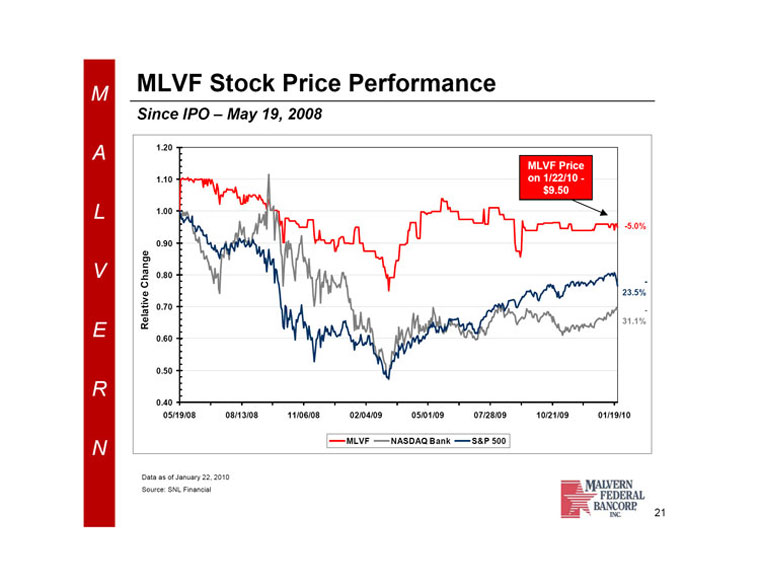 |
MALVERN MLVF Stock Price Performance Since IPO - May
19, 2008 MLVF Price on 1/22/10 - $9.50 Relative Change 1.20 1.10 1.00 0.90
0.80 0.70 0.60 0.50 0.40 05/19/08 08/13/08 11/06/08 02/04/09 05/01/09
07/28/09 10/21/09 01/19/10 -5.0% -23.5% -31.1% MLVF NASDAQ Bank S&P
500 Data as of January 22, 2010 Source: SNL Financial 21
|
|
|
|
 |
MALVERN 2010 Outlook o Continue to manage nonperforming
loans o Decrease other real estate owned o Continue to manage capital o
Improve deposit composition o Increase margin o Continue to add value to
Malvern shareholders 22
|
|
|
|
 |
MALVERN Questions?
|