Attached files
| file | filename |
|---|---|
| 8-K - COPANO ENERGY, L.L.C. FORM 8-K - Copano Energy, L.L.C. | form8-k.htm |

Copano
Energy
January
Investor Presentation
NASDAQ: CPNO
NASDAQ: CPNO
January
26, 2010

Copano
Energy
2
Disclaimer
Statements made by
representatives of Copano Energy, L.L.C. (“Copano”) during this
presentation will include “forward-looking statements,” as defined in the federal securities laws.
All statements that address activities, events or developments that Copano expects, believes or
anticipates will or may occur in the future are forward-looking statements. Underlying these
forward-looking statements are certain assumptions made by Copano’s management based on
their experience and perception of historical trends, current conditions, expected future
developments and other factors management believes are appropriate under the circumstances.
Whether
actual results and developments in the future will conform to Copano’s
expectations is
subject to a number of risks and uncertainties, many of which are beyond Copano’s control. If
one or more of these risks or uncertainties materializes, or if underlying assumptions prove
incorrect, then Copano’s actual results may differ materially from those implied or expressed by
forward-looking statements made during this presentation. These risks and uncertainties include
the volatility of prices and market demand for natural gas and natural gas liquids; Copano’s ability
to complete any pending acquisitions and integrate any acquired assets or operations; Copano’s
ability to continue to obtain new sources of natural gas supply; the ability of key producers to
continue to drill and successfully complete and attach new natural gas supplies; Copano’s ability
to retain key customers; the availability of local, intrastate and interstate transportation systems
and other facilities to transport natural gas and natural gas liquids; Copano’s ability to access
sources of liquidity when needed and to obtain additional financing, if necessary, on acceptable
terms; the effectiveness of Copano’s hedging program; unanticipated environmental or other
liability; general economic conditions; the effects of government regulations and policies; and
other financial, operational and legal risks and uncertainties detailed from time to time in the Risk
Factors sections of Copano’s annual and quarterly reports filed with the Securities and Exchange
Commission.
Copano
undertakes no obligation to update any forward-looking statements, whether as a
result
of new information or future events.
of new information or future events.
Copano
Energy
3
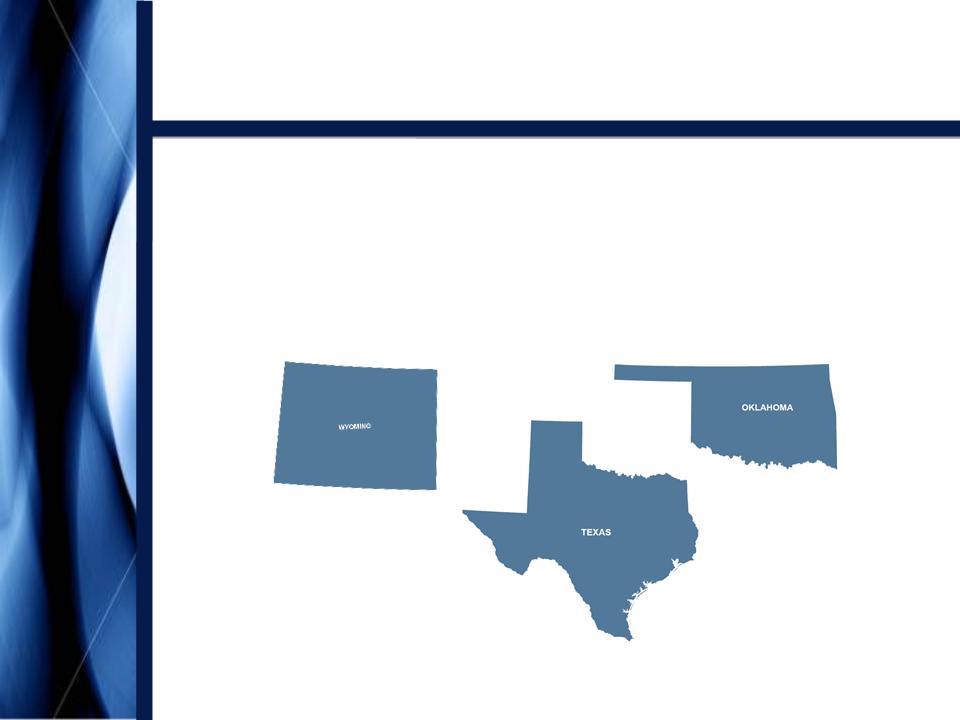
Introduction to
Copano
• Founded in 1992 as
an independent midstream company
• Serves natural gas
producers in three producing areas
Texas
South
Texas and
North
Texas
Oklahoma
Central
and Eastern Oklahoma
Rocky
Mountains
Wyoming’s Powder
River Basin

Copano
Energy
4
Key
Metrics
• Service throughput
volumes
approximate 2 Bcf
per day of natural
gas(1)
gas(1)
• Approximately 6,700
miles of active pipelines
• 7 natural gas
processing plants with over 1 Bcf/d of combined
processing capacity
processing capacity
• Equity market cap:
$1.5 billion(2)
• Enterprise value:
$2.3 billion(2)
(1) Based
on 3Q09 results. Includes
unconsolidated affiliates.
(2) As
of January 21, 2010.
Copano
Energy
5
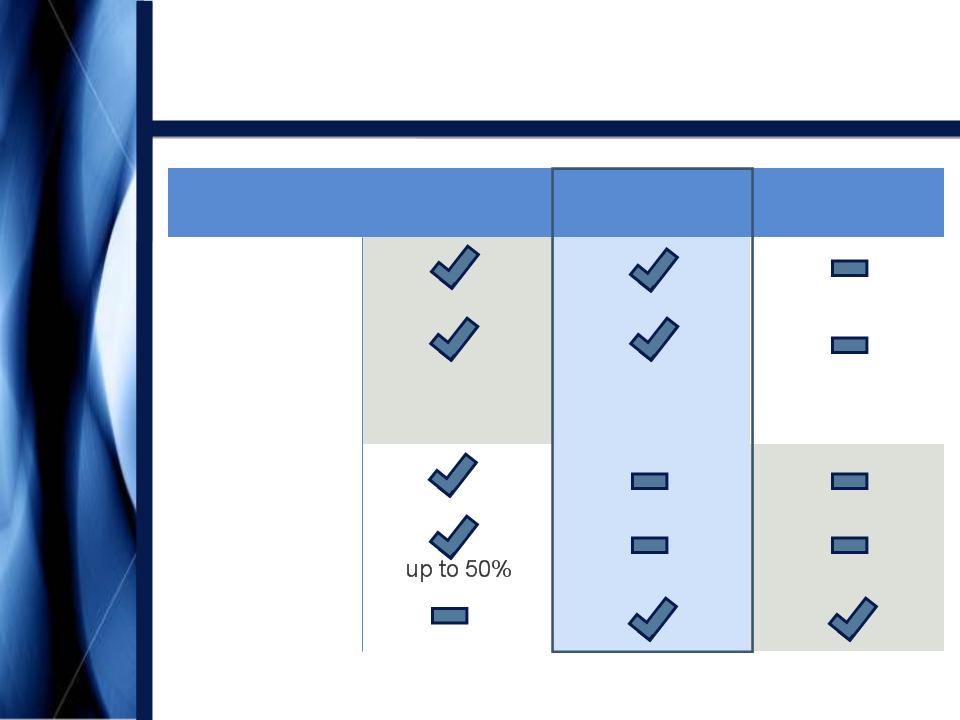
Copano’s LLC
Structure
|
Characteristic
|
Typical
MLP
|
Copano
Energy
|
Typical
Corporation |
|
Non-Taxable
Entity |
|
|
|
|
Tax Shield
on
Distributions |
|
|
|
|
Tax
Reporting
|
|
|
|
|
General
Partner
|
|
|
|
|
Incentive
Distribution Rights |
|
|
|
|
Voting
Rights
|
|
|
|
Schedule
K-1
Schedule
K-1
Form
1099

Copano
Energy
6
Agenda
Throughput
Volume Outlook
Volume Outlook
Commodity
Prices and
Margin
Sensitivities
Prices and
Margin
Sensitivities
Capital
and
Liquidity
Liquidity
Distribution
Policy
and Outlook
and Outlook
Copano
Energy
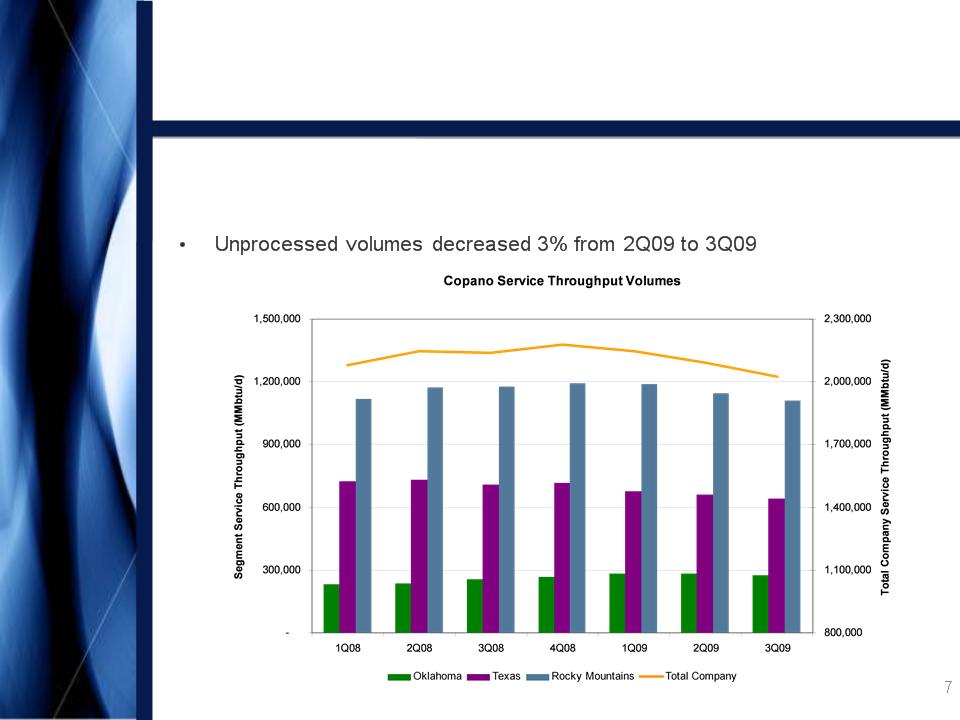
• Total service
throughput volumes decreased 3% from 2Q09 to 3Q09
• Processed volumes
decreased 2% from 2Q09 to 3Q09
Total
Volume Trends
Note:
Includes affiliates, net of intercompany volumes.

Copano
Energy
8
• Rich gas (primarily
Hunton de-watering play)
– Drilling activity
remains steady with current commodity prices
and long-term price outlook
and long-term price outlook
– 2 rigs currently
running in the Hunton and 8 rigs in other rich
gas areas
gas areas
– High BTU gas,
processing upgrade and low geologic risk
enhance drilling economics, but activity remains subject to
market conditions
enhance drilling economics, but activity remains subject to
market conditions
– 4Q09 volumes are
expected to be down vs. 3Q09 due to
delayed down-hole repair schedules, shut-in volumes and
weather related issues
delayed down-hole repair schedules, shut-in volumes and
weather related issues
• Lean gas (primarily
Woodford Shale and Coalbed methane)
– Drilling activity
slightly increasing with current commodity
prices and long-term price outlook
prices and long-term price outlook
– 8 rigs currently
running
– 4Q09 volumes are
expected to be slightly down from 3Q09
due to normal declines and lag between drilling and production
due to normal declines and lag between drilling and production
Oklahoma Volume
Outlook
Copano
Energy
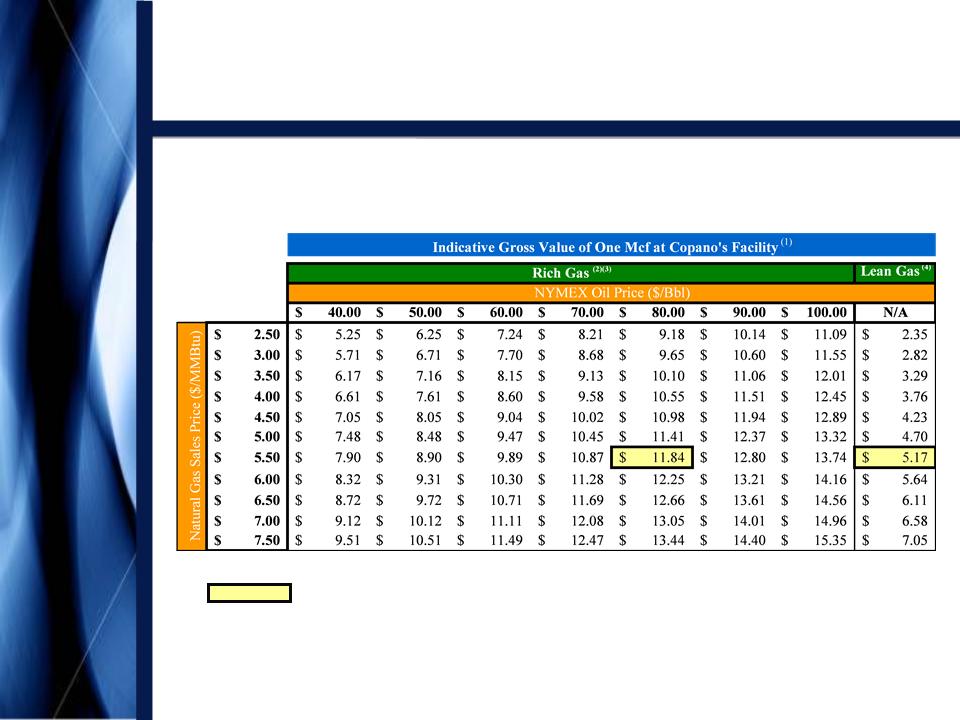
Oklahoma Rich Gas
vs. Lean Gas
(1) Full
value prior to deduction of Copano’s margin. Excludes
value of condensate and crude oil recovered by the
producer at the wellhead.
producer at the wellhead.
(2) Implied
NGL prices are based on a six-year historical regression analysis.
(3) Assumes
9 GPM gas with a Btu factor of 1.375 processed at Copano’s cryogenic plant, and
field fuel of 6.25%.
(4) Assumes
unprocessed gas with a Btu factor of 1.0 and field fuel of 6%.
9
Prices
as of 1/21/10

Copano
Energy
10
South
Texas Volume Outlook
• Recently connected a
third Eagle Ford Shale well, which IP’d at
17 MMcf/d
17 MMcf/d
• In 4Q09, announced
plans for a joint venture with Kinder Morgan
to provide gathering, transportation and processing services to
gas producers in the Eagle Ford Shale
to provide gathering, transportation and processing services to
gas producers in the Eagle Ford Shale
• 4Q09 volumes are
expected to be slightly down from 3Q09
• In December 2009,
FERC issued an order denying Transco
authority to abandon its McMullen Lateral pipeline in South Texas
by sale to Copano. Copano and Transco will not file for rehearing
authority to abandon its McMullen Lateral pipeline in South Texas
by sale to Copano. Copano and Transco will not file for rehearing

Copano
Energy
11
Texas
Fractionation Strategy
• Capacity at NGL
fractionation facilities along the Texas Gulf Coast
remains constrained
remains constrained
• Utilizing Houston
Central’s fractionation unit and extensive tailgate
NGL pipelines, Copano plans to produce purity products by 2Q10
NGL pipelines, Copano plans to produce purity products by 2Q10
– Copano is expanding
its de-ethanization capacity in order to produce
purity ethane and propane
purity ethane and propane
– Iso-butane and
normal butane will be sold as purity products by tank
truck

Copano
Energy
12
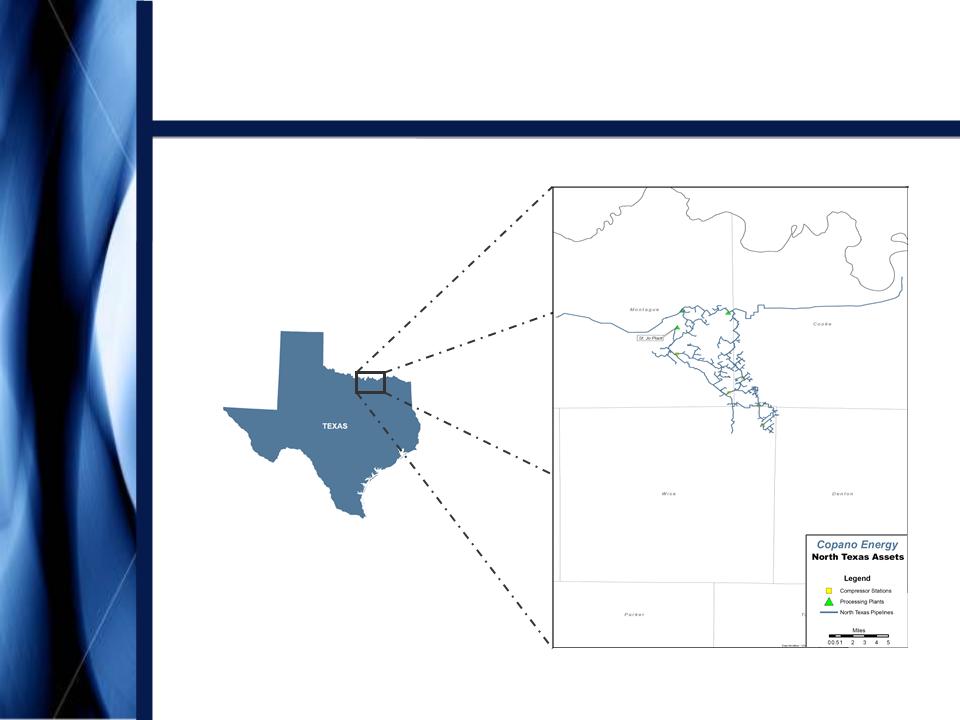
North
Texas Volume Outlook
• 9 rigs running in
the area with
an additional 2-4 rigs
anticipated in 1Q10
an additional 2-4 rigs
anticipated in 1Q10
• Drilling economics
are driven
by associated crude oil
production
by associated crude oil
production
• Production from this
area
requires a full slate of
midstream services
requires a full slate of
midstream services
• Based on producer
drilling
schedule, plant inlet volumes
are expected to steadily
increase in 2010
schedule, plant inlet volumes
are expected to steadily
increase in 2010

Copano
Energy
13
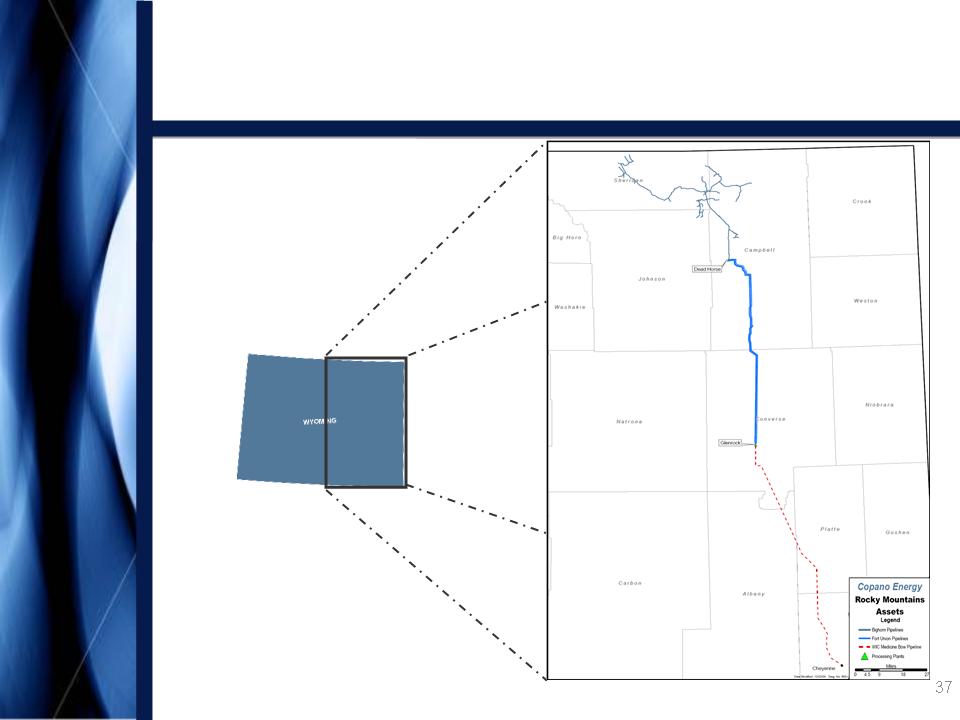
Rocky
Mountains Volume Outlook
• Drilling and
dewatering will be driven by producer economics and
commodity prices
commodity prices
• 4Q09 volumes are
expected to be flat vs. 3Q09 due to previously
drilled wells
drilled wells
• For Bighorn, 130
previously drilled wells can be connected with
minimal capital expenditures
minimal capital expenditures
– An additional 70
drilled wells can be connected with moderate capital
expenditures
expenditures
• On Fort Union,
during the third and fourth quarters, roughly 150
MMcf/d was temporarily shut in by producers due to commodity prices;
by mid-October, volumes were back to near pre-shut-in levels
MMcf/d was temporarily shut in by producers due to commodity prices;
by mid-October, volumes were back to near pre-shut-in levels

Copano
Energy
14
Commodity Prices and
Margin
Sensitivities
Sensitivities
Commodity
Prices and
Margin
Sensitivities
Prices and
Margin
Sensitivities
Distribution
Policy
and Outlook
and Outlook
Capital
and
Liquidity
Liquidity
Throughput
Volume Outlook
Volume Outlook
Copano
Energy
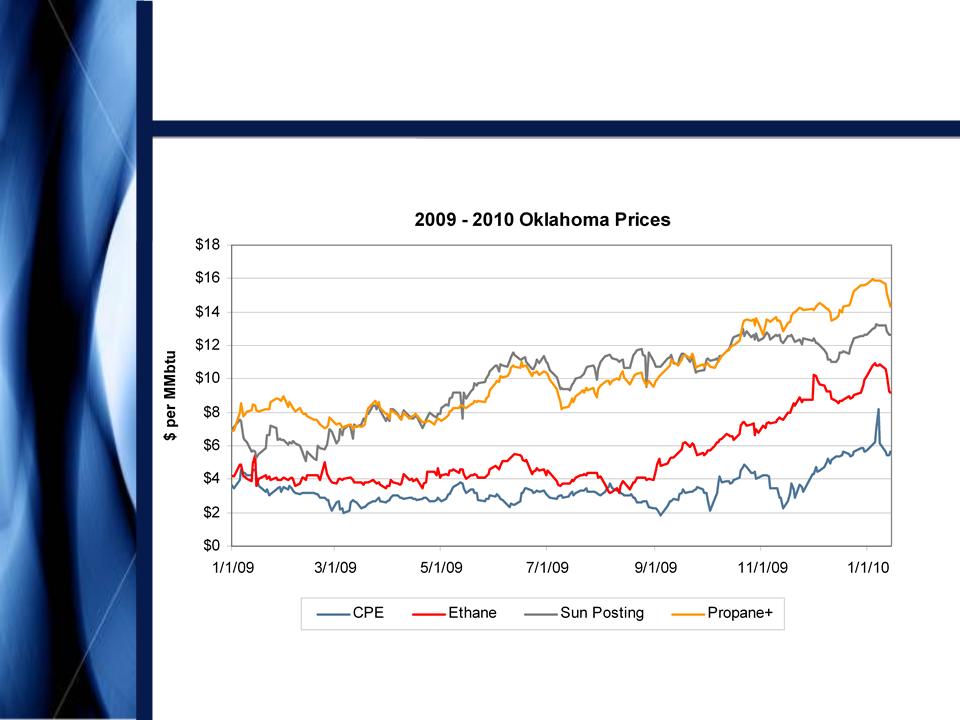
Oklahoma Commodity
Prices
15

Copano
Energy
16
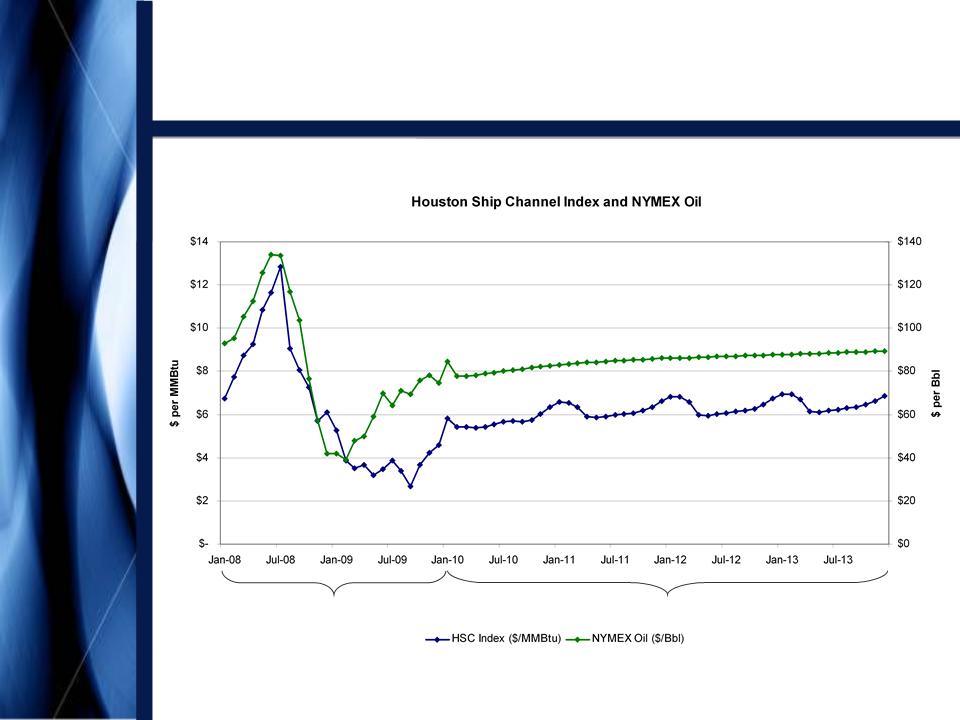
Actual
Prices: 1/08 - 1/10
Forward
Prices as of 1/21/10: 2/10 - 12/13
Oklahoma Natural Gas
Price
Outlook
Outlook
Copano
Energy
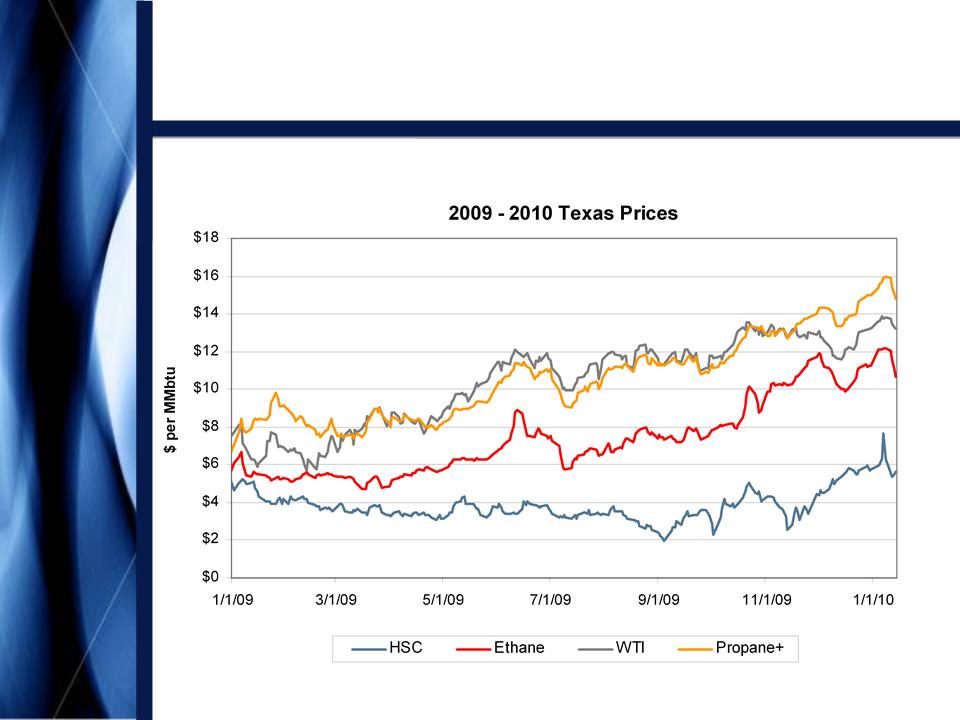
17
Texas
Commodity Prices
Copano
Energy
18
Actual
Prices: 1/08 - 1/10
Forward
Prices as of 1/21/10: 2/10 - 12/13
South
Texas Natural Gas Price
Outlook
Outlook
Copano
Energy
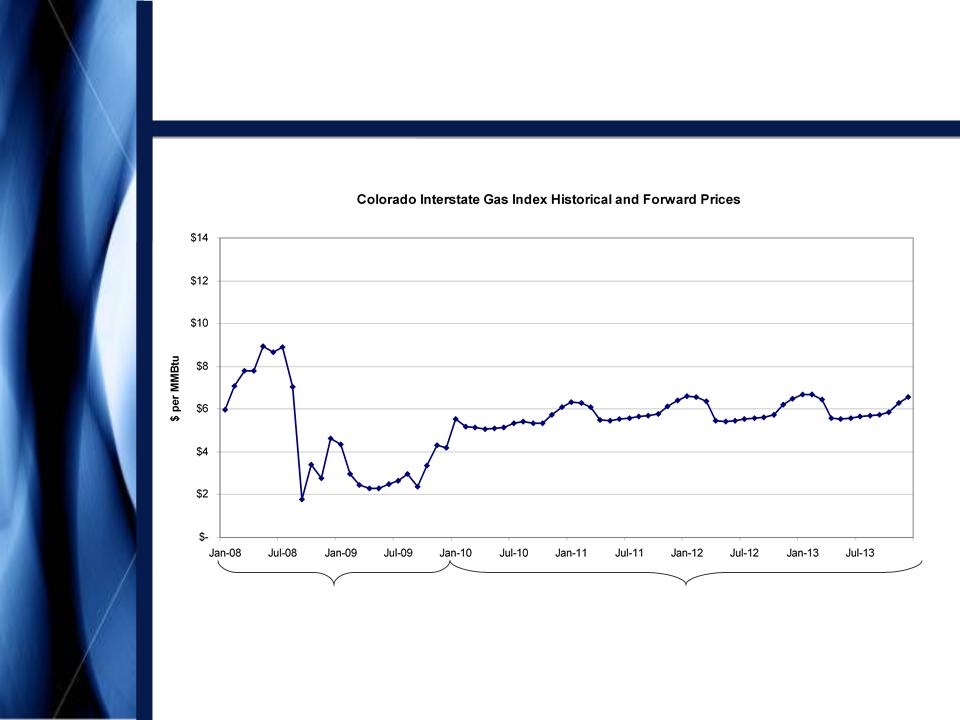
19
Actual
Prices: 1/08 - 1/10
Forward
Prices as of 1/21/10: 2/10 - 12/13
Rocky
Mountains Natural Gas Price
Outlook
Outlook
Copano
Energy
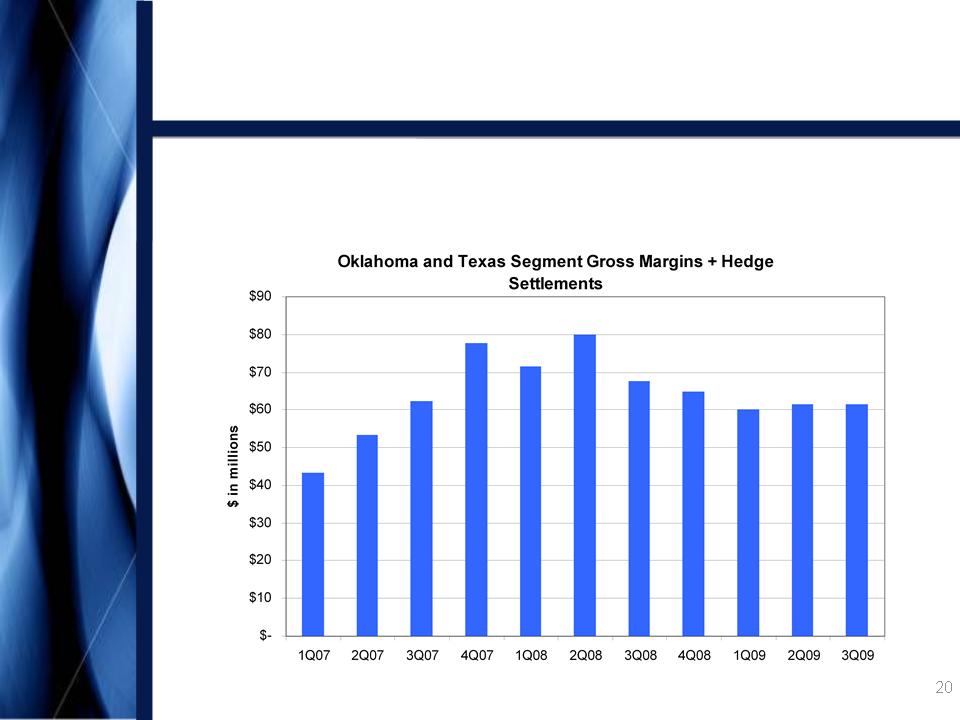
Combined
Commodity-Sensitive Segment Margins
and Hedging Settlements
and Hedging Settlements
• Copano’s hedge
portfolio supports cash flow stability based on
combined segment gross margins and cash hedging settlements
combined segment gross margins and cash hedging settlements
Copano
Energy
21
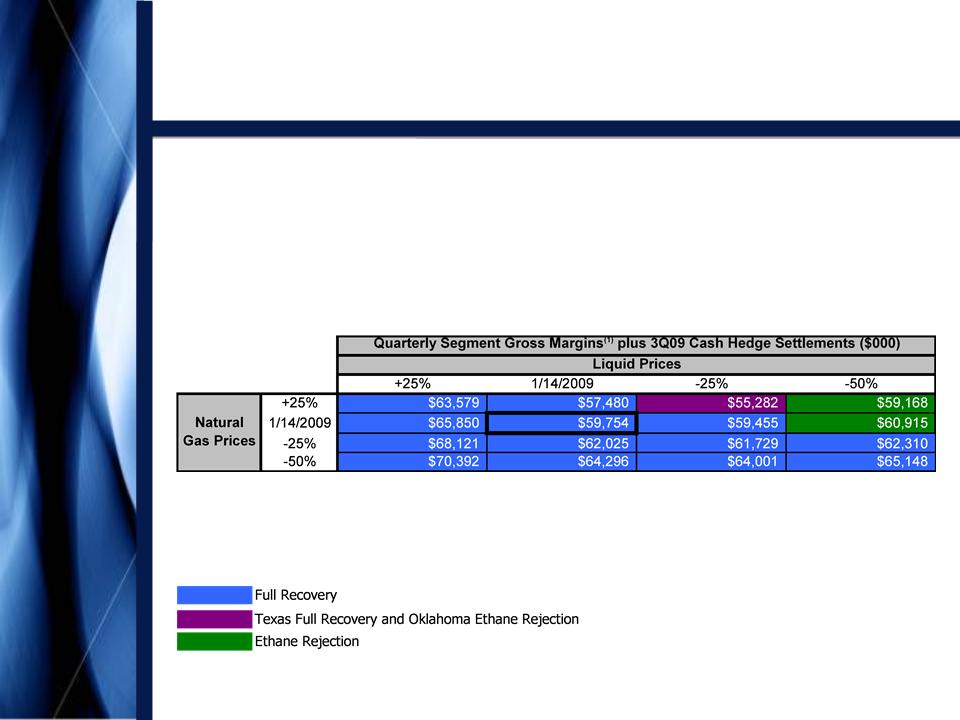
Commodity-Related
Margin
Sensitivities
Sensitivities
Note: Please
see Appendix for definitions of processing modes and additional
details.
• Matrix reflects 3Q09
wellhead and plant inlet volumes,
adjusted using Copano’s 2009 planning model
adjusted using Copano’s 2009 planning model
(1) Consists
of Texas and Oklahoma Segment gross margins.
Copano
Energy
22
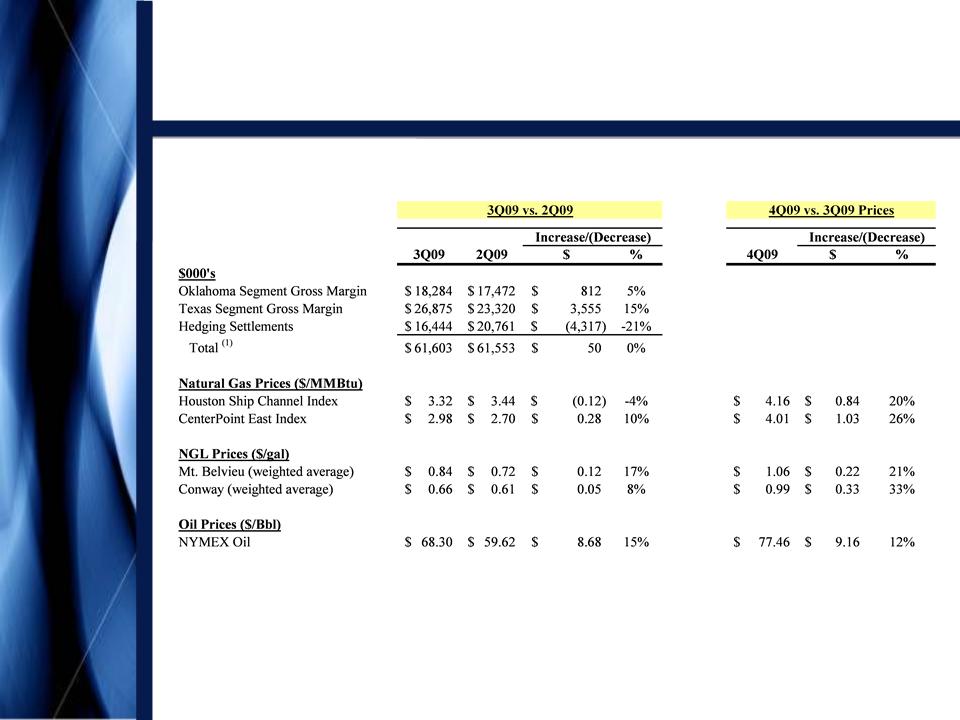
Combined
Commodity-Sensitive Segment Margins
and Hedging Settlements
and Hedging Settlements
(1) Does
not include non-cash expenses included in Corporate and Other for purposes of
calculating Total Segment
Gross Margin. See Appendix for reconciliation of Total Segment Gross Margin.
Gross Margin. See Appendix for reconciliation of Total Segment Gross Margin.

Copano
Energy
23
Capital
and Liquidity
Capital
and
Liquidity
Liquidity
Distribution
Policy
and Outlook
and Outlook
Commodity
Prices and
Margin
Sensitivities
Prices and
Margin
Sensitivities
Throughput
Volume Outlook
Volume Outlook

Copano
Energy
24
2010
Expansion Capital
• Copano has
approximately $105 million(1) in approved
expansion capital projects for 2010. Major areas of focus
include:
expansion capital projects for 2010. Major areas of focus
include:
– Eagle Ford Shale and
Houston Central processing plant in
south Texas
south Texas
– Saint Jo processing
plant and pipelines in north Texas
– Additional pipeline
and processing capacity in Oklahoma
• Financing to be
consistent with Copano’s historical policy -
balance of debt and equity
balance of debt and equity
(1) Includes
Copano’s net share for unconsolidated affiliates. Does not
include future potential acquisitions.

Copano
Energy
25
Liquidity and Debt
Facilities
• At September 30,
2009:
– Cash: $35
million
– $550 million
revolving credit facility
• Approximately $290
million available
• Remaining term:
approximately 3.1 years
• LIBOR + 175
bps
– $582 million senior
notes
• $332,665,000 8 ⅛%
due 2016
• $249,525,000 7 ¾%
due 2018
• Weighted average
rate: 7.96%
• Weighted average
maturity: 7.4 years

Copano
Energy
• Senior Secured
Revolving Credit Facility
– $550 million
facility with $100 million accordion
– Maintenance
tests:
• 5x total debt to
defined EBITDA(1)
limitation
§ 3.99x at September
30, 2009
• Minimum required
interest coverage 2.5x defined EBITDA
§ 3.41x at September
30, 2009
• Defined EBITDA adds
back hedge amortization and other non-cash
expenses
expenses
– Following an
acquisition, Copano may increase total debt to defined
EBITDA limitation to 5.5x for three quarters
EBITDA limitation to 5.5x for three quarters
• Senior
Notes
– Incurrence
tests:
• Minimum defined
EBITDA to interest test of 2.00x for debt incurrence
• Minimum defined
EBITDA to interest test of 1.75x for restricted payments
• Defined EBITDA is
similar to that for credit facility
26
Key
Debt Terms and Covenants
(1) See
Appendix for reconciliation of defined EBITDA, which is referred to in our
credit facility as “Consolidated
EBITDA.”
EBITDA.”

Copano
Energy
27
Distribution Policy
and Outlook
Distribution
Policy
and Outlook
and Outlook
Capital
and
Liquidity
Liquidity
Commodity
Prices and
Margin
Sensitivities
Prices and
Margin
Sensitivities
Throughput
Volume Outlook
Volume Outlook
Copano
Energy
28
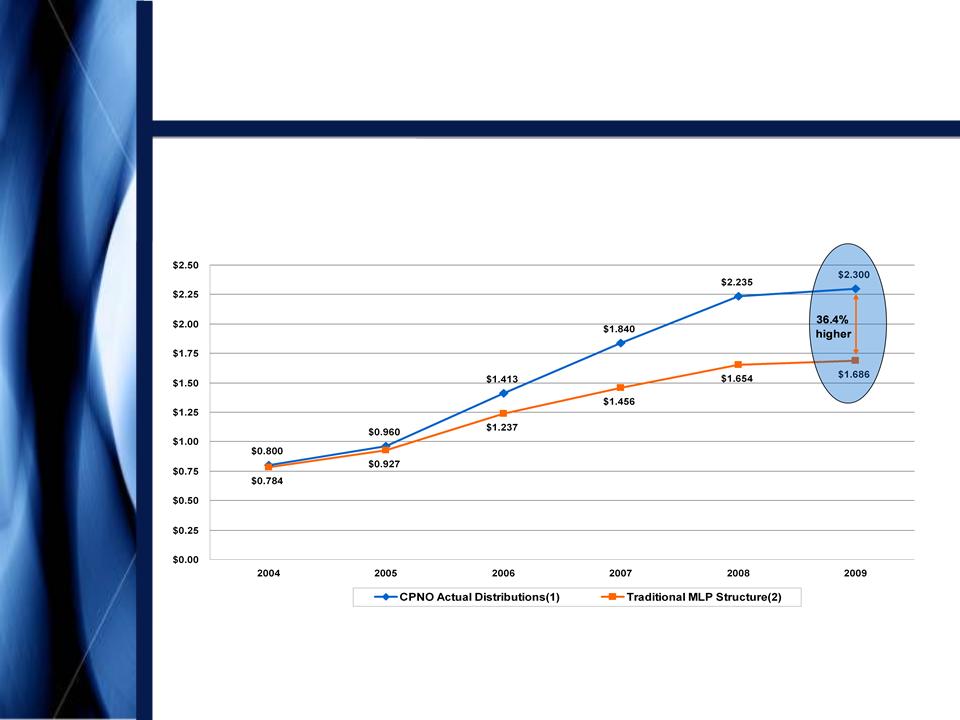
Distribution Track
Record
• On January 13, 2010,
Copano announced a cash distribution for
the fourth quarter of 2009 of $0.575 per common unit
the fourth quarter of 2009 of $0.575 per common unit
(3)(4)
(1) All
pre-1Q 2007 distributions are adjusted to reflect Copano’s 3/30/07 two-for-one
unit split.
(2) Assumes
generic MLP splits with 10%, 25% & 50% increases in distributable cash flow
to LP units resulting in
incremental 13%, 23% and 48% increases in the percentage of total distributable cash flow applicable to the GP.
incremental 13%, 23% and 48% increases in the percentage of total distributable cash flow applicable to the GP.
(3) Actual
$0.10 distribution per unit was for the period from November 15, 2004 through
December 31, 2004.
(4) 4Q
2004 annualized.

Copano
Energy
29
Distribution
Outlook
|
Driver
|
Potential
2011 - 2012
Annual Incremental Total DCF Impact(1) ($
in millions)
|
Comments
and Risk
Factors |
|
Forward
Commodity Prices
(3Q09 vs. 2012 forward curve(2) and without hedges) |
$60
|
• Reflects
January 2010
forward curve(2) • Future market
conditions
|
|
North
Texas
|
$35 -
$45
|
• Resource
play
• Drilling
activity
• Product
prices
|
|
South Texas
Fractionation
Expansion and Development Projects (2) |
$25 -
$30
|
• Eagle Ford
Shale
development • Drilling
activity
• Product
prices
• New
attachments
|
(1) Compared
to 3Q09 annualized levels. See
Appendix for an explanation of how we calculate total distributable
cash flow.
cash flow.
(2) Reflects
January 2010 forward price curves with regression-based NGL
prices.

Copano
Energy
30
Distribution
Outlook
|
Driver
|
Potential
2011 - 2012
Annual Incremental Total DCF Impact(1) ($
in millions)
|
Comments
and Risk
Factors |
|
Oklahoma
Volumes(2)
|
$15 -
$20
|
• Resource
play
• Drilling
activity
• Product
prices
|
|
Rocky
Mountains
|
$10 -
$20
|
• Resource
play
• Drilling
activity
• Dewatering
rates
• New
projects
|
|
Future
Acquisitions and Major
Projects |
TBD
|
• Build-out of
Corporate
Development team • Opportunities
• Execution
|
(1) Compared
to 3Q09 annualized levels. See
Appendix for an explanation of how we calculate total distributable
cash flow.
cash flow.
(2) Reflects
January 2010 forward price curves with regression-based NGL
prices.

Copano
Energy
• On October 14, 2009,
EnergyPoint Research, Inc. announced
results of its Natural Gas Midstream Services Survey
results of its Natural Gas Midstream Services Survey
• Copano placed first
overall among 16 midstream energy
companies. Copano also rated first in many categories for
gathering and processing/treating
companies. Copano also rated first in many categories for
gathering and processing/treating
31
#1 in
Customer Satisfaction

Copano
Energy
• Current cash flow
trends remain solid
• Forward market
prices should support continued drilling activity in
our cost-competitive operating regions
our cost-competitive operating regions
• Copano’s liquidity
and access to capital remain strong
• Copano continues to
enjoy an abundant opportunity environment
32
Conclusions

Copano
Energy
33
Appendix
Copano
Energy
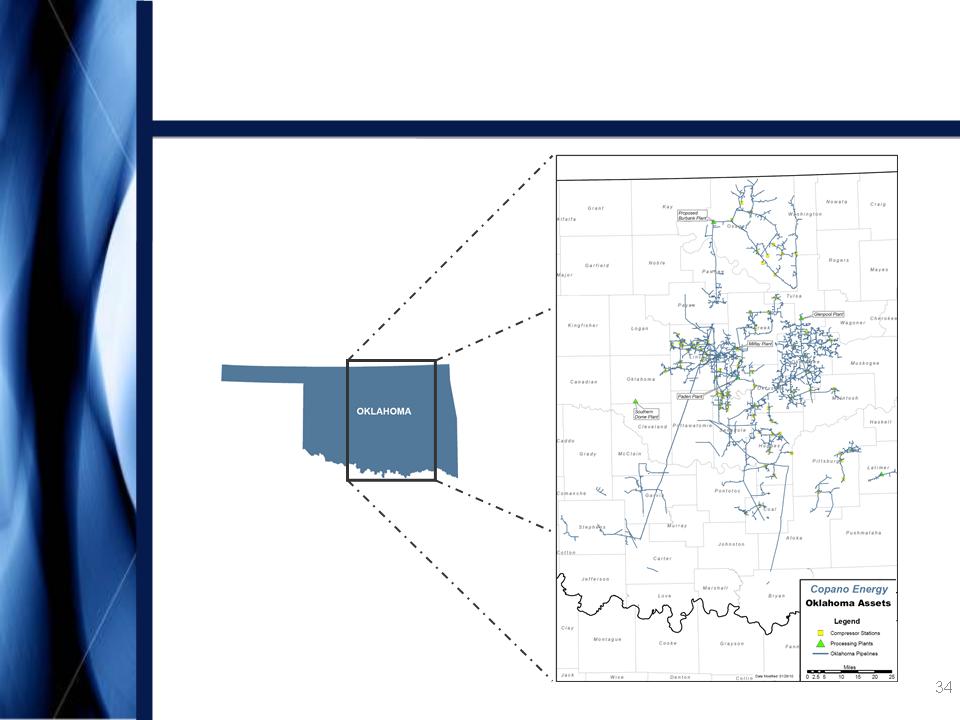
Oklahoma
Assets
Appendix
Copano
Energy
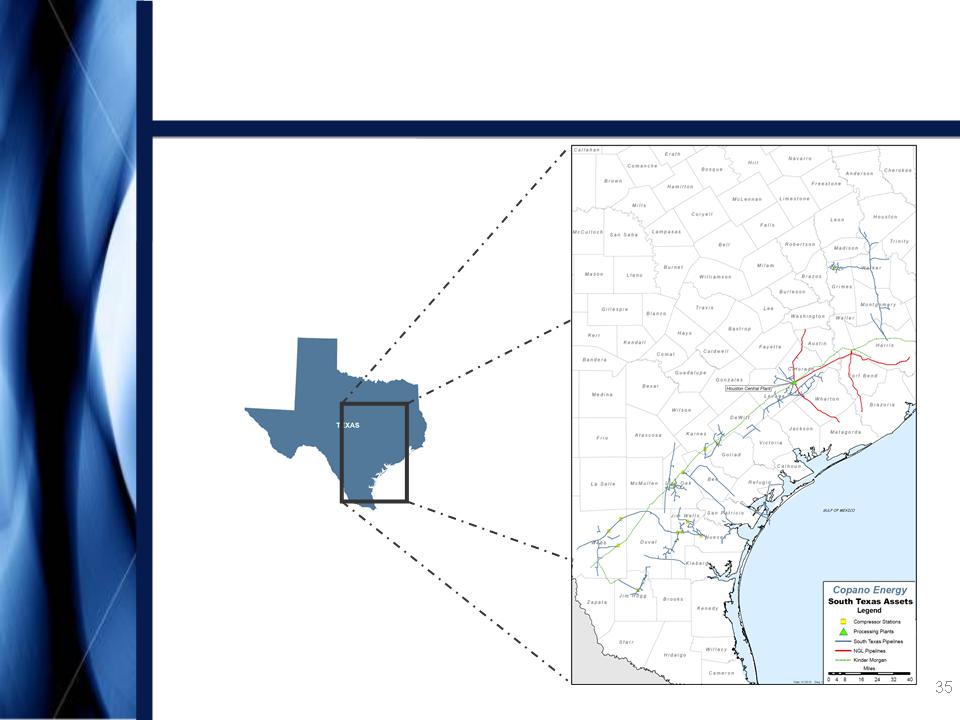
South
Texas Assets
Appendix
Copano
Energy
36
North
Texas Assets
Appendix
Copano
Energy
Rocky
Mountains Assets
Appendix

Copano
Energy
38
Processing
Modes
• Full
Recovery
• Ethane
Rejection
• Conditioning
Mode
→ Texas and Oklahoma -
If the value of
recovered NGLs exceeds the fuel and gas
shrinkage costs of recovering NGLs
recovered NGLs exceeds the fuel and gas
shrinkage costs of recovering NGLs
→ Texas - If the value
of recovered NGLs is less
than the fuel and gas shrinkage cost of
recovering NGLs (available at Houston
Central plant and at Saint Jo plant in North
Texas)
than the fuel and gas shrinkage cost of
recovering NGLs (available at Houston
Central plant and at Saint Jo plant in North
Texas)
→ Texas and Oklahoma -
If the value of ethane
is less than the fuel and shrinkage costs to
recover ethane (in Oklahoma, ethane
rejection at Paden plant is limited by nitrogen
rejection facilities)
is less than the fuel and shrinkage costs to
recover ethane (in Oklahoma, ethane
rejection at Paden plant is limited by nitrogen
rejection facilities)
Appendix

Copano
Energy
39
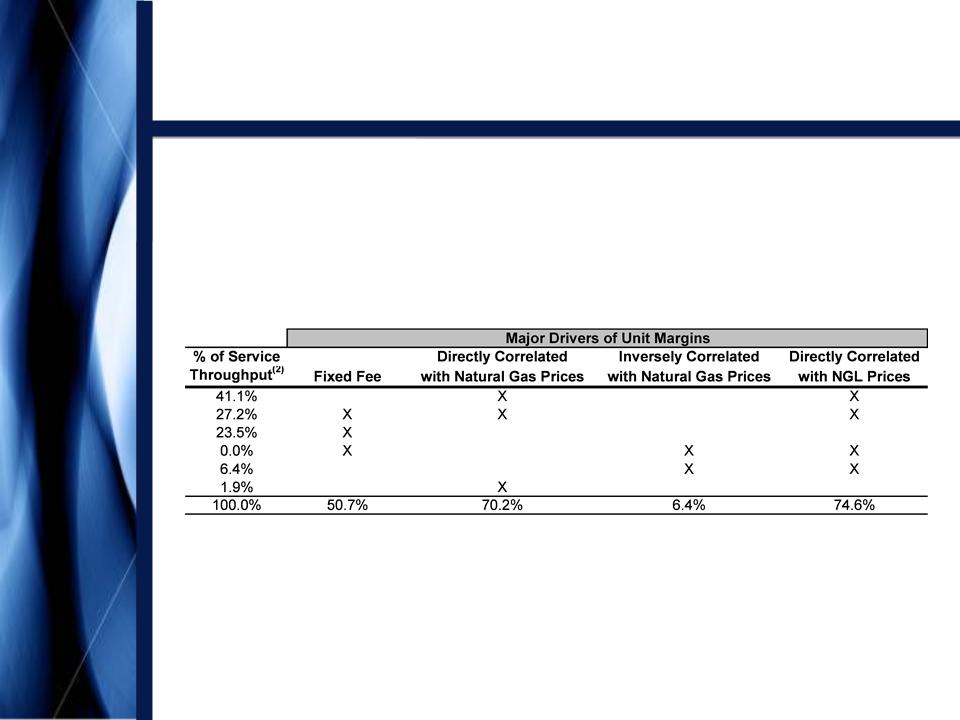
Oklahoma Commercial
Update
• Third Quarter
2009
– Total service
throughput volumes: 260,000 MMBtu/d(1)
– Unit margin:
$0.76/MMBtu(2)
– Margins from
approximately 75% of contract volumes are directly
correlated with NGL prices
correlated with NGL prices
– Significant
percentage of contract volumes (51%) contain fee-based
components, including volumes subject to minimum margin provisions
components, including volumes subject to minimum margin provisions
• Operated in full
processing mode for third and fourth quarter 2009
(1) Excludes
13,857
MMBtu/d service throughput for Southern Dome, a majority-owned
affiliate.
(2) Refers
to Oklahoma segment gross margin ($18.3
million) divided by Oklahoma service throughput volumes
(268,000 MMBtu/d) for the period. See this Appendix for reconciliation of Oklahoma segment gross margin.
(268,000 MMBtu/d) for the period. See this Appendix for reconciliation of Oklahoma segment gross margin.
Appendix
Copano
Energy
40
Oklahoma Contract
Mix
• Third quarter 2009
contract mix(1)
(1) Source:
Copano Energy internal financial planning models for consolidated
subsidiaries.
(2) Excludes
13,857 MMBtu/d service throughput for Southern Dome, a majority-owned
affiliate.
Appendix
Copano
Energy
41
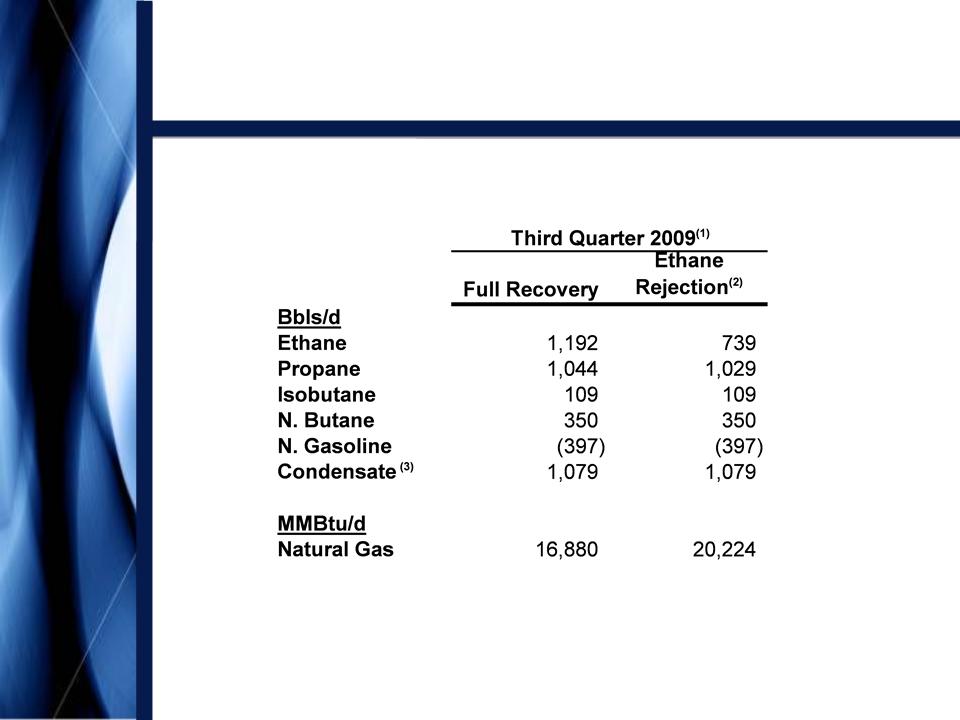
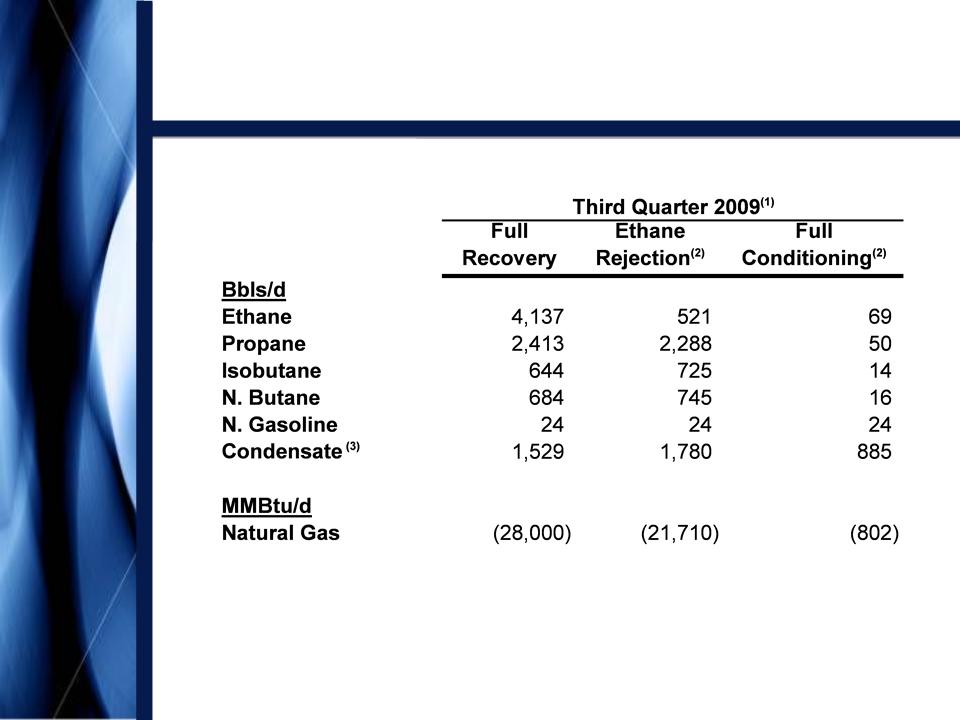
Oklahoma Net
Commodity
Exposure
Exposure
Note: See
explanation of processing modes in this Appendix. Values
reflect rounding.
(1) Source: Copano
Energy internal financial planning models for consolidated
subsidiaries.
(2) Ethane
rejection at Paden plant is limited by nitrogen rejection
facilities.
(3) Reflects
impact of producer delivery point allocations, offset by field condensate
collection and stabilization.
Appendix
Copano
Energy
42
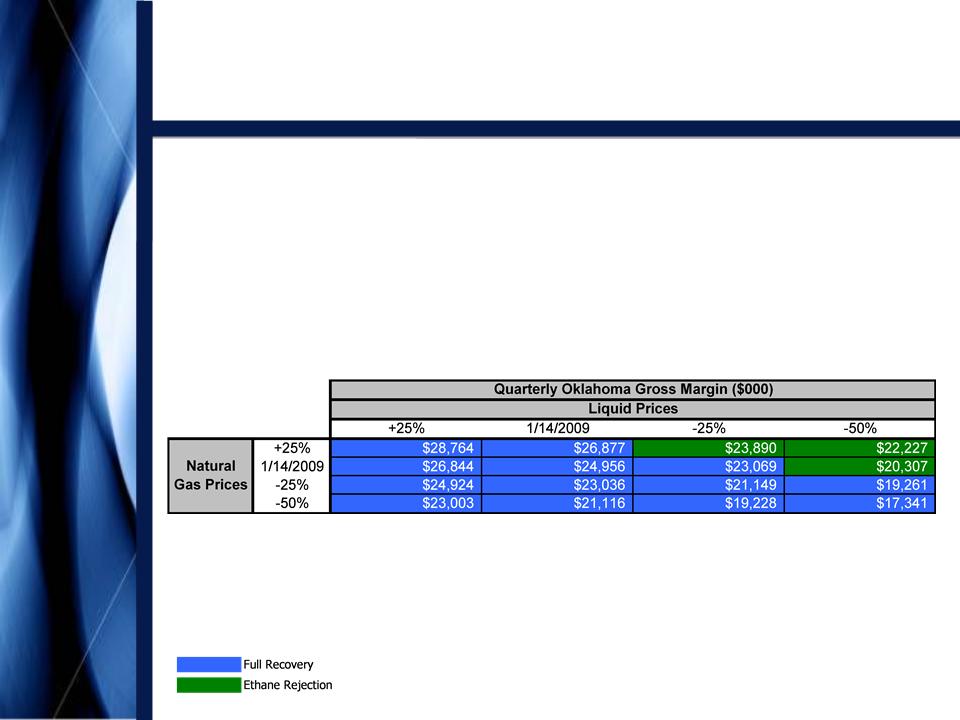
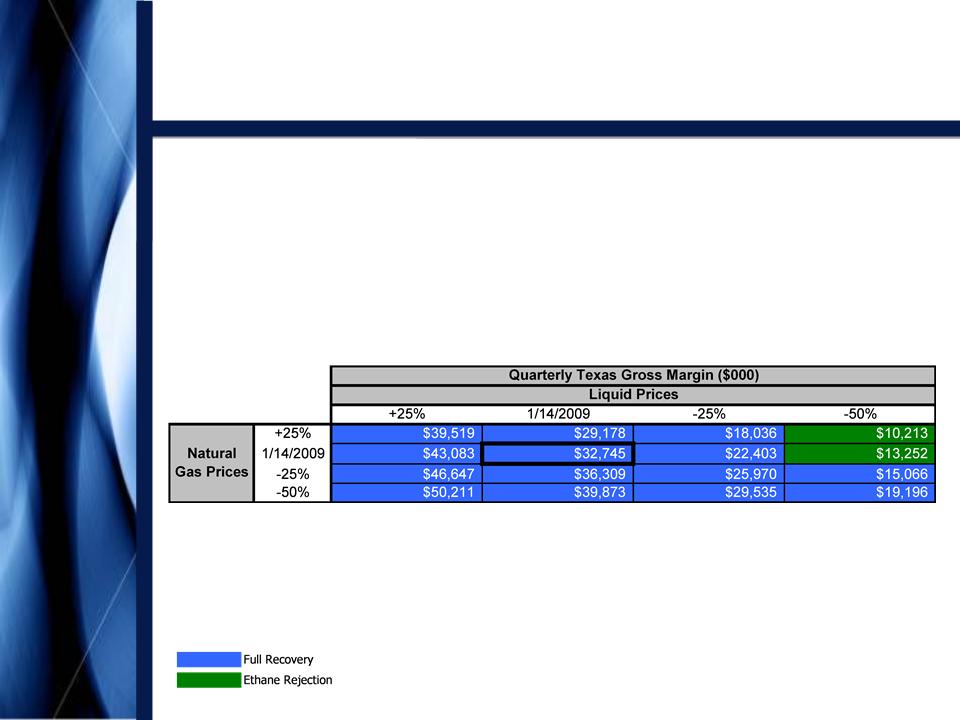
Oklahoma Commodity
Price
Sensitivities
Sensitivities
• Oklahoma segment
gross margins excluding hedge
settlements
settlements
– Matrix reflects 3Q09
volumes, adjusted using Copano’s 2009
planning model
planning model
Appendix

Copano
Energy
43
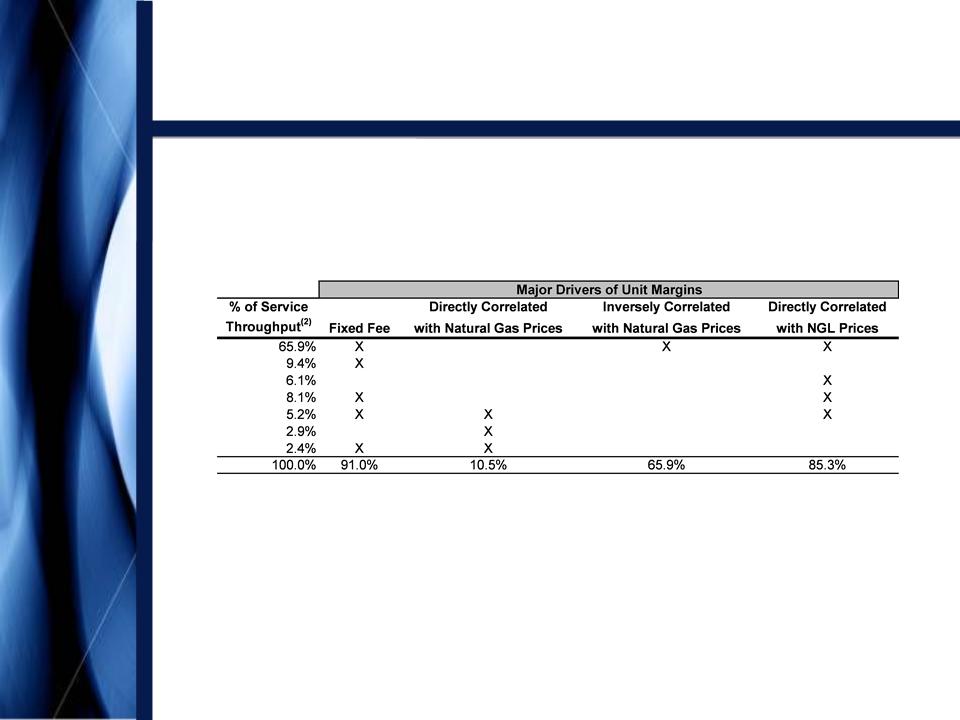
Texas
Commercial Update
• Third Quarter
2009
– Total service
throughput volumes:
613,000 MMBtu/d(1)
– Unit margin:
$0.48/MMBtu(2)
– Margins from
approximately 85% of contract volumes are directly
correlated with NGL prices
correlated with NGL prices
– Approximately 91% of
contract volumes have fee-based components,
including volumes subject to minimum margin provisions
including volumes subject to minimum margin provisions
• Operated in full
processing mode for third and fourth quarter 2009
(1) Excludes
72,985
MMBtu/d service throughput for Webb Duval, a majority-owned
affiliate.
(2) Refers
to Texas segment gross margin ($26.9 million) divided by Texas service
throughput volumes (613,000
MMBtu/d) for the period. See this Appendix for reconciliation of Texas segment gross margin.
MMBtu/d) for the period. See this Appendix for reconciliation of Texas segment gross margin.
Appendix
Copano
Energy
44
Texas
Contract Mix
• Third quarter 2009
contract mix(1)
Appendix
(1) Source: Copano
Energy internal financial planning models for consolidated
subsidiaries.
(2) Excludes
72,985 MMBtu/d service throughput for Webb Duval, a majority-owned
affiliate.
Copano
Energy
45
Texas
Net Commodity Exposure
Note: See
explanation of processing modes in this Appendix.
(1) Source: Copano
Energy internal financial planning models for consolidated subsidiaries. Based on
3Q09 daily
wellhead/plant inlet volumes.
wellhead/plant inlet volumes.
(2) Fractionation
at Houston Central processing plant permits significant reductions in ethane
recoveries in ethane
rejection mode and full ethane rejection in conditioning mode. To optimize profitability, plant operations can
also be adjusted to partial recovery mode.
rejection mode and full ethane rejection in conditioning mode. To optimize profitability, plant operations can
also be adjusted to partial recovery mode.
(3) At
the Houston Central processing plant, pentanes+ may be sold as
condensate.
Appendix
Copano
Energy
46
Texas
Commodity Price
Sensitivities
Sensitivities
• Texas segment gross
margins excluding hedge settlements
– Matrix reflects 3Q09
volumes and operating conditions,
adjusted using Copano’s 2009 planning model
adjusted using Copano’s 2009 planning model
Appendix

Copano
Energy
47
Rocky
Mountains Commercial
Update
Update
• Third Quarter
2009
– Total service
throughput volumes:
• Consolidated
affiliates (producer services): 157,000 MMBtu/d
• Unconsolidated
affiliates:
§ Bighorn: 190,000
MMBtu/d
§ Fort Union: 762,000
MMBtu/d
• All Bighorn and Fort
Union margins are fixed fee
• Virtually all
producer services margins are fixed margin
Appendix

Copano
Energy
48
Rocky
Mountains Sensitivities
Appendix
Note: See this
Appendix for reconciliation of Adjusted EBITDA. Values
reflect rounding.
(1) Impact
on Adjusted EBITDA based on Copano’s interest in the unconsolidated
affiliate.
• Third Quarter
2009
– Adjusted EBITDA
volume sensitivity (positive or negative impact)
• Consolidated
(producer services): 10,000 MMBtu/d = $28,000
• Unconsolidated
affiliates:
§ Bighorn: 10,000
MMBtu/d = $249,000(1)
§ Fort Union: 10,000
MMBtu/d = $70,000(1)
Copano
Energy
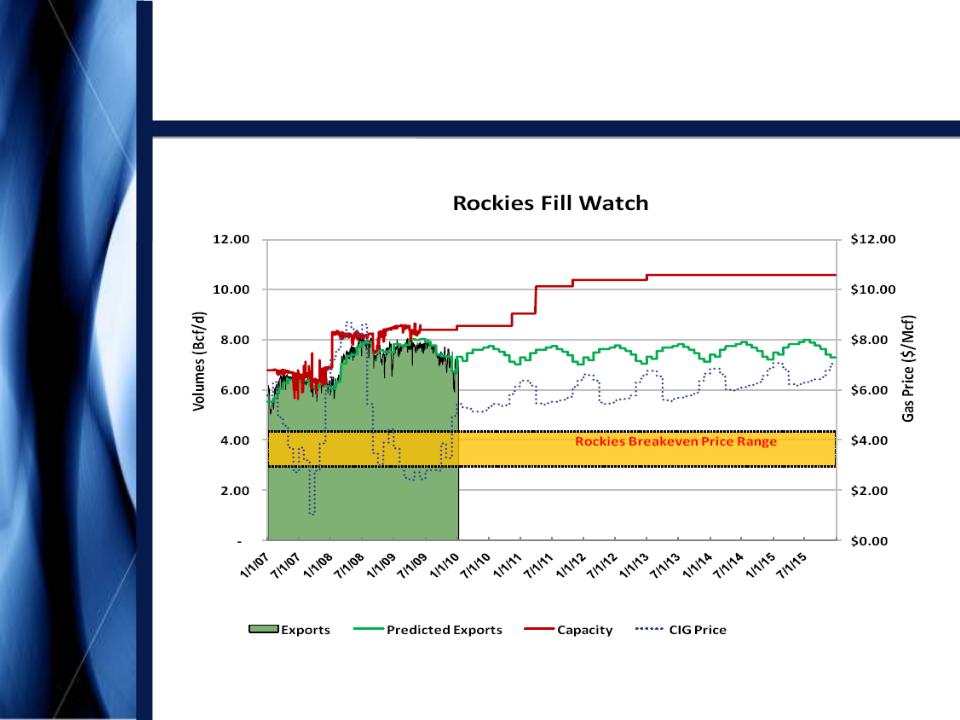
Rocky
Mountains Takeaway
Capacity Outlook
Capacity Outlook
Source:
Bentek Energy, LLC
(1) Historical
and future prices as of 1/5/10. 1/21/10
spot: $5.095/Mcf
49
(1)
Appendix
Copano
Energy
50
Hedging
Impact
of Commodity Price Sensitivities
of Commodity Price Sensitivities
• Commodity hedging
program supplements cash flow in 2010
through 2012 during less favorable commodity price periods
through 2012 during less favorable commodity price periods
Appendix
Copano
Energy
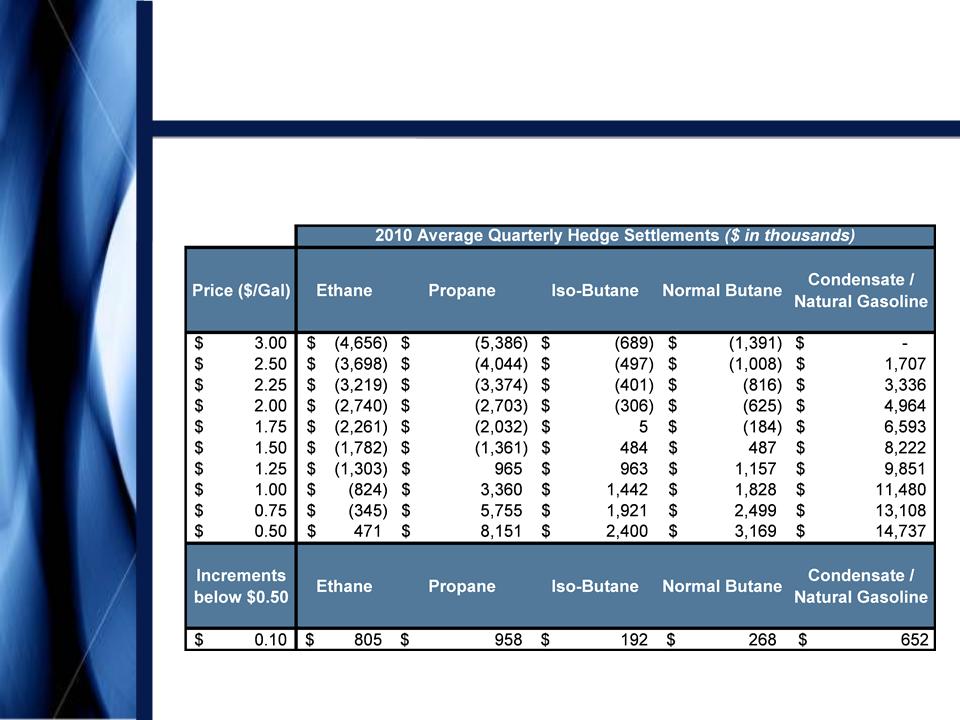
51
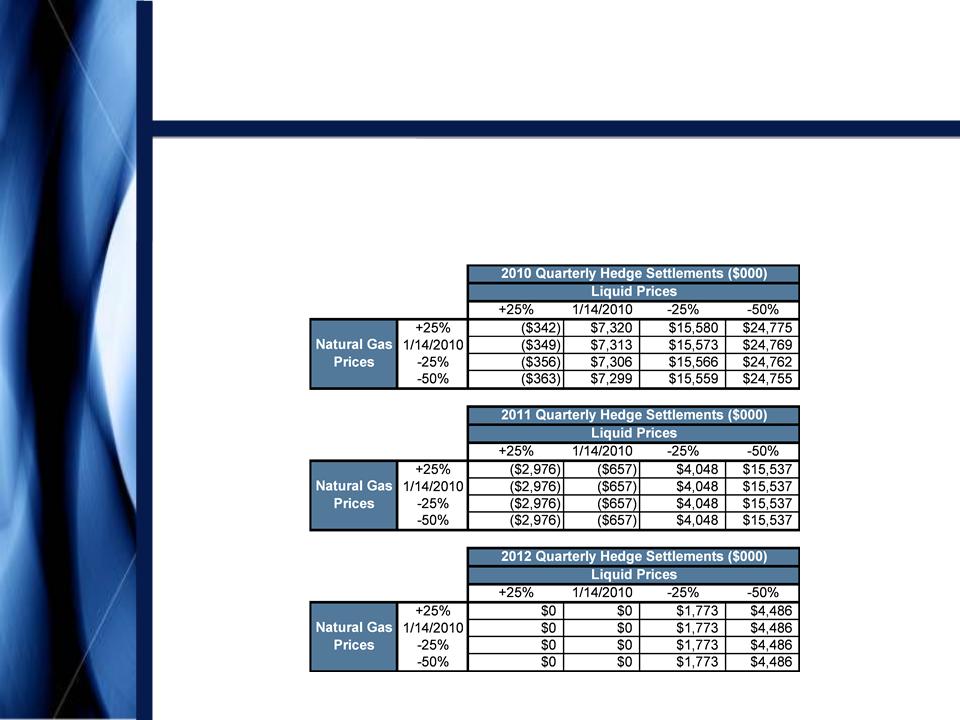
Hedging
Impact
• 2010 NGLs Hedge
Settlement Matrix
Note: All
hedge instruments are reported in Copano’s SEC filings. Hedge
settlements are based on monthly average
Mt. Belvieu NGL and NYMEX WTI prices. Positive amounts reflect payments from hedge counterparties under
swap and put option instruments. Negative amounts reflect payments to hedge counterparties under swap
instruments.
Mt. Belvieu NGL and NYMEX WTI prices. Positive amounts reflect payments from hedge counterparties under
swap and put option instruments. Negative amounts reflect payments to hedge counterparties under swap
instruments.
Appendix
Copano
Energy
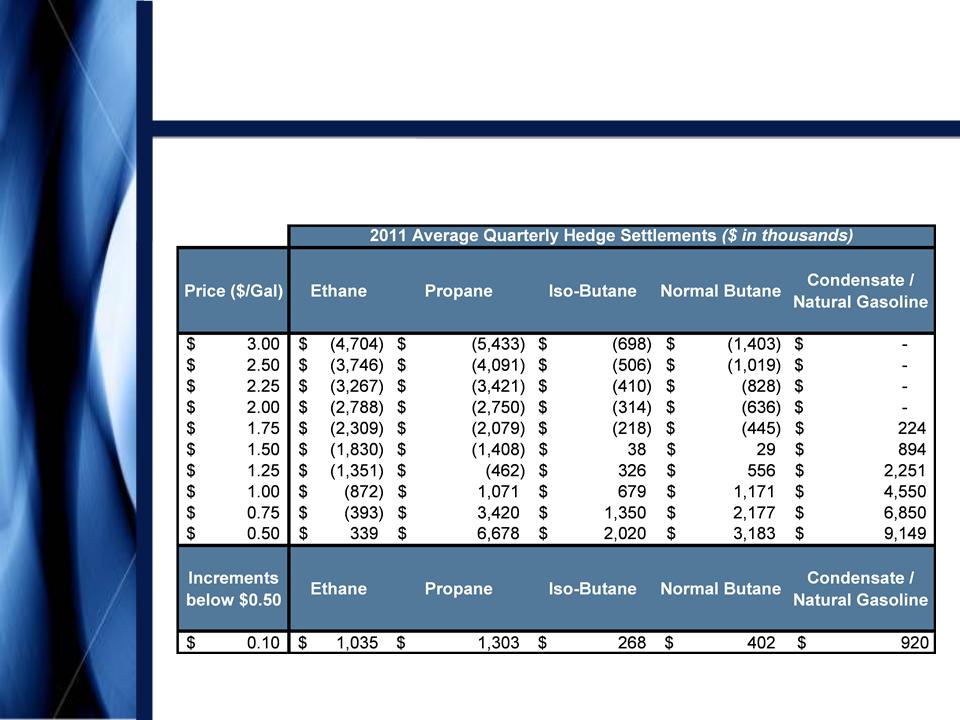
52
Hedging
Impact
• 2011 NGLs Hedge
Settlement Matrix
Note: All
hedge instruments are reported in Copano’s SEC filings. Hedge
settlements are based on monthly average
Mt. Belvieu NGL and NYMEX WTI prices. Positive amounts reflect payments from hedge counterparties under
swap and put option instruments. Negative amounts reflect payments to hedge counterparties under swap
instruments.
Mt. Belvieu NGL and NYMEX WTI prices. Positive amounts reflect payments from hedge counterparties under
swap and put option instruments. Negative amounts reflect payments to hedge counterparties under swap
instruments.
Appendix
Copano
Energy
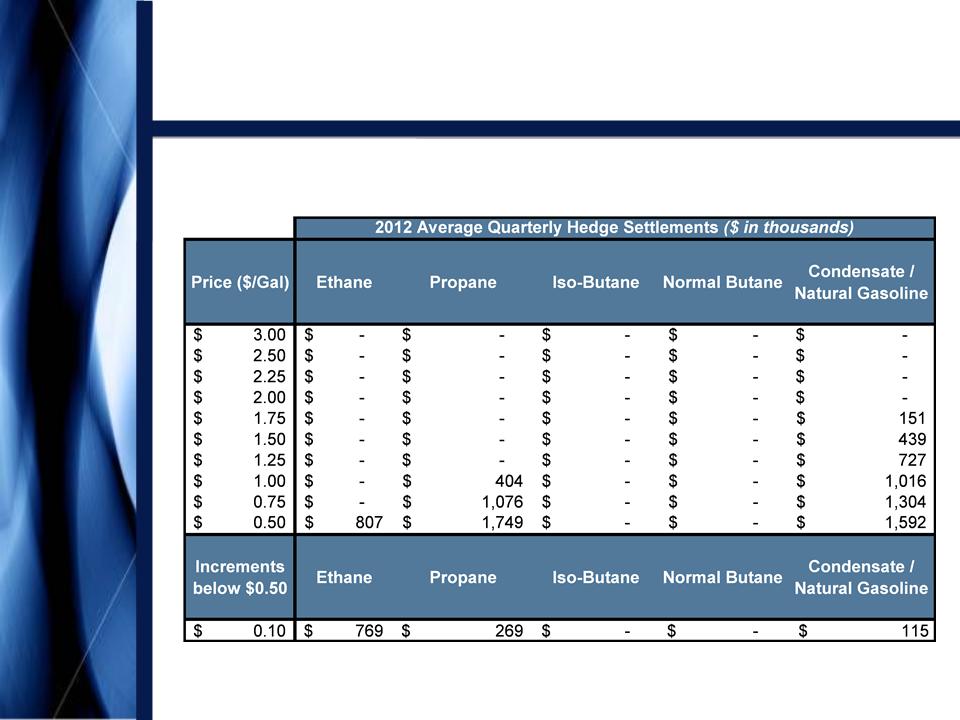
53
Hedging
Impact
• 2012 NGLs Hedge
Settlement Matrix
Note: All
hedge instruments are reported in Copano’s SEC filings. Hedge
settlements are based on monthly average
Mt. Belvieu NGL and NYMEX WTI prices. Positive amounts reflect payments from hedge counterparties under
swap and put option instruments. Negative amounts reflect payments to hedge counterparties under swap
instruments.
Mt. Belvieu NGL and NYMEX WTI prices. Positive amounts reflect payments from hedge counterparties under
swap and put option instruments. Negative amounts reflect payments to hedge counterparties under swap
instruments.
Appendix
Copano
Energy
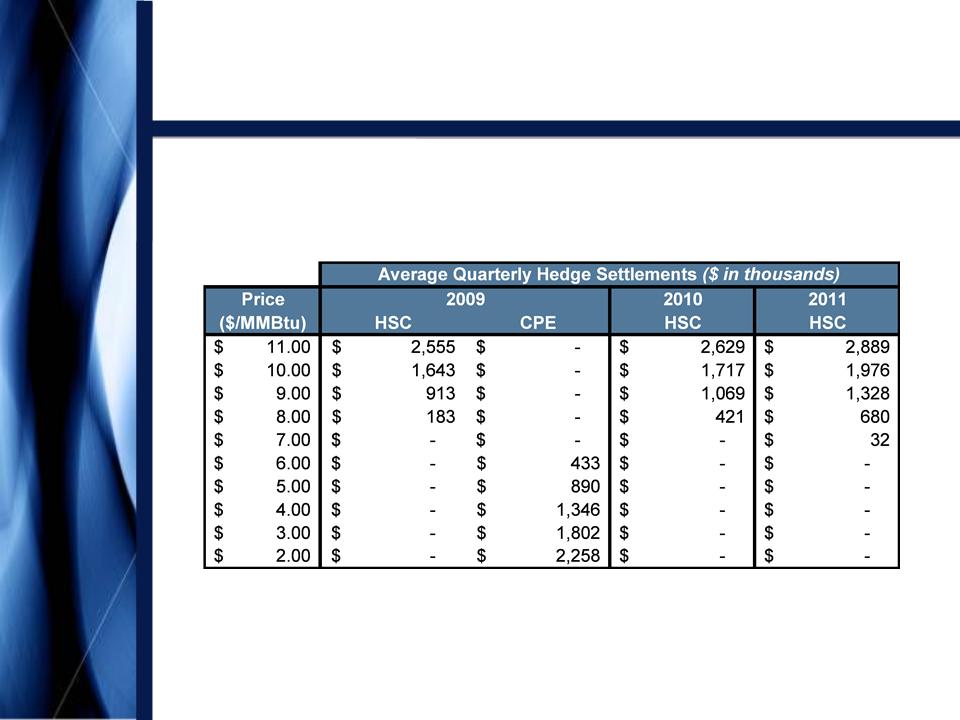
54
Hedging
Impact
• 2009 - 2011 Natural
Gas Hedge Settlement Matrix(1)
Note: All
hedge instruments are reported in Copano’s SEC filings. Hedge
settlements are based on first of the month
Houston Ship Channel and CenterPoint East natural gas prices. Positive amounts reflect payments from hedge
counterparties under call and put option instruments.
Houston Ship Channel and CenterPoint East natural gas prices. Positive amounts reflect payments from hedge
counterparties under call and put option instruments.
(1) Not
included in the matrix, for calendar 2010, Copano entered into a basis spread
between Houston Ship Channel
and Centerpoint East natural gas indices to lock in the basis between the two indices for 10,000 MMBtu/d of
natural gas at $0.185/MMbtu.
and Centerpoint East natural gas indices to lock in the basis between the two indices for 10,000 MMBtu/d of
natural gas at $0.185/MMbtu.
Appendix

Copano
Energy
55
Reconciliation of
Non-GAAP
Financial Measures
Financial Measures
Segment
Gross Margin and Total Segment Gross Margin
• We define segment
gross margin, with respect to a Copano operating segment, as segment revenue
less cost of sales. Cost of
sales includes the following:
cost of natural gas and NGLs purchased from third parties, cost of natural gas and NGLs purchased from affiliates, cost of crude oil purchased from third
parties, costs paid to third parties to transport volumes and costs paid to affiliates to transport volumes. Total segment gross margin is the sum of the
operating segment gross margins and the results of Copano’s risk management activities that are included in Corporate and other. We view total segment
gross margin as an important performance measure of the core profitability of our operations. Segment gross margin allows Copano’s senior management
to compare volume and price performance of the segments and to more easily identify operational or other issues within a segment. The GAAP measure
most directly comparable to total segment gross margin is operating income.
Appendix
Copano
Energy
56
Reconciliation of
Non-GAAP
Financial Measures
Financial Measures
Adjusted
EBITDA
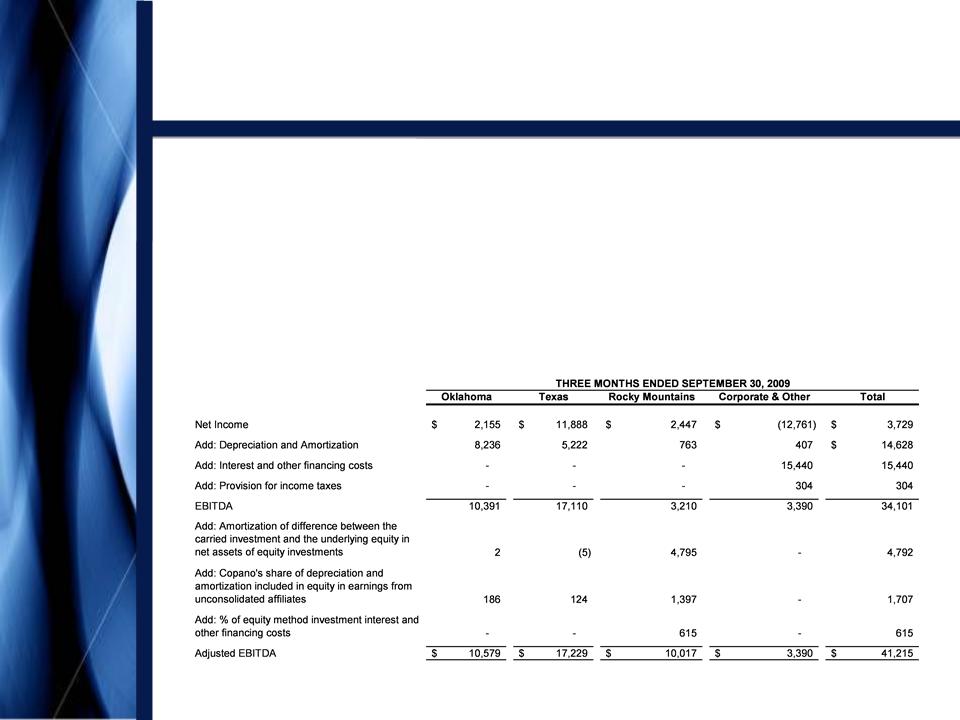
• We define EBITDA as
net income (loss) plus interest expense, provision for income taxes and
depreciation and amortization expense. Because a portion of
our net income (loss) is attributable to equity in earnings (loss) from our equity investees (which include Bighorn, Fort Union, Webb Duval and Southern
Dome), our management also calculates Adjusted EBITDA to reflect the depreciation and amortization expense embedded in equity in earnings (loss) from
unconsolidated affiliates. Specifically, our management determines Adjusted EBITDA by adding to EBITDA (i) the amortization expense attributable to the
difference between our carried investment in each unconsolidated affiliate and the underlying equity in its net assets, (ii) the portion of each unconsolidated
affiliate’s depreciation and amortization expense, which is proportional to our ownership interest in that unconsolidated affiliate and (iii) the portion of each
unconsolidated affiliate’s interest and other financing costs, which is proportional to our ownership interest in that unconsolidated affiliate.
• External users of our
financial statements such as investors, commercial banks and research analysts
use EBITDA or Adjusted EBITDA, and our
management uses Adjusted EBITDA, as a supplemental financial measure to assess:
management uses Adjusted EBITDA, as a supplemental financial measure to assess:
– The financial
performance of our assets without regard to financing methods, capital structure
or historical cost basis;
– The ability of our
assets to generate cash sufficient to pay interest costs and support our
indebtedness;
– Our operating
performance and return on capital as compared to those of other companies in the
midstream energy sector, without regard to
financing or capital structure; and
financing or capital structure; and
– The viability of
acquisitions and capital expenditure projects and the overall rates of return on
alternative investment opportunities.
• The following table
presents a reconciliation of the portion of our EBITDA and Adjusted EBITDA
attributable to each of our segments to the GAAP financial
measure of net income (loss):
measure of net income (loss):
Appendix
Copano
Energy
57
Reconciliation of
Non-GAAP
Financial Measures
Financial Measures
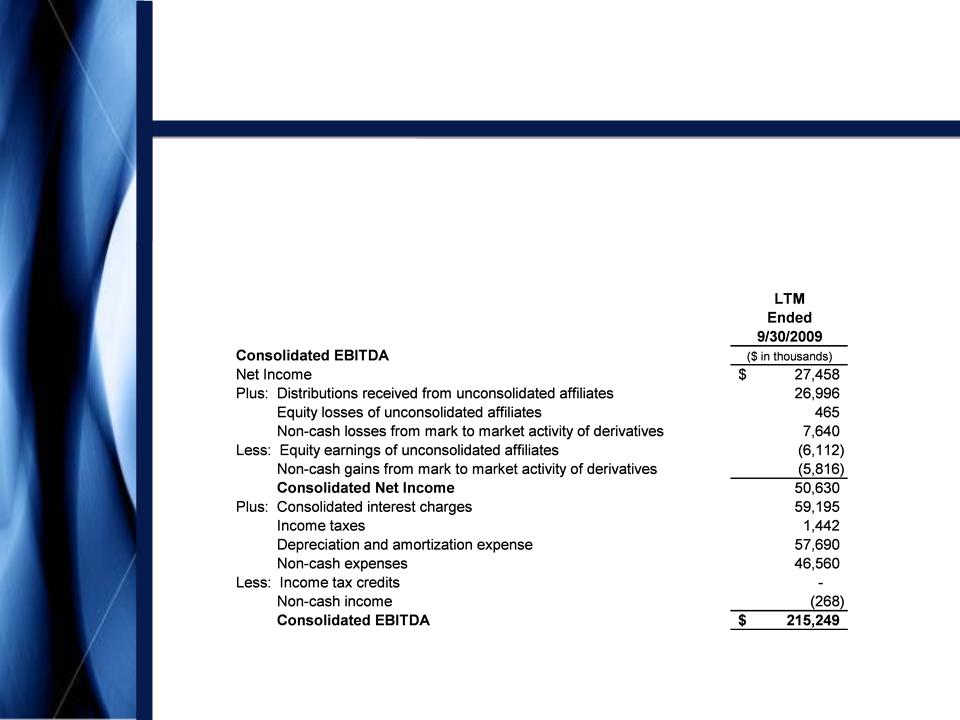
Consolidated
EBITDA
§ EBITDA is also a
financial measure that, with negotiated pro forma adjustments relating to
acquisitions completed during the
period, is reported to our lenders as Consolidated EBITDA and is used to compute our financial covenants under our senior
secured revolving credit facility.
period, is reported to our lenders as Consolidated EBITDA and is used to compute our financial covenants under our senior
secured revolving credit facility.
§ The following table
presents a reconciliation of the non-GAAP financial measure of Consolidated
EBITDA to the GAAP
financial measure of net income (loss):
financial measure of net income (loss):
Appendix

Copano
Energy
58
Definitions of
Non-GAAP
Financial Measures
Financial Measures
Total
Distributable Cash Flow
§ We define total
distributable cash flow as net income plus: (i) depreciation, amortization and
impairment expense (including
amortization expense relating to the option component of our risk management portfolio); (ii) cash distributions received from
investments in unconsolidated affiliates and equity losses from such unconsolidated affiliates; (iii) provision for deferred
income taxes; (iv) the subtraction of maintenance capital expenditures; (v) the subtraction of equity in earnings from
unconsolidated affiliates and (vi) the addition of losses or subtraction of gains relating to other miscellaneous non-cash
amounts affecting net income for the period, such as equity-based compensation, mark-to-market changes in derivative
instruments, and our line fill contributions to third-party pipelines and gas imbalances. Maintenance capital expenditures are
capital expenditures employed to replace partially or fully depreciated assets to maintain the existing operating capacity of
our assets and to extend their useful lives, or other capital expenditures that are incurred in maintaining existing system
volumes and related cash flows.
§ Total distributable
cash flow is a significant performance metric used by senior management to
compare basic cash flows
generated by us (prior to the establishment of any retained cash reserves by our Board of Directors) to the cash distributions
we expect to pay our unitholders, and it also correlates with the metrics of our existing debt covenants. Using total
distributable cash flow, management can quickly compute the coverage ratio of estimated cash flows to planned cash
distributions. Total distributable cash flow is also an important non-GAAP financial measure for our unitholders because it
serves as an indicator of our success in providing a cash return on investment — specifically, whether or not we are
generating cash flow at a level that can sustain or support an increase in our quarterly distribution rates. Total distributable
cash flow is also used by industry analysts with respect to publicly traded partnerships and limited liability companies
because the market value of such entities’ equity securities is significantly influenced by the amount of cash they can
distribute to unitholders.
Appendix

Copano
Energy
NASDAQ:
CPNO
January
2010