Attached files
| file | filename |
|---|---|
| 8-K - 8-K - MARTEK BIOSCIENCES CORP | a10-2236_18k.htm |
| EX-99.1 - EX-99.1 - MARTEK BIOSCIENCES CORP | a10-2236_1ex99d1.htm |
Exhibit 99.2
|
|
Martek Biosciences Acquisition of Amerifit Brands January 21, 2010 |
|
|
Forward Looking Statements Sections of this presentation contain forward-looking statements concerning, among other things, expectations regarding the timing and financial impact of the proposed acquisition, GAAP and pro forma financial information, future revenue growth, product introductions, production expansion, and revenue and earnings expectations. These statements are based upon numerous assumptions that Martek cannot control and involve risks and uncertainties that could cause actual results to differ, including the possibility that the acquisition may not achieve its anticipated benefits, and may not be completed as scheduled or at all. These statements should be understood in light of the risk factors set forth in the Company's filings with the SEC. This presentation includes certain financial measures that were not prepared in accordance with U.S. generally accepted accounting principles. Reconciliations of those non-U.S. GAAP financial measures to the most directly comparable U.S. GAAP financial measures can be found in the footnotes or the Appendix section of this presentation. 2 |
|
|
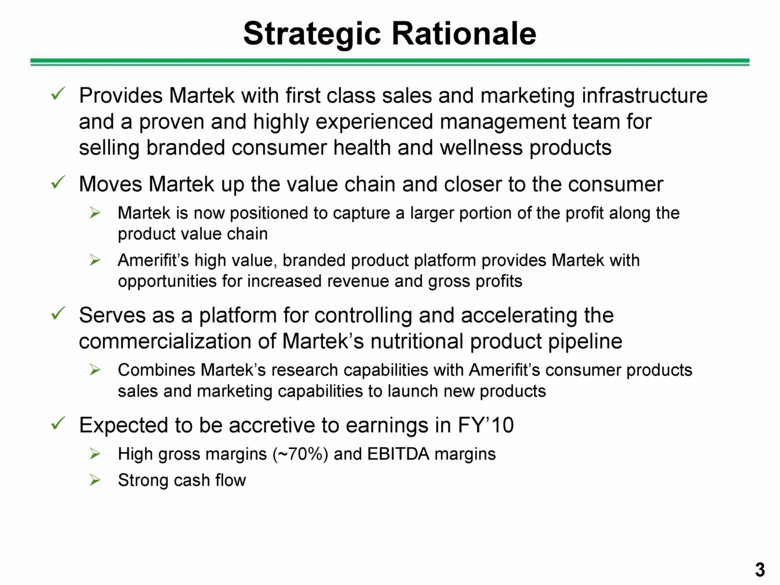
Strategic Rationale Provides Martek with first class sales and marketing infrastructure and a proven and highly experienced management team for selling branded consumer health and wellness products Moves Martek up the value chain and closer to the consumer Martek is now positioned to capture a larger portion of the profit along the product value chain Amerifit’s high value, branded product platform provides Martek with opportunities for increased revenue and gross profits Serves as a platform for controlling and accelerating the commercialization of Martek’s nutritional product pipeline Combines Martek’s research capabilities with Amerifit’s consumer products sales and marketing capabilities to launch new products Expected to be accretive to earnings in FY’10 High gross margins (~70%) and EBITDA margins Strong cash flow 3 |
|
|
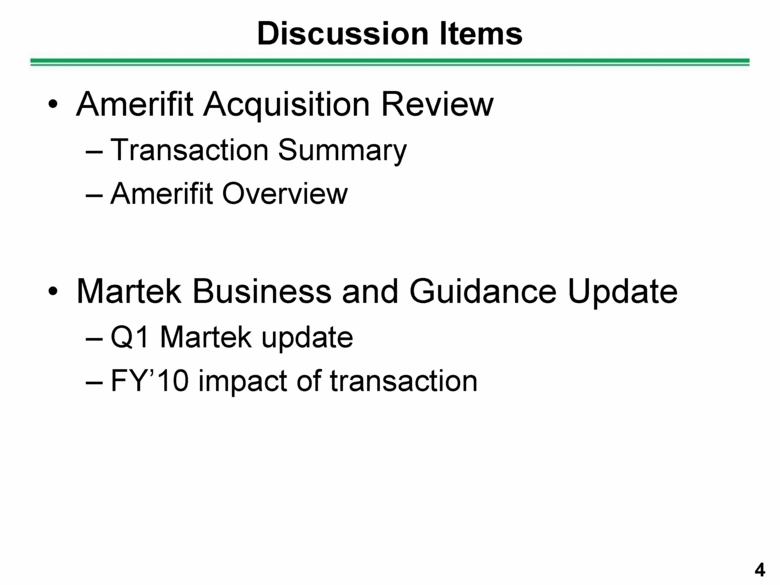
Discussion Items Amerifit Acquisition Review Transaction Summary Amerifit Overview Martek Business and Guidance Update Q1 Martek update FY’10 impact of transaction 4 |
|
|
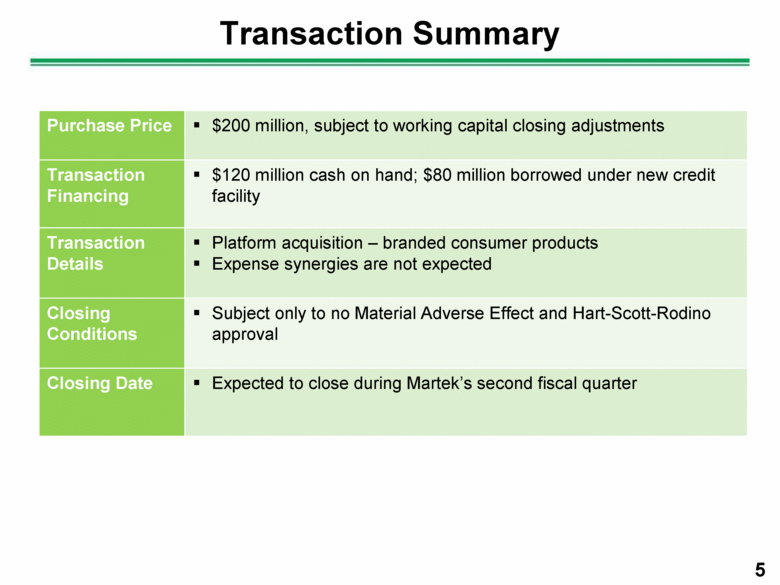
Transaction Summary 5 Purchase Price $200 million, subject to working capital closing adjustments Transaction Financing $120 million cash on hand; $80 million borrowed under new credit facility Transaction Details Platform acquisition – branded consumer products Expense synergies are not expected Closing Conditions Subject only to no Material Adverse Effect and Hart-Scott-Rodino approval Closing Date Expected to close during Martek’s second fiscal quarter |
|
|
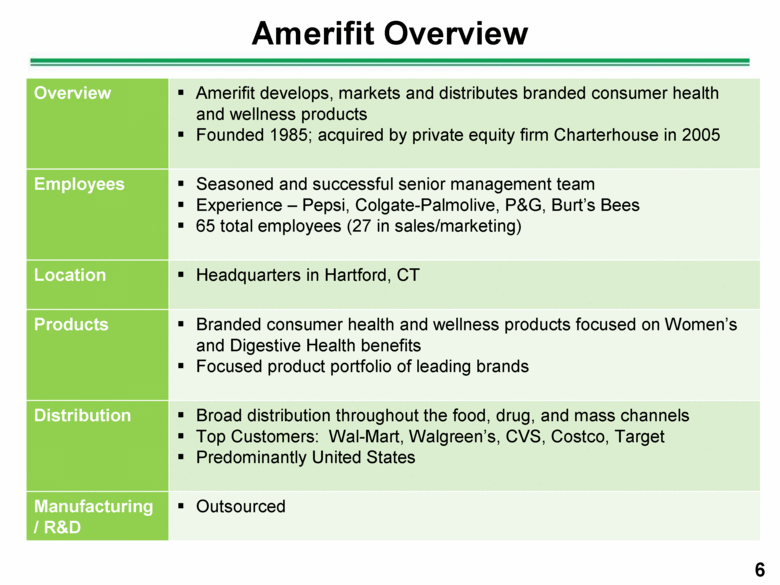
Amerifit Overview 6 Overview Amerifit develops, markets and distributes branded consumer health and wellness products Founded 1985; acquired by private equity firm Charterhouse in 2005 Employees Seasoned and successful senior management team Experience – Pepsi, Colgate-Palmolive, P&G, Burt’s Bees 65 total employees (27 in sales/marketing) Location Headquarters in Hartford, CT Products Branded consumer health and wellness products focused on Women’s and Digestive Health benefits Focused product portfolio of leading brands Distribution Broad distribution throughout the food, drug, and mass channels Top Customers: Wal-Mart, Walgreen’s, CVS, Costco, Target Predominantly United States Manufacturing / R&D Outsourced |
|
|
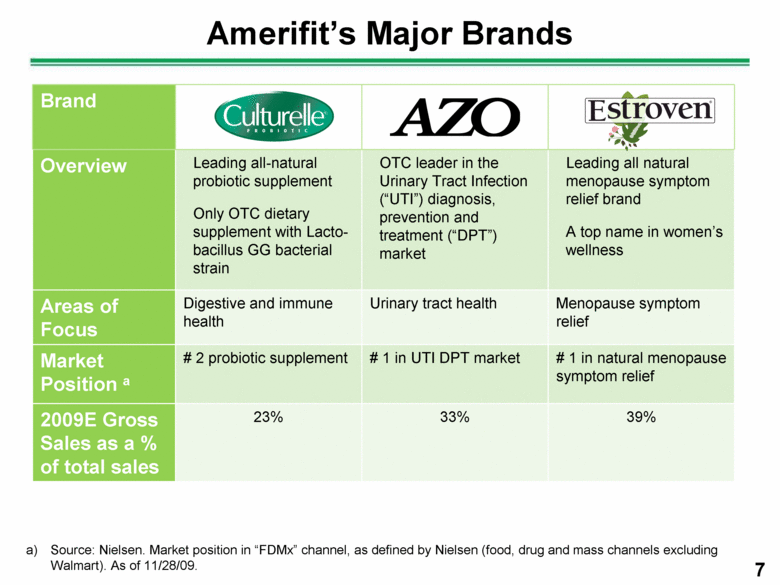
Amerifit’s Major Brands Source: Nielsen. Market position in “FDMx” channel, as defined by Nielsen (food, drug and mass channels excluding Walmart). As of 11/28/09. Brand Overview Leading all-natural probiotic supplement Only OTC dietary supplement with Lacto-bacillus GG bacterial strain OTC leader in the Urinary Tract Infection (“UTI”) diagnosis, prevention and treatment (“DPT”) market Leading all natural menopause symptom relief brand A top name in women’s wellness Areas of Focus Digestive and immune health Urinary tract health Menopause symptom relief Market Position a # 2 probiotic supplement # 1 in UTI DPT market # 1 in natural menopause symptom relief 2009E Gross Sales as a % of total sales 23% 33% 39% 7 |
|
|
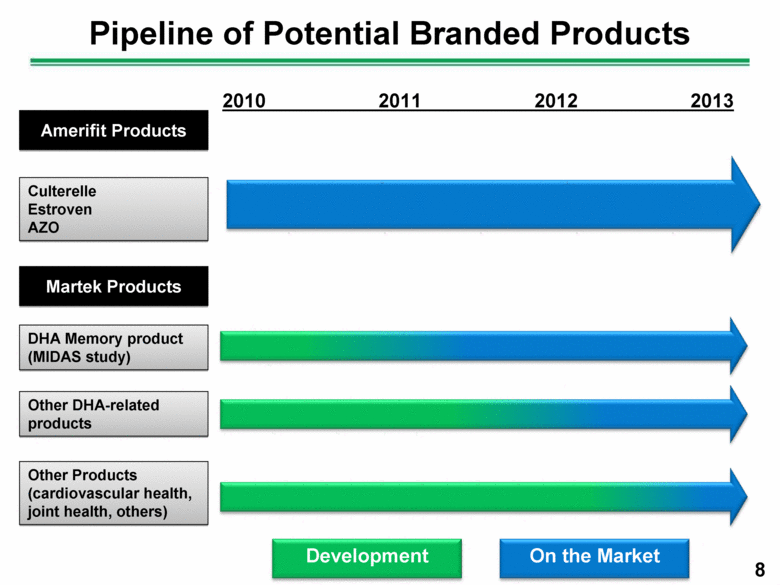
Pipeline of Potential Branded Products 8 DHA Memory product (MIDAS study) Other Products (cardiovascular health, joint health, others) 2010 2011 2012 2013 Amerifit Products Martek Products Culterelle Estroven AZO Other DHA-related products On the Market Development |
|
|
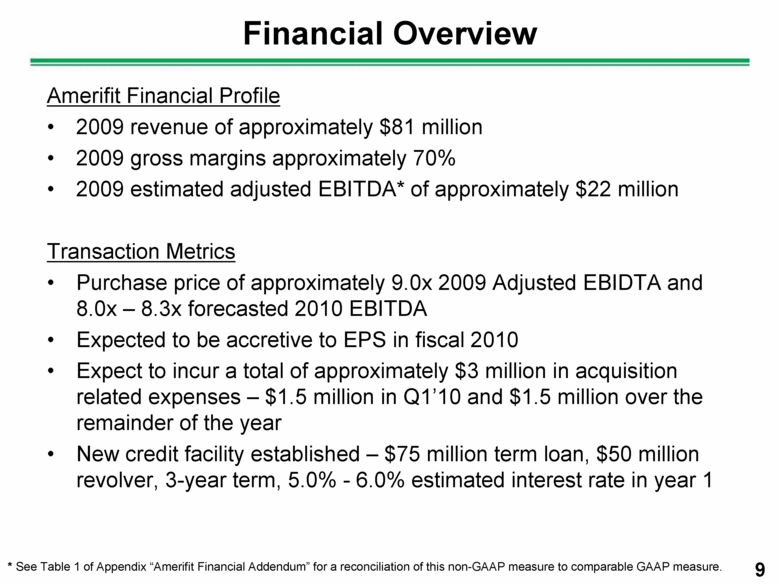
Financial Overview Amerifit Financial Profile 2009 revenue of approximately $81 million 2009 gross margins approximately 70% 2009 estimated adjusted EBITDA* of approximately $22 million Transaction Metrics Purchase price of approximately 9.0x 2009 Adjusted EBIDTA and 8.0x – 8.3x forecasted 2010 EBITDA Expected to be accretive to EPS in fiscal 2010 Expect to incur a total of approximately $3 million in acquisition related expenses – $1.5 million in Q1’10 and $1.5 million over the remainder of the year New credit facility established – $75 million term loan, $50 million revolver, 3-year term, 5.0% - 6.0% estimated interest rate in year 1 9 * See Table 1 of Appendix “Amerifit Financial Addendum” for a reconciliation of this non-GAAP measure to comparable GAAP measure. |
|
|
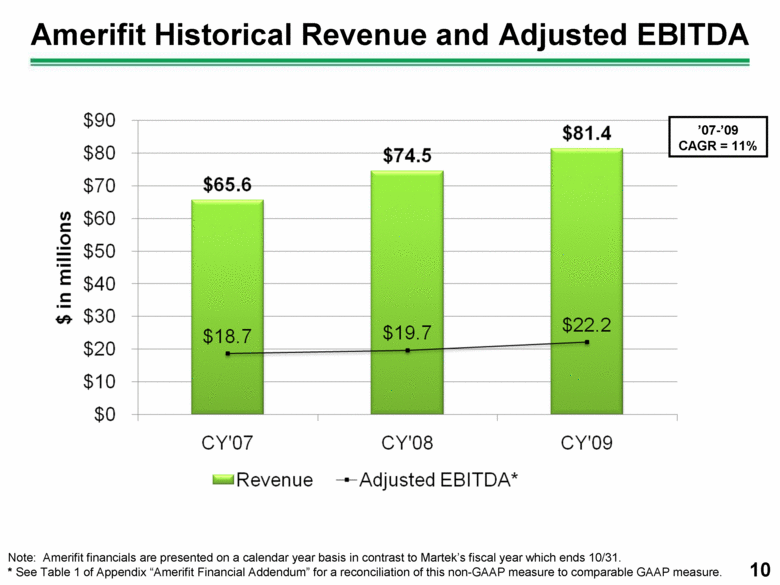
Amerifit Historical Revenue and Adjusted EBITDA 10 Note: Amerifit financials are presented on a calendar year basis in contrast to Martek’s fiscal year which ends 10/31. * See Table 1 of Appendix “Amerifit Financial Addendum” for a reconciliation of this non-GAAP measure to comparable GAAP measure. ’07-’09 CAGR = 11% |
|
|
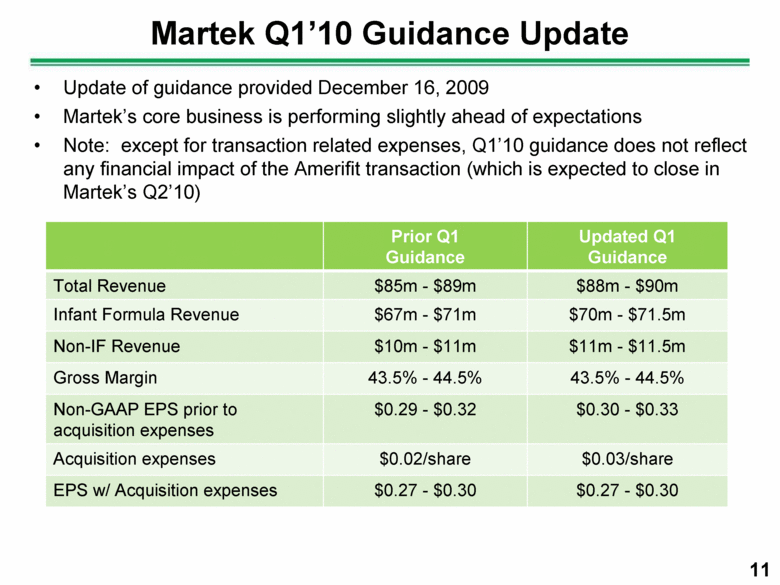
Martek Q1’10 Guidance Update Prior Q1 Guidance Updated Q1 Guidance Total Revenue $85m - $89m $88m - $90m Infant Formula Revenue $67m - $71m $70m - $71.5m Non-IF Revenue $10m - $11m $11m - $11.5m Gross Margin 43.5% - 44.5% 43.5% - 44.5% Non-GAAP EPS prior to acquisition expenses $0.29 - $0.32 $0.30 - $0.33 Acquisition expenses $0.02/share $0.03/share EPS w/ Acquisition expenses $0.27 - $0.30 $0.27 - $0.30 11 Update of guidance provided December 16, 2009 Martek’s core business is performing slightly ahead of expectations Note: except for transaction related expenses, Q1’10 guidance does not reflect any financial impact of the Amerifit transaction (which is expected to close in Martek’s Q2’10) |
|
|
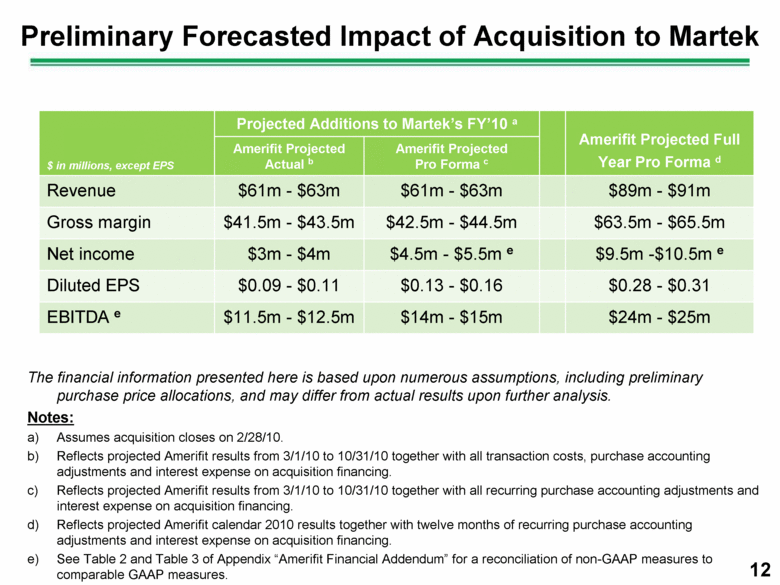
Preliminary Forecasted Impact of Acquisition to Martek 12 $ in millions, except EPS Projected Additions to Martek’s FY’10 a Amerifit Projected Full Year Pro Forma d Amerifit Projected Actual b Amerifit Projected Pro Forma c Revenue $61m - $63m $61m - $63m $89m - $91m Gross margin $41.5m - $43.5m $42.5m - $44.5m $63.5m - $65.5m Net income $3m - $4m $4.5m - $5.5m e $9.5m -$10.5m e Diluted EPS $0.09 - $0.11 $0.13 - $0.16 $0.28 - $0.31 EBITDA e $11.5m - $12.5m $14m - $15m $24m - $25m The financial information presented here is based upon numerous assumptions, including preliminary purchase price allocations, and may differ from actual results upon further analysis. Notes: Assumes acquisition closes on 2/28/10. Reflects projected Amerifit results from 3/1/10 to 10/31/10 together with all transaction costs, purchase accounting adjustments and interest expense on acquisition financing. Reflects projected Amerifit results from 3/1/10 to 10/31/10 together with all recurring purchase accounting adjustments and interest expense on acquisition financing. Reflects projected Amerifit calendar 2010 results together with twelve months of recurring purchase accounting adjustments and interest expense on acquisition financing. See Table 2 and Table 3 of Appendix “Amerifit Financial Addendum” for a reconciliation of non-GAAP measures to comparable GAAP measures. a) b) c) d) e) |
|
|
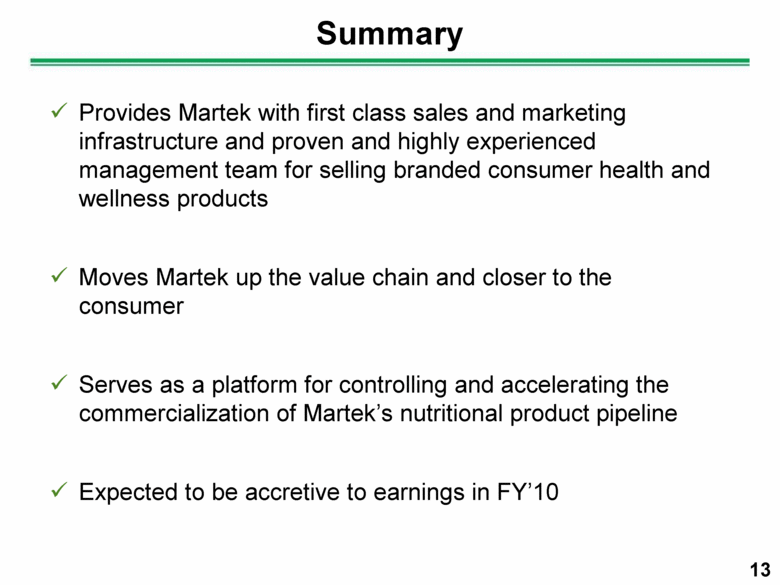
Summary Provides Martek with first class sales and marketing infrastructure and proven and highly experienced management team for selling branded consumer health and wellness products Moves Martek up the value chain and closer to the consumer Serves as a platform for controlling and accelerating the commercialization of Martek’s nutritional product pipeline Expected to be accretive to earnings in FY’10 13 |
|
|
APPENDIX Reconciliations CONFIDENTIAL |
|
|
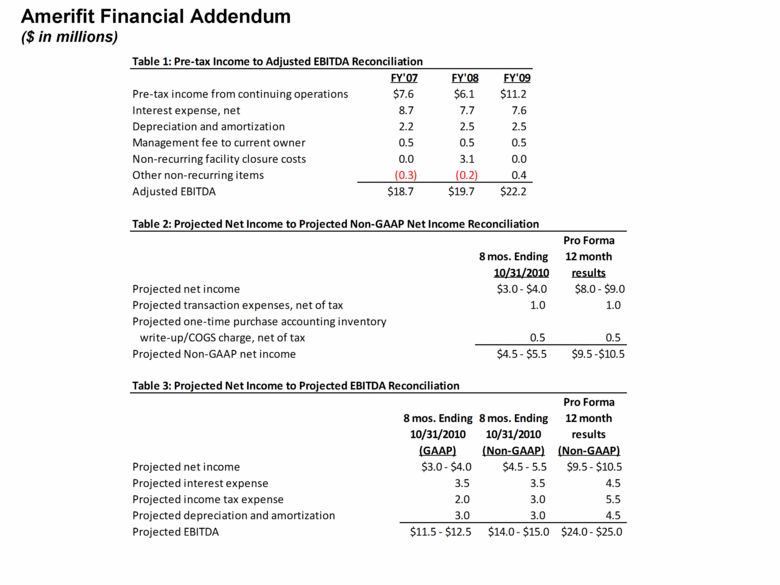
Amerifit Financial Addendum ($ in millions) Pro Forma 8 mos. Ending 12 month 10/31/2010 results Projected net income $3.0 - $4.0 $8.0 - $9.0 Projected transaction expenses, net of tax 1.0 1.0 Projected one-time purchase accounting inventory write-up/COGS charge, net of tax 0.5 0.5 Projected Non-GAAP net income $4.5 - $5.5 $9.5 -$10.5 Table 2: Projected Net Income to Projected Non-GAAP Net Income Reconciliation Pro Forma 8 mos. Ending 8 mos. Ending 12 month 10/31/2010 10/31/2010 results (GAAP) (Non-GAAP) (Non-GAAP) Projected net income $3.0 - $4.0 $4.5 - 5.5 $9.5 - $10.5 Projected interest expense 3.5 3.5 4.5 Projected income tax expense 2.0 3.0 5.5 Projected depreciation and amortization 3.0 3.0 4.5 Projected EBITDA $11.5 - $12.5 $14.0 - $15.0 $24.0 - $25.0 Table 3: Projected Net Income to Projected EBITDA Reconciliation Table 1: Pre-tax Income to Adjusted EBITDA Reconciliation FY'07 FY'08 FY'09 Pre-tax income from continuing operations $7.6 $6.1 $11.2 Interest expense, net 8.7 7.7 7.6 Depreciation and amortization 2.2 2.5 2.5 Management fee to current owner 0.5 0.5 0.5 Non-recurring facility closure costs 0.0 3.1 0.0 Other non-recurring items (0.3) (0.2) 0.4 Adjusted EBITDA $18.7 $19.7 $22.2 |

