Attached files
| file | filename |
|---|---|
| 8-K - FORM 8-K - US BANCORP \DE\ | c55611e8vk.htm |
| EX-99.1 - EXHIBIT 99.1 - US BANCORP \DE\ | c55611exv99w1.htm |
Exhibit 99.2

| U.S. Bancorp 4Q09 Earnings Conference Call January 20, 2010 Richard K. Davis Chairman, President and CEO Andy Cecere Vice Chairman and CFO |

| 2 Forward-looking Statements and Additional Information The following information appears in accordance with the Private Securities Litigation Reform Act of 1995: This presentation contains forward-looking statements about U.S. Bancorp. Statements that are not historical or current facts, including statements about beliefs and expectations, are forward-looking statements and are based on the information available to, and assumptions and estimates made by, management as of the date made. These forward-looking statements cover, among other things, anticipated future revenue and expenses and the future plans and prospects of U.S. Bancorp. Forward-looking statements involve inherent risks and uncertainties, and important factors could cause actual results to differ materially from those anticipated. Global and domestic economies could fail to recover from the recent economic downturn or could experience another severe contraction, which could adversely affect our revenues and the values of our assets and liabilities. Global financial markets could experience a recurrence of significant turbulence, which could reduce the availability of funding to certain financial institutions and lead to a tightening of credit, a reduction of business activity, and increased market volatility. Stress in the commercial real estate markets, as well as a delay or failure of recovery in the residential real estate markets, could cause additional credit losses and deterioration in asset values. In addition, our business and financial performance could be impacted as the financial industry restructures in the current environment, by increased regulation of financial institutions or other effects of recently enacted legislation, and by changes in the competitive landscape. Our results could also be adversely affected by continued deterioration in general business and economic conditions; changes in interest rates; deterioration in the credit quality of our loan portfolios or in the value of the collateral securing those loans; deterioration in the value of securities held in our investment securities portfolio; legal and regulatory developments; increased competition from both banks and non-banks; changes in customer behavior and preferences; effects of mergers and acquisitions and related integration; effects of critical accounting policies and judgments; and management's ability to effectively manage credit risk, market risk, operational risk, legal risk, and regulatory and compliance risk. For discussion of these and other risks that may cause actual results to differ from expectations, refer to U.S. Bancorp's Annual Report on Form 10-K for the year ended December 31, 2008, on file with the Securities and Exchange Commission, including the sections entitled "Risk Factors" and "Corporate Risk Profile" contained in Exhibit 13, and all subsequent filings with the Securities and Exchange Commission under Sections 13(a), 13(c), 14 or 15(d) of the Securities Exchange Act of 1934. Forward-looking statements speak only as of the date they are made, and the Company undertakes no obligation to update them in light of new information or future events. This presentation includes non-GAAP financial measures to describe U.S. Bancorp's performance. The reconciliations of those measures to GAAP measures are provided within or in the appendix of the presentation. These disclosures should not be viewed as a substitute for operating results determined in accordance with GAAP, nor are they necessarily comparable to non-GAAP performance measures that may be presented by other companies. |

| 4Q09 Highlights Net income of $602 million; $.30 per diluted common share Record total net revenue of $4.4 billion Achieved positive operating leverage vs. 4Q08; industry leading efficiency ratio of 49.1% Strong average deposit growth of 25.2% (15.3% excluding acquisitions) and average loan growth of 8.2% (0.4% excluding acquisitions) vs. 4Q08 Net charge-offs and nonperforming assets (excluding covered assets) increased at a moderating rate; provision for credit losses declined vs. 3Q09 Maintained strong capital position Acquired the majority of the operations of the banking subsidiaries of FBOP Corporation of Oak Park, IL from the FDIC |

| Performance Ratios 4Q08 1Q09 2Q09 3Q09 4Q09 Return on Avg Common Equity 0.053 0.09 0.042 0.1 0.096 Return on Avg Assets 0.0051 0.0081 0.0071 0.009 0.0086 4Q08 1Q09 2Q09 3Q09 4Q09 Efficiency Ratio 0.5 0.458 0.51 0.475 0.491 Net Interest Margin 0.0381 0.0359 0.036 0.0367 0.0383 ROE and ROA Efficiency Ratio and Net Interest Margin Return on Avg Common Equity Return on Avg Assets Efficiency Ratio Net Interest Margin Efficiency ratio computed as noninterest expense divided by the sum of net interest income on a taxable-equivalent basis and noninterest income excluding securities gains (losses) net |

| Capital Position $ in billions |

| 4Q08 1Q09 2Q09 3Q09 4Q09 Loans 177.2 185.7 183.9 182 191.6 Deposits 144.5 160.5 163.2 166.4 180.9 Loan and Deposit Growth Average Balances Year-Over-Year Growth 4Q09 Acquisition Adjusted Loan Growth = 0.4% Deposit Growth = 15.3% 8.2% $191.6 17.0% $177.2 19.6% $185.7 12.8% $183.9 9.3% $182.0 25.2% $180.9 15.2% $144.5 22.7% $160.5 20.2% $163.2 24.6% $166.4 $ in billions |

| Taxable-equivalent basis 4Q08 1Q09 2Q09 3Q09 4Q09 Reported 3624 3883 4159 4250 4376 Core 3839 3989 4178 4287 4534 Revenue Growth USB Record Revenue 4Q09 Year-Over-Year Core Growth 4.4% 8.0% 8.2% 12.0% 18.1% Reported Core $ in millions |

| 3Q07 4Q07 1Q08 2Q08 3Q08 4Q08 1Q09 2Q09 3Q09 4Q09 NPA $ Change 76 49 155 290 357 489 727 626 386 184 NPA % Change 0.13 0.08 0.22 0.34 0.31 0.33 0.37 0.23 0.12 0.05 3Q07 4Q07 1Q08 2Q08 3Q08 4Q08 1Q09 2Q09 3Q09 4Q09 NCO $ Change 8 26 68 103 102 134 156 141 112 69 NCO % Change 0.041884817 0.130653266 0.302222222 0.351535836 0.257575758 0.269076305 0.246835443 0.17893401 0.12056 0.07 Credit Quality $ in millions, linked quarter change * Excluding Covered Assets (assets subject to loss sharing agreements with FDIC) Change in Net Charge-offs Change in Nonperforming Assets* The Company continues to expect Net Charge-offs and Nonperforming Assets, excluding nonperforming acquired covered assets, to increase at a decreasing rate NCO $ Change (Left Scale) NCO % Change (Right Scale) NPA $ Change (Left Scale) NPA % Change (Right Scale) |

| Credit Quality - Reserves 4Q07 1Q08 2Q08 3Q08 4Q08 1Q09 2Q09 3Q09 4Q09 Allowance 2260 2243 2448 2648 3004 3575 4105 4571 4986 Provision Exceeding NCO's 0 192 200 250 635 530 466 415 278 Provision/NCO's 1 1.66 1.51 1.5 2 1.67 1.5 1.4 1.25 Allowance for Credit Losses Allowance Provision Exceeding NCO's Provision/NCO's $ in millions |

| Credit Quality - Commercial Loans 4Q08 1Q09 2Q09 3Q09 4Q09 Average Loans 50328 49362 47362 44655 43490 Net Charge-offs Ratio 0.0085 0.0092 0.015 0.0178 0.0228 Average Loans and Net Charge-offs Ratios Key Statistics Comments Corporate loan demand remained weak as evidenced by the declining utilization trend Net charge-offs increased with losses coming mainly from leveraged sectors, such as mortgage banking, correspondent banking and gaming 4Q08 3Q09 4Q09 Average Loans 50,328 44,655 43,490 30-89 Delinquencies 1.32% 0.89% 1.02% 90+ Delinquencies 0.15% 0.19% 0.25% Nonperforming 0.58% 2.06% 2.05% 1208 0109 0209 0309 0409 0509 0609 0709 0809 0909 1009 1109 1209 Utilization 0.3705 0.3757 0.374 0.3662 0.3602 0.3507 0.3382 0.3201 0.311 0.3095 0.3007 0.3043 0.2883 Revolving Line Utilization Trend $ in millions |

| Credit Quality - Commercial Leases 4Q08 1Q09 2Q09 3Q09 4Q09 Average Loans 6608 6772 6697 6567 6489 Net Charge-offs Ratio 0.0187 0.0329 0.0329 0.0266 0.0202 Average Loans and Net Charge-offs Ratios Key Statistics Comments Delinquency levels and net charge-offs have declined due to improvement in the small ticket leasing portfolio 4Q08 3Q09 4Q09 Average Loans 6,608 6,567 6,489 30-89 Delinquencies 2.61% 2.28% 2.07% 90+ Delinquencies --% --% --% Nonperforming 1.49% 1.82% 1.91% $ in millions EF ST Mix 2165 4324 Equipment Finance $2,165 Small Ticket $4,324 |

| Credit Quality - CRE Mortgages 4Q08 1Q09 2Q09 3Q09 4Q09 Average Loans 22967 23553 23875 24296 24895 Net Charge-offs Ratio 0.0024 0.0022 0.0047 0.0049 0.0048 Average Loans and Net Charge-offs Ratios Key Statistics Comments Average loans increased 2.5% on a linked quarter basis and increased 8.4% over 4Q08 due to the lack of permanent financing previously available in the CMBS market 4Q08 3Q09 4Q09 Average Loans 22,967 24,296 24,895 30-89 Delinquencies 0.83% 0.95% 1.08% 90+ Delinquencies --% 0.01% --% Nonperforming 1.25% 2.04% 2.30% Investor Owner Mix 13948 10947 Investor $13,948 Owner Occupied $10,947 $ in millions |

| Credit Quality - CRE Construction 4Q08 1Q09 2Q09 3Q09 4Q09 Average Loans 9691 9845 9852 9533 9149 Net Charge-offs Ratio 0.0259 0.0482 0.0379 0.0662 0.0624 Average Loans and Net Charge-offs Ratios Key Statistics Comments Residential construction has declined from $4.7 billion in 3Q07 to $2.3 billion in 4Q09, which includes $0.6 billion in condominium exposure Net charge-offs remain elevated at 6.24%, reflecting market value declines in both commercial and residential construction properties 4Q08 3Q09 4Q09 Average Loans 9,691 9,533 9,149 30-89 Delinquencies 4.33% 2.30% 2.67% 90+ Delinquencies 0.36% 0.39% 0.07% Nonperforming 7.98% 13.30% 13.57% Multi-Family Retial Res Construction Condo Construction A&D Commercial Office Other Mix 2126 1389 1689 627 1077 986 1255 Multi-family $2,126 Other $1,255 Office $986 A&D Construction $1,077 Retail $1,389 Condo Construction $627 Residential Construction $1,689 $ in millions |

| 4Q08 1Q09 2Q09 3Q09 4Q09 Restructured 813 1129 1289 1338 1354 Credit Quality - Residential Mortgage 4Q08 1Q09 2Q09 3Q09 4Q09 Average Loans 23430 23915 23964 24405 25621 Net Charge-offs Ratio 0.0143 0.0154 0.0194 0.021 0.0237 Average Loans and Net Charge-offs Ratios Key Statistics Comments Continue to actively work with customers to modify loans for borrowers who are having financial difficulties Began participating in HAMP program in August 2009, now at 26% of active trial modifications as a percent of eligible modifications 4Q08 3Q09 4Q09 Average Loans 23,430 24,405 25,621 30-89 Delinquencies 2.27% 2.39% 2.36% 90+ Delinquencies 1.55% 2.32% 2.80% Nonperforming 0.89% 1.54% 1.79% Residential Mortgage Restructured Loans $ in millions |

| Credit Quality - Home Equity 4Q08 1Q09 2Q09 3Q09 4Q09 Average Loans 18691 19215 19314 19368 19444 Net Charge-offs Ratio 0.0111 0.0148 0.0172 0.0182 0.0196 Average Loans and Net Charge-offs Ratios Key Statistics Comments Demand is weak for home equity products High quality traditional portfolio (branch and private client originated) has performed well in declining home value environment 4Q08 3Q09 4Q09 Average Loans 18,691 19,368 19,444 30-89 Delinquencies 0.89% 1.00% 0.93% 90+ Delinquencies 0.55% 0.78% 0.78% Nonperforming 0.07% 0.13% 0.17% Traditional Consumer Finance Mix 87 13 Traditional: 87% Wtd Avg LTV: 71% NCO: 1.29% Consumer Finance: 13% Wtd Avg LTV: 83% NCO: 6.56% $ in millions |

| 4Q08 3Q09 4Q09 Average Loans 12,976 15,387 16,399 30-89 Delinquencies 2.73% 2.58% 2.38% 90+ Delinquencies 2.20% 2.41% 2.59% Nonperforming 0.50% 0.77% 0.84% Credit Quality - Credit Card 4Q08 1Q09 2Q09 3Q09 4Q09 Average Loans 12976 13597 14329 15387 16399 Net Charge-offs Ratio 0.0518 0.0632 0.0736 0.0699 0.0689 Average Loans and Net Charge-offs Ratios Key Statistics Comments Excluding acquired portfolios, net charge-offs of 7.46% increased modestly from 7.30% in prior quarter Average loans have grown 6.6% on a linked quarter basis and 26.4% over 4Q08 due to new accounts, balance growth initiatives and portfolio acquisitions $ in millions Impact of Acquired Portfolios Net Charge-off Ratio 4Q08 3Q09 4Q09 As Reported 5.18% 6.99% 6.89% Excluding Acquired* 5.18% 7.30% 7.46% * Excluding portfolio purchases where the acquired loans were recorded at fair value at the purchase date |

| Credit Quality - Retail Leasing 4Q08 1Q09 2Q09 3Q09 4Q09 Average Loans 5062 5115 5031 4822 4620 Net Charge-offs Ratio 0.0086 0.0103 0.008 0.0066 0.0043 Average Loans and Net Charge-offs Ratios Key Statistics Comments 30+ delinquency rates continue to improve Improvement in used car prices has significantly reduced end of term and credit losses 4Q08 3Q09 4Q09 Average Loans 5,062 4,822 4,620 30-89 Delinquencies 0.96% 0.79% 0.74% 90+ Delinquencies 0.16% 0.11% 0.11% Nonperforming --% --% --% $ in millions 1208 0109 0209 0309 0409 0509 0609 0709 0809 0909 1009 1109 1209 Index 98 101.7 105.5 106.1 106.6 109.1 114.1 115.4 116.4 118.5 117.4 117.4 117.5 Manheim Used Vehicle Value Index |

| Credit Quality - Other Retail 4Q08 1Q09 2Q09 3Q09 4Q09 Average Loans 22247 22987 22753 22647 23037 Net Charge-offs Ratio 0.017 0.0175 0.018 0.0194 0.0191 Average Loans and Net Charge-offs Ratios Key Statistics Comments Average loans have grown 1.7% linked quarter basis and 3.6% over 4Q08 on strong growth in revolving credit and student lending portfolios Auto loan portfolio loss rate declined to 1.17% in 4Q09, down from 1.28% in 3Q09 and 1.47% in 4Q08 4Q08 3Q09 4Q09 Average Loans 22,247 22,647 23,037 30-89 Delinquencies 1.13% 1.13% 1.10% 90+ Delinquencies 0.36% 0.37% 0.40% Nonperforming 0.05% 0.10% 0.13% Auto Install Studend Revolving Mix 9476 5506 4580 3475 Installment $5,506 Auto Loans $9,476 Revolving Credit $3,475 Student Lending $4,580 $ in millions |

| Earnings Summary $ in millions Taxable-equivalent basis |
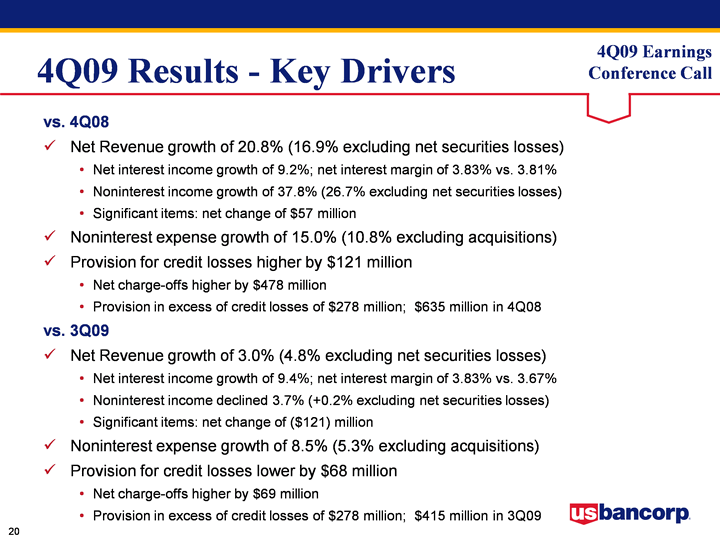
| 4Q09 Results - Key Drivers vs. 4Q08 Net Revenue growth of 20.8% (16.9% excluding net securities losses) Net interest income growth of 9.2%; net interest margin of 3.83% vs. 3.81% Noninterest income growth of 37.8% (26.7% excluding net securities losses) Significant items: net change of $57 million Noninterest expense growth of 15.0% (10.8% excluding acquisitions) Provision for credit losses higher by $121 million Net charge-offs higher by $478 million Provision in excess of credit losses of $278 million; $635 million in 4Q08 vs. 3Q09 Net Revenue growth of 3.0% (4.8% excluding net securities losses) Net interest income growth of 9.4%; net interest margin of 3.83% vs. 3.67% Noninterest income declined 3.7% (+0.2% excluding net securities losses) Significant items: net change of ($121) million Noninterest expense growth of 8.5% (5.3% excluding acquisitions) Provision for credit losses lower by $68 million Net charge-offs higher by $69 million Provision in excess of credit losses of $278 million; $415 million in 3Q09 |

| Significant Items $ in millions * The impact of the TARP discount being treated as a deemed dividend does not reduce earnings, but it is a component of the computation of earnings per diluted common share |
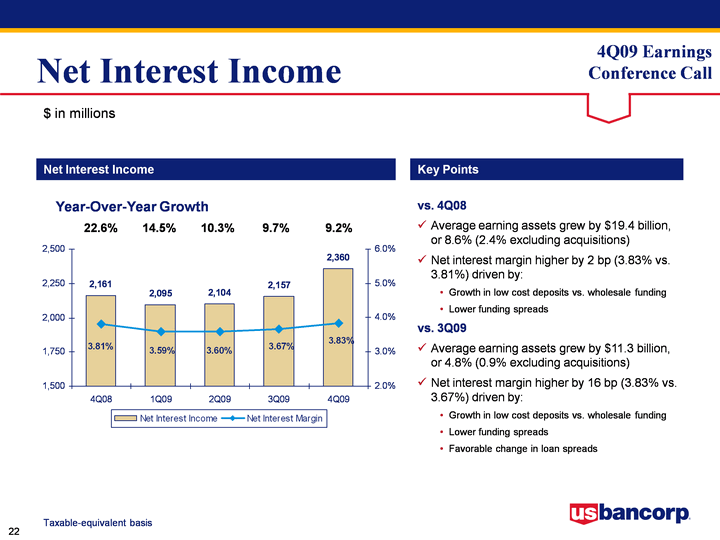
| Net Interest Income 4Q08 1Q09 2Q09 3Q09 4Q09 Net Interest Income 2161 2095 2104 2157 2360 Net Interest Margin 0.0381 0.0359 0.036 0.0367 0.0383 Net Interest Income Key Points $ in millions Taxable-equivalent basis vs. 4Q08 Average earning assets grew by $19.4 billion, or 8.6% (2.4% excluding acquisitions) Net interest margin higher by 2 bp (3.83% vs. 3.81%) driven by: Growth in low cost deposits vs. wholesale funding Lower funding spreads vs. 3Q09 Average earning assets grew by $11.3 billion, or 4.8% (0.9% excluding acquisitions) Net interest margin higher by 16 bp (3.83% vs. 3.67%) driven by: Growth in low cost deposits vs. wholesale funding Lower funding spreads Favorable change in loan spreads Year-Over-Year Growth 22.6% 14.5% 10.3% 9.7% 9.2% |

| Average Earning Assets 4Q08 1Q09 2Q09 3Q09 4Q09 Other 6.807 7.288 8.198 9.585 9.586 Loans 177.205 185.705 183.878 181.968 191.648 Securities 41.974 42.321 42.189 42.558 44.149 Average Earning Assets Key Points $ in billions Year-Over-Year Growth 12.8% 13.7% 10.5% 8.9% 8.6% Securities Loans LHFS and Other EA $226.0 $235.3 $234.3 $234.1 $245.4 vs. 4Q08 Average earning assets grew by $19.4 billion, or 8.6% (2.4% excluding acquisitions) Average total loans grew by $14.4 billion, or 8.2% (0.4% excluding acquisitions) Average investment securities grew by $2.2 billion, or 5.2% vs. 3Q09 Average earning assets grew by $11.3 billion, or 4.8% (0.9% excluding acquisitions) Average total loans grew by $9.7 billion, or 5.3% (0.4% excluding acquisitions) Average investment securities grew by $1.6 billion, or 3.7% |

| Average Loans 4Q08 1Q09 2Q09 3Q09 4Q09 Covered 5.205 11.344 10.701 10.288 18.504 Commercial 56.936 56.134 54.059 51.222 49.979 CRE 32.658 33.398 33.727 33.829 34.044 Res Mtg 23.43 23.915 23.964 24.405 25.621 Retail 58.976 60.914 61.427 62.224 63.5 Average Loans Key Points $ in billions Year-Over-Year Growth 17.0% 19.6% 12.8% 9.3% 8.2% $177.2 $185.7 $183.9 $181.9 $191.6 Retail Res Mtg Covered CRE Commercial vs. 4Q08 Average total loans grew by $14.4 billion, or 8.2% (0.4% excluding acquisitions) Average total commercial loans declined $7.0 billion, or 12.2%, primarily due to reduction in utilization of revolving lines of credit (30% 4Q09 vs. 38% 4Q08) Acquisition impact primarily in average covered assets which grew by $13.3 billion ($8.9 billion FBOP Banks and $4.4 billion Downey/PFF) Covered assets at December 31, 2009 equaled $22.5 billion ($13.2 billion FBOP Banks and 9.3 billion Downey/PFF) vs. 3Q09 Average total loans grew by $9.7 billion, or 5.3% (0.4% excluding acquisitions) Average total commercial loans declined by $1.2 billion, or 2.4%, primarily due to utilization rates (30% 4Q09 vs. 32% 3Q09) Average covered assets grew by $8.2 billion, primarily due to acquisition of FBOP Banks |
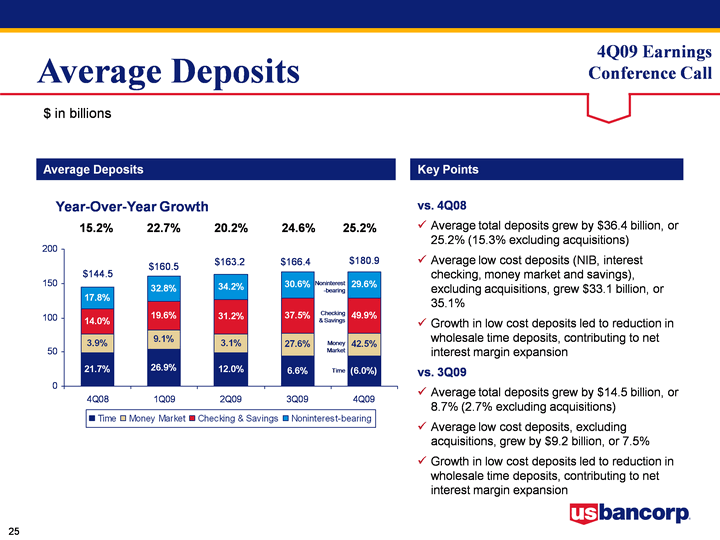
| Average Deposits 4Q08 1Q09 2Q09 3Q09 4Q09 Time 48.697 54.203 48.911 43.951 43.951 Money Market 27.009 27.927 27.25 33.387 33.387 Checking & Savings 37.124 42.378 49.671 52.042 52.042 Noninterest-bearing 31.639 36.02 37.388 36.982 36.982 Average Deposits Key Points $ in billions Year-Over-Year Growth 15.2% 22.7% 20.2% 24.6% 25.2% $144.5 $160.5 $163.2 $166.4 $180.9 Noninterest -bearing Checking & Savings Time Money Market vs. 4Q08 Average total deposits grew by $36.4 billion, or 25.2% (15.3% excluding acquisitions) Average low cost deposits (NIB, interest checking, money market and savings), excluding acquisitions, grew $33.1 billion, or 35.1% Growth in low cost deposits led to reduction in wholesale time deposits, contributing to net interest margin expansion vs. 3Q09 Average total deposits grew by $14.5 billion, or 8.7% (2.7% excluding acquisitions) Average low cost deposits, excluding acquisitions, grew by $9.2 billion, or 7.5% Growth in low cost deposits led to reduction in wholesale time deposits, contributing to net interest margin expansion |

| Noninterest Income 4Q08 1Q09 2Q09 3Q09 4Q09 All Other 71 230 346 379 400 Mortgage 23 233 308 276 218 Service Charges 388 363 392 397 370 Trust & Inv Mgmt 300 294 304 293 277 Payment Services 681 668 705 748 751 Noninterest Income Key Points $ in million Year-Over-Year Growth (19.2%) (12.5%) 8.6% 48.2% 37.8% $1,463 $1,788 $2,055 $2,093 $2,016 Trust & Inv Mgmt Service Charges & Treasury Mgmt All Other Mortgage Payment Services Payment services = credit and debt card revenue, corporate payment products revenue and merchant processing services All Other Mortgage Service Charges Trust & Inv Mgmt Payment Services vs. 4Q08 Noninterest income grew by $553 million, or 37.8% (26.7% excl net securities losses), driven by: Payments revenue (10.3% growth) Mortgage banking revenue growth of $195 million 36.4% increase in production volume Favorable change in MSR hedge ($33 4Q09 vs. ($70) 4Q08) Commercial products revenue (41.2% growth) Higher other revenue Lower end of term lease residual valuation losses Payments contract termination gain Significant items, including net securities losses, were favorable by $57 million vs. 3Q09 Noninterest income was lower by $77 million, or 3.7% (+0.2% excl net securities losses), driven by: Mortgage banking revenue decline of $58 million 25.2% reduction in production volume Unfavorable change in MSR hedge ($33 4Q09 vs. $67 3Q09) Commercial products revenue (17.8% growth) Lower trust and investment management fees, deposit service charges and treasury management fees Higher other revenue Lower end of term lease residual valuation losses Payment contract termination gain Significant items, including net securities losses, unfavorable by $121 million |

| Noninterest Expense 4Q08 1Q09 2Q09 3Q09 4Q09 All Other 446 382 649 500 611 Tech & Communications 156 155 157 175 186 Prof Svcs, Marketing and PPS 240 182 211 272 256 Occupancy & Equip 202 211 208 203 214 Compensation & Benefits 894 941 904 903 961 Noninterest Expense Key Points $ in million Year-Over-Year Growth (0.6%) 5.2% 17.1% 13.2% 15.0% $1,938 $1,871 $2,129 $2,053 $2,228 Occupancy & Equip Prof Svcs, Marketing & PPS All Other Tech & Comm Compensation & Benefits Occupancy & Equip All Other Tech & Communications Prof Svcs, Marketing and PPS Compensation & Benefits vs. 4Q08 Noninterest expense was higher by $290 million, or 15.0% (10.8% excluding acquisitions), majority of variance driven by: Acquisitions ($86 million of increase) Tax credit amortization ($79 million of increase) FDIC expense Other loan expense vs. 3Q09 Noninterest expense was higher by $175 million, or 8.5% (5.3% excluding acquisitions), majority of variance driven by: Acquisitions ($66 million of increase) Tax credit amortization ($60 million of increase) Elimination of salary reductions related to cost containment initiative Legal and professional Other loan expense |

| Positioned for Growth Opportunities Core businesses continue to perform Solid capital and liquidity position Positioned to capitalize on economic recovery "Flight to Quality" Investing for growth - organic initiatives, M&A and joint ventures USB prepared to opportunistically acquire Core businesses are scalable and can be leveraged as the economy recovers Challenges Credit quality Regulatory / legislative oversight and actions |

| Appendix |

| Non-Regulatory Capital Ratios $ in millions |

| U.S. Bancorp 4Q09 Earnings Conference Call January 20, 2010 |