Attached files
| file | filename |
|---|---|
| 8-K - AZZ Q3 PRESENTATION - AZZ INC | form8kq3presentation.htm |
| EX-99.2 - EX 99.2 FINANCIAL AND OTHER INFO - AZZ INC | ex992financialinfo.htm |

January
2010
2
Except for the
statements of historical fact, this report may contain forward-looking
statements that involve risks and uncertainties some of which are detailed from time to
time in documents filed by the company with the SEC. Those risks and uncertainties
include, but are not limited to: changes in customer demand and response to products
and services offered by the company, including demand by the electrical power
generation markets, electrical transmission and distribution markets, the industrial
markets, and the hot dip galvanizing markets; prices and raw material costs, including
zinc and natural gas which are used in the hot dip galvanizing process and steel,
aluminum and copper which are used in the electrical and industrial segment; changes in
the economic conditions of the various markets the company serves, foreign and
domestic, customer requested delays of shipments, acquisition opportunities, currency
exchange rates, adequacy of financing, and availability of experienced management
employees to implement the company's growth strategy, a downturn in market conditions
in any industry relating to the products we sell or the services that we provide; the effects
and duration of continuing economic recession in the U.S. and other markets in which we
operate; and laws and regulations related to environmental matters, including those
addressing the risks of global climate change; and other political developments and laws
and regulations. The company can give no assurance that such forward-looking
statements will prove to be correct. We undertake no obligation to affirm, publicly update
or revise any forward-looking statements, whether as a result of information, future
events or otherwise.
Forward
Looking Statement

3
AZZ is
a specialty electrical equipment
manufacturer serving the global markets
of power generation, transmission,
distribution and industrial as well as a
leading provider of hot dip galvanizing
services to the steel fabrication market
nationwide.
manufacturer serving the global markets
of power generation, transmission,
distribution and industrial as well as a
leading provider of hot dip galvanizing
services to the steel fabrication market
nationwide.
Company
Overview
Total
Company
Sales By Segment
Sales By Segment
45%
43%
55%
57%
Actual
FY2009
$412.4
(in
millions)
Projected
FY2010
$355
to $365
(in
millions)
Projected
FY2011
$310
to $330
(in
millions)
51%
49%
Galvanizing
Electrical
and Industrial
4

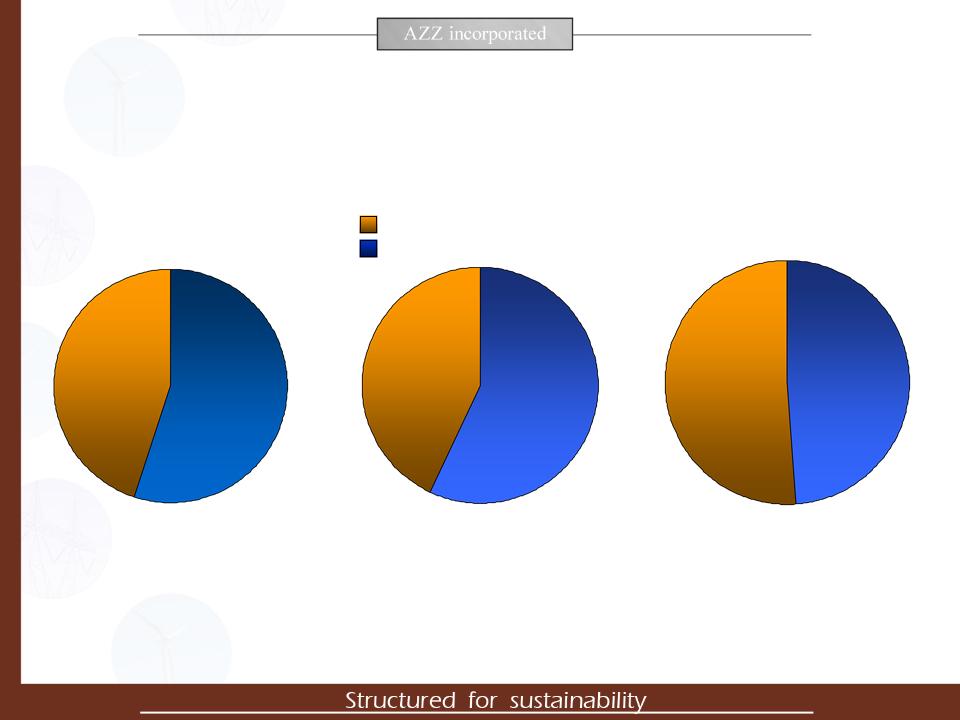
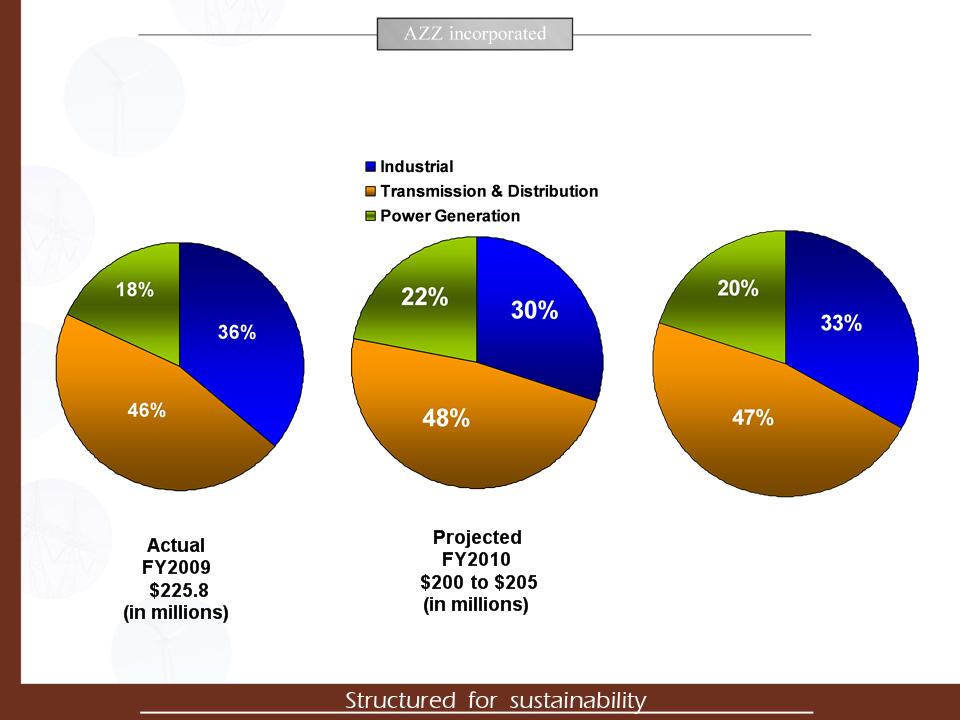
Total
Company
Sales By Market Segment
Sales By Market Segment
Actual
FY2009
$412.4
(in
millions)
Projected
FY2010
$355
to $365
(in
millions)
Projected
FY2011
$310
to $330
(in
millions)
5

Electrical
and Industrial Products
6
Electrical
and Industrial Products
Projected
2011
$150
to $160
(in
millions)
7

Power
Generation
8

Power
Transmission
9
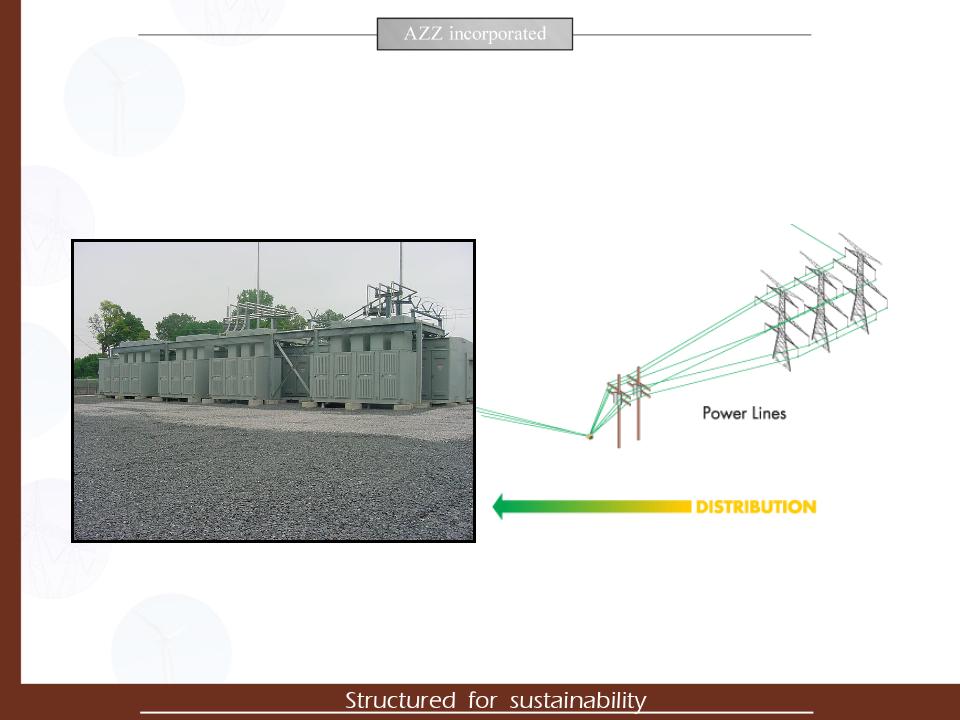
Power
Distribution
10
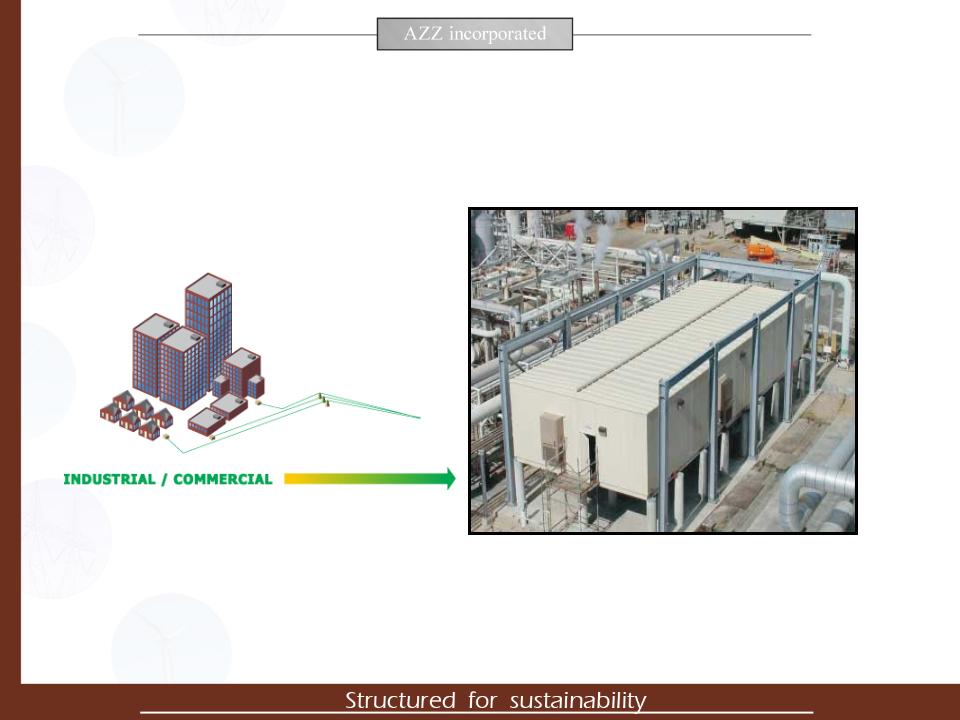
Industrial
/ Commercial
11
12
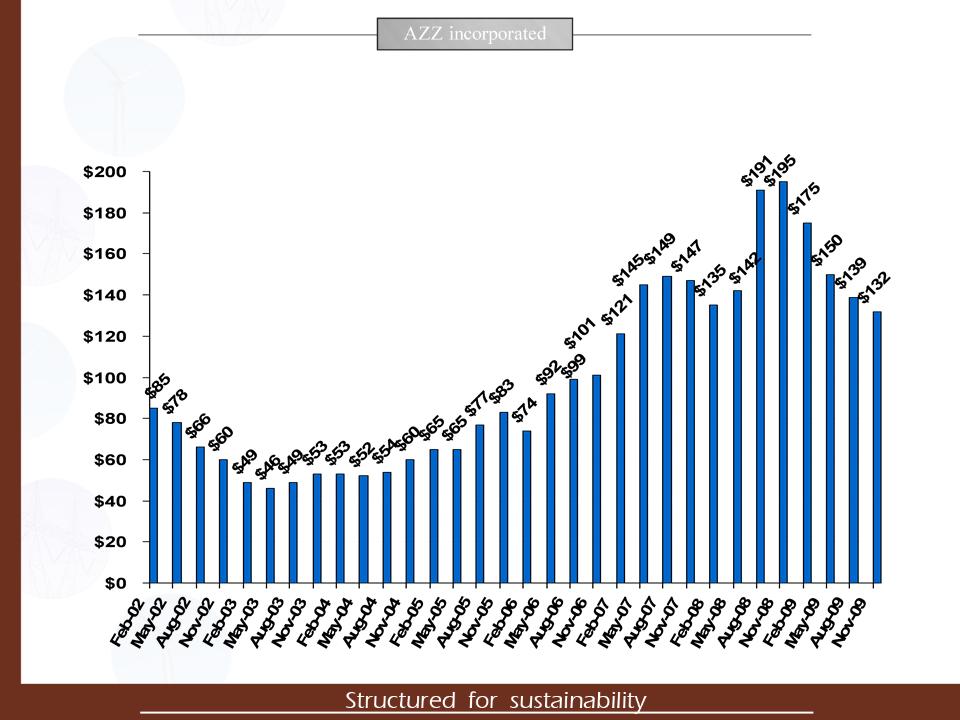
Backlog
($ In
Millions)

13
Backlog
($ In
Millions)
|
|
Fiscal
2008 |
Fiscal
2009 |
1st
Qtr 2010 |
2nd
Qtr
2010 |
3rd
Qtr
2010 |
|
Beginning
Backlog |
$120.7
|
$134.9
|
$174.8
|
$150.0
|
$139.4
|
|
Bookings
|
$334.4
|
$452.3
|
$70.7
|
$84.5
|
$73.9
|
|
Shipments
|
$320.2
|
$412.4
|
$95.5
|
$95.2
|
$81.5
|
|
Ending
Backlog |
$134.9
|
$174.8
|
$150.0
|
$139.4
|
$131.8
|
|
Book
to
Ship Ratio |
104%
|
106%
|
74%
|
89%
|
91%
|
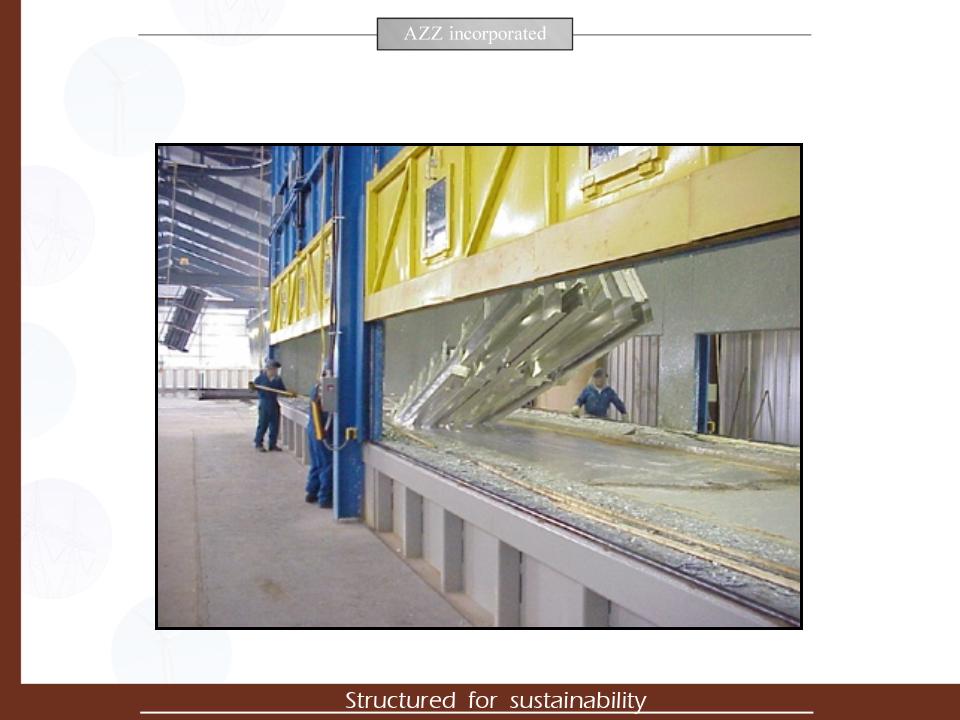
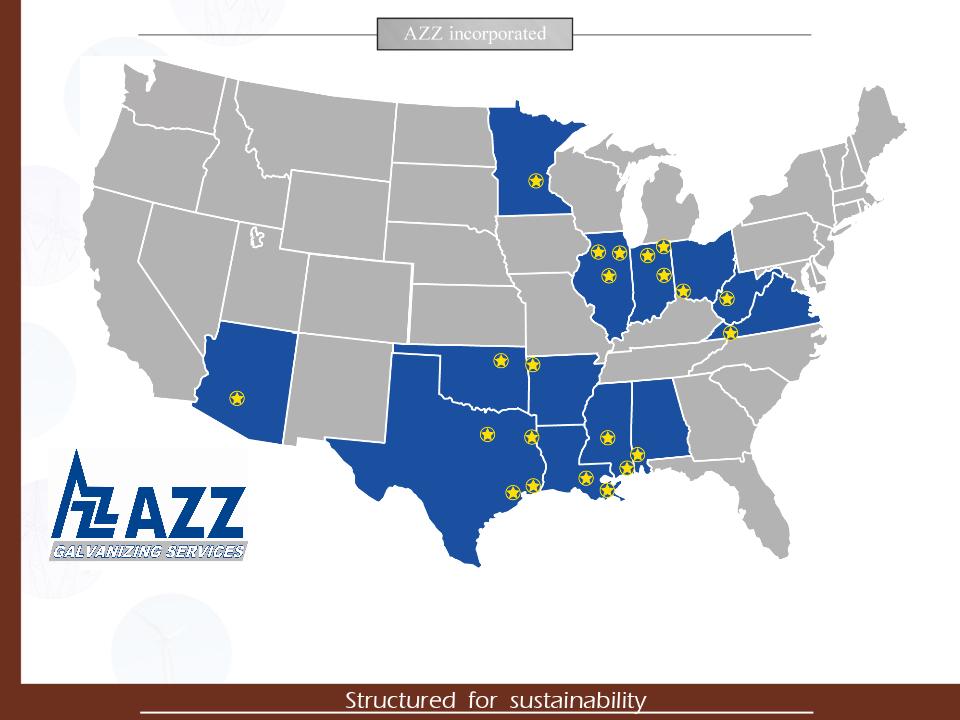
Galvanizing
Services
Application:
“After-fabrication”
steel corrosion protection
steel corrosion protection
Locations: 22
facilities in 13 states
15

16
Galvanizing
Services
Projected
FY2010
$155
to $165
(in
millions)
Projected
FY2011
$160
to $170
(in
millions)

18
Consolidated
Net Sales
($ In Millions)
($ In Millions)
$355
to
$365
$365
$310
to
$330
$330

19
Consolidated
Net Sales
First Nine Months FY10
($ In Millions)
First Nine Months FY10
($ In Millions)

20
Earnings
Per Share
(Fully Diluted)
(Fully Diluted)
$3.00
to
$3.10
$3.10
$1.85
to
$2.20
$2.20

21
Earnings
Per Share
First Nine Months FY10
(Fully Diluted)
First Nine Months FY10
(Fully Diluted)

22
Operating
Margins

23
Operating
Margins
First Nine Months FY10
First Nine Months FY10
Electrical
and Industrial
Products

24
Projected

25
Total
Bank Debt / Long Term Debt to Equity
($ In Millions)
($ In Millions)
Projected
Debt
Projected Debt to
Equity Ratio
Projected
Cash
Fiscal
Year
26
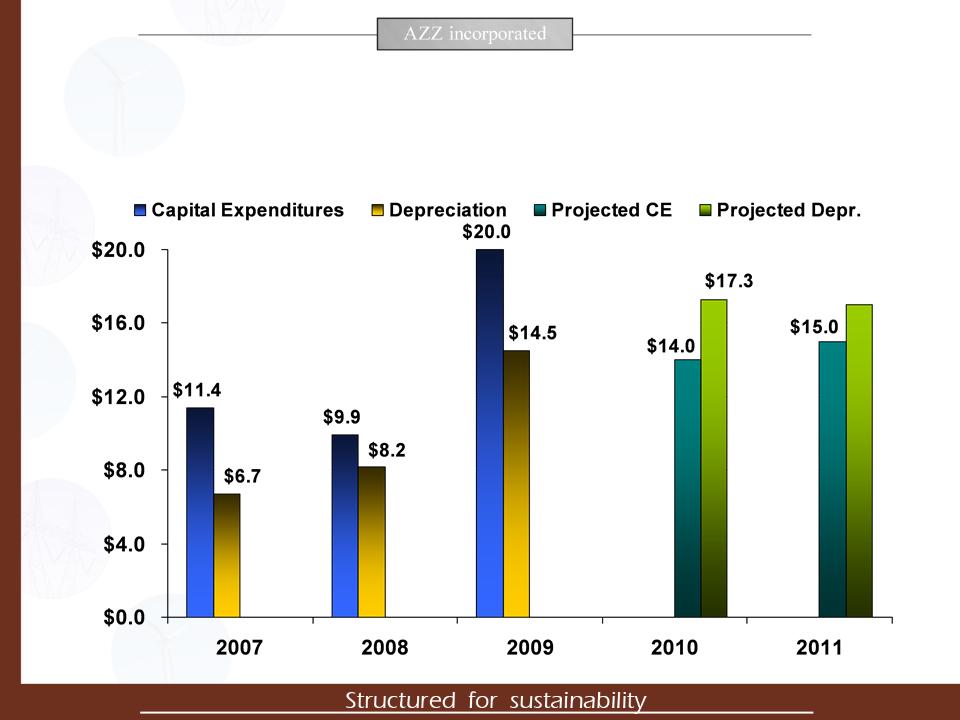
Capital
Expenditures / Depreciation
($ In Millions)
($ In Millions)
$17.0

27
Return
On Assets

28
Investment
Summary
• Strong
Historical Performance
Ø FY10 was 23rd consecutive year of
profitability
Ø 5 Yr CAGR - Revenues
19%, Net Income 51%, EPS 38%
Ø Significant
Operating Margins (above industry averages)
• Key
Growth Drivers
Ø Domestic &
international demand for electrical power and energy
Ø U.S. infrastructure
investment
• Niche
products and value added services with strong market
share position
share position
• Strong
Management Team
• Successful
acquisition track record and opportunities for further
expansion and growth
expansion and growth
• Strong
balance sheet and cash flows

January 2010