Attached files
UNITED STATES
SECURITIES AND EXCHANGE COMMISSION
Washington, D.C. 20549
FORM 10-K
(Mark One)
|
x |
ANNUAL REPORT PURSUANT TO SECTION 13 OR 15(d) OF THE SECURITIES EXCHANGE ACT OF 1934 |
For the fiscal year ended October 31, 2009
OR
|
o |
TRANSITION REPORT PURSUANT TO SECTION 13 OR 15(d) OF THE SECURITIES EXCHANGE ACT OF 1934 |
For the transition period from to
Commission file number: 0-20820
SHUFFLE MASTER, INC.
(Exact name of registrant as specified in its charter)
|
Minnesota |
|
41-1448495 |
|
(State or Other Jurisdiction of Incorporation or Organization) |
|
(IRS Employer Identification No.) |
|
|
|
|
|
1106 Palms Airport Drive, Las Vegas |
NV |
89119 |
|
(Address of Principal Executive Offices) |
(State) |
(Zip Code) |
Registrant’s Telephone Number, Including Area Code: (702) 897-7150
Securities registered pursuant to Section 12(b) of the Act:
|
Title of each class |
Name of each exchange on which registered |
|
Common Stock, $0.01 par value per share |
The NASDAQ Stock Market LLC |
Securities registered pursuant to Section 12(g) of the Act: None
Indicate by check mark if the registrant is a well-known seasoned issuer, as defined in Rule 405 of the Securities Act. Yes o No x
Indicate by check mark if the registrant is not required to file reports pursuant to Section 13 or Section 15(d) of the Act. Yes o No x
Indicate by check mark whether the registrant (1) has filed all reports required to be filed by Section 13 or 15(d) of the Securities Exchange Act of 1934 during the preceding 12 months (or for such shorter period that the registrant was required to file such reports), and (2) has been subject to such filing requirements for the past 90 days.
Yes x No o
Indicate by check mark whether the registrant has submitted electronically and posted on its corporate Web site, if any, every Interactive Data File required to be submitted and posted pursuant to Rule 405 of Regulation S-T (§ 232.405 of this chapter) during the preceding 12 months (or for
such shorter period that the registrant was required to submit and post such files). Yes o No o
Indicate by check mark if disclosure of delinquent filers pursuant to Item 405 of Regulations S-K (§229.405 of this chapter) is not contained herein, and will not be contained, to the best of registrant’s knowledge, in definitive proxy or information statements incorporated by reference in Part III of the Form 10-K or any amendments
to this Form 10-K. o
Indicate by check mark whether the registrant is a large accelerated filer, an accelerated filer, or a non-accelerated filer, or a smaller reporting company. See the definitions of “large accelerated filer,” “accelerated filer” and “smaller reporting company” in Rule 12b-2 of the Exchange Act:
|
Large accelerated filer o |
Accelerated filer x |
Non-accelerated filer o
(Do not check if a smaller reporting company) |
Smaller reporting company o |
Indicate by check mark whether the registrant is a shell company (as defined in Rule 12b-2 of the Act). Yes o No x
The aggregate market value of voting Common Stock held by non-affiliates of the Registrant on April 30, 2009 was approximately $204,369,097.
As of January 11, 2010, 53,608,873 shares of Common Stock of the Registrant were outstanding.
DOCUMENTS INCORPORATED BY REFERENCE
Part III of this Annual Report on Form 10-K incorporates by reference information from the Registrant’s Proxy Statement for its Annual Meeting of Shareholders to be held on March 26, 2010 (“Fiscal 2009 Proxy Statement”) to be filed with the SEC within 120 days of the end of the fiscal year covered by this report.
SHUFFLE MASTER, INC.
ANNUAL REPORT ON FORM 10-K FOR THE YEAR ENDED OCTOBER 31, 2009
TABLE OF CONTENTS
|
|
|
Page |
|
|
Forward Looking Statements |
|
|
|
Part I |
|
|
Item 1. |
5 | |
|
Item 1A. |
18 | |
|
Item 1B. |
25 | |
|
Item 2. |
25 | |
|
Item 3. |
26 | |
|
Item 4. |
26 | |
|
|
Part II |
|
|
Item 5. |
27 | |
|
Item 6. |
29 | |
|
Item 7. |
30 | |
|
Item 7A. |
65 | |
|
Item 8. |
66 | |
|
Item 9. |
104 | |
|
Item 9A. |
104 | |
|
Item 9B. |
107 | |
|
|
Part III |
|
|
Item 10. |
108 | |
|
Item 11. |
108 | |
|
Item 12. |
108 | |
|
Item 13. |
108 | |
|
Item 14. |
108 | |
|
|
Part IV |
|
|
Item 15. |
109 |
SPECIAL NOTE REGARDING FORWARD-LOOKING STATEMENTS
This Form 10-K contains forward-looking statements. The forward-looking statements are contained principally in the sections entitled, “Risk Factors,” “Management's Discussion and Analysis of Financial Condition and Results of Operations” and “Business,” but are also contained elsewhere in this Form 10-K.
In some cases, you can identify forward-looking statements by the following words: “may,” “might,” “will,” “could,” “would,” “should,” “expect,” “intend,” “plan,” “objective,” “anticipate,” “believe,” “estimate,” “predict,” “project,” “potential,” “continue,” “ongoing” or the negative of these terms
or other comparable terminology intended to identify performance or achievements to be materially different from the information expressed or implied by these forward-looking statements. Although we currently believe that we have a reasonable basis for each forward-looking statement contained in this Form 10-K, we caution you that these statements are based on a combination of facts and factors currently known by us, as well as our projections of the future, about which we cannot be certain. Forward-looking statements
reflect and are subject to inherent known and unknown risks and uncertainties that could cause actual results to differ materially from those expressed or implied. Risk factors that could cause actual results to differ materially from expectations include, but are not limited to, the following:
|
· |
We are dependent on our intellectual property and trade secrets and we may be unable to protect our intellectual property and trade secrets from infringement, misappropriation, or claims of infringement or invalidity. Additionally, changes in the patent laws could adversely affect the validity or enforceability of one or more of our patents; |
|
· |
the gaming industry is highly regulated and we must adhere to various regulations and maintain our licenses to continue our operations. Failure to obtain and/or maintain our licenses could be disruptive to our business and could adversely affect our operations; |
|
· |
a continued downturn in general worldwide economic conditions or in the gaming industry or a reduction in demand for gaming may adversely affect our results of operations. As a result, the market price of our common stock may decline; |
|
· |
our domestic and global growth and ability to access capital markets are subject to a number of economic risks; |
|
· |
risks that impact our customers may impact us; |
|
· |
economic, political, legal and other risks associated with our international sales and operations could adversely affect our operating results; |
|
· |
litigation may subject us to significant legal expenses, damages and liability and is inherently unpredictable and risky; |
|
· |
our products currently in development may not achieve commercial success and if we are unable to maintain a competitive technological position, we may suffer a material adverse effect on our business, results of operations or financial condition; |
|
· |
we compete in a single industry and our business may suffer if our products become obsolete or demand for them decreases, including without limitation, a result of the downturn in the gaming industry; |
|
· |
any disruption in our manufacturing processes, any significant increases in manufacturing costs or any inability to manufacture a sufficient number of our products to meet demand could adversely affect our business and operating results; |
|
· |
the products in each of our segments may experience losses due to technical difficulties or fraudulent activities; |
|
· |
we operate in a very competitive business environment and if we do not adapt our approach and our products to meet this demand, our business, results of operations or financial condition could be adversely impacted; |
|
· |
we are dependent on the success of our customers and are subject to industry fluctuations; |
|
· |
certain market risks may affect our business, results of operations and prospects; |
|
· |
we are exposed to interest rate and foreign currency risk; |
|
· |
we could face considerable business and financial risk in implementing acquisitions; |
|
· |
if our products contain defects, our reputation could be harmed and our operating results and financial results could be adversely effected; |
|
· |
we may not be able to attract, retain, or motivate the management or employees necessary to remain competitive in our industry; |
|
· |
we may be unable to adequately comply with public reporting requirements; |
|
· |
our continued compliance with our financial covenants in our Senior Secured Credit Facility is subject to many factors, some of which are beyond our control and if we are unable to remain compliant under our financial covenants, our results of operations could be adversely affected by servicing costs; |
|
· |
the restrictive covenants in our Senior Secured Credit Facility may limit our ability to finance future operations or capital needs or engage in other business activities that may be in our interest; and |
|
· |
our business is subject to quarterly fluctuation. |
In addition, refer to the “Risk Factors” section for a discussion of other important factors that may cause our actual results to differ materially from those expressed or implied by our forward-looking statements. As a result of these factors, we cannot assure that the forward-looking statements will prove to be accurate. Furthermore,
if our forward-looking statements prove to be inaccurate, the inaccuracy may be material. In light of the significant uncertainties in these forward-looking statements, these statements should not be regarded as a representation or warranty by us or any other person that we will achieve our objectives and plans in any specified time frame, or at all. We undertake no obligation to publicly update any forward-looking statements, whether as a result of new information, future events or otherwise, except as required
by law. Our actual future results may be materially different from what we expect. We qualify all of our forward-looking statements by each of these cautionary statements above.
PART I
(In thousands, except units, per unit/seat amounts and square footage)
ITEM 1. BUSINESS
BUSINESS
Unless the context indicates otherwise, references to “Shuffle Master, Inc.”, “we”, “us”, “our”, or the “Company”, include Shuffle Master, Inc. and its consolidated subsidiaries.
We are a Minnesota corporation formed in 1983. We conducted our initial public offering and became a NASDAQ-listed public company in 1992. Our corporate offices are located at 1106 Palms Airport Drive, Las Vegas, Nevada 89119 and our telephone number is 702-897-7150.
We maintain an Internet website at www.shufflemaster.com and we make available on the website, free of charge, our Annual Reports on Form 10-K, Quarterly Reports on Form 10-Q and Current Reports on Form 8-K and amendments to those reports filed or furnished pursuant to Section 13(a) or 15(d) of the Securities Exchange Act of 1934, as amended,
as soon as reasonably practicable after filing such material electronically with the Securities and Exchange Commission. We also provide a variety of other information on our website including all of our press releases. We have included our website address in this filing only as a textual reference. The information contained on our website is not incorporated by reference into this Annual Report on Form 10-K.
We specialize in providing casino and other gaming customers with products and services that enhance their gaming floors by improving profitability, productivity and security, as well as offering popular cutting-edge gaming entertainment content and technology. We operate through four business segments: Utility, Proprietary Table Games (“PTG”),
Electronic Table Systems (“ETS”) and Electronic Gaming Machines (“EGM”). Our four business segments are summarized as follows:
Utility. Our Utility segment develops products for our customers that enhance table game speed, productivity, profitability and security. We introduced the first successful automatic card shuffling equipment
to the gaming industry and we continue to develop and market a full complement of automatic card shufflers for use with the vast majority of card-based table games placed in casinos and other gaming locations, including our own proprietary table games. We are working on the development of next generation shufflers and technological advancements in the areas of card recognition and remote diagnostics, among other developments. Currently, our Utility segment revenue is derived substantially from the lease and sale
of our automatic card shufflers and associated service revenue. We also offer chip sorting products that simplify the handling of gaming chips on high volume roulette tables. Additionally, we have acquired or are developing products to gather data and to enable casinos to track table game play such as our i-Shoe™ Auto card reading shoe, our i-Score™ baccarat viewer that displays current game results and trends and our Deck Checker® card
deck checking device. These products are intended to cost-effectively provide casinos and our other customers with data on table game play for security and marketing purposes, which in turn allows them to increase their profitability.
Proprietary Table Games. We develop and deliver proprietary titles that enhance our casino and other gaming customers’ table game operations. Products in this segment include our live and electronic proprietary table games as well as progressive
upgrades and proprietary features added to public domain games such as poker, baccarat, pai gow poker and blackjack table games. We believe we currently have the most popular proprietary table game titles in the world, as our current proprietary table games titles include twelve of the top fifteen most popular proprietary titles in the world (by revenue) as of October 31, 2009.
We intend to broaden our PTG content through development and acquisition. By enhancing the value of our existing proprietary table games in the marketplace with side bets, add-ons and progressives and by increasing our footprint with new titles, we hope to increase our domestic market penetration and expand further into international markets.
We also intend to expand the domestic presence of our proprietary titles on electronic platforms such as our Table Master® and i-Table™. We also plan to continue to install proprietary progressives and side bets on public domain table games in addition to our proprietary table games. Additionally, to maximize the reach of our broad intellectual property portfolio, we have licensed several
of our popular proprietary table game titles to a variety of other companies including Delta Rangers, Inc. that offer, where legal, play-for-real internet gaming. Internet gaming is not legal in the United States.
Electronic Table Systems. Our ETS segment develops and delivers various products involving popular table game content using e-Table game platforms. Our primary ETS products are the Table Master, Vegas Star®,
Rapid Table Games™ and the newly developed i-Table platforms. Our Table Master and some of our Vegas Star products feature a virtual dealer which enables us to offer table game content in markets where live table games are not permitted, such as racinos, video lottery and arcade markets. Our Rapid Table Games product enables the automation of certain components of traditional table games such as data collection, placement
of bets, collection of losing bets and payment of winning bets combined with live dealer and game outcomes. This automation provides benefits to both casino operators and players, including greater security and faster speed of play. Our newly developed i-Table platform combines an electronic betting interface with a live dealer who deals physical cards from a Shuffle Master card reading shoe or shuffler which is designed to dramatically improve game speed and security while reducing many operating
expenses associated with live tables.
Electronic Gaming Machines. Our EGM segment develops and delivers our PC-based video slot machines into select markets, primarily in Australia and, to a lesser extent, Asia and Latin America. Through our Australian subsidiary Stargames Limited
(“Stargames”), we offer an extensive selection of video slot titles which include a range of bonus round options that can be configured as a network of machines or as stand-alone units. In addition to selling the full EGM complement, we sell software conversion kits that allow existing EGM terminals to be converted to other games on the PC3 and PC4 platform. Popular titles for our EGMs include Drifting Sands™, Ninja™,
iChing™, Kelly Country™, Deep Sea Dollars™, Cuba™, Galapagos Wild™, Sunset on the Serengeti™ and
Lonesome George™, as well as the Pink Panther™ and Grand Central™ progressive links.
For additional information about our segments, including segment revenue, operating income (loss) and assets, see “Item 6. Selected Financial Data,” “Item 7. Management’s Discussion and Analysis of Financial Condition and Results of Operations” and “Item 8. Financial Statements and Supplementary Data”
included in this Form 10-K.
The table below presents our product lines and the percentage of total revenue from continuing operations contributed by each product line in the fiscal years ended October 31:
|
Percentage of Total Revenue |
||||||||||||
|
Product Segment |
2009 |
2008 |
2007 |
|||||||||
|
Utility |
40.0 | % | 42.5 | % | 43.9 | % | ||||||
|
Proprietary Table Games |
21.6 | % | 20.3 | % | 18.5 | % | ||||||
|
Electronic Table Systems |
12.4 | % | 14.5 | % | 15.5 | % | ||||||
|
Electronic Gaming Machines |
26.0 | % | 22.6 | % | 22.0 | % | ||||||
|
Other revenue |
0.0 | % | 0.1 | % | 0.1 | % | ||||||
| 100.0 | % | 100.0 | % | 100.0 | % | |||||||
OUR STRATEGY
We are proud of the products that we develop and market and believe we can have continued growth and expansion. To that end, we have devised and are implementing the following ongoing strategic plan:
Develop a true “strategic partner” relationship with our customers
Our first strategic goal focuses on partnering with our customers, not only to provide enhanced efficiencies, maximize security and maximize profitability on the casino floor, but also work diligently to develop innovative products that anticipate and respond to their needs. To demonstrate our top strategic initiative, we rolled out a
12 Point Pledge that outlines our commitment to our customers:
|
We will be a strategic partner to our customers. | |
|
We will work diligently to meet our customers’ needs. | |
|
We will provide solutions, not just products. | |
|
We will never forget: we’re in the business of fun. | |
|
We will foster trust from the very first handshake. | |
|
We will provide innovative products. | |
|
We will be tireless in our pursuit of excellence. | |
|
We will provide answers, not excuses. | |
|
We will set a high bar for service. | |
|
We will identify creative ways to improve our customers’ performance. | |
|
We will collaborate with our customers to fuel their profitability. | |
|
We will know we’ve reached our full potential when we’ve enabled our customers to reach theirs. |
Continued emphasis on leasing versus selling
We intend to continue executing this strategy primarily in North America although we will encourage leasing programs in other parts of the world.
Continued development of technology to drive new products across all product lines
This strategic initiative includes our card reading shoes and shufflers, shuffler interface with table systems, live and electronic table game progressive systems and the development of new titles for all of our e-Table platforms on a worldwide basis.
Value engineering to reduce manufacturing costs across all product lines
Our focus is currently on savings attributable to component parts, product redesign and lower cost manufacturing opportunities.
Continued commitment to reduce expenses throughout the Company without compromising the quality of our products or service
Our goal is to reduce expenses through cost savings initiatives as well as thoroughly examining our infrastructure to improve our operating margins without compromising the quality of our products or service.
This ongoing strategic plan assists us in defining and implementing our specific product strategies for the future, which in no particular order are:
|
· |
To focus on developing, manufacturing and marketing products that increase the speed, profitability, productivity and security of our casino and other customers in their table game operations. |
|
· |
To develop and market shufflers with advanced features and capabilities, such as optical card recognition and deck validation, to replace older generation shufflers and to further penetrate domestic and foreign markets. |
|
· |
To broaden our PTG segment by developing or acquiring additional table game content to increase our penetration of casino customers' table game operations. In addition, our analysis has shown that there exists a strong correlation between proprietary table game growth and demand for automatic shufflers. |
|
· |
To develop a variety of felt-based and e-Table solutions to increase revenue from existing assets in the field by adding new proprietary features such as progressives and side bets. |
|
· |
To market our e-Table platforms to provide a cost-effective brand extension of our PTG content to existing casino and new casino customers and to explore other venues in which the platforms could be reasonably modified to fulfill market demands. |
|
· |
To continue our commitment to develop new and exciting titles for our EGM products, allowing us to maintain our niche product offering. |
|
· |
To develop or acquire patents, licenses and other intellectual property both to broaden our product offerings and to vigorously protect our patents and products from potential infringement. |
OUR UTILITY SEGMENT
Since our founding, we have developed and marketed products that include a combination of technology to enhance the speed, productivity, security and profitability of the table game operations of our customers. Our automatic card shufflers were the first such products. We believe that our customers are seeking to increase the operating
returns of their table game operations.
Our Shuffler Products. We currently market a complete range of shufflers, including single deck, batch and continuous shufflers. Single deck shufflers that deliver randomized hands of cards such as our i-Deal™ and
ACE® shufflers are generally used on proprietary table games such as our own Three Card Poker® and Ultimate Texas Hold ‘Em® games. Additionally, we offer a single deck/double deck batch shuffler, the Deck Mate®,
for use on live stakes poker tables and single or double deck blackjack games. For multiple deck “shoe” games such as Blackjack, Blackjack variants, Baccarat and Casino War® we offer the one2six® family of continuous shufflers. For casinos that prefer to shuffle “shoe” games in a batch shuffler, we
offer the MD2® with card recognition. Shuffled batches of cards may then be delivered to one of our secure card reading i-Shoe™ and i-Shoe Auto shoes.
Our shufflers significantly reduce the opportunity for card manipulation by dealers, resulting in increased security. By allowing cards to be shuffled continuously or in frequent batches, our shufflers reduce or eliminate card counting and shuffle tracking. Because our shufflers shuffle one or more decks while a game is being played, down-time
related to dealer shuffling is also significantly reduced, with the potential for a corresponding increase in playing time and win for the casino.
Our latest single-deck shuffler, the i-Deal, combines a number of enhanced features such as optical card recognition technology, card re-sorting, a new ergonomic design with flush mount load and a programmable multi-game function to enhance game security and provide cost savings for the casino.
Our Chip Sorting Machines. Our chip sorting machines simplify the handling of gaming chips, which increases the productivity and security on roulette tables.
Intelligent Table Systems ("ITS") and other Utility Products. We have acquired and are developing technology to enable casinos and other customers to track and analyze play on their table games.
Our existing Utility products are the following:
ACE®
Deck Mate®
i-Deal™
MD2®
one2six®
one2six Plus™
Easy Chipper™ C
Chipmaster™
i-Score™
i-Shoe™ Auto
i-Verify™
MD2® Workstation
OUR PROPRIETARY TABLE GAMES SEGMENT
Our Proprietary Table Games and Other Proprietary Features. Our PTG segment includes our live and electronic proprietary table games, progressive table games with bonusing options and proprietary side bets. We are continuously developing new table games to complement
our existing offerings and to extend our penetration of proprietary table games on the casino floor.
Our more popular titles, including progressive table games with bonusing options and proprietary side bets are listed below in four categories; premium titles, side bets, add-ons and progressives. The combination of premium titles and side bets represents the equivalent of casino floor space (“real estate”) while add-ons
and progressives generate incremental revenue on existing casino floor space.
Premium titles:
Caribbean Stud®
Casino War®
Crazy 4 Poker®
Four Card Poker®
Fortune Three Card Poker™
Let It Ride®
Let It Ride Bonus®
Mississippi Stud™
Texas Hold'Em Bonus®
Three Card Poker®
Ultimate Texas Hold ‘Em ®
Side bets:
Bet the Set "21"®
Dragon Bonus®
Fortune Pai Gow Poker®
King’s Bounty™ blackjack
Royal Match 21®
Sharp Shooter™
Add-ons:
Bad Beat Bonus bets
Three Card Poker Bonus bets
Progressives:
Progressive bonus bets
OUR ELECTRONIC TABLE SYSTEMS SEGMENT
Our Electronic Table Systems. Our ETS products are e-Table platforms developed for multi-player use. We have developed or acquired other technology or platforms to deliver our proprietary table game content or public domain games on multi-player terminals. Some of
our e-Table products enable us to offer table game content in markets where live table games are not permitted, such as racino, video lottery and arcade markets. We are developing these e-Table platforms to enable the marketing and deployment of our table game content into previously unpenetrated international and domestic casino, racino and other gaming markets.
Our existing ETS products are the following:
i-Table™
Rapid Table Games™
Table Master®
Vegas Star®
OUR ELECTRONIC GAMING MACHINES (“EGM”) SEGMENT
Our Electronic Gaming Machines. We offer an extensive selection of video slot titles developed for select markets primarily in Australia and, to a lesser extent, Asia and Latin America. Featuring a wide variety of denominations and configurations,
EGMs can be configured as a network of machines or as stand-alone units. EGM titles are offered in the ergonomic eStar™ cabinet and are available on both the dependable Stargames PC3 operating platform and more recently the PC4 operating platform. The PC4 operating platform features enhanced audiovisual capabilities as well as greater capacity to integrate with technical advancements expected in the coming years.
At Stargames' headquarters, the slot cabinets are designed and assembled and the gaming content is developed for the various Australian and international jurisdictions where these machines are sold. These games are developed to function on a multitude of operating protocols including SAS, X Series, QCOM, VLC and ASP. Some popular titles for
our EGMs include Drifting Sands, Ninja, iChing, Kelly Country, Deep Sea Dollars, Cuba, Galapagos Wild, Sunset on the Serengeti and Lonesome George, as well as the Pink Panther and Grand Central progressive links.
Stargames also licensed content from and paid royalties to WMS Industries Inc. (“WMS”), a U.S. slot manufacturer. This agreement was limited to the Australian and New Zealand markets and terminated on January 31, 2008. Except for several titles, the rights expired in mid 2009, and we have no minimum royalty obligations
with respect to those titles.
OTHER SEGMENT INFORMATION
Customers and marketing. We market our products to casinos and other legal gaming establishments around the world with our direct domestic and international sales force and several domestic and international distributors and/or representatives. We also market several
of our e-Table products to a variety of gaming venues not permitted to offer live table games, such as racinos and other legal gaming establishments around the world. We currently maintain sales and marketing offices on six continents and have relationships with various distributors worldwide.
We believe the quality and breadth of our customer base is a strong testament to the effectiveness and quality of our product offerings, technological innovation and customer service. Our customer base includes the leading casino operators on all six continents that allow casino style gaming, including operators in leading established gaming
markets such as the United States, Canada, Latin America, Macau, Singapore, Malaysia, Australia, Europe and Africa. Moreover, our customer base includes all of the top 20 global gaming companies measured by annual revenues. Our customers include, among others, Harrah's Entertainment, MGM Mirage, Mohegan Tribal Gaming Authority, Las Vegas Sands Corp., Crown Ltd., Wynn Resorts, Limited, Sociedade de Jogos de Macau S.A., Genting Groups, Galaxy Entertainment Group Limited, The Rank Group and Sun International Resorts.
Our products and the locations in which we may sell them are subject to the licensing and product approval requirements of various national, state, provincial and tribal jurisdictional agencies that regulate gaming around the world. See “Business—Gaming Regulation” section below. We both lease and sell
our products, although we implemented a strategy to continue our emphasis on leasing versus selling, predominantly in the United States. When we lease our products, we generally negotiate a month-to-month operating lease or license for our products for a fixed fee, or to a lesser extend, enter into participation arrangements whereby casinos pay a fee to us based on a percentage of net win. When we sell certain of our products, we sometimes offer our customers a choice between a sale or a longer-term
sales-type lease or other financing arrangements, depending on the needs of each customer. We service the products we sell and lease with those on lease including a service contract. We also offer service packages to customers who purchase products from us.
Competition. We compete with other gaming products and supply companies for space on the casino customer's floor, as well as for our customer's capital spending. With respect to our Utility segment, namely shufflers and other gaming equipment, we compete on this basis
as well as on the basis of offering a complete line of shufflers, product reliability, a superior service network, the strength of our intellectual property and the breadth of our sales, regulatory and distribution channels. Other companies may develop and market shufflers and seek to develop and obtain regulatory approvals of additional shuffler products. Our shufflers also compete against hand shuffling, which remains the most common shuffling option on casino card games around the world. Finally, since the
need for our shufflers is dependant upon the casino’s use of live table games, our shufflers also compete against any products that live table games compete against. We cannot provide assurances that a competitive product will not gain substantial placements or that a competitive product or hand shuffling will cause price erosion of our shufflers in the future. As it relates to our Easy Chipper C™ and
Chipmaster roulette chip sorting products, competition is primarily limited to the Chipper Champ Plus™ and the more current Chipper Champ 2™, both sold by TCSJohnHuxley. Competition with our i-Shoe card reading shoe is predominantly limited to Angel Co. Ltd.'s Angel Eye® card
reading shoe and the Bee Electronic Baccarat Dealing Shoe (U.S. Playing Card Company).
With respect to our PTG segment, in addition to companies such as International Game Technology (“IGT”), Bally Technologies, Inc. (“Bally”), Aristocrat Gaming (“Aristocrat”) and WMS Industries Inc. (“WMS) that primarily market slot machines, we also compete with both non-proprietary table games such
as blackjack and several companies which primarily develop and license proprietary table games. Some of those competitors' widely known proprietary table game titles include Galaxy Gaming's Lucky Ladies™, Emperor's Challenge™, Masque Publishing's Spanish 21®,
DEQ Systems EZ Baccarat, Prime Table Games and Gaming Entertainment. Additionally, competition with our progressive bet system for table games includes DEQ Systems. Competition in this segment is particularly based on price, brand recognition, player appeal and the strength of underlying intellectual property. Smaller developers and vendors are more able to participate in developing and marketing table games, compared to other gaming products, because of the lower cost and complexity associated with the development
of these products and a generally less stringent regulatory environment. We compete on these bases, as well as on the strength of our extensive sales, service and distribution channels. We have been able to increase our placements of table games not only because of the general growth of table games, but also by displacing other table game products. In the future, table game competitors as well as slot machine companies could market table games that might displace our products.
With respect to our ETS segment, there are numerous other companies that manufacture and/or sell e-Tables that are similar to the games in our ETS segment. These companies include, but are not limited to, TCSJohnHuxley, Aristocrat, Interblock (member of Elektroncek Group), Aruze Corporation (“Aruze”), Novomatic Industries (“Novomatic”),
IGT, PacificNet Inc. (“PacificNet”), PokerTek, Inc. (“PokerTek”) and TableMAX Holdings (“TableMAX”). Our e-Tables, as well as those of other companies, also compete for casino floor space with live table games and EGMs. One of our competitive strengths in this segment is the ability to offer our proprietary table game titles on various e-Table platforms.
Our EGM segment is part of a highly competitive international slot market. The Australasian market reflects other worldwide markets insofar as most of the major international manufacturers have a presence there. The major competitors to our EGM products in these markets are Aristocrat, IGT, Bally, WMS, Konami Gaming, Inc. (“Konami”),
Aruze and Ainsworth Game Technology (“Ainsworth”). In Asia, these competitors are also active along with further competition from myriad of European slot manufacturers.
Finally, some of our product segments may compete against each other for space on the casino floor.
Product supply. We obtain most of the parts for our products from outside suppliers, including both off-the-shelf items as well as components manufactured to our specifications. We also manufacture a small number of parts in-house that are used both for product assembly
and for servicing existing products. We generally perform warehousing, quality control, final assembly and shipping ourselves from our facilities in both Las Vegas and Sydney, Australia, although small inventories are maintained and repairs are performed by our field service employees.
Additionally, some of our products are manufactured by subcontract manufacturers, located in Desplaines, Illinois, Phoenix, Arizona and Salzburg, Austria, all of which also inventory and ship these products. We believe that our sources of supply for components and raw materials are adequate and that alternative sources of materials are available.
Research and development (“R&D”). We employ a staff of electrical, mechanical and software engineers, graphic artists and game developers to support, improve and upgrade our existing shufflers, to develop new shufflers, to develop technology
and game content for our PTG, e-Table platforms and EGM products and to develop and explore other potential table-related products. We perform the majority of our research and development ourselves in the U.S. and in Australia. We also conduct research and development through the use of a foreign, third party developer for certain of our international product offerings.
We believe that one of our strengths is identifying new product opportunities and developing new products, therefore we expect to continue to spend a significant portion of our annual revenues on research and development, including the acquisition of intellectual property from third parties. Total R&D expense was $17,349, $18,474
and $17,337 for fiscal 2009, 2008 and 2007, respectively.
INTELLECTUAL PROPERTY
We believe that our patents, trademarks, licenses, copyrights and trade secrets are significant assets that provide us with a competitive advantage and are critical to our future profitability and growth. We protect our investment in research and development by seeking patent and trademark protection for our technologies. We also acquire
and license patents and other intellectual property from third parties. Infringement claims, patent invalidity or expiration, license non-renewal, failure to stop infringers, inadequacy of patent and other intellectual property coverage, delays in using our intellectual property to develop products or the costs of protecting our intellectual property and changes to the intellectual property laws could adversely affect our future results of operations and our financial position.
Patents. We own numerous United States and international patents and applications related to our existing products and methods, future products that have not yet been introduced, potential product modifications and improvements and to products we do not currently
sell. Some of the patents (primarily our game play method patents) we own are issued only in the United States. A majority of the technology is internally developed, however, some of our technology has been purchased and is licensed.
Most of the patents that we own have a life of 20 years from the filing date of the first non-provisional patent application in a family of patents. While some of our older owned game patents expire in the next 3-5 years and some older technology shuffler patents expire in 2014, the majority of our patents, including those with
our newest technology, expire thereafter. Under the laws of the United States, when a patent expires, a competitor would be legally able to make, use, offer to sell or sell the invention claimed in the patent. We believe that the expiration of any of our patents prior to 2015 will not have a material adverse effect on our business. A number of our licensed patents expired in 2009, but the expirations have not and are not expected to materially affect our business. We also have numerous patent
applications pending for our existing, planned and potential products. No assurance can be given that any such patents will be issued, or that the patents we currently hold or have licensed or any new patents that we acquire are, will be, or will remain valid, will provide any competitive protection for our products, or will adequately cover our competitors' products. We may decide to sell in the ordinary course of business patents that we no longer continue to believe are strategic to our business.
Trademarks. We own numerous United States and international trademark registrations and common law trademarks. Some of the more important marks include: Shuffle Master, Incorporated®,
the Shuffle Master 4-square logo®, ACE, Deck Mate, i-Deal, MD1®, MD2, one2six, Deck Checker, Easy Chipper C, i-Shoe, i-Shoe Auto, Bet the Set “21”, Blackjack Press®, Caribbean Stud, Casino War, Crazy 4 Poker, Dragon Bonus, Fortune Blackjack®,
Fortune Pai Gow Poker, Four Card Poker®, Jackpot Baccarat™, Let It Ride, Let It Ride Bonus, Let It Ride The Tournament™, Mississippi Stud®, Royal Match 21, Texas Hold ‘Em
Bonus®, Three Card Poker, Ultimate Texas Hold' Em Bonus®, i-Table, Table Master, Rapid Table Games and Vegas Star. We believe that our trademarks and trade dress are an important component of the brand identity of our products. We also license trademarks from others.
Intellectual property licenses. We obtain licenses to intellectual property from third parties. These licenses are subject to various conditions and restrictions and typically involve us paying royalties on a fixed or unit basis. While we do not believe that any of
these current license agreements are in jeopardy of being terminated, we can make no assurance that all of these license agreements will remain in effect or that such licenses can be extended under terms favorable to us.
In addition, when we license our products to our customers, we also license the right to use our intellectual property to casino customers. We typically earn license royalties on a periodic basis. We do not license our intellectual property to other gaming equipment suppliers, except occasionally as part of a cross-license arrangement.
We granted a multiple game license to Delta Rangers, Inc. for the play of a number of our proprietary table games on legalized internet gaming sites outside of the United States.
Other intellectual property. In addition to patents, we also own intellectual property in the form of copyrights (registered and unregistered), trademarks (registered and unregistered), trade dress and as trade secrets. No assurance can be given that we will be successful
in maintaining the confidentiality of our trade secrets and other proprietary information. Costs associated with defending and pursuing infringement claims can be substantial. In the absence of valid and enforceable patent, copyright, trademark or trade secret protection, we would be vulnerable to competitors who could lawfully copy our products and technology.
Product-related agreements. We are a party to certain cross-licensing agreements. Under these agreements, we have certain rights to third party intellectual property. There are no royalty obligations with respect to any of these agreements that are material to our
results of operations. Further, none of the royalties that we receive from these agreements are material to our results of operations.
Infringement and litigation. We do not believe that any of our products, methods or technologies infringes the valid and enforceable patents or other intellectual property rights of others. However, we have been and are subject to litigation claiming that we have
infringed the rights of others and that certain of our patents and other intellectual property are invalid or unenforceable. We have also brought actions against others to protect our rights. For a discussion of these cases see “Item 3. Legal Proceedings” and Note 15 in “Item 8. Financial Statements and Supplementary Data”, included in this Form 10-K.
GAMING REGULATION
Overview. We are subject to a wide range of complex gaming laws and regulations in over 200 jurisdictions, both foreign and domestic, in which we are licensed or have applications pending. Jurisdictions require us to be licensed, our key personnel to be found suitable, qualified or licensed and our products to be reviewed and approved before placement. Additionally, gaming laws and regulations of most jurisdictions provide that beneficial owners of 5% or more of our common stock
are subject to reporting procedures and may be subject to licensure that includes suitability investigations and submission of personal and financial information as required, unless the owner is eligible for and obtains an exemption or waiver. Under certain circumstances, an “Institutional Investor,” as such term is defined by certain gaming jurisdictions' statutes or regulations, who acquires more than 5%, may apply for a waiver of the suitability requirement. Generally, gaming jurisdictions may
permit an Institutional Investor to hold up to 15% upon a showing that they meet the jurisdiction's definition of an “Institutional Investor” and certification as to their passive investment intent. Furthermore, most jurisdictions have ongoing reporting requirements for certain transactions and are concerned with our accounting practices, internal controls, business relationships and the fair operation of our products. Gaming regulatory requirements vary from jurisdiction to jurisdiction and licensing,
approvals and processes related to findings of suitability, qualifications or licenses, our products, key personnel and certain shareholders can be lengthy and expensive.
General regulatory licensing and approvals. We intend to maintain our existing licenses and to seek the necessary licenses, approvals, qualifications and findings of suitability for us, our products and our management personnel in new jurisdictions where we anticipate
sales or leasing opportunities. We have never been denied a license, permit or approval necessary to do business in any jurisdiction, nor had a license suspended or revoked. However, there can be no assurance that new licenses, approvals, qualifications or findings of suitability will be obtained or that our existing licenses will not be revoked, suspended or conditioned. If a license, approval, qualification or finding of suitability is required by a regulatory authority and we fail to seek or do not receive
the necessary license, qualification or finding of suitability, then we may be prohibited from distributing our products for use in the respective jurisdiction or may be required to provide our products through other licensed entities at a reduced profit to us. There can also be no assurance that we will be able to obtain the necessary approvals for our products as they are developed. In addition, changes in legislation or in judicial or regulatory interpretations could occur which could adversely affect us.
We are licensed as a manufacturer and distributor of gaming devices, an operator of inter-casino linked systems and a slot route operator in Nevada. We are a gaming-related casino service industry licensee in New Jersey and hold supplier, manufacturer and distributor licenses in numerous other jurisdictions throughout North America and elsewhere.
Due to variations in jurisdictional regulatory transaction reporting, as well as manufacturer, distributor and product licensing requirements, only the specifics of Nevada gaming law requirements are provided below as being representative of gaming regulation to which we are subject in other jurisdictions.
Nevada regulatory matters. We are subject to the Nevada Gaming Control Act (the “Nevada Act”) and to the licensing and regulatory control of the Nevada State Gaming Control Board (the “Nevada Board”), the Nevada Gaming Commission (the “Nevada
Commission”) and various local, city and county regulatory agencies (collectively, the “Nevada Gaming Authorities”).
The laws, regulations and supervisory procedures of the Nevada Gaming Authorities are based upon declarations of public policy which are concerned with, among other things: (i) the character of persons having any direct or indirect involvement with gaming to prevent unsavory or unsuitable persons from having a direct or indirect involvement
with gaming at any time or in any capacity; (ii) application of appropriate accounting practices and procedures; (iii) maintenance of effective control over the financial practices and financial stability of licensees, including procedures for internal controls and the safeguarding of assets and revenues; (iv) record-keeping and reporting to the Nevada Gaming Authorities; (v) fair operation of games; and (vi) the raising of revenues through taxation and licensing fees.
We are registered with the Nevada Commission as a publicly traded corporation and are licensed as a manufacturer and distributor of gaming devices, an operator of inter-casino linked systems and a slot route operator. Such licenses are not transferable and require periodic payment of fees. The Nevada Gaming Authorities may limit, condition,
suspend or revoke a license, registration, approval or finding of suitability for any cause deemed reasonable by such licensing agency. If it were determined that we violated gaming laws, then the approvals and licenses we hold could be limited, conditioned, suspended or revoked and we, and the individuals involved, could be subject to substantial fines for each separate violation of the gaming laws at the discretion of the Nevada Commission. Each type of gaming device, slot game, slot game operating system,
table game or associated equipment manufactured, distributed, leased, licensed or sold in Nevada must first be approved by the Nevada Board and, in some cases, the Nevada Commission. We must regularly submit detailed financial and operating reports to the Nevada Board. Certain loans, leases, sales of securities and similar financing transactions must also be reported to or approved by the Nevada Commission.
Certain officers, directors and key employees are required to be found suitable by the Nevada Commission and employees associated with gaming must obtain work permits which are subject to immediate suspension under certain circumstances. An application for suitability may be denied for any cause deemed reasonable by the Nevada Commission.
Changes in specified key positions must be reported to the Nevada Commission. In addition to its authority to deny an application for a license, the Nevada Commission has jurisdiction to disapprove a change in position by an officer, director or key employee. The Nevada Commission has the power to require licensed gaming companies to suspend or dismiss officers, directors or other key employees and to sever relationships with other persons who refuse to file appropriate applications or whom the authorities find
unsuitable to act in such capacities.
The Nevada Commission may also require anyone having a material relationship or involvement with us to be found suitable or licensed, in which case those persons are required to pay the costs and fees of the Nevada Board in connection with the investigation. We customarily reimburse such costs and fees. Any person who acquires more than 5% of any class of our voting securities must report the acquisition to the Nevada Commission. Any person who becomes a beneficial
owner of more than 10% of any class of our voting securities is required to apply for a finding of suitability. Under certain circumstances, an “Institutional Investor,” as such term is defined in the regulations of the Nevada Commission, which acquires more than 10% but not more than 15% of any class of our voting securities, may apply to the Nevada Commission for a waiver of such finding of suitability requirements, provided the Institutional Investor holds the voting securities for investment purposes
only. (It should be noted that in many other states the requirement of a suitability finding or of a licensure applies to any holder of 5% or more of our stock, unless the owner is eligible for and obtains an exemption.) The Nevada Commission has amended its regulations pertaining to Institutional Investors to temporarily allow an Institutional Investor to beneficially own more than 15%, but not more than 19%, if the ownership percentage results from a stock repurchase program. These Institutional Investors may
not acquire any additional shares and must reduce their holdings within one year from constructive notice of exceeding 15%, or must file a suitability application. An Institutional Investor will be deemed to hold voting securities for investment purposes only if the voting securities were acquired and are held in the ordinary course of business as an Institutional Investor and not for the purpose of causing, directly or indirectly, the election of a majority of our board of directors, any change in our corporate
charter, bylaws, management, policies or operations, or any of our gaming affiliates, or any other action which the Nevada Commission finds to be inconsistent with holding our voting securities for investment purposes only.
Any person who fails or refuses to apply for a finding of suitability or a license within 30 days after being ordered to do so by the Nevada Commission may be found unsuitable based solely on such failure or refusal. The same restrictions apply to a record owner if the record owner, when requested, fails to identify the beneficial owner.
Any security holder found unsuitable and who holds, directly or indirectly, any beneficial ownership of the common stock beyond such period of time as may be prescribed by the Nevada Commission may be guilty of a gross misdemeanor. We are subject to disciplinary action if, after we receive notice that a person is unsuitable to be a security holder or to have any other relationship with us, we: (i) pay that person any dividend or interest upon our voting securities; (ii) allow that person to exercise, directly
or indirectly, any voting right conferred through securities held by that person; or (iii) give remuneration in any form to that person. If a security holder is found unsuitable, then we may be found unsuitable if we fail to pursue all lawful efforts to require such unsuitable person to relinquish his or her voting securities for cash at fair market value.
The Nevada Commission may also, in its discretion, require any other holders of our equity securities or any holders of our debt securities to file applications, be investigated and be found suitable to own our debt or equity securities. The applicant security holder is required to pay all costs of such investigation. If the Nevada Commission
determines that a person is unsuitable to own such security, then pursuant to the regulations of the Nevada Commission, we may be sanctioned, including the loss of our approvals, if, without the prior approval of the Nevada Commission, we: (i) pay to the unsuitable person any dividends, interest or any distribution whatsoever; (ii) recognize any voting right by such unsuitable person in connection with such securities; (iii) pay the unsuitable person remuneration in any form; or (iv) make any payment to the unsuitable
person by way of principal, redemption, conversion, exchange, liquidation or similar transaction.
We are required to maintain a current stock ledger in Nevada which may be examined by the Nevada Commission at any time and to file with the Nevada Commission, at least annually, a list of our shareholders. The Nevada Commission has the power to require our stock certificates to bear a legend indicating that the securities are subject to
the Nevada Act and the regulations of the Nevada Commission. However, to date, the Nevada Commission has not imposed such a requirement on us.
We may not make certain public offerings of our securities, without the prior approval of the Nevada Commission. Such approval, if given, does not constitute a finding, recommendation or approval by the Nevada Commission or the Nevada Board as to the accuracy or adequacy of the prospectus or the investment merits of the securities offered.
Any representation to the contrary is unlawful.
On December 20, 2007, the Nevada Commission granted us prior approval to make public offerings for a period of two years, subject to certain conditions (the “Shelf Approval”). At this time we have applied to the Nevada Commission for a new Shelf Approval, which application we anticipate will be considered for action by the Nevada
Board and the Nevada Commission on either February 3, 2010 or March 3, 2010 and February 18, 2010 or March 18, 2010, respectively. While we know of no reason why our application for a new Shelf Approval would not be granted at that time, we cannot provide assurance that a new Shelf Approval will be granted by the Nevada Commission at that time or at all. If granted, the Shelf Approval may be rescinded for good cause without prior notice upon the issuance of an interlocutory stop order by the Chairman
of the Nevada Board. The Shelf Approval if granted, will not constitute a finding, recommendation or approval by the Nevada Commission or the Nevada Board as to the accuracy or adequacy of the prospectus or the investment merits of the securities offered. Any representation to the contrary is unlawful.
Changes in control of us through merger, consolidation, acquisition of assets, management or consulting agreements or any form of takeover cannot occur without prior investigation by the Nevada Board and approval by the Nevada Commission. Entities seeking to acquire control of us must satisfy the Nevada Board and the Nevada Commission concerning
a variety of stringent standards prior to assuming control of us. The Nevada Commission may also require controlling shareholders, officers, directors and other persons having a material relationship or involvement with the entity proposing to acquire control, to be investigated and licensed as part of the approval process of the transaction.
Approvals are required from the Nevada Commission: (i) before we can make exceptional repurchases of voting securities above the current market price and (ii) before a corporate acquisition opposed by management can be consummated.
We have formally adopted a compliance plan and appointed a compliance committee in accordance with Nevada Commission requirements. Our compliance committee meets quarterly and is responsible for implementing and monitoring our compliance with regulatory matters. This committee also reviews information and reports regarding the suitability
of potential key employees or other parties who may be involved in material transactions or relationships with us.
Federal registration. As a manufacturer and distributor of gaming devices, we are registered pursuant to and have complied with the Federal Gambling Devices Act of 1962 (the “Federal Act”). In order to manufacture, sell, deliver, or operate our gaming
devices, we must renew our federal registration annually and comply with its various record-keeping and equipment identification requirements. The Federal Act makes it unlawful for a person or business entity to manufacture, deliver, receive, operate, lease or sell gaming devices in interstate or foreign commerce unless that person or entity has first registered with the Attorney General of the United States. Violation of the Federal Act may result in seizure and forfeiture of the equipment, as well as other
penalties.
Native American gaming regulation. Gaming on Native American lands is governed by the Federal Indian Gaming Regulatory Act of 1988 (“IGRA”) and specific tribal ordinances and regulations. Class III gaming, as defined under IGRA, also generally requires
a Tribal-State Compact, which is a written agreement between a specific tribe and the respective state. This compact authorizes the type of Class III gaming activity and the standards, procedures and controls under which the Class III gaming activity must be conducted. The National Indian Gaming Commission (“NIGC”) has oversight authority over gaming on Native American lands and generally monitors tribal gaming including the establishment and enforcement of required minimum internal control standards.
Each Tribe is sovereign and must have a tribal gaming commission or office established to regulate tribal gaming activity to ensure compliance with IGRA, NIGC and its Tribal-State Compact. We have complied with each of the numerous vendors licensing and specific product approval and shipping notification requirements imposed by Tribal-State Compacts and enforced by tribal and/or state gaming agencies under IGRA in the Native American lands in which we do business.
Other jurisdictions. We have obtained or are in the process of obtaining all licenses/permits required by jurisdictions having legalized gaming. In general, such requirements are similar to Nevada in that there are company approvals as well as individual licensing
and product approvals.
Product approvals. Each of our products is subject to extensive testing and reviews by multiple state, jurisdictional or third party laboratories. The detail and extent of the review generally depends upon the classification of the product by the respective gaming
authority as a new game, game variation, associated equipment, gaming equipment or gaming device. Associated equipment is equipment that is not classified as a gaming device or gaming equipment but due to its integral relationship to the conduct of licensed gaming, regulatory authorities have discretion to require manufacturers and distributors of such associated equipment to meet licensing or suitability requirements prior to or concurrently with the use of such equipment in the respective jurisdiction. The
time required for product testing can be extensive and is subject to a wide range of formal and informal standards that can lead to great uncertainty as to the length of the regulatory approval process. Additionally, product testing is subject to changing standards, as a result of which, we may be required to upgrade or revise our products.
OTHER BUSINESS INFORMATION
Customer service. As part of our strategy to maintain and expand our market position, we have made a commitment to maintain a high level of service to our customers. We have numerous field service centers in the United States as well as at most of our foreign locations.
Within our service areas, we provide regular corrective and preventative maintenance service and on-demand repair service for our leased equipment, provide service training to our customers and provide back-up units to our lessees. For casinos that purchase our products, we offer service contracts providing service benefits similar to those of leased units or parts-only warranty contracts.
Significant customer sales, foreign sales and foreign assets. For fiscal 2009, 2008 and 2007, sales to customers outside the United States accounted for approximately 50%, 53% and 55% of consolidated revenue; and no individual customer accounted for more than 10%
of consolidated revenue in each of those years. As of October 31, 2009, approximately 25% of our revenues are in our EGM segment, which revenues relate primarily to outside the U.S. As of October 31, 2009, approximately 62% of our long-lived assets, including goodwill and acquired intangible assets, were outside the U.S. As of October 31, 2009 and 2008, no single customer balance exceeded 10% of our net trade accounts receivable. As of October 31, 2009, one customer exceeded 10% of our net investment in sales-type
lease and notes receivable. This customer has a well-established history of payments to Shuffle Master as well as a credit rating that supports the credit line they have been extended. There was no single customer with a balance in excess of 10% of our net investment in sales-type leases and notes receivable for the year ended 2008. Additional information regarding our foreign sales and long-lived assets by geographic region is included in Note 14 in “Item 8. Financial Statements and Supplementary Data”,
included in this Form 10-K
Seasonality and business fluctuations. Quarterly revenue and net income may vary based on the timing of the opening of new gaming jurisdictions, the opening or closing of casinos or the expansion or contraction of existing casinos, gaming regulatory approvals or denial
of our products and corporate licenses, the introduction of new products, the seasonality of customer capital budgets, or fluctuation in general economic conditions. Historically, our operating results have been lowest in our first fiscal quarter ending January 31, primarily due to the seasonality of customer capital budgets as well as the December holiday season.
Employees. As of October 31, 2009, we had approximately 640 employees. We are not subject to any collective bargaining agreements and we believe that our environment will continue to be union free.
ITEM 1A. RISK FACTORS
RISKS RELATED TO OUR BUSINESS
We are dependent on our intellectual property and trade secrets and we may be unable to protect our intellectual property and trade secrets from infringement, misappropriation, or claims of infringement or invalidity.
The gaming industry is characterized by the use of various forms of intellectual property to entertain. We are dependent upon patented technologies, trademarked brands and proprietary information for our business. We endeavor to protect our intellectual property rights and our products through a combination of patent, trademark, trade dress,
copyright and trade secret laws, as well as licensing agreements and third-party nondisclosure and assignment agreements.
We have numerous patents and trademarks and we utilize patent protection in the United States relating to certain existing and proposed processes and products. We cannot assure you that all of our existing patents would be found valid or enforceable or will continue to be valid or enforceable, or that any pending patent applications will
be approved. Our competitors have in the past challenged, are currently challenging and may in the future challenge the validity or enforceability of certain of our patents. The patents we own could be challenged, invalidated or circumvented by others and may not be of sufficient scope or strength to provide us with any meaningful protection or commercial advantage. Competitors may infringe our patents and we may not have adequate resources or there may be other reasons we do not enforce our patents. Our patents
may not adequately cover a competitor's products. The future interpretation by courts of United States laws regarding the validity of patents could negatively affect the validity or enforceability of our current or future patents.
We also rely on unpatented proprietary technology. It is possible that others will independently develop the same or similar technology or otherwise obtain access to our unpatented technology. To protect our trade secrets and other proprietary information, we generally require employees, consultants, advisors and collaborators to enter into
confidentiality agreements. We cannot assure you that these agreements are fully enforceable or will provide meaningful protection for our trade secrets, know-how or other proprietary information in the event of any unauthorized use, misappropriation or disclosure of such trade secrets, know-how or other proprietary information. If we are unable to maintain the proprietary nature of our technologies, it could have a material adverse effect on our business.
We rely on our trademarks, trade names, trade dress, copyrights and brand names to distinguish our products from the products of our competitors. We have registered or applied to register many of these trademarks. Our trademark applications may not be approved and/or all of the above intellectual property may not remain valid or enforceable.
We may not be able to build and maintain goodwill in our trademarks or other intellectual property. We cannot assure you that any trademark, copyright, issued patent or other types of intellectual property will provide competitive advantages for us. Third parties may oppose our trademark applications or challenge our use of the trademarks. Our trademarks may become so well known by the public that their use becomes generic and they lose trademark protection. In the event that our trademarks are successfully challenged,
we could be forced to rebrand our products, which could result in loss of brand recognition and could require us to devote resources towards advertising and marketing new brands. Further, our competitors may infringe our trademarks or other intellectual property and we may not have adequate resources or there may be other reasons we do not enforce our trademarks or other types of intellectual property.
Because of the differences in foreign patent, trademark, trade dress, copyright and other laws concerning proprietary rights, our intellectual property frequently does not receive the same degree of protection in foreign countries as it would in the United States. Our failure to possess, obtain or maintain adequate protection of our intellectual
property rights for any reason could have a material adverse effect on our business, results of operations and financial condition.
We also face the risk that it may be claimed that we have infringed, or now infringe, or could in the future infringe third parties' intellectual property rights and could be sued for the same. We have many competitors in both the United States and foreign countries, some of which have substantially greater resources and have made substantial
investments in competing technologies. Some competitors have applied for and obtained and may in the future apply for and obtain, patents that may prevent, limit or otherwise interfere with our ability to make and sell our products. Any royalty, licensing or settlement agreements, if required, may not be available to us on acceptable terms or at all.
Significant litigation regarding intellectual property rights exists in our industry. We have in the past made, are currently making and may in the future make, enforcement claims against third parties and third parties have in the past made, are currently making and may in the future make, claims of infringement, invalidity or enforceability
against us or against our licensees or manufacturers in connection with their use of our technology. For more information, see “Item 3. Legal Proceedings” and Note 15 in “Item 8. Financial Statements and Supplementary Data”, included in this Form 10-K. A successful challenge to or invalidation of one of our patents or trademarks, a successful claim of infringement by a third party against us, our products, or one of our licensees in connection with the use of our technology,
or an unsuccessful claim of infringement made by us against a third party or its products could adversely affect our business or cause us financial harm. We are currently in litigation over various intellectual property matters. Any claims -- whether with or without merit -- could:
|
· |
be expensive and time consuming to defend; |
|
· |
cause one or more of our patents to be ruled or rendered unenforceable or invalid; |
|
· |
cause us to cease making, licensing or using products that incorporate the challenged intellectual property; |
|
· |
require us to redesign, reengineer or rebrand our products; |
|
· |
divert management's attention and resources; |
|
· |
require us to pay significant amounts in damages; |
|
· |
require us to enter into royalty, licensing or settlement agreements in order to obtain the right to use a necessary product, process or component; |
|
· |
limit our ability to bring new products to the market in the future; or |
|
· |
cause us by way of injunction to have to remove products on lease and/or stop selling or leasing new products. |
In addition, the gaming industry is characterized by the rapid development of new technologies, which requires us to continuously introduce new products using these technologies and innovations, as well as to expand into new markets that may be created. Therefore, our success depends in part on our ability to continually adapt our products
and systems to incorporate new technologies and to expand into markets that may be created by new technologies. However, to the extent technologies are protected by the intellectual property rights of others, including our competitors, we may be prevented from introducing products based on these technologies or expanding into markets created by these technologies. If the intellectual property rights of others prevent us from taking advantage of innovative technologies, our financial condition, operating results
or prospects may be harmed.
The gaming industry is highly regulated and we must adhere to various regulations and maintain our licenses to continue our operations. Failure to obtain and/or maintain our licenses could be disruptive to our business and could adversely affect our operations.
We and our products are subject to extensive regulation under federal, state, local and foreign laws, rules and regulations of the jurisdictions in which we do business and our products are used. These laws, rules and regulations generally concern the responsibility, financial stability, character and suitability of our officers, directors,
major stockholders, key personnel or business partners in gaming operations, including makers of gaming equipment such as ourselves. In many jurisdictions, shareholders owning greater than 5% of our shares must be licensed under applicable gaming regulations unless they qualify for and are able to obtain an exemption or waiver from licensing in those jurisdictions. Some jurisdictions empower their regulators to investigate participation by licensees in gaming outside their jurisdiction and require access to periodic
reports concerning gaming activities. Violations of laws in one jurisdiction could result in disciplinary action in other jurisdictions. Licenses, approvals or findings of suitability may be revoked, suspended or conditioned. We may not be able to obtain or maintain all necessary registrations, licenses, permits or approvals. We cannot assure you that the licensing process will not result in delays or adversely affect our operations and our ability to maintain key personnel, or that complying with these regulations
will not increase our costs. For a summary of gaming regulations that affect our business, see “Item 1. Business–Gaming Regulation”, included in this Form 10-K.
We will also become subject to regulation in any other jurisdiction where our customers operate in the future. To expand into any such jurisdiction, we may need to be licensed, obtain approvals of our products and/or seek licensure of our officers, directors, major stockholders, key personnel or business partners. If we fail to seek, do not
receive or receive a revocation of a license in a particular jurisdiction for our games, hardware or software, we would not be able to sell or place on a leased or participation basis our products in that jurisdiction.
In addition, legislative and regulatory changes may affect demand for or place limitations on the placement of our products. Such changes could affect us in a variety of ways. Legislation or regulation may introduce limitations on our products or opportunities for the use of our products and could foster competitive games or technologies
at our or our customers' expense. For example, current regulations in a number of jurisdictions where our customers operate limit the amount of space allocable to our products and substantial changes in those regulations may adversely affect demand for our products. Our business will also suffer if our products became obsolete due to changes in laws or the regulatory framework.
Legislative or regulatory changes negatively impacting the gaming industry as a whole or our customers in particular could also decrease the demand for our products. Opposition to gaming could result in restrictions or even prohibitions of gaming operations in any jurisdiction or could result in increased taxes on gaming revenues. Tax matters,
including changes in state, federal or other tax legislation or assessments by tax authorities could have a negative impact on our business. A reduction in growth of the gaming industry or in the number of gaming jurisdictions or delays in the opening of new or expanded casinos could reduce demand for our products. Changes in current or future laws or regulations or future judicial intervention in any particular jurisdiction may have a material adverse effect on our existing and proposed foreign and domestic
operations. Any such adverse change in the legislative or regulatory environment could have a material adverse effect on our business, results of operations or financial condition.
A continued downturn in general worldwide economic conditions or in the gaming industry or a reduction in demand for gaming may adversely affect our results of operations. As a result, the market price of our common stock may decline.
Our business operations are affected by international, national and local economic conditions. The current recession and continued downturn in the general economy, or in a region constituting a significant source of our customers, or a reduction in demand for gaming, may harm the health of casino operators and our other customers and consequently
result in fewer customers leasing or purchasing our products, which would adversely affect our results.
General worldwide economic conditions continue to be unfavorable. These conditions continue to make it difficult for our customers and us to accurately forecast and plan future business activities and they continue to cause our domestic and foreign customers to slow their spending on both our lease- and sales-based products. We
cannot predict the effect or duration of this economic slowdown or the timing or strength of a subsequent economic recovery, worldwide or in the gaming industry. If the domestic and foreign markets for our products significantly deteriorate due to these macroeconomic effects, our business, financial condition and results of operations will likely be materially and adversely affected and the market price of our common stock may decline.
The gaming industry has been notably impacted by the general economic downturn. Additionally, due to recent disruptions in the financial markets, gaming operators have been less able to secure financing for development projects and have scaled back such projects considerably. Clients have made significant cuts in expenditures,
including layoffs of workers and management employees as well as delayed expansions or new openings. Current economic conditions may cause both our domestic and international clients to decrease their expenditures on gaming equipment and our financial condition, results of operations and stock price may be negatively affected thereby.
Our domestic and global growth and ability to access capital markets are subject to a number of economic risks.
Financial markets in the United States, Europe and Asia continue to experience disruption, including, among other things, diminished liquidity and credit availability, rating downgrades of certain investments and declining valuations of others. It is possible that the disruption in financial markets will continue or even that there will be
a further deterioration in financial markets and confidence in major economies.
These financial market conditions affect our business in a number of ways. The current tightening of credit in financial markets adversely affects the ability of our customers to obtain financing for purchases and operations and could result in a decrease in or cancellation of lease and sale orders for our products and services. Current
financial market conditions could also affect our ability to raise funds in the capital and bank lending markets. Our senior secured credit facility (the “Senior Secured Credit Facility”), which consists of a $65,000 term loan (the “Term Loan”) and $100,000 revolving credit facility (the “Revolver”), both of which mature on November 30, 2011. If economic conditions do not improve by such time, we might not be able to refinance such facilities on favorable economic
terms, or at all.
Risks that impact our customers may impact us.
If fewer players visit our customers' facilities, if such players have less disposable income to spend at our customers' facilities or if our customers are unable to devote resources to purchasing and leasing our products, there could be an adverse effect on our business. Such risks that affect our customers include, but are not limited to:
|
· |
adverse economic and market conditions in gaming markets such as those being currently experienced, including recession, economic slowdown, higher interest rates, higher airfares and higher energy and gasoline prices; |
|
· |
global geopolitical events such as terrorist attacks and other acts of war or hostility; |
|
· |
natural disasters such as major fires, floods, hurricanes and earthquakes; and |
|
· |
concerns about H1N1 (Swine) virus, influenza or contagious illnesses. |
Economic, political, legal and other risks associated with our international sales and operations could adversely affect our operating results.
Since we sell or lease our products worldwide, our business is subject to risks associated with doing business internationally. Our sales to customers outside the United States, primarily Canada, Europe and Australasia accounted for approximately 50% of our consolidated revenue from continuing operations for fiscal 2009. Accordingly, our
future results could be harmed by a variety of factors, including:
|
· |
changes in foreign currency exchange rates; |
|
· |
exchange controls; |
|
· |
changes in regulatory requirements, such as, without limitation, caps on the number of table games in locations such as Macau; |
|
· |
changes in a specific country's or region's political or economic conditions; |
|
· |
tariffs, other trade protection measures and import or export licensing requirements; |
|
· |
potentially negative consequences from changes in tax laws or application of such tax laws; |
|
· |
difficulty in staffing and managing widespread operations; |
|
· |
changing labor regulations; |
|
· |
requirements relating to withholding taxes on remittances and other payments by subsidiaries; |
|
· |
different regimes controlling the protection of our intellectual property and the ability for us to repossess our equipment or products in the event of a lease default; |
|
· |
restrictions on our ability to own or operate subsidiaries, make investments or acquire new businesses in these jurisdictions; |
|
· |
restrictions on our ability to repatriate dividends from our subsidiaries; and |
|
· |
the intellectual property laws in certain foreign countries provide for criminal penalties for actions that would be civil penalties in the United States and such criminal penalties may affect all of our gaming licenses. |
Our international operations are affected by global economic and political conditions. Changes in economic or political conditions in any of the countries in which we operate could result in exchange rate movement, new currency or exchange controls or other restrictions being imposed on our operations.
We also have agreements with casinos in Native American jurisdictions, which may subject us to sovereign immunity risks and could subject us to additional compliance costs.
Litigation may subject us to significant legal expenses, damages and liability and is inherently unpredictable and risky.
We are currently engaged in litigation on a variety of matters, including, in particular, several suits regarding our intellectual property rights and related anti-trust and trade practice issues. For information on our current material litigation and our assessments, see “Item 3. Legal Proceedings” and Note 15 in “Item
8. Financial Statements and Supplementary Data”, included in this Form 10-K. Our assessment of each matter may change based on future unknown or unexpected events, or we may simply be wrong. Litigation requires the expenditure of significant time and resources and is inherently unpredictable and risky. We are unable at this time to estimate the likely outcome of pending litigation. An adverse judgment or injunction in any pending or future litigation could have a material impact on our business operations,
intellectual property, results of operations or financial position.
Our products currently in development may not achieve commercial success and if we are unable to maintain a competitive technological position, we may suffer a material adverse effect on our business, results of operations or financial condition.
We have a number of products in various stages of development. We believe that our future success will depend in large part upon our ability to enhance our existing products and to develop, introduce and market new products and improvements to our existing products. As a result, we expect to continue to make significant investments in product
development, as needed. Our development of products is dependent on factors such as reaching definitive agreements with third parties, obtaining requisite governmental approvals, having the necessary financial and other resources and the performance and financial and operational viability of various third parties.
Future technological advances in the gaming products industry may result in the availability of new products or increase the efficiency of existing products. However, we may not be able to finance capital expenditures for new technologies that are more cost-effective or create superior products. Existing, proposed or as yet undeveloped
technologies may render our current technology less profitable or less viable and we may not have available the financial and other resources to compete effectively against companies possessing such technologies.
While we are pursuing and will continue to pursue product development opportunities, we cannot assure you that such products will come to fruition or become successful. Furthermore, a number of those products are being tested and we cannot provide any definite date by which they will be commercially available. These products may not prove
to be commercially viable and even if they do, we may not be able to obtain the various gaming licenses necessary to distribute them to our customers. Additionally, subsequent to the commercial introduction of such products, we may experience operational problems that could delay or defeat the ability of such products to generate revenue or operating profits. Future operational problems could increase our costs, delay our plans or adversely affect our reputation or our sales of other products which, in turn,
could have a material adverse effect on our success. We cannot predict which of the many possible future products, if any, will meet evolving industry standards and consumer demands. Should we be unable to adapt to such technological changes, offer such products on a timely basis or establish or maintain a competitive position, we may suffer a material adverse effect on our business, results of operations or financial condition.
We compete in a single industry and our business may suffer if our products become obsolete or demand for them decreases, including without limitation, as a result of the downturn in the gaming industry.
We derive substantially all of our revenues from leasing, licensing, selling and other financing arrangements of products for the gaming industry. The gaming industry is currently suffering from a significant downturn, with several casinos announcing layoffs and major reductions in spending. Because of this downturn, our business may materially
suffer if our products become obsolete or if use of our products decreases. Additionally, if table games are particularly affected by this market downturn, we may also materially suffer. Our operating lease agreements with our customers are typically month-to-month and provide for termination upon 30 days' prior notice by either party. Accordingly, consistent demand for and satisfaction with our products by our customers is critical to our financial condition and future success and problems,
defects or dissatisfaction with our products could cause us to lose customers or revenues from leases with minimal notice. Additionally, our success depends on our ability to keep pace with technological advances in our industry and to adapt and improve our products in response to evolving customer needs and industry trends. If demand for our products weakens due to lack of market acceptance, technological change, competition, regulatory changes, or other factors, it could have a material adverse effect on our
business, results of operations or financial condition.
Any disruption in our manufacturing processes, any significant increase in manufacturing costs or any inability to manufacture a sufficient number of our products to meet demand could adversely affect our business and operating results.
We manufacture our products at our headquarters and manufacturing facility in Las Vegas, Nevada, as well as our facility in Milperra, New South Wales, Australia. We also outsource the manufacturing of certain of our sub-assemblies in the United States, Europe and Australasia. Should any of these manufacturing processes be disrupted, we cannot
provide assurance that we would be able to timely remedy such disruption. In such a case, we may be unable to produce a sufficient quantity of our products to meet the demand of our customers. In addition, manufacturing costs may increase significantly and we may not be able to successfully recover these cost increases with increased pricing to our customers. Either case could have an adverse impact on our business, results of operations or financial condition.
The products in each of our segments may experience losses due to technical difficulties or fraudulent activities.
Our success partly depends on our ability to avoid, detect, replicate and correct software and hardware errors and fraudulent manipulation of our systems. We incorporate security features into the design of our gaming products in order to prevent us or our patrons from being defrauded. To the extent any of our gaming products or software
experience errors or fraudulent manipulation, our customers may replace our products and services with those of our competitors. In addition, the occurrence of errors in, or fraudulent manipulation of, our gaming products or software may give rise to claims for lost revenues and related litigation by our customers and may subject us to investigation or other action by gaming regulatory authorities, including suspension or revocation of our gaming licenses and disciplinary action, which may lead to a material
adverse effect on our business, results of operations or financial condition. Further, in the event of such issues with our gaming products or software, substantial engineering and marketing resources may be diverted from other areas to rectify the problem.
We operate in a very competitive business environment and if we do no adapt our approach and our products to meet this demand, our business, results of operations or financial condition could be adversely impacted.
There is intense competition in the gaming products industry, which is characterized by dynamic customer demand and rapid technological advances. We must continually adapt our approach and our products to meet this demand and match these technological advances and if we cannot do so, our business, results of operations or financial condition
may be adversely impacted. Conversely, the development of new competitive products or the enhancement of existing competitive products in any market in which we operate could have an adverse impact on our business, results of operations or financial condition. Due to the downturn in the economy in general and particularly in the gaming industry, we may not be able to adapt to the market adequately. If we are unable to remain dynamic in the face of changes in the market, it could have a material
adverse effect on our business, results of operations or financial condition.
In general, we compete with other gaming and entertainment products for space on the casino customers’ floor, as well as for our customers' capital and operational spending. Our shufflers also compete with hand shuffling. Some of the larger gaming supply companies with whom we compete are IGT, Bally, WMS and Aristocrat. New competitors
may also enter our key markets.
In the Utility segment, namely shufflers and other gaming equipment, we compete with hand shuffling and other shuffler providers. Additionally, other companies may develop, “reverse engineer,” or market shufflers and seek to develop and obtain regulatory approvals of additional shuffler products. A competitive product may gain
substantial placements or cause price erosion of our shufflers in the future. Casinos may choose to shift from automatic to hand shuffling which would cause price erosion of our shufflers. Several companies also manufacture and sell chipper products which are competitive with our Easy Chipper® product line. Competition with our i-Shoe card reading shoe is predominantly limited to Angel Co. Ltd.'s Angel Eye card reading
shoe and the Bee Electronic Baccarat Dealing Shoe (U.S. Playing Card Company).
With respect to our PTG segment, in addition to companies such as IGT, Bally, Aristocrat and WMS that primarily market slot machines, we also compete with both non-proprietary table games such as blackjack and several companies which primarily develop and license proprietary table games. Some of those competitors’ widely known proprietary
table game titles include Galaxy Gaming's Lucky Ladies, Emperor's Challenge, Masque Publishing's Spanish 21, DEQ Systems EZ Baccarat, Prime Table Games and Gaming Entertainment. Additionally, competition with our progressive bet system for table games is predominantly limited to DEQ Systems. Competition in this segment is particularly based on price, brand recognition, player appeal and the strength of underlying intellectual property. Smaller developers and vendors are more able to participate in developing
and marketing table games, compared to other gaming products, because of the lower cost and complexity associated with the development of these products and a generally less stringent regulatory environment. In the future, slot manufacturers, as well as table game competitors or others could market table games that might displace our products.
With our continued expansion, we have increased our ETS segment to expand our e-Table platforms. This product line has significant competition, perhaps more than our traditional Utility and PTG segment product offerings. There are numerous other companies that manufacture and/or sell e-Table games, which are similar to our Table Master, Vegas
Star and Rapid Table Games. These companies include, but are not limited to, Elektroncek (also known as Interblock), Aruze, PacificNet, Novomatic, IGT and TableMAX. Our e-Tables, as well as those of other companies, also compete for casino floor space with live table games and EGMs.
Our EGM segment competes for casino floor space with products of other gaming suppliers. The international slot environment is competitive. The Australasia market reflects other worldwide markets as most of the major international manufacturers have a presence there. The major competitors in these markets are IGT, Bally, Aristocrat, WMS,
Konami, Aruze and Ainsworth. In Asia, these competitors are also active along with further competition from myriad European slot manufacturers.
Finally, some of our product segments may compete against each other for space on the casino floor.
We are dependent on the success of our customers and are subject to industry fluctuations.
Our success depends on our customers leasing or buying our products to expand their existing operations, replace existing gaming products or equip a new casino. Any slowdown in the replacement cycle as a result of the current downturn in the gaming industry may negatively impact our operations.
Additionally, to the extent existing or potential customers choose to allocate capital to expenditures other than gaming products, such as real estate acquisitions, hotel furnishings, restaurants and other improvements, or generally to reduce expenditures, particularly in response to the current downturn in the gaming industry, we may suffer
a material adverse effect on our business, results of operations or financial condition.
Certain market risks may affect our business, results of operations and prospects.
In the normal course of our business, we are routinely subjected to a variety of market risks, examples of which include, but are not limited to, interest rate movements, fluctuating commodities markets, higher labor costs, increased fuel prices, collectability of receivables and recoverability of residual values on leased assets such as
those in certain international markets. Further, some of our customers may experience financial difficulties, possibly as a result of the current downturn in the gaming industry, or may otherwise not pay accounts receivable when due, resulting in increased write-offs. Material losses may be incurred in these areas in the future.
We are exposed to interest rate and foreign currency risk.
The indebtedness under the Revolver and Term Loan has variable rates of interest, which exposes us to the risk of increased interest rates. As of October 31, 2009, we had approximately $93,000 of variable rate debt. Assuming a 1% change in the average interest rate as of October 31, 2009, our annual interest cost would change by approximately
$930.
We are exposed to foreign currency exchange rate risk inherent in our lease and sales commitments, anticipated leases and sales, anticipated purchases of inventory in foreign jurisdictions and assets, liabilities and debt denominated in currencies other than the U.S. dollar. We transact business in numerous countries around the world in a
variety of foreign currencies. Fluctuations in the value of the Euro, the Australian dollar, the Pataca or the Rand may adversely affect our results of operations, of which the most significant to our operations for fiscal 2009 were the Australian dollar and the Euro. We expect that a significant portion of the volume of our business will continue to be denominated in foreign currency and because our financial results are reported in U.S. dollars, if we generate sales or earnings in other currencies,
the translation of those results into U.S. dollars can result in a significant increase or decrease in the amount of those sales or earnings. As such, we expect our cash flows and earnings to continue to be exposed to the risks that may arise from fluctuations in foreign currency exchange rates.
We could face considerable business and financial risk in implementing acquisitions.
As part of our overall growth strategy, we have in the past acquired and will continue to seek to acquire, complementary products, assets and businesses. We regularly engage in discussions with respect to and investigate possible acquisitions. Future acquisitions could result (and past acquisitions have resulted) in potentially dilutive issuances
of equity securities, significant expenditures of cash, the incurrence of debt and contingent liabilities and an increase in amortization expenses, which could have (and have, in the past, had) a material adverse effect upon our business, financial condition and results of operations.
The risks associated with acquisitions could have (and have, in the past, had) a material adverse effect upon our business, financial condition and results of operations. We may not be successful in consummating future acquisitions on favorable terms or at all or that any future acquisition will work out as we expect.
Our past acquisitions and any other future potential acquisitions may not produce the revenues, earnings or business synergies that we anticipate and may not perform as expected for a variety of reasons, including:
|
· |
in the integration of the operations, financial reporting, technologies, products and personnel, including those caused by national, geographic and cultural differences; |
|
· |
risks of entering markets in which we have no or limited prior experience; |
|
· |
difficulties in the use, development or sale of intellectual property or future or present products; |
|
· |
the potential loss of employees; |
|
· |
currency fluctuations or changes in exchange rates in connection with sales to customers and the purchase of inventory in foreign currencies; |
|
· |
diversion of management's attention away from other business concerns; |
|
· |
expenses of any undisclosed or potential legal liabilities; |
|
· |
difficulties in staffing and managing worldwide operations; and |
|
· |
impairments in acquired assets. |
Any one or a combination of these factors may cause our revenues or earnings to decline.
If our products contain defects, our reputation could be harmed and our operating results and financial results could be adversely affected.
Some of our products are complex and may contain undetected defects. The occurrence of defects or malfunctions in one or more of our products could result in financial losses for our customers and in turn termination of leases, cancellation of orders, product returns and diversion of our resources, and could additionally result in lost revenues,
civil damages and regulatory penalties, as well as possible rescission of product approvals. Any of these occurrences could also result in the loss of or delay in market acceptance of our products and loss of placements.
We may not be able to attract, retain, or motivate the management or employees necessary to remain competitive in our industry.
The competition for qualified personnel in the gaming industry is intense. Our future success depends on the retention and continued contributions of our key management, finance, marketing, development, technical and staff personnel, many of whom would be difficult or impossible to replace. Our success is also tied to
our ability to recruit additional key personnel in the future. We may not be able to retain our current personnel or recruit any additional key personnel required. The loss of services of any of our personnel or our inability to recruit additional necessary key personnel could have a material adverse effect on our business, financial condition, results of operations and prospects.
We may be unable to adequately comply with public reporting requirements.
If we cannot maintain and execute adequate internal controls over financial reporting or implement required new or improved controls that provide reasonable assurance of the reliability of the financial reporting and preparation of our financial statements for external use, or we simply make an error in compiling our financial results, we
may suffer harm to our reputation, fail to meet our public reporting requirements on a timely basis or be unable to properly report on our business and the results of our operations. Failure to meet reporting requirements on a timely basis could cause a default under our Senior Secured Credit Facility and accordingly inhibit our ability to borrow on available credit on our Revolver. See “Item 7. Management’s Discussion and Analysis of Financial Condition and Results of Operations—Liquidity
and Capital Resources” included in this Form 10-K. Additionally, the inherent limitations of internal control over financial reporting may not prevent or detect all misstatements or errors, regardless of the adequacy of those controls.
Our continued compliance with our financial covenants in our Senior Secured Credit Facility is subject to many factors, some of which are beyond our control and if we are unable to remain compliant under our financial covenants, our results of operations could be adversely affected by servicing costs.
If our operating results decline, we may need to seek an amendment to our existing facility or refinance the indebtedness outstanding under such facility. Depending on the debt market conditions at the time such an amendment or refinancing is necessary, it is possible that such amendment or refinancing could lead to a significant increase
in debt service costs and interest expense, or result in additional restrictions being put on our operations. In such a circumstance, if we are unable to obtain an amendment or refinancing, then we may be forced to file for bankruptcy protection or allow proceedings to take place whereby the lender’s security interests are exercised.
The restrictive covenants in our Senior Secured Credit Facility may limit our ability to finance future operations or capital needs or engage in other business activities that may be in our interest.
The agreement governing the Revolver and Term Loan imposes and the terms of any future indebtedness may impose, operating and other restrictions on us. Such restrictions will affect and in many respects limit or prohibit, among other things, our ability to take certain actions. The terms of the agreement may make it difficult to obtain financing
in the future for working capital, capital expenditures, acquisitions and other purposes. See “Item 7. Management's Discussion and Analysis of Financial Condition and Results of Operations—Liquidity and Capital Resources” included in this Form 10-K for further details.
See “Item 7. Management's Discussion and Analysis of Financial Condition and Results of Operations —Contractual Obligations and Off-Balance Sheet Arrangements” included in this Form 10-K for years beyond 2009.
Our business is subject to quarterly fluctuation.
Historically, our operating results have been lowest in our first fiscal quarter ending January 31, primarily due to the seasonality of customer capital budgets and the December holiday season. Our quarterly operating results may vary based on the timing of the opening of new gaming jurisdictions, the opening or closing of casinos, the expansion
or contraction of existing casinos, approval or denial of our products and corporate licenses under gaming regulations, the introduction of new products, the mix of domestic versus international sales and the mix of lease and royalty revenue versus sales and service revenue. As a result, our operating results could be volatile, particularly on a quarterly basis.
ITEM 1B. UNRESOLVED STAFF COMMENTS
None.
ITEM 2. PROPERTIES
Properties. We lease facilities in various locations throughout North America for office, research and development, warehouse and service totaling approximately 105,000 square feet to support our American operations. Our corporate headquarters, as well
as our research and development and manufacturing, are located in Las Vegas, Nevada and account for 76,000 square feet.
We lease facilities in various locations throughout Australia and New Zealand, totaling approximately 54,000 square feet for office, service and warehouse space to support our Australasia operations. In addition, we own an approximately 59,000 square foot facility in Milperra, New South Wales, Australia that we use for research
and development and manufacturing space for our e-Table and EGM products.
We lease facilities in Vienna, Austria, totaling approximately 14,000 square feet for office, warehouse and apartment rental space to support our European operations.
We lease approximately 6,000 square feet facilities in Macau, China and Singapore, China for office and warehouse space to support our Asia operations.
We lease an approximately 3,000 square feet facility in Johannesburg, South Africa for office and warehouse space to support our Africa operations.
We believe that our existing properties are suitable and adequate for our current needs and that additional facilities/space are available to us to support expansion, if required.
ITEM 3. LEGAL PROCEEDINGS
For information on Legal Proceedings, see Notes 15 and 16 in “Item 8. Financial Statements and Supplementary Data” included in this Form 10-K.
Litigation is inherently unpredictable and risky. Our current assessment of each matter may change based on future unknown or unexpected events. If any litigation were to have an adverse result that we did not expect, there could be a material impact on our results of operations or financial position. We believe costs associated with litigation
will not have a material impact on our financial position or liquidity, but may be material to the results of operations in any given period. We assume no obligation to update the status of pending litigation, except as may be required by applicable law, statute or regulation. We believe that the final disposition of these matters will not have a material adverse effect on our financial position, results of operations or liquidity.
ITEM 4. SUBMISSION OF MATTERS TO A VOTE OF SECURITY HOLDERS
No matters were submitted to a vote of our security holders during the fourth quarter of fiscal 2009.
PART II
(In thousands, except per share amounts)
ITEM 5. MARKET FOR REGISTRANT’S COMMON EQUITY, RELATED STOCKHOLDER MATTERS AND ISSUER PURCHASES OF EQUITY SECURITIES
Stock Listing. Our common stock is traded on The NASDAQ Stock Market under the symbol SHFL. As of January 8, 2010, we had approximately 250 shareholders of record. There are a significantly greater number of shareholders whose shares are held in street
name. Based on information we collected as of January 8, 2010, we estimate that we have approximately 12,540 beneficial holders in total. The following table sets forth quarterly high and low prices for trades of our common stock during fiscal 2009 and 2008:
|
2009 |
2008 |
|||||||||||||||
|
High |
Low |
High |
Low |
|||||||||||||
|
First Quarter |
$ | 5.43 | $ | 2.50 | $ | 14.04 | $ | 7.77 | ||||||||
|
Second Quarter |
4.12 | 1.97 | 10.24 | 4.50 | ||||||||||||
|
Third Quarter |
7.63 | 3.72 | 8.38 | 3.93 | ||||||||||||
|
Fourth Quarter |
9.90 | 6.67 | 5.89 | 2.60 | ||||||||||||
The closing price of our common stock on January 11, 2010, was $8.68 per share.
Dividend Policy. We have not paid dividends on our common stock and certain covenants in our Revolver and Term Loan restrict our ability to pay dividends or make other distributions with respect to our equity securities.
Transfer Agent. Our stock transfer agent and registrar is Wells Fargo Bank Minnesota, N.A., Shareowner Services, 161 North Concord Exchange, South St. Paul, Minnesota 55075, (800) 468-9716.
Performance Graph. The following graph compares a shareholder’s cumulative total return for the last five fiscal years, assuming $100 invested at October 31, 2004, with the reinvestment of all dividends, as if such amounts had been invested in: (i) our common
stock; (ii) the stocks included in the S&P Small Cap 600 Index: (iii) the stocks included in the NASDAQ Index Composite; (iv) the stocks included in the Dow Jones U.S. Gambling Index; and (v) an index of selected issuers in our industry, or Peer group, composed of IGT, Aristocrat, WMS, Bally and PGIC.
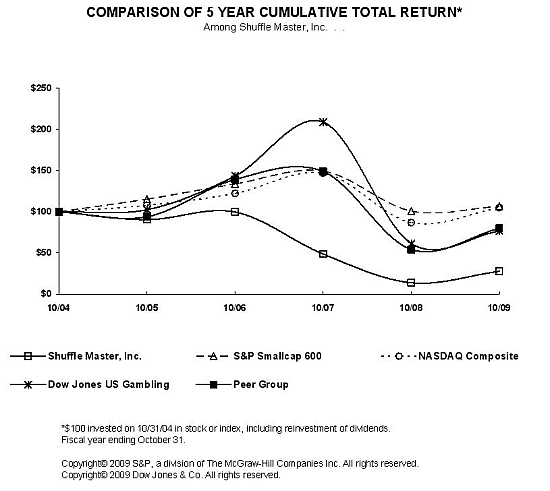
|
Company Name / Index |
Investment Value as of October 31, |
|||||||||||||||||||||||
|
2004 |
2005 |
2006 |
2007 |
2008 |
2009 |
|||||||||||||||||||
|
Shuffle Master, Inc. |
100.00 | 90.38 | 99.71 | 48.75 | 13.76 | 27.83 | ||||||||||||||||||
|
S&P Smallcap 600 |
100.00 | 115.27 | 133.83 | 149.28 | 100.85 | 106.46 | ||||||||||||||||||
|
NASDAQ Composite |
100.00 | 107.75 | 122.18 | 146.93 | 86.70 | 104.97 | ||||||||||||||||||
|
Dow Jones US Gambling |
100.00 | 102.41 | 143.34 | 208.84 | 61.50 | 76.61 | ||||||||||||||||||
|
Peer Group |
100.00 | 93.94 | 139.17 | 148.80 | 54.08 | 79.78 | ||||||||||||||||||
ITEM 6. SELECTED FINANCIAL DATA
SELECTED CONSOLIDATED FINANCIAL DATA
The following summary consolidated financial data should be read in conjunction with and is qualified by reference to, “Item 7. Management’s Discussion and Analysis of Financial Condition and Results of Operations” and “Item 8. Financial Statements and Supplementary Data” included in this Form 10-K. The
consolidated statements of operations data for the years ended October 31, 2009, 2008, 2007, 2006 and 2005, and the consolidated balance sheet data are derived from our consolidated financial statements. The historical results are not necessarily indicative of future results.
|
Year Ended October 31, |
||||||||||||||||||||
|
2009 |
2008 |
2007 |
2006 |
2005 |
||||||||||||||||
|
(In thousands, except per share and unit/seat amounts) |
||||||||||||||||||||
|
Summary financial statements (a): |
||||||||||||||||||||
|
Revenue |
||||||||||||||||||||
|
Utility |
$ | 71,707 | $ | 80,893 | $ | 78,457 | $ | 86,792 | $ | 67,029 | ||||||||||
|
Proprietary Table Games |
38,697 | 38,594 | 33,125 | 38,316 | 39,517 | |||||||||||||||
|
Electronic Table Systems |
22,342 | 27,461 | 27,890 | 16,555 | 6,022 | |||||||||||||||
|
Electronic Gaming Machines |
46,598 | 42,898 | 39,269 | 21,090 | - | |||||||||||||||
|
Unallocated Corporate |
83 | 160 | 110 | 238 | 292 | |||||||||||||||
|
Total revenue |
179,427 | 190,006 | 178,851 | 162,991 | 112,860 | |||||||||||||||
|
Cost of revenue |
73,756 | 79,104 | 74,985 | 56,721 | 29,260 | |||||||||||||||
|
Gross profit |
105,671 | 110,902 | 103,866 | 106,270 | 83,600 | |||||||||||||||
|
Income (Loss) from continuing operations |
15,459 | (10,802 | ) | 16,301 | 5,339 | 29,104 | ||||||||||||||
|
Discontinued operations, net of tax |
- | (1 | ) | 78 | (246 | ) | 76 | |||||||||||||
|
Net Income (loss) |
$ | 15,459 | $ | (10,803 | ) | $ | 16,379 | $ | 5,093 | $ | 29,180 | |||||||||
|
Earnings (Loss) per share - continuing operations: |
||||||||||||||||||||
|
Earnings (loss) per share, basic (b) |
$ | 0.29 | $ | (0.27 | ) | $ | 0.47 | $ | 0.15 | $ | 0.83 | |||||||||
|
Earnings (loss) per share, diluted (b) |
$ | 0.29 | $ | (0.27 | ) | $ | 0.46 | $ | 0.15 | $ | 0.80 | |||||||||
|
Weighted average shares, basic (b) |
53,120 | 40,006 | 34,680 | 34,585 | 34,924 | |||||||||||||||
|
Weighted average shares, diluted (b) |
53,449 | 40,006 | 35,276 | 36,052 | 36,378 | |||||||||||||||
|
Balance Sheet Data (end of year): |
||||||||||||||||||||
|
Cash, cash equivalents, and investments |
$ | 7,840 | $ | 5,374 | $ | 4,392 | $ | 8,917 | $ | 34,088 | ||||||||||
|
Total assets |
$ | 285,469 | $ | 261,946 | $ | 359,767 | $ | 305,207 | $ | 193,117 | ||||||||||
|
Total debt |
$ | 93,210 | $ | 125,149 | $ | 235,011 | $ | 234,991 | $ | 165,552 | ||||||||||
|
Total long-term liabilities |
$ | 96,109 | $ | 86,428 | $ | 233,936 | $ | 164,367 | $ | 162,659 | ||||||||||
|
Shareholders' equity |
$ | 156,074 | $ | 102,858 | $ | 87,634 | $ | 32,549 | $ | 13,400 | ||||||||||
|
Cash Flow Data: |
||||||||||||||||||||
|
Cash provided by operating activities |
$ | 40,142 | $ | 44,018 | $ | 33,048 | $ | 34,021 | $ | 34,508 | ||||||||||
|
Cash (used) by investing activities |
$ | (9,045 | ) | $ | (5,812 | ) | $ | (33,119 | ) | $ | (104,142 | ) | $ | (6,526 | ) | |||||
|
Cash (used) provided by financing activities |
$ | (30,124 | ) | $ | (37,256 | ) | $ | (3,513 | ) | $ | 65,923 | $ | (35,027 | ) | ||||||
(a) In September 2007, we purchased PGIC's table games division. Effective February 1, 2006, we acquired Stargames. These acquisitions, in addition to less significant acquisitions, are included in our consolidated financial statements beginning on the effective date of the transactions.
(b) Earnings per share and weighted average share amounts reflect the effects of our 3 for 2 common share stock splits in January 2005 as well as our equity offering in July 2008 of an additional 20,294 common shares. For fiscal 2008, the dilution of 75 shares related to our options, restricted stock
and contingent convertible notes have not been included in the diluted loss per share computation as their inclusion would be anti-dilutive.
ITEM 7. MANAGEMENT'S DISCUSSION AND ANALYSIS OF FINANCIAL CONDITION AND RESULTS OF OPERATIONS
(In thousands, except per share, unit/seat amounts and product lease/sale prices)
The following is a discussion and analysis of our financial condition, results of operations and liquidity and capital resources as of October 31, 2009 and 2008 and for the fiscal years ended October 31, 2009, 2008 and 2007. This discussion should be read together with our audited consolidated financial statements and related
notes included in “Item 8. Financial Statements and Supplementary Data” included in this Annual Report on Form 10-K (“Form 10-K”). Some of the information contained in this discussion includes forward-looking statements that involve risks and uncertainties; therefore our "Special Note Regarding Forward-Looking Statements" and "Risk Factors" should be reviewed for a discussion of important factors that could cause actual results to differ materially from the results
described in, or implied by, such forward-looking statements.
OVERVIEW
We develop, manufacture and market technology and entertainment-based products for the gaming industry for placement on the casino floor. We specialize in providing casino and other gaming customers with products and services that improve their speed, profitability, productivity and security. Our products are offered in highly
regulated markets, throughout the world. Our products are manufactured at our headquarters and manufacturing facility in Las Vegas, Nevada, at our Australian headquarters in Milperra, New South Wales, Australia, as well as outsourced, for certain subassemblies in the United States, Europe and Australasia.
Our business is segregated into the following four product segments: Utility, Proprietary Table Games (“PTG”), Electronic Table Systems (“ETS”) and Electronic Gaming Machines (“EGM”). Each segment's activities include the design, development, acquisition, manufacturing, marketing, distribution, installation
and servicing of a distinct product line.
See “Item 1. Business” included in this Form 10-K for a more detailed discussion of our business, strategy and each of our four segments.
Current Economic Environment
The gaming industry in both the United States and abroad has been particularly affected by the downturn in general worldwide economic conditions, which continued to have negative consequences on our results in fiscal 2009 and is likely to continue to have a negative impact in fiscal 2010. The activity in the credit markets and in the broader
global economy and financial markets has exacerbated these trends. Consumer confidence has been significantly impacted, as seen in broader economic trends such as declines in auto and other retail sales, the weakness in the housing market and increased unemployment.
As a result, the outlook for the gaming, travel and entertainment industries both domestically and internationally remains highly uncertain. Due to recent disruptions in the financial markets, gaming operators have been less able to secure financing for development projects and have scaled back such projects considerably. Customers
have made significant cuts in expenditures, including layoffs of workers and management employees as well as delayed expansions or new openings. These economic conditions may cause both our domestic and international clients to decrease their expenditures on gaming equipment and our financial condition, results of operations and stock price may be negatively affected thereby.
Sources of Revenue
We derive our revenue from the lease, license and sale of our products and by providing service to our leased and in some cases, previously sold units. Consistent with our strategy, we have a continuing emphasis on leasing or licensing our products. When we lease or license our products, we generally negotiate month-to-month fixed
fee contracts, or to a lesser extent, enter into participation arrangements whereby casinos pay a fee to us based on a percentage of net win. Product lease contracts typically include parts and service. When we sell our products, we offer our customers a choice between a sale, a longer-term sales-type lease or other long-term financing. We also offer a majority of our products for sale with an optional parts and service contract. A more detailed discussion of our revenue components and related revenue
recognition policies is included under the heading “Critical Accounting Policies and Estimates” below.
The following points should be noted as they relate to our strategy to emphasize leasing over selling as this strategy can differ by segment and geography:
|
· |
We expect to continue to increase our lease revenues in our Utility segment within the United States. Outside of the United States, we expect to continue to realize a large proportion of our Utility revenues from sales rather than leases. This segment has a planned replacement cycle which, under normal circumstances, will typically drive a certain level of sales activity in any one period. |
|
· |
Our lease model is strongest in our PTG segment. While we have strong leasing in the United States, we are looking to expand our proprietary table games in other parts of the world where the current penetration of proprietary table games is lower. |
|
· |
We expect to continue to increase our lease revenues in our ETS segment within the United States. Outside of the United States, we expect to continue to realize a large proportion of our ETS revenues from sales rather than leases. |
|
· |
Our EGM segment is predominately a sales model and we expect to continue to realize substantially all of our EGM revenues from sales of EGMs in our primary market, Australasia. |
Currently, Utility segment revenue is derived substantially from our automatic card shufflers. In addition to leasing shufflers, we also sell and service them. In the PTG segment, the majority of games placed are licensed to our customers, which provides us with royalty revenue. In the ETS segment, we derive revenue from leases, sales and
service contracts. In the EGM segment, we derive revenue from selling the full EGM complement and conversion kits which allow existing EGM terminals to be converted to other games on the PC3 and PC4 platform.
Expenses
Our direct expenses primarily include cost of products sold, depreciation of leased assets, amortization of product-related intangible assets, service, manufacturing overhead, shipping and installation. Indirect expenses include other costs directly identified with each segment, such as R&D, product approval costs, product-related
litigation expenses, amortization of patents and other product-related intellectual property, sales commissions and other directly-allocable sales expenses. We continue to consume significant R&D efforts on the development of our newer generation shuffler products, such as the i-Deal and one2six Plus, our card recognition products, as well as other table accessories, such as the i-Shoe and i-Score. With our expansion into the e-Table markets, we continue to spend significant R&D dollars on
developing and implementing new gaming mediums, such as the i-Table, our newest e-Table that combines a variety of our products to create an exciting new table game experience. Finally, we have incurred significant R&D expense related to the operating system upgrades from the PC3 to the PC4 platforms for Vegas Star, Rapid Table Games and EGMs. We expect to continue to spend a significant portion of our annual revenue on R&D.
The amounts classified as unallocated corporate expenses consist primarily of costs related to overall corporate management and support functions. These include costs related to executive management, accounting and finance, general sales support, legal and compliance costs, office expenses and other amounts for which allocation to specific
segments is not practicable.
During 2009, we undertook a cost cutting initiative to reduce our operating costs by 10% or approximately $7,000. We exceeded this goal by reducing our SG&A expenses in excess of $12,300, excluding severance costs of $6,838 and approximately $2,300 due to foreign exchange fluctuations which may not recur in future periods. Our
infrastructure to support our growing global business is expected to remain generally consistent with our existing levels; however, our goal is to maintain the cost cutting discipline to continue to hold down costs to further improve our overall operating margins.
Gross Margin
The number and mix of products placed and the average lease or sales price are the most significant factors affecting our gross margins. Our continuing emphasis on leasing versus selling, the shift in product mix, timing of installations and related upfront installation charges, as well as increases in non-cash depreciation and amortization
expenses attributable to our acquisitions, impact our margins.
In general, lease gross margin is greater than the sales gross margin for the same products. However, total gross profit from leasing will be lower in a given reporting period than those of a sale due to the much higher price of a sale versus a lease. A number of factors impact gross margins, including the number and mix of products
placed and the average lease or sales price of those products. For example, in our PTG segment, certain proprietary table games warrant a higher average lease price than a PTG add-on such as a felt side-bet or a progressive. For Utility products, when a new shuffler is introduced into the market, we use introductory lease pricing. This is consistent with our rollout strategy whereby we provide very favorable lease rates at the inception of a lease to entice the customer to try our new product. After the introductory
pricing period expires, the price generally increases to the monthly “list” lease price, which we believe will increase future revenues because most customers keep the products beyond the introductory pricing period. Accordingly, we anticipate that gross margins will increase under our lease model.
Our leasing strategy is primarily focused in the United States, because many foreign customers prefer to purchase rather than lease product. Lastly, our pricing strategy recognizes that our Utility products are always subject to sales activity as part of our “replacement cycle” whereby we sell our prior generation shufflers before
the introduction of our next generation product.
In addition to the lease versus sell strategy, we expect to improve our gross margins through value engineering to reduce manufacturing costs. Our focus is currently on savings attributable to component parts, product redesign and lower cost manufacturing opportunities within each of our segments.
ACQUISITIONS AND OTHER SIGNIFICANT TRANSACTIONS
Contingent convertible senior notes. In our third quarter ended July 31, 2008, we engaged in a multi-step refinancing (the “Refinancing”) of our 1.25% contingent convertible senior notes (the “Notes”) which included a Tender Offer
whereby we repurchased $89,350 in aggregate principal amount of our Notes at 97.25% of face value. We engaged in the Refinancing because holders of our Notes had the option to require us to repurchase all or a portion of such Notes on April 15, 2009 at 100% of the principal amount of the Notes, plus accrued and unpaid interest.
On December 10, 2008, we purchased $10,000 of our outstanding Notes in a separate open market transaction at a discount. On April 15, 2009, we purchased an additional $30,250 of our outstanding Notes at face value, representing approximately 99.97% of the aggregate principal amount of the remaining outstanding Notes, resulting
in gain on early extinguishment of debt of $163. The holders of the Notes had an option, pursuant to the terms of the Notes, to require us to purchase, on April 15, 2009, all or a portion of their Notes (the “Put Option”). All Notes validly tendered and not validly withdrawn in the Put Option were accepted for payment and purchased by us and cancelled. We made our regularly scheduled interest payment on April 15, 2009. Accordingly, there was no accrued and unpaid interest remaining through
the date of purchase. After giving effect to the purchase of the tendered Notes, $8 aggregate principal amount of the Notes remained outstanding. We redeemed these Notes pursuant to the terms of the Notes on May 29, 2009 at 100% plus accrued and unpaid interest. In order to repurchase the Notes, we drew on our $100,000 revolving credit facility (the “Revolver”).
Progressive Gaming International Corporation/International Game Technology Transaction. In January 2009, International Game Technology (“IGT”) entered into an arrangement to acquire substantially all of the assets of Progressive Gaming International Corporation
(“PGIC”). On February 17, 2009, a number of agreements were entered into between us, PGIC and IGT. These agreements include the Royalty Acceleration Agreement (PGIC and us), the Waiver Agreement (IGT and us) and the Binding Term Sheet (IGT and us). In part, these agreements addressed certain commitments that were made by us and PGIC in an agreement dated September 26, 2007 to acquire all of PGIC’s Table Game Division (“TGD”) business (the “Purchase
Agreement”), including certain worldwide rights and lease contracts for all of PGIC’s table game titles including Caribbean Stud and Texas Hold’ Em Bonus®, as well as the Software Distribution License Agreement (“SDLA”) which provided us a license to use/distribute certain progressive related software on games that were not purchased as part of the TGD. The Purchase Agreement provided for,
in addition to an initial up-front payment, future earn-out payments beginning in calendar 2008, including $3,500 in total non-interest bearing guaranteed minimum payments over a 4-year period, as follows: for each of 2008 and 2009, the guaranteed minimum amounts were $1,000 each year, paid quarterly; and for 2010 and 2011, $750 each year, also paid quarterly. At the time of the acquisition, we recorded an estimated discounted liability for the minimum consideration due under the Purchase Agreement
of $2,922. Pursuant to the SDLA and as part of the TGD acquisition, we prepaid royalties of $3,000 related to the use of the Casino Jackpot System (“CJS”) and Game Manager™ software and related table hardware (collectively, the “GMS”). These prepaid royalties plus an additional $1,750 were to be earned as defined in the agreement on a per progressive unit placement basis. The term
of the SDLA was 5 years, with automatic renewal of 5 year increments, unless a non-renewal notice was given by either party ninety days in advance.
The Royalty Acceleration Agreement dated February 17, 2009 relieved us of all future monetary obligations related to the Purchase Agreement as well as any potential additional monies due under the SDLA in excess of the prepaid royalty previously paid. As a condition for being relieved of any future monies due under the Purchase
Agreement and the SDLA, we made a final payment of $960. Up until February 17, 2009, we had paid PGIC approximately $951 related to minimum consideration due under the Purchase Agreement.
The Binding Term Sheet, which became effective March 6, 2009, absent any other agreement, resolved a dispute between us and IGT as to our rights in certain patents owned at one time by PGIC. This dispute involved other parties as well. We claimed that we had certain rights in certain patents of PGIC before IGT allegedly received
the patents as a result of the foreclosure of PGIC by Private Equity Management (“PEM”). As to certain patents, IGT’s alleged ownership rights were transferred to us (the “SMI Patents”). The Term Sheet also provided for IGT to obtain a license to the SMI Patents with certain restrictions in addition to allowing us to license certain patents from IGT which IGT allegedly acquired from PGIC through foreclosure by PEM (“PEM Patents”). These
licenses are not exclusive and are for limited use only. The Term Sheet also waived our claims of certain rights in other patents that were once owned by PGIC.
As a result of the above agreements, we wrote-off the net book value of approximately $160 related to the covenants not to compete between us and PGIC. In addition, the prepaid royalty related to the SDLA was re-characterized as a lifetime license to be amortized over a 10-year life. The acquired SMI patents were fair valued at $520. The
remaining discounted minimum consideration due under the Purchase Agreement of approximately $2,247 was relieved resulting in a net gain on early extinguishment of $1,798.
Elixir Gaming Technologies Inc. (formerly VendingData Corporation) purchase and settlement agreement. On March 16, 2009, we entered into an agreement with Elixir Gaming Technologies, Inc. (“Elixir Gaming”) pursuant to which Elixir Gaming sold
us their intellectual property related to Elixir Gaming’s card shuffling and card deck checking equipment, including the RandomPlus® shuffler, the ShufflePro™ shuffler and the DeckChecker™. Also contained in the agreement is a 7-year covenants
not to compete clause. In connection with this acquisition, we also purchased Elixir Gaming’s remaining finished-goods inventory of products in this category. In addition, we also agreed with Elixir Gaming to jointly dismiss all claims with prejudice pertaining to the outstanding patent infringement litigation. This included the release of our $3,000 cash security, plus accrued interest, that we posted in 2004 in connection with an injunction that we received at that time.
The total consideration paid to Elixir Gaming was $2,800. Total direct acquisition costs associated with this acquisition was $148.
We expensed the fair value of the effective settlement of the lawsuit. We determined the fair value of the effective settlement of the lawsuit by taking the difference between the fair values of each identifiable element of the transaction and the total purchase price using the residual method. The fair value of $400
related to the effective settlement of the lawsuit was immediately charged to selling, general and administrative expenses (“SG&A”).
This transaction was accounted for as an asset purchase; no liabilities were assumed. The following table sets forth the determination of the consideration paid for the asset acquisition:
|
Effective settlement of lawsuit |
$ | 400 | ||
|
Inventory |
122 | |||
|
Patents (amortized over a 3 year period to Utility segment cost of goods sold) |
850 | |||
|
Covenant not to compete (amortized over a 7 year period to Utility segment SG&A) |
1,576 | |||
|
Total consideration |
$ | 2,948 |
CRITICAL ACCOUNTING POLICIES AND ESTIMATES
We prepare our consolidated financial statements in conformity with accounting principles generally accepted in the United States. Our accounting policies are more fully described in Note 1 in “Item 8. Financial Statements and Supplementary Data”, included in this Form 10-K. Some of our accounting policies require us
to make difficult, complex and subjective judgments, often as a result of the need to make estimates of matters that are inherently uncertain. We periodically evaluate our policies, estimates and related assumptions and base our estimates on historical experience, current trends and expectations of the future. We considered the following critical accounting policies to be the most important to understanding and evaluating our financial results and require the most subjective and complex judgments made by management.
We have discussed the development, selection and disclosure of our critical accounting policies and estimates with the Audit Committee of our Board of Directors. Actual results may differ from our estimates under different conditions and assumptions.
Revenue recognition. We recognize revenue when the following criteria are met:
|
· |
persuasive evidence of an arrangement between us and our customer exists; |
|
· |
shipment has occurred or services have been rendered; |
|
· |
the price is fixed or determinable; and |
|
· |
collectability is reasonably assured and/or probable. |
We earn our revenue in a variety of ways. We offer our products for lease or sale as well as sell service and warranty contracts for our sold equipment.
Product lease and royalty revenue—Lease and royalty revenue is earned from the leasing of our tangible products and the licensing of our intangible products, such as our proprietary table games. When we lease or license our products, we generally negotiate month-to-month fixed
fee contracts, or to a lesser extent, enter into participation arrangements whereby casinos pay a fee to us based on a percentage of net win. Lease and royalty revenue commences upon the completed installation of the product. Lease terms are generally cancellable with 30 days notice.
Product sales and service revenue—We generate sales revenue through the sale of equipment in each product segment, including sales revenue from sales-type leases and the sale of lifetime licenses for our proprietary table games. Financing for intangible property and sales-type
leases for tangible property have payment terms ranging generally from 24 to 36 months and are interest-bearing at market interest rates. Revenue from the sale of equipment is recorded in accordance with the contractual shipping terms. If a customer purchases existing leased equipment, revenue is recorded on the effective date of the purchase agreement. Revenue on service and warranty contracts is recognized as the services are provided over the term of the contracts, which are generally one year. Revenue from
the sale of lifetime licenses, under which we have no continuing obligation, is recorded on the effective date of the license agreement.
Certain of our products contain software and when leasing or selling software we consider whether the software component is incidental to the product as a whole based on the following criteria:
|
· |
Whether the software is a significant focus of the marketing effort or is sold separately. |
|
· |
Whether post-contract customer support or PCS (PCS includes the right to receive services or unspecified upgrades/enhancements, or both, offered to users or resellers) is provided. |
|
· |
Whether the development and production costs of the software as a component of the cost of the product is incidental. |
|
· |
Whether an agreement includes service elements (other than PCS related services), such as training or installation and whether such services are essential to the functionality of the software or whether such software is considered “off-the-shelf” (off-the-shelf software is software that is marketed as a stock item that can be used by customers with little or no customization). Conversely, “core software”
requires significant customization of the software in order for the software to be used by the end customer. |
Some of our revenue arrangements contain multiple deliverables, such as a product sale combined with a service element or the delivery of a future product. If an arrangement requires the delivery or performance of multiple elements, we divide deliverables into separate units of accounting if:
|
· |
The delivered items have value to the customer on a stand alone basis; |
|
· |
we have objective and reliable evidence of the fair value of the undelivered items; and |
|
· |
delivery of any undelivered item is considered probable and substantially in our control. |
If these criteria are not met, we do not recognize revenue until all essential elements have been delivered. If the installation of the product is not considered inconsequential and perfunctory, then we defer revenue recognition until installation is complete.
The subjective and complex judgments for revenue recognition typically involve whether collectability is probable, whether fees under an arrangement are fixed or determinable and the identification of specific deliverables under multiple element arrangements. In addition, multiple element arrangements must be analyzed to determine the relative
fair value of each element, the amount of revenue to be recognized and the period and conditions under which deferred revenue should be recognized. The ability to establish vendor specific objective evidence of fair value for our products and services also requires judgment by management.
Goodwill and other indefinite lived intangible assets. We review our goodwill for impairment annually in October or when circumstances indicate that the carrying amount of goodwill may not be fully recoverable. The review is performed at the reporting unit
level, which we have determined is the equivalent to our reportable segments. The goodwill impairment test is a two-part test. In the first step, we selected a discounted cash flow model (income approach) and the Guideline Public Company Model (market approach) to assess the fair values of our reporting units. These two methodologies were weighted in determining fair values. The fair value of the reporting unit is then compared to the book value of the reporting unit, including
its goodwill. If the fair value is less than the book value, then we would perform a second step to compare the implied fair value of the reporting unit's goodwill to its book value. The implied fair value of the goodwill is determined based on the estimated fair value of the reporting unit less the fair value of the reporting unit's identifiable assets and liabilities. We would record an impairment charge to the extent that the book value of the reporting unit's goodwill exceeds its fair value.
Our income approach analysis is based on the present value of two components: the sum of our three-year projected cash flows and a terminal value assuming a long-term growth rate. The cash flow estimates are prepared based on our business plans for each reporting unit, considering historical results and anticipated future performance based
on our expectations regarding product introductions and market opportunities. The discount rates used to determine the present value of future cash flows were derived from the weighted average cost of capital of a group of comparable companies with consideration for the size and specific risks of each our reporting units. The discount rates used for each reporting unit were 13% for our fiscal 2009 test and 16% for our fiscal 2008 test.
As of October 31, 2009 and 2008, our goodwill totaled $74,662 and $60,929, respectively. Our fiscal 2009 annual goodwill impairment test indicated the fair value of each reporting unit was in excess of its carrying value. Inherent in such fair value determinations are significant judgments and estimates, including assumptions about our future
revenues, profitability, cash flows and long-term growth rates, as well as our operational plans and our ability to execute such plans and our interpretation of current economic indicators and market valuations.
If our assumptions do not prove correct or economic conditions affecting future operations change, our goodwill could become impaired and result in a material adverse effect on our results of operations and financial position. To illustrate the sensitivity of the fair value calculations on our goodwill impairment test, if the discount rates
used for the 2009 analysis increased to 15% for each reporting unit (all other assumptions held constant), the fair value of each reporting unit would still be in excess of their carrying value by at least 50%.
For fiscal 2009, 2008 and 2007, we recorded an impairment charge of $0, $22,137 and $0, respectively.
We review our indefinite lived intangible assets (“tradenames”) for impairment annually in October or when circumstances indicate that the carrying amount of the tradename may not be fully recoverable. We would record an impairment loss if the carrying amount of the indefinite lived intangible asset is not recoverable and the
carrying amount exceeds its estimated fair value.
In October 2009, we performed our annual indefinite lived intangible asset impairment analysis for our Stargames and CARD tradenames, which is discussed in Note 6, by comparing the discounted, estimated future cash flows using the income approach as compared to the carrying value of the tradenames and determined that no impairment was indicated.
Other intangible assets. Other intangible assets include intellectual property for games, patents, trademarks, copyrights, licenses, developed technology, customer relationships and non-compete
agreements that were purchased separately or acquired in connection with a business combination. All of our significant intangible assets are definite lived and, accordingly, amortized over their expected useful lives which range from 1 to 15 years. We amortize certain of our intangible assets proportionate to the ratio of actual revenue to total actual plus expected revenue from the utilization of the intangible asset. We believe this method reflects the pattern in which the economic benefits of the intangible
asset are consumed or otherwise used up. For certain other intangibles, such as covenants not to compete, we amortize on a straight-line basis over their useful lives.
Impairment of long-lived assets. We estimate the useful lives of our long-lived assets, excluding goodwill and indefinite lived intangible assets, based on historical experience, estimates of products' commercial lives, the likelihood of technological obsolescence
and estimates of the duration of commercial viability for patents, licenses and games.
We review our long-lived assets, excluding goodwill and indefinite lived intangible assets, for impairment whenever events or circumstances indicate the carrying value may not be recoverable or warrant a revision to the estimated remaining useful life. We would record an impairment loss if the carrying amount of the asset or asset
group is not recoverable (as determined by undiscounted cash flows) and the carrying amount exceeds its estimated fair value. For fiscal 2009, 2008 and 2007 we did not have any such impairment loss.
Inventories. Inventories are stated at the lower of cost, determined on a first-in-first-out basis, or market. Cost elements included in work-in-process and finished goods include raw materials, direct labor and manufacturing overhead. We regularly
review inventory quantities and update estimates for the net realizable value of inventories. This process includes examining the carrying values of new and used gaming devices, parts and ancillary equipment in comparison to the current fair market values for such equipment (less costs to sell or dispose). Some of the factors involved in this analysis include the overall levels of our inventories, the current and projected sales levels for such products, the projected markets for such products, the costs required
to sell the products, including refurbishment costs and importation costs for international shipments and the overall projected demand for products once the next generation of products are scheduled for release.
As a result of our ongoing analysis of inventory, we recognized inventory write-downs of $1,523, $72 and $1,415 for fiscal years 2009, 2008 and 2007, respectively. Additional valuation charges could occur in the future as a result of changes in the factors listed above.
Provisions for bad debts. We maintain provisions for bad debts for estimated credit losses that result from the inability of our customers to make required payments. Provisions for bad debts are estimated based on historical experience and specific customer collection
issues. Changes in the financial condition of our customers could result in the adjustment upward or downward in the provisions for bad debts, with a corresponding impact to our operating results.
Income taxes. We recognize deferred tax assets, net of applicable reserves, related to net operating loss carryforwards and certain temporary differences. The standard requires recognition of a future tax benefit to the extent that realization of such benefit is more
likely than not. Otherwise, a valuation allowance is applied. Except for certain foreign net operating losses, we believe that it is more likely than not that our deferred tax assets are fully realizable because of the future reversal of existing taxable temporary differences and future projected taxable income.
In November 2007, we adopted new accounting guidance related to the accounting for uncertainty in income taxes which required the recognition of uncertain tax positions taken or expected to be taken in a tax return, when it is “more likely than not” to be sustained upon examination. This assessment further presumes that tax authorities
evaluate the technical merits of transactions individually with full knowledge of all facts and circumstances surrounding the issue. See Note 13 for additional information.
Share based compensation. We measure and recognize all share-based compensation, including shares and share-based awards to employees, under the fair value method. We measure the fair value of share-based awards using the Black-Scholes model.
Compensation is attributed to the periods of associated service and such expense is recognized on a straight-line basis over the vesting period of the awards. Forfeitures are estimated at the time of grant, with such estimate updated when the expected forfeiture rate changes.
In addition, the excess tax benefit from stock-option exercises—tax deductions in excess of compensation cost recognized—is classified as a financing activity.
Contingencies. We assess our exposures to loss contingencies including legal and income tax matters and provide for an exposure if it is judged to be probable and reasonably estimable. If the actual loss from a contingency differs from our estimate, there could be
a material impact on our results of operations or financial position. Operating expenses, including legal fees, associated with contingencies are expensed when incurred.
RECENTLY ISSUED ACCOUNTING STANDARDS
In October 2009, the FASB issued two Accounting Standards Updates (“ASU”) providing new revenue recognition guidance with respect to revenue arrangements that include software elements and multiple deliverables. Under the new guidance, tangible products, containing both software and nonsoftware components that function together
to deliver a tangible product’s essential functionality, will not be subject to software revenue accounting. This new guidance also establishes a new hierarchy for allocating revenues among multiple deliverables in a multi-element arrangement. In order of preference, revenues will be allocated based on VSOE, third-party evidence, or estimated selling price. Additional disclosures will be required to describe the effects of adoption, including changes in how arrangement consideration is allocated or in the
pattern and timing of revenue recognition. This new guidance is effective for fiscal years beginning on or after June 15, 2010, and we have elected to early adopt prospectively for new or materially modified arrangements entered into on or after the beginning of our fiscal 2010. We continue to evaluate the extent to which this new guidance will impact the timing of our revenues and expect many of the Company’s products, such as those in our ETS and EGM segments, will no longer be accounted for as software,
allowing for revenue recognition earlier in certain bundled arrangements.
In June 2009, the FASB issued an authoritative guidance for the FASB accounting standards codification and hierarchy of generally accepted accounting principles. The guidance establishes only two levels of U.S. generally accepted accounting principles (“GAAP”), authoritative and nonauthoritative. The FASB Accounting Standards
Codification (the “Codification”) will become the source of authoritative, nongovernmental GAAP, except for rules and interpretive releases of the SEC, which are sources of authoritative GAAP for SEC registrants. All other non-grandfathered, non-SEC accounting literature not included in the Codification will become nonauthoritative. The guidance is effective for interim and annual periods ending after September 15, 2009. The adoption of the guidance did not have a material impact on our consolidated
financial statements.
In May 2009, the FASB issued an authoritative guidance for subsequent events, which is effective for interim and annual financial statements ending after June 15, 2009. The guidance establishes general standards of accounting for and disclosure of subsequent events that occur after the balance sheet date. Entities are also required to
disclose the date through which subsequent events have been evaluated and the basis for that date. The adoption of the guidance did not have a material impact on our consolidated financial statements. The Company has evaluated subsequent events through the date of issuance, January 14, 2010. See Note 16 for more information.
The following table presents our various items of revenue and expense as a percentage of total revenue:
CONSOLIDATED STATEMENTS OF OPERATION
|
Year Ended October 31, |
||||||||||||||||||||||||
|
2009 |
2008 |
2007 |
||||||||||||||||||||||
|
(In thousands) |
||||||||||||||||||||||||
|
Revenue: |
||||||||||||||||||||||||
|
Utility |
$ | 71,707 | 40.0 | % | $ | 80,893 | 42.5 | % | $ | 78,457 | 43.9 | % | ||||||||||||
|
Proprietary Table Games |
38,697 | 21.6 | % | 38,594 | 20.3 | % | 33,125 | 18.5 | % | |||||||||||||||
|
Electronic Table Systems |
22,342 | 12.4 | % | 27,461 | 14.5 | % | 27,890 | 15.5 | % | |||||||||||||||
|
Electronic Gaming Machines |
46,598 | 26.0 | % | 42,898 | 22.6 | % | 39,269 | 22.0 | % | |||||||||||||||
|
Other |
83 | 0.0 | % | 160 | 0.1 | % | 110 | 0.1 | % | |||||||||||||||
|
Total revenue |
179,427 | 100.0 | % | 190,006 | 100.0 | % | 178,851 | 100.0 | % | |||||||||||||||
|
Cost of revenue |
73,756 | 41.1 | % | 79,104 | 41.6 | % | 74,985 | 41.9 | % | |||||||||||||||
|
Gross profit |
105,671 | 58.9 | % | 110,902 | 58.4 | % | 103,866 | 58.1 | % | |||||||||||||||
|
Selling, general and administrative |
63,647 | 35.5 | % | 71,350 | 37.6 | % | 61,947 | 34.6 | % | |||||||||||||||
|
Research and development |
17,349 | 9.7 | % | 18,474 | 9.7 | % | 17,337 | 9.7 | % | |||||||||||||||
|
Impairment of goodwill |
- | 0.0 | % | 22,137 | 11.7 | % | - | 0.0 | % | |||||||||||||||
|
Income (Loss) from operations |
24,675 | 13.7 | % | (1,059 | ) | (0.6 | %) | 24,582 | 13.8 | % | ||||||||||||||
|
Other income (expense): |
||||||||||||||||||||||||
|
Interest income |
860 | 0.5 | % | 1,759 | 0.9 | % | 1,644 | 0.9 | % | |||||||||||||||
|
Interest expense |
(5,401 | ) | (3.0 | %) | (6,630 | ) | (3.5 | %) | (7,487 | ) | (4.2 | %) | ||||||||||||
|
Other, net |
731 | 0.4 | % | 1,261 | 0.7 | % | (4,131 | ) | (2.3 | %) | ||||||||||||||
|
Total other income (expense) |
(3,810 | ) | (2.1 | %) | (3,610 | ) | (1.9 | %) | (9,974 | ) | (5.6 | %) | ||||||||||||
|
Gain on early extinguishment of debt |
1,961 | 1.1 | % | 1,773 | 0.9 | % | - | 0.0 | % | |||||||||||||||
|
Impairment of investments |
- | 0.0 | % | (1,560 | ) | (0.8 | %) | - | 0.0 | % | ||||||||||||||
|
Equity method investment loss |
- | 0.0 | % | - | 0.0 | % | (306 | ) | (0.2 | %) | ||||||||||||||
|
Income (Loss) from continuing operations before tax |
22,826 | 12.7 | % | (4,456 | ) | (2.4 | %) | 14,302 | 8.0 | % | ||||||||||||||
|
Income tax (benefit) provision |
7,367 | 4.1 | % | 6,346 | 3.3 | % | (1,999 | ) | (1.1 | %) | ||||||||||||||
|
Income (Loss) from continuing operations |
15,459 | 8.6 | % | (10,802 | ) | (5.7 | %) | 16,301 | 9.1 | % | ||||||||||||||
|
Discontinued operations, net of tax |
- | 0.0 | % | (1 | ) | (0.0 | %) | 78 | 0.0 | % | ||||||||||||||
|
Net income (loss) |
$ | 15,459 | 8.6 | % | $ | (10,803 | ) | (5.7 | %) | $ | 16,379 | 9.1 | % | |||||||||||
The following table provides additional information regarding our revenue, gross profit and gross margin:
REVENUE AND GROSS MARGIN
|
Year Ended October 31, |
Percentage Change |
|||||||||||||||||||
|
2009 |
2008 |
2007 |
09 vs. 08 |
08 vs. 07 |
||||||||||||||||
|
(In thousands) |
||||||||||||||||||||
|
Revenue: |
||||||||||||||||||||
|
Leases and royalties |
$ | 76,258 | $ | 70,898 | $ | 56,426 | 7.6 | % | 25.6 | % | ||||||||||
|
Sales and service |
103,113 | 118,948 | 122,315 | (13.3 | %) | (2.8 | %) | |||||||||||||
|
Other |
56 | 160 | 110 | (65.0 | %) | 45.5 | % | |||||||||||||
|
Total |
$ | 179,427 | $ | 190,006 | $ | 178,851 | (5.6 | %) | 6.2 | % | ||||||||||
|
Cost of revenue: |
||||||||||||||||||||
|
Leases and royalties |
$ | 24,559 | $ | 21,866 | $ | 17,221 | 12.3 | % | 27.0 | % | ||||||||||
|
Sales and service |
49,197 | 57,238 | 57,764 | (14.0 | %) | (0.9 | %) | |||||||||||||
|
Total |
$ | 73,756 | $ | 79,104 | $ | 74,985 | (6.8 | %) | 5.5 | % | ||||||||||
|
Gross profit: |
||||||||||||||||||||
|
Leases and royalties |
$ | 51,699 | $ | 49,032 | $ | 39,205 | 5.4 | % | 25.1 | % | ||||||||||
|
Sales and service |
53,916 | 61,710 | 64,551 | (12.6 | %) | (4.4 | %) | |||||||||||||
|
Other |
56 | 160 | 110 | (65.0 | %) | 45.5 | % | |||||||||||||
|
Total |
$ | 105,671 | $ | 110,902 | $ | 103,866 | (4.7 | %) | 6.8 | % | ||||||||||
|
Gross margin: |
||||||||||||||||||||
|
Leases and royalties |
67.8 | % | 69.2 | % | 69.5 | % | ||||||||||||||
|
Sales and service |
52.3 | % | 51.9 | % | 52.8 | % | ||||||||||||||
|
Total |
58.9 | % | 58.4 | % | 58.1 | % | ||||||||||||||
RESULTS OF OPERATIONS
Fiscal 2009 compared to Fiscal 2008
Revenue
Our revenue in fiscal 2009 decreased $10,579 over fiscal 2008, primarily due to the following:
· Impact of foreign currency fluctuations
|
|
o |
The strengthening of the U.S. dollar of 10.0% and 15.0%, respectively, to the Euro and the Australian dollar, resulted in a reduction in revenues of $10,135. These decreases primarily impacted sales and service revenues in our EGM, ETS and Utility segments |
· Reduction in our sales and service revenues
|
|
o |
A decrease of approximately 21.8% in the Utility segment primarily representing a reduction in sales in the European market. The European market has experienced credit market deterioration, smoking bans and the dissolution of the Russian gaming market due to regulatory changes |
|
|
o |
A decrease of approximately 42.2% in the ETS segment due to declines in sales of our Vegas Star and Rapid Table Games products in Australia and our Table Master™ products in the United States |
The decreases were offset by the following increases:
· Increases in our lease and royalty revenue
|
|
o |
The ETS segment provided the largest increase at 28.8% due to increased Table Master™ seats on lease |
|
|
o |
The Utility segment demonstrated an 8.2% increase due to placements of our i-Deal shuffler |
|
|
o |
The PTG segment increased 1.2% due to growth in our Ultimate Texas Hold’em® premium title and Fortune Pai Gow Poker Progressive |
· EGM sales revenue
|
|
o |
A 7.8% increase in revenue driven primarily by the strength of our newer titles and the success of our progressive links, Pink Panther and Grand Central |
Gross margin
Our gross margin in fiscal 2009 increased 50 basis points ("bps") bps to 58.9% from fiscal 2008, reflecting the following:
· Mix of revenue
|
|
o |
A proportionate increase in lease and royalty revenue which generates higher gross margins than sales and service revenue primarily driven by increased placements and average lease prices |
|
|
o |
Increased average sales prices, primarily in our Utility segment and EGM segment, on a local currency basis |
Offsetting these increases were the following decreases:
· Impact of foreign currency fluctuations
|
|
o |
The strength of the U.S. dollar negatively impacted margins by 3.1% |
|
· |
Write-down for inventory obsolescence |
|
|
o |
A decrease in gross margin of approximately 0.8% related to lower of cost or market adjustments primarily on older generation products. These were mostly in the Utility and ETS Segments. |
Fiscal 2008 compared to Fiscal 2007
Revenue
Our revenue in fiscal 2008 increased $11,155 over fiscal 2007, primarily due to the following:
|
· |
Impact of foreign currency fluctuations |
|
|
o |
The weakening of the U.S. dollar of 12.1% and 8.1%, respectively, to the Euro and the Australian dollar, resulted in an increase in revenues of $6,018. These increases occurred primarily in sales and service revenues in our EGM, Utility and ETS segments |
|
· |
Increases in lease revenues |
|
|
o |
Increases in our PTG revenue generating lease base resulted in a 29.5% increase in PTG royalties. This increase was due in part to the approximate 600 unit installed base that we acquired in connection with the purchase of PGIC’s TGD business |
|
|
o |
ETS lease revenue grew 60.1% and Utility lease revenue grew 13.8% due to increases in placements as well as increases in our average monthly lease prices |
|
· |
Mix of revenue |
|
|
o |
Sales of our EGMs and the associated parts and peripherals increased 9.3% due to the strength of our newer game titles which led to increased average sales prices |
The increases were slightly offset by the following decrease:
|
· |
Reduction in sales |
|
|
o |
Consistent with our lease strategy, a concerted effort to reduce sales in our Utility, PTG and ETS segments |
Gross margin
Our gross margin in fiscal 2008 increased 30 bps to 58.4% from fiscal 2007, reflecting the following:
|
· |
Mix of revenue |
|
|
o |
A proportionate increase in lease and royalty revenue which generates higher gross margins than sales and service revenue primarily driven by increased placements and higher average lease prices |
This increase was offset by the following:
|
· |
Introductory pricing on our i-Deal shuffler |
|
· |
An increase in non-cash amortization related to the acquisition of the PGIC TGD in late fiscal 2007 and other product-related intangibles of Stargames and CARD, which increased over the prior-year period |
The following table provides additional information regarding our operating expenses:
OPERATING EXPENSES
|
Year Ended October 31, |
Percentage Change |
|||||||||||||||||||
|
2009 |
2008 |
2007 |
09 vs. 08 |
08 vs. 07 |
||||||||||||||||
|
(In thousands) |
||||||||||||||||||||
|
Selling, general and administrative |
$ | 63,647 | $ | 71,350 | $ | 61,947 | (10.8 | %) | 15.2 | % | ||||||||||
|
Percentage of revenue |
35.5 | % | 37.6 | % | 34.6 | % | ||||||||||||||
|
Research and development |
$ | 17,349 | $ | 18,474 | $ | 17,337 | (6.1 | %) | 6.6 | % | ||||||||||
|
Percentage of revenue |
9.7 | % | 9.7 | % | 9.7 | % | ||||||||||||||
|
Impairment of goodwill |
$ | - | $ | 22,137 | - | (100.0 | %) | 100.0 | % | |||||||||||
|
Percentage of revenue |
0.0 | % | 11.7 | % | 0.0 | % | ||||||||||||||
|
Total operating expenses |
$ | 80,996 | $ | 111,961 | $ | 79,284 | (27.7 | %) | 41.2 | % | ||||||||||
|
Percentage of revenue |
45.1 | % | 58.9 | % | 44.3 | % | ||||||||||||||
Fiscal 2009 compared to Fiscal 2008
Selling, general & administrative (“SG&A”) expenses
SG&A decreased $7,703 in fiscal 2009 as compared to fiscal 2008. This decrease primarily reflects the following:
· Impact of foreign currency fluctuations
|
|
o |
Net decreases of approximately $2,262 at our foreign subsidiaries due to the strengthening of the U.S. dollar |
· Salaries, benefits and consultants
|
|
o |
Decreased costs of approximately $9,521, excluding cash salary and related benefits severance costs, due to cost rationalization efforts |
|
|
o |
Severance costs of $6,838, which primarily related to the retirement of our former CEO and the departure of several senior executives. The $6,838 of severance costs were primarily comprised of $3,628 of accelerated stock compensation expense and $3,210 of cash salary and related benefits |
· Professional fees
|
|
o |
Decreased legal expenses of $2,214, excluding the effect of the Elixir item discussed below. Corporate legal expense decreased as a result of lower legal expenses incurred on our shareholder derivative and VendingData II lawsuits, settlement of prior cases, which primarily included MP Games LLC, and decreased costs related to other general corporate matters |
|
|
o |
Decreased costs of approximately $1,500 for professional fees, primarily related to reductions in accounting and other professional fees |
|
|
o |
Legal charge of $400 related to the Elixir purchase and settlement agreement, which approximates the fair value of the effective settlement related to the previous lawsuit between us and Elixir |
Research & development (“R&D”) expenses
R&D expense decreased $1,125 in fiscal 2009 as compared to fiscal 2008. This decrease primarily reflects:
|
· |
Impact of foreign currency fluctuations |
|
|
o |
Net decreases of approximately $1,114 at our foreign subsidiaries due to the strengthening of the U.S. dollars |
The following projects have been the focus of our R&D efforts during fiscal 2009:
|
· |
Utility |
|
|
o |
Expenses primarily related to finalizing the mechanical, hardware and software development of the i-Shoe Auto featuring optical card recognition and an auto-card feeding mechanism, finalizing hardware and software for the one2six Plus continuous shuffler featuring optical card recognition and developing and improving other Utility products, including developing generic card recognition technology to replace card libraries. Additional
R&D efforts were focused on developing the i-Score Baccarat display system, including new computer hardware |
|
· |
PTG |
|
|
o |
Expenses primarily related to development of implementing progressives onto existing proprietary games as well as developing or licensing a large variety of new games including Dealer Bluff Six Card Poker |
|
|
o |
Additional R&D efforts were spent on developing the Video Progressive Display System (“ViPS”) to support our PTG progressive products |
|
· |
ETS |
|
|
o |
Expenses primarily related to the final development of the i-Table, our first product that benefited from an emphasis on “globalizing” our research and development by combining resources from our Utility, PTG and ETS segments and utilizing product knowledge from both our U.S. operations as well as our operations in Australia |
|
|
o |
Additional R&D efforts were spent on creating and implementing new game content for our Table Master, Vegas Star and Rapid Table Games |
|
· |
EGM |
|
|
o |
Expenses primarily related to development of new game titles and themes. This was in conjunction with the continued commercialization of existing linked jackpot products, “Pink Panther” and “Grand Central” |
Fiscal 2008 compared to Fiscal 2007
SG&A expenses
SG&A increased $9,403 in fiscal 2008 as compared to fiscal 2007. The increase in SG&A expenses primarily reflects the following:
|
· |
Salaries, benefits and consultants |
|
|
o |
Personnel costs increased $6,545, due to staffing our newly established corporate division, adding to the sales and service staff in our Shuffle Master Americas division and expanding into new territories, including South Africa |
|
|
o |
Severance costs of approximately $1,023 associated with the departure of a senior executive at our corporate office, in addition to other subsidiary senior management |
|
· |
Facility |
|
|
o |
Additional costs of $2,413 associated with increased facilities and office-related expenses for our Shuffle Master Asia division |
|
· |
Impact of foreign currency fluctuation |
|
|
o |
Net increases of approximately $1,978 at our foreign subsidiaries due to the weakening of the U.S. dollar |
|
· |
Other |
|
|
o |
A write-off of prepaid licensing costs of $1,124, in fiscal 2008 associated with the abandonment of a project |
These increases were offset by the following:
|
· |
Total SG&A expenses were offset by a gain of $738 recognized on the sale of our fractional ownership in a Net Jets, Inc. (“Net Jets”) corporate airplane. Effective February 27, 2008, we sold our interest in the airplane. This sale, carried out as part of our strategic initiative to monetize certain non-core assets, resulted in proceeds of approximately $1,309 |
|
· |
Professional fees |
|
|
o |
Corporate legal expense marginally decreased $154, or 2.6%, in fiscal 2008 as compared to fiscal 2007. Corporate legal expense decreased as a result of lower legal expenses incurred on our pending cases, which primarily included VendingData II and Awada, as well as settlement of prior cases in fiscal 2008, which primarily included MP Games LLC |
R&D expenses
R&D expense increased $1,137 in fiscal 2008 as compared to fiscal 2007. The increase is due to the following:
|
· |
Corporate Products Group (“CPG”) was formed in the fourth quarter 2007 and is responsible for overseeing the creation and development of our existing and future product lines as well as overseeing our global products R&D. In fiscal 2008, approximately $1,266 was expended by the newly formed CPG as compared to $233, in fiscal 2007, primarily for general operational purposes |
|
· |
Impact of foreign currency fluctuation |
|
|
o |
Net increases of approximately $566 at our foreign subsidiaries due to the weakening of the U.S. dollar |
|
· |
Utility |
|
|
o |
Expenses primarily related to the development of the i-Deal shuffler and the development of the i-Shoe Auto featuring optical card recognition and an auto-card feeding mechanism |
|
|
o |
Expenses related to value engineering of the one2six and future Utility product offerings |
|
· |
PTG |
|
|
o |
Expenses primarily related to development of content for our progressives for placement onto existing proprietary games such as Fortune Pai Gow Poker Progressive and Three Card Poker Progressive |
|
· |
ETS |
|
|
o |
Expenses primarily related to the development of Vegas Star Craps, a fully electronic craps game with touch screen roll-of-the-dice capability |
|
|
o |
Additional R&D efforts were spent on creating and implementing new video dealers for our Table Master platform |
|
· |
EGM |
|
|
o |
Expenses primarily related to the continued development of our PC4 platform and development of new game titles and themes |
|
|
o |
Additional R&D efforts were focused on continued commercialization of existing linked jackpot products, “Pink Panther” and “Grand Central” |
Impairment of goodwill
In October 2008, we performed our annual goodwill impairment analysis. The goodwill impairment test is a two-part test. We selected a discounted cash flows model (income approach) and the Guideline Public Company Model (market approach) to assess the fair values of our reporting units. These two methodologies
were weighted in determining a fair value. Step one of the impairment test compares the fair values of each of our reporting units to their carrying value. If the fair value is less than the carrying value for any of our reporting units, step two must be completed. Based on the step one analysis performed, we concluded the fair value was less than the net carrying value of the assets assigned to our ETS reporting unit. As such, step two of the goodwill impairment
test was performed. Step two required that we allocate the fair value of the ETS segment to all of the assets and liabilities, as if the segment was acquired in a business combination. The goodwill calculated in step two is then compared to the recorded goodwill, with an impairment charge recorded in the amount that the book value of goodwill exceeds the amount calculated in this step. Based on the step two analysis performed, we concluded that the goodwill assigned to our ETS
segment was impaired as of October 31, 2008. As such, we recorded an impairment charge related to the goodwill assigned to the ETS segment of $22,137 on our consolidated statements of operation in “Item 8. Financial Statements and Supplementary Data” included in the Annual Report on Form 10-K for fiscal 2008. No tax benefit is associated with this impairment charge. There was no such charge recorded in fiscal 2009 or 2007.
DEPRECIATION AND AMORTIZATION EXPENSES
|
Year Ended October 31, |
Percentage Change |
|||||||||||||||||||
|
2009 |
2008 |
2007 |
09 vs. 08 |
08 vs. 07 |
||||||||||||||||
|
(In thousands) |
||||||||||||||||||||
|
Gross margin: |
||||||||||||||||||||
|
Depreciation |
$ | 7,312 | $ | 5,929 | $ | 5,266 | 23.3 | % | 12.6 | % | ||||||||||
|
Amortization |
10,481 | 12,037 | 9,725 | (12.9 | %) | 23.8 | % | |||||||||||||
|
Total |
17,793 | 17,966 | 14,991 | (1.0 | %) | 19.8 | % | |||||||||||||
|
Operating expenses: |
||||||||||||||||||||
|
Depreciation |
2,632 | 2,780 | 2,833 | (5.3 | %) | (1.9 | %) | |||||||||||||
|
Amortization |
3,090 | 2,694 | 1,597 | 14.7 | % | 68.7 | % | |||||||||||||
|
Total |
5,722 | 5,474 | 4,430 | 4.5 | % | 23.6 | % | |||||||||||||
|
Total: |
||||||||||||||||||||
|
Depreciation |
9,944 | 8,709 | 8,099 | 14.2 | % | 7.5 | % | |||||||||||||
|
Amortization |
13,571 | 14,731 | 11,322 | (7.9 | %) | 30.1 | % | |||||||||||||
|
Total |
$ | 23,515 | $ | 23,440 | $ | 19,421 | 0.3 | % | 20.7 | % | ||||||||||
Depreciation expense is primarily comprised of depreciation associated with products leased and held for lease and to a lesser extent depreciation of property, plant and equipment. Amortization expense is primarily comprised of amortization associated with intellectual property, acquired developed technology and customer relationships.
Fiscal 2009 compared to Fiscal 2008
Depreciation and amortization included in gross margin decreased 100 bps in fiscal 2009 as compared to fiscal 2008. Increased depreciation in gross margin is attributable to increases in leased assets. Decreased amortization in gross margin is due to the strengthening of the U.S. dollar related to amortization
at our foreign subsidiaries. Depreciation and amortization included in operating expenses increased 4.5% in fiscal 2009 as compared to fiscal 2008. The increase relates primarily to amortization of the covenant not to compete acquired as part of the Elixir Purchase and Settlement Agreement entered into during our second quarter ended April 30, 2009, as well as additions of property, plant and equipment in the normal course of business.
Fiscal 2008 compared to Fiscal 2007
Depreciation and amortization included in gross margin increased 1,980 bps in fiscal 2008 as compared to fiscal 2007. Increased depreciation in gross margin is attributable to increases in leased assets consistent with our lease strategy. Increased amortization in gross margin relates to previously acquired intangible
assets, including 12 months of amortization related to product specific intangible assets acquired in our PGIC TGD. Depreciation and amortization included in operating expenses increased 23.6% in fiscal 2008 as compared to fiscal 2007. This increase is attributable to amortization of customer relationships and covenant not to compete related to the PGIC TGD acquisition in the fourth quarter of fiscal 2007.
The following table provides additional information regarding our non-operating expenses:
NON-OPERATING EXPENSES
Other income (expense), gain on early extinguishment of debt, net and impairment of investment
|
Year Ended October 31, |
Percentage Change |
|||||||||||||||||||
|
2009 |
2008 |
2007 |
09 vs. 08 |
08 vs. 07 |
||||||||||||||||
|
(In thousands) |
||||||||||||||||||||
|
Other income (expense) |
||||||||||||||||||||
|
Interest income |
$ | 860 | $ | 1,759 | $ | 1,644 | (51.1 | %) | 7.0 | % | ||||||||||
|
Interest expense |
(5,401 | ) | (6,630 | ) | (7,487 | ) | 18.5 | % | 11.4 | % | ||||||||||
|
Other, net |
731 | 1,261 | (4,131 | ) | (42.0 | %) | 130.5 | % | ||||||||||||
|
Total other income (expense) |
$ | (3,810 | ) | $ | (3,610 | ) | $ | (9,974 | ) | (5.5 | %) | 63.8 | % | |||||||
|
Gain on early extinguishment of debt, net |
$ | 1,961 | $ | 1,773 | $ | - | 10.6 | % | 100.0 | % | ||||||||||
|
Impairment of investment |
$ | - | $ | (1,560 | ) | $ | - | 100.0 | % | (100.0 | %) | |||||||||
Fiscal 2009 compared to Fiscal 2008
Total other income (expense) increased $200, or 5.5% in fiscal 2009 as compared to fiscal 2008, primarily due to the following:
|
· |
A decrease in interest expense of $1,229 in fiscal 2009 as compared to fiscal 2008, due to a decrease in total outstanding debt balance and reduced effective interest rates |
|
· |
Net foreign currency gains of $825 in fiscal 2009 as compared to net foreign currency gains of $3,356 in fiscal 2008. This year over year change was caused by foreign currency fluctuations, primarily between the U.S. dollar, the Australian dollar and the Euro during fiscal 2009. Our foreign subsidiaries engage in activities with us and certain customers in U.S. dollar and other foreign denominated contracts.
As of our third quarter of fiscal 2008, we made the decision to begin settling all inter-company trade balances, which has resulted in the recognition of additional foreign currency fluctuations in our consolidated statement of operations |
|
· |
Partially offset by a reduction in interest income of $899, in fiscal 2009 as compared to fiscal 2008, due to 50.8% reduction in the total amount of our investment in sales-type leases and notes receivable |
Gain on early extinguishment of debt, net relates to the following:
|
· |
Gain on early extinguishment of debt, net of $1,961 and $1,773, respectively, relate to the following: |
|
|
o |
Fiscal 2009 includes approximately $1,800 related to the PGIC / IGT agreements entered into in January 2009. See Acquisitions and Other Significant Transactions for more information |
|
|
o |
Fiscal 2008 includes a net gain realized from the early extinguishment of our Notes |
Fiscal 2008 compared to Fiscal 2007
Total other income (expense) decreased $6,364, or 63.8%, in fiscal 2008 as compared to fiscal 2007, primarily due to the following:
|
|
· |
Net foreign currency gains of $3,356 in fiscal 2008 as compared to net foreign currency losses of $1,336 in fiscal 2007. This year over year change was caused by foreign currency fluctuations, primarily between the U.S. dollar, the Australian dollar and the Euro during fiscal 2009. Our foreign subsidiaries engage in activities with us and certain customers in U.S. dollars and other foreign denominated
contracts. As of our third quarter of fiscal 2008, we began net settling all inter-company trade balances, which has resulted in the recognition of additional foreign currency fluctuations in our consolidated statement of operations |
|
|
· |
A decrease in interest expense of $857 in fiscal 2008 as compared to fiscal 2007. Interest expense in fiscal 2008 primarily related to interest on our Revolver, Term Loan and Notes. Interest expense in fiscal 2007 primarily related to interest on our Revolver and our Notes. Interest expense decreased as the outstanding balance of our Revolver and Notes decreased as well as a decrease
in the effective interest rate on the Revolver |
Gain on early extinguishment of debt, net relates to the following:
|
|
· |
A net gain of $1,773 was realized from the early extinguishment of our Notes in fiscal 2008, pursuant to the Tender Offer discussed in Note 2 in “Item 8. Financial Statements and Supplementary Data” included in this Form 10-K. The gain on the early extinguishment of our Notes was net of direct costs associated with the Tender Offer |
Impairment of investment in fiscal 2008 related to our investment in Sona Mobile Holdings Corp. (“Sona”), due to the following:
|
|
· |
During our third quarter ended July 31, 2008, we analyzed our cost method investment in Sona and, due to the severity and duration in the decline in fair value, we recorded a $1,486 impairment write-down, as we determined that the investment was other than temporarily impaired. This impairment write-down represented the difference between our historical book value and fair market value at July 31, 2008. Additionally,
we sold our investment in Sona in the fourth quarter of fiscal 2008 and recorded an additional pre-tax loss of $74 in impairment of investments, net of $65 proceeds received from the sale, for a total of $1,560, which is reflected in the consolidated statement of operations included in “Item 8. Financial Statements and Supplemental Data” in the Form 10-K for fiscal 2008. There were no such impairment losses recorded during fiscal 2007 |
INCOME TAXES
|
Year Ended October 31, |
Percentage Change |
|||||||||||||||||||
|
2009 |
2008 |
2007 |
09 vs. 08 |
08 vs. 07 |
||||||||||||||||
|
(In thousands) |
||||||||||||||||||||
|
Income tax provision (benefit) |
$ | 7,367 | $ | 6,346 | $ | (1,999 | ) | 16.1 | % | (417.5 | %) | |||||||||
|
Effective tax rate |
32.3 | % | 142.4 | % | (14.0 | %) | ||||||||||||||
Our effective income tax rate may fluctuate due to changes in our amount and mix of United States and foreign income (loss), changes in tax legislation, changes in our estimates of federal tax credits, changes in our assessment of uncertainties, as well as accumulated interest and penalties and other deductions.
Fiscal 2009 compared to Fiscal 2008
Income tax provision and the respective effective tax rate decreased for fiscal 2009 as compared to fiscal 2008, primarily due to the following:
|
|
· |
For the fiscal year ended October 31, 2008, we recognized no tax benefit on the impairment of $22,137 of goodwill. Excluding the impact of this goodwill impairment, the effective tax rate for the year ended October 31, 2008 would have been 35.9% |
|
|
· |
The decrease in the effective tax rate, excluding the impact of the goodwill impairment, in fiscal 2009 relates primarily to the derecognition of uncertain tax positions |
Fiscal 2008 compared to Fiscal 2007
Income tax provision and the respective effective tax rate increased for fiscal 2008 as compared to fiscal 2007, primarily due to the following:
|
|
· |
For the fiscal year ended October 31, 2008, we recognized no tax benefit on the impairment of $22,137 of goodwill. Excluding the impact of this goodwill impairment, the effective tax rate for the year ended October 31, 2008 would have been 35.9%. For the fiscal year ended October 31, 2007, a $6,707 decrease to income tax expense and corresponding increase to deferred tax assets were recorded to
account for additional tax basis recognized in conjunction with newly enacted Australian tax consolidation rules |
|
|
· |
The increase in the effective tax rate, excluding the goodwill impairment and Australian tax consolidation rules impact, in fiscal 2008 relates to the implementation of uncertain tax positions |
SEGMENT BUSINESS INFORMATION
Segment revenues include leasing, licensing, or selling of products within each reportable segment. We measure segment performance in terms of revenue, gross profit, gross margins and unit / seat placements. We believe that unit / seat placements is an important gauge of segment performance because it measures historical market placements
of leased and sold units / seats and provides insight into potential markets for next-generation products and service. We do not present a cumulative installed base as previously sold units / seats may no longer be in use by our customers or may have been replaced by other models or products.
We evaluate the performance of our operating segments based on net revenues, gross profit and operating income (loss). Segment operating income (loss) includes net revenues attributable to third parties and expenses directly and indirectly associated with the product lines included in each segment. Our direct expenses primarily include cost
of products sold, depreciation of leased assets, amortization of product-related intangible assets, service, manufacturing overhead, shipping and installation. Indirect expenses include other costs directly identified with each segment, such as research and development, product approval costs, product-related litigation expenses, amortization of patents and other product-related intellectual property, sales commissions and other directly-allocable sales expenses. Operating income (loss)
for each segment excludes other income and expense and certain expenses that are managed outside of the operating segments. The amounts classified as unallocated corporate expenses consist primarily of costs related to overall corporate management and support functions. These include costs related to executive management, accounting and finance, general sales support, legal and compliance costs, office expense and other amounts for which allocation to specific segments is not practicable.
SEGMENT OPERATING RESULTS
(In thousands, except units, per unit/seat amounts and product lease/sale prices)
Utility Segment Operating Results
Fiscal 2009 compared to Fiscal 2008
|
Year Ended |
||||||||||||||||
|
October 31, |
Increase |
Percentage |
||||||||||||||
|
2009 |
2008 |
(Decrease) |
Change |
|||||||||||||
|
(In thousands, except for units and per unit/seat amounts) |
||||||||||||||||
|
Utility Segment Revenue: |
||||||||||||||||
|
Lease |
$ | 30,443 | $ | 28,145 | $ | 2,298 | 8.2 | % | ||||||||
|
Sales - Shuffler |
29,301 | 37,738 | (8,437 | ) | (22.4 | ) | ||||||||||
|
Sales - Chipper |
1,500 | 3,992 | (2,492 | ) | (62.4 | ) | ||||||||||
|
Service |
6,998 | 6,718 | 280 | 4.2 | ||||||||||||
|
Other |
3,465 | 4,300 | (835 | ) | (19.4 | ) | ||||||||||
|
Total sales and service |
41,264 | 52,748 | (11,484 | ) | (21.8 | ) | ||||||||||
|
Total Utility segment revenue |
$ | 71,707 | $ | 80,893 | $ | (9,186 | ) | (11.4 | %) | |||||||
|
Utility segment gross profit |
$ | 40,513 | $ | 46,097 | $ | (5,584 | ) | (12.1 | %) | |||||||
|
Utility segment gross margin |
56.5 | % | 57.0 | % | ||||||||||||
|
Utility segment operating income |
$ | 32,742 | $ | 36,078 | $ | (3,336 | ) | (9.2 | %) | |||||||
|
Utility segment operating margin |
45.7 | % | 44.6 | % | ||||||||||||
|
Shuffler unit information: |
||||||||||||||||
|
Lease units, end of year |
5,697 | 5,318 | 379 | 7.1 | % | |||||||||||
|
Average monthly lease price |
$ | 445 | $ | 441 | $ | 4 | 1.0 | % | ||||||||
|
Sold units during the period |
1,997 | 2,624 | (627 | ) | (23.9 | %) | ||||||||||
|
Average sales price |
$ | 14,673 | $ | 14,382 | $ | 291 | 2.0 | % | ||||||||
|
Chipper unit information: |
||||||||||||||||
|
Lease units, end of year |
36 | 26 | 10 | 38.5 | % | |||||||||||
|
Sold during year |
71 | 154 | (83 | ) | (53.9 | %) | ||||||||||
|
Average sales price |
$ | 21,127 | $ | 25,922 | $ | (4,795 | ) | (18.5 | %) | |||||||
Our Utility segment revenue in fiscal 2009 decreased $9,186 as compared to fiscal year 2008, primarily due to the following:
· A 26.2% reduction in our sales revenue
|
|
o |
A reduction in shuffler and chipper sales in the European market which has experienced credit market deterioration, smoking bans and the dissolution of the Russian gaming market due to regulatory changes |
|
|
o |
Reduction in sold shuffler units in markets outside of Europe, offset by a slight increase in average sales prices |
|
|
o |
Reduction in sold Chipmaster units, which have a higher sale price than our Easy Chipper® C |
These decreases were offset by the following increases:
· An 8.2% increase in our lease revenue
|
|
o |
Increased units on lease, mostly our i-Deal and one2six shufflers due to our replacement cycle and lease strategy |
|
|
o |
Increased average monthly lease price |
Utility gross profit decreased 12.1% for fiscal 2009 as compared to fiscal 2008. Utility gross margin also decreased 50 bps, to 56.5% for fiscal 2009 as compared to fiscal 2008.
The decreases in gross profit and gross margin primarily relate to the following:
· Mix of revenue
|
|
o |
The overall reduction in sale revenue which generally generates a higher initial gross profit, but a lower gross margin |
|
· |
Non-cash charges |
|
|
o |
A 16.6% decrease in amortization expense associated with the one2six shuffler and Easy Chipper, due to foreign currency fluctuations. In local currency, amortization decreased 7.1% |
|
|
o |
A decrease in gross margin of approximately 0.4% related to lower of cost or market adjustments primarily on older generation products |
Utility operating income decreased 9.2% for fiscal 2009 as compared to fiscal 2008. However, Utility operating margin increased 110 bps to 45.7% for fiscal 2009 as compared to fiscal 2008. The decrease in operating income primarily related to the following:
· The overall reduction in sale revenue as discussed above
The increase in operating margin primarily related to the following:
· Proportionate decreases in R&D, legal and sales commission costs attributable to the Utility segment
Fiscal 2008 compared to Fiscal 2007
|
Year Ended |
||||||||||||||||
|
October 31, |
Increase |
Percentage |
||||||||||||||
|
2008 |
2007 |
(Decrease) |
Change |
|||||||||||||
|
(In thousands, except for units and per unit/seat amounts) |
||||||||||||||||
|
Utility Segment Revenue: |
||||||||||||||||
|
Lease |
$ | 28,145 | $ | 24,728 | $ | 3,417 | 13.8 | % | ||||||||
|
Sales - Shuffler |
37,738 | 42,197 | (4,459 | ) | (10.6 | ) | ||||||||||
|
Sales - Chipper |
3,992 | 2,582 | 1,410 | 54.6 | ||||||||||||
|
Service |
6,718 | 5,631 | 1,087 | 19.3 | ||||||||||||
|
Other |
4,300 | 3,319 | 981 | 29.6 | ||||||||||||
|
Total sales and service |
52,748 | 53,729 | (981 | ) | (1.8 | ) | ||||||||||
|
Total Utility segment revenue |
$ | 80,893 | $ | 78,457 | $ | 2,436 | 3.1 | % | ||||||||
|
Utility segment gross profit |
$ | 46,097 | $ | 48,086 | $ | (1,989 | ) | (4.1 | %) | |||||||
|
Utility segment gross margin |
57.0 | % | 61.3 | % | ||||||||||||
|
Utility segment operating income |
$ | 36,078 | $ | 33,783 | $ | 2,295 | 6.8 | % | ||||||||
|
Utility segment operating margin |
44.6 | % | 43.1 | % | ||||||||||||
|
Shuffler unit information: |
||||||||||||||||
|
Lease units, end of year |
5,318 | 4,986 | 332 | 6.7 | % | |||||||||||
|
Average monthly lease price |
$ | 441 | $ | 413 | $ | 28 | 6.7 | % | ||||||||
|
Sold during year |
2,624 | 3,076 | (452 | ) | (14.7 | %) | ||||||||||
|
Average sales price |
$ | 14,382 | $ | 13,718 | $ | 664 | 4.8 | % | ||||||||
|
Chipper unit information: |
||||||||||||||||
|
Lease units, end of year |
26 | 17 | 9 | 52.9 | % | |||||||||||
|
Sold during year |
154 | 101 | 53 | 52.5 | % | |||||||||||
|
Average sales price |
$ | 25,922 | $ | 25,564 | $ | 358 | 1.4 | % | ||||||||
Utility segment revenue increased $2,436 for fiscal 2008 as compared to fiscal 2007, primarily due to the following:
|
· |
A 13.8% increase in Utility lease revenue |
|
|
o |
A 6.7% increase in leased units due to our replacement cycle and lease strategy |
|
|
o |
A 6.7% increase in average monthly lease price |
|
· |
A 54.6% increase in chipper sales revenue |
|
|
o |
A net increase of 52.5% sold units |
|
|
o |
An increase in the average sales price driven primarily by increased sales of Chipmaster units, which have a higher sale price than our Easy Chipper® C |
|
· |
A 19.3% increase in service revenue |
These increases were partially offset by the following decreases:
|
· |
A decrease in the number of sold shufflers although at increased average sales prices |
|
· |
A decrease in conversion of leased shufflers to sold shufflers of 266 units from 418 units |
Utility gross profit decreased 4.1% for fiscal 2008 as compared to fiscal 2007. Utility gross margin also decreased 430 bps to 57.0% for fiscal 2008 as compared to fiscal 2007. These decreases in both gross profit and gross margin primarily related to the following:
|
· |
Introductory pricing on new products, such as our i-Deal shuffler |
|
· |
The continued reduction in leased shuffler conversions which traditionally generate higher gross margins |
|
· |
An increase in amortization expense associated with the one2six shuffler and Easy Chipper to $5,763 for fiscal 2008 as compared to $4,555 for fiscal 2007 |
Utility operating income increased 6.8% for fiscal 2008 as compared to fiscal 2007. Utility operating margin also increased 150 bps to 44.6% for fiscal 2008 as compared to fiscal 2007. These increases in both operating income and operating margin primarily related to the following:
|
· |
A reduction of approximately $1,000 in legal costs specifically related to the Utility segment |
Proprietary Table Games Segment Operating Results
Fiscal 2009 compared to Fiscal 2008
|
Year Ended |
||||||||||||||||
|
October 31, |
Increase |
Percentage |
||||||||||||||
|
2009 |
2008 |
(Decrease) |
Change |
|||||||||||||
|
(In thousands, except for units and per unit/seat amounts) |
||||||||||||||||
|
PTG segment revenue: |
||||||||||||||||
|
Royalties and leases |
$ | 34,048 | $ | 33,639 | $ | 409 | 1.2 | % | ||||||||
|
Sales |
3,581 | 4,332 | (751 | ) | (17.3 | ) | ||||||||||
|
Service |
170 | 276 | (106 | ) | (38.4 | ) | ||||||||||
|
Other |
898 | 347 | 551 | 1.6 | ||||||||||||
|
Total sales and service revenue |
4,649 | 4,955 | (306 | ) | (6.2 | ) | ||||||||||
|
Total PTG segment revenue |
$ | 38,697 | $ | 38,594 | $ | 103 | 0.3 | % | ||||||||
|
PTG segment gross profit |
$ | 32,079 | $ | 31,983 | $ | 96 | 0.3 | % | ||||||||
|
PTG segment gross margin |
82.9 | % | 82.9 | % | ||||||||||||
|
PTG segment operating income |
$ | 29,035 | $ | 28,957 | $ | 78 | 0.3 | % | ||||||||
|
PTG segment operating margin |
75.0 | % | 75.0 | % | ||||||||||||
|
PTG unit information: |
||||||||||||||||
|
Premium units, end of year |
2,241 | 2,245 | (4 | ) | (0.2 | %) | ||||||||||
|
Side bet units, end of year |
1,646 | 1,806 | (160 | ) | (8.9 | %) | ||||||||||
|
Progressive units, end of year |
359 | 137 | 222 | 162.0 | % | |||||||||||
|
Add-on units, end of year |
39 | 34 | 5 | 14.7 | % | |||||||||||
|
Total revenue generating lease base |
4,285 | 4,222 | 63 | 1.5 | % | |||||||||||
|
Average monthly lease/license price |
$ | 662 | $ | 664 | $ | (2 | ) | (0.3 | %) | |||||||
|
Sold during year |
165 | 154 | 11 | 7.1 | % | |||||||||||
|
Average sales price |
$ | 21,703 | $ | 28,130 | $ | (6,427 | ) | (22.8 | %) | |||||||
Total PTG segment revenue increased $103 for fiscal 2009 as compared to fiscal 2008. The PTG segment revenue increase was primarily due to the following:
|
· |
Increase in PTG royalty and lease revenue and other revenue |
|
|
o |
Increased placements of premium table games, specifically our Ultimate Texas Hold’em |
|
|
o |
Increased placements of add-ons, specifically Fortune Pai Gow Poker Progressive |
|
|
o |
Average monthly lease price remained relatively flat, even with increased placements of progressive units, which generally have a lower monthly average lease price than premium game titles |
|
|
o |
An increase in net revenue from our Three Card Poker World Championship Tournament, which was held in December 2008, to approximately $580 from $130 |
These increases were partially offset by the following:
|
· |
A 17.3% decrease in PTG sales revenue |
|
|
o |
A decrease in average sales price resulting from the sale of approximately 80 Royal Match 21 table game side bet lifetime licenses in 2009. Excluding this sale, our average sales price would have been approximately $38,800, an increase over 2008 driven by two large conversion sales of Three Card Poker table games in 2009 |
|
· |
A reduction of $368 related to license fees for the use of certain of our proprietary table game content on certain legalized internet gaming sites to $195 in fiscal 2009 as compared to fiscal 2008 |
|
· |
PTG gross profit and gross margin remained constant year over year |
|
· |
PTG operating income and operating margin remained constant year over year |
Fiscal 2008 compared to Fiscal 2007
|
Year Ended |
||||||||||||||||
|
October 31, |
Increase |
Percentage |
||||||||||||||
|
2008 |
2007 |
(Decrease) |
Change |
|||||||||||||
|
(In thousands, except for units and per unit/seat amounts) |
||||||||||||||||
|
PTG segment revenue: |
||||||||||||||||
|
Royalties and leases |
$ | 33,639 | $ | 25,974 | $ | 7,665 | 29.5 | % | ||||||||
|
Sales |
4,332 | 6,980 | (2,648 | ) | (37.9 | ) | ||||||||||
|
Service |
276 | 157 | 119 | 75.8 | ||||||||||||
|
Other |
347 | 14 | 333 | 2,378.6 | ||||||||||||
|
Total sales and service revenue |
4,955 | 7,151 | (2,196 | ) | (30.7 | ) | ||||||||||
|
Total PTG segment revenue |
$ | 38,594 | $ | 33,125 | $ | 5,469 | 16.5 | % | ||||||||
|
PTG segment gross profit |
$ | 31,983 | $ | 28,154 | $ | 3,829 | 13.6 | % | ||||||||
|
PTG segment gross margin |
82.9 | % | 85.0 | % | ||||||||||||
|
PTG segment operating income |
$ | 28,957 | $ | 23,465 | $ | 5,492 | 23.4 | % | ||||||||
|
PTG segment operating margin |
75.0 | % | 70.8 | % | ||||||||||||
|
PTG unit information: |
||||||||||||||||
|
Premium units, end of year |
2,245 | 2,145 | 100 | 4.7 | % | |||||||||||
|
Side bet units, end of year |
1,806 | 1,861 | (55 | ) | (3.0 | %) | ||||||||||
|
Progressive units, end of year |
137 | - | 137 | 100.0 | % | |||||||||||
|
Add-on units, end of year |
34 | 36 | (2 | ) | (5.6 | %) | ||||||||||
|
Total revenue generating lease base |
4,222 | 4,042 | 180 | 4.5 | % | |||||||||||
|
Average monthly lease/license Price |
$ | 664 | $ | 536 | $ | 128 | 24.0 | % | ||||||||
|
Sold during year |
154 | 204 | (50 | ) | (24.5 | %) | ||||||||||
|
Average sales price |
$ | 28,130 | $ | 34,216 | $ | (6,086 | ) | (17.8 | %) | |||||||
Total PTG segment revenue increased $5,469 for fiscal 2008 as compared to fiscal 2007. The PTG segment revenue increase was primarily due to the following:
|
· |
A 29.5% increase in PTG royalty and lease revenue |
|
|
o |
A $4,648 increase related to the approximate 600 unit revenue generating lease base that we acquired in connection with the purchase of PGIC’s TGD business in late fiscal 2007 |
|
|
o |
A 9.6% increase related to growth in our traditional non-PGIC table games. This primarily relates to increases of our Ultimate Texas Hold’em and Fortune Pai Gow Poker table games |
|
|
o |
An increase in the average monthly lease price |
|
|
o |
An increase of 100% in progressive units, primarily related to the increase in our Fortune Pai Gow Poker Progressive |
|
|
o |
A 15.0% increase to $563 related to license fees for the use of certain of our proprietary table game content on certain legalized internet gaming sites in fiscal 2008 as compared to fiscal 2007 |
These increases were partially offset by the following:
|
· |
A 37.9% decrease in PTG sales revenue |
|
|
o |
A net decrease of 24.5% of sold units comprised primarily of decreases of our Three Card Poker and Four Card Poker table games |
|
|
o |
A decrease in average sales price as a result of selling approximately 90 Fortune Pai Gow Poker table games in fiscal 2008 and the sale of certain lifetime licenses through an Asian distributor |
|
|
o |
A decrease of 42.9% of conversions from leased to sold table games in fiscal 2008, comprised primarily of decreases of our Three Card Poker and Four Card Poker table game conversions |
PTG gross profit increased 13.6% for fiscal 2008 as compared to fiscal 2007.
|
· |
The increase in PTG gross profit was a result of the royalty and lease revenue increases offset by the decrease in sold royalty units discussed above |
Although PTG gross profit increased, PTG gross margin decreased 210 bps to 82.9% for fiscal 2008 as compared to fiscal 2007. The increase in gross profit and decrease in gross margin were a result of the following:
|
· |
The decrease in PTG gross margin was due to a full year of amortization associated with the PGIC TGD acquired in late 2007 |
|
· |
The decrease in conversions noted above. Conversions traditionally generate higher gross margins |
PTG operating income increased 23.4% for fiscal 2008 as compared to fiscal 2007. PTG operating margin also increased 420 bps to 75.0% for fiscal 2008 as compared to fiscal 2007. These increases in both operating income and operating margin primarily related to the following:
|
· |
The increased gross profit referred to above |
|
· |
Notwithstanding the decline in gross margin referred to above, operating income and operating margin were favorably impacted by a reduction of approximately $960 of R&D and legal costs specifically related to our PTG segment |
Electronic Table Systems Segment Operating Results
Fiscal 2009 compared to Fiscal 2008
|
Year Ended |
||||||||||||||||
|
October 31, |
Increase |
Percentage |
||||||||||||||
|
2009 |
2008 |
(Decrease) |
Change |
|||||||||||||
|
(In thousands, except for units and per unit/seat amounts) |
||||||||||||||||
|
ETS segment revenue: |
||||||||||||||||
|
Royalties and leases |
$ | 11,730 | $ | 9,110 | $ | 2,620 | 28.8 | % | ||||||||
|
Sales |
8,326 | 14,911 | (6,585 | ) | (44.2 | ) | ||||||||||
|
Service |
509 | 405 | 104 | 25.7 | ||||||||||||
|
Other |
1,777 | 3,035 | (1,258 | ) | (41.4 | ) | ||||||||||
|
Total sales and service revenue |
10,612 | 18,351 | (7,739 | ) | (42.2 | ) | ||||||||||
|
Total ETS segment revenue |
$ | 22,342 | $ | 27,461 | $ | (5,119 | ) | (18.6 | %) | |||||||
|
ETS segment gross profit |
$ | 9,430 | $ | 13,068 | $ | (3,638 | ) | (27.8 | %) | |||||||
|
ETS segment gross margin |
42.2 | % | 47.6 | % | ||||||||||||
|
ETS segment operating income |
$ | 3,427 | $ | (16,105 | ) | $ | 19,532 | (121.3 | %) | |||||||
|
ETS segment operating margin |
15.3 | % | (58.6 | %) | ||||||||||||
|
ETS unit information: |
||||||||||||||||
|
Lease seats, end of year |
2,134 | 1,445 | 689 | 47.7 | % | |||||||||||
|
Average monthly lease price |
$ | 458 | $ | 525 | $ | (67 | ) | (12.8 | %) | |||||||
|
Sold during year |
440 | 740 | (300 | ) | (40.5 | %) | ||||||||||
|
Average sales price |
$ | 18,923 | $ | 20,150 | $ | (1,227 | ) | (6.1 | %) | |||||||
Total ETS segment revenue decreased $5,119 for fiscal 2009 as compared to fiscal 2008. The decrease was primarily due to the following:
|
· |
Impact of foreign exchange fluctuations |
|
|
o |
Total revenue was negatively impacted by $1,292 due to the exchange effect of a strengthening U.S. dollar. |
|
· |
A 43.7% decrease in sales and other revenue |
|
|
o |
A 80.4% decline in the number of Table Master™ sold seats consistent with our lease strategy |
|
|
o |
A decrease in the average sales price. This decrease was driven primarily by fluctuations in the exchange rate between the Australian dollar and the U.S. dollar related to our Vegas Star and Rapid Table Game products sold in Australia. The average sales price in Australian dollars remained constant from the prior year period |
|
|
o |
A 41.4% decrease in parts and other peripheral sales related to previously sold ETS seats, primarily relating to our Vegas Star products and secondarily relating to our Rapid Table Games |
Slightly offsetting these decreases was an increase in the following:
|
· |
A 28.8% increase in royalty and lease revenue |
|
|
o |
A 47.7% increase in seats on lease, driven mostly by Table Master™ seats. These leases are primarily our Royal Match 21, Three Card Poker and Bet The Set 21 proprietary games |
|
|
o |
Offset by a decrease in our average monthly lease price caused by installations of our ETS product in markets where they compete with live table games |
ETS gross profit decreased 27.8% for fiscal 2009 as compared to fiscal 2008. ETS gross margin also decreased 540 bps to 42.2% for fiscal 2009 as compared to fiscal 2008. These declines are due to the following:
|
· |
Fixed amortization |
|
|
o |
The ETS segment is burdened with substantial amounts of fixed amortization which can have a large impact on gross margin depending on total revenue. Accordingly, gross margin can vary materially from period to period. Gross margin in the current period was negatively impacted by 7.2% |
|
· |
Mix of revenue |
|
|
o |
The decreases in sales revenue as noted above |
|
|
o |
Sale of refurbished units at reduced prices and reduced margins |
|
|
o |
The decrease in other revenue, primarily parts and other peripherals, as noted above. Parts and other peripheral sales generally have a higher margin than completed units |
ETS operating income increased 121.3%, to $3,427 for fiscal 2009 as compared to ($16,105) for fiscal 2008. ETS operating margin also increased 73.9% to 15.3% for fiscal 2009 as compared to (58.6%) for fiscal 2008. These increases in both operating income and operating margin primarily related to the following:
|
· |
The $22,137 impairment of goodwill associated with our ETS segment in fiscal 2008, which did not recur in 2009 |
|
|
o |
Excluding the impact of the impairment, operating margin in 2008 would have been 22.0%. The 6.7% decrease in margin, excluding the impact of the goodwill impairment, related to the decreases in both operating income and operating margin as discussed above |
Fiscal 2008 compared to Fiscal 2007
|
Year Ended |
||||||||||||||||
|
October 31, |
Increase |
Percentage |
||||||||||||||
|
2008 |
2007 |
(Decrease) |
Change |
|||||||||||||
|
(In thousands, except for units and per unit/seat amounts) |
||||||||||||||||
|
ETS segment revenue: |
||||||||||||||||
|
Royalties and leases |
$ | 9,110 | $ | 5,691 | $ | 3,419 | 60.1 | % | ||||||||
|
Sales |
14,911 | 19,535 | (4,624 | ) | (23.7 | ) | ||||||||||
|
Service |
405 | 373 | 32 | 8.6 | ||||||||||||
|
Other |
3,035 | 2,291 | 744 | 32.5 | ||||||||||||
|
Total sales and service revenue |
18,351 | 22,199 | (3,848 | ) | (17.3 | ) | ||||||||||
|
Total ETS segment revenue |
$ | 27,461 | $ | 27,890 | $ | (429 | ) | (1.5 | %) | |||||||
|
ETS segment gross profit |
$ | 13,068 | $ | 13,891 | $ | (823 | ) | (5.9 | %) | |||||||
|
ETS segment gross margin |
47.6 | % | 49.8 | % | ||||||||||||
|
ETS segment operating income |
$ | (16,105 | ) | $ | 6,600 | $ | (22,705 | ) | (344.0 | %) | ||||||
|
ETS segment operating margin |
(58.6 | %) | 23.7 | % | ||||||||||||
|
ETS unit information: |
||||||||||||||||
|
Lease seats, end of year |
1,445 | 1,096 | 349 | 31.8 | % | |||||||||||
|
Average monthly lease price |
$ | 525 | $ | 433 | $ | 92 | 21.4 | % | ||||||||
|
Sold during year |
740 | 918 | (178 | ) | (19.4 | %) | ||||||||||
|
Average sales price |
$ | 20,150 | $ | 21,280 | $ | (1,130 | ) | (5.3 | %) | |||||||
Total ETS segment revenue decreased $429 for fiscal 2008 as compared to fiscal 2007. The decrease was primarily due to the following:
|
· |
A 23.7% decrease in ETS sales revenue |
|
|
o |
A 45.3% decrease in sold Vegas Star seats driven primarily by decreased demand for our older Vegas Star classic cabinet in Australia |
|
|
o |
A 5.3% decrease in the average sales price due to sales to a South American distributor |
This decrease was partially offset by the following:
|
· |
Impact of foreign currency fluctuations |
|
|
o |
Total revenue was favorably impacted by $1,151 due to foreign currency fluctuations between the U.S. dollar and the Australian dollar |
|
· |
A 60.1% increase in lease and royalty revenue |
|
|
o |
A 31.8% increase in seats on lease, driven mostly by Table Master™ seats. These leases are primarily our Royal Match 21, Three Card Poker and Ultimate Texas Hold’em proprietary games |
|
|
Ø |
This increase is primarily related to the five-year exclusive agreement with the Delaware State Lottery System as well as several properties in Nevada and Pennsylvania |
|
|
o |
A 21.4% increase in the average monthly lease price |
|
· |
A 32.5% increase in other revenue related to sales of parts and other peripherals related to previously sold Vegas and Rapid seats |
ETS gross profit decreased 5.9% for fiscal 2008 as compared to fiscal 2007. ETS gross margin also decreased 220 bps to 47.6% for fiscal 2008 as compared to fiscal 2007. These decreases in both gross profit and gross margin primarily related to the following:
|
· |
Increase of approximately $1,400 in depreciation associated with new leased units |
|
· |
Increased installation costs of approximately $400 on newly placed leased units |
ETS operating income decreased 344.0%, to ($16,105) for fiscal 2008 as compared to $6,600 for fiscal 2007. ETS operating margin also decreased 82.3% to (58.6%) for fiscal 2008 as compared to 23.7% for fiscal 2007. These decreases in both operating income and operating margin primarily related to the following:
|
· |
The $22,137 impairment of goodwill associated with our ETS segment, as previously referred to in the discussion of our operating expenses |
Electronic Gaming Machines Segment Operating Results
Fiscal 2009 compared to Fiscal 2008
|
Year Ended |
||||||||||||||||
|
October 31, |
Increase |
Percentage |
||||||||||||||
|
2009 |
2008 |
(Decrease) |
Change |
|||||||||||||
|
(In thousands, except for units and per unit/seat amounts) |
||||||||||||||||
|
EGM segment revenue: |
||||||||||||||||
|
Lease revenue |
$ | 45 | $ | - | $ | 45 | (100.0 | %) | ||||||||
|
Sales |
35,502 | 32,946 | 2,556 | 7.8 | ||||||||||||
|
Other |
11,051 | 9,952 | 1,099 | 11.0 | ||||||||||||
|
Total sales and service revenue |
46,553 | 42,898 | 3,655 | 8.5 | ||||||||||||
|
Total EGM segment revenue |
$ | 46,598 | $ | 42,898 | $ | 3,700 | 8.6 | % | ||||||||
|
EGM segment gross profit |
$ | 23,643 | $ | 19,662 | $ | 3,981 | 20.2 | % | ||||||||
|
EGM segment gross margin |
50.7 | % | 45.8 | % | ||||||||||||
|
EGM segment operating income |
$ | 16,529 | $ | 11,693 | $ | 4,836 | 41.4 | % | ||||||||
|
EGM segment operating margin |
35.5 | % | 27.3 | % | ||||||||||||
|
EGM unit information: |
||||||||||||||||
|
Lease seats, end of year |
17 | - | 17 | (100.0 | %) | |||||||||||
|
Sold during year |
2,741 | 2,328 | 413 | 17.7 | % | |||||||||||
|
Average sales price |
$ | 12,952 | $ | 14,152 | $ | (1,200 | ) | (8.5 | %) | |||||||
Total EGM segment revenue increased $3,700 for fiscal 2009 as compared to fiscal 2008 primarily due to the following:
|
· |
Impact of foreign currency fluctuations |
|
|
o |
Total revenue was negatively impacted by $7,362 due to foreign currency fluctuations between the U.S. dollar and the Australian dollar. Excluding the impacts of foreign currency fluctuations, revenue would have increased $11,062 |
|
· |
A 7.8% increase in sales revenue |
|
|
o |
A 17.7% increase in sold seats driven primarily by the strength of our newer titles and the success of our progressive links: Pink Panther and Grand Central |
|
|
o |
Partially offset by a decrease in average sales price, driven by fluctuations in the exchange rate between the Australian dollar and the U.S. dollar. The average sales price in Australian dollars increased approximately 4.1% over the prior year period |
|
· |
An 11.0% increase in other revenue |
|
|
o |
A 25.1% increase in parts and peripherals. The current year includes a large sale of hardware combined with software conversion kits to a single customer |
|
|
o |
Offset by a 13.9% decrease in EGM software conversion kits |
EGM gross profit increased 20.2% for fiscal 2009 as compared to fiscal 2008. EGM gross margin also increased 490 bps to 50.7% for fiscal 2009 as compared to fiscal 2008. These increases in both gross profit and gross margin primarily related to the following:
|
· |
The increases in EGM sales revenue as noted above |
|
· |
The increased amount of parts and peripheral sales which have a substantially higher margin than completed units. As noted above, the current year includes a large sale of hardware combined with software conversion kits to a single customer |
|
· |
The impact of a $662 refund of previously assessed import duties in Australia, which is not expected to have a recurring impact |
EGM operating income increased 41.4% for fiscal 2009 as compared to fiscal 2008. EGM operating margin also increased 820 bps to 35.5% for fiscal 2009 as compared to fiscal 2008. These increases in both operating income and operating margin primarily related to the following:
|
· |
The revenue increases as noted in our gross profit discussion |
|
· |
A decrease of $399 in the amount of R&D costs directly related to the EGM segment |
Fiscal 2008 compared to Fiscal 2007
|
Year Ended |
||||||||||||||||
|
October 31, |
Increase |
Percentage |
||||||||||||||
|
2008 |
2007 |
(Decrease) |
Change |
|||||||||||||
|
(In thousands, except for units and per unit/seat amounts) |
||||||||||||||||
|
EGM segment revenue: |
||||||||||||||||
|
Lease revenue |
$ | - | $ | 33 | $ | (33 | ) | (100.0 | %) | |||||||
|
Sales |
32,946 | 30,955 | 1,991 | 6.4 | ||||||||||||
|
Other |
9,952 | 8,281 | 1,671 | 20.2 | ||||||||||||
|
Total sales and service revenue |
42,898 | 39,236 | 3,662 | 9.3 | ||||||||||||
|
Total EGM segment revenue |
$ | 42,898 | $ | 39,269 | $ | 3,629 | 9.2 | % | ||||||||
|
EGM segment gross profit |
$ | 19,662 | $ | 14,027 | $ | 5,635 | 40.2 | % | ||||||||
|
EGM segment gross margin |
45.8 | % | 35.7 | % | ||||||||||||
|
EGM segment operating income |
$ | 11,693 | $ | 7,390 | $ | 4,303 | 58.2 | % | ||||||||
|
EGM segment operating margin |
27.3 | % | 18.8 | % | ||||||||||||
|
EGM unit information: |
||||||||||||||||
|
Lease seats, end of year |
- | 2 | (2 | ) | (100.0 | %) | ||||||||||
|
Sold during year |
2,328 | 2,714 | (386 | ) | (14.2 | %) | ||||||||||
|
Average monthly sales price |
$ | 14,152 | $ | 11,406 | $ | 2,746 | 24.1 | % | ||||||||
Total EGM segment revenue increased $3,629 for fiscal 2008 as compared to fiscal 2007. The increase was primarily due to the following:
|
· |
Impact of foreign currency fluctuations |
|
|
o |
Total revenue was favorably impacted by $2,771 due to foreign currency fluctuations between the U.S. dollar and the Australian dollar. |
|
· |
A 6.4% increase in sales revenue |
|
|
o |
An increase in average sales price driven by the success of our titles, linked series of games and the PC4 platform |
|
|
Ø |
The prior year included the sale of a large number of refurbished units which negatively impacted the prior years average sales price |
This increase was offset by a 14.2% decrease in the number of sold seats
|
· |
A 20.2% increase in other revenue |
|
|
o |
A 193.0% increase in sales of parts and peripherals |
|
|
o |
Offset by a decrease of 38.7% of conversion kits |
EGM gross profit increased 40.2% for fiscal 2008 as compared to fiscal 2007. EGM gross margin increased 1,010 bps to 45.8% for fiscal 2008 as compared fiscal 2007. These increases in both gross profit and gross margin primarily related to the following:
|
· |
Substantial increases in the average sales price of our EGMs as noted above |
|
· |
The increased amount of peripheral sales which have a substantially higher margin than completed units |
|
· |
Prior year margins were adversely impacted by a minimum royalty shortfall of $2,900 and inventory write-offs of $2,800 recognized at our Australian subsidiary |
EGM operating income increased 58.2% for fiscal 2008 as compared to fiscal 2007. EGM operating margin also increased 850 bps to 27.3% for fiscal 2008 as compared to fiscal 2007. These increases in both operating income and operating margin primarily related to the following:
|
· |
The revenue increases as noted in our gross profit discussion |
|
· |
Offset by an increase of $1,300 in the amount of R&D costs directly related to the EGM segment |
LIQUIDITY AND CAPITAL RESOURCES
(In thousands, except ratios and per share amounts)
Our primary historical source of liquidity and capital resources has been cash on hand, cash from operations and various forms of debt. We use cash to fund growth in our operating assets, including inventory, products leased and held for lease and sales-type leases and to fund new products through both research and development and strategic
acquisitions of businesses and intellectual property.
Our Senior Secured Credit Facility contains two financial maintenance covenants: a Total Leverage Ratio and an Interest Expense Coverage Ratio. Under the facility, we are required to maintain a Total Leverage Ratio, as defined therein, of not more than 4.0 to 1.0. Our Total Leverage Ratio as of October 31, 2009 was 1.52
to 1.0. We are also required to maintain an Interest Coverage Ratio, as defined therein, in excess of 3.0 to 1.0. Our Interest Coverage Ratio as of October 31, 2009 was 14.8 to 1.0.
Working capital
The following summarizes our cash, cash equivalents and working capital:
|
October 31, |
Increase |
Percentage |
||||||||||||||
|
2009 |
2008 |
(Decrease) |
Change |
|||||||||||||
|
(In thousands, except ratios) |
||||||||||||||||
|
Cash and cash equivalents |
$ | 7,840 | $ | 5,374 | $ | 2,466 | 45.9 | % | ||||||||
|
Working capital |
$ | 59,272 | $ | 7,739 | $ | 51,533 | 665.9 | % | ||||||||
|
Current ratio |
2.8 : 1 |
1.1 : 1 |
1.8 | |||||||||||||
The increase in working capital and our current ratio year over year primarily relates to $40,258 of our Notes being classified in current liabilities in the prior year. The classification in current liabilities was in anticipation of our Notes being put by the holders on April 15, 2009. The Notes were fully paid off during the
year ended October 31, 2009.
CASH FLOWS SUMMARY
Fiscal 2009 compared to Fiscal 2008
|
Year Ended |
||||||||||||||||
|
October 31, |
Provided |
Percentage |
||||||||||||||
|
2009 |
2008 |
(Used) |
Change |
|||||||||||||
|
(In thousands) |
||||||||||||||||
|
Operations |
$ | 40,142 | $ | 44,018 | $ | (3,876 | ) | (8.8 | %) | |||||||
|
Investing |
(9,045 | ) | (5,812 | ) | (3,233 | ) | (55.6 | %) | ||||||||
|
Financing |
(30,124 | ) | (37,256 | ) | 7,132 | 19.1 | % | |||||||||
|
Effects of exchange rates |
1,493 | 32 | 1,461 | (4,565.6 | %) | |||||||||||
|
Net Change |
$ | 2,466 | $ | 982 | $ | 1,484 | (151.1 | %) | ||||||||
Capital expenditures
We expect our capital expenditures to grow in a proportionate ratio to our revenue and/or mix of revenue, as our leasing model extends into our more capital-intensive products. Significant items included in cash flows related to capital expenditures are as follows:
|
Year ended |
||||||||||||||||
|
October 31, |
Provided |
Percentage |
||||||||||||||
|
2009 |
2008 |
(Used) |
Change |
|||||||||||||
|
(In thousands) |
||||||||||||||||
|
Payments for products leased and held for lease |
$ | (11,990 | ) | $ | (13,670 | ) | $ | 1,680 | 12.3 | % | ||||||
|
Purchases of property and equipment |
(1,150 | ) | (2,554 | ) | 1,404 | 55.0 | % | |||||||||
|
Purchases of intangible assets |
(4,493 | ) | (1,202 | ) | (3,291 | ) | (273.8 | %) | ||||||||
|
Total capital expenditures |
$ | (17,633 | ) | $ | (17,426 | ) | $ | (207 | ) | (1.2 | %) | |||||
Operations
Cash flows provided by operating activities decreased $3,876 year over year, primarily due to the following:
|
· |
An increase in cash used for inventory of $10,884, to a use of cash of ($2,304) in fiscal 2009 from $8,580 cash provided from inventory in fiscal 2008. In fiscal 2009, we experienced an increase in our inventory balance primarily related to increased demand for our ETS and shuffler products. We intend to focus our operational efforts in fiscal 2010 to optimize level of inventory to fulfill sales orders with
a focus on increasing our turnover ratio. We also intend to improve our operational efficiencies surrounding inventory management through continued value engineering of our more popular products. |
|
· |
An increase in accounts receivable of $7,376, to a use of cash of ($5,120) in fiscal 2009 from a source of cash of $2,256 in fiscal 2008. Average days sales outstanding (“DSO”) for fiscal 2009 increased to approximately 74 days from approximately 55 days in fiscal 2008 on higher receivables and lower revenues. |
|
· |
A decrease in non-cash items of $16,233, to $26,847 in fiscal 2009 from $43,080 in fiscal 2008. In fiscal 2009, non-cash items primarily consisted of depreciation and amortization, share-based compensation, amortization of debt issuance costs, gain on sales of leased assets, gain on early extinguishment of debt and write-down for inventory obsolescence. In fiscal 2008, non-cash items also included
an impairment of goodwill and an impairment related to our former equity method investment in Sona Mobile Holdings Inc. No such charges are included in fiscal 2009. |
Investing
Cash flows used for investing activities increased $3,233 in fiscal 2009 as compared to fiscal 2008, primarily due to the following:
|
· |
Increase in cash used for purchases of intangible assets of $3,291 related to the Elixir asset purchase during March 2009. |
|
· |
Cash inflows increased from the release of our $3,000 cash security, plus interest earned thereon, posted in 2004 that related to a patent infringement lawsuit with Elixir. |
|
· |
The prior year included $2,302 received from the sale of assets, primarily related to the sale of our fractional ownership in a corporate airplane. No such sales occurred in 2009. |
Financing
Cash flows used by financing activities decreased $7,132, primarily due to the following:
|
· |
In 2008, we executed a multi-step refinancing plan (the “Refinancing”) that involved a public offering of our common stock, a second amendment to our senior secured credit facility and a cash tender offer for our Notes. |
|
|
o |
We issued 20,294 shares of our common stock at $4.25 per share for net proceeds of $80,453. We offered no common stock for public sale in 2009. |
|
|
o |
We entered into a second amendment to our senior secured facility which, among other things, provided for a new $65,000 Term Loan. Net proceeds from the Term Loan were $63,438. No such amendment occurred in 2009. |
|
|
o |
We executed a Tender Offer to repurchase our Notes. Under the Tender Offer, we repurchased $89,350 in aggregate principal amount of our Notes. No such Tender Offer occurred in 2009. |
|
|
o |
We repurchased $20,384 of our Notes in separate transactions in the open market. |
|
· |
Cash provided by debt proceeds decreased by $47,100. In fiscal 2009, debt proceeds primarily related to borrowings under our Revolver. In fiscal 2008, debt proceeds related to both our Term Loan and Revolver as part of the Refinancing. Debt proceeds in fiscal 2009 include approximately $40,000 of borrowings on our Revolver used to satisfy the remaining Notes outstanding that had not been repurchased in fiscal 2008. |
|
· |
A decrease in cash used for debt repayments of $125,403, or 60.9%, to $80,420 for fiscal 2009 compared to $205,823 in fiscal 2008. For fiscal 2009, debt repayments primarily related to the repurchase of our remaining outstanding Notes, as part of the Refinancing, payments on our Revolver and payments on the remaining liability to Bet Technology, Inc. For fiscal 2008, debt payments related primarily to our
Notes, as part of the Refinancing and our Revolver. |
|
· |
Net debt, total debt less cash and cash equivalents, decreased by $34,405 to $85,730 as of October 31, 2009. |
Fiscal 2008 compared to Fiscal 2007
|
Year Ended |
||||||||||||||||
|
October 31, |
Provided |
Percentage |
||||||||||||||
|
2008 |
2007 |
(Used) |
Change |
|||||||||||||
|
(In thousands) |
||||||||||||||||
|
Operations |
$ | 44,018 | $ | 33,048 | $ | 10,970 | 33.2 | % | ||||||||
|
Investing |
(5,812 | ) | (33,119 | ) | 27,307 | 82.5 | % | |||||||||
|
Financing |
(37,256 | ) | (3,513 | ) | (33,743 | ) | (960.5 | %) | ||||||||
|
Effects of exchange rates |
32 | (930 | ) | 962 | 103.4 | % | ||||||||||
|
Net Change |
$ | 982 | $ | (4,514 | ) | $ | 5,496 | 121.8 | % | |||||||
Capital expenditures
We expect our capital expenditures to grow in a proportionate ratio to our revenue and/or mix of revenue, as our leasing model extends into our more capital-intensive products. Significant items included in cash flows related to capital expenditures are as follows:
|
Year ended |
||||||||||||||||
|
October 31, |
Provided |
Percentage |
||||||||||||||
|
2008 |
2007 |
(Used) |
Change |
|||||||||||||
|
(In thousands) |
||||||||||||||||
|
Payments for products leased and held for lease |
$ | (13,670 | ) | $ | (10,085 | ) | $ | (3,585 | ) | (35.5 | %) | |||||
|
Purchases of property and equipment |
(2,554 | ) | (2,774 | ) | 220 | 7.9 | % | |||||||||
|
Purchases of intangible assets |
(1,202 | ) | (2,397 | ) | 1,195 | 49.9 | % | |||||||||
|
Total capital expenditures |
$ | (17,426 | ) | $ | (15,256 | ) | $ | (2,170 | ) | (14.2 | %) | |||||
Operations
Cash flows provided by operating activities increased $10,970, or 33.2%, to $44,018 for fiscal 2008 as compared to $33,048 for fiscal 2007, primarily due to the following:
|
· |
Non-cash goodwill impairment charge of $22,137 in fiscal 2008 which did not exist in fiscal 2007. |
|
· |
Reductions in inventory of $8,580 in fiscal 2008 as compared to cash used for inventory of ($5,803) in fiscal 2007. |
|
· |
Increased depreciation and amortization expense of $4,019, or 20.7%, to $23,440 in fiscal 2008 as compared to $19,421 in fiscal 2007. This increase is due to the acquisition of the PGIC TGD business effective September 28, 2007, in addition to our increased leased asset base as a result of our continued emphasis on leasing versus selling. |
|
· |
Increase of $1,560 due to the impairment and ultimate sale of our investment in Sona. |
|
· |
Offset by a gain on the early extinguishment of our Notes of $1,773 for fiscal 2008 as compared to $0 in fiscal 2007. |
|
· |
Offset by a gain on the sale of our fractional ownership in the corporate airplane of $738 for fiscal 2008 as compared to $0 in fiscal 2007. See SG&A discussion in “Item 7. Management’s Discussion and Analysis of Financial Condition and Results of Operations” for more information. |
|
· |
Offset by a gain on sale of leased assets of $7,238 for fiscal 2008 as compared to $2,511 in fiscal 2007. |
Investing
Cash flows used by investing activities decreased $27,307, or 82.5%, to ($5,812) for fiscal 2008 as compared to ($33,119) in fiscal 2007 primarily due to the following:
|
· |
Proceeds received from the sale of our fractional ownership in a corporate airplane of approximately $1,309. |
|
· |
Proceeds received from the sale of leased assets of $9,247 in fiscal 2008 as compared to $4,070 in fiscal 2007. |
|
· |
Decrease in cash used in business acquisitions of $21,946, or 100%, to $0 for fiscal 2008 as compared to $21,946 in fiscal 2007. The prior year amounts relate to our acquisition of the PGIC TGD. See Note 2 in “Item 8. Financial Statements and Supplementary Data” included in this Form 10-K for more information. |
|
· |
Offset by an increase in payments for products leased and held for lease of $3,585, or 35.5%, to ($13,670) for fiscal 2008 as compared to ($10,085) in fiscal 2007. Consistent with our strategy of leasing versus selling, we expect this trend to continue. |
Financing
Cash flows used by financing activities increased $33,743, or 960.5%, to ($37,256) for fiscal 2008 as compared to ($3,513) in fiscal 2007 primarily due to the following:
|
· |
Increase in debt payments of $113,444, or 122.8%, to ($205,823) for fiscal 2008 as compared to ($92,379) in fiscal 2007. For fiscal 2008, debt payments related to our Notes and Revolver. For fiscal 2007, the debt payments primarily included payments made on our Old Credit Agreement. |
|
· |
Increase in repurchases of our common stock of $5,192, or 268.6%, to ($7,125) for fiscal 2008 as compared to ($1,933) for fiscal 2007. |
|
· |
Offset by cash received from the Offering, which resulted in total net proceeds of $80,453. See Note 2 in “Item 8. Financial Statements and Supplementary Data” included in this Form 10-K for more information. |
|
|
CONTRACTUAL OBLIGATIONS AND OFF-BALANCE SHEET ARRANGEMENTS |
Contractual Obligations. The following table summarizes our current and long-term liabilities, material obligations and commitments to make future payments under certain contracts, including current and long-term debt obligations, purchase commitments and
operating leases.
|
Total |
Less than 1 Year |
1 - 3 Years |
3 - 5 Years |
More than 5 Years |
||||||||||||||||
|
(In thousands) |
||||||||||||||||||||
|
Contractual obligations: |
||||||||||||||||||||
|
Debt |
||||||||||||||||||||
|
Term Loan (1) |
$ | 64,350 | 650 | 63,700 | - | - | ||||||||||||||
|
Interest on the Term Loan (2) |
5,469 | 2,636 | 2,833 | |||||||||||||||||
|
Senior secured revolving credit facility (the "Revolver") (3) |
28,000 | - | 28,000 | - | - | |||||||||||||||
|
Interest on the Revolver (4) |
991 | 476 | 515 | - | - | |||||||||||||||
|
Kings Gaming Inc. including imputed interest (5) |
525 | 25 | 500 | - | - | |||||||||||||||
|
Magnum Gaming (Bet the Set "21") (6) |
353 | 353 | ||||||||||||||||||
|
Other |
||||||||||||||||||||
|
Purchase commitments (7) |
9,747 | 9,747 | - | - | - | |||||||||||||||
|
Operating leases (8) |
7,259 | 2,345 | 3,707 | 902 | 305 | |||||||||||||||
|
Uncertain tax positions (9) |
1,435 | |||||||||||||||||||
|
Other (10) |
3,472 | 1,558 | 1,229 | 158 | 527 | |||||||||||||||
|
Total contractual obligations |
$ | 121,601 | $ | 17,437 | $ | 100,484 | $ | 1,060 | $ | 1,185 | ||||||||||
(1) Represents the outstanding amount on our $65,000 Term Loan, entered into on July 14, 2008, in connection with the Second Amendment to our Senior Secured Credit Facility. The Term Loan matures on November 30, 2011.
(2) Represents interest on the outstanding balance of the Term Loan.
(3) Represents the amount on our $100,000 Revolver as of October 31, 2009. The Revolver matures on November 31, 2011
(4) Represents interest on the outstanding balance, as of October 31, 2009, on the Revolver assuming no changes to such balance.
(5) Represents contingent interest payments in connection with our purchase of the Play Four Poker patent and trademark from Kings Gaming Inc.
(6) Represents contingent consideration in connection with our acquisition of Bet the Set “21”.
(7) Represents short-term open purchase orders with our vendors.
(8) Represents operating lease agreements for our Las Vegas headquarters, Australian facilities and other field service facilities.
(9) Represents the total uncertain tax positions. We are unable to determine the unrecognized tax benefits due each year.
(10) Represents other current and long term liabilities.
Off-Balance Sheet Arrangements. We do not have any material off-balance sheet arrangements with unconsolidated entities or other persons.
Impact of Inflation. To date, inflation has not had a material effect on our operations.
SELECTED QUARTERLY FINANCIAL DATA
|
Quarter Ended |
||||||||||||||||
|
January 31, |
April 30, |
July 31, |
October 31, |
|||||||||||||
|
(In thousands, except per share amounts) |
||||||||||||||||
|
2009: |
||||||||||||||||
|
Revenue |
$ | 34,489 | $ | 45,304 | $ | 45,066 | $ | 54,568 | ||||||||
|
Gross profit |
20,561 | 25,698 | 27,371 | 32,041 | ||||||||||||
|
Income (Loss) from continuing operations |
(973 | ) | 4,577 | 5,611 | 6,244 | |||||||||||
|
Net income (loss) |
(973 | ) | 4,577 | 5,611 | 6,244 | |||||||||||
|
Earnings (Loss) per share - continuing operations: |
||||||||||||||||
|
Earnings (Loss) per share, basic (a) |
(0.02 | ) | 0.09 | 0.11 | 0.12 | |||||||||||
|
Earnings (Loss) per share, diluted (a) |
(0.02 | ) | 0.09 | 0.10 | 0.12 | |||||||||||
|
2008: |
||||||||||||||||
|
Revenue |
$ | 37,897 | $ | 49,003 | $ | 49,492 | $ | 53,614 | ||||||||
|
Gross profit |
21,846 | 29,190 | 29,131 | 30,735 | ||||||||||||
|
Income (Loss) from continuing operations |
(1,803 | ) | 3,049 | 2,998 | (15,046 | ) | ||||||||||
|
Net income (loss) |
(1,803 | ) | 3,048 | 2,998 | (15,046 | ) | ||||||||||
|
Earnings (Loss) per share - continuing operations: |
||||||||||||||||
|
Earnings (Loss) per share, basic (a) |
(0.05 | ) | 0.09 | 0.08 | (0.28 | ) | ||||||||||
|
Earnings (Loss) per share, diluted (a) |
(0.05 | ) | 0.09 | 0.08 | (0.28 | ) | ||||||||||
(a) Due to the effect of the equity offering of 20,294 common shares in July 2008, the earnings (loss) per share calculation by quarter does not sum to our total annual earnings per share reported in our Consolidated Statements of Income in “Item 8. Financial Statements and Supplementary Data” included in this
Form 10-K due to the weighting of those shares for each period presented.
ITEM 7A. QUANTITATIVE AND QUALITATIVE DISCLOSURES ABOUT MARKET RISK
(In thousands)
We are exposed to market risks, which arise during the normal course of business from changes in interest rates and foreign exchange rates. A discussion of our primary market risks is presented below.
Interest rate risk. As of October 31, 2009, we had approximately $93,000 of variable rate debt. Assuming a 1% change in the average interest rate as of October 31, 2009, our annual interest cost would
change by approximately $930.
Foreign currency risk. We are exposed to foreign currency exchange rate risk inherent in our leases and sales commitments, anticipated leases and sales, anticipated purchases and assets, liabilities and debt denominated in currencies other than the U.S.
dollar. We transact business in numerous countries around the world using numerous currencies, of which the most significant to our operations for the fiscal years ended 2009, 2008 and 2007, were the Australian dollar and the Euro. We settle inter-company trade balances, which results in the recognition of foreign currency fluctuations. We expect that a significant portion of the volume of our business will continue to be denominated in foreign currencies. As such, we expect our cash flows
and earnings to continue to be exposed to the risks that may arise from fluctuations in foreign currency exchange rates.
ITEM 8. FINANCIAL STATEMENTS AND SUPPLEMENTARY DATA
INDEX TO CONSOLIDATED FINANCIAL STATEMENTS
|
|
|
Page | |
|
|
67 |
| |
|
|
68 |
| |
|
|
69 |
| |
|
|
70 |
| |
|
|
71 |
| |
|
|
73 |
| |
To the Board of Directors and Stockholders of
Shuffle Master, Inc.
Las Vegas, Nevada
We have audited the accompanying consolidated balance sheets of Shuffle Master, Inc. and subsidiaries (the “Company”) as of October 31, 2009 and 2008, and the related consolidated statements of operation, shareholders’ equity and cash flows for each of the three years in the period ended October 31, 2009. These consolidated
financial statements are the responsibility of the Company’s management. Our responsibility is to express an opinion on these consolidated financial statements based on our audits.
We conducted our audits in accordance with the standards of the Public Company Accounting Oversight Board (United States). Those standards require that we plan and perform the audit to obtain reasonable assurance about whether the financial statements are free of material misstatement. An audit includes examining, on
a test basis, evidence supporting the amounts and disclosures in the financial statements. An audit also includes assessing the accounting principles used and significant estimates made by management, as well as evaluating the overall financial statement presentation. We believe that our audits provide a reasonable basis for our opinion.
In our opinion, such consolidated financial statements present fairly, in all material respects, the financial position of Shuffle Master, Inc and subsidiaries as of October 31, 2009 and 2008, and the results of their operations and their cash flows for each of the three years in the period ended October 31, 2009, in conformity with accounting
principles generally accepted in the United States of America.
As discussed in Note 13 to the consolidated financial statements, on November 1, 2007 the Company adopted recent provisions for accounting for uncertainty in income taxes.
We have also audited, in accordance with the standards of the Public Company Accounting Oversight Board (United States), the Company's internal control over financial reporting as of October 31, 2009, based on the criteria established in Internal Control—Integrated Framework issued
by the Committee of Sponsoring Organizations of the Treadway Commission and our report dated January 14, 2010 expressed an unqualified opinion on the Company's internal control over financial reporting.
/s/ Deloitte & Touche LLP
Las Vegas, Nevada
January 14, 2010
SHUFFLE MASTER, INC.
|
Year Ended October 31, |
||||||||||||
|
2009 |
2008 |
2007 |
||||||||||
|
(In thousands, except per share amounts |
||||||||||||
|
Revenue: |
||||||||||||
|
Product leases and royalties |
$ | 76,258 | $ | 70,898 | $ | 56,426 | ||||||
|
Product sales and service |
103,113 | 118,948 | 122,315 | |||||||||
|
Other |
56 | 160 | 110 | |||||||||
|
Total revenue |
179,427 | 190,006 | 178,851 | |||||||||
|
Costs and expenses: |
||||||||||||
|
Cost of leases and royalties |
24,559 | 21,866 | 17,221 | |||||||||
|
Cost of sales and service |
49,197 | 57,238 | 57,764 | |||||||||
|
Gross profit |
105,671 | 110,902 | 103,866 | |||||||||
|
Selling, general and administrative |
63,647 | 71,350 | 61,947 | |||||||||
|
Research and development |
17,349 | 18,474 | 17,337 | |||||||||
|
Impairment of goodwill |
- | 22,137 | - | |||||||||
|
Total costs and expenses |
154,752 | 191,065 | 154,269 | |||||||||
|
Income (Loss) from operations |
24,675 | (1,059 | ) | 24,582 | ||||||||
|
Other income (expense): |
||||||||||||
|
Interest income |
860 | 1,759 | 1,644 | |||||||||
|
Interest expense |
(5,401 | ) | (6,630 | ) | (7,487 | ) | ||||||
|
Other, net |
731 | 1,261 | (4,131 | ) | ||||||||
|
Total other income (expense) |
(3,810 | ) | (3,610 | ) | (9,974 | ) | ||||||
|
Gain on early extinguishment of debt |
1,961 | 1,773 | - | |||||||||
|
Impairment of investment |
- | (1,560 | ) | - | ||||||||
|
Equity method investment loss |
- | - | (306 | ) | ||||||||
|
Income (Loss) from continuing operations before tax |
22,826 | (4,456 | ) | 14,302 | ||||||||
|
Income tax provision (benefit) |
7,367 | 6,346 | (1,999 | ) | ||||||||
|
Income (Loss) from continuing operations |
15,459 | (10,802 | ) | 16,301 | ||||||||
|
Discontinued operations, net of tax |
- | (1 | ) | 78 | ||||||||
|
Net income (loss) |
$ | 15,459 | $ | (10,803 | ) | $ | 16,379 | |||||
|
Basic earnings (loss) per share: |
||||||||||||
|
Continuing operations |
$ | 0.29 | $ | (0.27 | ) | $ | 0.47 | |||||
|
Discontinued operations |
- | - | - | |||||||||
|
Net income (loss) |
$ | 0.29 | $ | (0.27 | ) | $ | 0.47 | |||||
|
Diluted earnings (loss) per share: |
||||||||||||
|
Continuing operations |
$ | 0.29 | $ | (0.27 | ) | $ | 0.46 | |||||
|
Discontinued operations |
- | - | - | |||||||||
|
Net income (loss) |
$ | 0.29 | $ | (0.27 | ) | $ | 0.46 | |||||
|
Weighted average shares outstanding: |
||||||||||||
|
Basic |
53,120 | 40,006 | 34,680 | |||||||||
|
Diluted |
53,449 | 40,006 | 35,276 | |||||||||
See notes to consolidated financial statements
SHUFFLE MASTER, INC.
|
October 31, |
||||||||
|
2009 |
2008 |
|||||||
|
(In thousands, except per share amounts) |
||||||||
|
ASSETS |
||||||||
|
Current assets: |
||||||||
|
Cash and cash equivalents |
$ | 7,840 | $ | 5,374 | ||||
|
Accounts receivable, net of allowance for bad debts of $630 and $584 |
36,371 | 28,915 | ||||||
|
Investment in sales-type leases and notes receivable, net of allowance |
||||||||
|
for bad debts of $164 and $202 |
2,281 | 5,655 | ||||||
|
Inventories |
27,639 | 22,753 | ||||||
|
Prepaid income taxes |
5,893 | 7,459 | ||||||
|
Deferred income taxes |
6,637 | 5,318 | ||||||
|
Other current assets |
5,897 | 4,925 | ||||||
|
Total current assets |
92,558 | 80,399 | ||||||
|
Investment in sales-type leases and notes receivable, net of current portion |
1,295 | 1,961 | ||||||
|
Products leased and held for lease, net |
23,653 | 21,054 | ||||||
|
Property and equipment, net |
9,506 | 9,143 | ||||||
|
Intangible assets, net |
71,338 | 66,153 | ||||||
|
Goodwill |
74,662 | 60,929 | ||||||
|
Deferred income taxes |
9,414 | 10,013 | ||||||
|
Other assets |
3,043 | 12,294 | ||||||
|
Total assets |
$ | 285,469 | $ | 261,946 | ||||
|
LIABILITIES AND SHAREHOLDERS' EQUITY |
||||||||
|
Current liabilities: |
||||||||
|
Accounts payable |
$ | 6,336 | $ | 10,645 | ||||
|
Accrued liabilities and other current liabilities |
16,608 | 13,441 | ||||||
|
Deferred income taxes, current |
62 | - | ||||||
|
Customer deposits |
2,828 | 2,211 | ||||||
|
Deferred revenue |
6,802 | 4,610 | ||||||
|
Current portion of long-term debt |
650 | 41,753 | ||||||
|
Total current liabilities |
33,286 | 72,660 | ||||||
|
Long-term debt, net of current portion |
92,560 | 83,396 | ||||||
|
Other long-term liabilities |
3,549 | 2,659 | ||||||
|
Deferred income taxes |
- | 373 | ||||||
|
Total liabilities |
129,395 | 159,088 | ||||||
|
Commitments and Contingencies (See Note 15) |
||||||||
|
Shareholders' equity: |
||||||||
|
Common stock, $0.01 par value; 151,368 shares authorized; 53,617 and 53,535 shares issued and outstanding |
536 | 535 | ||||||
|
Additional paid-in capital |
88,977 | 83,710 | ||||||
|
Retained earnings |
42,282 | 26,823 | ||||||
|
Accumulated other comprehensive income (loss) |
24,279 | (8,210 | ) | |||||
|
Total shareholders' equity |
156,074 | 102,858 | ||||||
|
Total liabilities and shareholders' equity |
$ | 285,469 | $ | 261,946 | ||||
See notes to consolidated financial statements
SHUFFLE MASTER, INC.
|
Common Stock |
Additional Paid-in |
Retained |
Accumulated Other Comprehensive |
Total Share-holders' |
||||||||||||||||||||
|
Shares |
Amount |
Capital |
Earnings |
Income (loss) |
Equity |
|||||||||||||||||||
|
(In thousands) |
||||||||||||||||||||||||
|
Balance, October 31, 2006 |
34,895 | $ | 349 | $ | 717 | $ | 22,391 | $ | 9,092 | $ | 32,549 | |||||||||||||
|
Comprehensive Income: |
||||||||||||||||||||||||
|
Net Income |
16,379 | 16,379 | ||||||||||||||||||||||
|
Currency translation |
32,850 | 32,850 | ||||||||||||||||||||||
|
Reclassification of loss on investments |
78 | 78 | ||||||||||||||||||||||
|
Total comprehensive income |
49,307 | |||||||||||||||||||||||
|
Stock repurchased |
(77 | ) | (1 | ) | (1,962 | ) | (1,963 | ) | ||||||||||||||||
|
Options exercised |
229 | 3 | 2,544 | 2,547 | ||||||||||||||||||||
|
Shares surrendered and retired for stock option exercises |
(76 | ) | (1 | ) | (750 | ) | (751 | ) | ||||||||||||||||
|
Share-based compensation expense |
4,812 | 4,812 | ||||||||||||||||||||||
|
Tax benefit from stock option exercises |
1,133 | 1,133 | ||||||||||||||||||||||
|
Issuance of restricted stock |
227 | 2 | (2 | ) | - | |||||||||||||||||||
|
Balance, October 31, 2007 |
35,198 | $ | 352 | $ | 6,492 | $ | 38,770 | $ | 42,020 | $ | 87,634 | |||||||||||||
|
Comprehensive Income: |
||||||||||||||||||||||||
|
Net Income (loss) |
(10,803 | ) | (10,803 | ) | ||||||||||||||||||||
|
Currency translation |
(50,152 | ) | (50,152 | ) | ||||||||||||||||||||
|
Reclassification of loss on investments |
(123 | ) | (123 | ) | ||||||||||||||||||||
|
Tax on unrealized loss on investments |
45 | 45 | ||||||||||||||||||||||
|
Total comprehensive income |
(61,033 | ) | ||||||||||||||||||||||
|
Stock issued |
20,294 | 202 | 80,250 | - | - | 80,452 | ||||||||||||||||||
|
Stock repurchased |
(2,000 | ) | (20 | ) | (7,105 | ) | - | - | (7,125 | ) | ||||||||||||||
|
Shares surrendered and retired for stock option exercises |
(16 | ) | - | - | - | - | - | |||||||||||||||||
|
Share-based compensation expense |
- | - | 4,189 | - | - | 4,189 | ||||||||||||||||||
|
Tax effect from stock option exercises |
- | - | (115 | ) | - | - | (115 | ) | ||||||||||||||||
|
FIN 48 Adoption |
- | - | - | (1,144 | ) | - | (1,144 | ) | ||||||||||||||||
|
Issuance of restricted stock |
59 | 1 | (1 | ) | - | |||||||||||||||||||
|
Balance, October 31, 2008 |
53,535 | $ | 535 | $ | 83,710 | $ | 26,823 | $ | (8,210 | ) | $ | 102,858 | ||||||||||||
|
Comprehensive Income: |
||||||||||||||||||||||||
|
Net Income (loss) |
15,459 | 15,459 | ||||||||||||||||||||||
|
Currency translation |
32,489 | 32,489 | ||||||||||||||||||||||
|
Total comprehensive income |
47,948 | |||||||||||||||||||||||
|
Stock repurchased |
(25 | ) | (104 | ) | (104 | ) | ||||||||||||||||||
|
Share-based compensation expense |
6,480 | 6,480 | ||||||||||||||||||||||
|
Tax effect from stock option exercises |
(1,108 | ) | (1,108 | ) | ||||||||||||||||||||
|
Issuance of restricted stock |
119 | 1 | (1 | ) | - | |||||||||||||||||||
|
Other stock issuances (RES cancels; swaps) |
(12 | ) | - | - | ||||||||||||||||||||
|
Balance, October 31, 2009 |
53,617 | $ | 536 | $ | 88,977 | $ | 42,282 | $ | 24,279 | $ | 156,074 | |||||||||||||
See notes to consolidated financial statements
SHUFFLE MASTER, INC.
|
Year Ended October 31, |
||||||||||||
|
2009 |
2008 |
2007 |
||||||||||
|
(In thousands) |
||||||||||||
|
Cash flows from operating activities: |
||||||||||||
|
Net income (loss) |
$ | 15,459 | $ | (10,803 | ) | $ | 16,379 | |||||
|
Adjustments to reconcile net income (loss) to cash provided by operating activities: |
||||||||||||
|
Depreciation and amortization |
23,515 | 23,440 | 19,421 | |||||||||
|
Amortization of debt issuance costs |
1,158 | 1,339 | 1,327 | |||||||||
|
Gain on early extinguishment of debt |
(1,961 | ) | (1,773 | ) | - | |||||||
|
Share-based compensation |
6,480 | 4,189 | 4,812 | |||||||||
|
Equity method investment loss |
- | - | 306 | |||||||||
|
Impairment of investment |
- | 1,560 | - | |||||||||
|
Impairment of goodwill |
- | 22,137 | - | |||||||||
|
Provision for bad debts |
301 | 92 | (406 | ) | ||||||||
|
Write-down for inventory obsolescence |
1,523 | 72 | 1,415 | |||||||||
|
Loss (Gain) on sale of assets |
110 | (738 | ) | - | ||||||||
|
Gain on sale of leased assets |
(4,279 | ) | (7,238 | ) | (2,511 | ) | ||||||
|
Excess tax benefit from stock option exercises |
- | - | (854 | ) | ||||||||
|
Tax benefit from stock option exercises |
- | - | 279 | |||||||||
|
Changes in operating assets and liabilities: |
||||||||||||
|
Accounts receivable |
(5,120 | ) | 2,256 | 1,245 | ||||||||
|
Investment in sales-type leases and notes receivable |
4,067 | 7,597 | 6,801 | |||||||||
|
Inventories |
(2,304 | ) | 8,580 | (5,803 | ) | |||||||
|
Accounts payable and accrued liabilities |
(3,069 | ) | (5,639 | ) | 5,505 | |||||||
|
Customer deposits and deferred revenue |
2,149 | (1,411 | ) | (232 | ) | |||||||
|
Income taxes, net of stock option exercises |
(23 | ) | (9 | ) | (20 | ) | ||||||
|
Deferred income taxes |
260 | 2,893 | (8,315 | ) | ||||||||
|
Prepaid income taxes |
2,143 | (3,937 | ) | (2,690 | ) | |||||||
|
Other |
(267 | ) | 1,411 | (3,611 | ) | |||||||
|
Net cash provided by operating activities |
40,142 | 44,018 | 33,048 | |||||||||
|
Cash flows from investing activities: |
||||||||||||
|
Return of security bonds posted with courts |
3,050 | - | - | |||||||||
|
Proceeds from sale and maturities of investments |
- | 65 | 13 | |||||||||
|
Proceeds from sale of assets |
82 | 2,302 | - | |||||||||
|
Proceeds from sale of leased assets |
6,400 | 9,247 | 4,070 | |||||||||
|
Payments for products leased and held for lease |
(11,990 | ) | (13,670 | ) | (10,085 | ) | ||||||
|
Purchases of property and equipment |
(1,150 | ) | (2,554 | ) | (2,774 | ) | ||||||
|
Purchases of intangible assets |
(4,493 | ) | (1,202 | ) | (2,397 | ) | ||||||
|
Acquisition of businesses, net of cash acquired |
- | - | (21,946 | ) | ||||||||
|
Other |
(944 | ) | - | - | ||||||||
|
Net cash used by investing activities |
(9,045 | ) | (5,812 | ) | (33,119 | ) | ||||||
|
Cash flows from financing activities: |
||||||||||||
|
Payments on acquisition financing |
- | - | (70,000 | ) | ||||||||
|
Proceeds from Revolver |
50,400 | 32,500 | 87,680 | |||||||||
|
Payments on Revolver |
(38,400 | ) | (92,180 | ) | (12,000 | ) | ||||||
|
Payments on Contingent convertible senior notes |
(40,095 | ) | (107,969 | ) | - | |||||||
|
Payments on notes payable and other long-term debt |
(1,925 | ) | (5,674 | ) | (10,379 | ) | ||||||
|
Proceeds from other borrowings |
- | 65,000 | 1,926 | |||||||||
|
Repurchase of common stock |
- | (7,125 | ) | (1,933 | ) | |||||||
|
Proceeds from issuance of common stock, net |
- | 80,453 | 2,061 | |||||||||
|
Debt issuance costs |
- | (2,261 | ) | (1,722 | ) | |||||||
|
Excess tax benefit from stock option exercises |
- | - | 854 | |||||||||
|
Other |
(104 | ) | - | - | ||||||||
|
Net cash used by financing activities |
(30,124 | ) | (37,256 | ) | (3,513 | ) | ||||||
|
Effect of exchange rate changes on cash |
1,493 | 32 | (930 | ) | ||||||||
|
Net increase (decrease) in cash and cash equivalents |
2,466 | 982 | (4,514 | ) | ||||||||
|
Cash and cash equivalents, beginning of year |
5,374 | 4,392 | 8,906 | |||||||||
|
Cash and cash equivalents, end of year |
$ | 7,840 | $ | 5,374 | $ | 4,392 | ||||||
See notes to the consolidated financial statements
SHUFFLE MASTER, INC.
CONSOLIDATED STATEMENTS OF CASH FLOWS
Supplemental Disclosures of Cash Flows Information—
|
Year Ended October 31, |
||||||||||||
|
2009 |
2008 |
2007 |
||||||||||
|
(In thousands) |
||||||||||||
|
Non-cash Investing and Financing transactions: |
||||||||||||
|
Accrued direct acquisition costs related to acquisitions |
$ | - | $ | - | $ | 792 | ||||||
|
Note payable and contingent consideration issued in |
||||||||||||
|
connection with the acquisition of a business or assets |
- | - | 2,922 | |||||||||
|
Recharacterization of prepaid royalty |
4,667 | - | 1,750 | |||||||||
|
Cash paid for: |
||||||||||||
|
Income taxes, net of refunds |
6,417 | $ | 6,007 | $ | 8,475 | |||||||
|
Interest |
4,358 | 6,815 | 5,844 | |||||||||
See notes to consolidated financial statements
SHUFFLE MASTER, INC.
(In thousands, except per share amounts)
1. DESCRIPTION OF BUSINESS AND SUMMARY OF SIGNIFICANT ACCOUNTING POLICIES
Description of business. Unless the context indicates otherwise, references to “Shuffle Master, Inc.”, “we”, “us”, “our”, or the “Company”, includes Shuffle Master, Inc. and its consolidated subsidiaries.
We develop, manufacture and market technology and entertainment-based products for the gaming industry for placement on the casino floor. Our products primarily relate to our casino customers’ table game activities and focus on either increasing their profitability, productivity and security or expanding their gaming entertainment offerings.
Our business is segregated into the following four operating segments: Utility, Proprietary Table Games (“PTG”), Electronic Table Systems (“ETS”) and Electronic Gaming Machines (“EGM”).
Utility. Our Utility segment develops products for our casino customers that enhance table game speed, productivity, profitability and security. Utility products include automatic card shufflers and roulette chip sorters. Additionally, we have acquired
or are developing products, such as our i-Shoe™ Auto card reading shoe, that gather data and enable casinos to track table game play and our i-Score™ baccarat viewer that displays current game results and trends. These products are intended to cost-effectively provide casinos and our other customers with data on table game play for security and marketing purposes, which in turn allows them to increase
their profitability.
Proprietary Table Games. Our PTG segment develops and delivers proprietary table games that enhance our casino customers' and other licensed operators' table game operations. Products in this segment include
our proprietary table games as well as proprietary features added to public domain games such as poker, baccarat, pai gow poker and blackjack table games.
We intend to broaden our PTG content through development and acquisition. By enhancing the value of our existing proprietary table games in the marketplace with side bets, add-ons and progressives and by increasing our footprint with new titles, we hope to increase our domestic market penetration and expand further into international markets.
We also intend to expand the domestic presence of our proprietary titles on electronic platforms such as our Table Master® and i-Table™. We also plan to continue to install proprietary progressives and side bets on public domain table games in addition to our proprietary table games. Additionally, to maximize the reach of our broad intellectual property portfolio, we have licensed several
of our popular proprietary table game titles to a variety of other companies including Delta Rangers, Inc. that offer, where legal, play-for-real internet gaming. Internet gaming is not legal in the United States.
Electronic Table Systems. Our ETS segment develops and delivers various products involving popular table game content using e-Table game platforms. Our primary ETS products are the i-Table, Table Master™,
Vegas Star® and Rapid Table Games. Our i-Table platform combines an electronic betting interface with a live dealer who deals the cards from a Shuffle Master card reading shoe or shuffler which is designed to dramatically improve game speed and security while reducing many operating expenses associated with live tables. Our Table Master and Vegas Star feature a virtual dealer which enables us to offer table game content
in both traditional gaming markets and in markets where live table games are not permitted, such as racinos, video lottery and arcade markets. Our Rapid Table Games product enables the automation of certain components of traditional table games such as data collection, placement of bets, collection of losing bets and payment of winning bets combined with live dealer and game outcomes. This automation provides benefits to both casino operators and players, including greater security and faster speed of play.
Electronic Gaming Machines. Our EGM segment develops and delivers our PC-based video slot machines into select markets, primarily in Australasia. Through our Australian subsidiary, Stargames Limited (“Stargames”), we offer an extensive
selection of video slot titles which include a range of bonus round options that can be configured as a network of machines or as stand-alone units. In addition to selling the full EGM complement, we sell software conversion kits that allow existing EGM terminals to be converted to other games on the PC3 and PC4 platform. Popular titles for our EGMs include Drifting Sands™, Ninja™,
iChing™, Kelly Country™, Deep Sea Dollars™, Cuba™, Galapagos Wild™, Sunset on the Serengeti™ and
Lonesome George™, as well as the Pink Panther™ and Grand Central™ progressive links.
We lease, license and sell our products. When we lease or license our products, we generally negotiate a month-to-month operating lease. When we sell our products, we offer our customers a choice between a sale, a longer-term sales-type lease or other long-term financing. We offer our products worldwide in markets that are highly regulated.
We manufacture our products at our headquarters and manufacturing facility in Las Vegas, Nevada, as well as at our headquarters and manufacturing facility in Milperra, New South Wales, Australia. In addition, we outsource the manufacturing of certain of our sub-assemblies in the United States, Europe and Australasia.
Principles of consolidation. Our consolidated financial statements have been prepared pursuant to the rules and regulations of the Securities and Exchange Commission (“SEC”) and in accordance with accounting principles generally accepted in the United
States (“GAAP”) and include all adjustments necessary to fairly present our consolidated results of operations, financial position and cash flows for each period presented.
Our consolidated financial statements include the accounts of Shuffle Master, Inc. and our wholly-owned domestic and foreign subsidiaries. All inter-company accounts and transactions have been eliminated. We have no unconsolidated subsidiaries.
Use of estimates and assumptions. The preparation of our consolidated financial statements in conformity with GAAP requires the use of estimates and assumptions that affect the reported amounts of assets and liabilities, the disclosure of contingent assets and liabilities
at the date of the consolidated financial statements and the reported amounts of revenues and expenses during the reporting periods. Significant estimates and assumptions are used for, but not limited to: (1) the subjective and complex judgments for revenue recognition typically involve whether collectability is probable, whether fees under an arrangement are fixed or determinable and the identification of specific deliverables under multiple element arrangements. In addition, multiple element arrangements
must be analyzed to determine the relative fair value of each element, the amount of revenue to be recognized and the period and conditions under which deferred revenue should be recognized. The ability to establish vendor specific objective evidence of fair value for our products and services also requires judgment by management; (2) allowance for doubtful accounts; (3) asset impairments, including determination of the fair value of goodwill and indefinite lived trade names; (4) depreciable lives
of assets; (5) useful lives and amortization of intangible assets; (6) income tax valuation allowances and uncertain tax positions; (7) fair value of stock options; and (8) the need for contingency and litigation reserves. Future events and their effects cannot be predicted with certainty; accordingly, our accounting estimates require the exercise of judgment. The accounting estimates used in the preparation of our consolidated financial statements will change as new events occur, as more experience is acquired,
as additional information is obtained and as our operating environment changes. We evaluate and update our assumptions and estimates on an ongoing basis. Actual results could differ from those estimates.
Concentration of credit risk. Our financial instruments that have potential concentrations of credit risk include cash and cash equivalents, accounts receivable, investments in sales-type leases and notes receivable. We maintain cash balances that exceed federally
insured limits; however, we have incurred no losses on such accounts. Accounts receivable, investments in sales-type leases and notes receivable have concentration of credit risk because they all relate to our customers in the gaming industry. We grant customers credit terms for periods of 120 days or less or may grant extended credit terms, with interest at prevailing rates. The notes receivable are generally collateralized by the related equipment sold, although the value of such equipment,
if repossessed, may be less than the receivable balance outstanding and the ability to actually repossess the equipment may not always be undisputed or able to be effectively executed.
From time to time, we make significant sales to customers that exceed 10% of our then-outstanding accounts receivable balance. As of October 31, 2009 and 2008, no customer balance exceeded 10% of our net trade accounts receivable. As of October 31, 2009, one customer exceeded 10% of our net investment in sales-type lease and notes receivable.
This customer has a well-established history of payments to Shuffle Master as well as a credit rating that supports the credit line they have been extended. There was no single customer with a balance in excess of 10% of our net investment in sales-type leases and notes receivable for the year ended October 31, 2008. For the fiscal years ended 2009, 2008 and 2007, no individual customer accounted for more than 10% of consolidated revenue.
Provisions for bad debts. We maintain provisions for bad debts for estimated credit losses that result from the inability of our customers to make required payments. Provisions for bad debts are estimated based on historical experience and specific customer collection
issues. Changes in the financial condition of our customers could result in the adjustment upward or downward in the provisions for bad debts, with a corresponding impact to our operating results.
Inventories. Inventories are stated at the lower of cost, determined on a first-in-first-out basis, or market. Cost elements included in work-in-process and finished goods include raw materials, direct labor and manufacturing overhead. We regularly
review inventory quantities and update estimates for the net realizable. This process includes examining the carrying values of new and used gaming devices, parts and ancillary equipment in comparison to the current fair market values for such equipment (less costs to sell or dispose). Some of the factors involved in this analysis include the overall levels of our inventories, the current and projected sales levels for such products, the projected markets for such products, the costs required to sell the products,
including refurbishment costs and importation costs for international shipments and the overall projected demand for products once the next generation of products are scheduled for release.
As a result of our ongoing analysis of inventory, we recognized inventory write-downs of $1,523, $72 and $1,415 for fiscal years 2009, 2008 and 2007, respectively. Additional valuation charges could occur in the future as a result of changes in the factors listed above.
Products leased and held for lease. Our products are primarily leased to customers pursuant to operating leases. Products leased and held for lease are stated at cost, net of depreciation. Depreciation on leased products is calculated using the straight-line method
over the estimated useful life of three to five years. We provide maintenance of our products on lease as part of our normal lease agreements.
Property and equipment. Property and equipment is stated at cost. Depreciation is recorded using the straight-line method over the estimated useful life of the asset of three to eight years, or lease terms, if shorter, for leasehold improvements.
We also review these assets for impairment whenever events or changes in circumstances indicate that we may not be able to recover the asset's carrying amount.
Goodwill and other indefinite lived intangible assets. We review our goodwill for impairment annually in October or when circumstances indicate that the carrying amount of goodwill may not be fully recoverable. The review is performed at the reporting unit
level, which we have determined is the equivalent to our reportable segments. The goodwill impairment test is a two-part test. In the first step, we selected a discounted cash flow model (income approach) and the Guideline Public Company Model (market approach) to assess the fair values of our reporting unit. These two methodologies were equally weighted in determining fair values. The fair value of the reporting unit is then compared to the book value of the reporting unit, including
its goodwill. If the fair value is less than the book value, then we would perform a second step to compare the implied fair value of the reporting unit's goodwill to its book value. The implied fair value of the goodwill is determined based on the estimated fair value of the reporting unit less the fair value of the reporting unit's identifiable assets and liabilities. We would record an impairment charge to the extent that the book value of the reporting unit's goodwill exceeds its fair value.
We review our indefinite lived intangible assets for impairment annually in October or when circumstances indicate that the carrying amount of the tradename may not be fully recoverable. We would record an impairment loss if the carrying amount of the indefinite lived intangible asset is not recoverable and the carrying amount exceeds its
estimated fair value.
Other intangible assets. Other intangible assets include intellectual property for games, patents, trademarks, copyrights, licenses, developed technology, customer relationships and non-compete
agreements that were purchased separately or acquired in connection with a business combination. All of our significant intangible assets are definite lived and, accordingly, amortized over their expected useful lives which range from 1 to 15 years. We amortize certain of our intangible assets proportionate to the related actual revenue from the utilization of the intangible asset. We believe this method reflects the pattern in which the economic benefits of the intangible asset are consumed or otherwise used
up. For certain other intangibles, such as covenants not to compete, we amortize on a straight-line basis over their useful lives.
Impairment of long-lived assets. We estimate the useful lives of our long-lived assets, excluding goodwill and indefinite lived intangible assets, based on historical experience, estimates of products' commercial lives, the likelihood of technological obsolescence
and estimates of the duration of commercial viability for patents, licenses and games.
We review our long-lived assets, excluding goodwill and indefinite lived intangible assets, for impairment whenever events or circumstances indicate the carrying value may not be recoverable or warrant a revision to the estimated remaining useful life. We would record an impairment loss if the carrying amount of the asset or asset
group is not recoverable (as determined by undiscounted cash flows) and the carrying amount exceeds its estimated fair value. For fiscal 2009, 2008 and 2007, we did not have any such impairment loss.
Revenue recognition. We recognize revenue when the following criteria are met:
|
· |
persuasive evidence of an arrangement between us and our customer exists; |
|
· |
shipment has occurred or services have been rendered; |
|
· |
the price is fixed or determinable; and |
|
· |
collectability is reasonably assured and/or probable. |
We earn our revenue in a variety of ways. We offer our products for lease or sale as well as sell service and warranty contracts for our sold equipment.
Product lease and royalty revenue—Lease and royalty revenue is earned from the leasing of our tangible products and the licensing of our intangible products. When we lease or license our products, we generally negotiate month-to-month fixed fee contracts, or to a lesser extent,
enter into participation arrangements whereby casinos pay a fee to us based on a percentage of net win. Product lease contracts typically include parts and service. Lease terms are generally cancellable with 30 days notice.
Product sales and service revenue—We generate sales revenue through the sale of equipment in each product segment, including sales revenue from sales-type leases and the sale of lifetime licenses for our proprietary table games. Financing for intangible property and sales-type
leases for tangible property have payment terms ranging generally from 24 to 36 months and are interest-bearing at market interest rates. Revenue from the sale of equipment is recorded in accordance with the contractual shipping terms. If a customer purchases existing leased equipment, revenue is recorded on the effective date of the purchase agreement. Revenue on service and warranty contracts is recognized as the services are provided over the term of the contracts, which are generally one year. Revenue from
the sale of lifetime licenses, under which we have no continuing obligation, is recorded on the effective date of the license agreement.
Certain of our products contain software and when licensing or selling software we consider whether the software component is incidental to the product as a whole based on the following criteria:
|
· |
Whether the software is a significant focus of the marketing effort or is sold separately. |
|
· |
Whether post-contract customer support or PCS (PCS includes the right to receive services or unspecified upgrades/enhancements, or both, offered to users or resellers) is provided. |
|
· |
Whether the development and production costs of the software as a component of the cost of the product is incidental. |
|
· |
Whether an agreement includes service elements (other than PCS related services), such as training or installation and whether such services are essential to the functionality of the software or whether such software is considered “off-the-shelf” (off-the-shelf software is software that is marketed as a stock item that can be used by customers
with little or no customization). Conversely, “core software” requires significant customization of the software in order for the software to be used by the end customer. |
Some of our revenue arrangements contain multiple deliverables, such as a product sale combined with a service element or the delivery of a future product. If an arrangement requires the delivery or performance of multiple elements, we divide deliverables into separate units of accounting if:
|
· |
The delivered items have value to the customer on a stand alone basis; |
|
· |
we have objective and reliable evidence of the fair value of the undelivered items; and |
|
· |
delivery of any undelivered item is considered probable and substantially in our control. |
If these criteria are not met, we do not recognize revenue until all essential elements have been delivered. If the installation of the product is not considered inconsequential and perfunctory, then we defer revenue recognition until installation is complete.
The subjective and complex judgments for revenue recognition typically involve whether collectability is probable, whether fees under an arrangement are fixed or determinable and the identification of specific deliverables under multiple element arrangements. In addition, multiple element arrangements must be analyzed to determine the relative
fair value of each element, the amount of revenue to be recognized and the period and conditions under which deferred revenue should be recognized. The ability to establish vendor specific objective evidence of fair value for our products and services also requires judgment by management.
Income taxes. We recognize deferred tax assets, net of applicable reserves, related to net operating loss carryforwards and certain temporary differences. The standard requires recognition of a future tax benefit to the extent that realization of such benefit is more
likely than not. Otherwise, a valuation allowance is applied. Except for certain foreign net operating losses, we believe that it is more likely than not that our deferred tax assets are fully realizable because of the future reversal of existing taxable temporary differences and future projected taxable income.
In November 2007, we adopted new accounting guidance related to accounting for uncertainty in income taxes which required the recognition of uncertain tax positions taken or expected to be taken in a tax return, when it is “more likely than not” to be sustained upon examination. This assessment further presumes that tax authorities
evaluate the technical merits of transactions individually with full knowledge of all facts and circumstances surrounding the issue. See Note 13 for additional information.
Share based compensation. We measure and recognize all share-based compensation, including restricted shares and share-based awards to employees, under the fair value method. We measure the fair value of share-based awards using the Black-Scholes
model.
Compensation is attributed to the periods of associated service and such expense is recognized on a straight-line basis over the vesting period of the awards. Forfeitures are estimated at the time of grant with such estimate updated when the expected forfeiture rate changes.
In addition, the excess tax benefit from stock-option exercises—tax deductions in excess of compensation cost recognized—is classified as a financing activity in the consolidated statement of cash flows.
Contingencies. We assess our exposures to loss contingencies including legal and income tax matters and provide for an exposure if it is judged to be probable and reasonably estimable. If the actual loss from a contingency differs from our estimate, there could be
a material impact on our results of operations or financial position. Operating expenses, including legal fees, associated with contingencies are expensed when incurred.
Advertising costs. We expense advertising and promotional costs as incurred, which totaled approximately $1,882, $2,769 and $2,353, for the fiscal years ended October 31, 2009, 2008 and 2007, respectively.
Research and development costs. We incur research and development costs to develop our new and next-generation products. Our products reach technological feasibility shortly before the products are released and therefore R&D costs are generally expensed as incurred.
Foreign currency translation. Our foreign subsidiaries' asset and liability accounts are translated into U.S. dollar amounts at the exchange rate in effect at the balance sheet date. Foreign exchange translation adjustments are recorded as a separate component of
shareholders' equity. Revenue and expense accounts are translated at the average monthly exchange rates. Inter-company trade balances, which we anticipate to settle in the foreseeable future, result in foreign currency gains and losses which are included in other expenses in our consolidated statements of operations. Transaction gains and losses are included in other expense in our consolidated statements of operations.
Earnings per common share. Basic earnings per share is calculated by dividing net income by the weighted average number of common shares outstanding and issuable during the year. Diluted earnings per share is similar to basic, except that the weighted average number
of shares outstanding is increased by the potentially dilutive effect of outstanding stock options, restricted stock and contingent convertible notes, if applicable, during the year, using the treasury stock method.
Cash and cash equivalents. Cash and cash equivalents include short-term investments with maturities of three months or less from their date of purchase. We maintain cash balances that exceed federally insured limits; however, we have incurred no losses on such accounts.
Fair value measurement. Effective November 1, 2008, we adopted new fair value accounting guidance for financial assets and liabilities which defines fair value, establishes a framework for measuring fair value in GAAP, and expands disclosures about fair value measurements.
The guidance does not require any new fair value measurements, but provides guidance on how to measure fair value by providing a fair value hierarchy used to classify the source of the information. We did not elect the fair value option for any of our existing financial instruments. Accordingly, we determined the adoption of the guidance did not have a material impact on our consolidated financial statements. The guidance specifies a hierarchy of valuation techniques based on whether the inputs to those valuation
techniques are observable or unobservable. Observable inputs reflect market data obtained from independent sources, while unobservable inputs reflect our market assumptions. These two types of inputs create the following fair value hierarchy:
|
|
Level 1: |
Quoted prices for identical instruments in active markets. |
|
|
Level 2: |
Quoted prices for similar instruments in active markets; quoted prices for identical or similar instruments in markets that are not active; and model-derived valuations in which all significant inputs and significant value drivers are observable in active markets. |
|
|
Level 3: |
Valuations derived from valuation techniques in which one or more significant inputs or significant value drivers are unobservable. |
This hierarchy requires us to use observable market data, when available, and to minimize the use of unobservable inputs when determining fair value. For some products or in certain market conditions, observable inputs may not be available.
See Note 3 for further discussions of the valuations of certain of our financial instruments.
Recently issued or adopted accounting standards. In October 2009, the FASB issued two Accounting Standards Updates (“ASU”) providing new revenue recognition guidance with respect to revenue arrangements that include software elements and multiple deliverables.
Under the new guidance, tangible products, containing both software and nonsoftware components that function together to deliver a tangible product’s essential functionality, will not be subject to software revenue accounting. This new guidance also establishes a new hierarchy for allocating revenues among multiple deliverables in a multi-element arrangement. In order of preference, revenues will be allocated based on VSOE, third-party evidence, or estimated selling price. Additional disclosures will be
required to describe the effects of adoption, including changes in how arrangement consideration is allocated or in the pattern and timing of revenue recognition. This new guidance is effective for fiscal years beginning on or after June 15, 2010, and we have elected to early adopt prospectively for new or materially modified arrangements entered into on or after the beginning of our fiscal 2010. We continue to evaluate the extent to which this new guidance will impact the timing of our revenues and expect many
of the Company’s products, such as those in our ETS and EGM segments, will no longer be accounted for as software, allowing for revenue recognition earlier in certain bundled arrangements.
In June 2009, the FASB issued authoritative guidance for the FASB accounting standards codification and hierarchy of generally accepted accounting principles. The guidance establishes only two levels of GAAP, authoritative and nonauthoritative. The FASB Accounting Standards Codification (the “Codification”) will become the
source of authoritative, nongovernmental GAAP, except for rules and interpretive releases of the SEC, which are sources of authoritative GAAP for SEC registrants. All other non-grandfathered, non-SEC accounting literature not included in the Codification will become nonauthoritative. The guidance is effective for interim and annual periods ending after September 15, 2009. The adoption of the guidance did not have a material impact on our consolidated financial statements.
In May 2009, the FASB issued authoritative guidance for subsequent events, which is effective for interim and annual financial statements ending after June 15, 2009. The guidance establishes general standards of accounting for and disclosure of subsequent events that occur after the balance sheet date. Entities are also required to disclose
the date through which subsequent events have been evaluated and the basis for that date. The adoption of the guidance did not have a material impact on our consolidated financial statements. The Company has evaluated subsequent events through the date of issuance, January 14, 2010, the date these financial statements were available to be issued. See Note 16 for more information.
In June 2008, the FASB revised the authoritative guidance for determining whether an instrument (or embedded feature) is indexed to an entity’s own stock, which mandates a two-step process for evaluating whether an equity-linked financial instrument or embedded feature is indexed to the entity’s own stock. It is effective for
our fiscal year beginning November 2009. We do not believe that adoption of the guidance will have a material effect on our consolidated financial statements.
In May 2008, the FASB issued authoritative guidance, requiring the separation of liability (debt) and equity (conversion option) components for convertible debt instruments that may settle in cash upon conversion. This guidance will be effective for our fiscal year beginning in November 2009 and requires retrospective application
for all periods presented. We do not believe that adoption of the guidance will have a material effect on our consolidated financial statements.
In April 2008, the FASB issued authoritative guidance for determining the useful life of intangible assets, which amended the factors that should be considered in developing renewal or extension assumptions used to determine the useful life of a recognized intangible asset. The guidance
for determining the useful life of a recognized intangible asset shall be applied prospectively to intangible assets acquired after the effective date. However, the disclosure requirements must be applied prospectively to all intangible assets recognized in the Company’s financial statements as of the effective date. The guidance is effective for financial statements issued for fiscal years beginning after December 15, 2008, and interim periods within those fiscal years. The guidance will be
effective for our fiscal year beginning in November 2009 and will be applied prospectively to our future intangible assets acquired after the effective date. We do not believe this guidance will have a material effect on our consolidated financial statements.
In March 2008, the FASB revised authoritative guidance for disclosures about derivative instruments and hedging activities. This guidance requires disclosures about derivatives and hedging activities including enhanced disclosure about (a) how and why an entity uses derivative instruments, (b) how derivative instruments and related hedged
items are accounted and (c) how derivative instruments and related hedged items affect financial position, financial performance and cash flows. This statement is effective for years beginning after November 15, 2008. This will be effective for our fiscal year beginning in November 2009. We do not believe that adoption of the guidance will have a material effect on our consolidated financial statements.
In December 2007, the FASB revised the authoritative guidance for business combinations, which establishes principles and requirements for how the acquirer in a business combination (i) recognizes and measures in its financial statements the identifiable assets acquired, the liabilities assumed and any noncontrolling interest in the acquiree,
(ii) recognizes and measures the goodwill acquired in the business combination or a gain from a bargain purchase and (iii) determines what information to disclose to enable users of the financial statements to evaluate the nature and financial effects of the business combination. The guidance will be effective for our fiscal year beginning in November 2009 and must be applied prospectively to business combinations completed on or after that date.
2. ACQUISITIONS AND OTHER SIGNIFICANT TRANSACTIONS
Contingent convertible senior notes. In our third quarter ended July 31, 2008, we engaged in a multi-step refinancing (the “Refinancing”) of our 1.25% contingent convertible senior notes (the “Notes”). We engaged in the Refinancing because
holders of our Notes had the option to require us to repurchase all or a portion of such Notes on April 15, 2009 at 100% of the principal amount of the Notes, plus accrued and unpaid interest.
On December 10, 2008, we purchased $10,000 of our outstanding Notes in a separate open market transaction at a discount, resulting in gain on early extinguishment of debt of $163. On April 15, 2009, we purchased an additional $30,250 of our outstanding Notes at face value, representing approximately 99.97% of the aggregate principal
amount of the remaining outstanding Notes. The holders of the Notes had an option, pursuant to the terms of the Notes, to require us to purchase, on April 15, 2009, all or a portion of their Notes (the “Put Option”). All Notes validly tendered and not validly withdrawn in the Put Option were accepted for payment and purchased by us and cancelled. We made our regularly scheduled interest payment on April 15, 2009. Accordingly, there was no accrued and unpaid interest remaining through the
date of purchase. After giving effect to the purchase of the tendered Notes, $8 aggregate principal amount of the Notes remained outstanding. We redeemed these Notes pursuant to the terms of the Notes on May 29, 2009 at 100% plus accrued and unpaid interest. In order to repurchase the Notes, we drew on our $100,000 revolving credit facility (the “Revolver”).
Progressive Gaming International Corporation/International Game Technology Transaction. In January 2009, International Game Technology (“IGT”) entered into an arrangement to acquire substantially all of the assets of Progressive Gaming International Corporation
(“PGIC”). On February 17, 2009, a number of agreements were entered into between us, PGIC and IGT. These agreements include the Royalty Acceleration Agreement (PGIC and us), the Waiver Agreement (IGT and us) and the Binding Term Sheet (IGT and us). In part, these agreements addressed certain commitments that were made by us and PGIC in an agreement dated September 26, 2007 to acquire all of PGIC’s Table Game Division (“TGD”) business (the “Purchase
Agreement”), including certain worldwide rights and lease contracts for all of PGIC’s table game titles including Caribbean Stud® and Texas Hold’ Em Bonus, as well as the Software Distribution License Agreement (“SDLA”) which provided us a license to use/distribute certain progressive related software on games that were not purchased as part of the TGD. The Purchase Agreement provided for,
in addition to an initial up-front payment, future earn-out payments beginning in calendar 2008, including $3,500 in total non-interest bearing guaranteed minimum payments over a 4-year period, as follows: for each of 2008 and 2009, the guaranteed minimum amounts were $1,000 each year, paid quarterly; and for 2010 and 2011, $750 each year, also paid quarterly. At the time of the acquisition, we recorded an estimated discounted liability for the minimum consideration due under the Purchase Agreement
of $2,922. Pursuant to the SDLA and as part of the TGD, we prepaid royalties of $3,000 related to the use of the Casino Jackpot System (“CJS”) and Game Manager™ software and related table hardware (collectively, the “GMS”). These prepaid royalties plus an additional $1,750 were to be earned as defined in the agreement on a per progressive unit placement basis. The term of the SDLA
was 5 years, with automatic renewal of 5 year increments, unless a non-renewal notice was given by either party ninety days in advance.
The Royalty Acceleration Agreement dated February 17, 2009 relieved us of all future monetary obligations related to the Purchase Agreement as well as any potential additional monies due under the SDLA in excess of the prepaid royalty previously paid. As a condition for being relieved of any future monies due under the Purchase
Agreement and the SDLA, we made a final payment of $960. Up until February 17, 2009, we had paid PGIC approximately $951 related to minimum consideration due under the Purchase Agreement.
The Binding Term Sheet, which became effective March 6, 2009, absent any other agreement, resolved a dispute between us and IGT as to our rights in certain patents owned at one time by PGIC. This dispute involved other parties as well. We claimed that we had certain rights in certain patents of PGIC before IGT allegedly received
the patents as a result of the foreclosure of PGIC by Private Equity Management (“PEM”). As to some of certain patents, IGT’s alleged ownership rights were transferred to us (the “SMI Patents”). The Term Sheet also provided for IGT to obtain a license to the SMI Patents with certain restrictions in addition to allowing us to license certain patents from IGT which IGT allegedly acquired from PGIC through foreclosure by PEM (“PEM Patents”). These
licenses are not exclusive and are for limited use only. The Term Sheet also waived our claims of certain rights in other patents that were once owned by PGIC.
As a result of the above agreements, we wrote-off the net book value of approximately $160 related to the covenant not to compete between us and PGIC. In addition, the prepaid royalty related to the SDLA was re-characterized as a lifetime license to be amortized over a 10 year life. The acquired SMI Patents were fair valued at $520. The
remaining discounted minimum consideration due under the Purchase Agreement of approximately $2,247 was relieved resulting in a net gain on early extinguishment of $1,798.
Elixir Gaming Technologies Inc. (formerly VendingData Corporation) purchase and settlement agreement. On March 16, 2009, we entered into an agreement with Elixir Gaming Technologies, Inc. (“Elixir Gaming”) pursuant to which Elixir Gaming sold
us their intellectual property related to Elixir Gaming’s card shuffling and card deck checking equipment, including the RandomPlus® shuffler, the ShufflePro™ shuffler and the DeckChecker™. Also contained in the agreement is a 7-year covenant
not to compete clause. In connection with this acquisition, we also purchased Elixir Gaming’s remaining finished-goods inventory of products in this category. In addition, we also agreed with Elixir Gaming to jointly dismiss all claims with prejudice pertaining to the outstanding patent infringement litigation. This included the release of our $3,000 cash security, plus accrued interest, that we posted in 2004 in connection with an injunction that we received at that time.
The total consideration paid to Elixir Gaming was $2,800. Total direct acquisition costs associated with this acquisition was $148.
We expensed the amount which approximates the fair value of the effective settlement of the lawsuit. We determined the fair value of the effective settlement of the lawsuit by taking the difference between the fair values of each identifiable element of the transaction and the total purchase price using the residual method. The
fair value of $400 related to the effective settlement of the lawsuit was immediately charged to selling, general and administrative expenses (“SG&A”).
This transaction was accounted for as an asset purchase; no liabilities were assumed. The following table sets forth the determination of the consideration paid for the asset acquisition:
|
Effective settlement of lawsuit |
$ | 400 | ||
|
Inventory |
122 | |||
|
Patents (amortized over a 3 year period to Utility segment cost of goods sold) |
850 | |||
|
Covenant not to compete (amortized over a 7 year period to Utility segment SG&A) |
1,576 | |||
|
Total consideration |
$ | 2,948 |
3. FINANCIAL INSTRUMENTS
Fair value disclosures of financial instruments. As discussed in Note 1, we utilize a three level hierarchy that defines the assumptions used to measure certain assets and liabilities at fair value.
Cash and cash equivalents, accounts receivable, the current portion of our investment in sales-type leases and notes receivable are not presented in the table below as their carrying value approximates fair value due to their short term nature. It is impracticable to estimate the fair value of the long-term portion of our investment
in sales-type leases and notes receivable as it is comprised of many insignificant balances, customers with different credit profiles and various interest rates. The fair values of our Revolver and Term Loan have been calculated based on market borrowing rates available as of October 31, 2009 for debt with similar terms and maturities. These market assumptions include a LIBOR-based yield curve, interest rate spread based on our specific risk and an original issue discount. The following
table provides the fair value measurement information about our long-term debt as of October 31, 2009.
|
Carrying Value |
Fair Value |
Fair Value | |||||||
|
October 31, 2009 |
October 31, 2009 |
Hierarchy | |||||||
|
Term Loan |
$ | 64,350 | $ | 62,806 |
Level 2 | ||||
|
Revolver |
28,000 | 25,312 |
Level 2 | ||||||
|
Total |
$ | 92,350 | $ | 88,118 | |||||
4. RECEIVABLES AND INVESTMENTS IN SALES-TYPE LEASES
|
October 31, |
||||||||
|
2009 |
2008 |
|||||||
|
(In thousands) |
||||||||
|
Accounts receivable, net: |
||||||||
|
Trade receivables |
$ | 37,001 | $ | 29,499 | ||||
|
Less: allowance for bad debts |
(630 | ) | (584 | ) | ||||
|
Total |
$ | 36,371 | $ | 28,915 | ||||
|
October 31, |
||||||||
|
2009 |
2008 |
|||||||
|
(In thousands) |
||||||||
|
Investment in sales-type leases and notes receivable, net: |
||||||||
|
Minimum sales-type lease payments |
$ | 3,570 | $ | 5,476 | ||||
|
Notes receivable - table game licenses |
998 | 3,800 | ||||||
|
Sub-total sales-type leases and notes receivable |
4,568 | 9,276 | ||||||
|
Less: interest sales-type leases |
(321 | ) | (626 | ) | ||||
|
Less: deferred service revenue |
(507 | ) | (832 | ) | ||||
|
Less: allowance for bad debts |
(164 | ) | (202 | ) | ||||
|
Investment in sales-type leases and notes receivable, net |
3,576 | 7,616 | ||||||
|
Less: current portion sales-type leases |
(1,466 | ) | (2,995 | ) | ||||
|
Less: current portion notes receivable - table game licenses |
(815 | ) | (2,660 | ) | ||||
|
Long-term portion investment in sales-type leases and notes receivable |
$ | 1,295 | $ | 1,961 | ||||
We maintain allowances for bad debts for estimated credit losses that result from the inability of our customers to make required payments. The allowances for bad debts are estimated based on historical experience and specific customer collection issues.
Sales-type leases are interest-bearing at fixed market interest rates, require monthly installment payments over periods ranging generally from 24 to 36 months and contain bargain purchase options. Notes receivable include financing arrangements for sales of our intellectual property products. Amounts are interest-bearing at fixed market
interest rates and require monthly installments ranging generally from 24 to 36 months.
Future minimum lease payments (principal, deferred revenue and interest) to be received for both sales-type leases and notes receivable are as follows:
|
October 31, |
2010 |
2011 |
2012 |
Total |
||||||||||||
|
(In thousands) |
||||||||||||||||
|
Investment in sales-type leases |
||||||||||||||||
|
and notes receivable, net: |
||||||||||||||||
|
Future sales-type lease payments |
$ | 2,031 | $ | 1,113 | $ | 426 | $ | 3,570 | ||||||||
|
Notes receivable - table game licenses |
874 | 123 | 1 | 998 | ||||||||||||
|
Sub-total sales-type leases and notes receivable |
2,905 | 1,236 | 427 | 4,568 | ||||||||||||
|
Less: interest sales-type leases |
(242 | ) | (66 | ) | (13 | ) | (321 | ) | ||||||||
|
Less: deferred service revenue |
(277 | ) | (160 | ) | (70 | ) | (507 | ) | ||||||||
|
Less: allowance for bad debts |
(105 | ) | (45 | ) | (14 | ) | (164 | ) | ||||||||
|
Investment in sales-type leases and notes receivable, net |
$ | 2,281 | $ | 965 | $ | 330 | $ | 3,576 | ||||||||
5. OTHER BALANCE SHEET DATA
The following provides additional disclosure for selected balance sheet accounts as of October 31:
|
October 31, |
||||||||
|
2009 |
2008 |
|||||||
|
(In thousands) |
||||||||
|
Inventories: |
||||||||
|
Raw materials and component parts |
$ | 13,668 | $ | 16,649 | ||||
|
Work-in-process |
4,353 | 710 | ||||||
|
Finished goods |
9,618 | 5,394 | ||||||
|
Total |
$ | 27,639 | $ | 22,753 | ||||
|
October 31, |
||||||||
|
2009 |
2008 |
|||||||
|
(In thousands) |
||||||||
|
Products leased and held for lease: |
||||||||
|
Utility |
$ | 32,828 | $ | 30,014 | ||||
|
Less: accumulated depreciation |
(23,649 | ) | (21,456 | ) | ||||
|
Utility, net |
9,179 | 8,558 | ||||||
|
Proprietary Table Games |
2,706 | 2,658 | ||||||
|
Less: accumulated depreciation |
(1,498 | ) | (1,117 | ) | ||||
|
Proprietary Table Games, net |
1,208 | 1,541 | ||||||
|
Electronic Table Systems |
22,258 | 16,420 | ||||||
|
Less: accumulated depreciation |
(8,992 | ) | (5,465 | ) | ||||
|
Electronic Table Systems, net |
13,266 | 10,955 | ||||||
|
Total, net |
$ | 23,653 | $ | 21,054 | ||||
|
October 31, |
||||||||
|
2009 |
2008 |
|||||||
|
(In thousands) |
||||||||
|
Property and equipment: |
||||||||
|
Office furniture and computer equipment |
$ | 9,492 | $ | 7,612 | ||||
|
Less: accumulated depreciation |
(6,772 | ) | (5,051 | ) | ||||
|
Property and equipment, net |
2,720 | 2,561 | ||||||
|
Leasehold improvements: |
4,751 | 5,878 | ||||||
|
Less: accumulated depreciation |
(3,704 | ) | (3,308 | ) | ||||
|
Leasehold Improvements, net |
1,047 | 2,570 | ||||||
|
Production equipment and other: |
11,219 | 8,230 | ||||||
|
Less: accumulated depreciation |
(5,480 | ) | (4,218 | ) | ||||
|
Production equipment and other, net |
5,739 | 4,012 | ||||||
|
Total, net |
$ | 9,506 | $ | 9,143 | ||||
|
October 31, |
||||||||
|
2009 |
2008 |
|||||||
|
(In thousands) |
||||||||
|
Other current assets: |
||||||||
|
Prepaid legal fees |
$ | - | $ | 1,358 | ||||
|
Deferred cost of goods sold |
2,118 | 1,248 | ||||||
|
Other prepaid expenses |
1,956 | 1,552 | ||||||
|
Other receivables |
1,631 | 670 | ||||||
|
Other |
192 | 97 | ||||||
|
Total |
$ | 5,897 | $ | 4,925 | ||||
As of October 31, 2009 and 2008, other receivables consisted primarily of tax receivables.
|
October 31, |
||||||||
|
2009 |
2008 |
|||||||
|
(In thousands) |
||||||||
|
Other long-term assets: |
||||||||
|
PGIC TGD prepaid royalty (see Note 2) |
$ | - | $ | 4,709 | ||||
|
Deposits |
259 | 3,628 | ||||||
|
Debt issuance costs, net |
2,160 | 3,319 | ||||||
|
Other |
624 | 638 | ||||||
|
Total |
$ | 3,043 | $ | 12,294 | ||||
Total debt issuance costs incurred with the issuance of long-term debt are capitalized and amortized as interest expense using the straight-line method which approximates the effective interest method. Amortization of debt issuance costs were $1,158, $1,339 and $1,327 in fiscal 2009, 2008 and 2007, respectively. The unamortized
portion of the debt issuance costs are expected to be recognized over a period of 2.0 years. As of October 31, 2009, debt issuance costs related to the refinancing of our Revolver and our Term Loan. As of October 31, 2008, debt issuance costs related to the refinancing of our Notes, our Revolver and our Term Loan.
Deposits are primarily comprised of a $246 security deposit related to various operating leases.
Other long term assets of $624 and $638 as of October 31, 2009 and 2008, respectively, principally includes, $506 and $532, respectively, of restricted cash related to the Kings Gaming Inc. contingent consideration in connection with the purchase of the Play Four Poker™ patent
and trademark. See Note 7 for more information related to Kings Gaming contingent consideration. Additionally, other long term assets include $52 and $42, as of October 31, 2009 and 2008, respectively, of prepaid licensing costs.
|
October 31, |
||||||||
|
2009 |
2008 |
|||||||
|
(In thousands) |
||||||||
|
Accrued liabilities and other current liabilities: |
||||||||
|
Accrued interest |
$ | 155 | $ | 340 | ||||
|
Accrued compensation |
10,137 | 8,012 | ||||||
|
Accrued taxes |
2,083 | 2,318 | ||||||
|
Other accrued liabilities |
4,233 | 2,771 | ||||||
|
Total |
$ | 16,608 | $ | 13,441 | ||||
As of October 31, 2009 and 2008, other accrued liabilities consisted primarily of professional fees, legal fees and consulting fees.
6. INTANGIBLE ASSETS AND GOODWILL
Amortizable intangible assets. All of our recorded intangible assets, excluding goodwill and the Stargames and CARD tradenames, are subject to amortization. We amortize certain of our intangible assets proportionate to the related actual revenue from the
utilization of the intangible asset. We believe this method reflects the pattern in which the economic benefits of the intangible asset are consumed or otherwise used up. For certain other intangibles, such as covenants not to compete, we amortize on a straight-line basis over their useful lives. Amortization expense was $13,571, $14,731and $11,322 for fiscal 2009, 2008 and 2007, respectively. Amortizable intangible expenses are included in cost of leases and royalties and cost of sales and service, except for
customer relationships which are amortized in selling, general and administrative expenses.
Amortizable intangible assets are comprised of the following as of October 31:
|
Weighted Average |
October 31, |
||||||||
|
Useful Life |
2009 |
2008 |
|||||||
|
(In thousands) |
|||||||||
|
Amortizable intangible assets: |
|||||||||
|
Patents, games and products |
10 years |
$ | 65,345 | $ | 60,478 | ||||
|
Less: accumulated amortization |
(42,697 | ) | (30,839 | ) | |||||
| 22,648 | 29,639 | ||||||||
|
Customer relationships |
10 years |
23,290 | 19,497 | ||||||
|
Less: accumulated amortization |
(6,704 | ) | (3,592 | ) | |||||
| 16,586 | 15,905 | ||||||||
|
Licenses and other |
6 years |
12,722 | 4,392 | ||||||
|
Less: accumulated amortization |
(2,934 | ) | (2,189 | ) | |||||
| 9,788 | 2,203 | ||||||||
|
Developed technology |
4 years |
9,934 | 7,318 | ||||||
|
Less: accumulated amortization |
(9,313 | ) | (5,031 | ) | |||||
| 621 | 2,287 | ||||||||
|
Total |
$ | 49,643 | $ | 50,034 | |||||
Changes in gross balances relate primarily to foreign currency translation adjustments.
Estimated amortization expense related to recorded finite lived intangible assets is as follows:
|
Year ending October 31, |
(In thousands) |
|||
|
2010 |
$ | 11,743 | ||
|
2011 |
9,105 | |||
|
2012 |
7,600 | |||
|
2013 |
5,213 | |||
|
2014 |
8,179 | |||
|
Thereafter |
7,803 | |||
| $ | 49,643 | |||
Tradenames. Intangibles with an indefinite life, consisting of the Stargames and CARD tradenames, are not amortized and were $21,695 and $16,119 as of October 31, 2009 and 2008, respectively. However, the Stargames and CARD tradenames are subject
to an annual impairment analysis. The changes in balances are only related to foreign currency translation adjustments.
In October 2009, we performed our annual impairment analysis of our indefinite lived Stargames and CARD tradenames. We utilized the income approach valuation technique to estimate the fair values of the Stargames and CARD tradenames and compared those estimates to related carrying values. The fair values of the tradenames were
derived based upon discounted future cash flows dependent on a number of critical management assumptions including estimates of revenue growth, expected economic asset life and hypothetical royalty and discount rates. As of October 31, 2009 and 2008, based upon the results of the analysis, we determined that the implied fair values of the Stargames and CARD tradenames exceeded their carrying values and were not impaired.
Goodwill. All of our goodwill originated from the acquisitions of foreign subsidiaries and the PGIC TGD. Goodwill has been assigned to our Utility, PTG, ETS and EGM reporting segments. Changes in the carrying amount of goodwill as of October
31, 2009, are as follows:
|
Proprietary |
Electronic |
Electronic |
||||||||||||||||||
|
Utility |
Table Games |
Table Systems |
Gaming Machines |
Total |
||||||||||||||||
|
(In thousands) |
||||||||||||||||||||
|
Balance at October 31, 2008 |
$ | 37,194 | $ | 7,373 | $ | 8,200 | $ | 8,162 | $ | 60,929 | ||||||||||
|
Foreign currency translation adjustment |
6,941 | - | 2,931 | 2,917 | 12,789 | |||||||||||||||
|
Other |
- | 944 | - | - | 944 | |||||||||||||||
|
Balance at October 31, 2009 |
$ | 44,135 | $ | 8,317 | $ | 11,131 | $ | 11,079 | $ | 74,662 | ||||||||||
We performed our annual goodwill impairment analysis in October 2009. For purposes of testing goodwill, we performed step one of the goodwill impairment test by estimating the fair value of each of our segments to which goodwill is allocated. We selected a discounted cash flows model (income approach) and the Guideline
Public Company Model (market approach) to assess the fair value of our segments. These two methodologies were equally weighted in determining the fair values. The market approach is a valuation technique in which fair value is estimated based on observed prices in actual transactions and on asking prices for similar assets. This valuation process is essentially that of comparison and correlation between the subject asset and other similar assets. The income approach is a technique in which fair value
is estimated based on the discounted cash flows that an asset could be expected to generate over its useful life, including residual value cash flows. These cash flows are discounted to their present value equivalents using a rate of return that accounts for the relative risk of not realizing the estimated annual cash flows and for the time value of money. We determined the fair value of each of our reporting units exceeded their respective carrying values. As such, no impairment charge was recorded.
Impairment assessment inherently involves judgment as to assumptions about expected future cash flows and the impact of market conditions on those assumptions. Future events and changing market conditions may impact our assumptions as to prices, costs, growth rates or other factors that may result in changes in our estimates of future cash
flows. Although we believe the assumptions used in testing for impairment are reasonable, significant changes in any one of our assumptions could produce a significantly different result.
The $944 of additional goodwill in our PTG segment relates to our acquisition of certain assets from Bet Technology, Inc. (“BTI”) in 2004. In 2004, we recorded an initial estimated liability of $7,616 for contingent installment payments computed as the excess fair value of the acquired assets over the fixed installments and other direct costs. During fiscal 2009, we paid amounts in excess of the remaining liability associated with the contingent consideration originally recorded as part of the acquisition. The excess amount of $944 was recorded as an increase to goodwill.
7. DEBT
Debt consisted of the following:
|
October 31, |
||||||||
|
2009 |
2008 |
|||||||
|
(In thousands) |
||||||||
|
Term Loan |
$ | 64,350 | $ | 65,000 | ||||
|
Contingent convertible senior notes (the "Notes"), fixed rate interest at 1.25%, due 2024 |
- | 40,258 | ||||||
|
Senior secured revolving credit facility (the "Revolver") |
28,000 | 16,000 | ||||||
|
PGIC TGD minimum consideration, non-interest bearing, due in installments through 2011 |
- | 2,444 | ||||||
|
BTI acquisition contingent consideration |
- | 527 | ||||||
|
Kings Gaming Inc. contingent consideration |
506 | 508 | ||||||
|
Bet the Set "21" contingent consideration |
354 | 412 | ||||||
|
Total debt |
93,210 | 125,149 | ||||||
|
Less: current portion |
(650 | ) | (41,753 | ) | ||||
|
Total long-term debt |
$ | 92,560 | $ | 83,396 | ||||
Contingent convertible senior notes. In April 2004, we issued $150,000 in contingent convertible senior notes due 2024 through a private placement under Rule 144A of the Securities Act of 1933 (the “Notes”). The Notes were unsecured and bore interest
at a fixed rate of 1.25% per annum. Interest was payable semi-annually in arrears on April 15 and October 15 of each year, beginning October 15, 2004. The Notes were fully paid off during the third quarter of 2009.
In anticipation of our Notes being put by the holders on April 15, 2009, we executed a multi-step refinancing plan in fiscal 2008 that involved a second amendment to our senior secured credit facility, a public offering of our common stock and a cash tender offer for our Notes. The balance of this liability as of October 31, 2009 and 2008
was $0 and $40,258, respectively.
Senior Secured Credit Facility
Revolver. On November 30, 2006, we entered into a senior secured credit facility (the “Senior Secured Credit Facility”) with Deutsche Bank Trust Company Americas, as a Lender and as the Administrative Agent, Deutsche Bank Securities Inc. and Wells Fargo
Bank, N.A., as Joint Lead Arrangers and Book Managers and Wells Fargo Bank, N.A. as Syndication Agent. The Senior Secured Credit Facility consisted of a $100,000 revolving credit facility (the “Revolver”), from which we initially drew $71,180 in order to repay in its entirety a bridge loan originally entered into on January 25, 2006 (the “Old Credit Agreement”). Loans under the Revolver bear interest at a margin over LIBOR or Base Rate, as elected by us. The applicable margins fluctuate
based on our total leverage ratio from time to time. Our effective interest rates as of October 31, 2009 and 2008 were 4.8% and 6.5%, respectively. Borrowings under the Revolver may be used to repurchase the remaining outstanding Notes, for working capital, capital expenditures and general corporate purposes (including share repurchases).
The amount drawn under the Revolver was $28,000 and $16,000 as of October 31, 2009 and 2008, respectively. As of October 31, 2009, we had approximately $72,000 of available remaining credit under the Revolver. The Revolver matures on November 30, 2011.
Second Amendment and Term Loan. On July 14, 2008, we entered into a second amendment (the “Second Amendment”), to our Senior Secured Credit Facility. Among other things, the Second
Amendment provided for a new $65,000 term loan facility (the “Term Loan”), which was funded in full on August 25, 2008, resulting in net proceeds of $63,438. The amendment left in place our $100,000 Revolver discussed above. In addition to the Term Loan and Revolver, our amended Senior Secured Credit Facility provides a $35,000 incremental facility (the “Incremental Facility”) pursuant to which we may request (but no lender is committed to provide) additional loans under the
facility, subject to customary conditions.
The Term Loan bears interest at 2.75% over the Base Rate or 3.75% over LIBOR, as elected by us. The Term Loan has scheduled amortization payments of 0.25% of the principal every quarter starting with the quarter ending on January 31, 2009. The mandatory prepayment provisions also requires us to prepay the Term Loan (i)
up to 75% of our domestic excess cash flow (as defined) or up to 50% of our worldwide excess cash flow (as defined), whichever is less (with step-downs based on total leverage) (the “Excess Cash Flow Payment”); (ii) 100% of the proceeds of certain issuances of debt; and (iii) the proceeds of asset sales or recovery events in excess of $1,500, to the extent not reinvested. The scheduled amortization payments of 0.25% of the principal every quarter are classified as current portion of long term debt
as they are intended to be satisfied with cash on hand. The Excess Cash Flow Payment is intended to be satisfied through borrowings on our Revolver and has been classified under long term debt. The Term Loan matures on November 30, 2011.
Covenants. Our Senior Secured Credit Facility contains two financial maintenance covenants requiring us to maintain a Total Leverage Ratio, as defined therein, of not more than 4.0 to 1.0 and an Interest Coverage Ratio, as defined therein, of at least 3.0 to 1.0. The
Total Leverage Ratio threshold stepped down to 4.0 to 1.0 starting with the quarter ended July 31, 2009 and will step down to 3.75 to 1.0 in the quarter ending July 31, 2010. Our Total Leverage Ratio as of October 31, 2009 and 2008 was 1.52 to 1.0 and 2.3 to 1.0, respectively, and our Interest Coverage Ratio as of October 31, 2009 and 2008 was 14.8 to 1.0 and 8.3 to 1.0, respectively.
The Senior Secured Credit Facility also contains customary affirmative and negative covenants for transactions of this nature, including but not limited to restrictions and limitations on the following:
|
· |
Acquisitions; |
|
· |
Incurrence of indebtedness; |
|
· |
Granting or incurrence of liens; |
|
· |
Dividends and other distributions in respect of our equity securities; |
|
· |
Investments; |
|
· |
Sales of assets; |
|
· |
Transactions with affiliates; |
|
· |
Mergers; and |
|
· |
Agreements to restrict dividends and other payments from subsidiaries. |
Guarantors and collateral. The Revolver and Term Loan obligations under our Senior Secured Credit Facility are guaranteed by each existing and future wholly-owned domestic subsidiary of ours that is not an immaterial
subsidiary and are secured by a first priority lien on substantially all of our and our guarantors’ assets. If loans are ever made pursuant to our Incremental Facility, such loans would share such collateral equally and ratably with our Term Loan and Revolver.
PGIC TGD minimum consideration. In connection with our acquisition of PGIC’s worldwide TGD on September 26, 2007, we recorded minimum consideration of $3,500 due in non-interest bearing quarterly installments through December 2011. The minimum consideration
consisted of quarterly payments for each calendar year beginning in 2008 through 2011. The annual minimum consideration amount to be paid in 2009 was $1,000 and the annual minimum consideration amounts to be paid in 2010 and 2011 were $750 each year. The balance of this liability as of October 31, 2008 was $2,444, which represented the discounted present value of the future payments, excluding imputed interest of approximately $306. As of October 31, 2009, the balance of this liability was
$0 as a result of the PGIC/IGT transaction entered into during February 2009. This liability was satisfied in full for $960 during February 2009, resulting in a net gain on the early extinguishment of debt of $1,798.
Bet Technology Inc. (“BTI”) liabilities. In connection with our acquisition of certain assets from BTI in February 2004, we recorded an initial estimated liability of $7,616 for contingent installment payments computed as the excess fair value of
the acquired assets over the fixed installments and other direct costs. In November 2004, we began paying monthly note installments based on a percentage of certain revenue from BTI games for a period of up to ten years, not to exceed $12,000. The remaining principal and interest payment of $98 related to our initial estimated liability of $7,616 was paid in February 2009 and therefore no outstanding balance existed as of October 31, 2009. As of October 31, 2009, we paid approximately $8,560 of the
$12,000 maximum amount since February 2004. The balance of this liability as of October 31, 2008 was $527.
Kings Gaming Inc. contingent consideration. In April 2007, we purchased the Play Four Poker patent and trademark from Kings Gaming Inc. for a total purchase price of $1,140. Of the total $1,140 purchase price, $500 was deposited into an interest bearing
escrow account for Kings Gaming Inc, which shall remain in escrow until September 1, 2012 (“Maturity Date”); consequently the $500 is classified as a restricted asset on our balance sheet in other long term assets. Upon expiration of the escrow period, Kings Gaming Inc. will be entitled to the $500 escrowed amount and interest earned thereon contingent upon no claims being made against the purchased patent and trademark, as outlined in the Intellectual Property Purchase Agreement, dated April 17,
2007 (“Effective Date”). On each anniversary of the Effective Date until the Maturity Date, Kings Gaming, Inc. shall only be entitled to interest accrued in the interest bearing escrow account. The balance of this liability as of October 31, 2009 and 2008 was $506 and $508, respectively. With an effective interest rate of 2.7% and 3.5%, we paid $12 and $22 of interest for fiscal 2009 and 2008, respectively.
Bet the Set “21” contingent consideration. In connection with our acquisition of Bet the Set “21” in June 2005, we recorded contingent consideration of $560. The contingent consideration is non-interest bearing and consists of quarterly
payments of 22.5% of “adjusted gross revenues,” as defined, attributed to the Bet the Set “21”® side bet table game up to a maximum of $560. The balance of this liability as of October 31, 2009 and 2008 was $354 and $412, respectively.
Maturities of Long-Term Debt
Maturities of long-term debt for the five fiscal years ending subsequent to October 31, 2009 are as follows:
|
October 31, |
(In thousands) |
|||
|
2010 |
650 | |||
|
2011 |
650 | |||
|
2012 |
91,556 | |||
|
2013 |
- | |||
|
2014 |
- | |||
|
Thereafter |
354 | |||
| 93,210 | ||||
8. SHARE-BASED COMPENSATION
Share-based award plans. In February 2004, our board of directors adopted and, in March 2004, our shareholders approved the Shuffle Master, Inc. 2004 Equity Incentive Plan (the “2004 Plan”) and the Shuffle Master, Inc. 2004 Equity Incentive
Plan for Non-Employee Directors (the “2004 Directors’ Plan”). These approved plans replaced our prior plans and no further options may be granted from the prior plans. Both the 2004 Plan and the 2004 Directors’ Plan provide for the grant of stock options, stock appreciation rights (none issued) and restricted stock and restricted stock units, individually or in any combination (collectively referred to as “Awards”). Stock options may not be granted at an exercise price less
than the market value of our common stock on the date of grant and may not be subsequently repriced. Equity granted under the 2004 Plan generally vests in equal increments over four years and expires in ten years. Equity granted under the 2004 Directors’ Plan generally vests immediately and expires in ten years, although initial equity grants to directors upon joining the Board can partially vest either immediately and/or partially over one or two years.
The 2004 Plan provides for the grants of Awards to our officers, other employees and contractors. The maximum number of Awards which may be granted is 2,700 of which no more than 1,890 may be granted as restricted stock. The 2004 Directors’ Plan provides for the grants of Awards to our non-employee directors. The maximum number of Awards
which may be granted is 1,125 of which no more than 788 may be granted as restricted stock.
In January 2009, our board of directors adopted and, in March 2009, our shareholders approved the Shuffle Master, Inc. 2004 Equity Incentive Plan (as amended and restated on January 28, 2009) (the “Amended 2004 Plan”). The Amended 2004 Plan increased the number of shares available for issuance in addition to other related technical
changes. Subject to the Amended 2004 Plan, the aggregate number of shares that may be granted under the Amended 2004 Plan shall not exceed 5,200 shares of which no more than 2,590 shares may be granted as restricted stock.
As of October 31, 2009, 2,515 and 480 shares are available for grant under the 2004 Plan and 2004 Directors’ Plan, respectively.
A summary of activity under shared-based incentive awards for fiscal 2007, 2008 and 2009 is presented below:
|
Shares |
Weighted
Average
Exercise
Price |
Weighted
Average
Remaining
Contractual
Term |
Aggregate
Intrinsic
Value | |||||||
|
(In thousands, except per share amount) | ||||||||||
|
Outstanding at October 31, 2006 |
3,131 | $ | 19.16 | |||||||
|
Granted |
142 | 27.23 | ||||||||
|
Exercised |
(229 | ) | 11.12 | |||||||
|
Forfeited or expired |
(138 | ) | 29.96 | |||||||
|
Outstanding at October 31, 2007 |
2,906 | 19.68 | ||||||||
|
Granted |
655 | 9.37 | ||||||||
|
Exercised |
- | - | ||||||||
|
Forfeited or expired |
(165 | ) | 17.39 | |||||||
|
Outstanding at October 31, 2008 |
3,396 | 17.80 | ||||||||
|
Granted |
1,155 | 4.05 | ||||||||
|
Exercised |
- | - | ||||||||
|
Forfeited or expired |
(186 | ) | $ | 8.42 | ||||||
|
Outstanding at October 31, 2009 |
4,365 | 14.56 | 6.2 | 4,520 | ||||||
|
Exercisable at October 31, 2009 |
2,642 | 17.20 | 4.8 | 456 | ||||||
|
Vested and expected to vest at October 31, 2009 |
3,960 | 14.56 | 6.2 | 4,520 | ||||||
In fiscal 2009 and 2008, there were no stock options exercised and therefore no related income tax benefit. As of October 31, 2009, there was a total of $2,746 of unamortized compensation related to stock options, which expense is expected to be recognized over a weighted-average period of 1.9 years.
During the fiscal years ended 2009, 2008 and 2007, we granted 1,155, 655 and 142 stock options, respectively, with a grant date fair value of $2,549, $2,485 and $1,467, respectively. Included in the fiscal 2009 grants is inducement grants of 360 stock options granted to our Chief Executive Officer and Chief Financial Officer. These inducement
awards were granted in reliance on The NASDAQ Stock Market Rule 435(i)(1)(A)(iv).
A summary of activity related to restricted stock for the years ended October 31 is presented below:
|
Weighted Average Grant-Date |
||||||||
|
Shares |
Fair Value |
|||||||
|
(In thousands, except per share amount) |
||||||||
|
Nonvested at October 31, 2006 |
340 | $ | 26.01 | |||||
|
Granted |
227 | 25.42 | ||||||
|
Vested |
(30 | ) | 33.02 | |||||
|
Forfeited |
(51 | ) | 25.94 | |||||
|
Nonvested at October 31, 2007 |
486 | 26.19 | ||||||
|
Granted |
59 | 11.66 | ||||||
|
Vested |
(25 | ) | 20.87 | |||||
|
Forfeited |
(16 | ) | 18.25 | |||||
|
Nonvested at October 31, 2008 |
504 | $ | 24.15 | |||||
|
Granted |
121 | 4.36 | ||||||
|
Vested |
(170 | ) | 23.19 | |||||
|
Forfeited |
(13 | ) | 8.70 | |||||
|
Nonvested at October 31, 2009 |
442 | 19.55 | ||||||
During the fiscal years ended 2009, 2008 and 2007 we issued 121, 59 and 227 shares of restricted stock, respectively, with an aggregate fair value of $526, $686 and $5,773, respectively. The total value of each restricted stock grant, based on the fair market value of the stock on the date of grant, is amortized to compensation expense over
the related vesting period. Net income (loss), as reported, for the fiscal years ended 2009 and 2008, reflects $2,273 and $1,944 respectively, of amortization of restricted stock compensation.
As of October 31, 2009, there was $2,053 of unamortized compensation expense related to restricted stock, which is expected to be recognized over a weighted-average period of 1.3 years.
Recognition of compensation expense. The following table shows information about compensation costs recognized for the years ended October 31:
|
Year Ended October 31, |
||||||||||||
|
2009 |
2008 |
2007 |
||||||||||
|
(In thousands) |
||||||||||||
|
Compensation costs: |
||||||||||||
|
Stock options |
$ | 2,909 | $ | 1,577 | $ | 1,881 | ||||||
|
Restricted stock |
3,571 | 2,612 | 2,931 | |||||||||
|
Total compensation cost |
$ | 6,480 | $ | 4,189 | $ | 4,812 | ||||||
|
Related tax benefit |
$ | (2,206 | ) | $ | (1,131 | ) | $ | (1,313 | ) | |||
Reported share-based compensation expense was classified as follows for the years ended October 31:
|
Year Ended October 31, |
||||||||||||
|
2009 |
2008 |
2007 |
||||||||||
|
(In thousands) |
||||||||||||
|
Cost of sales |
$ | 32 | $ | 25 | $ | 43 | ||||||
|
Selling, general and administrative |
6,018 | 3,770 | 4,391 | |||||||||
|
Research and development |
430 | 394 | 378 | |||||||||
|
Total share-based compensation |
$ | 6,480 | $ | 4,189 | $ | 4,812 | ||||||
Option valuation models require the input of certain assumptions and changes in assumptions used can materially affect the fair value estimate. Expected volatility and dividends are based on historical factors related to our common stock. Expected term represents the estimated weighted-average time between grant and employee exercise. Risk
free interest rate is based on U.S. Treasury rates appropriate for the expected term.
We estimate the fair value of each stock option award on the grant date using the Black-Scholes valuation model incorporating the weighted-average assumptions noted in the following table:
|
Year Ended October 31, |
||||||||||||
|
2009 |
2008 |
2007 |
||||||||||
|
Option valuation assumptions: |
||||||||||||
|
Expected dividend yield |
None |
None |
None |
|||||||||
|
Expected volatility |
68.9 | % | 47.1 | % | 39.6 | % | ||||||
|
Risk-free interest rate |
1.7 | % | 3.0 | % | 4.6 | % | ||||||
|
Expected term |
4.4 years |
4.2 years |
4.2 years |
|||||||||
9. EARNINGS PER SHARE
Shares used to compute basic and diluted earnings per share from continuing operations for the years ended October 31 are as follows:
|
Year Ended October 31, |
||||||||||||
|
2009 |
2008 |
2007 |
||||||||||
|
(In thousands, except per share amount) |
||||||||||||
|
Income (Loss) from continuing operations |
$ | 15,459 | $ | (10,802 | ) | $ | 16,301 | |||||
|
Basic: |
||||||||||||
|
Weighted average shares |
53,120 | 40,006 | 34,680 | |||||||||
|
Diluted: |
||||||||||||
|
Weighted average shares, basic |
53,120 | 40,006 | 34,680 | |||||||||
|
Dilutive effect of options and restricted stock |
329 | - | 593 | |||||||||
|
Dilutive effect of contingent convertible notes |
- | - | 3 | |||||||||
|
Weighted average shares, diluted |
53,449 | 40,006 | 35,276 | |||||||||
|
Basic earnings (loss) per share |
$ | 0.29 | $ | (0.27 | ) | $ | 0.47 | |||||
|
Diluted earnings (loss) per share |
$ | 0.29 | $ | (0.27 | ) | $ | 0.46 | |||||
|
Weighted average anti-dilutive shares excluded |
||||||||||||
|
from diluted EPS |
5,432 | 16,292 | 6,739 | |||||||||
We account for our Notes by including the dilutive effect of our outstanding Notes in our diluted earnings per share calculation, regardless of whether the market price trigger or other contingent conversion feature has been met. Because the Notes include a mandatory cash settlement feature for the principal payment, we apply the treasury
stock method. This method results in incremental dilutive shares when the average fair value of our common stock for a reporting period exceeds the initial conversion price per share of $28.07. For certain quarters during the fiscal years ended 2007, the average fair value of our common stock exceeded $28.07, and accordingly, the dilutive effect is included in our diluted shares calculation. During fiscal 2009 and 2008, the average fair value of our common stock did not exceed $28.07, therefore no
dilutive effect of our outstanding Notes is included in our diluted earnings per share calculation. The Notes were fully satisfied during the third quarter of 2009, therefore the conversion feature and the impact on dilution is not applicable as of October 2009.
10. SHAREHOLDERS’ EQUITY
Common stock repurchases. Our board of directors periodically authorizes us to repurchase shares of our common stock, however, we generally prioritize bank debt reduction over share repurchases. As such, during the fiscal year 2009, there were no common
stock repurchases. As of October 31, 2009, $21,077 remained outstanding under our board authorization. Under our board authorization, for fiscal 2008 and 2007, we repurchased 2,000 and 77 shares of our common stock at total costs of $7,125 and $1,963, respectively. We cancel shares that we repurchase.
The timing of our common stock repurchases pursuant to our board of directors’ authorization is dependent on future opportunities and on our views, as they may change from time to time, as to the most prudent uses of our capital resources, including cash and borrowing capacity.
Tax effect from stock option exercises. For fiscal 2009 and 2008, there was no income tax benefit from stock option exercises. For fiscal 2007, we recorded income tax benefits of $1,133, related to employee stock option exercises. The tax effect/benefit
from stock option exercises affected our deferred tax asset or income tax payable as well as our additional paid-in capital by an equal amount and had no effect on our provision (benefit) for income taxes.
11. EMPLOYEE BENEFIT PLANS
U.S. defined contribution plan. We sponsor a defined contribution plan, which qualifies under Section 401(k) of the Internal Revenue Code and covers United States employees who meet certain age and service requirements. We may make matching contributions
to the plan based on a percentage of employee compensation and actual contributions. For fiscal 2009, 2008 and 2007, we elected to make matching contributions of 50% of employee contributions up to 6% of compensation, totaling $473, $430 and $335, respectively.
Austrian pension commitments. In April and May 2004, we formalized our defined contribution pension agreements with certain Austrian employees. We pay contributions to an external pension fund administered by ÖPAG Pensionskassen AG. Aggregate pension expense
relating to our Austrian agreements for fiscal 2009, 2008 and 2007 were $80, $98 and $102, respectively.
12. OTHER INCOME (EXPENSE) AND GAIN ON EARLY EXTINGUISHMENT OF DEBT
|
Year Ended October 31, |
||||||||||||
|
2009 |
2008 |
2007 |
||||||||||
|
(In thousands) |
||||||||||||
|
Other income (expense): |
||||||||||||
|
Interest income |
860 | 1,759 | 1,644 | |||||||||
|
Interest expense |
(5,401 | ) | (6,630 | ) | (7,487 | ) | ||||||
|
Other, net |
731 | 1,261 | (4,131 | ) | ||||||||
|
Total other income (expense) |
$ | (3,810 | ) | $ | (3,610 | ) | $ | (9,974 | ) | |||
|
Gain on early extinguishment of debt |
$ | 1,961 | $ | 1,773 | - | |||||||
Interest income relates primarily to our investment in sales-type leases, notes receivable portfolio and cash on hand.
Interest expense for fiscal 2009 primarily relates to interest on our Revolver and Term Loan. Interest expense for fiscal 2008 primarily related to interest on our Revolver, Term Loan and Notes. Interest expense for fiscal 2007 primarily related to interest on our Revolver and Notes. For fiscal 2009, amortization
of debt issue costs of $1,158 related to our Revolver and our Term Loan. For fiscal 2008, amortization of debt issue costs of $1,339 related to our Revolver, our Term Loan and our Notes. For fiscal 2007, amortization of debt issue costs of $1,327 related primarily to our Revolver and our Notes.
Other, net primarily relates to fluctuations of the U.S. dollar, the Euro and the Australian dollar. Net foreign currency gains of $825 was recognized in fiscal 2009 and net foreign currency losses of $3,356 and $1,336 were recognized for fiscal 2008 and 2007, respectively. This year over year change was primarily caused by the
strengthening of the U.S. dollar versus the Australian dollar and the Euro during fiscal 2009. Our foreign subsidiaries engage in activities with us and certain customers in U.S. dollar and other foreign denominated contracts. As of our third quarter of fiscal 2008, we made the decision to begin settling all inter-company trade balances, which has resulted in the recognition of additional foreign currency fluctuations in our consolidated statement of operations
Gain on early extinguishment of debt for fiscal 2009 related to agreements entered into with PGIC/IGT of $1,798 and the gain realized from the early extinguishment of our Notes of $163. We wrote-off the net book value of approximately $160 related to the covenants not to compete between us and PGIC. In addition, the prepaid royalty related
to the SDLA was re-characterized as a lifetime license to be amortized over a 10 year life. The acquired SMI Patents were fair valued at $520. The remaining discounted minimum consideration due under the Purchase Agreement of approximately $2,247 was relieved resulting in a net gain on early extinguishment of $1,798.
13. INCOME TAXES
We record deferred income taxes to reflect the income tax consequences in future years between the financial reporting and income tax bases of assets and liabilities and future tax benefits such as net operating loss carryforwards and other tax credits. Deferred tax assets and liabilities are measured using enacted tax rates expected to apply
to taxable income in the years in which the differences are expected to reverse. We provide valuation allowances to reduce deferred tax assets to an amount that is more likely than not to be realized. The provision for income taxes is the sum of the tax currently payable and the change in deferred taxes during the year.
The income tax provision (benefit) attributable to our continuing and discontinued operations was as follows for the years ended October 31:
|
2009 |
2008 |
2007 |
||||||||||
|
(In thousands) |
||||||||||||
|
Continuing operations |
$ | 7,367 | $ | 6,346 | $ | (1,999 | ) | |||||
|
Discontinued operations |
- | - | 46 | |||||||||
|
Total |
$ | 7,367 | $ | 6,346 | $ | (1,953 | ) | |||||
The components of the provision (benefit) for income taxes from continuing operations was as follows for the years ended October 31:
|
Year Ended October 31, |
||||||||||||
|
2009 |
2008 |
2007 |
||||||||||
|
(In thousands) |
||||||||||||
|
Current: |
||||||||||||
|
Federal |
$ | 6,590 | $ | 5,982 | $ | 6,345 | ||||||
|
State |
1,157 | 726 | 747 | |||||||||
|
Foreign |
567 | 473 | 64 | |||||||||
| 8,314 | 7,181 | 7,156 | ||||||||||
|
Deferred: |
||||||||||||
|
Federal |
(1,993 | ) | (1,547 | ) | (1,586 | ) | ||||||
|
State |
(47 | ) | (85 | ) | (82 | ) | ||||||
|
Foreign |
1,093 | 797 | (7,487 | ) | ||||||||
| (947 | ) | (835 | ) | (9,155 | ) | |||||||
|
Total |
$ | 7,367 | $ | 6,346 | $ | (1,999 | ) | |||||
Deferred tax assets and liabilities consisted of the following as of October 31:
|
Year Ended October 31, |
||||||||
|
2009 |
2008 |
|||||||
|
(In thousands) |
||||||||
|
Deferred tax assets: |
||||||||
|
Inventories |
$ | 3,040 | $ | 2,969 | ||||
|
Accounts receivable |
240 | 202 | ||||||
|
Employee benefits |
2,096 | 1,063 | ||||||
|
Deferred revenue |
976 | 517 | ||||||
|
Investment impairment write-downs |
- | - | ||||||
|
Other reserves |
- | - | ||||||
|
Stock awards |
5,242 | 3,642 | ||||||
|
Fixed assets |
- | - | ||||||
|
Foreign net operating loss carryforward |
8,036 | 6,026 | ||||||
|
Contingent consideration on patent purchase |
- | - | ||||||
|
Foreign tax credits / receivables |
1,249 | 566 | ||||||
|
Intangible assets |
6,125 | 5,712 | ||||||
|
Other |
2,147 | 2,397 | ||||||
|
Total gross deferred tax assets |
29,151 | 23,094 | ||||||
|
Less: valuation allowance |
(1,869 | ) | (1,557 | ) | ||||
|
Deferred tax assets |
27,282 | 21,537 | ||||||
|
Deferred tax liabilities: |
||||||||
|
Goodwill |
5,307 | 3,171 | ||||||
|
Inventories |
692 | 1,139 | ||||||
|
Depreciation |
2,786 | 762 | ||||||
|
Translation Gains/Losses |
154 | 870 | ||||||
|
IRC §108(e) Gain Deferral |
541 | - | ||||||
|
Other |
1,813 | 1,427 | ||||||
|
Total gross deferred tax liabilities |
11,293 | 7,369 | ||||||
|
Net deferred tax assets |
$ | 15,989 | $ | 14,168 | ||||
We have income tax net operating loss carryforwards related to our international operations of approximately $29,606 which have an indefinite life. We have recorded a deferred tax asset of $8,036 related to these operating losses. Due to a history of pre-tax book losses adjusted for permanent items and no identifiable
sources of future taxable income, we believe that it is more likely than not that the benefit from certain international operating loss carryforwards will not be realized. In recognition of this risk, we have provided a valuation allowance of $1,609 on the deferred tax assets relating to certain of these international net operating loss carryforwards. In addition, we have provided a valuation allowance of $260 related to other foreign deferred tax assets which we believe are not more likely
than not to be realized. If our assumptions change and we determine we will be able to realize these deferred tax assets, the tax benefits relating to any reversal of the valuation allowance on deferred tax assets at October 31, 2009 will be recognized as a reduction of income tax expense.
We have foreign tax credits of $1,248 for U.S. Federal income tax purposes. The United States foreign tax credit carryforward will begin to expire in 2017. We believe that it is more likely than not that the benefit from this foreign tax credit carryforward will be recognized within the carryforward period.
We have not provided U.S. Federal income tax on $14,024 of undistributed earnings of our foreign subsidiaries. We intend to permanently reinvest such earnings outside the United States. Upon distribution of these earnings in the form of dividends or capital gains, we would be subject to U.S. income tax net of applicable
foreign tax credits. Determination of the amount of unrecognized deferred U.S. income tax liability is not practicable because of the complexities associated with its hypothetical calculation.
The reconciliation of the federal statutory rate to our effective income tax rate for continuing operations for the years ended October 31 is as follows:
|
Year Ended October 31, |
||||||||||||
|
2009 |
2008 |
2007 |
||||||||||
|
Federal income tax at the statutory rate |
35.0 | % | (35.0 | %) | 35.0 | % | ||||||
|
Permanent Goodwill Impairment |
0.0 | % | 149.0 | % | 0.0 | % | ||||||
|
Stargames PC4 software technology |
0.0 | % | 0.0 | % | (46.9 | %) | ||||||
|
Interest expense |
(3.6 | %) | (21.7 | %) | (5.7 | %) | ||||||
|
Research & development benefits |
(2.4 | %) | (12.2 | %) | (7.4 | %) | ||||||
|
Manufacturing deduction |
(1.5 | %) | (9.1 | %) | (0.6 | %) | ||||||
|
Foreign dividend inclusion |
2.0 | % | 10.1 | % | 0.0 | % | ||||||
|
Stock compensation |
(2.1 | %) | 8.0 | % | 1.8 | % | ||||||
|
Valuation allowances |
0.2 | % | 13.5 | % | 1.1 | % | ||||||
|
Unrecognized tax benefits |
(0.4 | %) | 4.5 | % | 0.0 | % | ||||||
|
State income taxes, net of federal benefit |
1.9 | % | 7.4 | % | 2.1 | % | ||||||
|
Withholding taxes |
2.7 | % | 10.1 | % | 2.9 | % | ||||||
|
Foreign tax credits |
(4.0 | %) | (11.1 | %) | (2.9 | %) | ||||||
|
Foreign Rate Differential |
1.2 | % | 27.5 | % | 2.6 | % | ||||||
|
Other |
3.3 | % | 1.4 | % | 4.0 | % | ||||||
|
Effective tax rate |
32.3 | % | 142.4 | % | (14.0 | %) | ||||||
Our income tax returns are subject to examination by the Internal Revenue Service (“IRS”) and other tax authorities in the locations where we operate. We assess potentially unfavorable outcomes of such examinations, which we adopted on November 1, 2007. The authoritative guidance prescribes a minimum recognition
threshold a tax position is required to meet before being recognized in the financial statements. This applies to all tax positions related to income taxes. The methodology utilizes a two-step approach for evaluating tax positions. Recognition (Step I) occurs when we conclude that a tax position, based on its technical merits, is more likely than not to be sustained upon examination. Measurement (Step II) is only addressed if the position is deemed to be more likely
than not to be sustained. Under Step II, the tax benefit is measured as the largest amount of benefit that is more likely than not to be realized upon settlement. The use of the term “more likely than not” is consistent with the criteria that the “likelihood of occurrence is greater than 50%.”
Tax positions failing to qualify for initial recognition will be recognized in the first subsequent interim period that meet the “more likely than not” standard. If it is subsequently determined that a previously recognized tax position no longer meets the “more likely than not” standard, it is required that the tax
position be derecognized. The authoritative guidance specifically prohibits the use of a valuation allowance as a substitute for derecognition of a tax position.
The total amount of unrecognized tax benefits that, if recognized, would affect the effective tax rate was $1,322 and $1,484 as of October 31, 2009 and 2008, respectively.
We have a policy of recognizing interest and penalties related to unrecognized tax benefits within the income tax expense line in the consolidated statement of operations and within the related tax liability line in the consolidated balance sheet. For the years ended October 31, 2009 and 2008, we recognized a $26 benefit and $255 expense,
respectively, related to interest and penalties in our consolidated statement of operations. Our total accrued interest and penalties as of October 31, 2009 and 2008 is $229 and $255, respectively.
We filed numerous consolidated and separate income tax returns in the United States federal jurisdiction and in many state and foreign jurisdictions. With few exceptions, we are no longer subject to United States federal income tax examinations for years before 2004, and are no longer subject to state and local, or foreign income
tax examinations for years before 2003 and 2004 respectively.
We believe that it is reasonably possible that approximately $787 of unrecognized tax benefits related to foreign income inclusion items and other significant unrecognized tax benefits will decrease within 12 months due to the expiration of the statutes.
A reconciliation of the beginning and ending amount of unrecognized tax benefits is as follows:
|
Year Ended October 31, |
||||||||
|
2009 |
2008 |
|||||||
|
(In thousands) |
||||||||
|
Balance at adoption |
$ | 1,484 | $ | 1,334 | ||||
|
Increases related to prior year tax positions |
18 | 24 | ||||||
|
Decreases related to prior year tax positions |
(22 | ) | - | |||||
|
Increases related to current year tax positions |
100 | 126 | ||||||
|
Decreases related to current year tax positions |
- | - | ||||||
|
Reductions for settlements with taxing authorities |
(258 | ) | - | |||||
|
Reductions due to lapse of statutes of limitations |
- | - | ||||||
|
Balance at year end |
$ | 1,322 | $ | 1,484 | ||||
14. OPERATING SEGMENTS
We report segment information based on the “management approach”. The management approach designates the internal reporting used by management for making decisions and assessing performance as the source of our reportable segments.
We develop, manufacture and market technology and entertainment-based products for the gaming industry for placement on the casino floor. Our products primarily relate to our casino customers’ table game activities and focus on either increasing their profitability, productivity and security or expanding their gaming entertainment offerings.
Our business is segregated into the following four operating segments: Utility, Proprietary Table Games (“PTG”), Electronic Table Systems (“ETS”) and Electronic Gaming Machines (“EGM”).
See Note 1 for a detailed discussion of our four segments. Each segment’s activities include the design, development, acquisition, manufacturing, marketing, distribution, installation and servicing of its product lines. We evaluate the performance of our operating segments based on net revenues, gross margin and operating income.
Segment revenues include leasing, licensing, or selling of products within each reportable segment. Segment operating income (loss) includes net revenues attributable to third parties and expenses directly and indirectly associated with the product lines included in each segment. Our direct expenses primarily include cost of products sold,
depreciation of leased assets, amortization of product-related intangible assets, service, manufacturing overhead, shipping and installation. Indirect expenses include other costs directly identified with each segment, such as research and development, product approval costs, product-related litigation expenses, amortization of patents and other product-related intellectual property, sales commissions and other directly-allocable sales expenses. Capital expenditures include amounts reported
in our consolidated statements of cash flows for purchases of leased products, property and equipment and intangible assets plus the financed or non-cash portion of these purchases which is excluded from cash flows.
Operating income (loss) for each segment excludes other income and expense, income taxes and certain expenses that are managed outside of the operating segments. The amounts classified as unallocated corporate expenses consist primarily of costs related to overall corporate management and support functions. These include costs related to
executive management, accounting and finance, general sales support, legal and compliance costs, office expenses and other amounts for which allocation to specific segments is not practicable. Segment assets exclude corporate assets.
The following provides financial information concerning our reportable segments of our continuing operations for the years ended October 31:
|
Year Ended October31, |
||||||||||||
|
2009 |
2008 |
2007 |
||||||||||
|
(In thousands) |
||||||||||||
|
Revenue: |
||||||||||||
|
Utility |
$ | 71,707 | $ | 80,893 | $ | 78,457 | ||||||
|
Proprietary Table Games |
38,697 | 38,594 | 33,125 | |||||||||
|
Electronic Table Systems |
22,342 | 27,461 | 27,890 | |||||||||
|
Electronic Gaming Machines |
46,598 | 42,898 | 39,269 | |||||||||
|
Unallocated Corporate |
83 | 160 | 110 | |||||||||
| $ | 179,427 | $ | 190,006 | $ | 178,851 | |||||||
|
Gross profit (loss): |
||||||||||||
|
Utility |
$ | 40,513 | $ | 46,097 | $ | 48,086 | ||||||
|
Proprietary Table Games |
32,079 | 31,983 | 28,154 | |||||||||
|
Electronic Table Systems |
9,430 | 13,068 | 13,891 | |||||||||
|
Electronic Gaming Machines |
23,643 | 19,662 | 14,027 | |||||||||
|
Unallocated Corporate |
6 | 92 | (292 | ) | ||||||||
| $ | 105,671 | $ | 110,902 | $ | 103,866 | |||||||
|
Operating income (loss): |
||||||||||||
|
Utility |
$ | 32,742 | $ | 36,078 | $ | 33,783 | ||||||
|
Proprietary Table Games |
29,035 | 28,957 | 23,465 | |||||||||
|
Electronic Table Systems |
3,427 | (16,105 | ) | 6,600 | ||||||||
|
Electronic Gaming Machines |
16,529 | 11,693 | 7,390 | |||||||||
|
Unallocated Corporate |
(57,058 | ) | (61,682 | ) | (46,656 | ) | ||||||
| $ | 24,675 | $ | (1,059 | ) | $ | 24,582 | ||||||
|
Depreciation and amortization: |
||||||||||||
|
Utility |
$ | 8,997 | $ | 9,497 | $ | 8,634 | ||||||
|
Proprietary Table Games |
4,836 | 4,310 | 2,661 | |||||||||
|
Electronic Table Systems |
6,715 | 6,335 | 5,305 | |||||||||
|
Electronic Gaming Machines |
840 | 1,422 | 586 | |||||||||
|
Unallocated Corporate |
3,285 | 3,215 | 3,562 | |||||||||
| $ | 24,673 | $ | 24,779 | $ | 20,748 | |||||||
|
Capital expenditures: |
||||||||||||
|
Utility |
$ | 6,889 | $ | 6,699 | $ | 3,352 | ||||||
|
Proprietary Table Games |
1,469 | 1,338 | 1,969 | |||||||||
|
Electronic Table Systems |
7,836 | 6,860 | 8,004 | |||||||||
|
Electronic Gaming Machines |
24 | 691 | 103 | |||||||||
|
Unallocated Corporate |
1,415 | 1,838 | 1,828 | |||||||||
| $ | 17,633 | $ | 17,426 | $ | 15,256 | |||||||
|
Assets, end of year: |
||||||||||||
|
Utility |
$ | 113,994 | $ | 105,472 | $ | 121,822 | ||||||
|
Proprietary Table Games |
52,722 | 47,281 | 53,635 | |||||||||
|
Electronic Table Systems |
51,003 | 48,752 | 89,259 | |||||||||
|
Electronic Gaming Machines |
41,468 | 26,170 | 37,495 | |||||||||
|
Unallocated Corporate |
26,282 | 34,271 | 57,556 | |||||||||
| $ | 285,469 | $ | 261,946 | $ | 359,767 | |||||||
REVENUE BY GEOGRAPHIC AREA
Revenues by geographic area are determined based on the location of our customers. For fiscal 2009, 2008 and 2007, sales to customers outside the United States accounted for 50%, 53% and 55% of consolidated revenue, respectively. No individual customer accounted for more than 10% of consolidated revenue.
The following provides financial information concerning our operations by geographic area for the years ended October 31:
|
Year Ended October 31, |
||||||||||||||||||||||||
|
2009 |
2008 |
2007 |
||||||||||||||||||||||
|
(In thousands) |
||||||||||||||||||||||||
|
Revenue: |
||||||||||||||||||||||||
|
United States |
$ | 89,073 | 49.7 | % | $ | 90,292 | 47.5 | % | $ | 80,331 | 44.9 | % | ||||||||||||
|
Canada |
9,754 | 5.5 | % | 7,298 | 3.8 | % | 7,314 | 4.1 | % | |||||||||||||||
|
Other North America |
3,458 | 1.9 | % | 2,235 | 1.2 | % | 1,828 | 1.0 | % | |||||||||||||||
|
Europe |
7,751 | 4.3 | % | 14,631 | 7.7 | % | 9,702 | 5.4 | % | |||||||||||||||
|
Australia |
56,767 | 31.6 | % | 57,692 | 30.4 | % | 52,417 | 29.3 | % | |||||||||||||||
|
Asia |
10,251 | 5.7 | % | 11,761 | 6.2 | % | 21,809 | 12.2 | % | |||||||||||||||
|
Other |
2,373 | 1.3 | % | 6,097 | 3.2 | % | 5,450 | 3.1 | % | |||||||||||||||
| $ | 179,427 | 100.0 | % | $ | 190,006 | 100.0 | % | $ | 178,851 | 100.0 | % | |||||||||||||
|
Long-lived assets, end of year: |
||||||||||||||||||||||||
|
United States |
$ | 72,659 | 37.7 | % | $ | 75,578 | 41.6 | % | $ | 95,193 | 36.6 | % | ||||||||||||
|
Austria |
47,911 | 24.8 | % | 46,012 | 25.3 | % | 56,618 | 21.8 | % | |||||||||||||||
|
Australia |
64,599 | 33.5 | % | 52,652 | 29.0 | % | 107,691 | 41.5 | % | |||||||||||||||
|
Other |
7,681 | 4.0 | % | 7,305 | 4.1 | % | 300 | 0.1 | % | |||||||||||||||
| $ | 192,850 | 100.0 | % | $ | 181,547 | 100.0 | % | $ | 259,802 | 100.0 | % | |||||||||||||
15. COMMITMENTS AND CONTINGENCIES
Operating leases. We lease office, production, warehouse and service facilities, office equipment and service vans under operating leases. The facility leases are for periods ranging from one to ten years, include renewal options and include an allocation
of real estate taxes and other operating expenses. Total rent expense under operating leases was approximately $2,570, $2,389 and $1,934 for fiscal 2009, 2008 and 2007, respectively.
Estimated future minimum lease payments under operating leases subsequent to October 31, 2009 are as follows:
|
October 31, |
(In thousands) |
|||
|
2010 |
2,345 | |||
|
2011 |
2,200 | |||
|
2012 |
1,507 | |||
|
2013 |
537 | |||
|
2014 |
366 | |||
|
Thereafter |
305 | |||
| $ | 7,260 | |||
Minimum royalty payments. We have entered into an agreement related to the licensing of intellectual property for use in our business which contains annual minimum royalty payments. The aggregate annual minimum royalty payments are approximately $19,130
through 2019. The annual minimum royalty payments under this agreement vary from $750 to $2,000 annually and are only required in order for us to preserve our exclusivity rights.
Employment agreements. We have entered into employment contracts with our Corporate Officers and certain other key employees with durations ranging from one to three years. Significant contract provisions include minimum annual base salaries, healthcare benefits,
bonus compensation if performance measures are achieved and non-compete provisions. These contracts are primarily “at will” employment agreements, under which the employee or we may terminate employment. If we terminate any of these employees without cause, we are obligated to pay the employee severance benefits as specified in their individual contract. As of October 31, 2009 and 2008, minimum aggregate severance benefits totaled $6,063 and $5,939, respectively.
Severance obligations. Pursuant to the retirement of our former Chief Executive Officer and the departure of several senior executives, we incurred severance costs of $6,838
for the year ended October 31, 2009. The $6,838 severance costs were comprised of $3,628 of accelerated stock compensation expense and $3,210 of cash salary and related benefits and are expected to be paid out over a three-year period.
Legal proceedings. In the ordinary course of business, we are involved in various legal proceedings and other matters that are complex in nature and have outcomes that are difficult to predict. We record accruals for such contingencies to the extent that
we conclude that it is probable that a liability will be incurred and the amount of the related loss can be reasonably estimated. Our assessment of each matter may change based on future unexpected events. An unexpected adverse judgment in any pending litigation could cause a material impact on our business operations, intellectual property, results of operations, financial position or liquidity. Unless otherwise expressly stated, we believe costs associated with litigation will not have
a material impact on our financial position or liquidity, but may be material to the results of operations in any given period. We assume no obligation to update the status of pending litigation, except as may be required by applicable law, statute or regulation.
1. VendingData II – In October 2004, we filed a second patent infringement lawsuit (“VendingData II”) against VendingData Corporation (“VendingData”) now known as Elixir Gaming Technologies. We
settled our first patent infringement lawsuit against VendingData on July 12, 2005 (“VendingData I”). This second suit alleges that the use, importation and offering for sale of VendingData's PokerOne™ shuffler infringes another patent owned by us (a different patent than the patents that were the subject of the VendingData I case). VendingData II was filed in the U.S. District Court for the
District of Nevada (the “Court”) in Las Vegas, Nevada. The complaint seeks an unspecified amount of damages against VendingData and a preliminary and permanent injunction against VendingData's infringing conduct. VendingData has denied infringement and has also filed a counterclaim for a declaratory judgment of non-infringement.
On February 1, 2008, the Court granted VendingData's Motion for Summary Judgment and denied Shuffle Master's Cross Motion for Summary Judgment. We appealed this ruling to the Court of Appeals for the Federal Circuit on February 29, 2008, but subsequently dismissed our appeal. On February 15, 2008, VendingData filed a Motion for
Attorney's Fees and Costs requesting in excess of approximately $1,800, based on VendingData's theory that the case was filed by us in bad faith and that the case was a “vexatious” litigation, which Motion we opposed. This Motion was never ruled upon. A mediation on all contested matters occurred in October 2008 but failed to resolve any issues in the case.
The case was settled and dismissed with prejudice (including VendingData’s Motion for Attorneys Fees and Costs) on March 16, 2009, as part of our acquisition of the intellectual property and finished-goods inventory related to Elixir Gaming’s table business, including the RandomPlus shuffler, the ShufflePro shuffler and the DeckChecker. The
$3,000 cash security previously posted, plus interest, was returned to us in full on March 17, 2009.
2. Awada – On April 25 and April 26, 2005, our rescission trial was held in the District Court in Clark County, Nevada, in the case against us and our CEO, Mark Yoseloff, brought by plaintiffs Yehia Awada and
Gaming Entertainment, Inc (“GEI”). At the conclusion of the trial, the court granted our rescission motion, ordering that the subject contract, called the “Game Option Agreement”, be rescinded and/or void. On May 18, 2005, the Court entered Findings of Fact/Conclusions of Law confirming the Court's rescission ruling. Among the findings, the Court found that the actions of the plaintiffs Awada and Gaming Entertainment, Inc. demonstrated that the plaintiffs
never had any intention of conveying to us the exclusive license to the 3-Way Action game, as they had agreed and were required to do under the Game Option Agreement. The Court further found that we had established by a preponderance of the evidence that the plaintiffs had materially failed to perform their obligations under the Game Option Agreement, that plaintiff's testimony about the Game Option Agreement was not credible and that we were entitled to the remedy of rescission. On May
5, 2005, the Court ruled on the parties' damages requests in connection with the case and as required under Nevada law. Plaintiffs were seeking approximately $13,000 in damages. The Court ordered that the total damages under Nevada law due to the successful rescission of the Game Option Agreement was $130 including all interest. The damages amount was paid in June 2006.
Plaintiffs appealed the Court's order granting the rescission of the “Game Option Agreement” to the Nevada Supreme Court.
On December 27, 2007, the Nevada Supreme Court denied the appeal filed by the plaintiffs with regard to the District Court's rescission judgment and its dismissal of all claims related to the breach of contract issues and affirmed the District Court's order granting the rescission of the “Game Option Agreement”. The
Supreme Court also remanded to the District Court, on procedural grounds, the remaining non-contract claims.
We filed our Motion for Summary Judgment as to the remaining non-contract claims on December 15, 2008. On February 23, 2009, the Court dismissed all of Awada’s remaining claims except for Awada’s claim against us for conversion. There were no remaining claims against our former Chief Executive Officer, Dr.
Yoseloff. The denial of summary judgment on the conversion claim was without prejudice.
On July 10, 2009, the Court granted our Motion for Summary Judgment on the conversion claim which was the final claim in the case and, thus, no claims remained pending in the case as of that time. On August 31, 2009, the Court entered a judgment for taxable costs in our favor for approximately $17. The time to appeal
this judgment and the dismissal of the claims has expired and we consider this matter to be concluded.
3. GEI – In July 2004, we filed a patent infringement lawsuit against Gaming Entertainment, Inc. and Yehia Awada (“GEI”) in the U.S. District Court for the District of Nevada, in Las Vegas, Nevada. The
lawsuit alleges that GEI's 3-5-7 Poker™ game infringes one of our Three Card Poker patents and one of our Let-It-Ride® patents. We were seeking a permanent injunction and an undetermined amount of damages at that time against GEI.
On March 6, 2008, the Court ordered the Clerk to enter default against GEI, which default was entered on that same date. In accordance with the Court's order of March 6, 2008, we sought appropriate damages, an injunction and costs to be included in a default judgment. On June 13, 2008, the Court issued a Default Judgment
against Awada and GEI for $792 and also issued a permanent injunction against their 3-5-7 game, which judgment was entered on July 8, 2008. The judgment is still outstanding. There is no assurance of collectability of this judgment.
In August 2008, we started certain proceedings to collect the Judgment for $792 entered on July 8, 2008, including but not limited to, a lawsuit filed in the Eighth Judicial District Court, Clark County, Nevada, related to the fraudulent transfer of certain intellectual property assets by Awada. Those proceedings are ongoing. The
Court entered an order on August 11, 2008, that in part required GEI to remove all 3-5-7 Poker™ games by August 12, 2008, with which they complied, on a later date, to the best of our knowledge.
On October 29, 2009, Yehia Awada filed for bankruptcy which stays all collection activities against him, including concerning our judgment.
See also Subsequent Events. (Note 16)
4. Class Action Lawsuits –
a. Stocke—On June 1, 2007, a putative class action complaint for violation of the federal securities laws against the Company and our Chief Executive Officer, Mark L. Yoseloff and former Chief Financial Officer, Richard L. Baldwin, was filed in the U.S. District Court for the District of Nevada on behalf of persons who purportedly
purchased our stock between December 22, 2006 and March 12, 2007. The case is entitled Joseph Stocke vs. Shuffle Master, Inc., Mark L. Yoseloff and Richard L. Baldwin. The complaint asserts claims pursuant to Sections 10(b) and 20(a) of the Securities Exchange Act of 1934, and Rule 10b-5 promulgated thereunder. These claims allegedly relate to our March 12, 2007, announcement that we would restate our Fiscal Fourth Quarter and full year financial results. The complaint
seeks compensatory damages in an unstated amount. On or about August 4, 2007, four plaintiffs moved the Court for appointment as lead plaintiff.
b. Armistead—On June 12, 2007, a second putative class action complaint for violation of the federal securities laws against the Company and Dr. Yoseloff and Mr. Baldwin was filed in the U.S. District Court for the District of Nevada. The case is entitled Robert Armistead, Jr. vs. Shuffle Master, Inc., Mark L.
Yoseloff and Richard L. Baldwin. This lawsuit effectively mirrors the allegations in the Stocke lawsuit filed against these same defendants on June 1, 2007, except that the Armistead complaint was filed on behalf of persons who purchased our stock between March 20, 2006 and March 12, 2007.
c. Tempel—On June 25, 2007, a third putative class action complaint for violation of the federal securities laws against the Company, Dr. Yoseloff and Mr. Baldwin was filed in the U.S. District Court for the District of Nevada. The case is entitled Andrew J. Tempel vs. Shuffle Master, Inc., Mark L. Yoseloff and
Richard L. Baldwin. This lawsuit is a “copycat” lawsuit of the Stocke lawsuit filed against these same defendants on June 1, 2007.
d. Consolidated case of a - c above.
On June 22, 2007, a Joint Stipulation was filed in the U.S. District Court for the District of Nevada providing that all presently filed and any subsequently filed related class actions shall be consolidated and captioned In Re Shuffle Master, Inc. Securities Litigation. We were not required to answer, move against or otherwise
respond to any class action complaints until a consolidated complaint was filed.
On November 30, 2007, the Court appointed the “Shuffle Master Institutional Investor Group,” consisting of the Tulsa Municipal Employees' Retirement Plan and the Oklahoma Firefighters Pension and Retirement System, as Lead Plaintiff. Grant & Eisenhofer is the Lead Plaintiff's counsel.
A Consolidated Amended Class Action Complaint (“Consolidated Complaint”) was filed on February 5, 2008. The Consolidated Complaint asserts the same causes of action for violation of federal securities law as the initial lawsuits and applies to a class period of February 1, 2006 to March 12, 2007. The Consolidated
Complaint contains essentially the same material allegations as in the initial lawsuits and also contains allegations arising out of the Company's acquisition of Stargames and disclosures concerning the Company's internal controls. This Consolidated Complaint supersedes all previously filed lawsuits covering this class period. On March 25, 2008, defendants filed a Motion to Dismiss. On March 23, 2009, the Court denied our Motion to Dismiss. The Defendants answered on
April 29, 2009. The case is presently pending.
The Company believes that all of the above purported class action suits are without merit and intends to vigorously defend each of these cases. Due to the uncertainty of the ultimate outcome of these matters, the impact on future financial results is not subject to reasonable estimates. However, we have tendered these
cases to our directors and officers insurance carriers. Thus far, reimbursement by our directors and officers insurance carriers for substantially all of the legal fees incurred for the cases (after our deductible was satisfied) has occurred in the ordinary course. While at this time, we believe that our directors and officers insurance carriers will continue to reimburse us for legal fees and pay any settlement or damages amounts subsequently agreed to or ordered, there can be no assurance
that such reimbursement will continue in the future or actually occur.
At this time, subject to judicial and other risks beyond our control, we do not believe that we will suffer any loss, but if we did, such loss, at this time, cannot be reasonably estimated. Further, subject to judicial and other risks beyond our control, we do not believe that the loss, if any, would be material.
5. Shareholder Derivative Suits –
a. Shareholder Derivative Lawsuit I (“Pirelli”) – On September 7, 2007, Pirelli Armstrong Tire Corporation Retiree Medical Benefits Trust filed a shareholder derivative complaint in the U.S. District Court for the District of Nevada against our then CEO, Mark Yoseloff, our former President, Paul Meyer, our former
CFO, Richard Baldwin, our General Counsel, Jerome R. Smith and the then current members of our Board of Directors. The Company was also named as a nominal defendant. On September 24, 2007, plaintiffs voluntarily dismissed Mr. Smith from the case without prejudice. The complaint, on behalf of the Company, alleges breach of fiduciary duty and related causes of action against the defendants. The allegations generally relate to the restatement of the Company's Fiscal 2006
annual results and our acquisition of Stargames and are very similar to the allegations in the class action suit, discussed above. The complaint seeks an unspecified amount of damages.
A consolidated amended complaint was filed on October 2, 2009, and a corrected version thereof was filed on October 26, 2009. The case is presently pending.
b. Shareholder Derivative Lawsuit II—On September 17, 2007, Chad Hodgkins filed a shareholder derivative complaint against our then CEO, Mark Yoseloff, our former CFO, Richard Baldwin, former Board of Directors member Todd Jordan and current Board of Directors members Mr. Saunders and Mr. Castle. The Company was
also named as a nominal defendant. The complaint was filed in the U.S. District Court for the District of Nevada. The complaint, on behalf of the Company alleges breach of fiduciary duty and related causes of action against the defendants. The allegations generally relate to the restatement of the Company's Fiscal 2006 annual results and our acquisition of Stargames and are very similar to the allegations in the three class actions suits and/or the shareholder derivative lawsuit
I described above Pirelli case. The complaint seeks an unspecified amount of damages.
On October 24, 2007, the Court approved a stipulation to transfer the Hodgkins case to Judge Dawson, who had already been assigned the Pirelli case. On November 9, 2007, the Court ordered the Hodgkins case to be consolidated into the Pirelli case. See Pirelli above.
Additionally, any future federal court derivative actions alleging similar facts and legal theories will be consolidated into the Pirelli case.
Due to the uncertainty of the ultimate outcome of these matters, the impact, if any, on future financial results is not subject to reasonable estimates. However, we have tendered the case to our directors and officers insurance carriers. Thus far, reimbursement by our directors and officers insurance carriers for substantially
all of the legal fees incurred for the cases has occurred in the ordinary course. While at this time we believe that our directors and officers insurance carriers will continue to reimburse us for legal fees, there can be no assurance that such reimbursement will continue in the future.
At this time, subject to judicial and other risks beyond our control, we do not believe that we will suffer any loss, but if we did, such loss, at this time, cannot be reasonably estimated. Further, subject to judicial and other risks beyond our control, we do not believe that the loss, if any, would be material.
See also Subsequent Events. (Note 16)
6. Prime Table Games, et al. vs. Shuffle Master – On August 25, 2008, Prime Table Games LLC, Derek Webb, Hannah O’Donnell and Prime Table Games
UK (collectively, “Prime Table”) filed suit against the Company in the United States District Court for the Southern District of Mississippi. The complaint primarily involves our Three Card Poker game and alleges that certain alleged conduct of the Company constitutes a violation of various federal antitrust laws and also asserts related claims. Other claims include the following (some of which are related to Three Card Poker and others related to other games): breach
of contract (including certain equitable claims), breach of the duty of good faith and fair dealing, patent infringement, patent misuse and unfair trade practices. Prime Table is seeking in excess of $15,000 in damages, plus various equitable remedies, including without limitation, rescission or reformation of the non-competition and first right of refusal provisions of our Three Card Poker purchase agreement with plaintiffs and a ruling that the Three Card Poker patents are unenforceable.
On August 29, 2008 and October 22, 2008, respectively, Prime Table filed amended complaints. The amended complaints do not materially modify the allegations made in the complaint referenced above and filed on August 25, 2008.
On October 24, 2008, we filed a Motion to Transfer Venue pursuant to 28 U.S.C. § 1404(a). The Motion asks the Court to transfer venue to the United States District Court for the District of Nevada, Southern Division. On November 17, 2008, we filed a Motion to Dismiss several of Prime Table’s causes of
action pursuant to Federal Rule of Civil Procedure 12(b)(6). The motion asks the Court to dismiss certain counts of the Second Amended Complaint, which include most of the antitrust claims. We have not yet received a ruling on either of these Motions.
We believe that the above claims and litigation are without merit and intend to vigorously defend the case. Due to the uncertainty of the ultimate outcome of this matter, the impact, if any, on future financial results is not subject to reasonable estimates.
At this time, subject to judicial and other risks beyond our control, we do not believe that we will suffer any loss, but if we did, such loss, at this time, cannot be reasonably estimated. Further, subject to judicial and other risks beyond our control, we do not believe that the loss, if any, would be material.
7. Intellectual property license legal proceeding – On January 8, 2009, we sued Progressive Gaming International Corporation (hereinafter “PGIC”), Private Equity Management Group, Inc., and Private
Equity Management Group Financial Corporation (hereinafter collectively “PEM”) in the Supreme Court for the State of New York, County of New York. The Supreme Court, in New York, is the trial court in that state.
The action sought the issuance of a temporary, preliminary, and permanent injunction prohibiting the alienation, sale, transfer, or encumbrance of certain patents licensed to us. We believe that the sale, on January 15, 2009, of substantially all of the assets of PGIC will include certain patents licensed to us in September 2007,
which we have the right to buy for one dollar each.
On January 12, 2009, we asked the Court for a temporary restraining order prohibiting PGIC or PEM from selling, during the pendency of the arbitration, any patents licensed to us and for an order to show cause why a preliminary injunction should not issue granting the same relief. On that date, the Court denied our request for
a temporary restraining order. The decision was based on the Court’s belief that our rights had been secured by contract and that those rights would survive any planned sale and would be binding upon any subsequent acquirer of the patents. In other words, the Court apparently believed that we will not be irreparably injured by any sale, given the survivorship of our rights. Further, the denial of the temporary restraining order was not a decision on the merits of our claim
of rights to the licensed patents.
These proceedings do not affect the following items which were material in regards to the purchase of PGIC’s worldwide Table Games Division: our rights in the progressive table game software and hardware; the Caribbean Stud game; Texas Hold’em Bonus game; and the broad range of intellectual property that complements
our existing PTG business.
However, if the licensed patents are, in fact, sold to a third party, especially a competitor, we could face disputes about the scope of our rights, claims of infringement and ongoing possible infringement and validity of the non-compete provisions as well as ongoing legal fees in attempting to enforce our rights. Further, while we believe
that our license rights to the licensed patents would survive any sale and remain in full force and effect, there is still a risk that a court or arbitrator would disagree with our legal positions.
Between January 16, 2009 and January 19, 2009, PGIC and certain of its subsidiaries entered into various agreements with PEM and International Game Technology (“IGT”) and certain of its affiliates, pursuant to which IGT acquired substantially all of PGIC's domestic and foreign assets, along with all of PEM's rights under PGIC's
existing senior credit facility, for an aggregate cash purchase price of $16,237. This transaction included the purchase by IGT of at least some of the patents that are the subject of this proceeding.
On February 17, 2009, we reached an agreement with IGT in the form of a Binding Term Sheet. This agreement should materially resolve our rights in the known material patents that are part of the PGIC TGD acquisition and the associated patent license agreement. In addition, in February 2009, we executed the Royalty Acceleration
Agreement with PGIC and IGT that allowed us to pay, at a discount, the minimum discounted consideration of $2,247 due as of January 31, 2009, under the PGIC TGD acquisition and certain other potential royalties due under both the PGIC TGD acquisition and the SDLA dated September 26, 2007. On February 18, 2009, we paid $960 pursuant to the Royalty Agreement in full satisfaction of the PGIC TGD minimum consideration and other potential future royalties, including, but not limited to, amounts in excess
of $4,679 of prepaid royalties paid under the SDLA. See Notes 2, 3 and 5 for detailed discussion related to the PGIC prepaid royalty and PGIC TGD minimum consideration. Furthermore, on February 17, 2009, we also executed a Waiver Agreement with IGT, whereas IGT agreed not to contest that our payment of $960 stated in the Royalty Agreement was not fair, complete and/or adequate satisfaction of all present and future monetary obligations owed to PGIC as it relates to the PGIC TGD acquisition
and the SDLA. Accordingly, under the Waiver Agreement, we should have no material further financial obligations to PGIC and/or IGT related to the PGIC TGD acquisition and the SDLA.
On April 8, 2009, for no cash consideration by either party, SMI entered into a mutual release with PEM related to the above events.
This matter is now resolved; however, see Note 16 Subsequent Events, #9, as to the SSI Case. The resolution of the SSI Case could adversely impact the intellectual property rights, described above, which we obtained from IGT, as well as the royalty reduction pursuant to the Royalty Agreement.
Subject to the foregoing, we do not believe that we will suffer any loss, but if we did, such loss, at this time, cannot be reasonably estimated. Further, subject to judicial risks beyond our control, we do not believe that the loss, if any, would be material.
8. TableMAX - On April 14, 2009, TableMAX IP Holdings, Inc. and TableMAX Gaming, Inc. (hereinafter collectively “TableMAX”) filed a Complaint against
us in the United States District Court for the District of Nevada. This case is a patent infringement claim alleging that our Table Master™ product infringes the following U.S. Patents: 5,688,174, 6,921,337 and 7,201,667. The Complaint seeks injunctive relief and an unspecified amount of damages including claims for attorney’s fees, costs, increased damages and disbursements. On August 13,
2009, TableMAX voluntarily dismissed the First Complaint. On the same date, TableMAX and Vegas Amusement, Inc. (the alleged owner of U.S. Patents: 5,688,174, 6,921,337 and 7,201,667) filed a new complaint (the “New Complaint”) making allegations materially the same as the allegations in the First Complaint. On August 19, 2009, the Plaintiffs filed an amended complaint (the “Second Complaint”). The Second Complaint superseded and is materially the same as
the New Complaint, except that the Plaintiffs added a new claim that Table Master® infringes U.S. Patent 7,575,512. U.S. Patent 7,575,512 was issued on August 18, 2009. On August 19, 2009, the Plaintiffs filed a Motion for Preliminary Injunction in the Second Complaint based on U.S. Patent 7,575,512. The Motion for Preliminary Injunction sought to enjoin future sales of our Table Master ® product. On
October 26, 2009, the Court denied the Motion for Preliminary Injunction without hearing oral argument. The Court also denied without prejudice various motions for summary judgment which SMI filed.
We deny any liability or wrongdoing. We believe that the above claims and litigation are without merit and intend to vigorously defend the case. Due to the uncertainty of the ultimate outcome of this matter, the impact, if any, on future financial results is not subject to reasonable estimates.
See also Subsequent Events. (Note 16)
9. Smart Shoes, Inc. (the “SSI Case”) - On April 22, 2009, we filed a Complaint for declaratory relief against Smart Shoes, Inc. and Otho D. Hill (hereinafter collectively “SSI”), in the Eighth
Judicial District Court, Clark County, Nevada. The declaratory relief claim seeks a judicial finding that we do not owe any money concerning SSI’s claim that we owe approximately $1,100 in regards to certain known material patents discussed above in the “Intellectual Property Licensing Proceeding ” (hereinafter “Hill Patents”). We believe that the approximate amount of $1,100, if it is owed, is owed by
PGIC or possibly others, but not us. On May 26, 2009, the Defendants removed the matter to the United States District Court for the District of Nevada. On June 9, 2009, the Defendants filed an Answer and Counterclaims which included the following claims: rescission of the assignment agreements between the Defendants and PGIC for certain patents and imposition of a constructive trust; declaration of priority of rights as to the certain patents under the Federal Patent Laws; the
Defendants’ priority of rights as to the certain patents based on prior recorded assignments; the Defendants’ priority of rights as to the certain patents based on prior assignments; and the Defendants’ priority of rights in the certain patents based on the Nevada Uniform Commercial Code. On July 2, 2009, we filed a Motion to Remand the entire case to the Eighth Judicial District Court, Clark County, Nevada and a Motion to Dismiss all of the Defendants’ counterclaims. On
October 14, 2009, the Court granted SMI’s Motion to Remand and denied the Motion to Dismiss as moot. The case is no longer pending in Federal Court.
We believe that SSI’s claim is without merit, we deny any liability or wrongdoing and we intend to vigorously pursue our rights. Due to the uncertainty of the ultimate outcome of this matter, the impact, if any, on future financial results is not subject to reasonable estimates.
See also Subsequent Events. (Note 16)
10. Rapid Baccarat Macau patent issue – On or about June 3, 2009, at the G2E Asia Gaming Show, customs officials from the Macau SAR seized our one Rapid Baccarat® unit
related to a claim of patent infringement by an alleged Macau patent owner of an alleged Macau patent. There is the possibility of future legal proceedings being commenced against our subsidiary, Shuffle Master Asia Limited (“SMAL”) and its directors in Macau relating to this patent, although, at this time, no such proceedings have been commenced. Such proceedings, if initiated, would be for patent infringement, a criminal matter in Macau. On October 27, 2009, the governmental official
in charge of the investigation elected to dismiss the investigation based on there being no patent infringement and also based on the report of the Macau Customs SAR. We deny any liability or wrongdoing. We believe the claim is without merit. If any legal proceedings were to be commenced against us, we would vigorously contest such proceedings. Due to the uncertainty of the ultimate outcome of this matter, the impact, if any, on future financial results is not subject
to reasonable estimates.
See also Subsequent Events. (Note 16)
16. SUBSEQUENT EVENTS
Legal proceedings update.
3. GEI – On November 24, 2009, Gaming Entertainment, Inc. filed bankruptcy which stays all collection activities against Gaming Entertainment, Inc.
5. Shareholder Derivative Lawsuit I and II –
The Special Demand Review Committee of the Board of Directors of Nominal Defendant Shuffle Master, Inc. filed a Motion to Dismiss in the consolidated Pirelli case on November 2, 2009. We expect the Plaintiffs to file an opposition to the Motion sometime on or before April 19, 2010 with a ruling on the Motion sometime in calendar
year 2010.
Shareholder Derivative Lawsuit III (the “State Derivative Lawsuit”)
On November 9, 2009, Gerard Denham, derivatively on behalf of Nominal Defendant Shuffle Master, Inc., filed a lawsuit in the Eighth Judicial District Court, Clark County, Nevada, against the following Defendants: Mark L. Yoseloff, Richard L. Baldwin, Garry W. Saunders, Louis Castle, Phillip Peckman, John Bailey, Todd D. Jordan,
Ken Robson, William Warner and Nominal Defendant, Shuffle Master, Inc. The claims in this case are substantively similar to Shareholder Derivative Lawsuit I and II discussed above. Defendant Yoseloff is our former CEO. Defendant Baldwin is our former CFO. Defendants Saunders, Castle, Peckman and Bailey are present members of our Board of Directors. Defendants Jordan, Robson and Warner are
former members of our Board of Directors. The claims stem from a demand made by the Plaintiff on our Board of Directors in July 2007 and the September 2009 rejection of the demand in a letter by a Special Demand Review Committee created by our Board. The Complaint contains the following claims against all Defendants:
|
|
1. |
Breach of fiduciary duties for disseminating false and misleading statements. |
|
|
2. |
Breach of fiduciary duties for failing to maintain internal controls. |
|
|
3. |
Unjust enrichment. |
|
|
4. |
Abuse of control. |
|
|
5. |
Gross mismanagement. |
On December 21, 2009, a Special Demand Review Committee of the Company’s Board filed a motion to dismiss the State Derivative Lawsuit based upon its investigation and business judgment. The motion is currently set for hearing on January 26, 2010. The lawsuit is presently pending.
We believe that the claims in the Pirelli case and the State Derivative Lawsuit are without merit and intend to vigorously defend the cases. Due to the uncertainty of the ultimate outcome of these matters, the impact, if any, on future financial results is not subject to reasonable estimates. However, we have tendered the cases
to our directors and officers insurance carriers. Thus far, reimbursement by our directors and officers insurance carriers for substantially all of the legal fees incurred for the cases has occurred in the ordinary course. While at this time we believe that our directors and officers insurance carriers will continue to reimburse us for legal fees, there can be no assurance that such reimbursement will continue in the future.
8. TableMAX- During the discovery process TableMAX has made new allegations that certain of our Vegas Star® products infringe one of the patents in the Second Complaint. We deny these allegations
and believe that these allegations are untrue.
9. Smart Shoes - In an adversary proceeding by SSI in the United States Bankruptcy Court District of Nevada against the trustee of Progressive Gaming International Corporation (“PGIC”), the trustee filed
Motions to: (1) approve compromise and settlement pursuant to Bankruptcy Rule 9019 approving settlement between Smart Shoes, Inc. and Otho D. Hill and Progressive Gaming International Corporation fdba Mikohn Gaming Corporation; and (2) approve conferral of derivative rights to sue on Smart Shoes, Inc. and Otho D. Hill. The Motions are set for hearing on January 26, 2010. If these Motions are granted by the Court then: (1) SSI’s agreement with PGIC regarding the Hill Patents
would be rescinded; (2) SSI would have the right to try and bring an avoidance action against us, PEM and IGT regarding the transaction between PEM and IGT between January 16 and 19, 2009 and the agreement of February 17, 2009 between us and IGT referenced above in “Intellectual Property License Proceedings ”(hereinafter “Foreclosure”). If the court grants the trustee’s Motions and SSI were able to succeed in an
avoidance action against us then: (i) we may have to pay approximately $1,530 in additional royalties; and (ii) the rights that we received in regards to the known material patents that are part of the PGIC TGD acquisition and the associated patent license agreement may be adversely affected; and (iii) our agreement with IGT, as reflected in the Binding Term Sheet and in the Waiver Agreement, could be modified, terminated or otherwise adversely impact. We intend to oppose the Motions. We can not make
any prediction as to the outcome of these Motions.
We continue to believe SSI’s claim is without merit. However, due to the uncertainty of the ultimate outcome of this matter, as well as how the trustee’s Motions may be decided, the impact, if any, on future financial results and on the Hill Patents which we currently own, is not subject to reasonable estimates.
10. Rapid Baccarat Macau patent issue - The patent holder has appealed the decision to the Macau Court System. If the appeal is successful, then a criminal case for patent infringement against our subsidiary,
Shuffle Master Asia Limited (“SMAL”) and its directors, could be instituted. No proceeding against either SMAL or any of its directors has yet been commenced. We do not know when a decision on the appeal will be reached.
11. Taiwan Fulgent case - On November 17, 2009, we filed a lawsuit for patent infringement against Taiwan Fulgent Enterprise, Co., LTD. (“Taiwan Fulgent”) in the United States District Court for the District
of Nevada. The lawsuit alleges that a certain type of Taiwan Fulgent product infringes the following U.S. patents: 6,588,751; 7,255,344 and 7,322,576 (hereinafter “SMI Patents in Suit”). This Taiwan Fulgent product is a continuous shuffler similar to our one2six product. We believe that the SMI Patents in Suit are valid and infringed, but, like in any patent lawsuit, there is a risk that a court will disagree with us on one or both of those issues.
ITEM 9. CHANGES IN AND DISAGREEMENTS WITH ACCOUNTANTS ON ACCOUNTING AND FINANCIAL DISCLOSURE
None.
ITEM 9A. CONTROLS AND PROCEDURES
Evaluation of Disclosure Controls and Procedures
We maintain disclosure controls and procedures that are designed to provide reasonable assurance that information required to be disclosed in our reports under the Securities Exchange Act of 1934 is recorded, processed, summarized and reported within the time period specified in the Securities and Exchange Commission’s rules and forms
and that such information is accumulated and communicated to our management, including our Chief Executive Officer and Chief Financial Officer, as appropriate, to allow timely decisions regarding required disclosure.
As required by Rule 13a-15(b) promulgated under the Exchange Act, our management, with the participation of our Chief Executive Officer and Chief Financial Officer, evaluated the design and operating effectiveness as of October 31, 2009 of our disclosure controls and procedures, as defined in Rule 13a-15(e) promulgated under the Exchange
Act. Based on this evaluation our Chief Executive Officer and Chief Financial Officer concluded that our disclosure controls and procedures were effective as of October 31, 2009. Therefore, we believe that the consolidated financial statements included in this Annual Report on Form 10-K correctly present our financial condition, results of operations and cash flows for the periods covered thereby in all material respects.
Internal Control Over Financial Reporting
Management’s Report on Internal Control Over Financial Reporting
Internal control over financial reporting (as defined in Rules 13a-15(f) and 15d-15(f) under the Exchange Act) refers to the process designed by, or under the supervision of, our Chief Executive Officer and Chief Financial Officer and effected by our board of directors, management and other personnel, to provide reasonable assurance regarding
the reliability of financial reporting and the preparation of financial statements for external purposes in accordance with generally accepted accounting principles. Management is responsible for establishing and maintaining adequate internal control over financial reporting.
Because of its inherent limitations, internal control over financial reporting may not prevent or detect misstatements. Also, the application of any evaluation of effectiveness to future periods is subject to the risk that controls may become inadequate because of changes in conditions, or that compliance with the policies or procedures
may deteriorate.
We have evaluated the effectiveness of our internal control over financial reporting as of October 31, 2009. This evaluation was performed using the Internal Control – Evaluation Framework developed by the Committee of Sponsoring Organizations of the Treadway Commission
(“COSO”). Based on such evaluation, management concluded that our internal control over financial reporting was effective as of October 31, 2009.
Prior Year Material Weakness
A material weakness is a deficiency, or a combination of deficiencies, in internal control over financial reporting, such that there is a reasonable possibility that a material misstatement of the company’s annual or interim financial statements will not be prevented or detected on a timely basis. Because of the material
weakness described below, management concluded that our internal control over financial reporting was not effective as of October 31, 2008.
The specific material weakness identified by management as of October 31, 2008, is described as follows:
Our cycle count process to track domestic raw materials through the manufacturing process was ineffective resulting in errors in the recorded inventory balance. These errors were not detected timely due to deficiencies in the design and operation of our periodic counting procedures. Although these deficiencies did not result in a material
misstatement for the period ended October 31, 2008, the Company’s compensating monitoring controls were not operating at a sufficient level of precision, to prevent or timely detect a material misstatement in our inventory for an interim or annual period.
Subsequent to October 31, 2008, the Company implemented measures to remedy the material weakness described above. Such remediation efforts included, but were not limited to, the following actions:
|
|
· |
Modified the period end closing procedures to include physical counts of all inventory. |
As of October 31, 2009, we concluded that the controls designed to track raw materials through the manufacturing process were operating effectively at fiscal year end to ensure inventory was accurately stated at year end and that we have remediated this material weakness.
Deloitte & Touche LLP audited the Company’s consolidated financial statements as of and for the year ended October 31, 2009 and issued their reports thereon, which is included in this Form 10-K.
Deloitte and Touche LLP has also issued an attestation report on the effectiveness of our internal control over financial reporting for the fiscal year ended October 31, 2009. This report follows this Item 9A.
Changes in Internal Control Over Financial Reporting
Except for the remediation initiatives with respect to the material weakness described above, there have been no changes in our internal control over financial reporting that occurred during our fourth quarter of our fiscal year ended October 31, 2009, that have materially affected, or are reasonable likely to materially affect, our internal
control over financial reporting.
REPORT OF INDEPENDENT REGISTERED PUBLIC ACCOUNTING FIRM
To the Board of Directors and Stockholders of
Shuffle Master, Inc.
Las Vegas, Nevada
We have audited the internal control over financial reporting of Shuffle Master, Inc. and subsidiaries (the "Company") as of October 31, 2009, based on criteria established in Internal Control — Integrated Framework issued by the Committee of Sponsoring Organizations of the Treadway
Commission. The Company's management is responsible for maintaining effective internal control over financial reporting and for its assessment of the effectiveness of internal control over financial reporting included in the accompanying Management’s Report on Internal Control Over Financial Reporting. Our responsibility is to express an opinion on the Company's internal control over financial reporting based on our audit.
We conducted our audit in accordance with the standards of the Public Company Accounting Oversight Board (United States). Those standards require that we plan and perform the audit to obtain reasonable assurance about whether effective internal control over financial reporting was maintained in all material respects. Our audit
included obtaining an understanding of internal control over financial reporting, assessing the risk that a material weakness exists, testing and evaluating the design and operating effectiveness of internal control based on that risk, and performing such other procedures as we considered necessary in the circumstances. We believe that our audit provides a reasonable basis for our opinion.
A company's internal control over financial reporting is a process designed by, or under the supervision of, the company's principal executive and principal financial officers, or persons performing similar functions, and effected by the company's board of directors, management, and other personnel to provide reasonable assurance regarding
the reliability of financial reporting and the preparation of financial statements for external purposes in accordance with generally accepted accounting principles. A company's internal control over financial reporting includes those policies and procedures that (1) pertain to the maintenance of records that, in reasonable detail, accurately and fairly reflect the transactions and dispositions of the assets of the company; (2) provide reasonable assurance that transactions are recorded as necessary to
permit preparation of financial statements in accordance with generally accepted accounting principles, and that receipts and expenditures of the company are being made only in accordance with authorizations of management and directors of the company; and (3) provide reasonable assurance regarding prevention or timely detection of unauthorized acquisition, use, or disposition of the company's assets that could have a material effect on the financial statements.
Because of the inherent limitations of internal control over financial reporting, including the possibility of collusion or improper management override of controls, material misstatements due to error or fraud may not be prevented or detected on a timely basis. Also, projections of any evaluation of the effectiveness of the internal
control over financial reporting to future periods are subject to the risk that the controls may become inadequate because of changes in conditions, or that the degree of compliance with the policies or procedures may deteriorate.
In our opinion, the Company maintained, in all material respects, effective internal control over financial reporting as of October 31, 2009, based on the criteria established in Internal Control — Integrated Framework issued by the Committee of Sponsoring Organizations
of the Treadway Commission.
We have also audited, in accordance with the standards of the Public Company Accounting Oversight Board (United States), the consolidated financial statements as of and for the year ended October 31, 2009 of the Company and our report dated January 14, 2009 expressed an unqualified opinion on those financial statements and includes an explanatory
paragraph regarding the Company’s adoption of recent provisions for accounting for uncertainty in income taxes on November 1, 2007.
/s/ Deloitte & Touche LLP
Las Vegas, Nevada
January 14, 2010
ITEM 9B. OTHER INFORMATION
None.
PART III
ITEM 10. DIRECTORS, EXECUTIVE OFFICERS AND CORPORATE GOVERNANCE
|
· |
Information regarding our directors, including the audit committee financial expert, appears under the caption “Election of Directors” in our Fiscal 2009 Proxy Statement and is incorporated herein by reference. |
|
· |
Executive Officers of the Registrant. The information under the caption “Executive Officers” in our Fiscal 2009 Proxy Statement is incorporated herein by reference. |
|
· |
Corporate Governance. The information under the caption “Corporate Governance” in our Fiscal 2009 Proxy Statement is incorporated herein by reference. |
|
· |
Compliance with Section 16(a) of the Exchange Act. The information under the caption “Section 16(a) Beneficial Ownership Reporting Compliance” in our Fiscal 2009 Proxy Statement is incorporated herein by reference. |
|
· |
Information regarding our Code of Conduct appears in our Fiscal 2009 Proxy Statement, under the caption “Proposal 1—Election of Directors—Corporate Governance—Compliance Committee,” and is incorporated herein by reference. |
|
· |
Our Code of Conduct is publicly available on our website at www.shufflemaster.com and is also available in print to any shareholder upon request. Our website address is intended to be an inactive, textual reference only; none of the material on the website is part of this report. We may revise these policies from time to time and will promptly post any revisions
on our website. If we grant any waiver from a provision of the Code of Conduct to our Chief Executive Officer or Chief Financial Officer, we will disclose the nature of such amendment or waiver on our website or in a report on Form 8-K. |
ITEM 11. EXECUTIVE COMPENSATION
The information under the captions “Compensation Discussion and Analysis,” “Executive Compensation Tables,” “Independent Director Compensation,” “Certain Relationships and Related Party Transactions—Compensation Committee Interlocks
and Insider Participation,” and “Compensation Committee Report,” in our Fiscal 2009 Proxy Statement is incorporated herein by reference.
ITEM 12. SECURITY OWNERSHIP OF CERTAIN BENEFICIAL OWNERS AND MANAGEMENT AND RELATED STOCKHOLDER MATTERS
The information under the captions “Security Ownership of Certain Beneficial Owners and Management” and “Equity Compensation Plan Information” in our Fiscal 2009 Proxy Statement is incorporated herein by reference.
ITEM 13. CERTAIN RELATIONSHIPS AND RELATED TRANSACTIONS AND DIRECTOR INDEPENDENCE
The information under the captions “Certain Relationships and Related Party Transactions” and “Corporate Governance—Director Independence” in our Fiscal 2009 Proxy Statement is incorporated herein by reference.
ITEM 14. PRINCIPAL ACCOUNTANT FEES AND SERVICES
Information regarding our principal accountant fees and services and the Audit Committee’s approval policies and procedures appears in our Fiscal 2009 Proxy Statement under the captions “Independent Registered Public Accountant” and “Report of the Audit Committee” and is incorporated herein by reference.
PART IV
|
(a) |
1. |
Financial Statements | |
|
See index to consolidated financial statements included as Item 8 to this Annual Report on Form 10-K. | |||
|
2. |
Financial Statement Schedules | ||
|
See Item 8 to this Annual Report on Form 10-K for applicable financial statement schedules. | |||
|
3. |
Management Contracts, Compensatory Plans and Arrangements | ||
|
Management contracts, compensatory plans and arrangements are indicated by the symbol “†” in exhibits 10.1 through 10.39 included in Item 15(b) of this Annual Report. | |||
|
(b) |
Exhibits | ||
|
3.1 |
Articles of Incorporation of Shuffle Master, Inc. as amended July 15, 1992 (Incorporated by reference to exhibit 3.2 in our Annual Report on Form 10-K for the year ended October 31, 1995). | ||
|
3.2 |
Articles of Amendment to Articles of Incorporation of Shuffle Master, Inc., effective January 14, 2005 (Incorporated by reference to exhibit 3.2 to our Annual Report on Form 10-K, filed January 13, 2005). | ||
|
3.3 |
Articles of Correction of Articles of Amendment of Articles of Incorporation of Shuffle Master, Inc., effective March 15, 2005 (Incorporated by reference to exhibit 3.1 to our Current Report on Form 8-K, filed March 18, 2005). | ||
|
3.4 |
Amended and Restated Bylaws of Shuffle Master, Inc., effective November 11, 2008 (Incorporated by reference to exhibit 3.4 to our Current Report on Form 8-K, filed November 13, 2008). | ||
|
4.1 |
Registration Rights Agreement dated May 13, 2004, by and between Casinos Austria AG on the one hand and Shuffle Master, Inc. on the other hand (Incorporated by reference to exhibit 10.2 in our Quarterly Report on Form 10-Q for the quarter ended April 30, 2004). | ||
|
10.1† |
Shuffle Master, Inc. 2002 Stock Option Plan (Incorporated by reference to Exhibit B in our Proxy Statement dated February 11, 2002). | ||
|
10.2† |
Amendment to the Shuffle Master, Inc. 2002 Stock Option Plan (Incorporated by reference to exhibit 10.33 in our Quarterly Report on Form 10-Q for the quarter ended April 30, 2002). | ||
|
10.3† |
Shuffle Master, Inc. Restated Outside Directors’ Option Plan dated January 24, 2002 (Incorporated by reference to exhibit 10.32 in our Annual Report on Form 10-K for the year ended October 31, 2001). | ||
|
10.4† |
Shuffle Master, Inc. 2004 Equity Incentive Plan for Non-Employee Directors (Incorporated by reference to our Proxy Statement dated February 23, 2004). | |
|
10.5† |
Employment Agreement, by and between Shuffle Master, Inc. and Brooke Dunn, dated January 9, 2006 (Incorporated by reference to exhibit 10.5 in our Annual Report on Form 10-K for the year ended October 31, 2005). | |
|
10.6† |
Employment Agreement by and between Shuffle Master, Inc. and Paul Meyer dated October 31, 2005 (Incorporated by reference to exhibit 10.1 in our Current Report on Form 8-K, filed on November 4, 2005). | |
|
10.7 |
Distributorship Agreement by and between Machines Games Automatics, S.A. and Shuffle Master GMBH & CO KG dated May 17, 2005 (request for confidential treatment filed with SEC) (filed as exhibit 10.1 to our Current Report on Form 8-K, filed September 16, 2005). | |
|
10.8 |
Call Option Deed by and between Shuffle Master, Inc. and CVC Limited dated November 15, 2005 (Incorporated by reference to exhibit 10.1 of our Current Report on Form 8-K, filed November 15, 2005). | |
|
10.9 |
Call Option Deed by and between Shuffle Master, Inc. and CVC Communication and Technology Pty Ltd. dated November 15, 2005 (Incorporated by reference to exhibit 10.2 of our Current Report on Form 8-K, filed November 15, 2005). | |
|
10.10 |
Pre-Bid Agreement between Shuffle Master, Inc. and Stargames Corporation Pty Limited dated November 15, 2005 (Incorporated by reference to exhibit 10.3 of our Current Report on Form 8-K, filed November 15, 2005). | |
|
10.11 |
Shuffle Master Australasia Pty Ltd’s Bidder Statement, along with Stargames’ Target Statement, each dated November 15, 2005 (Incorporated by reference to exhibit 10.4 of our Current Report on Form 8-K, filed November 15, 2005). | |
|
10.12 |
Patent Licensing Agreement between Shuffle Master, Inc. and Progressive Gaming International Corporation dated September 29, 2006 (Request for Confidential Treatment filed with SEC). | |
|
10.13 |
Credit Agreement, dated November 30, 2006, among Shuffle Master, Inc., Deutsche Bank Trust Company Americas, Deutsche Bank, Deutsche Bank Securities, Inc. and Wells Fargo Bank, N.A. (Incorporated by reference to exhibit 10.1 of our Current Report on Form 8-K, filed December 6, 2006). | |
|
10.14 |
Amendment No. 1, dated April 5, 2007 to the Credit Agreement, dated as of November 30, 2006, among Shuffle Master, Inc., Deutsche Bank Trust Company Americas, as Administrative Agent and the lenders party thereto (Incorporated by reference to exhibit 10.1 in our Current Report on Form 8-K, filed April 6,
2007). | |
|
10.15 |
Security Agreement, dated November 30, 2006, between Shuffle Master, Inc. and the guarantors party thereto in favor of Deutche Bank Trust Company Americas (Incorporated by reference to exhibit 10.2 of our Current Report on Form 8-K, filed December 6, 2006). | |
|
10.16 |
Purchase Agreement by and among Shuffle Master, Inc., on the one hand, and Progressive Gaming International and Progressive Games, Inc. on the other hand, dated September 26, 2007 (Incorporated by reference to exhibit 10.1 (a) in our Current Report on form 8-K, filed September 28, 2007). |
|
10.17 |
Amended and Restated License Agreement by and among Shuffle Master, Inc., on the one hand, and Progressive Gaming International on the other hand, dated September 26, 2007 (Incorporated by reference to exhibit 10.1 (b) in our Current Report on Form 8-K, filed September 28, 2007). | |
|
10.18 |
Software Distribution License Agreement by and among Shuffle Master, Inc. and its affiliates, on the one hand, and Progressive Gaming International Corporation and its affiliates, on the other hand, dated September 26, 2007 (Incorporated by reference to exhibit 10.1 in our Current Report on form 8-K, filed October 2,
2007). | |
|
10.19† |
First Amendment to Employment Agreement, by and between Shuffle Master, Inc. and Brooke Dunn (Incorporated by reference to exhibit 10.1 in our Current Report on Form 8-K, filed January 11, 2008). | |
|
10.20† |
Employment Agreement, by and between Shuffle Master, Inc. and Coreen Sawdon (Incorporated by reference to exhibit 10.1 in our Current Report on Form 8-K, filed March 6, 2008). | |
|
10.21† |
Second Amendment to Employment Agreement, by and between Shuffle Master, Inc. and Mark L. Yoseloff (Incorporated by reference to exhibit 10.1 in our Current Report on Form 8-K, filed July 11, 2008). | |
|
10.22 |
Amendment No. 2 to Credit Agreement, dated July 14, 2008, among Shuffle Master, Inc., Deutsche Bank Trust company Americas, as Deutsche Bank Securities Inc. and Wells Fargo Bank, N.A (Incorporated by reference to Exhibit 10.28 to Amendment No.1 to the Registration Statement on Form S-1 of Shuffle Master, Inc., Registration No. 333-12000, filed
on July 14, 2008). | |
|
10.23† |
Second Amendment to Employment Agreement, by and between Shuffle Master, Inc. and Brooke Dunn (Incorporated by reference to exhibit 10.1 in our Current Report on Form 8-K, filed November 4, 2008). | |
|
10.24† |
Form of Indemnification Agreement (Incorporated by reference to exhibit 10.26 in our Current Report on Form 8-K, filed November 13, 2008). | |
|
10.25† |
Employment Agreement, by and between Shuffle Master, Inc. and David Lopez (Incorporated by reference to exhibit 10.1 in our Current Report on Form 8-K, filed November 20, 2008). | |
|
10.26† |
First Amendment to Employment Agreement, by and between Shuffle Master, Inc. and David Lopez (Incorporated by reference to exhibit 10.2 in our Current Report on Form 8-K, filed November 20, 2008). | |
|
10.27† |
The Shuffle Master, Inc. 2004 Equity Incentive Plan (As Amended and Restated on December 31, 2008) (Incorporated by reference to exhibit 10.1 in our Current Report on Form 8-K, filed January 7, 2009). | |
|
10.28† |
The Shuffle Master, Inc. 2004 Equity Incentive Plan For Non-Employee Directors (As Amended and Restated on December 31, 2008) (Incorporated by reference to exhibit 10.2 in our Current Report on Form 8-K, filed January 7, 2009). | |
|
10.29† |
Amended and Restated Employment Agreement, by and between Shuffle Master, Inc. and Mark L. Yoseloff (Incorporated by reference to exhibit 10.3 in our Current Report on Form 8-K, filed January 7, 2009). | |
|
10.30† |
Amended and Restated Covenant Not To Compete, by and between Shuffle Master, Inc. and Mark L. Yoseloff (Incorporated by reference to exhibit 10.4 in our Current Report on Form 8-K, filed January 7, 2009). | |
|
10.31† |
Amended and Restated Employment Agreement, by and between Shuffle Master, Inc. and Coreen Sawdon (Incorporated by reference to exhibit 10.5 in our Current Report on Form 8-K, filed January 7, 2009). | |
|
10.32† |
Amended and Restated Employment Agreement, by and between Shuffle Master, Inc. and David Lopez (Incorporated by reference to exhibit 10.6 in our Current Report on Form 8-K, filed January 7, 2009). |
|
10.33† |
Amended and Restated Employment Agreement, by and between Shuffle Master, Inc. and Jerry Smith (Incorporated by reference to exhibit 10.1 in our Annual Report on Form 10-K for the year ended October 31, 2008). | |
|
10.34† |
Amended and Restated Employment Agreement, by and between Shuffle Master, Inc. and Roger Snow (Incorporated by reference to exhibit 10.2 in our Annual Report on Form 10-K for the year ended October 31, 2008). | |
|
10.35† |
Employment Agreement, by and between Shuffle Master, Inc. and Timothy J. Parrott (Incorporated by reference to exhibit 10.1 in our Current Report on Form 8-K, filed February 2, 2009). | |
|
10.36† |
First Amendment to the Amended and Restated Employment Agreement, by and between Shuffle Master, Inc. and Mark L. Yoseloff (Incorporated by reference to exhibit 10.1 in our Current Report on Form 8-K, filed April 15, 2009) | |
|
10.37† |
The Shuffle Master, Inc. 2004 Equity Incentive Plan (as Amended and Restated on January 28, 2009) (Incorporated by reference to Exhibit 10.1 of our Quarterly Report on Form 10-Q, filed June 9, 2009). | |
|
10.38† |
Employment Agreement, by and between Shuffle Master, Inc. and Linster W. Fox (Incorporated by reference to exhibit 10.1 in our Current Report on Form 8-K, filed August 6, 2009). | |
|
10.39† |
Employment Agreement, by and between Shuffle Master, Inc. and Coreen Sawdon (Incorporated by reference to exhibit 10.1 in our Current Report on Form 8-K, filed August 14, 2009). | |
|
21 |
Subsidiaries of Registrant | |
|
23 |
Consent of Independent Registered Public Accounting Firm | |
|
31.1 |
Certification of Chief Executive Officer Pursuant to Section 302 of the Sarbanes-Oxley Act of 2002. | |
|
31.2 |
Certification of Acting Chief Financial Officer Pursuant to Section 302 of the Sarbanes-Oxley Act of 2002. | |
|
32.1* |
Certification of Chief Executive Officer Pursuant to Section 906 of the Sarbanes-Oxley Act of 2002. | |
|
32.2* |
Certification of Acting Chief Financial Officer Pursuant to Section 906 of the Sarbanes-Oxley Act of 2002. |
|
|
Exhibits 32.1 and 32.2 are furnished to accompany this report on Form 10-K but shall not be deemed “filed” for the purposes of Section 18 of the Securities Exchange Act of 1934 or otherwise and shall not be deemed incorporated by reference into any registration statements filed under the Securities Act of 1933. |
SIGNATURES
Pursuant to the requirements of Section 13 or 15(d) of the Securities Exchange Act of 1934, the registrant has duly caused this report to be signed on its behalf by the undersigned, thereunto duly authorized.
|
SHUFFLE MASTER, INC. | ||
|
Dated: January 14, 2010 |
By: |
/s/ TIMOTHY J. PARROTT
Chief Executive Officer |
Pursuant to the requirements of the Securities Exchange Act of 1934, this report has been signed below by the following persons on behalf of the registrant and in the capacities and on the dates indicated:
|
Signature |
Title |
Date | |
|
/s/ TIMOTHY J. PARROTT |
Chief Executive Officer (Principal Executive Officer) |
January 14, 2010 | |
|
Timothy J. Parrott |
|||
|
/s/ LINSTER W. FOX |
Chief Financial Officer (Principal Financial and Accounting Officer) |
January 14, 2010 | |
|
Linster W. Fox |
|||
|
/s/ PHILLIP C. PECKMAN |
Chairman of the Board of Directors |
January 14, 2010 | |
|
Phillip C. Peckman |
|||
|
/s/ LOUIS CASTLE |
Director |
January 14, 2010 | |
|
Louis Castle |
|||
|
/s/ GARRY W. SAUNDERS |
Director |
January 14, 2010 | |
|
Garry W. Saunders |
|||
|
/s/ JOHN R. BAILEY |
Director |
January 14, 2010 | |
|
John R. Bailey | |||
111