Attached files
| file | filename |
|---|---|
| 8-K - FORM 8-K - Howmet Aerospace Inc. | d8k.htm |
| EX-99.1 - TRANSCRIPT OF ALCOA INC. FOURTH QUARTER 2009 EARNINGS CALL - Howmet Aerospace Inc. | dex991.htm |
 [Alcoa
Logo] 4 th Quarter 2009 Earnings Conference January 11, 2010 Exhibit 99.2 |
 [Alcoa
Logo] Today’s discussion may include “forward-looking statements” within the meaning of the Private Securities Litigation Reform Act of 1995. Such statements relate to future events and expectations and involve known and unknown risks and uncertainties. Alcoa’s actual results or actions
may differ materially from those projected in the forward-looking statements. For a summary of the specific risk factors that could cause
results to differ materially from those expressed in the forward-looking
statements, please refer to Alcoa’s Form 10-K for the year ended
December 31, 2008, Forms 10-Q for the quarters ended March 31, 2009,
June 30, 2009, and September 30, 2009, and other reports filed with the Securities and Exchange Commission. 2 Forward-Looking Statements |
 [Alcoa
Logo] Chuck McLane Executive Vice President and Chief Financial Officer 3 |
 [Alcoa
Logo] 4 th Quarter 2009 Financial Overview Cash Sustainability targets achieved Cash from operations of $1.1 billion Free cash flow of $761 million Debt-to-cap at 38.6% down 390 basis points from Q4’08 — Total debt reduced by $759 million since 4Q’08 — Cash on hand of $1.5 billion Loss from continuing operations of $266 million, or $0.27 per share — Restructuring and special items total $275 million, or $0.28 per share Negative impact from currency and energy of $65 million Continued end-market weakness compounded by Aero & IGT destocking 4 , |
 [Alcoa
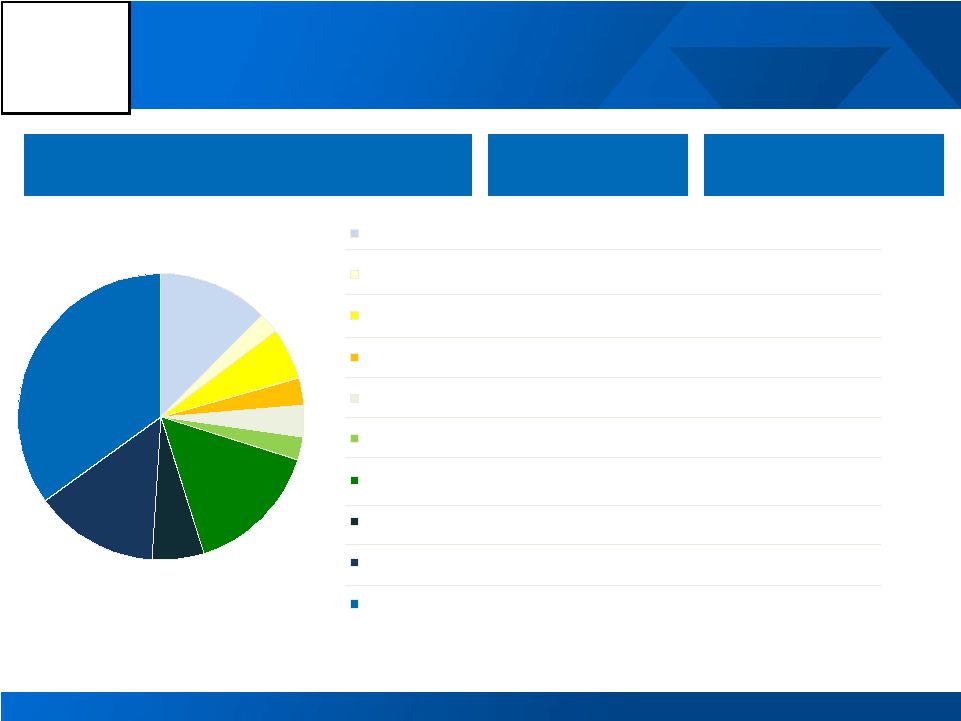
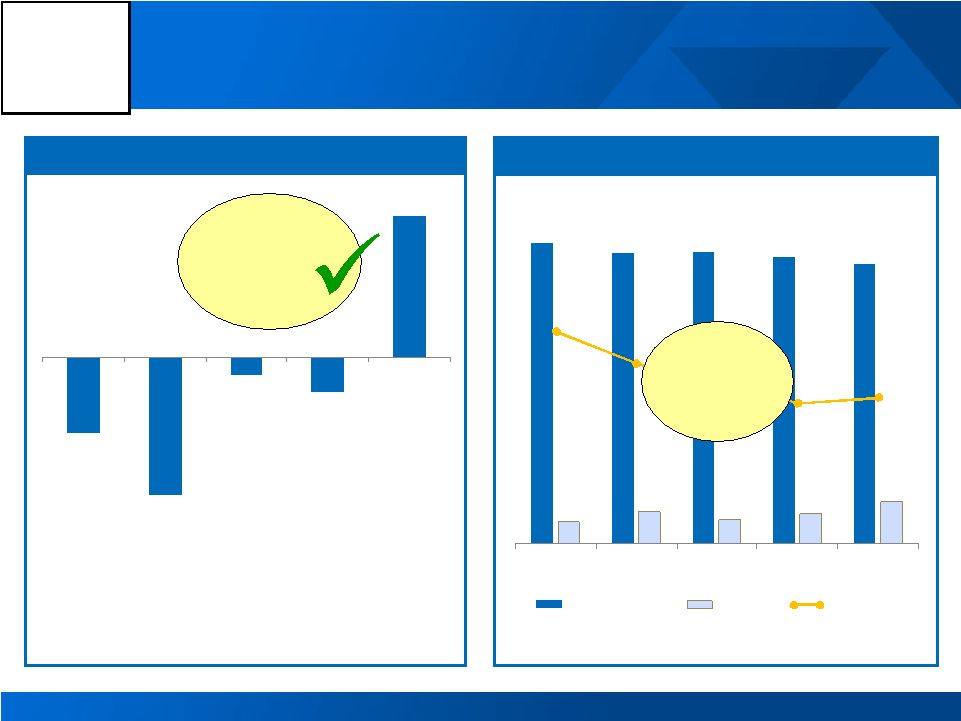
Logo] Revenue Change by Market (3%) 25% (4%) 8% 1% (16%) 4% 11% 43% 39% (21%) (43%) (30%) (45%) (36%) (9%) (21%) (55%) (26%) (35%) 4Q’09 Third Party Revenue Sequential Change Year-Over-Year Change 5 12% 2% 6% 3% 4% 3% 15% 6% 14% 35% Aerospace Automotive B&C Comm. Transport Industrial Products IGT Packaging Distribution/Other Alumina Primary Metals |
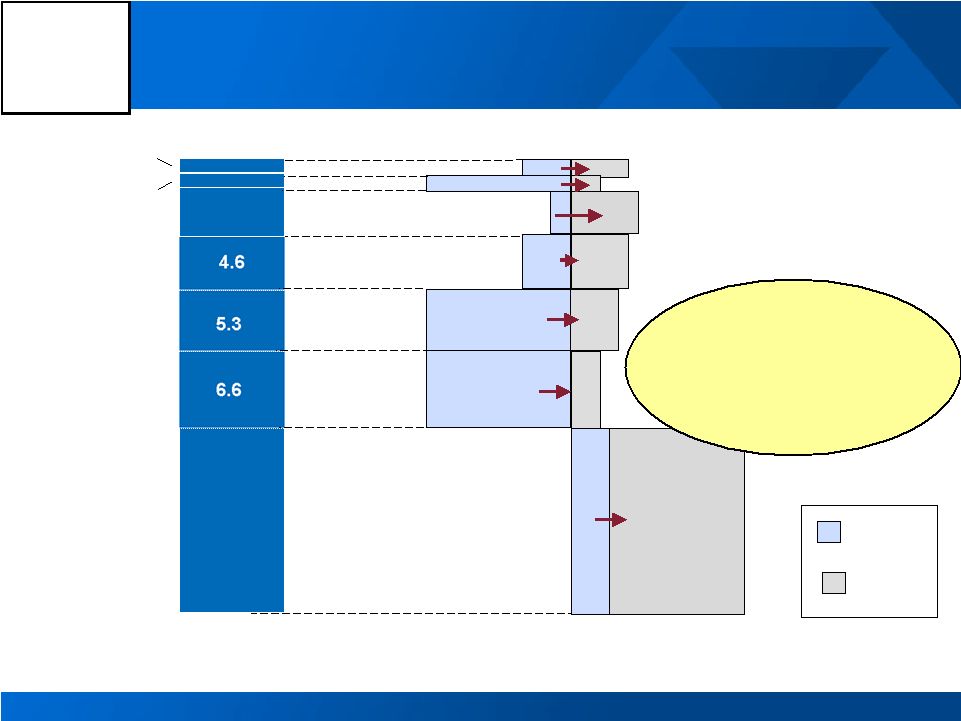
 [Alcoa
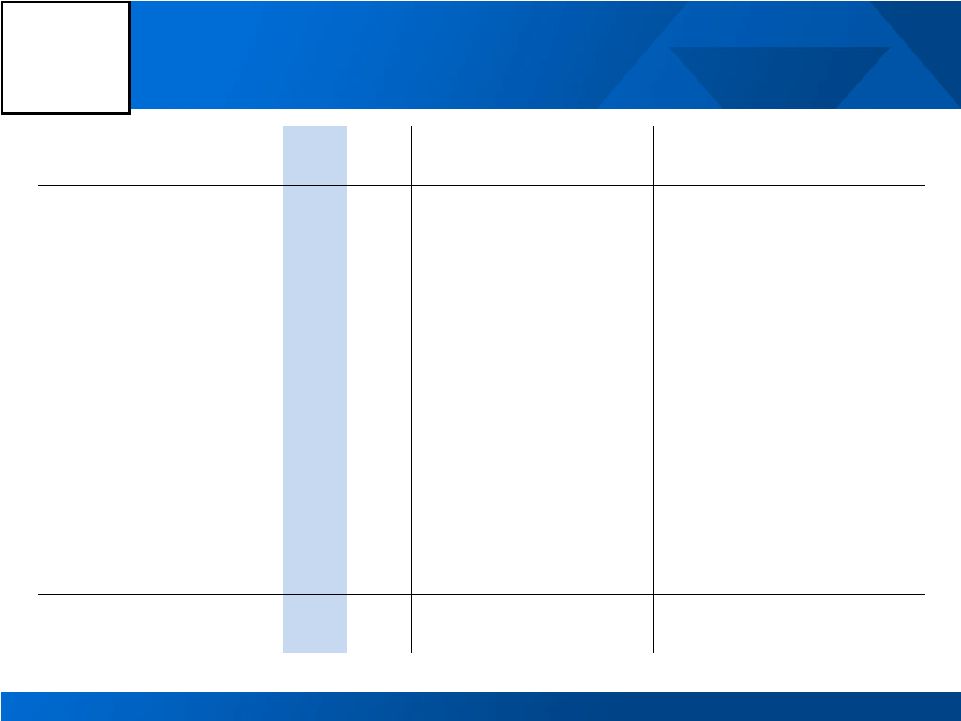
Logo] Sequential Income Statement Summary 6 $ Millions 3Q’09 4Q’09 Change Sales $4,615 $5,433 $818 Cost of Goods Sold $3,888 $4,905 $1,017 COGS % Sales 84.2% 90.3% 6.1 % pts. Selling, General Administrative, Other $234 $291 $57 SGA % Sales 5.1% 5.4% 0.3 % pts. Restructuring and Other Charges $17 $69 $52 Effective Tax Rate (22.4%) 34.8% N/A Income (Loss) from Continuing Operations $73 ($266) ($339) Income (Loss) from Discontinued Operations $4 ($11) ($15) |
 [Alcoa
Logo] 7 4 th Quarter Restructuring and Special Items $ Millions Italy Other After-Tax & Non- Controlling Interests Earnings Per Share Income Statement Classification Segment Restructuring ($15) ($34) ($49) Restructuring Corporate Discrete Tax Items ($41) $123 $82 Taxes Corporate Special Items: Italy Power Drawback ($250) ($250) Cost of Goods Sold Primary Metals Environmental Accrual ($15) ($15) Cost of Goods Sold Corporate MRN Tax Settlement ($24) ($24) COGS / Minority Interest Alumina / Corporate Intalco Repowering ($19) ($19) Other Income / Expense Corporate Total ($321) $46 ($275) ($0.28) |
 [Alcoa
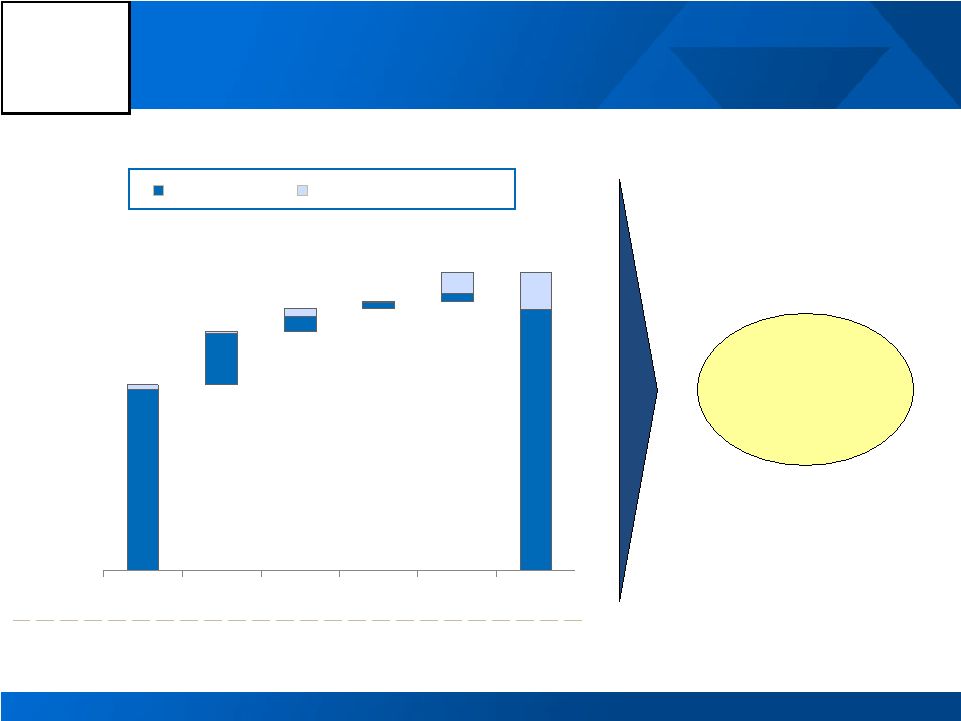
Logo] Total Headcount Reduced By 38% Since Q2’08 8 Charges ($ Millions) 224 48 38 5 36 351 2009 cash savings of $325 million - Run rate savings of $600 million Headcount Reductions Announced by Quarter Completed Not Yet Completed 15,300 4,400 1,950 550 2,400 24,600 2H'08 Q1'09 Q2'09 Q3'09 Q4'09 Total |
 [Alcoa
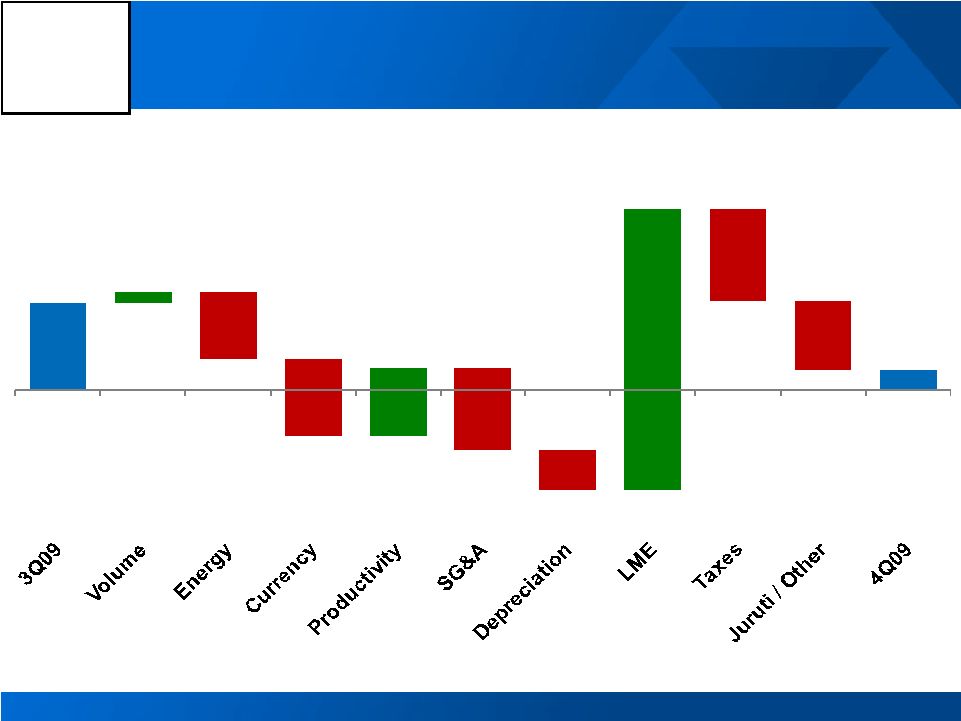
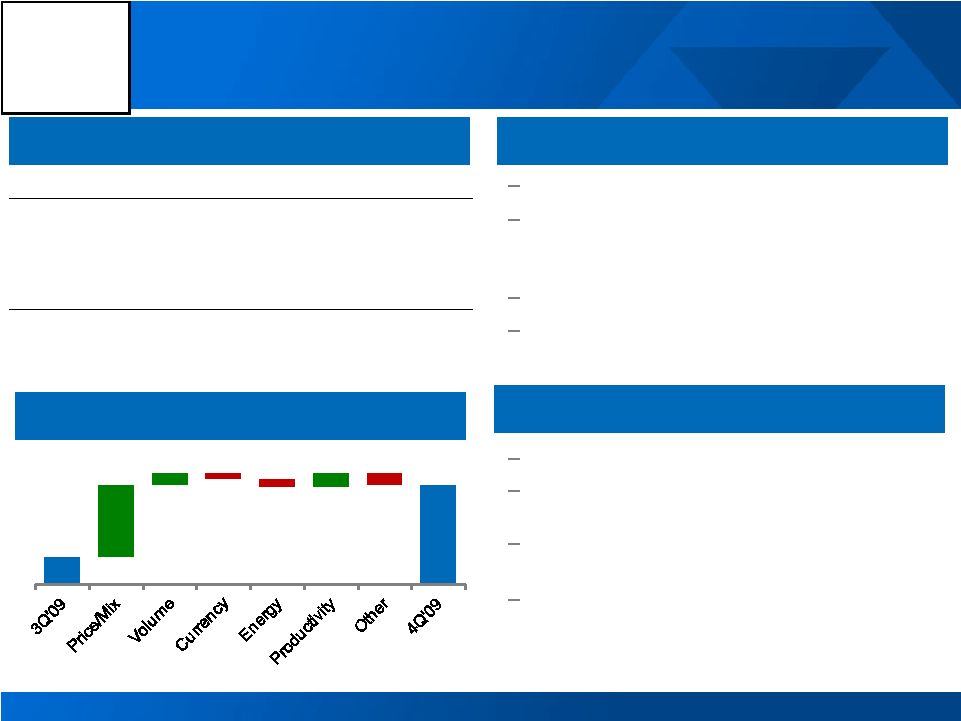
Logo] 4Q'09 vs. 3Q'09 Earnings Bridge Income from Continuing Operations excluding Restructuring & Other Special Items ($ millions) 9 See appendix for reconciliation $39 $5 ($30) ($35) $31 ($37) ($18) $126 ($41) ($31) $9 |
 [Alcoa
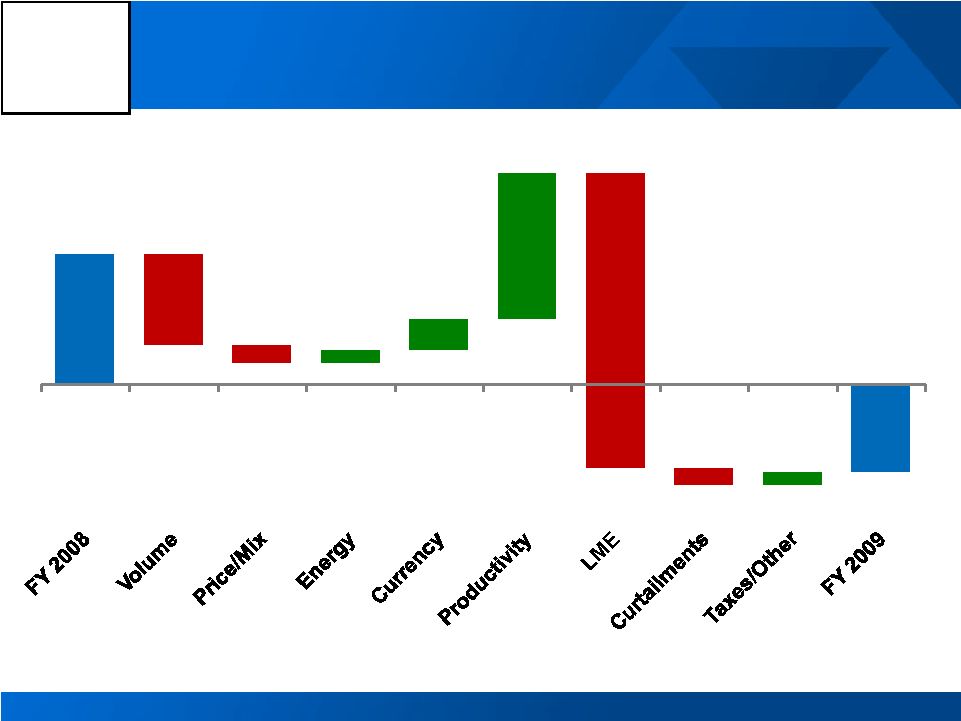
Logo] 2009 vs. 2008 Earnings Bridge Income (Loss) from Continuing Operations excluding Restructuring & Other Special Items ($ millions) See appendix for reconciliation 10 $1,012 ($2,298) ($706) ($139) $97 $246 $1,135 ($133) $101 ($685) |
 [Alcoa
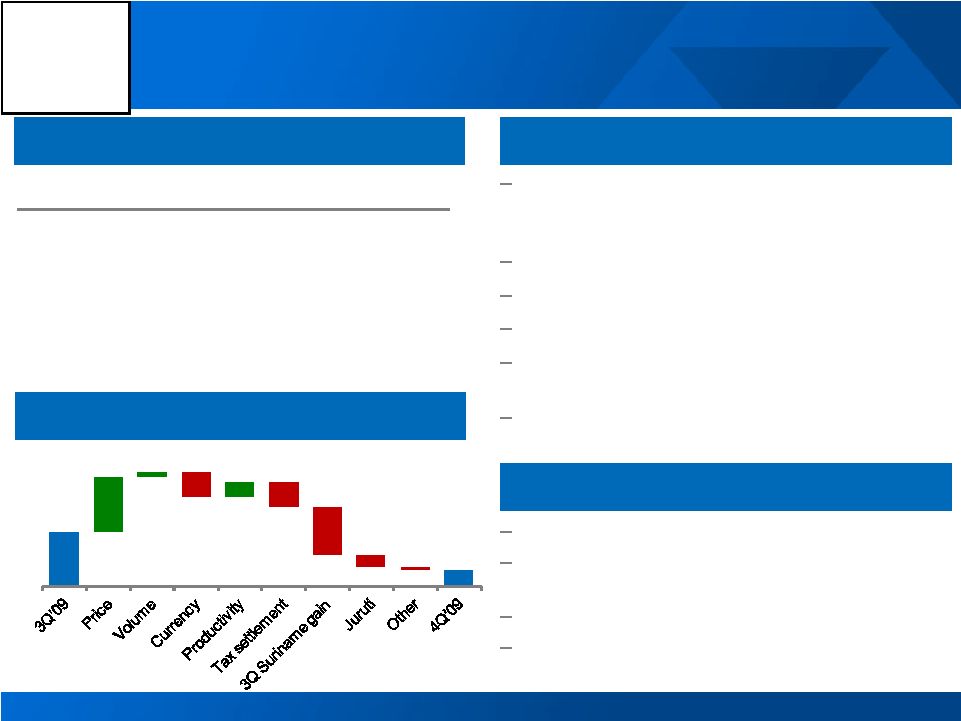
Logo] Alumina 4 th Quarter Highlights 1 st Quarter Outlook 4 th Quarter Business Conditions 11 4Q 08 3Q 09 4Q 09 Production (kmt) 3,776 3,614 3,897 3 rd Party Shipments (kmt) 2,123 2,191 2,716 3 rd Party Revenue ($MM) 722 530 760 ATOI ($MM) 162 65 19 Record quarterly production and third party shipments on market demand and Sao Luis ramp up Realized 3 rd party Alumina price up 15% Negative currency impact of $30 million Tax expense related to litigation of $30 million Lower caustic costs and benefits from cash sustainability initiatives Ramp-up costs of Juruti bauxite mine $14 million sequentially Pricing to follow two month lag on LME Continued benefit from cash sustainability initiatives Continued benefit of lower caustic cost Higher depreciation on growth projects placed into service 4 th Quarter Performance Bridge $ Millions $65 ($14) $19 $66 $7 ($30) $17 ($30) ($58) ($4) |
 [Alcoa
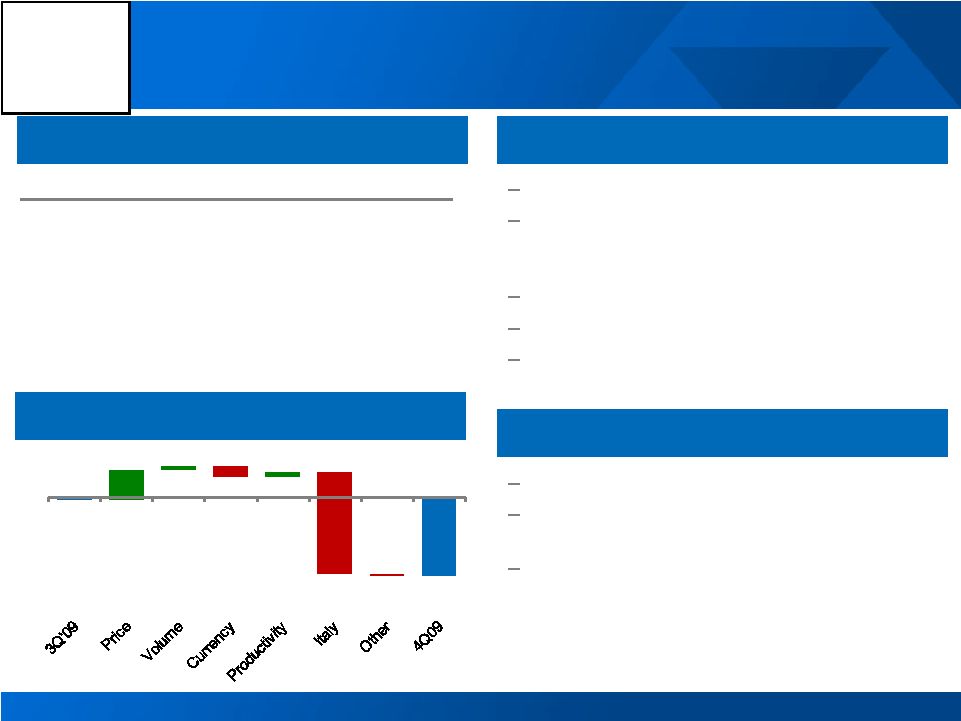
Logo] Primary Metals 4 th Quarter Highlights 4 th Quarter Business Conditions 1 st Quarter Outlook 12 4Q 08 3Q 09 4Q 09 Production (kmt) 971 881 897 3 rd Party Shipments (kmt) 807 698 878 3 rd Party Revenue ($MM) 1,580 1,362 1,900 3 rd Party Price ($/MT) 2,125 1,972 2,155 ATOI ($MM) (101) (8) (214) Realized pricing up 9% Smelter disruption and non-cash cost for Italy power decision negatively affected quarter by $273 million Negative currency impact of $29 million Lower carbon costs Productivity gains Pricing to follow 15 day lag Continued benefit from cash sustainability initiatives Potential Italy curtailment 4 th Quarter Performance Bridge $ Millions ($8) ($214) $82 $9 ($29) $12 ($273) ($7) |
 [Alcoa
Logo] Flat-Rolled Products 13 1 st Quarter Outlook 4 th Quarter Business Conditions 4 th Quarter Highlights ATOI $ Millions 4Q 08 3Q 09 4Q 09 Flat-Rolled Products, excl Russia, China & Other (9) 37 63 Russia, China & Other (97) (27) (26) Total ATOI (106) 10 37 Improved mix and pricing – revenue up 5% Revenue increases in automotive and commercial transportation, offsetting decline in building & construction Gains from cash sustainability initiatives Year-to-date headcount reduction of 25% Cautious demand outlook for aerospace Expecting volume loss in North America can sheet in return for longer-term profitability Continued benefits from cash sustainability initiatives Higher energy costs expected 4 th Quarter Performance Bridge $ Millions $10 $27 $4 ($2) ($3) $5 ($4) $37 |
 [Alcoa
Logo] Engineered Products and Solutions 4 th Quarter Business Conditions 1 st Quarter Outlook 4 th Quarter Highlights 14 Continued destocking in Aerospace supply chain and further decline in IGT sales Improved performance in the Commercial Transportation market Seasonal impact from year-end holiday shutdowns Year over year ATOI % revenue flat with cash sustainability initiatives mitigating a 21% decline in sales Weak market conditions Continued destocking in aerospace fastener and the turbine markets Unfavorable product mix Continued benefit from cash sustainability initiatives $ Millions 4Q 08 3Q 09 4Q 09 3 rd Party Revenue 1,392 1,128 1,097 ATOI 73 75 57 ATOI % of Revenue 5.2% 6.6% 5.2% 4 th Quarter Performance Bridge $ Millions $75 $3 ($15) ($2) ($4) $57 |
  [Alcoa Logo] Q4’09 Cash From Operations of $1.1 Billion Cash Flow 15 Best CFO since Q2’07 FCF positive – highest since Q2’03 10 day decline in DWC vs. Q4’08 See appendix for free cash flow reconciliation ($ Millions) 4Q'08 3Q'09 4Q'09 Net (Loss) Income ($1,191) $124 ($268) DD&A 291 342 369 Change in Working Capital 610 100 522 Taxes (250) (69) (170) Pension Contributions (38) (33) (26) Other Adjustments 1,186 (280) 697 Cash From Operations $608 $184 $1,124 Capital Expenditures (1,017) (370) (363) Free Cash Flow ($409) ($186) $761 |
 [Alcoa
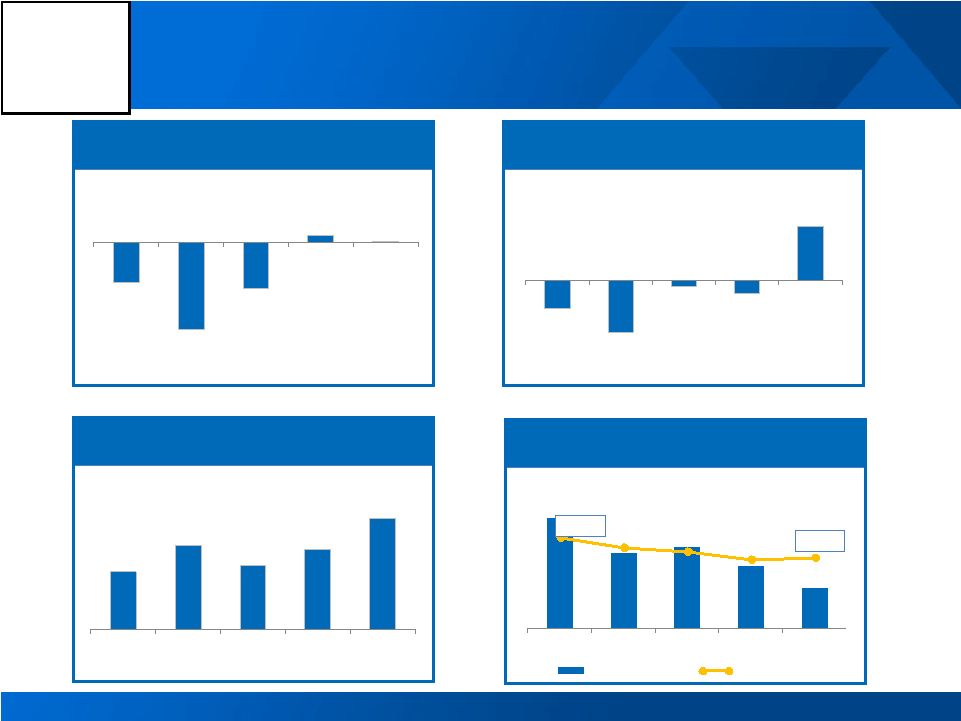
Logo] Undeniably Strong Response To Severe Recession 16 Drove Cash Sustainability savings to the bottom line… …efficiently managed cash flows and capex… …strengthened the balance sheet Adjusted (Loss) Income ($ Millions) Free Cash Flow ($ Millions) Debt ($ Millions) Debt-to-Capital % …improved liquidity… Cash on Hand ($ Millions) See appendix for reconciliations of adjusted income (loss) and free cash
flow ($221) ($477) ($256) $39 $9 4Q'08 1Q'09 2Q'09 3Q'09 4Q'09 ($409) ($742) ($90) ($186) $761 4Q'08 1Q'09 2Q'09 3Q'09 4Q'09 $762 $1,131 $851 $1,066 $1,481 4Q'08 1Q'09 2Q'09 3Q'09 4Q'09 $10,578 $10,205 $10,265 $10,073 $9,819 42.5% 38.6% 4Q'08 1Q'09 2Q'09 3Q'09 4Q'09 Gross Debt Debt to Cap |
 [Alcoa
Logo] Klaus Kleinfeld President and Chief Executive Officer 17 |
 [Alcoa
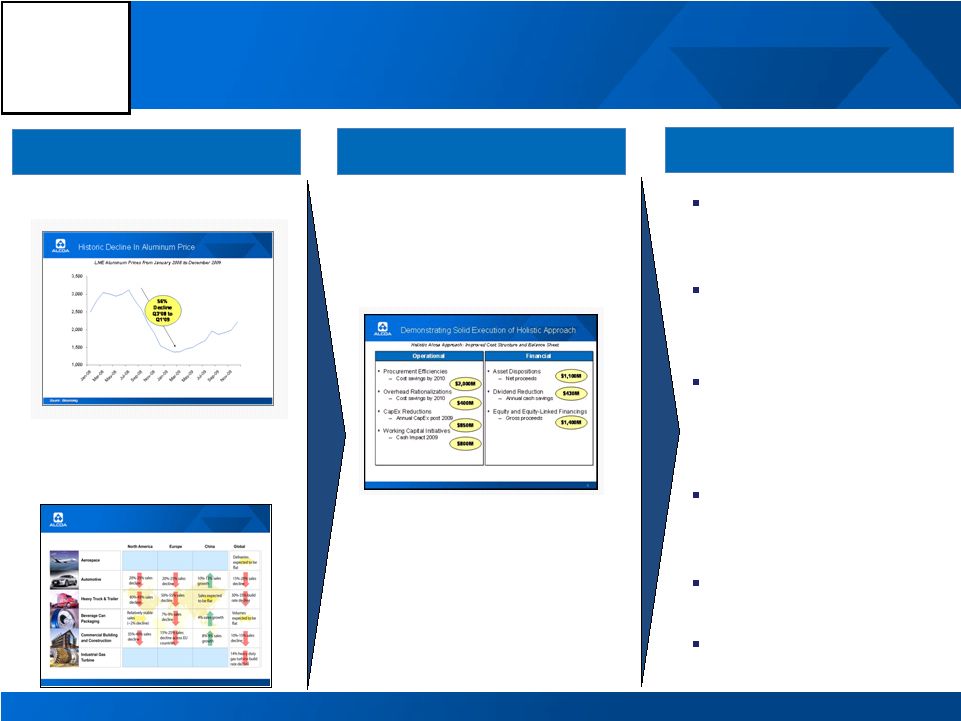
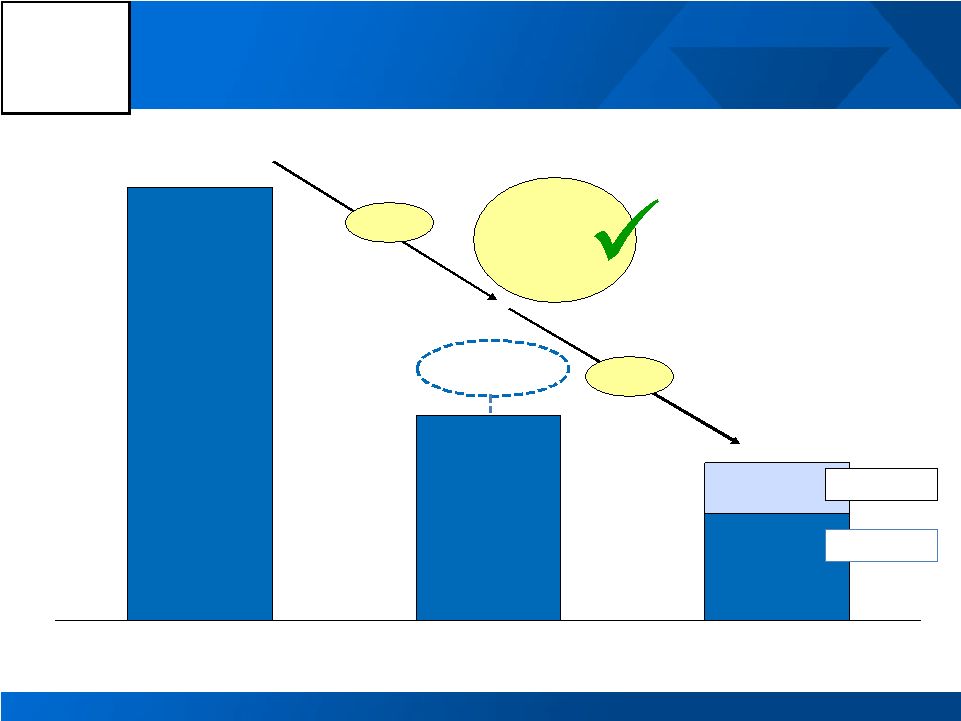
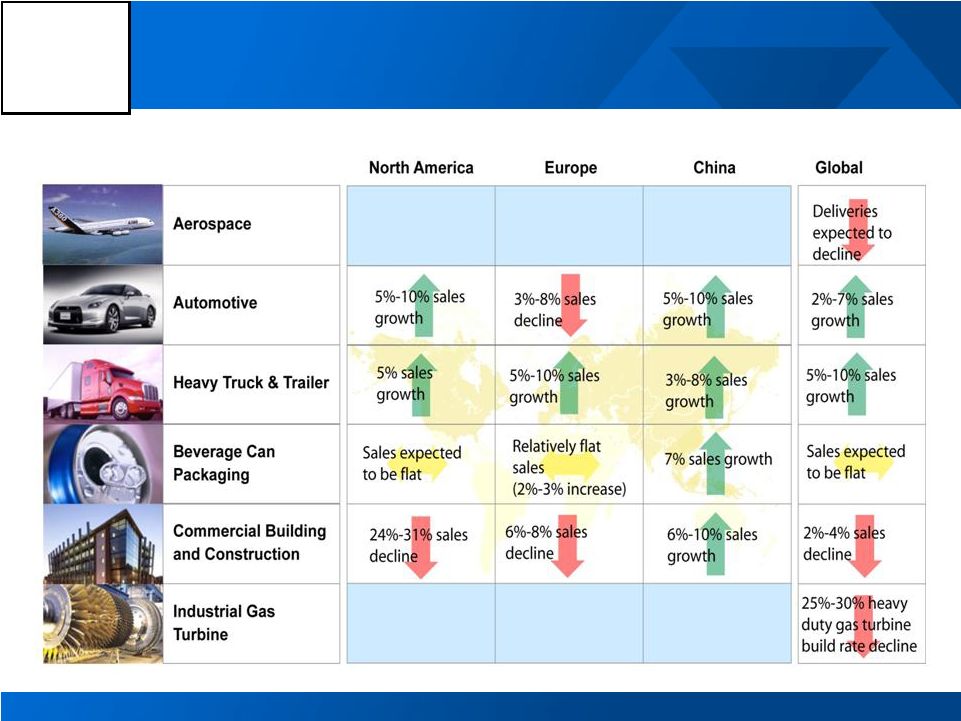
Logo] 2009 In Review 18 Market Conditions in 2009 Source: Alcoa analysis Alcoa End Markets: Current Assessment of 2009 Conditions Challenging Environment Alcoa Takes Action… …And Delivers Equaled best ever safety performance Exceeded cash sustainability targets Continued growth projects and improved portfolio Repowered globally competitive smelters FCF positive in 4Q’09 Strengthened liquidity Historic Price Decline Broad-based Demand Destruction Holistic Solution: Operational & Financial Actions |
 [Alcoa
Logo] Alcoa Lives Its Values Every Day 19 Total Recordable Incident Rate Lost Workday Incident Rate Strengthened Reputation Continued Sustainable Growth Established Carbon Leadership 8 th Consecutive Year Safety Incident Rate History and Significant Accreditations in 2009 Founding Member Best Ever Safety Performance 3.86 3.57 2.26 2.03 1.85 1.47 1.39 1.47 1.40 1.27 0.29 0.32 0.19 0.19 0.13 0.13 0.11 0.14 0.14 0.13 0.0 0.5 1.0 1.5 2.0 2.5 3.0 3.5 4.0 |
 [Alcoa
Logo] Achieved 2010 Procurement Spending Target Procurement Efficiencies: Reduction Targets 2009E (millions) Reduction Targets by Spend Category Savings 2010E 20 2010 Target Achieved 15% 7% 6% 21% 34% 29% 5% 18% 2% 5% 4% 6% 2% 4% Strategic Raw Materials - Alumina and Primary Metals Strategic Raw Materials - Flat-Rolled Products Indirect - Services Indirect - Maintenance Repair & Overhaul Non-Smelter Energy Transportation Business Unit Metals $1,998 $1,500 $2,000 2009 2009 Savings Target vs. 2008 2010 Savings Target vs. 2008 |
 [Alcoa
Logo] Surpassed 2010 Overhead Savings Target Overhead includes SG&A, R&D and Plant Administrative Expenses; excludes
divestitures Overhead Rationalization: Reduction Targets and Savings
$400M (millions) Overhead Savings Target Savings 21 2010 Target Achieved 100% 80% 2008 2010 Target $412 $200 $400 2009 2009 Savings Target vs. 2008 2010 Savings Target vs. 2008 |
 [Alcoa
Logo] $3,438 $1,800 Target $1,250 2008 2009 2010E Capital Expenditures of $1.6B, Down 52% Vs. 2008 -53% -23% Capital Expenditure Reduction: Annual CapEx ($ millions) $1,622 22 Surpassed 2009 Target Growth Sustaining |
 [Alcoa
Logo] 100% 72% Dec-08 Dec-09 Target Working Capital Days Reduction Targets -28% 2009 YTD Working Capital Change ($ millions) $800M decrease in working capital in 2009 Working Capital Initiatives: Targets and Year-to-date Results Reduced Working Capital By $1.3 Billion 23 Surpassed 2009 Target $1,258 $1,302 $800 $676 ($632) Inventory Receivables Accounts Payable 2009 Cash Generation 2009 Target |
 [Alcoa
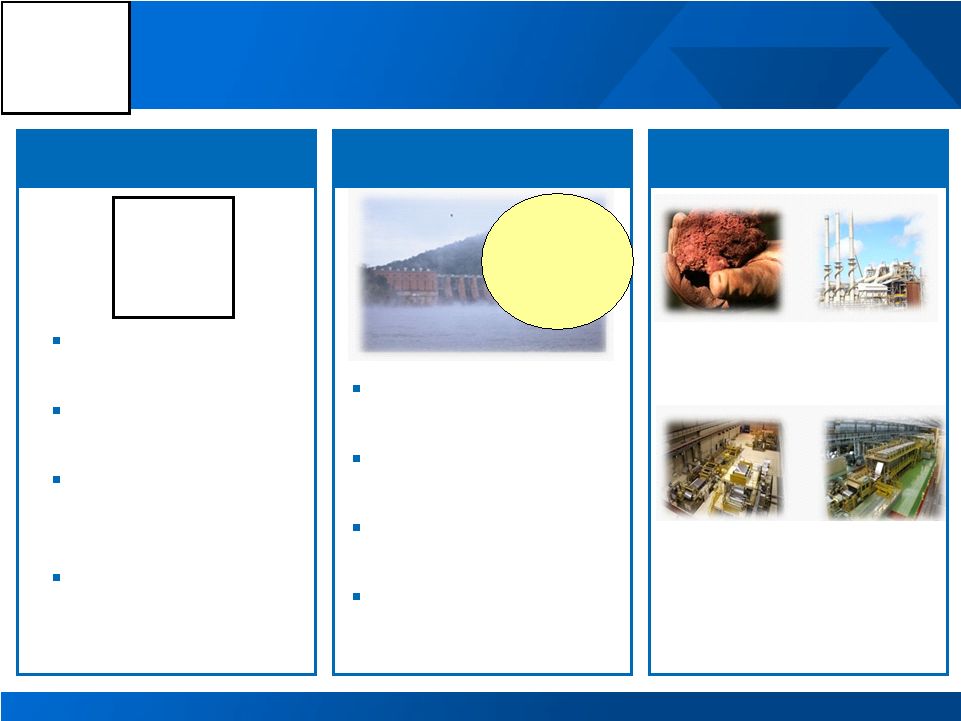
Logo] Strengthened Alcoa’s Strategic Position In The Downturn 24 Growth: Improved Competitive Position Re-Powering: Secured LT Power for 40% of System Portfolio: Optimized For Liquidity and Growth Quebec – 1 MMT Spain – 500 KMT Massena – 300 KMT Intalco – 184 KMT Shining Prospect JV AEES Divestiture Norway Smelter Asset Exchange Suriname Refinery Minority Position Acquisition Exceptional Bauxite in Juruti Low-cost Refining in Sao Luis Bohai - One of a Kind Asset in China Samara – Unmatched Opportunity 85% of System Powered Through 2025 [Alcoa Logo] |
 [Alcoa
Logo] Unparalleled Growth Opportunity with Ma’aden JV Forms the lowest cost aluminum production complex in the world Creates the world’s most efficient integrated aluminum complex Utilizes fully developed infrastructure, including low-cost natural gas power
Lowers Alcoa’s refining and smelting position on the global cost curve Offers flexibility for expansion Establishes strategic footprint in fast growing region 25 [Alcoa Logo] |
 [Alcoa
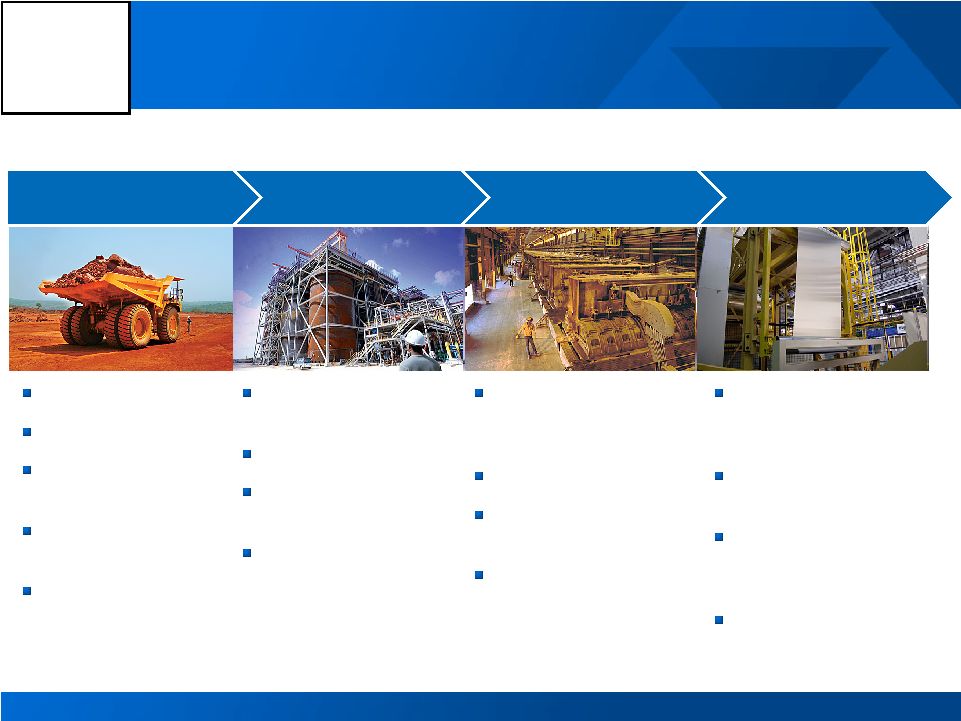
Logo] Ma’aden JV Capitalizes on Region’s Significant Resources 26 Refinery Smelter Bauxite Mine The largest, most efficient vertically integrated aluminum complex in the world
Al Ba’itha mine 4 MMT annually 30+ years of reserves Direct rail line to refinery Operational 2014 Located at Ras Az Zawr 1.8 MMT annually Designed for expansion Operational 2014 Co-located with Refinery at Ras Az Zawr 740 KMT annually Designed for expansion Operational 2013 Co-located with Smelter at Ras Az Zawr Up to 460 KMT hot mill Body, end and tab stock for aluminum cans Operational 2013 Rolling Mill |
 [Alcoa
Logo] $10,578 $10,205 $10,265 $10,073 $9,819 $762 $1,131 $851 $1,066 $1,481 42.5% 38.6% 4Q'08 1Q'09 2Q'09 3Q'09 4Q'09 Gross Debt Cash Debt to Cap FCF Improved and Balance Sheet Strengthened Cash and Debt (in millions) Free Cash Flow (in millions) FCF Positive in Q4’09 Debt-to- Cap Down 3.9% pts 27 ($409) ($742) ($90) ($186) $761 4Q'08 1Q'09 2Q'09 3Q'09 4Q'09 |
 [Alcoa
Logo] Market Conditions in 2010 Source: Alcoa analysis Alcoa End Markets: Current Assessment of 2010 vs. 2009 Conditions 28 |
 [Alcoa
Logo] 6% 2010 Projected Primary Aluminum Consumption by Region (in mmt) Projecting 10% Consumption Growth in 2010 Brazil Russia Asia w/o China North America Europe China 2009 vs. 2010 Projected Growth Rates 2010 Estimated Consumption -15% -15% -5% 16.1 4% -15% -5% 0.9 6% Other* 4.2 7% -2% *Other consists of: Middle East, India, Latin America ex Brazil and Rest of World
38.5 2009 Actual 2010 Forecast 0.8 18% 29 Source: Alcoa analysis 5% 2009 Global Demand Growth Rate: -6% 2010 Global Demand Growth Rate 10% (2010 ex China: 5%) 3% 3% |
 [Alcoa
Logo] China Western World 2010 Global Primary Metal Balance 2010E Primary Metal Supply / Demand Balance (in kmt) Surplus Source: Alcoa estimates, Brook Hunt, CRU, CNIA, IAI 30 Surplus 2010 Annualized Run Rate 16,100 2010 Restarts or Curtailments 0 2010 Brown//Greenfield Expansion 200 Total Supply 16,300 Demand (16,100) Imports from West 105 (Deficit) / Surplus 305 2010 Annualized Run Rate 23,150 2010 Restarts or Curtailments (365) 2010 Brown/Greenfield Expansion 745 Total Supply 23,530 Demand (22,500) Exports to China (105) (Deficit) / Surplus 925 |
 [Alcoa
Logo] 2010E Alumina Supply / Demand Balance (in kmt) Source: Alcoa estimates, CRU, CNIA, IAI, as of 11/24/09 Balanced 2010 Global Alumina Balance China Western World 31 2010 Annualized Run Rate 25,900 Imports from Western World 5,000 Supply 30,900 Demand (30,900) (Deficit) / Surplus 0 2010 Annualized Run Rate 50,750 Exports to China (5,000) Supply 45,750 Demand (45,000) (Deficit) / Surplus 750 |
 [Alcoa
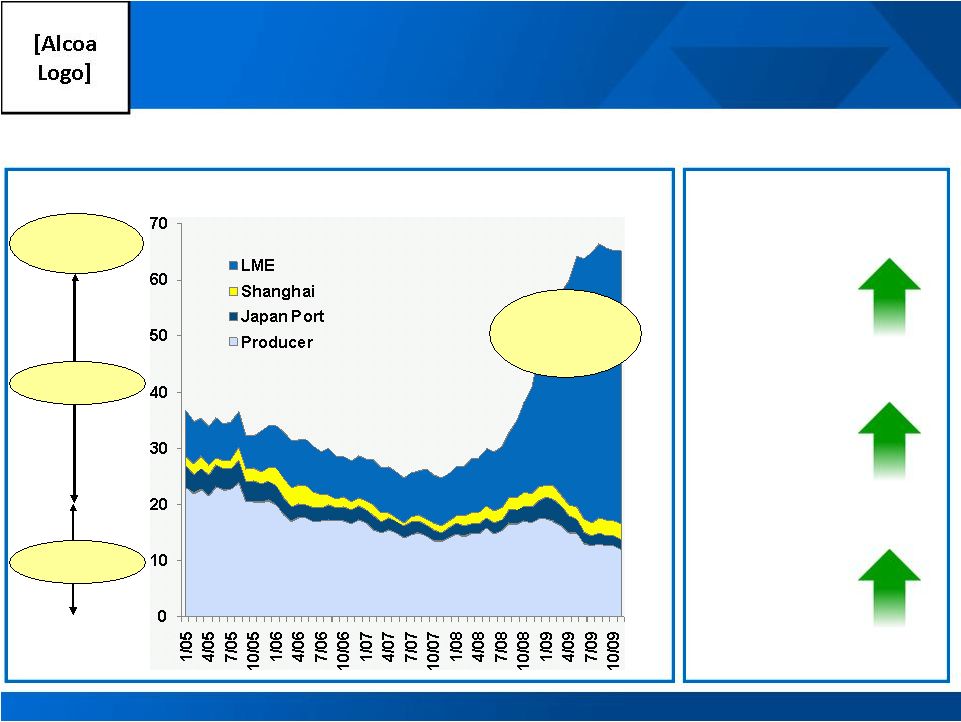
Logo] Source: Bloomberg, IAI 65 days of consumption Non-LME at 17 days LME at 48days Global Inventories Leveling Off Europe +250% Japan +79% Midwest - US +30% Global inventory days of consumption and regional premiums Regional Premiums YTD 2009 Change 32 Tight Physical Conditions Driving Regional Premiums |
 [Alcoa
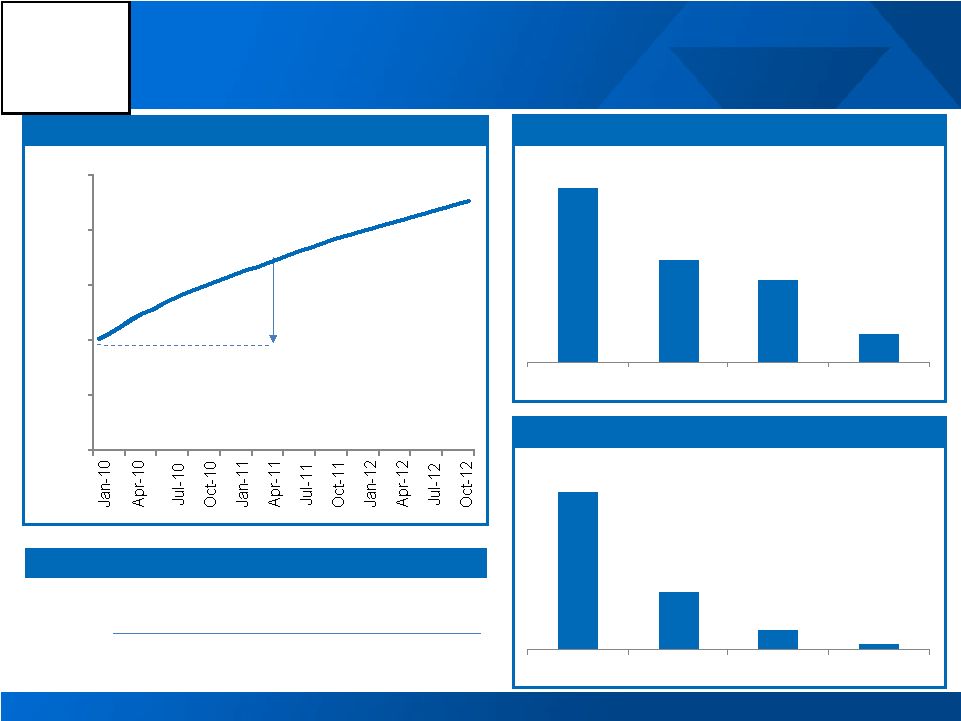
Logo] 33 18-month Forward +$145 Return = Price Forward – Price Spot – Storage – Insurance Price Spot Aluminum Forward Curve Return Mechanics Financial Participants Responding to Strong Forward Curve Percentage Change in Forward Curves 18-month Forwards vs. Spot Total Value of LME Inventories $ Billions Source: Bloomberg 6.6% 3.9% 3.1% 1.1% Aluminum Zinc Lead Copper 10.2 3.7 1.2 0.4 Aluminum Copper Zinc Lead 2,000 2,100 2,200 2,300 2,400 2,500 |
 [Alcoa
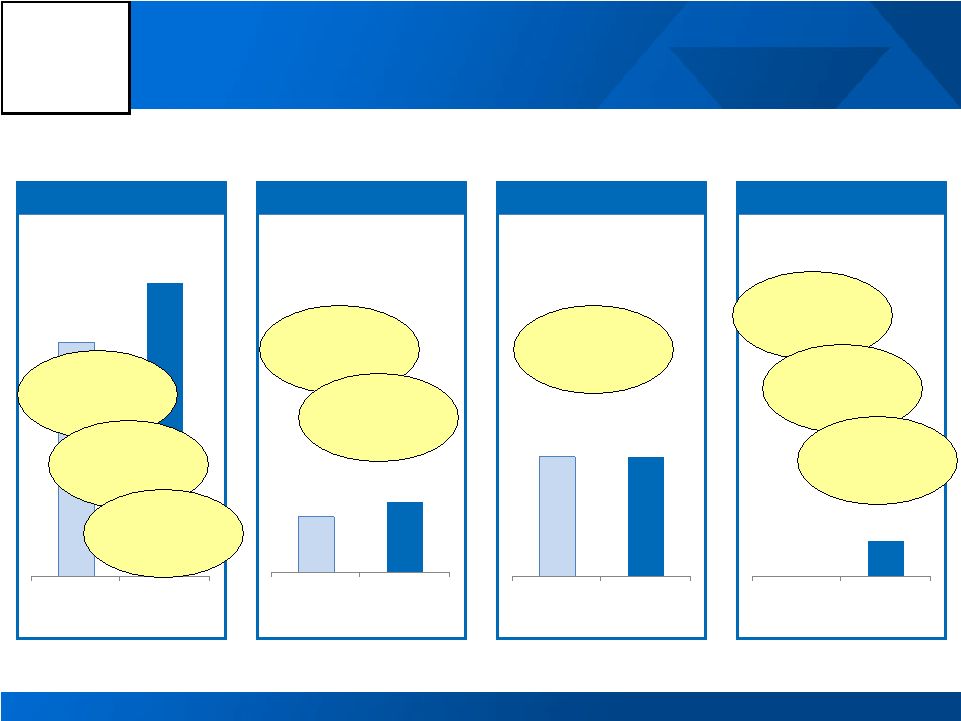
Logo] Original 2010 Target New 2010 Target Aggressively Pursuing 2010 Operational Targets 34 $2,000 $2,500 Procurement Overhead $400 $500 Sustaining Capex $850 $850 Working Capital $0 $200 2010 Cash Sustainability Operational Targets and Actual Performance $ Millions Locking-in Savings Overcoming Headwinds Net Additional $500M Locking-in Savings Net Additional $100M Overcoming Headwinds Locking-in Savings Additional 2 Days WC Additional $200M Original 2010 Target New 2010 Target Original 2010 Target New 2010 Target Original 2010 Target New 2010 Target |
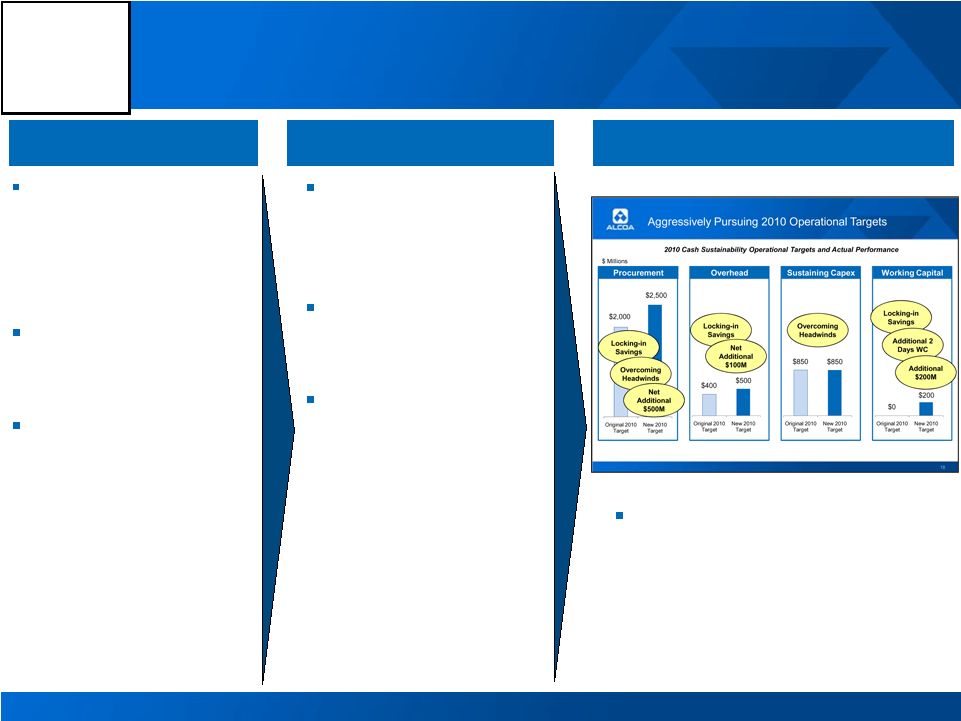 [Alcoa
Logo] Conditions Improve in 2010 – We Maintain Aggressive Stance Market Environment Key end-markets improve vs. 2009; absolute levels still low Aluminum market in modest surplus Currency and energy cost headwinds persist Alcoa Actions Aggressively pursuing 2010 operational targets Focusing on balance sheet strength Optimizing businesses for improved market conditions 35 2010 Commitments Free Cash Flow Positive |
 [Alcoa
Logo] [Alcoa Logo] Matthew E. Garth Director, Investor Relations 390 Park Avenue New York, NY 10022-4608 Telephone: (212) 836-2674 www.alcoa.com Additional Information 36 |
 [Alcoa
Logo] |
 [Alcoa
Logo] Effective Tax Rate Effective tax rate, excluding discrete tax items is a non-GAAP financial measure.
Management believes that the Effective tax rate, excluding discrete tax items is
meaningful to investors because it provides a view of Alcoa’s operational tax rate. 38 $ Millions 1Q’09 2Q’09 3Q’09 4Q’09 2009 (Loss) income from continuing operations before income taxes ($777) ($425) $98 ($394) ($1,498) Benefit for income taxes ($307) ($108) ($22) ($137) ($574) Effective tax rate as reported 39.5% 25.4% (22.4%) 34.8% 38.3% Discrete tax (benefits) provisions: Discrete items ($28) ($82) ($110) Nondeductible Italian losses $98 $98 After-tax restructuring items ($11) ($8) ($19) Subtotal - Discrete tax (benefits) provisions ($39) $0 ($8) $16 ($31) Benefit for income taxes excluding discrete tax (benefits) provisions ($268) ($108) ($14) ($153) ($543) Effective tax rate excluding discrete tax (benefits) provisions 34.5% 25.4% (14.3%) 38.8% 36.2% Charge (benefit) for adjustments to year-to-date effective tax rate N/A $25 ($48) ($10) ($34) |
 [Alcoa
Logo] Reconciliation of ATOI to Consolidated Net (Loss) Income Attributable to Alcoa 39 (in millions) 4Q08 2008 1Q09 2Q09 3Q09 4Q09 2009 Total segment ATOI $ 28 $ 2,199 $ (143) $ (132) $ 142 $ (101) $ (234) Unallocated amounts (net of tax): Impact of LIFO 73 (7) 29 39 80 87 235 Interest income 4 35 1 8 (1) 4 12 Interest expense (81) (265) (74) (75) (78) (79) (306) Noncontrolling interests (1) – (221) (10) 5 (47) (9) (61) Corporate expense (78) (328) (71) (70) (71) (92) (304) Restructuring and other charges (637) (693) (46) (56) (3) (50) (155) Discontinued operations (262) (303) (17) (142) 4 (11) (166) Other (238) (491) (166) (31) 51 (26) (172) Consolidated net (loss) income attributable to Alcoa $ (1,191) $ (74) $ (497) $ (454) $ 77 $ (277) $ (1,151) (1) On January 1, 2009, Alcoa adopted changes issued by the Financial Accounting Standards Board to
consolidation accounting and reporting. These changes, among others, require that minority interests be renamed noncontrolling interests for all
periods presented. |
 [Alcoa
Logo] Reconciliation of Adjusted (Loss) Income 40 (in millions) Quarter ended Year ended December 31, 2008 March 31, 2009 June 30, 2009 September 30, 2009 December 31, 2009 December 31, 2008 December 31, 2009 Net (loss) income attributable to Alcoa $ (1,191) $ (497) $ (454) $ 77 $ (277) $ (74) $ (1,151) (Loss) income from discontinued operations (262) (17) (142) 4 (11) (303) (166) (Loss) income from continuing operations attributable to Alcoa (929) (480) (312) 73 (266) 229 (985) Restructuring and other charges 614 46 56 1 49 670 152 Discrete tax items* 65 (28) – – (82) 84 (110) Special items** 29 (15) – (35) 308 29 258 (Loss) income from continuing operations attributable to Alcoa – as adjusted $ (221) $ (477) $ (256) $ 39 $ 9 $ 1,012 $ (685) Discrete tax items include the following: a benefit for the reorganization of an equity
investment in Canada (-$71), a charge for the write-off of deferred tax assets related to operations in Italy ($41), a benefit for a tax rate change in Iceland (-$31), and a benefit for the reversal of a valuation allowance on net operating losses in Norway (-$21) for the quarter ended December 31, 2009; a benefit for a tax law change in Canada for the quarter ended March 31, 2009; a charge for
non-cash tax on repatriated earnings for the quarter ended December 31, 2008; and, the previously mentioned item for the quarter ended December 31, 2008 and a charge related to the sale
of the Packaging and Consumer businesses for the year ended December 31, 2008. Special items include the following: charges related to a recent European Commission’s ruling on electricity pricing for smelters in Italy ($250), a tax settlement related to an equity investment in Brazil ($24), an estimated loss on excess power at our Intalco smelter ($19), and an environmental accrual for smelters in Italy ($15) for the quarter ended December 31, 2009; a gain on an acquisition in Suriname for the quarter ended September 30, 2009; a gain on the Elkem/SAPA swap
(-$133) and a loss on the sale of Shining Prospect ($118) for the quarter ended March 31, 2009; and, charges for environmental reserve ($26), obsolete inventory ($16), and accounts receivable
reserve ($11), and a refund of an indemnification payment (-$24) for the quarter ended December 31, 2008. ** (Loss) income from continuing operations attributable to Alcoa – as adjusted is a
non-GAAP financial measure. Management believes that this measure is meaningful to investors because management reviews the operating results of Alcoa excluding the impacts of restructuring
and other charges, discrete tax items, and special items. There can be no assurances that
additional restructuring and other charges, discrete tax items, and special items will not occur in future periods. To compensate for this limitation, management believes that it is appropriate to consider both (Loss) income from continuing
operations attributable to Alcoa determined under GAAP as well as (Loss) income from continuing
operations attributable to Alcoa – as adjusted. *
|
 [Alcoa
Logo] Reconciliation of Free Cash Flow 41 (in millions) Quarter ended December 31, 2008 March 31, 2009 June 30, 2009 September 30, 2009 December 31, 2009 Cash provided from operations $ 608 $ (271) $ 328 $ 184 $ 1,124 Capital expenditures* (1,017) (471) (418) (370) (363) Free cash flow $ (409) $ (742 ) $ (90) $ (186) $ 761 discontinued operations. (in millions) Two month period ended Ten month period ended Year ended February 28, 2009 December 31, 2009 December 31, 2009 Cash provided from operations $ (708) $ 2,073 $ 1,365 Capital expenditures** (298) (1,324) (1,622) Free cash flow $ 749 $ (257) ** Capital expenditures for the two-month period ended February 28, 2009 and the
ten-month ended period December 31, 2009, include $2 and $3, respectively, related to discontinued operations. * Free Cash Flow is a non-GAAP financial measure. Management believes that this
measure is meaningful to investors because management reviews cash flows
generated from operations after taking into consideration capital expenditures due to the fact that these expenditures are considered necessary to maintain and expand Alcoa’s asset base and are expected to generate future cash flows from operations. It is important to note that Free Cash Flow does not represent the residual cash flow
available for discretionary expenditures since other non- discretionary
expenditures, such as mandatory debt service requirements, are not deducted from the measure. (1,006) * Capital expenditures for the quarters ended December 31, 2008, March 31, 2009, and June 30, 2009, include
$9, $3, and $2, respectively, related to |
 [Alcoa
Logo] Other Reconciliations 42 Net Debt (in millions) Year ended December 31, 2008 December 31, 2009 Change Total debt 1 $ 10,578 $ 9,819 $ (759) Less: Cash and cash equivalents 762 1,481 719 Net Debt $ 9,816 $ 8,338 $ (1,478) Debt-to-Capital ($ in millions) As of December 31, 2009 Debt-to-Capital Hypothetical debt repayment Adjusted Debt-to-Capital Total debt 1 $ 9,819 $ 1,000 $ 8,819 Capital: Total debt $ 9,819 $ 1,000 $ 8,819 Convertible securities of subsidiary 40 – 40 Total equity 15,552 – 15,552 Sub-total $ 25,411 $ 1,000 $ 24,411 Debt-to-Capital 38.6% 36.1% 1 2 Net Debt and Debt-to-Capital are non-GAAP financial measures. Management
believes that these measures are meaningful to investors because they
provide further insight to Alcoa’s liquidity and leverage position.
Management also believes that it is appropriate to consider both Total debt and Debt-to-Capital prior to any adjustment as well as Net Debt and Debt-to-Capital after
adjustments. 2 Total debt includes short-term borrowings, commercial paper, long-term debt due within one year,
and Long- term debt, less amount due within one year from the Consolidated Balance Sheet as
of December 31, 2009 and 2008. Hypothetical debt repayment is based on cash and cash equivalent of $1,481 millions as of December 31,
2009. |
 [Alcoa
Logo] Other Reconciliations 43 Days Working Capital ($ in millions) Quarter ended December 31, 2008 December 31, 2009 Change Receivables from customers, less allowances $ 1,883 $ 1,529 Add: Inventories 3,238 2,328 Less: Accounts payable, trade 2,518 1,954 Working Capital $ 2,603 $ 1,903 Sales $ 5,688 $ 5,433 Less: businesses classified as held for sale 69 64 Adjusted Sales 1 $ 5,619 $ 5,369 Days Working Capital 42.6 32.6 (10.0) Days Working Capital = Working Capital divided by (Adjusted Sales/number of days in the
quarter) 1 Cost of Goods Sold % Sales ($ in millions) Quarter ended December 31, 2009 Cost of goods sold (COGS) $ 4,905 Less: Special items and buy/resell activity² 714 Adjusted Cost of goods sold³ $ 4,191 Sales $ 5,433 Less: buy/resell activity² 419 Adjusted Sales³ $ 5,014 COGS % Sales 83.6% 2 3 - Adjusted Sales is a non-GAAP financial measure and is being used to calculate Days
Working Capital to be consistent with the fact that the working capital
components of the businesses classified as held for sale (the Global Foil and Transportation Products Europe businesses) are not included in the Working Capital
amounts above under accounting principles generally accepted in the U.S.
Adjusted Cost of goods sold and Adjusted Sales are non-GAAP financial
measures and are being used to calculate COGS % Sales because management reviews the operating results of Alcoa excluding the impacts of special items, among others, and the aluminum buy/sell activity affects both components by the same
amount. There can be no assurances that special items will not occur in
future periods. Special items include the following: charges related to a recent European Commission’s ruling on electricity pricing for smelters in Italy ($250), a tax settlement related to an equity investment in Brazil
($30), and an environmental accrual for smelters in Italy ($15). The
buy/sell activity relates to Alcoa’s Primary Metals segment. |