Attached files
| file | filename |
|---|---|
| 8-K - FORM 8-K - BIOMET INC | d8k.htm |
 Exhibit 99.1 |
 Biologics Bracing Microfixation Orthopaedics Osteobiologics Spine Sports Medicine Trauma 3i Forward-Looking & Non-GAAP Financial Measures 2 Forward-Looking Statements This presentation may contain forward-looking statements. They will be based upon management's current
expectations and will involve certain risks and uncertainties. Actual results may differ
materially from those contemplated by the forward looking statements due to, among others, the
following factors: the success of the Company’s principal product lines; the results of ongoing investigations by the United States Department of Justice and the United States Securities and Exchange
Commission; the ability to successfully implement new technologies; the Company’s ability
to sustain sales and earnings growth; the Company’s success in achieving timely approval
or clearance of its products with domestic and foreign regulatory entities; the impact to the business as a result of compliance with federal, state and foreign governmental regulations and with the Corporate
Integrity Agreement; the impact to the business as a result of the economic downturn in both
foreign and domestic markets; the possible enactment of federal or state health care reform;
the impact of anticipated changes in the musculoskeletal industry and the ability of the Company to react to and capitalize on those changes; the ability of the Company to successfully implement its desired
cost-saving initiatives; the success of the Company’s transition of certain
manufacturing operations to China; the ability of the Company’s customers to receive adequate levels of reimbursement from third-party payors; the Company’s ability to maintain its existing
intellectual property rights and obtain future intellectual property rights; the Company’s
ability to retain existing independent sales agents for its products; and other factors set
forth in the Company’s filings with the SEC, including the Company’s most recent annual report on Form 10-K and quarterly reports on Form 10-Q. The inclusion of a forward-looking statement herein should not be regarded as
a representation by the Company that the Company’s objectives will be achieved. The
Company undertakes no obligation to update publicly or revise any forward-looking
statements, whether as a result of new information, future events or otherwise. Accordingly, the reader is cautioned not to place undue reliance on forward-looking statements which speak only as of the date on which they
were made. Non-GAAP Financial Measures This presentation contains the use of non-GAAP financial measures, such as net sales excluding dental
sales and/or the impact of foreign currency (constant currency), operating income as adjusted,
net income as adjusted, free cash flow, unlevered free cash flow, net debt, Earnings Before
Interest, Taxes, Depreciation and Amortization (EBITDA) and Adjusted EBITDA (as defined by our bank agreement, the method to calculate this is likely to be different from methods used by other
companies). These non-GAAP measures are not in accordance with, or an alternative
for, generally accepted accounting principles in the United States. Biomet management
believes that these non-GAAP measures provide useful information to investors; however, this additional non-GAAP financial information is not meant to be considered in isolation or as a substitute for financial
information prepared in accordance with GAAP. Reconciliations of these non-GAAP
financial measures to the most directly comparable GAAP measures are included on the Biomet
website at Biomet.com. |
 Biologics Bracing Microfixation Orthopaedics Osteobiologics Spine Sports Medicine Trauma 3i Contents 3 Company Profile Progress Against Initial Priorities - March 2007 Business Performance Highlights Current Priorities |
 Summary Business Overview Summary Business Overview 7,000+ team members 3,000+ sales representatives 900+ new products introduced FY 2000 – 2009 Operations in 50+ locations Products distributed in ~90 countries Eight strategic business units Joint Reconstructive 63% Spine 9% Other (sports med +) 8% Fixation 9% Dental 11% 4 Company Profile Asia-Pac/ROW 11% United States 61% Europe 28% FY 2009 Revenues FY 2009 Revenues by Product Segment by Product Segment $2.5B $2.5B FY 2009 Revenues FY 2009 Revenues by Geography by Geography $2.5B $2.5B |
 5
|
 Biologics Bracing Microfixation Orthopaedics Osteobiologics Spine Sports Medicine Trauma 3i Initial Priorities: March 2007 Strengthen management team, especially in selected functions Stabilize U.S. Orthopaedic distribution; establish stand-alone SBU Turn around Biomet Trauma & Biomet Spine Establish momentum on Value Creation Program Maintain culture while developing infrastructure and managing change 6 |
 Recruited 10+
top tier new executives to complement long-tenured members of management team Senior
team now filled out with strong operating expertise Jeff Binder, CEO
Dan Florin, CFO Maggie Anderson, Pres. of 3iFormerly, TPG Operations Glen Kashuba, Pres. of Trauma & Spine Robin Barney, SVP, Operating Systems Jon Serbousek, Pres. of U.S. Orthopaedics Formerly, Abbott Laboratories and DePuy Orthopaedics (Johnson & Johnson) Formerly, Boston Scientific Group Formerly, Cordis Endovascular (Johnson & Johnson) Formerly, DePuy Orthopedics (Johnson & Johnson) Formerly, Medtronic New Additions 7 Priority 1: Strengthen Management Team |
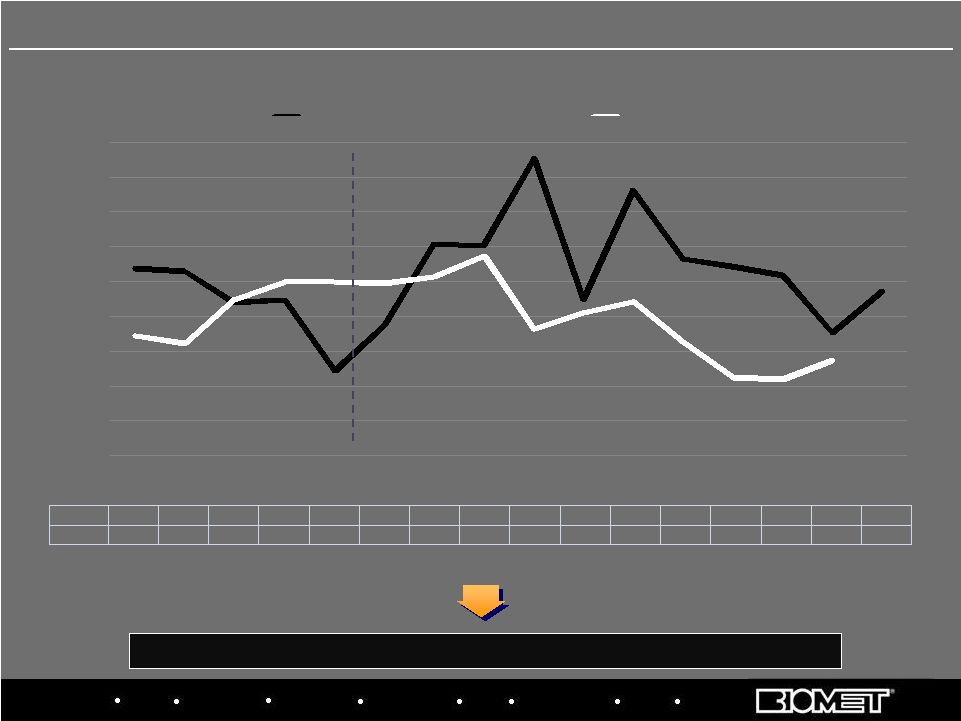 Biologics Bracing Microfixation Orthopaedics Osteobiologics Spine Sports Medicine Trauma 3i U.S. Hip/Knee Growth Rates by Calendar Quarter* Fended off significant competitive threat and re-established sales momentum Priority 2: Stabilize U.S. Ortho Distribution and Establish SBU BIOMET 10.8% 10.6% 8.8% 9.0% 4.9% 7.5% 12.2% 12.1% 17.1% 9.0% 15.3% 11.3% 10.9% 10.4% 7.1% 9.5% MARKET 6.9% 6.5% 9.0% 10.0% 10.0% 9.9% 10.3% 11.5% 7.3% 8.2% 8.9% 6.6% 4.5% 4.4% 5.5% 0.0% 2.0% 4.0% 6.0% 8.0% 10.0% 12.0% 14.0% 16.0% 18.0% Q1'06 Q2'06 Q3'06 Q4'06 Q1'07 Q2'07 Q3'07 Q4'07 Q1'08 Q2'08 Q3'08 Q4'08 Q1'09 Q2'09 Q3'09 Q4'09 BIOMET MARKET 8 *Based on internal estimates; Biomet data from corresponding fiscal quarters
|
 Biologics Bracing Microfixation Orthopaedics Osteobiologics Spine Sports Medicine Trauma 3i 1Q 2Q 3Q 4Q 1Q 2Q 3Q 4Q 1Q 2Q 3Q 4Q 1Q 2Q 3Q 4Q 1Q 2Q 3Q 4Q 1Q 2Q Transaction Announced Transaction Closed Overhauled management team Fixed systems issues Created focused sales forces around spine and trauma Developed tools to improve sales force metrics and effectiveness Revamped new product development processes Improved surgeon education programs KEY INITIATIVES Quarterly Sales Progress in Fiscal 2008, 2009 and H1 2010 2006 2007 2008 2005 2009 9 Priority 3: Turn Around U.S. Trauma and Spine Stabilization and return to growth has been led by spine, but trauma turnaround lags 2010 |
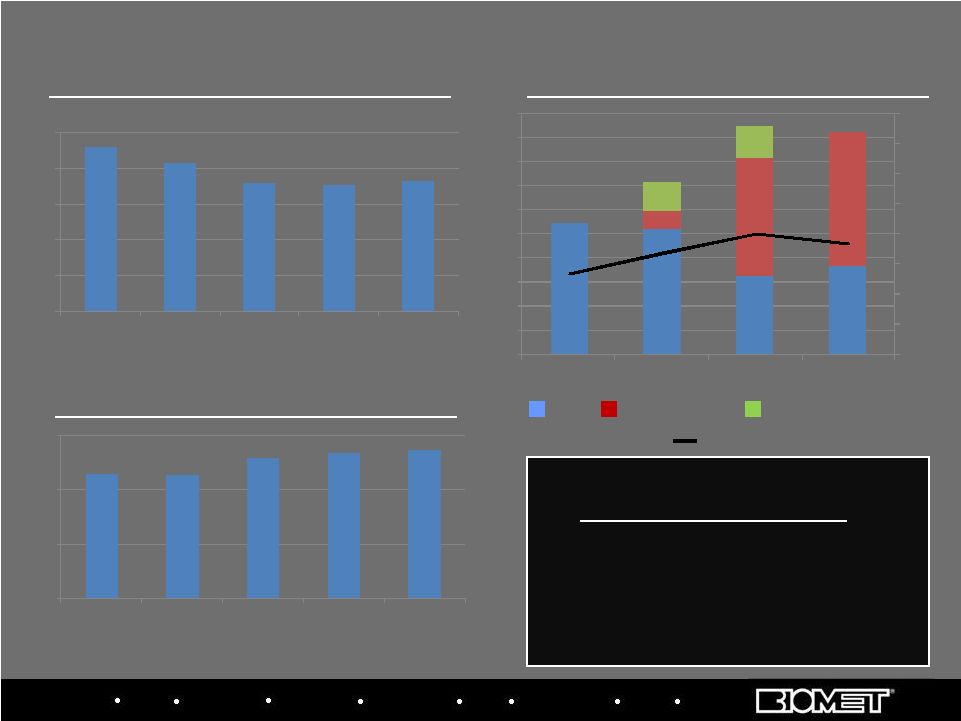
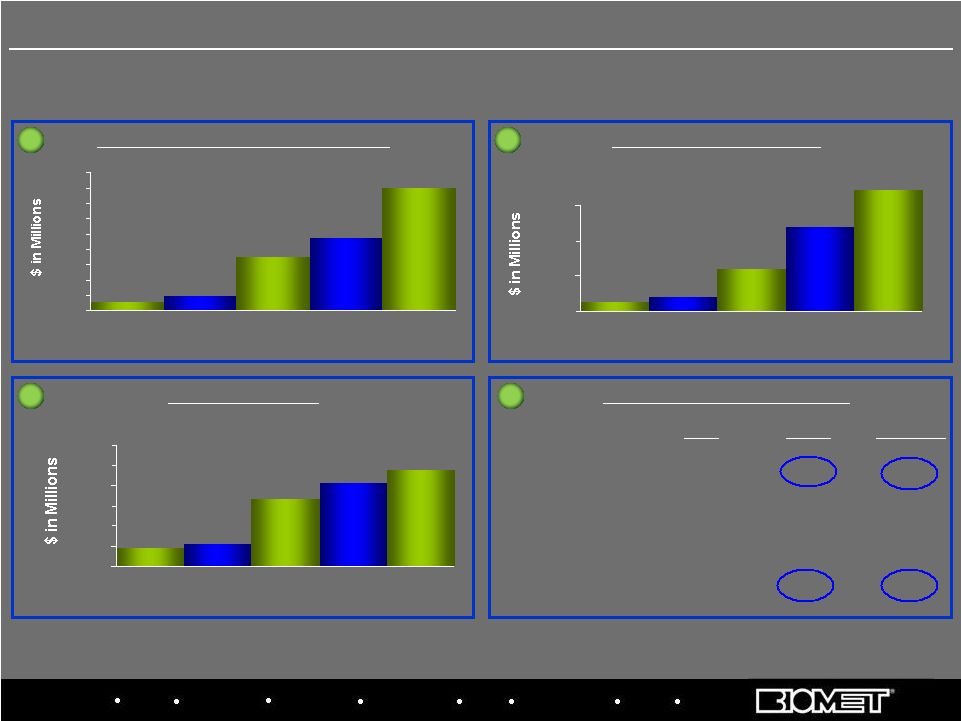 Biologics Bracing Microfixation Orthopaedics Osteobiologics Spine Sports Medicine Trauma 3i Savings v. Fiscal 2007 Baseline Plant Optimization and Offshoring Strategic Sourcing Labor Productivity / Lean Value Creation (VC) Estimates $7.9 $9.8 $22.6 $28.7 $44.8 $5 $10 $15 $20 $25 $30 $35 $40 $45 $50 2008 Goal 2008 Actual 2009 Goal 2009 Actual 2010 Goal $14.6 $15.5 $26.6 $30.7 $34.0 $10 $15 $20 $25 $30 $35 $40 2008 Goal 2008 Actual 2009 Goal 2009 Actual 2010 Goal $6.3 $7.0 $11.0 $16.9 $5 $10 $15 $20 2008 Goal 2008 Actual 2009 Goal 2009 Actual 2010 Goal 1 1 2 2 3 3 4 4 FY’08 FY’09A FY’10 Goal Est. Cash Savings $15M – 20M
$76M $101M VC Program
Costs $10M $ 8M $ 10M Cap
Ex $
4M $23M
$ 5M EBITDA Benefit Estimate $
8M $26M $ 53M $22.1 10 Priority 4: Establish Momentum on Value Creation |
 11
|
 H1 FY ’10
Growth FY 2009 Growth FY 2009 Growth FY 2008 Growth FY 2008 Growth Note: Rates exclude U.S. instrument sales; 2007 reflects “as previously reported” with month lag reporting for OUS locations Recon Ex-Dental 8%
13% 12% 9% Dental
12% 13% (6%) (7%) Recon
9% 13% 9% 7% Fixation
(11%) 0% 4% (1%) Spine
(8%) 0% 7% 11% Other
(1%) 6% 7% 8% Total
3% 10% 8% 6% 12 Growth has rebounded from FY’07 levels, driven by core orthopedics business off-setting
dental headwind Sales Growth by Product Segment at Constant Currency FY 2007 Growth FY 2007 Growth Total Ex-Dental 3% 9% 10% 8% |
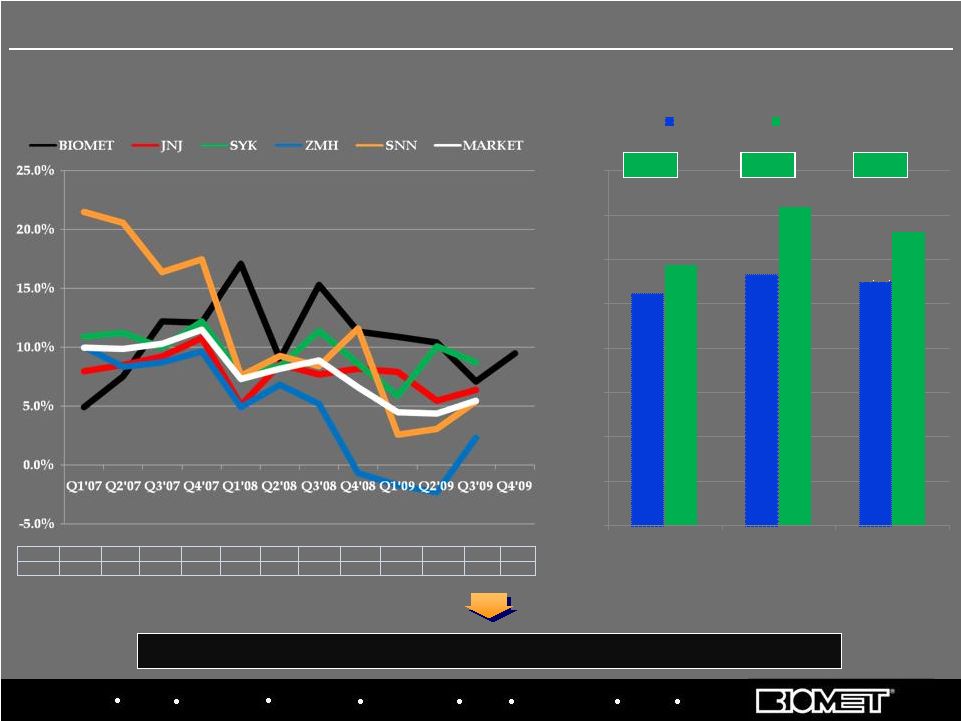 Biologics Bracing Microfixation Orthopaedics Osteobiologics Spine Sports Medicine Trauma 3i Fended off significant competitive threat and re-established sales momentum U.S. Hip/Knee Growth Rates by Calendar Quarter* BIOMET 4.9% 7.5% 12.2% 12.1% 17.1% 9.0% 15.3% 11.3% 10.9% 10.4% 7.1% 9.5% MARKET 10.0% 9.9% 10.3% 11.5% 7.3% 8.2% 8.9% 6.6% 4.5% 4.4% 5.5% Biomet’s U.S. Hip/Knee Market Share Growth* *Based on internal estimates; Biomet data from corresponding fiscal quarters 13 10.5% 11.3% 11.0% 11.8% 14.4% 13.3% 0.0% 2.0% 4.0% 6.0% 8.0% 10.0% 12.0% 14.0% 16.0% U.S. Hips U.S. Knees U.S. Hips/Knees QE 03/31/07 QE 09/30/09 +1.3% +3.1% +2.3% U.S. Orthopaedics Performance vs. Market |
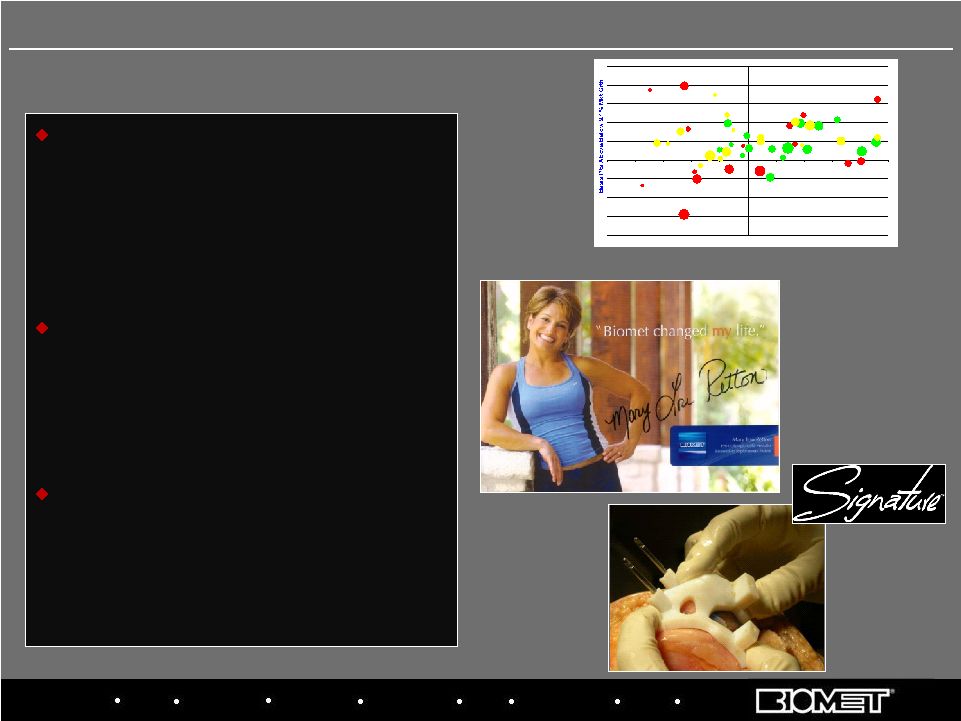 Biologics Bracing Microfixation Orthopaedics Osteobiologics Spine Sports Medicine Trauma 3i Sales Force Effectiveness o Commission structure change to incentivize growth o Enhanced metrics focused on local share and growth Marketing o Direct to patient where appropriate o Pricing discipline with focus on protecting premium brands New Product Development o Overhaul of process from portfolio decisions through execution o Momentum through DPA o Emphasis on maintaining innovation and productivity culture A B C D E G H I J K L M N O P R S T U V W X Y Z AA CC DD EE FF GG HH II JJ KK LL MM NN OO PP QQ RR SS TT UU VV WW XX -40 -30 -20 -10 0 10 20 30 40 50 -100 -80 -60 -40 -20 0 20 40 60 80 100 Basis Pts Above/Below Average Market Share Q F B B 14 U.S. Orthopaedics: Key Initiatives Driving Performance |
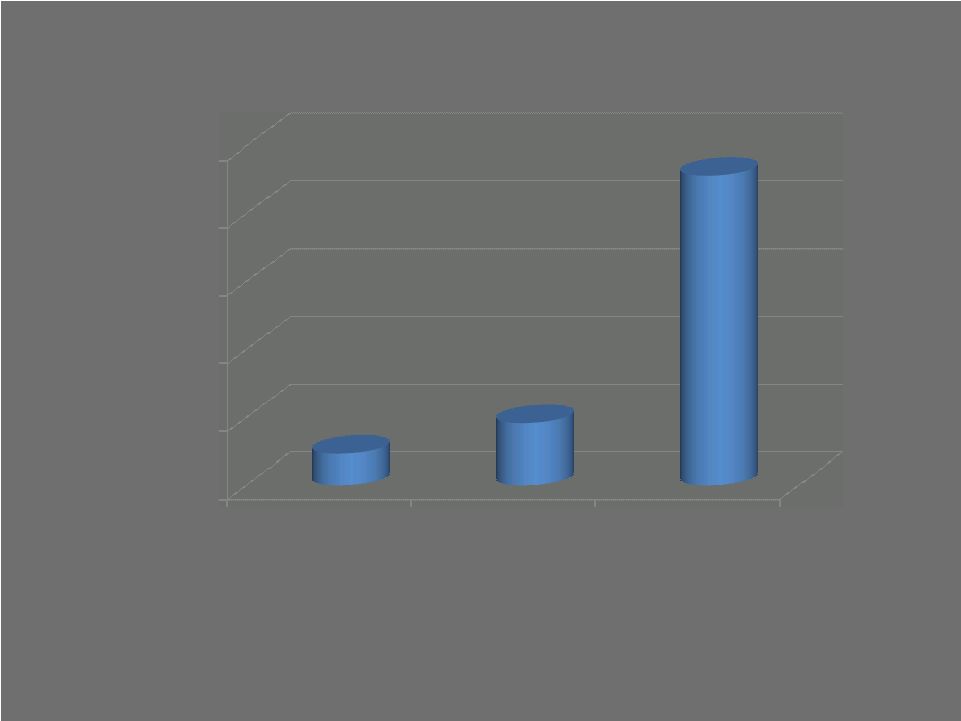 Sources: Total hip: Rasanan P., et al., Acta Orthop., February, 2007. Total knee: Losina E., et al., Arch Intern Med., June 22, 2009. Cost-effectiveness threshold: World Health Organization CHOICE Project; Braithwaite RS, et al., Medical Care, April, 2008 15 Cost/Quality-adjusted life year (QALY) $0 $20,000 $40,000 $60,000 $80,000 $100,000 Total hip Total knee Cost-effective (WHO) $9,200 $18,300 $91,318 |
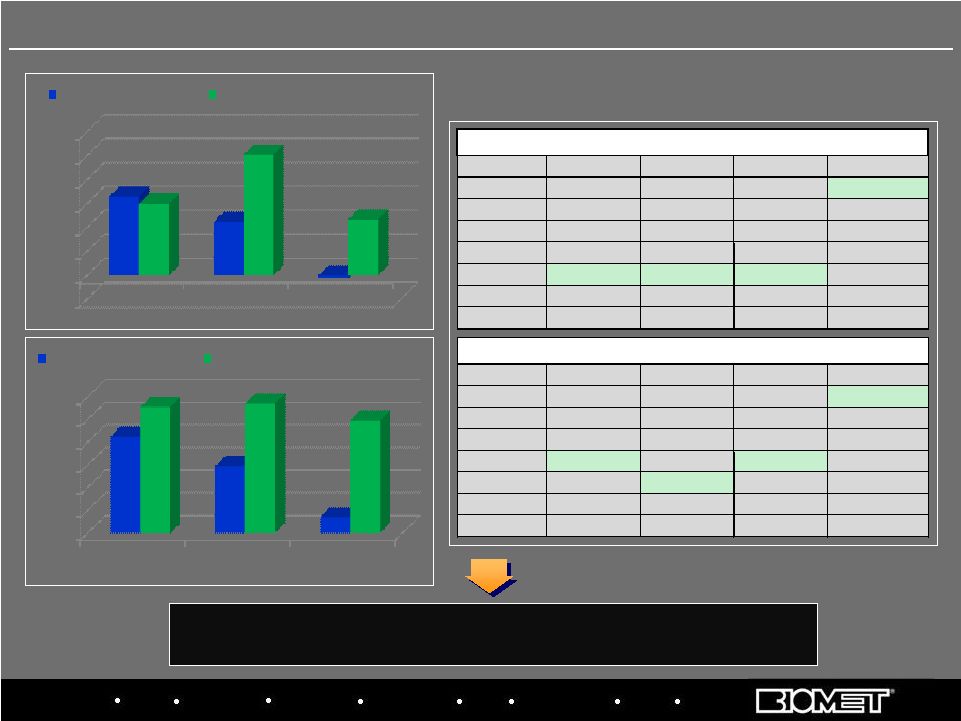 Biologics Bracing Microfixation Orthopaedics Osteobiologics Spine Sports Medicine Trauma 3i Biomet has gained share since 2007 and would have moved to 3 rd place if not for Smith & Nephew acquisition of Plus EU Market Share Positions CY 2007 vs. H1 CY 2009 16 Biomet Europe Performance vs. Market Data based on Company estimates -2.0% 0.0% 2.0% 4.0% 6.0% 8.0% 10.0% 12.0% CY 2007 CY 2008 Jan - Nov'09 6.6% 4.5% -0.2% 6.0% 10.1% 4.7% EU HIP MARKET GROWTH B IOMET EUROPE HIP SALES GROWTH 0.0% 2.0% 4.0% 6.0% 8.0% 10.0% 12.0% CY 2007 CY 2008 Jan - Nov'09 8.5% 5.9% 1.4% 11.1% 11.4% 9.9% EU KNEE MARKET GROWTH POSITION TOTAL HIPS KNEES BONE CEMENT 1 Zimmer Zimmer Zimmer Biomet 2 Depuy Depuy Depuy Depuy 3 Stryker Stryker Smith&Nephew Stryker 4 Smith&Nephew Smith&Nephew Stryker Zimmer 5 Biomet Biomet Biomet Smith&Nephew 6 Aesculap Aesculap Aesculap WrightMedical 7 WrightMedical WrightMedical WrightMedical Aesculap COMPANY RANKING (Jan-Dec 2007) B IOMET EUROPE KNEE SALES GROWTH POSITION TOTAL HIPS KNEES BONE CEMENT 1 Zimmer Zimmer Zimmer Biomet 2 Depuy Depuy Depuy Depuy 3 SmithNephew Stryker SmithNephew Stryker 4 Biomet SmithNephew Biomet Zimmer 5 Stryker Biomet Stryker SmithNephew 6 Aesculap Aesculap Aesculap WrightMedical 7 WrightMedical WrightMedical WrightMedical Corin COMPANY RANKING (Jan-Jun 2009) |
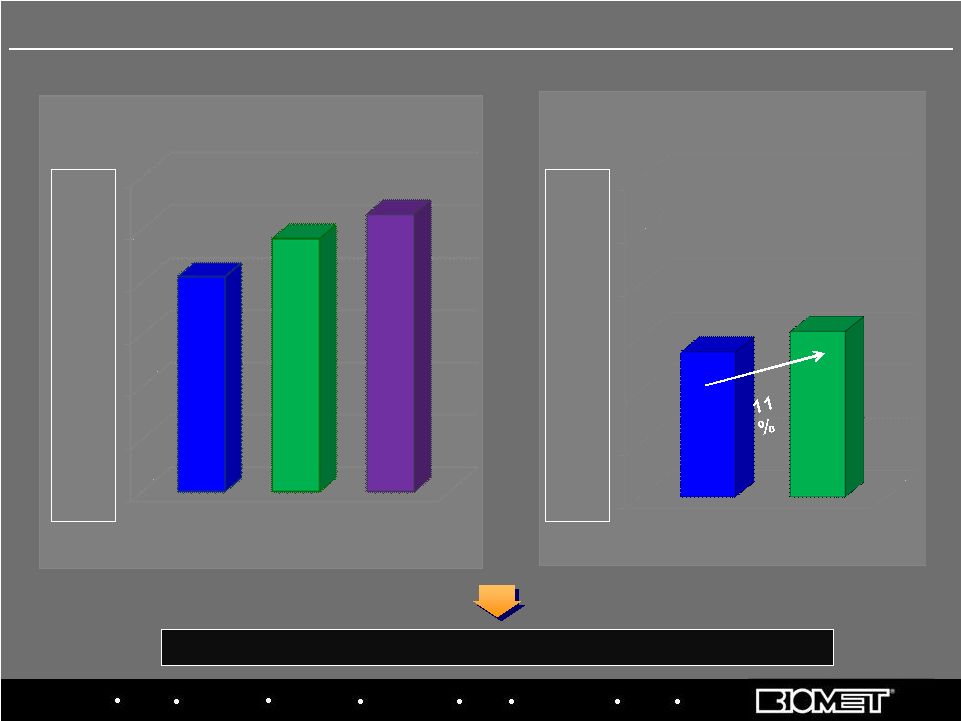 Biologics Bracing Microfixation Orthopaedics Osteobiologics Spine Sports Medicine Trauma 3i $- $50.0 $100.0 $150.0 $200.0 $250.0 $300.0 $137.1 $156.4 Primarily includes Canada, South America, Mexico and the Pacific Rim $- $50.0 $100.0 $150.0 $200.0 $250.0 $300.0 $205.0 $241.2 264.5 17 International Sales at Constant Currency Growth Rates In Millions FY’07 FY’08 FY’09 13% 12% 8% H1 FY’09 H1 FY’10 Fiscal Years 2007 - 2009 H1 FY 2009 vs. H1 FY 2010 Y/Y Constant Currency Growth Rates |
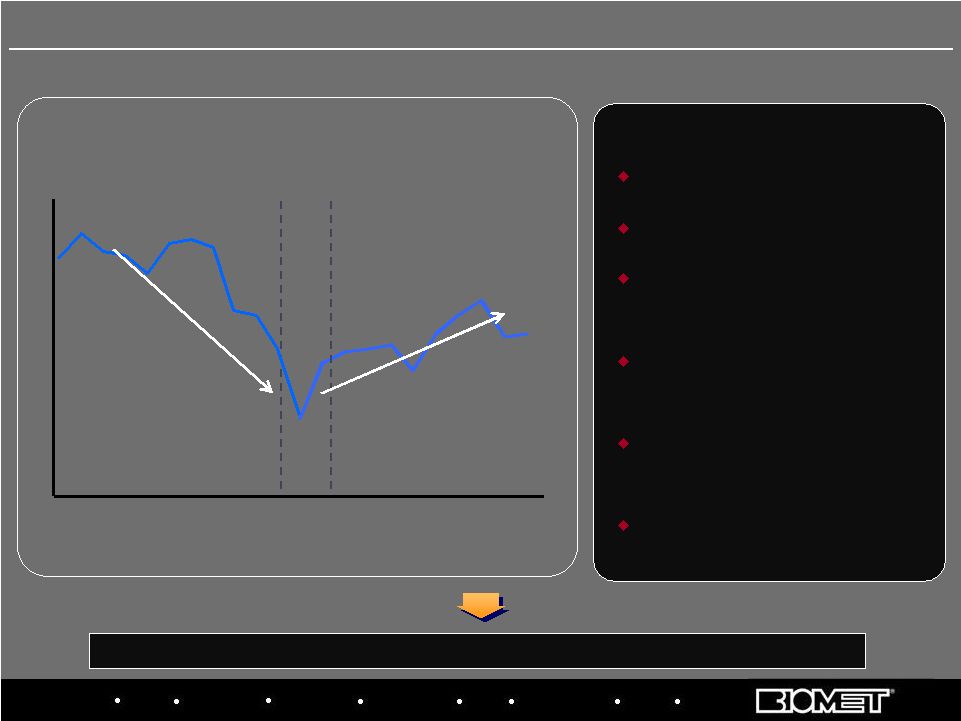
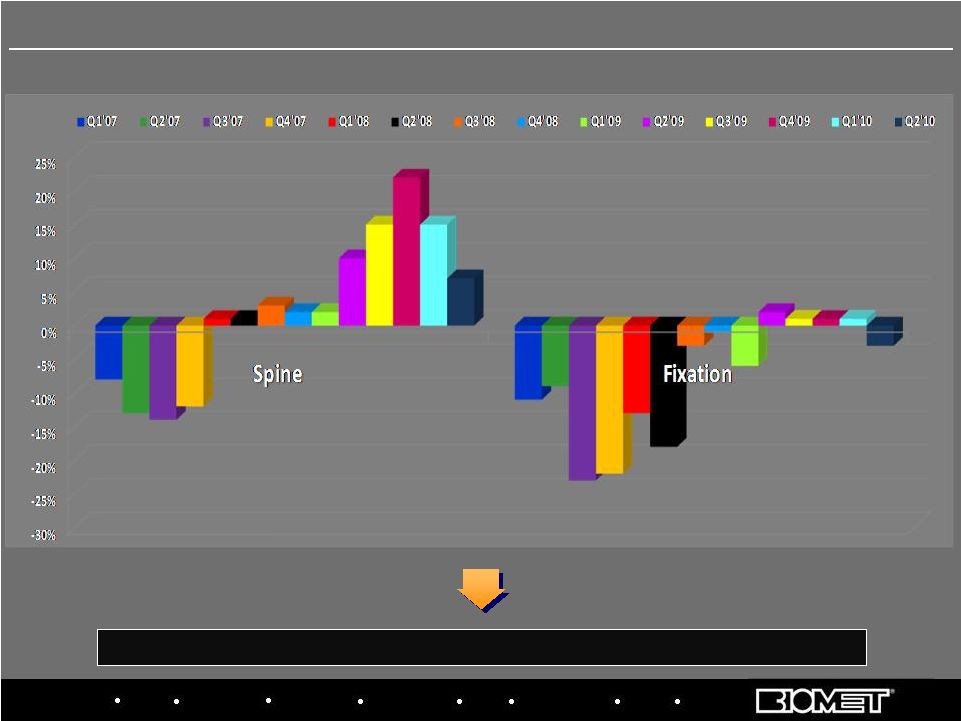 Biologics Bracing Microfixation Orthopaedics Osteobiologics Spine Sports Medicine Trauma 3i Stabilization and return to growth has been led by spine, but trauma turnaround lags By Fiscal Quarter, Q1’07 – Q2’10 18 U.S. Spine and Fixation Sales Growth Trends |
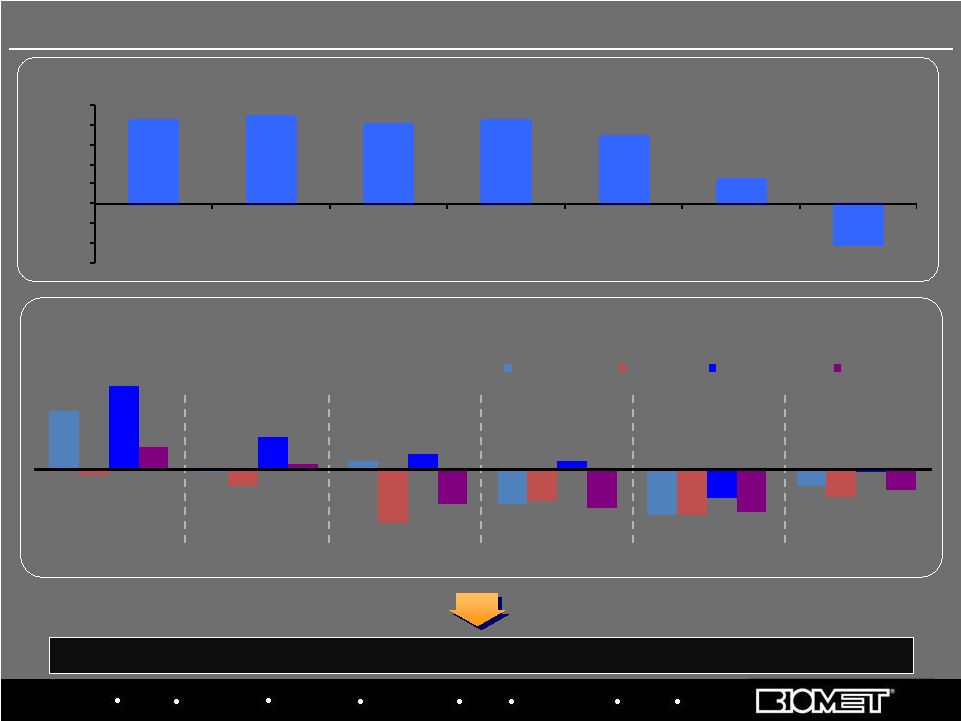 Biologics Bracing Microfixation Orthopaedics Osteobiologics Spine Sports Medicine Trauma 3i (15%) (10%) (5%) 0% 5% 10% 15% 20% 25% CY 03 CY 04 CY 05 CY 06 CY 07 CY 08 CY 09E DENTAL IMPLANT MARKET (Constant Currency Sales Growth) QUARTERLY SALES GROWTH Constant-Currency, Based on Calendar Quarters (with Biomet ‘s Corresponding Fiscal
Quarters) Source: Bank of America, 27-Jul-09 Biomet 3i: Industry Headwinds After years of double-digit growth, 3i and dental industry facing significant economic headwinds 19 16% (1%) 2% (10%) (13%)(13%) (5%) (2%) (5%) (15%) (9%) (8%) 23% 9% 4% 2% (8%) (1%) 6% 1% (10%) (11%) (12%) (6%) Q2 2008 Q3 2008 Q4 2008 Q1 2009 Q2 2009 Q3 2009 Biomet 3i Nobel Straumann Zimmer |
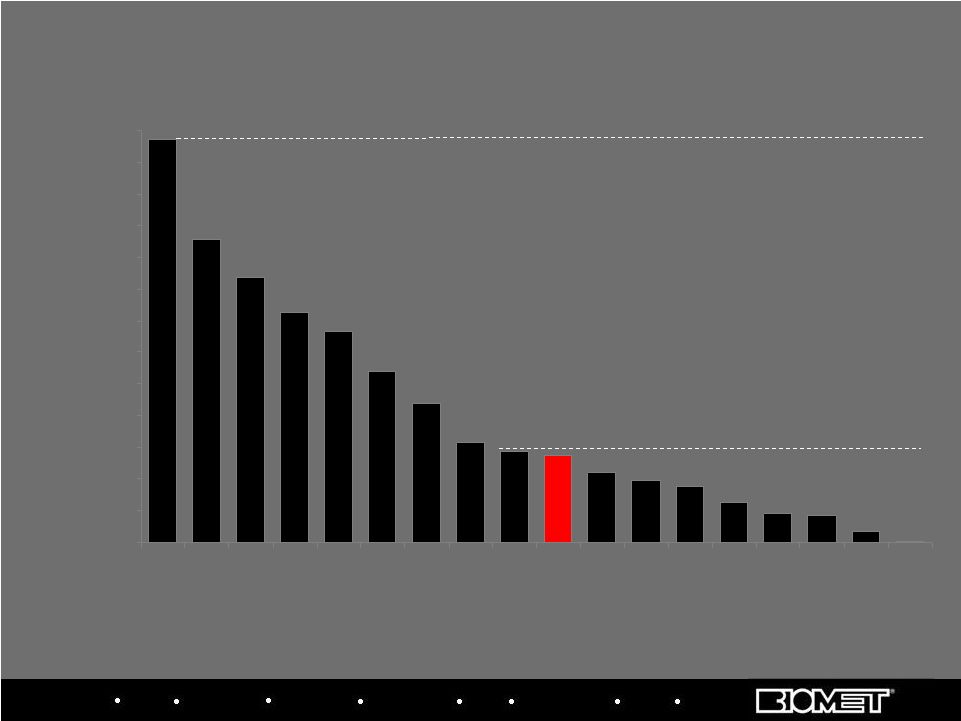 Biologics Bracing Microfixation Orthopaedics Osteobiologics Spine Sports Medicine Trauma 3i Source: MRG, idata; team estimates 1,320 17 7 1 0 20 40 60 80 100 120 140 160 180 200 220 240 260 Implants / 10k People 54 57 63 87 168 107 192 133 255 145 44 18 25 35 39 France US Brazil Ben- elux Germ- any Italy Swed- en KOREA Switz. Spain China Mex- ico Poland Russia UK Argen- tina Aust- ralia Japan Population (M) 49 Implant Penetration (2008, Implants per 10k People) Highest Penetration: S. Korea 58 40 8 9 82 27 190 64 301 127 20 40 61 109 Median Penetration: 57 implants per 10k People Mkt size (k units) 1,248 1,114 678 110 120 885 239 1,200 365 1,641 563 80 143 151 78 70 141 258 38 65 20 Several Large Markets (including the U.S.) Still Have Low Penetration Dental Implant Market Growth Drivers |
     Biologics Bracing Microfixation Orthopaedics Osteobiologics Spine Sports Medicine Trauma 3i FY'07 FY'08 FY'09 Sales $2,108.4 $2,383.3 $2,504.1 Y/Y Growth @ Constant Currency 4.1% 9.1% 8.2% Gross Profit 1,491.9 1,683.6 1,792.9 Percentage of Sales 70.8% 70.6% 71.6% Total SG&A 786.1 890.9 920.6 Percentage of Sales 37.3% 37.4% 36.8% R&D 92.1 89.8 89.9 Percentage of Sales 4.4% 3.8% 3.6% Income from Operations 613.7 702.4 781.5 Percentage of Sales 29.1% 29.5% 31.2% Adjusted Net Income $421.7 $107.4 $158.0 Effective Tax Rate 32.7% 39.2% 24.5% Adjusted EBITDA $719.1 $829.1 $926.4 Percentage of Sales 34.1% 34.8% 37.0% Y/Y Increase 1.3% 15.4% 11.7% 21 Adjusted Net Income and Adjusted EBITDA reflect add-backs to GAAP results for non-cash
amortization and stock comp expense, sponsor fees and other special charges Fiscal 2007 – 2009 Adjusted Operating Results |
 Biologics Bracing Microfixation Orthopaedics Osteobiologics Spine Sports Medicine Trauma 3i 22 Adjusted Net Income and Adjusted EBITDA reflect add-backs to GAAP results for non-cash
amortization and stock comp expense, sponsor fees and other special charges H1 Fiscal 2010 vs. H1 Fiscal 2009 Adjusted Operating Results H1'10 H1'09 % vs. PY Sales $1,325.7 $1,249.8 6.1% Gross Profit 951.1 892.9 6.5% Percentage of Sales 71.7% 71.4% Total SG&A 486.2 465.3 4.5% Percentage of Sales 36.7% 37.2% R&D 49.8 44.6 11.7% Percentage of Sales 3.8% 3.6% Income from Operations 413.2 383.0 7.9% Percentage of Sales 31.2% 30.6% Adjusted Net Income $124.0 $50.0 Effective Tax Rate 25.5% 39.1% Adjusted EBITDA $495.7 $454.1 9.2% Percentage of Sales 37.4% 36.3% |
 Biologics Bracing Microfixation Orthopaedics Osteobiologics Spine Sports Medicine Trauma 3i CAPITAL EXPENDITURES RECEIVABLE DAYS INVENTORY TURNOVER, ADJUSTED (1) 23 92 83 72 71 73 0 20 40 60 80 100 FY 2006 FY 2007 FY 2008 FY 2009 11/30/2009 1.15 1.14 1.30 1.34 1.37 0 0.5 1 1.5 FY 2006 FY 2007 FY 2008 FY 2009 11/30/2009 109 104 64 73 15 99 112 24 27 5.4% 6.7% 8.0% 7.4% 0.0% 2.0% 4.0% 6.0% 8.0% 10.0% 12.0% 14.0% 16.0% 0 20 40 60 80 100 120 140 160 180 200 FY 2006 FY 2007 FY 2008 FY 2009 109 143 190 185 Balance Sheet & Cash Flow Data (1) See reconciliation of the cost of sales to exclude special items at www.biomet. com Capex Instruments Placed Distributor Instrument Buybacks As a % of Sales Working Capital Initiatives • Tax efficient global Supply Chain • Receivables Management • Centralized Treasury |
  Six Months Ended
 November 30, 2009 November 30, 2008 Unlevered Free Cash Flow (1) 224.9 $
(2) 223.1 $
Cash Paid for
Interest (257.1) $
(277.1) $
Free Cash Flow (24.9) $
(45.3) $
Cash From
Operations 81.1 $
47.6 $
In Millions, Unaudited 24 (1) Free cash flow (FCF) that does not take into account the interest payments required on
outstanding debt. Commonly used by companies that are highly leveraged to show how assets perform before
interest. (2) Amount includes a $53M legal settlement, as previously disclosed. Free Cash Flow H1 Fiscal 2010 vs. H1 Fiscal
2009 |
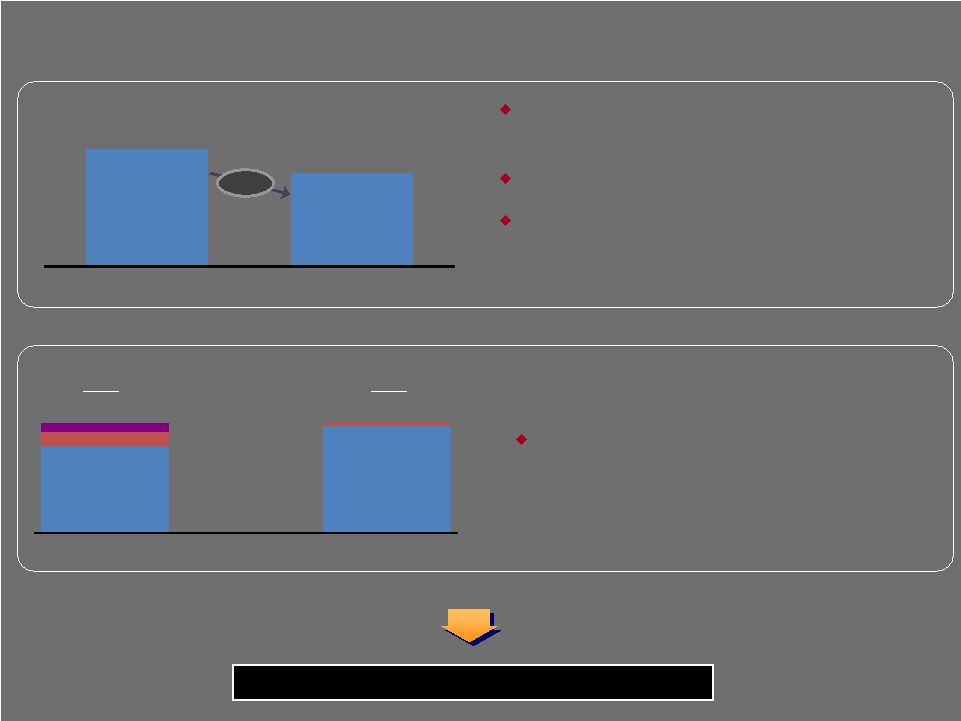 $792 $968 Total Liquidity LTM EBITDA 7.7x 6.1x At Transaction Close Today LIQUIDITY NET DEBT LEVERAGE RATIOS (including projected run rate cost savings) Flexible capital structure with significant liquidity (1) As of November 30, 2009, as defined by our Credit Agreement (1) (1) Significant progress in driving down the leverage ratio since the LBO No maintenance covenants No material debt maturities until $750MM revolver (largely undrawn today) in 2013 – Remainder of debt maturities in 2015–2017 Significant available liquidity provides operational and strategic flexibility Cash Available Revolving Borrowings 21% $80 Cash Savings from 1 year PIK Toggle 25 Capital Structure $118 $27 $990 $995 RRCS Actual LTM |
 26
|
 Sustain
above market growth globally in our core joint reconstructive product segments
Ensure pipeline is rich in short- and long-term growth drivers Grow spine, sports medicine and biologics double digits; turn around trauma Limit downside risk to 3i profitability and cash flow due to economic recession and invest in new products to drive long-term growth, while positioning for long-term growth upon recovery Continue to drive efficiencies in our global operations and supply chain network Continue to manage working capital aggressively to maximize cash flow generation Retain key aspects of Biomet’s unique culture, while driving broad-based change and infusing new talent as required 27 Current Priorities |
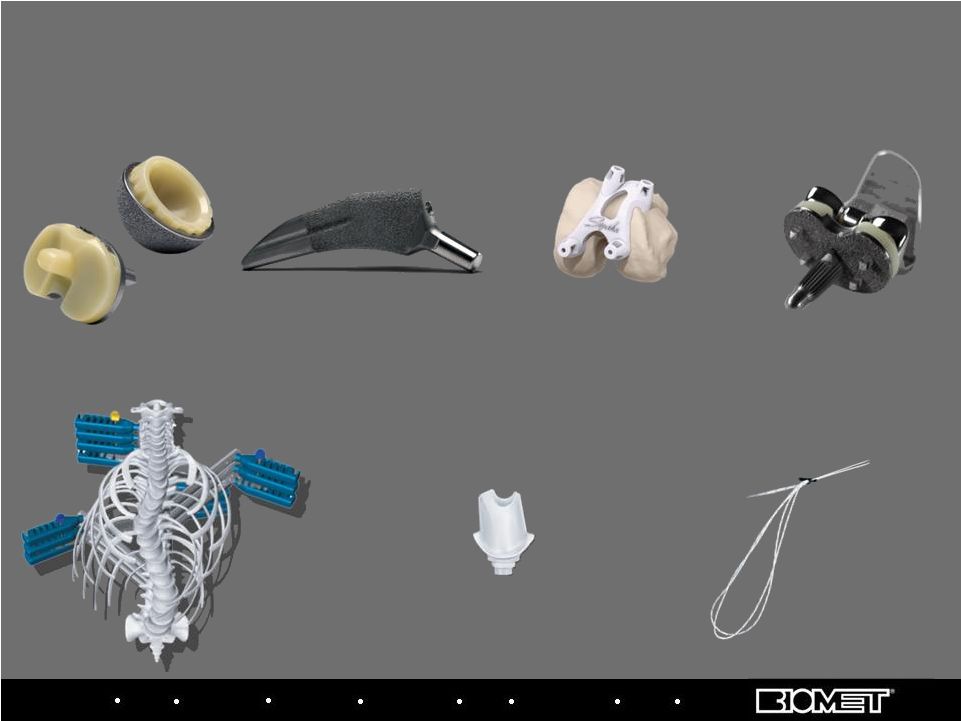 Biologics Bracing Microfixation Orthopaedics Osteobiologics Spine Sports Medicine Trauma 3i E1 Antioxidant Infused Technology Bearings Vanguard Regenerex Tibial Tray Signature Personalized Patient Care Program Taperloc Microplasty Hip Stem 28 Current Recently Launched Product Growth Drivers Polaris Deformity System Encode Complete System ToggleLoc Femoral Fixation Device with ZipLoop Technology |
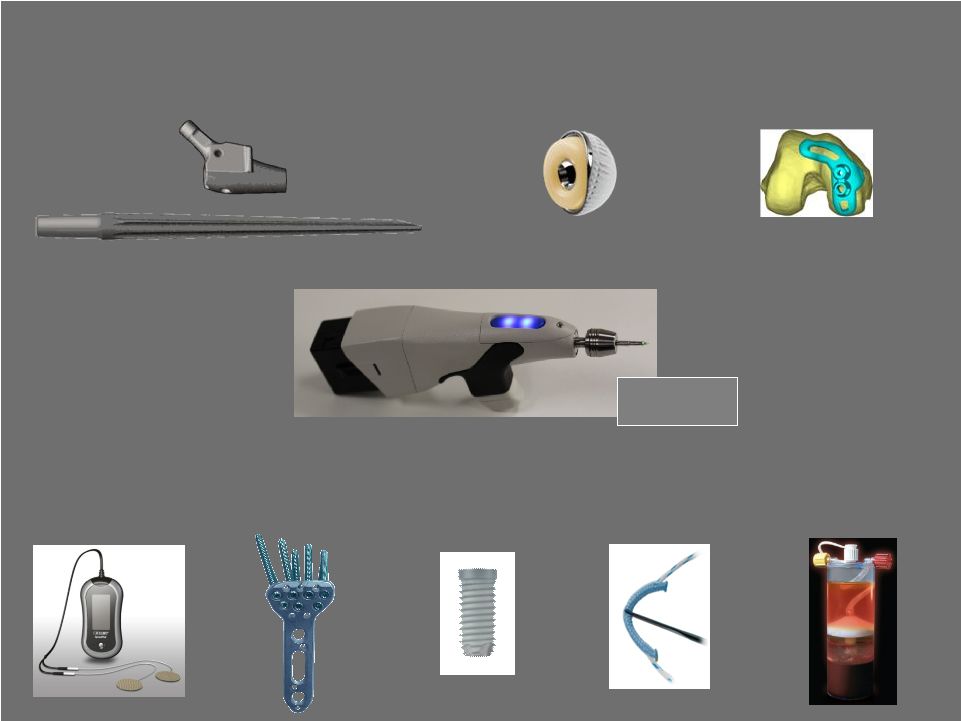 29 Pipeline Highlights BioCue Platelet Concentration System IQ Intelligent System OrthoPak Stimulation System OptiLock VL Distal Radius Plate System JuggerKnot Suture Anchor OSSEOTITE II Dental Implant Arcos Modular Revision Hip System E1 Avantage Hip Cup* Signature System for Partial Knee *Not available in the U.S. |
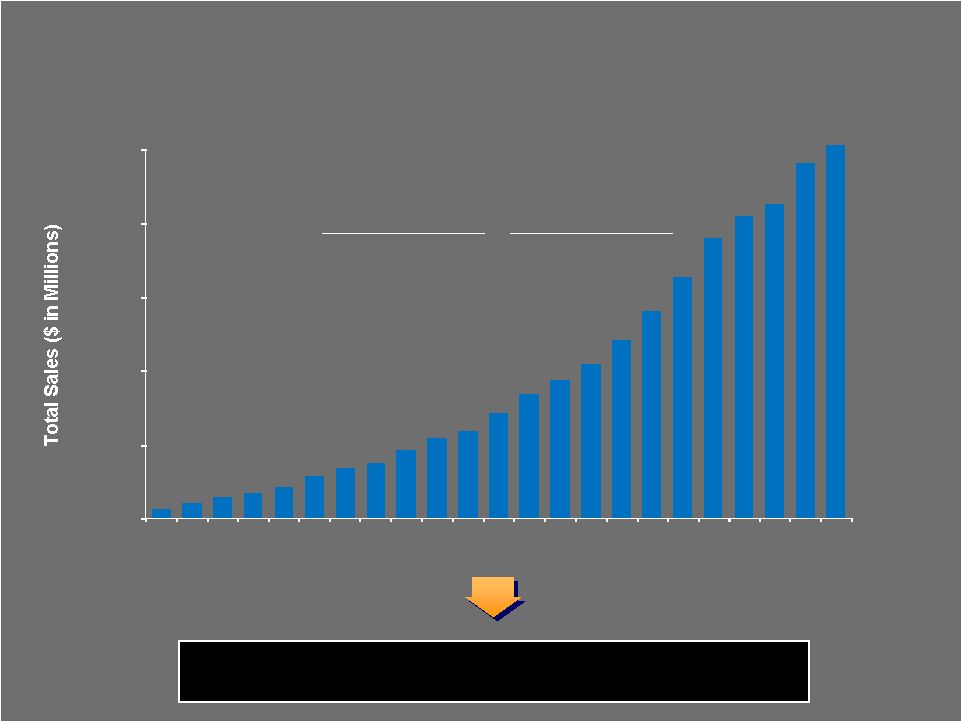 CONSOLIDATED SALES (Total Sales $ in Millions) Extraordinary long-term track record of revenue growth through multiple industry and macro-economic cycles 10 Year CAGR 20 Year CAGR 11.7% 15.7% 30 Biomet Long-Term Track Record $0 $500 $1,000 $1,500 $2,000 $2,500 1987 1988 1989 1990 1991 1992 1993 1994 1995 1996 1997 1998 1999 2000 2001 2002 2003 2004 2005 2006 2007 2008 2009 Sales |
 |