Attached files
| file | filename |
|---|---|
| 8-K - 8-K - VIVUS INC | a10-1678_18k.htm |
| EX-99.3 - EX-99.3 - VIVUS INC | a10-1678_1ex99d3.htm |
| EX-99.2 - EX-99.2 - VIVUS INC | a10-1678_1ex99d2.htm |
Exhibit 99.1
|
|
VIVUS, Inc. (NASDAQ: VVUS) Innovative Products, Novel Therapies |
|
|
Forward-Looking Statements Forward-Looking Statements During the course of this presentation, we will make forward-looking statements regarding future events and our future performance. The words “believe”, “anticipate”, “expect”, “estimate”, “intend”, ”plan”, “may”, “will” and other similar expressions generally identify forward-looking statements. In addition, any statements that refer to expectations, projections or other characterizations of future events or circumstances are forward-looking statements. Forward-looking statements entail various significant risks and uncertainties that could cause our actual results to differ materially from those expressed in such forward-looking statements. You are cautioned not to place undue reliance on these forward-looking statements, which speak only as of the date hereof. We do not intend to update any of the information contained in any forward-looking statement, except as required by law. Please see the sections entitled “Risk factors” in our quarterly report on Form 10-Q for the quarter ended September 30, 2009 and in our prospectus supplement recently filed with the SEC for a more detailed description of the risks and uncertainties to which we are subject, as well as the section entitled "Forward Looking Statements" in the prospectus supplement for additional information regarding forward-looking statements. |
|
|
Vivus Recent History of Success Approval of Evamist on PDUFA date Monetization of Evamist generating $150M cash Demonstrated that Qnexa was highly effective in treating diabetes (HbA1c reduced by 1.6%). Qnexa treatment also shown to stop the progression of diabetics in pre-diabetics. Phase 3 data with Qnexa in obesity showed unprecedented weight loss up to 14.7% and improvements in all cardiovascular and metabolic risk factors Qnexa well tolerated in 3,749 patients. No meaningful signal for depression, suicidality or impairment of cognitive function Submitted Qnexa NDA for obesity on time Showed Qnexa resulted in 69% reduction in sleep apnea events, significant weight loss, improvements in blood oxygen levels and blood pressure Avanafil phase 3 results indicate efficacy in 15 minutes |
|
|
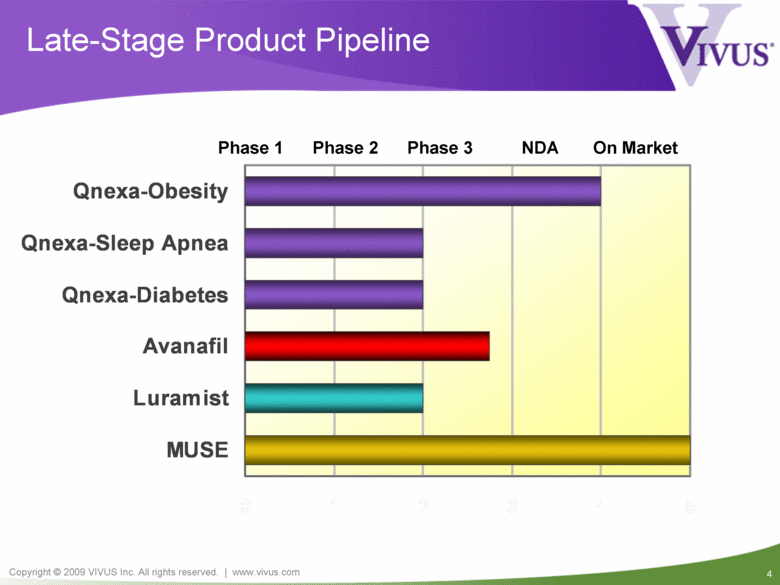
Late-Stage Product Pipeline Phase 1 Phase 2 Phase 3 NDA On Market MUSE Luramist Avanafil Qnexa-Diabetes Qnexa-Sleep Apnea Qnexa-Obesity |
|
|
Qnexa (OB-204) Obstructive Sleep Apnea |
|
|
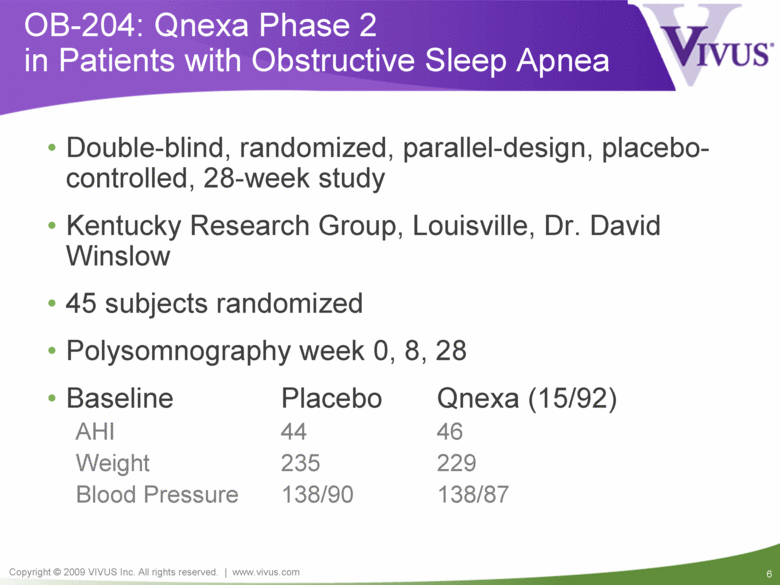
OB-204: Qnexa Phase 2 in Patients with Obstructive Sleep Apnea Double-blind, randomized, parallel-design, placebo-controlled, 28-week study Kentucky Research Group, Louisville, Dr. David Winslow 45 subjects randomized Polysomnography week 0, 8, 28 Baseline Placebo Qnexa (15/92) AHI 44 46 Weight 235 229 Blood Pressure 138/90 138/87 |
|
|
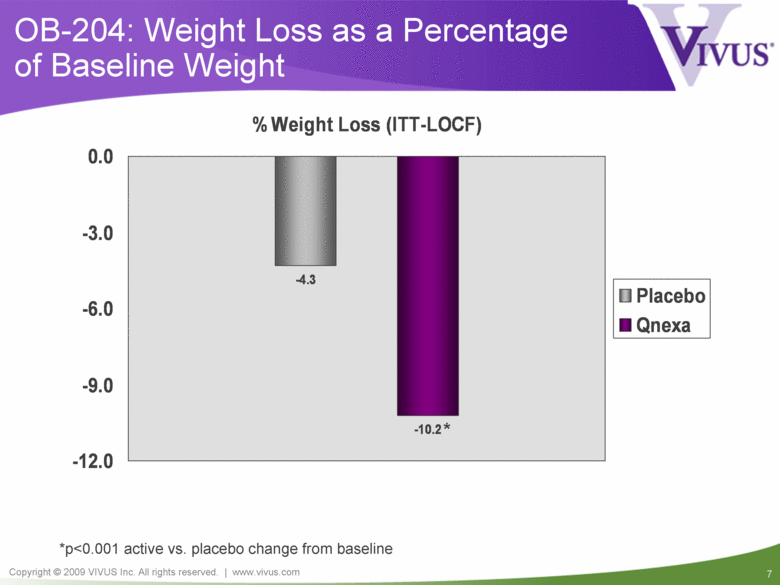
OB-204: Weight Loss as a Percentage of Baseline Weight *p<0.001 active vs. placebo change from baseline -4.3 -10.2* -12.0 -9.0 -6.0 -3.0 0.0 % Weight Loss (ITT-LOCF) Placebo Qnexa |
|
|
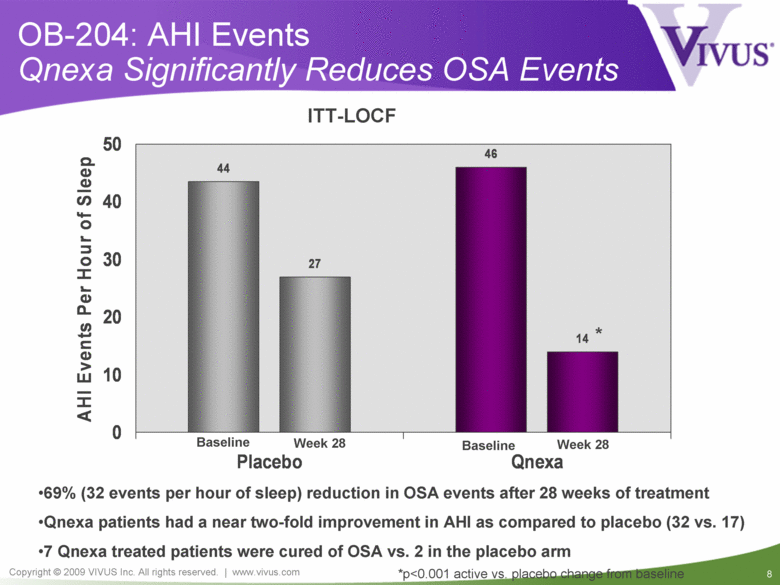
OB-204: AHI Events Qnexa Significantly Reduces OSA Events *p<0.001 active vs. placebo change from baseline 69% (32 events per hour of sleep) reduction in OSA events after 28 weeks of treatment Qnexa patients had a near two-fold improvement in AHI as compared to placebo (32 vs. 17) 7 Qnexa treated patients were cured of OSA vs. 2 in the placebo arm ITT-LOCF Baseline Week 28 Week 28 Baseline 46 27 14* 44 0 10 20 30 40 50 Placebo Qnexa AHI Events Per Hour of Sleep |
|
|
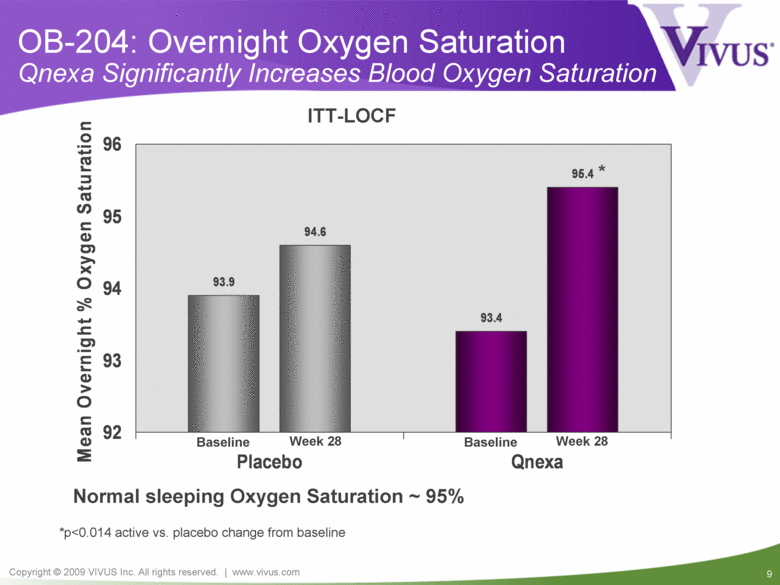
OB-204: Overnight Oxygen Saturation Qnexa Significantly Increases Blood Oxygen Saturation *p<0.014 active vs. placebo change from baseline ITT-LOCF Normal sleeping Oxygen Saturation ~ 95% Baseline Baseline Week 28 Week 28 93.9 93.4 94.6 95.4 * 92 93 94 95 96 Placebo Qnexa Mean Overnight % Oxygen Saturation |
|
|
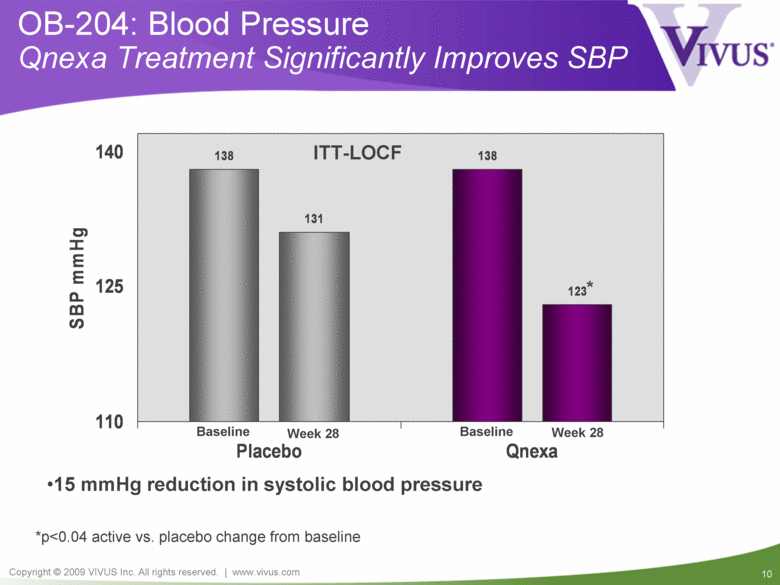
OB-204: Blood Pressure Qnexa Treatment Significantly Improves SBP *p<0.04 active vs. placebo change from baseline ITT-LOCF 15 mmHg reduction in systolic blood pressure Week 28 Week 28 Baseline Baseline 138 138 131 123 * 110 125 140 Placebo Qnexa SBP mmHg |
|
|
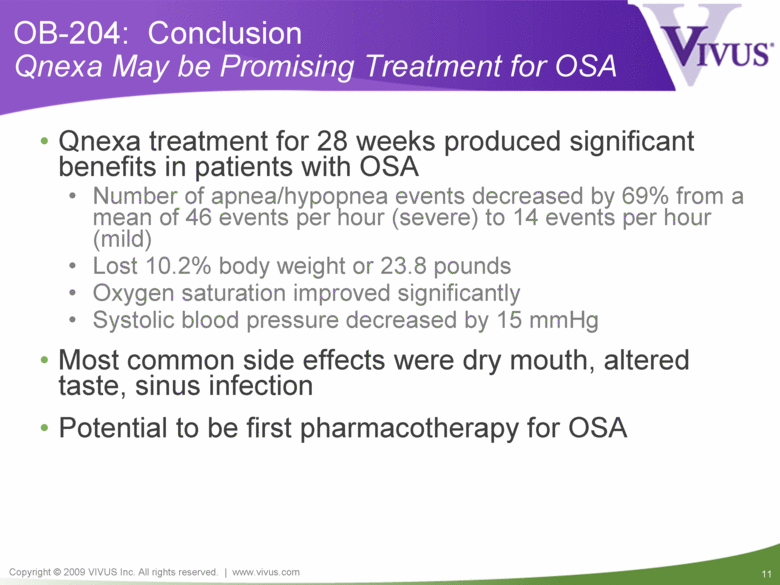
OB-204: Conclusion Qnexa May be Promising Treatment for OSA Qnexa treatment for 28 weeks produced significant benefits in patients with OSA Number of apnea/hypopnea events decreased by 69% from a mean of 46 events per hour (severe) to 14 events per hour (mild) Lost 10.2% body weight or 23.8 pounds Oxygen saturation improved significantly Systolic blood pressure decreased by 15 mmHg Most common side effects were dry mouth, altered taste, sinus infection Potential to be first pharmacotherapy for OSA |
|
|
Qnexa Oral Treatment for Obesity |
|
|
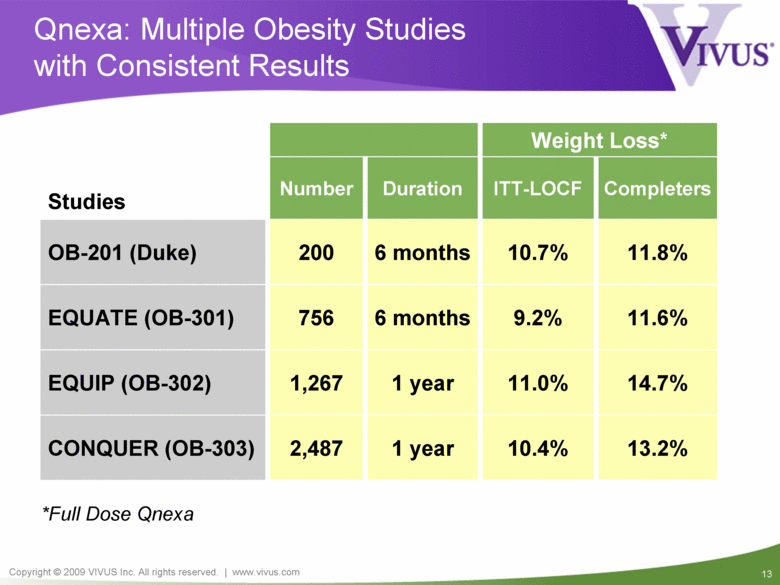
14.7% 11.0% 1 year 1,267 EQUIP (OB-302) 11.8% 10.7% 6 months 200 OB-201 (Duke) 11.6% 9.2% 6 months 756 EQUATE (OB-301) 13.2% 10.4% 1 year 2,487 CONQUER (OB-303) Weight Loss* ITT-LOCF Studies Number Duration Completers Qnexa: Multiple Obesity Studies with Consistent Results *Full Dose Qnexa |
|
|
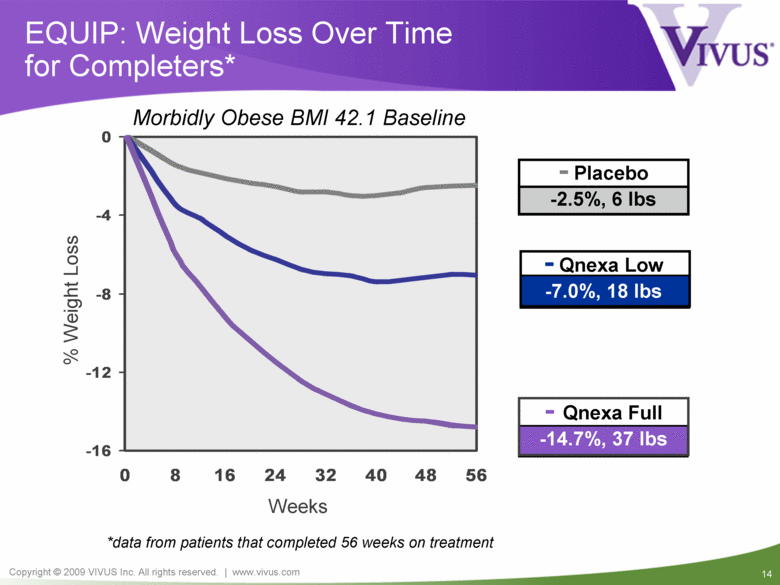
EQUIP: Weight Loss Over Time for Completers* *data from patients that completed 56 weeks on treatment - Qnexa Low -7.0%, 18 lbs - Placebo -2.5%, 6 lbs - Qnexa Full -14.7%, 37 lbs % Weight Loss Weeks Morbidly Obese BMI 42.1 Baseline -16 -12 -8 -4 0 0 8 16 24 32 40 48 56 |
|
|
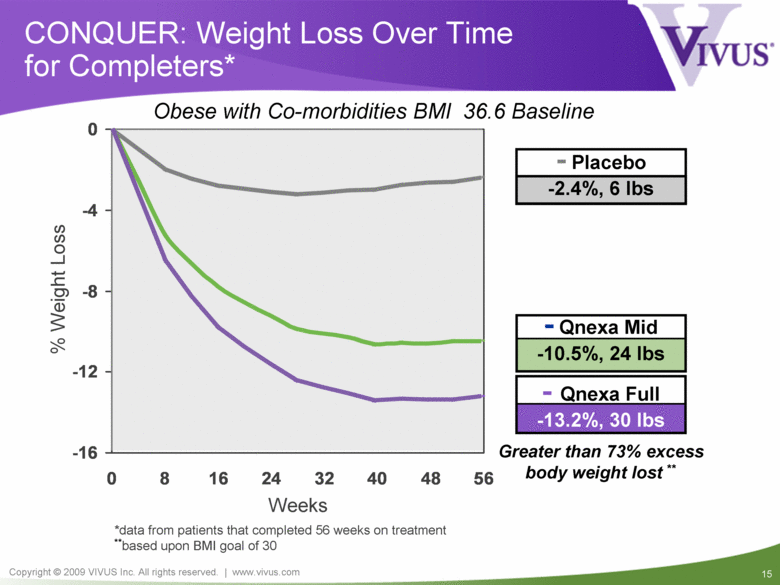
- Qnexa Mid -10.5%, 24 lbs - Qnexa Full -13.2%, 30 lbs CONQUER: Weight Loss Over Time for Completers* *data from patients that completed 56 weeks on treatment **based upon BMI goal of 30 Greater than 73% excess body weight lost ** - Placebo -2.4%, 6 lbs Weeks % Weight Loss Obese with Co-morbidities BMI 36.6 Baseline -16 -12 -8 -4 0 0 8 16 24 32 40 48 56 |
|
|
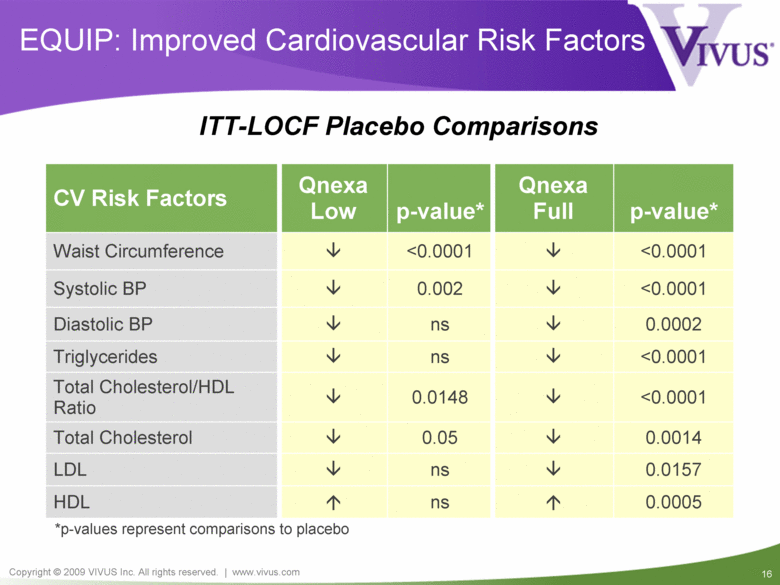
EQUIP: Improved Cardiovascular Risk Factors <0.0001 0.0148 Total Cholesterol/HDL Ratio <0.0001 ns Triglycerides 0.0157 ns LDL 0.0005 ns HDL <0.0001 <0.0001 Waist Circumference 0.0014 0.05 Total Cholesterol ns 0.002 p-value* Qnexa Low CV Risk Factors Qnexa Full p-value* Systolic BP <0.0001 Diastolic BP 0.0002 *p-values represent comparisons to placebo ITT-LOCF Placebo Comparisons |
|
|
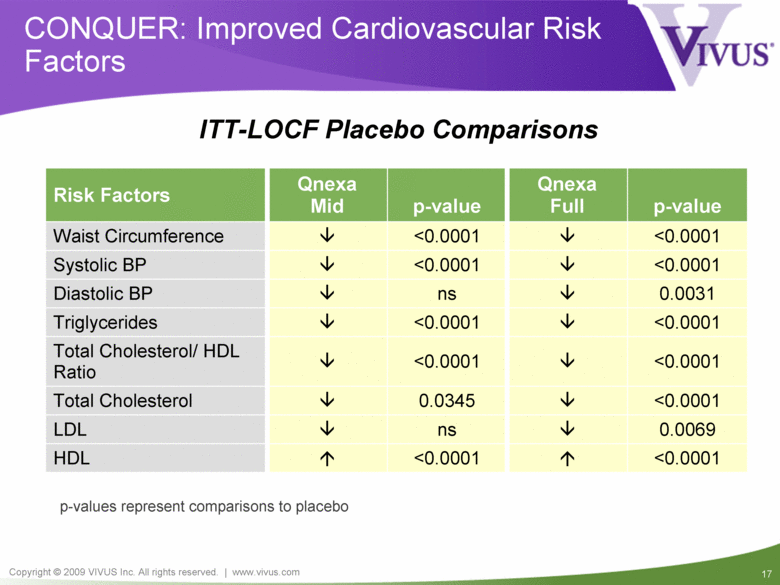
CONQUER: Improved Cardiovascular Risk Factors <0.0001 0.0345 Total Cholesterol <0.0001 <0.0001 Triglycerides 0.0069 ns LDL <0.0001 <0.0001 HDL <0.0001 <0.0001 Waist Circumference <0.0001 <0.0001 Total Cholesterol/ HDL Ratio ns <0.0001 p-value Qnexa Mid Risk Factors Qnexa Full p-value Systolic BP <0.0001 Diastolic BP 0.0031 p-values represent comparisons to placebo ITT-LOCF Placebo Comparisons |
|
|
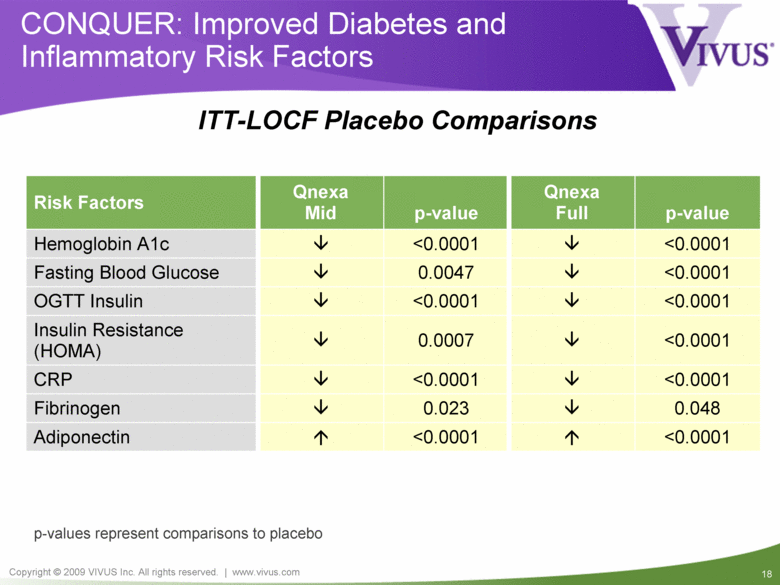
CONQUER: Improved Diabetes and Inflammatory Risk Factors <0.0001 <0.0001 CRP 0.048 0.023 Fibrinogen <0.0001 <0.0001 Adiponectin <0.0001 <0.0001 Insulin Resistance (HOMA) <0.0001 0.0007 OGTT Insulin <0.0001 0.0047 Fasting Blood Glucose <0.0001 <0.0001 Hemoglobin A1c p-value Qnexa Mid Risk Factors Qnexa Full p-value p-values represent comparisons to placebo ITT-LOCF Placebo Comparisons |
|
|
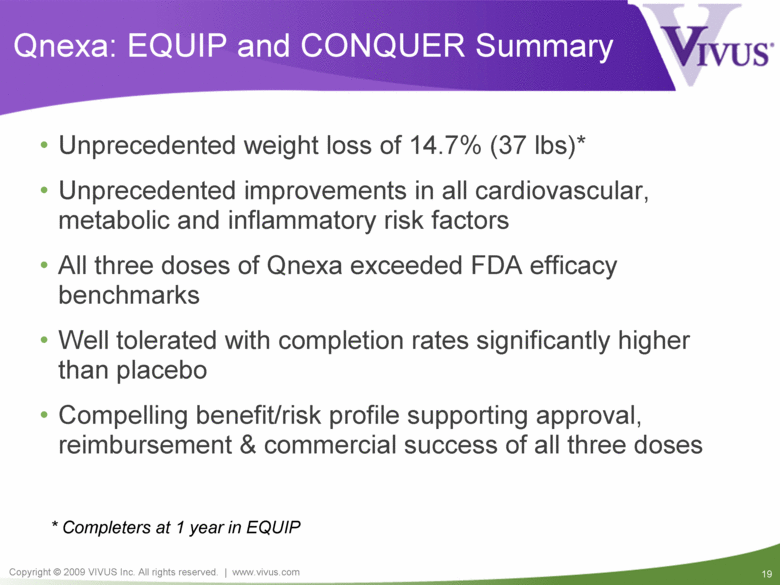
Qnexa: EQUIP and CONQUER Summary Unprecedented weight loss of 14.7% (37 lbs)* Unprecedented improvements in all cardiovascular, metabolic and inflammatory risk factors All three doses of Qnexa exceeded FDA efficacy benchmarks Well tolerated with completion rates significantly higher than placebo Compelling benefit/risk profile supporting approval, reimbursement & commercial success of all three doses * Completers at 1 year in EQUIP |
|
|
Qnexa for Diabetes Phase 2 Results |
|
|
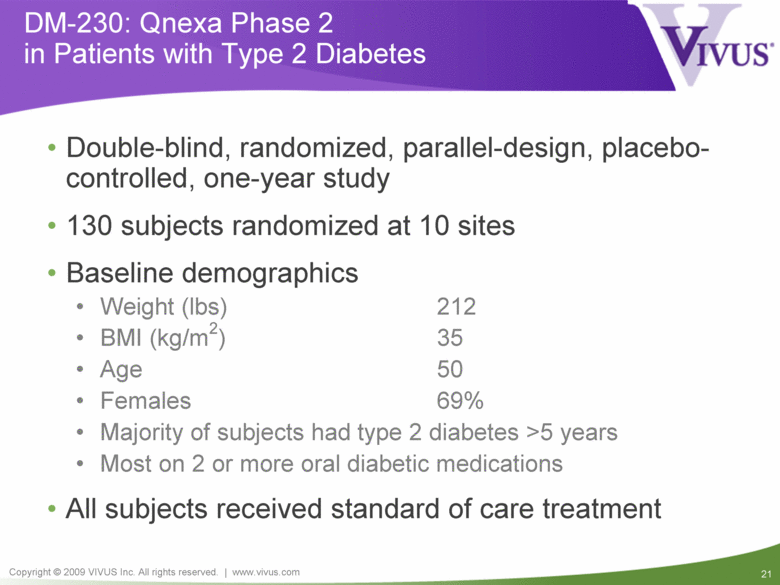
DM-230: Qnexa Phase 2 in Patients with Type 2 Diabetes Double-blind, randomized, parallel-design, placebo-controlled, one-year study 130 subjects randomized at 10 sites Baseline demographics Weight (lbs) 212 BMI (kg/m2) 35 Age 50 Females 69% Majority of subjects had type 2 diabetes >5 years Most on 2 or more oral diabetic medications All subjects received standard of care treatment |
|
|
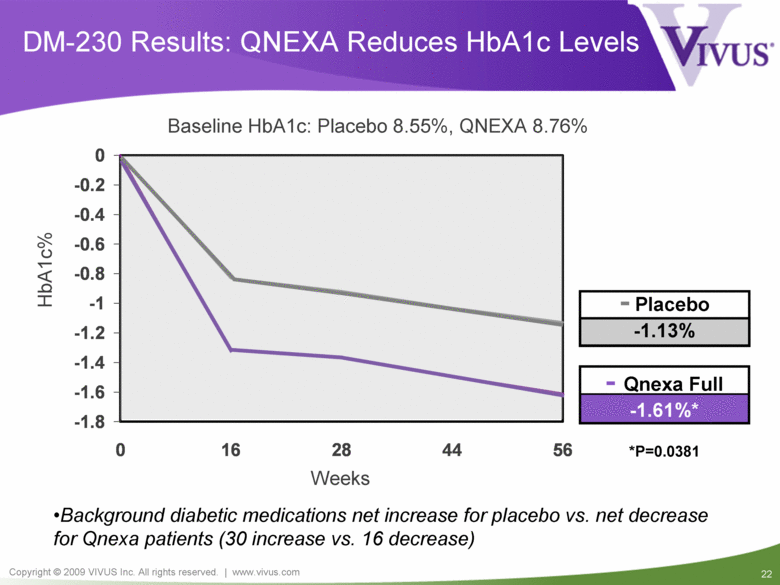
DM-230 Results: QNEXA Reduces HbA1c Levels Baseline HbA1c: Placebo 8.55%, QNEXA 8.76% *P=0.0381 Background diabetic medications net increase for placebo vs. net decrease for Qnexa patients (30 increase vs. 16 decrease) - Placebo -1.13% HbA1c% - Qnexa Full -1.61%* Weeks -1.8 -1.6 -1.4 -1.2 -1 -0.8 -0.6 -0.4 -0.2 0 0 16 28 44 56 |
|
|
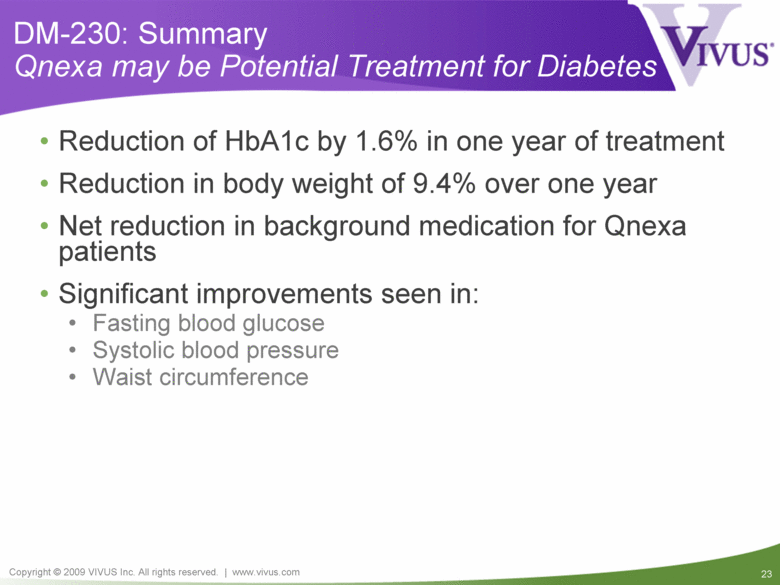
DM-230: Summary Qnexa may be Potential Treatment for Diabetes Reduction of HbA1c by 1.6% in one year of treatment Reduction in body weight of 9.4% over one year Net reduction in background medication for Qnexa patients Significant improvements seen in: Fasting blood glucose Systolic blood pressure Waist circumference |
|
|
Avanafil for ED Phase 3 Results |
|
|
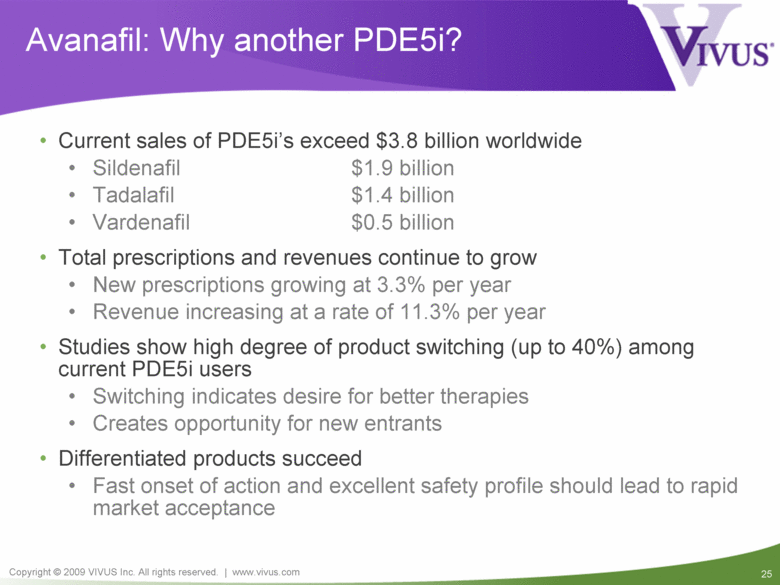
Avanafil: Why another PDE5i? Current sales of PDE5i’s exceed $3.8 billion worldwide Sildenafil $1.9 billion Tadalafil $1.4 billion Vardenafil $0.5 billion Total prescriptions and revenues continue to grow New prescriptions growing at 3.3% per year Revenue increasing at a rate of 11.3% per year Studies show high degree of product switching (up to 40%) among current PDE5i users Switching indicates desire for better therapies Creates opportunity for new entrants Differentiated products succeed Fast onset of action and excellent safety profile should lead to rapid market acceptance |
|
|
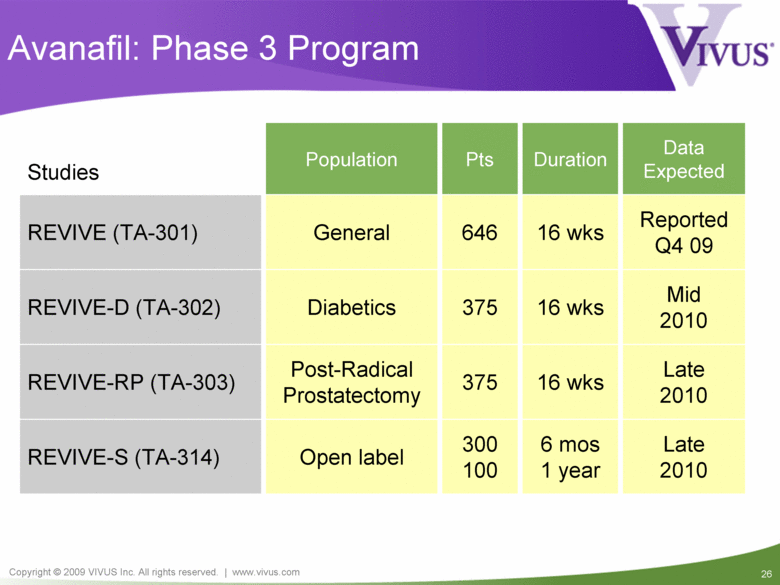
Late 2010 16 wks 375 Post-Radical Prostatectomy REVIVE-RP (TA-303) Reported Q4 09 16 wks 646 General REVIVE (TA-301) Mid 2010 16 wks 375 Diabetics REVIVE-D (TA-302) Late 2010 6 mos 1 year 300 100 Open label REVIVE-S (TA-314) Duration Studies Population Pts Data Expected Avanafil: Phase 3 Program |
|
|
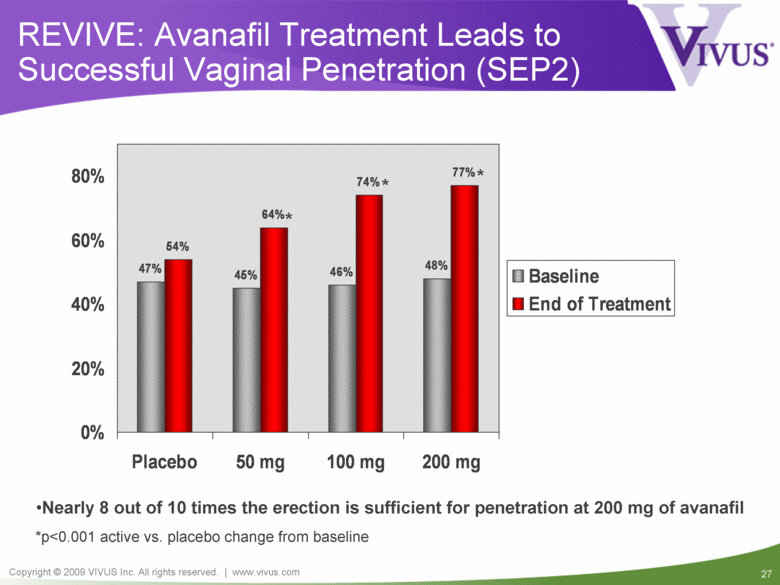
REVIVE: Avanafil Treatment Leads to Successful Vaginal Penetration (SEP2) *p<0.001 active vs. placebo change from baseline Nearly 8 out of 10 times the erection is sufficient for penetration at 200 mg of avanafil * * * 47% 45% 46% 48% 54% 64% 74% 77% 0% 20% 40% 60% 80% Placebo 50 mg 100 mg 200 mg Baseline End of Treatment |
|
|
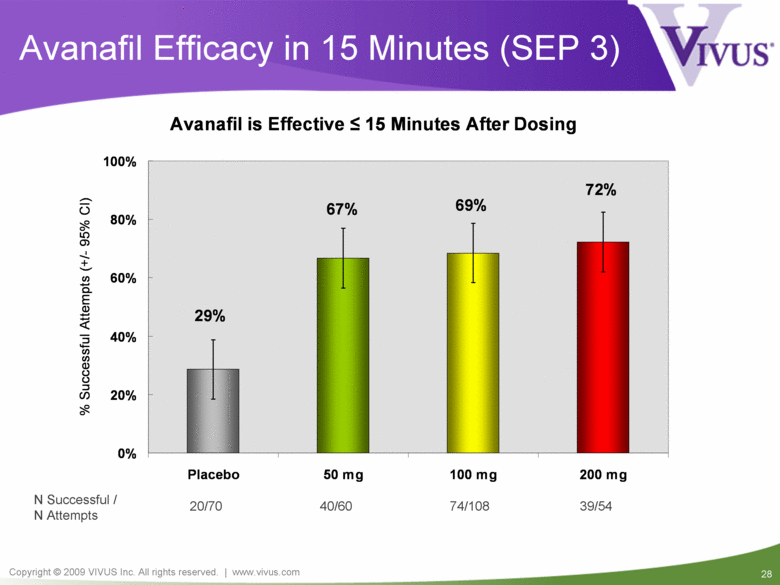
20/70 40/60 39/54 N Successful / N Attempts 74/108 Avanafil Efficacy in 15 Minutes (SEP 3) Avanafil is Effective < 15 Minutes After Dosing 72% 69% 67% 29% 0% 20% 40% 60% 80% 100% Placebo 50 mg 100 mg 200 mg % Successful Attempts (+/- 95% CI) |
|
|
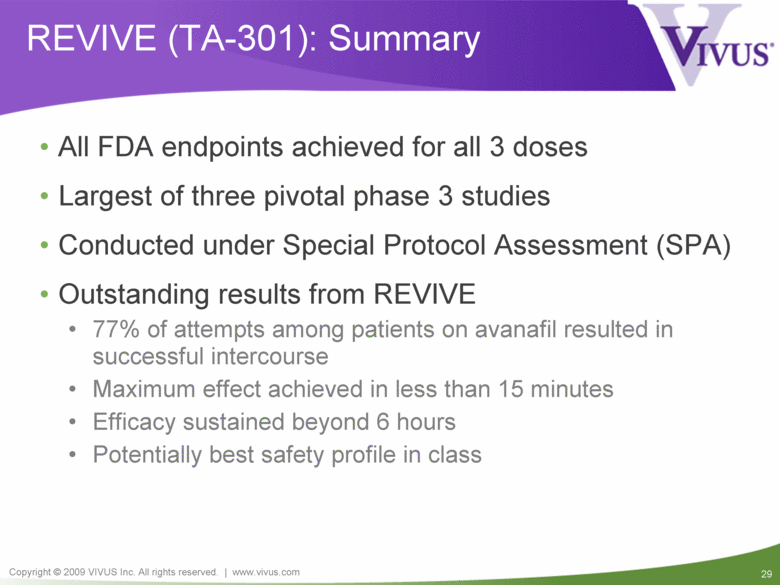
REVIVE (TA-301): Summary All FDA endpoints achieved for all 3 doses Largest of three pivotal phase 3 studies Conducted under Special Protocol Assessment (SPA) Outstanding results from REVIVE 77% of attempts among patients on avanafil resulted in successful intercourse Maximum effect achieved in less than 15 minutes Efficacy sustained beyond 6 hours Potentially best safety profile in class |
|
|
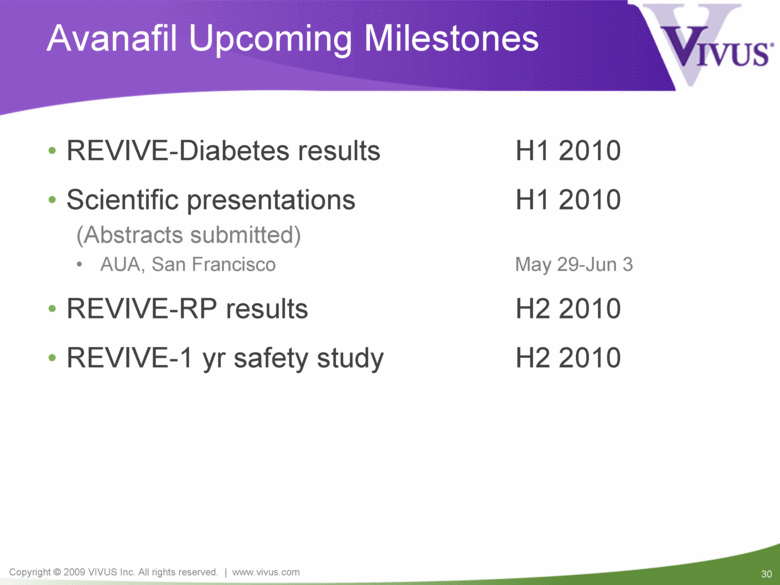
Avanafil Upcoming Milestones REVIVE-Diabetes results H1 2010 Scientific presentations H1 2010 (Abstracts submitted) AUA, San Francisco May 29-Jun 3 REVIVE-RP results H2 2010 REVIVE-1 yr safety study H2 2010 |
|
|
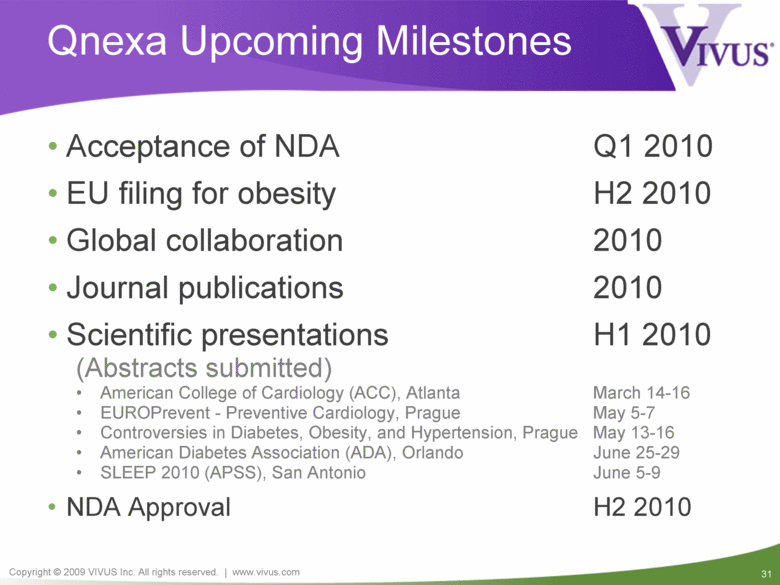
Qnexa Upcoming Milestones Acceptance of NDA Q1 2010 EU filing for obesity H2 2010 Global collaboration 2010 Journal publications 2010 Scientific presentations H1 2010 (Abstracts submitted) American College of Cardiology (ACC), Atlanta March 14-16 EUROPrevent - Preventive Cardiology, Prague May 5-7 Controversies in Diabetes, Obesity, and Hypertension, Prague May 13-16 American Diabetes Association (ADA), Orlando June 25-29 SLEEP 2010 (APSS), San Antonio June 5-9 NDA Approval H2 2010 |
|
|
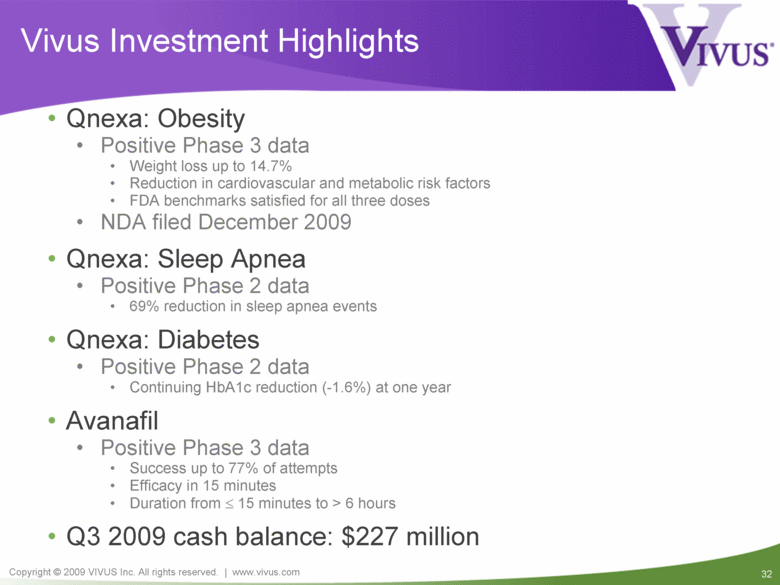
Vivus Investment Highlights Qnexa: Obesity Positive Phase 3 data Weight loss up to 14.7% Reduction in cardiovascular and metabolic risk factors FDA benchmarks satisfied for all three doses NDA filed December 2009 Qnexa: Sleep Apnea Positive Phase 2 data 69% reduction in sleep apnea events Qnexa: Diabetes Positive Phase 2 data Continuing HbA1c reduction (-1.6%) at one year Avanafil Positive Phase 3 data Success up to 77% of attempts Efficacy in 15 minutes Duration from < 15 minutes to > 6 hours Q3 2009 cash balance: $227 million |


