Attached files
| file | filename |
|---|---|
| 8-K - FORM 8-K - NATIONAL FUEL GAS CO | l38474e8vk.htm |
Exhibit 99
| The BMO Capital Markets 2010 Unconventional Resource Conference January 12, 2010 Exhibit 99 |

| Safe Harbor For Forward Looking Statements This presentation may contain "forward-looking statements" as defined by the Private Securities Litigation Reform Act of 1995, including statements regarding future prospects, plans, performance and capital structure, anticipated capital expenditures and completion of construction projects, as well as statements that are identified by the use of the words "anticipates," "estimates," "expects," "forecasts," "intends," "plans," "predicts," "projects," "believes," "seeks," "will," "may," and similar expressions. Forward-looking statements involve risks and uncertainties, which could cause actual results or outcomes to differ materially from those expressed in the forward-looking statements. The Company's expectations, beliefs and projections contained herein are expressed in good faith and are believed to have a reasonable basis, but there can be no assurance that such expectations, beliefs or projections will result or be achieved or accomplished. In addition to other factors, the following are important factors that could cause actual results to differ materially from results referred to in the forward-looking statements: financial and economic conditions, including the availability of credit, and their effect on the Company's ability to obtain financing on acceptable terms for working capital, capital expenditures and other investments; occurrences affecting the Company's ability to obtain financing under credit lines or other credit facilities or through the issuance of commercial paper, other short-term notes or debt or equity securities, including any downgrades in the Company's credit ratings and changes in interest rates and other capital market conditions; changes in economic conditions, including global, national or regional recessions, and their effect on the demand for, and customers' ability to pay for, the Company's products and services; the creditworthiness or performance of the Company's key suppliers, customers and counterparties; economic disruptions or uninsured losses resulting from terrorist activities, acts of war, major accidents, fires, hurricanes, other severe weather, pest infestation or other natural disasters; changes in actuarial assumptions, the interest rate environment and the return on plan/trust assets related to the Company's pension and other post-retirement benefits, which can affect future funding obligations and costs and plan liabilities; changes in demographic patterns and weather conditions; changes in the availability and/or price of natural gas or oil and the effect of such changes on the accounting treatment of derivative financial instruments or the valuation of the Company's natural gas and oil reserves; impairments under the SEC's full cost ceiling test for natural gas and oil reserves; uncertainty of oil and gas reserve estimates; factors affecting the Company's ability to successfully identify, drill for and produce economically viable natural gas and oil reserves, including among others geology, lease availability, weather conditions, shortages, delays or unavailability of equipment and services required in drilling operations, and the need to obtain governmental approvals and permits and comply with environmental laws and regulations; significant differences between the Company's projected and actual production levels for natural gas or oil; changes in the availability and/or price of derivative financial instruments; changes in the price differentials between oil having different quality and/or different geographic locations, or changes in the price differentials between natural gas having different heating values and/or different geographic locations; inability to obtain new customers or retain existing ones; significant changes in competitive factors affecting the Company; changes in laws and regulations to which the Company is subject, including tax, environmental, safety and employment laws and regulations; governmental/regulatory actions, initiatives and proceedings, including those involving acquisitions, financings, rate cases (which address, among other things, allowed rates of return, rate design and retained natural gas), affiliate relationships, industry structure, franchise renewal, and environmental/safety requirements; unanticipated impacts of restructuring initiatives in the natural gas and electric industries; significant differences between the Company's projected and actual capital expenditures and operating expenses, and unanticipated project delays or changes in project costs or plans; the nature and projected profitability of pending and potential projects and other investments, and the ability to obtain necessary governmental approvals and permits; ability to successfully identify and finance acquisitions or other investments and ability to operate and integrate existing and any subsequently acquired business or properties; significant changes in tax rates or policies or in rates of inflation or interest; significant changes in the Company's relationship with its employees or contractors and the potential adverse effects if labor disputes, grievances or shortages were to occur; changes in accounting principles or the application of such principles to the Company; the cost and effects of legal and administrative claims against the Company or activist shareholder campaigns to effect changes at the Company; increasing health care costs and the resulting effect on health insurance premiums and on the obligation to provide other post-retirement benefits; or increasing costs of insurance, changes in coverage and the ability to obtain insurance. For a discussion of these risks and other factors that could cause actual results to differ materially from results referred to in the forward-looking statements, see "Risk Factors" in the Company's Form 10-K for the fiscal year ended September 30, 2009. The Company disclaims any obligation to update any forward-looking statements to reflect events or circumstances after the date hereof or to reflect the occurrence of unanticipated events. The Securities and Exchange Commission (the "SEC") currently permits the Company, in its filing with the SEC, to disclose only proved reserves that the Company has demonstrated by actual production or conclusive formation tests to be economically and legally producible under existing economic and operating conditions. The Company uses the terms "probable," "possible," "resource potential" and other descriptions of volumes of reserves or resources potentially recoverable through additional drilling or recovery techniques that the SEC's guidelines would prohibit us from including in filings with the SEC. These estimates are by their nature more speculative than estimates of proved reserves and, accordingly, are subject to substantially greater risk of being actually realized. Investors are urged to consider closely the disclosure in our Form 10-K available at www.nationalfuelgas.com. You can also obtain this form on the SEC's website at www.sec.gov. |

| Exploration & Production Seneca Resources Corporation |
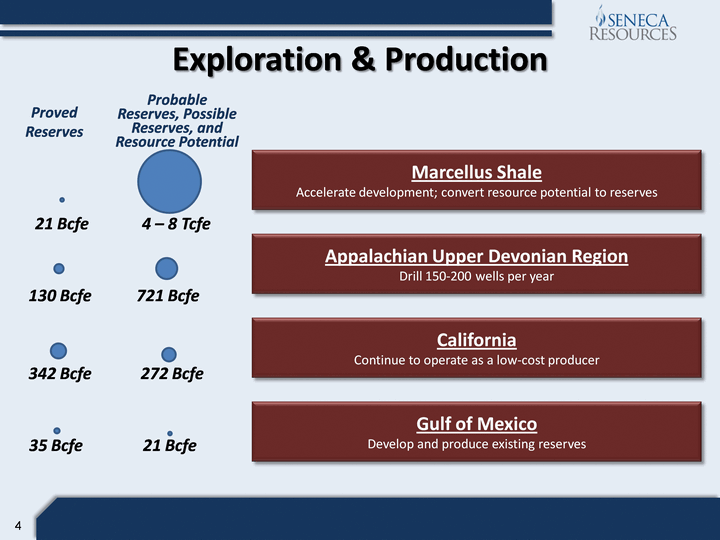
| Exploration & Production Marcellus Shale Accelerate development; convert resource potential to reserves Appalachian Upper Devonian Region Drill 150-200 wells per year Proved Reserves California Continue to operate as a low-cost producer Gulf of Mexico Develop and produce existing reserves 721 Bcfe 4 - 8 Tcfe 35 Bcfe 342 Bcfe Probable Reserves, Possible Reserves, and Resource Potential 130 Bcfe 21 Bcfe 272 Bcfe 21 Bcfe |
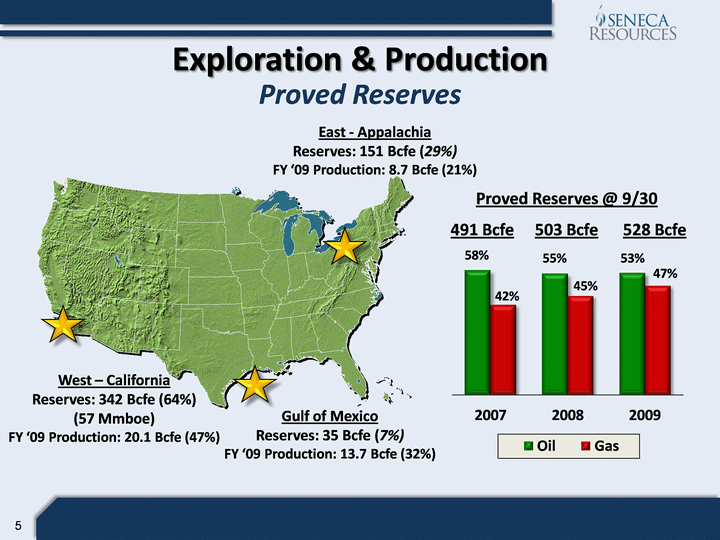
| Exploration & Production Proved Reserves (CHART) Proved Reserves @ 9/30 491 Bcfe 503 Bcfe 528 Bcfe West - California Reserves: 342 Bcfe (64%) (57 Mmboe) FY '09 Production: 20.1 Bcfe (47%) Gulf of Mexico Reserves: 35 Bcfe (7%) FY '09 Production: 13.7 Bcfe (32%) East - Appalachia Reserves: 151 Bcfe (29%) FY '09 Production: 8.7 Bcfe (21%) 58% 55% 53% |
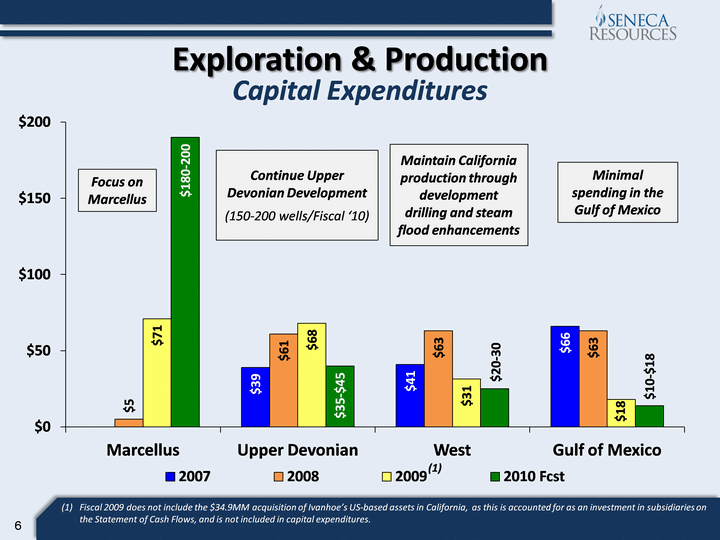
| Exploration & Production Capital Expenditures (CHART) Fiscal 2009 does not include the $34.9MM acquisition of Ivanhoe's US-based assets in California, as this is accounted for as an investment in subsidiaries on the Statement of Cash Flows, and is not included in capital expenditures. (1) |
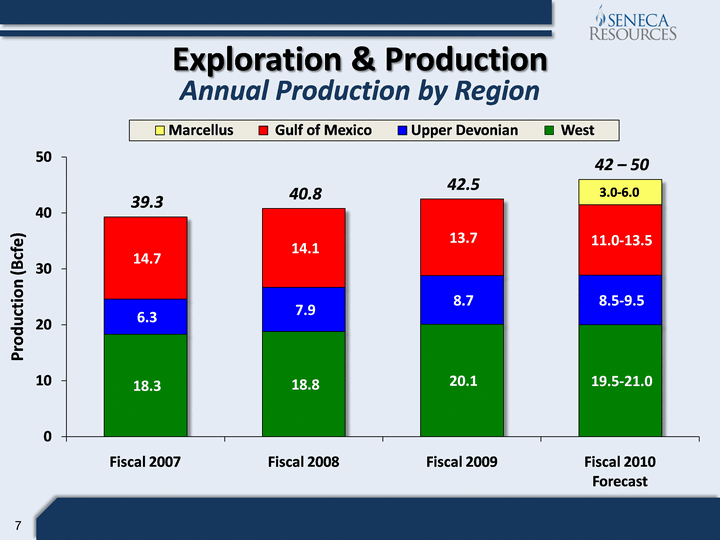
| Exploration & Production Annual Production by Region (CHART) |
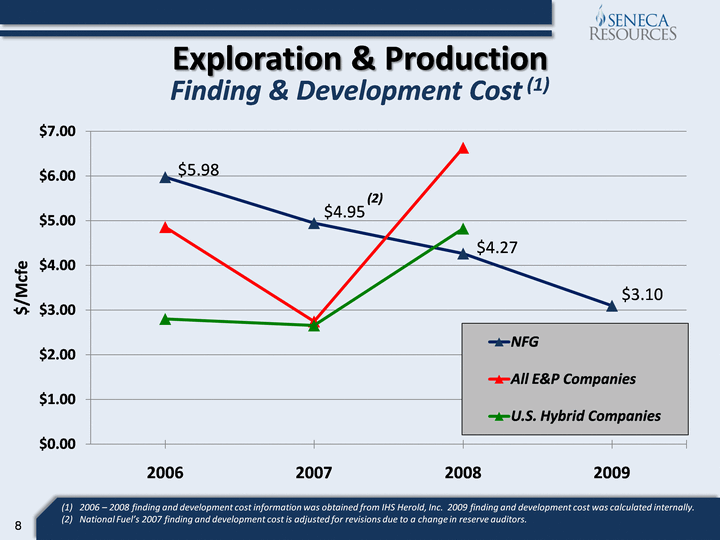
| Exploration & Production (CHART) Finding & Development Cost (1) 2006 - 2008 finding and development cost information was obtained from IHS Herold, Inc. 2009 finding and development cost was calculated internally. National Fuel's 2007 finding and development cost is adjusted for revisions due to a change in reserve auditors. (2) |

| Marcellus Shale Exploration & Production |
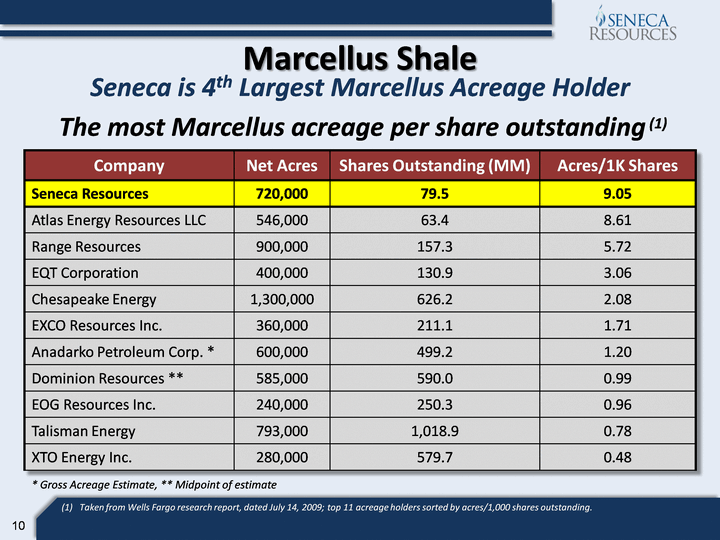
| Marcellus Shale Company Net Acres Shares Outstanding (MM) Acres/1K Shares Seneca Resources 720,000 79.5 9.05 Atlas Energy Resources LLC 546,000 63.4 8.61 Range Resources 900,000 157.3 5.72 EQT Corporation 400,000 130.9 3.06 Chesapeake Energy 1,300,000 626.2 2.08 EXCO Resources Inc. 360,000 211.1 1.71 Anadarko Petroleum Corp. * 600,000 499.2 1.20 Dominion Resources ** 585,000 590.0 0.99 EOG Resources Inc. 240,000 250.3 0.96 Talisman Energy 793,000 1,018.9 0.78 XTO Energy Inc. 280,000 579.7 0.48 Seneca is 4th Largest Marcellus Acreage Holder Taken from Wells Fargo research report, dated July 14, 2009; top 11 acreage holders sorted by acres/1,000 shares outstanding. * Gross Acreage Estimate, ** Midpoint of estimate The most Marcellus acreage per share outstanding (1) |
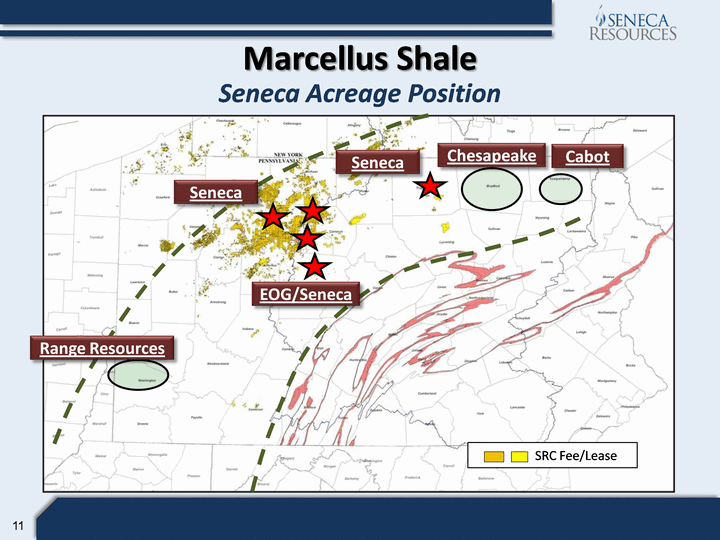
| Marcellus Shale Seneca Acreage Position Cabot SRC Fee/Lease Range Resources Chesapeake EOG/Seneca Seneca Seneca |
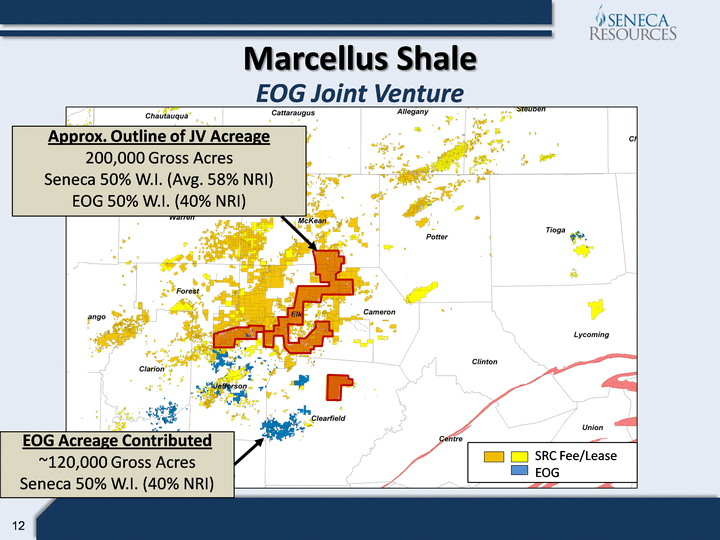
| SRC Fee/Lease EOG Marcellus Shale EOG Joint Venture Approx. Outline of JV Acreage 200,000 Gross Acres Seneca 50% W.I. (Avg. 58% NRI) EOG 50% W.I. (40% NRI) EOG Acreage Contributed ~120,000 Gross Acres Seneca 50% W.I. (40% NRI) |
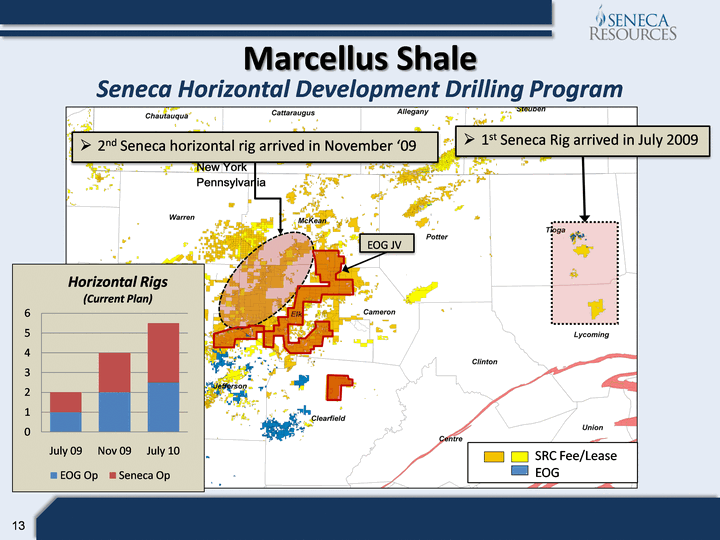
| SRC Fee/Lease EOG Seneca Horizontal Development Drilling Program 1st Seneca Rig arrived in July 2009 2nd Seneca horizontal rig arrived in November '09 EOG JV (CHART) Marcellus Shale |
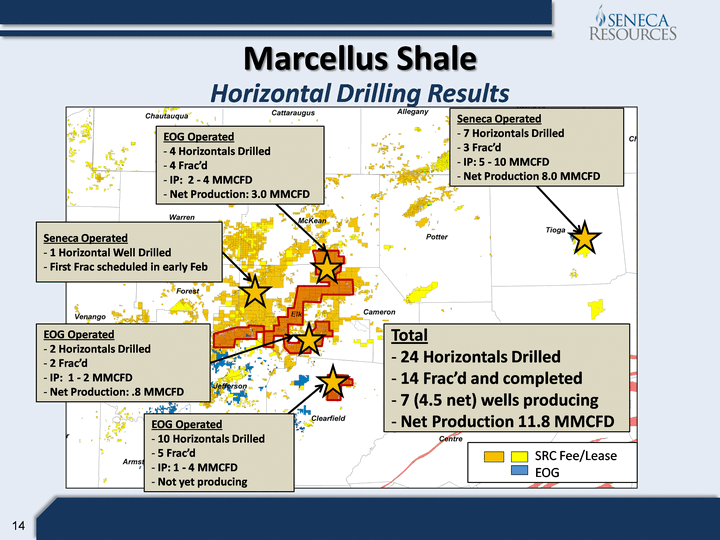
| SRC Fee/Lease EOG Marcellus Shale Horizontal Drilling Results EOG Operated 10 Horizontals Drilled 5 Frac'd IP: 1 - 4 MMCFD Not yet producing Seneca Operated 7 Horizontals Drilled 3 Frac'd IP: 5 - 10 MMCFD Net Production 8.0 MMCFD EOG Operated 4 Horizontals Drilled 4 Frac'd IP: 2 - 4 MMCFD Net Production: 3.0 MMCFD EOG Operated 2 Horizontals Drilled 2 Frac'd IP: 1 - 2 MMCFD Net Production: .8 MMCFD Total 24 Horizontals Drilled 14 Frac'd and completed 7 (4.5 net) wells producing Net Production 11.8 MMCFD Seneca Operated 1 Horizontal Well Drilled First Frac scheduled in early Feb |

| Fiscal 2010 Marcellus Shale Drilling Plan Develop JV focus area (EOG Operated) 25-35 wells September 2010 net production 15-25 Mmcfd Develop Tioga focus area (Seneca Operated) 15-20 wells September 2010 net production 15-25 Mmcfd De-risk and prioritize additional areas: 15-20 wells (includes some verticals) Minimal production in Fiscal Year 2010 2-3 new focus areas by Sept '10 Marcellus Shale |

| Wells Drilled per Year (CHART) Marcellus Shale |

| Marcellus Shale Decline Curve - 3.0 BCF Estimated Ultimate Recovery (EUR) (CHART) Category Type Curve Parameters Initial Rate 3,550 MCF/D Average first year decline 68% Final decline 6% Hyperbolic Coefficient 1.6 Abandonment rate 10 MCF/D Average first month rate 3,090 MCF/D Average first year rate 1,580 MCF/D EUR 3.0 BCF |
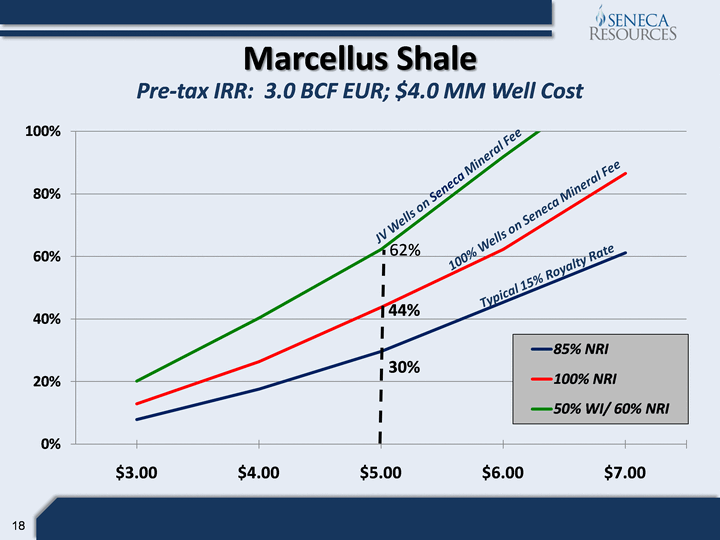
| Marcellus Shale Pre-tax IRR: 3.0 BCF EUR; $4.0 MM Well Cost (CHART) JV Wells on Seneca Mineral Fee 100% Wells on Seneca Mineral Fee Typical 15% Royalty Rate |
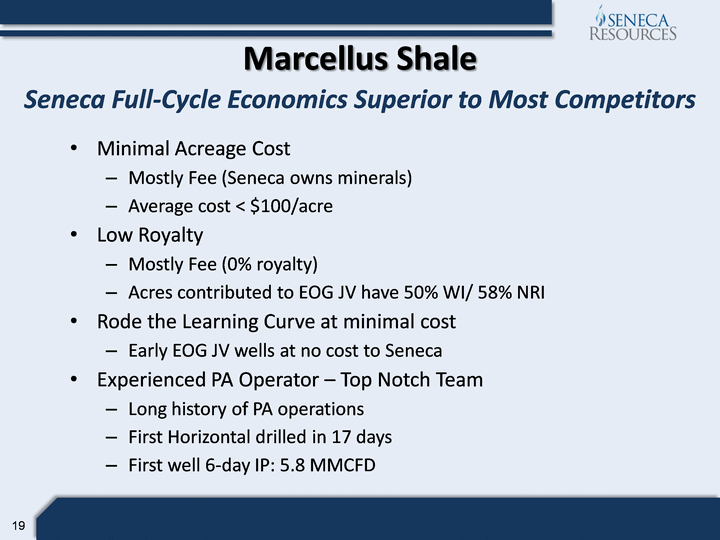
| Seneca Full-Cycle Economics Superior to Most Competitors Minimal Acreage Cost Mostly Fee (Seneca owns minerals) Average cost < $100/acre Low Royalty Mostly Fee (0% royalty) Acres contributed to EOG JV have 50% WI/ 58% NRI Rode the Learning Curve at minimal cost Early EOG JV wells at no cost to Seneca Experienced PA Operator - Top Notch Team Long history of PA operations First Horizontal drilled in 17 days First well 6-day IP: 5.8 MMCFD Marcellus Shale |
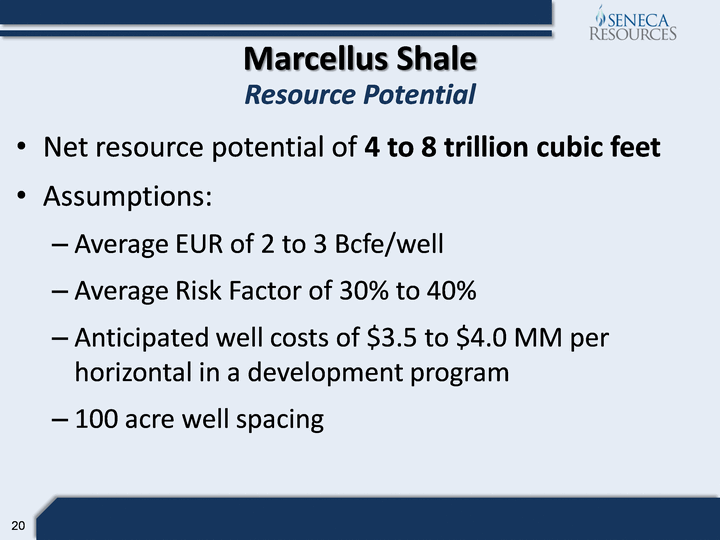
| Marcellus Shale Resource Potential Net resource potential of 4 to 8 trillion cubic feet Assumptions: Average EUR of 2 to 3 Bcfe/well Average Risk Factor of 30% to 40% Anticipated well costs of $3.5 to $4.0 MM per horizontal in a development program 100 acre well spacing |
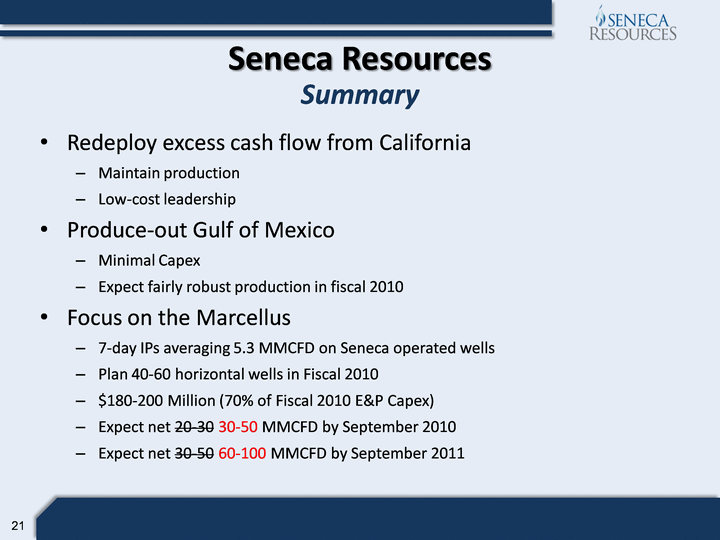
| Seneca Resources Summary Redeploy excess cash flow from California Maintain production Low-cost leadership Produce-out Gulf of Mexico Minimal Capex Expect fairly robust production in fiscal 2010 Focus on the Marcellus 7-day IPs averaging 5.3 MMCFD on Seneca operated wells Plan 40-60 horizontal wells in Fiscal 2010 $180-200 Million (70% of Fiscal 2010 E&P Capex) Expect net 20-30 30-50 MMCFD by September 2010 Expect net 30-50 60-100 MMCFD by September 2011 |

| National Fuel Gas Supply Corporation Empire Pipeline, Inc. Pipeline & Storage |

| WEST TO EAST PHASE 1 & PHASE 2 APPALACHIAN LATERAL LAMONT COMPRESSOR STATION COVINGTON GATHERING SYSTEM TIOGA COUNTY EXTENSION LINE "N" EXPANSION TUSCARORA STORAGE GALBRAITH STORAGE EAST BRANCH STORAGE PIPELINE & STORAGE / MIDSTREAM EXPANSION INITIATIVES 23 WEST TO EAST EXPANSION HORIZONTAL DRILLING ACTIVITY VERTICAL DRILLING ACTIVITY |
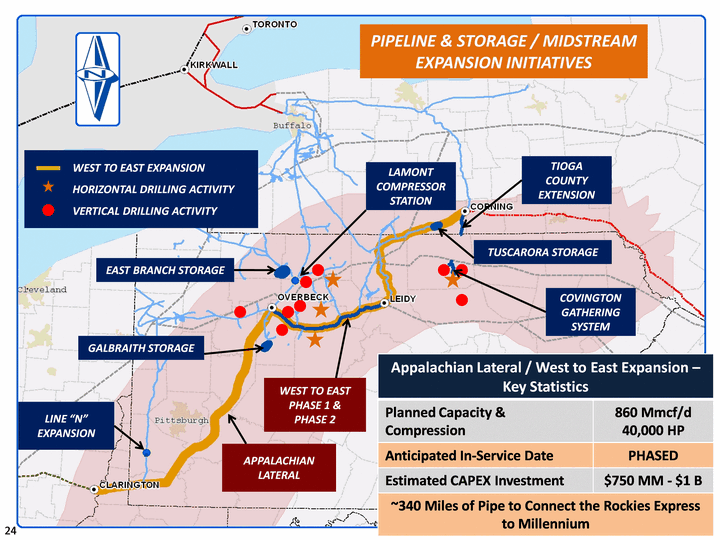
| WEST TO EAST PHASE 1 & PHASE 2 APPALACHIAN LATERAL LAMONT COMPRESSOR STATION COVINGTON GATHERING SYSTEM TIOGA COUNTY EXTENSION LINE "N" EXPANSION TUSCARORA STORAGE GALBRAITH STORAGE EAST BRANCH STORAGE PIPELINE & STORAGE / MIDSTREAM EXPANSION INITIATIVES 24 WEST TO EAST EXPANSION HORIZONTAL DRILLING ACTIVITY VERTICAL DRILLING ACTIVITY Appalachian Lateral / West to East Expansion - Key Statistics Appalachian Lateral / West to East Expansion - Key Statistics Planned Capacity & Compression 860 Mmcf/d40,000 HP Anticipated In-Service Date PHASED Estimated CAPEX Investment $750 MM - $1 B ~340 Miles of Pipe to Connect the Rockies Express to Millennium ~340 Miles of Pipe to Connect the Rockies Express to Millennium |

| WEST TO EAST PHASE 1 & PHASE 2 APPALACHIAN LATERAL LAMONT COMPRESSOR STATION COVINGTON GATHERING SYSTEM TIOGA COUNTY EXTENSION LINE "N" EXPANSION TUSCARORA STORAGE GALBRAITH STORAGE EAST BRANCH STORAGE PIPELINE & STORAGE / MIDSTREAM EXPANSION INITIATIVES 25 WEST TO EAST EXPANSION HORIZONTAL DRILLING ACTIVITY VERTICAL DRILLING ACTIVITY West to East Expansion Phase I - Key Statistics West to East Expansion Phase I - Key Statistics Planned Capacity 200,000 dth/d Anticipated In-Service Date November 2011 Estimated CAPEX Investment $108 MM Open Season Concluded 10/8/2009Negotiating Precedent Agreements Open Season Concluded 10/8/2009Negotiating Precedent Agreements |
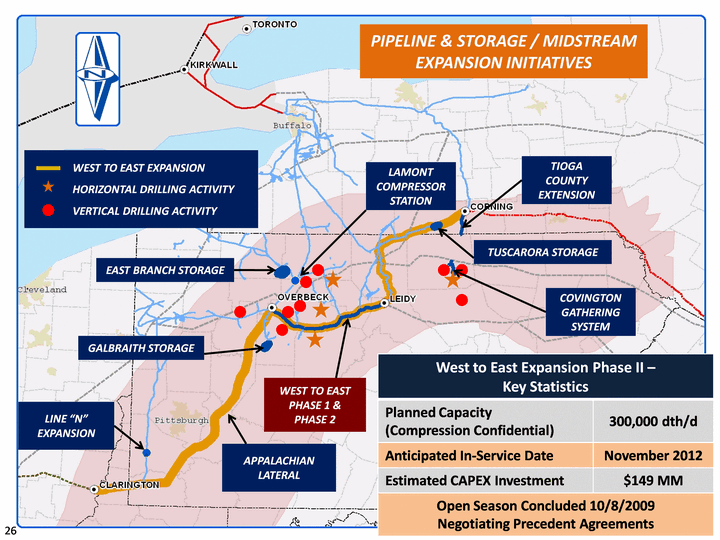
| WEST TO EAST PHASE 1 & PHASE 2 APPALACHIAN LATERAL LAMONT COMPRESSOR STATION COVINGTON GATHERING SYSTEM TIOGA COUNTY EXTENSION LINE "N" EXPANSION TUSCARORA STORAGE GALBRAITH STORAGE EAST BRANCH STORAGE PIPELINE & STORAGE / MIDSTREAM EXPANSION INITIATIVES 26 WEST TO EAST EXPANSION HORIZONTAL DRILLING ACTIVITY VERTICAL DRILLING ACTIVITY West to East Expansion Phase II - Key Statistics West to East Expansion Phase II - Key Statistics Planned Capacity(Compression Confidential) 300,000 dth/d Anticipated In-Service Date November 2012 Estimated CAPEX Investment $149 MM Open Season Concluded 10/8/2009Negotiating Precedent Agreements Open Season Concluded 10/8/2009Negotiating Precedent Agreements |
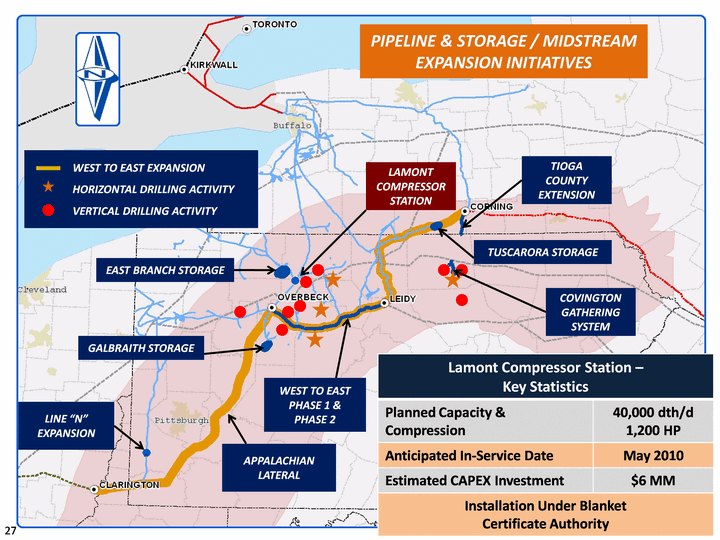
| WEST TO EAST PHASE 1 & PHASE 2 APPALACHIAN LATERAL LAMONT COMPRESSOR STATION COVINGTON GATHERING SYSTEM TIOGA COUNTY EXTENSION LINE "N" EXPANSION TUSCARORA STORAGE GALBRAITH STORAGE EAST BRANCH STORAGE PIPELINE & STORAGE / MIDSTREAM EXPANSION INITIATIVES 27 WEST TO EAST EXPANSION HORIZONTAL DRILLING ACTIVITY VERTICAL DRILLING ACTIVITY Lamont Compressor Station -Key Statistics Lamont Compressor Station -Key Statistics Planned Capacity & Compression 40,000 dth/d1,200 HP Anticipated In-Service Date May 2010 Estimated CAPEX Investment $6 MM Installation Under BlanketCertificate Authority Installation Under BlanketCertificate Authority |
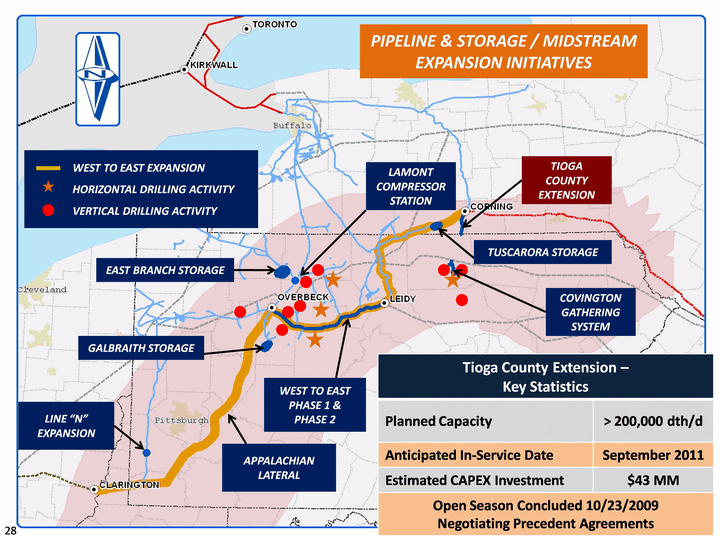
| WEST TO EAST PHASE 1 & PHASE 2 APPALACHIAN LATERAL LAMONT COMPRESSOR STATION COVINGTON GATHERING SYSTEM TIOGA COUNTY EXTENSION LINE "N" EXPANSION TUSCARORA STORAGE GALBRAITH STORAGE EAST BRANCH STORAGE PIPELINE & STORAGE / MIDSTREAM EXPANSION INITIATIVES 28 WEST TO EAST EXPANSION HORIZONTAL DRILLING ACTIVITY VERTICAL DRILLING ACTIVITY Tioga County Extension - Key Statistics Tioga County Extension - Key Statistics Planned Capacity > 200,000 dth/d Anticipated In-Service Date September 2011 Estimated CAPEX Investment $43 MM Open Season Concluded 10/23/2009Negotiating Precedent Agreements Open Season Concluded 10/23/2009Negotiating Precedent Agreements |
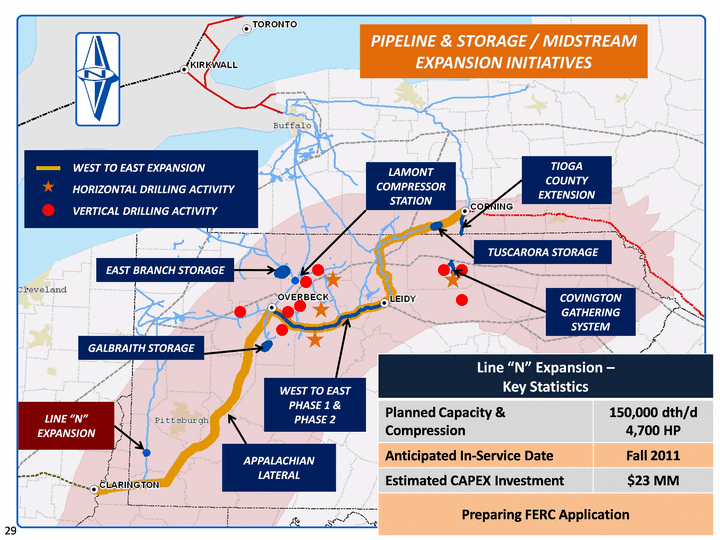
| WEST TO EAST PHASE 1 & PHASE 2 APPALACHIAN LATERAL LAMONT COMPRESSOR STATION COVINGTON GATHERING SYSTEM TIOGA COUNTY EXTENSION LINE "N" EXPANSION TUSCARORA STORAGE GALBRAITH STORAGE EAST BRANCH STORAGE PIPELINE & STORAGE / MIDSTREAM EXPANSION INITIATIVES 29 WEST TO EAST EXPANSION HORIZONTAL DRILLING ACTIVITY VERTICAL DRILLING ACTIVITY Line "N" Expansion - Key Statistics Line "N" Expansion - Key Statistics Planned Capacity &Compression 150,000 dth/d4,700 HP Anticipated In-Service Date Fall 2011 Estimated CAPEX Investment $23 MM Preparing FERC Application Preparing FERC Application |
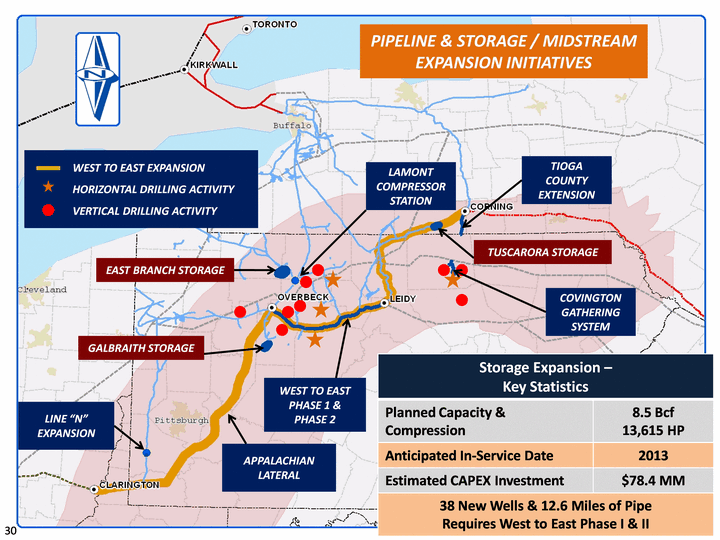
| WEST TO EAST PHASE 1 & PHASE 2 APPALACHIAN LATERAL LAMONT COMPRESSOR STATION COVINGTON GATHERING SYSTEM TIOGA COUNTY EXTENSION LINE "N" EXPANSION TUSCARORA STORAGE GALBRAITH STORAGE EAST BRANCH STORAGE PIPELINE & STORAGE / MIDSTREAM EXPANSION INITIATIVES 30 WEST TO EAST EXPANSION HORIZONTAL DRILLING ACTIVITY VERTICAL DRILLING ACTIVITY Storage Expansion - Key Statistics Storage Expansion - Key Statistics Planned Capacity &Compression 8.5 Bcf13,615 HP Anticipated In-Service Date 2013 Estimated CAPEX Investment $78.4 MM 38 New Wells & 12.6 Miles of PipeRequires West to East Phase I & II 38 New Wells & 12.6 Miles of PipeRequires West to East Phase I & II |

| WEST TO EAST PHASE 1 & PHASE 2 APPALACHIAN LATERAL LAMONT COMPRESSOR STATION COVINGTON GATHERING SYSTEM TIOGA COUNTY EXTENSION LINE "N" EXPANSION TUSCARORA STORAGE GALBRAITH STORAGE EAST BRANCH STORAGE PIPELINE & STORAGE / MIDSTREAM EXPANSION INITIATIVES 31 WEST TO EAST EXPANSION HORIZONTAL DRILLING ACTIVITY VERTICAL DRILLING ACTIVITY Covington Gathering System Phase I - Key Statistics Covington Gathering System Phase I - Key Statistics Planned Capacity 100,000 dth/d Anticipated In-Service Date In-Service Estimated CAPEX Investment ~ $16 MM Project Completed On-Time During November 2009 Project Completed On-Time During November 2009 |

| Questions |
Reconciliation of Exploration & Production Segment Capital Expenditures to
Consolidated Capital Expenditures
($000s)
Consolidated Capital Expenditures
($000s)
| 2010 | ||||||||||||||||
| 2007 | 2008 | 2009 | Forecast | |||||||||||||
Exploration & Production Capital Expenditures (Contiunuing Operations) |
$ | 146,687 | $ | 192,187 | $ | 188,290 | $ | 245,000-293,000 | ||||||||
Exploration & Production Capital Expenditures (Discontinued Operations) |
29,129 | — | — | — | ||||||||||||
Less Exploration & Production Accrued Capital Expenditures |
— | — | (9,093 | ) | ||||||||||||
Pipeline & Storage Capital Expenditures |
43,226 | 165,520 | 50,118 | 51,000 | ||||||||||||
Add (Subtract) Pipeline & Storage Accrued Capital Expenditures |
— | (16,768 | ) | 16,768 | ||||||||||||
Utility Capital Expenditures |
54,185 | 57,457 | 56,178 | 60,000 | ||||||||||||
Energy Marketing Capital Expenditures |
— | 39 | 25 | — | ||||||||||||
Corporate, All Other Capital Expenditures (Continuing Operations) |
3,501 | 1,706 | 8,703 | 47,000 | ||||||||||||
Corporate & All Other Capital Expenditures (Discontinued Operations) |
— | — | — | — | ||||||||||||
Less All Other Accrued Capital Expenditures |
— | (715 | ) | |||||||||||||
Eliminations |
— | (2,407 | ) | (344 | ) | |||||||||||
Total Capital Expenditures Per Statement of Cash Flows |
$ | 276,728 | $ | 397,734 | $ | 309,930 | $ | 403,000-451,000 | ||||||||
| Note: | The capital expenditures amounts by segment include accrued capital expenditures that are subtracted out for statement of cash flow purposes in the year they are accrued. They are added back to the statement of cash flows in the following year when they are paid. |
