Attached files
| file | filename |
|---|---|
| 8-K - CHARLES RIVER LABORATORIES INTERNATIONAL, INC. | v171094_8k.htm |

Caution Concerning Forward-Looking
Statements. This
presentation includes forward-looking statements within the meaning of the
Private Securities Litigation
Reform Act of 1995. Forward-looking statements may be identified by the use of words such as “anticipate,” “believe,” “expect,” “will,” “may,” “estimate,” “plan,”
“outlook,” and “project” and other similar expressions that predict or indicate future events or trends or that are not statements of historical matters. These statements
also include statements regarding our projected 2009 financial performance, including expectations regarding our projected 2009 sales and non-GAAP earnings; the
future demand for drug discovery and development products and services (particularly in light of the challenging economic environment), including the outsourcing of
these services and present spending trends by our customers; the impact of specific actions intended to improve overall operating efficiencies and profitability
(including without limitation our Six Sigma program, our ERP project, our sales force realignment and restructuring of our PCS segment); the expected impact of the
suspension of PCS Massachusetts operations on the Company, its products, service offerings and earnings; our intentions with respect to resuming the operations of
our PCS Massachusetts site; the timing of the opening of new and expanded facilities by us and our competitors; Charles River’s expectations with respect to the
impact of acquisitions on the Company, its service offerings, and earnings; the potential passage and impact of healthcare reform legislation; our future stock
purchase activities; future cost reduction activities by our customers; and Charles River’s future performance as delineated in our forward-looking guidance, and
particularly our expectations with respect to sales growth and foreign exchange impact. In addition, these statements include the availability of funding for our
customers and the impact of economic and market conditions on them generally, and the anticipated strength of our balance sheet, the effects of our 2009 and 2010
cost-saving actions and other actions designed to manage expenses, operating costs and capital spending, and to streamline efficiency, and the ability of the
Company to withstand the current market conditions. Forward-looking statements are based on Charles River’s current expectations and beliefs, and involve a
number of risks and uncertainties that are difficult to predict and that could cause actual results to differ materially from those stated or implied by the forward-looking
statements. Those risks and uncertainties include, but are not limited to: the ability to successfully integrate companies we acquire; the ability to successfully develop
and commercialize SPC’s technology platform; a decrease in research and development spending, a decrease in the level of outsourced services, or other cost
reduction actions by our customers; the ability to convert backlog to sales; special interest groups; contaminations; industry trends; new displacement technologies;
USDA and FDA regulations; changes in law; continued availability of products and supplies; loss of key personnel; interest rate and foreign currency exchange rate
fluctuations; changes in tax regulation and laws; changes in generally accepted accounting principles; and any changes in business, political, or economic conditions
due to the threat of future terrorist activity in the U.S. and other parts of the world, and related U.S. military action overseas. A further description of these risks,
uncertainties, and other matters can be found in the Risk Factors detailed in Charles River's Annual Report on Form 10-K as filed on February 23, 2009, and our
Quarterly Report on Form 10-Q as filed on November 4, 2009, as well as other filings we make with the Securities and Exchange Commission. Because forward-
looking statements involve risks and uncertainties, actual results and events may differ materially from results and events currently expected by Charles River, and
Charles River assumes no obligation and expressly disclaims any duty to update information contained in this presentation except as required by law.
The presentation contains estimates
of certain preliminary 2009 (and indirectly fourth-quarter 2009) financial
information. We are continuing to review our finance and
operating results (including the effects of the decision to suspend the operations of PCS Massachusetts), and actual results may differ materially from those contained
herein. In particular, the preliminary financial information could vary from the above estimates based on the final accounting and/or determination as to whether non-
GAAP characterization is appropriate for certain items.
Regulation G
This presentation includes discussion
of non-GAAP financial measures. We believe that the inclusion of
these non-GAAP financial measures provides useful
information to allow investors to gain a meaningful understanding of our core operating results and future prospects, without the effect of one-time charges, consistent
with the manner in which management measures and forecasts the Company’s performance. The non-GAAP financial measures included in this presentation are not
meant to be considered superior to or a substitute for results of operations prepared in accordance with GAAP. The company intends to continue to assess the
potential value of reporting non-GAAP results consistent with applicable rules and regulations. In accordance with Regulation G, you can find the comparable GAAP
measures and reconciliations to those GAAP measures on our website at ir.criver.com.
Safe Harbor
Statement
2

Charles River
accelerating drug development. exactly.
accelerating drug development. exactly.
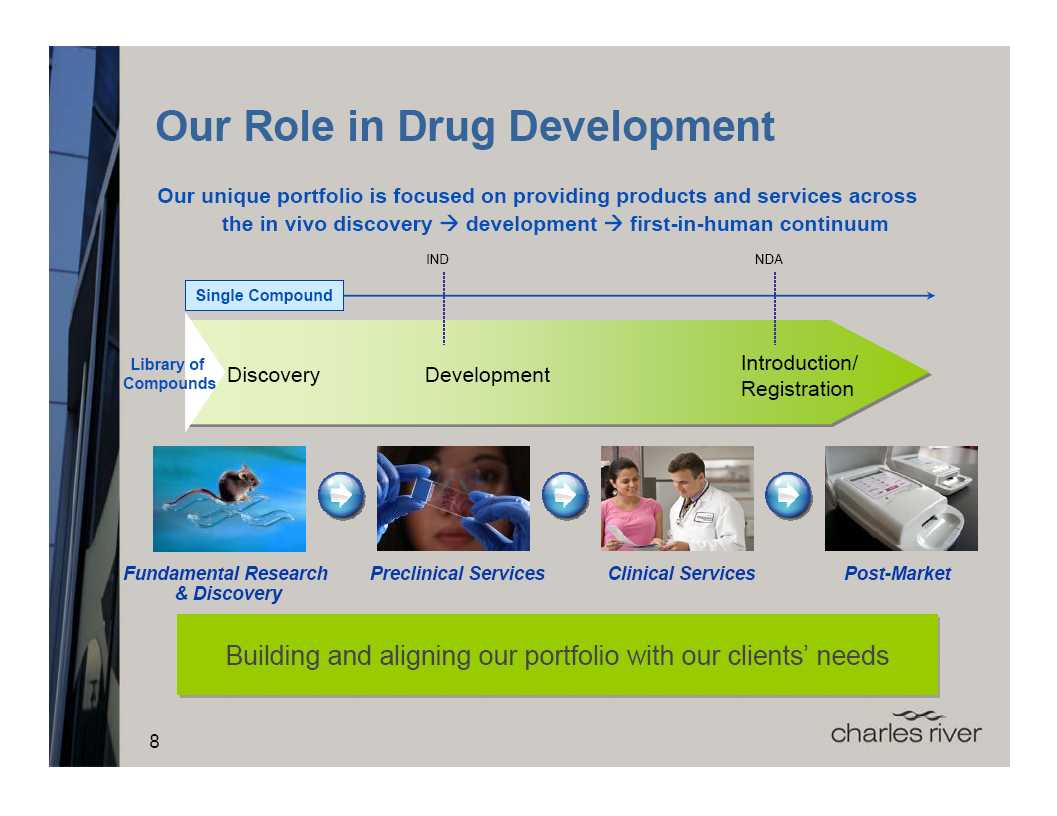
Strategically partnering with our
clients
to provide essential products and services
that expedite drug development
to provide essential products and services
that expedite drug development
3

4
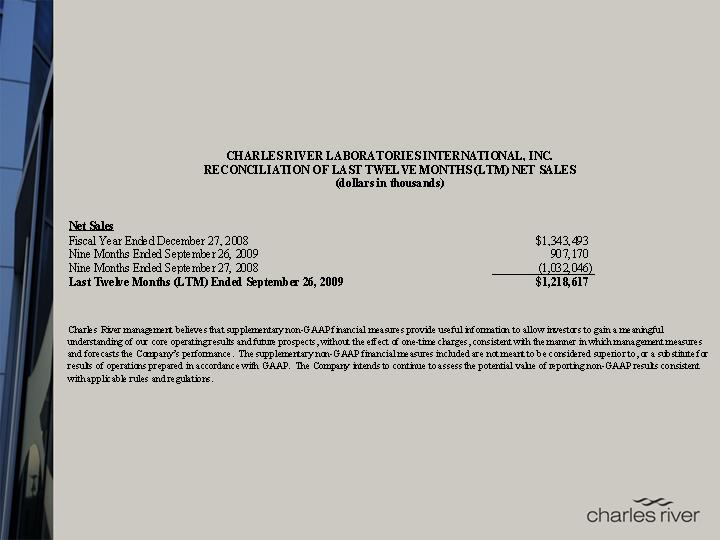
See website for reconciliations of
Non-GAAP to GAAP results.
Charles River
Snapshot
A leading in vivo biology company
$1.22B in net sales (LTM 9/09)
Unique portfolio of products and services focused on
the research and development continuum for new drugs
the research and development continuum for new drugs
A multinational company with ~8,000 employees
worldwide
~70 facilities in 17 countries
Continuous expansion to support
client needs
Source: Based on Charles River’s FY
2008 net sales.
Non-Commercial
16%
Commercial
84%
ROW
32%
North America
68%
Geographic
Sales
Sales
Client Base
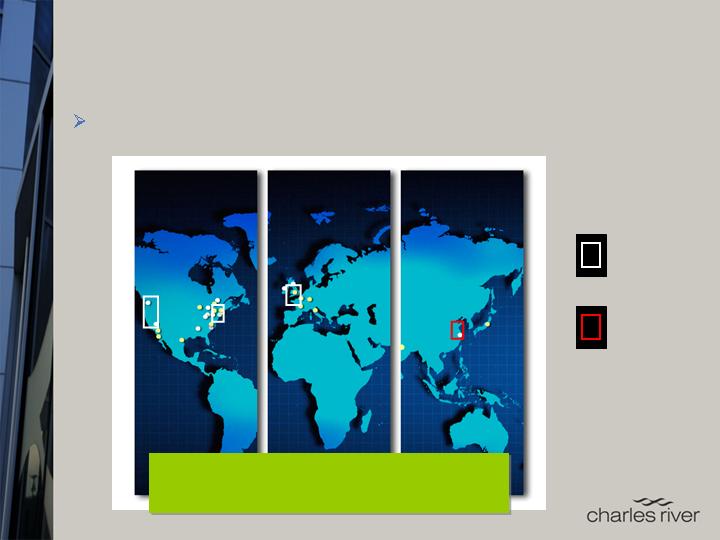
Providing drug discovery and
development expertise in
North America, Europe, Japan, China
North America, Europe, Japan, China
Global Solutions
Emerging
Market
Market
Existing Pharma /
Biotech Cluster
Biotech Cluster
We are where our
clients are
5

Partnering with Charles River
reduces clients’ R&D costs and
improves efficiency and speed
improves efficiency and speed
Supports increasing virtualization of Big Pharma
Lower staff and operating costs
Using our facilities and staff instead of their own
Reduces the need for them to invest
in infrastructure
Flexible workload / workforce
management
Benefit from higher utilization and efficiency at Charles River
Facilities are purpose-built for high throughput
Charles River offers specialty services that are often cost
prohibitive for clients to maintain in-house
prohibitive for clients to maintain in-house
Partnering with
Charles River may deliver up to
20%-30% cost savings to clients and save 3-6 months
20%-30% cost savings to clients and save 3-6 months
CRL Value
Proposition
6

7
Attractive Market
Opportunities
*Represents Charles River’s
addressable market through Phase I clinical services.
Addressable market now includes in vivo discovery services and biopharmaceutical services.
Addressable market now includes in vivo discovery services and biopharmaceutical services.
RMS
Harlan-RMS
Taconic
Jackson
PCS
LSR MPI
SNBL WIL
Harlan-CRS
Charles River is the outsourcing
market leader
from discovery through first-in-human testing
from discovery through first-in-human testing
Other
CVD
CRL
Source: Wall Street research and
company estimates.
Market Size*:
~$7.0-7.5B (2009E)
~$7.0-7.5B (2009E)
Long-term
market growth:
Estimated in the
high-single digits
market growth:
Estimated in the
high-single digits
Leveraging our
leadership and
core competencies in in vivo biology
core competencies in in vivo biology

RMS Franchise
The market-leading provider of
research models and services
to support their use in research
to support their use in research
Models are essential to the drug
discovery and development
process
process
Stable demand for products and
services
Exceptional operating margin and free cash flow generation
Even in this challenging market
environment
Establishes our relationship with
clients early in the drug
development cycle
development cycle
Global infrastructure with
proximity to client operations
The in vivo biology
experts
9

Discovery & Imaging Services
(DIS)
We are now one of the largest
providers of non-GLP efficacy
testing
testing
Acquired MIR (Sept. ‘08) to add extensive
in vivo imaging
capabilities and enhance therapeutic area expertise in
oncology and inflammation pharmacology
capabilities and enhance therapeutic area expertise in
oncology and inflammation pharmacology
Acquisition of Piedmont Research
Center (May ‘09)
added
significant expertise in oncology
significant expertise in oncology
Added CNS through Cerebricon acquisition
(Aug. ’09)
(Aug. ’09)
DIS expertise currently includes
five
of the largest TAs
of the largest TAs
Oncology, CNS,
cardiovascular,
metabolism and inflammation
metabolism and inflammation
12

Investment in alternatives to
in vivo testing
The only FDA-approved in vitro non-clinical test
Used for lot release testing of
medical devices and injectable drugs
PTS (Portable Testing System) is a
significant advance over
existing technology
existing technology
Portable, hand-held device
with
rapid, accurate results
rapid, accurate results
Competitive differentiation
Promotes real-time testing of
in-process samples
in-process samples
Fastest-growing product
line
Endotoxin and Microbial Detection
(EMD):
Endosafe®-PTS™
Endosafe®-PTS™
13

Partnering with
clients
to enhance their scientific breadth and depth
to enhance their scientific breadth and depth
Preclinical
Services
Providing clients with expertise for
integrated drug development
integrated drug development
Regulatory and process consulting
Efficacy studies
Safety studies including general
and specialty toxicology
and specialty toxicology
Inhalation, infusion, developmental
and reproductive, juvenile / neonatal,
ocular, bone, immunotoxicology and
phototoxicology
and reproductive, juvenile / neonatal,
ocular, bone, immunotoxicology and
phototoxicology
Expert pathology services
Biopharmaceutical services
Phase I clinical trials
14

BioPharmaceutical Services
(BPS)
A market-leading provider of
services to support the
development and manufacture of biologics
development and manufacture of biologics
Global footprint of four sites in North America and
Europe
Europe
Expect to continue to develop this
business to support
the increasing proportion of biologics in the drug
development pipeline
the increasing proportion of biologics in the drug
development pipeline
Believe biologics are the future of
medicine
15

Strategic
Initiatives
Using this period of softer market
demand to streamline
internal operations and align our business portfolio to client
needs
internal operations and align our business portfolio to client
needs
Four distinct pathways:
Acquisition of strategic assets and other
alliances
Restructuring and
realignment of
our PCS business
operations and sales organization
operations and sales organization
Six Sigma and other efficiency initiatives
Strengthening our relationships with existing and potential
clients through discussions with senior-level decision makers
clients through discussions with senior-level decision makers
16

Portfolio
Expansion
Charles River has historically
driven growth through a
combination of internal development and strategic bolt-on
acquisitions
combination of internal development and strategic bolt-on
acquisitions
~30 acquisitions since ’89
Expanding our breadth of services as
clients continue to identify
capabilities as non-core
capabilities as non-core
Identifying strategic acquisitions and
alliances which
augment existing capabilities or add new ones
augment existing capabilities or add new ones
Goal to expand and fill out our
unique early development
portfolio and maintain market leadership position
portfolio and maintain market leadership position
Identifying novel technologies and innovative working
relationships
relationships
17

Portfolio Expansion
- Technology
Acquired Systems Pathology
Company,
developer of
Computer Assisted Pathology System (CAPS™)
Computer Assisted Pathology System (CAPS™)
A unique use of analytical smart-imaging
software
technology to increase efficiency of pathologists
technology to increase efficiency of pathologists
CAPS™ fully automates labor-intensive processes
Frees pathologists to focus more
time on high-value
interpretation
interpretation
Allows for the same number of
pathologists to evaluate a greater
number of tissues, speeding the reporting process
number of tissues, speeding the reporting process
A limited number of large global
pharmas are participating in
the development phase, providing important scientific input to
the validation process
the development phase, providing important scientific input to
the validation process
Can be licensed to
clients for
internal use
18

Business Changes: PCS
Reorganization
Implemented in 2Q09
Enhances our ability to provide
clients with a centralized ,
integrated global approach to their drug development
programs
integrated global approach to their drug development
programs
Enables us to manage global
operations centrally
Dual
accountability
structure provides both global functional
management and site-level management
management and site-level management
Migrated from site-level-only
accountability
Allows for standardization of all services across the PCS
organization
organization
Consistent delivery of services worldwide
Particularly important to our
clients who already use multiple
Charles River sites
Charles River sites
Client feedback continues to be
positive
19

Key structural element in our
ability to enhance client service
and gain market share
and gain market share
Migrating to a sales approach
focused on solutions tailored
for individual and global clients
for individual and global clients
More comprehensive coverage of all
market segments
Diverse client
population
requires different sales strategies
Global account
managers already
in place for major pharma and
biotech clients
biotech clients
Expanded coverage of academic accounts
Supporting market share gains and
expected benefit from
increased NIH funding in ‘10
increased NIH funding in ‘10
Business Changes: Sales
Realignment
20

Process Efficiency
Initiatives
Driving efficiency and profitability through Six Sigma and ERP
Strengthening Six Sigma organization
Continuing to ramp up, with 100
projects underway
and more in the pipeline
and more in the pipeline
Achieved modest efficiency gains in
’09,
and expect more significant gains in ’10
and expect more significant gains in ’10
Successfully rolled out ERP to all
U.S. sites in late December
Total expense of $14-$15M in ’10, including
$2-$3M of implementation and conversion costs
$2-$3M of implementation and conversion costs
Operational benefits expected in
’10, with
substantial cost savings to begin in ‘11
substantial cost savings to begin in ‘11
Goal is to drive efficiencies which
enable us to offer clients
enhanced services at a lower cost
enhanced services at a lower cost
Expect to be able to improve our margins in the absence of
significant upward pricing
significant upward pricing
22

PCS Massachusetts
Announced decision to suspend operations of PCS
Massachusetts to improve global PCS capacity utilization
Massachusetts to improve global PCS capacity utilization
Decision based on surplus industry
capacity
Slowdown in demand from East Coast
biotechs
Cost structure of PCS-MA exacerbated
by current pricing
Leaner PCS infrastructure will
improve operating
margin while
maintaining ability to meet anticipated upturn in demand
maintaining ability to meet anticipated upturn in demand
Will complete ongoing in-life
studies by mid-year ’10
Expected to generate cost savings of
~$20M in 2010, with an
annual run rate ~$25M
annual run rate ~$25M
Anticipate retaining majority of
business, but
some loss
of revenue in ‘10
of revenue in ‘10
Intend to resume
operations as
PCS capacity fills and PCS-MA
is required
is required
23

Drivers of Market
Rebound
Major mergers are
closed, which
should galvanize the
pharmaceutical industry
pharmaceutical industry
Pfizer-Wyeth on 10/15/09 and
Merck-Schering on 11/04/09
Expected to quickly implement
integration plans
With clarity on mergers,
pharmaceutical industry expected to
refocus on driving therapies through the development pipeline
refocus on driving therapies through the development pipeline
Mergers closing coincides with
beginning of 2010 budget
year
year
New funding available for our
clients
However, budgets not expected to be
finalized until 1Q10,
delaying spending until 2Q09
delaying spending until 2Q09
Biotech funding improving
$30B in ’08 grows to an estimated
$47B in ’09 (Source: Burrill)
Resolution of healthcare reform will eliminate uncertainty for
the pharmaceutical industry
the pharmaceutical industry
24

Drivers of Market
Rebound
Our continuing discussions with
senior heads of
R&D of our
large pharma and biotech clients reinforces the desire for
enhanced strategic outsourcing
large pharma and biotech clients reinforces the desire for
enhanced strategic outsourcing
Continuing to identify additional
areas of expertise as non-core
Want broader and more innovative strategic
relationships
with
CROs like CRL who can provide support for a larger portion of the
drug development process
CROs like CRL who can provide support for a larger portion of the
drug development process
Exploring a myriad of partnership
arrangements – no
“one-size-
fits-all” answer
fits-all” answer
Dedicated resources
Long-term “Take-or-Pay” arrangements
Long-term contracts across all
product and service lines
Aspire to increasingly be
“on the same side of the
table” with
our clients, helping to enhance their decision-making process
our clients, helping to enhance their decision-making process
25

2009 Guidance/2010
Outlook
Reaffirming 2009 sales and expect
non-GAAP EPS to be
above the range*
above the range*
Limited preclinical
visibility
persists, but continue to believe
that demand will begin to improve in 2Q10
that demand will begin to improve in 2Q10
4Q09 PCS business trends consistent
with our expectations
Strategic discussions with clients
Stable inquiry levels and steady win
rates
Positive early indications for 1Q10
Do not expect major changes to PCS
pricing in ’10 from ’09
levels
levels
Pricing stabilized below ’08 levels
PCS-MA savings more than offset by
increased ERP costs,
merit increases and incentive compensation
merit increases and incentive compensation
*Guidance previously provided on
November 3, 2009.
26

2009 Guidance/2010 Outlook
(cont.)
New RMS catalog and pricing
effective 1/1/10
Anticipate RMS will benefit from
increased NIH funding
Expect to provide a more detailed
outlook with ’10 guidance
on February 8th
on February 8th
27

Operating efficiency and improved
capacity utilization to drive
longer-term margin improvement
longer-term margin improvement
Productivity and efficiency gains
through IT investment
and Six Sigma
and Six Sigma
Operating margin target >20%
Strong balance
sheet /
conservative capital structure
$215M of cash and marketable
securities on hand at 09/26/09
Low total debt to EBITDA ratio
Significant improvement in
free cash flow beginning in 2009
Long-term organic sales growth
potential in the low-double
digits
digits
CRL Investment
Thesis
28

© 2010 Charles River Laboratories
International, Inc.
Accelerating Drug
Development. Exactly.

Appendix
30
31