Attached files
| file | filename |
|---|---|
| 8-K - FORM 8-K - GULFMARK OFFSHORE INC | h69242e8vk.htm |
Exhibit 99.1

| GulfMark Offshore, Inc: 20 Years of Making Waves Pritchard Capital Partners L.L.C. 7th Annual Energize Conference January 2010 |

| Cautionary Statement Regarding Forward-Looking Statements This presentation includes forward-looking statements and projections, made in reliance on the safe harbor provisions of the Private Securities Litigation Reform Act of 1995. The Company has made every reasonable effort to ensure that the information and assumptions on which these statements and projections are based are current, reasonable, and complete. However, a variety of factors could cause actual results to differ materially from the projections, anticipated results or other expectations expressed in this presentation. While the Company makes these statements and projections in good faith, neither the company nor its management can guarantee that the anticipated future results will be achieved. Reference should be made to the Company's Securities and Exchange Commission filings for additional important factors that may affect actual results. NYSE: GLF www.GulfMark.com Forward-Looking Statements |
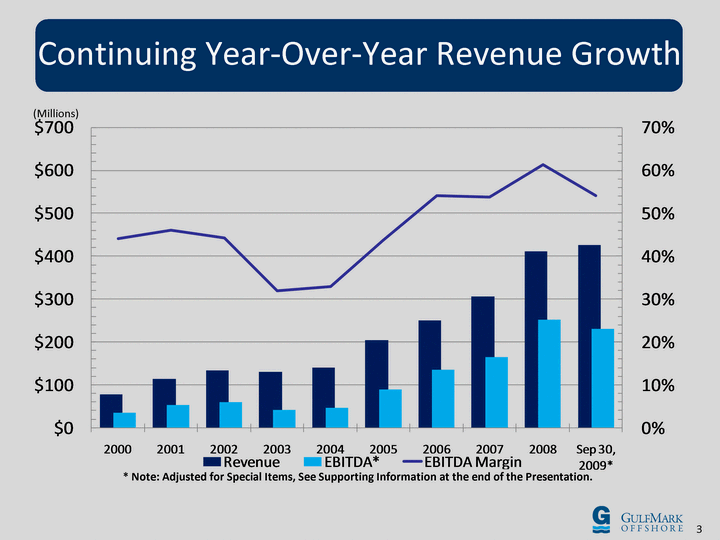
| Continuing Year-Over-Year Revenue Growth (Millions) * Note: Adjusted for Special Items, See Supporting Information at the end of the Presentation. |

| 4 Geographic Diversification Revenue Breakout by Region - Trailing Twelve Months as of September 30, 2009 North Sea Southeast Asia Americas Rest of Americas Gulf of Mexico |

| North Sea Regional Total of 25 Owned Vessels 21 PSVs, 3 AHTS Vessels and 1 SpVs Expanding "Managed" Fleet Largest Operator of PSVs in the North Sea Operations Include Activities in India, Mediterranean & Africa Spearheading HSE & Training Initiatives High Level of Long Term Contract Cover |
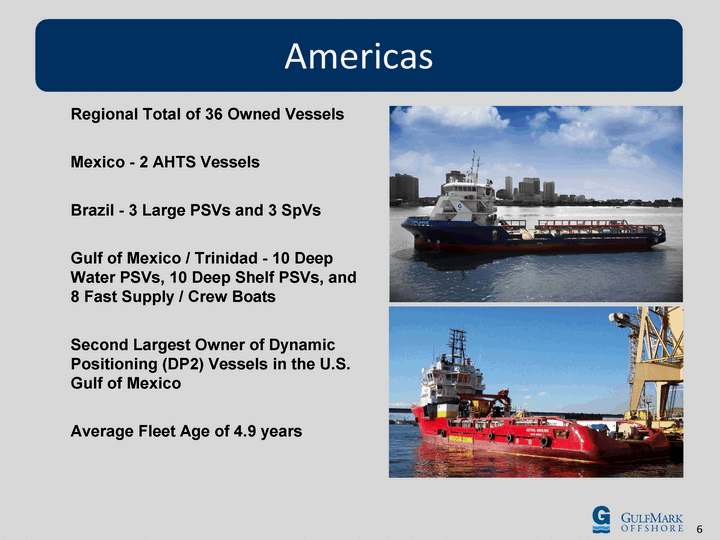
| Americas Regional Total of 36 Owned Vessels Mexico - 2 AHTS Vessels Brazil - 3 Large PSVs and 3 SpVs Gulf of Mexico / Trinidad - 10 Deep Water PSVs, 10 Deep Shelf PSVs, and 8 Fast Supply / Crew Boats Second Largest Owner of Dynamic Positioning (DP2) Vessels in the U.S. Gulf of Mexico Average Fleet Age of 4.9 years |
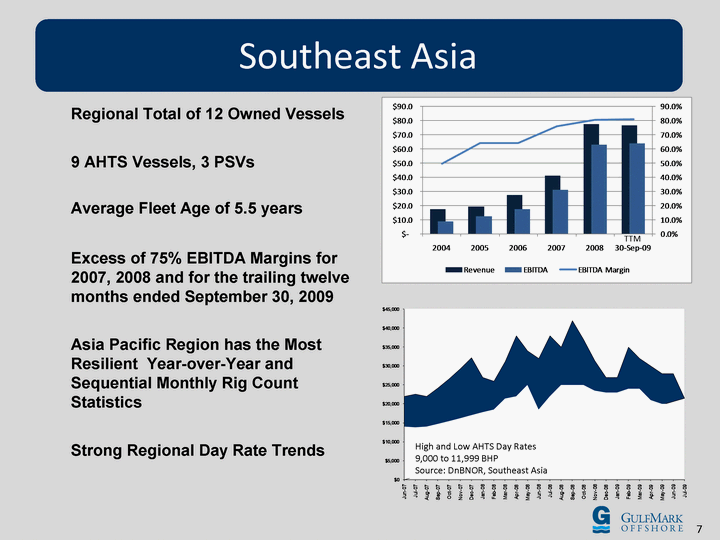
| Southeast Asia High and Low AHTS Day Rates 9,000 to 11,999 BHP Source: DnBNOR, Southeast Asia TTM Regional Total of 12 Owned Vessels 9 AHTS Vessels, 3 PSVs Average Fleet Age of 5.5 years Excess of 75% EBITDA Margins for 2007, 2008 and for the trailing twelve months ended September 30, 2009 Asia Pacific Region has the Most Resilient Year-over-Year and Sequential Monthly Rig Count Statistics Strong Regional Day Rate Trends |
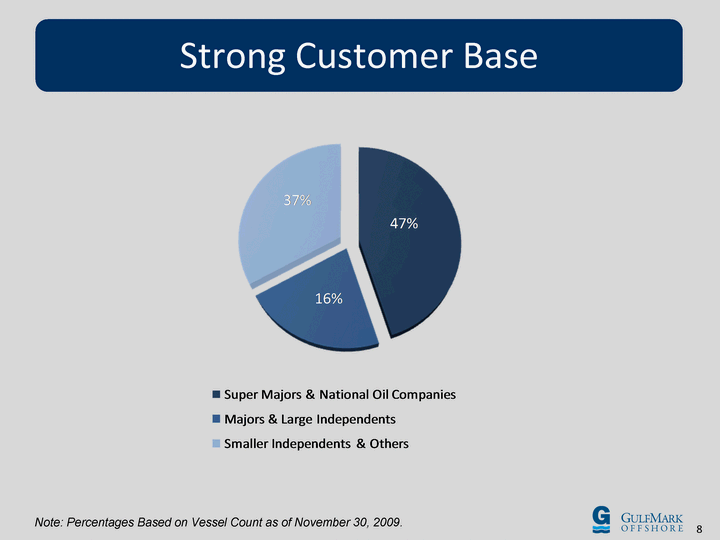
| Strong Customer Base Note: Percentages Based on Vessel Count as of November 30, 2009. |

| The GulfMark Fleet |
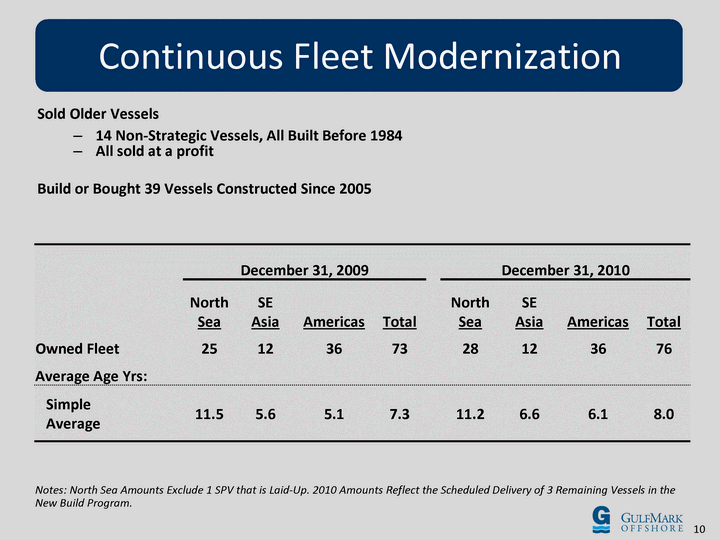
| Notes: North Sea Amounts Exclude 1 SPV that is Laid-Up. 2010 Amounts Reflect the Scheduled Delivery of 3 Remaining Vessels in the New Build Program. December 31, 2009 December 31, 2009 December 31, 2009 December 31, 2009 December 31, 2010 December 31, 2010 December 31, 2010 December 31, 2010 North Sea SE Asia Americas Total North Sea SE Asia Americas Total Owned Fleet 25 12 36 73 28 12 36 76 Average Age Yrs: Simple Average 11.5 5.6 5.1 7.3 11.2 6.6 6.1 8.0 Continuous Fleet Modernization Sold Older Vessels 14 Non-Strategic Vessels, All Built Before 1984 All sold at a profit Build or Bought 39 Vessels Constructed Since 2005 |
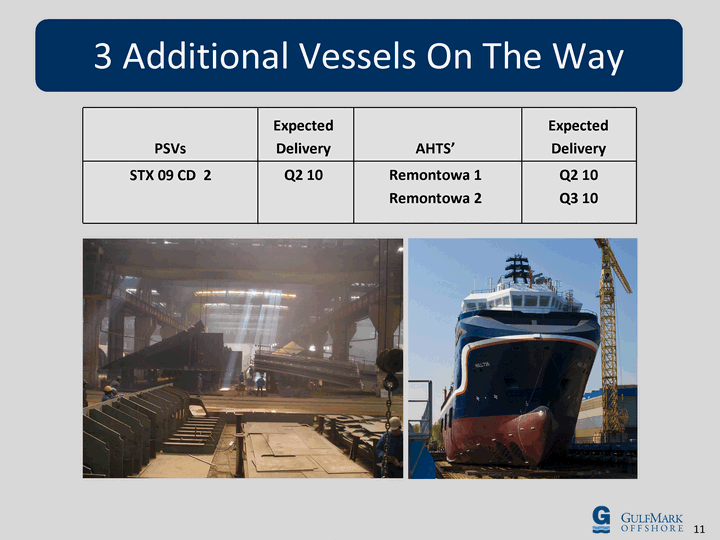
| PSVs Expected Delivery AHTS' Expected Delivery STX 09 CD 2 Q2 10 Remontowa 1 Remontowa 2 Q2 10 Q3 10 3 Additional Vessels On The Way |
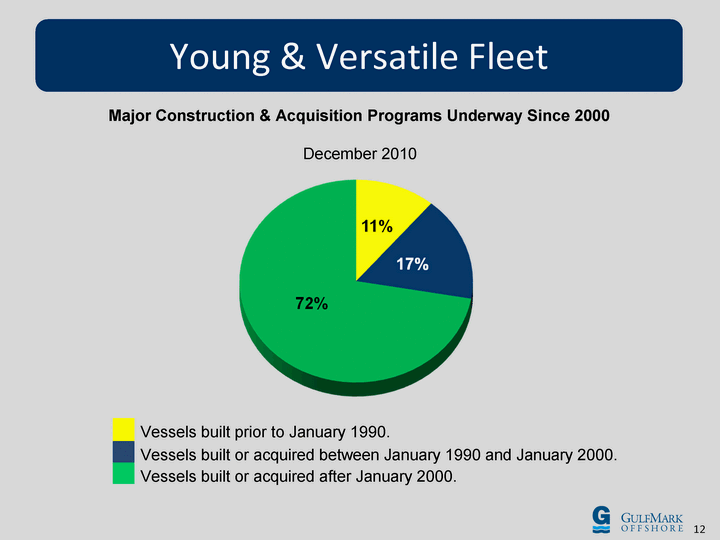
| December 2010 Vessels built prior to January 1990. Vessels built or acquired between January 1990 and January 2000. Vessels built or acquired after January 2000. Young & Versatile Fleet Major Construction & Acquisition Programs Underway Since 2000 |

| Financial Information |
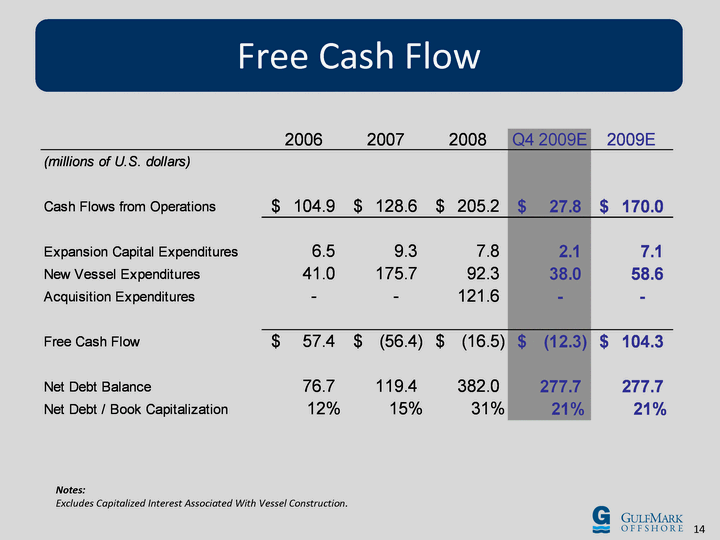
| Notes: Excludes Capitalized Interest Associated With Vessel Construction. Free Cash Flow |
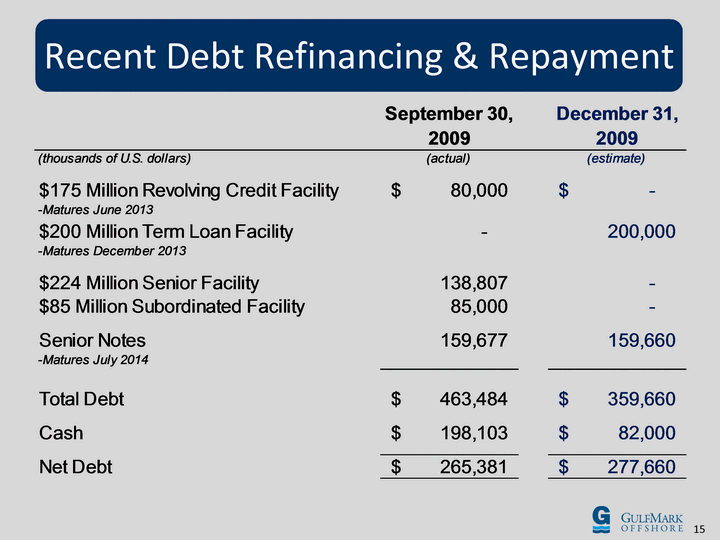
| Recent Debt Refinancing & Repayment |

| Vessel Cash Operating Margin (1) Excludes Depreciation, Amortization, SG&A and dry dock costs. (2) Represents percentage of available days that existing vessels are under charter contract or option. (3) Excludes estimated dry dock days. (4) Represents available days subsequent to expected delivery date of new build vessels. Q4 2009E New Build Vessel Est. Days (4) 70 Cash Operating Margin ($mm) (1) $46.1 Contract Cover (2) 63.8% Non-contracted Available Days (3) 2,332 Existing Vessels |

| Industry Leaders in HSE Performance & People Development Strong Demand for Modern Offshore Marine Equipment Global Presence and Operations Expertise Financial Stability & Flexibility to Pursue Opportunities Growth though Acquisition and New Construction Young, Versatile, High-Specification Fleet Investment Highlights |

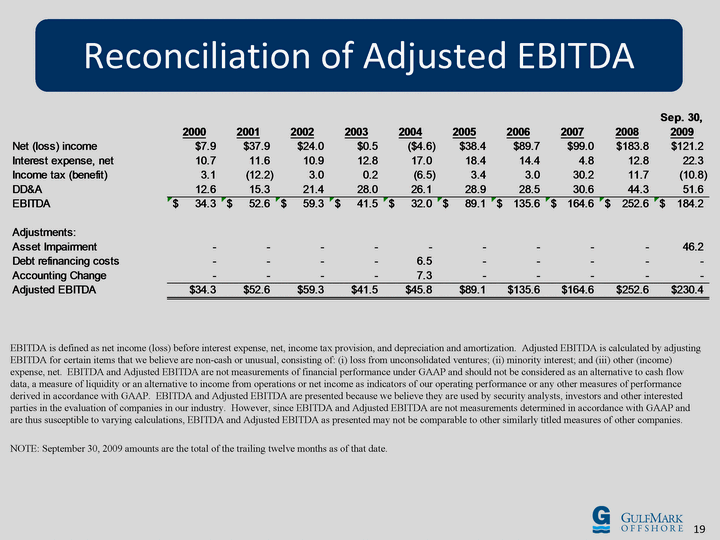
| EBITDA is defined as net income (loss) before interest expense, net, income tax provision, and depreciation and amortization. Adjusted EBITDA is calculated by adjusting EBITDA for certain items that we believe are non-cash or unusual, consisting of: (i) loss from unconsolidated ventures; (ii) minority interest; and (iii) other (income) expense, net. EBITDA and Adjusted EBITDA are not measurements of financial performance under GAAP and should not be considered as an alternative to cash flow data, a measure of liquidity or an alternative to income from operations or net income as indicators of our operating performance or any other measures of performance derived in accordance with GAAP. EBITDA and Adjusted EBITDA are presented because we believe they are used by security analysts, investors and other interested parties in the evaluation of companies in our industry. However, since EBITDA and Adjusted EBITDA are not measurements determined in accordance with GAAP and are thus susceptible to varying calculations, EBITDA and Adjusted EBITDA as presented may not be comparable to other similarly titled measures of other companies. NOTE: September 30, 2009 amounts are the total of the trailing twelve months as of that date. Reconciliation of Adjusted EBITDA |
