Attached files
| file | filename |
|---|---|
| 8-K - CURRENT REPORT OF MATERIAL EVENTS OR CORPORATE CHANGES - SUPERMEDIA INC. | a10-1174_18k.htm |
|
|
Investor Presentation January 6, 2010 CEO Scott W. Klein CFO Dee Jones Exhibit 99.1 |
|
|
Agenda Industry and Business Overview We Are SuperMedia Financial Summary |
|
|
Industry and Business Overview |
|
|
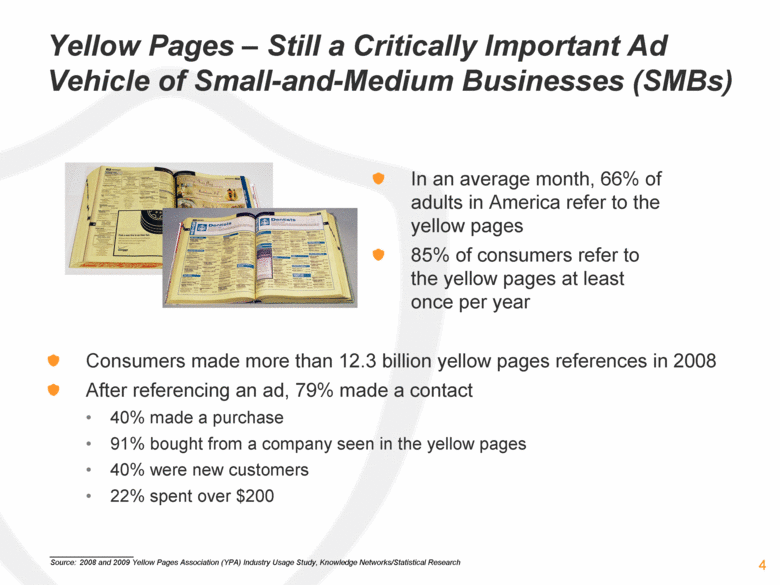
Yellow Pages – Still a Critically Important Ad Vehicle of Small-and-Medium Businesses (SMBs) In an average month, 66% of adults in America refer to the yellow pages 85% of consumers refer to the yellow pages at least once per year Source: 2008 and 2009 Yellow Pages Association (YPA) Industry Usage Study, Knowledge Networks/Statistical Research Consumers made more than 12.3 billion yellow pages references in 2008 After referencing an ad, 79% made a contact 40% made a purchase 91% bought from a company seen in the yellow pages 40% were new customers 22% spent over $200 |
|
|
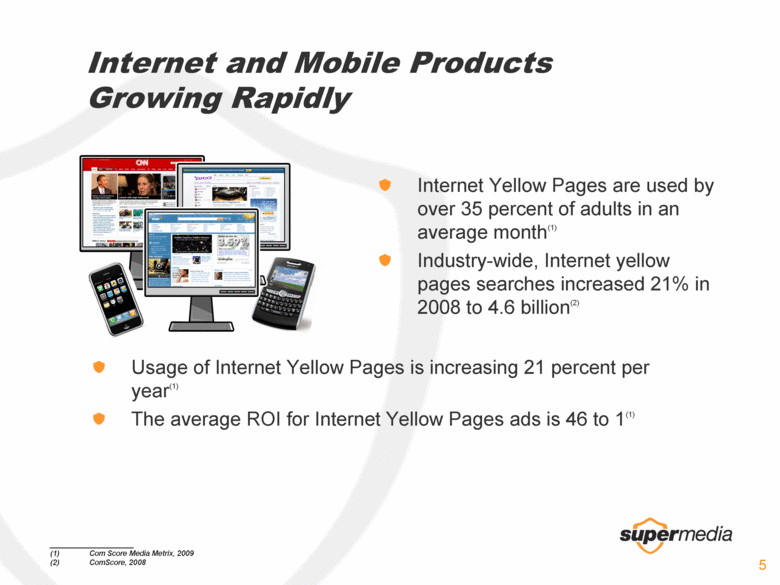
Internet and Mobile Products Growing Rapidly Internet Yellow Pages are used by over 35 percent of adults in an average month(1) Industry-wide, Internet yellow pages searches increased 21% in 2008 to 4.6 billion(2) Com Score Media Metrix, 2009 ComScore, 2008 Usage of Internet Yellow Pages is increasing 21 percent per year(1) The average ROI for Internet Yellow Pages ads is 46 to 1(1) |
|
|
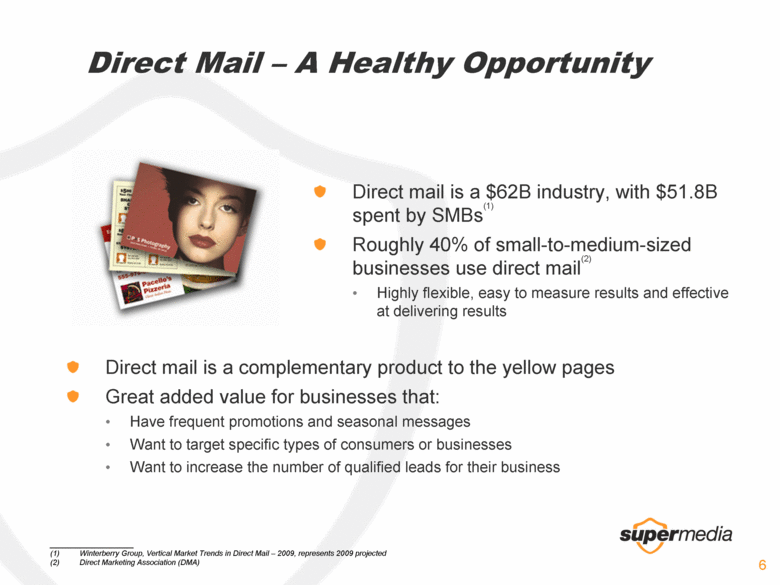
Direct Mail – A Healthy Opportunity Direct mail is a $62B industry, with $51.8B spent by SMBs(1) Roughly 40% of small-to-medium-sized businesses use direct mail(2) Highly flexible, easy to measure results and effective at delivering results Winterberry Group, Vertical Market Trends in Direct Mail – 2009, represents 2009 projected Direct Marketing Association (DMA) Direct mail is a complementary product to the yellow pages Great added value for businesses that: Have frequent promotions and seasonal messages Want to target specific types of consumers or businesses Want to increase the number of qualified leads for their business |
|
|
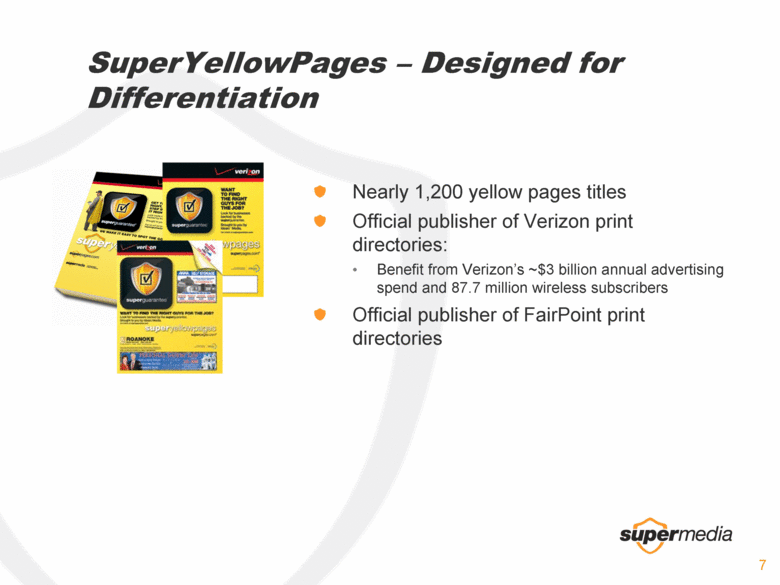
SuperYellowPages – Designed for Differentiation Nearly 1,200 yellow pages titles Official publisher of Verizon print directories: Benefit from Verizon’s ~$3 billion annual advertising spend and 87.7 million wireless subscribers Official publisher of FairPoint print directories |
|
|
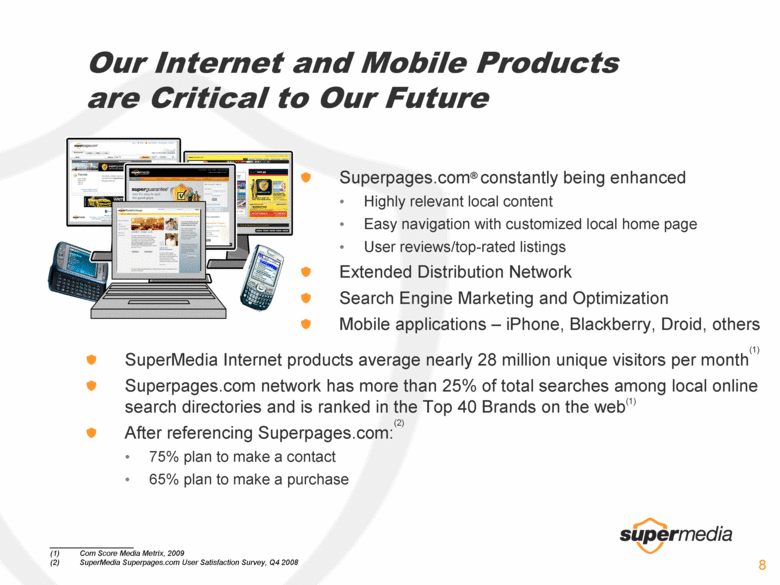
Our Internet and Mobile Products are Critical to Our Future Superpages.com® constantly being enhanced Highly relevant local content Easy navigation with customized local home page User reviews/top-rated listings Extended Distribution Network Search Engine Marketing and Optimization Mobile applications – iPhone, Blackberry, Droid, others Com Score Media Metrix, 2009 SuperMedia Superpages.com User Satisfaction Survey, Q4 2008 SuperMedia Internet products average nearly 28 million unique visitors per month(1) Superpages.com network has more than 25% of total searches among local online search directories and is ranked in the Top 40 Brands on the web(1) After referencing Superpages.com:(2) 75% plan to make a contact 65% plan to make a purchase |
|
|
Direct Mail – A Complementary and High Potential Growth Engine SuperpagesDirectTM shared advertising postcard packs and exclusive mailers Highly targeted to those most likely to buy Complete, turn-key services for small business Direct mail is a complementary product to the yellow pages SuperpagesDirect revenue is approximately 3.5x the prior year’s total |
|
|
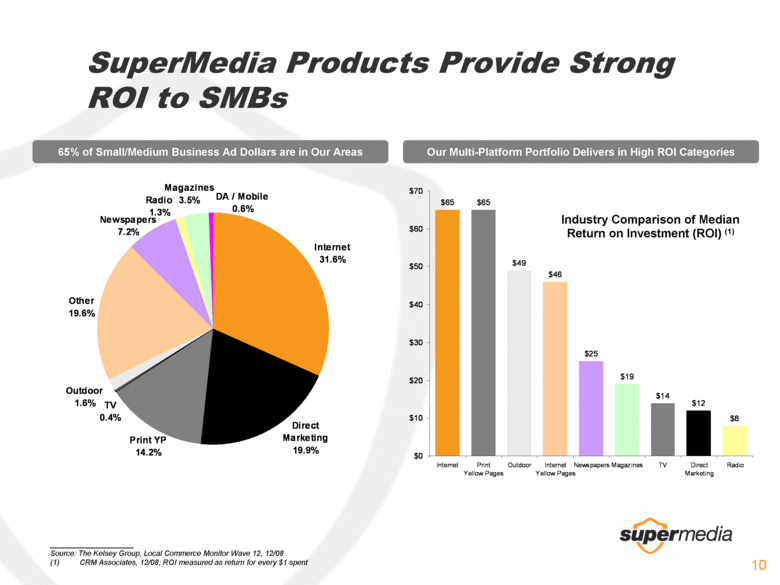
SuperMedia Products Provide Strong ROI to SMBs 65% of Small/Medium Business Ad Dollars are in Our Areas Our Multi-Platform Portfolio Delivers in High ROI Categories Industry Comparison of Median Return on Investment (ROI) (1) Source: The Kelsey Group, Local Commerce Monitor Wave 12, 12/08 CRM Associates, 12/08; ROI measured as return for every $1 spent $65 $65 $49 $46 $25 $19 $14 $12 $8 $0 $10 $20 $30 $40 $50 $60 $70 Internet Print Yellow Pages Outdoor Internet Yellow Pages Newspapers Magazines TV Direct Marketing Radio Magazines 3.5% Radio 1.3% Newspapers 7.2% Other 19.6% Outdoor 1.6% TV 0.4% Print YP 14.2% Direct Marketing 19.9% Internet 31.6% DA / Mobile 0.6% |
|
|
We Are SuperMedia |
|
|
Why is SuperMedia Different? [SuperMedia Mantra Video Clip] |
|
|
Transformation Renewed focus Building a new company Superior value proposition |
|
|
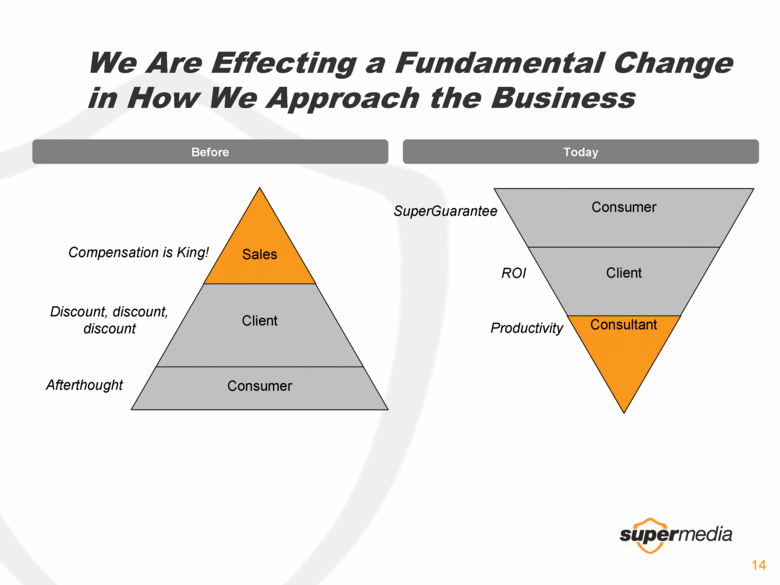
Sales Client Consumer Compensation is King! Discount, discount, discount Afterthought We Are Effecting a Fundamental Change in How We Approach the Business Before Today Consultant Client Consumer SuperGuarantee ROI Productivity |
|
|
Changing the Rules of the Game with SuperGuarantee Providing consumers protection so they can spend with confidence Only service providers covered, not products Free consumer registration required on Superpages.com or SuperGuarantee.com Consumer service team organized to step in and make it right or provide up to $500 compensation |
|
|
Breakthrough Consumer Service Guarantee Backed by powerful advertising [Commercial Video Clip] |
|
|
Breakthrough Consumer Service Guarantee Client testimonial – GrimeBusters [Client Testimonial Video Clip] |
|
|
Breakthrough Consumer Service Guarantee Client testimonial – Avatar Painting [Client Testimonial Video Clip] |
|
|
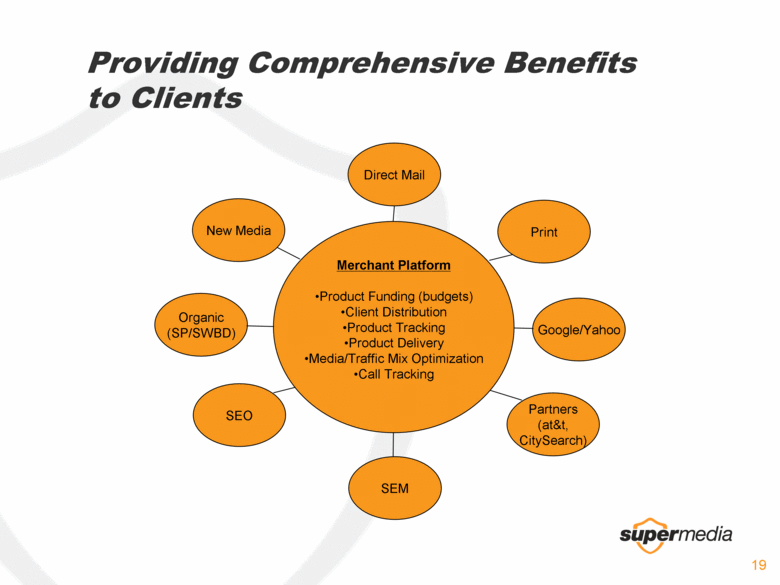
Providing Comprehensive Benefits to Clients Merchant Platform Product Funding (budgets) Client Distribution Product Tracking Product Delivery Media/Traffic Mix Optimization Call Tracking Organic (SP/SWBD) Print Partners (at&t, CitySearch) Google/Yahoo SEM SEO Direct Mail New Media |
|
|
Raising the Stakes with SuperTradeExchange Advanced form of barter Over 22,000 traders Provides “stickiness” Must be an advertiser in good standing |
|
|
Revolutionary Program - SuperTradeExchange Client testimonial – Bungalow Beach Resort [Client Testimonial Video Clip] |
|
|
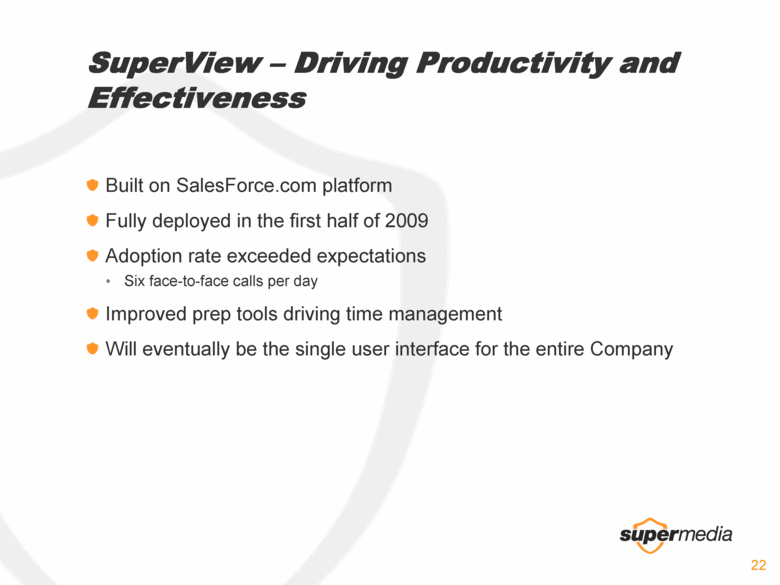
Built on SalesForce.com platform Fully deployed in the first half of 2009 Adoption rate exceeded expectations Six face-to-face calls per day Improved prep tools driving time management Will eventually be the single user interface for the entire Company SuperView – Driving Productivity and Effectiveness |
|
|
Media Consultants Embrace SuperView [Media Consultant Testimonial Video Clip] |
|
|
Financial Summary |
|
|
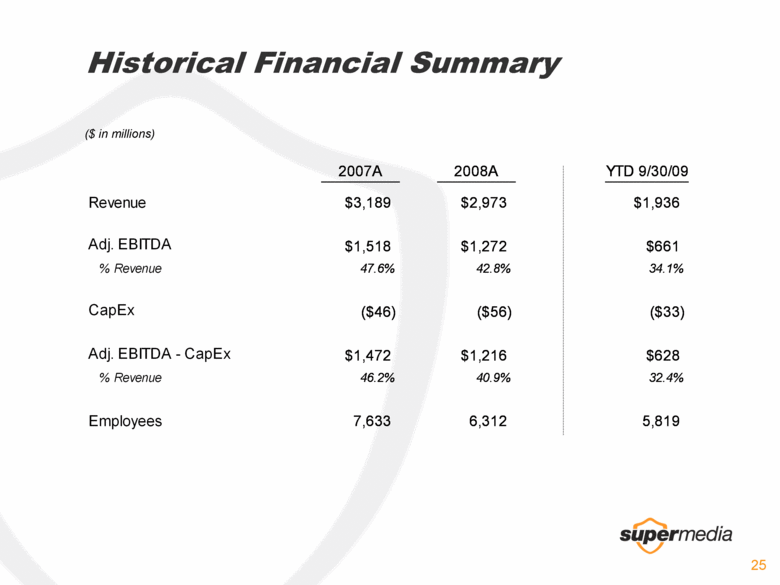
Historical Financial Summary ($ in millions) 2007A 2008A YTD 9/30/09 Revenue $3,189 $2,973 $1,936 Adj. EBITDA $1,518 $1,272 $661 % Revenue 47.6% 42.8% 34.1% CapEx ($46) ($56) ($33) Adj. EBITDA - CapEx $1,472 $1,216 $628 % Revenue 46.2% 40.9% 32.4% Employees 7,633 6,312 5,819 |
|
|
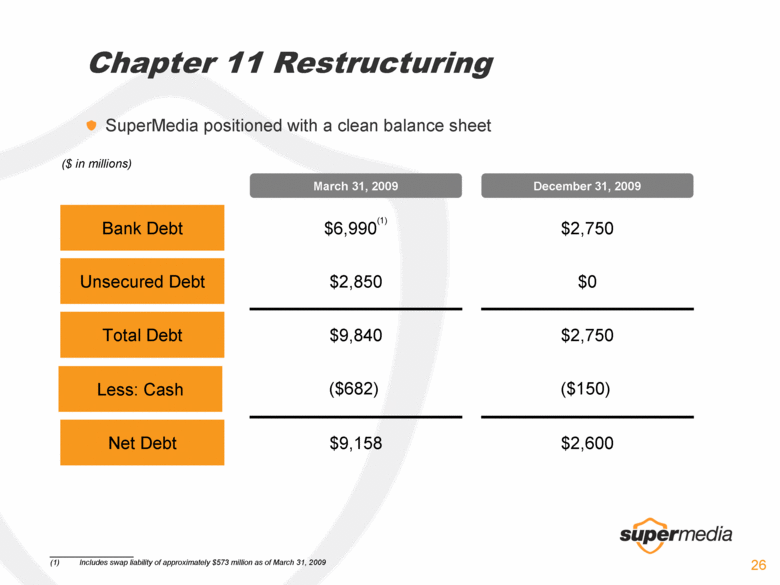
Chapter 11 Restructuring SuperMedia positioned with a clean balance sheet ($ in millions) December 31, 2009 March 31, 2009 Bank Debt $6,990(1) $2,750 Unsecured Debt $2,850 $0 Total Debt $9,840 $2,750 Less: Cash ($682) ($150) Net Debt $9,158 $2,600 Includes swap liability of approximately $573 million as of March 31, 2009 |
|
|
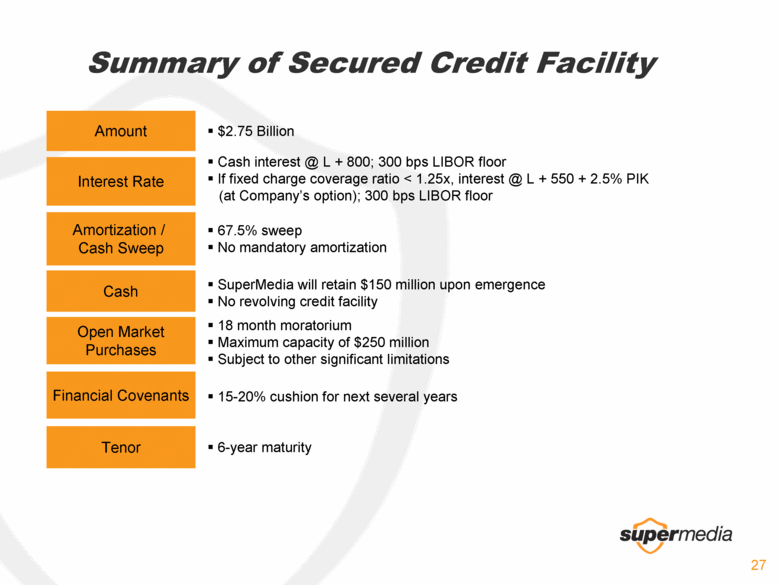
146 Amount Interest Rate Amortization / Cash Sweep Cash Tenor $2.75 Billion Cash interest @ L + 800; 300 bps LIBOR floor If fixed charge coverage ratio < 1.25x, interest @ L + 550 + 2.5% PIK (at Company’s option); 300 bps LIBOR floor 67.5% sweep No mandatory amortization SuperMedia will retain $150 million upon emergence No revolving credit facility 6-year maturity Open Market Purchases 18 month moratorium Maximum capacity of $250 million Subject to other significant limitations Financial Covenants 15-20% cushion for next several years Summary of Secured Credit Facility |
|
|
APPENDIX |
|
|
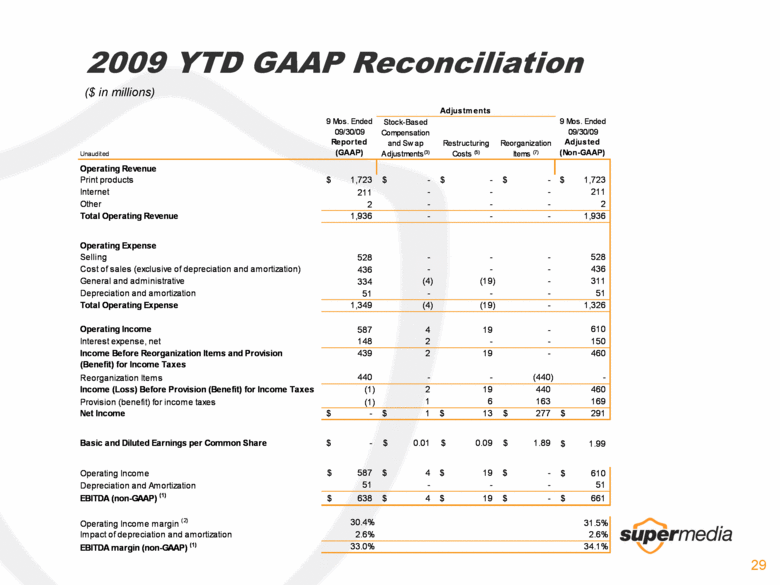
2009 YTD GAAP Reconciliation ($ in millions) 9 Mos. Ended 09/30/09 9 Mos. Ended 09/30/09 Unaudited Reported (GAAP) Adjusted (Non-GAAP) Operating Revenue Print products 1,723 $ - $ - $ - $ 1,723 $ Internet 211 - - - 211 Other 2 - - - 2 Total Operating Revenue 1,936 - - - 1,936 Operating Expense Selling 528 - - - 528 Cost of sales (exclusive of depreciation and amortization) 436 - - - 436 General and administrative 334 (4) (19) - 311 Depreciation and amortization 51 - - - 51 Total Operating Expense 1,349 (4) (19) - 1,326 Operating Income 587 4 19 - 610 Interest expense, net 148 2 - - 150 439 2 19 - 460 Reorganization Items 440 - - (440) - (1) 2 19 440 460 Provision (benefit) for income taxes (1) 1 6 163 169 Net Income - $ 1 $ 13 $ 277 $ 291 $ Basic and Diluted Earnings per Common Share - $ 0.01 $ 0.09 $ 1.89 $ 1.99 $ Operating Income 587 $ 4 $ 19 $ - $ 610 $ Depreciation and Amortization 51 - - - 51 EBITDA (non-GAAP) (1) 638 $ 4 $ 19 $ - $ 661 $ Operating Income margin (2) 30.4% 31.5% Impact of depreciation and amortization 2.6% 2.6% EBITDA margin (non-GAAP) (1) 33.0% 34.1% Adjustments Income (Loss) Before Provision (Benefit) for Income Taxes Income Before Reorganization Items and Provision (Benefit) for Income Taxes Reorganization Items (7) Stock-Based Compensation and Swap Adjustments (3) Restructuring Costs (5) |
|
|
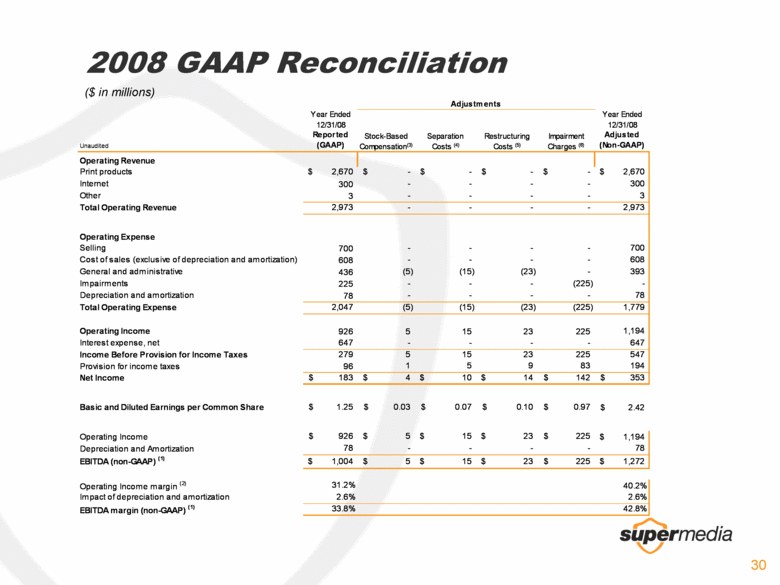
2008 GAAP Reconciliation ($ in millions) Year Ended 12/31/08 Year Ended 12/31/08 Unaudited Reported (GAAP) Adjusted (Non-GAAP) Operating Revenue Print products 2,670 $ - $ - $ - $ - $ 2,670 $ Internet 300 - - - - 300 Other 3 - - - - 3 Total Operating Revenue 2,973 - - - - 2,973 Operating Expense Selling 700 - - - - 700 Cost of sales (exclusive of depreciation and amortization) 608 - - - - 608 General and administrative 436 (5) (15) (23) - 393 Impairments 225 - - - (225) - Depreciation and amortization 78 - - - - 78 Total Operating Expense 2,047 (5) (15) (23) (225) 1,779 Operating Income 926 5 15 23 225 1,194 Interest expense, net 647 - - - - 647 279 5 15 23 225 547 Provision for income taxes 96 1 5 9 83 194 Net Income 183 $ 4 $ 10 $ 14 $ 142 $ 353 $ Basic and Diluted Earnings per Common Share 1.25 $ 0.03 $ 0.07 $ 0.10 $ 0.97 $ 2.42 $ Operating Income 926 $ 5 $ 15 $ 23 $ 225 $ 1,194 $ Depreciation and Amortization 78 - - - - 78 EBITDA (non-GAAP) (1) 1,004 $ 5 $ 15 $ 23 $ 225 $ 1,272 $ Operating Income margin (2) 31.2% 40.2% Impact of depreciation and amortization 2.6% 2.6% EBITDA margin (non-GAAP) (1) 33.8% 42.8% Adjustments Income Before Provision for Income Taxes Impairment Charges (6) Stock-Based Compensation (3) Restructuring Costs (5) Separation Costs (4) |
|
|
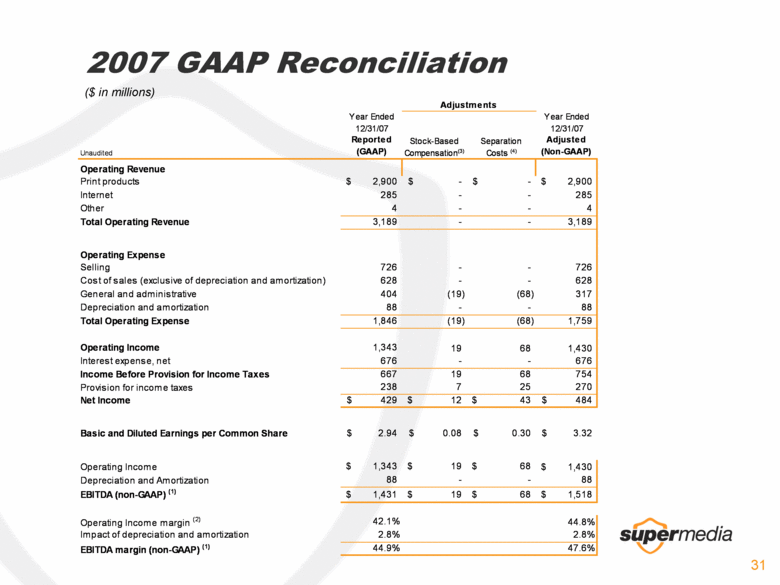
2007 GAAP Reconciliation ($ in millions) Year Ended 12/31/07 Year Ended 12/31/07 Unaudited Reported (GAAP) Adjusted (Non-GAAP) Operating Revenue Print products 2,900 $ - $ - $ 2,900 $ Internet 285 - - 285 Other 4 - - 4 Total Operating Revenue 3,189 - - 3,189 Operating Expense Selling 726 - - 726 Cost of sales (exclusive of depreciation and amortization) 628 - - 628 General and administrative 404 (19) (68) 317 Depreciation and amortization 88 - - 88 Total Operating Expense 1,846 (19) (68) 1,759 Operating Income 1,343 19 68 1,430 Interest expense, net 676 - - 676 667 19 68 754 Provision for income taxes 238 7 25 270 Net Income 429 $ 12 $ 43 $ 484 $ Basic and Diluted Earnings per Common Share 2.94 $ 0.08 $ 0.30 $ 3.32 $ Operating Income 1,343 $ 19 $ 68 $ 1,430 $ Depreciation and Amortization 88 - - 88 EBITDA (non-GAAP) (1) 1,431 $ 19 $ 68 $ 1,518 $ Operating Income margin (2) 42.1% 44.8% Impact of depreciation and amortization 2.8% 2.8% EBITDA margin (non-GAAP) (1) 44.9% 47.6% Income Before Provision for Income Taxes Adjustments Stock-Based Compensation (3) Separation Costs (4) |
|
|
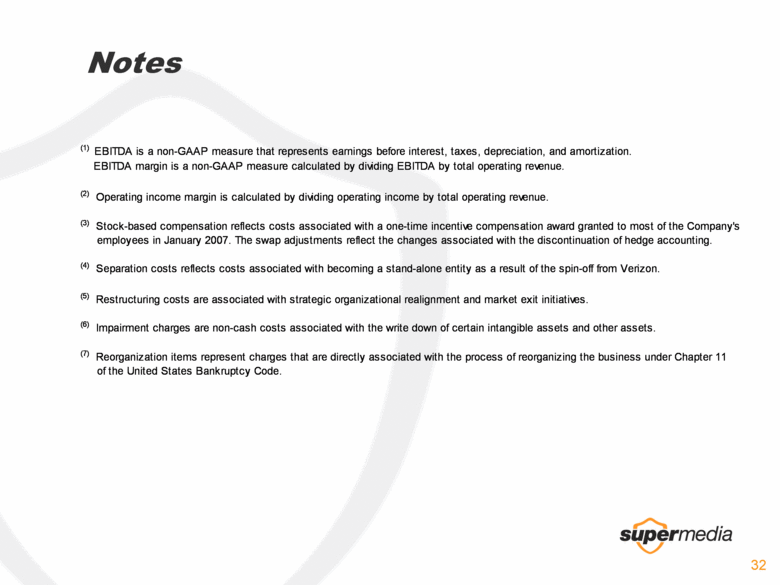
Notes (1) EBITDA is a non-GAAP measure that represents earnings before interest, taxes, depreciation, and amortization. EBITDA margin is a non-GAAP measure calculated by dividing EBITDA by total operating revenue. (2) Operating income margin is calculated by dividing operating income by total operating revenue. (3) Stock-based compensation reflects costs associated with a one-time incentive compensation award granted to most of the Company's employees in January 2007. The swap adjustments reflect the changes associated with the discontinuation of hedge accounting. (4) Separation costs reflects costs associated with becoming a stand-alone entity as a result of the spin-off from Verizon. (5) Restructuring costs are associated with strategic organizational realignment and market exit initiatives. (6) Impairment charges are non-cash costs associated with the write down of certain intangible assets and other assets. (7) Reorganization items represent charges that are directly associated with the process of reorganizing the business under Chapter 11 of the United States Bankruptcy Code. |


