Attached files
| file | filename |
|---|---|
| 8-K - CURRENT REPORT - CHART INDUSTRIES INC | d8k.htm |
      Pritchard Capital – Energize 2010 Conference Chart Industries, Inc Investment Highlights January 2010 Pritchard Capital – Energize 2010 Conference Chart Industries, Inc Investment Highlights January 2010 Exhibit 99.1 |
 Disclosure 1 This presentation includes “forward-looking statements” within the meaning of the Private
Securities Litigation Reform Act of 1995. The use of words such as “may”,
“might”, “should”, “will”, “expect”, “plan”, “anticipate”, “believe”, “estimate”, “project”, “forecast”, “outlook”, “intend”, “future”, “potential” or
“continue”, and other similar expressions are intended to identify forward-looking
statements. All of these forward-looking statements are based on estimates and assumptions by our management as of the date of this presentation that, although we believe to be reasonable, are inherently
uncertain. Forward-looking statements involve risks and uncertainties that could cause the
Company’s actual results or circumstances to differ materially from those expressed or
implied by forward-looking statements. These risks and uncertainties include, among
others, the following: the cyclicality of the markets that the Company serves and the vulnerability of those markets to economic downturns; the negative impacts of the continuing global economic and financial crisis, including
the extent of decline in future sales and earnings related to these events; a delay, significant
reduction in or loss of purchases by large customers; fluctuations in energy prices; the
modification or cancellation of orders in our backlog; changes in government healthcare and
medical device regulations, taxes, fees and reimbursement policies, including any health care reform legislation that may be enacted; our reliance on key suppliers and potential supplier failures;
competition; general economic, political, business and market risks associated with the
Company's global operations; fluctuations in foreign currency exchange and interest rates;
potential future charges to income associated with potential impairment of the Company’s
significant goodwill and other intangibles; the Company's ability to successfully manage its costs, core business resources and growth, including its ability to successfully acquire and integrate new product lines or
businesses; the satisfaction of customary conditions to closing pending acquisitions; the loss
of key employees and deterioration of labor and employee relations; potential labor disputes and
work stoppages at our facilities; the pricing and availability of raw materials; the Company's
ability to manage its fixed-price contract exposure; additional liabilities related to taxes; the costs of compliance with environmental, health and safety laws, and potential liabilities under these laws; the
impact of hurricanes and other severe weather; litigation and disputes involving the Company,
including product liability, contract, warranty, pension and severance claims; volatility and
fluctuations in the price of our stock; and long-term risks associated with our indebtedness, including our ability to refinance our debt on terms favorable to the Company. For a
discussion of these and additional risks that could cause actual results to differ from those
described in the forward-looking statements, see disclosure under Item 1A. “Risk
Factors” in the Company’s most recent Annual Report on Form 10-K and other recent filings with the Securities and Exchange Commission, which should be reviewed carefully. Please
consider the Company’s forward-looking statements in light of these risks.
Any forward-looking statement speaks only as of its date. We undertake no obligation to
publicly update or revise any forward-looking statement, whether as a result of new information, future events or otherwise, except as required by law. This presentation includes certain non-GAAP financial measures as defined in the Securities and
Exchange Commission’s Regulation G. More information on these non-GAAP financial
measures including EBITDA, and the required reconciliations under Regulation G are set forth in
the Appendix to this presentation. EBITDA, as shown in this presentation and the Appendix,
represents earnings before interest, taxes, depreciation and amortization. |
 SECTION 1 Company Overview |
 3 Energy industry is the largest end-user of the Company’s products #1 or #2 in all
primary markets served Global operations with 12 manufacturing facilities and about 2,600 employees (1) $650 million of sales, $135 million of EBITDA for LTM 9/30/09 Company Overview Chart Industries is a leading provider of highly engineered cryogenic equipment for
the hydrocarbon, industrial gas, and biomedical markets. Asia 32% U.S. 35% Americas (Non-US) 8% RoW 5% Europe 20% 2008 Sales by Segment Energy 62% BioMedical 13% General Industrial 25% 2008 Sales by Region (1) Includes about 375 employees added from recent acquisitions 2008 Sales by End-User Energy & Chemicals 42% Distribution & Storage 45% BioMedical 13% |
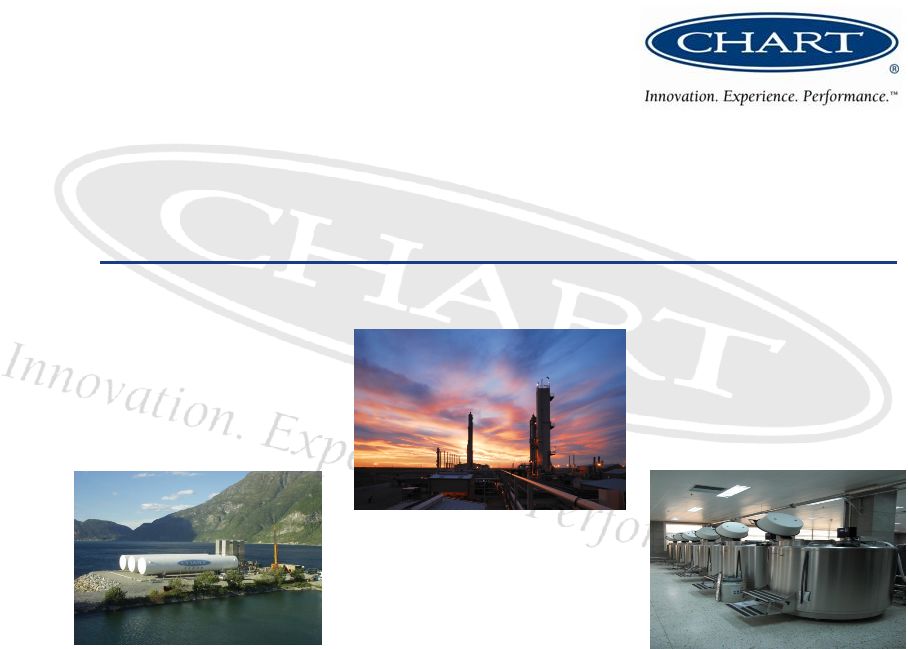
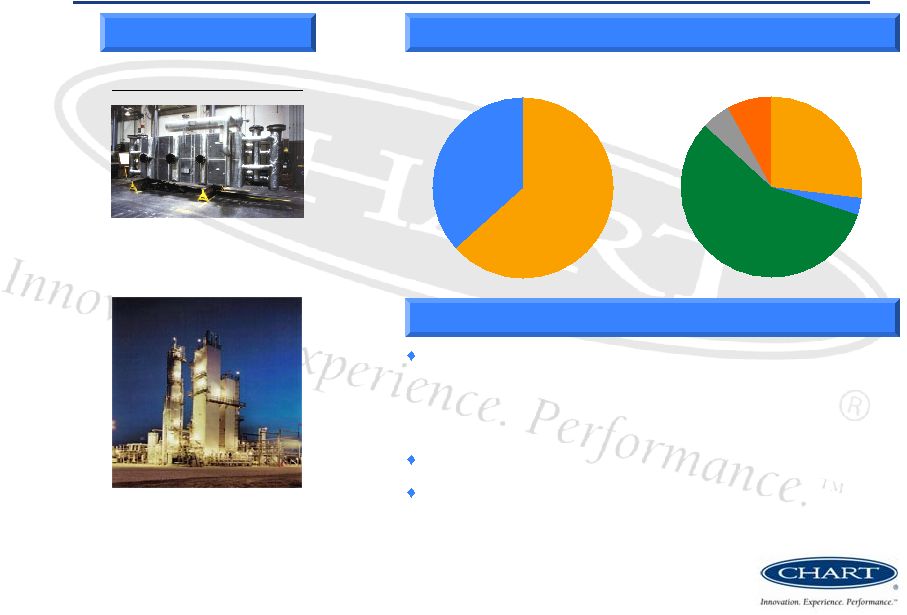 E&C Segment Overview 4 Heat Exchanger Cold Box Production Heat Exchangers 63% Cold Boxes and LNG VIP 37% 2008 Sales by Product/Region Highlights Leading provider of heat exchangers and cold boxes critical to LNG, IGCC and natural gas processing markets – Separation, liquefaction and purification of hydrocarbon and industrial gases Leading market positions domestically and internationally One of three global suppliers of mission-critical LNG and LNG liquefaction equipment Selected Products Americas (Non-US) 5% RoW 8% Asia 57% U.S. 27% Europe 3% |
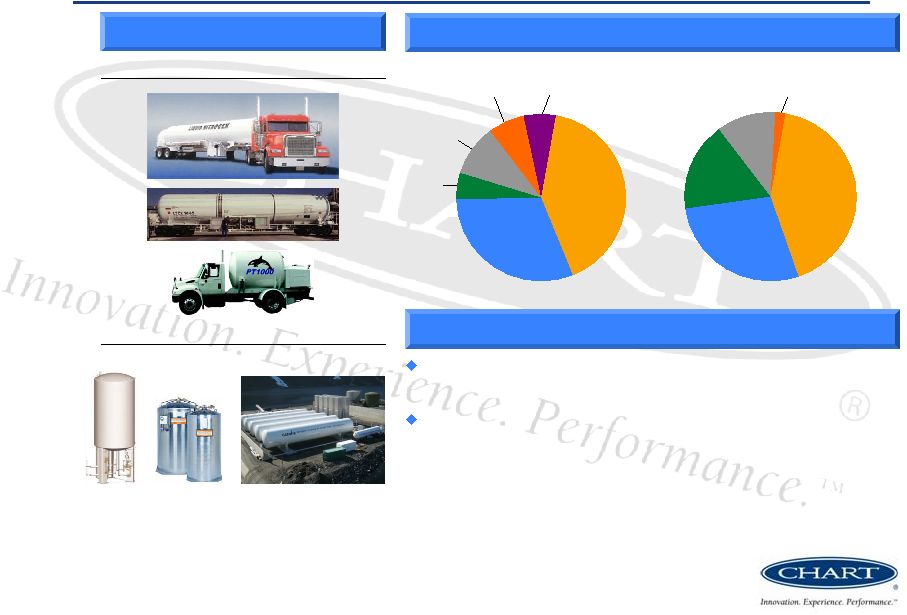 D&S Segment Overview 5 2008 Sales by Product/Region Highlights 44% of 2008 segment sales derived from products used in energy applications Manufacturing strategically located near growing end markets and lower-cost countries – Positioned to capitalize on strong expected growth in Asia and Eastern Europe – Continued investment in key global manufacturing facilities Bulk MicroBulk Distribution Storage Selected Products Satellite LNG Storage Bulk Storage Systems 41% Packaged Gas Systems 31% VIP, Systems and Components 5% Parts, Repair and On- Site Service 10% Beverage Liquid CO Systems 7% LNG Terminals and Vehicle Fuel Systems 6% Americas (Non-US) 11% RoW 2% Asia 17% U.S. 42% Europe 28% 2 |
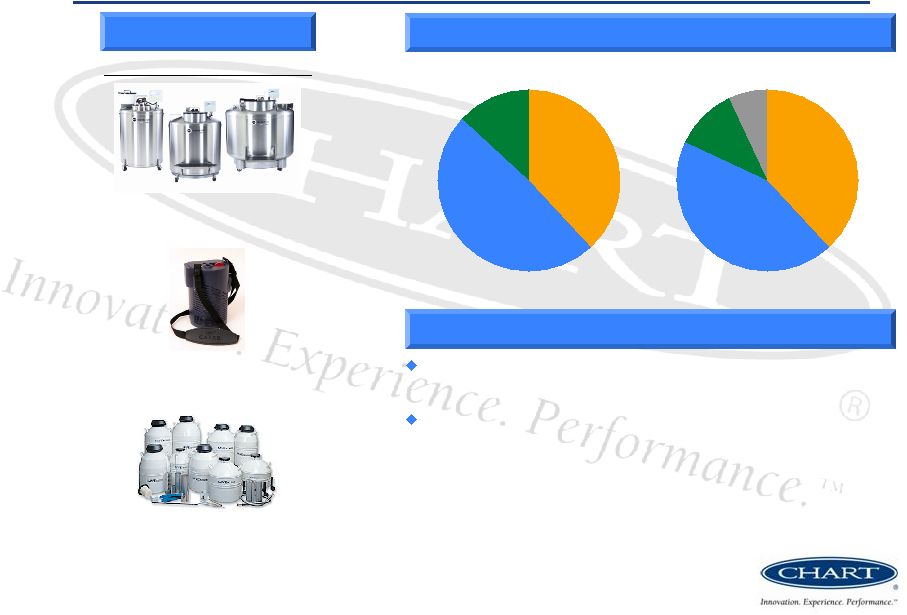 BioMedical Segment Overview 6 2008 Sales by Product/Region Highlights Strong expected growth in oxygen respiratory therapy and biomedical research, led by international markets End markets include: – Home healthcare and nursing home – Hospitals and long-term care – Biomedical and pharmaceutical research – Animal breeding Portable Oxygen Lab Storage Stainless Steel Freezer End-Use Consumption Respiratory Therapy Systems 38% Other 13% Biological Storage Systems 49% Selected Products Americas (Non-US) 7% U.S. 38% Europe 44% Asia 11% |
 SECTION 2 Chart Investment Highlights |
 Summary of Investment Highlights End markets are positioned to recover with strong energy demand – Energy demand recently forecasted to expand 40% between now and 2030* – Global investment of $26 trillion, over $1 trillion/year, is needed to keep up with
demand* A market leader – Leading market position in all segments – Significant sustainable competitive advantages – Strong balance sheet with significant liquidity Aggressive response to current economic downturn – Cost management made a priority along with operations excellence – Flexible cost structure provides the ability to quickly downsize SG&A and plant overhead costs – Work force levels down 24% from 12/31/08 levels excluding recent acquisitions. – Exit of low margin MRI product line – Will emerge from downturn more strongly positioned Continued growth initiatives – Three strategic acquisitions completed during 2009 – Expect continued acquisition activity due to strong balance sheet and liquidity
Strong track record of maximizing operating efficiencies and growth – 23% sales compound annual growth rate (“CAGR”) 2003 through 2008 – 51% EBITDA CAGR 2003 through 2008 8 * Source: International Energy Agency - World Energy
Outlook 2009, Reference Scenario. Based on assumption that
governments do not change their policies relating to energy; differences would arise should governments change energy policies
|
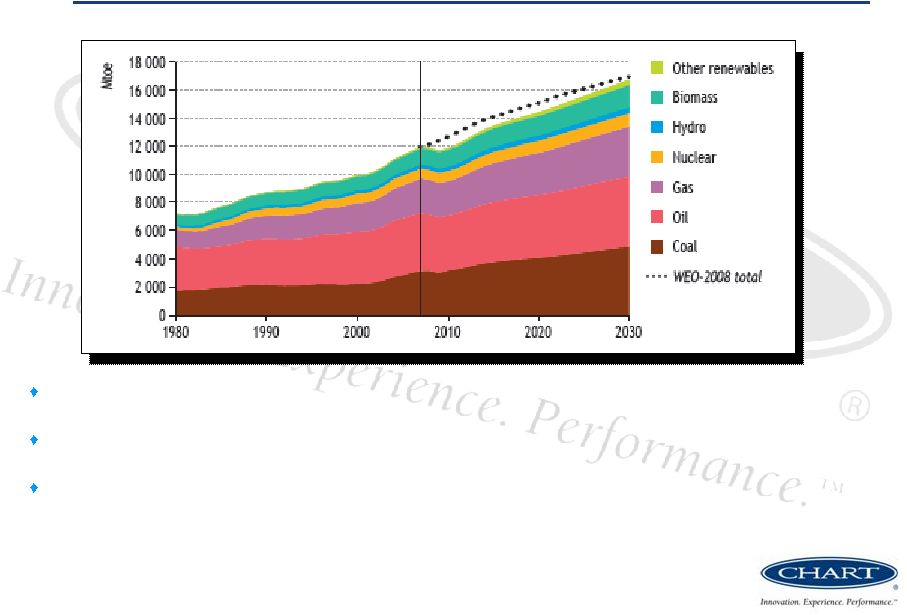 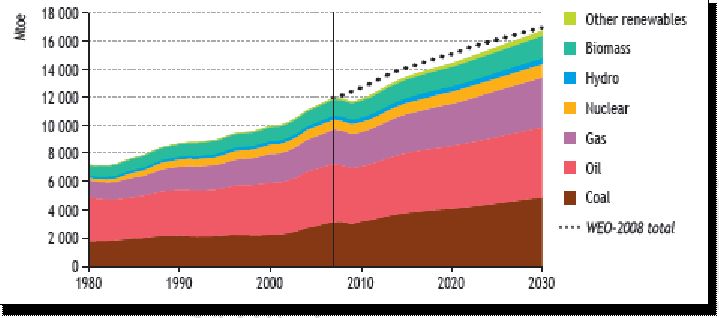  9 World primary demand for natural gas expands on average by 1.5% per year.
The biggest increases occur in the Middle East, China and India. New power generation stations absorb 45% of the increase. * Demand for coal grows more strongly than demand for any other energy sources. Growth in
production in all other regions is dwarfed by China’s 61% share of incremental global production.* Cumulative energy investment needs amount to $26 trillion in
2008-2030. The power transmission, distribution and generation sectors require 53% of total investment, and gas supply infrastructure
requires 20%.* * Source: International Energy Agency World Energy Outlook 2009, Reference Scenario Reference Scenario based on assumption that governments do not change their policies relating to energy; differences would arise should governments change energy policies Energy Trends - Long-Term Growth Drivers World Primary Energy Demand by Fuel* |
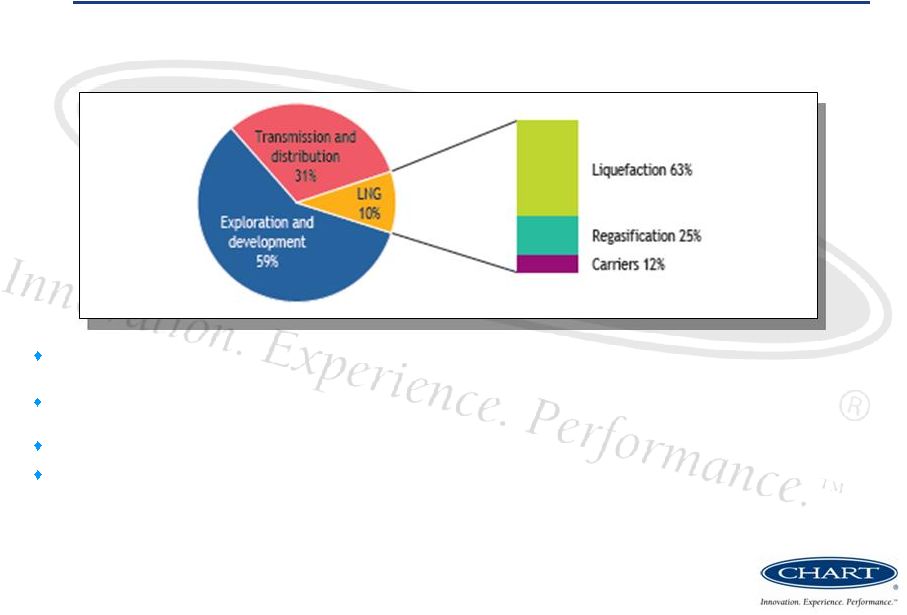 10 Energy Trends - Long-Term Growth Drivers “Overall global Capex on LNG facilities for the 2010-2014 period is forecast to total over $108 billion – a growth of 10% relative to the 2005-2009 period.” Source: Douglas-Westwood World LNG Market Report 2010-2014 - (12/3/2009) “Global gas demand is likely to rise by 25%, while the use of LNG is set to surge by 40% by 2020.
” Source: ExxonMobil quoted at CWC World LNG Summit, Barcelona - (12/2/2009) $220 billion annual investment into the entire gas-supply infrastructure is needed
through 2030 * More than half of the global gas investment is needed in
non-OECD countries (primarily in Eastern Europe/Eurasia, Asia and the
Middle East) * Cumulative Investment in Gas-Supply Infrastructure by
Activity, 2008-2030* Total Investment over Period: $5.1 trillion
* Source: International Energy Agency – World Energy Outlook 2009, Reference Scenario Reference Scenario based on assumption that governments do not change their policies relating to energy; differences would arise should governments change energy policies |
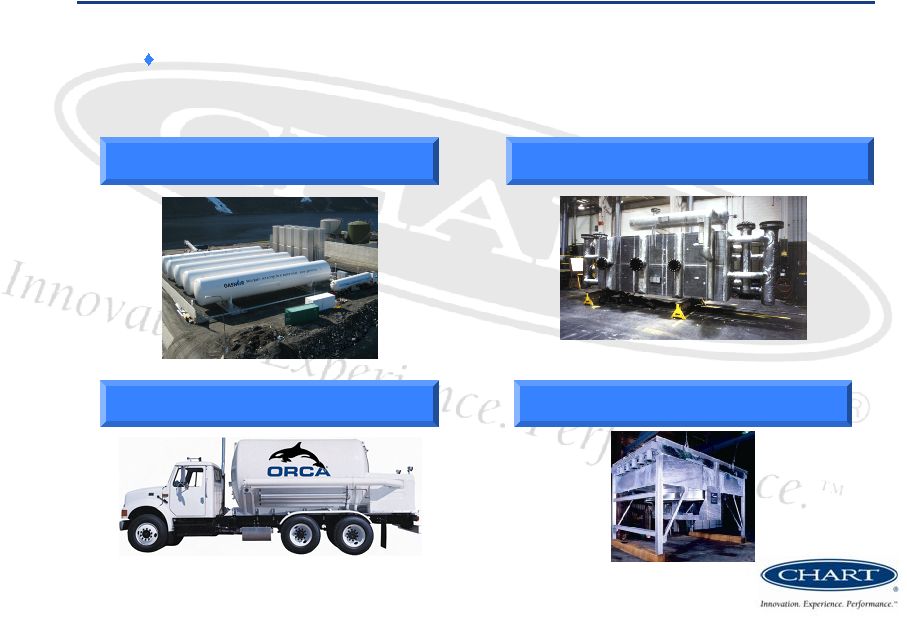 Leading Proprietary Technology and Designs 11 Take advantage of leading proprietary technology and designs through new product development Satellite LNG Storage MicroBulk Air Cooled Heat Exchangers Brazed Aluminum Heat Exchangers |
 Growth Initiatives 12 Acquisition criteria include: – Global niche engineered equipment, systems or aftermarket business – Fit with Chart value proposition including product/technology synergies – #1 or potential to become #1 within existing or adjacent growth markets – Geographic expansion or cost savings synergies Completed three acquisitions during 2009 – Covidien’s Global Oxygen Therapy Business (HELiOS™ and Companion™ products) – Plainfield, Indiana – Increases Biomedical sales by over 50% to an expected annual run rate of approximately $150 million – Opportunity to substantially improve operating margins through business rationalization
and leveraging strategic sourcing capabilities – Golden Phoenix Liquid Nitrogen Container – Chengdu, China – Expand BioMedical’s geographical footprint to support the growing Asian and European demand – Take advantage of lower cost manufacturing – Tri-Thermal Inc. – Tulsa, Oklahoma – Build E&C aftermarket business by supplying high margin parts and repair
service – Establish new customer relationships and opportunity to sell replacement heat
exchangers Current economic environment continues to provide acquisition opportunities for
Companies with strong balance sheets and more than adequate liquidity, such as Chart
|
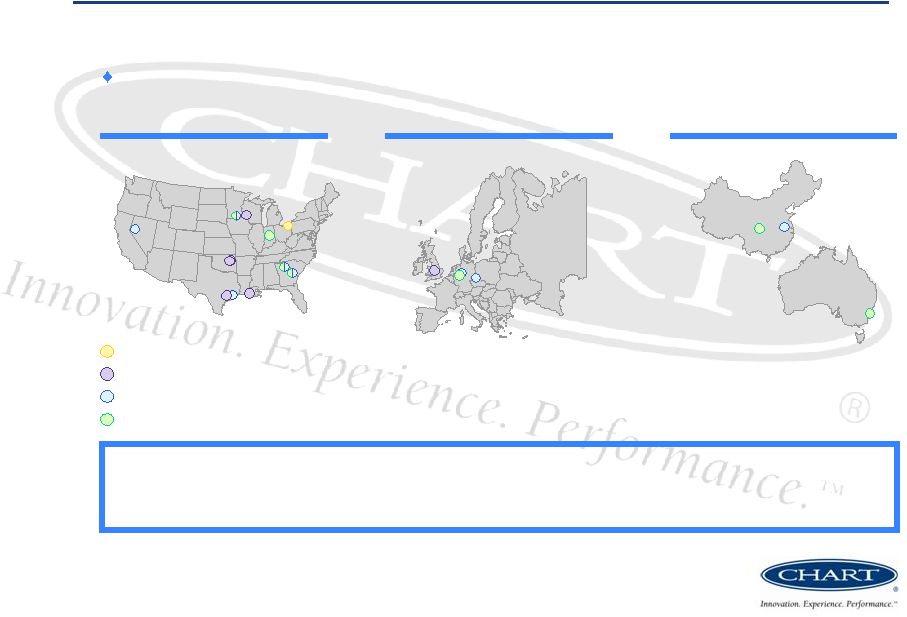 Global Manufacturing and Distribution Platform 13 Operating leverage provides the flexibility to expand and reduce capacity as needed with minimal capital expenditure Manufacturing facilities are strategically located in lower-cost countries and near centers of demand Corporate Energy & Chemicals Distribution & Storage BioMedical Total: Manufacturing: Europe Asia-Pacific 12 8 4 2 3 2 North America |
 SECTION 3 Financial Overview |
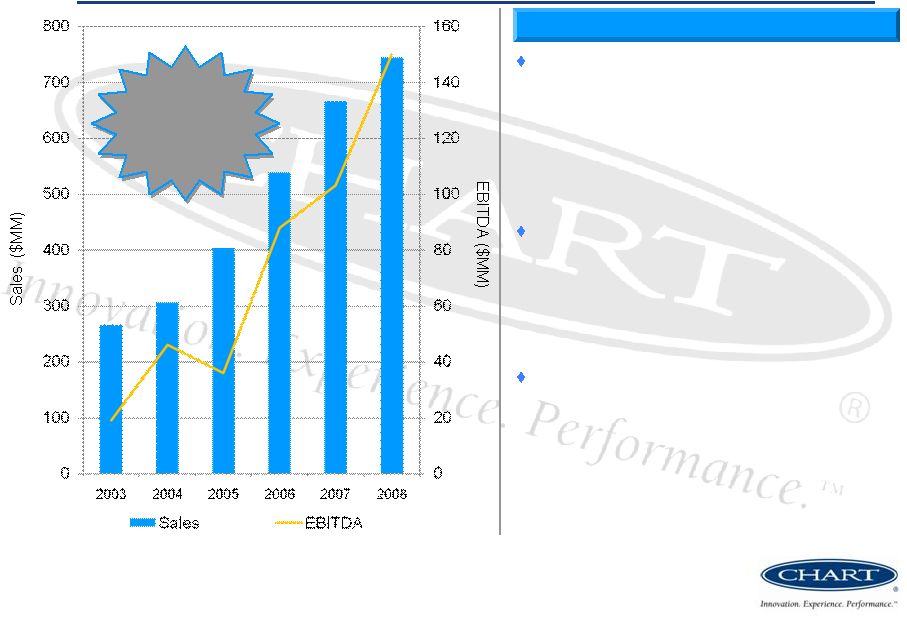 Strong Track Record of Successful Execution 15 Drivers of Growth Distribution & Storage – Expanding aftermarket business – Global relationships with major industrial gas companies – Well positioned in areas of expected growth (Asia & Eastern Europe) Energy & Chemicals – Significant exposure to expected global energy demand growth – Environmental legislation and alternative energy opportunities BioMedical – Liquid oxygen growth in emerging markets – Increasing biological research expenditures – Aging demographic CAGR (2003-2008) Sales 23% EBITDA 51% (1) EBITDA includes non-recurring costs of $24 million for the acquisition of Chart
Industries by First Reserve. (2) EBITDA includes non-recurring costs of $7 million for stock compensation expense due to secondary stock offering. (1) (2) |
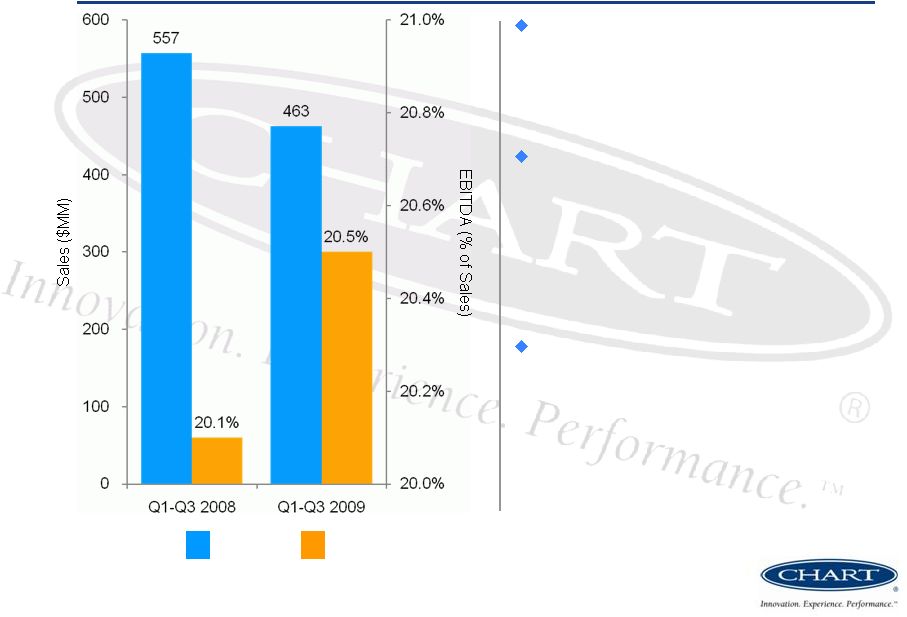 EBITDA Margin Improvement 16 Year over year sales decline attributed to lower volumes across segments due to poor economic environment and unfavorable currency effects. EBITDA performance benefited from improved project execution and ongoing cost reduction initiatives – Gross Margin improvement (+144 bps improvement Q1-Q3 2009 vs. Q1-Q3 2008) – 24% workforce reduction from 12/31/08 levels (excluding recent acquisitions) Strong balance sheet, significant liquidity and cost savings initiatives position us well to face the challenges of the economic downturn Net Sales EBITDA |
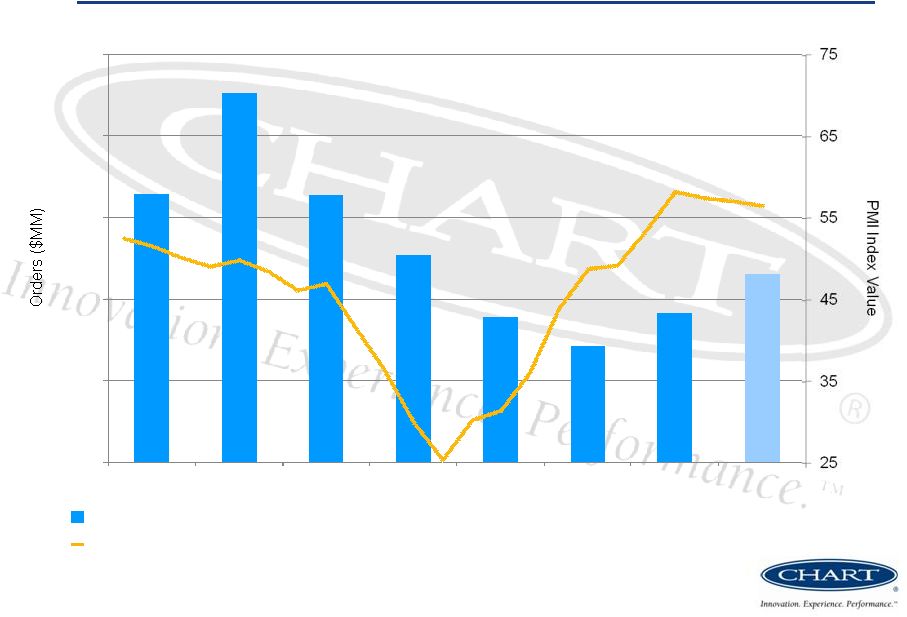 165 227 164 127 89 71 92 115 0 50 100 150 200 250 Q1 2008 Q2 2008 Q3 2008 Q4 2008 Q1 2009 Q2 2009 Q3 2009 Q4 2009 ** Quarterly Firm Orders against Monthly Global New Orders Index (PMI) Improving Order Trends 17 Global Manufacturing New Orders Index * * Source: JP Morgan Global Manufacturing PMI ** 4 Quarter 2009 orders estimated through 12/27/2009 Firm Orders (Quarterly) th |
 Positive Developments 18 Current economic environment has been challenging but recent developments support some optimism Order trends in D&S and BioMedical have shown signs of stabilization or improvement. – BioMedical has traditionally been counter-cyclic and order trends continue to hold up.
– D&S order trends have stabilized and started to move up in certain product
lines. E&C quote activity has been fairly active. Bids for large
base-load LNG liquefaction projects submitted could lead to 2010
orders. E&C revenue typically lags order intake due to project size and
duration. We continue to invest in this business to meet long-term
expectations despite short-term competitive pricing pressure. Cost
savings initiatives ahead of management expectations as workforce levels, excluding impact of acquisitions, are down 24% from year end 2008. Continue to generate positive cash flow during the economic downturn with cash
and investments of $219.5 million at the end of September, up $65.1 million from
December 31, 2008. |
 SECTION 4 Conclusion Note: The Company’s 2010 earnings outlook
will be provided during the fourth quarter and year-end 2009 conference
call scheduled for February 24, 2010 |
 Positioned on Strong and Stable Platform for Growth Flexible Manufacturing Platform – Ability to ramp up or scale back production as demand fluctuates – Necessary capacity expansion/contraction is easily attainable – Proven ability to implement cost-savings measures during periods of sharp
decline Very strong balance sheet – Significant improvement in net debt position – Substantial free cash flow growth – Continued ability to invest in and take advantage of growth opportunities Stable business model – Attractive industry with long-term customer relationships – Solid platform with worldwide presence and leading market positions in all
segments – Significant sustainable competitive advantages Positioned for continued significant growth when markets recover – Strong track record of maximizing operating efficiencies and growth 20 Chart represents a unique investment opportunity to capitalize on the return of strong growth in the markets it serves, particularly natural gas processing and LNG sectors. |
 APPENDIX Reconciliation of Net Income to EBITDA |
 Reconciliation of Net Income to EBITDA 22 ($ In Millions) 2003 2004 2005 2006 2007 2008 Q1-Q3 2008 Q1-Q3 2009 Net Income (Loss) $ (7) $ 23 $ 8 $ 27 $ 44 $ 79 $ 57 $ 46 Interest expense, net 12 5 10 25 22 18 14 12 Income tax expense 3 10 7 13 17 30 25 21 Depreciation and amortization 11 8 11 23 20 23 16 16 EBITDA $ 19 $ 46 $ 36 $ 88 $ 103 $ 150 $ 112 $ 95 Years Ended December 31, EBITDA represents earnings before interest, taxes, depreciation and amortization.
EBITDA is not intended to represent cash flow from operations as defined by
U.S. GAAP and should not be used as an alternative to net income or as an
indicator of operating performance. |
 |