Attached files
Table of Contents
UNITED STATES
SECURITIES AND EXCHANGE COMMISSION
Washington, D.C. 20549
Form 10-K
| þ | ANNUAL REPORT PURSUANT TO SECTION 13 OR 15(d) OF THE SECURITIES EXCHANGE ACT OF 1934 |
For the Fiscal Year Ended October 31, 2009
OR
| ¨ | TRANSITION REPORT PURSUANT TO SECTION 13 OR 15(d) OF THE SECURITIES EXCHANGE ACT OF 1934 |
For the transition period from to .
Commission File Number 0-13351
NOVELL, INC.
(Exact name of registrant as specified in its charter)
| Delaware | 87-0393339 | |
| (State or other jurisdiction of incorporation or organization) | (I.R.S. Employer Identification No.) |
404 Wyman Street, Suite 500
Waltham, MA 02451
(Address of principal executive offices including zip code)
(781) 464-8000
(Registrant’s telephone number, including area code)
Securities registered pursuant to Section 12(b) of the Act:
| Title of Each Class |
Name of Each Exchange on Which Registered | |
| Common Stock, par value $.10 per share | The NASDAQ Stock Market LLC (NASDAQ Global Select Market) |
Securities registered pursuant to Section 12(g) of the Act: None
Indicate by check mark if the registrant is a well-known seasoned issuer, as defined in Rule 405 of the Securities Act. Yes þ No ¨
Indicate by check mark if the registrant is not required to file reports pursuant to Section 13 or Section 15(d) of the Act. Yes ¨ No þ
Indicate by check mark whether the registrant (1) has filed all reports required to be filed by Section 13 or 15(d) of the Securities Exchange Act of 1934 during the preceding 12 months (or for such shorter period that the registrant was required to file such reports) and (2) has been subject to such filing requirements for the past 90 days. Yes þ No ¨
Indicate by check mark whether the registrant has submitted electronically and posted on its corporate Web site, if any, every Interactive Data File required to be submitted and posted pursuant to Rule 405 of Regulation S-T during the preceding 12 months (or for such shorter period that the registrant was required to submit and post such files). Yes ¨ No ¨
Indicate by check mark if disclosure of delinquent filers pursuant to Item 405 of Regulation S-K is not contained herein, and will not be contained, to the best of registrant’s knowledge, in definitive proxy or information statements incorporated by reference in Part III of this Form 10-K or any amendment to this Form 10-K. ¨
Indicate by check mark whether the registrant is a large accelerated filer, an accelerated filer, a non-accelerated filer, or a smaller reporting company. See the definitions of “large accelerated filer,” “accelerated filer,” and “smaller reporting company” in Rule 12b-2 of the Exchange Act)
Large accelerated filer þ Accelerated filer ¨ Non-accelerated filer ¨ Smaller reporting company ¨
Indicate by check mark whether the registrant is a shell company (as defined in Rule 12b-2 of the Act) Yes ¨ No þ
The aggregate market value of the registrant’s common stock held by non-affiliates as of April 30, 2009 (based on the last reported sales price of the common stock on the NASDAQ Global Select Market on such date) was $1,004,441,358. For purposes of this disclosure, shares of common stock held by persons who hold more than 5% of the outstanding common stock and common stock held by executive officers and directors of the registrant have been excluded because such persons are deemed to be “affiliates” as that term is defined under the rules and regulations promulgated under the Securities Act of 1933. This determination is not necessarily conclusive for other purposes.
As of November 30, 2009 there were 347,123,032 shares of the registrant’s common stock outstanding.
DOCUMENTS INCORPORATED BY REFERENCE
Portions of the registrant’s definitive Proxy Statement to be filed with the Securities and Exchange Commission and delivered to stockholders in connection with the 2009 Annual Meeting of Stockholders are incorporated by reference into Part III of this report to the extent described herein.
Table of Contents
TABLE OF CONTENTS
i
Table of Contents
NOVELL, INC.
FORM 10-K
This Annual Report on Form 10-K contains certain forward-looking statements within the meaning of Section 27A of the Securities Act of 1933, as amended, and Section 21E of the Securities Exchange Act of 1934, as amended. All statements, other than statements of historical fact, regarding our strategy; future operations; financial position and results; liquidity; future opportunities; growth of business unit segments at or above market growth rates; the macroeconomic environment; market evolution and opportunities; company trends; market outlook; customer priorities; timing of realization of projections; functionality, characteristics, quality and performance capabilities of our products and technology; results achievable and benefits attainable through deployment of our products and provision of services; cost reduction; risk reduction; success of our Intelligent Workload Management strategy; support of the open source development community; use of resources for development and sales of product functions that operate on Linux; delivery of solutions based on open standards; integration of native and third-party technologies; extension of capabilities and products to the cloud; acquisition activities; impact of our partnership program; opportunities created by open source and identity solutions; and impact of the Microsoft Agreements and our relationship with Microsoft; prospects; plans; our long-range forecast; realization of net deferred tax assets; opportunities; beliefs; and objectives constitute “forward-looking statements.” The words “may,” “will,” “expect,” “plan,” “anticipate,” “believe,” “estimate,” “potential,” or “continue” and similar types of expressions identify such statements, although not all forward-looking statements contain these identifying words. These statements are based upon information that is currently available to us and/or management’s current expectations, speak only as of the date hereof, and are subject to risks and uncertainties. We expressly disclaim any obligation, except as required by federal securities laws, or undertaking to update or revise any forward-looking statements contained herein to reflect any change of expectations with regard thereto or to reflect any change in events, conditions, or circumstances on which any such forward-looking statement is based, in whole or in part. Our actual results may differ materially from the results discussed in or implied by such forward-looking statements. We are subject to a number of risks, including, among others, risks relating to: indirect sales, growth rates of our business units, renewal of SUSE Linux Enterprise ServerTM subscriptions with customers who have received certificates from Microsoft, decline rates of Open Enterprise Server (“OES”) and NetWare revenue, development of products and services, the Intelligent Workload Management market, software vulnerabilities, delays in product releases, reliance on open source software, adequacy of renewal rates, uncertain economic conditions, competition, rapid technological changes, failure to expand brand awareness, adequacy of technical support, pricing pressures, system failures, integration of acquisitions, industry consolidation, challenges resulting from a global business, foreign research and development operations, loss of key employees, intellectual property infringement, litigation matters, unpredictable financial results, impairments, the timing of revenue recognition, our investments, and effective use of our cash. Risks that may affect our operating results include, but are not limited to, those discussed in Part I Item 1A, titled “Risk Factors.” Readers should carefully review the risk factors described in this document and in other documents that we file from time to time with the Securities and Exchange Commission.
The Company
We develop, sell and install enterprise-quality software that is positioned in the operating systems and infrastructure software layers of the information technology (“IT”) industry. We develop and deliver Linux operating system software for the full range of computers from desktops to servers. In addition, we provide a portfolio of integrated IT management software for systems, identity and security management for both Linux and mixed-platform environments. Our 26 years of experience serving the full range of enterprise sizes, combined with the quality and flexibility of our open-platform software technology, offers customers an IT infrastructure that is responsive to the cost pressures and the expanding IT initiatives that are characteristic of today’s business environment.
In addition to our technology offerings, within each of our business unit segments, we offer a worldwide network of service personnel to help our customers and third-party partners effectively utilize our software. We also have strategic partnerships with application providers, hardware and software vendors, distributors and resellers, consultants, and systems integrators. In this way we can offer a broad set of solutions to our customers.
Our business unit segments are Open Platform Solutions, Identity and Security Management, Systems and Resource Management, and Workgroup. They are described below in more detail.
1
Table of Contents
NOVELL, INC.
BUSINESS (Continued)
The Company (Continued)
Open Platform Solutions
We deliver Linux and related solutions for the enterprise. The SUSE® Linux Enterprise platform underpins all of our products. SUSE Linux Enterprise is a leading distribution system that focuses considerable effort on interoperability, support for mission-critical computing requirements, and virtualization and provides ease in usability and management. Our primary Open Platform Solutions offerings are:
Linux Platform Products:
| • | SUSE Linux Enterprise Server (“SLES”) is an enterprise-class, open source server operating system for professional deployment in heterogeneous (open source and proprietary) IT environments of all sizes and sectors. This operating system integrates many server-related services relevant to Linux, including integrated virtualization, and constitutes a stable and secure platform for the cost-efficient operation of IT environments. |
| • | SUSE Linux Enterprise Desktop (“SLED”) is a business desktop operating system that brings together the Linux operating environment with a comprehensive set of business applications. Included among the more significant business applications are OpenOffice.org (an office productivity suite), Mozilla’s Firefox browser, and Novell® EvolutionTM, an e-mail and collaboration tool. |
| • | SUSE StudioTM is a set of tools and services that allows Independent Software Vendors (“ISVs”) to build customized software appliances that are efficient and cost effective to deploy, maintain and support. SUSE Studio provides a user friendly solution for building a software appliance with an optimized operating system and associated tools for configuring, patching and updating the appliance. |
| • | SUSE Moblin is our version of Moblin, an open source operating system based on Linux that is designed for netbooks, nettops and mobile Internet devices. SUSE Moblin offers users a friendly way to access the Internet, enjoy multi-media and interact with others on social networks. The product is brought to market through our original equipment manufacturers (“OEMs”) and original design manufacturer partners. |
Other Open Platform Solutions products include: openSUSE®, a home computing product that lets users browse the Web, send e-mail, chat with friends, organize digital photographs, play movies and songs, and create documents and spreadsheets; products based on the Mono® open source project, which provides software to develop and run .NET server and client applications on different operating systems, including SUSE Linux Enterprise; and SUSE Engineering, a specialized product development program we perform for customers.
Identity and Security Management
Our identity, security, and compliance management solutions are designed to help customers integrate, secure, and manage IT assets while reducing complexity and ensuring compliance with government and industry mandates. Adding this intelligence to every part of a customer’s IT environment makes their systems more agile and secure. Our solutions leverage automated, centrally-managed policies to provide insight into events happening throughout the enterprise. Our primary Identity and Security Management offerings are:
Identity, Access and Compliance Management products:
| • | Identity Manager is a powerful data-sharing and synchronization solution, often referred to as a meta-directory solution, that automatically distributes new and updated information across every designated application and directory on a network. This is designed to ensure that trusted customers, partners, and suppliers are accessing consistent information. Identity Manager integrates with numerous key enterprise IT systems, such as SAP AG (“SAP”), to provide a common and consistent identity management framework across the enterprise. |
| • | Access ManagerTM helps customers maximize access without limiting security or control. It simplifies and safeguards online asset-sharing, allowing customers to control access to web-based and traditional business applications. Trusted users gain secure authentication and access to portals, web-based content, and enterprise applications. |
2
Table of Contents
NOVELL, INC.
BUSINESS (Continued)
The Company (Continued)
| • | SecureLogin is a directory-integrated authentication solution that delivers reliable, single sign-on access across multi-platform networks, simplifying password management by eliminating the need for users to remember more than one password. |
| • | SentinelTM automates the monitoring of IT effectiveness allowing users to detect and resolve threats in real-time. This enables enterprises to maintain a more secure network. Sentinel also provides documented evidence needed by some users to comply with regulatory and industry compliance requirements. |
| • | Compliance Management Platform is an integrated identity solution that is designed to provide “out of the box” compliance assurance through real-time automation and validation. It enforces business policies and offers wizards to simplify deployment and configuration. Compliance Management Platform is comprised of Identity Manager, Access Manager and Sentinel. |
Other Identity and Security Management products include Novell® eDirectory TM, a full-service, platform-independent directory that simplifies the complexities of managing users and resources in a mixed Linux, NetWare®, UNIX, and Windows environment.
Systems and Resource Management
With our systems and resource management solutions, customers can define business and IT policies to automate the management of multiple IT resources, including the emerging challenge of managing virtual environments. As a result, customers are able to reduce IT effort, control IT costs, and reduce IT skill requirements to manage and leverage their IT investment. Our primary Systems and Resource Management products include:
| • | The Novell ZENworks® product portfolio - Configuration Management, Patch Management, Asset Management, Endpoint Security Management, Application Virtualization, Linux Management, Handheld Management, and Network Access Control – is designed to leverage policy-based automation to centrally manage and secure a heterogeneous endpoint environment, including desktops, laptops, notebooks, and handheld devices, across Windows and Linux environments. |
| • | PlateSpin® workload mobility, workload protection, and workload management solutions are designed to reduce cost, maximize efficiency and provide disaster recovery capabilities in data centers. Our suite of products, which includes PlateSpin Migrate, PlateSpin Protect, PlateSpin Forge, PlateSpin Recon, and PlateSpin Orchestrate, delivers integrated management of physical and virtual resources across mixed IT environments. |
| • | The Novell Business Service Management solutions (formerly Managed Objects products) enables IT organizations to measure real-time performance, availability and configuration compliance of services running the business, thereby providing control over the infrastructure in alignment with business objectives. The Business Service view of the environment enables a reduction of downtime, improved resource utilization, and control of risk in complex, mixed technology environments. |
Workgroup
We provide comprehensive and adaptable workgroup solutions that provide the infrastructure, services, and tools customers require to effectively and securely collaborate across a myriad of devices. We offer the security, reliability, and manageability our customers’ employees need to efficiently get their jobs done at lower cost. Our primary Workgroup products are:
OES and NetWare-related products:
| • | OES is a secure, highly available suite of services that provides networking, communication, collaboration, and application services in an open, easy-to-deploy environment. OES provides customers the choice of deploying on either NetWare or SLES and provides common management tools, identity-based services, and our support. |
3
Table of Contents
NOVELL, INC.
BUSINESS (Continued)
The Company (Continued)
| • | NetWare is our proprietary operating system platform that offers secure continuous access to core network resources such as files, printers, directories, e-mail, and databases seamlessly across all types of networks, storage platforms, and client desktops. |
| • | Novell Cluster ServicesTM is a scalable, highly available Storage Area Network resource management tool that reduces the administrative costs and complexity of delivering uninterrupted access to information and resources. |
Collaboration products:
| • | GroupWise® collaboration products offer both traditional and mobile users solutions for communication over intranets, extranets and the Internet. |
| • | Teaming + Conferencing allows for social networking within an enterprise where subject matter experts are easily identified and where new team workspaces can be easily formed. |
Other Workgroup products:
| • | Novell Open Workgroup Suite provides organizations of all sizes with a secure, flexible, and cost-effective IT infrastructure as well as workgroup services. Unlike a proprietary, Windows-centric solution, the Novell Open Workgroup Suite is comprised of a package of open standards-based software from our business unit segments. This suite offers a low-cost, open alternative to Microsoft Corporation (“Microsoft”) products, includes an infrastructure and productivity solution from the desktop to the server, and includes OES, GroupWise, ZENworks Configuration Management Standard, ZENworks Linux Management, SLED, and OpenOffice.org for Linux and Windows. |
In addition to our technology offerings, within each of our business unit segments we offer a worldwide network of service personnel to help our customers and third-party partners utilize our software. We also have partnerships with application providers, hardware and software vendors, and consultants and systems integrators. In this way, we can offer a broad solution to our customers, including:
| • | Professional services: We provide technical expertise to deliver infrastructure solutions, based on an innovative approach focused on solving our customers’ business problems. We deliver services ranging from discovery workshops to strategy projects to solution implementations, all using a consistent, well-defined methodology. Our professional services approach is based on a strong commitment to open standards, interoperability, and the right blend of our technology with technology from other leading vendors. |
| • | Technical support: We provide phone-based, web-based, and onsite technical support for our proprietary and open source products through our Premium ServiceSM program. Premium Service provides customers with the flexibility to select the appropriate level of technical support services, which may include stated response times, around-the-clock support, service account management, and dedicated resources, such as our most experienced engineers. The Dedicated Support Engineer, Primary Support Engineer, Advantage Support Engineer, and Account Management programs allow us to build an ongoing support relationship with our customers at an appropriate level for their needs. We have committed a significant amount of technical support resources to the Linux open source platform. |
| • | Training services: We accelerate the adoption and enable the effective use of our products and solutions through the delivery of timely and relevant instructor-led and technology-based training courses, assessments and performance services. Programs are either delivered directly to our customers or through our global channel of authorized training partners. Our courses provide customers with a thorough understanding of the implementation, configuration, and administration of our products and solutions. Additionally, we offer performance services that provide our customers and partners with an evaluation of their proficiencies and their knowledge gaps. We also deliver Advanced Technical TrainingTM at an engineer level to customers and partners on a global basis. |
4
Table of Contents
NOVELL, INC.
BUSINESS (Continued)
Strategy
We offer customers enterprise infrastructure software in a flexible combination of open source, mixed-source and proprietary technologies. We also offer a range of high-quality services to enable customers to succeed in their deployments of our solutions. We do this through the delivery of our interoperable Linux platform and a portfolio of integrated IT management software designed to help businesses reduce cost, complexity, and risk on virtually any platform. Deployed either directly to our customers or through our network of partners, our solutions are designed to enable our customers to devote more of their time, energy, and resources to driving their own businesses forward. A key component of our strategy is to ensure that our critical product functions operate on the Linux platform and in mixed IT environments.
On December 8, 2009, we announced an evolution in our strategy – our intention to become an industry leader in the new market category of Intelligent Workload Management (“IWM”). IWM is a new model of computing that enables IT organizations to manage and optimize computing resources in a policy-driven, secure and compliant manner across physical, virtual and cloud computing environments. Our planned differentiated approach to delivering IWM would integrate identity and systems management capabilities into an application workload. As a result, enterprises would be able to reduce the risks and challenges of computing across multiple environments while granting their users secure and compliant access to the computing services they need.
On December 14, 2009, we announced a reorganization of our structure and management to better align our business with our strategic objective of becoming an industry leader in the emerging IWM market, while continuing to develop collaboration solutions. These changes are designed to simplify the organization and provide a clear focus on markets that leverage our strengths to capture future opportunities for growth.
As part of this reorganization, effective January 1, 2010, we will consolidate our business unit segments from four to two. Our current Identity and Security Management, Systems and Resource Management and Open Platform Solutions business unit segments will be integrated to create the new Security, Management and Operating Platforms business unit. Our current Workgroup business unit segment will be renamed Collaboration Solutions to promote and highlight our recent areas of innovation and the growth opportunity in the collaboration market. The Security, Management and Operating Platforms business unit segment should enable us to integrate our product development efforts for identity and security management tools, systems management tools, and our Linux operating system to pursue opportunities in the IWM market. Our Collaboration Solutions business unit segment is structured to enable us to focus our efforts on developing tools for the evolving collaboration market.
We pursue our strategy through the four key areas as follows:
Product Strategy
Our overall products and services strategy is to leverage our competencies in Linux, identity and security management, and systems and resource management with the objective of providing the industry’s leading IWM solutions. Our product strategy focuses on the four pillars of IWM: build, secure, manage and measure.
Build
To enable enterprises and ISVs to build intelligent workloads, we plan to leverage our competency in operating systems in general and Linux in particular to provide easy to use and cost effective products for building and maintaining intelligent workloads and software appliances. We will draw on our experience with products such as SLES and SUSE Studio.
With regard to Linux adoption, we plan to continue our strong support of the open source development community, and of the many open source organizations and projects to which we presently contribute. We also plan to continue to use our significant engineering and support resources to encourage customers to adopt Linux. We can accomplish this by developing and selling key product functions that operate on the Linux platform.
Secure
To help customers address their identity, security and compliance needs, we plan to continue to deliver a portfolio of solutions that are based on open standards, provide ease of implementation and offer quick time to value. Our strategy is to build upon our strong portfolio of existing products such as Identity Manager, Sentinel, and Compliance Management Platform and to integrate identity and security capabilities throughout our IWM solutions.
5
Table of Contents
NOVELL, INC.
BUSINESS (Continued)
Strategy (Continued)
Manage
To help customers manage their physical and virtual environments and the migration between the two, we provide the PlateSpin Workload Management and ZENworks Management families of solutions. These solutions offer a service driven approach to the management of the data center and endpoint devices. In support of our IWM strategy we plan to integrate and extend these management capabilities to the cloud to ensure optimized execution of workloads both on and off site.
Measure
To help our customers measure and gain real time insight into their IT operations, we offer a suite of products including Business Service Manager, Business Experience Manager and Sentinel Log Manager. Our strategy is to extend these products to manage cloud environments to ensure business service level reporting of workloads across physical, virtual and cloud environments.
We utilize our professional services to focus our IT services and training expertise on identity management solutions and open source software adoption, and to provide a full range of support services for all our proprietary, mixed-source, and open source products, which may drive further product sales.
Alliances and Partnership Strategy
We partner with industry leaders in the software, hardware, consulting, and system integration industries to bring to market our solution offerings. We believe that a well-managed and supported partnership portfolio is critical to our success in today’s competitive solutions market and helps increase our revenue and customer reach. Our business partner strategy is based on having a single partner program with a goal of providing consistent interactions focused on technology enablement, certification, joint marketing, and sales initiatives.
To enhance partner efficiency, we have developed a partner ecosystem that combines our knowledge, services, and solutions with that of our partners to enable customers to adapt to, and profit from, the opportunities that open source and identity solutions bring to businesses. We contribute to the ecosystem by providing technology, programs, resources, and skills to create solutions and provide customers with the functionality and business value required to improve the bottom line results of their businesses.
At the beginning of fiscal 2007, we entered into a Business Collaboration Agreement, a Technical Collaboration Agreement, and a Patent Cooperation Agreement with Microsoft (“Microsoft Agreements”) that collectively were designed to build, market and support a series of new solutions to enhance the interoperability of our products with Microsoft’s products. The overarching purpose of our partnership with Microsoft is to increase the utility, customer value, and penetration of Linux by enabling its interoperation with Windows in a mixed environment that is easier to maintain and is supported by both us and Microsoft. We believe that our relationship with Microsoft has been, and will continue to be, successful in helping us deliver differentiated value to customers by giving them greater flexibility and effectiveness in their IT environments. The Business Collaboration Agreement with Microsoft enables Microsoft to distribute certificates that entitle customers to SLES support from us. The Technical Collaboration Agreement consists of several projects that improve the interoperability between various Microsoft and Open Source products. We believe that this partnership addresses pressing, industry-wide issues, puts customers’ needs first, and creates financial and strategic benefits.
In addition to our channel partnership with Microsoft, we have established global strategic alliances with Accenture Ltd. (“Accenture”), Affiliated Computer Services (“ACS”), Dell Inc. (“Dell”), Hewlett-Packard Co. (“HP”), International Business Machines Corporation (“IBM”), Intel Corporation, and SAP. Additional alliance partners include: Atos Origin S.A. (“Atos Origin”), Cap Gemini S.A. (“Cap Gemini”), Deloitte Touche Tohmatsu, Lenovo Group Limited, and Oracle Corporation (“Oracle”). These partners are members of our PartnerNet® Program and gain value through participating in different partner programs. Solution providers gain access to various marketing programs that help drive sales volumes. Technology partners receive solution developer toolkits and services that ensure successful enablement of their technology with our technology. Our training partners have opportunities to increase their skill levels and provide training services to our customers.
6
Table of Contents
NOVELL, INC.
BUSINESS (Continued)
Strategy (Continued)
Multi-channel Sales Strategy
We deliver solutions through direct channels, by serving large organizations directly, with systems integration partners, or through telemarketing or web sales. We also deliver solutions through indirect channels, serving small- and medium-sized organizations through our channel partners. Our business partner and channel relationships, together with our emphasis on specialization, provide us a greater presence in the marketplace while lowering our distribution costs. To maximize our reach while seeking to ensure the highest quality of service to our customers, we provide our channel partners pervasive access to our tools, training, and methodologies.
Personnel Development Strategy
We believe that our employees are our most significant asset. We work continuously to update their skill sets by providing education and training to improve their productivity. We regularly assess their development progress and focus on key areas as appropriate.
Acquisitions and Dispositions
We typically acquire companies or technologies after we determine that the related products or technologies are strategic or complementary to our current or future product offerings. For example, during November 2008, we acquired Managed Object Solutions, Inc. (“Managed Objects”), a provider of business services management software, and in February 2009, we acquired Fortefi Ltd., a United Kingdom-based company, and Fortefi Corporation, a Delaware corporation (collectively referred to as “Fortefi”), a supplier of an identity management solution that controls “super user” access rights.
As we determine that parts of our business are no longer strategic to us as a whole, or are not profitable, we will look for alternatives such as divestitures or other capital structures. For example, in April 2009, we sold our Chile subsidiary to one of our Latin America distribution partners as we determined that a distributor-led model would be a more profitable model to operate our businesses in that region.
Segment and Geographical Information
Segment and geographical disclosures for fiscal 2009, 2008, and 2007 are presented in Part II, Item 8, Note Y, “Segment Information,” of the notes to the consolidated financial statements of this report, which is incorporated by reference into this Part I, Item 1.
As our strategy continues to evolve, the way in which management views financial information to best evaluate performance and operating results may also change.
Product Development
We conduct product development activities throughout the world in order to meet the needs of our worldwide customer base. Our commitment to deliver world-class products means continued investment in product development. We also contract some product development activities to third-party developers.
In addition to technology developed in-house, our products also include technology developed by the open source community. Some of our product development engineers work as a part of open source development teams across the world. This involvement establishes our role in leading technical advances, developing new features, and influencing the timing of releases, as well as other information related to the development of Linux and other open source projects.
Product development expenses for fiscal 2009, 2008, and 2007 are discussed in Part II, Item 7 of this report, “Management’s Discussion and Analysis of Financial Condition and Results of Operations,” which is incorporated by reference into this Part I, Item 1.
7
Table of Contents
NOVELL, INC.
BUSINESS (Continued)
Sales and Marketing
We sell our software and services primarily to corporations, government entities, educational institutions, independent hardware and software vendors, resellers, and distributors both domestically and internationally. Our sales and marketing strategy targets customers seeking solutions in the following three focus areas: data center, end-user computing, and identity and security. Within these focus areas we currently market and sell eight distinctive solutions via multi-channel specialized sales and marketing models. Our partner ecosystem includes value added partners such as demand agents, vertical market resellers, systems integrator distributors, and OEMs who meet our criteria. We also sell directly to enterprise customers. We conduct sales and marketing activities and provide technical support, training, and field service to our customers from our 11 U.S. and 41 international sales offices.
Distributors. We have established a network of independent distributors who sell our products to resellers, value added resellers (“VARs”) and computer retail outlets.
VARs and Systems Integrators. We also sell directly to VARs and systems integrators who provide solutions across multiple vertical market segments and whose volume of purchases warrants buying directly from us.
OEMs/Independent Hardware Vendors (“IHVs”)/Independent Software Vendors (“ISVs”). We license subsets of products to domestic and international OEMs, IHVs, and ISVs for integration with their products and/or solutions.
End-User Customers. We have assembled worldwide field resources to work directly with enterprise end-users. Additionally, product upgrades and software maintenance are sold directly to end-users. Customers can also purchase products and services under license agreements through partners or resellers in or near their geographic locations.
Marketing Strategy. Our marketing strategy is to clearly articulate our value in the markets we serve, and in doing so, attract and retain satisfied customers. To do this, we employ multiple channels of communications to raise awareness, generate demand, and provide tools for our multi-channel field sales and services organizations. We examine and select market opportunities that best fit our current product portfolio and solutions strengths. This includes researching geographic and industry markets, determining product life cycle maturity, and assessing competitive strategies. Our marketing strategy is driven by a key set of metrics that include the measurement of awareness across geographies, specific lead generation metrics, and deliverables to support the sales process. Our target marketing audience is the CIO and other senior IT executives responsible for key IT functions across the enterprise.
Marketing Initiatives. To more closely align our offerings with customer needs, we developed a series of strategic campaigns that address customer needs and align them with our capabilities. Specifically, our campaigns are focused on helping customers create a more agile data center, improve the productivity of their end-user computing environments, and create and maintain a trusted computing environment. Our marketing campaigns are based on our commitment to interoperability and our positioning of “Making IT Work As OneTM.” We believe this positioning best serves us in increasing our relevance to our customers.
Major Customers
No single customer accounted for more than 10% of our revenue in fiscal 2009, 2008, or 2007. During fiscal 2007, we received $355.6 million in cash payments from Microsoft related to the Microsoft Agreements discussed above, which we have been recognizing as revenue since the beginning of fiscal 2007. In fiscal 2008, Microsoft agreed to purchase up to $100 million of additional SLES certificates by January 1, 2012. Payment will be made in $25 million increments as the certificates are distributed. We received the first $25 million payment in November 2008. Only this first $25 million payment is nonrefundable.
Manufacturing Suppliers
Our physical products, which consist primarily of discs, manuals, our openSUSE Linux box product, and PlateSpin’s “Forge” product, are duplicated and manufactured by outside vendors. Multiple high-volume manufacturers are available, though we currently utilize only one manufacturer for each of these products. We do not rely on a single provider for our raw materials, nor have we encountered problems with our existing manufacturing suppliers. Total sales of our physical products represent less than 1% of recognized revenue in fiscal 2009.
8
Table of Contents
NOVELL, INC.
BUSINESS (Continued)
Backlog
Lead times for our products are relatively short. Consequently, we do not believe that backlog is a reliable indicator of future revenue or earnings. Our practice is to ship products promptly upon the receipt of purchase orders from our customers and, therefore, backlog is not significant. Because much of the revenue we invoice is deferred and recognized over time, we consider invoicing, or bookings, to be a key indicator of current sales force performance and future revenue performance.
We have a significant amount of deferred revenue recorded on our consolidated balance sheets, the majority of which relates to maintenance and subscription contracts which is recognized ratably over the related service periods, typically one to three years, and does not pertain to unshipped product. Deferred revenue related to the Microsoft Agreements is recognized ratably over various related service periods, which can extend up to five years.
Competition
The market for all of our business unit segments is highly competitive and subject to rapid technological change. We expect competition to continue to increase both from existing competitors and new market entrants. We believe that competitive factors common to all of our segments include the following:
| • | our ability to preserve our traditional customer base; |
| • | our ability to sell overall solutions comprised of products and services provided by us and our partners; |
| • | the timing and market acceptance of new solutions developed by us and our competitors; |
| • | brand and product awareness; |
| • | the ability of Linux and open source solutions to provide a lower total cost of ownership; |
| • | the ability of our suite of products and solution offerings to solve customer problems; |
| • | our ability to establish and maintain key strategic relationships with distributors, resellers, ISVs, and other partners; and |
| • | the pricing of our products and services and the pricing strategies of our competitors. |
Primary competitors of our Identity and Security Management and Systems and Resource Management business unit segments include Microsoft, IBM, Sun Microsystems, Inc (“Sun”), Oracle, HP, Symantec (“Symantec”), BMC Software, Inc., VMware, Inc. (“VMware”) and Computer Associates (“CA”). Primary competitors for our Linux and platform services solutions include Microsoft and Red Hat, Inc. (“Red Hat”). The primary competitors for our Workgroup products are Microsoft and IBM.
One pervasive factor facing us and all companies doing business in our industry is the dominance of Microsoft. However, as previously discussed, in fiscal 2007, we entered into the Microsoft Agreements to build, market, and support a series of new solutions designed to make our products work better with Microsoft’s products. Under the Microsoft Agreements, Microsoft agreed to covenant with our customers not to assert its patents against our customers for their use of our products and services for which we receive revenue directly or indirectly, with certain exceptions, while we agreed to covenant with Microsoft’s customers not to assert our patents against Microsoft’s customers for their use of Microsoft products and services for which Microsoft receives revenue directly or indirectly, with certain exceptions. In addition, we and Microsoft each irrevocably released the other party, and its customers, from any liability for patent infringement arising prior to November 2, 2006, with certain exceptions. We will continue to compete with Microsoft, but through these agreements, Microsoft can serve as an important indirect source for our Linux sales.
Copyright, Licenses, Patents, and Trademarks
We rely on copyright, patent, trade secret, and trademark law, as well as provisions in our license, distribution, and other agreements to protect our intellectual property rights. Our portfolio of patents, copyrights, and trademarks as a whole is material to our business but no individual piece of intellectual property is critical to our business. We have what we consider to be valuable patents and have numerous other patents pending. No assurance can be given that the pending patents will be issued or, if issued, will provide protection for our competitive position. Notwithstanding our efforts to protect our intellectual property through contractual measures, unauthorized parties may still attempt to violate our intellectual property rights.
Our business includes a mix of proprietary offerings and offerings based on open source technologies. With respect to proprietary offerings, we perform the majority of our development efforts internally, but we also acquire and license technologies from third parties. No one license is critical to our business. Our open source offerings are primarily comprised of open source components
9
Table of Contents
NOVELL, INC.
BUSINESS (Continued)
Copyright, Licenses, Patents, and Trademarks (Continued)
developed by independent third parties over whom we exercise no control. The collective licenses to those open source technologies are critical to our business. If we are unable to maintain licenses to these third-party open source materials, our distribution of relevant offerings may be delayed until we are able to develop, license, or acquire replacement technologies. Such a delay could have a material adverse impact on our business.
In November 2005, Open Invention Network, LLC (“OIN”) was established by us, IBM, Koninklijke Philips Electronics N.V. (“Philips”), Red Hat and Sony Corporation (“Sony”). OIN is a privately-held company that has and is expected to continue to acquire patents to promote Linux and open source by offering its patents on a royalty-free basis to any company, institution or individual that agrees not to assert its patents against the Linux operating system or certain Linux-related applications. In addition, OIN, in its discretion, may enforce its patents to the extent it believes such action will serve to further protect and promote Linux and open source. In fiscal 2007, NEC Corporation became an investor in OIN, with the same rights, privileges and obligations as the original investors.
The software industry is characterized by frequent litigation regarding patent, copyright, and other intellectual property rights, and trends suggest that this may increase. From time to time, we have had infringement claims asserted by third parties against us and our products. While there are no known pending or threatened claims against us for which we expect to have an unsatisfactory resolution that would have a material adverse effect on our results of operations, financial condition or cash flow, there can be no assurance that such claims will not be asserted, or, if asserted, will be resolved in a satisfactory manner. In addition, there can be no assurance that third-parties will not assert other claims against us with respect to any third-party technology. In the event of litigation to determine the validity of any third-party claims, such litigation could result in significant expense to us and divert the efforts of our technical and management personnel, whether or not such litigation is determined in our favor.
In the event of an adverse result in any such litigation, we could be required to expend significant resources to develop non-infringing technology or to obtain licenses to the technology that was the subject of the litigation. There can be no assurance that we would be successful in such development or that any such licenses would be available.
In addition, the laws of certain countries in which our products are or may be developed, manufactured, or sold may not protect our products and intellectual property rights to the same extent as the laws of the United States.
Seasonality
All segments of our business often experience a higher volume of invoicing at the end of each quarter due to the spending cycles of our customers and the negotiation patterns typical in the software industry.
Corporate Information
Novell was incorporated in Delaware on January 25, 1983. Our headquarters and principal executive offices are located at 404 Wyman Street, Suite 500, Waltham, MA 02451. Our telephone number at that address is (781) 464-8000. We also have offices located in Provo, Utah, telephone number (801) 861-7000. Our website is www.novell.com.
Our Annual Report, Securities and Exchange Commission (“SEC”) filings, earnings announcements, and other financial information are available on our Investor Relations website URL at http://www.novell.com/ir. We make our annual, quarterly, and current reports, including any amendments to those reports, freely available on our website as soon as reasonably practicable after they are filed with or furnished to the SEC. This and other information that we file with or furnish to the SEC is also freely available on the SEC’s website at www.sec.gov. Mailed copies of these reports, including exhibits, can be obtained free of charge through our automated telephone access system at (800) 317-3195 or by e-mailing our investor relations department at irmail@novell.com. The information on our website, including the documents identified above, is not and should not be considered part of this Annual Report on Form 10-K and our website addresses are intended to be an inactive textual reference only.
10
Table of Contents
NOVELL, INC.
BUSINESS (Continued)
Employees
We currently have approximately 3,600 employees. None of our employees are represented by a labor union, and we consider our employee relations to be good.
Executive Officers of the Registrant
Set forth below are the names, ages, and titles of the persons currently serving as our executive officers.
| Name |
Age |
Position | ||
| Ronald W. Hovsepian |
48 |
President and Chief Executive Officer | ||
| John K. Dragoon |
49 | Senior Vice President and Chief Marketing Officer | ||
| James P. Ebzery (a) |
50 | Senior Vice President and General Manager, Security, Management and Operating Platforms | ||
| Dr. Jeffrey M. Jaffe (b) |
55 | Executive Vice President and Chief Technology Officer | ||
| Colleen A. O’Keefe (c) |
53 | Senior Vice President of Services | ||
| Russell C. Poole |
55 | Senior Vice President, Human Resources | ||
| Dana C. Russell |
48 | Senior Vice President and Chief Financial Officer | ||
| Scott N. Semel |
53 | Senior Vice President, General Counsel and Secretary | ||
| Joseph H. Wagner (d) |
49 | Senior Vice President and General Manager, Global Alliances |
| (a) | Title effective as of January 1, 2010. Mr. Ebzery’s current title is Senior Vice President and General Manager, Identity and Security Management Solutions. |
| (b) | Effective January 1, 2010, Dr. Jaffe’s title will be Strategic Advisor. |
| (c) | Effective January 1, 2010, Ms. O’Keefe’s title will be Senior Vice President and General Manager, Collaboration Solutions and Global Services. |
| (d) | Title effective as of January 1, 2010. Mr. Wagner’s current title is Senior Vice President and General Manager, Systems and Resource Management. |
Ronald W. Hovsepian
Ronald W. Hovsepian has served as one of our directors and as our President and Chief Executive Officer since June 2006. Mr. Hovsepian served as our President and Chief Operating Officer from October 2005 to June 2006. From May 2005 to November 2005, Mr. Hovsepian served as Executive Vice President and President, Worldwide Field Operations. Mr. Hovsepian joined us in June 2003 as President, Novell North America. Before joining us, Mr. Hovsepian was a Managing Director with Bear Stearns Asset Management, a technology venture capital fund, from February 2002 to December 2002. From March 2000 to February 2002, Mr. Hovsepian served as Managing Director for Internet Capital Group, a venture capital firm. Prior to that, Mr. Hovsepian served in a number of executive positions with IBM over an approximate 17-year period. Mr. Hovsepian is also the non-employee chairman of the Board of Directors of Ann Taylor Corporation.
John K. Dragoon
John K. Dragoon has served as our Senior Vice President and Chief Marketing Officer since March 2006. Mr. Dragoon joined us in October 2003 as Vice President, Worldwide Field Marketing. Prior to joining us, from April 2002 to September 2003, Mr. Dragoon was the senior vice president of marketing and product management at Art Technology Group, a provider of Internet commerce, service, and marketing solutions and from April 2001 to March 2003 served as vice president, operations, of Internet Capital Group, a venture capital firm. Prior to his tenure at Internet Capital Group, Mr. Dragoon served in a number of sales and marketing positions at IBM from 1984 to 2000.
11
Table of Contents
NOVELL, INC.
BUSINESS (Continued)
Executive Officers of the Registrant (Continued)
James P. Ebzery
James P. Ebzery was appointed Senior Vice President and General Manager, Security, Management and Operating Platforms in December 2009, effective January 2010. Prior to that, Mr. Ebzery served as our Senior Vice President & General Manager, Identity & Security Management business unit, from May 2007 to December 2009. Before joining us, Mr. Ebzery was President of the Viisage Division at L-1 Identity Solutions, a leading provider of advanced technology identity solutions, from January 2006 to May 2007. Mr. Ebzery was Senior Vice President of Sales and Marketing of Viisage, from November 2002 to January 2006. Prior to that, Mr. Ebzery served as vice president of operations for Internet Capital Group, a venture capital firm, from April 2000 to February 2002. In addition, Mr. Ebzery spent approximately 17 years at IBM in various sales, marketing, and general management roles.
Dr. Jeffrey M. Jaffe
Dr. Jeffrey M. Jaffe, our Executive Vice President and Chief Technology Officer, joined us in November 2005. From October 2001 to October 2005, Dr. Jaffe served as President of Bell Labs Research and Advanced Technologies. Prior to that, Dr. Jaffe held a variety of technical and management positions with IBM, most recently serving as general manager of IBM’s SecureWay business unit, where he was responsible for IBM’s security, directory, and networking software business. Effective January 1, 2010, Dr. Jaffe’s title will be Strategic Advisor.
Colleen A. O’Keefe
Colleen A. O’Keefe joined us in December 2006 as our Senior Vice President of Services to oversee our global technical support group, which provides onsite and remote support services, technical training services, and professional services to customers. Prior to joining us, from September 2002 to November 2006, Ms. O’Keefe held several key leadership positions at NCR Corporation in the Payment Solutions and Worldwide Services divisions. From September 1999 to March 2002, she served as senior vice president, Customer Services, at Global Crossing. In addition, Ms. O’Keefe served in a number of positions in the telecommunications industry, including 18 years at Southern New England Telephone and two years at AT&T. Effective January 1, 2010, Ms. O’Keefe will become our Senior Vice President and General Manager, Collaboration Solutions and Global Services.
Russell C. Poole
Russell C. Poole was appointed as our Senior Vice President, Human Resources in November 2009. Prior to that, Mr. Poole, served as our Vice President – Senior HR Partner in the Human Resources organization, from September 2007 to November 2009, providing valuable direction and leadership within Human Resources as well as partnering with the Sales and Services organizations. Mr. Poole served as our Vice President – Law – People from November 2002 to September 2007. Prior to joining us, Mr. Poole had also held various supervisory and management positions over a 20-year period in which he evaluated, managed, and resolved human resource, employment, benefit and transactional issues.
Dana C. Russell
Dana C. Russell has served as our Senior Vice President and Chief Financial Officer since February 2007. Prior to that, Mr. Russell served as our Vice President and Interim Chief Financial Officer from June 2006 to February 2007, and as Vice President of Finance from March 2000 to June 2006. Mr. Russell served as the Corporate Controller from June 2003 to June 2006, and was also the Treasurer from December 2005 to June 2006. Mr. Russell joined us in 1994. Prior to joining us, Mr. Russell worked at Price Waterhouse in Salt Lake City. Mr. Russell is a CPA licensed in the State of Utah.
12
Table of Contents
NOVELL, INC.
BUSINESS (Continued)
Executive Officers of the Registrant (Continued)
Scott N. Semel
Scott N. Semel joined us in September 2008 as our Senior Vice President, General Counsel and Secretary and from April 2009 to November 2009, also served as our interim Senior Vice President, Human Resources. Prior to joining us, Mr. Semel was Chief Legal Officer and Corporate Secretary at Tele Atlas N.V., a Dutch Euronext company, from late 2006 to June 2008. Mr. Semel also engaged in the private practice of law with GTC Law Group LLC, a boutique law firm that specializes in IP strategy, mergers and acquisitions, and business and technology transactions, during 2006. Mr. Semel served as Vice President, General Counsel and Secretary to Ascential Software Corporation, a NASDAQ listed company, from 2001 through April 2005, when Ascential was sold to IBM, after which Mr. Semel served as Associate General Counsel-Legal Transition Executive at IBM. Prior to that, he served as Vice President, General Counsel and Secretary to NaviSite, Inc., a NASDAQ listed company. Before that, he also served as general counsel to other public and private companies as well as the private practice of law.
Joseph H. Wagner
Joseph H. Wagner was appointed Senior Vice President and General Manager, Global Alliances in December 2009. Since 2005, Mr. Wagner served as Senior Vice President and General Manager of the Systems and Resource Management Business Unit. Previously Mr. Wagner was our Vice President of Global Operations responsible for the global field strategy, structure, incentives and productivity, customer operations, and the global partner organization. Mr. Wagner joined us in August 2003 as Vice President of North America Operations where he led the roll-out of the North America and global field model now in place. Before joining us, Mr. Wagner was Vice President of Transportation Solutions for Manhattan Associates and was the Sr. Vice President of Global Sales and Marketing at Logistics.com prior to their acquisition by Manhattan. Additionally, Mr. Wagner has held numerous sales, marketing and operational executive positions over a 20-year high technology career at Unitech Systems, Quantra Corporation and IBM.
We may not be able to attract and retain new customers through indirect sales, which may result in decreased or fluctuating revenue. In addition, our reliance on an indirect sales channel for the distribution of our products could adversely affect the sales of our products.
Our ability to attract and retain new customers and achieve significant revenue growth in the future will depend in large part on our ability to continue to establish and maintain strategic distribution and other collaborative relationships with industry-leading hardware manufacturers, distributors, software vendors and enterprise solutions providers such as Microsoft, SAP, ACS, Dell, HP, IBM, Cap Gemini, Atos Origin, Accenture and other third parties that are willing to recommend, design and implement solutions that include our products. These relationships create the potential to distribute our products to a much larger customer base than we would otherwise be able to reach through our direct sales and marketing efforts. We are currently investing, and plan to continue to invest, significant resources to develop these distribution relationships.
The reliance and the distribution of our products through indirect channel partners presents a number of special risks, including but not limited to:
| • | our ability to retain or attract a sufficient number of existing or future distribution partners; |
| • | our lack of control over the delivery of our products to end-users; |
| • | the ability of resellers and distributors to terminate their relationships with us on short notice; |
| • | the failure of our indirect channel partners to recommend, or continue to recommend, or support our products effectively or to release their products in which our products are embedded in a timely manner; |
| • | our inability to effectively manage conflicts between our indirect channel partners and the end-users of our products; |
| • | the impact of economic conditions or industry demand on our indirect channel partners; and |
| • | the failure of indirect channel partners to devote sufficient resources to marketing and supporting our products. |
Our inability to establish or maintain successful relationships with distribution partners could have a material adverse effect on our business, financial condition, and operating results. In addition, revenues derived from indirect channel partners may fluctuate significantly, which could have a material adverse effect on our business, financial condition, and operating results.
13
Table of Contents
NOVELL, INC.
RISK FACTORS (Continued)
If our Open Platform Solutions, Identity and Security Management and Systems and Resource Management business unit segments do not grow at the rates we anticipate, or if growth rates decline, our financial results, including cash flow, will be negatively impacted.
Our near-term growth strategy focuses on three business unit segments: Open Platform Solutions, Identity and Security Management, and Systems and Resource Management, with an emphasis on open source platforms. We have focused on these businesses because we believe that they represent the best current opportunity for us to profitably grow our revenue. Our ability to achieve success with this strategy is dependent on a number of factors including, but not limited to, the following:
| • | the growth of these markets; |
| • | our development of key products and upgrades; |
| • | delivery of product milestones in a timely manner; |
| • | the acceptance of our products particularly by enterprise companies, large industry partners and major accounts; |
| • | the decisions by customers to upgrade from older versions of our products to newer versions; and |
| • | the attractiveness of our products to current and future distribution partners. |
If any of these business unit segments do not grow at the rates we anticipate or decline, our business, financial condition, and operating results could be adversely affected.
Our inability to renew SLES subscriptions with those customers who have received SLES certificates from Microsoft, or renewals of such subscriptions at deeply discounted rates, or failure to maintain our channel partnership with Microsoft at historical levels, could adversely affect our future sales and profitability.
The Microsoft Agreements have been a significant contributor to our product revenue and the increase in our gross and operating margins over the past few years. Most of the Microsoft SLES certificate sales have been three-year arrangements that begin to expire in the first quarter of fiscal 2010. Accordingly, the ongoing financial benefit of the Microsoft Agreements will depend on our ability to renew SLES subscriptions with those customers who received SLES certificates from Microsoft and the pricing we are able to obtain in connection with such renewals. If we are unable to renew the SLES subscriptions as they expire, or if renewed subscriptions are at a lower price than Microsoft paid us for the SLES certificates, our financial results could be adversely affected. In addition, if Microsoft does not acquire additional SLES certificates, ceases to distribute SLES certificates, diminishes its marketing efforts in relation to SLES certificates, or significantly discounts SLES certificates upon distribution, our financial results could be adversely affected. There can be no assurance that Microsoft will continue to operate as a distribution partner for us, or that the channel partnership will be maintained at historical levels.
Microsoft also provides funding for development to enable interoperability between our respective platforms. There can be no assurance that Microsoft will continue to fund development efforts. If funding were reduced or terminated, the rate of interoperability development could be affected, which could adversely affect SLES revenues and our financial results.
Our OES and NetWare-related revenue stream may decline at accelerated rates which would adversely affect our business, operating results and cash flow.
Sales of our OES and NetWare-related products have been declining for many years and declines at accelerated rates could offset or out-pace any growth in sales of our other products. We have announced our intention to terminate general support of our NetWare products effective in March 2010. While customers will be eligible to receive extended support for NetWare, some NetWare customers may migrate to a competing platform which would negatively impact our revenue. Our strategy is to stabilize these sales declines to the extent practicable with new product releases and other efforts; however, combined OES and NetWare-related software licenses, and maintenance and subscriptions revenue declined by $28.1 million, or 14%, in fiscal 2009, compared to fiscal 2008. If our strategy is unsuccessful, our combined OES and NetWare-related revenue stream may decline more rapidly than any growth of other revenue streams from our other products, which could have a material adverse effect on our business, financial condition, and operating results.
If we are unable to develop new and enhanced products and services that achieve widespread market acceptance, or if we are unable to continually improve the performance, features, and reliability of our existing products and services or adapt our business model to keep pace with industry trends, our business and operating results would be adversely affected.
14
Table of Contents
NOVELL, INC.
RISK FACTORS (Continued)
Our success depends on our ability to respond to the rapidly changing needs of our customers by developing or introducing new products, product upgrades, and services on a timely basis. We have in the past incurred, and will continue to incur, significant research and development expenses as we strive to remain competitive. New product development and introduction involves a significant commitment of time and resources and is subject to a number of risks and challenges including:
| • | managing the length of the development cycle for new products and product enhancements, which has frequently been longer than we originally estimated; |
| • | adapting to emerging and evolving industry standards and to technological developments by our competitors and customers; |
| • | entering into new or unproven markets with which we have limited experience; |
| • | shifting our skill set to new strategic areas; |
| • | managing new product and service strategies; |
| • | incorporating acquired products and technologies; and |
| • | developing or expanding efficient sales channels. |
If we are not successful in managing these risks and challenges, or if our new products, product upgrades, and services are not technologically competitive or do not achieve market acceptance, our business and operating results would be adversely affected.
The success of our recently-announced Intelligent Workload Management strategy is contingent upon the realization and development of the IWM market.
Our IWM strategy is intended to enable computing resources to be managed and optimized in a policy-driven, secure, and compliant manner across physical, virtual, and cloud environments. Although we have encountered interest in IWM-oriented products, the IWM market is nascent and developing. It is difficult to accurately predict the scale of the IWM market, the timing of development of the IWM market, and our ability to penetrate the IWM market. While we anticipate differentiable solutions that will be attractive to many customers within the IWM market, we are investing at an early stage and success in the IWM market, if achieved, would require time and resources. It is uncertain whether or when the IWM market will realize its potential, as well as the extent and timing of our impact within the IWM market. We also expect other enterprise software vendors to enter the IWM market with solutions that will directly compete with our offerings. Our ability to capture market share will depend on the relative timing of product offerings; capabilities, design and functionality of our products relative to products of our competitors; and strategic fit of our products within the IWM market.
Our software may have vulnerabilities, defects and errors, which may lead to a loss of revenue or product liability claims.
Software products are internally complex and occasionally contain defects or errors, especially when first introduced or when new versions or enhancements are released. Despite extensive testing, we may not detect defects or errors in our new products, platforms or product enhancements until after we have commenced commercial shipments. If defects or errors, including security flaws or incompatibilities, are discovered in our existing or acquired products, platforms or product enhancements, then potential customers may delay or forego purchases; our reputation in the marketplace may be damaged; we may incur additional service and warranty costs; and we may have to divert additional development resources to correct the defects or errors. If any or all of the foregoing occur, we may lose revenues or incur higher operating expenses and lose market share, any of which could severely harm our financial condition and operating results.
We have experienced, and may continue to experience, delays in the introduction of new products due to various factors, which results in lost revenue.
In the past, we have experienced delays in the introduction of new products due to a number of factors including: the complexity of software products, the need for extensive testing of software to ensure compatibility of new releases with a wide variety of application software and hardware devices, the need to ensure quality of products prior to extensive distribution, and with regard to our open source products, our continuing reliance on the work of third parties not employed by us. Our open source offerings depend to a large extent on the efforts of developers not employed by us for the creation and modification of open source technologies. For example, Linus Torvalds, the original developer of the Linux kernel, and a small group of engineers, many of whom are not employed by us, are primarily responsible for the development and evolution of the Linux kernel that is a key component of our OES and SUSE Linux Enterprise offerings. The timing and nature of new releases of the Linux kernel are controlled by these third parties. Delays in developing, completing, or shipping new or enhanced products could continue to result in delayed or reduced revenue for those products and could adversely impact customer acceptance of those offerings.
15
Table of Contents
NOVELL, INC.
RISK FACTORS (Continued)
Our inability to rely on software licensed from third parties, including open source contributions of third-party programmers and corporations would adversely affect our business and operating results.
We use various types of software licensed from unaffiliated third parties. Our open source offerings, for example, are primarily comprised of open source components developed by independent third parties over whom we exercise no control. The collective licenses to third-party technologies are critical to our business. If we are unable to maintain licenses to third-party materials, our distribution of relevant offerings may be delayed until we are able to develop, license, or acquire replacement technologies. Such a delay could have a material adverse impact on our business.
If key developers or a significant percentage of developers or corporations decide to cease development of the Linux kernel or other open source software, or if we are unable to maintain licenses to proprietary software or such software is no longer available to us on commercially reasonable terms, we would have to either rely on another party (or parties) to develop these technologies, develop them ourselves, or adapt our product strategy accordingly. This could increase our development expenses, delay our product releases and upgrades, and adversely impact customer acceptance of our relevant offerings.
In addition, we may be unable to predict the future course of open source technology development, which could impact the market appeal of our products as well as our reputation.
Because of the characteristics of open source software, there are few technology barriers to entry in the open source market by new competitors and it may be relatively easy for new competitors with greater resources than we have to enter our markets and compete with us.
One of the characteristics of open source software is that any open source licensee can modify the existing software or develop new software that competes with existing open source software. Such competition can develop without the degree of overhead and lead time required by traditional proprietary software companies. It is possible for new competitors with greater resources than ours to develop their own open source solutions, potentially reducing the demand for, and putting price pressure on, our solutions. In addition, some competitors make their open source software available for free download and use, or may position their open source software as a loss leader. We cannot guarantee that we will be able to compete successfully against current and future competitors or that competitive pressure and/or the availability of open source software will not result in price reductions, reduced operating margins and loss of market share, any one of which could seriously harm our business.
If our customers do not renew their maintenance and subscription agreements with us, our operating results may be adversely impacted.
Our customers may elect not to renew their maintenance and subscriptions for our service after expiration of their agreements. In addition, our customers may opt for a lower priced service option. Our customers’ renewal rates may decline or fluctuate as a result of a number of factors, including their level of satisfaction with our services and their ability to continue their operations and spending levels. Renewal rates may also decline as a result of elections by customers to use our products on an unsupported basis. If we experience a decline in the renewal rates for our customers or they opt for a lower priced service option or fewer subscriptions, our operating results may be adversely impacted.
Uncertain economic conditions and reductions in IT spending could adversely affect our business, financial condition, and operating results.
In the past, unfavorable or uncertain economic conditions have resulted in reduced global IT spending rates that have adversely affected the markets in which we do business. Accordingly, current and/or future weakness in the United States economy and/or in the economies of the other geographic regions in which we operate could have a negative impact on our revenues and operating results. For example, as a result of present company trends and continued economic uncertainty, management reduced its long-range revenue growth plans, resulting in the impairment of $270.0 million of goodwill in fiscal 2009 related to our Systems and Resource Management business unit segment. While we are unable to accurately predict changes in general economic conditions and how the current global financial and market conditions will affect global IT spending rates, we believe that there is the potential for a continued slowdown in global IT spending rates in the next few quarters. This could result in reductions in sales of our products, longer sales cycles, slower adoption of new technologies, and increased price competition. Any of these events would likely harm our business, financial condition, and operating results.
16
Table of Contents
NOVELL, INC.
RISK FACTORS (Continued)
We may not be able to successfully compete in a challenging market for infrastructure software services.
The industries in which we compete are highly competitive, and customer requirements evolve rapidly. We expect competition to continue to increase both from existing competitors and from new market entrants. Our competitors include, but are not limited to, Microsoft, Oracle, IBM, Sun, HP, Symantec, VMware, and CA. Our primary competitor in the Linux market is Red Hat. Many of our competitors have greater financial, technical and marketing resources than we have. We believe that competitive factors common to all of our segments include:
| • | the pricing of products and services as well as pricing strategies; |
| • | the availability of open source or free-ware alternatives; |
| • | the timing and market acceptance of new products; |
| • | brand and product awareness; |
| • | the performance, reliability and security of products; |
| • | the ability to preserve an existing customer base; |
| • | the impact of current macroeconomic conditions ; |
| • | the ability to establish and maintain key strategic relationships with distributors, resellers, and other partners; and |
| • | the ability to attract and retain highly qualified development, services, and managerial personnel. |
Our inability to maintain a strong brand could impact our future success.
We believe that the future success of our business depends on our ability to maintain and enhance our brand, and expand brand awareness into emerging strategic markets. If we fail to promote and maintain our brand, we may not be able to expand our customer base or attract talented employees, and our business, financial condition, and operating results could be materially and adversely affected.
Our inability to meet customer demand for technical support services could adversely affect our customer relationships.
We offer technical support services with many of our products. There may be situations where we are unable to respond adequately to accommodate short-term increases in customer demand for support services. We also may be unable to modify the format of our support services to compete with changes in support services provided by our competitors. Any failure to maintain adequate customer support could cause customer dissatisfaction, result in reduced sales of products and reductions in the renewals of software maintenance and support agreements, and, accordingly, have a material adverse affect on our business, financial condition, and operating results.
Our professional services clients may cancel or reduce the scope of their engagements with us on short notice.
If our clients cancel or reduce the scope of a professional services engagement, we may be unable to reassign our professionals to new engagements without delay. Because these expenses are relatively fixed, and because we establish the levels of these expenses well in advance of any particular quarter, cancellations or reductions in the scope of client engagements could result in the under-utilization of our professional services employees, leading to reduced profitability.
We are vulnerable to system failures, which could harm our reputation and business.
Although we have outsourced much of our internal IT services, we are still vulnerable to system failures. We rely on our technology infrastructure and outsourcing partner, among other functions, to sell our products and services, support our partners, fulfill orders and bill, collect and make payments. Our systems are vulnerable to damage or interruption from natural disasters, power loss, telecommunication failures, terrorist attacks, computer intrusions and viruses, computer denial-of-service attacks and other events. A significant number of our systems are not redundant, and our disaster recovery planning is not sufficient to address every eventuality. Our systems are also subject to break-ins, sabotage and intentional acts of vandalism by internal employees, contractors and third-parties. Despite any precautions we may take, such problems could result in, among other consequences, interruptions in our services, which could harm our reputation, business and financial condition. We do not carry business interruption insurance sufficient to protect us from all losses that may result from interruptions in our services as a result of system failures or to cover all contingencies.
17
Table of Contents
NOVELL, INC.
RISK FACTORS (Continued)
The success of our acquisitions is dependent on our ability to integrate personnel, operations, and technology, and if we are not successful, our financial and operating results may be adversely affected.
Achieving the benefits of acquisitions depends on the successful integration of personnel, operations and technology. The integration of acquisitions is subject to risks and requires significant expenditure of time and resources. During fiscal 2009, we made two acquisitions. The most recent acquisition was completed in February 2009. The challenges involved in integrating acquisitions include the following:
| • | obtaining synergies from the companies’ organizations and service and product offerings effectively and quickly; |
| • | bringing together marketing efforts so that the market receives useful information about the combined companies and their products; |
| • | coordinating sales efforts so that customers can do business easily with the combined companies; |
| • | integrating product offerings, technology, back office, human resources, and accounting and financial systems; |
| • | assimilating employees with diverse corporate cultural backgrounds into a common business culture revolving around our corporate strategy; and |
| • | retaining key officers and employees who possess the necessary skills and experience to quickly and effectively transition and integrate the businesses. |
Failure to effectively and timely complete the integration of acquisitions could materially harm the business and operating results of the combined companies. Furthermore, we may assume significant liabilities in connection with acquisitions and/or incur substantial accounting charges for restructuring and related expenses, the write-off of purchased in-process research and development, impairment of goodwill and intangible assets, and stock-based compensation expense. Using our cash for acquisitions may prevent us from pursuing other business opportunities. For example, during fiscal 2009 it was determined that $270.0 million of our goodwill, and $5.7 million of PlateSpin’s and $3.4 million of Managed Objects’ developed technology and customer relationship intangible assets were impaired.
The consolidation of our industry may adversely affect our acquisition program.
We believe that the software industry will continue to undergo considerable consolidation and changes during the next several years. This consolidation could increase the competition we face to acquire businesses and increase the prices we must pay for the businesses that we acquire. In response to this consolidation, we consider from time to time additional strategies to enhance stockholder value. In considering various strategies, we evaluate the consequences, including, among other things, the implications to our liquidity and capital structure, tax effects and accounting consequences, any of which could have a material adverse impact on our financial condition.
The risks associated with conducting a global business could adversely affect our results.
We are a global corporation with subsidiaries, offices and employees around the world and, as such, we face certain risks in doing business abroad that we do not face domestically. Risks inherent in transacting business internationally could negatively impact our operating results, including:
| • | costs and difficulties in staffing and managing international operations; |
| • | unexpected changes in regulatory requirements; |
| • | tariffs and other trade barriers; |
| • | difficulties in enforcing contractual and intellectual property rights; |
| • | longer payment cycles; |
| • | local political and economic conditions; |
| • | potentially adverse tax consequences, including restrictions on repatriating earnings and the threat of “double taxation”; and |
| • | fluctuations in foreign currency exchange rates, which can affect demand, increase our costs and affect our net income. |
Increasing our foreign research and development operations exposes us to risks that are beyond our control and could affect our ability to operate successfully.
In order to enhance the cost-effectiveness of our operations, we have shifted portions of our research and development operations to jurisdictions outside of the United States. The transition of even a portion of our research and development operations to a foreign
18
Table of Contents
NOVELL, INC.
RISK FACTORS (Continued)
country involves a number of logistical and technical challenges that could result in product development delays and operational interruptions, which could reduce our revenues and adversely affect our business. We may encounter complications associated with the set-up, migration and operation of business systems and equipment in expanded or new facilities. This could result in delays in our research and development efforts and otherwise disrupt our operations. If such delays or disruptions occur, they could damage our reputation and otherwise adversely affect our business, financial condition, and operating results.
We cannot be certain that any shifts in our operations to offshore jurisdictions will ultimately produce sustained cost savings. We cannot predict the extent of government support, availability of qualified workers, future labor rates, or monetary and economic conditions in any offshore location where we may operate.
The relocation of labor resources may have a negative impact on our existing employees, which could negatively impact our operations. In addition, we will likely be faced with competition in these offshore markets for qualified personnel, including skilled design and technical personnel, and we expect this competition to increase as other companies expand their operations offshore. If the supply of qualified personnel becomes limited due to increased competition or otherwise, it could increase our costs and employee turnover rates.
We may not be able to attract and retain qualified personnel because of the intense competition for qualified personnel in the software industry. Furthermore, the loss of certain key individuals could adversely affect our performance and could have material adverse affect on our business, financial condition, and operating results.
Our ability to maintain and enhance our competitive technological position depends, in large part, on our ability to attract and retain highly qualified development, services, and managerial personnel. Furthermore, our future success depends on the services and effectiveness of a number of key officers and employees, including our CEO. Competition for personnel of the highest caliber is intense in the software industry. The loss of the technical knowledge and industry expertise of certain key individuals could seriously impede our success. Moreover, the loss of these individuals, particularly to a competitor, some of which may be in a position to offer greater compensation, and any resulting loss of customers or market confidence could reduce our market share, diminish our brand and adversely affect our business. If we do not succeed in retaining and motivating our key employees, and attracting new key personnel, our business, its financial performance and our stock price may decline.
If third parties claim that we infringed their intellectual property, our ability to use some technologies and products could be limited and we may incur significant costs to resolve these claims.
Litigation regarding intellectual property rights is common in the software industry. We have from time to time received letters or been the subject of claims suggesting that we are infringing the intellectual property rights of others. In addition, we have faced and expect to continue to face from time to time disputes over rights and obligations concerning intellectual property, including with respect to third party proprietary and open source components. The cost and time of defending ourselves can be significant. If an infringement claim is successful, we and our customers may be required to obtain one or more licenses from third parties, and we may be obligated to pay or reimburse our customers for monetary damages. In such instances, we or our customers may not be able to obtain necessary licenses from third parties at a reasonable cost or at all, and may face delays in product shipment while developing or arranging for alternative technologies, which could adversely affect our operating results.
In the event claims for indemnification are brought for intellectual property infringement, we could incur significant expenses, thereby adversely affecting our operating results.
We indemnify customers against certain claims that our products, including open source components thereof, infringe the intellectual property rights of others. Although indemnification programs for proprietary software are common in our industry, indemnification programs that cover open source software are less so. In the event that we are required to indemnify our customers against claims for intellectual property infringement, we could incur significant expense reimbursing customers for their legal costs and, in the event those claims are successful, for damages.
Legal actions taken by claimants alleging intellectual property infringement could adversely affect our revenue and business plan if these legal actions cause a reduction in demand for our SUSE Linux and Ximian® products.
In January 2004, The SCO Group, Inc. (“SCO”) filed suit against us in Utah State Court and the case was later removed to the U.S. District Court in Utah (See Part II, Item 8, Note S, “Legal Proceedings,” in the consolidated financial statements). SCO’s complaint asserted ownership of UNIX copyrights and further alleged that our public statements and filings regarding the ownership of the
19
Table of Contents
NOVELL, INC.
RISK FACTORS (Continued)
copyrights in UNIX have harmed SCO’s business reputation and affected its efforts to protect its ownership interest in UNIX and UnixWare. In August 2007, the U.S. District Court granted us summary judgment against SCO, concluding that we retained ownership of the UNIX copyrights, and dismissed SCO’s claims against us. In August, 2009, the Tenth Circuit Court of Appeals issued an opinion that reversed in part and affirmed in part the Trial Court’s decision. If SCO is able to succeed on its claims before a jury, our future revenue and business plans associated with our SUSE Linux and Ximian products could be adversely affected.
We may not be able to protect our confidential information, and this could adversely affect our business.
We generally enter into contractual relationships with our employees and third parties to protect our confidential information. The misappropriation of our trade secrets or other proprietary information could harm our business. In addition, we may not be able to timely detect unauthorized use of our intellectual property and take appropriate steps to enforce our rights. In the event we are unable to enforce these contractual obligations and our intellectual property rights, our business could be adversely affected.
Litigation matters related to or arising out of our historical stock-based compensation practices could have a material adverse effect on our business, financial condition, operating results and cash flows.
As discussed in Part II, Item 8, Note S, “Legal Proceedings,” of this report, derivative actions were filed against us and our current and former officers and directors relating to our historical stock-based compensation practices. No assurance can be given regarding the outcomes of this litigation or any possible government actions relating to our historical stock-based compensation practices. The resolution of such matters may be time consuming and expensive, and may distract management from the conduct of our business. Furthermore, if we are subject to adverse findings in litigation actions, we could be required to pay damages or penalties or have other remedies imposed, which could harm our business, financial condition, operating results and cash flows.
Failure to maintain effective internal controls over financial reporting could have a material adverse effect on our business, operating results and stock price.
We must continue to document and test our internal controls over financial reporting in order to satisfy the requirements of Section 404 of the Sarbanes-Oxley Act of 2002, which requires an annual management assessment of the effectiveness of our internal controls over financial reporting and a report by our independent registered public accounting firm addressing this assessment. During the course of our documentation and testing we may identify deficiencies that we may not be able to remediate in time to meet the deadlines imposed by the Sarbanes-Oxley Act for continuing compliance with the requirements of Section 404. If we fail to maintain the adequacy of our internal controls, as such standards are modified, supplemented or amended from time to time, we and/or our independent registered public accounting firm may not be able to conclude at each fiscal year-end that we have effective internal controls over financial reporting in accordance with Section 404 of the Sarbanes-Oxley Act. In addition, we may incur increased costs in order to address the requirements of Section 404 and other provisions of the Sarbanes-Oxley Act, as well as other newly proposed or enacted rules of the SEC and the NASDAQ stock market. The extent and timing of incurrence of any such costs is difficult to predict. Moreover, effective internal controls, particularly those related to revenue recognition, are necessary for us to produce reliable financial reports and are important to helping prevent financial fraud. If, in any year, we and/or our independent registered public accounting firm cannot attest that we have effective internal controls over financial reporting in accordance with Section 404 of the Sarbanes-Oxley Act, our business and operating results could be harmed and result in a negative market reaction.
Our financial and operating results may fluctuate from quarter to quarter, which may cause the price of our common stock to decline.
Our financial and operating results may fluctuate from quarter to quarter due to a variety of factors including, but not limited to:
| • | the timing of orders from customers and shipments to customers; |
| • | the decisions of our current and future customers not to renew their subscription agreements with us; |
| • | the impact of foreign currency exchange rates on the price of our products in international locations; |
| • | the inability to respond to the decline in revenue through the distribution channel; and |
| • | the inability to deliver products that are satisfactory to our customers and distribution partners. |
In addition, we often experience a higher volume of revenue at the end of each quarter. Because of this, fixed costs that are not appropriate for prevailing revenue levels may not be detected until late in any given quarter and operating results could be adversely affected. Due to these factors or other unanticipated events, our financial and operating results in any one quarter may not be a reliable indicator of our future performance.
20
Table of Contents
NOVELL, INC.
RISK FACTORS (Continued)
During fiscal 2009 we recorded goodwill impairment charges of $270.0 million. If our goodwill or intangible assets become further impaired we may be required to record a significant charge to earnings.
Under generally accepted accounting principles, we review our intangible assets for impairment when events or changes in circumstances indicate the carrying value may not be recoverable. Goodwill is tested for impairment at least annually. In determining whether an asset is impaired, we must make assumptions regarding recoverability of costs, estimated future cash flows from the asset, intended use of the asset and other related factors. Fair values are estimated using the combination of a discounted cash flow methodology and a market analysis and weighting the results. Factors that may be considered a change in circumstances, indicating that the carrying value of our goodwill or amortizable intangible assets may not be recoverable, include a decline in stock price and market capitalization, reduced future cash flow estimates, and slower growth rates in our industry. We may be required to record a significant charge in our financial statements during the period in which any impairment of our goodwill or amortizable intangible assets is determined, negatively impacting our operating results. For more information on our goodwill impairment charge of $270.0 million recorded in fiscal 2009, see Part II, Item 8, Note K, “Goodwill and Intangible Assets” in the consolidated financial statements.
Changes to the estimates used in the analysis, including estimated future cash flows, could cause one or more of the business unit segments or indefinite-lived intangibles to be valued differently in future periods. It is at least reasonably possible that future analyses could result in additional material non-cash goodwill impairment charges.
Because we recognize revenue from maintenance and subscriptions over the term of the agreements, downturns or upturns in sales may not be immediately reflected in our operating results.
We recognize maintenance and subscription revenue from customers ratably over the term of their agreements, which are generally one to three years. As a result, much of the revenue we report in each quarter is deferred revenue from maintenance and subscription agreements entered into during previous quarters. Consequently, a decline in maintenance and/or subscriptions sales in any one quarter will not necessarily be fully reflected in the revenue in that quarter and will negatively affect our revenue in future quarters. In addition, we may be unable to adjust our cost structure to reflect this reduced revenue. Accordingly, the effect of significant downturns in sales and market acceptance of our products may not be fully reflected in our operating results until future periods. Our maintenance and subscription model also makes it difficult for us to rapidly increase our revenue through additional sales in any period, as revenue from new customers must be recognized over the term of the applicable agreement.
If we do not make effective use of our substantial cash resources, our financial results could suffer and the value of our common stock could decline.
Our ability to increase stockholder value is dependent, in part, on the effective use of our cash balance. We may use these funds to continue to operate our business, finance strategic acquisitions, execute corporate transactions, or repurchase shares of our common stock. We cannot ensure that any of these measures will be executed, or that such measures will improve our financial results or increase stockholder value.
We may experience risks in our investments due to changes in the market, which could adversely affect the value or liquidity of our investments.
At October 31, 2009, we had $983.5 million in cash, cash equivalents and short-term investments. We maintain a portfolio of cash equivalents and short-term and long-term investments in a variety of securities that may include commercial paper, certificates of deposit, money market funds and government debt securities. These available-for-sale investments are subject to interest rate risk, credit risk, and general market risk and may decline in value.
During fiscal 2009, we recorded other-than-temporary impairment charges on our Auction Rate Securities (“ARSs”) of $5.5 million, based on our assessment that it is likely that the fair value of the ARSs will not fully recover in the foreseeable future, given a combination of factors, including the duration, severity and continued declining trend of the fair value of these securities as well as a deterioration in some of the securities’ credit ratings. During fiscal 2008, we recorded an other-than-temporary impairment charge of $28.7 million. We consider all of our other-than-temporary losses to be credit losses and therefore these losses have been recorded in the “Impairment of investments” line item in our consolidated statements of operations. We estimated that the fair market value of these securities at October 31, 2009 and October 31, 2008 was $10.3 million and $11.1 million, respectively. During fiscal 2009, we sold two of our ARSs for $0.3 million. These two securities had an aggregate cost basis of $10.0 million and had been entirely impaired prior to the sale. Late in fiscal 2009, our remaining six ARSs had improvements in their estimated fair value resulting in a $4.7 million unrealized gain. At October 31, 2009, the original cost of the remaining ARSs was $29.8 million.
21
Table of Contents
NOVELL, INC.
RISK FACTORS (Continued)
As noted above, our investments are subject to general credit, liquidity, market and interest rate risks. As a result, we may experience further reductions in value or loss of liquidity of our investments. In addition, should any investment cease paying or reduce the amount of interest paid to us, our interest income would suffer. These market risks associated with our investment portfolio could have a material adverse effect on our business, financial condition, and operating results.
We have real estate lease commitments for unoccupied space and restoration obligations, and if we are unable to sublet this space on acceptable terms our operating results and financial condition could be adversely affected.
We are party to real estate leases worldwide for a total of approximately 634,000 square feet. At October 31, 2009, we actively utilized approximately 95% of this space, or 602,000 square feet. We own 995,000 square feet of office space. At October 31, 2009, approximately 19%, or 213,000 square feet of our owned space is currently unoccupied. Approximately 17% or 165,000 square feet of the owned space is sublet to a third party.
Our stock price may be volatile in the future, and the stock price may decline.
The market price of our common stock has experienced significant fluctuations in the past and may continue to fluctuate in the future. The market price of our common stock may be affected by a number of factors, including:
| • | announcements of quarterly operating results and revenue and earnings forecasts by us that fail to meet or be consistent with our earlier projections or the expectations of our investors or securities analysts; |
| • | announcements by either our competitors or our customers that fail to meet or be consistent with their earlier projections or the expectations of our investors or securities analysts; |
| • | rumors, announcements, or press articles regarding our, or our competitors’ operations, management, organization, financial condition, or financial statements; |
| • | changes in revenue and earnings estimates by us, our investors, or securities analysts; |
| • | accounting charges, including charges relating to the impairment of goodwill, intangible assets or other assets; |
| • | announcements of planned acquisitions or dispositions by us or by our competitors; |
| • | announcements of new or planned products by us, our competitors, or our customers; |
| • | gain or loss of a significant customer or partner; |
| • | the inception of, or material developments in relation to, litigation initiated by us or brought against us; |
| • | inquiries by the SEC, NASDAQ, law enforcement, or other regulatory bodies; |
| • | acts of terrorism, the threat of war, and other crises or emergency situations; and |
| • | economic slowdowns or the perception of an oncoming economic slowdown in any of the major markets in which we operate. |
The stock market in general, and the market prices of stocks of technology companies in particular, have experienced extreme price volatility that has adversely affected, and may continue to adversely affect, the market price of our common stock.
Item 1B. Unresolved Staff Comments
None.
In the U.S., we own approximately 887,000 (and occupy approximately 534,000) square feet of office space on 51 acres in Provo, Utah. We use that space for administrative offices and a product development center. We are consolidating our occupancy on the Provo campus and are currently marketing 475,000 square feet of space for sale or lease. We also have other facilities for warehouse space in and around Provo for operational support. Our corporate headquarters and principal executive offices in Waltham, Massachusetts are leased. We lease offices that host sales, support and/or product development activity in Arkansas, Georgia, Illinois, Michigan, New York, and Virginia.
Internationally, we own office buildings in the United Kingdom and South Africa. We use these office buildings for sales, support and administrative offices.
22
Table of Contents
NOVELL, INC.
PROPERTIES (Continued)
We lease and occupy a shared service center in Dublin, Ireland and product development centers in Toronto, Canada; Nuremberg, Germany; Prague, Czech Republic; Bangalore, India; and Beijing, China. In addition, each of our subsidiaries in Australia, Belgium, Brazil, China, Denmark, France, Germany, India, Italy, Japan, Netherlands, New Zealand, Portugal, Singapore, South Africa, Spain, Sweden, Switzerland, Taiwan, and United Kingdom leases a small facility used as sales and support offices.
The terms of the above leases vary from month-to-month to up to 20 years. We believe that our existing facilities are adequate to meet our current requirements and we anticipate that suitable additional or substitute space will be available, as necessary, upon reasonable terms.
Incorporated by reference to Part II, Item 8, Note S, “Legal Proceedings,” of this report.
Item 4. Submission of Matters to a Vote of Security Holders
No matters were submitted to a vote of security holders during the fourth quarter of the fiscal year covered by this report.
23
Table of Contents
NOVELL, INC.
Item 5. Market for Registrant’s Common Equity, Related Stockholder Matters, and Issuer Purchases of Equity Securities
Our common stock trades on the NASDAQ Global Select Market under the symbol “NOVL.” The following chart sets forth the high and low sales prices of our common stock during each quarter of the last two fiscal years:
| First Quarter |
Second Quarter |
Third Quarter |
Fourth Quarter | |||||||||
| Fiscal 2009 |
||||||||||||
| High |
$ | 4.86 | $ | 4.54 | $ | 4.98 | $ | 4.85 | ||||
| Low |
$ | 3.43 | $ | 2.97 | $ | 3.70 | $ | 4.06 | ||||
| Fiscal 2008 |
||||||||||||
| High |
$ | 7.59 | $ | 7.59 | $ | 7.10 | $ | 6.62 | ||||
| Low |
$ | 5.96 | $ | 5.29 | $ | 5.34 | $ | 3.80 | ||||
No dividends have been declared on our common stock. We have no current plans to pay dividends on our common stock, and currently intend to retain our earnings for use in our business. We had 6,591 stockholders of record at November 30, 2009.
Issuances of Unregistered Common Stock
Not Applicable
Issuer Purchases of Equity Securities
The following table presents information regarding purchases of shares of our common stock pursuant to our share repurchase program during the three months ended October 31, 2009.
| (In thousands, except per share amounts)
Period |
Total number of shares purchased |
Average price paid per share |
Total number of shares purchased as part of publicly announced plans or programs |
Maximum dollar value of shares that may yet be purchased under the plans or programs | ||||||
| August 1, 2009 through August 31, 2009 |
123 | $ | 4.66 | — | $ | 33,180 | ||||
| September 1, 2009 through September 30, 2009 |
25 | 4.47 | — | 33,180 | ||||||
| October 1, 2009 through October 31, 2009 |
16 | 4.20 | — | 33,180 | ||||||
| Total |
164 | $ | 4.59 | — | $ | 33,180 | ||||
The total number of shares purchased was for shares surrendered to us to satisfy tax withholding obligations in connection with our equity plans.
During fiscal 2008, our Board of Directors authorized the repurchase of up to $100 million of our outstanding common stock. There is no fixed termination date for the repurchase program. There were no repurchases under the program during fiscal 2009. As of October 31, 2009, $33.2 million remains available to be used for repurchasing our common stock under the current Board authorization.
24
Table of Contents
NOVELL, INC.
MARKET FOR REGISTRANT’S COMMON EQUITY, RELATED STOCKHOLDER MATTERS,
AND ISSUER PURCHASES OF EQUITY SECURITIES (Continued)
Performance Graph
The following graph compares the total return on a cumulative basis, assuming the reinvestment of dividends, of $100 invested on October 31, 2004 in our common stock, the Standard & Poor’s 500 Composite Stock Price Index, and the Dow Jones U.S. Software Index. The comparisons in the graph below are based upon historical data and are not indicative of, nor intended to forecast, future performance of our common stock.
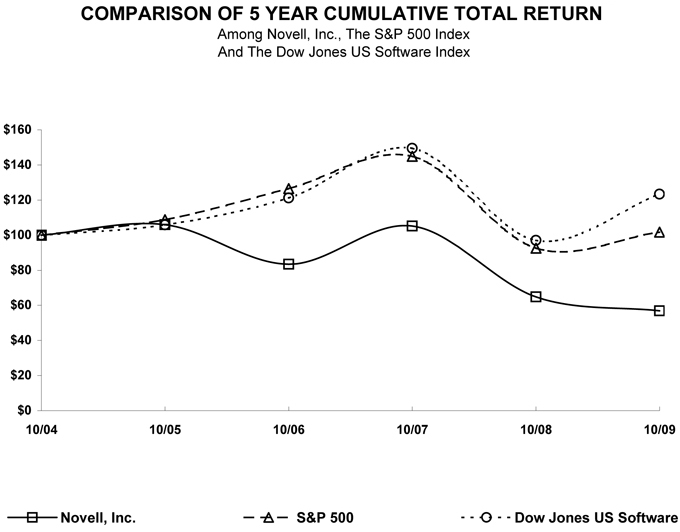
| Base Period 2004 |
Indexed/Cumulative Returns Fiscal Year Ended October 31, | ||||||||||||
| Company/Index Name |
2005 | 2006 | 2007 | 2008 | 2009 | ||||||||
| Novell, Inc. |
$ | 100 | 105.98 | 83.45 | 105.15 | 64.81 | 56.88 | ||||||
| S&P 500 Index |
$ | 100 | 108.72 | 126.49 | 144.90 | 92.60 | 101.68 | ||||||
| Dow Jones U.S. Software |
$ | 100 | 105.84 | 121.16 | 149.48 | 97.04 | 123.36 | ||||||
25
Table of Contents
NOVELL, INC.
SELECTED FINANCIAL DATA
Item 6. Selected Financial Data
The following selected historical consolidated financial data should be read in conjunction with “Management’s Discussion and Analysis of Financial Condition and Results of Operations” and our audited consolidated financial statements and related notes to those statements included in this report. The selected historical consolidated financial data for the periods presented have been derived from our audited consolidated financial statements.
| Fiscal Year Ended October 31, | |||||||||||||||||||
| 2009 (a) | 2008 | 2007 | 2006 (b) | 2005 (c) | |||||||||||||||
| (In thousands, except per share data) | |||||||||||||||||||
| Statements of operations |
|||||||||||||||||||
| Net revenue (d) |
$ | 862,185 | $ | 956,513 | $ | 932,499 | $ | 919,331 | $ | 986,149 | |||||||||
| Gross profit (d) |
675,354 | 721,274 | 674,180 | 638,319 | 678,909 | ||||||||||||||
| (Loss) income from operations (d) |
(206,492 | ) | 4,776 | (55,768 | ) | (42,194 | ) | 423,611 | |||||||||||
| (Loss) income from continuing operations before taxes |
(203,974 | ) | 22,878 | 8,415 | 27,180 | 457,423 | |||||||||||||
| Income tax expense |
10,666 | 35,217 | 34,691 | 22,642 | 86,612 | ||||||||||||||
| (Loss) income from continuing operations |
(214,640 | ) | (12,339 | ) | (26,276 | ) | 4,538 | 370,811 | |||||||||||
| Income (loss) from discontinued operations, net of taxes |
1,904 | 3,594 | (18,184 | ) | 15,015 | 5,911 | |||||||||||||
| (Loss) income before accounting change |
(212,736 | ) | (8,745 | ) | (44,460 | ) | 19,553 | 376,722 | |||||||||||
| Cumulative effect of accounting change, net of tax (e) |
— | — | — | (897 | ) | — | |||||||||||||
| Net (loss) income |
(212,736 | ) | (8,745 | ) | (44,460 | ) | 18,656 | 376,722 | |||||||||||
| (Loss) income from continuing operations, diluted |
$ | (214,640 | ) | $ | (12,339 | ) | $ | (26,276 | ) | $ | 4,332 | $ | 372,708 | ||||||
| Net (loss) income available to common stockholders, diluted |
$ | (212,736 | ) | $ | (8,745 | ) | $ | (44,460 | ) | $ | 18,220 | $ | 378,159 | ||||||
| (Loss) income from continuing operations per common share, diluted |
$ | (0.62 | ) | $ | (0.04 | ) | $ | (0.08 | ) | $ | 0.01 | $ | 0.85 | ||||||
| Net (loss) income per common share, diluted |
$ | (0.62 | ) | $ | (0.02 | ) | $ | (0.13 | ) | $ | 0.05 | $ | 0.86 | ||||||
| Balance sheet |
|||||||||||||||||||
| Cash, cash equivalents and short-term investments |
$ | 983,465 | $ | 1,067,847 | $ | 1,857,637 | $ | 1,466,287 | $ | 1,654,904 | |||||||||
| Working capital |
549,521 | 486,059 | 1,332,218 | 1,075,580 | 1,284,901 | ||||||||||||||
| Total assets |
1,902,908 | 2,269,349 | 2,854,394 | 2,449,723 | 2,761,858 | ||||||||||||||
| Senior convertible debentures |
— | 125,668 | 600,000 | 600,000 | 600,000 | ||||||||||||||
| Series B Preferred Stock |
— | — | — | 9,350 | 9,350 | ||||||||||||||
| Total stockholders’ equity (f) |
$ | 934,522 | $ | 1,087,528 | $ | 1,158,326 | $ | 1,104,650 | $ | 1,386,486 | |||||||||
| (a) | In the fourth quarter of fiscal 2009, we recognized goodwill and intangible asset impairment charges of $279.1 million (see Note K, “Goodwill and Intangible Assets” in the consolidated financial statements contained in this report). |
| (b) | In the first quarter of fiscal 2006, we adopted new stock-based accounting rules, which required us to record compensation expenses related to stock awards. For fiscal 2009, 2008, 2007 and 2006, compensation expense related to stock awards totaled $25.9 million, $33.8 million, $34.3 million and $35.3 million, respectively. Fiscal 2005 was not restated to include such expense. |
| (c) | In the first quarter of fiscal 2005, we recognized a gain of $447.6 million on a litigation settlement with Microsoft to settle potential anti-trust litigation. |
| (d) | Net revenue, gross profit and (loss) income from operations for all periods presented excludes the results of divested subsidiaries that were classified as discontinued operations (see Note D, “Divestitures,” in the consolidated financial statements contained in this report). |
| (e) | In May 2006, we adopted accounting rules for asset retirement obligations that required us to recognize the cumulative effect of initially applying these rules as a change in accounting principle. |
| (f) | In accordance with the provisions of Staff Accounting Bulletin No. 108, we decreased beginning retained earnings at November 1, 2005 by approximately $19.2 million, from $984.1 million to $964.9 million, with the offset to additional paid-in capital, to record a cumulative after-tax stock-based compensation expense that should have been recognized in the consolidated financial statements during the period 1997 through 2005 as a result of our internal review of stock-based compensation expense practices. Had the stock-based compensation expense been recognized in each of the years during that period, net income would have been reduced by $0.2 million in fiscal 2005. |
We decreased beginning retained earnings at November 1, 2007 by $1.4 million as part of our implementation of new rules for accounting for uncertainty in income tax reserves.
26
Table of Contents
NOVELL, INC.
MANAGEMENT’S DISCUSSION AND ANALYSIS OF
FINANCIAL CONDITION AND RESULTS OF OPERATIONS
Item 7. Management’s Discussion and Analysis of Financial Condition and Results of Operations
Overview
During fiscal 2009, total revenue decreased 10% compared to fiscal 2008. Foreign currency exchange rate fluctuations unfavorably impacted revenue by 2% in fiscal 2009, compared to fiscal 2008. The lower total revenue for fiscal 2009 reflected lower services revenue of 31%, and lower product revenue of 6%, compared to fiscal 2008. The lower services revenue is due in part to our strategic initiative of focusing our services business on driving more profitable product revenue while leveraging our services capabilities internally and through third-party partners. The lower product revenue for fiscal 2009, compared to fiscal 2008, was primarily a result of lower software licenses revenue, which declined across all business unit segments. The lower software licenses revenue reflected the impact of the slowing economy, which affected our industry more severely in fiscal 2009 than in fiscal 2008. In general, despite challenges posed by the current economic climate, maintenance and subscriptions revenue increased in all business unit segments except Workgroup.
Below is a brief summary of the revenue results in fiscal 2009 for each of our four business unit segments compared to fiscal 2008:
| • | Within our Open Platform Solutions business unit segment, total revenue increased 13%, reflecting strong growth in our Linux Platform Products category. |
| • | Within our Identity and Security Management business unit segment, total revenue decreased 19%, reflecting lower software licenses and services revenues. |
| • | Within our Systems and Resource Management business unit segment, total revenue decreased 6%, reflecting lower software licenses and services revenues. During fiscal 2009, revenue from the PlateSpin and Managed Objects acquisitions was $26.0 million. In fiscal 2008 revenue from our PlateSpin acquisition was $15.5 million. |
| • | Within our Workgroup business unit segment, total revenue decreased 16%, reflecting lower software licenses, maintenance and subscriptions, and services revenues. |
During fiscal 2009, total services revenue decreased 31%, compared to fiscal 2008. Our services offerings are focused on supporting product sales, not generating stand-alone revenue or profits, which is in line with our strategic initiative of focusing our services business on driving more profitable product revenue while leveraging our services capabilities internally and through third-party partners. Our prior strategy positioned our services offerings less as an enabler of software sales, and more as an independent and unrelated direct revenue initiative. We shifted our services strategy and positioning in fiscal 2008, with an intended gradual implementation. As a result of this, we have seen a general decline in our services revenue in fiscal 2009 compared to fiscal 2008. Services revenues were also impacted by the economic climate as customers reduced their discretionary spending.
Because much of the revenue we invoice is deferred and recognized over time, we consider invoicing, or bookings, to be a key indicator of current sales performance and future revenue performance. Overall invoicing was lower in all of our business unit segments for fiscal 2009 compared to fiscal 2008, largely as a result of the economic climate as customers focused on capital conservation and expense management. These factors have led to projects being delayed or reduced in scope, and have resulted in extended sales cycles for our customers. While we expect these trends to continue in the near term, the fundamental markets that we serve and the value we bring to those markets remain attractive. We believe that the current customer focus on reducing cost, complexity and risk is aligned with our overall value proposition. Additionally, the recent financial turmoil demands stricter requirements for regulation and audit, creating the potential for expanded opportunities for certain of our products.
The increase in gross profit as a percentage of revenue from 75% in fiscal 2008 to 78% in fiscal 2009 reflected the benefits of our cost reduction initiatives, including prior restructuring actions, and the benefits of realigning our services business to be more efficient and product focused, resulting in a shift to higher-margin product revenue. Total gross profit was lower in fiscal 2009 compared to fiscal 2008, due primarily to the 10% decrease in total net revenue.
In fiscal 2009, we recorded goodwill and intangible asset impairment charges of $270.0 million and $9.1 million, respectively, related to our Systems and Resource Management business unit segment. As a result of these charges, we reported an operating margin for fiscal 2009 of negative 24%, which compares to just above break even in fiscal 2008. The goodwill and intangible asset impairment charges were 32% of revenue.
27
Table of Contents
NOVELL, INC.
MANAGEMENT’S DISCUSSION AND ANALYSIS OF
FINANCIAL CONDITION AND RESULTS OF OPERATIONS (Continued)
Overview (Continued)
During fiscal 2009, we recorded net restructuring expenses of $25.2 million. This was comprised of $13.9 million from the completion of the restructuring plan that we began implementing in the fourth quarter of fiscal 2006, $10.2 million under our current restructuring plan, which we implemented in the third and fourth quarters of fiscal 2009 in response to current economic conditions, and $1.1 million for increases to accruals for changes in estimates related to prior year restructuring activities.
Critical Accounting Policies
An accounting policy is deemed to be critical if it requires us to make an accounting estimate based on assumptions about matters that are uncertain at the time an accounting estimate is made, and if different estimates that reasonably could have been used or changes in the accounting estimate that are reasonably likely to occur periodically could materially change the financial statements. We consider accounting policies related to revenue recognition and related reserves, impairment of long-term assets, valuation of deferred tax assets, loss contingency accruals and restructurings, and share-based payments to be critical accounting policies due to the judgments and estimation processes involved in each.
Revenue Recognition and Related Reserves
Our revenue is derived primarily from the sale of software licenses, software maintenance, subscriptions of SLES, technical support, training, and professional services. Our customers include: distributors, who sell our products to resellers and VARs; OEMs, who integrate our products with their products or solutions; VARs, who provide solutions across multiple vertical market segments which usually include services; and end-users, who may purchase our products and services directly from us or from other partners or resellers. Except for our SUSE Linux product, distributors do not order to stock and only order products when they have an end customer order. With respect to our SUSE Linux product, distributors place orders and the product is then sold to end customers principally through the retail channel. OEMs report the number of copies duplicated and sold via an activity or royalty report. Software maintenance, technical support, and subscriptions of SLES typically involve one- to three-year contract terms. Our standard practice is to provide customers with a 30-day general right of return. Such return provision allows for a refund and/or credit of any amount paid by our customers.
When an arrangement does not require significant production, modification, or customization of software or does not contain services considered to be essential to the functionality of the software, revenue is recognized when the following four criteria are met:
| • | Persuasive evidence of an arrangement exists — We require evidence of an agreement with a customer specifying the terms and conditions of the products or services to be delivered typically in the form of a signed contract or statement of work accompanied by a purchase order. |
| • | Delivery has occurred — For software licenses, delivery takes place when the customer is given access to the software programs via access to a website or shipped medium. For services, delivery takes place as the services are provided. |
| • | The fee is fixed or determinable — Fees are fixed or determinable if they are not subject to cancellation or other payment terms that exceed our standard payment terms. |
| • | Collection is probable — We perform a credit review of all customers with significant transactions to determine whether a customer is creditworthy and collection is probable. Prior credit history with us, credit reports, financial statements, and bank references are used to assess creditworthiness. |
In general, revenue for transactions that do not involve software customization or services considered essential to the functionality of the software is recognized as follows:
| • | Software fees for our SUSE Linux product are recognized when the product is sold to an end customer; |
| • | Software license fees for sales through OEMs are recognized upon receipt of license activity or royalty reports; |
| • | All other software license fees are recognized upon delivery of the software; |
| • | Software maintenance, technical support, and subscriptions of SLES are recognized ratably over the contract term; and |
| • | Professional services, training and other similar services are recognized as the services are performed. |
If the fee due from the customer is not fixed or determinable, revenue is recognized as payments become due from the customer. If collection is not considered probable, revenue is recognized when the fee is collected. We record provisions against revenue for
28
Table of Contents
NOVELL, INC.
MANAGEMENT’S DISCUSSION AND ANALYSIS OF
FINANCIAL CONDITION AND RESULTS OF OPERATIONS (Continued)
Critical Accounting Policies (Continued)
estimated sales returns and allowances on product and service-related sales in the same period as the related revenue is recorded. We also record a provision to operating expenses for bad debts resulting from customers’ inability to pay for the products or services they have received. These estimates are based on historical sales returns and bad debt expense, analyses of credit memo data, and other known factors, such as bankruptcy. If the historical data we use to calculate these estimates does not accurately reflect future returns or bad debts, adjustments to these reserves may be required that would increase or decrease revenue or net income.
Many of our software arrangements include multiple elements. Such elements typically include any or all of the following: software licenses, rights to additional software products, software maintenance, technical support, training and professional services. For multiple-element arrangements that do not involve significant modification or customization of the software and do not involve services that are considered essential to the functionality of the software, we allocated value to each element based on its relative fair value for transactions prior to fiscal 2009.
Prior to the start of fiscal 2009, we sold software licenses individually as well as combined with other products (multi-element arrangements), allowing us to determine vendor-specific objective evidence (“VSOE”) of fair value for substantially all software license products. Accordingly, when we sold multi-element arrangements we used the relative fair value, or proportional, revenue accounting method to allocate the value of multi-element arrangements proportionally to the software license and other components.
At the start of fiscal 2009, we made a sales program change requiring all customers to initially purchase maintenance with licenses, which is common industry practice. As a result of eliminating stand-alone software license sales, VSOE of fair value for software licenses no longer existed. Accordingly, beginning in the first quarter of fiscal 2009, the residual method as defined in current accounting standards is now used to allocate the value of multi-element arrangements to the various components, which is also common industry practice. Under the residual method, each undelivered element (typically maintenance) is allocated value based on Novell-specific objective evidence of fair value for that element and the remainder of the total arrangement fee is allocated to the delivered element, typically the software. This method results in discounts being allocated to the software license rather than spread proportionately over all elements. Therefore, when a discount exists, less revenue is recognized at the time of sale under the residual method than under the relative fair value method, which we used prior to fiscal 2009. We believe that the impact of the change to the residual method was not material to net revenue in fiscal 2009.
If sufficient Novell-specific objective evidence of fair value does not exist for all undelivered elements and the arrangement involves rights to unspecified additional software products, all revenue is recognized ratably over the term of the arrangement. If the arrangement does not involve rights to unspecified additional software products, all revenue is initially deferred until the only remaining undelivered element is software maintenance or technical support, at which time the entire fee is recognized ratably over the remaining maintenance or support term.
In the case of multiple-element arrangements that involve significant modification or customization of the software or involve services that are considered essential to the functionality of the software, contract accounting is applied. When Novell-specific objective evidence of fair value exists for software maintenance or technical support in arrangements requiring contract accounting, the professional services and license fees are combined and revenue is recognized on the percentage of completion basis. The percentage of completion is generally calculated using hours incurred to date relative to the total expected hours for the entire project. The cumulative impact of any revision in estimates to complete or recognition of losses on contracts is reflected in the period in which the changes or losses become known. The maintenance or support fee is unbundled from the other elements and revenue is recognized ratably over the maintenance or support term. When Novell-specific objective evidence of fair value does not exist for software maintenance or support, then all revenue is deferred until completion of the professional services, at which time the entire fee is recognized ratably over the remaining maintenance or support period.
For consolidated statements of operations classification purposes only, we allocate the revenue first to those elements for which we have Novell-specific objective evidence of fair value, and any remaining recognized revenue is then allocated to those items for which we lack Novell-specific objective evidence of fair value.
Professional services contracts are either time-and-materials or fixed-price contracts. Revenue from time-and-materials contracts is recognized as the services are performed. Revenue from fixed-price contracts is recognized based on the proportional performance method, generally using estimated time to complete to measure the completed effort. The cumulative impact of any revision in estimates to complete or recognition of losses on contracts is reflected in the period in which the changes or losses become known. Professional services revenue includes reimbursable expenses charged to our clients.
29
Table of Contents
NOVELL, INC.
MANAGEMENT’S DISCUSSION AND ANALYSIS OF
FINANCIAL CONDITION AND RESULTS OF OPERATIONS (Continued)
Critical Accounting Policies (Continued)
Microsoft Agreements-related revenue
On November 2, 2006, we entered into the Microsoft Agreements. Each of the agreements is scheduled to expire on January 1, 2012.
Under the Business Collaboration Agreement, we are marketing a combined offering with Microsoft. The combined offering consists of SLES and a subscription for SLES support along with Microsoft Windows Server, Microsoft Virtual Server and Microsoft Viridian, and is offered to customers desiring to deploy Linux and Windows in a virtualized setting. Microsoft made an upfront payment to us of $240 million for SLES subscription “certificates,” which Microsoft may use, resell or otherwise distribute over the term of the agreement, allowing the certificate holder to redeem single or multi-year subscriptions for SLES support from us (entitling the certificate holder to upgrades, updates and technical support). Microsoft agreed to spend $60 million over the term of the agreement for marketing Linux and Windows virtualization scenarios and also agreed to spend $34 million over the term of the agreement for a Microsoft sales force devoted primarily to marketing the combined offering. Microsoft agreed that for three years following the initial date of the agreement it will not enter into an agreement with any other Linux distributor to encourage adoption of other company’s Linux/Windows Server virtualization through a program substantially similar to the SLES subscription “certificate” distribution program.
The Technical Collaboration Agreement focuses primarily on four areas:
| • | Development of technologies to optimize SLES and Windows, each running as guests in a virtualized setting on the other operating system; |
| • | Development of management tools for managing heterogeneous virtualization environments, to enable each party’s management tools to command, control and configure the other party’s operating system in a virtual machine environment; |
| • | Development of translators to improve interoperability between Microsoft Office and OpenOffice.org document formats; and |
| • | Collaboration on improving directory and identity interoperability and identity management between Microsoft Active Directory software and Novell eDirectory software. |
Under the Technical Collaboration Agreement, Microsoft agreed to provide funding to help accomplish these broad objectives, subject to certain limitations.
Under the Patent Cooperation Agreement, Microsoft agreed to covenant with our customers not to assert its patents against our customers for their use of our products and services for which we receive revenue directly or indirectly, with certain exceptions, while we agreed to covenant with Microsoft’s customers not to assert our patents against Microsoft’s customers for their use of Microsoft products and services for which Microsoft receives revenue directly or indirectly, with certain exceptions. In addition, we and Microsoft each irrevocably released the other party, and its customers, from any liability for patent infringement arising prior to November 2, 2006, with certain exceptions. Both we and Microsoft have payment obligations under the Patent Cooperation Agreement. Microsoft made an upfront net balancing payment to us of $108 million, and we are making ongoing payments to Microsoft totaling a minimum of $40 million over the five-year term of the agreement based on a percentage of our Open Platform Solutions and Open Enterprise Server revenues.
As the three agreements are interrelated and were negotiated and executed simultaneously, for accounting purposes we considered all of the agreements to constitute one arrangement containing multiple elements. The SLES subscription purchases of $240 million are being accounted for based on VSOE of fair value. We recognize the revenue ratably over the respective subscription terms beginning upon customer activation, or for subscriptions which expire un-activated, if any, we recognize revenue upon subscription expiration. Objective evidence of the fair value of elements within the Patent Cooperation Agreement and Technical Collaboration Agreement did not exist. As such, we combined the $108 million for the Patent Cooperation Agreement payment and amounts we are receiving under the Technical Collaboration Agreement and are recognizing this revenue ratably over the contractual term of the agreements of five years. Our periodic payments to Microsoft are recorded as a reduction of revenue. The contractual expenditures by Microsoft, including the dedicated sales force of $34 million and the marketing funds of $60 million, do not obligate us to perform, and, therefore, do not have an accounting consequence to us.
30
Table of Contents
NOVELL, INC.
MANAGEMENT’S DISCUSSION AND ANALYSIS OF
FINANCIAL CONDITION AND RESULTS OF OPERATIONS (Continued)
Critical Accounting Policies (Continued)
Impairment of Long-term Assets
Our long-term assets include goodwill, net property, plant and equipment, other intangible assets, and long-term investments. At October 31, 2009, our long-term assets included $356.0 million of goodwill, $170.5 million of net property, plant and equipment, $36.6 million of other identifiable intangible assets, and $10.3 million of long-term investments.
Goodwill and indefinite-lived intangible assets
We evaluate the recoverability of goodwill and indefinite-lived intangible assets annually as of August 1, or more frequently if events or changes in circumstances warrant, such as a material adverse change in the business. Goodwill is considered to be impaired when the carrying value of a reporting unit exceeds its estimated fair value. Indefinite-lived intangible assets are considered impaired if their carrying value exceeds their estimated fair value. Fair values are estimated using the combination of a discounted cash flow methodology and a market analysis, and weighting the results. In assessing the recoverability of our goodwill and indefinite-lived intangible assets, we must make assumptions regarding estimated future cash flows and other factors to determine the fair value of the respective assets. This process requires subjective judgment at many points throughout the analysis. Changes in reporting units and changes to the estimates used in the analyses, including estimated future cash flows, could cause one or more of the reporting units or indefinite-lived intangibles to be valued differently in future periods. Future analysis could potentially result in a non-cash goodwill impairment charge of up to $356.0 million, the full amount of our goodwill, depending on the estimated value of the reporting units and the value of the net assets attributable to those reporting units at that time. In fiscal 2009, we recorded a goodwill impairment charge of $270.0 million. For more information about this charge see the subsection below entitled, “Impairment of goodwill,” in the “Results of Operations – Fiscal 2009 as compared to Fiscal 2008” section.
Net property, plant and equipment and other intangible assets
We periodically review our net property, plant and equipment for impairment whenever events or changes in circumstances indicate that the carrying value of the asset may not be recoverable. Factors that could indicate an impairment include significant underperformance of the asset as compared to historical or projected future operating results, significant changes in the actual or intended use of the asset, or significant negative industry or economic trends. When we determine that the carrying value of an asset may not be recoverable, the related estimated future undiscounted cash flows expected to result from the use and eventual disposition of the asset are compared to the carrying value of the asset. If the sum of the estimated future undiscounted cash flows is less than the carrying amount, we record an impairment charge based on the difference between the carrying value of the asset and its fair value, which we estimate based on discounted expected future cash flows. In determining whether an asset is impaired, we must make assumptions regarding recoverability of costs, estimated future cash flows from the asset, intended use of the asset and other related factors. If these estimates or their related assumptions change, we may be required to record impairment charges for these assets. For fiscal 2009, 2008, and 2007, we have not identified or recorded any impairment of our net property, plant and equipment.
Most of our trademarks/trade names have indefinite lives and therefore are not amortized but are reviewed for impairment at least annually. During fiscal 2009, we recorded a $9.1 million impairment charge for certain intangible assets we acquired as part of our PlateSpin and Managed Objects acquisitions. During fiscal 2008, we recorded a $7.7 million impairment charge for developed technology intangible assets that we acquired but later determined that we would not utilize as initially planned. During fiscal 2007, we recorded a $3.9 million impairment charge for certain intangible assets we acquired as a part of the e-Security acquisition.
Long-term investments
At October 31, 2009 and October 31, 2008, all of our ARSs were classified as long-term investments on our consolidated balance sheets, and at October 31, 2009, were our only long-term investments.
We estimated the fair value of these ARSs using a discounted cash flow analysis that considered the following key inputs: (i) the underlying structure of each security; (ii) the present value of the future principal and interest payments discounted at rates considered to reflect current market conditions and the relevant risk associated with each security; and (iii) consideration of the time horizon that the market value of each security could return to its cost. When available, we also include market information and weigh this with our discounted cash flow analysis to estimate fair value. We estimated that the fair market value of these securities at October 31, 2009
31
Table of Contents
NOVELL, INC.
MANAGEMENT’S DISCUSSION AND ANALYSIS OF
FINANCIAL CONDITION AND RESULTS OF OPERATIONS (Continued)
Critical Accounting Policies (Continued)
and October 31, 2008 was $10.3 million and $11.1 million, respectively. At October 31, 2009, the original cost of the remaining ARSs was $29.8 million.
During fiscal 2009, we recorded other-than-temporary impairment charges of $5.5 million, based on our assessment that it is likely that the fair value of the ARSs will not fully recover in the foreseeable future, given a combination of factors, including the duration, severity and continued declining trend of the fair value of these securities as well as a deterioration in some of the securities’ credit ratings. During fiscal 2008, we recorded an other-than-temporary impairment charge of $28.7 million. We consider all of our other-than-temporary losses to be credit losses and therefore these losses have been recorded in the “Impairment of investments” line item in our consolidated statements of operations. During fiscal 2009, we sold two of our ARSs for $0.3 million. These two securities had an aggregate cost basis of $10.0 million and had been entirely impaired prior to the sale. Late in fiscal 2009, our remaining six ARSs had improvements in their estimated fair value resulting in a $4.7 million unrealized gain.
The fair value of the ARSs could change in the future and we may be required to record additional other-than-temporary impairment charges if there are further reductions in fair value in future periods.
Valuation of Deferred Tax Assets
We regularly assess our ability to realize our deferred tax assets. Assessments of the realization of deferred tax assets require that management consider all available evidence, both positive and negative, and make significant judgments about many factors, including the amount and likelihood of future income. Based on all the available evidence, we continue to believe that it is more likely than not that most of our net deferred tax assets, and certain foreign deferred tax assets, are not currently realizable. In reaching this determination, we evaluated our three-year cumulative results as well as the impacts that current economic conditions may have on our future results. As a result, we continue to provide a valuation reserve on our U.S. net deferred tax assets and certain foreign deferred tax assets. It is reasonably possible that we could reduce a significant portion of our valuation allowance in the near-term.
Loss Contingency Accruals and Restructurings
We are required to make accruals for certain loss contingencies related to litigation. We accrue for losses we believe are probable and can be reasonably estimated. However, the estimation of the amount to accrue requires significant judgment. Litigation accruals require us to make assumptions about the future outcome of each case based on current information.
Prior to fiscal 2008, we evaluated our tax reserves based on accounting guidance which required us to accrue for losses we believed were probable and could be reasonably estimated. Beginning in fiscal 2008, guidance related to accounting for uncertainty in income taxes recognized in the financial statements was clarified so that a company can recognize the benefit of an income tax position only if it is more likely than not (greater than 50%) that the tax position will be sustained upon tax examination, based solely on the technical merits of the tax position. Otherwise, no benefit can be recognized. The tax benefits recognized are measured based on the largest benefit that has a greater than 50% likelihood of being realized upon ultimate settlement. Additionally, companies are required to accrue interest and related penalties, if applicable, on all tax exposures for which reserves have been established consistent with jurisdictional tax laws. The adoption of this guidance resulted in a $1.4 million non-cash adjustment to increase our reserves for unrecognized tax benefits and a reduction to beginning retained earnings in fiscal 2008. Our policy for interest and penalties related to income tax exposures was not impacted as a result of the adoption of the updated recognition and measurement provisions. Interest and penalties on tax reserves continue to be classified as income tax expense in our consolidated statements of operations.
When our restructurings include leased facilities we are required to make assumptions about future sublease income, which would offset our costs and decrease our accrual. During fiscal 2009 and fiscal 2007, we recorded net increases of $0.4 million and $0.3 million, respectively, to increase accruals related to facility reserves due to changes in facts and circumstances.
Share-based Payments
Under the fair value recognition guidance of stock-based compensation accounting rules, stock-based compensation cost is estimated at the grant date based on the fair value of the award and is recognized as expense over the requisite service period of the award. The fair value of restricted stock awards is determined by reference to the fair market value of our common stock on the date of grant. We use the Black-Scholes model to value both service condition and performance condition option awards. For awards with only service
32
Table of Contents
NOVELL, INC.
MANAGEMENT’S DISCUSSION AND ANALYSIS OF
FINANCIAL CONDITION AND RESULTS OF OPERATIONS (Continued)
Critical Accounting Policies (Continued)
conditions and graded-vesting features, we recognize compensation cost on a straight-line basis over the requisite service period. For awards with performance conditions, we recognize stock-based compensation expense based on the graded-vesting method.
Determining the appropriate fair value model and related assumptions requires judgment, including estimating stock price volatility, forfeiture rates, and expected terms. The expected volatility rates are estimated based on historical and implied volatilities of our common stock. The expected term represents the average time that options that vest are expected to be outstanding based on the vesting provisions and our historical exercise, cancellation and expiration patterns. We estimate pre-vesting forfeitures when recognizing stock-based compensation expense based on historical rates and forward-looking factors. We update these assumptions at least on an annual basis and on an interim basis if significant changes to the assumptions are warranted.
We issue performance-based equity awards, typically to senior executives, which vest upon the achievement of certain financial performance goals, including revenue and income targets. Determining the appropriate amount to expense based on the anticipated achievement of the stated goals requires judgment, including forecasting future financial results. The estimate of expense is revised periodically based on the probability of achieving the required performance targets and adjustments are made as appropriate. The cumulative impact of any revision is reflected in the period of change. If the financial performance goals are not met, the award does not vest, so no compensation cost is recognized and any previously recognized stock-based compensation expense is reversed.
Acquisitions
Fortefi
On February 10, 2009, we acquired certain assets of Fortefi, a supplier of an identity management solution that controls “super user” access rights. Fortefi was a small operation of which the revenues, net operating results, assets and liabilities were immaterial to us. The purchase price consisted of $3.0 million in cash, plus merger and transaction costs of $0.1 million. Fortefi’s products have been integrated into our Identity and Security Management business unit segment.
Managed Objects
On November 13, 2008, we acquired 100% of the outstanding stock of Managed Objects, a supplier of business service management solutions, through a merger of Managed Objects into a wholly-owned subsidiary. The purchase price consisted of $46.3 million in cash, plus merger and transaction costs of $1.1 million. Managed Objects’ products have been integrated into our Systems and Resource Management business unit segment.
PlateSpin
On March 26, 2008, we acquired 100% of the outstanding stock of PlateSpin, a leader in support solutions for complete workload life cycle management and optimization for Windows, UNIX and Linux operating systems in the physical and virtual data center. The purchase price consisted of $204.1 million in cash, plus merger and transaction costs of $3.8 million. PlateSpin’s products have been integrated into our Systems and Resource Management business unit segment.
SiteScape
On February 13, 2008, we acquired 100% of the outstanding stock of SiteScape, Inc. (“SiteScape”), a provider of open collaboration software, including Teaming + Conferencing products. The purchase price consisted of $18.5 million in cash, plus merger and transaction costs of $0.4 million. SiteScape’s products have been integrated into our Workgroup business unit segment.
Senforce
On August 1, 2007, we acquired 100% of the outstanding stock of Senforce Technologies, Inc. (“Senforce”), a provider of endpoint security management, for $20.0 million in cash, plus transaction costs of $0.2 million. Endpoint security management focuses on technology that provides data security for workstations, laptops or mobile devices in order to ensure that data cannot be accessed when they are lost or stolen. Senforce’s products have been integrated into our Systems and Resource Management business unit segment.
33
Table of Contents
NOVELL, INC.
MANAGEMENT’S DISCUSSION AND ANALYSIS OF
FINANCIAL CONDITION AND RESULTS OF OPERATIONS (Continued)
Acquisitions (Continued)
RedMojo
On November 17, 2006, we acquired 100% of the outstanding stock of RedMojo Inc. (“RedMojo”), a privately-held company that specialized in cross-platform virtualization management software tools. RedMojo’s products have been integrated into our Systems and Resource Management business unit segment. The purchase price was approximately $9.7 million in cash, plus merger and transaction costs of approximately $0.2 million.
Divestitures
Discontinued Operations
Our discontinued operations include the divestitures of our Cambridge Technology Partners (Switzerland) SA (“CTP Switzerland”), subsidiary in fiscal 2008 and our Salmon Ltd. (“Salmon”) subsidiary in fiscal 2007. Detailed discussions of each of these divestitures follow:
CTP Switzerland
On October 31, 2007, we signed an agreement to sell our CTP Switzerland subsidiary to a management-led buyout group for $0.8 million ($0.5 million was received at close on January 31, 2008, and an additional contingent payment of $0.3 million was received during the fourth quarter of fiscal 2008). No further payments are due from the CTP Switzerland buyout group. As of January 31, 2008, we ceased stockholder and operational relationships with CTP Switzerland.
When we signed the agreement, we began classifying CTP Switzerland’s results as a discontinued operation in our consolidated statements of operations and reclassified our results of operations for the prior comparable period. In fiscal 2007, we recognized an estimated loss on disposal of $8.9 million resulting from the expected sale. During fiscal 2008, we recognized a gain on final liquidation of CTP Switzerland of $1.4 million, for a total net loss on the disposition of $7.4 million.
Salmon
On March 12, 2007, we sold our shares in our wholly-owned Salmon subsidiary to Okam Limited, a U.K. Limited Holding Company, for $4.9 million, which amount has been received, plus an additional contingent payment of £2.0 million (approximately $3.2 million).
Of the $4.9 million initial sales proceeds, $2.9 million was received at the time of sale and the remaining $2.0 million was received during the second quarter of fiscal 2008. During fiscal 2008, we received $1.2 million of the approximate $3.2 million contingent amount. During fiscal 2009, we received an additional contingent cash payment of $1.0 million. We earned the remaining balance during fiscal 2009, for which a receivable of approximately $1.0 million was recorded and is due to be paid to us during fiscal 2010.
During the first quarter of fiscal 2007, we determined that it was more likely than not that Salmon would be sold. This determination triggered the need to test the $11.9 million of goodwill related to Salmon for impairment. Using an estimate of proceeds to be received upon sale as an indicator of Salmon’s fair value, we determined that $10.2 million of Salmon’s goodwill had become impaired, and was, therefore, written off during the quarter as a component of discontinued operations in the consolidated statement of operations. In addition, we also determined that $0.5 million of customer relationship intangible assets and $0.1 million of non-compete agreement intangible assets had become impaired and, therefore, were also written off in the first quarter of fiscal 2007.
In the second quarter of fiscal 2007, we recognized a gain on the consummation of the sale of approximately $0.6 million. Salmon’s results of operations are classified as a discontinued operation in our consolidated statements of operations.
34
Table of Contents
NOVELL, INC.
MANAGEMENT’S DISCUSSION AND ANALYSIS OF
FINANCIAL CONDITION AND RESULTS OF OPERATIONS (Continued)
Divestitures (Continued)
The results of discontinued operations (CTP Switzerland and Salmon) for fiscal 2009, 2008, and 2007 are as follows:
| Fiscal Year Ended October 31, | |||||||||||
| 2009 | 2008 | 2007 | |||||||||
| (In thousands) | |||||||||||
| CTP Switzerland net revenue |
$ | — | $ | 6,566 | $ | 25,625 | |||||
| Salmon net revenue |
— | — | 7,351 | ||||||||
| $ | — | $ | 6,566 | $ | 32,976 | ||||||
| CTP Switzerland income before taxes |
$ | — | $ | 105 | $ | 739 | |||||
| Salmon income before taxes |
— | — | 83 | ||||||||
| Income before taxes |
— | 105 | 822 | ||||||||
| Salmon impairment of long-lived assets |
— | — | (10,848 | ) | |||||||
| Salmon gain on sale |
1,904 | 1,223 | 628 | ||||||||
| CTP Switzerland gain on sale |
— | 1,430 | — | ||||||||
| CTP Switzerland impairment of goodwill |
— | — | (3,903 | ) | |||||||
| CTP Switzerland impairment loss |
— | — | (4,952 | ) | |||||||
| Gain (loss) on discontinued operations |
1,904 | 2,653 | (19,075 | ) | |||||||
| Income tax benefit on discontinued operations |
— | (836 | ) | (69 | ) | ||||||
| Income (loss) from discontinued operations |
$ | 1,904 | $ | 3,594 | $ | (18,184 | ) | ||||
The net cash proceeds from the sale of our discontinued operations (CTP Switzerland and Salmon) are as follows:
| Fiscal Year Ended October 31, | ||||||||||
| (In thousands) | 2009 | 2008 | 2007 | |||||||
| CTP Switzerland net cash distributions |
$ | — | $ | (2,667 | ) | $ | — | |||
| Salmon net cash proceeds |
1,036 | 3,231 | 783 | |||||||
| Net cash proceeds from sale of discontinued operations |
$ | 1,036 | $ | 564 | $ | 783 | ||||
Sales of Subsidiaries
Our sales of subsidiaries include the divestitures of our Chile subsidiary in fiscal 2009 and our Mexico and Argentina subsidiaries in fiscal 2008. We sold all three of these subsidiaries to one of our Latin America distribution partners. We will continue to sell products to customers in these countries through the distribution partner. Accordingly, we will have continuing cash flows from these businesses and have not presented them as discontinued operations in our consolidated statements of operations. Detailed discussions of each of these divestitures follow:
Chile subsidiary
Our Chile subsidiary, which we sold during fiscal 2009 for an insubstantial amount, was a very small operation with an immaterial net book value. The loss recorded on this sale was $0.1 million and is shown as a component of the line item “(Gain) loss on sale of subsidiaries” on our consolidated statements of operations.
Mexico and Argentina subsidiaries
During fiscal 2008, we sold our Mexico and our Argentina subsidiaries and recorded a total loss on the sale of both subsidiaries of $3.7 million. These subsidiaries were primarily sales operations and sold products from our four business unit segments. During fiscal 2009, we reached final settlement related to working capital adjustments on the sale of our Mexico and Argentina subsidiaries. This resulted in a non-cash gain of $0.2 million related to our Mexico subsidiary and a non-cash loss of $0.1 million related to our Argentina subsidiary. These gains and losses are shown as a component of the line item “(Gain) loss on sale of subsidiaries” on our consolidated statements of operations.
35
Table of Contents
NOVELL, INC.
MANAGEMENT’S DISCUSSION AND ANALYSIS OF
FINANCIAL CONDITION AND RESULTS OF OPERATIONS (Continued)
Divestitures (Continued)
Japan Consulting Group
During fiscal 2006, we sold our Japan Consulting Group (“JCG”) to Nihon Unisys, LTD (“Unisys”) for $4.0 million, of which $2.8 million of the selling price was paid at closing and $1.2 million was contingent upon certain key employees remaining employed by Unisys for the 12 month period after closing. In fiscal 2007, Unisys paid the contingent consideration of $0.2 million for each key employee that was still employed by Unisys at the end of the retention period, totaling $1.2 million. We recognized a gain of $1.2 million in fiscal 2007 related to contingent consideration.
The net cash (distributions) proceeds from the sale of our subsidiaries (Mexico, Argentina and the JCG) are as follows (Chile had an insignificant net cash distribution):
| Fiscal Year Ended October 31, | ||||||||||
| (In thousands) | 2009 | 2008 | 2007 | |||||||
| Mexico net cash distributed |
$ | — | $ | (13 | ) | $ | — | |||
| Argentina net cash distributed |
— | (158 | ) | — | ||||||
| JCG net cash proceeds |
— | — | 1,200 | |||||||
| Net cash (distributions) proceeds from sale of subsidiaries |
$ | — | $ | (171 | ) | $ | 1,200 | |||
Results of Operations – Fiscal 2009 as compared to Fiscal 2008
Revenue
We sell our software and services primarily to corporations, government entities, educational institutions, independent hardware and software vendors, resellers and distributors both domestically and internationally. In our consolidated statements of operations, we categorize revenue as software licenses, maintenance and subscriptions, and services. Software licenses revenue includes sales of proprietary licenses and certain royalties. Maintenance and subscriptions revenue includes product maintenance agreements and Linux subscriptions. Services revenue includes professional services, technical support, and training.
| Fiscal Year Ended October 31, | ||||||||
| (Dollars in thousands) | 2009 | 2008 | Change | |||||
| Software licenses |
$ | 116,919 | $ | 188,983 | (38)% | |||
| Maintenance and subscriptions |
640,745 | 616,493 | 4% | |||||
| Services |
104,521 | 151,037 | (31)% | |||||
| Total net revenue |
$ | 862,185 | $ | 956,513 | (10)% | |||
Our overall revenue decline of 10% in fiscal 2009 compared to fiscal 2008, reflected the impact of the economic climate. It is reasonably possible that this revenue decline could continue into fiscal 2010.
Revenue in our software licenses category decreased during fiscal 2009 compared to the prior year as software licenses revenue declined across all business unit segments. The lower software licenses revenue reflected the impact of the economic climate, which affected our industry more severely in fiscal 2009 than in fiscal 2008.
Revenue from maintenance and subscriptions increased in fiscal 2009 compared to the prior year primarily due to increased revenue from Linux Platform Products, which increased $25.8 million, or 21%. Maintenance and subscriptions revenue increased in all of our business unit segments except Workgroup in fiscal 2009 compared to the prior year. In general, despite challenges posed by the economic climate, maintenance and subscriptions revenue continued at relatively steady rates due primarily to consistent renewal rates with respect to existing software deployments. Revenue from maintenance and subscriptions also benefited from our acquisitions. Incremental maintenance and subscriptions revenue in the first year after acquiring PlateSpin and from Managed Objects accounted for $7.3 million of new revenue.
While our services offerings are focused increasingly on supporting product sales, rather than generating stand-alone revenue or profits, the decline in services revenue in fiscal 2009 compared to the prior year was greater than anticipated as customers reduced their discretionary spending in response to economic conditions.
36
Table of Contents
NOVELL, INC.
MANAGEMENT’S DISCUSSION AND ANALYSIS OF
FINANCIAL CONDITION AND RESULTS OF OPERATIONS (Continued)
Results of Operations – Fiscal 2009 as compared to Fiscal 2008 (Continued)
Foreign currency exchange rate fluctuations, as measured by using prior period foreign currency exchange rates on non-U.S. dollar denominated revenue, negatively impacted total net revenue by $16.8 million, or 2%, during fiscal 2009.
Net revenue in the Open Platform Solutions segment was as follows:
| Fiscal Year Ended October 31, | ||||||||
| (Dollars in thousands) | 2009 | 2008 | Change | |||||
| Software licenses |
$ | 125 | $ | 164 | (24)% | |||
| Maintenance and subscriptions |
156,754 | 132,962 | 18% | |||||
| Services |
17,451 | 21,731 | (20)% | |||||
| Total net revenue |
$ | 174,330 | $ | 154,857 | 13% | |||
Revenue from our Open Platform Solutions segment increased in fiscal 2009 compared to the prior year primarily due to Linux Platform Products, which increased by $25.8 million, or 21%. Invoicing for Linux Platform Products in fiscal 2009 decreased 18% compared to the prior year. The invoicing change in fiscal 2009 compared to the prior year is primarily the result of a decrease in the number of large deals that closed in fiscal 2009 compared to fiscal 2008, and lower levels of SLES certificates distributed by Microsoft. We have now invoiced essentially all of the remaining balance of the original $240 million agreement with Microsoft. In fiscal 2009, the SLES certificates distributed by Microsoft accounted for 32% of Linux Platform Products invoicing.
Net revenue in the Identity and Security Management segment was as follows:
| Fiscal Year Ended October 31, | ||||||||
| (Dollars in thousands) | 2009 | 2008 | Change | |||||
| Software licenses |
$ | 33,873 | $ | 56,623 | (40)% | |||
| Maintenance and subscriptions |
87,177 | 80,622 | 8% | |||||
| Services |
35,241 | 56,745 | (38)% | |||||
| Total net revenue |
$ | 156,291 | $ | 193,990 | (19)% | |||
Revenue from our Identity and Security Management segment decreased in fiscal 2009 compared to the prior year, primarily due to the economic climate. Identity, Access and Compliance Management product revenue decreased $12.0 million, or 10%, compared to fiscal 2008, due in part to invoicing declines of 7% in fiscal 2009 compared to the prior year. Longer sales cycles and decreased contract duration also negatively impacted revenue.
Net revenue in the Systems and Resource Management segment was as follows:
| Fiscal Year Ended October 31, | ||||||||
| (Dollars in thousands) | 2009 | 2008 | Change | |||||
| Software licenses |
$ | 33,806 | $ | 48,126 | (30)% | |||
| Maintenance and subscriptions |
126,963 | 122,040 | 4% | |||||
| Services |
21,446 | 23,055 | (7)% | |||||
| Total net revenue |
$ | 182,215 | $ | 193,221 | (6)% | |||
Revenue from our Systems and Resource Management segment decreased in fiscal 2009 compared to the prior year, primarily from lower software licenses revenue from our ZENworks products. This decrease was partially offset by additional revenue in the first year after acquiring PlateSpin and from Managed Objects which resulted in incremental revenue of $13.6 million. In the second half of fiscal 2009, PlateSpin revenue was $2.9 million lower compared to the prior year period. Invoicing for Systems and Resource Management products decreased 10% in fiscal 2009 compared to the prior year, reflecting the impact of the economic climate and integration challenges with respect to the PlateSpin and Managed Objects acquisitions. These revenue declines were also impacted by longer sales cycles and decreased contract duration.
37
Table of Contents
NOVELL, INC.
MANAGEMENT’S DISCUSSION AND ANALYSIS OF
FINANCIAL CONDITION AND RESULTS OF OPERATIONS (Continued)
Results of Operations – Fiscal 2009 as compared to Fiscal 2008 (Continued)
Net revenue in the Workgroup segment was as follows:
| Fiscal Year Ended October 31, | ||||||||
| (Dollars in thousands) | 2009 | 2008 | Change | |||||
| Software licenses |
$ | 49,115 | $ | 84,070 | (42)% | |||
| Maintenance and subscriptions |
269,851 | 280,869 | (4)% | |||||
| Services |
30,383 | 49,506 | (39)% | |||||
| Total net revenue |
$ | 349,349 | $ | 414,445 | (16)% | |||
Revenue from our Workgroup segment decreased in fiscal 2009 compared to the prior year primarily from lower combined OES and NetWare-related product revenue of $28.1 million, lower services revenue of $19.1 million and lower Collaboration product revenue of $13.8 million. Invoicing for the combined OES and NetWare-related products decreased 18% in fiscal 2009 compared to the prior year. Product invoicing for the Workgroup segment decreased 18% in fiscal 2009 compared to the prior year. These declines were attributable to the economic climate and the life cycle stage of our products in the Workgroup segment, and further reflect longer sales cycles and decreased contract duration.
Deferred Revenue
We had total deferred revenue of $688.8 million at October 31, 2009 compared to $730.1 million at October 31, 2008. Deferred revenue represents revenue that has been invoiced and is expected to be recognized in future periods under maintenance contracts and subscriptions that are recognized ratably over the related contract periods, typically one to three years. Deferred revenue related to the Microsoft Agreements is recognized ratably over various related service periods, which can extend up to five years. The decrease in total deferred revenue of $41.3 million is primarily attributable to the recognition of deferred revenue related to our agreement with Microsoft to purchase SLES certificates. (See the subsection entitled “Microsoft Agreements—related revenue” of Critical Accounting Policies, above, for more details on the 2006 Microsoft Agreements.)
Gross Profit
| Fiscal Year Ended October 31, | ||||||||||
| (Dollars in thousands) | 2009 | 2008 | Change | |||||||
| Software licenses gross profit |
$ | 105,779 | $ | 171,753 | (38)% | |||||
| percentage of related revenue |
90 | % | 91 | % | ||||||
| Maintenance and subscriptions gross profit |
$ | 587,709 | $ | 567,379 | 4% | |||||
| percentage of related revenue |
92 | % | 92 | % | ||||||
| Services gross profit |
$ | (18,134 | ) | $ | (17,858 | ) | (2)% | |||
| percentage of related revenue |
(17 | )% | (12 | )% | ||||||
| Total gross profit |
$ | 675,354 | $ | 721,274 | (6)% | |||||
| percentage of revenue |
78 | % | 75 | % | ||||||
The increase in gross profit as a percentage of revenue during fiscal 2009 compared to the prior year reflected the benefits of our cost reduction initiatives, including our prior restructuring actions, and the benefits of realigning our services business to be more efficient and product focused, resulting in a shift to higher-margin product revenue. Our services offerings are increasingly focused on supporting product sales, not generating stand-alone revenue or profits, in line with our strategic initiatives.
Total gross profit was lower for fiscal 2009 compared to the prior year primarily due to the 10% decrease in total net revenue. Foreign currency exchange rate fluctuations during fiscal 2009, compared to the prior year, unfavorably impacted gross profit by $9.8 million, or 1%.
38
Table of Contents
NOVELL, INC.
MANAGEMENT’S DISCUSSION AND ANALYSIS OF
FINANCIAL CONDITION AND RESULTS OF OPERATIONS (Continued)
Results of Operations – Fiscal 2009 as compared to Fiscal 2008 (Continued)
Gross profit by business unit segment was as follows:
| Fiscal Year Ended October 31, | ||||||||||
| (Dollars in thousands) | 2009 | 2008 | Change | |||||||
| Open Platform Solutions |
$ | 141,389 | $ | 113,171 | 25% | |||||
| percentage of related revenue |
81 | % | 73 | % | ||||||
| Identity and Security Management |
$ | 106,458 | $ | 114,364 | (7)% | |||||
| percentage of related revenue |
68 | % | 59 | % | ||||||
| Systems and Resource Management |
$ | 145,614 | $ | 160,351 | (9)% | |||||
| percentage of related revenue |
80 | % | 83 | % | ||||||
| Workgroup |
$ | 294,526 | $ | 346,226 | (15)% | |||||
| percentage of related revenue |
84 | % | 84 | % | ||||||
| Common unallocated operating costs |
$ | (12,633 | ) | $ | (12,838 | ) | 2% | |||
| Total gross profit |
$ | 675,354 | $ | 721,274 | (6)% | |||||
| percentage of revenue |
78 | % | 75 | % | ||||||
The changes in gross profit in each of our segments as a percentage of related revenue in fiscal 2009 compared to fiscal 2008 can be characterized as follows:
| • | Open Platform Solutions — increased both as a percentage of revenue and in total primarily from higher revenues, cost containment efforts, and increased technical support efficiency. |
| • | Identity and Security Management — increased as a percentage of revenue due to a more favorable mix of higher-margin product revenue and cost containment efforts. The total decrease in gross profit reflects the revenue decreases. |
| • | Systems and Resource Management — decreased both as a percentage of revenue and in total primarily from lower overall revenues and from lower gross profit percentages due primarily to higher royalties related to PlateSpin. |
| • | Workgroup — remained flat as a percentage of revenue, but decreased in total due to lower revenues. |
Operating Expenses
| Fiscal Year Ended October 31, | ||||||||||
| (Dollars in thousands) | 2009 | 2008 | Change | |||||||
| Sales and marketing |
$ | 295,998 | $ | 368,719 | (20)% | |||||
| as a percent of net revenue |
34 | % | 39 | % | ||||||
| Product development |
$ | 181,383 | $ | 191,547 | (5)% | |||||
| as a percent of net revenue |
21 | % | 20 | % | ||||||
| General and administrative |
$ | 102,345 | $ | 113,529 | (10)% | |||||
| as a percent of net revenue |
12 | % | 12 | % | ||||||
| Restructuring expenses |
$ | 25,200 | $ | 28,645 | (12)% | |||||
| as a percent of net revenue |
3 | % | 3 | % | ||||||
| Impairment of goodwill |
$ | 270,044 | $ | — | —% | |||||
| as a percent of net revenue |
31 | % | — | % | ||||||
| Impairment of intangible assets |
$ | 9,091 | $ | 7,664 | 19% | |||||
| as a percent of net revenue |
1 | % | 1 | % | ||||||
| (Gain) loss on sale of subsidiaries |
$ | (16 | ) | $ | 3,694 | 100% | ||||
| as a percent of net revenue |
— | % | — | % | ||||||
| Gain on sale of property, plant and equipment, net |
$ | (2,199 | ) | $ | — | —% | ||||
| as a percent of net revenue |
— | % | — | % | ||||||
| Purchased in-process research and development |
$ | — | $ | 2,700 | —% | |||||
| as a percent of net revenue |
— | % | — | % | ||||||
| Total operating expenses |
$ | 881,846 | $ | 716,498 | 23% | |||||
| as a percent of net revenue |
102 | % | 75 | % | ||||||
39
Table of Contents
NOVELL, INC.
MANAGEMENT’S DISCUSSION AND ANALYSIS OF
FINANCIAL CONDITION AND RESULTS OF OPERATIONS (Continued)
Results of Operations – Fiscal 2009 as compared to Fiscal 2008 (Continued)
Sales and marketing
Sales and marketing expenses decreased in fiscal 2009 compared to fiscal 2008 primarily due to cost reduction initiatives, including our prior restructuring actions, lower program spending, reduced travel and entertainment and outside service costs, and favorable foreign currency exchange rate fluctuations of $15.3 million, partially offset by incremental sales and marketing expenses in the first year after acquiring PlateSpin and Managed Objects. Sales and marketing headcount was lower by 60 employees, or 6%, at the end of fiscal 2009 compared to fiscal 2008.
Product development
Product development expenses decreased in fiscal 2009 compared to fiscal 2008 primarily from cost reduction initiatives, including our prior restructuring actions, and favorable foreign currency exchange rate fluctuations of $7.6 million, partially offset by incremental product development expenses in the first year after acquiring PlateSpin and Managed Objects. Product development headcount decreased by 124 employees, or 9%, at the end of fiscal 2009 compared to fiscal 2008.
General and administrative
General and administrative expenses decreased in fiscal 2009 compared to fiscal 2008 primarily due to cost reduction initiatives, including our prior restructuring actions, and favorable foreign currency exchange rate fluctuations of $2.4 million. General and administrative headcount was lower by 176 employees, or 29%, at the end of fiscal 2009 compared to fiscal 2008, reflecting the outsourcing of the majority of our IT support functions to ACS as part of the agreement that was signed in the third quarter of fiscal 2009 (the “ACS Agreement”). This decrease in headcount-related expense was offset by an increase in outside service costs as a result of the ACS Agreement.
Restructuring expenses
During fiscal 2009, we recorded net restructuring expenses of $25.2 million. This was comprised of $10.2 million in restructuring expenses under our current restructuring plan, which we began implementing in the third quarter of fiscal 2009 in response to economic conditions, $13.9 million for restructuring actions incurred for the completion of the restructuring plan that we began during the fourth quarter of fiscal 2006 and completed during the second quarter of fiscal 2009, and $1.1 million in additions to accruals for changes in estimates related to prior period restructuring activities. As part of both restructuring actions, during fiscal 2009, we reduced our headcount by 341 employees. At October 31, 2009, our total headcount was approximately 3,600.
Impairment of goodwill
On August 1, 2009, 2008 and 2007, we performed our annual goodwill impairment test. The first step (“step one”) in evaluating impairment is to determine if the estimated fair value of a reporting unit, which is equivalent to our business unit segments as this is the level at which our chief decision makers review financial information, is less than the carrying value of the business unit segments. If step one indicates that the fair value is less than the carrying value of the business unit segment, then impairment potentially exists, and the second step (“step two”) is performed to measure the amount of impairment, if any. To estimate the fair value of each of our four business unit segments for step one, management made estimates and judgments about future cash flows based on assumptions that are consistent with both short-term plans and long-range forecasts used to manage the business. We also considered factors such as our market capitalization and current economic events in assessing the fair value of the business unit segments. This process requires subjective judgment at many points throughout the analysis. Changes to the estimates used in the analysis, including estimated future cash flows, could cause one or more of the business unit segments or indefinite-lived intangibles to be valued differently in future periods. Based on the results of our analysis, we determined that no goodwill impairment existed at August 1 of each fiscal year.
40
Table of Contents
NOVELL, INC.
MANAGEMENT’S DISCUSSION AND ANALYSIS OF
FINANCIAL CONDITION AND RESULTS OF OPERATIONS (Continued)
Results of Operations – Fiscal 2009 as compared to Fiscal 2008 (Continued)
Events subsequent to annual goodwill impairment test as of August 1, 2009
In the week leading up to the September 22, 2009 Board of Directors annual budget meeting, management updated its long-range forecast concurrent with the completion of the fiscal 2010 budgeting process. Management reduced its long-range revenue growth assumptions late in the annual planning process due to present company trends, a revised market outlook and continued economic uncertainty.
Management’s revised long-range forecast lowered the projected revenue and operating income utilized in the August 1, 2009 discounted cash flow model valuation. We considered this lowered financial outlook to be an impairment trigger event for both goodwill and long-lived assets, requiring us to re-perform the step one test for potential impairment, which we did as of September 30, 2009, our closest balance sheet date. Also, because long-term revenue projections were lowered in all four of our business unit segments, each business unit segment had to be reviewed for potential impairment.
As discussed under “Goodwill impairment test as of September 30, 2009” below, the lower long-term projections resulted in the failure of the step one test for our Systems and Resource Management business unit segment because the estimated fair value of this business unit segment was lower than its carrying value. All other business unit segments passed the step one test. Because the Systems and Resource Management business unit segment failed the step one test, we were required to perform the step two test, which utilizes a notional purchase price allocation using the estimated fair value from step one as the purchase price to determine the implied value of the business unit segment’s goodwill. The completion of the step two test resulted in the determination that $270.0 million of the Systems and Resource Management business unit segment’s goodwill was impaired. The $270.0 million impairment charge is shown in the line item “Impairment of goodwill” in our consolidated statements of operations.
While we believe that Systems and Resource Management business unit segment revenues can grow at or above market growth rates in the future, this growth was not sufficient to avoid failing the step one test. We continue to believe that our growth businesses can grow at or above market rates in the future due in part to our strategic focus with these technologies.
Goodwill impairment test as of September 30, 2009
In performing step one of the goodwill impairment test, it was necessary to determine the fair value of each of the four business unit segments. The fair values of all business unit segments, except for the Workgroup business unit segment, were estimated using a weighted average of a discounted cash flow methodology (“DCF”) and a market analysis. The market analysis included looking at the valuations of comparable public companies, as well as recent acquisitions of comparable companies. For the Workgroup business unit segment only, the DCF was utilized as it was felt that there was no comparable market information, due to the uniqueness of the Workgroup business unit segment which is forecasted to have a long-term declining revenue stream, yet have high operating margins. With respect to the other three business unit segments, a 10% weighting was given to the market analysis, unlike the prior year, when a weighting of 50% was utilized, as solid comparable market data is not available due to the uniqueness of each of our business unit segments. As a result, a weighting of 90% was given to the DCF.
Two key inputs to the DCF analysis were our future cash flow projection and the discount rate. We used a ten-year future cash flow projection, based on management’s long-range forecast, discounted to present value, and an estimate of terminal values, which was also discounted to present value. Terminal values represent the present value an investor would pay today for the rights to cash flows of the business unit segment for the years subsequent to the ten-year cash flow projection period. As noted above, the long-range forecast that was utilized for the impairment test after the September 22, 2009 Board meeting was lower than what was utilized in both the August 1, 2009 valuation and the fiscal 2008 valuation. The lower forecast was the primary reason for the lower fair values that resulted in the need to perform a step two impairment valuation for the Systems and Resource Management business unit segment. A driver of the lower forecast for the Systems and Resource Management business unit segment was the underperformance of our ZENworks products as well as our recent acquisitions.
The other major input into the DCF analysis was the discount rate, which was determined by estimating each business unit segment’s weighted average cost of capital, reflecting the nature of the respective business unit segment and the perceived risk of the underlying cash flows. We used the following discount rates in our DCF methodology for each of our business unit segments: 16.0% for Open Platform Solutions, 15.6% for Identity and Security Management, 14.6% for Systems and Resource Management and 13.0% for Workgroup. If we had increased our discount rates by 1%, it would not have impacted the ultimate results of our step one test. The
41
Table of Contents
NOVELL, INC.
MANAGEMENT’S DISCUSSION AND ANALYSIS OF
FINANCIAL CONDITION AND RESULTS OF OPERATIONS (Continued)
Results of Operations – Fiscal 2009 as compared to Fiscal 2008 (Continued)
excess of the fair value over the carrying value of our business unit segments was as follows: 68% for Open Platform Solutions, 139% for Identity and Security Management, and 379% for Workgroup.
The step two test involves allocating the fair value of the Systems and Resource Management business unit segment to all of its assets and liabilities on a fair value basis, with the excess amount representing the implied value of goodwill. As part of this process the fair value of the Systems and Resource Management business unit segment’s identifiable intangible assets, including in-process research and development, developed technology, customer relationships and trademarks/trade names were determined. The fair values of these assets were determined primarily through the use of the DCF method. The fair values of Systems and Resource Management’s property, plant and equipment were determined primarily through the use of third party broker quotes. The fair value of Systems and Resource Management’s deferred revenue was based upon the estimate of the amount that would be required to pay a third party to assume the obligation. After determining the fair value of all Systems and Resource Management business unit segment assets and liabilities, it was determined that the implied value of goodwill was $56.0 million. The September 30, 2009 carrying value of the Systems and Resource Management business unit segment’s goodwill was $326.0 million, which, when compared to the implied goodwill value of $56.0 million resulted in the impairment charge of $270.0 million.
The above described process requires subjective judgment at many points throughout the analysis. Changes to the estimates used in the analysis, including estimated future cash flows, could cause one or more of the business unit segments or indefinite-lived intangibles to be valued differently in future periods. It is at least reasonably possible that future analyses could result in additional material non-cash goodwill impairment charges.
Review of long-lived assets
As noted above, we concurrently performed an assessment of long-lived assets for impairment. These assets, which include tangible and intangible assets, need to be tested for impairment before the step two goodwill impairment analysis can be completed because any change in these assets would impact the carrying value of the Systems and Resource Management business unit segment.
To test the recoverability of our long-lived assets and liabilities, which for us is primarily long-lived assets, they were grouped with other assets at the lowest level for which identifiable cash flows were largely independent of the cash flows of other assets. With the exception of our Systems and Resource Management business unit segment, we determined that our asset groups were our business unit segments, as that was the lowest level at which cash flows could be separated from other assets. For the Systems and Resource Management business unit segment, separate identifiable cash flows were available for PlateSpin and Managed Objects products, with all other cash flows belonging to our remaining Systems and Resource Management business (primarily ZENworks). Therefore, the Systems and Resource Management business unit segment had three asset groups.
The test for recoverability compares undiscounted future cash flows of the long-lived asset group to its carrying value. The future cash flow period was based on the future service life of the primary asset within the long-lived asset group.
If the future cash flows exceed the carrying values of the asset group, the asset group is not considered to be impaired. If the carrying values of the asset group exceed the future cash flows, the asset group is considered to be potentially impaired. It was determined that for all asset groups except for PlateSpin and Managed Objects, the future cash flows exceeded the carrying values of the respective asset groups.
As the PlateSpin and Managed Objects asset groups had carrying values in excess of their estimated undiscounted future cash flows, it was necessary to determine the fair value of the individual assets within the asset group. Because the aggregate fair values of the individual assets of the group were less than their carrying values, an impairment was recorded equal to the excess of the aggregated carrying value of the asset group over the aggregate fair value. This loss was allocated to each asset within the group that had a fair value less than its carrying value, based on their relative carrying values, with no asset reduced below its fair value. As a result of this test, it was determined that $5.7 million of PlateSpin’s and $3.4 million of Managed Objects’ developed technology and customer relationships were impaired. These impairment charges, totaling $9.1 million, are shown in the line item, “Impairment of intangible assets” in our consolidated statements of operations.
In the third quarter of fiscal 2008, we acquired $12.0 million of developed technology, which was integrated into our Identity and Security Management business unit segment. During the fourth quarter of fiscal 2008, we completed our detailed internal reviews of
42
Table of Contents
NOVELL, INC.
MANAGEMENT’S DISCUSSION AND ANALYSIS OF
FINANCIAL CONDITION AND RESULTS OF OPERATIONS (Continued)
Results of Operations – Fiscal 2009 as compared to Fiscal 2008 (Continued)
the technology and determined that we would not utilize all of the acquired developed technology as initially planned. These reviews determined that only a portion of the acquired developed technology would be utilized in our products. We used discounted cash flow models to estimate the fair value of this acquired developed technology based upon the updated plans, and determined that $7.7 million had become impaired. This intangible asset was written down and the related charge was recorded as a component of operating expenses in the consolidated statements of operations during fiscal 2008. The entire $7.7 million impairment charge related to the Identity and Security Management business unit segment. As part of this review, it was determined that the estimated useful life of the remaining asset would be four years.
(Gain) loss on sale of subsidiaries
The fiscal 2009 gain on sale of subsidiaries relates to a net gain recognized upon the finalization of working capital adjustments related to the sales of our Mexico and Argentina subsidiaries, partially offset by a loss on the sale of our Chile subsidiary, discussed in the “Divestitures” section, above. The fiscal 2008 loss on sale of subsidiaries resulted from the divestiture of our Mexico and Argentina subsidiaries discussed in the “Divestitures” section, above.
Gain on sale of property, plant and equipment, net
During fiscal 2009, we sold certain corporate real estate assets and computer equipment for net proceeds of $10.7 million that had a net book value of $8.1 million. The sales also included other fees and expenses of $0.4 million and resulted in a $2.2 million gain.
Purchased in-process research and development
Purchased in-process research and development of $2.7 million during fiscal 2008 related to the PlateSpin acquisition. At the acquisition date, PlateSpin was developing the next release of its three major products. These releases had not yet reached technological feasibility at the time of the acquisition. The purchased in-process research and development did not have any alternative future use and did not otherwise qualify for capitalization. As a result, this amount was expensed upon acquisition.
Foreign currency exchange rate fluctuations
Foreign currency exchange rate fluctuations during fiscal 2009 compared to fiscal 2008 unfavorably impacted revenue by $16.8 million, favorably impacted operating expenses by $32.3 million and favorably impacted income from continuing operations by $15.5 million. Since a large portion of our recognized revenue is deferred revenue that was recorded at different foreign currency exchange rates, the impact to revenue of changes in foreign currency exchange rates is recognized over time, whereas the impact to expenses is more immediate, as expenses are recognized at the current foreign currency exchange rate in effect at the time the expense is incurred.
Other Income (Expense), Net
| Fiscal Year Ended October 31, | ||||||||||
| (Dollars in thousands) | 2009 | 2008 | Change | |||||||
| Investment income |
$ | 22,720 | $ | 71,640 | (68)% | |||||
| as a percent of net revenue |
3 | % | 7 | % | ||||||
| Impairment of investments |
$ | (5,466 | ) | $ | (30,024 | ) | 82% | |||
| as a percent of net revenue |
(1 | )% | (3 | )% | ||||||
| Interest expense and other, net |
$ | (14,736 | ) | $ | (23,514 | ) | 37% | |||
| as a percent of net revenue |
(2 | )% | (2 | )% | ||||||
| Total other income, net |
$ | 2,518 | $ | 18,102 | (86)% | |||||
| as a percent of net revenue |
— | % | 2 | % | ||||||
Investment income includes income from short-term and long-term investments. Investment income for fiscal 2009 decreased compared to fiscal 2008 due primarily to lower interest rates and to a decrease in cash, cash equivalents and short-term investments resulting primarily from cash expended for repurchasing the remainder of our 0.5% senior convertible debentures due 2024 (“Debentures”), and acquisitions.
43
Table of Contents
NOVELL, INC.
MANAGEMENT’S DISCUSSION AND ANALYSIS OF
FINANCIAL CONDITION AND RESULTS OF OPERATIONS (Continued)
Results of Operations – Fiscal 2009 as compared to Fiscal 2008 (Continued)
During fiscal 2009, we recorded an other-than-temporary impairment charge of $5.5 million related to our ARSs based on our assessment that it is likely that the fair value of the ARSs will not fully recover in the foreseeable future, given a combination of factors, including the duration, severity and continued declining trend of the fair value of these securities as well as a deterioration in some of the securities’ credit ratings.
Interest expense and other, net for fiscal 2009 decreased compared to fiscal 2008 due primarily to the Debenture repurchase, which resulted in lower interest expense.
Income Tax Expense on Income From Continuing Operations
| Fiscal Year Ended October 31, | ||||||||||
| (Dollars in thousands) | 2009 | 2008 | Change | |||||||
| Income tax expense |
$ | 10,666 | $ | 35,217 | (70)% | |||||
| Effective tax rate |
(5 | )% | 154 | % | ||||||
The effective tax rate on continuing operations for fiscal 2009 was (5%) compared to 154% for fiscal 2008. The fiscal 2009 rate of (5%) is the result of recording tax expense on a pre-tax book loss. This was primarily due to the $279.1 million of goodwill and intangible asset impairment charges recorded for book purposes in fiscal 2009 for which we received minimal current tax benefit. In the U.S. these impairment charges are either non-deductible or deductible over 15 years with a valuation allowance on the deferred asset, and outside the U.S. these impairment charges are attributable to jurisdictions where we receive little or no tax benefit.
In fiscal 2008 we had significant book to tax differences that increased fiscal 2008 taxable income primarily as a result of a large one-time cash payment to us in fiscal 2007 that we deferred for tax purposes to fiscal 2008. Because of these book-to-tax differences, we recorded significantly higher tax expense in the U.S. in fiscal 2008 when compared to fiscal 2009, resulting in the higher overall effective tax rate in fiscal 2008 compared to fiscal 2009. Included in the fiscal 2008 effective tax rate are $3.3 million in adjustments related to settlements of prior period audits and tax filings.
We continue to believe that it is more likely than not that most of our net deferred tax assets will not be realized based on all available evidence. As a result, we have provided a valuation allowance on those U.S. net deferred tax assets. In reaching this determination, we evaluated our three-year cumulative results, pre-tax losses in recent quarters, as well as the impacts that current economic conditions may have on our future results. It is reasonably possible that we could reduce a significant portion of our valuation allowance in the near-term.
Net Loss Components
| Fiscal Year Ended October 31, | ||||||||
| (In thousands) | 2009 | 2008 | ||||||
| Loss from continuing operations |
$ | (214,640 | ) | $ | (12,339 | ) | ||
| Income from discontinued operations, net of tax |
1,904 | 3,594 | ||||||
| Net loss |
$ | (212,736 | ) | $ | (8,745 | ) | ||
Discontinued operations for fiscal 2009 relate to the gains from the sale in March 2007 of Salmon as they met certain cumulative revenue targets. Discontinued operations for fiscal 2008 relates to the disposition of CTP Switzerland discussed in the “Divestitures” section, above.
44
Table of Contents
NOVELL, INC.
MANAGEMENT’S DISCUSSION AND ANALYSIS OF
FINANCIAL CONDITION AND RESULTS OF OPERATIONS (Continued)
Results of Operations – Fiscal 2008 as compared to Fiscal 2007
Revenue
| Fiscal Year Ended October 31, | ||||||||
| (Dollars in thousands) | 2008 | 2007 | Change | |||||
| Software licenses |
$ | 188,983 | $ | 175,548 | 8% | |||
| Maintenance and subscriptions |
616,493 | 566,355 | 9% | |||||
| Services |
151,037 | 190,596 | (21)% | |||||
| Total net revenue |
$ | 956,513 | $ | 932,499 | 3% | |||
Revenue in our software licenses category increased in fiscal 2008 compared to fiscal 2007 primarily due to increased license revenue from our Systems and Resource Management products, which included $11.7 million of software license revenue from the acquisition of PlateSpin, which we acquired in March 2008, and from our Identity and Security Management products. These increases were offset somewhat by an anticipated decrease in combined OES and NetWare-related license revenue.
Maintenance and subscriptions revenue increased in fiscal 2008 compared to fiscal 2007 primarily due to increased revenue from our Linux Platform Products, which increased $34.8 million, or 39%, and from higher Systems and Resource Management and Identity and Security Management maintenance and subscriptions revenue. Workgroup maintenance and subscriptions revenue was basically flat in fiscal 2008 compared to fiscal 2007.
Services revenue decreased in fiscal 2008 compared to fiscal 2007 reflecting the impact of realigning our services business to be more efficient and product focused.
Foreign exchange rate fluctuations favorably impacted revenue by $21.9 million in fiscal 2008 compared to fiscal 2007, as measured by using beginning of fiscal year foreign currency exchange rates on non-U.S. dollar denominated revenue.
Net revenue in the Open Platform Solutions segment was as follows:
| Fiscal Year Ended October 31, | ||||||||
| (Dollars in thousands) | 2008 | 2007 | Change | |||||
| Software licenses |
$ | 164 | $ | 197 | (17)% | |||
| Maintenance and subscriptions |
132,962 | 97,462 | 36% | |||||
| Services |
21,731 | 22,201 | (2)% | |||||
| Total net revenue |
$ | 154,857 | $ | 119,860 | 29% | |||
Revenue from our Open Platform Solutions segment increased in fiscal 2008 compared to fiscal 2007 primarily due to Linux Platform Products, which increased maintenance and subscriptions revenue by $34.8 million, or 39%. For Linux Platform Products, invoicing decreased $33.1 million, or 16% in fiscal 2008 compared to fiscal 2007. This decrease was primarily due to the high invoicing levels of $73.3 million in the first quarter of fiscal 2007 that followed the signing of the Microsoft Agreements. In fiscal 2008, the SLES certificates distributed by Microsoft accounted for 42% of Linux Platform Products invoicing.
Net revenue in the Identity and Security Management segment was as follows:
| Fiscal Year Ended October 31, | ||||||||
| (Dollars in thousands) | 2008 | 2007 | Change | |||||
| Software licenses |
$ | 56,623 | $ | 50,505 | 12% | |||
| Maintenance and subscriptions |
80,622 | 75,179 | 7% | |||||
| Services |
56,745 | 78,996 | (28)% | |||||
| Total net revenue |
$ | 193,990 | $ | 204,680 | (5)% | |||
Revenue from our Identity and Security Management segment decreased in fiscal 2008 compared to fiscal 2007 primarily due to lower services revenue reflecting the impact of realigning our services business as discussed above, partially offset by higher Identity, Access and Compliance Management product revenue, which increased 15% during the period. Invoicing for Identity, Access and Compliance Management products increased 25% in fiscal 2008 compared to fiscal 2007.
45
Table of Contents
NOVELL, INC.
MANAGEMENT’S DISCUSSION AND ANALYSIS OF
FINANCIAL CONDITION AND RESULTS OF OPERATIONS (Continued)
Results of Operations – Fiscal 2008 as compared to Fiscal 2007 (Continued)
Net revenue in the Systems and Resource Management segment was as follows:
| Fiscal Year Ended October 31, | ||||||||
| (Dollars in thousands) | 2008 | 2007 | Change | |||||
| Software licenses |
$ | 48,126 | $ | 34,692 | 39% | |||
| Maintenance and subscriptions |
122,040 | 113,056 | 8% | |||||
| Services |
23,055 | 27,868 | (17)% | |||||
| Total net revenue |
$ | 193,221 | $ | 175,616 | 10% | |||
Revenue from our Systems and Resource Management segment increased in fiscal 2008 compared to fiscal 2007 primarily as a result of $19.0 million of higher revenue from our PlateSpin and Senforce acquisitions. Senforce was acquired in the fourth quarter of fiscal 2007 and PlateSpin was acquired in the second quarter of fiscal 2008. Invoicing for Systems and Resource Management products increased 19% in fiscal 2008 compared to fiscal 2007.
Net revenue in the Workgroup segment was as follows:
| Fiscal Year Ended October 31, | ||||||||
| (Dollars in thousands) | 2008 | 2007 | Change | |||||
| Software licenses |
$ | 84,070 | $ | 90,154 | (7)% | |||
| Maintenance and subscriptions |
280,869 | 280,658 | —% | |||||
| Services |
49,506 | 61,531 | (20)% | |||||
| Total net revenue |
$ | 414,445 | $ | 432,343 | (4)% | |||
Revenue from our Workgroup segment decreased in fiscal 2008 compared to fiscal 2007 primarily from lower services revenue. Combined OES and NetWare-related revenue decreased $7.4 million, or 3%, partially offset by a $6.5 million, or 6%, increase in Collaboration revenue. Invoicing for the combined OES and NetWare-related products was basically flat in fiscal 2008 compared to fiscal 2007. Product invoicing for the Workgroup segment increased 1% in fiscal 2008 compared to fiscal 2007 after excluding the $108.0 million of invoicing in the first quarter of fiscal 2007 related to the signing of the Microsoft Agreements.
Deferred Revenue
We had total deferred revenue of $730.1 million at October 31, 2008 compared to $767.7 million at October 31, 2007. The decrease in total deferred revenue of $37.6 million is primarily attributable to the recognition of Microsoft-related deferred revenue during fiscal 2008.
Gross Profit
| Fiscal Year Ended October 31, | ||||||||||
| (Dollars in thousands) | 2008 | 2007 | Change | |||||||
| Software licenses gross profit |
$ | 171,753 | $ | 157,820 | 9% | |||||
| percentage of related revenue |
91 | % | 90 | % | ||||||
| Maintenance and subscriptions gross profit |
$ | 567,379 | $ | 519,234 | 9% | |||||
| percentage of related revenue |
92 | % | 92 | % | ||||||
| Services gross profit |
$ | (17,858 | ) | $ | (2,874 | ) | (521)% | |||
| percentage of related revenue |
(12 | )% | (2 | )% | ||||||
| Total gross profit |
$ | 721,274 | $ | 674,180 | 7% | |||||
| percentage of revenue |
75 | % | 72 | % | ||||||
Higher gross profit and gross profit as a percentage of related revenue for fiscal 2008 compared to fiscal 2007 reflects the benefits of our prior restructuring actions, other cost reduction initiatives and favorable foreign currency exchange rate fluctuations. Our overall gross profit improvement also reflected the benefits of realigning our services business to be more product focused resulting in a change in revenue mix from negative margin services revenue to higher-margin product revenue as discussed above. Foreign currency exchange rate fluctuations during fiscal 2008 compared to fiscal 2007 favorably impacted total gross profit by $16.1 million.
46
Table of Contents
NOVELL, INC.
MANAGEMENT’S DISCUSSION AND ANALYSIS OF
FINANCIAL CONDITION AND RESULTS OF OPERATIONS (Continued)
Results of Operations – Fiscal 2008 as compared to Fiscal 2007 (Continued)
Gross profit by business unit segment was as follows:
| Fiscal Year Ended October 31, | ||||||||||
| (Dollars in thousands) | 2008 | 2007 | Change | |||||||
| Open Platform Solutions |
$ | 113,171 | $ | 81,206 | 39% | |||||
| percentage of related revenue |
73 | % | 68 | % | ||||||
| Identity and Security Management |
$ | 114,364 | $ | 105,407 | 8% | |||||
| percentage of related revenue |
59 | % | 51 | % | ||||||
| Systems and Resource Management |
$ | 160,351 | $ | 143,097 | 12% | |||||
| percentage of related revenue |
83 | % | 81 | % | ||||||
| Workgroup |
$ | 346,226 | $ | 353,980 | (2)% | |||||
| percentage of related revenue |
84 | % | 82 | % | ||||||
| Common unallocated operating costs |
$ | (12,838 | ) | $ | (9,510 | ) | (35)% | |||
| Total gross profit |
$ | 721,274 | $ | 674,180 | 7% | |||||
| percentage of revenue |
75 | % | 72 | % | ||||||
The changes in gross profit in each of our segments as a percentage of related revenue in fiscal 2008 compared to fiscal 2007 can be characterized as follows:
| • | Open Platform Solutions — increased primarily due to higher revenue reflecting increased amounts of recognized revenue from the Microsoft Agreements, and cost containment efforts. |
| • | Identity and Security Management — increased primarily due to a more favorable mix of higher-margin product revenue and cost containment efforts. |
| • | Systems and Resource Management — increased primarily due to a more favorable mix of higher-margin product revenue. |
| • | Workgroup — increased as a percentage of revenue primarily due to cost containment efforts, but decreased in total dollars due to lower revenue. |
Operating Expenses
| Fiscal Year Ended October 31, | ||||||||||
| (Dollars in thousands) | 2008 | 2007 | Change | |||||||
| Sales and marketing |
$ | 368,719 | $ | 353,795 | 4% | |||||
| as a percent of net revenue |
39 | % | 38 | % | ||||||
| Product development |
$ | 191,547 | $ | 201,420 | (5)% | |||||
| as a percent of net revenue |
20 | % | 22 | % | ||||||
| General and administrative |
$ | 113,529 | $ | 128,985 | (12)% | |||||
| as a percent of net revenue |
12 | % | 14 | % | ||||||
| Restructuring expenses |
$ | 28,645 | $ | 43,097 | (34)% | |||||
| as a percent of net revenue |
3 | % | 5 | % | ||||||
| Impairment of intangible assets |
$ | 7,664 | $ | 3,851 | 99% | |||||
| as a percent of net revenue |
1 | % | — | % | ||||||
| Loss (gain) on sale of subsidiaries |
$ | 3,694 | $ | (1,200 | ) | 408% | ||||
| as a percent of net revenue |
— | % | — | % | ||||||
| Purchased in-process research and development |
$ | 2,700 | $ | — | —% | |||||
| as a percent of net revenue |
— | % | — | % | ||||||
| Total operating expenses |
$ | 716,498 | $ | 729,948 | (2)% | |||||
| as a percent of net revenue |
75 | % | 78 | % | ||||||
Sales and marketing
Sales and marketing expenses increased in fiscal 2008 compared to fiscal 2007 primarily due to $13.3 million of sales and marketing expenses from PlateSpin, which was acquired during the second quarter of fiscal 2008, and $10.6 million of unfavorable foreign currency exchange rate fluctuations. These increases were partially offset by cost reductions from our recent restructuring actions. Sales and marketing headcount was lower by 13 employees, or 1%, at the end of fiscal 2008 compared to fiscal 2007.
47
Table of Contents
NOVELL, INC.
MANAGEMENT’S DISCUSSION AND ANALYSIS OF
FINANCIAL CONDITION AND RESULTS OF OPERATIONS (Continued)
Results of Operations – Fiscal 2008 as compared to Fiscal 2007 (Continued)
Product development
Product development expenses decreased in fiscal 2008 compared to fiscal 2007 reflecting the benefits of our strategic initiative of integrating our product development approach and balancing between on and offshore development locations. These expense decreases were partially offset by an additional $6.4 million of expense related to PlateSpin, as well as $3.8 million of unfavorable foreign currency exchange rate fluctuations. Product development headcount increased by 85 employees, or 6%, at the end of fiscal 2008 compared to fiscal 2007, due primarily to increases from the PlateSpin and SiteScape acquisitions.
General and administrative
General and administrative expenses decreased in fiscal 2008 compared to fiscal 2007 primarily due to the completion of our historical stock-based compensation review in the third quarter of fiscal 2007, which added $16.2 million of expenses in fiscal 2007. These decreases were partially offset by $2.2 million of general and administrative expenses related to PlateSpin and $1.9 million unfavorable foreign currency exchange rate fluctuations. General and administrative headcount was lower by 16 employees, or 3%, at the end of fiscal 2008 compared to fiscal 2007.
Restructuring expenses
During fiscal 2008, we recorded net restructuring expenses of $28.6 million. This was comprised of $31.0 million in restructuring activities recognized during fiscal 2008 and $2.4 million in reductions of accruals for restructuring activities recorded in prior periods.
The restructuring actions undertaken during fiscal 2008 were a continuation of the restructuring plan that we began during the fourth quarter of fiscal 2006. The restructuring plan was related to our strategy to implement a comprehensive transformation of our business and to achieve competitive operating margins. This strategy had four main initiatives: 1) improving our sales model and sales staff specialization; 2) integrating our product development approach and balancing between on and offshore development locations; 3) improving our administrative and support functions; and 4) transforming our services business to be more efficient and product focused. Specific actions taken during fiscal 2008 included reducing our workforce by 364 employees. At October 31, 2008, our total headcount was approximately 4,000. We also vacated several facilities and terminated some service provider contracts.
Impairment of intangible assets
In the third quarter of fiscal 2008, we acquired $12.0 million of developed technology, which was integrated into our Identity and Security Management business unit segment. During the fourth quarter of fiscal 2008, we completed our detailed internal reviews of the technology and determined that we would not utilize all of the acquired developed technology as initially planned. These reviews determined that only a portion of the acquired developed technology would be utilized in our products. We used discounted cash flow models to estimate the fair value of this acquired developed technology based upon the updated plans, and determined that $7.7 million had become impaired. This intangible asset was written down and the related charge was recorded as a component of operating expenses in the consolidated statements of operations during fiscal 2008. The entire $7.7 million impairment charge related to the Identity and Security Management business unit segment. As part of this review, it was determined that the estimated useful life of the remaining asset would be four years.
The impairment of intangible assets of $3.9 million in fiscal 2007 related to developed technology, customer relationship and trade name intangible assets acquired as a part of the e-Security acquisition. During fiscal 2007, as part of our periodic review of intangible assets, we determined that e-Security’s financial performance declined significantly and that its estimated future undiscounted direct cash flows would not be sufficient to cover the carrying value of its intangible assets. We used discounted cash flow models to estimate the value of e-Security’s intangible assets and determined that $2.5 million, $1.3 million and $0.1 million of e-Security’s developed technology, customer relationship and trade name intangible assets, respectively, had become impaired. These intangible assets were written down and the related charges were recorded as a component of operating expenses in the consolidated statements of operations during fiscal 2007. This entire $3.9 million impairment charge related to the Identity and Security Management business unit segment.
48
Table of Contents
NOVELL, INC.
MANAGEMENT’S DISCUSSION AND ANALYSIS OF
FINANCIAL CONDITION AND RESULTS OF OPERATIONS (Continued)
Results of Operations – Fiscal 2008 as compared to Fiscal 2007 (Continued)
Loss (gain) on sale of subsidiaries
The fiscal 2008 loss on sale of subsidiaries resulted from the divestiture of our Mexico and Argentina subsidiaries discussed in the “Divestitures” section, above. The fiscal 2007 gain on sale of subsidiaries relates to the contingent earn-out received for the JCG, discussed in the “Divestitures” section, above.
Purchased in-process research and development
Purchased in-process research and development of $2.7 million during fiscal 2008 related to the PlateSpin acquisition. At the acquisition date, PlateSpin was developing the next release of its three major products. These releases had not yet reached technological feasibility at the time of the acquisition. The purchased in-process research and development did not have any alternative future use and did not otherwise qualify for capitalization. As a result, this amount was expensed upon acquisition.
Foreign currency exchange rate fluctuations
Foreign currency exchange rate fluctuations during fiscal 2008 compared to fiscal 2007 favorably impacted revenue by $21.9 million, unfavorably impacted operating expenses by $22.0 million and unfavorably impacted income (loss) from operations by $0.1 million.
Other Income (Expense), Net
| Fiscal Year Ended October 31, | ||||||||||
| (Dollars in thousands) | 2008 | 2007 | Change | |||||||
| Investment income |
$ | 71,640 | $ | 86,531 | (17)% | |||||
| as a percent of net revenue |
7 | % | 9 | % | ||||||
| Impairment of investments |
$ | (30,024 | ) | $ | — | —% | ||||
| as a percent of net revenue |
(3 | )% | — | % | ||||||
| Gain on sale of venture capital funds |
$ | — | $ | 3,591 | —% | |||||
| as a percent of net revenue |
— | % | — | % | ||||||
| Interest expense and other, net |
$ | (23,514 | ) | $ | (25,939 | ) | 9% | |||
| as a percent of net revenue |
(2 | )% | (3 | )% | ||||||
| Total other income, net |
$ | 18,102 | $ | 64,183 | (72)% | |||||
| as a percent of net revenue |
2 | % | 7 | % | ||||||
Investment income includes income from short-term and long-term investments. Investment income for fiscal 2008 decreased compared to fiscal 2007 due primarily to a decrease in cash, cash equivalents and short-term investments resulting primarily from the PlateSpin acquisition, repurchases of $474.3 million face value of our Debentures, our stock repurchase program, and lower interest rates.
During fiscal 2008, we recorded an other-than-temporary impairment charge of $28.7 million related to our ARSs based on our assessment that it is likely that the fair value of the ARSs will not fully recover in the foreseeable future, given a combination of factors, including the duration, severity and continued declining trend of the fair value of these securities as well as a deterioration in some of the securities’ credit ratings. At October 31, 2008, we held $1.5 million of Lehman Brothers’ corporate notes. As a result of Lehman Brothers’ bankruptcy announcement, a $1.3 million other-than-temporary charge was recorded in fiscal 2008 related to this security. During fiscal 2009, we sold this security for a minimal gain.
During the first quarter of fiscal 2007, we sold the final portion of our venture capital funds, resulting in a gain of $3.6 million.
Interest expense and other, net for fiscal 2008 decreased compared to fiscal 2007 due primarily from the Debenture repurchases, which resulted in a $4.6 million gain, and from lower interest expense. At October 31, 2008, we had repurchased $474.3 million of the original $600 million of Debentures.
49
Table of Contents
NOVELL, INC.
MANAGEMENT’S DISCUSSION AND ANALYSIS OF
FINANCIAL CONDITION AND RESULTS OF OPERATIONS (Continued)
Results of Operations – Fiscal 2008 as compared to Fiscal 2007 (Continued)
Income Tax Expense on Income from Continuing Operations
| Fiscal Year Ended October 31, | ||||||||||
| (Dollars in thousands) | 2008 | 2007 | Change | |||||||
| Income tax expense |
$ | 35,217 | $ | 34,691 | 2% | |||||
| Effective tax rate |
154 | % | 412 | % | ||||||
The effective tax rate on continuing operations for fiscal 2008 was 154% compared to an effective tax rate of 412% for the same period in fiscal 2007. In both fiscal 2007 and 2008 we had U.S. income tax expense resulting primarily from the use of previously reserved U.S. net operating loss carryovers, the benefit of which was credited to additional paid-in capital or goodwill. In fiscal 2008 we had significant book to tax differences that increased U.S. fiscal 2008 taxable income primarily as a result of a large one-time cash payment to us in fiscal 2007 that we deferred for tax purposes to fiscal 2008. U.S. taxes increased year over year due to this one-time payment while foreign taxes decreased primarily due to a reduction in reserves for unrecognized tax benefits credited to foreign income tax expense. As a result of these items, we had comparable tax expense in fiscal 2008 and fiscal 2007 even though the book earnings were much lower in fiscal 2007.
Net Loss Components
| Fiscal Year Ended October 31, | ||||||||
| (In thousands) | 2008 | 2007 | ||||||
| Loss from continuing operations |
$ | (12,339 | ) | $ | (26,276 | ) | ||
| Income (loss) from discontinued operations, net of tax |
3,594 | (18,184 | ) | |||||
| Net loss |
$ | (8,745 | ) | $ | (44,460 | ) | ||
Discontinued operations relates to the sales of CTP Switzerland and Salmon, discussed in the “Divestitures” section, above.
Restructuring Expenses
Fiscal 2009
During fiscal 2009, we recorded net restructuring expenses of $25.2 million. This was comprised of $10.2 million in restructuring expenses under our current restructuring plan, which we began implementing in the third quarter of fiscal 2009 in response to current economic conditions, $13.9 million for restructuring actions incurred for the completion of the restructuring plan that we began during the fourth quarter of fiscal 2006 and completed during the second quarter of fiscal 2009, and $1.1 million in additions to accruals for changes in estimates related to prior period restructuring activities.
The $10.2 million recorded under our current restructuring plan is in response to current economic conditions. As part of that plan, we reduced our workforce by 191 employees, which was comprised of: 90 product development employees, 73 sales and marketing employees, 12 technical support employees, 9 general and administrative employees, 5 consulting employees and 2 operations employees. We also vacated a facility and recorded $0.5 million in restructuring charges for lease exit costs. At October 31, 2009, our total headcount was approximately 3,600. The following table summarizes the activity related to this restructuring action:
| (In thousands) | Severance and Benefits |
Excess Facilities |
Other Restructuring Related Costs |
Total | ||||||||||||
| Original reserve |
$ | 9,225 | $ | 526 | $ | 419 | $ | 10,170 | ||||||||
| Cash payments |
(2,684 | ) | (13 | ) | (419 | ) | (3,116 | ) | ||||||||
| Balance at October 31, 2009 |
$ | 6,541 | $ | 513 | $ | — | $ | 7,054 | ||||||||
The remaining unpaid balance as of October 31, 2009 is primarily for severance, which we expect to pay over the next twelve months, and lease costs for redundant facilities, which we expect to pay over the respective remaining contract terms, the longest of which extends to 2013.
50
Table of Contents
NOVELL, INC.
MANAGEMENT’S DISCUSSION AND ANALYSIS OF
FINANCIAL CONDITION AND RESULTS OF OPERATIONS (Continued)
Restructuring Expenses (Continued)
The $13.9 million of fiscal 2009 restructuring actions are a completion of the restructuring plan that we began during the fourth quarter of fiscal 2006 and completed during the second quarter of fiscal 2009. This restructuring plan was related to our strategy to implement a comprehensive transformation of our business and to achieve competitive operating margins. As part of that plan, during fiscal 2009, we reduced our workforce by 150 employees, which was comprised of: 68 product development employees, 36 technical support employees, 13 general and administrative employees, 18 sales and marketing employees, 11 consulting employees and four operations employees. We also vacated several facilities and recorded $4.4 million in restructuring charges for lease exit costs. The following table summarizes the activity related to this restructuring action:
| (In thousands) | Severance and Benefits |
Excess Facilities |
Total | |||||||||
| Original reserve |
$ | 9,528 | $ | 4,408 | $ | 13,936 | ||||||
| Cash payments |
(9,463 | ) | (1,471 | ) | (10,934 | ) | ||||||
| Balance at October 31, 2009 |
$ | 65 | $ | 2,937 | $ | 3,002 | ||||||
The remaining unpaid balance as of October 31, 2009 is primarily for lease costs for redundant facilities, which we expect to pay over the respective remaining contract terms, the longest of which extends to 2018.
Fiscal 2008
During fiscal 2008, we recorded net restructuring expenses of $28.6 million. This was comprised of $31.0 million in restructuring activities recognized during fiscal 2008 and $2.4 million in reductions of accruals for restructuring activities recorded in prior periods.
The restructuring actions undertaken during fiscal 2008 were a continuation of the restructuring plan that we began during the fourth quarter of fiscal 2006. The restructuring plan is related to our strategy to implement a comprehensive transformation of our business and to achieve competitive operating margins. Specific actions taken during fiscal 2008 included reducing our workforce by 364 employees. The following table summarizes the activity related to the fiscal 2008 restructuring:
| (In thousands) | Severance and Benefits |
Excess Facilities |
Other Restructuring Related Costs |
Total | ||||||||||||
| Original reserve |
$ | 25,583 | $ | 3,492 | $ | 1,949 | $ | 31,024 | ||||||||
| Cash payments |
(10,893 | ) | (2,213 | ) | (1,576 | ) | (14,682 | ) | ||||||||
| Non-cash adjustments |
37 | (41 | ) | (144 | ) | (148 | ) | |||||||||
| Balance at October 31, 2008 |
14,727 | 1,238 | 229 | 16,194 | ||||||||||||
| Cash payments |
(15,006 | ) | (734 | ) | (217 | ) | (15,957 | ) | ||||||||
| Non-cash adjustments |
901 | 331 | (12 | ) | 1,220 | |||||||||||
| Balance at October 31, 2009 |
$ | 622 | $ | 835 | $ | — | $ | 1,457 | ||||||||
The remaining unpaid balance as of October 31, 2009 is primarily for lease costs for redundant facilities, which we expect to pay over the respective remaining contract terms, the longest of which extends to 2013, and for severance, which we expect to pay over the next twelve months.
Fiscal 2007
During fiscal 2007, we recorded net restructuring expenses of $43.1 million, of which $43.3 million related to restructuring activities recognized during fiscal 2007 and $0.2 million related to net releases of previously recorded restructuring liabilities. The fiscal 2007 restructuring action is a continuation of the restructuring plan that we began implementing during the fourth quarter of fiscal 2006 and continued throughout fiscal 2007 and is related to our strategy discussed above.
51
Table of Contents
NOVELL, INC.
MANAGEMENT’S DISCUSSION AND ANALYSIS OF
FINANCIAL CONDITION AND RESULTS OF OPERATIONS (Continued)
Restructuring Expenses (Continued)
Specific actions taken during fiscal 2007 included reducing our workforce by 619 employees and exiting several facilities. The following table summarizes the activity related to the fiscal 2007 restructuring:
| (In thousands) | Severance and Benefits |
Excess Facilities |
Other Restructuring Related Costs |
Total | ||||||||||||
| Original reserve |
$ | 38,796 | $ | 4,238 | $ | 289 | $ | 43,323 | ||||||||
| Cash payments |
(17,383 | ) | (1,988 | ) | (273 | ) | (19,644 | ) | ||||||||
| Non-cash adjustments |
(103 | ) | (149 | ) | (2 | ) | (254 | ) | ||||||||
| Balance at October 31, 2007 |
21,310 | 2,101 | 14 | 23,425 | ||||||||||||
| Cash payments |
(20,189 | ) | (1,143 | ) | (14 | ) | (21,346 | ) | ||||||||
| Non-cash adjustments |
(974 | ) | 241 | — | (733 | ) | ||||||||||
| Balance at October 31, 2008 |
147 | 1,199 | — | 1,346 | ||||||||||||
| Cash payments |
(40 | ) | (1,007 | ) | — | (1,047 | ) | |||||||||
| Non-cash adjustments |
(107 | ) | 156 | — | 49 | |||||||||||
| Balance at October 31, 2009 |
$ | — | $ | 348 | $ | — | $ | 348 | ||||||||
The remaining unpaid balance as of October 31, 2009 is for lease costs for redundant facilities which we expect to pay over the respective remaining contract terms, the longest of which extends to 2012.
Liquidity and Capital Resources
| (Dollars in thousands) | October 31, 2009 |
October 31, 2008 |
Percentage Change |
||||||||
| Cash, cash equivalents, and short-term investments |
$ | 983,465 | $ | 1,067,847 | (8 | )% | |||||
| Percentage of total assets |
52 | % | 47 | % | |||||||
An overview of the significant cash flow activities are explained below:
| (in thousands) | Fiscal 2009 | Fiscal 2008 | Fiscal 2007 | |||||||||
| Net cash provided by operating activities |
$ | 68,770 | $ | 55,870 | $ | 411,794 | ||||||
| Proceeds from sales of and distributions from long-term investments |
4,209 | 24,757 | 2,917 | |||||||||
| Cash restricted due to litigation |
(332 | ) | (52,701 | ) | — | |||||||
| Net cash proceeds from sale of discontinued operations |
1,036 | 564 | 783 | |||||||||
| Net cash paid for acquisitions |
(48,472 | ) | (219,553 | ) | (29,704 | ) | ||||||
| Purchase of intangible assets |
— | (12,000 | ) | (1,175 | ) | |||||||
| Purchases of property, plant and equipment |
(22,087 | ) | (37,716 | ) | (25,235 | ) | ||||||
| Issuance of common stock |
3,566 | 13,297 | 21,786 | |||||||||
| Common stock repurchases/retirements |
— | (66,820 | ) | — | ||||||||
| (Repayment) issuance of debt |
(4,658 | ) | 4,795 | — | ||||||||
| Debenture repurchases |
(125,537 | ) | (456,500 | ) | — | |||||||
Net cash provided by operating activities in fiscal 2007 included the receipt of $355.6 million in cash in connection with the Microsoft Agreements.
As of October 31, 2009, we had cash, cash equivalents and short-term investments of $415.1 million held in accounts outside the United States, which would largely be subject to punitive taxation if repatriated. Our short-term investment portfolio is diversified among security types, industry groups, and individual issuers. As of October 31, 2009, $6.9 million of our short-term investments are designated to fund deferred compensation payments, which are paid out as requested by participants in the Novell, Inc. Deferred Compensation Plan upon termination. As of October 31, 2009, our short-term investment portfolio includes gross unrealized gains and losses of $7.3 million and $1.0 million, respectively. We monitor our investments and record losses when a decline in the investment’s market value is determined to be other-than-temporary.
At October 31, 2009 and October 31, 2008, all of our ARSs were classified as long-term investments on our consolidated balance sheets, and at October 31, 2009, were our only long-term investments. Contractual maturities for these ARSs are 15 years or greater
52
Table of Contents
NOVELL, INC.
MANAGEMENT’S DISCUSSION AND ANALYSIS OF
FINANCIAL CONDITION AND RESULTS OF OPERATIONS (Continued)
Liquidity and Capital Resources (Continued)
with an interest rate reset date approximately every 28 to 90 days. With the liquidity issues experienced in the global credit and capital markets, our ARSs have experienced multiple failed auctions.
During fiscal 2009, we recorded other-than-temporary impairment charges on our ARSs of $5.5 million, based on our assessment that it is likely that the fair value of the ARSs will not fully recover in the foreseeable future, given a combination of factors, including the duration, severity and continued declining trend of the fair value of these securities as well as a deterioration in some of the securities’ credit ratings. During fiscal 2008, we recorded an other-than-temporary impairment charge of $28.7 million. We consider all of our other-than-temporary losses to be credit losses and therefore these losses have been recorded in the “Impairment of investments” line item in our consolidated statements of operations. We estimated that the fair market value of these securities at October 31, 2009 and October 31, 2008 was $10.3 million and $11.1 million, respectively. During fiscal 2009, we sold two of our ARSs for $0.3 million. These two securities had an aggregate cost basis of $10.0 million and had been entirely impaired prior to the sale. Late in fiscal 2009, our remaining six ARSs had improvements in their estimated fair value resulting in a $4.7 million unrealized gain. At October 31, 2009, the original cost of the remaining ARSs was $29.8 million.
The fair value of the ARSs could change in the future and we may be required to record additional other-than-temporary impairment charges if there are further reductions in fair value in future periods.
During fiscal 2008, our holdings in an enhanced liquidity fund were frozen due to liquidity issues. The fund manager continued to distribute cash on a pro rata basis to the fund’s stockholders as the underlying securities matured. Those distributions that were forecasted to be received more than twelve months after the balance sheet date were classified as a long-term investment on our consolidated balance sheets. At October 31, 2008, the short-term and long-term portions of this fund were $18.4 million and $3.9 million, respectively. During fiscal 2009, we received distributions at par for the remaining $22.3 million balance of the fund.
Based on our ability to access our cash, cash equivalents, and short-term investments, our expected operating cash flows, and our other potential sources of cash, we do not anticipate that the lack of liquidity in our ARSs will affect our ability to operate our business in the usual course over the next twelve months.
In relation to the appeal we filed in the Amer Jneid legal matter, we were required by the court to post a $51.5 million bond during fiscal 2008 (See Note S, “Legal Proceedings” in the notes to the consolidated financial statements). The amount of the bond was determined by statutory regulations and has no connection to the amount we may ultimately pay in this matter. The bond is held in an interest-bearing account in our name, but is restricted and classified as such on our consolidated balance sheet. The restriction will continue until the resolution of this legal matter. The bond earned interest of $0.3 million and $1.1 million, in fiscal 2009 and 2008, respectively. As of October 31, 2009, restricted cash was $53.0 million.
According to the terms of the Open Invention Network, LLC (“OIN”) agreement under which we have a $20.0 million or 17% interest in OIN, we could be required to make future cash contributions that we plan to fund with cash from operating activities and cash on hand. OIN is a privately-held company that has and is expected to continue to acquire patents to promote Linux and open source by offering its patents on a royalty-free basis to any company, institution or individual that agrees not to assert its patents against the Linux operating system or certain Linux-related applications.
As of October 31, 2009, we have various operating leases related to our facilities. These leases have minimum annual lease commitments of $12.4 million in fiscal 2010, $10.9 million in fiscal 2011, $9.6 million in fiscal 2012, $6.0 million in fiscal 2013, $4.8 million in fiscal 2014, and $11.7 million thereafter. We also have $19.4 million of minimum rentals to be received in the future from subleases.
During fiscal 2008, we received authorization from our Board of Directors to repurchase, from time to time, up to $600 million face value of the Debentures in such quantities, at such prices and in such manner as may be directed by our management. During fiscal 2008, we purchased and retired $474.3 million face value of the Debentures for total cash consideration of $456.5 million.
During the first quarter of fiscal 2009, we purchased and retired $4.0 million face value of the Debentures under this plan for total cash consideration of $3.9 million, including less than $0.1 million of accrued interest. During the third quarter of fiscal 2009, in accordance with the terms of the Debentures, we offered to repurchase our outstanding Debentures. As a result, we repurchased the
53
Table of Contents
NOVELL, INC.
MANAGEMENT’S DISCUSSION AND ANALYSIS OF
FINANCIAL CONDITION AND RESULTS OF OPERATIONS (Continued)
Liquidity and Capital Resources (Continued)
remaining $121.7 million of outstanding Debentures at face value and paid $0.1 million, primarily for legal fees incurred in connection with the repurchase.
During fiscal 2008, we issued $4.8 million of debt to finance leasehold improvements for our Bangalore, India product development facility. During fiscal 2009, we repaid this obligation in full.
Our contractual obligations as of October 31, 2009 are as follows:
| Payments Due by Period | |||||||||||||||
| (in millions) | Total | Less Than 1 Year (2010) |
1-3 Years (2011-2012) |
3-5 Years (2013-2014) |
More Than 5 Years (2014+) | ||||||||||
| Purchase obligations (a) (b) |
$ | 157.7 | $ | 36.2 | $ | 61.0 | $ | 55.4 | $ | 5.1 | |||||
| Operating lease obligations |
55.4 | 12.4 | 20.5 | 10.8 | 11.7 | ||||||||||
| Uncertain tax reserves (c) |
35.4 | 22.9 | 4.9 | 1.6 | 6.0 | ||||||||||
| Letters of credit |
8.7 | 8.7 | — | — | — | ||||||||||
| Total |
$ | 257.2 | $ | 80.2 | $ | 86.4 | $ | 67.8 | $ | 22.8 | |||||
| (a) | Purchase obligations represent future contracted payments entered into as a part of the normal course of business that are not recorded as liabilities at October 31, 2009. |
| (b) | Included in this amount is the five-year contract to outsource the majority of our internal IT systems and operations to ACS. |
| (c) | The timing of the payouts is estimated and subject to change. |
Our principal sources of liquidity continue to be from operating activities, cash on hand, and short-term investments. At October 31, 2009, our principal unused sources of liquidity consisted of cash, cash equivalents and short-term investments of $983.5 million, of which $415.1 million is held in accounts outside the United States and would be subject to punitive taxation if repatriated. Our liquidity needs for the next twelve months and beyond are principally for financing of property, plant and equipment, repurchases of common stock under our share repurchase plan, payments under our restructuring plans, product development investments, and maintaining flexibility in a dynamic and competitive operating environment, including pursuing potential acquisition and investment opportunities.
Barring unforeseen circumstances, we anticipate being able to fund these liquidity needs for the next twelve months with existing cash, cash equivalents, and short-term investments together with cash generated from operating activities and investment income. We believe that offerings of equity or debt securities are possible for expenditures beyond the next twelve months, if the need arises, although such offerings may not be available to us on acceptable terms and are dependent on market conditions at such time.
Off-Balance Sheet Arrangements
At October 31, 2009, we had no off-balance sheet arrangements as defined by applicable SEC rules.
Recent Pronouncements
In December 2007, the FASB issued new accounting guidance related to business combinations. This guidance establishes principles and requirements for how an acquiring company: 1) recognizes and measures in its financial statements the identifiable assets acquired, the liabilities assumed, and any non-controlling interest in the acquiree; 2) recognizes and measures the goodwill acquired in the business combination or a gain from a bargain purchase; and 3) discloses information to enable users of the financial statements to evaluate the nature and financial effects of the business combination. This guidance is effective for business combinations occurring on or after the beginning of the fiscal year beginning on or after December 15, 2008 (our fiscal 2010). For acquisitions that close after November 1, 2009 or for any acquisition-related tax adjustments, including any release of deferred tax asset valuation allowances, that occur after November 1, 2009, this pronouncement will impact our financial position and results of operations.
54
Table of Contents
NOVELL, INC.
MANAGEMENT’S DISCUSSION AND ANALYSIS OF
FINANCIAL CONDITION AND RESULTS OF OPERATIONS (Continued)
Recent Pronouncements (Continued)
In April 2009, the FASB issued new guidance related to accounting for assets acquired and liabilities assumed in a business combination that arise from contingencies. These rules provide guidance and clarification in measuring, accounting, and disclosing acquired contingent assets and liabilities. These rules are effective for business combinations occurring on or after the beginning of the fiscal year beginning on or after December 15, 2008 (our fiscal 2010). For acquisitions that close after November 1, 2009 that have contingent assets or liabilities, this pronouncement will impact our financial position and results of operations.
In December 2007, the FASB issued new guidance related to noncontrolling interests in consolidated financial statements. This guidance requires that the ownership interests in subsidiaries held by parties other than the parent be clearly identified, labeled, and presented in the consolidated statement of financial position within equity, but separate from the parent’s equity. It also requires that the amount of consolidated net income attributable to the parent and to the noncontrolling interest be clearly identified and presented on the face of the consolidated statement of income. This guidance is effective for fiscal years and fiscal quarters beginning on or after December 15, 2008 (our fiscal 2010). The impact of this pronouncement on our financial position and results of operations is anticipated to be immaterial.
In April 2008, the FASB issued new guidance for estimating the useful lives of recognized intangible assets and required additional disclosures related to renewing or extending the terms of a recognized intangible asset. In estimating the useful life of a recognized intangible asset, companies are required to consider their historical experience in renewing or extending similar arrangements together with the asset’s intended use, regardless of whether the arrangements have explicit renewal or extension provisions. This guidance is effective for fiscal years beginning after December 15, 2008 (our fiscal 2010), and is to be applied prospectively to intangible assets acquired after the effective date. The disclosure requirements are to be applied prospectively to all intangible assets. For intangible assets acquired after November 1, 2009, this pronouncement may impact our financial position and results of operations.
In June 2009, the FASB issued new guidance to replace the quantitative-based risks and rewards calculation for initially determining which enterprise, if any, has a controlling financial interest in, and will be required to consolidate, a variable interest entity. A variable interest entity is defined as an entity that will need additional funding to operate. Companies are now required to follow a more qualitative approach, focused on identifying which enterprise has the power to direct the activities of the variable interest entity that most significantly impacts the variable interest entity’s economic performance. Companies are also required to perform ongoing assessments of which enterprise, if any, will have to consolidate the variable interest entity. Additional disclosures are also required. This guidance is effective for fiscal years beginning after November 15, 2009 (our fiscal 2011). The impact of this pronouncement on our financial position and results of operations is anticipated to be immaterial.
In August 2009, the FASB issued additional guidance regarding fair value measurements. This guidance provides clarification for circumstances in which a quoted price in an active market for the identical liability is not available. In these circumstances, a reporting entity is required to measure fair value using one or more of the following methods: (1) a valuation technique that uses a) the quoted price of the identical liability when traded as an asset or b) quoted prices for similar liabilities or similar liabilities when traded as assets and/or (2) a valuation technique that is consistent with U.S. GAAP (e.g. an income approach or market approach). This guidance also clarifies that when estimating the fair value of a liability, a reporting entity is not required to include inputs relating to the existence of transfer restrictions on that liability. This guidance is effective for fiscal years and fiscal quarters beginning after August 26, 2009 (our first quarter of fiscal 2010). The adoption of this standard is not anticipated to have any impact on our financial position or results of operations.
In January 2009, the SEC issued its final rules requiring public companies to provide their financial statements and financial statement schedules to the SEC and their corporate websites in interactive data format using eXtensible Business Reporting Language (“XBRL”). XBRL is a standardized, machine-readable language designed to enhance the electronic communication of business information and should make business information more accessible. These rules will not change the SEC’s existing requirement to provide financial statements in the traditional format. Under these rules, we will be required to file our financial statements for the third quarter of fiscal 2010 using XBRL, in addition to our traditional filing format.
55
Table of Contents
NOVELL, INC.
MANAGEMENT’S DISCUSSION AND ANALYSIS OF
FINANCIAL CONDITION AND RESULTS OF OPERATIONS (Continued)
Subsequent Event
On December 14, 2009, we announced a reorganization of our structure and management to better align our business with our strategic objective of becoming an industry leader in the emerging IWM market, while continuing to develop collaboration solutions. These changes are designed to simplify the organization and provide a clear focus on markets that leverage our strengths to capture future opportunities for growth.
Effective January 1, 2010, we will consolidate our business unit segments from four to two. Our current Identity and Security Management, Systems and Resource Management and Open Platform Solutions business unit segments will be integrated to create the new Security, Management and Operating Platforms business unit segment. Our current Workgroup business unit segment will be renamed Collaboration Solutions.
As of the filing of this Annual Report on Form 10-K, we have not yet finalized our reporting units for financial statement reporting purposes as a result of these organizational changes. In accordance with segment reporting accounting guidance, we are required to perform a goodwill impairment review when our operating segments change. We presently do not expect to incur any goodwill impairment charges as a result of this reorganization in the first quarter of fiscal 2010.
Item 7A. Quantitative and Qualitative Disclosures About Market Risk
We are exposed to financial market risks, including changes in interest rates, foreign currency exchange rates, and market prices of equity securities. To mitigate some of these risks, we utilize currency forward contracts and currency options. We do not use derivative financial instruments for speculative or trading purposes, and no significant derivative financial instruments were outstanding at October 31, 2009.
Interest Rate Risk
The primary objective of our short-term investment activities is to preserve principal while maximizing yields without significantly increasing risk. Our strategy is to invest in widely diversified short-term investments, consisting primarily of investment grade securities, substantially all of which either mature within the next twelve months or have characteristics of short-term investments. A hypothetical 50 basis point increase in interest rates would result in an approximate $3.5 million decrease (less than 1%) in the fair value of our available-for-sale securities. With what we believe to be the conservative nature of our investments and our strong cash and short-term investment position, we believe that we are in a good position to endure the current economic conditions, barring unforeseen circumstances.
Market Risk
We have experienced market risk and liquidity issues related to our investment funds. See the “Liquidity and Capital Resources” section in Management’s Discussion and Analysis for more detail on these investments. We hold available-for-sale equity securities in our short-term investment portfolio related to our deferred compensation plan. As of October 31, 2009, the gross unrealized loss before tax effect on the short-term public equity securities totaled $1.0 million. A reduction in prices of 10% of these short-term equity securities would result in an approximately $0.7 million decrease (less than 0.2%) in the fair value of our short-term investments.
As a result of the failure of the auctions for our ARSs, and the ensuing duration, severity and continued decline of the fair value of these securities, we recorded an other-than-temporary impairment charge of $5.5 million on our ARSs in fiscal 2009. We estimate that these securities have a fair value of $10.3 million at October 31, 2009. If the issuers are unable to successfully close future auctions and their credit ratings significantly deteriorate, we may be required to further adjust the carrying value of these investments and recognize additional other-than-temporary declines in fair value. During fiscal 2009, we sold two of our ARSs for $0.3 million. These two securities had an aggregate cost basis of $10.0 million and had been entirely impaired prior to the sale. At October 31, 2009, the original cost of the remaining ARSs was $29.8 million.
We continue to closely monitor current economic and market events to minimize our market risk on our investment portfolio. Based on our ability to access our cash and other short-term investments, our expected operating cash flows, and our other potential sources of cash, we do not anticipate that the lack of liquidity on these investments will affect our ability to operate our business in the usual course in the next twelve months.
56
Table of Contents
NOVELL, INC.
PART II
Item 7A. Quantitative and Qualitative Disclosures About Market Risk (Continued)
Foreign Currency Risk
We use derivatives to hedge those net assets and liabilities that, when re-measured or settled according to accounting principles generally accepted in the United States, impact our consolidated statements of operations. Currency forward contracts are utilized in our hedging program and are entered into for the sole purpose of hedging an existing or anticipated currency exposure, not for speculation or trading purposes. Gains and losses on currency forward contracts should generally be offset by corresponding gains and losses on the net foreign currency assets and liabilities that they hedge, resulting in negligible net gain or loss overall on the hedged exposures. Gains and losses on currency forward contracts used in our hedging program are recognized in other income (expense) in our consolidated statements of operations in the same period that the gains and losses on the re-measurement of the related foreign currency denominated assets and liabilities occur. Gains and losses related to foreign exchange contracts are included in cash flows from operating activities in our consolidated statements of cash flows. Our hedging program reduces, but does not always entirely eliminate, the impact of foreign currency exchange rate movements. If we do not hedge against foreign currency exchange rate movements, an increase or decrease of 10% in exchange rates would result in an increase or decrease in income before taxes of approximately $9.7 million. This number represents the exposure related to balance sheet re-measurements only and assumes that all currencies move in the same direction at the same time relative to the U.S. dollar.
We do not currently hedge currency risk related to revenues or expenses denominated in foreign currencies. Foreign currency exchange rate fluctuations during fiscal 2009, compared to fiscal 2008, unfavorably impacted revenue by $16.8 million, favorably impacted operating expenses by $32.3 million and favorably impacted (loss) income from continuing operations by $15.5 million.
If the U.S. dollar were to strengthen 10%, it is anticipated that the impact to revenue would be approximately 3%. This assumes that all currencies move in the same direction at the same time and the ratio of non-U.S. dollar denominated revenue and expenses to U.S. dollar denominated revenue and expenses does not change from current levels. Since a large portion of our recognized revenue is deferred revenue that is recorded at different foreign currency exchange rates, the impact to revenue of changes in foreign currency exchange rates is recognized over time, whereas the impact to expenses is more immediate, as expenses are recognized at the current foreign currency exchange rate in effect at the time the expense is incurred.
All of the potential changes noted above are based on sensitivity analyses performed on our financial position at October 31, 2009. Actual results may differ materially.
57
Table of Contents
NOVELL, INC.
Item 8. Financial Statements and Supplementary Data
Novell, Inc.
| Page | ||
| 59 | ||
| 60 | ||
| 61 | ||
| 62 | ||
| 63 | ||
| Report of PricewaterhouseCoopers LLP, Independent Registered Public Accounting Firm |
108 | |
| 109 |
58
Table of Contents
CONSOLIDATED STATEMENTS OF OPERATIONS
(Amounts in thousands, except per share data)
| Fiscal Year Ended October 31, | ||||||||||||
| 2009 | 2008 | 2007 | ||||||||||
| Net revenue: |
||||||||||||
| Software licenses |
$ | 116,919 | $ | 188,983 | $ | 175,548 | ||||||
| Maintenance and subscriptions |
640,745 | 616,493 | 566,355 | |||||||||
| Services |
104,521 | 151,037 | 190,596 | |||||||||
| Total net revenue |
862,185 | 956,513 | 932,499 | |||||||||
| Cost of revenue: |
||||||||||||
| Software licenses |
11,140 | 17,230 | 17,728 | |||||||||
| Maintenance and subscriptions |
53,036 | 49,114 | 47,121 | |||||||||
| Services |
122,655 | 168,895 | 193,470 | |||||||||
| Total cost of revenue |
186,831 | 235,239 | 258,319 | |||||||||
| Gross profit |
675,354 | 721,274 | 674,180 | |||||||||
| Operating expenses (income): |
||||||||||||
| Sales and marketing |
295,998 | 368,719 | 353,795 | |||||||||
| Product development |
181,383 | 191,547 | 201,420 | |||||||||
| General and administrative |
102,345 | 113,529 | 128,985 | |||||||||
| Restructuring expenses |
25,200 | 28,645 | 43,097 | |||||||||
| Impairment of goodwill |
270,044 | — | — | |||||||||
| Impairment of intangible assets |
9,091 | 7,664 | 3,851 | |||||||||
| (Gain) loss on sale of subsidiaries |
(16 | ) | 3,694 | (1,200 | ) | |||||||
| Gain on sale of property, plant and equipment, net |
(2,199 | ) | — | — | ||||||||
| Purchased in-process research and development |
— | 2,700 | — | |||||||||
| Total operating expenses |
881,846 | 716,498 | 729,948 | |||||||||
| (Loss) income from operations |
(206,492 | ) | 4,776 | (55,768 | ) | |||||||
| Other income (expense): |
||||||||||||
| Investment income |
22,720 | 71,640 | 86,531 | |||||||||
| Impairment of investments |
(5,466 | ) | (30,024 | ) | — | |||||||
| Gain on sale of venture capital funds |
— | — | 3,591 | |||||||||
| Interest expense and other, net |
(14,736 | ) | (23,514 | ) | (25,939 | ) | ||||||
| Total other income, net |
2,518 | 18,102 | 64,183 | |||||||||
| (Loss) income from continuing operations before taxes |
(203,974 | ) | 22,878 | 8,415 | ||||||||
| Income tax expense |
10,666 | 35,217 | 34,691 | |||||||||
| Loss from continuing operations |
(214,640 | ) | (12,339 | ) | (26,276 | ) | ||||||
| Income (loss) from discontinued operations before taxes (including gain (loss) on disposal of $1,904, $2,653, and ($19,075), in fiscal 2009, 2008, and 2007, respectively) |
1,904 | 2,758 | (18,253 | ) | ||||||||
| Income tax benefit on discontinued operations |
— | (836 | ) | (69 | ) | |||||||
| Income (loss) from discontinued operations |
1,904 | 3,594 | (18,184 | ) | ||||||||
| Net loss |
$ | (212,736 | ) | $ | (8,745 | ) | $ | (44,460 | ) | |||
| Basic and diluted loss per share: |
||||||||||||
| Loss from continuing operations |
$ | (0.62 | ) | $ | (0.04 | ) | $ | (0.08 | ) | |||
| Discontinued operations |
— | 0.02 | (0.05 | ) | ||||||||
| Net loss per share |
$ | (0.62 | ) | $ | (0.02 | ) | $ | (0.13 | ) | |||
| Basic and diluted weighted-average shares outstanding |
345,493 | 350,207 | 347,552 | |||||||||
See notes to consolidated financial statements.
59
Table of Contents
CONSOLIDATED BALANCE SHEETS
(Amounts in thousands, except share and per share data)
| October 31, 2009 |
October 31, 2008 |
|||||||
| ASSETS |
||||||||
| Current assets: |
||||||||
| Cash and cash equivalents |
$ | 591,656 | $ | 680,034 | ||||
| Short-term investments |
391,809 | 387,813 | ||||||
| Restricted cash |
53,033 | 52,701 | ||||||
| Receivables (net of allowances of $4,085 and $3,679 at October 31, 2009 and 2008, respectively) |
177,898 | 193,088 | ||||||
| Prepaid expenses |
33,915 | 34,365 | ||||||
| Current deferred tax assets |
5,521 | 5,685 | ||||||
| Other current assets |
26,747 | 32,006 | ||||||
| Total current assets |
1,280,579 | 1,385,692 | ||||||
| Property, plant and equipment, net |
170,459 | 174,978 | ||||||
| Long-term investments |
10,303 | 14,972 | ||||||
| Goodwill |
356,033 | 582,117 | ||||||
| Intangible assets, net |
36,621 | 53,320 | ||||||
| Deferred income taxes |
26,717 | 36,244 | ||||||
| Other assets |
22,196 | 22,026 | ||||||
| Total assets |
$ | 1,902,908 | $ | 2,269,349 | ||||
| LIABILITIES AND STOCKHOLDERS’ EQUITY |
||||||||
| Current liabilities: |
||||||||
| Accounts payable |
$ | 37,628 | $ | 36,982 | ||||
| Accrued compensation |
101,031 | 102,317 | ||||||
| Other accrued liabilities |
97,154 | 108,929 | ||||||
| Senior convertible debentures |
— | 125,668 | ||||||
| Income taxes payable |
— | 22,563 | ||||||
| Deferred revenue |
495,245 | 503,174 | ||||||
| Total current liabilities |
731,058 | 899,633 | ||||||
| Deferred income taxes |
8,403 | 11,725 | ||||||
| Long-term deferred revenue |
193,526 | 226,876 | ||||||
| Other long-term liabilities |
35,399 | 43,587 | ||||||
| Total liabilities |
968,386 | 1,181,821 | ||||||
| Commitments and contingencies (Note R) |
||||||||
| Stockholders’ equity: |
||||||||
| Common stock, par value $.10 per share, Authorized — 600,000,000 shares; Issued — 362,175,921 and 358,526,217 shares at October 31, 2009 and 2008, respectively; Outstanding — 347,072,762 and 343,407,896 shares at October 31, 2009 and 2008, respectively |
36,218 | 35,853 | ||||||
| Additional paid-in capital |
441,798 | 420,669 | ||||||
| Treasury stock, at cost — 15,103,159 and 15,118,321 shares at October 31, 2009 and 2008, respectively |
(124,299 | ) | (124,424 | ) | ||||
| Retained earnings |
559,823 | 772,559 | ||||||
| Accumulated other comprehensive income (loss) |
20,982 | (17,129 | ) | |||||
| Total stockholders’ equity |
934,522 | 1,087,528 | ||||||
| Total liabilities and stockholders’ equity |
$ | 1,902,908 | $ | 2,269,349 | ||||
See notes to consolidated financial statements.
60
Table of Contents
CONSOLIDATED STATEMENTS OF STOCKHOLDERS’ EQUITY
(Amounts in thousands)
| Common Stock Shares |
Common Stock Amount |
Treasury Stock Shares |
Treasury Stock Amount |
Additional Paid-In Capital |
Retained Earnings |
Accumulated Other Comprehensive Income (Loss) |
Total | |||||||||||||||||||||||
| Balance at October 31, 2006 |
358,512 | $ | 35,851 | (15,150 | ) | $ | (124,684 | ) | $ | 338,954 | $ | 840,449 | $ | 14,080 | $ | 1,104,650 | ||||||||||||||
| Stock issued from stock plans |
6,112 | 577 | 21 | 172 | 21,008 | — | — | 21,757 | ||||||||||||||||||||||
| Stock-based compensation expense |
— | — | — | — | 34,316 | — | — | 34,316 | ||||||||||||||||||||||
| Excess tax effects from stock-based compensation |
— | — | — | — | 13,099 | — | — | 13,099 | ||||||||||||||||||||||
| Shares cancelled |
(381 | ) | (4 | ) | — | — | (3,395 | ) | — | — | (3,399 | ) | ||||||||||||||||||
| Stock issued for conversion of Series B Preferred Stock |
1,496 | 150 | — | — | 9,200 | — | — | 9,350 | ||||||||||||||||||||||
| Dividends on Series B Preferred Stock |
— | — | — | — | — | (5 | ) | — | (5 | ) | ||||||||||||||||||||
| Impact to initially apply new pension classification rules |
— | — | — | — | — | — | 1,409 | 1,409 | ||||||||||||||||||||||
| Change in unrealized gain on investments |
— | — | — | — | — | — | 4,385 | 4,385 | ||||||||||||||||||||||
| Cumulative translation adjustment |
— | — | — | — | — | — | 17,224 | 17,224 | ||||||||||||||||||||||
| Net loss |
— | — | — | — | — | (44,460 | ) | — | (44,460 | ) | ||||||||||||||||||||
| Comprehensive loss |
— | — | — | — | — | — | — | (22,851 | ) | |||||||||||||||||||||
| Balance at October 31, 2007 |
365,739 | 36,574 | (15,129 | ) | (124,512 | ) | 413,182 | 795,984 | 37,098 | 1,158,326 | ||||||||||||||||||||
| Stock issued from stock plans |
5,216 | 522 | 11 | 88 | 12,656 | — | — | 13,266 | ||||||||||||||||||||||
| Stock-based compensation expense |
— | — | — | — | 33,818 | — | — | 33,818 | ||||||||||||||||||||||
| Excess tax effects from stock-based compensation |
— | — | — | — | 18,500 | — | — | 18,500 | ||||||||||||||||||||||
| Shares cancelled |
(802 | ) | (80 | ) | — | — | (5,118 | ) | — | — | (5,198 | ) | ||||||||||||||||||
| Shares repurchased and retired |
(11,627 | ) | (1,163 | ) | — | — | (52,369 | ) | (13,288 | ) | — | (66,820 | ) | |||||||||||||||||
| Impact to initially adopt new rules on accounting for tax uncertainties |
— | — | — | — | — | (1,392 | ) | — | (1,392 | ) | ||||||||||||||||||||
| Amortization included in net periodic pension costs |
— | — | — | — | — | — | 2,234 | 2,234 | ||||||||||||||||||||||
| Change in unrealized gain on investments |
— | — | — | — | — | — | (3,602 | ) | (3,602 | ) | ||||||||||||||||||||
| Cumulative translation adjustment |
— | — | — | — | — | — | (52,859 | ) | (52,859 | ) | ||||||||||||||||||||
| Net loss |
— | — | — | — | — | (8,745 | ) | — | (8,745 | ) | ||||||||||||||||||||
| Comprehensive loss |
— | — | — | — | — | — | — | (62,972 | ) | |||||||||||||||||||||
| Balance at October 31, 2008 |
358,526 | 35,853 | (15,118 | ) | (124,424 | ) | 420,669 | 772,559 | (17,129 | ) | 1,087,528 | |||||||||||||||||||
| Stock issued from stock plans |
4,811 | 481 | 15 | 125 | 2,845 | — | — | 3,451 | ||||||||||||||||||||||
| Stock-based compensation expense |
— | — | — | — | 25,881 | — | — | 25,881 | ||||||||||||||||||||||
| Excess tax effects from stock-based compensation |
— | — | — | — | (2,775 | ) | — | — | (2,775 | ) | ||||||||||||||||||||
| Shares cancelled |
(1,161 | ) | (116 | ) | — | — | (4,822 | ) | — | — | (4,938 | ) | ||||||||||||||||||
| Amortization included in net periodic pension costs |
— | — | — | — | — | — | 755 | 755 | ||||||||||||||||||||||
| Change in unrealized gain on investments |
— | — | — | — | — | — | 13,802 | 13,802 | ||||||||||||||||||||||
| Cumulative translation adjustment |
— | — | — | — | — | — | 23,554 | 23,554 | ||||||||||||||||||||||
| Net loss |
— | — | — | — | — | (212,736 | ) | — | (212,736 | ) | ||||||||||||||||||||
| Comprehensive loss |
— | — | — | — | — | — | — | (174,625 | ) | |||||||||||||||||||||
| Balance at October 31, 2009 |
362,176 | $ | 36,218 | (15,103 | ) | $ | (124,299 | ) | $ | 441,798 | $ | 559,823 | $ | 20,982 | $ | 934,522 | ||||||||||||||
See notes to consolidated financial statements.
61
Table of Contents
CONSOLIDATED STATEMENTS OF CASH FLOWS
(Amounts in thousands)
| Fiscal Year Ended October 31, | ||||||||||||
| 2009 | 2008 | 2007 | ||||||||||
| Cash flows from operating activities |
||||||||||||
| Net loss |
$ | (212,736 | ) | $ | (8,745 | ) | $ | (44,460 | ) | |||
| Adjustments to reconcile net loss to net cash provided by operating activities: |
||||||||||||
| Stock-based compensation expense |
25,881 | 33,818 | 34,316 | |||||||||
| Depreciation and amortization |
40,675 | 42,892 | 40,438 | |||||||||
| Change in accounts receivable allowances |
444 | (254 | ) | (1,786 | ) | |||||||
| Utilization of previously reserved acquired net operating losses |
2,580 | 5,026 | 4,844 | |||||||||
| SUSE purchase price tax adjustment |
— | — | 24,677 | |||||||||
| Purchased in-process research and development |
— | 2,700 | — | |||||||||
| Deferred income taxes |
8,610 | (19,078 | ) | (10,718 | ) | |||||||
| Gain on sale of property, plant and equipment, net |
(2,199 | ) | — | — | ||||||||
| (Gain) loss on sale of subsidiaries |
(16 | ) | 3,694 | (1,200 | ) | |||||||
| (Gain) loss on disposal of discontinued operations, before taxes |
(1,904 | ) | (2,653 | ) | 19,075 | |||||||
| Impairment of investments |
5,466 | 30,024 | — | |||||||||
| Gain on sale of previously impaired long-term investments |
(300 | ) | (1,969 | ) | (2,917 | ) | ||||||
| Gain on debenture repurchases |
(11 | ) | (4,606 | ) | — | |||||||
| Gain on sale of venture capital funds |
— | — | (3,591 | ) | ||||||||
| Impairment of goodwill |
270,044 | — | — | |||||||||
| Impairment of intangible assets |
9,091 | 7,664 | 3,851 | |||||||||
| Changes in assets and liabilities, excluding acquisitions and dispositions: |
||||||||||||
| Receivables |
23,951 | 11,782 | 23,534 | |||||||||
| Prepaid expenses |
3,377 | 7,997 | (18,858 | ) | ||||||||
| Other current assets |
6,166 | 402 | (4,672 | ) | ||||||||
| Accounts payable |
(7,420 | ) | (7,586 | ) | 341 | |||||||
| Accrued liabilities |
(53,939 | ) | (6,225 | ) | 12,166 | |||||||
| Deferred revenue |
(48,990 | ) | (39,013 | ) | 336,754 | |||||||
| Net cash provided by operating activities |
68,770 | 55,870 | 411,794 | |||||||||
| Cash flows from investing activities |
||||||||||||
| Purchases of short-term investments |
(341,500 | ) | (427,549 | ) | (532,422 | ) | ||||||
| Maturities of short-term investments |
62,263 | 128,137 | 175,245 | |||||||||
| Sales of short-term investments |
284,337 | 655,335 | 336,946 | |||||||||
| Proceeds from sales of and distributions from long-term investments |
4,209 | 24,757 | 2,917 | |||||||||
| Cash restricted due to litigation |
(332 | ) | (52,701 | ) | — | |||||||
| Net cash proceeds from sale of discontinued operations |
1,036 | 564 | 783 | |||||||||
| Net cash (distributions) proceeds from sale of subsidiaries |
— | (171 | ) | 1,200 | ||||||||
| Net cash paid for acquisitions |
(48,472 | ) | (219,553 | ) | (29,704 | ) | ||||||
| Purchase of intangible assets |
— | (12,000 | ) | (1,175 | ) | |||||||
| Purchases of property, plant and equipment |
(22,087 | ) | (37,716 | ) | (25,235 | ) | ||||||
| Net proceeds from the sale of property, plant and equipment |
10,748 | — | — | |||||||||
| Proceeds from sale of venture capital funds |
— | — | 4,964 | |||||||||
| Other |
7,228 | (5,793 | ) | 12,147 | ||||||||
| Net cash (used in) provided by investing activities |
(42,570 | ) | 53,310 | (54,334 | ) | |||||||
| Cash flows from financing activities |
||||||||||||
| Issuance of common stock |
3,566 | 13,297 | 21,786 | |||||||||
| Excess tax effects from stock-based compensation |
(2,775 | ) | 18,500 | 13,099 | ||||||||
| Common stock repurchases/retirements |
— | (66,820 | ) | — | ||||||||
| (Repayment) issuance of debt |
(4,658 | ) | 4,795 | — | ||||||||
| Debenture repurchases |
(125,537 | ) | (456,500 | ) | — | |||||||
| Net cash (used in) provided by financing activities |
(129,404 | ) | (486,728 | ) | 34,885 | |||||||
| (Decrease) increase in cash and cash equivalents |
(103,204 | ) | (377,548 | ) | 392,345 | |||||||
| Effect of exchange rate changes on cash |
14,826 | (22,237 | ) | 11,687 | ||||||||
| Cash and cash equivalents — beginning of year |
680,034 | 1,079,819 | 675,787 | |||||||||
| Cash and cash equivalents — end of year |
$ | 591,656 | $ | 680,034 | $ | 1,079,819 | ||||||
| Supplemental disclosures of cash and non-cash financing and investing activities: |
||||||||||||
| Conversion of Series B Preferred Stock |
$ | — | $ | — | $ | 9,350 | ||||||
See notes to consolidated financial statements.
62
Table of Contents
NOTES TO CONSOLIDATED FINANCIAL STATEMENTS
A. Summary of Business Operations
We develop, sell and install enterprise-quality software that is positioned in the operating systems and infrastructure software layers of the information technology (“IT”) industry. We develop and deliver Linux operating system software for the full range of computers from desktops to servers. In addition, we provide a portfolio of integrated IT management software for systems, identity and security management for both Linux and mixed-platform environments. Our 26 years of experience serving the full range of enterprise sizes, combined with the quality and flexibility of our open-platform software technology, offers customers an IT infrastructure that is responsive to the cost pressures and the expanding IT initiatives that are characteristic of today’s business environment.
We were incorporated in the State of Delaware on January 25, 1983 and have established a reputation for innovation and industry leadership. We currently have approximately 3,600 employees in 52 offices worldwide.
Our business unit segments are Open Platform Solutions, Identity and Security Management, Systems and Resource Management, and Workgroup. They are described below in more detail.
Open Platform Solutions
We deliver Linux and related solutions for the enterprise. SUSE Linux Enterprise platform underpins all of our products. SUSE Linux Enterprise is a leading distribution system that focuses considerable effort on interoperability, support for mission-critical computing requirements, and virtualization and provides ease in usability and management.
Identity and Security Management
Our identity, security, and compliance management solutions are designed to help customers integrate, secure and manage IT assets, while reducing complexity and ensuring compliance with government and industry mandates. Adding this intelligence to every part of a customer’s IT environment makes their systems more agile and secure. Our solutions leverage automated, centrally-managed policies to provide insight into events happening throughout the enterprise.
Systems and Resource Management
With our systems and resource management solutions, customers can define business and IT policies to automate the management of multiple IT resources, including the emerging challenge of managing virtual environments. As a result, customers are able to reduce IT effort, control IT costs, and reduce IT skill requirements to manage and leverage their IT investment.
Workgroup
We provide comprehensive and adaptable workgroup solutions that provide the infrastructure, services and tools customers require to effectively and securely collaborate across a myriad of devices. We offer the security, reliability, and manageability our customers’ employees need to efficiently get their jobs done at lower cost.
In addition to our technology offerings, within each of our business unit segments we offer a worldwide network of service personnel to help our customers and third-party partners utilize our software. We also have partnerships with application providers, hardware and software vendors, consultants, and systems integrators. In this way, we can offer a full solution to our customers.
63
Table of Contents
NOVELL, INC.
NOTES TO CONSOLIDATED FINANCIAL STATEMENTS (Continued)
B. Summary of Significant Accounting Policies
The accompanying consolidated financial statements reflect the application of significant accounting policies as described in this note and elsewhere in the accompanying consolidated financial statements.
Principles of Consolidation
The accompanying consolidated financial statements include the accounts of Novell, Inc., and its wholly-owned and majority-owned subsidiaries. All material inter-company accounts and transactions have been eliminated in consolidation.
Management’s Estimates and Uncertainties
The preparation of financial statements in conformity with accounting principles generally accepted in the U.S. requires management to make estimates and assumptions that affect the amounts reported and related disclosure of contingent assets and liabilities in the financial statements and accompanying notes. Actual results could differ materially from those estimates.
Reclassifications
Certain amounts reported in prior years have been reclassified from what was previously reported to conform to the current year’s presentation. These reclassifications did not have any impact on net loss in any period.
Foreign Currency Translation
The functional currency of all of our international subsidiaries, except for our Irish subsidiaries and a German holding company, is the local currency. These subsidiaries generate and expend cash primarily in their respective local currencies. The assets and liabilities of these subsidiaries are translated at current month-end exchange rates. Revenue and expenses are translated monthly at the average monthly exchange rate. Translation adjustments are recorded in the line item, “Accumulated other comprehensive income (loss),” in the consolidated balance sheets. With respect to our Irish subsidiaries and German holding company, the functional currency is the U.S. dollar for which translation gains and losses are included in the line item, “Interest expense and other, net” in the consolidated statements of operations. All transaction gains and losses are reported in the line item, “Interest expense and other, net,” in the consolidated statements of operations. Foreign currency exchange rate fluctuations resulted in net foreign exchange losses of $6.6 million, $5.6 million, and $2.0 million during fiscal 2009, 2008, and 2007, respectively.
Cash, Cash Equivalents and Short-Term Investments
All investments with an initial term to maturity of three months or less at the date of purchase are classified as cash equivalents. Short-term investments are diversified and: 1) mature greater than 3 months but within the next 12 months; 2) have characteristics of short-term investments; or 3) are available to be used for current operations, even if some maturities may extend beyond one year.
All marketable debt and equity securities that are included in short-term investments are considered available-for-sale and are carried at fair value. We have only acquired investment grade securities. Temporary increases or decreases in fair value are recorded as unrealized gains or losses in the “Accumulated other comprehensive income (loss)” line item in our consolidated balance sheets. In April 2009, the Financial Accounting Standards Board (“FASB”) amended the existing guidance on determining whether an impairment for investments in debt securities is other-than-temporary. Effective in our third quarter of fiscal 2009, impairment is considered to be other-than-temporary if there is intent to sell the debt security or it is more likely than not that the debt security will be required to be sold before its anticipated recovery. If these conditions are not evident, the present value of cash flows expected to be collected from the debt security should be compared to the amortized cost basis of the security to determine the other-than-temporary impairment. These new accounting rules require the separation of the total other-than-temporary impairment to the portion due to credit loss and the portion related to all other factors, typically considered market risks. The portion related to credit loss is recognized in earnings in the “Impairment of investments” line item in the consolidated statements of operations, while the portion related to other factors is recognized in the “Accumulated other comprehensive income (loss)” line item in our consolidated balance sheets.
For our equity securities, impairment is considered to be other-than-temporary if we have the intent to sell the security or we do not have both the intent and the ability to hold the equity security until its anticipated recovery. Additionally, we consider an equity security to be other-than-temporarily impaired if events and circumstances indicate that a decline in the value of an equity security has
64
Table of Contents
NOVELL, INC.
NOTES TO CONSOLIDATED FINANCIAL STATEMENTS (Continued)
B. Summary of Significant Accounting Policies (Continued)
occurred and is other than temporary. When an equity security is considered to be other-than-temporarily impaired, we record the loss in the “Impairment of investments” line item in the consolidated statements of operations, for the difference between fair value and cost at the balance sheet date.
Long-Term Investments
At October 31, 2009 and October 31, 2008, all of our Auction Rate Securities (“ARSs”) were classified as long-term investments on our consolidated balance sheets, and at October 31, 2009, were our only long-term investments.
We estimated the fair value of these ARSs using a discounted cash flow analysis that considered the following key inputs: (i) the underlying structure of each security; (ii) the present value of the future principal and interest payments discounted at rates considered to reflect current market conditions and the relevant risk associated with each security; and (iii) consideration of the time horizon that the market value of each security could return to its cost. When available, we also include market information and weigh this with our discounted cash flow analysis to estimate fair value. We estimated that the fair market value of these securities at October 31, 2009 and October 31, 2008 was $10.3 million and $11.1 million, respectively. At October, 31, 2009, the original cost of the remaining ARSs was $29.8 million.
The fair value of the ARSs could change in the future and we may be required to record additional other-than-temporary impairment charges if there are further reductions in fair value in future periods.
Concentrations of Credit Risk/Significant Customers
Financial instruments that subject us to credit risk primarily consist of cash equivalents, short-term and long-term investments, accounts receivable, and amounts due under subleases. Our credit risk is managed by investing cash and cash equivalents primarily in high-quality money market instruments, securities of the U.S. government and its agencies, highly rated corporate debt, and highly rated asset-backed securities all of which are of short duration. The $3.2 million in mortgage-backed securities debt that we hold (less than 1% of our short-term investments) are all related to bonds from Freddie Mac and Fannie Mae, which are not considered to be credit risks, due to U.S. government actions. As of October 31, 2009, we have ARSs which we determined to have a fair value of $10.3 million that failed at auction and are no longer considered liquid. During fiscal 2009, we recorded other-than-temporary-impairment charges of $5.5 million (see Note G, “Long-Term Investments”) related to the ARSs. During fiscal 2009, we sold two of our ARSs for $0.3 million which had an aggregate cost basis of $10.0 million and which had been entirely impaired. The remaining ARSs are currently paying premium interest rates. However, given their decrease in fair value, the credit standing of the underlying issuers, and the lack of liquidity, they are considered a credit risk and are being monitored accordingly. The future potential loss associated with these securities is their remaining $5.6 million carrying value. At October 31, 2009, the original cost of the remaining ARSs was $29.8 million.
Based on our ability to access our cash and other short-term investments, we do not anticipate that the lack of liquidity on the ARSs will affect our ability to operate our business in the usual course in the next twelve months.
Accounts receivable include amounts owed by geographically dispersed end-users, distributors, resellers, original equipment manufacturers (“OEMs”) and other customers. No collateral is required. Accounts receivable are not sold or factored. At October 31, 2009 and 2008, there were no receivables greater than 10% of our total receivables outstanding with any one customer. We generally have not experienced any material losses related to receivables from individual customers or groups of customers. Due to these factors, no significant additional credit risk, beyond amounts provided for, is believed by management to be inherent in our accounts receivable. During fiscal 2009, 2008 and 2007, there were no customers who accounted for more than 10% of total net revenue.
Our subleases are with many different parties and thus no concentration of credit risk exists at October 31, 2009.
65
Table of Contents
NOVELL, INC.
NOTES TO CONSOLIDATED FINANCIAL STATEMENTS (Continued)
B. Summary of Significant Accounting Policies (Continued)
Equity Investments
We account for our equity investments where we hold more than 20 percent of the outstanding stock of the investee’s stock or where we have the ability to significantly influence the operations or financial decisions of the investee under the equity method of accounting. We initially record the investment at cost and adjust the carrying amount each period to recognize our share of the earnings or losses of the investee based on our percentage of ownership. We review our equity investments periodically for indicators of impairment.
Property, Plant and Equipment
Property, plant and equipment are carried at cost, less accumulated depreciation and amortization. Depreciation and amortization is computed on the straight-line method over the estimated useful lives of the assets, or lease term, if shorter. Such lives are as follows:
| Asset Classification |
Useful Lives | |
| Buildings |
30 years | |
| Furniture and equipment |
2 – 7 years | |
| Leasehold improvements and other |
3 – 10 years |
We periodically review our property, plant and equipment for impairment whenever events or changes in circumstances indicate that the carrying value of the asset may not be recoverable. Factors that could indicate an impairment include significant underperformance of the asset as compared to historical or projected future operating results, significant changes in the actual or intended use of the asset, or significant negative industry or economic trends. When we determine that the carrying value of an asset may not be recoverable, the related estimated future undiscounted cash flows expected to result from the use and eventual disposition of the asset are compared to the carrying value of the asset. If the sum of the estimated future undiscounted cash flows is less than the carrying amount, we record an impairment charge based on the difference between the carrying value of the asset and its fair value, which we estimate based on discounted expected future cash flows. In determining whether an asset is impaired, we must make assumptions regarding recoverability of costs, estimated future cash flows from the asset, intended use of the asset and other related factors. If these estimates or their related assumptions change, we may be required to record impairment charges for these assets. For fiscal 2009, 2008, and 2007, we have not identified or recorded any impairment of our property, plant and equipment.
Goodwill and Intangible Assets
We evaluate the recoverability of goodwill and indefinite lived intangible assets annually as of August 1, or more frequently if events or changes in circumstances warrant, such as a material adverse change in the business. Goodwill is considered to be impaired when the carrying value of a reporting unit exceeds its estimated fair value. Fair values are estimated using the combination of a discounted cash flow methodology and a market analysis and weighting the results. Our reporting units are our four business unit segments.
We do not amortize goodwill or intangibles with indefinite lives resulting from acquisitions. We review these assets periodically for potential impairment issues. Separable intangible assets that are not deemed to have an indefinite life are amortized over their estimated useful lives.
We review our finite-lived intangible assets for indicators of impairment whenever events or changes in circumstances indicate that the carrying value may not be recoverable. When we determine that the carrying value of an asset may not be recoverable, the related estimated future undiscounted cash flows expected to result from the use and eventual disposition of the asset are compared to the carrying value of the asset. If the sum of the estimated future undiscounted cash flows is less than the carrying amount, we record an impairment charge based on the difference between the carrying value of the asset and its fair value, which we estimate based on discounted expected future cash flows.
Disclosure of Fair Value of Financial Instruments
Our financial instruments mainly consist of cash and cash equivalents, short-term and long-term investments, accounts receivable, accounts payable, accrued expenses, and at October 31, 2008, the 0.5% senior convertible debentures due 2024 (“Debentures”), which were repurchased during the third quarter of fiscal 2009. The carrying amounts of our cash equivalents, accounts receivable, accounts payable, and accrued expenses approximate fair value due to the short-term nature of these instruments. As of October 31, 2009
66
Table of Contents
NOVELL, INC.
NOTES TO CONSOLIDATED FINANCIAL STATEMENTS (Continued)
B. Summary of Significant Accounting Policies (Continued)
and 2008, we did not hold any publicly-traded long-term equity securities. Our long-term investments approximate fair value (See Note G, “Long-Term Investments”).
Effective November 1, 2008, we adopted new accounting guidance related to fair value measurements. This new accounting guidance did not impact our results of operations, but rather provided us with a framework for measuring fair value and enhanced our disclosures about fair value measurements. In February 2008, the FASB issued additional guidance that provided a one-year deferral of the effective date of the fair value guidance for non-financial assets and non-financial liabilities, except those that are recognized or disclosed in the financial statements at fair value at least annually. Accordingly, we have currently adopted the accounting provisions only with respect to our financial assets and financial liabilities. Likewise, our planned adoption in fiscal 2010 of the deferred portions of the applicable accounting guidance is not anticipated to impact our results of operations but will enhance our disclosures about fair value measurements for non-financial assets and non-financial liabilities, except those that are recognized or disclosed in the financial statements at fair value at least annually.
Fair value is defined as the exchange price that would be received for an asset or paid to transfer a liability (an exit price) in the principal or most advantageous market for the asset or liability in an orderly transaction between willing market participants on the measurement date. Valuation techniques used to measure fair value should maximize the use of observable inputs and minimize the use of unobservable inputs. The fair value hierarchy is based on three levels of market inputs (Levels 1, 2 & 3), of which the first two are considered observable and the last unobservable, that may be used to measure fair value.
Our Level 1 financial instruments are valued using quoted prices in active markets for identical instruments. Level 2 financial instruments are valued using quoted prices for identical instruments in less active markets or using other observable market inputs for comparable instruments. Level 3 financial instruments are valued using unobservable inputs that are supported by little or no market activity and that are significant to the fair value of the assets or liabilities.
Our Level 3 assets consist of our ARSs (See the subsection above entitled, “Long-Term Investments,” for more detail on the key inputs that we utilized in our discounted cash flow model to estimate the fair value of our ARSs).
Revenue Recognition and Related Reserves
Our revenue is derived primarily from the sale of software licenses, software maintenance, subscriptions of SUSE Linux Enterprise Server (“SLES”), technical support, training, and professional services. Our customers include: distributors, who sell our products to resellers, and value added resellers (“VARs”); OEMs, who integrate our products with their products or solutions VARs, who provide solutions across multiple vertical market segments which usually include services; and end-users, who may purchase our products and services directly from us or from other partners or resellers. Except for our SUSE Linux product, distributors do not order to stock and only order products when they have an end customer order. With respect to our SUSE Linux product, distributors place orders and the product is then sold to end customers principally through the retail channel. OEMs report the number of copies duplicated and sold via an activity or royalty report. Software maintenance, technical support, and subscriptions of SLES typically involve one- to three-year contract terms. Our standard practice is to provide customers with a 30-day general right of return. Such return provision allows for a refund and/or credit of any amount paid by our customers.
When an arrangement does not require significant production, modification, or customization of software or does not contain services considered to be essential to the functionality of the software, revenue is recognized when the following four criteria are met:
| • | Persuasive evidence of an arrangement exists — We require evidence of an agreement with a customer specifying the terms and conditions of the products or services to be delivered typically in the form of a signed contract or statement of work accompanied by a purchase order. |
| • | Delivery has occurred — For software licenses, delivery takes place when the customer is given access to the software programs via access to a website or shipped medium. For services, delivery takes place as the services are provided. |
| • | The fee is fixed or determinable — Fees are fixed or determinable if they are not subject to cancellation or other payment terms that exceed our standard payment terms. |
| • | Collection is probable — We perform a credit review of all customers with significant transactions to determine whether a customer is creditworthy and collection is probable. Prior credit history with us, credit reports, financial statements, and bank references are used to assess creditworthiness. |
67
Table of Contents
NOVELL, INC.
NOTES TO CONSOLIDATED FINANCIAL STATEMENTS (Continued)
B. Summary of Significant Accounting Policies (Continued)
In general, revenue for transactions that do not involve software customization or services considered essential to the functionality of the software is recognized as follows:
| • | Software fees for our SUSE Linux product are recognized when the product is sold to an end customer; |
| • | Software license fees for sales through OEMs are recognized upon receipt of license activity or royalty reports; |
| • | All other software license fees are recognized upon delivery of the software; |
| • | Software maintenance, technical support, and subscriptions of SLES are recognized ratably over the contract term; and |
| • | Professional services, training and other similar services are recognized as the services are performed. |
If the fee due from the customer is not fixed or determinable, revenue is recognized as payments become due from the customer. If collection is not considered probable, revenue is recognized when the fee is collected. We record provisions against revenue for estimated sales returns and allowances on product and service-related sales in the same period as the related revenue is recorded. We also record a provision to operating expenses for bad debts resulting from customers’ inability to pay for the products or services they have received. These estimates are based on historical sales returns and bad debt expense, analyses of credit memo data, and other known factors, such as bankruptcy. If the historical data we use to calculate these estimates does not accurately reflect future returns or bad debts, adjustments to these reserves may be required that would increase or decrease revenue or net income.
Many of our software arrangements include multiple elements. Such elements typically include any or all of the following: software licenses, rights to additional software products, software maintenance, technical support, training and professional services. For multiple-element arrangements that do not involve significant modification or customization of the software and do not involve services that are considered essential to the functionality of the software, we allocated value to each element based on its relative fair value for transactions prior to fiscal 2009.
Prior to the start of fiscal 2009, we sold software licenses individually as well as combined with other products (multi-element arrangements), allowing us to determine vendor-specific objective evidence (“VSOE”) of fair value for substantially all software license products. Accordingly, when we sold multi-element arrangements we used the relative fair value, or proportional, revenue accounting method to allocate the value of multi-element arrangements proportionally to the software license and other components.
At the start of fiscal 2009, we made a sales program change requiring all customers to initially purchase maintenance with licenses, which is common industry practice. As a result of eliminating stand-alone software license sales, VSOE of fair value for software licenses no longer existed. Accordingly, beginning in the first quarter of fiscal 2009, the residual method as defined in current accounting standards is now used to allocate the value of multi-element arrangements to the various components, which is also common industry practice. Under the residual method, each undelivered element (typically maintenance) is allocated value based on Novell-specific objective evidence of fair value for that element and the remainder of the total arrangement fee is allocated to the delivered element, typically the software. This method results in discounts being allocated to the software license rather than spread proportionately over all elements. Therefore, when a discount exists, less revenue is recognized at the time of sale under the residual method than under the relative fair value method, which we used prior to fiscal 2009. We believe that the impact of the change to the residual method was not material to net revenue in fiscal 2009.
If sufficient Novell-specific objective evidence of fair value does not exist for all undelivered elements and the arrangement involves rights to unspecified additional software products, all revenue is recognized ratably over the term of the arrangement. If the arrangement does not involve rights to unspecified additional software products, all revenue is initially deferred until the only remaining undelivered element is software maintenance or technical support, at which time the entire fee is recognized ratably over the remaining maintenance or support term.
In the case of multiple-element arrangements that involve significant modification or customization of the software or involve services that are considered essential to the functionality of the software, contract accounting is applied. When Novell-specific objective evidence of fair value exists for software maintenance or technical support in arrangements requiring contract accounting, the professional services and license fees are combined and revenue is recognized on the percentage of completion basis. The percentage of completion is generally calculated using hours incurred to date relative to the total expected hours for the entire project. The cumulative impact of any revision in estimates to complete or recognition of losses on contracts is reflected in the period in which the changes or losses become known. The maintenance or support fee is unbundled from the other elements and revenue is recognized ratably over the maintenance or support term. When Novell-specific objective evidence of fair value does not exist for software
68
Table of Contents
NOVELL, INC.
NOTES TO CONSOLIDATED FINANCIAL STATEMENTS (Continued)
B. Summary of Significant Accounting Policies (Continued)
maintenance or support, then all revenue is deferred until completion of the professional services, at which time the entire fee is recognized ratably over the remaining maintenance or support period.
For consolidated statements of operations classification purposes only, we allocate the revenue first to those elements for which we have Novell-specific objective evidence of fair value, and any remaining recognized revenue is then allocated to those items for which we lack Novell-specific objective evidence of fair value.
Professional services contracts are either time-and-materials or fixed-price contracts. Revenue from time-and-materials contracts is recognized as the services are performed. Revenue from fixed-price contracts is recognized based on the proportional performance method, generally using estimated time to complete to measure the completed effort. The cumulative impact of any revision in estimates to complete or recognition of losses on contracts is reflected in the period in which the changes or losses become known. Professional services revenue includes reimbursable expenses charged to our clients.
Microsoft Agreements-related revenue
On November 2, 2006, we entered into the Microsoft Agreements. Each of the agreements is scheduled to expire on January 1, 2012.
Under the Business Collaboration Agreement, we are marketing a combined offering with Microsoft. The combined offering consists of SLES and a subscription for SLES support along with Microsoft Windows Server, Microsoft Virtual Server and Microsoft Viridian, and is offered to customers desiring to deploy Linux and Windows in a virtualized setting. Microsoft made an upfront payment to us of $240 million for SLES subscription “certificates,” which Microsoft may use, resell or otherwise distribute over the term of the agreement, allowing the certificate holder to redeem single or multi-year subscriptions for SLES support from us (entitling the certificate holder to upgrades, updates and technical support). Microsoft agreed to spend $60 million over the term of the agreement for marketing Linux and Windows virtualization scenarios and also agreed to spend $34 million over the term of the agreement for a Microsoft sales force devoted primarily to marketing the combined offering. Microsoft agreed that for three years following the initial date of the agreement it will not enter into an agreement with any other Linux distributor to encourage adoption of other company’s Linux/Windows Server virtualization through a program substantially similar to the SLES subscription “certificate” distribution program.
The Technical Collaboration Agreement focuses primarily on four areas:
| • | Development of technologies to optimize SLES and Windows, each running as guests in a virtualized setting on the other operating system; |
| • | Development of management tools for managing heterogeneous virtualization environments, to enable each party’s management tools to command, control and configure the other party’s operating system in a virtual machine environment; |
| • | Development of translators to improve interoperability between Microsoft Office and OpenOffice.org document formats; and |
| • | Collaboration on improving directory and identity interoperability and identity management between Microsoft Active Directory software and Novell eDirectory software. |
Under the Technical Collaboration Agreement, Microsoft agreed to provide funding to help accomplish these broad objectives, subject to certain limitations.
Under the Patent Cooperation Agreement, Microsoft agreed to covenant with our customers not to assert its patents against our customers for their use of our products and services for which we receive revenue directly or indirectly, with certain exceptions, while we agreed to covenant with Microsoft’s customers not to assert our patents against Microsoft’s customers for their use of Microsoft products and services for which Microsoft receives revenue directly or indirectly, with certain exceptions. In addition, we and Microsoft each irrevocably released the other party, and its customers, from any liability for patent infringement arising prior to November 2, 2006, with certain exceptions. Both we and Microsoft have payment obligations under the Patent Cooperation Agreement. Microsoft made an upfront net balancing payment to us of $108 million, and we are making ongoing payments to Microsoft totaling a minimum of $40 million over the five-year term of the agreement based on a percentage of our Open Platform Solutions and Open Enterprise Server revenues.
As the three agreements are interrelated and were negotiated and executed simultaneously, for accounting purposes we considered all of the agreements to constitute one arrangement containing multiple elements. The SLES subscription purchases of $240 million are
69
Table of Contents
NOVELL, INC.
NOTES TO CONSOLIDATED FINANCIAL STATEMENTS (Continued)
B. Summary of Significant Accounting Policies (Continued)
being accounted for based on VSOE of fair value. We recognize the revenue ratably over the respective subscription terms beginning upon customer activation, or for subscriptions which expire un-activated, if any, we recognize revenue upon subscription expiration. Objective evidence of the fair value of elements within the Patent Cooperation Agreement and Technical Collaboration Agreement did not exist. As such, we combined the $108 million for the Patent Cooperation Agreement payment and amounts we are receiving under the Technical Collaboration Agreement and are recognizing this revenue ratably over the contractual term of the agreements of five years. Our periodic payments to Microsoft are recorded as a reduction of revenue. The contractual expenditures by Microsoft, including the dedicated sales force of $34 million and the marketing funds of $60 million, do not obligate us to perform, and, therefore, do not have an accounting consequence to us.
Cost of Revenue
Cost of revenue includes the amortization of intangible assets related to products or services sold, royalty costs and costs associated with personnel providing professional services and technical support services.
Expenses
Product development costs are expensed as incurred. Due to the use of the working model approach, costs incurred subsequent to the establishment of technological feasibility but prior to the general release of the product, have not been significant and therefore have not been capitalized.
Advertising costs are expensed as incurred. Advertising expenses totaled $4.9 million, $5.9 million, and $7.7 million, in fiscal 2009, 2008, and 2007, respectively.
Share-based Payments
Under the fair value recognition guidance of stock-based compensation accounting rules, stock-based compensation cost is estimated at the grant date based on the fair value of the award and is recognized as expense over the requisite service period of the award. The fair value of restricted stock awards is determined by reference to the fair market value of our common stock on the date of grant. We use the Black-Scholes model to value both service condition and performance condition option awards. For awards with only service conditions and graded-vesting features, we recognize compensation cost on a straight-line basis over the requisite service period. For awards with performance conditions, we recognize stock-based compensation expense based on the graded-vesting method.
Determining the appropriate fair value model and related assumptions requires judgment, including estimating stock price volatility, forfeiture rates, and expected terms. The expected volatility rates are estimated based on historical and implied volatilities of our common stock. The expected term represents the average time that options that vest are expected to be outstanding based on the vesting provisions and our historical exercise, cancellation and expiration patterns. We estimate pre-vesting forfeitures when recognizing stock-based compensation expense based on historical rates and forward-looking factors. We update these assumptions at least on an annual basis and on an interim basis if significant changes to the assumptions are warranted.
We issue performance-based equity awards, typically to senior executives, which vest upon the achievement of certain financial performance goals, including revenue and income targets. Determining the appropriate amount to expense based on the anticipated achievement of the stated goals requires judgment, including forecasting future financial results. The estimate of expense is revised periodically based on the probability of achieving the required performance targets and adjustments are made as appropriate. The cumulative impact of any revision is reflected in the period of change. If the financial performance goals are not met, the award does not vest, so no compensation cost is recognized and any previously recognized stock-based compensation expense is reversed.
70
Table of Contents
NOVELL, INC.
NOTES TO CONSOLIDATED FINANCIAL STATEMENTS (Continued)
B. Summary of Significant Accounting Policies (Continued)
Valuation of Deferred Tax Assets
We regularly assess our ability to realize our deferred tax assets. Assessments of the realization of deferred tax assets require that management consider all available evidence, both positive and negative, and make significant judgments about many factors, including the amount and likelihood of future income. Based on all the available evidence, we continue to believe that it is more likely than not that most of our net deferred tax assets, and certain foreign deferred tax assets, are not currently realizable. In reaching this determination, we evaluated our three-year cumulative results as well as the impacts that current economic conditions may have on our future results. As a result, we continue to provide a valuation reserve on our U.S. net deferred tax assets and certain foreign deferred tax assets. It is reasonably possible that we could reduce a significant portion of our valuation allowance in the near-term.
Net Loss Per Share
Basic net loss per share is computed by dividing net loss by the actual weighted-average number of common shares outstanding during the period. Diluted net loss for the periods presented is the same as the basic net loss per share calculation due to the anti-dilutive effect of potential common shares under the treasury stock method as a result of our net losses. Potential dilutive common shares include stock options and unvested restricted stock.
Derivative Instruments
A large portion of our revenue, expense, and capital purchasing activities are transacted in U.S. dollars. However, we enter into transactions in other currencies, primarily the Euro, the British Pound Sterling, and certain other European, Latin American and Asian currencies. To protect against reductions in value caused by changes in foreign currency exchange rates, we have established balance sheet and inter-company hedging programs. We hedge currency risks of some assets and liabilities denominated in foreign currencies through the use of one-month foreign currency forward contracts. We do not currently hedge currency risks related to revenue or expenses denominated in foreign currencies.
Under our hedging program, we utilize one-month foreign currency forward contracts. We enter into these contracts two business days before the end of each month and settle them two business days before the end of the following month. We do not account for any of our derivatives as hedging instruments; rather, we record the impact of any gains or losses on our hedging program in the consolidated statements of operations. Due to the short period of time between entering into the forward contracts and our fiscal year-end, the fair value of the derivatives as of October 31, 2009 and 2008 is insignificant. Gains and losses recognized during the year on these foreign currency contracts are recorded in the line item, “Interest expense and other, net,” in the consolidated statements of operations and would generally be offset by corresponding losses or gains on the related hedged items.
Recent Pronouncements
In December 2007, the FASB issued new accounting guidance related to business combinations. This guidance establishes principles and requirements for how an acquiring company: 1) recognizes and measures in its financial statements the identifiable assets acquired, the liabilities assumed, and any non-controlling interest in the acquiree; 2) recognizes and measures the goodwill acquired in the business combination or a gain from a bargain purchase; and 3) discloses information to enable users of the financial statements to evaluate the nature and financial effects of the business combination. This guidance is effective for business combinations occurring on or after the beginning of the fiscal year beginning on or after December 15, 2008 (our fiscal 2010). For acquisitions that close after November 1, 2009 or for any acquisition-related tax adjustments, including any release of deferred tax asset valuation allowances, that occur after November 1, 2009, this pronouncement will impact our financial position and results of operations.
In April 2009, the FASB issued new guidance related to accounting for assets acquired and liabilities assumed in a business combination that arise from contingencies. These rules provide guidance and clarification in measuring, accounting, and disclosing acquired contingent assets and liabilities. These rules are effective for business combinations occurring on or after the beginning of the fiscal year beginning on or after December 15, 2008 (our fiscal 2010). For acquisitions that close after November 1, 2009 that have contingent assets or liabilities, this pronouncement will impact our financial position and results of operations.
In December 2007, the FASB issued new guidance related to noncontrolling interests in consolidated financial statements. This guidance requires that the ownership interests in subsidiaries held by parties other than the parent be clearly identified, labeled, and presented in the consolidated statement of financial position within equity, but separate from the parent’s equity. It also requires that
71
Table of Contents
NOVELL, INC.
NOTES TO CONSOLIDATED FINANCIAL STATEMENTS (Continued)
B. Summary of Significant Accounting Policies (Continued)
the amount of consolidated net income attributable to the parent and to the noncontrolling interest be clearly identified and presented on the face of the consolidated statement of income. This guidance is effective for fiscal years and fiscal quarters beginning on or after December 15, 2008 (our fiscal 2010). The impact of this pronouncement on our financial position and results of operations is anticipated to be immaterial.
In April 2008, the FASB issued new guidance for estimating the useful lives of recognized intangible assets and required additional disclosures related to renewing or extending the terms of a recognized intangible asset. In estimating the useful life of a recognized intangible asset, companies are required to consider their historical experience in renewing or extending similar arrangements together with the asset’s intended use, regardless of whether the arrangements have explicit renewal or extension provisions. This guidance is effective for fiscal years beginning after December 15, 2008 (our fiscal 2010), and is to be applied prospectively to intangible assets acquired after the effective date. The disclosure requirements are to be applied prospectively to all intangible assets. For intangible assets acquired after November 1, 2009, this pronouncement may impact our financial position and results of operations.
In June 2009, the FASB issued new guidance to replace the quantitative-based risks and rewards calculation for initially determining which enterprise, if any, has a controlling financial interest in, and will be required to consolidate, a variable interest entity. A variable interest entity is defined as an entity that will need additional funding to operate. Companies are now required to follow a more qualitative approach, focused on identifying which enterprise has the power to direct the activities of the variable interest entity that most significantly impacts the variable interest entity’s economic performance. Companies are also required to perform ongoing assessments of which enterprise, if any, will have to consolidate the variable interest entity. Additional disclosures are also required. This guidance is effective for fiscal years beginning after November 15, 2009 (our fiscal 2011). The impact of this pronouncement on our financial position and results of operations is anticipated to be immaterial.
In August 2009, the FASB issued additional guidance regarding fair value measurements. This guidance provides clarification for circumstances in which a quoted price in an active market for the identical liability is not available. In these circumstances, a reporting entity is required to measure fair value using one or more of the following methods: (1) a valuation technique that uses a) the quoted price of the identical liability when traded as an asset or b) quoted prices for similar liabilities or similar liabilities when traded as assets and/or (2) a valuation technique that is consistent with U.S. GAAP (e.g. an income approach or market approach). This guidance also clarifies that when estimating the fair value of a liability, a reporting entity is not required to include inputs relating to the existence of transfer restrictions on that liability. This guidance is effective for fiscal years and fiscal quarters beginning after August 26, 2009 (our first quarter of fiscal 2010). The adoption of this standard is not anticipated to have any impact on our financial position or results of operations.
In January 2009, the SEC issued its final rules requiring public companies to provide their financial statements and financial statement schedules to the SEC and their corporate websites in interactive data format using eXtensible Business Reporting Language (“XBRL”). XBRL is a standardized, machine-readable language designed to enhance the electronic communication of business information and should make business information more accessible. These rules will not change the SEC’s existing requirement to provide financial statements in the traditional format. Under these rules, we will be required to file our financial statements for the third quarter of fiscal 2010 using XBRL, in addition to our traditional filing format.
C. Acquisitions
Fortefi
On February 10, 2009, we acquired certain assets of Fortefi Ltd., a United Kingdom-based company, and Fortefi Corporation, a Delaware corporation (collectively referred to as “Fortefi”). Fortefi is a supplier of an identity management solution that controls “super user” access rights. Fortefi was a small operation of which the revenues, net operating results, assets and liabilities were immaterial to us. The purchase price consisted of $3.0 million in cash, plus merger and transaction costs of $0.1 million. Of the $3.1 million purchase price, $2.2 million was allocated to goodwill, $0.7 million was allocated to developed technology and $0.2 million was allocated to customer relationships.
72
Table of Contents
NOVELL, INC.
NOTES TO CONSOLIDATED FINANCIAL STATEMENTS (Continued)
C. Acquisitions (Continued)
Goodwill from the acquisition resulted from our belief that the products developed by Fortefi that control “super user” access rights are a valuable addition to our Identity and Security Management offerings. We believe these products will help us remain competitive in the Identity and Security Management market and increase our Identity and Security Management revenue. The goodwill from the Fortefi acquisition was allocated to our Identity and Security Management product business unit segment and is tax-deductible.
Managed Objects
On November 13, 2008, we acquired 100% of the outstanding stock of Managed Object Solutions, Inc. (“Managed Objects”), a supplier of business service management solutions, through a merger of Managed Objects into a wholly-owned subsidiary. The purchase price, consisting of $46.3 million in cash, plus merger and transaction costs of $1.1 million, was allocated as follows:
| (In thousands) | Estimated Fair Value |
Estimated Useful Life | |||
| Net tangible assets acquired |
$ | 3,410 | N/A | ||
| Identifiable intangible assets: |
|||||
| Developed technology |
5,800 | 3 years | |||
| Customer relationships |
3,000 | 3 years | |||
| Goodwill |
35,176 | Indefinite | |||
| Total net assets acquired |
$ | 47,386 | |||
The acquired net tangible assets of Managed Objects consisted primarily of cash and cash equivalents, accounts receivable, prepaid expenses and property, plant and equipment, partially offset by accounts payable, and other current liabilities that we assumed.
Developed technology relates to Managed Objects products that were commercially available and could be combined with our products and services. Discounted expected future cash flows attributable to the products were used to determine the fair value of developed technology. This resulted in a valuation of $5.8 million related to developed technology that had reached technological feasibility.
Customer relationships of $3.0 million relate primarily to customers under maintenance agreements. The fair value of these relationships was determined based on discounted future cash flows expected to be received as a result of the agreements and assumptions about their renewal rates.
Goodwill from the acquisition resulted from our belief that the business service management products developed by Managed Objects are a valuable addition to our Systems and Resource Management offerings. We believe they will help us remain competitive in the Systems and Resource Management market and increase our Systems and Resource Management revenue. The goodwill from the Managed Objects acquisition was allocated to our Systems and Resource Management product business unit segment and is not tax-deductible.
Managed Objects’ revenue and income were immaterial in prior years and would not have had a material impact to our reported financial results.
We analyze our intangible assets periodically for indicators of impairment. During the fourth quarter of fiscal 2009, we determined that we had experienced an impairment trigger event. As a result, we incurred an impairment charge of $2.2 million and $1.2 million, related to Managed Objects’ developed technology and customer relationship intangible assets, respectively. For more information on this charge, see Note K, “Goodwill and Intangible Assets.”
73
Table of Contents
NOVELL, INC.
NOTES TO CONSOLIDATED FINANCIAL STATEMENTS (Continued)
C. Acquisitions (Continued)
PlateSpin
On March 26, 2008, we acquired 100% of the outstanding stock of PlateSpin, a leader in support solutions for complete workload life cycle management and optimization for Windows, UNIX and Linux operating systems in the physical and virtual data center. The purchase price, consisting of $204.1 million in cash, plus merger and transaction costs of $3.8 million, was allocated as follows:
| (In thousands) | Estimated Fair Value |
Estimated Useful Life | |||
| Net tangible assets acquired |
$ | 3,303 | N/A | ||
| Purchased in-process research and development |
2,700 | N/A | |||
| Identifiable intangible assets: |
|||||
| Developed technology |
12,600 | 3 years | |||
| Customer relationships |
11,900 | 3 years | |||
| Trade name |
900 | 3 years | |||
| Goodwill |
176,480 | Indefinite | |||
| Total net assets acquired |
$ | 207,883 | |||
The acquired net tangible assets of PlateSpin consisted primarily of cash and cash equivalents, accounts receivable, prepaid expenses and property, plant and equipment, partially offset by accounts payable, and other current liabilities that we assumed.
Purchased in-process research and development, valued at $2.7 million, pertained to technology that was not technologically feasible at the date of the acquisition, meaning it had not reached the working model stage, did not contain all of the major functions planned for the product, and was not ready for initial customer testing. At the acquisition date, PlateSpin was working on the next release of its three major products: PowerConvert®, PowerRecon, and Forge, all of which were planned for release at various dates in the latter part of calendar year 2008. These releases had not yet reached technological feasibility at the time of the acquisition. The purchased in-process research and development was valued based on discounting estimated future cash flows from the related products. The purchased in-process research and development does not have any alternative future use and did not otherwise qualify for capitalization. As a result, this amount was expensed upon acquisition.
Developed technology relates to PlateSpin products that were commercially available and could be combined with our products and services. Discounted expected future cash flows attributable to the products were used to determine the fair value of developed technology. This resulted in a valuation of $12.6 million related to developed technology that has reached technological feasibility.
Customer relationships of $11.9 million relate primarily to customers under maintenance agreements. The fair value of these relationships was determined based on discounted expected future cash flows to be received as a result of the agreements and assumptions about their renewal rates.
PlateSpin’s trade name, with a fair value of $0.9 million, was determined using the relief-from-royalty method, which assigns a royalty rate to the revenue streams that were expected from the products using the trade name. The royalty rate was determined based on the history of PlateSpin’s trade name, the expected life, and information from comparable market transactions, applied to the product revenue and discounted to a present value.
Goodwill from the acquisition resulted from our belief that the workload life cycle management products developed by PlateSpin are a valuable addition to our Systems and Resource Management business unit segment. We believe they will help us remain competitive in the Systems and Resource Management market and increase our Systems and Resource Management business unit segment revenue. The goodwill from the PlateSpin acquisition was allocated to our Systems and Resource Management business unit segment and is tax deductible due to a tax election that treats the acquisition of a foreign company as an asset purchase.
We analyze our intangible assets periodically for indicators of impairment. During the fourth quarter of fiscal 2009, we determined that we had experienced an impairment trigger event. As a result, we incurred an impairment charge of $3.4 million and $2.3 million, related to PlateSpin’s developed technology and customer relationship intangible assets, respectively. For more information on this charge, see Note K, “Goodwill and Intangible Assets.”
74
Table of Contents
NOVELL, INC.
NOTES TO CONSOLIDATED FINANCIAL STATEMENTS (Continued)
C. Acquisitions (Continued)
SiteScape
On February 13, 2008, we acquired 100% of the outstanding stock of SiteScape, Inc. (“SiteScape”), a provider of open collaboration software, including Teaming + Conferencing products. The purchase price, consisting of $18.5 million in cash, plus merger and transaction costs of $0.4 million, was allocated as follows:
| (In thousands) | Estimated Fair Value |
Estimated Useful Life | ||||
| Net liabilities assumed |
$ | (3,792 | ) | N/A | ||
| Identifiable intangible assets: |
||||||
| Developed technology |
1,800 | 3 years | ||||
| Customer relationships |
1,200 | 3 years | ||||
| Goodwill |
19,723 | Indefinite | ||||
| Total net assets acquired |
$ | 18,931 | ||||
The assumed net liabilities of SiteScape consisted primarily of accounts payable and other current liabilities, partially offset by acquired cash and cash equivalents and accounts receivable.
Developed technology relates to SiteScape products that were commercially available and could be combined with our products and services. Discounted expected future cash flows attributable to the products were used to determine the fair value of developed technology. This resulted in a valuation of $1.8 million related to developed technology that has reached technological feasibility.
Customer relationships of $1.2 million relate primarily to customers under maintenance agreements. The fair value of these relationships was determined based on discounted expected future cash flows to be received as a result of the agreements and assumptions about their renewal rates.
Goodwill from the acquisition resulted from our belief that the open collaboration products developed by SiteScape are a valuable addition to our Workgroup product offerings. We believe they will help us remain competitive in the Workgroup market and increase our Workgroup business unit segment revenue. The goodwill from the SiteScape acquisition was allocated to our Workgroup business unit segment and is not tax deductible.
If the PlateSpin and SiteScape acquisitions had occurred on November 1, 2007 (fiscal 2008) and on November 1, 2006 (fiscal 2007), our unaudited pro forma results of operations would have been as follows:
| Fiscal Year Ended October 31, | ||||||||
| (Amounts in thousands, except per share amounts) | 2008 | 2007 | ||||||
| Net revenue |
$ | 967,767 | $ | 965,045 | ||||
| Net loss |
(19,835 | ) | (62,411 | ) | ||||
| Net loss per share |
$ | (0.06 | ) | $ | (0.18 | ) | ||
Our pro forma net loss for fiscal 2008 and 2007 includes $2.7 million of non-recurring purchased in-process research and development costs.
Senforce
On August 1, 2007, we acquired 100% of the outstanding stock of Senforce Technologies, Inc. (“Senforce”), a provider of endpoint security management, for $20.0 million in cash plus transaction costs of $0.2 million. Endpoint security management focuses on technology that provides data security for workstations, laptops or mobile devices in order to ensure that data cannot be accessed when they are lost or stolen. Senforce’s products have been integrated into our Systems and Resource Management business unit segment. Senforce’s results of operations were included in our consolidated financial statements beginning on the acquisition date.
75
Table of Contents
NOVELL, INC.
NOTES TO CONSOLIDATED FINANCIAL STATEMENTS (Continued)
C. Acquisitions (Continued)
The purchase price was allocated as follows:
| (In thousands) | Estimated Fair Value |
Estimated Useful Life | ||||
| Net liabilities assumed |
$ | (8 | ) | N/A | ||
| Identifiable intangible assets: |
||||||
| Developed technology |
2,000 | 3 years | ||||
| Customer relationships |
500 | 3 years | ||||
| Goodwill |
17,728 | Indefinite | ||||
| Total net assets acquired |
$ | 20,220 | ||||
Developed technology relates to Senforce’s products that were commercially available and could be combined with our products and services. Discounted expected future cash flows attributable to the products were used to determine the value of developed technology. This resulted in a valuation of approximately $2.0 million related to developed technology that had reached technological feasibility.
Goodwill from the acquisition resulted from our belief that the security management products developed by Senforce are a valuable addition to our Systems and Resource Management business unit segment. We believe they will help us remain competitive in the endpoint security management markets and increase our revenue. The goodwill from the Senforce acquisition was allocated to our Systems and Resource Management business unit segment and is not tax deductible.
Senforce’s revenue and income were immaterial in prior years and would not have had a material impact to our reported financial results.
RedMojo
On November 17, 2006, we acquired 100% of the outstanding stock of RedMojo Inc. (“RedMojo”), a privately-held company that specialized in cross-platform virtualization management software tools. RedMojo’s products have been integrated into our Systems and Resource Management business unit segment. The purchase price was approximately $9.7 million in cash, plus merger and transaction costs of approximately $0.2 million. RedMojo’s results of operations were included in our consolidated financial statements beginning on the acquisition date.
The purchase price was allocated as follows:
| (In thousands) | Estimated Fair Value |
Estimated Useful Life | |||
| Identifiable intangible assets: |
|||||
| Developed technology |
$ | 2,370 | 3 years | ||
| Goodwill |
7,554 | Indefinite | |||
| Total net assets acquired |
$ | 9,924 | |||
Developed technology relates to RedMojo products that were commercially available and could be combined with our products and services. Discounted expected future cash flows attributable to the products were used to determine the value of developed technology. This resulted in a valuation of approximately $2.4 million related to developed technology that had reached technological feasibility.
Goodwill from the acquisition resulted from our belief that the virtualization products developed by RedMojo are a valuable addition to our Systems and Resource Management business unit segment. We believe they will help us remain competitive in the virtualization markets and increase our Systems and Resource Management business unit segment revenue. The goodwill from the RedMojo acquisition was allocated to our Systems and Resource Management business unit segment and is not tax deductible.
RedMojo’s revenue and income were immaterial in prior years and would not have had a material impact to our reported financial results.
76
Table of Contents
NOVELL, INC.
NOTES TO CONSOLIDATED FINANCIAL STATEMENTS (Continued)
D. Divestitures
Discontinued Operations
Our discontinued operations include the divestitures of our Cambridge Technology Partners (Switzerland) SA (“CTP Switzerland”), subsidiary in fiscal 2008 and our Salmon Ltd. (“Salmon”) subsidiary in fiscal 2007. Detailed discussions of each of these divestitures follow:
CTP Switzerland
On October 31, 2007, we signed an agreement to sell our CTP Switzerland subsidiary to a management-led buyout group for $0.8 million ($0.5 million was received at close on January 31, 2008, and an additional contingent payment of $0.3 million was received during the fourth quarter of fiscal 2008). No further payments are due from the CTP Switzerland buyout group. As of January 31, 2008, we ceased stockholder and operational relationships with CTP Switzerland.
When we signed the agreement, we began classifying CTP Switzerland’s results as a discontinued operation in our consolidated statements of operations and reclassified our results of operations for the prior comparable period. In fiscal 2007, we recognized an estimated loss on disposal of $8.9 million resulting from the expected sale. During fiscal 2008, we recognized a gain on final liquidation of CTP Switzerland of $1.4 million, for a total net loss on the disposition of $7.4 million.
The net loss on the sale of CTP Switzerland was calculated as follows:
| (In thousands) | ||||
| Sales price |
$ | 750 | ||
| Costs to sell |
(304 | ) | ||
| 446 | ||||
| Net book value of CTP Switzerland: |
||||
| Cash |
3,417 | |||
| Accounts receivable, net |
3,508 | |||
| Other current assets |
1,718 | |||
| Other long-term assets |
315 | |||
| Current liabilities |
(3,322 | ) | ||
| Realization of cumulative translation adjustment |
(1,668 | ) | ||
| Impairment of goodwill |
3,903 | |||
| 7,871 | ||||
| Net loss on sale of CTP Switzerland before income taxes |
$ | (7,425 | ) | |
| Loss before income taxes recognized in fiscal 2007 |
$ | (8,855 | ) | |
| Gain before income taxes recognized in fiscal 2008 |
$ | 1,430 | ||
Salmon
On March 12, 2007, we sold our shares in our wholly-owned Salmon subsidiary to Okam Limited, a U.K. Limited Holding Company, for $4.9 million, which amount has been received, plus an additional contingent payment of £2.0 million (approximately $3.2 million).
Of the $4.9 million initial sales proceeds, $2.9 million was received at the time of sale and the remaining $2.0 million was received during the second quarter of fiscal 2008. During fiscal 2008, we received $1.2 million of the approximate $3.2 million contingent amount. During fiscal 2009, we received an additional contingent cash payment of $1.0 million. We earned the remaining balance during fiscal 2009, for which a receivable of approximately $1.0 million was recorded and is due to be paid to us during fiscal 2010.
During the first quarter of fiscal 2007, we determined that it was more likely than not that Salmon would be sold. This determination triggered the need to test the $11.9 million of goodwill related to Salmon for impairment. Using an estimate of proceeds to be received upon sale as an indicator of Salmon’s fair value, we determined that $10.2 million of Salmon’s goodwill had become impaired, and was, therefore, written off during the quarter as a component of discontinued operations in the consolidated statement of operations. In addition, we also determined that $0.5 million of customer relationship intangible assets and $0.1 million of non-compete agreement intangible assets had become impaired and, therefore, were also written off in the first quarter of fiscal 2007.
77
Table of Contents
NOVELL, INC.
NOTES TO CONSOLIDATED FINANCIAL STATEMENTS (Continued)
D. Divestitures (Continued)
In the second quarter of fiscal 2007, we recognized a gain on the consummation of the sale of approximately $0.6 million. Salmon’s results of operations are classified as a discontinued operation in our consolidated statements of operations.
The gain on the sale of Salmon was calculated as follows:
| (In thousands) | ||||
| Sales price |
$ | 4,914 | ||
| Costs to sell |
(102 | ) | ||
| 4,812 | ||||
| Net book value of Salmon: |
||||
| Cash |
2,165 | |||
| Other current assets |
4,089 | |||
| Goodwill |
2,177 | |||
| Other long-term assets |
139 | |||
| Liabilities |
(4,386 | ) | ||
| 4,184 | ||||
| Gain before income taxes recognized in fiscal 2007 |
628 | |||
| Contingent payment received in fiscal 2008 |
1,223 | |||
| Contingent payment received in fiscal 2009 |
1,036 | |||
| Contingent payment earned in fiscal 2009 |
868 | |||
| Total gain recognized to date |
$ | 3,755 | ||
The results of discontinued operations (CTP Switzerland and Salmon) for fiscal 2009, 2008, and 2007 are as follows:
| Fiscal Year Ended October 31, | |||||||||||
| 2009 | 2008 | 2007 | |||||||||
| (In thousands) | |||||||||||
| CTP Switzerland net revenue |
$ | — | $ | 6,566 | $ | 25,625 | |||||
| Salmon net revenue |
— | — | 7,351 | ||||||||
| $ | — | $ | 6,566 | $ | 32,976 | ||||||
| CTP Switzerland income before taxes |
$ | — | $ | 105 | $ | 739 | |||||
| Salmon income before taxes |
— | — | 83 | ||||||||
| Income before taxes |
— | 105 | 822 | ||||||||
| Salmon impairment of long-lived assets |
— | — | (10,848 | ) | |||||||
| Salmon gain on sale |
1,904 | 1,223 | 628 | ||||||||
| CTP Switzerland gain on sale |
— | 1,430 | — | ||||||||
| CTP Switzerland impairment of goodwill |
— | — | (3,903 | ) | |||||||
| CTP Switzerland impairment loss |
— | — | (4,952 | ) | |||||||
| Gain (loss) on discontinued operations |
1,904 | 2,653 | (19,075 | ) | |||||||
| Income tax benefit on discontinued operations |
— | (836 | ) | (69 | ) | ||||||
| Income (loss) from discontinued operations |
$ | 1,904 | $ | 3,594 | $ | (18,184 | ) | ||||
| The net cash proceeds from the sale of our discontinued operations (CTP Switzerland and Salmon) are as follows: |
|||||||||||
| Fiscal Year Ended October 31, | |||||||||||
| (In thousands) | 2009 | 2008 | 2007 | ||||||||
| CTP Switzerland net cash distributions |
$ | — | $ | (2,667 | ) | $ | — | ||||
| Salmon net cash proceeds |
1,036 | 3,231 | 783 | ||||||||
| Net cash proceeds from sale of discontinued operations |
$ | 1,036 | $ | 564 | $ | 783 | |||||
78
Table of Contents
NOVELL, INC.
NOTES TO CONSOLIDATED FINANCIAL STATEMENTS (Continued)
D. Divestitures (Continued)
Sales of Subsidiaries
Our sales of subsidiaries include the divestitures of our Chile subsidiary in fiscal 2009 and our Mexico and Argentina subsidiaries in fiscal 2008. We sold all three of these subsidiaries to one of our Latin America distribution partners. We will continue to sell products to customers in these countries through the distribution partner. Accordingly, we will have continuing cash flows from these businesses and have not presented them as discontinued operations in our consolidated statements of operations. Detailed discussions of each of these divestitures follow:
Chile subsidiary
Our Chile subsidiary, which we sold during fiscal 2009 for an insubstantial amount, was a very small operation with an immaterial net book value. The loss recorded on this sale was $0.1 million and is shown as a component of the line item “(Gain) loss on sale of subsidiaries” on our consolidated statements of operations.
Mexico and Argentina subsidiaries
During fiscal 2008, we sold our Mexico and our Argentina subsidiaries and recorded a total loss on the sale of both subsidiaries of $3.7 million. These subsidiaries were primarily sales operations and sold products from our four business unit segments. During fiscal 2009, we reached final settlement related to working capital adjustments on the sale of our Mexico and Argentina subsidiaries. This resulted in a non-cash gain of $0.2 million related to our Mexico subsidiary and a non-cash loss of $0.1 million related to our Argentina subsidiary. These gains and losses are shown as a component of the line item “(Gain) loss on sale of subsidiaries” on our consolidated statements of operations.
The loss on the sale of both subsidiaries was calculated as follows:
| (In thousands) | Mexico | Argentina | Total | |||||||||
| Sales price |
$ | 5,891 | $ | 686 | $ | 6,577 | ||||||
| Costs to sell |
(24 | ) | (22 | ) | (46 | ) | ||||||
| 5,867 | 664 | 6,531 | ||||||||||
| Net book value: |
||||||||||||
| Assets |
8,268 | 1,671 | 9,939 | |||||||||
| Liabilities |
(1,357 | ) | (538 | ) | (1,895 | ) | ||||||
| Allocated goodwill |
1,330 | 155 | 1,485 | |||||||||
| Realization of cumulative translation adjustment |
691 | 5 | 696 | |||||||||
| 8,932 | 1,293 | 10,225 | ||||||||||
| Loss before income taxes |
$ | (3,065 | ) | $ | (629 | ) | $ | (3,694 | ) | |||
The cumulative recognized loss on the sale of our subsidiaries is as follows:
| (In thousands) | Mexico | Argentina | Chile | Total | ||||||||||||
| Loss before income taxes recognized in fiscal 2008 |
$ | (3,065 | ) | $ | (629 | ) | $ | — | $ | (3,694 | ) | |||||
| Gain (loss) before income taxes recognized in fiscal 2009 |
200 | (72 | ) | (112 | ) | 16 | ||||||||||
| Total loss before income taxes |
$ | (2,865 | ) | $ | (701 | ) | $ | (112 | ) | $ | (3,678 | ) | ||||
Japan Consulting Group
During fiscal 2006, we sold our Japan Consulting Group (“JCG”) to Nihon Unisys, LTD (“Unisys”) for $4.0 million of which $2.8 million of the selling price was paid at closing and $1.2 million was contingent upon certain key employees remaining employed by Unisys for the 12 month period after closing. In fiscal 2007, Unisys paid the contingent consideration of $0.2 million for each key employee that was still employed by Unisys at the end of the retention period, totaling $1.2 million. We recognized a gain of $1.2 million in fiscal 2007 related to contingent consideration.
79
Table of Contents
NOVELL, INC.
NOTES TO CONSOLIDATED FINANCIAL STATEMENTS (Continued)
D. Divestitures (Continued)
The net cash (distributions) proceeds from the sale of our subsidiaries (Mexico, Argentina and the JCG) are as follows (Chile had an insignificant net cash distribution):
| Fiscal Year Ended October 31, | ||||||||||
| (In thousands) | 2009 | 2008 | 2007 | |||||||
| Mexico net cash distributed |
$ | — | $ | (13 | ) | $ | — | |||
| Argentina net cash distributed |
— | (158 | ) | — | ||||||
| JCG net cash proceeds |
— | — | 1,200 | |||||||
| Net cash (distributions) proceeds from sale of subsidiaries |
$ | — | $ | (171 | ) | $ | 1,200 | |||
E. Cash and Short-Term Investments
The following is a summary of our short-term available-for-sale investments at October 31, 2009 and 2008:
| (In thousands) | Cost at October 31, 2009 |
Gross Unrealized Gains |
Gross Unrealized Losses |
Fair Market Value at October 31, 2009 | |||||||||
| Short-term investments: |
|||||||||||||
| U.S. government and agency securities |
$ | 183,062 | $ | 2,633 | $ | — | $ | 185,695 | |||||
| Corporate notes and bonds |
169,685 | 4,269 | (12 | ) | 173,942 | ||||||||
| Asset-backed securities |
24,828 | 439 | — | 25,267 | |||||||||
| Equity securities |
7,923 | — | (1,018 | ) | 6,905 | ||||||||
| Total short-term investments |
$ | 385,498 | $ | 7,341 | $ | (1,030 | ) | $ | 391,809 | ||||
| (In thousands) | Cost at October 31, 2008 |
Gross Unrealized Gains |
Gross Unrealized Losses |
Fair Market Value at October 31, 2008 | |||||||||
| Short-term investments: |
|||||||||||||
| U.S. government and agency securities |
$ | 227,992 | $ | 3,060 | $ | (380 | ) | $ | 230,672 | ||||
| Corporate notes and bonds |
100,335 | 193 | (1,928 | ) | 98,600 | ||||||||
| Asset-backed securities |
54,302 | 2 | (1,218 | ) | 53,086 | ||||||||
| Equity securities |
7,969 | — | (2,514 | ) | 5,455 | ||||||||
| Total short-term investments |
$ | 390,598 | $ | 3,255 | $ | (6,040 | ) | $ | 387,813 | ||||
At October 31, 2009, approximately $6.9 million market value of our equity securities are designated for deferred compensation payments, which are paid out as requested by the participants of the plan upon termination.
At October 31, 2009, contractual maturities of our short-term investments were:
| (In thousands) | Cost | Fair Market Value | ||||
| Less than one year |
$ | 47,198 | $ | 47,803 | ||
| Due in one to two years |
125,030 | 127,601 | ||||
| Due in two to three years |
156,996 | 160,039 | ||||
| Due in more than three years |
48,351 | 49,461 | ||||
| No contractual maturity |
7,923 | 6,905 | ||||
| Total short-term investments |
$ | 385,498 | $ | 391,809 | ||
We had net unrealized gains related to short-term investments of $6.3 million at October 31, 2009 and net unrealized losses of $2.8 million at October 31, 2008. We realized gains on the sales of securities of $4.8 million, $10.6 million, and $0.6 million in fiscal 2009, 2008, and 2007, respectively, while realizing losses on sales of securities of $1.5 million, $2.6 million, and $1.4 million during those same periods, respectively. At October 31, 2009, no investments had been in a continuous unrealized loss position for more than 12 months. At October 31, 2009, $8.9 million market value of investments with gross unrealized losses of less than $0.1 million had been in a continuous unrealized loss position for less than 12 months. We did not record any impairment losses on short-term investments during fiscal 2009 and 2007, as we considered the unrealized losses to be temporary. During fiscal 2008, as a result of Lehman
80
Table of Contents
NOVELL, INC.
NOTES TO CONSOLIDATED FINANCIAL STATEMENTS (Continued)
E. Cash and Short-Term Investments (Continued)
Brother’s bankruptcy announcement, we recorded a $1.3 million other-than temporary impairment charge on the $1.5 million of Lehman Brothers’ securities that we held at that time. During fiscal 2009 we sold this security for a minimal gain. With respect to our debt securities that are in an unrealized loss position, we expect to recover the entire cost basis of these securities before we sell them, therefore they are not considered to be other-than-temporarily impaired. We do not consider our equity securities that are in an unrealized loss position to be impaired as we have the ability and intent to hold these investments until a recovery of fair value.
F. Restricted Cash
In relation to the appeal we filed in the Amer Jneid legal matter, we were required by the court to post a $51.5 million bond during fiscal 2008 (See Note S, “Legal Proceedings”). The amount of the bond was determined by statutory regulations and has no connection to the amount we may ultimately pay in this matter. The bond is held in an interest-bearing account in our name, but is restricted and classified as such on our consolidated balance sheet. The restriction will continue until the resolution of this legal matter. The bond earned interest of $0.3 million and $1.1 million, in fiscal 2009 and 2008, respectively. As of October 31, 2009, restricted cash was $53.0 million.
G. Long-Term Investments
At October 31, 2009 and October 31, 2008, all of our ARSs were classified as long-term investments on our consolidated balance sheets, and at October 31, 2009, were our only long-term investments. Contractual maturities for these ARSs are 15 years or greater with an interest rate reset date approximately every 28 to 90 days. With the liquidity issues experienced in the global credit and capital markets, our ARSs have experienced multiple failed auctions.
During fiscal 2009, we recorded other-than-temporary impairment charges on our ARSs of $5.5 million, based on our assessment that it is likely that the fair value of the ARSs will not fully recover in the foreseeable future, given a combination of factors, including the duration, severity and continued declining trend of the fair value of these securities as well as a deterioration in some of the securities’ credit ratings. During fiscal 2008, we recorded an other-than-temporary impairment charge of $28.7 million. We consider all of our other-than-temporary losses to be credit losses and therefore these losses have been recorded in the “Impairment of investments” line item in our consolidated statements of operations. We estimated that the fair market value of these securities at October 31, 2009 and October 31, 2008 was $10.3 million and $11.1 million, respectively. During fiscal 2009, we sold two of our ARSs for $0.3 million. These two securities had an aggregate cost basis of $10.0 million and had been entirely impaired prior to the sale. Late in fiscal 2009, our remaining six ARSs had improvements in their estimated fair value resulting in a $4.7 million unrealized gain. At October 31, 2009, the original cost of the remaining ARSs was $29.8 million.
The fair value of the ARSs could change in the future and we may be required to record additional other-than-temporary impairment charges if there are further reductions in fair value in future periods.
During fiscal 2008, our holdings in an enhanced liquidity fund were frozen due to liquidity issues. The fund manager continued to distribute cash on a pro rata basis to the fund’s stockholders as the underlying securities matured. Those distributions that were forecasted to be received more than twelve months after the balance sheet date were classified as a long-term investment on our consolidated balance sheets. At October 31, 2008, the short-term and long-term portions of this fund were $18.4 million and $3.9 million, respectively. During fiscal 2009, we received distributions at par for the remaining $22.3 million balance of the fund.
Based on our ability to access our cash, cash equivalents, and short-term investments, our expected operating cash flows, and our other potential sources of cash, we do not anticipate that the lack of liquidity in our ARSs will affect our ability to operate our business in the usual course in the next twelve months.
81
Table of Contents
NOVELL, INC.
NOTES TO CONSOLIDATED FINANCIAL STATEMENTS (Continued)
H. Fair Value Measurements
The following table summarizes the composition and fair value hierarchy of our financial assets as of October 31, 2009:
| Fair Value Measurements Using | ||||||||||||
| (In thousands) | Total as of October 31, 2009 |
Quoted Prices in Active Markets for Identical Assets (Level 1) |
Significant Other Observable Inputs (Level 2) |
Significant Unobservable Inputs (Level 3) | ||||||||
| Short-term investments |
$ | 391,809 | $ | 391,809 | $ | — | $ | — | ||||
| Long-term investments |
10,303 | — | — | 10,303 | ||||||||
| Total |
$ | 402,112 | $ | 391,809 | $ | — | $ | 10,303 | ||||
| The following table summarizes the composition and fair value hierarchy of our financial assets as of October 31, 2008: | ||||||||||||
| Fair Value Measurements Using | ||||||||||||
| (In thousands) | Total as of October 31, 2008 |
Quoted Prices in Active Markets for Identical Assets (Level 1) |
Significant Other Observable Inputs (Level 2) |
Significant Unobservable Inputs (Level 3) | ||||||||
| Short-term investments |
$ | 387,813 | $ | 369,417 | $ | 18,396 | $ | — | ||||
| Long-term investments |
14,972 | — | 3,909 | 11,063 | ||||||||
| Total |
$ | 402,785 | $ | 369,417 | $ | 22,305 | $ | 11,063 | ||||
The following table summarizes the change in composition and fair value hierarchy of our Level 3 financial assets during fiscal 2009:
| (In thousands) | Fair Value Measurements Using Significant Unobservable Inputs (Level 3) Long-term Investments |
|||
| Beginning balance |
$ | 11,063 | ||
| Total gains or (losses): |
||||
| Included in earnings |
(5,466 | ) | ||
| Included in accumulated other comprehensive income (loss) |
4,706 | |||
| Ending balance |
$ | 10,303 | ||
I. Derivative Instruments and Hedging Activities
The net notional amount of foreign currency exchange contracts hedging foreign currency transactions was $27.0 million and $33.7 million at October 31, 2009 and October 31, 2008, respectively. The fair value of these contracts was immaterial at both October 31, 2009 and October 31, 2008.
During fiscal 2009, we recognized $7.3 million of losses on our foreign currency exchange contracts. These losses are shown as a component of the line item, “Interest expense and other, net” in our consolidated statements of operations.
82
Table of Contents
NOVELL, INC.
NOTES TO CONSOLIDATED FINANCIAL STATEMENTS (Continued)
J. Property, Plant and Equipment
Property, plant and equipment consist of the following:
| (In thousands) | October 31, 2009 |
October 31, 2008 |
||||||
| Buildings and land |
$ | 181,949 | $ | 189,958 | ||||
| Furniture and equipment |
164,789 | 199,091 | ||||||
| Leasehold improvements and other |
45,773 | 46,005 | ||||||
| Property, plant and equipment, at cost |
392,511 | 435,054 | ||||||
| Accumulated depreciation |
(222,052 | ) | (260,076 | ) | ||||
| Property, plant and equipment, net |
$ | 170,459 | $ | 174,978 | ||||
Depreciation and amortization expense related to property, plant and equipment totaled $23.0 million, $27.4 million, and $29.1 million, in fiscal 2009, 2008, and 2007, respectively.
During fiscal 2009, we sold certain corporate real estate assets and computer equipment for net proceeds of $10.7 million that had a net book value of $8.1 million. The sales also included other fees and expenses of $0.4 million and resulted in a $2.2 million gain.
K. Goodwill and Intangible Assets
Goodwill
Goodwill allocated to our business unit segments as of October 31, 2009 and 2008 is as follows:
| (In thousands) | Open Platform Solutions |
Identity and Security Management |
Systems and Resource Management |
Workgroup | Total | |||||||||||||||
| Balance as of October 31, 2007 |
$ | 70,599 | $ | 81,142 | $ | 120,802 | $ | 132,069 | $ | 404,612 | ||||||||||
| PlateSpin acquisition |
— | — | 176,480 | — | 176,480 | |||||||||||||||
| Impact of foreign currency translation |
— | — | (12,113 | ) | — | (12,113 | ) | |||||||||||||
| SiteScape acquisition |
— | — | — | 19,723 | 19,723 | |||||||||||||||
| Mexico/Argentina disposition |
(468 | ) | (355 | ) | (251 | ) | (411 | ) | (1,485 | ) | ||||||||||
| Adjustments |
(873 | ) | (1,021 | ) | (1,483 | ) | (1,723 | ) | (5,100 | ) | ||||||||||
| Balance as of October 31, 2008 |
$ | 69,258 | $ | 79,766 | $ | 283,435 | $ | 149,658 | $ | 582,117 | ||||||||||
| Managed Objects acquisition |
— | — | 35,176 | — | 35,176 | |||||||||||||||
| Fortefi acquisition |
— | 2,222 | — | — | 2,222 | |||||||||||||||
| Impact of foreign currency translation |
— | — | 9,222 | — | 9,222 | |||||||||||||||
| Impairment |
— | — | (270,044 | ) | — | (270,044 | ) | |||||||||||||
| Adjustments |
(72 | ) | (82 | ) | (1,877 | ) | (629 | ) | (2,660 | ) | ||||||||||
| Balance as of October 31, 2009 |
$ | 69,186 | $ | 81,906 | $ | 55,912 | $ | 149,029 | $ | 356,033 | ||||||||||
Annual goodwill impairment test as of August 1, 2009, 2008 and 2007
On August 1, 2009, 2008 and 2007, we performed our annual goodwill impairment test. The first step (“step one”) in evaluating impairment is to determine if the estimated fair value of a reporting unit, which is equivalent to our business unit segments as this is the level at which our chief decision makers review financial information, is less than the carrying value of the business unit segments. If step one indicates that the fair value is less than the carrying value of the business unit segment, then impairment potentially exists, and the second step (“step two”) is performed to measure the amount of impairment, if any. To estimate the fair value of each of our four business unit segments for step one, management made estimates and judgments about future cash flows based on assumptions that are consistent with both short-term plans and long-range forecasts used to manage the business. We also considered factors such as our market capitalization and current economic events in assessing the fair value of the business unit segments. This process requires subjective judgment at many points throughout the analysis. Changes to the estimates used in the analysis, including estimated future cash flows, could cause one or more of the business unit segments or indefinite-lived intangibles to be valued differently in future periods. Based on the results of our analysis, we determined that no goodwill impairment existed at August 1 of each fiscal year.
83
Table of Contents
NOVELL, INC.
NOTES TO CONSOLIDATED FINANCIAL STATEMENTS (Continued)
K. Goodwill and Intangible Assets (Continued)
Events subsequent to annual goodwill impairment test as of August 1, 2009
In the week leading up to the September 22, 2009 Board of Directors annual budget meeting, management updated its long-range forecast concurrent with the completion of the fiscal 2010 budgeting process. Management reduced its long-range revenue growth assumptions late in the annual planning process due to present company trends, a revised market outlook and continued economic uncertainty.
Management’s revised long-range forecast lowered the projected revenue and operating income utilized in the August 1, 2009 discounted cash flow model valuation. We considered this lowered financial outlook to be an impairment trigger event for both goodwill and long-lived assets, requiring us to re-perform the step one test for potential impairment, which we did as of September 30, 2009, our closest balance sheet date. Also, because long-term revenue projections were lowered in all four of our business unit segments, each business unit segment had to be reviewed for potential impairment.
As discussed under “Goodwill impairment test as of September 30, 2009” below, the lower long-term projections resulted in the failure of the step one test for our Systems and Resource Management business unit segment because the estimated fair value of this business unit segment was lower than its carrying value. All other business unit segments passed the step one test. Because the Systems and Resource Management business unit segment failed the step one test, we were required to perform the step two test, which utilizes a notional purchase price allocation using the estimated fair value from step one as the purchase price to determine the implied value of the business unit segment’s goodwill. The completion of the step two test resulted in the determination that $270.0 million of the Systems and Resource Management business unit segment’s goodwill was impaired. The $270.0 million impairment charge is shown in the line item “Impairment of goodwill” in our consolidated statements of operations.
While we believe that Systems and Resource Management business unit segment revenues can grow at or above market growth rates in the future, this growth was not sufficient to avoid failing the step one test. We continue to believe that our growth businesses can grow at or above market rates in the future due in part to our strategic focus with these technologies.
Goodwill impairment test as of September 30, 2009
In performing step one of the goodwill impairment test, it was necessary to determine the fair value of each of the four business unit segments. The fair values of all business unit segments, except for the Workgroup business unit segment, were estimated using a weighted average of a discounted cash flow methodology (“DCF”) and a market analysis. The market analysis included looking at the valuations of comparable public companies, as well as recent acquisitions of comparable companies. For the Workgroup business unit segment only, the DCF was utilized as it was felt that there was no comparable market information, due to the uniqueness of the Workgroup business unit segment which is forecasted to have a long-term declining revenue stream, yet have high operating margins. With respect to the other three business unit segments, a 10% weighting was given to the market analysis, unlike the prior year, when a weighting of 50% was utilized, as solid comparable market data is not available due to the uniqueness of each of our business unit segments. As a result, a weighting of 90% was given to the DCF.
Two key inputs to the DCF analysis were our future cash flow projection and the discount rate. We used a ten-year future cash flow projection, based on management’s long-range forecast, discounted to present value, and an estimate of terminal values, which was also discounted to present value. Terminal values represent the present value an investor would pay today for the rights to cash flows of the business unit segment for the years subsequent to the ten-year cash flow projection period. As noted above, the long-range forecast that was utilized for the impairment test after the September 22, 2009 Board meeting was lower than what was utilized in both the August 1, 2009 valuation and the fiscal 2008 valuation. The lower forecast was the primary reason for the lower fair values that resulted in the need to perform a step two impairment valuation for the Systems and Resource Management business unit segment. A driver of the lower forecast for the Systems and Resource Management business unit segment was the underperformance of our ZENworks products as well as our recent acquisitions.
The other major input into the DCF analysis was the discount rate, which was determined by estimating each business unit segment’s weighted average cost of capital, reflecting the nature of the respective business unit segment and the perceived risk of the underlying cash flows. We used the following discount rates in our DCF methodology for each of our business unit segments: 16.0% for Open Platform Solutions, 15.6% for Identity and Security Management, 14.6% for Systems and Resource Management and 13.0% for Workgroup. If we had increased our discount rates by 1%, it would not have impacted the ultimate results of our step one test. The
84
Table of Contents
NOVELL, INC.
NOTES TO CONSOLIDATED FINANCIAL STATEMENTS (Continued)
K. Goodwill and Intangible Assets (Continued)
excess of the fair value over the carrying value of our business unit segments was as follows: 68% for Open Platform Solutions, 139% for Identity and Security Management, and 379% for Workgroup.
The step two test involves allocating the fair value of the Systems and Resource Management business unit segment to all of its assets and liabilities on a fair value basis, with the excess amount representing the implied value of goodwill. As part of this process the fair value of the Systems and Resource Management business unit segment’s identifiable intangible assets, including in-process research and development, developed technology, customer relationships and trademarks/trade names were determined. The fair values of these assets were determined primarily through the use of the DCF method. The fair values of Systems and Resource Management’s property, plant and equipment were determined primarily through the use of third party broker quotes. The fair value of Systems and Resource Management’s deferred revenue was based upon the estimate of the amount that would be required to pay a third party to assume the obligation. After determining the fair value of all Systems and Resource Management business unit segment assets and liabilities, it was determined that the implied value of goodwill was $56.0 million. The September 30, 2009 carrying value of the Systems and Resource Management business unit segment’s goodwill was $326.0 million, which, when compared to the implied goodwill value of $56.0 million resulted in the impairment charge of $270.0 million.
The above described process requires subjective judgment at many points throughout the analysis. Changes to the estimates used in the analysis, including estimated future cash flows, could cause one or more of the business unit segments or indefinite-lived intangibles to be valued differently in future periods. It is at least reasonably possible that future analyses could result in additional material non-cash goodwill impairment charges.
Review of long-lived assets
As noted above, we concurrently performed an assessment of long-lived assets for impairment. These assets, which include tangible and intangible assets, need to be tested for impairment before the step two goodwill impairment analysis can be completed because any change in these assets would impact the carrying value of the Systems and Resource Management business unit segment.
To test the recoverability of our long-lived assets and liabilities, which for us is primarily long-lived assets, they were grouped with other assets at the lowest level for which identifiable cash flows were largely independent of the cash flows of other assets. With the exception of our Systems and Resource Management business unit segment, we determined that our asset groups were our business unit segments, as that was the lowest level at which cash flows could be separated from other assets. For the Systems and Resource Management business unit segment, separate identifiable cash flows were available for PlateSpin and Managed Objects products, with all other cash flows belonging to our remaining Systems and Resource Management business (primarily ZENworks). Therefore, the Systems and Resource Management business unit segment had three asset groups.
The test for recoverability compares undiscounted future cash flows of the long-lived asset group to its carrying value. The future cash flow period was based on the future service life of the primary asset within the long-lived asset group.
If the future cash flows exceed the carrying values of the asset group, the asset group is not considered to be impaired. If the carrying values of the asset group exceed the future cash flows, the asset group is considered to be potentially impaired. It was determined that for all asset groups except for PlateSpin and Managed Objects, the future cash flows exceeded the carrying values of the respective asset groups.
As the PlateSpin and Managed Objects asset groups had carrying values in excess of their estimated undiscounted future cash flows, it was necessary to determine the fair value of the individual assets within the asset group. Because the aggregate fair values of the individual assets of the group were less than their carrying values, an impairment was recorded equal to the excess of the aggregated carrying value of the asset group over the aggregate fair value. This loss was allocated to each asset within the group that had a fair value less than its carrying value, based on their relative carrying values, with no asset reduced below its fair value. As a result of this test, it was determined that $5.7 million of PlateSpin’s and $3.4 million of Managed Objects’ developed technology and customer relationships were impaired. These impairment charges, totaling $9.1 million, are shown in the line item, “Impairment of intangible assets” in our consolidated statements of operations.
85
Table of Contents
NOVELL, INC.
NOTES TO CONSOLIDATED FINANCIAL STATEMENTS (Continued)
K. Goodwill and Intangible Assets (Continued)
Adjustments
Adjustments during fiscal 2009 decreased goodwill by $2.7 million and related primarily to the reversal of deferred tax asset valuation allowances for acquired net operating loss carryforwards that were utilized by income generated during fiscal 2009 for the Managed Objects, Senforce, SiteScape, Tally, e-Security, and SilverStream acquisitions. For information on our Managed Objects and Fortefi acquisitions, see Note C, “Acquisitions.”
Adjustments during fiscal 2008 decreased goodwill by $5.1 million. The adjustments were comprised primarily of a $5.0 million decrease due to tax adjustments and a $0.1 million decrease from merger liability adjustments. The $5.0 million tax adjustments related to the reversal of deferred tax asset valuation allowances for acquired net operating loss carryforwards that were utilized by income generated during fiscal 2008 for the SilverStream, Ximian, Immunix, Tally, RedMojo, Senforce and SiteScape acquisitions. For information on our PlateSpin and SiteScape acquisitions, see Note C, “Acquisitions.” For information on the Mexico/Argentina dispositions, see Note D, “Divestitures.”
The $9.2 million increase in fiscal 2009, and the $12.1 million decrease in fiscal 2008 related to the impact of foreign currency translation results from the portion of goodwill related to PlateSpin that is denominated in Canadian dollars, and therefore, subject to foreign currency exchange rate fluctuations.
Intangible Assets
The following is a summary of intangible assets:
| October 31, 2009 | October 31, 2008 | |||||||||||||||||||||
| (In thousands) | Gross Amount |
Accumulated Amortization |
Net Book Value |
Gross Amount |
Accumulated Amortization |
Net Book Value |
Asset Lives | |||||||||||||||
| Developed technology |
$ | 30,765 | $ | (22,546 | ) | $ | 8,219 | $ | 52,769 | $ | (35,410 | ) | $ | 17,359 | 3-4 years | |||||||
| Trademarks/trade names |
25,511 | (865 | ) | 24,646 | 25,631 | (666 | ) | 24,965 | 3 years or Indefinite | |||||||||||||
| Customer relationships |
15,701 | (11,945 | ) | 3,756 | 31,911 | (20,915 | ) | 10,996 | 3 years | |||||||||||||
| Internal use software |
— | — | — | 5,057 | (5,057 | ) | — | 3 years | ||||||||||||||
| Total intangible assets |
$ | 71,977 | $ | (35,356 | ) | $ | 36,621 | $ | 115,368 | $ | (62,048 | ) | $ | 53,320 | ||||||||
Acquisitions
During fiscal 2009, we acquired developed technology and customer relationships of $5.8 million and $3.0 million, respectively, related to the Managed Objects acquisition, which was integrated into our Systems and Resource Management business unit segment. Further discussion was presented above in the subsection entitled, “Review of long-lived assets,” with regards to the fiscal 2009 impairment of a portion of these intangible assets. During fiscal 2009, we also acquired developed technology and customer relationships of $0.7 million and $0.2 million, respectively, related to the Fortefi acquisition, which was integrated into our Identity and Security Management business unit segment.
During fiscal 2009, the gross amount and accumulated amortization amounts in the table above were reduced $44.0 million for intangible assets that were fully amortized and were no longer being utilized. This $44.0 million was comprised of $22.9 million of developed technology, $15.9 million of customer relationships, $5.1 million of internal use software, and $0.1 million of trademarks/trade names.
During fiscal 2008, we also acquired developed technology, customer relationships, and trademarks and trade names of $12.6 million, $11.9 million and $0.9 million, respectively, related to the PlateSpin acquisition, which was integrated into our Systems and Resource Management business unit segment. Further discussion was presented above in the subsection entitled, “Review of long-lived assets,” with regards to the fiscal 2009 impairment of a portion of these intangible assets. During fiscal 2008, we acquired $12.0 million of developed technology. This developed technology relates to our Identity and Security Management business unit segment. During fiscal 2008, we also acquired developed technology and customer relationships of $1.8 million and $1.2 million, respectively, related to the SiteScape acquisition, which was integrated into our Workgroup business unit segment.
86
Table of Contents
NOVELL, INC.
NOTES TO CONSOLIDATED FINANCIAL STATEMENTS (Continued)
K. Goodwill and Intangible Assets (Continued)
Developed technology at October 31, 2009 related primarily to the Systems and Resource Management product line as a result of our acquisitions of Managed Objects, PlateSpin, and Senforce, and to our Identity and Security Management product line primarily from our acquisition of developed technology from the Hewlett-Packard Co., and the acquisitions of e-Security and Fortefi. Trademarks and trade names at October 31, 2009 related primarily to the SUSE and PlateSpin individual product names, which we continue to use, of which $24.2 million relates to SUSE, and has an indefinite life. Customer relationships at October 31, 2009 related primarily to the customers we acquired as a part of our acquisitions of PlateSpin and Managed Objects in our Systems and Resource Management business unit segment.
Amortization
Amortization expense on intangible assets was $17.3 million, $13.0 million, and $8.4 million in fiscal 2009, 2008, and 2007, respectively. Amortization of intangible assets is estimated to be $7.9 million in fiscal 2010, $4.0 million in fiscal 2011, and $0.5 million in fiscal 2012, with nothing thereafter. The weighted average amortization period of our developed technology, customer relationships, trademarks/trade names, and in total is 1.8 years, 1.6 years, 1.4 years and 1.7 years, respectively.
Impairment analysis
As discussed above, it was determined in fiscal 2009 that $5.7 million of PlateSpin’s and $3.4 million of Managed Objects’ developed technology and customer relationships were impaired.
During the fourth quarter of fiscal 2008, we completed our detailed internal reviews of the $12.0 million of developed technology acquired in the third quarter of fiscal 2008 and determined that we would not utilize all of this developed technology as initially planned. These reviews determined that only a portion of the acquired developed technology would be utilized in our products. We used discounted cash flow models to estimate the fair value of this acquired developed technology based upon the updated plans, and determined that $7.7 million had become impaired. This intangible asset was written down and the related charge was recorded in the line item, “Impairment of intangible assets” in our consolidated statements of operations during fiscal 2008. The entire $7.7 million impairment charge related to the Identity and Security Management business unit segment. As part of this review, it was determined that the estimated useful life of the remaining asset would be four years.
In the intangible asset table above, the impairment charges recorded during fiscal 2009 and 2008 were reflected in the column, “Gross Amount.”
During fiscal 2007, as part of our periodic review of intangible assets, we determined that e-Security’s financial performance declined significantly and that its estimated future undiscounted direct cash flows would not be sufficient to cover the carrying value of its intangible assets. We used discounted cash flow models to estimate the value of e-Security’s intangible assets and determined that $2.5 million, $1.3 million and $0.1 million of e-Security’s developed technology, customer relationship and trade name intangible assets, respectively, had become impaired. These intangible assets were written down and the related charges were recorded in the line item, “Impairment of intangible assets” in our consolidated statements of operations during fiscal 2007. The entire $3.9 million impairment charge related to the Identity and Security Management business unit segment.
As discussed above in Note D, “Divestitures,” in the subsection, “Salmon,” we reviewed other long-lived assets related to Salmon for impairment. This review resulted in the determination that $0.5 million of customer relationship intangible assets and $0.1 million of non-compete agreement intangible assets had become impaired and, therefore, were written off during fiscal 2007.
See Note AA, “Subsequent Events” for information regarding future changes to our business unit segments.
87
Table of Contents
NOVELL, INC.
NOTES TO CONSOLIDATED FINANCIAL STATEMENTS (Continued)
L. Income Taxes
The components of income tax expense attributable to continuing operations consist of the following:
| Fiscal Year Ended October 31, | ||||||||||||
| (In thousands) | 2009 | 2008 | 2007 | |||||||||
| Income tax expense |
||||||||||||
| Current: |
||||||||||||
| Federal |
$ | (2,939 | ) | $ | 48,778 | $ | 18,652 | |||||
| State |
1,009 | 4,884 | 1,175 | |||||||||
| Foreign |
13,226 | (1,875 | ) | 7,857 | ||||||||
| Total current income tax expense |
11,296 | 51,787 | 27,684 | |||||||||
| Deferred: |
||||||||||||
| Federal |
1,847 | (23,961 | ) | 276 | ||||||||
| State |
— | — | — | |||||||||
| Foreign |
(2,477 | ) | 7,391 | 6,731 | ||||||||
| Total deferred income tax (benefit) expense |
(630 | ) | (16,570 | ) | 7,007 | |||||||
| Total income tax expense from continuing operations |
$ | 10,666 | $ | 35,217 | $ | 34,691 | ||||||
| Differences between the U.S. statutory and effective tax rates computed as a percentage of income from continuing operations before income taxes are as follows: |
||||||||||||
| Fiscal Year Ended October 31, | ||||||||||||
| 2009 | 2008 | 2007 | ||||||||||
| U.S. statutory rate |
35.0 | % | 35.0 | % | 35.0 | % | ||||||
| State income taxes, net of federal tax effect |
0.9 | 1.5 | 4.2 | |||||||||
| Research and development tax credits |
1.1 | (9.9 | ) | (66.6 | ) | |||||||
| Foreign income taxed at different rates than U.S. statutory rate |
(2.4 | ) | (6.1 | ) | 80.5 | |||||||
| Goodwill impairment |
(19.5 | ) | — | — | ||||||||
| Valuation allowances |
(12.2 | ) | 233.2 | 324.6 | ||||||||
| Stock-based compensation |
(1.0 | ) | 12.2 | 35.9 | ||||||||
| Adjustments to prior year tax provisions |
(3.9 | ) | (4.4 | ) | — | |||||||
| Change in assertion for unremitted earnings |
— | (110.8 | ) | — | ||||||||
| Recognition of previously unrecognized tax benefits |
— | (1.3 | ) | — | ||||||||
| Other, net |
(3.2 | ) | 4.5 | (1.4 | ) | |||||||
| Effective tax rate on continuing operations |
(5.2 | )% | 153.9 | % | 412.2 | % | ||||||
| Domestic and foreign components of (loss) income from continuing operations before taxes are as follows: |
||||||||||||
| Fiscal Year Ended October 31, | ||||||||||||
| (In thousands) | 2009 | 2008 | 2007 | |||||||||
| Domestic |
$ | (123,823 | ) | $ | 280 | $ | (15,278 | ) | ||||
| Foreign |
(80,151 | ) | 22,598 | 23,693 | ||||||||
| Total (loss) income from continuing operations before taxes |
$ | (203,974 | ) | $ | 22,878 | $ | 8,415 | |||||
| Cash paid for income taxes |
$ | 35,565 | $ | 12,854 | $ | 10,272 | ||||||
Income Tax Expense
The effective tax rate for fiscal 2009 differs from the federal statutory rate of 35% primarily due to the effects of stock-based compensation, differences between the book and tax treatment of certain income items on which a valuation allowance has been recorded, as discussed below, and the jurisdictional mix of earnings. A quantitative reconciliation of our effective tax rate to the U.S. statutory rate is provided in the above tables.
The effective tax rate on continuing operations for fiscal 2009 was (5%) compared to 154% for fiscal 2008. The fiscal 2009 rate of (5%) is the result of recording tax expense on a pre-tax book loss. This was primarily due to the $279.1 million of goodwill and intangible asset impairment charges recorded for book purposes in fiscal 2009 for which we received minimal current tax benefit. In the U.S. these impairment charges are either non-deductible or deductible over 15 years with a valuation allowance on the deferred asset, and outside the U.S. these impairment charges are attributable to jurisdictions where we receive little or no tax benefit.
88
Table of Contents
NOVELL, INC.
NOTES TO CONSOLIDATED FINANCIAL STATEMENTS (Continued)
L. Income Taxes (Continued)
In fiscal 2008 we had significant book to tax differences that increased fiscal 2008 taxable income primarily as a result of a large one-time cash payment to us in fiscal 2007 that we deferred for tax purposes to fiscal 2008. Because of these book-to-tax differences, we recorded significantly higher tax expense in the U.S. in fiscal 2008 when compared to fiscal 2009, resulting in the higher overall effective tax rate in fiscal 2008 compared to fiscal 2009. Included in the fiscal 2008 effective tax rate are $3.3 million in adjustments related to settlements of prior period audits and tax filings.
Deferred Tax Assets
The components of deferred tax assets at October 31, 2009 and 2008 are as follows:
| (In thousands) | October 31, 2009 |
October 31, 2008 |
||||||
| Deferred income taxes: |
||||||||
| Deferred tax assets: |
||||||||
| Accruals |
$ | 86,706 | $ | 117,992 | ||||
| Capital loss carryforwards |
32,457 | 32,162 | ||||||
| Credit carryforwards |
138,894 | 133,706 | ||||||
| Net operating loss carryforwards |
120,807 | 105,859 | ||||||
| Intangibles from acquisitions |
41,967 | — | ||||||
| Investment impairments |
33,222 | 34,167 | ||||||
| Receivable valuation accounts |
1,238 | 1,071 | ||||||
| Stock-based compensation expense |
16,809 | 18,364 | ||||||
| Other items |
12,065 | 8,958 | ||||||
| Gross deferred tax assets |
484,165 | 452,279 | ||||||
| Valuation allowance |
(459,795 | ) | (409,219 | ) | ||||
| Total deferred tax assets |
24,370 | 43,060 | ||||||
| Deferred tax liabilities: |
||||||||
| Depreciation |
(535 | ) | (6,916 | ) | ||||
| Intangibles from acquisitions |
— | (5,940 | ) | |||||
| Total deferred tax liabilities |
(535 | ) | (12,856 | ) | ||||
| Net deferred tax assets |
$ | 23,835 | $ | 30,204 | ||||
We record deferred tax assets and liabilities based upon the future tax consequence of differences between the book and tax basis of assets and liabilities, and other tax attributes. We also assess our ability to realize deferred tax assets based upon a “more likely than not” standard and provide a valuation allowance for any tax assets not deemed realizable.
We follow tax ordering laws to determine the sequence in which deductions, net operating loss carryforwards, and tax credits are utilized. For fiscal years including 2005 through 2009, substantially all of the benefit received from our net operating loss carryforwards used to offset U.S. taxable income has been credited to additional paid-in capital or goodwill and not to income tax expense. In addition, the windfall tax benefits associated with stock-based compensation has been credited to additional paid-in capital. Beginning in fiscal 2010, as a result of new accounting rules for business combinations, the benefit from our remaining acquisition-related net operating loss carryforwards used to offset U.S. taxable income will be credited to income tax expense.
As of October 31, 2009, we had $195.6 million in net operating loss carryforwards from acquired companies that will expire in years 2018 through 2028. These loss carryforwards from acquired companies can be utilized to offset future taxable income, but are subject to certain annual limitations. In future years, the benefit of the use of these loss carryforwards will be recorded to reduce income tax expense. In addition, we have approximately $166.9 million of foreign loss carryforwards, of which $5.9 million, $24.5 million, and $15.8 million are subject to expiration in years 2010, 2011, and 2012 through 2028, respectively. The remaining losses do not expire. We have $84.1 million in capital loss carryforwards, which, if not utilized, will expire in fiscal years 2010 through 2014. We have foreign tax credit carryforwards of $33.8 million that expire between fiscal years 2010 and 2019, general business credit carryforwards of $83.8 million that expire between fiscal years 2010 and 2029, and alternative minimum tax credit carryforwards of $11.3 million that do not expire. We also have various state net operating loss and credit carryforwards that expire in accordance with the respective state statutes.
89
Table of Contents
NOVELL, INC.
NOTES TO CONSOLIDATED FINANCIAL STATEMENTS (Continued)
L. Income Taxes (Continued)
Valuation Allowance
We continue to believe that it is more likely than not that most of our net deferred tax assets will not be realized based on all available evidence. As a result, we have provided a valuation allowance on those U.S. net deferred tax assets. In reaching this determination, we evaluated our three-year cumulative results, pre-tax losses in recent quarters, as well as the impacts that current economic conditions may have on our future results. As of October 31, 2009, deferred tax assets of approximately $19.4 million pertain to certain tax credits and net operating loss carryforwards resulting from the exercise of employee stock options. If realized, the tax benefit of these credits and losses will be accounted for as a credit to stockholders’ equity. It is reasonably possible that we could reduce a significant portion of our valuation allowance in the near-term.
Foreign Earnings
We have not provided deferred taxes relative to undistributed earnings of foreign subsidiaries as such undistributed earnings are considered to be indefinitely reinvested. Prior to fiscal 2008, we had provided deferred taxes on the undistributed earnings of certain foreign subsidiaries, but such deferred taxes were reversed during fiscal 2008 based on our assertion to remain indefinitely reinvested in all foreign subsidiaries. We consider the earnings to be indefinitely reinvested based on management’s overall business strategy, including anticipated future uses of global cash balances. Total undistributed earnings of approximately $233.6 million at October 31, 2009 may become taxable upon their remittance as dividends or upon the sale or liquidation of these foreign subsidiaries. It is not practicable to determine the amounts of net additional income tax that may be payable if such earnings were repatriated.
Income Tax Reserves
As of October 31, 2009, we had reserves for unrecognized tax benefits totaling $37.3 million, excluding interest, of which $26.1 million would favorably impact our effective tax rate if recognized. As of October 31, 2008, we had reserves for unrecognized tax benefits totaling $49.9 million, excluding interest. The $12.6 million decrease in reserves for unrecognized tax benefits, excluding interest, during the fiscal year relates primarily to the release of reserves which were effectively settled during fiscal 2009.
During fiscal 2009, we accrued approximately $2.3 million in interest related to unrecognized tax benefits, partially offset by a $0.4 million reduction in accrued interest attributable to the decrease in unrecognized tax benefits in which the statute of limitations lapsed during the year. We had $9.3 million and $7.4 million accrued for the payment of interest related to unrecognized tax benefits as of October 31, 2009 and October 31, 2008, respectively.
As of October 31, 2009, we have recorded a $35.4 million liability for unrecognized tax benefits and related interest in the line item, “Other long-term liabilities” on our consolidated balance sheet.
The difference between the total unrecognized tax benefits and those affecting the effective tax rate is due to certain unrecognized tax benefits that would have a full valuation allowance if recognized. As of October 31, 2009, we believe it is reasonably possible that $24.0 million of unrecognized tax benefits and accrued interest will decrease within the next 12 months as the result of statutes of limitations expiring in various jurisdictions. The favorable $24.0 million decrease in unrecognized tax benefits would significantly impact the 2010 effective tax rate.
90
Table of Contents
NOVELL, INC.
NOTES TO CONSOLIDATED FINANCIAL STATEMENTS (Continued)
L. Income Taxes (Continued)
The following is a reconciliation of our change in uncertain tax positions:
| (In thousands) | Total Gross Unrecognized Tax Benefits |
|||
| Balance at November 1, 2007 |
$ | 55,092 | ||
| Increases related to fiscal 2008 tax positions |
6,449 | |||
| Increases related to prior fiscal year tax positions |
2,923 | |||
| Decreases related to settlement of prior fiscal year tax positions |
(2,687 | ) | ||
| Expiration of statute of limitations for assessment of taxes |
(11,915 | ) | ||
| Balance at October 31, 2008 |
49,862 | |||
| Increases related to fiscal 2009 tax positions |
1,091 | |||
| Increases related to prior fiscal year tax positions |
4,496 | |||
| Decreases related to settlement of prior fiscal year tax positions |
(17,471 | ) | ||
| Expiration of statute of limitations for assessment of taxes |
(670 | ) | ||
| Balance at October 31, 2009 |
$ | 37,308 | ||
We conduct business globally and, as a result, one or more of our subsidiaries file income tax returns in the U.S. federal jurisdiction and various state and foreign jurisdictions. In the normal course of business, we are subject to examination by taxing authorities throughout the world. During fiscal year 2009, with the exception of two issues, we reached a settlement with the Internal Revenue Service (“IRS”) on its 2005 through 2006 examination. We do not anticipate that the settlement of the two outstanding issues will have a material impact on our financial position or results of operations. In addition, we are at various stages in examinations in some foreign jurisdictions. With few exceptions, we are no longer subject to U.S. federal, state and local income tax examinations for years prior to fiscal 2002 or non-U.S. income tax examinations for years prior to fiscal 2005.
M. Other Accrued Liabilities
Other accrued liabilities consist of the following:
| (In thousands) | October 31, 2009 |
October 31, 2008 | ||||
| Accrued property and other taxes |
$ | 14,069 | 15,831 | |||
| Restructuring reserves |
12,843 | 20,570 | ||||
| Accrued royalties |
10,735 | 10,984 | ||||
| Merger liabilities |
10,098 | 10,618 | ||||
| Accrued marketing expenses |
7,279 | 5,296 | ||||
| Other accrued expenses |
42,130 | 45,630 | ||||
| Total other accrued liabilities |
$ | 97,154 | $ | 108,929 | ||
N. Restructuring Expenses and Merger Liabilities
Fiscal 2009
During fiscal 2009, we recorded net restructuring expenses of $25.2 million. This was comprised of $10.2 million in restructuring expenses under our current restructuring plan, which we began implementing in the third quarter of fiscal 2009 in response to current economic conditions, $13.9 million for restructuring actions incurred for the completion of the restructuring plan that we began during the fourth quarter of fiscal 2006 and completed during the second quarter of fiscal 2009, and $1.1 million in additions to accruals for changes in estimates related to prior period restructuring activities.
The $10.2 million recorded under our current restructuring plan is in response to current economic conditions. As part of that plan, we reduced our workforce by 191 employees, which was comprised of: 90 product development employees, 73 sales and marketing employees, 12 technical support employees, 9 general and administrative employees, 5 consulting employees and 2 operations employees. We also vacated a facility and recorded $0.5 million in restructuring charges for lease exit costs. At October 31, 2009, our total headcount was approximately 3,600.
91
Table of Contents
NOVELL, INC.
NOTES TO CONSOLIDATED FINANCIAL STATEMENTS (Continued)
N. Restructuring Expenses and Merger Liabilities (Continued)
The following table summarizes the activity related to this restructuring action:
| (In thousands) | Severance and Benefits |
Excess Facilities |
Other Restructuring Related Costs |
Total | ||||||||||||
| Original reserve |
$ | 9,225 | $ | 526 | $ | 419 | $ | 10,170 | ||||||||
| Cash payments |
(2,684 | ) | (13 | ) | (419 | ) | (3,116 | ) | ||||||||
| Balance at October 31, 2009 |
$ | 6,541 | $ | 513 | $ | — | $ | 7,054 | ||||||||
The remaining unpaid balance as of October 31, 2009 is primarily for severance, which we expect to pay over the next twelve months, and lease costs for redundant facilities, which we expect to pay over the respective remaining contract terms, the longest of which extends to 2013.
The $13.9 million of fiscal 2009 restructuring actions are a completion of the restructuring plan that we began during the fourth quarter of fiscal 2006 and completed during the second quarter of fiscal 2009. This restructuring plan was related to our strategy to implement a comprehensive transformation of our business and to achieve competitive operating margins. As part of that plan, during fiscal 2009, we reduced our workforce by 150 employees, which was comprised of: 68 product development employees, 36 technical support employees, 13 general and administrative employees, 18 sales and marketing employees, 11 consulting employees and four operations employees. We also vacated several facilities and recorded $4.4 million in restructuring charges for lease exit costs.
The following table summarizes the activity related to this restructuring action:
| (In thousands) | Severance and Benefits |
Excess Facilities |
Total | |||||||||
| Original reserve |
$ | 9,528 | $ | 4,408 | $ | 13,936 | ||||||
| Cash payments |
(9,463 | ) | (1,471 | ) | (10,934 | ) | ||||||
| Balance at October 31, 2009 |
$ | 65 | $ | 2,937 | $ | 3,002 | ||||||
The remaining unpaid balance as of October 31, 2009 is primarily for lease costs for redundant facilities, which we expect to pay over the respective remaining contract terms, the longest of which extends to 2018.
Fiscal 2008
During fiscal 2008, we recorded net restructuring expenses of $28.6 million. This was comprised of $31.0 million in restructuring activities recognized during fiscal 2008 and $2.4 million in reductions of accruals for restructuring activities recorded in prior periods.
The restructuring actions undertaken during fiscal 2008 were a continuation of the restructuring plan that we began during the fourth quarter of fiscal 2006. The restructuring plan is related to our strategy to implement a comprehensive transformation of our business and to achieve competitive operating margins. Specific actions taken during fiscal 2008 included reducing our workforce by 364 employees.
92
Table of Contents
NOVELL, INC.
NOTES TO CONSOLIDATED FINANCIAL STATEMENTS (Continued)
N. Restructuring Expenses and Merger Liabilities (Continued)
The following table summarizes the activity related to the fiscal 2008 restructuring:
| (In thousands) | Severance and Benefits |
Excess Facilities |
Other Restructuring Related Costs |
Total | ||||||||||||
| Original reserve |
$ | 25,583 | $ | 3,492 | $ | 1,949 | $ | 31,024 | ||||||||
| Cash payments |
(10,893 | ) | (2,213 | ) | (1,576 | ) | (14,682 | ) | ||||||||
| Non-cash adjustments |
37 | (41 | ) | (144 | ) | (148 | ) | |||||||||
| Balance at October 31, 2008 |
14,727 | 1,238 | 229 | 16,194 | ||||||||||||
| Cash payments |
(15,006 | ) | (734 | ) | (217 | ) | (15,957 | ) | ||||||||
| Non-cash adjustments |
901 | 331 | (12 | ) | 1,220 | |||||||||||
| Balance at October 31, 2009 |
$ | 622 | $ | 835 | $ | — | $ | 1,457 | ||||||||
The remaining unpaid balance as of October 31, 2009 is primarily for lease costs for redundant facilities, which we expect to pay over the respective remaining contract terms, the longest of which extends to 2013, and for severance, which we expect to pay over the next twelve months.
Fiscal 2007
During fiscal 2007, we recorded net restructuring expenses of $43.1 million, of which $43.3 million related to restructuring activities recognized during fiscal 2007 and $0.2 million related to net releases of previously recorded restructuring liabilities. The fiscal 2007 restructuring action is a continuation of the restructuring plan that we began implementing during the fourth quarter of fiscal 2006 and continued throughout fiscal 2007 and is related to our strategy discussed above.
Specific actions taken during fiscal 2007 included reducing our workforce by 619 employees and exiting several facilities.
The following table summarizes the activity related to the fiscal 2007 restructuring:
| (In thousands) | Severance and Benefits |
Excess Facilities |
Other Restructuring Related Costs |
Total | ||||||||||||
| Original reserve |
$ | 38,796 | $ | 4,238 | $ | 289 | $ | 43,323 | ||||||||
| Cash payments |
(17,383 | ) | (1,988 | ) | (273 | ) | (19,644 | ) | ||||||||
| Non-cash adjustments |
(103 | ) | (149 | ) | (2 | ) | (254 | ) | ||||||||
| Balance at October 31, 2007 |
21,310 | 2,101 | 14 | 23,425 | ||||||||||||
| Cash payments |
(20,189 | ) | (1,143 | ) | (14 | ) | (21,346 | ) | ||||||||
| Non-cash adjustments |
(974 | ) | 241 | — | (733 | ) | ||||||||||
| Balance at October 31, 2008 |
147 | 1,199 | — | 1,346 | ||||||||||||
| Cash payments |
(40 | ) | (1,007 | ) | — | (1,047 | ) | |||||||||
| Non-cash adjustments |
(107 | ) | 156 | — | 49 | |||||||||||
| Balance at October 31, 2009 |
$ | — | $ | 348 | $ | — | $ | 348 | ||||||||
The remaining unpaid balance as of October 31, 2009 is for lease costs for redundant facilities which we expect to pay over the respective remaining contract terms, the longest of which extends to 2012.
Fiscal 2005 to Fiscal 2002
During fiscal 2005, 2004, 2003, and 2002, we recorded net restructuring expenses of $57.7 million, $19.1 million, $37.8 million and $20.4 million, respectively. The remaining balances of these actions are not material to the consolidated financial statements presented in this Annual Report on Form 10-K.
93
Table of Contents
NOVELL, INC.
NOTES TO CONSOLIDATED FINANCIAL STATEMENTS (Continued)
N. Restructuring Expenses and Merger Liabilities (Continued)
Merger Liabilities
The following table summarizes the merger liabilities balance and activity during fiscal 2009:
| (In thousands) | Balance at October 31, 2008 |
Additions From Acquisitions |
Payments/ Adjustments |
Balance at October 31, 2009 | |||||||||
| Facilities related |
$ | 10,355 | $ | 145 | $ | (529 | ) | $ | 9,971 | ||||
| Employee related |
170 | — | (170 | ) | — | ||||||||
| Other |
93 | 988 | (954 | ) | 127 | ||||||||
| Total merger liabilities |
$ | 10,618 | $ | 1,133 | $ | (1,653 | ) | $ | 10,098 | ||||
The additions from acquisitions relate to the Managed Objects and Fortefi acquisitions (See Note C, “Acquisitions”). As of October 31, 2009, the remaining unpaid balance is for lease costs for redundant facilities, which we expect to pay over the respective remaining contract terms, the longest of which extends to 2025 and professional fees, which will be paid over the next twelve months.
O. Line of Credit
We have a $15.0 million bank line of credit available for letter of credit purposes. As of October 31, 2009, there were standby letters of credit of $8.7 million outstanding under this line, all of which are collateralized by cash. The bank line of credit expires on April 1, 2010. The bank line of credit is subject to the terms of a credit agreement containing financial covenants and restrictions, none of which are expected to affect our operations. As of October 31, 2009, we are in compliance with the financial covenants and restrictions contained in this credit agreement. In addition, as of October 31, 2009, we had outstanding letters of credit of an insignificant amount at other banks.
P. Senior Convertible Debentures
On July 2, 2004, we issued and sold $600 million aggregate principal amount of Debentures due 2024. The Debentures paid interest at 0.50% per annum, payable semi-annually on January 15 and July 15 of each year, commencing January 15, 2005. Each $1,000 principal amount of Debentures was convertible, at the option of the holders, into approximately 86.79 shares of our common stock prior to July 15, 2024 if (1) the price of our common stock traded above 130% of the conversion price for a specified duration, (2) the trading price of the Debentures was below a certain threshold, subject to specified exceptions, (3) the Debentures had been called for redemption, or (4) specified corporate transactions had occurred. None of the conversion triggers were met.
Due to the voluntary review of our historical stock-based compensation practices that was announced in August 2006 and not completed until May 2007, we did not file our third quarter fiscal 2006 Form 10-Q, fiscal 2006 Form 10-K, and first quarter fiscal 2007 Form 10-Q in a timely manner. As a result, to avoid a dispute with Wells Fargo Bank, N.A., the trustee of our Debentures, as to whether we were in default under the indenture because of the delay in filing our Form 10-Q for the period ended July 31, 2006, we solicited consents from the holders of the Debentures to proposed amendments to the indenture that would give us until Thursday, May 31, 2007 to become current in our SEC reporting obligations. Under the terms of the consent solicitation that was received on November 9, 2006, we paid an additional 7.3% per annum, or $44.0 million, in special interest on the Debentures from November 9, 2006 to, but excluding November 9, 2007. Since the change in the terms of the Debentures did not result in substantially different cash flows, this change in terms was accounted for as a modification of debt and not an extinguishment of debt, and therefore the additional $44.0 million of special interest payments was expensed over the period from November 9, 2006 through July 15, 2009, the date the Debentures were first callable by either party. During the period of November 9, 2006 through July 15, 2009, the new effective interest rate on this debt, including the $44.0 million, was 3.2%. The $44.0 million of special interest payments was paid over three periods. Payments of $8.1 million, $22.0 million and $13.9 million occurred in January 2007, July 2007, and January 2008, respectively. In addition, we expensed approximately $1.5 million in fees paid to Citigroup for work performed on the consent process. On May 25, 2007, we filed our delinquent reports bringing us current with our SEC reporting obligations.
In connection with the issuance of the Debentures, we incurred $14.9 million of issuance costs, which primarily consisted of investment banker fees and legal and other professional fees. These costs were amortized as interest expense using the effective interest method over the term from issuance through July 15, 2009, the date that the holders required us to repurchase the Debentures.
94
Table of Contents
NOVELL, INC.
NOTES TO CONSOLIDATED FINANCIAL STATEMENTS (Continued)
P. Senior Convertible Debentures (Continued)
Amortization expense related to the issuance costs was $0.4 million, $2.5 million and $3.0 million for fiscal 2009, 2008, and 2007, respectively.
During fiscal 2008, we received authorization from our Board of Directors to repurchase, from time to time, up to $600 million face value of the Debentures in such quantities, at such prices and in such manner as may be directed by our management.
During fiscal 2008, we purchased and retired $474.3 million face value of the Debentures for total cash consideration of $456.5 million, including $0.6 million of accrued interest. The portions of the unamortized debt issuance costs and prepaid interest related to the Debentures that were repurchased were written off, resulting in a $4.6 million gain during fiscal 2008. This gain is shown as a component of the line item “Interest expense and other, net” in our consolidated statements of operations.
During the first quarter of fiscal 2009, we purchased and retired $4.0 million face value of the Debentures under this plan for total cash consideration of $3.9 million, including less than $0.1 million of accrued interest. During the third quarter of fiscal 2009, in accordance with the terms of the Debentures, we offered to repurchase our outstanding Debentures. As a result, we repurchased the remaining $121.7 million of outstanding Debentures at face value and paid $0.1 million, primarily for legal fees incurred in connection with the repurchase.
During fiscal 2009, 2008 and 2007, we incurred interest expense of $3.2 million, $18.8 million and $22.0 million, respectively, including the amortization of deferred financing costs related to the Debentures. During fiscal 2009, we made cash payments for interest of $0.6 million.
Q. Guarantees
Like most software vendors, we are party to a variety of agreements, primarily with customers, resellers, distributors, and independent hardware and software vendors (generally, “Customers”), pursuant to which we may be obligated to indemnify the Customer against third-party allegations of intellectual property infringement resulting from the Customer’s use of our offerings or distribution of our software, either of which may include proprietary and/or open source materials. In such circumstances, the Customer must satisfy specified conditions to qualify for indemnification. Our obligations under these agreements may be limited in terms of time and/or amount, and in some instances we may have recourse against third parties.
It is not possible to predict the maximum potential amount of future payments under these guarantees and indemnifications or similar agreements due to the conditional nature of our obligations and the unique facts and circumstances involved in each particular agreement. To date, we have not been required to make any payment guarantees and indemnifications. We do not record a liability for potential litigation claims related to indemnification agreements with our Customers unless and until we conclude the likelihood of a material obligation is probable and estimable.
R. Commitments and Contingencies
As of October 31, 2009, we have various operating leases related to our facilities. These leases have minimum annual lease commitments of $12.4 million in fiscal 2010, $10.9 million in fiscal 2011, $9.6 million in fiscal 2012, $6.0 million in fiscal 2013, $4.8 million in fiscal 2014, and $11.7 million thereafter. We also have $19.4 million of minimum rentals to be received in the future from subleases.
Rent expense, net of sublease rental income, for operating and month-to-month leases was $14.9 million, $17.5 million, and $16.7 million, in fiscal 2009, 2008, and 2007, respectively.
During fiscal 2008, we issued $4.8 million of debt to finance leasehold improvements for our Bangalore, India product development facility. During fiscal 2009, we repaid this obligation in full. Interest expense in fiscal 2009 related to this debt was $0.3 million.
95
Table of Contents
NOVELL, INC.
NOTES TO CONSOLIDATED FINANCIAL STATEMENTS (Continued)
S. Legal Proceedings
SilverStream, which we acquired in July 2002, and several of its former officers and directors, as well as the underwriters who handled SilverStream’s two public offerings, were named as defendants in several class action complaints that were filed on behalf of certain former stockholders of SilverStream who purchased shares of SilverStream common stock between August 16, 1999 and December 6, 2000. These complaints are closely related to several hundred other complaints that the same plaintiffs have brought against other issuers and underwriters. These complaints all allege violations of the Securities Act of 1933, as amended, and the Securities Exchange Act of 1934, as amended. In particular, they allege, among other things, that there was undisclosed compensation received by the underwriters of the public offerings of all of the issuers, including SilverStream. A Consolidated Amended Complaint with respect to all of these complaints was filed in the U.S. District Court, Southern District of New York, on April 19, 2002. While we believe that SilverStream and its former officers and directors have meritorious defenses to the claims, various parties participated in settlement discussions and reached a proposed settlement agreement. After notice to the plaintiff class, the settlement agreement received final approval from the Court on September 10, 2009. We believe it is probable that any settlement payment will be covered by our insurance carrier. While there can be no assurance as to the ultimate disposition of the litigation, we do not believe that its resolution will have a material adverse effect on our financial position, results of operations or cash flows.
On July 12, 2002, Amer Jneid and other related plaintiffs filed a complaint in the Superior Court of California, Orange County, alleging claims for breach of contract, fraud in the inducement, misrepresentation, infliction of emotional distress, rescission, slander and other claims against us in connection with our purchase of so-called “DeFrame” technology from the plaintiffs and two affiliated corporations (TriPole Corporation and Novetrix), and employment agreements that we entered into with the plaintiffs in connection with the purchase. The complaint sought unspecified damages, including “punitive damages.” The dispute (resulting in these claims) arises out of the plaintiffs’ assertion that we failed to properly account for license distributions which the plaintiffs claim would have entitled them to certain bonus payouts under the purchase and employment agreements. After a lengthy jury trial, the jury returned a verdict in favor of the various plaintiffs on certain contract claims and in favor of us on various remaining claims. We then pursued an appeal of the judgment and the related orders to the California Court of Appeals. We accrued $27.0 million in prior fiscal periods for this matter. As part of the appeal process and during the first quarter of fiscal 2008, we posted a $51.5 million bond in conjunction with our appeal of this judgment. On December 17, 2009, the California Court of Appeals reversed the judgment against us and remanded the case for a new trial. As a result of the reversal, the bond is no longer required, and we are evaluating all of our options with respect to settling this case or taking it back to trial. While there can be no assurance as to the ultimate disposition of the litigation, we do not believe that its resolution will have a material adverse effect on our financial position or results of operations.
On January 20, 2004, the SCO Group, Inc. (“SCO”) filed suit against us in the Third Judicial District Court of Salt Lake County, State of Utah. Upon our motion, the action was removed to the U.S. District Court, District of Utah. SCO’s original complaint alleged that our public statements and filings regarding the ownership of the copyrights in UNIX and UnixWare harmed SCO’s business reputation and affected its efforts to protect its ownership interest in UNIX and UnixWare. Our answer set forth numerous affirmative defenses and counterclaims alleging slander of title and breach of contract, and seeking declaratory actions and actual, special and punitive damages in an amount to be proven at trial. On February 3, 2006, SCO filed a Second Amended Complaint alleging that we had violated supposed non-competition provisions of the agreement under which we sold certain UNIX-related assets to SCO, that we infringed SCO’s copyrights, and that we are engaging in unfair competition by attempting to deprive SCO of the value of the UNIX technology. SCO sought to require us to assign all copyrights that we have registered in UNIX and UnixWare to SCO, to prevent us from representing that we have any ownership interest in the UNIX and UnixWare copyrights, to require us to withdraw all representations we have made regarding our ownership of the UNIX and UnixWare copyrights, and to cause us to pay actual, special and punitive damages in an amount to be proven at trial. As a result of SCO’s Second Amended Complaint, our wholly-owned subsidiary, SUSE Linux AG (“SUSE”), filed a demand for arbitration before the International Court of Arbitration in Zurich, Switzerland, pursuant to a “UnitedLinux Agreement” in which SCO and SUSE were parties. On August 10, 2007, the U.S. District Court Judge issued a Memorandum Decision and Order that granted us summary judgment against SCO on significant issues in the litigation. The District Court determined that we own the UNIX copyrights and dismissed certain of SCO’s claims against us. On September 14, 2007, SCO filed a petition for relief under Chapter 11 of the U.S. Bankruptcy Code. On July 16, 2008, the U.S. District Court issued Findings of Fact and Conclusions of Law wherein the Court determined that SCO did not have authority to enter into the 2003 Sun Microsystems, Inc. agreement and owed us $2.5 million plus prejudgment interest. The Court further concluded that SCO’s licenses to Microsoft and other “SCOsource licensees” included an “incidental” license to Unix SVRX code and therefore we were not entitled to any proceeds from such licenses. On November 20, 2008, the U.S. District Court entered Final Judgment dismissing SCO’s remaining claims against us and awarded us $3.5 million. On November 25, 2008, SCO filed a Notice of Appeal from that decision to the Tenth Circuit Court of Appeals. On August 24, 2009, a three Judge Panel from the Tenth Circuit Court of Appeals issued an opinion that reversed in part and affirmed in part the Trial Court’s decision. The Circuit Court affirmed the award to us of $3.5 million but remanded the remainder of the case back to the Trial Court for trial on the issue of whether the Unix copyrights had been
96
Table of Contents
NOVELL, INC.
NOTES TO CONSOLIDATED FINANCIAL STATEMENTS (Continued)
S. Legal Proceedings (Continued)
or should be transferred to SCO. Trial on some of our and SCO’s remaining claims is now scheduled to begin on March 8, 2010. On August 25, 2009, the U.S. Bankruptcy Court entered an Order appointing an independent Chapter 11 Trustee to manage the SCO bankruptcy estate, including decisions relative to the litigation against us, IBM and other defendants. While there can be no assurance as to the ultimate disposition of the litigation, we do not believe that its resolution will have a material adverse effect on our financial position, results of operations or cash flows.
On November 12, 2004, we filed suit against Microsoft in the U.S. District Court, District of Utah. We are seeking treble and other damages under the Clayton Act, based on claims that Microsoft eliminated competition in the office productivity software market during the time that we owned the WordPerfect word-processing application and the Quattro Pro spreadsheet application. Among other claims, we allege that Microsoft withheld certain critical technical information about the Windows operating system (“Windows”) from us, thereby impairing our ability to develop new versions of WordPerfect and other office productivity applications, and that Microsoft integrated certain technologies into Windows designed to exclude WordPerfect and other applications owned by us from relevant markets. In addition, we allege that Microsoft used its monopoly power to prevent original equipment manufacturers from offering WordPerfect and other applications to customers. On June 10, 2005, Microsoft’s motion to dismiss the complaint was granted in part and denied in part. On October 15, 2007, the U.S. Fourth Circuit Court of Appeals affirmed the District Court’s ruling. On March 18, 2008, the United States Supreme Court rejected Microsoft’s Petition for a Writ of Certiorari seeking to appeal the Fourth Circuit’s Decision. As a result of these rulings, we are now proceeding with the remaining claims against Microsoft. In November 2009, we filed Motions for Summary Judgment on various legal issues in the case, as did Microsoft. Depending on the resolution of these Motions, we are anticipating a trial date in 2010.
Between September and November of 2006, seven separate derivative complaints were filed in Massachusetts state and federal courts against us and many of our current and former officers and directors asserting various claims related to alleged options backdating. We were also named as a nominal defendant in these complaints, although the actions are derivative in nature and purportedly asserted on our behalf. These actions arose out of our announcement of a voluntary review of our historical stock-based compensation practices. The two state court cases were consolidated before the Business Litigation Session of the Massachusetts Suffolk County Superior Court. After we filed a motion to dismiss the state court complaints, plaintiffs voluntarily stipulated to the dismissal of those actions without prejudice. The five federal court cases were also consolidated. On July 14, 2009, plaintiffs in the federal cases also voluntarily stipulated to the dismissal of those cases without prejudice. The federal court approved the dismissal of those cases on July 15, 2009.
On June 15, 2009, our Board of Directors received a letter from four stockholders who had previously filed lawsuits against us for alleged options backdating, demanding that the Board of Directors investigate certain issues relating to our historical stock option grant practices, as well as our Audit Committee’s findings concerning those practices announced in our May 23, 2007 press release. The Board of Directors has constituted a Special Litigation Committee to investigate and respond to the demand letter. On August 28, 2009, these stockholders filed a complaint in the Massachusetts Middlesex County Superior Court against many of our current and former officers and directors asserting various claims related to alleged option backdating. We were also named as a nominal defendant in this complaint, although the action is derivative in nature and purportedly asserted on our behalf. While there can be no assurance as to the ultimate disposition of the Special Litigation Committee’s investigation or this stockholder complaint, we do not believe that its resolution will have a material adverse effect on our financial position, results of operations or cash flows.
In November 2007, we were served with a complaint by IP Innovations (a patent litigation company), alleging that the distribution of Linux-based products by both Red Hat, Inc. (a co-defendant in the case) and us violates certain U.S. Patents. Our initial evaluation of the patent claims asserted by the plaintiff indicates that we have strong defenses to the claims. Although we are preparing to defend against the claims, we have also had settlement discussions with IP Innovations that we are hopeful may lead to a settlement without the need for protracted litigation. In prior periods, we accrued $1.3 million for this matter. While there can be no assurance as to the ultimate disposition of the litigation or negotiations, we do not believe that its resolution will have a material adverse effect on our financial position, results of operations or cash flows.
In addition to the matters discussed above, we are currently party to various legal proceedings and claims involving former employees, either asserted or unasserted, which arise in the ordinary course of business. While the outcome of these matters cannot be predicted with certainty, we do not believe that the outcome of any of these claims will have a material adverse effect, individually or in the aggregate, on our consolidated financial position, results of operations or cash flows.
97
Table of Contents
NOVELL, INC.
NOTES TO CONSOLIDATED FINANCIAL STATEMENTS (Continued)
S. Legal Proceedings (Continued)
We accrue for losses that we believe are probable and can be reasonably estimated. We evaluate the adequacy of our legal reserves based on our assessment of many factors, including our interpretations of the law and our assumptions about the future outcome of each case based on current information. It is reasonably possible that our legal reserves could be increased or decreased in the near term based on our assessment of these factors.
T. Stockholders’ Equity
Stock Repurchase
On May 13, 2008, our Board of Directors authorized the repurchase of up to $100.0 million of our outstanding common stock. There is no fixed termination date for the repurchase program. There were no repurchases under the program during fiscal 2009. As of October 31, 2009, 11.6 million shares of common stock have been repurchased and retired under this program at an average price of $5.75 per share. The total amount paid for the repurchase of our common stock was $66.8 million, leaving $33.2 million remaining to be repurchased under the current Board authorization.
Stock Award Plans
At the annual stockholders’ meeting on April 6, 2009, our stockholders approved the Novell, Inc. 2009 Omnibus Incentive Plan (“2009 Plan”). No new awards can be granted under our prior plans; however, we continue to manage outstanding awards under those plans, which are discussed in more detail below.
When granting stock options, we typically grant nonstatutory options at fair market value on the grant date, defined in the stock award plans as the closing price of our stock on the day prior to grant. Our current practice is to grant nonstatutory options or restricted units to mid- and upper-management at the time of hire. We also maintain an ongoing grant program under which certain employees are eligible for consideration based on their past performance or future retention requirement.
The 2009 Plan
The 2009 Plan provides for the grant of stock options, stock appreciation rights, restricted stock and restricted stock units, performance shares and performance units, and other cash-based and stock-based awards. It also provides for the issuance of common stock equivalents (“CSEs”). As of October 31, 2009, a total of 1.5 million potential shares from stock awards were outstanding.
As of October 31, 2009, 47.6 million shares are authorized under the 2009 Plan, of which 45.7 million shares are available for grant. For purposes of determining future shares available for grant, shares granted as full value awards, including restricted stock units and restricted stock, reduce the shares available for grant by 1.5 shares. All other types of grants reduce the shares available for grant by one share. We currently expect that under the 2009 Plan we will continue substantially the same stock-based compensation practices followed under prior plans. We generally grant nonqualified stock options and restricted stock units. Stock options are granted at fair market value on the grant date, defined in the 2009 Plan as the closing price of our stock on the day prior to grant and generally expire eight years from the date of grant. Upon vesting, restricted stock units are automatically converted into shares of common stock on a one-for-one basis without the payment of any additional consideration. CSEs may be issued to non-employee members of our Board of Directors who elect to have all or a portion of their board retainer fees deferred through the purchase of CSEs. The purchase price for CSEs is equal to the fair market value (as defined in the 2009 Plan) of our common stock on the date of purchase. Participating board members who defer compensation into the award of CSEs specify the future date, within specified parameters, such CSEs will be converted into shares of our common stock.
Prior Stock Plans
The 1991 Stock Plan, 2000 Stock Plan, 2000 Nonqualified Stock Option Plan, Novell/SilverStream 1997 Stock Option Plan, and Novell/SilverStream 2001 Stock Option Plan were all suspended by the approval of the 2009 Plan. No new awards can be granted under these plans; however, we continue to manage outstanding awards under all of these plans. Shares granted from these plans include nonqualified stock options, incentive stock options, restricted stock units, restricted stock, and CSEs. As of October 31, 2009, a total of 28.2 million potential shares from stock awards were authorized and outstanding. Shares outstanding from these plans that are forfeited, cancelled, expire or are otherwise not converted into common shares are available for grant under the 2009 Plan. Shares
98
Table of Contents
NOVELL, INC.
NOTES TO CONSOLIDATED FINANCIAL STATEMENTS (Continued)
T. Stockholders’ Equity (Continued)
that are converted into common stock through exercise or release and then surrendered for payment of the exercise price or tax obligations are considered cancelled and are not available for grant.
Expired Plans
The Stock Option Plan for Non-Employee Directors (the “Director Plan”) expired in April 2008. As of October 31, 2009, a total of 0.8 million potential shares from stock awards remain authorized and outstanding. Options previously granted under this plan that have not yet expired or otherwise become unexercisable continue to be administered under the Director Plan, and any portions that expire or become unexercisable under this expired plan for any reason shall be cancelled and be unavailable for future issuance.
A summary of the status of our stock award plans as of October 31, 2009, 2008 and 2007 is presented below.
| Fiscal 2009 | Fiscal 2008 | Fiscal 2007 | ||||||||||||||||
| (Number of awards in thousands)
|
Number of Awards |
Weighted- Average Exercise Price |
Number of Awards |
Weighted- Average Exercise Price |
Number of Awards |
Weighted- Average Exercise Price | ||||||||||||
| Outstanding at beginning of year |
32,921 | $ | 4.84 | 39,070 | $ | 5.71 | 42,657 | $ | 6.28 | |||||||||
| Granted: |
||||||||||||||||||
| Price at fair value |
4,153 | 3.70 | 3,902 | 6.62 | 3,614 | 6.59 | ||||||||||||
| Price at less than fair value |
3,007 | 0.00 | 5,050 | 0.00 | 5,730 | 0.00 | ||||||||||||
| Exercised |
(4,548 | ) | 0.41 | (4,982 | ) | 2.29 | (5,839 | ) | 3.32 | |||||||||
| Cancelled: |
||||||||||||||||||
| Forfeited |
(2,060 | ) | 3.14 | (2,590 | ) | 3.16 | (2,266 | ) | 3.38 | |||||||||
| Expired |
(3,022 | ) | 7.42 | (7,529 | ) | 9.30 | (4,826 | ) | 8.59 | |||||||||
| Outstanding at end of year |
30,451 | $ | 4.73 | 32,921 | $ | 4.84 | 39,070 | $ | 5.71 | |||||||||
| Exercisable at end of year |
15,892 | $ | 6.70 | 16,724 | $ | 6.71 | 23,552 | $ | 7.35 | |||||||||
The following table summarizes information about stock awards outstanding at October 31, 2009:
| Awards Outstanding | Awards Exercisable | |||||||||||
| (Number of awards in thousands)
Range of Exercise Prices |
Number of Awards Outstanding |
Weighted- Average Remaining Contractual Life |
Weighted- Average Exercise Price |
Number of Awards Exercisable |
Weighted- Average Exercise Price | |||||||
| $0.00 – $3.64 |
11,567 | 3.15 | $ | 1.31 | 1,109 | $ | 2.90 | |||||
| $3.67 – $4.68 |
3,485 | 2.86 | 4.25 | 2,796 | 4.33 | |||||||
| $4.70 – $5.55 |
3,119 | 3.26 | 5.48 | 3,058 | 5.50 | |||||||
| $5.62 – $6.44 |
2,590 | 4.69 | 6.08 | 1,789 | 6.11 | |||||||
| $6.45 – $6.71 |
2,801 | 5.93 | 6.70 | 1,094 | 6.69 | |||||||
| $6.75 – $8.22 |
3,014 | 4.43 | 7.37 | 2,297 | 7.39 | |||||||
| $8.67 – $10.68 |
2,981 | 1.94 | 9.78 | 2,855 | 9.81 | |||||||
| $11.26 – $38.88 |
894 | 1.97 | 12.46 | 894 | 12.46 | |||||||
| Total |
30,451 | 3.49 | $ | 4.73 | 15,892 | $ | 6.70 | |||||
The following table summarizes general information as of October 31, 2009 and October 31, 2008:
| (Number of shares and awards in thousands) | October 31, 2009 |
October 31, 2008 |
||||
| Awards available for future grants |
45,740 | 34,641 | ||||
| Shares of common stock outstanding |
347,073 | 343,408 | ||||
| Awards granted during the year as a percentage of outstanding common stock |
2.1 | % | 2.6 | % |
The increase in the awards available for future grant at October 31, 2009 compared to October 31, 2008 was a result of the approval of the 2009 Plan.
99
Table of Contents
NOVELL, INC.
NOTES TO CONSOLIDATED FINANCIAL STATEMENTS (Continued)
T. Stockholders’ Equity (Continued)
Employee Stock Purchase Plan
Through July 2009, we had an Employee Stock Purchase Plan (the “Purchase Plan”) under which we were authorized to issue up to 34.0 million shares of our common stock to our employees who work at least 20 hours a week and more than five months a year. The maximum number of shares that could be purchased by employees during any fiscal year was 3.0 million shares. Under the terms of the Purchase Plan, there were two six-month offer periods per year, and employees could choose to have up to 10% of their eligible compensation withheld to purchase our common stock at 95% of the fair market value of our common stock on the purchase date. The Purchase Plan was considered non-compensatory under U.S. GAAP and, accordingly, no stock-based compensation expense has been recorded for issuances under the Purchase Plan. The Purchase Plan expired in July 2009 and was not renewed.
Under the Purchase Plan, we issued 0.3 million, 0.2 million, and 0.3 million shares to employees in fiscal 2009, 2008, and 2007, respectively.
Shares Reserved for Future Issuance
As of October 31, 2009, there were 76.6 million shares of common stock reserved for issuance under our stock award plans.
U. Stock-Based Compensation
Our consolidated statements of operations include the following amounts of stock-based compensation expense in the respective captions:
| Fiscal Year Ended October 31, | |||||||||
| (In thousands) | 2009 | 2008 | 2007 | ||||||
| Cost of revenue |
$ | 2,649 | $ | 3,621 | $ | 4,403 | |||
| Sales and marketing |
7,015 | 10,134 | 9,806 | ||||||
| Product development |
9,332 | 10,363 | 9,882 | ||||||
| General and administrative |
6,885 | 9,700 | 10,225 | ||||||
| Operating expenses |
23,232 | 30,197 | 29,913 | ||||||
| Total stock-based compensation expense |
$ | 25,881 | $ | 33,818 | $ | 34,316 | |||
Total unrecognized stock-based compensation expense expected to be recognized over an estimated weighted-average amortization period of 2.2 years was $48.1 million at October 31, 2009.
The benefits of tax deductions in excess of recognized compensation cost are reported as a financing cash flow. In fiscal 2009, this requirement increased our net operating cash flows and decreased our net financing cash flows by $2.8 million. In fiscal 2008 and 2007, this requirement decreased our net operating cash flows and increased our net financing cash flows by $18.5 million and $13.1 million, respectively.
Stock-based compensation expense during fiscal 2007 included $2.5 million related to the modification of certain vested stock awards that otherwise would have expired during the period when our stock awards were not exercisable due to the delay in the filing of our SEC financial reports in connection with our review of our historical stock-based compensation practices (“Suspension Period”). We modified vested stock-based compensation awards held by terminated employees whose post termination exercise period was affected by the Suspension Period, giving them 60 days to exercise their awards once the Suspension Period ended.
Stock Plans
All stock-based compensation awards are administered under one of the stock award plans discussed in Note T, “Stockholders’ Equity.” When granting stock options, we grant nonstatutory options at fair market value on the date of grant (defined as the closing price on the day prior to the grant date). We also grant restricted stock units.
100
Table of Contents
NOVELL, INC.
NOTES TO CONSOLIDATED FINANCIAL STATEMENTS (Continued)
U. Stock-Based Compensation (Continued)
Time-Based Stock Awards
Our weighted-average assumptions used in the Black-Scholes valuation model for equity awards with time-based vesting provisions granted during fiscal 2009, 2008, and 2007 are shown below:
| Fiscal Year Ended October 31, | ||||||
| 2009 | 2008 | 2007 | ||||
| Expected volatility |
55% | 37% | 44% | |||
| Expected dividends |
0% | 0% | 0% | |||
| Expected term |
4.7 years | 4 years | 4 years | |||
| Risk-free interest rate |
0.9 – 3.0% | 2.9 – 4.7% | 3.7 – 4.8% | |||
The expected volatility rate was estimated based on equal weighting of the historical volatility of our common stock over a period coinciding with the expected term and the implied volatilities of our common stock. The expected term was estimated based on our historical experience of exercise, cancellation, and expiration patterns. The risk-free interest rates are based on U.S. Treasury STRIPS with maturities that approximate the expected term.
The estimated pre-vesting forfeiture rate used for fiscal 2009, 2008 and 2007 was 10%, which was based on historical rates and forward-looking factors. We adjust the estimated forfeiture rate to our actual experience upon vest or as additional information about future forfeitures becomes available.
A summary of the time-based stock awards, which include stock options and restricted stock units, as of October 31, 2009, and changes during the fiscal year then ended, is as follows:
| Shares | Weighted- Average Exercise Price |
Weighted- Average Remaining Contractual Term |
Aggregate Intrinsic Value | ||||||||
| (In thousands) | (Years) | (In thousands) | |||||||||
| Stock Awards |
|||||||||||
| Outstanding at November 1, 2008 |
28,801 | $ | 4.81 | ||||||||
| Granted: |
|||||||||||
| Price equal to fair market value |
2,220 | 3.75 | |||||||||
| Price less than fair market value |
2,156 | — | |||||||||
| Exercised or released |
(3,707 | ) | 0.50 | ||||||||
| Forfeited or expired |
(4,314 | ) | 5.56 | ||||||||
| Outstanding at October 31, 2009 |
25,156 | 4.81 | 3.13 | $ | 29,199 | ||||||
| Exercisable at October 31, 2009 |
15,141 | $ | 6.69 | 2.91 | $ | 1,996 | |||||
The weighted-average grant-date fair value of time-based stock awards granted during fiscal 2009 was $2.67. The total intrinsic value of awards exercised or released during fiscal 2009 was $12.9 million. As of October 31, 2009, there was $45.5 million of unrecognized stock-based compensation cost related to time-based stock awards. That cost is expected to be recognized over a weighted-average period of 2.4 years.
Performance-Based and Market-Condition Awards
We have issued performance-based equity awards to certain senior executives. These awards have the potential to vest over one to four years upon the achievement of certain specific financial performance goals, specifically related to the achievement of budgeted revenue and operating income targets in each fiscal year. The performance-based options were granted at an exercise price equal to the fair market value of our common stock on the date the option was granted and have a contractual life of up to eight years.
In the past, we have issued market-condition equity awards to certain senior executives the vesting of which is accelerated or contingent upon the price of our common stock meeting certain pre-established stock price targets. After various forfeitures, currently there are only two grants to one executive, totaling 62,000 options, that could still vest. These awards vest on the sixth anniversary of the grant date, December 2009. The market-condition options were granted at an exercise price equal to the fair market value on the grant date, defined as the closing price of our stock on the day prior to grant and have a contractual life of eight years. No market-condition awards were granted during fiscal 2009.
101
Table of Contents
NOVELL, INC.
NOTES TO CONSOLIDATED FINANCIAL STATEMENTS (Continued)
U. Stock-Based Compensation (Continued)
The fair value of each performance-based option was estimated using the closing price of our stock on the day prior to grant utilizing the Black-Scholes option valuation model without consideration of the performance measures or market conditions. The inputs for expected volatility, expected term, expected dividends, and risk-free interest rate used in estimating the fair value of performance-based awards in fiscal 2009 are the same as those noted above under time-based stock awards.
A summary of the performance-based and market-condition options and restricted stock units as of October 31, 2009, and changes during the fiscal year then ended, is as follows:
| Shares | Weighted- Average Exercise Price |
Weighted- Average Remaining Contractual Term |
Aggregate Intrinsic Value | ||||||||
| (In thousands) | (Years) | (In thousands) | |||||||||
| Stock Awards |
|||||||||||
| Outstanding at November 1, 2008 |
2,724 | $ | 4.53 | ||||||||
| Fair value determined during year |
593 | 5.12 | |||||||||
| Granted: |
|||||||||||
| Price equal to fair market value |
967 | 3.65 | |||||||||
| Price less than fair market value |
630 | — | |||||||||
| Exercised or released |
(841 | ) | — | ||||||||
| Forfeited or expired |
(680 | ) | 6.64 | ||||||||
| Outstanding at October 31, 2009 |
3,393 | 4.24 | 4.8 | $ | 4,200 | ||||||
| Exercisable at October 31, 2009 |
751 | $ | 6.85 | 4.7 | $ | — | |||||
The weighted-average grant-date fair value of awards granted during fiscal 2009 was $2.18. The total intrinsic value of stock awards exercised or released during fiscal 2009 was $2.9 million. As of October 31, 2009, there was $2.6 million of unrecognized compensation cost related to performance-based and market-condition awards. That cost is expected to be recognized ratably over a one to two year period.
As of October 31, 2009, there were 1.9 million performance stock awards that have been granted and remain outstanding but have not yet been valued because all of the conditions necessary to establish the grant date for U.S. GAAP purposes have not yet occurred. The grant date of these stock awards will not occur until budgets are approved by our Board of Directors for the respective years specified in the performance targets.
V. Employee Savings and Retirement Plans
We adopted a 401(k) savings and retirement plan in December 1986. The plan covers all of our U.S. employees who are 21 years of age or older who are scheduled to complete 1,000 hours of service during any consecutive 12-month period. Our 401(k) savings and retirement plan allows us to contribute an amount equal to 100% of each employee’s contribution up to the higher of 4% of the employee’s compensation or the maximum contribution allowed by tax laws. We made matching contributions on our 401(k) savings and retirement plan and other retirement plans of $15.7 million, $15.3 million, and $20.5 million, in fiscal 2009, 2008, and 2007, respectively.
In fiscal 2007, we adopted new accounting guidance related to employers’ accounting for defined benefit pensions and other post retirement plans. This guidance required us to recognize, in our balance sheet, the under-funded status of our defined benefit pension plans sponsored by our subsidiaries. This was measured as the present value of the benefit obligation since the assets we have designated to fund the pension obligation do not qualify as plan assets in accordance with the updated guidance. The recognition of the transition obligation of $0.7 million and the actuarial gain of $2.1 million was offset with an adjustment to accumulated other comprehensive income (loss) in stockholders’ equity. The updated guidance did not change how post-retirement benefits are accounted for and reported in the statements of operations.
The defined benefit pension plan sponsored by one of our German subsidiaries covers 77 current employees and 217 former employees or retirees as of October 31, 2009. The plan was closed to new members as of November 2004. Actuarial gains or losses
102
Table of Contents
NOVELL, INC.
NOTES TO CONSOLIDATED FINANCIAL STATEMENTS (Continued)
V. Employee Savings and Retirement Plans (Continued)
are being amortized over an 18.6 year period, and the amortization charges are included within the overall net periodic pension costs, which are charged to the statements of operations.
Other plan information is as follows:
| (In thousands) | Fiscal 2009 | Fiscal 2008 | Fiscal 2007 | |||||||||
| Change in benefit obligation |
||||||||||||
| Benefit obligation at beginning of fiscal year |
$ | 10,534 | $ | 13,204 | $ | 12,001 | ||||||
| Service cost |
464 | 610 | 814 | |||||||||
| Interest cost |
699 | 692 | 646 | |||||||||
| Actuarial gain |
(180 | ) | (2,617 | ) | (2,801 | ) | ||||||
| Benefits paid |
(39 | ) | (29 | ) | (17 | ) | ||||||
| Foreign exchange |
1,625 | (1,326 | ) | 2,561 | ||||||||
| Benefit obligation at end of fiscal year |
$ | 13,103 | $ | 10,534 | $ | 13,204 | ||||||
| Accrued benefit cost |
$ | (13,103 | ) | $ | (10,534 | ) | $ | (13,204 | ) | |||
| Components of accumulated other comprehensive income (loss) |
||||||||||||
| Pension transition obligation |
$ | (531 | ) | $ | (540 | ) | $ | (691 | ) | |||
| Pension actuarial gain |
4,929 | 4,183 | 2,100 | |||||||||
| Total recognized in accumulated other comprehensive income (loss) |
$ | 4,398 | $ | 3,643 | $ | 1,409 | ||||||
| Fiscal Year Ended October 31, | ||||||||
| (Dollars in thousands) | 2009 | 2008 | ||||||
| Weighted-average assumptions |
||||||||
| Discount rate |
6.0 | % | 6.3 | % | ||||
| Rate of salary increase |
3.0 | % | 3.0 | % | ||||
| Post-retirement pension increases |
2.0 | % | 2.0 | % | ||||
| Net periodic pension cost |
$ | 1,146 | $ | 1,012 | ||||
The amount of accumulated other comprehensive income that is expected to be amortized in fiscal 2010 is approximately $195 thousand. Estimated benefit payments for fiscal 2010, 2011, 2012, 2013, 2014 and thereafter are $42 thousand, $47 thousand, $52 thousand, $106 thousand, $141 thousand, and $998 thousand, respectively. At October 31, 2009, we had assets valued at $16.2 million designated to fund the German pension obligation, which do not qualify as plan assets.
We also have other retirement plans in certain foreign countries in which we employ personnel. Each plan is consistent with local laws and business practices.
W. Loss Per Share From Continuing Operations
The following table reconciles the numerators and denominators of the loss per share calculation for fiscal 2009, 2008, and 2007:
| Fiscal Year Ended October 31, | ||||||||||||
| (In thousands, except per share data) | 2009 | 2008 | 2007 | |||||||||
| Basic and diluted loss from continuing operations per share computation: |
||||||||||||
| Loss from continuing operations |
$ | (214,640 | ) | $ | (12,339 | ) | $ | (26,276 | ) | |||
| Weighted-average common shares outstanding, excluding unvested restricted stock |
345,493 | 350,207 | 347,552 | |||||||||
| Basic and diluted loss from continuing operations per share |
$ | (0.62 | ) | $ | (0.04 | ) | $ | (0.08 | ) | |||
Incremental shares of 2.3 million, 1.5 million and 2.3 million attributable to the assumed exercise of outstanding awards with exercise prices that were below the average market price (“in-the-money”) were not included in the calculation of diluted loss per share for
103
Table of Contents
NOVELL, INC.
NOTES TO CONSOLIDATED FINANCIAL STATEMENTS (Continued)
W. Loss Per Share From Continuing Operations (Continued)
fiscal 2009, 2008 and 2007, respectively, as their effect would have been anti-dilutive due to the loss in those periods. Incremental shares attributable to options with exercise prices that were at or greater than the average market price (“out-of-the-money”) at October 31, 2009, 2008, and 2007 were also excluded from the calculation of diluted earnings per share as their effect would have been anti-dilutive. At October 31, 2009, 2008, and 2007, there were 22.0 million, 16.1 million, and 19.2 million out-of-the-money options, respectively.
X. Comprehensive Income (Loss)
Our accumulated other comprehensive income (loss) is comprised of the following:
| Fiscal Year Ended October 31, | ||||||||
| (In thousands) | 2009 | 2008 | ||||||
| Net unrealized gain (loss) on investments |
$ | 11,018 | $ | (2,784 | ) | |||
| Pension actuarial gain |
4,929 | 4,183 | ||||||
| Pension transition obligation |
(531 | ) | (540 | ) | ||||
| Cumulative translation adjustment |
5,566 | (17,988 | ) | |||||
| Total accumulated other comprehensive income (loss) |
$ | 20,982 | $ | (17,129 | ) | |||
Changes to accumulated other comprehensive income (loss) are as follows:
| Fiscal Year Ended October 31, | |||||||||||
| (In thousands) | 2009 | 2008 | 2007 | ||||||||
| Total change in gross unrealized gain (loss) on investments during the year |
$ | 15,601 | $ | (9,631 | ) | $ | 2,961 | ||||
| Adjustment for net realized (losses) gains on investments included in net loss |
(1,799 | ) | 6,029 | 1,424 | |||||||
| Net unrealized gain (loss) on investments |
13,802 | (3,602 | ) | 4,385 | |||||||
| Pension adjustment |
755 | 2,234 | 1,409 | ||||||||
| Cumulative translation adjustments |
23,554 | (52,859 | ) | 17,224 | |||||||
| Other comprehensive income (loss) |
$ | 38,111 | $ | (54,227 | ) | $ | 23,018 | ||||
The components of accumulated other comprehensive income (loss) were not tax affected due to the fact that the related deferred tax assets were fully reserved at October 31, 2009, 2008, and 2007, respectively.
Y. Segment Information
We operate and report our financial results in four business unit segments, which are as follows:
| • | Open Platform Solutions |
| • | Identity and Security Management |
| • | Systems and Resource Management |
| • | Workgroup |
Our performance is evaluated by our Chief Executive Officer and our other chief decision makers based on reviewing revenue and operating income (loss) information for each segment. The business unit segments sell both our software and services. These offerings are sold directly to end-users and through OEMs, resellers, and distributors who sell to end-users.
104
Table of Contents
NOVELL, INC.
NOTES TO CONSOLIDATED FINANCIAL STATEMENTS (Continued)
Y. Segment Information (Continued)
Operating results by segment are as follows:
| Fiscal 2009 | |||||||||||
| (In thousands) | Net Revenue | Gross Profit | Operating Income (Loss) |
||||||||
| Open Platform Solutions |
$ | 174,330 | $ | 141,389 | $ | 87,355 | |||||
| Identity and Security Management |
156,291 | 106,458 | 68,854 | ||||||||
| Systems and Resource Management (a) |
182,215 | 145,614 | (178,187 | ) | |||||||
| Workgroup |
349,349 | 294,526 | 258,779 | ||||||||
| Common unallocated operating costs |
— | (12,633 | ) | (443,293 | ) | ||||||
| Total per statements of operations |
$ | 862,185 | $ | 675,354 | $ | (206,492 | ) | ||||
| Fiscal 2008 | |||||||||||
| (In thousands) | Net Revenue | Gross Profit | Operating Income (Loss) |
||||||||
| Open Platform Solutions |
$ | 154,857 | $ | 113,171 | $ | 55,258 | |||||
| Identity and Security Management |
193,990 | 114,364 | 69,805 | ||||||||
| Systems and Resource Management |
193,221 | 160,351 | 119,794 | ||||||||
| Workgroup |
414,445 | 346,226 | 308,071 | ||||||||
| Common unallocated operating costs |
— | (12,838 | ) | (548,152 | ) | ||||||
| Total per statements of operations |
$ | 956,513 | $ | 721,274 | $ | 4,776 | |||||
| Fiscal 2007 | |||||||||||
| (In thousands) | Net Revenue | Gross Profit | Operating Income (Loss) |
||||||||
| Open Platform Solutions |
$ | 119,860 | $ | 81,206 | $ | 29,944 | |||||
| Identity and Security Management |
204,680 | 105,407 | 46,459 | ||||||||
| Systems and Resource Management |
175,616 | 143,097 | 109,723 | ||||||||
| Workgroup |
432,343 | 353,980 | 306,253 | ||||||||
| Common unallocated operating costs |
— | (9,510 | ) | (548,147 | ) | ||||||
| Total per statements of operations |
$ | 932,499 | $ | 674,180 | $ | (55,768 | ) | ||||
(a) Includes goodwill impairment of $270.0 million and intangible asset impairments of $9.1 million.
Common unallocated operating costs include corporate services common to all segments such as sales and marketing, general and administrative costs, stock-based compensation expense, acquisition-related intangible asset amortization, acquisition-related integration expenses, restructuring expenses, certain impairments, purchased in-process research and development, and certain litigation settlement income or expenses. Our chief decision makers monitor all common unallocated operating costs closely but not in the context of our business unit segment reporting.
See Note AA, “Subsequent Events” for information regarding future changes to our business unit segments.
105
Table of Contents
NOVELL, INC.
NOTES TO CONSOLIDATED FINANCIAL STATEMENTS (Continued)
Y. Segment Information (Continued)
Geographic Information
Our revenue is generated from all parts of the world. In fiscal 2009, revenue in Germany accounted for 10% of our net revenue. No other country outside of the U.S. accounted for 10% or more of our net revenue in any period. For purposes of the table below we have grouped our revenue as follows:
| • | U.S. |
| • | Rest of Americas – includes Canada and South America |
| • | EMEA – includes Eastern and Western Europe, Middle East, and Africa |
| • | Asia Pacific – includes China, Southeast Asia, Australia, New Zealand, Japan and India |
| Fiscal Year Ended October 31, | |||||||||
| (In thousands) | 2009 | 2008 | 2007 | ||||||
| Net revenue: |
|||||||||
| U.S. |
$ | 424,606 | $ | 461,400 | $ | 467,132 | |||
| Rest of Americas |
55,011 | 70,534 | 73,001 | ||||||
| EMEA |
300,883 | 343,255 | 312,798 | ||||||
| Asia Pacific |
81,685 | 81,324 | 79,568 | ||||||
| Total net revenue |
$ | 862,185 | $ | 956,513 | $ | 932,499 | |||
| Long-lived assets at fiscal year end (1): |
|||||||||
| U.S. |
$ | 124,346 | $ | 121,459 | $ | 122,945 | |||
| Rest of Americas |
9,901 | 10,811 | 2,918 | ||||||
| EMEA |
33,300 | 37,431 | 47,758 | ||||||
| Asia Pacific |
2,912 | 5,277 | 6,916 | ||||||
| Total long-lived assets at fiscal year end |
$ | 170,459 | $ | 174,978 | $ | 180,537 | |||
| Reconciliation of long-lived assets to total assets is as follows: | |||||||||
| (In thousands) | October 31, 2009 |
October 31, 2008 | |||||||
| Long-lived assets (1) |
$ | 170,459 | $ | 174,978 | |||||
| Goodwill and intangible assets, net |
392,654 | 635,437 | |||||||
| Other long-term assets |
59,216 | 73,242 | |||||||
| Current assets |
1,280,579 | 1,385,692 | |||||||
| Total assets |
$ | 1,902,908 | $ | 2,269,349 | |||||
(1) Long-lived assets in this context is defined in the segment reporting accounting guidance as tangible long-lived assets and for us are comprised entirely of our property, plant and equipment, net.
In fiscal 2009, 2008, and 2007, sales to international customers were $437.6 million, $495.1 million, and $465.4 million, respectively. In fiscal 2009, 2008, and 2007, revenue in EMEA accounted for 69%, 69%, and 67%, of our total international revenue, respectively. There were no customers who accounted for more than 10% of revenue in any period.
Z. Redeemable Preferred Stock
On March 23, 2004, we entered into a definitive agreement with IBM in connection with IBM’s previously announced $50.0 million investment in us. The primary terms of the investment were negotiated in November 2003 and involved the purchase by IBM of 1,000 shares of our Series B redeemable preferred stock (“Series B Preferred Stock”) that are convertible into 8 million shares of our common stock at a conversion price of $6.25 per common share. The Series B Preferred Stock was entitled to a dividend of 2% per annum, payable quarterly in cash. Dividends on the Series B Preferred Stock during fiscal 2006 amounted to $0.2 million.
On November 10, 2006, IBM converted the remaining 187 outstanding shares of our Series B Preferred Stock into 1.5 million shares of our common stock.
106
Table of Contents
NOVELL, INC.
NOTES TO CONSOLIDATED FINANCIAL STATEMENTS (Continued)
AA. Subsequent Event
We have evaluated through December 22, 2009, which is the date these financial statements were filed with the SEC, and other than the subsequent event discussed below, determined that there were no subsequent events that need to be disclosed.
On December 14, 2009, we announced a reorganization of our structure and management to better align our business with our strategic objective of becoming an industry leader in the emerging Intelligent Workload Management (“IWM”) market, while continuing to develop collaboration solutions. These changes are designed to simplify the organization and provide a clear focus on markets that leverage our strengths to capture future opportunities for growth.
Effective January 1, 2010, we will consolidate our business unit segments from four to two. Our current Identity and Security Management, Systems and Resource Management and Open Platform Solutions business unit segments will be integrated to create the new Security, Management and Operating Platforms business unit segment. Our current Workgroup business unit segment will be renamed Collaboration Solutions.
As of the filing of this Annual Report on Form 10-K, we have not yet finalized our reporting units for financial statement reporting purposes as a result of these organizational changes. In accordance with segment reporting accounting guidance, we are required to perform a goodwill impairment review when our operating segments change. We presently do not expect to incur any goodwill impairment charges as a result of this reorganization in the first quarter of fiscal 2010.
107
Table of Contents
REPORT OF INDEPENDENT REGISTERED PUBLIC ACCOUNTING FIRM
To the Board of Directors and Stockholders of Novell, Inc.:
In our opinion, the consolidated financial statements listed in the index appearing under Item 15 (a)(1) present fairly, in all material respects, the financial position of Novell, Inc. and its subsidiaries at October 31, 2009 and 2008, and the results of their operations and their cash flows for each of the three years in the period ended October 31, 2009 in conformity with accounting principles generally accepted in the United States of America. In addition, in our opinion, the financial statement schedule listed in the index appearing under Item 15(a)(2) presents fairly, in all material respects, the information set forth therein when read in conjunction with the related consolidated financial statements. Also in our opinion, the Company maintained, in all material respects, effective internal control over financial reporting as of October 31, 2009, based on criteria established in Internal Control — Integrated Framework issued by the Committee of Sponsoring Organizations of the Treadway Commission (COSO). The Company’s management is responsible for these financial statements and financial statement schedule, for maintaining effective internal control over financial reporting and for its assessment of the effectiveness of internal control over financial reporting, included in Management’s Annual Report on Internal Control over Financial Reporting appearing under Item 9A. Our responsibility is to express opinions on these financial statements, the financial statement schedule and on the Company’s internal control over financial reporting based on our integrated audits. We conducted our audits in accordance with the standards of the Public Company Accounting Oversight Board (United States). Those standards require that we plan and perform the audits to obtain reasonable assurance about whether the financial statements are free of material misstatement and whether effective internal control over financial reporting was maintained in all material respects. Our audits of the financial statements included examining, on a test basis, evidence supporting the amounts and disclosures in the financial statements, assessing the accounting principles used and significant estimates made by management, and evaluating the overall financial statement presentation. Our audit of internal control over financial reporting included obtaining an understanding of internal control over financial reporting, assessing the risk that a material weakness exists, and testing and evaluating the design and operating effectiveness of internal control based on the assessed risk. Our audits also included performing such other procedures as we considered necessary in the circumstances. We believe that our audits provide a reasonable basis for our opinions.
As discussed in Note L to the consolidated financial statements, the Company changed the manner in which it accounts for unrecognized tax benefits in fiscal 2008.
A company’s internal control over financial reporting is a process designed to provide reasonable assurance regarding the reliability of financial reporting and the preparation of financial statements for external purposes in accordance with generally accepted accounting principles. A company’s internal control over financial reporting includes those policies and procedures that (i) pertain to the maintenance of records that, in reasonable detail, accurately and fairly reflect the transactions and dispositions of the assets of the company; (ii) provide reasonable assurance that transactions are recorded as necessary to permit preparation of financial statements in accordance with generally accepted accounting principles, and that receipts and expenditures of the company are being made only in accordance with authorizations of management and directors of the company; and (iii) provide reasonable assurance regarding prevention or timely detection of unauthorized acquisition, use, or disposition of the company’s assets that could have a material effect on the financial statements.
Because of its inherent limitations, internal control over financial reporting may not prevent or detect misstatements. Also, projections of any evaluation of effectiveness to future periods are subject to the risk that controls may become inadequate because of changes in conditions, or that the degree of compliance with the policies or procedures may deteriorate.
| /s/ PRICEWATERHOUSECOOPERS LLP |
Boston, Massachusetts
December 22, 2009
108
Table of Contents
SELECTED CONSOLIDATED QUARTERLY FINANCIAL DATA
Unaudited
| (In thousands, except per share data) | First Quarter |
Second Quarter |
Third Quarter |
Fourth Quarter |
Fiscal Year | |||||||||||||
| Fiscal Year Ended October 31, 2009 |
||||||||||||||||||
| Net revenue |
$ | 214,871 | $ | 215,595 | $ | 216,084 | $ | 215,635 | $ | 862,185 | ||||||||
| Gross profit |
167,974 | 170,313 | 169,101 | 167,966 | 675,354 | |||||||||||||
| Income (loss) from continuing operations before taxes |
16,008 | 17,828 | 20,508 | (258,318 | ) | (203,974 | ) | |||||||||||
| Income (loss) from continuing operations |
9,641 | 15,051 | 16,357 | (255,689 | ) | (214,640 | ) | |||||||||||
| Net income (loss) |
10,677 | 15,617 | 16,659 | (255,689 | ) | (212,736 | ) | |||||||||||
| Income (loss) from continuing operations per share, basic |
$ | 0.03 | $ | 0.04 | $ | 0.05 | $ | (0.74 | ) | $ | (0.62 | ) | ||||||
| Income (loss) from continuing operations per share, diluted |
$ | 0.03 | $ | 0.04 | $ | 0.05 | $ | (0.74 | ) | $ | (0.62 | ) | ||||||
| Net income (loss) per share, basic |
$ | 0.03 | $ | 0.05 | $ | 0.05 | $ | (0.74 | ) | $ | (0.62 | ) | ||||||
| Net income (loss) per share, diluted |
$ | 0.03 | $ | 0.05 | $ | 0.05 | $ | (0.74 | ) | $ | (0.62 | ) | ||||||
| Fiscal Year Ended October 31, 2008 |
||||||||||||||||||
| Net revenue |
$ | 230,926 | $ | 235,666 | $ | 245,185 | $ | 244,736 | $ | 956,513 | ||||||||
| Gross profit |
172,985 | 175,199 | 185,597 | 187,493 | 721,274 | |||||||||||||
| Income (loss) from continuing operations before taxes |
25,637 | 19,519 | (7,805 | ) | (14,473 | ) | 22,878 | |||||||||||
| Income (loss) from continuing operations |
14,684 | 5,866 | (15,125 | ) | (17,764 | ) | (12,339 | ) | ||||||||||
| Net income (loss) |
16,805 | 5,866 | (15,125 | ) | (16,291 | ) | (8,745 | ) | ||||||||||
| Income (loss) from continuing operations per share, basic |
$ | 0.04 | $ | 0.02 | $ | (0.04 | ) | $ | (0.05 | ) | $ | (0.04 | ) | |||||
| Income (loss) from continuing operations per share, diluted |
$ | 0.04 | $ | 0.02 | $ | (0.04 | ) | $ | (0.05 | ) | $ | (0.04 | ) | |||||
| Net income (loss) per share, basic |
$ | 0.05 | $ | 0.02 | $ | (0.04 | ) | $ | (0.05 | ) | $ | (0.02 | ) | |||||
| Net income (loss) per share, diluted |
$ | 0.05 | $ | 0.02 | $ | (0.04 | ) | $ | (0.05 | ) | $ | (0.02 | ) | |||||
Item 9. Changes in and Disagreements with Accountants on Accounting and Financial Disclosure
None
Item 9A. Controls and Procedures
Effectiveness of Disclosure Controls and Procedures.
Our management, with the participation of our Chief Executive Officer and Chief Financial Officer, evaluated the effectiveness of our disclosure controls and procedures as of the end of the period covered by this report. Based on that evaluation, our Chief Executive Officer and Chief Financial Officer concluded that our disclosure controls and procedures as of the end of the period covered by this report (i) were appropriately designed to provide reasonable assurance of achieving their objectives and (ii) were effective and provided reasonable assurance that the information required to be disclosed by us in reports filed under the Securities Exchange Act of 1934, as amended (“Exchange Act”) is (a) recorded, processed, summarized and reported within the time periods specified in the SEC’s rules and forms and (b) accumulated and communicated to our management, including our Chief Executive Officer and Chief Financial Officer, as appropriate to allow timely decisions regarding required disclosure.
109
Table of Contents
NOVELL, INC.
PART II
Item 9A. Controls and Procedures (Continued)
Management’s Annual Report on Internal Control over Financial Reporting.
Our management is responsible for establishing and maintaining adequate internal control over financial reporting. Internal control over financial reporting is defined in Rules 13a-15(f) and 15d-15(f) of the Exchange Act as a process designed by, or under the supervision of, our Chief Executive Officer and Chief Financial Officer and effected by our Board of Directors, management and other personnel, to provide reasonable assurance regarding the reliability of financial reporting and the preparation of financial statements for external purposes in accordance with generally accepted accounting principles and includes those policies and procedures that:
| • | pertain to the maintenance of records that in reasonable detail accurately and fairly reflect transactions and dispositions of our assets; |
| • | provide reasonable assurance that transactions are recorded as necessary to permit preparation of financial statements in accordance with generally accepted accounting principles, and that our receipts and expenditures are being made only in accordance with authorizations of our management and directors; and |
| • | provide reasonable assurance regarding prevention or timely detection of unauthorized acquisition, use or disposition of our assets that could have a material effect on the financial statements. |
Because of its inherent limitations, internal control over financial reporting may not prevent or detect misstatements. Projections of any evaluation of effectiveness to future periods are subject to the risk that controls may become inadequate because of changes in conditions, or that the degree of compliance with the policies or procedures may deteriorate.
Our management assessed the effectiveness of our internal control over financial reporting as of October 31, 2009 using the criteria set forth by the Committee of Sponsoring Organizations of the Treadway Commission (COSO) in Internal Control-Integrated Framework. Based on this assessment using those criteria, our management concluded that, as of October 31, 2009, our internal control over financial reporting was effective. The effectiveness of our internal control over financial reporting as of October 31, 2009 has been audited by PricewaterhouseCoopers LLP, our independent registered public accounting firm, as stated in their report, which appears under Item 8.
Changes in Internal Control Over Financial Reporting.
No change in our internal control over financial reporting occurred during our fourth quarter of fiscal 2009 that has materially affected, or is reasonably likely to materially affect, our internal control over financial reporting.
None
110
Table of Contents
NOVELL, INC.
Item 10. Directors, Executive Officers and Corporate Governance
Information about our Directors is incorporated by reference to the information contained in the section of our 2010 Proxy Statement captioned “Election of Directors.” Information about compliance with Section 16(a) of the Exchange Act is incorporated by reference to the information contained in the section of our 2010 Proxy Statement captioned “Section 16(a) Beneficial Ownership Reporting Compliance.”
Information about our Code of Business Ethics governing our employees, including our Chief Executive Officer and our Chief Financial Officer and Principal Accounting Officer, and the Non-Employee Director Code of Ethics governing our Directors, is incorporated by reference to the information contained in the section of our 2010 Proxy Statement captioned “Corporate Governance — Codes of Ethics.” Our Code of Business Ethics meets the definition of “code of ethics” under the rules and regulations of the SEC and is posted on our website at http://www.novell.com/company/ir/cg through the Corporate Governance page.
Information regarding material changes to the procedures by which our stockholders may recommend nominees to our Board of Directors is incorporated by reference to the information contained in the section of our 2010 Proxy Statement captioned “Corporate Governance — Director Nominations.”
Information about our Audit Committee, including the members of the Audit Committee and our Audit Committee financial experts, is incorporated by reference to the information contained in the section of our 2010 Proxy Statement captioned “Corporate Governance — Board Committees.” The balance of the information required by this item is contained in the discussion entitled Executive Officers of the Registrant in Part I of this Form 10-K.
Item 11. Executive Compensation
The information required by Item 11 of Form 10-K is incorporated by reference to the information contained in the section of our 2010 Proxy Statement captioned “Executive Compensation.”
Item 12. Security Ownership of Certain Beneficial Owners and Management and Related Stockholder Matters
The information required by Item 12 of Form 10-K is incorporated by reference to the information contained in the sections of our 2010 Proxy Statement captioned “Share Ownership by Principal Stockholders, Directors and Management” and “Equity Compensation Plan Information.”
Item 13. Certain Relationships and Related Transactions and Director Independence
The information required by Item 13 of Form 10-K is incorporated by reference to the information contained in the sections of our 2010 Proxy Statement captioned “Corporate Governance – Related Person Transactions Policy and Procedures,” “Corporate Governance – Transaction with Related Person,” and “Corporate Governance – Board of Directors and Director Independence.”
Item 14. Principal Accountant Fees and Services
The information required by Item 14 of Form 10-K is incorporated by reference to the information contained in the section of our 2010 Proxy Statement captioned “Information About Our Independent Registered Public Accounting Firm.”
111
Table of Contents
NOVELL, INC.
Item 15. Exhibits, Financial Statement Schedules
(a) (1.) Financial Statements:
The following documents are filed as a part of this Annual Report on Form 10-K for Novell, Inc.:
Consolidated Statements of Operations for the fiscal years ended October 31, 2009, October 31, 2008 and October 31, 2007.
Consolidated Balance Sheets at October 31, 2009 and October 31, 2008.
Consolidated Statements of Stockholders’ Equity for the fiscal years ended October 31, 2009, October 31, 2008 and October 31, 2007.
Consolidated Statements of Cash Flows for the fiscal years ended October 31, 2009, October 31, 2008 and October 31, 2007.
Notes to Consolidated Financial Statements.
Report of PricewaterhouseCoopers LLP, Independent Registered Public Accounting Firm.
(2.) Financial Statement Schedules:
The following consolidated financial statement schedule is included on page 115 of this Form 10-K:
Schedule II — Valuation and Qualifying Accounts
Schedules other than that listed above are omitted because they are not required, not applicable or because the required information is shown in the consolidated financial statements or notes thereto.
(3.) Exhibits:
A list of the exhibits required to be filed as part of this report is set forth in the Exhibit Index on page 116 of this Form 10-K, which immediately precedes such exhibits, and is incorporated herein by reference.
(b) Exhibits
See Item 15(a)(3).
(c) Financial Statement Schedules
See Item 15(a)(2).
112
Table of Contents
NOVELL, INC.
SIGNATURES
Pursuant to the requirements of Section 13 or 15(d) of the Securities Exchange Act of 1934, the Registrant has duly caused this report to be signed on its behalf by the undersigned, thereunto duly authorized.
| Novell, Inc. |
||||
| (Registrant) |
||||
| By: |
/s/ RONALD W. HOVSEPIAN |
|||
| Ronald W. Hovsepian, | ||||
| President and Chief Executive Officer | ||||
Date: December 22, 2009
113
Table of Contents
NOVELL, INC.
SIGNATURES
Pursuant to the requirements of the Securities Exchange Act of 1934, this report has been signed below by the following persons on behalf of the Registrant and in the capacities and on the dates indicated.
| Name |
Title |
Date | ||
| /s/ RONALD W. HOVSEPIAN Ronald W. Hovsepian |
President and Chief Executive Officer (Principal Executive Officer) |
December 22, 2009 | ||
| /s/ DANA C. RUSSELL Dana C. Russell |
Senior Vice President and Chief Financial Officer (Principal Financial and Accounting Officer) |
December 22, 2009 | ||
| /s/ ALBERT AIELLO Albert Aiello |
Director | December 22, 2009 | ||
| /s/ FRED CORRADO Fred Corrado |
Director | December 22, 2009 | ||
| /s/ RICHARD L. CRANDALL Richard L. Crandall |
Director | December 22, 2009 | ||
| /s/ GARY G. GREENFIELD Gary G. Greenfield |
Director | December 22, 2009 | ||
| /s/ JUDITH HAMILTON Judith Hamilton |
Director | December 22, 2009 | ||
| /s/ PATRICK S. JONES Patrick S. Jones |
Director | December 22, 2009 | ||
| /s/ CLAUDINE B. MALONE Claudine B. Malone |
Director | December 22, 2009 | ||
| /s/ RICHARD L. NOLAN Richard L. Nolan |
Director | December 22, 2009 | ||
| /s/ THOMAS G. PLASKETT Thomas G. Plaskett |
Director | December 22, 2009 | ||
| /s/ JOHN W. PODUSKA, SR. John W. Poduska, Sr. |
Director | December 22, 2009 | ||
| /s/ KATHY BRITTAIN WHITE Kathy Brittain White |
Director | December 22, 2009 | ||
114
Table of Contents
NOVELL, INC.
SCHEDULE II — VALUATION AND QUALIFYING ACCOUNTS
Accounts Receivable Allowance
| (In thousands) | Balance at Beginning of Period |
Additions Charged to Return Allowances |
Additions Charged to Bad Debt Allowances |
Additions from Acquisition |
Deductions from Return Allowances |
Deductions from Bad Debt Allowances |
Balance at End of Period | ||||||||||||||
| Fiscal year ended |
|||||||||||||||||||||
| October 31, 2007 |
$ | 5,574 | $ | 1,385 | $ | 79 | $ | 45 | $ | 2,723 | $ | 463 | $ | 3,897 | |||||||
| October 31, 2008 |
3,897 | 1,920 | 266 | 43 | 1,760 | 687 | 3,679 | ||||||||||||||
| October 31, 2009 |
3,679 | 1,783 | 593 | — | 1,948 | 22 | 4,085 | ||||||||||||||
115
Table of Contents
NOVELL, INC.
EXHIBIT INDEX
| Exhibit Number |
Description | |
| 3.1 |
Certificate of Incorporation. (1) (Exhibit 3.1) and (2) (Exhibit 3.1) | |
| 3.2 |
By-Laws. (4) (Exhibit 3.2) | |
| 4.1 |
Form of certificate representing the shares of Novell common stock. (5) (Exhibit 4.3) | |
| 4.2 |
Indenture dated as of July 2, 2004 between the Registrant and Wells Fargo Bank, National Association, as Trustee. (6) (Exhibit 4.1) | |
| 4.3 |
First Supplemental Indenture dated as of November 9, 2006 between the Registrant and Wells Fargo Bank, National Association, as Trustee. (7) (Exhibit 99.2) | |
| 10.1 |
Registration Rights Agreement dated July 2, 2004 between the Registrant and Citigroup Global Markets Inc., for itself and on behalf of certain purchasers. (6) (Exhibit 10.1) | |
| 10.2* |
Novell, Inc. 1989 Employee Stock Purchase Plan (As Amended April 17, 2001). (8) (Exhibit 4.1) | |
| 10.3* |
Novell, Inc. 1991 Stock Plan (As Amended April 12, 1995). (9) (Exhibit 4.1) | |
| 10.4* |
Novell, Inc. 2000 Stock Plan (As Amended April 3, 2003 and May 13, 2008). (23) (Exhibit 10.1) | |
| 10.5* |
Novell, Inc. Nonstatutory 2000 Stock Option Plan. (10) (Exhibit 4.1) | |
| 10.6* |
Novell, Inc. Stock Option Plan for Non-Employee Directors (As Amended January 12, 1996). (11) (Exhibit 4.1) | |
| 10.7* |
Novell, Inc./SilverStream Software, Inc. Amended and Restated 1997 Stock Incentive Plan. (12) (Exhibit 4.2) | |
| 10.8* |
Novell, Inc./SilverStream Software, Inc. 2001 Stock Incentive Plan. (12) (Exhibit 4.3) | |
| 10.9* |
Novell, Inc./SilverStream Software, Inc./Bondi Software, Inc. Employee Stock Option Plan, As Amended, Effective November 1, 1999. (12) (Exhibit 4.5) | |
| 10.10* |
Novell, Inc. 2009 Omnibus Incentive Plan. (13) | |
| 10.11* |
Form of Restricted Stock Unit Agreement for non-employee directors. (14) (Exhibit 10.2) | |
| 10.12* |
Form of Restricted Stock Unit Agreement for employees. (14) (Exhibit 10.3) | |
| 10.13* |
Form of Nonqualified Stock Option Agreement for non-employee directors. (14) (Exhibit 10.4) | |
| 10.14* |
Form of Nonqualified Stock Option Agreement for employees. (14) (Exhibit 10.5) | |
| 10.15* |
Form of Nonqualified Stock Option Grant Agreement. (15) (Exhibit 10.5) | |
| 10.16* |
Form of Restricted Stock Unit Grant Agreement. (15) (Exhibit 10.6) | |
| 10.17* |
Novell, Inc. Stock-Based Deferred Compensation Plan (As Amended and Restated, effective January 1, 2009). (17) (Exhibit 10.4) | |
| 10.18* |
Novell, Inc. Stock-Based Deferred Compensation Plan — Stock Purchase Assistance Subplan, Effective as of October 14, 2004. (16) (Exhibit 10.13) | |
| 10.19* |
First Amendment to the Novell, Inc. Deferred Compensation Plan. (18) (Exhibit 10.1) | |
| 10.20* |
Severance Agreement dated as of May 29, 2003 between the Registrant and Ronald W. Hovsepian. (19) (Exhibit 10.17) | |
| 10.21* |
Amendment 2005-1 to Severance Agreement dated as of October 31, 2005 between the Registrant and Ronald W. Hovsepian. (20) (Exhibit 10.18) | |
| 10.22* |
Severance Agreement dated as of October 3, 2005 between the Registrant and Thomas M. Francese. (20) (Exhibit 10.22) | |
| 10.23* |
Severance Agreement dated as of November 28, 2005 between the Registrant and Jeffrey M. Jaffe. (20) (Exhibit 10.23) | |
| 10.24* |
Severance Agreement dated as of April 24, 2007 between the Registrant and Dana C. Russell. (21) (Exhibit 10.1) | |
| 10.25* |
Severance Agreement dated as of February 8, 2007 between the Registrant and John K. Dragoon. (17) (Exhibit 10.5) | |
| 10.26* |
Amendment 2007-1 to Severance Agreement dated as of May 2, 2007 between the Registrant and John K. Dragoon. (17) (Exhibit 10.6) | |
| 10.27* |
Amendment to Severance Agreement dated as of September 15, 2008 between the Registrant and John K. Dragoon. (17) (Exhibit 10.7) | |
116
Table of Contents
NOVELL, INC.
EXHIBIT INDEX (Continued)
| 10.28* |
Severance Agreement dated as of March 25, 2003 between the Registrant and Alan J. Friedman. (19) (Exhibit 10.16) | |
| 10.29* |
Amendment to Severance Agreement dated as of September 15, 2008 between the Registrant and Alan J. Friedman. (17) (Exhibit 10.9) | |
| 10.30* |
Amendment to Severance Agreement dated as of September 15, 2008 between the Registrant and Ronald W. Hovsepian. (17) (Exhibit 10.10) | |
| 10.31* |
Amendment to Severance Agreement dated as of September 15, 2008 between the Registrant and Dana C. Russell. (17) (Exhibit 10.11) | |
| 10.32* |
Amendment to Severance Agreement dated as of September 15, 2008 between the Registrant and Jeffrey M. Jaffe. (17) (Exhibit 10.12) | |
| 10.33* |
Form of Indemnification Agreement. (3) (Exhibit 10.3) | |
| 10.34* |
Form of Amendment to Severance Agreement. (3) (Exhibit 10.4) | |
| Novell, Inc. Non-Employee Director Remuneration and Expense Reimbursement Summary. (28) | ||
| 10.36* |
Stock Option Amendment Agreement dated as of January 10, 2008 between the Registrant and Dana C. Russell. (23) (Exhibit 10.3) | |
| 10.37* |
Novell, Inc. Deferred Compensation Plan (As Amended and Restated, effective January 1, 2005). (17) (Exhibit 10.3) | |
| 10.38* |
Offer letter dated and countersigned May 27, 2003 between the Registrant and Ronald W. Hovsepian. (22) (Exhibit 10.28) | |
| 10.39* |
Offer letter dated August 31, 2005 and countersigned September 2, 2005 between the Registrant and Thomas M. Francese. (22) (Exhibit 10.30) | |
| 10.40* |
Letter of Understanding dated August 1, 2006 between the Registrant and Thomas M. Francese. (22) (Exhibit 10.31) | |
| 10.41* |
Offer letter dated and countersigned November 7, 2005 between the Registrant and Jeffrey M. Jaffe. (22) (Exhibit 10.32) | |
| 10.42* |
Novell, Inc. 2009 Annual Bonus Program for Executives. (24) | |
| 10.43* |
Novell, Inc. 2010 Annual Incentive Plan for Executives (25) | |
| 10.44* |
Separation of Employment and General Release Agreement dated August 1, 2008 between the Registrant and Thomas M. Francese. (26) (Exhibit 10.1) | |
| 10.45 |
Second Amended and Restated Technical Collaboration Agreement effective November 2, 2006 between the Registrant and Microsoft Corporation. (22)(27) (Exhibit 10.33) | |
| 10.46 |
First Amended and Restated Business Collaboration Agreement effective November 2, 2006 between the Registrant and Microsoft Corporation. (22)(27) (Exhibit 10.34) | |
| 10.47 |
Patent Cooperation Agreement effective November 2, 2006 between the Registrant and Microsoft Corporation. (22)(27) (Exhibit 10.35) | |
| 10.48 |
Side Letter Agreement, dated November 7, 2006, to the Patent Cooperation Agreement between the Registrant and Microsoft Corporation. (22) (Exhibit 10.36) | |
| Subsidiaries of the Registrant. (28) | ||
| Consent of PricewaterhouseCoopers LLP, Independent Registered Public Accounting Firm. (28) | ||
| Rule 13a-14(a) Certification. (28) | ||
| Rule 13a-14(a) Certification. (28) | ||
| 18 U.S.C. Section 1350 Certification. (28) | ||
| 18 U.S.C. Section 1350 Certification. (28) | ||
| * | Indicates management contracts or compensatory plans |
| (1) | Incorporated by reference to the Exhibit identified in parentheses, filed as an exhibit to the Registrant’s Quarterly Report on Form 10-Q, filed for the fiscal quarter ended April 30, 2004 (File No. 0-13351). |
| (2) | Incorporated by reference to the Exhibit identified in parentheses, filed as an exhibit to the Registrant’s Current Report on Form 8-K, filed June 19, 2009 (File No. 0-13351). |
117
Table of Contents
NOVELL, INC.
EXHIBIT INDEX (Continued)
| (3) |
Incorporated by reference to the Exhibit identified in parentheses, filed as an exhibit to the Registrant’s Quarterly Report on Form 10-Q, filed for the fiscal quarter ended April 30, 2009 (File No. 0-13351). | |
| (4) |
Incorporated by reference to the Exhibit identified in parentheses, filed as an exhibit to the Registrant’s Current Report on Form 8-K, filed August 13, 2009 (File No. 0-13351). | |
| (5) |
Incorporated by reference to the Exhibit identified in parentheses, filed as an exhibit to the Registrant’s Registration Statement on Form S-1, filed November 30, 1984, and amendments thereto (File No. 2- 94613). | |
| (6) |
Incorporated by reference to the Exhibit identified in parentheses, filed as an exhibit to the Registrant’s Quarterly Report on Form 10-Q, filed for the fiscal quarter ended July 31, 2004 (File No. 0-13351). | |
| (7) |
Incorporated by reference to the Exhibit identified in parentheses, filed as an exhibit to the Registrant’s Current Report on Form 8-K, filed November 15, 2006 (File No. 0-13351). | |
| (8) |
Incorporated by reference to the Exhibit identified in parentheses, filed as an exhibit to the Registrant’s Registration Statement on Form S-8, filed October 12, 2001 (File No. 333-71502). | |
| (9) |
Incorporated by reference to the Exhibit identified in parentheses, filed as an exhibit to the Registrant’s Registration Statement on Form S-8, filed May 30, 1996 (File No. 333-04775). | |
| (10) |
Incorporated by reference to the Exhibit identified in parentheses, filed as an exhibit to the Registrant’s Registration Statement on Form S-8, filed July 13, 2000 (File No. 333-41328). | |
| (11) |
Incorporated by reference to the Exhibit identified in parentheses, filed as an exhibit to the Registrant’s Registration Statement on Form S-8, filed May 30, 1996 (File No. 333-04823). | |
| (12) |
Incorporated by reference to the Exhibit identified in parentheses, filed as an exhibit to the Registrant’s Registration Statement on Form S-8, filed August 6, 2002 (File No. 333-97713). | |
| (13) |
Incorporated by reference from Appendix A of the Company’s Definitive Proxy Statement on Schedule 14A, filed with the Securities and Exchange Commission on February 25, 2009. | |
| (14) |
Incorporated by reference to the Exhibit identified in parentheses, filed as an exhibit to the Registrant’s Current Report on Form 8-K, filed April 9, 2009 (File No. 0-13351). | |
| (15) |
Incorporated by reference to the Exhibit identified in parentheses, filed as an exhibit to the Registrant’s Quarterly Report on Form 10-Q, filed for the fiscal quarter ended July 31, 2009 (File No. 0-13351). | |
| (16) |
Incorporated by reference to the Exhibit identified in parentheses, filed as an exhibit to the Registrant’s Annual Report on Form 10-K, filed for the fiscal year ended October 31, 2004 (File No. 0-13351). | |
| (17) |
Incorporated by reference to the Exhibit identified in parentheses, filed as an exhibit to the Registrant’s Quarterly Report on Form 10-Q, filed for the fiscal quarter ended January 31, 2009 (File No. 0-13351). | |
| (18) |
Incorporated by reference to the Exhibit identified in parentheses, filed as an exhibit to the Registrant’s Current Report on Form 8-K, filed November 2, 2009 (File No. 0-13351). | |
| (19) |
Incorporated by reference to the Exhibit identified in parentheses, filed as an exhibit to the Registrant’s Annual Report on Form 10-K, filed for the fiscal year ended October 31, 2003 (File No. 0-13351). | |
| (20) |
Incorporated by reference to the Exhibit identified in parentheses, filed as an exhibit to the Registrant’s Annual Report on Form 10-K, filed for the fiscal year ended October 31, 2005 (File No. 0-13351). | |
| (21) |
Incorporated by reference to the Exhibit identified in parentheses, filed as an exhibit to the Registrant’s Current Report on Form 8-K, filed April 27, 2007 (File No. 0-13351). | |
| (22) |
Incorporated by reference to the Exhibit identified in parentheses, filed as an exhibit to the Registrant’s Annual Report on Form 10-K, filed for the fiscal year ended October 31, 2006 (File No. 0-13351). | |
118
Table of Contents
NOVELL, INC.
EXHIBIT INDEX (Continued)
| (23) |
Incorporated by reference to the Exhibit identified in parentheses, filed as an exhibit to the Registrant’s Quarterly Report on Form 10-Q, filed for the fiscal quarter ended July 31, 2008 (File No. 0-13351). | |
| (24) |
Incorporated by reference to the Registrant’s Current Report on Form 8-K, filed April 13, 2009 (File No. 0-13351). | |
| (25) |
Incorporated by reference to the Registrant’s Current Report on Form 8-K, filed December 11, 2009 (File No. 0-13351). | |
| (26) |
Incorporated by reference to the Exhibit identified in parentheses, filed as an exhibit to the Registrant’s Current Report on Form 8-K, filed August 6, 2008 (File No. 0-13351). | |
| (27) |
Portions of this exhibit have been omitted and filed separately with the Securities and Exchange Commission pursuant to a request for confidential treatment. | |
| (28) |
Filed herewith. | |
119