Attached files
Table of Contents
UNITED STATES
SECURITIES AND EXCHANGE COMMISSION
Washington, D.C. 20549
FORM 10-K
(Mark One)
| x | ANNUAL REPORT PURSUANT TO SECTION 13 OR 15(d) OF THE SECURITIES EXCHANGE ACT OF 1934 |
For the fiscal year ended October 31, 2009
or
| ¨ | TRANSITION REPORT PURSUANT TO SECTION 13 OR 15(d) OF THE SECURITIES EXCHANGE ACT OF 1934 |
Commission file number: 000-52038
Verigy Ltd.
(Exact name of registrant as specified in its charter)
| SINGAPORE | N/A | |
| (State or other jurisdiction of incorporation or organization) |
(I.R.S. Employer Identification No.) | |
| NO. 1 YISHUN AVE 7 SINGAPORE 768923 |
N/A | |
| (Address of Principal Executive Offices) | (Zip Code) | |
Registrant’s telephone number, including area code (+65) 6755-2033
Securities registered pursuant to Section 12(b) of the Act:
| Title of Each Class |
Name of Each Exchange on Which Registered | |
| Ordinary Shares, no par value | The NASDAQ Global Select Market |
Securities registered pursuant to Section 12(g) of the Act:
None
Indicate by check mark if the registrant is a well-known seasoned issuer, as defined in Rule 405 of the Securities Act. Yes ¨ No x
Indicate by check mark if the registrant is not required to file reports pursuant to Section 13 or Section 15(d) of the Act. Yes ¨ No x
Indicate by check mark whether the registrant (1) has filed all reports required to be filed by Section 13 or 15(d) of the Securities Exchange Act of 1934 during the preceding 12 months (or for such shorter period that the registrant was required to file such reports), and (2) has been subject to such filing requirements for the past 90 days. Yes x No ¨
Indicate by check mark if disclosure of delinquent filers pursuant to Item 405 of Regulation S-K (Section 229.405) is not contained herein, and will not be contained, to the best of registrant’s knowledge, in definitive proxy or information statements incorporated by reference in Part III of this Form 10-K or any amendment to this Form 10-K. ¨
Indicate by check mark whether the registrant has submitted electronically and posted on its corporate Web site, if any, every Interactive Data File required to be submitted and posted pursuant to Rule 405 of Regulation S-T (§232.405 of this chapter) during the preceding 12 months (or for such shorter period that the registrant was required to submit and post such files). Yes ¨ No ¨
Indicate by check mark whether the registrant is a large accelerated filer, an accelerated filer, a non-accelerated filer, or a smaller reporting company. See definitions of “large accelerated filer,” “accelerated filer” and “smaller reporting company” in Rule 12b-2 of the Exchange Act. (Check one):
| Large accelerated filer x | Accelerated filer ¨ | |||
| Non-accelerated filer ¨ | Smaller reporting company ¨ | |||
| (Do not check if a smaller reporting company) |
Indicate by check mark whether the registrant is a shell company (as defined in Rule 12b-2 of the Act). Yes ¨ No x
The aggregate market value of the registrant’s voting and non-voting common equity held by non-affiliates as of April 30, 2009, the last business day of the registrant’s most recently completed second fiscal quarter, was $650 million based upon the closing sale price of our ordinary shares on The NASDAQ Global Select Market.
As of December 15, 2009, there were 59,241,685 outstanding ordinary shares of Verigy Ltd.
DOCUMENTS INCORPORATED BY REFERENCE
Portions of the registrant’s Proxy Statement for its 2010 Annual General Meeting of Shareholders, which will be filed pursuant to Regulation 14A within 120 days after registrant’s fiscal year ended October 31, 2009, are incorporated by reference into Part III, Items 10 - 14 of this Annual Report on Form 10-K. Except as expressly incorporated by reference, the registrant’s Proxy statement shall not be deemed to be a part of this Annual Report on Form 10-K.
Table of Contents
| Page | ||||
| 3 | ||||
| PART I | ||||
| Item 1 |
4 | |||
| Item 1A |
21 | |||
| Item 1B |
33 | |||
| Item 2 |
33 | |||
| Item 3 |
34 | |||
| Item 4 |
34 | |||
| PART II | ||||
| Item 5 |
35 | |||
| Item 6 |
37 | |||
| Item 7 |
Management’s Discussion and Analysis of Financial Condition and Results of Operations |
38 | ||
| Item 7A |
58 | |||
| Item 8 |
61 | |||
| Item 9 |
Changes in and Disagreements With Accountants on Accounting and Financial Disclosure |
105 | ||
| Item 9A |
105 | |||
| Item 9B |
106 | |||
| PART III | ||||
| Item 10 |
107 | |||
| Item 11 |
107 | |||
| Item 12 |
Security Ownership of Certain Beneficial Owners and Management and Related Stockholder Matters |
107 | ||
| Item 13 |
Certain Relationships and Related Transactions, and Director Independence |
107 | ||
| Item 14 |
107 | |||
| PART IV | ||||
| Item 15 |
108 | |||
| 109 | ||||
2
Table of Contents
The following discussion should be read in conjunction with the consolidated financial statements and notes thereto included elsewhere in this Annual Report on Form 10-K. This report contains forward-looking statements including, without limitation, statements regarding the anticipated effects of our restructuring actions, our plans to attain profitability, the continuing trend of revenue growth, our strategy, the effectiveness of our flexible operating model, timing for completion of the transition of certain manufacturing activities, anticipated revenue from Touchdown Technologies, recovery of the SOC and memory markets, our research and development activities and expenses, variations in quarterly revenues and operating results, our future effective tax rate, our liquidity position, our foreign currency risk, the potential impact of adopting new accounting pronouncements, our potential future financial results, the quality of our marketable securities, our purchase commitments, our obligation and assumptions about our retirement and post-retirement benefit plans, and our lease payment obligations, each of which involves risks and uncertainties. Additional forward-looking statements can be identified by words such as “anticipated,” “expect,” “believes,” “plan,” “predicts,” and similar terms. Our actual results could differ materially from the results contemplated by these forward-looking statements due to risks and uncertainties, including, but not limited to, macroeconomic conditions, unforeseen changes in demand for semiconductors and semiconductor test solutions, the strength of our customers and their businesses, market acceptance of Verigy’s existing and newly introduced products, and various other factors, including those discussed under “Part I, Item 1A, Risk Factors” and elsewhere in this report.
3
Table of Contents
PART I
| Item 1. | Business |
Overview
Prior to our initial public offering in June 2006, we were a wholly-owned subsidiary of Agilent Technologies, Inc. (“Agilent”). We became an independent company, incorporated in Singapore on June 1, 2006, when we separated from Agilent. On June 13, 2006, we completed our initial public offering and became a separate, stand-alone publicly-traded company focused on technology and innovation in semiconductor testing. We design, develop, manufacture and sell advanced test systems and solutions for the semiconductor industry.
We offer a single platform for each of the general categories of devices being tested: our V93000 Series platform, designed to test System-on-a-Chip (“SOC”), System-in-a-Package (“SIP”) and high-speed memory devices; our V6000 Series platform, which is the successor to the V5000 platform, designed to test both “flash” memory and dynamic random access memory (“DRAM”) devices, and our V101 platform, introduced in the third quarter of fiscal year 2009, designed to test highly cost-sensitive devices such as 4, 8 and 16-bit micro-controller units (“MCUs”). Also during the third quarter, we acquired the assets and business of Touchdown Technologies, a manufacturer of advanced memory probe cards.
Each of our test platforms is scalable across different frequency ranges, pin counts and numbers of devices under simultaneous test. The test platforms’ flexibility also allows for a single test system to test a wide range of semiconductor device applications. Our platform strategy allows us to optimize operational efficiencies such as research and development investments, engineering headcount, support requirements and inventory risk. This platform strategy also provides economic benefits to our customers by allowing them to bring their complex, feature-rich semiconductor devices to market quickly and to reduce their overall costs. In addition to our test platforms, our product portfolio includes advanced analysis and yield learning tools as well as consulting, service and support offerings such as start-up assistance, application services and system calibration and repair.
As of October 31, 2009, we have installed more than 2,000 V93000 Series systems and nearly 2600 V5000 Series systems worldwide. The V6000 Series systems and V101 began shipping in fiscal year 2009 and have not yet shipped in material quantities. We have a broad customer base which includes integrated device manufacturers (“IDMs”), fabless companies, and test subcontractors, also referred to as subcontractors or “OSAT” (outsourced sub-assembly and test) providers. OSATs include specialty assembly, package and test companies as well as wafer foundries, and companies that design, but contract with others for the manufacture of, integrated circuits (known as fabless design companies).
The Semiconductor Automated Test Equipment (ATE) Industry
Industry Background. Semiconductor devices, also referred to as integrated circuits, or ICs, are the fundamental building blocks used in all electronic systems. They have played an important role in enabling the proliferation of computing, communications and consumer electronic products. As technology continues to penetrate most aspects of daily life, semiconductor devices are playing a more important role in a growing number and variety of products. Consequently, the global semiconductor industry, while experiencing significant cyclical fluctuations in its growth rate, has exhibited strong overall growth over the last 30 years.
The design and manufacture of semiconductor devices is a complex and capital-intensive multi-step process. The process involves different types of equipment used to manufacture, assemble and test semiconductor devices. Semiconductor test equipment and services are a critical part of this complex design and manufacturing process and are utilized in each of the key design and manufacturing stages.
4
Table of Contents
Semiconductor test equipment and services are generally categorized by the type of semiconductor device tested. There are two general markets in which we sell our products—memory and non-memory.
• Non-Memory. The non-memory market includes testers designed to test very complex, highly integrated semiconductors such as SOCs, or SIPs, as well as testers for testing less complex semiconductors such as MCUs. SOCs and SIPs are semiconductors that integrate the functionality of multiple individual ICs onto a single IC or package, and often contain both digital and analog functionalities, including radio frequency (“RF”) capabilities, communication interfaces and embedded memory. By combining multiple technologies onto a single, more complex chip or package, these devices provide the benefits of lower cost, smaller size, higher performance and lower power consumption and facilitate faster time-to-market that is critical for products targeted to the consumer electronics market. MCUs are small, generally single purpose semiconductors designed for small or dedicated applications ranging from home appliances to toys.
• Memory. The memory market includes testers designed to test semiconductors designed to store user data such as DRAM, including DDR3 and GDDR graphics memories, and flash memory, including both NAND and NOR flash. Flash memory has become the dominant non-volatile memory technology wherever a significant amount of solid-state storage is required. The most meaningful characteristic of flash memory—and its key differentiator from DRAM—is the fact that it requires no power to maintain the information stored in the cells of the memory device. DRAM is the prevalent memory in personal computers, workstations and non-handheld gaming consoles. It is distinguished from flash in its structural simplicity and in the fact that it loses the data stored in its cells when powered off. High-speed DRAMs run at very high data rates and are used in high end graphics applications for high end computers and gaming consoles.
• Applications for Semiconductor Test through Development Cycle. Semiconductor test equipment plays an important role by enabling both non-memory and memory semiconductor designers and manufacturers to lower their overall costs and get products to market quickly in addition to improving the quality and reliability of their end products. By detecting manufacturing and engineering/design defects, test equipment enables semiconductor designers and manufacturers to shorten the time to move from initial production, in which the yield (number of parts per wafer that perform to specifications) tends to be low, to high-yielding full manufacturing production. By testing finished goods before they are shipped for installation into the products for which they were designed, manufacturers can ensure consistently high quality and reliability.
Bringing semiconductor products to market is a multi-step process, which includes stages referred to as engineering characterization, production ramp and high-volume production. As illustrated below, semiconductor test equipment plays an important role in each of these stages.
• Engineering Validation and Characterization. Once a semiconductor has been initially designed, the first phase in bringing an IC to market is producing a small quantity of prototypes to validate the design and ensure that it performs according to expectations and to establish the detailed specifications for the device. Testing at this stage is focused on validating the design—ensuring that the device works and does what it was designed to do—and determining the actual characteristics of the device. Key to this stage is the ability of the test equipment to quickly identify the physical location where a device is failing in order to allow the designer to modify the design to resolve the issue and move the device to fabrication. During this stage, test strategies and methodologies are also developed to ensure that the test solution implemented is capable of testing the ICs thoroughly and in a manner that is similar in nature to the devices’ likely end-use.
• Production Ramp. Once the engineering validation and characterization phase has been completed, the next phase is the ramp to production. Testing at this stage is focused on identifying any remaining design and/or process issues and fine-tuning the applications test program to optimize yield and minimize cost.
• High Volume Production. The final phase in bringing a semiconductor device to market is high-volume production. The key focus for the semiconductor manufacturer at this phase is to cost effectively achieve
5
Table of Contents
high output of quality semiconductor devices, which requires high-reliability and high-repeatability test equipment with tailored service and support. In order to achieve high throughput and lower cost of test per device, test equipment that is not only fast but can also test multiple devices simultaneously is critical. Parallel testing is especially important and well established for memory devices but is of increasing importance in SOC testing.
• Semiconductor Test Demand Drivers. Demand for new semiconductor test equipment is driven by two primary forces: growth in semiconductor unit volume that drives the need for additional testing capacity, and the adoption of new technologies in semiconductor design, manufacturing and packaging that require new types of semiconductor testing equipment.
• Non-Memory. The continuous integration of different functionality in fewer chips, enables manufacturers of a wide range of goods to create new, more feature rich and often smaller products (like Smart Phones), in turn driving growth in demand for semiconductors. This generates demand for testers to test new semiconductors incorporating new technologies and/or smaller geometries (“technology buys”) and also creates demand for testers to test the increased volume of semiconductor devices being manufactured (“capacity buys”). The integration of computing, communication connectivity, and consumer oriented technologies is currently a strong driver in this industry.
• Memory. Flash and DRAM represent the bulk of the memory device market (in terms of bit and unit shipments as well as revenue). The memory IC market is particularly volatile due to several factors including: the commodity nature of the products; competitive practices of the lead players; impact of global economic factors such as consumer spending; and low profit margins that are especially sensitive to changes in average selling prices.
¡ Flash. The market for flash memory, as measured by megabits shipped, has doubled every year from 2002 through 2008. Given the global recession during 2009, we expect the rate of growth to have dropped in 2009 compared to recent years, but expect the growth to resume doubling again in 2010. This growth has been fueled largely by the extensive use of flash memory in consumer products such as MP3 players, cell phones, digital cameras and other handheld devices. An emerging trend is replacing hard disk (magnetic disk) drives with solid state (memory IC devices) disk drives (SSDs). This trend is enabled by the declining cost of flash memory combined with the better reliability and lower power consumption of solid state memory products compared to those with moving parts.
¡ DRAM. The main application for DRAM is in the PC marketplace. Historically, growth in DRAM has been tied to the computer operating system such as Windows XP and Vista, and to the memory intensity of mainstream software applications. Most PCs today are running with 32 bit operating systems which limit the total useable memory to 3.5 gigabytes. The emerging 64 bit operating systems remove this limitation and are expected drive the next big growth in DRAM usage. The transition to 64 bit systems is expected to start with the server market within the next couple of years with PCs following 2 – 3 years after that. The market for DRAM devices historically has been characterized by extreme volatility with multi-year periods (typically three to four years) of substantial market growth (measured in aggregate revenues of DRAM manufacturers) followed by one or two years of decline. In addition to this general cyclicality, the DRAM market was particularly hard hit by the global economic difficulties of the past year.
Semiconductor Test Market Challenges
Because of the competitiveness of the broader consumer electronics market, semiconductor designers and manufacturers are increasingly focused on bringing high quality complex ICs to market faster and at lower costs. Semiconductor designers and manufacturers are in turn looking to their test equipment and service providers to help them address key challenges, including:
• Increased pressure to reduce overall cost of test. Continued cost pressures are driving semiconductor designers and manufacturers to demand higher utilization of test systems, as well as test systems
6
Table of Contents
that can be re-used across different types and generations of ICs. Test systems are required to demonstrate the scalability and flexibility necessary to permit desired levels of utilization and extend their useful life. Rapid technology change within the semiconductor industry can quickly render non-scalable test equipment obsolete for the testing of new generations of semiconductors. The main driver in the cost of test is the number of devices (units) that can be tested per hour, also referred to as “UPH.” This, in turn, is driving the need for test equipment with short test times and the ability to test an increasing number of units at the same time on the same tester (parallel test).
• Increased pressure to improve time-to-market. Today’s semiconductor market is characterized by shortening product life cycles as a result of increased exposure to and reliance on the consumer electronics market. Semiconductor designers and manufacturers that are first to market and that quickly adapt to changing technological advances gain a significant competitive advantage. The complex nature of semiconductor manufacturing requires that test solutions providers offer their customers more than just test equipment. Semiconductor designers and manufacturers require tailored test solutions and a breadth of application expertise in order to accelerate their time-to-market with new ICs and maximize their revenue opportunity. Equipment suppliers that are not able to complement their hardware systems with application expertise have limited ability to impact their customers’ time to market.
• Increased complexity and performance requirements of test. The trend towards SOCs, SIPs and Multi-Chip Packages (MCPs) has created new challenges for semiconductor designers and manufacturers. These increasingly complex semiconductor implementations, which enable improved performance and optimized form and function, require sophisticated test solutions. In addition, advances in interface technology, the adoption of new design protocols, and process technology innovations have only added to this complexity. Test equipment designed as “point solutions” rather than those designed for scalability and flexibility are frequently more costly in the long run.
Meeting the needs of test subcontractors
Test subcontractors or “OSATs,” face specific test challenges. Subcontractors provide test services to a diverse group of semiconductor designers and manufacturers, which include both fabless design companies and IDMs. As a result, subcontractors are continually challenged to provide the capabilities to test a wide range of ICs. Optimizing the utilization of a subcontractor’s installed capital equipment is therefore important to its success. In order to optimize this utilization, subcontractors require flexible semiconductor test systems that are capable of testing a broad spectrum of ICs. Additionally, subcontractors require systems that can test ICs with varying pin counts while maintaining cost efficiencies and high throughput levels. For this reason, test solutions providers who fail to offer scalable and flexible architectures, as well as a breadth of application expertise, may fall short in meeting the needs of subcontractors.
Our Solution
We design, develop, manufacture, sell and support advanced test solutions for the semiconductor industry. Unlike competitors who provide multiple platforms for testing similar devices, we provide a single scalable platform for testing each of the general categories of devices for which we offer test solutions: SOC/SIP, memory and MCUs. As part of our scalable platform strategy, we develop and offer performance and capability enhancements to our platforms. Our V93000 Series platform is designed to test SOC, SIP and high-speed memory devices. Our V6000 Series platform, which is the successor to the V5000 Series platform was designed to test memory devices, including flash, DRAM and multi-chip packaged memory. Touchdown Technologies, our wholly owned subsidiary, provides a solution for very high parallelism memory testing, including single touchdown, full wafer probing. Our V101 system is designed to test MCUs and other low cost devices. We provide a range of services to assist our customers in achieving the necessary time-to-volume manufacturing, required of the competitive end-use markets. We also deliver yield learning software that is targeted at the time-to-market and time-to-volume ramps of our customers.
7
Table of Contents
More than a decade ago, we introduced the concept of a scalable platform architecture for semiconductor testing, and we continue to capitalize on the benefits of that strategy today. Our scalable platform architecture provides us with internal operating model efficiencies, such as reduced research and development costs, simplified support requirements and reduced inventory risk. The scalability and flexibility of our solution also provide economic benefits to our customers by allowing them to get their complex, feature-rich semiconductor devices to market quickly and to reduce overall costs. We believe our advanced SOC/SIP/high-speed memory, memory and low cost test solutions provide optimal combinations of flexibility, cost and performance to a wide range of designers and manufacturers in the semiconductor industry at all stages of bringing a semiconductor product to market, from design to engineering characterization to high-volume manufacturing. The key elements of our solution are:
Scalable platform across a broad range of performance levels
Reducing the overall cost of test is critical for our customers. Our test platforms are scalable in a number of ways, including the frequency range of the applied test signals, the number of pins to accommodate ICs with different pin counts and the number of devices that can be tested in parallel. This scalability allows semiconductor manufacturers considerable flexibility in selecting the right test solution to meet their needs, at an optimized level of capital investment. In addition, our test systems can be quickly reconfigured or upgraded as requirements change. The combination of scalability, speed and ease of reconfiguration of our test systems enables our customers to reduce their long-term capital equipment requirements and minimize manufacturing downtime.
The scalability of our test platforms is enabled by a “tester-per-pin” architecture in the case of our SOC/SIP/high-speed memory (HSM) test platform, “tester-per-site” architecture in the case of our main memory test platform and “tester-on-board” architecture in the case of our V101 test platform.
• SOC/SIP/High-Speed Memory Tester-per-Pin. Our “tester-per-pin” architecture utilizes a separate and independent test processor for each pin, enabling each pin to be tested independently and in parallel to the testing of other pins. The tester-per-pin architecture of our SOC/SIP/HSM test systems also enables us to offer customers innovative licensing models. For example, we currently offer our customers the unique ability to purchase and share performance licenses across a test floor or even an enterprise thus allowing them to optimize their return on invested capital. As a result, our customers are able to buy only the performance they need for each pin of the system and to “instantly” upgrade a system through a software upload as the device test program is loaded into the system.
• Memory Tester-Per-Site. Our “tester-per-site” architecture is tailored to optimize parallel testing of a large number of memory devices simultaneously. Our V6000 System is capable of testing more devices in parallel than any other tester currently on the market.
• Low Cost Tester-on-Board. Our “tester-on-board” architecture, used in our low cost V101 system, places digital and power resources directly on the board, providing more accurate power resources, and enabling multi-site efficiency with high throughput and at lower test costs. The V101 is specifically targeted at testing inexpensive, high volume devices such as MCUs and for low cost wafer sort applications.
For all of our test systems, the process of scaling up the number of devices a test system is capable of testing in parallel is often accomplished quickly, typically requiring only a few hours for basic scaling and only a few days for more extensive scaling.
Flexible platforms across a wide range of applications
Our test platforms are also highly flexible in that they allow a single test system to test a wide range of applications for semiconductor devices. The high level of software reconfigurability of our test platforms, and the support and enhancements we offer, enable our customers to implement a broad range of application tests
8
Table of Contents
tailored to their needs, including tests for high-speed digital, analog/mixed signal, flash memory, RF and DRAM devices. In addition to enabling our customers to test a broad range of products, our test systems also support, through software reconfiguration, a number of advanced test methodologies, such as built-in self test (“BIST”), design-for-testability (“DfT”), reduced pin count (“RPC”) test and concurrent test. These methodologies can simplify testing complex devices, thereby increasing our customers’ throughput as well as improving their time to market. We are continually developing additional enhancements to our test platforms to support additional application tests and test methodologies.
Competing test platforms often require an IC device manufacturer to have devices tested by multiple test systems in order to complete the tests required for different applications contained in the devices. This process is not only expensive, cumbersome and time-consuming, but it also takes up valuable floor space in the manufacturing facility. In comparison, our test platforms are able to run the tests for a significant number of different applications without having to move devices to different test systems. The flexible test capabilities of our V93000 Series, V6000/V5000 Series and V101 test platforms enable our customers to reduce their overall cost of equipment acquisition, employee training and test equipment maintenance while simultaneously increasing equipment utilization.
Advanced, innovative test technology
As a result of the competitive pressures our customers face, they continually need to develop and bring to market increasingly complex products. We develop advanced technology solutions in order to assist our customers in accomplishing this goal in a cost effective and timely manner. From our history as part of Agilent, which was part of Hewlett Packard (“HP”) until its spin-off in 1999, we have a legacy of introducing new and innovative designs to market. Some of these key innovations include the development of scalable platforms for both SOC/SIP/HSM and memory test through our “tester-per-pin” and “tester-per-site” architectures, our test processors utilizing high performance application-specific integrated circuits, or “ASICs,” and our liquid cooling technology for our test system hardware.
Since 1991, we have used ASICs for our test processors in place of larger, less integrated and less sophisticated designs, allowing our test processors to be very small and providing our test systems with the high performance and accuracy expected from an ASIC-based design. The small size of our ASIC-based test processors enables our “tester-per-pin” and “tester-per-site” architectures. Along with the additional performance, scalability and flexibility benefits of those architectures, our ASIC-based architectures result in test systems that are able to test large numbers of devices in parallel in a small test platform footprint. The extensive use of ASICs and the degree of integration of our systems makes them more energy efficient than competitive systems. We complete the initial design phase and functional design of the ASIC, but we partner with other companies to complete the physical design, and fabrication of the ASIC. We have over 15 years of experience in designing ASICS and own the intellectual property rights for the initial and functional designs that are integrated into this technology.
Our larger systems use liquid cooling technology, which provides lower operating temperatures, greater system reliability and repeatability, reduced operating costs, improved accuracy and speed, and quieter and cooler operation than the traditional air cooled technology used in some competitive products. The liquid cooling supports the increased integration and enables us to achieve a small test platform footprint. We introduced our first liquid cooled tester in 1991 and have extensive experience in the application of liquid cooling technology to semiconductor test systems.
During fiscal year 2008, we completed the acquisition of Inovys Corporation. This acquisition added to our portfolio of test solutions a software suite aimed at optimizing customers’ engineering and high volume manufacturing environment, especially at the more challenging process nodes from 65nm and below. We are in the process of integrating this suite of software tools into the V93000. Once that integration is complete, Verigy will provide unique solutions for silicon debug and tester-based yield learning for devices that make extensive
9
Table of Contents
use of scan-based test, which is becoming prevalent in logic circuits at lower geometries. This software suite will provide value not only in the test operations of our customers but also in their design and process/yield operations.
Global delivery of expert application knowledge
Getting semiconductors to market quickly is vital for our customers. Our worldwide professional staff of highly trained applications engineers provides our customers with a high level of technical expertise to assist our customers as they develop test applications for their semiconductor devices. Our extensive expertise spans a broad range of semiconductor devices, including chipsets and graphics, wireless and wired communication, flash and DRAM memory, video and audio, high-speed and specialty memory and complex multi-chip memory packages. We also produce leading-edge innovative test technologies and deliver, on a global basis, superior expertise across a wide range of applications to assist our customers in quickly delivering new feature-rich products to the market.
Lowered overall cost of test for customers
We have designed our platforms to be versatile and reconfigurable. As a result, our customers are able to select a configuration to meet their current test requirements and, as those requirements change, to upgrade the capabilities of their test equipment to meet their future needs without having to purchase completely new systems. Our high quality and reliable test solutions provide high uptime as measured by the reliability of the test equipment. Additionally, our ability to provide innovative solutions and technical expertise across a wide variety of applications helps our customers optimize test equipment performance for the specific semiconductor device being tested, which reduces test times and increases both yield and cost efficiencies. Consequently, we believe our solutions lower our customers’ cost of test in high volume manufacturing.
Shortened time-to-market
To achieve fast time to market, our customers require scalable and flexible test platforms and application expertise and support at each stage of the manufacturing process. We provide scalable and flexible test platforms based on our established architectures, which can be changed and reconfigured quickly to address new test technologies. Our highly trained applications engineers provide support for the development of test strategies, test applications analysis and optimization and test equipment utilization for our customers.
Our Strategy
Our objective is to be the leading semiconductor test solutions and services supplier, providing the highest return on our customers’ investment in test operations. We continue to focus on our customers’ evolving needs by offering innovative and versatile semiconductor test solutions that address the challenges facing semiconductor designers and manufacturers, and we remain committed to providing outstanding service and support to our customers. We intend to maintain efficiency in our business and capitalize on our research and development resources in an effort to achieve and sustain profitable growth. We are executing on our flexible operating model and cost structure to enable us to flex our capabilities and spending in response to cycles in the semiconductor industry, and thereby deliver continued customer responsiveness as well as improved overall profitability. Key elements of our strategy include:
• Maintaining the rapid pace of product innovation on scalable platforms. We believe our scalable platforms offer our customers the best return on their investment in test equipment. The scalable architecture of our solutions coupled with the proven stability of our platforms facilitates our focus on innovative enhancements, application improvements and technical solutions in step with our customers’ needs. The pace of innovation in the semiconductor industry is so rapid that performance doubles roughly every 18 months—a phenomenon referred to as “Moore’s Law”. Semiconductor companies thus require substantial technical
10
Table of Contents
expertise and constant innovation to successfully compete. We believe that with our scalable product architecture, wide-ranging technical capabilities and expertise and established global delivery platform, we are well positioned to be an innovator in the semiconductor test market and to assist our customers in competing successfully in the semiconductor market.
• Continuing to focus on emerging opportunities for profitable growth. We will continue to seek increased market penetration by focusing on market opportunities where we can capitalize on our technical expertise and add value to our customers who demand the most advanced and cost-effective test solutions. Opportunities that address markets not served by products portfolio provides potential for increased customer adoption of our solutions and the potential for higher returns on our investment. Recent examples of such emerging opportunities include single-chip cell phone devices that feature radio frequency circuits integrated into CMOS die and other portable consumer electronics that utilize high-speed memory and complex SOCs, SIPs and MCPs. In addition to these, with our recent acquisitions we have expanded our product offerings to include debug and yield solutions as well as probe cards.
• Capitalizing on our success with test subcontractors to increase our success with IDMs. The scalability and flexibility of our platform architecture has led to our success in attracting subcontractors to our test solutions. We believe that the same advantages of our solutions that subcontractors find compelling will continue to drive the increased adoption of our solutions by customers that both design and manufacture ICs which are known as integrated device manufacturers or “IDMs.” Today, all of the top ten IDMs utilize Verigy platforms for either engineering or production applications, or both. IDMs are facing increasingly intense competition, time-to-market pressures and shorter product lifecycles associated with consumer driven demand, which has led them to begin to outsource an increasing percentage of their semiconductor test business. We believe that our success with our subcontractor customers will drive IDMs to direct a greater percentage of their test business to us, as IDMs have an interest in maintaining consistency across their internal and external test platforms. These factors, combined with the cost and capital expenditures restrictions that many IDMs experience, are increasing the need for better asset utilization by IDMs.
• Continuing to deliver an outstanding total customer experience throughout the product life cycle. Application support through all phases of the product life cycle is critical to our customers’ ability to achieve fast time-to-market for their products while achieving a high return on their test solution investments. We provide our customers with extensive application expertise, and strive to maintain the global delivery capabilities of our customer-facing teams and to efficiently service our customers with an emphasis on responsiveness. We intend to expand our presence in Asia in the areas of applications engineering, research and development and order fulfillment in order to maintain favorable proximity to, and further strengthen our relationships with, customers in Asia. Additionally, we will continue to accentuate and reward the values of professionalism, technical expertise and uncompromising integrity in all our employees in an effort to continually enhance our customers’ experience.
• Optimizing our operating model to generate sustainable profitability. The semiconductor industry has historically been cyclical. This cyclicality requires semiconductor test suppliers to have flexible cost structures in order to sustain profitability through the peaks and troughs of the industry’s cycles. To achieve this, we employ flexible supply agreements, flexible compensation structures for all employees and an optimized business infrastructure. For example, we rely on several contract manufacturers that have a global presence and focus on driving greater economies of scale through our global supply chain, our leveraged research and development model and our efficient global delivery system. We believe this structure provides us flexibility to modulate our expenses as our revenues rise and fall during the peaks and troughs of the ordinary business cycles in our industry.
Although our operating model offers us extensive flexibility, that flexibility alone was insufficient to address the global economic downturn that we began to experience in our fourth quarter of fiscal year 2008 and which continued throughout fiscal year 2009. As a result, during fiscal year 2009 we undertook a number of cost
11
Table of Contents
cutting and restructuring efforts to streamline our organization and reduce operating costs. As part of that restructuring program, we reduced our global workforce through a combination of attrition, voluntary and involuntary terminations and other workforce reduction programs consistent with local legal requirements. The majority of the workforce reductions were completed by October 31, 2009, and are expected to be paid out by the end of fiscal year 2010. We have achieved our quarterly cost and expense goals by reducing our annualized cost structure by approximately $120 million since our fourth quarter of fiscal year 2008, which includes savings from restructuring activities as described above and a combination of other temporary and permanent cost saving measures.
Our Products and Services
We offer a single platform for each of the general categories of devices being tested: our V93000 Series platform, designed to test System-on-a-Chip (“SOC”), System-in-a-Package (“SIP”) and high-speed memory devices; our V6000 Series platform, which is the successor to the V5000 platform, designed to test both “flash” memory and dynamic random access memory (“DRAM”) devices, and our V101 platform, introduced in the third quarter of fiscal year 2009, designed to test highly cost-sensitive devices such as 4, 8 and 16-bit micro-controller units (“MCUs”). Each of these platforms is highly scalable and flexible and contains advanced, innovative test technology. We also provide high levels of test application expertise, services and support for our customers who use these platforms. Also during the third quarter, we acquired the assets and business of Touchdown Technologies, a manufacturer of advanced memory probe cards.
V93000 Series Platform—SOC, SIP and High-Speed Memory Test
Our V93000 Series platform, introduced in 1999, tests SOCs, SIPs and high-speed memory devices, which are used in a wide range of consumer electronics products, including MP3 players, BluRay disc players, digital televisions, television set-top boxes, PCs, gaming consoles and cell phones and other wireless communication devices. In fiscal year 2009, we saw continued success with Verigy’s V93000 platform in the different market segments including SOCs, RF devices, consumer mixed signal devices and complex digital devices. Our PortScale RF solution, which was introduced in 2007, reached volume shipments 2008, and is targeted at testing highly integrated radio frequency devices requiring multi-site efficiency and multiple ports.
The scalability and flexibility of the V93000 Series platform, enabled by its advanced, innovative test technology, allows it to cover the testing requirements for a wide range of devices and applications in all stages of bringing a semiconductor product to market, from production prototype to high-volume manufacturing, assisting device manufacturers in speeding time to market and lowering the overall cost of test.
Scalability. Our V93000 Series platform, with its “tester-per-pin” architecture, is highly scalable in a number of ways, including with respect to the frequency range of the applied test signals, the number of pins to accommodate ICs with different pin counts and the number of devices that can be tested in parallel. The V93000 Series platform with our latest generation PinScale digital cards is scalable in frequency performance from 400 Mbits/second to 12 Gbits/second, addressing the test needs for a wide range of today’s high-speed interfaces, including PCI Express, HyperTransport, Serial ATA and ultra-high-speed I/O buses required for wired communications. With up to 32 channels per digital card and the ability to use from 4 to 64 cards per system, the V93000 Series platform can scale in the number of pins that it tests simultaneously, from 128 to 2,048 pins, enabling it to test large numbers of devices in parallel. Our V93000 Series platform’s scalability allows a customer to initially buy a V93000 Series platform with just a few test pins and moderate frequency performance capabilities today and then upgrade to more pins and greater frequency performance capabilities as test requirements change.
Our V93000 Series platform’s scalability is enabled by its “tester-per-pin” architecture. SOCs, SIPs and high-speed memory devices are complex and sophisticated, and each device pin may need to be tested independently for a thorough and complete test. Different SOCs, SIPs and high-speed memory devices have
12
Table of Contents
different numbers of pins. By being able to select the number of digital cards and pins in the system, the exact test system can be specified. A single V93000 Series system can test both different types and different numbers of devices by loading different test programs onto the test processor. This ability to quickly change the type and number of devices being tested makes our test systems particularly well suited for subcontractors who test a wide range of products.
Flexibility. Our V93000 Series platform can test a wide range of applications with only one test system. Some competitors require a device manufacturer to switch between different test systems in order to run the tests required for different applications. This is a cumbersome and time-consuming process. Not only can this process take hours to perform, which raises the overall cost of test, but the extra test system required to run the different application tests takes up valuable floor space within the manufacturing facility. In contrast, a single V93000 Series system is able to test the high-speed digital, analog/mixed signal, RF, embedded memory, high-speed memory and high speed interface I/O buses found in a wide range of applications without having to move devices between different test systems. Our V93000 Series platform also supports a number of advanced test methodologies such as BIST, DfT and concurrent test. As a result, our customers can test their portfolio of devices on a single platform, enabling them to cost-effectively address the changing test needs common in the semiconductor industry. This flexibility is particularly well suited to subcontractors, who test a wide variety of products.
In addition to our V93000 Series platform’s ability to adapt to changing test environments, the platform was built to be ready for future requirements. This means as devices get faster, interfaces and specifications of devices change or more capabilities are integrated into devices, the V93000 Series platform can be quickly updated or upgraded to accommodate the new technology as it becomes available. This is important to large, cutting-edge device manufacturers who constantly seek to remain at the head of the technology curve. When companies have to invest in new test systems, rather than simply upgrade their existing systems, their cost of test inevitably increases. The flexibility of the V93000 Series platform means that our customers’ investments in our test platforms are protected as they can continue to use the V93000 Series platform over several generations of products.
Enabled by advanced, innovative test technology. Our V93000 Series platform’s “tester-per-pin” architecture, enabled by its ASIC-based and liquid cooled design, is what makes the platform scalable, flexible and able to achieve high performance and accuracy in a small test platform footprint. Its “tester-per-pin” architecture provides for an ASIC-based test processor which tests each pin of each device, with all test processing done locally and each test processor operating independently. The use of high performance ASICs is what allows the test processors to achieve high performance and test a large number of devices in parallel while being capable of fitting into a test system that occupies a relatively small footprint on the floor of the manufacturing facility.
Our use of liquid cooling technology is another key element of the V93000 Series platform’s design. The combination of the V93000 Series’ “tester-per-pin” architecture and small test platform footprint means that there is a very large number of high performance ASICs concentrated into a small amount of space. Maintaining the test system’s high performance, accuracy and reliability for sustained periods of time in real world operating conditions requires an efficient means of dissipating the considerable amount of heat generated by the high performance ASICs. To address this issue, we introduced our first liquid cooled tester in 1991 and have continued to utilize liquid cooling in the V93000 Series platform because it provides lower operating temperatures, greater system reliability, reduced operating costs, improved accuracy and speed and quieter and cooler operation than the traditional air cooling used in some competitors’ products. As a result, our V93000 Series systems provide our customers with a high-performance and reliable test solution which, when compared to some of our competitors’ air cooled products, utilizes a relatively small amount of space on the semiconductor test floor and is quiet and cool in its operation.
13
Table of Contents
V6000 Series Platform—Flash, SRAM, DRAM and Mixed Memory Test
Our V6000 Series platform, introduced in 2009, is our sixth generation memory test system, and is designed to test flash memory, SRAM, DRAM and mixed memory devices contained in a very wide range of electronic products. It can also test multi-chip packages containing single or multiple types of memory, addressing the emerging use of MCPs to satisfy the increasing memory requirements of consumer electronics devices. Different systems are available that can be optimized for wafer test, final test or engineering development. The flexibility of this platform ensures that customers can test a number of different memory types at different stages of manufacturing, allowing them to change their mix of products without having to change test platforms.
Scalability. Our V6000 Series platform, with its “tester-per-site” architecture, is a highly scalable test solution designed specifically for the testing of memory devices to enable highly parallel and efficient testing to lower customers’ overall cost of test and shorten customers’ time to market. Low cost of test is achieved through testing efficiency and parallelism. Testing more devices in parallel can significantly reduce cost of test, especially in high volume manufacturing, but only if the tester architecture does not result in increased test times. The V6000 Series platform’s “tester-per-site” architecture enables increased parallelism with minimal effect on test time, thus supporting highly parallel tests with high throughput. As a result of the scalability of our V6000 Series platform, customers can buy test systems to meet their current exact requirements at the lowest capital cost, and then upgrade as their test requirements change.
Flexibility. There are fewer pure NOR and NAND flash manufacturers, and the test mix for most manufacturers now includes several different types of memory such as Flash, DRAM and SRAM. In addition, device densities are increasing and use of new test methodologies, such as Reduced Pin Count (RPC), Design for Test (DfT) and BIST, is increasing. The V6000 Series platform has the ability to test Flash, DRAM, SRAM and stacked memory devices on a single platform. This flexibility enables our customers to cost-effectively test a wide range of parts without having to change test platforms. The V6000 family features three fundamental systems: the V6000e for engineering characterization and debug; the V6000WS for wafer sort applications; and the V6000FT for final test of discrete memories or MCPs.
Architecture. The V6000 family is distinguished in its architecture by the Active Matrix Module, which facilitates configurations of up to 18,000 I/O channels without the compromises associated with multiplexing, loss of pin count or loss of functionality. Additionally, the system is scalable in frequency ranges from 140Mbps to 888Mbps. The Active Matrix technology, which is patent pending, provides significant advantages when compared to traditional approaches to memory testers, including:
| • | Better signal fidelity—which equates to production yield; |
| • | Higher parallelism—which equates to production throughput and lower cost of test; |
| • | Better cost efficiency; and |
| • | Parallel reads—which equates to reduced test time and therefore improved production throughput. |
Like our V93000 Series systems, our V6000 Series systems utilize liquid cooling technology that provides them with lower operating temperatures, greater system reliability, reduced operating costs, improved accuracy and speed and quieter and cooler operation than the traditional air cooling used in many of our competitors’ products. In addition to enabling our V6000 Series systems to utilize a relatively small amount of space on the semiconductor test floor and be quiet and cool in the operation compared to some of our competitors’ air cooled products, our liquid cooling technology enables the very high tester density, and hence the high parallelism of test, of our V6000 Series.
14
Table of Contents
V101—Low Cost Test System
Our V101 platform, which was introduced in the third quarter of fiscal year 2009, is designed to test today’s lowest-cost electronic devices—such as 4, 8, and 16-bit MCUs—that are used in a wide-range of communications, data processing, consumer, industrial and military/aerospace products. The extreme low cost and short time-to-market requirements for these products, coupled with the high-mix manufacturing model typically used for these devices drives requirements for tester solutions that can be quickly set up, easily maintained and are provide a very low overall cost of test. Like our other platforms, our V101 is a scalable, flexible platform specifically designed to cost-effectively test 4, 8, and 16-bit MCUs and other low pin count and low cost IC devices.
The V101 is optimized for wafer sort of low-cost devices, and uses a direct probe technology which simplifies set up, provides better signal fidelity and allows for the tester itself to sit above the prober thus eliminating the need for the additional floor space devoted to other testers. We refer to this as a zero footprint solution.
The V101 is based on hardware and software we acquired through the acquisition of Inovys in fiscal year 2008, combined with hardware and other intellectual property from our SOC/SIP product line. The introduction of the V101 marks the successful integration of a key portion of the Inovys products and technology into the Verigy portfolio.
Scalability. The V101 test platform, with its “tester-on-board” architecture, is a highly scalable test solution designed for testing MCUs and other low end consumer devices. Scalability is enabled by the “tester-on-board” architecture. Each “tester-on-board” card has 128 test channels and 8 power supplies, and V101 has a total of eight slots into which these unique tester-on-board cards may be inserted. The V101 can therefore scale from 128 test channels and 8 device power supplies to 1024 test channels and 64 device power supplies. This scalability allows customers can buy V101 with just enough test resources to meet their current test requirements at the lowest capital cost, and then upgrade as their test requirements change.
Flexibility. The V101 test platform can test a wide range of MCU and low end consumer devices. The V101 includes a Versatile Digital Instrument architecture consisting of test channels, power supplies, reference voltages and parametric measurement units. The V101 is capable of testing digital as well as embedded ADC analog functions. As a result, our customers can test a wide array of MCU or low end consumer devices on the same V101 platform.
Enabled by Advanced Technology. The V101 uses tester-on-board architecture for cost effective performance, simplifying the tester hardware, configuration and system support. The architecture places digital and power resources directly on the board, providing more accurate power resources, and enabling multi-site efficiency with high throughput and at lower test costs. The tester-on-board architecture is a modular design using standardized components for reliable hardware, ease-of-maintenance and easy installation. The V101 test system features Verigy’s award winning Stylus operating system software, which offers an easy to learn programming environment and shortens program development time with direct industry standard EDA links. Standard test interface language (“STIL”) based test programming simplifies test conversions from other STIL based programs and helps to significantly reduce program development time.
DfX Solutions
Verigy’s DfX product family provides innovative solutions for design debug, failure analysis and yield learning for complex semiconductor devices and processes. These solutions are designed to quickly identify design and/or process issues that arise as devices move from design to fabrication and can significantly impact device performance and yield, particularly for advanced designs utilizing sub 65-nanometer geometries. The traditional approach to diagnosing these failures is generally time consuming, sometimes taking up to several
15
Table of Contents
weeks, and have limited capacity to determine exactly where on a device—and why—the failure is occurring. The Verigy solutions enable diagnosis to start at the time the failure is first detected, allowing for more rapid resolution, and provide specific details about the failures detected.
Verigy currently provides two primary solutions to address these problems: Silicon Debug and Yield Learning, both of which operate in conjunction with our V93000 tester. The Silicon Debug solution helps customers shorten the time to debug and characterize new devices by diagnosing failures in the device using advanced scan test techniques. This analysis is primarily performed on the V93000 in the product engineering laboratory. The Yield Learning Solution was introduced in the second half of fiscal 2009. This solution helps customers accelerate the time to full production yield and to monitor for yield discrepancies using the V93000 at wafer test in the production flow. The solution comprises the V93000 running specific test algorithms to detect electrical failures at wafer test then map them to physical locations on the wafer/die using offline analysis tools to enable diagnosis to be completed through physical failure analysis techniques.
Touchdown Technologies—advanced memory probe cards
On June 15, 2009, Verigy, completed the acquisition of substantially all of the assets of Touchdown Technologies, Inc. Touchdown develops, manufactures and sells advanced, MEMS (micro electro-mechanical switch) based probe cards used in wafer-sort testing of memory devices. Probe cards are used in conjunction with memory testers, and establish the final physical and electrical connection between the tester and the wafer being tested. Unlike testers, which may be used to test many different device types during their active service life, probe cards are designed for the specific devices being tested, and must be replaced to test different devices. This consumable market, for advanced memory probe cards, is estimated by VLSI Research to be approximately $500 million in 2010.
Touchdown’s family of probe cards addresses the needs of the flash (including both NAND and NOR applications) and DRAM markets. Touchdown’s existing products include:
| • | For Flash: |
| • | Td110 ACCU-TORQ™ probe cards for testing high pin count, small die NOR wafers; |
| • | Td160 ACCU-TORQ™ probe cards for testing full pin count on NAND wafers; |
| • | For DRAM: |
| • | Td110 ACCU-TORQ™ probe cards for testing DRAM applications use a specially designed probe and an exceptionally high performance proprietary interposer capable of meeting challenging DRAM applications. |
| • | Td300 ACCU-TORQ™ probe cards for DRAM are capable of testing 300mm DRAM wafers in six or fewer touchdowns thus improving test floor throughput. |
Touchdown has also developed custom 200 and 300 millimeter (“mm”) cards which are currently being evaluated by potential customers. Touchdown’s unique one piece 300 mm substrate offers the advantage of lower cost and greatly simplifies the complex task of achieving probe planarization, which ensures that the probe points are in a parallel plane to the wafer.
Touchdown’s probe cards may be used with Verigy memory testers as well as with testers supplied by our competitors. In order to cause the least disruption with the opportunities for Touchdown to sell probe cards for systems made by Verigy competitors and to enable Verigy to continue to work with other probe card companies as appropriate, Touchdown is operated as an independent subsidiary.
Although Touchdown did not contribute material revenues to Verigy during fiscal year 2009 and is not expected to generate material revenues until the second half of fiscal year 2010, we believe that in the long term the ability to offer customers the opportunity to purchase testers and probe cards from a single vendor will provide us with a competitive advantage.
16
Table of Contents
Test and Application Expertise, Services and Support
Our worldwide service organization performs a wide variety of services for our customers, including professional test expertise services and total system support and professional services. Professional services include value-added, proactive services such as yield optimization and test program development assistance. On a global basis, we provide expertise across a wide range of applications to assist our customers in quickly delivering their new, feature-rich products to the market. System support includes ongoing and reactive services such as repair, calibration and relocation as well as education and training.
We strive to provide high levels of support and services through the life-cycle of our products. To this end, generally we provide a standard one-year warranty which can be extended by our customers on an annual basis.
Introduction of New Platform Families
We believe that our test platforms are among the most highly scalable platforms in the semiconductor test industry. At the same time, in an effort to keep our test platforms as technologically advanced as possible, we have in the past introduced and expect to introduce in the future new test platforms, such as our introduction in fiscal year 2009 of our V6000 platform which succeeds our V5000 family and the introduction in 1999 of the V93000 Series platform which succeeded our 83000 Series. As with the V101, we may also from time to time introduce entirely new platform families to address markets not served by products in our portfolio. We also expect that, from time to time, we may make upgrades to our test platforms that are so significant that upgrading older platform versions through simply replacing the test electronics will not be cost effective. While these new introductions and significant upgrades give our platforms a finite lifespan as the technology in devices being tested continues to advance, we generally provide continued support for our test platforms for a number of years after we have introduced a new or upgraded test platform and believe that we offer among the most scalable test platforms in the semiconductor test industry, enabling manufacturers to purchase only the amount and performance level of hardware that they are able to use while retaining the ability to upgrade that hardware as the need arises later.
Research and Development
Our scalable platform architectures provide for operating model efficiencies such as streamlined research and development and a more efficient engineering team. Our research and development strategy focuses on designing test solutions that lower the overall cost of test for semiconductor designers and manufacturers. We strive to design high performance, low overall cost per test semiconductor test equipment that has high throughput, scalability and flexibility and is efficient to manufacture, easy to use and simple to support.
From our history as part of Agilent, which was part of HP until its spin-off in 1999, we have a legacy of introducing new and innovative designs to market. We have a highly structured approach to optimize research and development efficiency. A group of internal advisors formulates a long-term technology plan with clear objectives. Through our direct engagement with customers, high-priority projects are identified and appropriate resources are allocated. Engineering resources are organized by area of competence to effectively develop expertise and to share technologies across product lines.
Our primary development center for SOC/SIP/high-speed memory test solutions is in Boeblingen, Germany, and our primary development center for memory test solutions is in Cupertino, California. The V101 system was a joint development effort of teams based in Boeblingen, Germany, Shanghai, China, and Pleasanton, California. Our test processor and ASIC development is done in Colorado for both SOC/SIP/high-speed memory and memory test solutions, where we have a center of core competency in very large scale integration SOC design.
Our expenditures for research and development for fiscal years 2009, 2008 and 2007 were $92 million, $103 million and $91 million, representing 28.5%, 14.9% and 12.0% of net revenue in each year, respectively.
17
Table of Contents
Sales and Support
We employ a direct worldwide sales and support model that enables us to meet strategic support commitments. Our experienced sales personnel have the knowledge to address the technical benefits as well as the economic advantages of our systems. Our sales organization is tightly integrated with our services and support organization, which allows us to better understand our customers’ needs and to tailor solutions to meet those needs. We believe an ongoing service and support business is critical to providing sustained value to customers and maintaining customer loyalty.
We sell our products and services directly to our customers. We have established specialized sales and services teams to meet the needs of our different types of customers, including IDMs, subcontractors and fabless design companies. Our sales organization is structured to foster collaboration between us and our customers. This collaboration allows us to better address our customers’ semiconductor test needs and positions us to help IDMs find solutions to their outsourced provider requirements and to help introduce subcontractors to IDMs who may need their services.
Applications engineers work as part of the sales team before a sale is made and assist customers in the use of the product after a sale is made. In the pre-sale role they provide in-depth technical communication with customers, writing complex test programs and performing demonstrations to show how our products solve specific test problems. Post-sale, our sales team assists in the creation of test programs and in the integration of the test cell into the customer’s environment. We believe that the quality of our applications sales force is a key differentiator in our ability to generate sales and provide customer satisfaction.
For our largest customers, we have dedicated global account managers with dedicated account teams. Account managers are responsible for both sales performance and customer satisfaction. We recognize that we must have strong, long-term customer relationships to grow our business over the semiconductor cycle. For that reason, each account manager is specifically responsible for the general relationship with the customer, including the coordination and preparation of technology roadmap exchanges. The account manager is also responsible for the support services for that account and achieving a high level of customer satisfaction.
Customers
Our customers are broadly distributed across geographic and product markets. In fiscal year 2009, one customer, Taiwan Semiconductor Manufacturing Company Limited, accounted for more than 10% of our revenue. In fiscal year 2008, one customer, ASE Group, accounted for more than 10% of our net revenue. In fiscal year 2007, two customers, ChipMos Technologies (Bermuda) Ltd. and Spansion Inc., each accounted for more than 10% of our net revenue.
We derive a significant percent of our net revenue from outside the North America. Historically, we have provided revenue by geography based on where the revenue is billed versus where the products are shipped. We are now reporting revenue by geography based on where the products are shipped. The amounts for fiscal years 2008 and 2007 were reclassified to conform to the presentation used for fiscal year 2009.
The following table illustrates the breakdown of our revenue by geography.
| Year Ended October 31, | ||||||||||||
| 2009 | 2008 | 2007 | ||||||||||
| ($ in millions) | ||||||||||||
| North America |
$ | 59 | $ | 100 | $ | 166 | ||||||
| As a percent of total net revenue |
18.3 | % | 14.5 | % | 21.8 | % | ||||||
| Europe |
$ | 31 | $ | 42 | $ | 32 | ||||||
| As a percent of total net revenue |
9.6 | % | 6.1 | % | 4.2 | % | ||||||
| Asia |
$ | 233 | $ | 549 | $ | 563 | ||||||
| As a percent of total net revenue |
72.1 | % | 79.4 | % | 74.0 | % | ||||||
| Total net revenue |
$ | 323 | $ | 691 | $ | 761 | ||||||
18
Table of Contents
Although we continued to have significant revenues in North America in fiscal year 2009, we expect the trend of an increasing portion of our revenue coming from customers located in the Asia region to continue as semiconductor manufacturing activities continue to concentrate in that region.
Manufacturing
Through June 2006, we relied upon two manufacturing models: an internal final integration and test model for our V93000 Series products and a completely outsourced integration model with a contract manufacturer for our V5000 Series products. The manufacture of sub-assemblies was outsourced to several contract manufacturers for both the V93000 and V5000 Series products. In connection with our separation from Agilent in June 2006, we transitioned the final integration and test processes for the V93000 Series platform products that we previously conducted internally to Flextronics Telecom Services Ltd. (“Flextronics”).
As of October 31, 2008, Flextronics was manufacturing our V5000 Series platform in China, our volume V93000 Series platform in China, and our high complexity V93000 Series products in Germany. During fiscal year 2009, we began to transition our principal manufacturing activities from Flextronics in China to Jabil Circuits, Inc. (“Jabil”) in Penang, Malaysia. The transition is currently under way, and is expected to be completed during the first half of fiscal year 2010. We believe that between the capacity ramping up at Jabil and the capacity remaining at Flextronics during the wind-down, we have sufficient final test and assembly capacity to meet anticipated demand.
Although we now rely entirely on contract manufacturers, we continue to maintain direct relationships with our key component suppliers and to control procurement of critical system components. This allows us to respond more quickly to changes in market demand and assure availability of parts. Effective component procurement is also critical to product quality, manufacturing cycle time and cost. We believe that the timely availability of low-cost, quality components provided by our planning and procurements teams, coupled with the large and variable capacity of our contract manufacturers, is an effective manufacturing strategy for our cyclical market.
Our quality assurance program focuses on continuous improvement in product quality. Engineering teams assess quality at critical manufacturing stages to identify potential problems. Manufacturing engineers work with our contract manufacturers to fine-tune the production process, improve quality and efficiency and solve problems as they arise. Customer service personnel extend the quality process into the field by monitoring the quality and reliability of systems at customer sites.
Competition
There has been considerable consolidation of semiconductor test companies during recent years. Teradyne acquired both NexTest Systems and Eagle Test Systems, and LTX Corporation merged with Credence Systems Corporation to form LTX-Credence Corporation. Notwithstanding the consolidation, the market for semiconductor test system is highly competitive, rapidly evolving and subject to changing technology, customer needs and new product introductions. Moreover, the economic downturn that began in late 2008 and has continued through 2009 has dramatically reduced the level of investment in semiconductor test equipment and has rendered the competition for the reduced level of business more intense.
We face substantial competition throughout the world in each of our product areas. In certain regions, Korea for example, local companies are being formed that threaten our ability to compete successfully in that region. Our primary competitors include Advantest Corporation, LTX-Credence Corporation, Teradyne, Inc. and Yokogawa Electric Corporation. We also compete with products developed internally by our customers.
The competitive factors affecting the market for our products include:
| • | product performance, features and functionality; |
| • | price; |
19
Table of Contents
| • | scalability; |
| • | flexibility; |
| • | reliability; |
| • | technical service and support; |
| • | quality and availability of supporting hardware and software; |
| • | size of installed base; and |
| • | the level of training and customer support provided. |
We believe that we compete effectively with our competitors on the basis of these factors. Our ability to remain competitive will depend to a great extent upon our ongoing performance in the areas of product development and customer support. To be successful in the future, we believe that we must respond promptly and effectively to the challenges of technical change and our competitors’ innovations by continually enhancing our product offerings.
Employees
As of October 31, 2009, we had approximately 1,500 employees, of which approximately 470 were located in Europe, approximately 530 were located in Asia and approximately 500 were located in North America. Of our total employees, approximately 380 were principally dedicated to research and development, 340 were dedicated to sales, general and administrative, 610 were dedicated to customer service, marketing and applications, and 170 were dedicated to manufacturing, service and support, order fulfillment and quality assurance. We consider our relationship with our employees to be good. None of our domestic employees is represented by a labor union or covered by a collective bargaining agreement, although works councils exist in various foreign jurisdictions where we have employees.
Backlog
At October 31, 2009, and 2008, Verigy’s backlog of unfilled orders for products and services were as follows:
| Year Ended October 31, | ||||||
| 2009 | 2008 | |||||
| (in millions) | ||||||
| Products backlog |
$ | 49 | $ | 43 | ||
| Services backlog |
55 | 75 | ||||
| Total backlog |
$ | 104 | $ | 118 | ||
We define products backlog as systems for which we have received purchase orders which we have not yet delivered, but we expect to deliver within six months of our fiscal period end. We define services backlog as total outstanding orders for product support and services not yet rendered. We expect approximately 80% of our services backlog as of October 31, 2009 to be fulfilled within twelve months of our fiscal year end.
While backlog is calculated on the basis of open orders, such orders may be subject to cancellation or delay by the customer with limited or no penalty. Our backlog at any particular date, therefore, is not necessarily indicative of actual sales which may be generated for any succeeding period. Historically, our backlog levels have fluctuated based upon the ordering pattern of our customers and limitations in our manufacturing capacity.
20
Table of Contents
Intellectual Property
We do not depend on any individual patent but, instead, rely on a combination of patents, copyrights, trademarks, trade secrets, know how, confidentiality provisions and licensing arrangements to establish and protect our proprietary rights. We may be required to spend significant resources to monitor and protect our intellectual property rights. We may not be able to detect infringement and may lose our competitive decision in the market before we do so. In addition, competitors may design around our technology or develop competing technologies. Intellectual property rights may also be unavailable or limited in some foreign countries, which could make it easier for competitors to capture market share. We often rely on licenses of intellectual property useful for our business. We cannot be sure that these licenses will be available in the future on favorable terms or at all.
Financial Information about Geographic Areas
For information on the geographic concentration of our net revenues and long-lived assets, please see Note 24, “Segment and Geographic Information” of our consolidated financial statements.
Investor Information
We are subject to the reporting requirements of the Securities Exchange Act of 1934 (the “Exchange Act”). Therefore, we file periodic reports, proxy statements and other information with the Securities and Exchange Commission (the “SEC”). Such reports, proxy statements and other information may be obtained by visiting the Public Reference Room of the SEC at 100 F Street N.E., Washington, D.C. 20549 or by calling the SEC at 1-800-SEC-0330. In addition, the SEC maintains an Internet site ( http://www.sec.gov ) that contains reports, proxy and information statements and other information regarding issuers that file electronically.
You can access our financial and certain other information at our Investor Relations website. The address is http://investor.verigy.com.
The charters of our Audit Committee, Compensation Committee, Nominating and Governance Committee, as well as our Standards of Business Conduct (including code of ethics provisions that apply to our principal executive officer, principal financial officer, controller and senior financial officers) are available on our website at http://investor.verigy.com/governance.cfm under “Documents and Charters”. This information is also available to shareholders by writing to us at the address on the cover of this Annual Report on Form 10-K.
| Item 1A. | Risk Factors |
Set forth below and elsewhere in this report on Form 10-K and in other documents we file with the SEC, are risks and uncertainties that could cause actual results to differ materially from the results expressed or implied by the forward-looking statements contained in this Annual Report. You should carefully consider the risks described below and the other information in this report before investing in our ordinary shares. Our business could be seriously harmed by any of these risks. The trading price of our ordinary shares could decline due to any of these risks, and you may lose all or part of your investment.
Risks Relating to Our Business
Current global economic conditions may continue to adversely affect our business.
Our operations and financial results depend on worldwide economic conditions and their impact on levels of business spending, which have deteriorated significantly in many countries and regions and may remain depressed for the foreseeable future. A sharp drop in demand and uncertainties in the financial and credit markets have caused our customers to postpone deliveries of ordered systems and placement of new orders. As a result, our revenues for fiscal year 2009 declined to $323 million, a 53.3% decrease from the $691 million recorded in fiscal year 2008. Continued uncertainties may continue to affect sales of our products and services.
21
Table of Contents
Throughout fiscal year 2009, the semiconductor industry experienced a severe downturn that has driven companies to reassess their use of cash and has negatively impacted consumer confidence. Many of our customers have undertaken or announced restructuring activities and significant cost cuts to their capital spending budgets. These factors have caused our customers to delay test system purchases. If the market conditions do not improve or they deteriorate and we continue to incur losses, we may experience increased collection times and greater write-offs, either of which could have a material adverse effect on our cash flow and liquidity.
In addition, the tightening of credit markets and concerns regarding the availability of credit may make it more difficult for our customers to raise capital, whether debt or equity, to finance their purchases of capital equipment, including the products we sell. Delays in our customers’ ability to obtain financing, or the unavailability of financing, would adversely affect our product sales and revenues and therefore harm our business and operating results.
Our business and operating results could be harmed by the highly cyclical nature of the semiconductor industry.
Our business and operating results depend in significant part upon capital expenditures of semiconductor designers and manufacturers, which in turn depend upon the current and anticipated market demand for products incorporating semiconductors from these designers and manufacturers. Historically, the semiconductor industry has been highly cyclical with recurring periods of diminished product demand. During these periods, semiconductor designers and manufacturers, facing reduced demand for their products, have significantly reduced their capital and other expenditures, including expenditures for semiconductor test equipment and services such as those we offer. Furthermore, because we have a high proportion of customers that are subcontractors, which during market downturns tend to reduce or cancel orders for new test systems and test services more quickly and dramatically than other customers, any downturn may cause a quicker and more significant adverse impact on our business than on the broader semiconductor industry. As a consequence, during these periods, we have experienced significant reductions in new orders for the products and services we offer, postponement or cancellation of existing customer orders, erosion of selling prices and write-offs of excess and obsolete inventory and related charges for liabilities to our contract manufacturing partners. The downturn we experienced in fiscal year 2009 went beyond the normal cycles of the semiconductor industry, and seemed to be driven by the overall global economic conditions. We expect our business to continue to be subject to cyclical downturns even when the overall economic conditions improve.
Our quarterly operating results may fluctuate significantly from period to period, and this may cause our share price to decline.
In the past, we have experienced, and in the future we expect to continue to experience, fluctuations in revenue and operating results from quarter to quarter for a variety of reasons. For example, sales of a relatively limited number of our test systems account for a substantial portion of our net revenue in any particular quarter. At the same time, our costs are relatively fixed in the short-term. Thus, changes in the timing or terms of a small number of transactions could disproportionately affect our operating results in any particular quarter. In addition, a substantial portion of our quarterly sales have historically been made in the last month of the quarter, and a substantial portion of those sales occur in the last week of the quarter. The timing of theses sales at the end of the quarter increases the risk of unanticipated variations in quarterly results. As a result of these and other risks described elsewhere in this report, we believe that quarter-to-quarter comparisons of our revenue and operating results may not be meaningful, and that these comparisons may not be an accurate indicator of our future performance. If our operating results in one or more future quarters fail to meet the expectations of securities analyst or investors, an immediate and significant decline in the trading price of our ordinary shares may occur.
22
Table of Contents
We cannot ensure that our cost saving actions will be sufficient to attain or sustain profitability.
In fiscal year 2009, we implemented restructuring actions to streamline our organization and further reduce operating costs in order to address the cyclical downturn in both the memory and SOC businesses. Among other things, our restructuring actions included reducing our global workforce, which may impair our ability to effectively develop and market products, to remain competitive in the markets in which we compete and to operate effectively. Our cost saving actions could have long-term effects on our business by reducing our pool of technical talent, decreasing or slowing improvements in our products, making it more difficult for us to respond to customers, limiting our ability to increase production quickly if and when the demand for our products increases and limiting our ability to hire and retain key personnel. We cannot ensure that our cost saving actions will be sufficient to attain or sustain profitability.
We have a limited ability to quickly or significantly reduce our costs, which makes us particularly vulnerable to the highly cyclical nature of the semiconductor industry.
Historically, downturns in the semiconductor industry have affected the test equipment and services market more significantly than the overall semiconductor industry. A significant portion of our overall costs are fixed. Because a high proportion of our costs are fixed, we have a limited ability to reduce expenses and inventory purchases quickly in response to decreases in orders and revenues. Moreover, to remain competitive even during downturns in the semiconductor industry or generally, we must maintain a significant level of costs, including fixed costs. As a consequence, the actions we have taken to reduce costs, and similar actions we may take in future downturns, may not be sufficient to attain or sustain profitability.
Our dependence on sole source suppliers may prevent us from delivering our products on a timely basis.
We rely on sole source suppliers, some of whom are relatively small in size, for many of the components we use in our products, including custom integrated circuits, relays and other electronic components. In the past, we experienced, and in the future may experience, delays in shipping our products due to our dependence on sole source suppliers. Failure of our sole source suppliers to meet our requirements in a timely manner could impair our ability to ship products and to realize the related revenues when anticipated, which could adversely affect our business and operating results.
We are dependent on contract manufacturers with whom we do not have long-term contracts, and changes to those relationships, expected or unexpected, may result in delays or disruptions that could cause us to lose revenue and damage our customer relationships.
We rely entirely on contract manufacturers, including Jabil, Zollner and Flextronics. Our reliance on contract manufacturers gives us less control over the manufacturing process and exposes us to significant risks, including limited control over capacity, late delivery, quality and costs. Moreover, because our products are very complex to manufacture, transitioning manufacturing activities from one location to another, or from one manufacturing partner to another, is complicated. Although we have contracts with our contract manufacturers, those contracts do not require them to manufacture our products on a long-term basis in any specific quantity or at any specific price. In addition, it is time consuming and costly to qualify and implement additional contract manufacturer relationships. Therefore, if we fail to effectively manage our contract manufacturer relationships or if one or more of them should experience delays, disruptions or quality control problems, or if we had to change or add additional contract manufacturers or contract manufacturing sites, our ability to ship products to our customers could be delayed.
During fiscal year 2009, we began to transition our principal manufacturing activities from Flextronics in China to Jabil’s facility in Penang, Malaysia. We expect the transition from Flextronics to Jabil to be substantially complete during the first half of fiscal year 2010. If Jabil is unable to meet our manufacturing
23
Table of Contents
requirements in a timely manner, whether as a result of transitional issues or otherwise, our ability to ship products and to realize the related revenues when anticipated could be materially impacted. In addition, we may incur additional costs as part of this transition.
The market for semiconductor test equipment and services is highly concentrated, and we have limited opportunities to sell our test equipment and services.
The semiconductor industry is highly concentrated in that a small number of semiconductor designers and manufacturers and subcontractors account for a substantial portion of the purchases of semiconductor test equipment and services generally, including our test equipment and services. For the year ended October 31, 2009, revenue from our top ten customers accounted for approximately 56.4% of our total net revenue, with one customer individually accounting for more than 10% of our total net revenue. Consolidation in the semiconductor industry is increasing this concentration. Accordingly, we expect that sales of our products will continue to be concentrated with a limited number of large customers for the foreseeable future. Our financial results will depend in large part on this concentrated base of customers’ sales and business results. Our relationships with our significant customers, who frequently evaluate competitive products prior to placing new orders, could be adversely affected by a number of factors, including:
| • | a decision by our customers to purchase test equipment and services from our competitors; |
| • | a decision by our customers to pursue the development and implementation of self-testing integrated circuits or other strategies that reduce their need for our products; |
| • | the loss of market share by our customers in the markets in which they operate; |
| • | the shift by our IDM customers to out-sourced manufacturing models; |
| • | our ability to keep pace with changes in semiconductor technology; |
| • | our ability to maintain quality levels of our equipment and services that meet customer expectations; |
| • | our ability to produce and deliver sufficient quantities of our test equipment in a timely manner; and |
| • | our ability to provide quality customer service and support. |
In addition, the global economic downturn in fiscal year 2009 caused significant disruption among the semiconductor manufacturing companies, including our customers. Two customers, Qimonda and Spansion, filed for protection under applicable bankruptcy laws. The loss of a significant customer, whether as a result of a failure or consolidation, will further concentrate, and could adversely impact, the market for our products.
If we do not maintain and expand existing customer relationships and establish new customer relationships, our ability to generate revenue growth will be adversely affected.
Our ability to increase our sales will depend in large part upon our ability to obtain orders for new test systems, enhancements for existing test systems and services from our existing and new customers. Maintaining and expanding our existing relationships and establishing new ones can require substantial investment without any assurance from customers that they will place significant orders. Moreover, if we are unable to provide new test systems, enhancements for existing test systems and services to our customers in a timely fashion or in sufficient quantities, our business will be harmed. In the past we have experienced, and in our industry it is not unusual to experience, difficulty in delivering new test equipment, as well as product enhancements and upgrades. When we encountered difficulties in the past, our customer relationships and our ability to generate additional revenue from customers were harmed. Our inability to meet the demands of customers would severely damage our reputation, which would make it more difficult for us to sell test equipment, enhancements and services to existing, as well as new, customers and would adversely affect our ability to generate revenue.
24
Table of Contents
In addition, we face significant obstacles in establishing new customer relationships. It is difficult for us to establish relationships with new customers because such companies may have existing relationships with our competitors, may be unfamiliar with our product and service offerings, may have an installed base of test equipment sufficient for their current needs or may not have the resources necessary to transition to, and train their employees on, our test equipment. Even if we do succeed in establishing new relationships, these new customers may nonetheless continue to favor our competitors, as our competitors may have had longer relationships with these customers or may maintain a larger installed base of their competing test equipment in the facilities of new customers and only purchase limited quantities from us. In addition, we could face difficulties in our efforts to develop new customer relationships abroad as a result of buying practices that may favor local competitors or non-local competitors with a larger presence in local economies than we have. As a result, we may be forced to partner with local companies in order to compete for business and such arrangements, if available, may not be achieved on economically favorable terms, which could negatively affect our financial performance.
Failure to accurately estimate our customers’ demand and plan the production of our new and existing products could adversely affect our inventory levels and our income.
Given the cyclical nature of the semiconductor industry, we cannot reliably forecast the timing and size of our customers’ orders. In order to meet anticipated demand, we must order components and build some inventory before we actually receive purchase orders, which includes inventory at our contract manufacturers and suppliers where we have non-cancelable purchase commitments. Our results could be harmed if we do not accurately estimate our customers’ product demands and are unable to adjust our purchases with market fluctuations, including those caused by the cyclical nature of the semiconductor industry. During a market upturn, our results could be materially and adversely affected if we cannot increase our purchases of components, parts and services quickly enough to meet increasing demand for our products, including securing sufficient capacity from our contract manufacturers. During a market downturn, we could have excess inventory that we would not be able to sell, resulting in inventory write-downs and in potential related liabilities to our contract manufacturing partners. For the year ended October 31, 2009, we recorded gross inventory-related provisions of $25 million, as a result of the global economic conditions and the downturn in the semiconductor industry. Having insufficient or excess inventory could have a material adverse effect on our business, financial condition and results of operations.
Further, if we do not successfully manage the introduction of our new products and estimate customer demand for such products, our ability to sell existing inventory may be adversely affected. If demand for our new products exceeds our projections, we might have insufficient quantities of products for sale to our customers, which could cause us to miss opportunities to increase revenues during market upturns. If our projections exceed demand for our new products or if some of our customers cancel their current orders for our old products in anticipation of our new products, we may have excess inventories of our new products and excess obsolete inventories, which could result in material future inventory write-downs that would adversely affect our financial performance.
Existing customers may be unwilling to bear expenses associated with transitioning to new and enhanced products.
In order to grow our business, we need to sell new and enhanced products. Certain customers may be unwilling, or unable, to bear the costs of implementing new test equipment platforms or enhancements, particularly during semiconductor industry downturns. As a result, it may be difficult to market and sell these products and customers may continue to buy upgrades to older existing product lines which may be a lower cost alternative. As we introduce new test equipment and enhancements, we cannot predict with certainty when or if our customers will transition to those new product platforms. Any delay in or failure of our customers to transition to new products and enhancements could result in excess inventories, which could result in inventory write-downs that would adversely affect our financial performance.
25
Table of Contents
If we do not introduce new test equipment platforms and upgrade existing test equipment platforms in a timely manner, and if we do not offer comprehensive and competitive services for our test equipment platforms, our test equipment and services will become obsolete, we will lose existing customers and our operating results will suffer.
The semiconductor design and manufacturing industry into which we sell our test equipment is characterized by rapid technological changes, frequent new product introductions, including upgrades to existing test equipment, and evolving industry standards. The success of our new or upgraded test equipment offerings will depend on several factors, including our ability to:
| • | properly identify customer needs and anticipate technological advances and industry trends, such as the disaggregation of the traditional IDM semiconductor supply chain into fabless design companies, foundries and packaging, assembly and test providers; |
| • | develop and commercialize new and enhanced technologies and applications that meet our customers’ evolving performance requirements in a timely manner; |
| • | develop and deliver enhancements and related services for our current test equipment that are capable of satisfying our customers’ specific test requirements; and |
| • | introduce and promote market acceptance of new test equipment platforms, such as our V6000 Series system for memory testing. |
In many cases, our test equipment and services are used by our customers to develop, test and manufacture their new products. We therefore must anticipate industry trends and develop new test equipment platforms or upgrade existing test equipment platforms in advance of the commercialization of our customers’ products. In addition, new methods of testing integrated circuits, such as self-testing integrated circuits, may be developed which would render our test equipment uncompetitive or obsolete if we failed to adopt and incorporate these new methods into our new or existing test equipment platforms. Developing new test equipment platforms and upgrading existing test equipment platforms requires a substantial investment before we can determine the commercial viability of the new or upgraded platform.
As our customers’ product requirements are diverse and subject to frequent change, we also need to ensure that we have an adequate mix of products that meet our customers’ varying requirements. If we fail to adequately predict our customers’ needs and technological advances, we may invest heavily in research and development of test equipment that does not lead to significant revenue, or we may fail to invest in technology necessary to meet changing customer demands. Without the timely introduction of new or upgraded test equipment that reflects technological advances, our test equipment and services would likely become obsolete, we may have difficulty retaining customers and our revenue and operating results would suffer.
Our long and variable sales cycle depends upon factors outside of our control, and we may expend significant time and resources prior to our ever earning associated revenues.
Sales of our semiconductor test equipment and services depend in significant part upon semiconductor designers and manufacturers upgrading existing manufacturing equipment to accommodate the requirements of new semiconductor devices and expanding existing, and adding new, manufacturing facilities. As a result, our sales are subject to a variety of factors we cannot control, including:
| • | the complexity of our customers’ fabrication processes, which impacts the number of our test systems and amount of our product enhancements and upgrades our customers require; |
| • | the willingness of our customers to adopt new or upgraded test equipment platforms; |
| • | the internal technical capabilities and sophistication of our customers, which impacts their need for our test services; and |
| • | the capital expenditures of our customers. |
26
Table of Contents
The decision to purchase our equipment and services generally involves a significant commitment of capital. As a result, our test equipment has lengthy and variable sales cycles during which we may expend substantial funds and management effort to secure a sale prior to receiving any commitment from a customer to purchase our test equipment or services. Prior to completing sales to our customers, we are often subject to a number of significant risks, including the risk that our competitors may compete for the sale or that the customer may change its technological requirements. Our business, financial condition and results of operations may be materially adversely affected by our long and variable sales cycle and the uncertainty associated with expending substantial funds and effort with no guarantee that sales will be made.
We face substantial competition which, among other things, may lead to price pressure and adversely affect our sales and revenue.
We face substantial competition throughout the world in each of our product areas. Our most significant competitors historically have included Advantest Corporation, LTX-Credence Corporation, Teradyne, Inc. and Yokogawa Electric Corporation. Some of our competitors have substantially greater financial resources, broader product offerings, more extensive engineering, manufacturing, marketing and customer support capabilities or a greater presence in certain countries than we do. We may have less leverage with component vendors than some of our competitors. Also, some of our competitors have greater resources and may be more willing or able than we are to put capital at risk to win business. Price reductions by our competitors may force us to lower our prices. We also expect our current competitors to continue to improve the performance of their current products and to introduce new products, technologies or services that could adversely affect sales of our current and future test equipment and services. Additionally, current and future competitors may introduce testing technologies, equipment and services, which may in turn reduce the value of our own test equipment and services. Any of these circumstances may limit our opportunities for growth and negatively impact our financial performance.
Test systems that contain defects that harm our customers could damage our reputation and cause us to lose customers and revenue.
Our test equipment is highly complex and employs advanced technologies. The use of complex technology in our test equipment increases the likelihood that we could experience design, performance or manufacturing problems. If any of our products have defects or reliability or quality problems, we may, in some circumstances, be exposed to liability, our reputation could be damaged significantly and customers might be reluctant to buy our products, which could result in a decline in revenues, an increase in product returns, loss of existing customers and the failure to attract new customers.
We may face competition from Agilent.
Pursuant to the intellectual property matters agreement between us and Agilent that was entered into in connection with our separation from Agilent, Agilent transferred all of the intellectual property rights Agilent held that relate exclusively to our products to us and agreed that, prior to October 31, 2009, it would not to develop, manufacture, distribute, support or service automated test equipment for providing high-volume functional test of integrated circuits (“ICs”) (including memory and high-speed memory devices and SOCs) or SIPs, or components for automated semiconductor test systems. There were certain exceptions to Agilent’s agreement not to compete, and Agilent retained and only licensed to us the intellectual property rights to underlying technologies used in both our products and the products of Agilent.
With the expiration of the agreement not to compete on October 31, 2009, Agilent is now free to compete with any portion or all of our business without restriction, and in doing so will be free to use the retained underlying technologies. Agilent will not be permitted to use the intellectual property rights transferred to us, and licensed from us back to Agilent, to compete with us with respect to our core business of developing, manufacturing, selling and supporting automated semiconductor test systems. Agilent will, however, be able to use such intellectual property rights to develop and sell components for such systems, including systems
27
Table of Contents
developed and sold by us as well as those developed and sold by our competitors. While selling components has not represented a material portion of our business in the past and is not expected to be an area of focus for the near future, our business could be adversely affected if systems offered by our competitors become more competitive as a result of Agilent supplying components for our competitors’ systems or if, by buying components from Agilent, our customers are able to delay or bypass altogether purchasing newer systems from us.
Third parties may compete with us by using intellectual property that Agilent licensed to us under the intellectual property matters agreement.
Under the intellectual property matters agreement, Agilent retained and only licensed to us the intellectual property rights to underlying technologies used in both our products and the products of Agilent. Under the agreement, Agilent remains free to license the intellectual property rights to the underlying technologies to any party, including our competitors. The intellectual property that Agilent retained and that can be licensed in this manner does not relate solely or primarily to one or more of our products, or groups of products, rather, the intellectual property that Agilent licensed to us is generally used broadly across our entire product portfolio. Competition by third parties using the underlying technologies retained by Agilent could harm our business and operating results.
Third parties may claim we are infringing their intellectual property, and we could suffer significant litigation or licensing expenses or be prevented from selling our products or services.
Our industry has been and continues to be characterized by uncertain and conflicting intellectual property claims and vigorous protection and pursuit of these rights. As a result, third parties may claim that we are infringing their intellectual property rights, and we may be unaware of intellectual property rights of others that may cover some of our technology, products and services. Any litigation regarding patents or other intellectual property could be costly and time-consuming, and divert our management and key personnel from our business operations. The complexity of the technology involved and the uncertainty of intellectual property litigation increase these risks. Claims of intellectual property infringement might also require us to enter into costly royalty or license agreements. However, we may not be able to obtain royalty or license agreements on terms acceptable to us, or at all. We also may be subject to significant damages or injunctions against development and sale of certain of our products and services.
Third parties may infringe our intellectual property, and we may expend significant resources enforcing our rights or suffer competitive injury.
Our success depends in large part on our proprietary technology. We rely on a combination of patents, copyrights, trademarks, trade secrets, confidentiality provisions and licensing arrangements to establish and protect our proprietary rights. If we fail to protect our intellectual property rights, our competitive position could suffer, which could harm our operating results. We may be required to spend significant resources to monitor and protect our intellectual property rights and there can be no assurance that, even with significant expenditures, we will be able to protect our intellectual property rights.
In addition, our agreements with Agilent, and in particular the intellectual property matters agreement, set forth the terms and provisions under which we received the intellectual property rights necessary to operate our business. Under our agreements with Agilent, we do not have the right to enforce against third parties intellectual property rights we license from Agilent, and Agilent is under no obligation to enforce such rights on our behalf.
28
Table of Contents
Intellectual property rights are difficult to enforce in certain countries, which may inhibit our ability to protect our intellectual property rights or those of our suppliers and customers in those countries.
The laws of some countries do not offer the same level of protection of our proprietary rights as the laws of the United States, and we may be subject to unauthorized use of our products or technologies in those countries, particularly in Asia, where we expect our business to continue to expand in the foreseeable future. Consequently, we cannot assure you that we will be able to protect our intellectual property rights or have adequate legal recourse in the event that we encounter difficulties with infringements of intellectual property under local law.
We may incur a variety of costs to engage in future acquisitions of, or investments in, companies, products or technologies, and the anticipated benefits of any acquisitions we may make may never be realized.
We may acquire, or make significant or minority investments in, complementary businesses, products or technologies. For example, in fiscal year 2009, we acquired substantially all of the assets of Touchdown Technologies. Any future acquisitions or investments could be accompanied by risks such as:
| • | difficulties in assimilating the operations and personnel of acquired companies; |
| • | diversion of our management’s attention from ongoing business concerns; |
| • | our potential inability to maximize our financial and strategic position through the successful incorporation of acquired technology and rights into our products and services; |
| • | additional expense associated with amortization of acquired assets; |
| • | difficulty in maintaining uniform standards, controls, procedures and policies; |
| • | impairment of existing relationships with employees, suppliers and customers as a result of the integration of new management personnel; |
| • | dilution to our shareholders in the event we issue shares as consideration to finance an acquisition; |
| • | impairment of goodwill associated with the acquisition or investment, requiring us to record a significant charge to earnings; |
| • | difficulty integrating and implementing the accounting controls necessary to comply with regulatory requirements such as Section 404 of the Sarbanes-Oxley Act; and |
| • | increased leverage, if we incur debt to finance an acquisition. |
We cannot guarantee that we will realize any benefit from the integration of any business, products or technologies that we might acquire in the future, and our failure to do so could harm our business.
Our executive officers and certain key personnel are critical to our business.
Our future operating results will depend substantially upon the performance of our executive officers and key personnel. Our future operating results also depend in significant part upon our ability to attract and retain qualified management, manufacturing, technical, application engineering, marketing, sales and support personnel. Competition for qualified personnel is intense, and we cannot ensure success in attracting or retaining qualified personnel. Our business is particularly dependent on expertise which only a very limited number of engineers possess and it may be increasingly difficult for us to hire personnel over time. We operate in several geographic locations, including parts of Asia and Silicon Valley, where the labor markets, especially for application engineers, are particularly competitive. Our business, financial condition and results of operations could be materially adversely affected by the loss of any of our key employees, by the failure of any key employee to perform in his or her current position, or by our inability to attract and retain skilled employees, particularly engineers.
29
Table of Contents
Funds associated with our auction rate securities may not be accessible for in excess of 12 months and our auction rate securities may experience an other-than-temporary decline in value, which would adversely affect our income.
As of October 31, 2009, all of our auction rate securities experienced failed auctions. The funds associated with these auctions will not be accessible to us until a successful auction occurs, a buyer is found outside of the auction process or the underlying securities have matured or are called by the issuer. Given the ongoing disruptions in the credit markets and the fact that the liquidity for these types of securities remains uncertain, we have classified all of our auction rate securities as long-term assets in our consolidated balance sheet as of October 31, 2009, as our ability to liquidate such securities in the next 12 months is uncertain.
Our auction rate securities primarily consist of investments that are backed by pools of student loans guaranteed by the U.S. Department of Education and other asset-backed securities. Our marketable securities portfolio as of October 31, 2009 had a carrying value of $398 million, of which approximately $56 million consisted of illiquid auction rate securities. Given the ongoing disruption in the market for auction rate securities, there is no longer an actively quoted market price for these securities. Accordingly, we utilized a model to estimate the fair value of these auction rate securities based on, among other items: (i) the underlying structure of each security and the underlying collateral quality; (ii) the present value of future principal and interest payments discounted at rates considered to reflect current market conditions; (iii) consideration of the probabilities of default, auction failure or repurchase at par for each period; and (iv) estimates of the recovery rates in the event of default for each security. These estimated fair values could change significantly based on future market conditions.
We evaluate our investments periodically for possible other-than-temporary impairment by reviewing factors such as the length of time and extent to which fair value has been below cost basis, the financial condition of the issuer and insurance guarantor, and our ability and intent to hold the investment for a period of time sufficient for anticipated recovery of market value. Based on an analysis of other-than-temporary impairment factors, we recorded an other-than-temporary impairment in the statement of operations of $11.5 million for the fiscal year ended October 31, 2009 related to our auction rate securities, of which $2 million was recorded as an impairment during the three months ended October 31, 2009. We have also recorded an unrealized gain within accumulated other comprehensive loss of approximately $2.1 million (net of tax of $0.5 million), primarily for our auction rate securities that are backed by pools of student loans as of October 31, 2009.
Our effective tax rate may vary significantly from period to period, and we could owe significant taxes even during periods when we experience low operating profit or operating losses.
We are incorporated in Singapore and have negotiated tax incentives with the Singapore Economic Development Board, an agency of the Government of Singapore, which have been approved by Singapore’s Ministry of Finance and Ministry of Trade and Industry. Under the incentives, a portion of the income we earn in Singapore during these ten to fifteen year incentive periods is subject to reduced rates of Singapore income tax. The incentive tax rates will expire in various fiscal years beginning in fiscal 2011. The Singapore corporate income tax rate that would apply, absent the incentives, is 18% for fiscal years 2009 and 2008. Without these incentives, our income taxes would have been lower by $22 million or an increase of $0.37 per share (diluted) for fiscal year 2009 and higher by $4 million or a decrease of $0.07 per share (diluted) for fiscal year 2008. In order to receive the benefit of the incentives, we must develop and maintain in Singapore certain functions such as procurement, financial services, order management, credit and collections, spare parts depot and distribution center, a refurbishment center and regional activities like an application development center. In addition to these qualifying activities, we must hire a specified number of employees and maintain minimum levels of investment in Singapore. We have from two to nine years to phase-in the qualifying activities and to hire the specified numbers of employees. If we do not fulfill these conditions for any reason, our incentive could lapse, our income in Singapore would be subject to taxation at higher rates, and our overall effective tax rate could be between fifteen to twenty percentage points higher than would have been the case had we maintained the benefit of the incentives.
30
Table of Contents
In addition, our effective tax rate may vary significantly from period to period because, for example, we may owe significant taxes in jurisdictions other than Singapore during periods when we are profitable in those jurisdictions even though we may be experiencing low operating profit or operating losses on a consolidated basis. Our effective tax rate varies based on a variety of factors, including overall profitability, the geographical mix of income before taxes and the related tax rates in the jurisdictions where we operate, as well as discrete events, such as settlements of future audits. Certain combinations of these factors could cause us to owe significant taxes even during periods when we experience low income before taxes or loss before taxes.
Currently, we do not maintain a valuation allowance for any deferred tax assets, except for capital losses, as we believe that it is more likely than not that all deferred tax assets will be realized. However, due to the significant amount of losses generated, we may be required to establish a valuation for deferred tax assets depending on our future profitability. This would result in an incremental tax provision and could adversely impact our results of operations.
We sell our products and services worldwide, and our business is subject to risks inherent in conducting business activities in geographies outside of the United States.
Our headquarters are in Singapore, and we sell our products and services worldwide. As a result, our business is subject to risks associated with doing business internationally. Revenue from customers in Asia accounted for approximately 72.1%, 79.4% and 74.0% for the fiscal years ended October 31, 2009, 2008 and 2007, respectively. The economies of Asia have been highly volatile and recessionary in the past, resulting in significant fluctuations in local currencies. Our exposure to the business risks presented by the economies of Asia will increase to the extent that we continue to expand our operations in that region.
Our international activities subjects us to a number of risks associated with conducting operations internationally, including:
| • | difficulties in managing geographically disparate operations; |
| • | potential greater difficulty and longer time in collecting accounts receivable from customers located abroad; |
| • | difficulties in enforcing agreements through non-U.S. legal systems; |
| • | unexpected changes in regulatory requirements that may limit our ability to export our software or sell into particular jurisdictions or impose multiple conflicting tax laws and regulations; |
| • | political and economic instability, civil unrest or war; |
| • | terrorist activities and health risks such as the “flu epidemic” and SARS that impact international commerce and travel; |
| • | difficulties in protecting our intellectual property rights, particularly in countries where the laws and practices do not protect proprietary rights to as great an extent as do the laws and practices of the United States; |
| • | changing laws and policies affecting economic liberalization, foreign investment, currency |
| • | convertibility or exchange rates, taxation or employment; and |
| • | nationalization of foreign owned assets, including intellectual property. |
In addition, we are exposed to foreign currency exchange movements versus the U.S. dollar, particularly the euro and the Japanese yen. With respect to revenue, our primary exposure exists during the period between execution of a purchase order denominated in a foreign currency and collection of the related receivable. During this period, changes in the exchange rates of the foreign currency to the U.S. dollar will affect our revenue, cost of sales and operating margins and could result in exchange gains or losses. While a significant portion of our
31
Table of Contents
purchase orders to date have been denominated in U.S. dollars, competitive conditions may require us to enter into an increasing number of purchase orders denominated in foreign currencies. We incur a variety of costs in foreign currencies, including some of our manufacturing costs, component costs and sales costs. Therefore, as we expand our operations in Asia, we may become more exposed to a strengthening of currencies in the region against the U.S. dollar. We cannot assure you that any hedging transactions we may enter into will be effective or will not result in foreign exchange hedging gains or losses. As a result, we are exposed to greater risks in currency fluctuations.
If our facilities or the facilities of our contract manufacturers were to experience catastrophic loss due to natural disasters, our operations would be seriously harmed.
Our facilities and the facilities of our contract manufacturers could be subject to a catastrophic loss caused by natural disasters, including fires and earthquakes. We and our contract manufacturers have significant facilities in areas with above average seismic activity, such as California, Japan and Taiwan. If any of these facilities were to experience a catastrophic loss, it could disrupt our operations, delay production and shipments, reduce revenue and result in large expenses to repair or replace the facility. We do not carry catastrophic insurance policies that cover potential losses caused by earthquakes.
Risks Related to the Securities Markets and Ownership of Our Ordinary Shares.
If we were classified as a passive foreign investment company, there would be adverse tax consequences to U.S. holders of our ordinary shares.
If we were classified as a “passive foreign investment company” or “PFIC” under section 1297 of the Internal Revenue Code, of 1986, as amended, or the Code, for any taxable year during which a U.S. holder holds ordinary shares, such U.S. holder generally would be taxed at ordinary income tax rates on any gain realized on the sale or exchange of the ordinary shares and on any “excess distributions” (including constructive distributions) received on the ordinary shares. Such U.S. holder could also be subject to a special interest charge with respect to any such gain or excess distribution.
We would be classified as a PFIC for U.S. federal income tax purposes in any taxable year in which either (i) at least 75% of our gross income is passive income or (ii) on average, the percentage of our assets that produce passive income or are held for the production of passive income is at least 50% (determined on an average gross value basis). We were not classified as a PFIC in fiscal year 2009 or in any prior taxable year. Whether we will, in fact, be classified as a PFIC for any subsequent taxable year depends on our assets and income over the course of the relevant taxable year and, as a result, cannot be predicted with certainty. In particular, because the total value of our assets for purposes of the asset test will be calculated based upon the market price of our ordinary shares, a significant and sustained decline in the market price of our ordinary shares and corresponding market capitalization relative to our passive assets could result in our being classified as a PFIC. There can be no assurance that we will not be classified as a PFIC in the future or the IRS will not challenge our determination concerning PFIC status for any prior period.
At times, our stock price has fluctuated significantly, and such fluctuations in the future could result in substantial losses for our investors.
The trading price of our ordinary shares has at times fluctuated significantly. For example, during fiscal year 2009, the trading price of our ordinary shares ranged from a low of $6.14 to a high of $14.80. Fluctuations have occurred and may continue to occur in response to various factors, many of which we cannot control, including:
| • | general economic and political conditions and specific conditions in the semiconductor industry; |
| • | changes in expectations as to our future financial performance, including financial estimates or publication of research reports by securities analysts; |
32
Table of Contents
| • | strategic moves by us or our competitors, such as acquisitions or restructurings; |
| • | announcements of new products or technical innovations by us or our competitors; |
| • | actions by institutional shareholders; and |
| • | speculation in the press or investment community. |
Accordingly, you may not be able to resell your ordinary shares at or above the price you paid.
We may become involved in securities litigation that could divert management’s attention and harm our business.
The stock market in general, and The NASDAQ Global Select Market and the securities of semiconductor capital equipment companies in particular, have experienced extreme price and volume fluctuations that have often been unrelated or disproportionate to the operating performance of the affected companies. These market and industry factors may materially harm the market price of our ordinary shares, regardless of our operating performance. In the past, following periods of volatility in the market price of a particular company’s securities, securities class action litigation has often been brought against that company. We may become involved in this type of litigation in the future. Such litigation, whether or not meritorious, could result in the expenditure of substantial funds, divert management’s attention and resources, and harm our reputation in the industry and the securities markets, which would reduce our profitability and harm our business.
It may be difficult for investors to effect service of process within the United States on us or to enforce civil liabilities under the U.S. federal securities laws of the United States against us.
We are incorporated in Singapore. Some of our officers and directors reside outside the United States. A substantial portion of our assets is located outside the United States. As a result, it may not be possible for investors to effect service of process within the United States upon us. Similarly, investors may be unable to enforce judgments obtained in U.S. courts predicated upon the civil liability provisions of the federal securities laws of the United States against us in U.S. courts. Judgments of U.S. courts based upon the civil liability provisions of the federal securities laws of the United States are not directly enforceable in Singapore courts and are not given the same effect in Singapore as judgments of a Singapore court. Accordingly, there can be no assurance as to whether Singapore courts will enter judgments in actions brought in Singapore courts based upon the civil liability provisions of the federal securities laws of the United States.
| Item 1B. | Unresolved Staff Comments |
None.
| Item 2. | Properties |
We have entered into long term lease arrangements for our corporate headquarters in Singapore, our principal U.S. facility in Cupertino, California, and our Boeblingen, Germany facility. We have also entered into long term lease arrangements for our ASIC development office in Colorado as well as other sales and support facilities around the world.
Our corporate headquarters are located at No. 1 Yishun Avenue 7, Singapore. Our principal U.S. offices are located at 10100 N. Tantau Avenue, Cupertino, California.
33
Table of Contents
The following table provides certain information as to Verigy’s general offices and manufacturing facilities:
| Region |
Description |
Principal Location |
Major Activity+ |
Total Leased Square Footage | ||||
| Americas |
5 Leased Facilities | • Austin, TX |
(3)(4) | 18,487 | ||||
| • Cupertino, CA |
(1)(2)(3)(4) | 100,491 | ||||||
| • Ft. Collins, CO |
(2) | 8,651 | ||||||
| • Pleasanton, CA |
(2)(3) | 11,877 | ||||||
| • Baldwin Park, CA |
(1)(2)(3)(5) | 54,000 | ||||||
| Asia |
7 Leased Facilities | • Chungli, Taiwan |
(2)(3)(4) | 19,711 | ||||
| • Hachioji, Japan |
(3) | 21,433 | ||||||
| • Hsinchu, Taiwan |
(2) | 3,309 | ||||||
| • Kaohsiung, Taiwan |
(3) | 1,890 | ||||||
| • Seoul, Korea |
(3) | 14,161 | ||||||
| • Shanghai, China |
(2)(3) | 48,212 | ||||||
| • Yishun, Singapore |
(1)(2)(3)(4) | 32,744 | ||||||
| Europe |
4 Leased Facilities | • Boeblingen, Germany |
(2)(3) | 180,877 | ||||
| • Grenoble, France |
(3) | 2,465 | ||||||
| • Milan, Italy |
(3) | 2,048 | ||||||
| • Petach Tikva, Israel |
(3) | 1,164 |
| + | Major activities are categorized as follows: |
| (1) | Corporate Administration |
| (2) | Research and Development |
| (3) | Sales, Support, and Marketing |
| (4) | Business / Call Center |
| (5) | Manufacturing |
We believe that all of our facilities are in good condition, are well maintained and are sufficient to support our operations at present levels.
| Item 3. | Legal Proceedings |
From time to time, we are subject to legal proceedings, claims and litigation arising in the ordinary course of business. While the outcome of litigation is uncertain, we do not expect that the ultimate costs to resolve ordinary-course matters that may arise to have a material adverse effect on our consolidated financial position, results of operations or cash flows.
| Item 4. | Submission of Matters to a Vote of Security Holders |
There were no matters submitted to a vote of securities holders during the quarter ended October 31, 2009.
34
Table of Contents
PART II
| Item 5. | Market for Registrant’s Common Equity, Related Stockholder Matters and Issuer Purchases of Equity Securities |
Price Range of Our Ordinary Shares
Our ordinary shares are listed on the NASDAQ Global Select Market under the ticker symbol “VRGY”. The following table sets forth the high and low per share price of our ordinary shares, as reported by The NASDAQ Global Select Market.
| Fiscal Year 2009 |
High | Low | ||||
| First Quarter (ended January 31, 2009) |
$ | 14.80 | $ | 7.35 | ||
| Second Quarter (ended April 30, 2009) |
$ | 11.43 | $ | 6.14 | ||
| Third Quarter (ended July 31, 2009) |
$ | 13.38 | $ | 9.60 | ||
| Fourth Quarter (ended October 31, 2009) |
$ | 13.46 | $ | 9.65 | ||
| Fiscal Year 2008 |
High | Low | ||||
| First Quarter (ended January 31, 2008) |
$ | 27.96 | $ | 19.46 | ||
| Second Quarter (ended April 30, 2008) |
$ | 22.17 | $ | 17.04 | ||
| Third Quarter (ended July 31, 2008) |
$ | 26.11 | $ | 20.13 | ||
| Fourth Quarter (ended October 31, 2008) |
$ | 22.87 | $ | 11.81 | ||
As of October 31, 2009, there were 36,113 shareholders of record of our ordinary shares. The closing share price for our ordinary shares on October 30, 2009, as reported by the NASDAQ Global Select Market, was $9.84 per share.
Ordinary Share Repurchases
2008 Repurchase Plan
On April 15, 2008, at our 2008 annual general meeting of shareholders, our shareholders approved our repurchase of up to 10 percent of Verigy’s outstanding ordinary shares, or approximately 6 million ordinary shares. This program was effective through the 2009 annual general meeting of shareholders.
2009 Repurchase Plan
On April 14, 2009, at our 2009 annual general meeting of shareholders, our shareholders approved a resolution to renew the share repurchase program to extend through the 2010 annual general meeting of shareholders. This approval allows the repurchase of up to 10 percent of Verigy’s outstanding ordinary shares, or approximately 6 million ordinary shares, incremental to the ordinary shares repurchased through the 2008 Repurchase Plan. The 2009 Repurchase Plan will expire at our 2010 annual general meeting of shareholders.
The following repurchases under the 2008 repurchase program and the 2009 repurchase program were completed in the periods presented below:
| Number of Ordinary Shares Repurchased |
Weighted Average Price Per Share |
Amount of Ordinary Shares Repurchased | ||||||
| (in thousands) | (in thousands) | |||||||
| 2008 Repurchase Program to date as of October 31, 2008 |
2,637 | $ | 20.06 | $ | 52,901 | |||
| Three months ended January 31, 2009 |
197 | $ | 8.48 | 1,669 | ||||
| Three months ended April 30, 2009 |
— | $ | — | — | ||||
| Three months ended July 31, 2009 |
— | $ | — | — | ||||
| Three months ended October 31, 2009 |
— | $ | — | — | ||||
| 2008 and 2009 Repurchase Programs to date as of October 31, 2009 |
2,834 | $ | 19.25 | $ | 54,570 | |||
35
Table of Contents
All repurchased shares are immediately retired and will not be available for future resale.
For the majority of restricted stock units granted, the number of shares issued on the date the restricted stock units vest is net of the statutory withholding requirements that we pay on behalf of our employees. These withheld shares are not included in the ordinary share repurchase totals in the table above. For further discussion, see Note 9, “Ordinary Share Repurchases” in Part II, Item 8 of this Form 10-K.
Dividend Policy
We have never paid any cash dividends, and we currently intend to retain and reinvest any future earnings to fund the development and growth of our business. We do not anticipate paying any cash dividends in the foreseeable future.
Stock Performance Graph
The graph below shows the cumulative total stockholder return of an investment of $100 (and the reinvestment of any dividends thereafter) for the period beginning on June 12, 2006 (the date our ordinary shares commenced trading on the NASDAQ Global Select Market) through October 30, 2009 (the last trading day in fiscal year 2009), in each of (i) our ordinary shares (ii) the S&P Smallcap 600 and (iii) a peer group comprised of companies with the standard industrial code, or “SIC,” 3825—Instruments for Measurement & Testing of Electricity & Electrical Signal. Our share price performance shown in the graph below is not indicative of future share price performance.
COMPARISON OF 40 MONTH CUMULATIVE TOTAL RETURN
Among Verigy Ltd., The S&P Smallcap 600 Index And A Peer Group
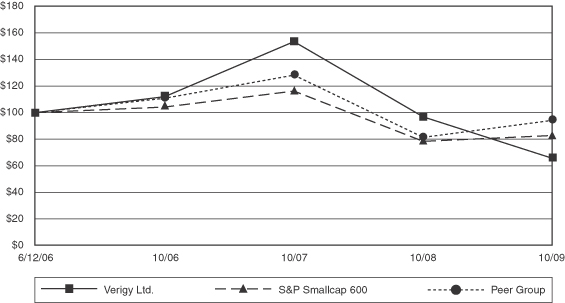
| 6/12/2006 | 10/31/2006 | 10/31/2007 | 10/31/2008 | 10/31/2009 | |||||||||||
| Verigy Ltd |
$ | 100.00 | $ | 112.00 | $ | 153.27 | $ | 96.67 | $ | 65.60 | |||||
| S&P Smallcap 600 |
$ | 100.00 | $ | 104.05 | $ | 116.06 | $ | 78.41 | $ | 82.77 | |||||
| Peer Group |
$ | 100.00 | $ | 110.83 | $ | 128.22 | $ | 81.38 | $ | 94.18 | |||||
Note: The graph shall not deemed to be “filed” for purpose of Section 18 of the Securities Exchange Act of 1934 (the “Exchange Act”) or otherwise subject to the liabilities of that Section, nor shall it be deemed to be incorporated by reference in any filing under the Securities Act of 1933 or the Exchange Act, regardless of any general incorporation language in such filing.
36
Table of Contents
| Item 6. | Selected Financial Data |
SELECTED FINANCIAL DATA
The selected financial data set forth below is derived in part from and should be read in conjunction with “Management’s Discussion and Analysis of Financial Condition and Results of Operations” and our consolidated financial statements and related notes thereto included elsewhere in this report on Form 10-K. Prior to June 1, 2006, we had operated as part of Agilent, and not as a stand-alone company. Therefore, the accompanying combined and consolidated statements prior to June 1, 2006, were derived from the accounting records of Agilent. Historical results are not necessarily indicative of results to be expected for future periods and may not reflect what our financial position and results of operations would have been had we been a separate, stand-alone entity for all the historical periods presented.
| Year Ended October 31, | |||||||||||||||||||
| 2009 | 2008 | 2007 | 2006 | 2005 | |||||||||||||||
| (in millions, except share and per share amounts) | |||||||||||||||||||
| Consolidated Statement of Operations Data: |
|||||||||||||||||||
| Net revenue: |
|||||||||||||||||||
| Products |
$ | 201 | $ | 531 | $ | 615 | $ | 646 | $ | 355 | |||||||||
| Services |
122 | 160 | 146 | 132 | 101 | ||||||||||||||
| Total net revenue |
323 | 691 | 761 | 778 | 456 | ||||||||||||||
| Cost of sales: |
|||||||||||||||||||
| Cost of products |
133 | 270 | 318 | 331 | 228 | ||||||||||||||
| Cost of services |
82 | 114 | 103 | 97 | 88 | ||||||||||||||
| Total cost of sales |
215 | 384 | 421 | 428 | 316 | ||||||||||||||
| Gross profit |
108 | 307 | 340 | 350 | 140 | ||||||||||||||
| Operating expenses: |
|||||||||||||||||||
| Research and development |
92 | 103 | 91 | 99 | 101 | ||||||||||||||
| Selling, general and administrative |
117 | 154 | 145 | 149 | 134 | ||||||||||||||
| Restructuring charges |
8 | 2 | 1 | 17 | 7 | ||||||||||||||
| Separation costs |
— | — | 4 | 69 | 3 | ||||||||||||||
| Total operating expenses |
217 | 259 | 241 | 334 | 245 | ||||||||||||||
| (Loss) income from operations |
(109 | ) | 48 | 99 | 16 | (105 | ) | ||||||||||||
| Interest income and other |
4 | 23 | 17 | 5 | (1 | ) | |||||||||||||
| Impairment of investments |
(18 | ) | (31 | ) | (2 | ) | — | — | |||||||||||
| (Loss) income before income taxes |
(123 | ) | 40 | 114 | 21 | (106 | ) | ||||||||||||
| Provision for income taxes |
4 | 12 | 17 | 21 | 13 | ||||||||||||||
| Net (loss) income |
$ | (127 | ) | $ | 28 | $ | 97 | $ | — | $ | (119 | ) | |||||||
| Net (loss) income per share—basic |
$ | (2.17 | ) | $ | 0.48 | $ | 1.63 | $ | — | $ | (2.38 | ) | |||||||
| Net (loss) income per share—diluted |
$ | (2.17 | ) | $ | 0.47 | $ | 1.61 | $ | — | $ | (2.38 | ) | |||||||
| Weighted average shares (in thousands) used in computing net (loss) income per share: |
|||||||||||||||||||
| Basic: |
58,437 | 59,574 | 59,190 | 53,356 | 50,000 | ||||||||||||||
| Diluted: |
58,437 | 60,360 | 59,883 | 53,356 | 50,000 | ||||||||||||||
37
Table of Contents
| October 31, | |||||||||||||||
| 2009 | 2008 | 2007 | 2006 | 2005 | |||||||||||
| (in millions) | |||||||||||||||
| Consolidated Balance Sheet Data: |
|||||||||||||||
| Cash and cash equivalents and short-term investments |
$ | 364 | $ | 340 | $ | 375 | $ | 300 | $ | — | |||||
| Working capital |
$ | 390 | $ | 342 | $ | 378 | $ | 300 | $ | 41 | |||||
| Total assets |
$ | 711 | $ | 734 | $ | 771 | $ | 674 | $ | 260 | |||||
| Convertible senior notes |
$ | 138 | $ | — | $ | — | $ | — | $ | — | |||||
| Shareholders’ equity |
$ | 402 | $ | 489 | $ | 498 | $ | 389 | $ | 87 | |||||
Financial statements prior to June 1, 2006 were derived from the accounting records of Agilent using the historical basis of assets and liabilities of Verigy. Prior to June 1, 2006, we engaged in extensive intercompany transactions with Agilent. As such, the combined financial statements prior to June 1, 2006 include allocations of certain Agilent corporate expenses, including information technology resources and support; finance, accounting, and auditing services; real estate and facility management services; human resources activities; certain procurement activities; treasury services, customer contract administration, legal advisory services, and Agilent Labs services. The amounts recorded for these transactions and allocations are not necessarily representative of the amounts that would have been reflected in those financial statements had the company been an entity operated independently of Agilent.
| Item 7. | Management’s Discussion and Analysis of Financial Condition and Results of Operations |
Overview
Basis of Presentation
The accompanying financial data has been prepared by us pursuant to the rules and regulations of the U.S. Securities and Exchange Commission (“SEC”). For a full understanding of our financial position and results of operations, this discussion should be read in conjunction with the consolidated financial statements and related notes presented in this report on Form 10-K.
Our fiscal year end is October 31, and our fiscal quarters end on January 31, April 30, July 31 and October 31. Unless otherwise stated, all dates refer to our fiscal years and fiscal periods.
Amounts included in the accompanying consolidated financial statements are expressed in U.S. dollars. The accompanying consolidated financial statements have been prepared pursuant to the rules and regulations of the Securities and Exchange Commission (“SEC”).
On June 15, 2009, we acquired Touchdown Technologies (“Touchdown”), a privately held company. Touchdown provides advanced MEMS probe cards which are designed to improve wafer throughput and yields for memory manufacturers. From the acquisition date, the results of operations of Touchdowns’ business are included in our consolidated statements of operations. Also see Note 10, “Acquisition of Touchdown Technologies” of our consolidated financial statements.
In the third quarter of fiscal year 2008, we recorded a $2.6 million adjustment in interest income and other, related to foreign currency remeasurement gains. These gains related to a failure to remeasure certain foreign currency assets and liabilities, primarily value added tax receivables, arising in fiscal years 2006, 2007 and the first two quarters of fiscal year 2008. Management has assessed the impact of this adjustment and does not believe the amounts are material, either individually or in the aggregate, to any of the prior years’ financial statements, and the impact of correcting these errors in the third quarter of fiscal year 2008 was not material to the full fiscal year 2008 financial statements.
38
Table of Contents
Business Summary
Prior to our initial public offering, we were a wholly-owned subsidiary of Agilent Technologies, Inc. (“Agilent”). We became an independent company on June 1, 2006, when we separated from Agilent. On June 13, 2006, we completed our initial public offering and became a separate stand-alone publicly-traded company focused on technology and innovation in semiconductor testing. We design, develop, manufacture and sell advanced test systems and solutions for the semiconductor industry.
We offer a single platform for each of the general categories of devices being tested: our V93000 Series platform, designed to test System-on-a-Chip (“SOC”), System-in-a-Package (“SIP”) and high-speed memory devices; our V6000 Series platform, which is the successor to the V5000 platform, designed to test both “flash” memory and dynamic random access memory (“DRAM”) devices, and our V101 platform, introduced in the third quarter of fiscal year 2009, designed to test highly cost-sensitive devices such as 4, 8 and 16-bit micro-controller units (“MCUs”). Our test platforms are scalable across different frequency ranges, different pin counts and different numbers of devices under simultaneous test. The test platforms’ flexibility also allows for a single test system to test a wide range of semiconductor device applications. Our scalable platform strategy allows us to optimize operational efficiencies such as research and development investments, engineering headcount, support requirements and inventory risk. This platform strategy also provides economic benefits to our customers by allowing them to bring their complex, feature-rich semiconductor devices to market quickly and to reduce their overall costs. In addition to our test platforms, our product portfolio includes advanced micro-electro-mechanical systems (“MEMS”) probe cards, advanced analysis tools, as well as consulting, service and support offerings such as start-up assistance, application services and system calibration and repair.
As of October 31, 2009, we have installed more than 2,000 V93000 Series systems and nearly 2,600 V5000 Series systems worldwide. We have a broad customer base which includes integrated device manufacturers (“IDMs”), test subcontractors, also referred to as subcontractors or “OSATs” (outsourced sub-assembly and test providers), which includes specialty assembly, package and test companies as well as wafer foundries, and companies that design, but contract with others for the manufacture of, integrated circuits (“ICs”) (known as fabless design companies).
Overview of Results
Our total net revenue for fiscal year 2009 was $323 million, down $368 million, or 53.3%, from $691 million in fiscal year 2008. The decrease was due to lower revenue from sales of our memory and SOC platforms. The decline in both of our businesses resulted from substantial declines in the capital spending patterns of semiconductor manufacturer customers and of their subcontractor test partners to which we also sell our products. The crisis in the global economy and financial markets has driven companies to reassess their use of cash and has negatively impacted consumer confidence. Many of our customers have undertaken or announced restructuring activities and significant cost cuts to their capital spending budgets. These factors have caused our customers to delay test system purchases. Despite the challenging business environment, in the second half of fiscal year 2009, customers began to see utilization rates improve and some increased demand primarily from the cell phone and personal computer markets. We have begun to see positive signs in both the SOC and memory markets and although our quarterly revenue hit an all time low in the first quarter of fiscal year 2009, our revenue has increased for three consecutive quarters, and we anticipate the upward trend to continue through fiscal 2010.
Our gross margin for fiscal year 2009 was 33.4%, a decrease of 11 percentage points compared to fiscal year 2008. Gross margin was negatively impacted primarily by the overall decline in product sales with a larger percentage of revenue being generated from service and support, which generally has a lower gross margin than our products. We also incurred higher expenses related to our restructuring and manufacturing transition actions. This was partially offset by lower excess and obsolete charges as we incurred significant charges in fiscal year 2008 primarily due to the extraordinary drop in memory tester demand in general as well as the impact of the
39
Table of Contents
introduction of our new V6000 product. The net impact of excess and obsolete inventory charges and the benefit from the sales of previously written down inventory on gross margin was $7 million for fiscal year 2009 compared to $27 million recorded for fiscal year 2008.
Our total operating expenses, including restructuring charges of $8 million, were $217 million in fiscal year 2009, down $42 million, or 16.2%, from fiscal year 2008. This decrease in operating expenses from fiscal year 2008 was primarily driven by lower compensation costs, cost savings from our restructuring actions, site shut downs and lower overall discretionary spending. This was partially offset by a $3.8 million in-process research and development charge and operating expenses related to our acquisition of Touchdown Technologies.
Net loss for fiscal year 2009 was $127 million, compared to net income of $28 million achieved in fiscal year 2008. The fiscal year 2009 loss was primarily due to the overall decline in revenue, combined with other-than-temporary impairments of $18 million related to write-downs of our investments, $14 million of restructuring charges, $3.8 million in-process research and development charge and operational expenses related to our acquisition of Touchdown Technologies. In fiscal year 2009, we used $94 million in cash for operating activities. On July 15, 2009, we received net proceeds of $133 million related to our issuance of convertible senior notes (the “notes”). The notes will mature on July 15, 2014, and bear interest at a fixed rate of 5.25% per annum. The interest is payable semi-annually on January 15th and July 15th of each year and payments commence on January 15, 2010. Our cash and cash equivalents balance as of October 31, 2009 was $197 million.
We derive a significant percentage of our net revenue from outside of North America. Net revenue from customers located outside of North America represented 81.7%, 85.5% and 78.2% of total net revenue in fiscal years 2009, 2008 and 2007, respectively. Net revenue in North America as a percentage of total net revenue was higher by 3.8 percentage points in fiscal year 2009, compared to fiscal year 2008, while net revenue in Asia as a percentage of total net revenue, was lower by 7.3 percentage points in fiscal year 2009, compared to fiscal year 2008. However, we expect a majority of our sales to be generated in the Asia region as semiconductor manufacturing activities continue to concentrate in that region.
The sales of our products and services are dependent, to a large degree, on customers who are subject to cyclical trends in the demand for their products. These cyclical periods have had, and will continue to have a significant effect on our business since our customers often delay or accelerate purchases in reaction to changes in their businesses and to demand fluctuations in the semiconductor industry. Historically, these demand fluctuations have resulted in significant variations in our results of operations. This was particularly relevant beginning in the second quarter of fiscal year 2008 when we saw a significant decrease in revenue from our memory platform and experienced some order postponements. We also experienced a similar downturn for our SOC business during fiscal year 2009 due to the deteriorating global economy, which has negatively impacted the entire semiconductor industry. The sharp swings in the semiconductor industry in recent years have generally affected the semiconductor test equipment and services industry more significantly than the overall capital equipment sector.
While we sell to a variety of customers, subcontractors represent a large portion of our customer base. During market troughs, these subcontractors tend to decrease or postpone orders for new test systems and test services more quickly and dramatically as they are more capacity-driven than other customers. As a result, industry downturns may cause a quicker and more significant adverse effect on our business than on the broader semiconductor industry. In addition, although a decline in orders for semiconductor capital equipment may accompany or precede the timing of a decline in the semiconductor market as a whole, recovery in semiconductor capital equipment spending may lag the recovery by the semiconductor industry.
We are feeling increasingly optimistic about the SOC and memory markets and believe that the worst is now behind us. Our product development efforts in DRAM and low end SOC as well as our acquisition of Touchdown Technologies have strengthened our product portfolio. As a result of these investments and the improving industry environment, we expect to deliver revenue growth in fiscal year 2010. We have achieved our
40
Table of Contents
quarterly cost and expense goals by reducing our annualized cost structure by approximately $120 million since our fourth quarter of fiscal year 2008, which includes savings from restructuring activities as described above and a combination of other temporary and permanent cost saving measures. We will maintain tight financial management and we expect to return to profitability by our second quarter of fiscal year 2010.
Critical Accounting Policies and Estimates
The preparation of financial statements in accordance with U.S. GAAP requires management to make estimates and assumptions that affect the amounts reported in our consolidated financial statements and accompanying notes. Management bases its estimates on historical experience and various other assumptions believed to be reasonable. Although these estimates are based on management’s knowledge of current events and of actions that may impact the company in the future, actual results may be different from the estimates. Our critical accounting policies are those that affect our financial statements materially and involve difficult, subjective or complex judgments by management. Those policies are revenue recognition, restructuring, inventory valuation, warranty, share-based compensation, retirement and post-retirement plan assumptions, valuation of goodwill and other long-lived assets, valuation of marketable securities and accounting for income taxes.
Revenue recognition. Net revenue is derived from the sale of products and services and is adjusted for estimated returns and allowances, which historically have been insignificant. We recognize revenue on the sale of semiconductor test equipment when there is persuasive evidence of an arrangement, delivery has occurred or services have been rendered, the sales price is fixed or determinable and collectibility is reasonably assured. Delivery is considered to have occurred when title and risk of loss have transferred to the customer, for products, or when service has been performed. We consider the price to be fixed or determinable when the price is not subject to refund or adjustments. At the time we take an order, we evaluate the creditworthiness of our customers to determine the appropriate timing of revenue recognition. For sales or arrangements that include customer-specified acceptance criteria, including those where acceptance is required upon achievement of performance milestones or fulfillment of other future obligations, revenue is recognized after the acceptance criteria have been met. If the criteria are not met, then revenue is deferred until such criteria are met or until the period(s) over which the last undelivered element is delivered.
Our product revenue is generated predominantly from the sales of various types of test equipment. Software is embedded in many of our test equipment products, but the software component is considered to be incidental. For revenue arrangements that include multiple elements, we recognize revenue in accordance with accounting principles generally accepted in the U.S. For products that include installation, if we have previously successfully installed similar equipment, product revenue is recognized upon delivery, and recognition of installation revenue is delayed until the installation is complete. Otherwise, neither the product nor the installation revenue is recognized until the installation is complete. Revenue from services includes extended warranty, customer support, consulting, training, and education services. Service revenue is deferred and recognized over the contractual period or as services are rendered to the customer. For example, customer support contracts are recognized ratably over the contractual period, while training revenue is recognized as the training is provided to the customer. In addition, all of the revenue recognition criteria described above must be met before service revenue is recognized. We use objective evidence of fair value to allocate revenue to elements in multiple element arrangements and recognize revenue when the criteria for revenue recognition have been met for each element. In the absence of objective evidence of fair value of a delivered element, we allocate revenue to the fair value of the undelivered elements and the residual revenue to the delivered elements. The price charged when an element is sold separately generally determines fair value.
Restructuring. We recognize a liability for restructuring costs when the liability is incurred. The restructuring accruals are based upon management estimates at the time they are recorded. These estimates can change depending upon changes in facts and circumstances subsequent to the date the original liability was recorded. The three main components of our restructuring charges are workforce reductions, consolidating
41
Table of Contents
facilities and asset impairments. Workforce-related charges are accrued when it is determined that a liability has been incurred, which is generally when individuals have been notified of their termination dates and expected severance payments. Plans to eliminate excess facilities result in charges for lease termination fees and future commitments to pay lease charges, net of estimated future sublease income. We recognize charges for elimination of excess facilities when we have vacated the premises. Asset impairments primarily consist of property, plant and equipment associated with excess facilities being eliminated, and are based on an estimate of the amounts and timing of future cash flows related to the expected future remaining use and ultimate sale or disposal of the property, plant and equipment. These estimates were derived using accounting principles generally accepted in the U.S. If the amounts and timing of cash flows from restructuring activities are significantly different from what we have estimated, the actual amount of restructuring and asset impairment charges could be materially different, either higher or lower, than those we have recorded.
In order to address the cyclical downturn and the negative impact on our results driven by the deteriorating global economy, in fiscal year 2009 we implemented restructuring actions to streamline our organizations and further reduce our operating costs. As market conditions continued to deteriorate, in the second quarter of fiscal year 2009, we announced a plan to expand our restructuring actions to further lower our quarterly operating costs in fiscal year 2009. As part of these restructuring actions, we reduced our global workforce through a combination of attrition, voluntary and involuntary terminations and other workforce reduction programs consistent with local legal requirements. The total charges incurred in fiscal year 2009 for these restructuring actions were approximately $14 million, $6 million was recorded within cost of sales and the remainder of which was recorded within operating expenses. At October 31, 2009, we achieved our quarterly cost and expense goals by reducing our annualized cost structure by approximately $120 million since the fourth quarter of fiscal year 2008, which includes savings from restructuring activities as described above and a combination of other temporary and permanent cost saving measures.
Inventory valuation. We assess the valuation of our inventory, including demonstration inventory, on a quarterly basis based upon estimates about future demand and actual usage. To the extent that we determine that we are holding excess or obsolete inventory, we write down the value of our inventory to its net realizable value. Such write-downs are reflected in cost of products and can be material in amount. The net impact of excess and obsolete inventory charges and the benefit from the sales of previously written down inventory on gross margin was $7 million for fiscal year 2009, $27 million for fiscal year 2008 and $8 million for fiscal year 2007. Our inventory assessment involves difficult estimates of future events and, as a result, additional write-downs may be required. If actual market conditions are more favorable than anticipated, inventory previously written down may be sold to customers, resulting in lower cost of products and higher income from operations than expected in that period. Excess and obsolete inventory resulting from shifts in demand or changes in market conditions for raw materials and components can result in significant volatility in our costs of products.
In our inventory valuation analysis, we also include inventory that we could be obligated to purchase from our suppliers based on our production forecasts. To the extent that our committed inventory purchases exceed our forecasted productions needs, we take a charge to our cost of products and establish a supplier liability for such amounts.
Warranty. We generally provide a one-year warranty on products commencing upon installation or delivery. We accrue for warranty costs, based on historical trends in warranty charges as a percent of gross product shipments. Estimated warranty charges are recorded within cost of products at the time revenue is recognized and the liability is reported in other current liabilities on the consolidated balance sheets. The accrual is reviewed regularly and periodically adjusted to reflect changes in warranty cost estimates. For some products, we also offer extended warranties beyond one year. Costs associated with our extended warranty contracts beyond one year are expensed as incurred.
Share-based compensation. On November 1, 2005, we adopted accounting guidance for share-based awards. Under this guidance, share-based compensation expense is primarily based on estimated grant date fair
42
Table of Contents
value using the Black-Scholes option pricing model and is recognized on a straight-line basis for awards granted after November 1, 2005 over the vesting period of the award. Our estimate of share-based compensation expense requires a number of complex and subjective assumptions including our stock price volatility, employee exercise patterns (expected life of the options), future forfeitures and related tax effects. The assumptions used in calculating the fair value of share-based awards represent our best estimates, but these estimates involve inherent uncertainties and the application of management judgment. Although we believe the assumptions and estimates we have made are reasonable and appropriate, changes in assumptions could materially impact our reported financial results. We incurred $19 million, $17 million, and $14 million in share-based compensation expense during fiscal years 2009, 2008, and 2007, respectively. Also see Note 8, “Share-Based Compensation” for additional information.
Retirement and post-retirement plan assumptions. Retirement and post-retirement benefit plan costs are a significant cost of doing business. They represent obligations that will ultimately be settled sometime in the future and therefore are subject to estimation. Pension accounting is intended to reflect the recognition of future benefit costs over the employees’ average expected future service based on the terms of the plans and the investment and funding decisions made by us. To estimate the impact of these future payments and our decisions concerning funding of these obligations, we are required to make assumptions using actuarial concepts within the framework of U.S. GAAP. Two critical assumptions are the discount rate and the expected long-term return on plan assets. Other important assumptions include the health care cost trend rate, expected future salary increases, expected future increases to benefit payments, expected retirement dates, employee turnover and retiree mortality rates. We evaluate these assumptions at least annually.
The discount rate is used to determine the present value of future benefit payments at the measurement date or October 31. The discount rate for U.S. plans was determined based on published rates for high quality corporate bonds. The discount rate for non-U.S. plans was generally determined in a similar manner. Differences between the expected future cash flows of our plans and the maturities of the high quality corporate bonds are not expected to have a material impact on the selection of discount rates. As discount rates decrease, we would expect our net plan costs to increase and as discount rates increase we would expect our net plan costs to decrease. On October 31, 2007, we adopted an accounting guidance for defined benefit pension and other postretirement plans. The accounting guidance required recognition of an asset or liability in the statement of financial position reflecting the funded status of pension and postretirement benefit plans such as retiree health and life, with current year changes recognized in shareholders’ equity. In fiscal year 2007, in order to recognize the funded status of our pension and post-retirement benefit plans in accordance with this accounting guidance, we recorded additional liabilities by a cumulative amount of $18 million, of which $12 million (net of tax of $6 million) was recorded as an increase to accumulated other comprehensive loss. These losses are being recognized over the expected average future service lives of plan participants. Also see Note 20, “Retirement Plans and Post-Retirement Benefits.”
The expected long-term return on plan assets is estimated using current and expected asset allocations, as well as historical and expected returns. Declining rate of return assumptions generally result in increased pension expense while increasing rate of return assumptions generally result in lower pension expense. A one percent change in the estimated long-term return on our pension plan assets would result in a $0.4 million impact on pension expense for our fiscal year 2009. There are no plan assets related to our post-retirement health care plans.
Workforce-related events such as restructurings or divestitures can result in curtailment and settlement gains or losses to the extent they have an impact on the average future working lifetime or total number of participants in our retirement and postretirement plans.
Valuation of goodwill and other long-lived assets. We perform our annual goodwill impairment analysis in the fourth quarter of our fiscal year. Based on our fiscal year 2009 impairment assessment, we concluded that we did not have any impairment as of October 31, 2009.
43
Table of Contents
Our accounting for goodwill and purchased intangible assets complies with accounting principles generally accepted in the U.S. We test goodwill for possible impairment on an annual basis and at any other time that impairment indicators arise. Circumstances that could trigger an impairment test include but are not limited to: significant decrease in market price of an asset, significant adverse changes in the extent or use or physical condition of an asset, significant adverse change in legal or regulatory factors affecting an asset, unanticipated competition, loss of key personnel, accumulation of costs significantly in excess of expected costs to acquire or construct an asset, operating or cash flow losses (or projections of losses) that demonstrates continuing losses associated with the use of an asset, or a current expectation that more likely than not, an asset will be sold or disposed of significantly before the end of its previously estimated useful life.
The process of evaluating the potential impairment of goodwill and other intangibles is highly subjective and requires significant judgment. We estimate expected future cash flows then compare the carrying value including goodwill and other intangibles to the discounted future cash flows. If the total of future cash flows is less than the carrying amount of the assets, we recognize an impairment loss based on the excess of the carrying amount over the fair value of the assets. Estimates of the future cash flows associated with the assets are critical to these assessments. Changes in these estimates based on changed economic conditions or business strategies could result in material impairment charges in future periods.
Purchased intangible assets are carried at cost less accumulated amortization. Amortization is computed using the straight-line method over the economic lives of the respective assets, generally three to five years. We continually monitor events and changes in circumstances that could indicate carrying amounts of long-lived assets, including intangible assets, may not be recoverable. When such events or changes in circumstances occur, we assess the recoverability of long-lived assets by determining whether the carrying value of such assets will be recovered through undiscounted expected future cash flows. If the total of the undiscounted future cash flows is less than the carrying amount of those assets, we recognize an impairment loss based on the excess of the carrying amount over the fair value of the assets.
Valuation of marketable securities. We account for our short-term marketable securities in accordance with accounting principles generally accepted in the U.S. We classify our marketable securities as available for sale at the time of purchase and re-evaluate such designation as of each consolidated balance sheet date. We amortize premiums and discounts against interest income over the life of the investment. Our marketable securities are classified as cash equivalents if the original maturity, from the date of purchase, is ninety days or less. For those investments that we intend to sell or more likely than not would be required to sell before recovery of the amortized cost basis, we recognized other-than-temporary impairment charges in earnings representing both credit and non-credit loss.
Our marketable securities include commercial paper, corporate bonds, government securities, money market funds and auction rate securities. Auction rate securities are securities that are structured with interest rate reset periods of generally less than ninety days but with contractual maturities that can be well in excess of 10 years. At the end of each interest rate reset period, investors can buy, sell or continue to hold the securities at par. As of October 31, 2009, all of our auction rate securities experienced failed auctions. The funds associated with these auctions will not be accessible to us until a successful auction occurs, a buyer is found outside of the auction process or the underlying securities have matured or are called by the issuer. Given the ongoing disruptions in the credit markets and the fact that the liquidity for these types of securities remains uncertain, we have classified all of our auction rate securities as long-term assets in our consolidated balance sheet as of October 31, 2009, as our ability to liquidate such securities in the next 12 months is uncertain.
Our auction rate securities primarily consist of investments that are backed by pools of student loans guaranteed by the U.S. Department of Education and other asset-backed securities. Our marketable securities portfolio as of October 31, 2009 had a carrying value of $398 million, of which approximately $56 million consisted of illiquid auction rate securities. Given the ongoing disruption in the market for auction rate securities, there is no longer an actively quoted market price for these securities. Accordingly, we utilized a model to
44
Table of Contents
estimate the fair value of these auction rate securities based on, among other items: (i) the underlying structure of each security and the underlying collateral quality; (ii) the present value of future principal and interest payments discounted at rates considered to reflect current market conditions; (iii) consideration of the probabilities of default, auction failure or repurchase at par for each period; and (iv) estimates of the recovery rates in the event of default for each security. These estimated fair values could change significantly based on future market conditions.
We evaluate our investments periodically for possible other-than-temporary impairment by reviewing factors such as the length of time and extent to which fair value has been below cost basis, the financial condition of the issuer and insurance guarantor, and our ability and intent to hold the investment for a period of time sufficient for anticipated recovery of market value. Based on an analysis of other-than-temporary impairment factors, we recorded an other-than-temporary impairment in the statement of operations of $11.5 million for the fiscal year ended October 31, 2009 related to our auction rate securities, of which $2 million was recorded as an impairment during the three months ended October 31, 2009. We have also recorded an unrealized gain within accumulated other comprehensive loss of approximately $2.1 million (net of tax of $0.5 million), primarily for our auction rate securities that are backed by pools of student loans as of October 31, 2009.
Investments in money market funds include investments in the Reserve Primary Fund and the Reserve International Liquidity Fund (collectively referred to as the “Reserve Funds”). The net asset value for the Reserve Funds fell below $1 because the funds had holdings of commercial paper and other notes with a major investment bank which filed for bankruptcy on September 15, 2008. As a result of these events, these funds are no longer classified as cash and cash equivalents. We have classified these investments as short-term marketable securities because, based on the maximum maturity date of the underlying securities as well as the proposed liquidation plan and distribution updates received for the funds, we believe that within one year, these investments will be redeemable. We received approximately $20.0 million from the distribution of these funds during fiscal year 2009, reducing the value of our remaining holdings of these funds to $3.1 million as of October 31, 2009.
Accounting for income taxes. We adopted accounting guidance for the uncertainty in income taxes. This interpretation clarifies the criteria for recognizing income tax benefits, and requires additional disclosures about uncertain tax positions. Under this accounting guidance, the financial statement recognition of the benefit for a tax position is dependent upon the benefit being more likely than not to be sustainable upon audit by the applicable taxing authority. If this threshold is met, the tax benefit is then measured and recognized at the largest amount that is greater than 50 percent likely of being realized upon ultimate settlement. This guidance required us to reclassify the majority of our uncertain tax positions from current to non-current in fiscal year 2008 (it does not allow for retroactive treatment or presentation). We recognize interest and penalties related to uncertain tax positions in our provision for income taxes line of our consolidated statements of operations.
We record a tax provision for the anticipated tax consequences of the reported results of operations. In accordance with accounting principles generally accepted in the U.S., the provision for income taxes is computed using the asset and liability method, under which deferred tax assets and liabilities are recognized for the expected future tax consequences of temporary differences between the financial reporting and tax bases of assets and liabilities, and for operating losses and tax credit carryforwards. Deferred tax assets and liabilities are measured using the currently enacted tax rates that apply to taxable income in effect for the years in which those tax assets are expected to be realized or settled.
We are required to assess the realization of our net deferred tax assets and the need for a valuation allowance. This assessment requires that our management make judgments about benefits that could be realized from future taxable income, as well as other positive and negative factors influencing the realization of deferred tax assets. We had a valuation allowance of $2.7 million as of October 31, 2009, compared to $1.0 million such allowances as of October 31, 2008. The net increase of this valuation allowance is attributable to deferred taxes related to capital losses which can only be realized through the generation of future capital gains.
45
Table of Contents
Undistributed earnings of our Domestic (U.S.) and Foreign Subsidiaries are indefinitely reinvested in the respective operations. No provision has been made for taxes that might be payable upon remittance of such earnings, nor is it practicable to determine the amount of this liability.
Our effective tax rate varies based on a variety of factors, including overall profitability, the geographical mix of income before taxes and the related tax rates in the jurisdictions where we operate, restructuring and other one-time charges, as well as discrete events, such as settlements of future audits. We are subject to audits and examinations of our tax returns by tax authorities in various jurisdictions, including the Internal Revenue Service. We regularly assess the likelihood of adverse outcomes resulting from these examinations to determine the adequacy of our provision for income taxes.
Recent Accounting Pronouncements
For a description of accounting changes and recent accounting pronouncements, including the expected dates of adoption and estimated effects, if any, on our consolidated financial statements, see Note 3, “Recent Accounting Pronouncements” in Part II, Item 8 of this Form 10-K.
Results of Operations
The following table sets forth certain operating data as a percent of net revenue for the periods presented.
| Year Ended October 31, | |||||||||
| 2009 | 2008 | 2007 | |||||||
| Net revenue: |
|||||||||
| Products |
62.2 | % | 76.8 | % | 80.8 | % | |||
| Services |
37.8 | 23.2 | 19.2 | ||||||
| Total net revenue |
100.0 | 100.0 | 100.0 | ||||||
| Cost of sales: |
|||||||||
| Cost of products |
41.2 | 39.1 | 41.8 | ||||||
| Cost of services |
25.4 | 16.5 | 13.5 | ||||||
| Total cost of sales |
66.6 | 55.6 | 55.3 | ||||||
| Gross margin(1) |
33.4 | 44.4 | 44.7 | ||||||
| Operating expenses: |
|||||||||
| Research and development |
28.5 | 14.9 | 12.0 | ||||||
| Selling, general and administrative |
36.2 | 22.3 | 19.1 | ||||||
| Restructuring charges |
2.4 | 0.3 | 0.1 | ||||||
| Separation costs |
— | — | 0.5 | ||||||
| Total operating expenses |
67.1 | 37.5 | 31.7 | ||||||
| (Loss) income from operations |
(33.7 | ) | 6.9 | 13.0 | |||||
| Interest income and other |
1.2 | 3.3 | 2.2 | ||||||
| Impairment of investments |
(5.6 | ) | (4.4 | ) | (0.2 | ) | |||
| (Loss) income before income taxes |
(38.1 | ) | 5.8 | 15.0 | |||||
| Provision for income taxes |
1.2 | 1.7 | 2.2 | ||||||
| Net (loss) income |
(39.3 | )% | 4.1 | % | 12.8 | % | |||
| (1) | Gross margin represents the ratio of gross profit to total net revenue. |
46
Table of Contents
Net Revenue
| Year Ended October 31, | 2009 over 2008 Change |
2008 over 2007 Change |
||||||||||||||||
| 2009 | 2008 | 2007 | ||||||||||||||||
| (in millions) | ||||||||||||||||||
| Net revenue from products: |
||||||||||||||||||
| SOC/SIP/High-Speed Memory |
$ | 179 | $ | 467 | $ | 333 | (61.7 | )% | 40.2 | % | ||||||||
| As a percent of total net revenue |
55.4 | % | 67.6 | % | 43.8 | % | ||||||||||||
| Memory |
$ | 22 | $ | 64 | $ | 282 | (65.6 | )% | (77.3 | )% | ||||||||
| As a percent of total net revenue |
6.8 | % | 9.2 | % | 37.0 | % | ||||||||||||
| Net revenue from products |
$ | 201 | $ | 531 | $ | 615 | (62.1 | )% | (13.7 | )% | ||||||||
| Net revenue from services |
$ | 122 | $ | 160 | $ | 146 | (23.8 | )% | 9.6 | % | ||||||||
| As a percent of total net revenue |
37.8 | % | 23.2 | % | 19.2 | % | ||||||||||||
| Total net revenue |
$ | 323 | $ | 691 | $ | 761 | (53.3 | )% | (9.2 | )% | ||||||||
Historically, we have provided revenue by geography based on where the revenue is billed versus where the products are shipped. We are now reporting revenue by geography based on where the products are shipped. The amounts for fiscal years 2008 and 2007 were reclassified to conform to the presentation used for fiscal year 2009.
Our net revenues by geographic region for fiscal years 2009, 2008 and 2007 are as follows:
| Year Ended October 31, | 2009 over 2008 Change |
2008 over 2007 Change |
||||||||||||||||
| 2009 | 2008 | 2007 | ||||||||||||||||
| ($ in millions) | ||||||||||||||||||
| North America |
$ | 59 | $ | 100 | $ | 166 | (41.0 | )% | (39.8 | )% | ||||||||
| As a percent of total net revenue |
18.3 | % | 14.5 | % | 21.8 | % | ||||||||||||
| Europe |
$ | 31 | $ | 42 | $ | 32 | (26.2 | )% | 31.3 | % | ||||||||
| As a percent of total net revenue |
9.6 | % | 6.1 | % | 4.2 | % | ||||||||||||
| Asia |
$ | 233 | $ | 549 | $ | 563 | (57.6 | )% | (2.5 | )% | ||||||||
| As a percent of total net revenue |
72.1 | % | 79.4 | % | 74.0 | % | ||||||||||||
| Total net revenue |
$ | 323 | $ | 691 | $ | 761 | (53.3 | )% | (9.2 | )% | ||||||||
Net Revenue. Net revenue is derived from the sale of products and services and is adjusted for estimated returns and allowances, which historically have been insignificant. Our product revenue is generated predominantly from the sales of our test equipment products. Revenue from services includes extended warranty, customer support, consulting, training and education activities. Service revenue is recognized over the contractual period or as services are rendered to the customer.
Net revenue for fiscal year 2009 was $323 million, a decrease of $368 million, or 53.3 %, from $691 million in fiscal year 2008. Net product revenue for fiscal year 2009 was $201 million, a decrease of $330 million, or 62.1 %, from $531 million in fiscal year 2008. These decreases were due to lower revenue from sales of our memory and SOC platforms. The decline in both of our businesses resulted from substantial declines in the capital spending patterns of semiconductor manufacturer customers and of their subcontractor test partners to which we also sell our products. The crisis in the global economy and financial markets has driven companies to reassess their use of cash and has negatively impacted consumer confidence. Many of our customers have undertaken or announced restructuring activities and significant cost cuts to their capital spending budgets. These factors have caused our customers to delay test system purchases. Despite the challenging business environment, in the second half of fiscal year 2009, customers began to see utilization rates improve and some increased demand primarily from the cell phone and personal computer markets. We have begun to see positive signs in
47
Table of Contents
both the SOC and memory markets, and, although our quarterly revenue hit an all time low in the first quarter of fiscal year 2009, our revenue has increased for three consecutive quarters, and we anticipate the upward trend to continue to continue through fiscal 2010.
Net revenue for fiscal year 2008 was $691 million, a decrease of $70 million, or 9.2%, from $761 million in fiscal year 2007. Net product revenue for fiscal year 2008 was $531 million, a decrease of $84 million, or 13.7%, from $615 million in fiscal year 2007. These decreases were due to lower revenue from sales of our memory test systems, partially offset by increases in SOC and services revenue.
We derive a significant percentage of our net revenue from outside of North America. Net revenue from customers located outside of North America represented 81.7%, 85.5% and 78.2% of total net revenue in fiscal years 2009, 2008 and 2007, respectively. Net revenue in North America as a percentage of total net revenue was higher by 3.8 percentage points in fiscal year 2009, compared to fiscal year 2008, while net revenue in Asia as a percentage of total net revenue, was lower by 7.3 percentage points in fiscal year 2009, compared to fiscal year 2008. However, we expect a majority of our sales to be generated in the Asia region as semiconductor manufacturing activities continue to concentrate in that region.
Service revenue for fiscal year 2009 accounted for $122 million, or 37.8% of net revenue, compared to $160 million, or 23.2% of net revenue in fiscal year 2008. Unlike product revenue, service revenue tends not to experience significant cyclical fluctuations due to the fact that service contracts generally extend for one to two years and revenue is recognized over the contractual period or as services are rendered. As such, the decline in our service revenue was not as severe during fiscal year 2009 as the decline in revenue for products. The decline in service revenue is due to lower systems product sales and service contracts that customers did not renew during the downturn.
Service revenue for fiscal year 2008 accounted for $160 million, or 23.2% of net revenue, compared to $146 million, or 19.2% of net revenue in fiscal year 2007.
Cost of Sales
Cost of Products
| Year Ended October 31, | 2009 over 2008 Change |
2008 over 2007 Change |
||||||||||||||||
| 2009 | 2008 | 2007 | ||||||||||||||||
| ($ in millions) | ||||||||||||||||||
| Cost of products |
$ | 133 | $ | 270 | $ | 318 | (50.7 | )% | (15.1 | )% | ||||||||
| As a percent of product revenue |
66.2 | % | 50.8 | % | 51.7 | % | ||||||||||||
Cost of Products. Cost of products consists primarily of manufacturing materials, outsourced manufacturing costs, direct labor, manufacturing and administrative overhead, warranty costs and provisions for excess and obsolete inventory, partially offset, when applicable, by benefits from sales of previously written-down inventory.
The decrease in cost of products of approximately $137 million in fiscal year 2009, compared to fiscal year 2008, was primarily due to the decrease in sales of our memory and SOC products. This reduction also includes the cost savings from our restructuring actions, primarily lower compensation and benefit costs as well as lower excess and obsolete inventory charges. This was partially offset by higher manufacturing overhead costs due to excess capacity and higher expenses relating to our restructuring and manufacturing transition actions. Cost of products included $5.5 million of restructuring expense in fiscal year 2009, compared to a benefit of $0.2 million of such charge in fiscal year 2008. Cost of products also included $2.2 million of share-based compensation expense in both fiscal years 2009 and 2008.
48
Table of Contents
Cost of products as a percent of net product revenue increased by 15.4 percentage points in fiscal year 2009, compared to fiscal year 2008, primarily due to the lower product revenue generated during the year as well as an increase in restructuring charges and expenses related to our manufacturing transition actions.
Gross excess and obsolete inventory-related charges in fiscal years 2009 and 2008 were $25 million and $30 million, respectively. We also sold previously written down inventory of $18 million and $3 million in fiscal years 2009 and 2008, respectively. The sales of previously written down inventory improved our gross margins on product sales by approximately 6.7 percentage points in fiscal year 2009 and 0.3 percentage points in fiscal year 2008.
The decrease in cost of products of approximately $48 million in fiscal year 2008, compared to fiscal year 2007, was primarily due to the decrease in memory product shipments as well as decreases of separation costs and restructuring charges in fiscal year 2008. This was partially offset by a $18 million increase in gross excess and obsolete inventory charges primarily driven by the significant drop in memory tester demand in general as well as the impact of the introduction of our new V6000 Series which was released in the first quarter of fiscal year 2009. Our cost of products included $2.2 million of share-based compensation expense in fiscal year 2008, compared to $1.7 million of such charges in fiscal year 2007.
Cost of products as a percent of net product revenue decreased by 0.9 percentage points in fiscal year 2008, compared to fiscal year 2007, primarily due to the shift in product mix toward higher gross margin SOC products, as well as decreases of separation costs and restructuring charges in fiscal year 2008.
Gross excess and obsolete inventory-related charges in fiscal years 2008 and 2007 were $30 million and $12 million, respectively. We also sold previously written down inventory of $3 million and $4 million in fiscal years 2008 and 2007, respectively. The sales of previously written down inventory improved our gross margins on product sales by approximately 0.3 percentage points in fiscal years 2008 and 2007.
Cost of Services
| Year Ended October 31, | 2009 over 2008 Change |
2008 over 2007 Change |
||||||||||||||||
| 2009 | 2008 | 2007 | ||||||||||||||||
| ($ in millions) | ||||||||||||||||||
| Cost of services |
$ | 82 | $ | 114 | $ | 103 | (28.1 | )% | 10.7 | % | ||||||||
| As a percent of service revenue |
67.2 | % | 71.3 | % | 70.5 | % | ||||||||||||
Cost of Services. Cost of services includes cost of field service and support personnel, spare parts consumed in service activities and administrative overhead allocations.
Cost of services for fiscal year 2009 was $32 million lower compared to fiscal year 2008. Cost of services as a percent of service revenue decreased by 4.1 percentage points, from 71.3% in fiscal year 2008 to 67.2% in fiscal year 2009. This margin improvement reflected cost savings from our restructuring actions, primarily lower compensation and benefit costs, cost savings from lower discretionary spending as well as lower repair volume. Our cost of services included $1.2 million and $0.9 million of share-based compensation expense in fiscal years 2009 and 2008, respectively.
Cost of services for fiscal year 2008 was $11 million higher compared to fiscal year 2007. Cost of services as a percent of service revenue increased by 0.8 percentage points, from 70.5% in fiscal year 2007 to 71.3% in fiscal year 2008. This margin deterioration was primarily due to the fact that we were putting more service capability in place for product introductions and had experienced slight erosion in our average selling price of our extended service and support contracts. In addition, we had higher material costs and experienced higher consumption, and had an unfavorable currency impact during the period. Our cost of services included $0.9 million and $0.8 million of share-based compensation expense in fiscal years 2008 and 2007, respectively.
49
Table of Contents
As a percent of service revenue, cost of services will vary depending on a variety of factors, including the effect of price erosion, the reliability and quality of our products and our need to maintain customer service and support centers worldwide.
Operating Expenses
Research and Development Expenses
| Year Ended October 31, | 2009 over 2008 Change |
2008 over 2007 Change |
||||||||||||||||
| 2009 | 2008 | 2007 | ||||||||||||||||
| ($ in millions) | ||||||||||||||||||
| Research and development |
$ | 92 | $ | 103 | $ | 91 | (10.7 | )% | 13.2 | % | ||||||||
| As a percent of net revenue |
28.5 | % | 14.9 | % | 12.0 | % | ||||||||||||
Research and Development. Research and development expense includes costs related to salaries and related compensation expenses for research and development and engineering personnel, materials used in research and development activities, outside contractor expenses, depreciation of equipment used in research and development activities, facilities and other overhead and support costs for the personnel, as well as in-process research and development related to our acquisitions. Research and development costs have generally been expensed as incurred.
Research and development expense decreased by $11 million in absolute dollars in fiscal year 2009, compared to fiscal year 2008. This decrease was primarily due to cost savings from our restructuring actions, primarily lower compensation and benefit costs and lower discretionary spending. It also reflected lower expenses for product development activities primarily from our memory business due to the recent release of the V6000 product in the first quarter of fiscal year 2009. These reductions were partially offset by a $3.8 million in-process research and development charge, as well as incremental operating expenses related to our acquisition of Touchdown Technologies. We also wrote down approximately $3 million of purchased intellectual property and incurred higher costs during fiscal year 2009 to support the recent introduction of our V101 platform. Research and development expense also included $2.1 million and $2.0 million of share-based compensation expense for fiscal years 2009 and 2008, respectively. Research and development expense as a percentage of revenue increased by 13.6 percentage points from 14.9% in fiscal year 2008 to 28.5% in fiscal year 2009. This increase was primarily due to the significantly lower revenue levels in fiscal year 2009, compared to fiscal year 2008.
Research and development expense increased by $12 million in absolute dollars in fiscal year 2008, compared to fiscal year 2007. This increase was primarily due to higher expenses to support product development activities for memory products released in the first quarter of fiscal year 2009 and SOC products planned for release during fiscal year 2009. Research and development expense also included $2.0 million and $1.7 million of share-based compensation expense for fiscal years 2008 and 2007, respectively. Research and development expense as a percentage of revenue increased by 2.9 percentage points from 12.0% in fiscal year 2007 to 14.9% in fiscal year 2008. The increase in research and development expense as a percent of revenue reflected the higher level of absolute spending combined with the lower revenue in fiscal year 2008.
We believe that we need to maintain a significant level of research and development spending in order to remain competitive and, as a result, we expect our research and development expenses to only vary modestly in dollar amount from period to period, and to fluctuate as a percentage of revenue based on revenue levels.
Selling, General and Administrative Expenses
| Year Ended October 31, | 2009 over 2008 Change |
2008 over 2007 Change |
||||||||||||||||
| 2009 | 2008 | 2007 | ||||||||||||||||
| ($ in millions) | ||||||||||||||||||
| Selling, general and administrative |
$ | 117 | $ | 154 | $ | 145 | (24.0 | )% | 6.2 | % | ||||||||
| As a percent of net revenue |
36.2 | % | 22.3 | % | 19.1 | % | ||||||||||||
50
Table of Contents
Selling, General and Administrative. Selling, general and administrative expense includes costs related to salaries and related expenses for sales, marketing and applications engineering personnel, sales commissions paid to sales representatives and distributors, outside contractor expenses, other sales and marketing program expenses, travel and professional service expenses, salaries and related expenses for administrative, finance, human resources, legal and executive personnel, facility and other overhead and support costs for these personnel.
Selling, general and administrative expense decreased by $37 million in absolute dollars in fiscal year 2009 compared to fiscal year 2008. The decrease was due to cost savings from our restructuring actions, primarily lower compensation and benefit costs and lower discretionary spending. These costs were partially offset by higher share-based compensation expenses as well as incremental operating expenses related to our acquisition of Touchdown Technologies. Selling, general and administrative expense included approximately $13.5 million of share-based compensation expenses in fiscal year 2009, compared to $11.7 million of such expenses in fiscal year 2008.
Selling, general and administrative expense increased by $9 million in absolute dollars in fiscal year 2008 compared to fiscal year 2007. The increase was primarily due to higher field selling costs and higher share-based compensation expenses, operating expenses associated with the acquisition of Inovys and increased governance costs. Selling, general and administrative expense included approximately $11.7 million of share-based compensation expenses in fiscal year 2008, compared to $9.6 million of such expenses in fiscal year 2007.
Restructuring Charges
In fiscal year 2008, we offered an early retirement plan to a number of eligible employees. The total net charges incurred in fiscal year 2008 for this early retirement plan were approximately $2 million, which was recorded within operating expenses.
In order to address the cyclical downturn and the negative impact on our results driven by the deteriorating global economy, in fiscal year 2009 we implemented restructuring actions to streamline our organizations and further reduce our operating costs. As market conditions continued to deteriorate, in the second quarter of fiscal year 2009, we announced a plan to expand our restructuring actions to further lower our quarterly operating costs in fiscal year 2009. As part of these restructuring actions, we reduced our global workforce through a combination of attrition, voluntary and involuntary terminations and other workforce reduction programs consistent with local legal requirements.
The total charges during fiscal year 2009 for our restructuring actions were approximately $13.7 million, $5.5 million of which was recorded within cost of sales and the remainder of which was recorded within operating expenses.
As of October 31, 2009, we had approximately $4.9 million of accrued restructuring liability included within other current liabilities on our consolidated balance sheet. The accrual relates to severance and benefit payments and are expected to be paid out by the end of fiscal year 2010.
At October 31, 2009, we achieved our quarterly cost and expense goals by reducing our annualized cost structure by approximately $120 million since the fourth quarter of fiscal year 2008, which includes savings from restructuring activities as described above and a combination of other temporary and permanent cost saving measures.
51
Table of Contents
Interest Income and Other
The following table presents the components of interest income and other for fiscal years 2009, 2008, and 2007:
| Year Ended October 31, | ||||||||||
| 2009 | 2008 | 2007 | ||||||||
| (in millions) | ||||||||||
| Interest and other income |
$ | 7 | $ | 17 | $ | 17 | ||||
| Interest expense |
(2 | ) | — | — | ||||||
| Net foreign currency remeasurement (loss) gain |
(1 | ) | 6 | — | ||||||
| Interest income and other |
$ | 4 | $ | 23 | $ | 17 | ||||
Interest income and other consists primarily of interest on cash, cash equivalents and investments, interest expense primarily related to our convertible senior note, gains and losses from the remeasurement of assets and liabilities denominated in currencies other than the functional currency, as well as gains and losses on foreign exchange balance sheet hedge transactions. These transactions are intended to offset foreign exchange gains and losses from remeasurement, which are generally for a period of 30 days or less and settled by the end of the month.
The following table presents the components of impairment of investments for fiscal years 2009, 2008, and 2007:
| Year Ended October 31, |
||||||||||||
| 2009 | 2008 | 2007 | ||||||||||
| (in millions) | ||||||||||||
| Impairment of cost-based investments |
$ | (6 | ) | $ | (11 | ) | $ | (2 | ) | |||
| Impairment of auction rate securities |
(12 | ) | (20 | ) | — | |||||||
| Impairment of investments |
$ | (18 | ) | $ | (31 | ) | $ | (2 | ) | |||
During fiscal year 2009, we incurred a $6.2 million charge related to the write-off of a cost method investment that was determined to be impaired on an other-than-temporary basis. We recorded an $11.5 million other-than-temporary impairment charge for fiscal year 2009 for our auction rate securities.
During fiscal year 2008, we incurred an $11.1 million charge related to the write-off of cost-based equity investment that was determined to be impaired on an other-than-temporary basis. Additionally, we have recorded other-than-temporary impairments within the statement of operations for the fiscal year 2008 of $17.4 million related to auction rate securities and $2.1 million related to our money market funds. See Note 12, “Marketable Securities” and Note 16, “Other Long Term Assets.”
Provision for Income Taxes
We recorded an income tax provision of $4 million, $12 million and $17 million for fiscal years ended 2009, 2008, and 2007, respectively. The decrease in our income tax provision is primarily attributable to a loss before income taxes of $123 million during fiscal year 2009, compared to income before income taxes of $40 million for fiscal year 2008 and $114 million for fiscal year 2007. Our current provision for income taxes relates to amounts due in foreign jurisdictions which had taxable income.
As of October 31, 2009 and 2008, we had $54 million and $62 million of net deferred tax assets due to temporary differences between the book and tax basis of the net assets. Management periodically evaluates the realizability of its net deferred tax assets and the need for any valuation allowance based on all available
52
Table of Contents
evidence, both positive and negative in accordance with the accounting guidance for income taxes. In performing this analysis, management considered the impact of Veirgy’s current year consolidated loss before income taxes of $123 million and the factors giving rise to such losses, as well as the lack of any carryback potential for the net operating losses included in the deferred tax assets. Management further considered various factors for each jurisdiction including historical evidence of profitability, expectations of future taxable income, indefinite loss carryovers in Singapore and the historical profitability of most jurisdictions due to Verigy’s tax structure. After evaluating both negative and positive factors, we determined that no valuation allowance is needed for the net deferred tax assets of $54 million as of October 31, 2009, and based on the available evidence, we concluded that its more likely than not that these assets will be realized. We have, however, established a valuation allowance of $2.7 million for the portion of our deferred tax assets related to capital losses for which we do not expect to be able to realize. This is a $1.7 million increase from the balance of $1.0 million as of October 31, 2008.
The provisions for income taxes in the consolidated financial statements have been determined on a separate return basis. We are required to assess the realization of our net deferred tax assets and the need for a valuation allowance. This assessment requires that our management make judgments about benefits that could be realized from future taxable income, as well as other positive and negative factors influencing the realization of deferred tax assets. Based on our earnings history and projected future taxable income, management determined that it was more likely than not that the deferred tax assets not arising from capital losses would be realized.
Our effective tax rate varies based on a variety of factors, including overall profitability, the geographical mix of income before taxes and the related tax rates in the jurisdictions where we operate, restructuring and other one-time charges, as well as discrete events, such as settlements of future audits. We are subject to audits and examinations of our tax returns by tax authorities in various jurisdictions, including the Internal Revenue Service. We regularly assess the likelihood of adverse outcomes resulting from these examinations to determine the adequacy of our provision for income taxes. Undistributed earnings of our subsidiaries are indefinitely reinvested in the respective operations. No provision has been made for taxes that might be payable upon remittance of such earnings, nor is it practicable to determine the amount of this liability.
We adopted accounting guidance for the uncertainty in income taxes. This guidance clarifies the criteria for recognizing income tax benefits, and requires additional disclosures about uncertain tax positions. Under this accounting guidance, the financial statement recognition of the benefit for a tax position is dependent upon the benefit being more likely than not to be sustainable upon audit by the applicable taxing authority. If this threshold is met, the tax benefit is then measured and recognized at the largest amount that is greater than 50 percent likely of being realized upon ultimate settlement. We have recognized interest and penalties related to uncertain tax positions in our provision for income taxes line of our consolidated statements of operations. Also see Note 7, “Provision for Income Taxes.”
Goodwill and Other Long-Lived Assets
Our goodwill balance as of both October 31, 2009 and 2008 was $18 million and represents an allocation of goodwill recorded during the 2006 separation from Agilent. We review our goodwill for impairment annually in the fourth quarter of our fiscal year, or more frequently if impairment indicators arise. Impairment of goodwill is tested at the reporting unit level by comparing the reporting unit’s carrying amount, including goodwill, to the fair value of the reporting unit. The fair values of the reporting units are estimated using a combination of the income approach that uses discounted cash flows and the market approach that utilizes comparable companies’ data. If the carrying amount of the reporting unit exceeds its fair value, goodwill is considered impaired and a second step is performed to measure the amount of impairment loss. We have two reporting units for which we assess goodwill for impairment.
During fiscal year 2009, we recorded $2 million of intangible assets related to our acquisition of Touchdown Technologies with a weighted-average amortization period of 4 years. These assets will be amortized on a straight-line basis with an estimated future amortization expense of approximately $0.5 million a year. We continually monitor events and changes in circumstances that could indicate carrying amounts of long-lived
53
Table of Contents
assets may not be recoverable. When such events or changes in circumstances occur, we assess the recoverability of long-lived assets by determining whether the carrying value of such assets will be recovered through undiscounted expected future cash flows. If the total of the undiscounted future cash flows is less than the carrying amount of those assets, we recognize an impairment loss based on the excess of the carrying amount over the fair value of the assets.
We performed an interim goodwill and long-lived asset impairment analysis during the three months ended January 31, 2009 because of the sharp deterioration in our operating results. Based on this interim assessment, we concluded that we did not have any impairment as of January 31, 2009. We completed our annual impairment assessment in the fourth quarter of fiscal year 2009 and we concluded that we did not have any impairment as of October 31, 2009.
Financial Condition
Liquidity and Capital Resources
As of October 31, 2009, we had $197 million in cash and cash equivalents, compared to $144 million as of October 31, 2008. This increase in cash was primarily due to net cash proceeds of $133 million from the issuance of our convertible senior notes in July 2009, partially offset by the net loss of $127 million.
Net Cash (Used in ) Provided By Operating Activities
In fiscal year 2009, we used $94 million in cash for operating activities, compared to $97 million generated in fiscal year 2008. The $94 million used during fiscal year 2009, was primarily a result of $127 million of net loss, an increase of $1 million in inventory, and decreases of $26 million in payables, $9 million in employee compensation and benefits, $25 million in deferred revenue, $2 million in income tax and other taxes payable, and a change in net assets of $5 million in other current and long-term assets and liabilities. This was offset by a $19 million reduction in receivables as a result of customer payments. Also during fiscal year 2009, we had non-cash charges of $16 million from depreciation and amortization expense, $4 million from an in-process research and development charge related to our acquisition of Touchdown, $25 million from gross excess and obsolete inventory provisions, $19 million of net share-based compensation costs and a $18 million impairment loss on marketable securities and a cost method investment.
In fiscal year 2008, we generated $97 million in cash from operating activities, compared to $121 million in fiscal year 2007. The $97 million cash generation during fiscal year 2008 was a result of $28 million of net income, a $35 million reduction in receivables as a result of customer payments, and a change in net assets of $16 million. Also during fiscal year 2008, we had non-cash charges of $15 million from depreciation and amortization expense, $30 million from gross excess and obsolete inventory provisions, $16 million of net share-based compensation costs, a $31 million impairment loss on marketable securities and a cost-based equity investment, and a $2 million loss on disposal of property, plant and equipment. These impacts were partially offset by an increase of $31 million in inventory primarily due the purchase of raw materials relating to our service and support business and the introduction of our new V6000 which was released in the first quarter of fiscal year 2009, and decreases of $9 million in income tax and other taxes payable, $12 million in employee compensation and benefits, $12 million in payables, and $12 million in deferred revenue.
Net Cash Provided by (Used in) Investing Activities
Net cash provided by investing activities in fiscal year 2009 was $10 million, compared to $51 million used in fiscal year 2008. The net cash generated was primarily related to the proceeds from the maturities and sales of available for sale marketable securities of $238 million and proceeds from the disposition of assets of $2 million. This was partially offset by purchases of available for sale marketable securities of $222 million and investments made for property, plant and equipment of $8 million. Our marketable securities include commercial
54
Table of Contents
paper, corporate bonds, government securities, money market funds and auction rate securities. Auction rate securities are securities that are structured with interest rate reset periods of generally less than ninety days but with contractual maturities that can be well in excess of 10 years. At the end of each interest rate reset period, investors can buy, sell or continue to hold the securities at par. As of October 31, 2009, all of our auction rate securities experienced failed auctions. The funds associated with these auctions will not be accessible to us until a successful auction occurs, a buyer is found outside of the auction process or the underlying securities have matured or are called by the issuer. Given the ongoing disruptions in the credit markets and the fact that the liquidity for these types of securities remains uncertain, we have classified all of our auction rate securities as long-term assets in our consolidated balance sheet as of October 31, 2009, as our ability to liquidate such securities in the next 12 months is uncertain.
Our auction rate securities primarily consist of investments that are backed by pools of student loans guaranteed by the U.S. Department of Education and other asset-backed securities. Our marketable securities portfolio as of October 31, 2009 had a carrying value of $398 million, of which approximately $56 million consisted of illiquid auction rate securities. Given the ongoing disruption in the market for auction rate securities, there is no longer an actively quoted market price for these securities. Accordingly, we utilized a model to estimate the fair value of these auction rate securities based on, among other items: (i) the underlying structure of each security and the underlying collateral quality; (ii) the present value of future principal and interest payments discounted at rates considered to reflect current market conditions; (iii) consideration of the probabilities of default, auction failure or repurchase at par for each period; and (iv) estimates of the recovery rates in the event of default for each security. These estimated fair values could change significantly based on future market conditions.
We evaluate our investments periodically for possible other-than-temporary impairment by reviewing factors such as the length of time and extent to which fair value has been below cost basis, the financial condition of the issuer and insurance guarantor, and our ability and intent to hold the investment for a period of time sufficient for anticipated recovery of market value. Based on an analysis of other-than-temporary impairment factors, we recorded an other-than-temporary impairment in the statement of operations of $11.5 million for the fiscal year ended October 31, 2009 related to our auction rate securities, of which $2 million was recorded as an impairment during the three months ended October 31, 2009. We have also recorded an unrealized gain within accumulated other comprehensive loss of approximately $2.1 million (net of tax of $0.5 million), primarily for our auction rate securities that are backed by pools of student loans as of October 31, 2009.
Investments in money market funds include investments in the Reserve Primary Fund and the Reserve International Liquidity Fund (collectively referred to as the “Reserve Funds”). The net asset value for the Reserve Funds fell below $1 because the funds had holdings of commercial paper and other notes with a major investment bank which filed for bankruptcy on September 15, 2008. As a result of these events, these funds are no longer classified as cash and cash equivalents. We have classified these investments as short-term marketable securities because, based on the maximum maturity date of the underlying securities as well as the proposed liquidation plan and distribution updates received for the funds, we believe that within one year, these investments will be redeemable. We received approximately $20.0 million from the distribution of these funds during fiscal year 2009, reducing the value of our remaining holdings of these funds to $3.1 million as of October 31, 2009.
On June 15, 2009, we completed the acquisition of substantially all of the assets and assumption of certain liabilities of Touchdown Technologies, Inc. The consideration payable in the acquisition consists of contingent consideration payable based on revenue from probe card sales during a five year period beginning November 1, 2009. There is no minimum or maximum amount of contingent consideration payable pursuant to the acquisition agreement.
Net cash used in investing activities in fiscal year 2008 was $51 million, compared to $290 million used in fiscal year 2007. The net cash used was primarily related to purchases of available for sale marketable
55
Table of Contents
securities of $293 million, cash paid for the acquisition of Inovys and other investments of $28 million, net of cash acquired, as well as the investments made in our property, plant and equipment of $12 million. This was partially offset by the net proceeds from the sales and maturities of available for sale marketable securities of $307 million. In addition, we reclassified approximately $25 million of cash and cash equivalents to short-term marketable securities.
Net Cash Provided by (Used in) Financing Activities
Net cash provided by financing activities in fiscal year 2009 was $137 million, compared to $44 million used in fiscal year 2008. The $137 million net cash provided in fiscal year 2009 was comprised of net cash proceeds of $133 million from the issuance of $138 million of convertible senior notes, $5 million from the issuance of shares under employee stock plans including contributions by participants to our employee shares purchase plan, pursuant to which 375,885 shares and 369,376 shares were issued in first and third quarter of fiscal year 2009, offset by $1 million of repurchases of our ordinary shares made pursuant to the repurchase program approved by our shareholders in the second quarter of fiscal year 2008.
On July 15, 2009, we issued $138 million of convertible senior notes. The notes will mature on July 15, 2014, and bear interest at a fixed rate of 5.25% per annum. The interest is payable semi-annually on January 15th and July 15th of each year and payments commence on January 15, 2010.
Net cash used in financing activities in fiscal year 2008 was $44 million, compared to $14 million provided in fiscal year 2007. In the second quarter of fiscal year 2008, our shareholders approved a share repurchase program, which provided our directors authority to acquire up to 10 percent, or approximately 6 million shares, of our outstanding ordinary shares. The $44 million net cash used in fiscal year 2008 was comprised of approximately $53 million of repurchase and retirement of ordinary shares, offset by $1 million of excess tax benefits from share-based compensation, $8 million from the issuance of shares under employee stock plans including contributions by participants to our employee shares purchase plan, pursuant to which 155,030 shares and 171,905 shares were issued in the first and third quarter of fiscal year 2008, respectively.
Other
Our liquidity is affected by many factors, some of which are based on normal ongoing operations of our business and some of which arise from fluctuations related to global economics and markets. Our cash balances are generated and held in many locations throughout the world. Local government regulations may restrict our ability to move cash balances to meet cash needs under certain circumstances. We do not currently expect such regulations and restrictions to affect our ability to pay vendors and conduct operations throughout our global organization.
We believe that existing cash, cash equivalents and short-term marketable securities of approximately $364 million as of October 31, 2009, will be sufficient to satisfy our working capital, capital expenditure and other liquidity needs at least through the next twelve months. We may require or choose to obtain debt or equity financing in the future. However, it is uncertain that additional financing, if needed, will be available on favorable terms, or at all.
Contractual Obligations and Commitments
Contractual Obligations
Our cash flows from operations are dependent on a number of factors, including fluctuations in our operating results, accounts receivable collections, inventory management and the timing of tax and other payments. As a result, the impact of contractual obligations on our liquidity and capital resources in future periods should be analyzed in conjunction with such factors.
56
Table of Contents
The following table summarizes our contractual obligations at October 31, 2009 (in millions):
| (in millions) | Total | Less than one year |
One to three years |
Three to five years |
More than five years | ||||||||||
| Operating and capital leases |
$ | 57 | $ | 13 | $ | 18 | $ | 14 | $ | 12 | |||||
| Commitments to contract manufacturers and suppliers |
77 | 77 | — | — | — | ||||||||||
| Other purchase commitments |
49 | 49 | — | — | — | ||||||||||
| Convertible senior note and related interest |
174 | 7 | 15 | 152 | — | ||||||||||
| Long-term liabilities |
33 | — | 9 | — | 24 | ||||||||||
| Total |
$ | 390 | $ | 146 | $ | 42 | $ | 166 | $ | 36 | |||||
The contractual obligations table excludes our long-term income taxes payable liabilities and earn out payments related to our acquisition in Touchdown because we cannot make a reliable estimate of the timing of cash payments. As of October 31, 2009, we had total unrecognized tax benefits of $15.6 million, of which $15.1 million is reflected in other long-term liabilities, with the remaining $0.5 million affecting goodwill if recognized.
Operating and capital leases. Commitments under operating leases relate primarily to leasehold property. We have entered into long-term lease arrangements for our corporate headquarters in Singapore, our principal U.S. facility in Cupertino, California, and our Boeblingen, Germany facility. We have also entered into long-term lease arrangements for our ASIC development office in Colorado, as well as other sales and support facilities around the world. As part of our acquisition of Touchdown, we assumed certain capital lease obligations primarily for machinery and equipment.
Commitments to contract manufacturers and suppliers. We purchase components from a variety of suppliers and, historically, we have used several contract manufacturers to provide manufacturing services for our products. During the normal course of business, we issue purchase orders with estimates of our requirements several months ahead of the delivery dates. However, our agreements with these suppliers usually allow us the option to cancel, reschedule or adjust our requirements based on our business needs prior to firm orders being placed. Typically purchase orders outstanding with delivery dates within 30 days are non-cancelable. Therefore, only approximately 2% of our purchase commitments arising from these agreements are firm, non-cancelable and unconditional commitments. We expect to fulfill the purchase commitments for inventory within one year.
In addition, we record a liability for firm, non-cancelable and unconditional purchase commitments for quantities in excess of our future demand forecasts. Such liabilities were $8 million as of October 31, 2009, and $12 million as of October 31, 2008. These amounts are included in other current liabilities in our consolidated balance sheets at October 31, 2009 and October 31, 2008.
Other purchase commitments. Other purchase commitments relate primarily to contracts with professional services suppliers, which include third-party consultants for legal, finance, engineering and other administrative services. With the exception of our IT service providers, our purchase commitments from professional service providers are typically cancelable with a notice of 90 days or less without significant penalties. The agreement with our primary IT service provider requires notice of 120 days and includes a termination charge of up to approximately $0.8 million in order to cancel our long-term contract.
Convertible senior notes. On July 15, 2009, we issued $138 million of convertible senior notes. The notes will mature on July 15, 2014, and bear interest at a fixed rate of 5.25% per annum. The interest is payable semi-annually on January 15th and July 15th of each year and payments commence on January 15, 2010.
57
Table of Contents
Long-term liabilities. Long-term liabilities relate primarily to $24 million of defined benefit and defined contribution retirement obligations, $3 million of extended warranty and deferred revenue obligations, a $6 million deferred acquisition credit related to the Touchdown Technologies acquisition. Upon our separation from Agilent, the defined benefit plans for our employees located in Germany, Korea, Taiwan, France and Italy were transferred to us. With the exception of Italy and France, which involve relatively insignificant amounts, Agilent completed the funding of these transferred plans, based on 100% of the accumulated benefit obligation level as of the separation date. We made approximately $2 million of contributions to the retirement plans for both periods presented. We expect expenses of approximately $4 million in fiscal year 2010 for the retirement plans, and we plan on making cash contributions of approximately $2 million.
Off-Balance Sheet Arrangements
We had no material off-balance sheet arrangements as of October 31, 2009 or October 31, 2008.
| Item 7A. | Quantitative and Qualitative Disclosures About Market Risk |
Foreign Currency Risk
We conduct business on a global basis in a number of major international currencies. As such, we are potentially exposed to adverse as well as beneficial movements in foreign currency exchange rates. The majority of our sales are denominated in U.S. dollars except for certain of our revenues that are denominated in Japanese yen. Services and support sales are denominated primarily in local currency after the initial product sale. A significant amount of expenses are denominated in euro for certain expenses such as employee payroll and benefits as well as other expenses that are paid in local currency. In addition, other expenses related to our non-U.S. and non-European offices are denominated in the countries’ local currency. As such, we enter into cash flow and balance sheet hedges to mitigate our foreign currency risk.
We currently enter into foreign currency forward contracts to minimize the short-term impact of the exchange rate fluctuations on euro-denominated cash flows, where the U.S. dollar is the functional currency, and Japanese yen-denominated cash flows and forecasted Japanese yen-denominated revenue. We currently believe these are our primary exposures to currency rate fluctuation. We have implemented a cash flow hedging strategy that is intended to mitigate our currency exposures by entering into foreign currency forward contracts that have maturities in excess of one month. These contracts are used to reduce our risk associated with exchange rate movements, as gains and losses on these contracts are intended to mitigate the effect of exchange rate fluctuations on certain foreign currency denominated revenues, costs and eventual cash flows.
These foreign currency forward contracts are designated as cash flow hedges and are carried on our balance sheet at fair value with the effective portion of the foreign exchange gain (loss) being reported as a component of accumulated other comprehensive income (loss) in shareholders’ equity and later reclassified into the statement of operations as part of income from operations when the hedged transaction affects earnings. If the underlying foreign currency requirement being hedged fails to occur, or if a portion of any derivative is deemed to be ineffective, we will recognize the gain (loss) on the associated financial instrument in operating income in the statement of operations. As of October 31, 2009, the fair value of foreign currency forward contracts designated as cash flow hedges is approximately $1.5 million. This amount is included within current assets and the related gain of $1.1 million (net of tax of $0.4 million) is included within unrealized gains in accumulated other comprehensive loss.
We also enter into foreign currency forward contracts to hedge the gains and losses generated by the remeasurement of assets and liabilities denominated in currencies other than the functional currency. These contracts are generally for a period of 30 days or less and settled by the end of the month. The change in fair value of these balance sheet hedge contracts is recorded into earnings as a component of interest income and other and offsets the change in fair value of the remeasured assets and liabilities.
58
Table of Contents
We performed a sensitivity analysis assuming a hypothetical 10 percent adverse movement in foreign exchange rates to the hedging contracts and the underlying exposures described above. As of October 31, 2009 and October 31, 2008, the analysis indicated that these hypothetical market movements would not have a material effect on our consolidated financial position, results of operations or cash flows.
Investment and Interest Rate Risk
We account for our investment instruments in accordance with accounting principles generally accepted in the U.S. All of our cash and cash equivalents and marketable securities are treated as “available for sale”. Our marketable securities include commercial paper, corporate bonds, government securities, and money market funds which we believe will be redeemed within one year and auction rate securities.
Our cash equivalents and our portfolio of marketable securities are subject to market risk due to changes in interest rates. Fixed rate interest securities may have their market value adversely impacted due to a rise in interest rates, while floating rate securities may produce less income than expected if interest rates fall. Due in part to these factors, our future investment income may fall short of expectation due to changes in interest rates or we may suffer losses in principal if we are forced to sell securities that decline in the market value due to changes in interest rates. However, because we classify our debt securities as “available for sale”, no gains or losses are recognized due to changes in interest rates unless such securities are sold prior to maturity or declines in fair value are determined to be other-than-temporary. Should interest rates fluctuate by 10 percent, the value of our marketable securities would not have a significant impact as of October 31, 2009, and our interest income would have changed by approximately $0.7 million for fiscal year 2009.
Auction rate securities are securities that are structured with interest rate reset periods of generally less than ninety days but with contractual maturities that can be well in excess of 10 years. At the end of each interest rate reset period, investors can buy, sell or continue to hold the securities at par. As of October 31, 2009, all of our auction rate securities experienced failed auctions. The funds associated with these auctions will not be accessible to us until a successful auction occurs, a buyer is found outside of the auction process or the underlying securities have matured or are called by the issuer. Given the ongoing disruptions in the credit markets and the fact that the liquidity for these types of securities remains uncertain, we have classified all of our auction rate securities as long-term assets in our consolidated balance sheet as of October 31, 2009, as our ability to liquidate such securities in the next 12 months is uncertain.
Our auction rate securities primarily consist of investments that are backed by pools of student loans guaranteed by the U.S. Department of Education and other asset-backed securities. Our marketable securities portfolio as of October 31, 2009 had a carrying value of $398 million, of which approximately $56 million consisted of illiquid auction rate securities. Given the ongoing disruption in the market for auction rate securities, there is no longer an actively quoted market price for these securities. Accordingly, we utilized a model to estimate the fair value of these auction rate securities based on, among other items: (i) the underlying structure of each security and the underlying collateral quality; (ii) the present value of future principal and interest payments discounted at rates considered to reflect current market conditions; (iii) consideration of the probabilities of default, auction failure or repurchase at par for each period; and (iv) estimates of the recovery rates in the event of default for each security. These estimated fair values could change significantly based on future market conditions.
We evaluate our investments periodically for possible other-than-temporary impairment by reviewing factors such as the length of time and extent to which fair value has been below cost basis, the financial condition of the issuer and insurance guarantor, and our ability and intent to hold the investment for a period of time sufficient for anticipated recovery of market value. Based on an analysis of other-than-temporary impairment factors, we recorded an other-than-temporary impairment in the statement of operations of $11.5 million for the fiscal year ended October 31, 2009 related to our auction rate securities, of which $2 million was recorded as an
59
Table of Contents
impairment during the three months ended October 31, 2009. We have also recorded an unrealized gain within accumulated other comprehensive loss of approximately $2.1 million (net of tax of $0.5 million), primarily for our auction rate securities that are backed by pools of student loans as of October 31, 2009.
Investments in money market funds include investments in the Reserve Primary Fund and the Reserve International Liquidity Fund (collectively referred to as the “Reserve Funds”). The net asset value for the Reserve Funds fell below $1 because the funds had holdings of commercial paper and other notes with a major investment bank which filed for bankruptcy on September 15, 2008. As a result of these events, these funds are no longer classified as cash and cash equivalents. We have classified these investments as short-term marketable securities because, based on the maximum maturity date of the underlying securities as well as the proposed liquidation plan and distribution updates received for the funds, we believe that within one year, these investments will be redeemable. We received approximately $20.0 million from the distribution of these funds during fiscal year 2009, reducing the value of our remaining holdings of these funds to $3.1 million as of October 31, 2009.
The fair value of our convertible senior notes is subject to interest rate risk, market risk and other factors due to the convertible feature. The fair value of the convertible notes will generally increase as interest rates fall and decrease as interest rates rise. In addition, the fair value of the convertible notes will generally increase as our share price increases and decreases as the share price declines. The interest and market value changes affect the fair value of our convertible notes but do not impact our financial position, cash flows or results of operations due to the fixed nature of the our debt. Additionally, we do not carry the convertible senior notes at fair value. We present the fair value of the convertible notes as required and for disclosure purposes only.
60
Table of Contents
| Item 8. | Financial Statements and Supplementary Data |
| Page | ||
| Index to Consolidated Financial Statements |
||
| Consolidated Financial Statements: |
||
| 62 | ||
| 63 | ||
| 64 | ||
| 65 | ||
| 66 | ||
| 67 | ||
| 105 |
61
Table of Contents
REPORT OF INDEPENDENT REGISTERED PUBLIC ACCOUNTING FIRM
To the Shareholders and Board of Directors of Verigy Ltd.:
In our opinion, the consolidated financial statements listed in the accompanying index present fairly, in all material respects, the financial position of Verigy Ltd. and its subsidiaries at October 31, 2009 and 2008, and the results of their operations and their cash flows for each of the three years in the period ended October 31, 2009 in conformity with accounting principles generally accepted in the United States of America. In addition, in our opinion, the financial statement schedule listed in the index appearing in Item 15(a)2 presents fairly, in all material respects, the information set forth therein when read in conjunction with the related consolidated financial statements. Also in our opinion, the Company maintained, in all material respects, effective internal control over financial reporting as of October 31, 2009, based on criteria established in Internal Control—Integrated Framework issued by the Committee of Sponsoring Organizations of the Treadway Commission (COSO). The Company’s management is responsible for these financial statements and financial statement schedule, for maintaining effective internal control over financial reporting and for its assessment of the effectiveness of internal control over financial reporting, included in Management’s Annual Report on Internal Control over Financial Reporting appearing under Item 9A. Our responsibility is to express opinions on these financial statements, on the financial statement schedule, and on the Company’s internal control over financial reporting based on our integrated audits. We conducted our audits in accordance with the standards of the Public Company Accounting Oversight Board (United States). Those standards require that we plan and perform the audits to obtain reasonable assurance about whether the financial statements are free of material misstatement and whether effective internal control over financial reporting was maintained in all material respects. Our audits of the financial statements included examining, on a test basis, evidence supporting the amounts and disclosures in the financial statements, assessing the accounting principles used and significant estimates made by management, and evaluating the overall financial statement presentation. Our audit of internal control over financial reporting included obtaining an understanding of internal control over financial reporting, assessing the risk that a material weakness exists, and testing and evaluating the design and operating effectiveness of internal control based on the assessed risk. Our audits also included performing such other procedures as we considered necessary in the circumstances. We believe that our audits provide a reasonable basis for our opinions.
As discussed in Note 2 to the consolidated financial statements, the Company changed the manner in which it accounts for uncertainty in income taxes in fiscal year 2008 and the manner in which it accounts for its defined benefit pension and other postretirement plans in fiscal year 2007.
A company’s internal control over financial reporting is a process designed to provide reasonable assurance regarding the reliability of financial reporting and the preparation of financial statements for external purposes in accordance with generally accepted accounting principles. A company’s internal control over financial reporting includes those policies and procedures that (i) pertain to the maintenance of records that, in reasonable detail, accurately and fairly reflect the transactions and dispositions of the assets of the company; (ii) provide reasonable assurance that transactions are recorded as necessary to permit preparation of financial statements in accordance with generally accepted accounting principles, and that receipts and expenditures of the company are being made only in accordance with authorizations of management and directors of the company; and (iii) provide reasonable assurance regarding prevention or timely detection of unauthorized acquisition, use, or disposition of the company’s assets that could have a material effect on the financial statements.
Because of its inherent limitations, internal control over financial reporting may not prevent or detect misstatements. Also, projections of any evaluation of effectiveness to future periods are subject to the risk that controls may become inadequate because of changes in conditions, or that the degree of compliance with the policies or procedures may deteriorate.
/s/ PricewaterhouseCoopers LLP
San Jose, California
December 21, 2009
62
Table of Contents
CONSOLIDATED STATEMENTS OF OPERATIONS
| Year Ended October 31, | ||||||||||||
| 2009 | 2008 | 2007 | ||||||||||
| (in millions, except share and per share amounts) |
||||||||||||
| Net revenue: |
||||||||||||
| Products |
$ | 201 | $ | 531 | $ | 615 | ||||||
| Services |
122 | 160 | 146 | |||||||||
| Total net revenue |
323 | 691 | 761 | |||||||||
| Cost of sales: |
||||||||||||
| Cost of products |
133 | 270 | 318 | |||||||||
| Costs of services |
82 | 114 | 103 | |||||||||
| Total cost of sales |
215 | 384 | 421 | |||||||||
| Operating expenses: |
||||||||||||
| Research and development |
92 | 103 | 91 | |||||||||
| Selling, general and administrative |
117 | 154 | 145 | |||||||||
| Restructuring charges |
8 | 2 | 1 | |||||||||
| Separation costs |
— | — | 4 | |||||||||
| Total operating expenses |
217 | 259 | 241 | |||||||||
| (Loss) income from operations |
(109 | ) | 48 | 99 | ||||||||
| Interest income and other |
4 | 23 | 17 | |||||||||
| Impairment of investments |
(18 | ) | (31 | ) | (2 | ) | ||||||
| (Loss) income before income taxes |
(123 | ) | 40 | 114 | ||||||||
| Provision for income taxes |
4 | 12 | 17 | |||||||||
| Net (loss) income |
$ | (127 | ) | $ | 28 | $ | 97 | |||||
| Net (loss) income per share—basic: |
$ | (2.17 | ) | $ | 0.48 | $ | 1.63 | |||||
| Net (loss) income per share—diluted: |
$ | (2.17 | ) | $ | 0.47 | $ | 1.61 | |||||
| Weighted average shares (in thousands) used in computing net (loss) income per share: |
||||||||||||
| Basic: |
58,437 | 59,574 | 59,190 | |||||||||
| Diluted: |
58,437 | 60,360 | 59,883 | |||||||||
The accompanying notes are an integral part of these consolidated financial statements.
63
Table of Contents
CONSOLIDATED BALANCE SHEETS
| October 31, | ||||||||
| 2009 | 2008 | |||||||
| (in millions, except share |
||||||||
| ASSETS |
||||||||
| Current assets: |
||||||||
| Cash and cash equivalents |
$ | 197 | $ | 144 | ||||
| Short-term marketable securities |
167 | 196 | ||||||
| Trade accounts receivable, net |
54 | 74 | ||||||
| Inventory |
55 | 78 | ||||||
| Other current assets |
40 | 46 | ||||||
| Total current assets |
513 | 538 | ||||||
| Property, plant and equipment, net |
41 | 42 | ||||||
| Long-term marketable securities |
75 | 71 | ||||||
| Goodwill and other intangibles, net |
20 | 18 | ||||||
| Other long-term assets |
62 | 65 | ||||||
| Total assets |
$ | 711 | $ | 734 | ||||
| LIABILITIES AND SHAREHOLDERS’ EQUITY |
||||||||
| Current liabilities: |
||||||||
| Accounts payable |
$ | 40 | $ | 65 | ||||
| Employee compensation and benefits |
32 | 41 | ||||||
| Deferred revenue, current |
26 | 53 | ||||||
| Income taxes and other taxes payable |
3 | 3 | ||||||
| Other current liabilities |
22 | 34 | ||||||
| Total current liabilities |
123 | 196 | ||||||
| Long-term liabilities: |
||||||||
| Convertible senior notes |
138 | — | ||||||
| Income taxes payable |
15 | 13 | ||||||
| Other long-term liabilities |
33 | 36 | ||||||
| Total liabilities |
309 | 245 | ||||||
| Commitments and contingencies (Note 22) |
||||||||
| Shareholders’ equity |
||||||||
| Ordinary shares, no par value; 58,841,248 and 57,822,242 issued and outstanding at October 31, 2009 and October 31, 2008, respectively |
||||||||
| Additional paid in capital |
429 | 406 | ||||||
| (Accumulated deficit) retained earnings |
(23 | ) | 105 | |||||
| Accumulated other comprehensive loss |
(4 | ) | (22 | ) | ||||
| Total shareholders’ equity |
402 | 489 | ||||||
| Total liabilities and shareholders’ equity |
$ | 711 | $ | 734 | ||||
The accompanying notes are an integral part of these consolidated financial statements.
64
Table of Contents
CONSOLIDATED STATEMENTS OF CASH FLOWS
| Year Ended October 31, |
||||||||||||
| 2009 | 2008 | 2007 | ||||||||||
| (in millions) | ||||||||||||
| Cash flows from operating activities: |
||||||||||||
| Net (loss) income |
$ | (127 | ) | $ | 28 | $ | 97 | |||||
| Adjustments to reconcile net (loss) income to net cash (used in) provided by operating activities: |
||||||||||||
| Depreciation and amortization |
16 | 15 | 13 | |||||||||
| In-process research and development charge |
4 | — | — | |||||||||
| Gross excess and obsolete inventory-related provisions |
25 | 30 | 12 | |||||||||
| Loss on disposal of property, plant and equipment |
— | 2 | 1 | |||||||||
| Share-based compensation |
19 | 17 | 14 | |||||||||
| Excess tax benefits from share-based compensation |
— | (1 | ) | (2 | ) | |||||||
| Impairment of investments |
18 | 31 | 2 | |||||||||
| Changes in assets and liabilities, net of effect of acquisition: |
||||||||||||
| Trade accounts receivable, net |
19 | 35 | 1 | |||||||||
| Receivables from Agilent |
— | — | 8 | |||||||||
| Inventory |
(1 | ) | (31 | ) | 2 | |||||||
| Accounts payable |
(26 | ) | (11 | ) | 1 | |||||||
| Payables to Agilent |
— | (1 | ) | (31 | ) | |||||||
| Employee compensation and benefits |
(9 | ) | (12 | ) | 10 | |||||||
| Deferred revenue, current |
(25 | ) | (12 | ) | 7 | |||||||
| Income taxes and other taxes payable |
(2 | ) | (9 | ) | (9 | ) | ||||||
| Other current assets and accrued liabilities |
(3 | ) | 5 | (2 | ) | |||||||
| Other long term assets and long term liabilities |
(2 | ) | 11 | (3 | ) | |||||||
| Net cash (used in) provided by operating activities |
(94 | ) | 97 | 121 | ||||||||
| Cash flows from investing activities: |
||||||||||||
| Acquisitions and investment, net of cash acquired |
— | (28 | ) | — | ||||||||
| Proceeds from disposition of assets |
2 | — | — | |||||||||
| Purchases of available-for-sale marketable securities |
(222 | ) | (293 | ) | (568 | ) | ||||||
| Proceeds from sales of available-for-sale marketable securities |
74 | 101 | 105 | |||||||||
| Proceeds from maturities of available-for-sale marketable securities |
164 | 206 | 185 | |||||||||
| Investment in property, plant and equipment |
(8 | ) | (12 | ) | (12 | ) | ||||||
| Reclassification to short-term marketable securities |
— | (25 | ) | — | ||||||||
| Net cash provided by (used in) investing activities |
10 | (51 | ) | (290 | ) | |||||||
| Cash flows from financing activities: |
||||||||||||
| Proceeds from issuance of convertible senior notes |
138 | — | — | |||||||||
| Issuance costs related to the issuance of convertible senior notes |
(5 | ) | — | — | ||||||||
| Issuance of ordinary shares under employee stock plans |
5 | 8 | 12 | |||||||||
| Excess tax benefits from share-based compensation |
— | 1 | 2 | |||||||||
| Repurchase and retirement of ordinary shares |
(1 | ) | (53 | ) | — | |||||||
| Net cash provided by (used in) financing activities |
137 | (44 | ) | 14 | ||||||||
| Effect of exchange rate movements |
— | (4 | ) | 1 | ||||||||
| Net increase (decrease) in cash and cash equivalents |
53 | (2 | ) | (154 | ) | |||||||
| Cash and cash equivalents at beginning of period |
144 | 146 | 300 | |||||||||
| Cash and cash equivalents at end of period |
$ | 197 | $ | 144 | $ | 146 | ||||||
| Supplemental disclosures of cash flow information: |
||||||||||||
| Cash paid for income taxes |
$ | 6 | $ | 12 | $ | 9 | ||||||
The accompanying notes are an integral part of these consolidated financial statements.
65
Table of Contents
CONSOLIDATED STATEMENTS OF SHAREHOLDERS’ EQUITY
| Number of Shares |
Additional Paid-In Capital |
Retained Earnings |
Accumulated Other Comprehensive Income (Loss) |
Total | |||||||||||||||
| (in millions, except number of shares in thousands) | |||||||||||||||||||
| Balance as of October 31, 2006 |
58,652 | $ | 358 | $ | 34 | $ | (3 | ) | $ | 389 | |||||||||
| Components of comprehensive income: |
|||||||||||||||||||
| Net income |
— | — | 97 | — | 97 | ||||||||||||||
| Change in unrealized gain (loss) on marketable securities and others, net of tax |
— | — | — | (1 | ) | (1 | ) | ||||||||||||
| Change in minimum pension liability, net of tax |
— | — | — | 1 | 1 | ||||||||||||||
| Change in foreign currency translation, net of tax |
— | — | — | 1 | 1 | ||||||||||||||
| Total comprehensive income |
98 | ||||||||||||||||||
| Adjustment to initially apply accounting guidance for defined benefit pension and other postretirement plans, net of tax |
— | — | — | (12 | ) | (12 | ) | ||||||||||||
| Issuance of ordinary shares under employee stock plans and employee shares purchase plan |
1,053 | 12 | — | — | 12 | ||||||||||||||
| Tax benefits from stock option exercises |
— | 2 | — | — | 2 | ||||||||||||||
| Share-based compensation |
— | 14 | — | — | 14 | ||||||||||||||
| Changes in deferred taxes related to separation from Agilent |
— | (5 | ) | — | — | (5 | ) | ||||||||||||
| Balance as of October 31, 2007 |
59,705 | $ | 381 | $ | 131 | $ | (14 | ) | $ | 498 | |||||||||
| Components of comprehensive income: |
|||||||||||||||||||
| Net income |
— | — | 28 | — | 28 | ||||||||||||||
| Change in unrealized gain (loss) on marketable securities and others, net of tax |
— | — | — | (3 | ) | (3 | ) | ||||||||||||
| Change in unrealized gain (loss) on derivatives, net of tax |
— | — | — | (7 | ) | (7 | ) | ||||||||||||
| Change in minimum pension liability, net of tax |
— | — | — | 6 | 6 | ||||||||||||||
| Change in foreign currency translation, net of tax |
— | — | — | (4 | ) | (4 | ) | ||||||||||||
| Total comprehensive income |
20 | ||||||||||||||||||
| Cumulative adjustment for the adoption of accounting guidance for uncertainty in income taxes |
— | — | (1 | ) | — | (1 | ) | ||||||||||||
| Issuance of ordinary shares under employee stock plans and employee shares purchase plan |
754 | 7 | — | — | 7 | ||||||||||||||
| Repurchase of ordinary shares |
(2,637 | ) | — | (53 | ) | — | (53 | ) | |||||||||||
| Tax benefits from stock option exercises |
— | 1 | — | — | 1 | ||||||||||||||
| Share-based compensation |
— | 17 | — | — | 17 | ||||||||||||||
| Balance as of October 31, 2008 |
57,822 | $ | 406 | $ | 105 | $ | (22 | ) | $ | 489 | |||||||||
| Components of comprehensive income: |
|||||||||||||||||||
| Net loss |
— | — | (127 | ) | — | (127 | ) | ||||||||||||
| Change in unrealized gain (loss) on marketable securities and others, net of tax |
— | — | — | 3 | 3 | ||||||||||||||
| Change in unrealized gain (loss) on derivatives, net of tax |
— | — | — | 8 | 8 | ||||||||||||||
| Change in minimum pension liability, net of tax |
— | — | — | 6 | 6 | ||||||||||||||
| Change in foreign currency translation, net of tax |
— | — | — | 1 | 1 | ||||||||||||||
| Total comprehensive loss |
(109 | ) | |||||||||||||||||
| Issuance of ordinary shares under employee stock plans and employee shares purchase plan |
1,216 | 5 | — | — | 5 | ||||||||||||||
| Repurchase of ordinary shares |
(197 | ) | — | (1 | ) | — | (1 | ) | |||||||||||
| Tax benefits from stock option exercises |
— | (1 | ) | — | — | (1 | ) | ||||||||||||
| Share-based compensation |
— | 19 | — | — | 19 | ||||||||||||||
| Balance as of October 31, 2009 |
58,841 | $ | 429 | $ | (23 | ) | $ | (4 | ) | $ | 402 | ||||||||
The accompanying notes are an integral part of these consolidated financial statements.
66
Table of Contents
Overview
Prior to our initial public offering in June 2006, we were a wholly-owned subsidiary of Agilent Technologies, Inc. (“Agilent”). We became an independent company, incorporated in Singapore on June 1, 2006, when we separated from Agilent. On June 13, 2006, we completed our initial public offering and became a separate, stand-alone publicly-traded company focused on technology and innovation in semiconductor testing. We design, develop, manufacture and sell advanced test systems and solutions for the semiconductor industry.
We offer a single platform for each of the general categories of devices being tested: our V93000 Series platform, designed to test System-on-a-Chip (“SOC”), System-in-a-Package (“SIP”) and high-speed memory devices; our V6000 Series platform, which is the successor to the V5000 platform, designed to test both “flash” memory and dynamic random access memory (“DRAM”) devices, and our V101 platform, introduced in the third quarter of fiscal year 2009, designed to test highly cost-sensitive devices such as 4, 8 and 16-bit micro-controller units (“MCUs”). Also during the third quarter, we acquired the assets and business of Touchdown Technologies, a manufacturer of advanced memory probe cards.
2. SUMMARY OF SIGNIFICANT ACCOUNTING POLICIES
Basis of presentation. The accompanying financial data has been prepared by us pursuant to the rules and regulations of the U.S. Securities and Exchange Commission (“SEC”). Our fiscal year end is October 31, and our fiscal quarters end on January 31, April 30, July 31 and October 31. Unless otherwise stated, all dates refer to our fiscal years and fiscal periods. Amounts included in the accompanying consolidated financial statements are expressed in U.S. dollars.
In the opinion of management, the accompanying consolidated financial statements reflect all adjustments—which are of a normal and recurring nature—necessary to fairly state the financial position, results of operations and cash flows for the dates and periods presented.
On June 15, 2009, we acquired Touchdown Technologies (“Touchdown”), a privately held company. Touchdown provides advanced MEMS probe cards which are designed to improve wafer throughput and yields for memory manufacturers. From the acquisition date, the results of operations of Touchdowns’ business are included in our consolidated statements of operations. Also see Note 10, “Acquisition of Touchdown Technologies.”
In the third quarter of fiscal year 2008, we recorded a $2.6 million adjustment in interest income and other, related to foreign currency remeasurement gains. These gains related to a failure to remeasure certain foreign currency assets and liabilities, primarily value added tax receivables, arising in fiscal years 2006, 2007 and the first two quarters of fiscal year 2008. Management has assessed the impact of this adjustment and does not believe the amounts are material, either individually or in the aggregate, to any of the prior years’ financial statements, and the impact of correcting these errors in the third quarter of fiscal year 2008 was not material to the full fiscal year 2008 financial statements.
Principles of consolidation. The consolidated financial statements include the accounts of the company and our wholly owned subsidiaries. All significant intercompany accounts and transactions have been eliminated.
Use of estimates. The preparation of financial statements in accordance with accounting principles generally accepted in the U.S. requires management to make estimates and assumptions that affect the amounts reported in our consolidated financial statements and accompanying notes. Management bases its estimates on historical experience and various other assumptions it believes to be reasonable. Although these estimates are based on management’s knowledge of current events and actions that may impact us in the future, actual results may be different from the estimates. Our critical accounting policies are those that affect our financial statements materially and involve difficult, subjective or complex judgments by management. Those policies are revenue
67
Table of Contents
recognition, restructuring, inventory valuation, warranty, share-based compensation, retirement and post-retirement plan assumptions, valuation of goodwill and long-lived assets, valuation of marketable securities and accounting for income taxes.
Revenue recognition. Net revenue is derived from the sale of products and services and is adjusted for estimated returns and allowances, which historically have been insignificant. Consistent with accounting principles generally accepted in the U.S., we recognize revenue on the sale of semiconductor test equipment when there is persuasive evidence of an arrangement, delivery has occurred or services have been rendered, the sales price is fixed or determinable and collectibility is reasonably assured. Delivery is considered to have occurred when title and risk of loss have transferred to the customer, for products, or when service has been performed. We consider the price to be fixed or determinable when the price is not subject to refund or adjustments. At the time we take an order, we evaluate the creditworthiness of our customers to determine the appropriate timing of revenue recognition. For sales or arrangements that include customer-specified acceptance criteria, including those where acceptance is required upon achievement of performance milestones or fulfillment of other future obligations, revenue is recognized after the acceptance criteria have been met. If the criteria are not met, then revenue is deferred until such criteria are met or until the period(s) over which the last undelivered element is delivered. To the extent that a contingent payment exceeds the fair value of the undelivered element, we defer the contingent payment.
Product revenue. Our product revenue is generated predominantly from the sales of various types of test equipment. Software is embedded in many of our test equipment products, but the software component is considered to be incidental. For sales or arrangements that include customer-specified acceptance criteria, including those where acceptance is required upon achievement of performance milestones or fulfillment of other future obligations, revenue is recognized after the acceptance criteria have been met. For products that include installation, if we have previously successfully installed similar equipment, product revenue is recognized upon delivery, and recognition of installation revenue is delayed until the installation is complete. Otherwise, neither the product nor the installation revenue is recognized until the installation is complete.
Service revenue. Revenue from services includes extended warranty, customer support, consulting, training and education. Service revenue is deferred and recognized over the contractual period or as services are rendered to the customer. For example, customer support contracts are recognized ratably over the contractual period, while training revenue is recognized as the training is provided to the customer. In addition, the four revenue recognition criteria described above must be met before service revenue is recognized.
Multiple element arrangements. We use objective evidence of fair value to allocate revenue to elements in multiple element arrangements and recognize revenue when the criteria for revenue recognition have been met for each element. If the criteria are not met, then revenue is deferred until such criteria are met or until the period(s) over which the last undelivered element is delivered. In the absence of objective evidence of fair value of a delivered element, we allocate revenue to the fair value of the undelivered elements and the residual revenue to the delivered elements. The price charged when an element is sold separately determines fair value. To the extent that a contingent payment exceeds the fair value of the undelivered element, we defer the contingent payment.
Warranty revenue and cost. We generally provide a one-year warranty on products commencing upon installation or delivery. We accrue for warranty costs in accordance with accounting principles generally accepted in the U.S., based on historical trends in warranty charges as a percentage of gross product shipments. Estimated warranty charges are recorded within cost of products at the time revenue is recognized and the liability is reported in other current liabilities on the consolidated balance sheet. The accrual is reviewed regularly and periodically adjusted to reflect changes in warranty cost estimates. For some products, we also sell extended warranties beyond one year. Revenue related to our extended warranty contracts beyond one year is recorded as long-term deferred revenue in the consolidated balance sheets and recognized on a straight-line basis over the contract period. Related costs are expensed as incurred.
68
Table of Contents
Deferred revenue. Deferred revenue is primarily comprised of extended warranty, revenue deferred for installations yet to be completed, and advanced billing and customer deposits for service, support and maintenance agreements.
Trade accounts receivable, net. Trade accounts receivable are recorded at the invoiced amount and do not bear interest. Our accounts receivable have been reduced by an allowance for doubtful accounts, which is our best estimate of the amount of probable credit losses in our existing accounts receivable. We determine the allowance based on customer specific experience and the aging of our receivables, among other factors. Our allowance for doubtful accounts was $0.4 million, $0.1 million and $0.1 million as of October 31, 2009, 2008, and 2007, respectively.
Restructuring. We recognize a liability for restructuring costs only when the liability is incurred. The restructuring accruals are based upon management estimates at the time they are recorded. These estimates can change depending upon changes in facts and circumstances subsequent to the date the original liability was recorded. The three main components of our restructuring charges are workforce reductions, consolidating facilities and asset impairments. Workforce-related charges are accrued when it is determined that a liability has been incurred, which is generally when individuals have been notified of their termination dates and expected severance payments. Plans to eliminate excess facilities result in charges for lease termination fees and future commitments to pay lease charges, net of estimated future sublease income. We recognize charges for elimination of excess facilities when we have vacated the premises. Asset impairments primarily consist of property, plant and equipment associated with excess facilities being eliminated, and are based on an estimate of the amounts and timing of future cash flows related to the expected future remaining use and ultimate sale or disposal of the property, plant and equipment. These estimates were derived using accounting principles generally accepted in the U.S. If the amounts and timing of cash flows from restructuring activities are significantly different from what we have estimated, the actual amount of restructuring and asset impairment charges could be materially different, either higher or lower, than those we have recorded.
Share-based compensation. On November 1, 2005, we adopted accounting guidance for share-based awards. Under this guidance, share-based compensation expense is primarily based on estimated grant date fair value using the Black-Scholes option pricing model and is recognized on a straight-line basis for awards granted after November 1, 2005 over the vesting period of the award. Our estimate of share-based compensation expense requires a number of complex and subjective assumptions including our stock price volatility, employee exercise patterns (expected life of the options), future forfeitures and related tax effects. The assumptions used in calculating the fair value of share-based awards represent our best estimates, but these estimates involve inherent uncertainties and the application of management judgment. Although we believe the assumptions and estimates we have made are reasonable and appropriate, changes in assumptions could materially impact our reported financial results. We incurred $19 million, $17 million, and $14 million in share-based compensation expense during fiscal years 2009, 2008, and 2007 respectively. Also see Note 8, “Share-Based Compensation” for additional information.
Retirement and post-retirement plan assumptions. Retirement and post-retirement benefit plan costs are a significant cost of doing business. They represent obligations that will ultimately be settled sometime in the future and therefore are subject to estimation. Pension accounting is intended to reflect the recognition of future benefit costs over the employees’ average expected future service based on the terms of the plans and the investment and funding decisions made by us. To estimate the impact of these future payments and our decisions concerning funding of these obligations, we are required to make assumptions using actuarial concepts within the framework of U.S. GAAP. Two critical assumptions are the discount rate and the expected long-term return on plan assets. Other important assumptions include the health care cost trend rate, expected future salary increases, expected future increases to benefit payments, expected retirement dates, employee turnover and retiree mortality rates. We evaluate these assumptions at least annually.
The discount rate is used to determine the present value of future benefit payments at the measurement date or October 31. The discount rate for U.S. plans was determined based on published rates for high quality
69
Table of Contents
corporate bonds. The discount rate for non-U.S. plans was generally determined in a similar manner. Differences between the expected future cash flows of our plans and the maturities of the high quality corporate bonds are not expected to have a material impact on the selection of discount rates. As discount rates decrease, we would expect our net plan costs to increase and as discount rates increase we would expect our net plan costs to decrease. The accounting guidance for defined benefit pension and other postretirement plans became effective for us as of October 31, 2007 and required recognition of an asset or liability in the statement of financial position reflecting the funded status of pension and postretirement benefit plans such as retiree health and life, with current year changes recognized in shareholders’ equity. In fiscal year 2007, in order to recognize the funded status of our pension and post-retirement benefit plans in accordance with this accounting guidance, we recorded additional liabilities by a cumulative amount of $18 million, of which $12 million (net of tax of $6 million) was recorded as an increase to accumulated other comprehensive loss. These losses are being recognized over the expected average future service lives of plan participants. Also see Note 20, “Retirement Plans and Post-Retirement Benefits.”
The expected long-term return on plan assets is estimated using current and expected asset allocations, as well as historical and expected returns. Declining rate of return assumptions generally result in increased pension expense while increasing rate of return assumptions generally result in lower pension expense. A one percent change in the estimated long-term return on our pension plan assets would result in a $0.4 million impact on pension expense for our fiscal year 2009. There are no plan assets related to our post-retirement health care plans.
Workforce-related events such as restructurings or divestitures can result in curtailment and settlement gains or losses to the extent they have an impact on the average future working lifetime or total number of participants in our retirement and postretirement plans.
Valuation of goodwill and other long-lived assets. We adopted accounting guidance for goodwill and other intangible assets on November 1, 2002 and recorded an allocation of goodwill from Agilent. Goodwill is not amortized but is reviewed annually (or more frequently if impairment indicators arise) for impairment. We perform our annual goodwill impairment analysis in the fourth quarter of our fiscal year. Impairment indicators include the significant decrease in market price of an asset, significant adverse changes in the extent or use or physical condition of an asset, significant adverse change in legal or regulatory factors affecting an asset, accumulation of costs significantly in excess of expected costs to acquire or construct an asset, operating or cash flow losses (or projections of losses) that demonstrates continuing losses associated with the use of an asset, or a current expectation that is more likely than not, that an asset will be sold or disposed of significantly before the end of its previously estimated useful life.
The process of evaluating the potential impairment of goodwill and other intangibles is highly subjective and requires significant judgment. We estimate expected future cash flows then compare the carrying value including goodwill and other intangibles to the discounted future cash flows. If the total of future cash flows is less than the carrying amount of the assets, we recognize an impairment loss based on the excess of the carrying amount over the fair value of the assets. Estimates of the future cash flows associated with the assets are critical to these assessments. Changes in these estimates based on changed economic conditions or business strategies could result in material impairment charges in future periods.
Purchased intangible assets are carried at cost less accumulated amortization. Amortization is computed using the straight-line method over the economic lives of the respective assets, generally three to five years. We continually monitor events and changes in circumstances that could indicate carrying amounts of long-lived assets, including intangible assets, may not be recoverable. When such events or changes in circumstances occur, we assess the recoverability of long-lived assets by determining whether the carrying value of such assets will be recovered through undiscounted expected future cash flows. If the total of the undiscounted future cash flows is less than the carrying amount of those assets, we recognize an impairment loss based on the excess of the carrying amount over the fair value of the assets.
70
Table of Contents
Shipping and handling costs. Our shipping and handling costs charged to customers are included in net revenue and the associated expense is recorded in cost of products in the consolidated statements of operations for all years presented.
Advertising. Business specific advertising costs are expensed as incurred. Advertising costs were insignificant for all three years presented.
Research and development. Costs related to research, design and development of our products are charged to research and development expense as they are incurred.
Net (loss) income per share. Basic net (loss) income per share is computed by dividing net (loss) income—the numerator—by the weighted average number of common shares outstanding—the denominator—during the period. Diluted net (loss) income per share gives effect to all potentially dilutive common stock equivalents outstanding during the period. In computing diluted net (loss) income per share, the average stock price for the period is used in determining the number of shares assumed to be purchased from the proceeds of stock option exercises and unamortized share-based compensation. The calculation of dilutive net (loss) income per share excludes shares of potential ordinary shares if the effect is anti-dilutive. The dilutive effect of our convertible senior notes will be reflected in diluted net income per share by application of the if-converted method. The conversion is not assumed for purposes of computing diluted earnings per share if the effect would be anti-dilutive.
Cash and cash equivalents. We classify highly liquid investments as cash equivalents if their original or remaining maturity is three months or less at the date of purchase. Cash and cash equivalents consist of cash deposited in checking accounts and money market funds.
Marketable Securities. We account for our short-term marketable securities in accordance with accounting principles generally accepted in the U.S. We classify our marketable securities as available for sale at the time of purchase and re-evaluate such designation as of each consolidated balance sheet date. We amortize premiums and discounts against interest income over the life of the investment. Our marketable securities are classified as cash equivalents if the original maturity, from the date of purchase, is ninety days or less. Our marketable securities are classified as short-term investments if the original maturity, from the date of purchase, is in excess of ninety days since we intend to convert them into cash as necessary to meet our liquidity requirements.
Our marketable securities are reported at fair value with the related unrealized gains and losses included in accumulated other comprehensive income (loss), a component of shareholders’ equity, net of tax. Realized gains or losses on the sale of marketable securities are determined using the specific-identification method and were not material for fiscal year 2009. We evaluate our investments periodically for possible other-than-temporary impairment by reviewing factors such as the length of time and extent to which fair value has been below cost basis, the financial condition of the issuer and our ability and intent to hold the investment for a period of time which may be sufficient for anticipated recovery of market value. We record an impairment charge to the extent that the carrying value of our available for sale securities exceeds the estimated fair market value of the securities and the decline in value is determined to be other-than-temporary.
Accounting for income taxes. We adopted accounting guidance for the uncertainty in income taxes. This interpretation clarifies the criteria for recognizing income tax benefits, and requires additional disclosures about uncertain tax positions. Under this accounting guidance the financial statement recognition of the benefit for a tax position is dependent upon the benefit being more likely than not to be sustainable upon audit by the applicable taxing authority. If this threshold is met, the tax benefit is then measured and recognized at the largest amount that is greater than 50 percent likely of being realized upon ultimate settlement. This accounting guidance also required us to reclassify the majority of our uncertain tax positions from current to non-current in fiscal year 2008 (it does not allow for retroactive treatment or presentation). We recognize interest and penalties related to uncertain tax positions in our provision for income taxes line of our consolidated statements of operations.
71
Table of Contents
We record a tax provision for the anticipated tax consequences of the reported results of operations. In accordance with accounting principles generally accepted in the U.S., the provision for income taxes is computed using the asset and liability method, under which deferred tax assets and liabilities are recognized for the expected future tax consequences of temporary differences between the financial reporting and tax bases of assets and liabilities, and for operating losses and tax credit carryforwards. Deferred tax assets and liabilities are measured using the currently enacted tax rates that apply to taxable income in effect for the years in which those tax assets are expected to be realized or settled.
We are required to assess the realization of our net deferred tax assets and the need for a valuation allowance. This assessment requires that our management make judgments about benefits that could be realized from future taxable income, as well as other positive and negative factors influencing the realization of deferred tax assets. We had a valuation allowance of $3 million as of October 31, 2009, compared to $1 million of such allowances as of October 31, 2008. The net increase of this valuation allowance is attributable to deferred taxes related to capital losses which can only be realized through the generation of future capital gains.
Undistributed earnings of our Domestic (U.S.) and Foreign Subsidiaries are indefinitely reinvested in the respective operations. No provision has been made for taxes that might be payable upon remittance of such earnings, nor is it practicable to determine the amount of this liability.
Our effective tax rate varies based on a variety of factors, including overall profitability, the geographical mix of income before taxes and the related tax rates in the jurisdictions where we operate, restructuring and other one-time charges, as well as discrete events, such as settlements of future audits. We are subject to audits and examinations of our tax returns by tax authorities in various jurisdictions, including the Internal Revenue Service. We regularly assess the likelihood of adverse outcomes resulting from these examinations to determine the adequacy of our provision for income taxes.
Fair value of financial instruments. The carrying values of accounts receivable, accounts payables, accrued employee compensation and benefits and other accrued liabilities approximate fair value because of their short maturities. The fair values of marketable securities are reported in Note 12, “Marketable Securities.”
Concentration of credit risk. We sell our products through our direct sales force. In fiscal years 2009 and 2008, one of our customers accounted for 10% or more of our net revenue. In fiscal year 2007, two customers accounted for 10% or more of our net revenue. As of October 31, 2009, one customer accounted for 11.8% of our accounts receivable balance. As of October 31, 2008, two customers accounted for 28.2% of our accounts receivable balance, with one accounting for 16.5% and another accounting for 11.7%. We perform ongoing credit evaluations of our customers’ financial conditions, and require collateral, such as letters of credit and bank guarantees, in certain circumstances.
Concentration of suppliers and contract manufacturers. Certain components and parts used in our products are procured from a single or a limited group of suppliers, some of whom are relatively small in size. The failure of these suppliers to meet our requirements in a timely manner could impair our ability to ship products and to realize the related revenues when anticipated which could adversely affect our business and operating results. We rely entirely on contract manufacturers, which gives us less control over the manufacturing process and exposes us to significant risks, especially inadequate capacity, late delivery, substandard quality and high costs.
Derivative instruments. We currently enter into foreign currency forward contracts to minimize the short-term impact of the exchange rate fluctuations on euro-denominated cash flows, where the U.S. dollar is the functional currency, and Japanese yen-denominated cash flows and forecasted Japanese yen-denominated revenue. We currently believe these are our primary exposures to currency rate fluctuation. We have implemented a cash flow hedging strategy that is intended to mitigate our currency exposures by entering into foreign currency forward contracts that have maturities in excess of one month. These contracts are used to reduce our risk associated with exchange rate movements, as gains and losses on these contracts are intended to mitigate the effect of exchange rate fluctuations on certain foreign currency denominated revenues, costs and eventual cash flows.
72
Table of Contents
These foreign currency forward contracts are designated as cash flow hedges and are carried on our balance sheet at fair value with the effective portion of the foreign exchange gain (loss) being reported as a component of accumulated other comprehensive income (loss) in shareholders’ equity and later reclassified into the statement of operations as part of income from operations when the hedged transaction affects earnings. If the underlying foreign currency requirement being hedged fails to occur, or if a portion of any derivative is deemed to be ineffective, we will recognize the gain (loss) on the associated financial instrument in operating income in the statement of operations. As of October 31, 2009, the fair value of foreign currency forward contracts designated as cash flow hedges is approximately $1.5 million. This amount is included within current assets and the related gain of $1.1 million (net of tax of $0.4 million) is included within unrealized gains in accumulated other comprehensive loss.
We also enter into foreign currency forward contracts to hedge the gains and losses generated by the remeasurement of assets and liabilities denominated in currencies other than the functional currency. These contracts are generally for a period of 30 days or less and settled by the end of the month. The change in fair value of these balance sheet hedge contracts is recorded into earnings as a component of interest income and other and offsets the change in fair value of the remeasured assets and liabilities. Verigy does not use derivative financial instruments for trading or speculative purposes.
Inventory valuation. Inventory is valued at standard cost, which approximates actual cost computed on a first in first out basis. We assess the valuation of our inventory, including demonstration inventory, on a quarterly basis based upon estimates about future demand and actual usage. To the extent that we determine that we are holding excess or obsolete inventory, we write down the value of our inventory to its net realizable value. Such write-downs are reflected in cost of products and can be material in amount. The net impact of excess and obsolete inventory charges and the benefit from the sales of previously written down inventory on gross margin was $7 million for fiscal year 2009, $27 million for fiscal year 2008 and $8 million for fiscal year 2007. Our inventory assessment involves difficult estimates of future events and, as a result, additional write-downs may be required. If actual market conditions are more favorable than anticipated, inventory previously written down may be sold to customers, resulting in lower cost of products and higher income from operations than expected in that period. Once inventory is written down, a new cost basis is established, however, for tracking purposes, write-downs recorded as a reserve on the balance sheet and these inventory reserves are not relieved until the related inventory has been sold or scrapped. Excess and obsolete inventory resulting from shifts in demand or changes in market conditions for raw materials and components can result in significant volatility in our costs of products.
In our inventory valuation analysis, we also include inventory that we could be obligated to purchase from our suppliers based on our production forecasts. To the extent that our committed inventory purchases exceed our forecasted productions needs, we write down the value of those inventories by taking a charge to our cost of products and increasing our supplier liability.
Property, plant and equipment. Property, plant and equipment are stated at cost less accumulated depreciation and amortization. Additions, improvements and major renewals are capitalized; maintenance, repairs and minor renewals are expensed as incurred. When assets are retired or disposed of, the assets and related accumulated depreciation and amortization are removed from our general ledger and the resulting gain or loss is reflected in the consolidated statement of operations. Buildings and improvements are depreciated over ten to forty years, or the lease term if lower, and machinery and equipment over three to ten years. We are currently using the straight-line method to depreciate assets. However, prior to November 1, 2001, we depreciated assets principally using accelerated methods and will continue to be depreciated under those methods until they are fully depreciated or retired.
Capitalized software. We capitalize certain internal and external costs incurred to acquire or create internal use software in accordance with accounting principles generally accepted in the U.S. Capitalized software is included in property, plant and equipment and is depreciated over three to six years when development is complete.
73
Table of Contents
Impairment of long-lived assets. We continually monitor events and changes in circumstances that could indicate carrying amounts of long-lived assets, including intangible assets, may not be recoverable. When such events or changes in circumstances occur, we assess the recoverability of long-lived assets by determining whether the carrying value of such assets will be recovered through undiscounted expected future cash flows. If the total of the undiscounted future cash flows is less than the carrying amount of those assets, we recognize an impairment loss based on the excess of the carrying amount over the fair value of the assets.
Foreign currency translation. We follow accounting principles generally accepted in the U.S. for both the translation and remeasurement of balance sheet and income statement items into U.S. Dollars. For those business units that operate in a local currency functional environment, all assets and liabilities are translated into U.S. Dollars using the exchange rates in effect at the end of the period; revenue and expenses are translated using average exchange rates in effect during each period. Resulting translation adjustments are reported as a separate component of accumulated comprehensive income (loss) in shareholders’ equity.
For those business units that operate in a U.S. Dollar functional environment, foreign currency assets and liabilities are remeasured into U.S. Dollars using the exchange rates in effect at the end of the period except for nonmonetary assets and capital accounts, which are remeasured at historical exchange rates. Revenue and expenses are generally translated at monthly exchange rates which approximate average exchange rates in effect during each year, except for those expenses related to balance sheet amounts that are remeasured at historical exchange rates.
3. RECENT ACCOUNTING PRONOUNCEMENTS
In December 2007, the FASB issued an amendment to the accounting guidance for business combinations. This amendment provides revised guidance for recognizing and measuring identifiable assets and goodwill acquired, liabilities assumed and any noncontrolling interest in an acquiree. It also provides disclosure requirements to enable users of the financial statements to evaluate the nature and financial effects of a business combination. In April 2009, the FASB issued another amendment for assets acquired and liabilities assumed in a business combination that arise from contingencies. This amendment clarifies the previous amendment and addresses application issues raised by preparers, auditors and members of the legal profession on initial recognition and measurement, subsequent measurement and accounting, and disclosure of assets and liabilities arising from contingencies in a business combination. It is effective for fiscal years beginning on or after December 15, 2008, and will be applied prospectively. We are currently assessing the impact that these two amendments may have on our consolidated financial statements upon adoption in fiscal year 2010.
In December 2007, the FASB revised the accounting guidance for noncontrolling interests in consolidated financial statements, which requires that ownership interests in subsidiaries held by parties other than the parent, and the amount of consolidated net income, be clearly identified, labeled and presented in the consolidated financial statements. It also requires that once a subsidiary is deconsolidated, any retained noncontrolling equity investment in the former subsidiary be initially measured at fair value. Sufficient disclosures are required to clearly identify and distinguish between the interests of the parent and the interests of the noncontrolling owners. It is effective for fiscal years beginning on or after December 15, 2008, and requires retroactive adoption of the presentation and disclosure requirements for existing minority interests. All other requirements will be applied prospectively. We are currently assessing the impact that the accounting guidance may have on our consolidated financial statements upon adoption in fiscal year 2010.
In December 2008, the FASB issued new guidance for employers’ disclosures about postretirement benefit plan assets. The new guidance provides revised guidance on the disclosure requirement of employers’ disclosures about pensions and other postretirement benefits. It requires companies to provide qualitative disclosures about how investment allocation decisions are made, the inputs and valuation techniques used to measure the fair value of plan assets and the concentration of risk within plan assets. Additionally, quantitative disclosures are required showing the fair value of each major category of plan assets, the level in which each
74
Table of Contents
assets is classified within the fair value hierarchy and a reconciliation for the period of plan assets that are measured using significant unobservable inputs. It is effective for fiscal years ending after December 15, 2009. We are currently assessing the impact that the guidance may have on our consolidated financial statements upon adoption in fiscal year 2010.
In June 2009, the FASB amended the accounting guidance for transfers of financial assets. This amendment requires greater transparency and additional disclosures for transfers of financial assets and the entity’s continuing involvement with them and changes the requirements for derecognizing financial assets. In addition, this amendment eliminates the concept of a qualifying special-purpose entity. This amendment must be applied as of the beginning of each reporting entity’s first annual reporting period that begins after November 15, 2009, for interim periods within that first annual reporting period and for interim and annual reporting periods thereafter. Earlier application is prohibited. We are currently assessing the impact that this amendment may have on our consolidated financial statements upon adoption in fiscal year 2011.
In June 2009, the FASB amended the accounting guidance for the consolidation of variable interest entities. This amendment revised the evaluation criteria to identify the primary beneficiary of a variable interest entity. Additionally, this amendment requires ongoing reassessments of whether an enterprise is the primary beneficiary of the variable interest entity. The amendment is effective for our first annual reporting period that begins after November 15, 2009, for interim periods within that first annual reporting period, and for interim and annual reporting periods thereafter. We are currently assessing the impact that this amendment may have on our consolidated financial statements upon adoption in fiscal year 2011.
In June 2009, the FASB issued the FASB Accounting Standards Codification (Codification). The Codification will become the source of authoritative U.S. generally accepted accounting principles (GAAP) recognized by the FASB to be applied by nongovernmental entities. SEC rules and interpretive releases under authority of federal securities laws are also sources of authoritative GAAP for SEC registrants. The Codification supersedes all then-existing non-SEC accounting and reporting standards. All other nongrandfathered non-SEC accounting literature not included in the Codification will become nonauthoritative. The Codification is effective for financial statements issued for interim and annual periods ending after September 15, 2009, and it was effective for us in the fourth quarter of fiscal year 2009, and upon adoption, did not have an impact on our consolidated financial statements.
In August 2009, the FASB amended the accounting guidance for the fair value measurement of liabilities. The amended guidance clarifies that in circumstances in which a quoted price in an active market for the identical liability is not available, we are required to use the quoted price of the identical liability when traded as an asset, quoted prices for similar liabilities, or quoted prices for similar liabilities when traded as assets. If these quoted prices are not available, we are required to use another valuation technique, such as an income approach or a market approach. The amended guidance is effective for the first reporting period (including interim periods) beginning after issuance, and it is effective for us in the first quarter of fiscal year 2010 and is not expected to have a significant impact on our consolidated financial statements.
In October 2009, the FASB issued new accounting guidance for revenue recognition with multiple deliverables. The new guidance impacts the determination of when the individual deliverables included in a multiple-element arrangement may be treated as separate units of accounting. Additionally, the guidance modifies the manner in which the transaction consideration is allocated across the separately identified deliverables by no longer permitting the residual method of revenue recognition in accounting for multiple deliverable arrangements. The guidance will be effective prospectively for revenue arrangements entered into or materially modified in fiscal years beginning on or after June 15, 2010, and will be effective for us in the first quarter of fiscal year 2011, however early adoption is permitted. We are currently assessing the impact that the guidance may have on our consolidated financial statements upon adoption in fiscal year 2011.
In October 2009, the FASB issued new accounting guidance for the accounting for certain revenue arrangements that include software elements. The new guidance amends the scope of pre-existing software
75
Table of Contents
revenue guidance by removing from the guidance non-software components of tangible products and certain software components of tangible products. The new guidance will be effective prospectively for revenue arrangements entered into or materially modified in fiscal years beginning on or after June 15, 2010, and will be effective for us in the first quarter of fiscal year 2011, however early adoption is permitted. We are currently assessing the impact that the guidance may have on our consolidated financial statements upon adoption in fiscal year 2011.
4. FAIR VALUE MEASUREMENTS
In the first quarter of fiscal year 2009, we adopted accounting guidance for fair value measurements, which defines fair value as the price that would be received from selling an asset or paid to transfer a liability in an orderly transaction between market participants at the measurement date.
Concurrently with the adoption of the guidance for fair value measurements, we adopted accounting guidance for the fair value option for financial assets and financial liabilities, which permits entities to choose to measure many financial instruments and certain other items at fair value. As of October 31, 2009, we did not elect the fair value option for any financial assets and liabilities that were not previously measured at fair value.
In April 2009, the FASB issued accounting guidance for interim disclosures about fair value of financial instruments, which requires disclosures of fair value for any financial instruments not currently reflected on the balance sheet at fair value for all interim periods. The guidance is effective prospectively for interim and annual reporting periods ending after June 15, 2009. We adopted this guidance during the third quarter of 2009, and the adoption had no material impact on our results of operations or financial position.
The accounting guidance for fair value measurements requires that assets and liabilities carried at fair value be classified and disclosed in one of the following three categories:
Level 1:
Valuations based on quoted prices in active markets for identical assets or liabilities as of the reporting date. Our Level 1 assets consist of various money market fund deposits and certificate of deposits, all of which are traded in an active market with sufficient volume and frequency of transactions.
Level 2:
Valuations based on quoted prices for similar assets or liabilities, quoted prices in markets with insufficient volume or infrequent transactions, or model-derived valuations in which all significant inputs are observable or can be derived principally from or corroborated by observable market data for substantially the full term of the assets or liabilities. Our Level 2 assets and liabilities consist of derivative assets and liabilities, U.S. government agency securities and corporate debt securities which are priced using inputs that are observable in the market or can be derived principally from or corroborated by observable market data. Our derivative liabilities were immaterial as of October 31, 2009.
Level 3:
Valuations based on unobservable inputs to the valuation methodology that are significant to the measurement of fair value of assets or liabilities. Our Level 3 assets consist of auction rate securities and money market investments in the Reserve Primary Fund and the Reserve International Liquidity Fund.
76
Table of Contents
The following table sets forth our financial assets that were measured at fair value on a recurring basis as of October 31, 2009:
| Fair Value Measurement as of October 31, 2009 Using | ||||||||||||
| Quoted Prices in Active Markets for Identical Assets (Level 1) |
Significant Other Observable Inputs (Level 2) |
Significant Unobservable Inputs (Level 3) |
Total | |||||||||
| (in millions) | ||||||||||||
| Assets |
||||||||||||
| Money market funds |
$ | 155 | $ | — | $ | 3 | $ | 158 | ||||
| U.S. government agency securities and certificate of deposits |
13 | 40 | — | 53 | ||||||||
| Corporate debt securities |
— | 131 | — | 131 | ||||||||
| Auction rate securities |
— | — | 56 | 56 | ||||||||
| Derivative assets |
— | 2 | — | 2 | ||||||||
| Total assets measured at fair value |
$ | 168 | $ | 173 | $ | 59 | $ | 400 | ||||
The amounts in the table above are reported in the consolidated balance sheet as of October 31, 2009 as follows:
| Fair Value Measurement as of October 31, 2009 Using | ||||||||||||
| Quoted Prices in Active Markets for Identical Assets (Level 1) |
Significant Other Observable Inputs (Level 2) |
Significant Unobservable Inputs (Level 3) |
Total | |||||||||
| (in millions) | ||||||||||||
| Assets |
||||||||||||
| Cash equivalents |
$ | 156 | $ | — | $ | — | $ | 156 | ||||
| Short-term marketable securities |
— | 164 | 3 | 167 | ||||||||
| Other current assets |
— | 2 | — | 2 | ||||||||
| Long-term marketable securities |
12 | 7 | 56 | 75 | ||||||||
| Total assets measured at fair value |
$ | 168 | $ | 173 | $ | 59 | $ | 400 | ||||
The following table provides a summary of changes in fair value of our Level 3 financial assets as of October 31, 2009:
| Auction Rate Securities |
Money Market Funds |
|||||||
| (in millions) | ||||||||
| Balance as of October 31, 2008 |
$ | 71 | $ | 23 | ||||
| Other-than-temporary impairment |
(12 | ) | — | |||||
| Money market redemptions |
— | (20 | ) | |||||
| Unrealized gain included in other comprehensive income |
3 | — | ||||||
| Transfer out of Level 3 to Level 2(1) |
(6 | ) | — | |||||
| Balance as of October 31, 2009 |
$ | 56 | $ | 3 | ||||
| (1) | In the first half of fiscal year 2009, one of our auction rate securities was converted into a subordinated bond. |
77
Table of Contents
The following table presents the financial instruments that are not carried at fair value but which require fair value disclosure.
| As of October 31, 2009 | ||||||
| Carrying Value |
Fair Value | |||||
| Convertible senior notes due July 15, 2014 |
$ | 138 | $ | 143 | ||
| Total convertible notes |
$ | 138 | $ | 143 | ||
The fair value of the convertible notes at each balance sheet date is determined based on recent quoted market prices for these notes. (Also see Note 11, “Convertible Senior Notes”.)
5. DERIVATIVES AND HEDGING ACTIVITIES
We use derivative instruments primarily to manage exposures to foreign currency. Our primary objective in holding derivatives is to reduce the volatility of earnings and cash flows associated with changes in foreign currency. The program is not designated for trading or speculative purposes. Our derivatives expose us to credit risk to the extent that the counterparties may be unable to meet the terms of the agreement. We seek to mitigate such risk by limiting our counterparties to major financial institutions and by spreading the risk across several major financial institutions. In addition, the potential risk of loss with any one counterparty resulting from this type of credit risk is monitored on an ongoing basis.
In accordance with accounting principles generally accepted in the U.S., we recognize derivative instruments as either assets or liabilities on the balance sheet at fair value. Changes in fair value (i.e. gains or losses) of the derivatives are recorded as cost of sales, interest income and other, or as accumulated other comprehensive income (loss).
In March 2008, the FASB amended the accounting guidance for disclosures about derivative instruments and hedging activities. The amendment expands the disclosure requirements, and requires qualitative disclosures about objectives and strategies for using derivatives, quantitative disclosures about fair value amounts of and gains and losses on derivative instruments, and disclosures about credit-risk-related contingent features in derivative agreements. We adopted the reporting requirements during the second quarter of fiscal year 2009.
Cash Flow Hedges
We use forward contracts designated as cash flow hedges to hedge a portion of future forecasted purchases in Japanese yen, Chinese yuan, Singapore dollar and the euro. Changes in the fair value of derivatives that do not qualify for hedge accounting treatment, as well as the ineffective portion of hedges, if any, are recognized in the consolidated statement of operations. The effective portion of the foreign exchange gain (loss) is reported as a component of accumulated other comprehensive income (loss) in shareholders’ equity and is reclassified into the statement of operations when the hedged transaction affects earnings. All amounts included in accumulated other comprehensive loss as of October 31, 2009 will generally be reclassified into earnings within twelve months. Changes in the fair value of foreign currency forward exchange due to changes in time value are excluded from the assessment of effectiveness and are recognized in earnings. If the transaction being hedged fails to occur, or if a portion of any derivative is deemed to be ineffective, we will recognize the gain (loss) on the associated financial instrument in interest income and other in the statement of operations. We did not have any ineffective hedges during the periods presented. As of October 31, 2009, the total notional amount of outstanding forward contracts in place that hedged future purchases was approximately $38.8 million, based upon the exchange rate as of October 31, 2009. The forward contracts cover future purchases that are expected to occur over the next twelve months.
78
Table of Contents
Balance Sheet Hedges
Other derivatives not designated as hedging instruments consists primarily of forward contracts to minimize the risk associated with the foreign exchange effects of remeasuring monetary assets and liabilities. Monetary assets and liabilities denominated in foreign currencies and the associated outstanding forward contracts are marked-to-market as of October 31, 2009, with realized and unrealized gains and losses included in interest income and other. As of October 31, 2009, we had foreign currency forward contracts in place to hedge exposures in euro, Israeli shekel, Japanese yen, Singapore dollar, Malaysian ringgit, Canadian dollar, Korean won and the Taiwanese dollar. As of October 31, 2009, the total notional amount of outstanding forward contracts in place for foreign currency purchases was approximately $18.4 million and the total outstanding forward contracts in place for foreign currency sales was $13.0 million, based upon the exchange rates as of October 31, 2009.
For fiscal year ended October 31, 2009, non-designated foreign currency forward contracts resulted in a loss of $0.5 million. For fiscal year ended October 31, 2009, the remeasurement of the foreign currency exposures hedged by these forward contracts resulted in a loss of $0.8 million. All of the above noted gains and losses are included in interest income and other in our consolidated statements of operations.
The amounts in the tables below include fair value adjustments related to our own credit risk and counterparty credit risk.
Fair Value of Derivative Contracts
Fair value of derivative contracts was as follows:
| Derivative Assets Reported in Other Current Assets |
Derivative Liabilities Reported in Other Current Liabilities | |||||||||||
| October 31, 2009 |
October 31, 2008 |
October 31, 2009 |
October 31, 2008 | |||||||||
| (in millions) | ||||||||||||
| Foreign exchange contracts designated as cash flow hedges |
$ | 1.5 | $ | 0.1 | $ | — | $ | 9.6 | ||||
| Foreign exchange contracts not designated as cash flow hedges |
0.4 | 1.8 | 0.1 | 2.6 | ||||||||
| Total derivatives costs |
$ | 1.9 | $ | 1.9 | $ | 0.1 | $ | 12.2 | ||||
Effect of Designated Derivative Contracts on Accumulated Other Comprehensive Loss
The following table represents only the amounts recognized in other comprehensive loss for designated derivative contracts and the associated impact that was reclassified to the statement of operations as an (increase) decrease in cost of sales:
| (Loss) Recognized in OCI (Effective Portion) |
Location of Amounts Reclassified from Accumulated OCI into Earnings (Effective Portion) |
Amounts Reclassified from Accumulated OCI into Earnings (Effective Portion) |
||||||||
| Year Ended October 31, 2009 |
Year Ended October 31, 2009 |
|||||||||
| (in millions) | (in millions) | |||||||||
| Foreign exchange contracts |
$ | (4.9 | ) | Cost of Sales | $ | (6.1 | ) | |||
We did not have a significant amount of cash flow hedging activity for the three months and fiscal year ended October 31, 2008. Foreign exchange contracts designated as cash flow hedges relate to employee payroll and benefits as well as other costs primarily related to manufacturing. The associated gains and losses are expected to be recorded in cost of sales when reclassified from accumulated other comprehensive loss.
79
Table of Contents
We expect to realize the accumulated other comprehensive income balance related to foreign exchange contracts within the next twelve months.
Effect of Designated Derivative Contracts on the Consolidated Statements of Operations
The effect of designated derivative contracts on results of operations recognized as an (increase) decrease in cost of sales was as follows:
| Year Ended October 31, | |||||||
| (in millions) | |||||||
| 2009 | 2008 | ||||||
| Foreign exchange contracts designated as cash flow hedges |
$ | (6.1 | ) | $ | 0.2 | ||
Effect of Non-Designated Derivative Contracts on the Consolidated Statements of Operations
The effect of non-designated derivative contracts on results of operations recognized in interest income and other was as follows:
| Year Ended October 31, |
||||||||
| (in millions) | ||||||||
| 2009 | 2008 | |||||||
| Gain (loss) on foreign exchange contracts |
$ | (0.5 | ) | $ | (0.4 | ) | ||
6. NET (LOSS) INCOME PER SHARE
The following is a reconciliation of the basic and diluted net (loss) income per share computations for the periods presented below:
| Year Ended October 31, | ||||||||||
| 2009 | 2008 | 2007 | ||||||||
| Basic Net (Loss) Income Per Share: |
||||||||||
| Net (loss) income (in millions) |
$ | (127 | ) | $ | 28 | $ | 97 | |||
| Weighted average number of ordinary shares(1) |
58,437 | 59,574 | 59,190 | |||||||
| Basic net (loss) income per share |
$ | (2.17 | ) | $ | 0.48 | $ | 1.63 | |||
| Diluted Net (Loss) Income Per Share: |
||||||||||
| Net (loss) income (in millions) |
$ | (127 | ) | $ | 28 | $ | 97 | |||
| Weighted average number of ordinary shares(1) |
58,437 | 59,574 | 59,190 | |||||||
| Potentially dilutive common stock equivalents—stock options, restricted share units and other employee stock plans(1)(2) |
— | 786 | 693 | |||||||
| Total shares for purpose of calculating diluted net (loss) income per share(1) |
58,437 | 60,360 | 59,883 | |||||||
| Diluted net (loss) income per share |
$ | (2.17 | ) | $ | 0.47 | $ | 1.61 | |||
| (1) | Weighted average shares are presented in thousands. |
| (2) | The dilutive effect of our convertible senior notes will be reflected in diluted net income per share by application of the if-converted method. The conversion is not assumed for purposes of computing diluted earnings per share if the effect would be anti-dilutive. Also see Note 11, “Convertible Senior Notes.” |
80
Table of Contents
The dilutive effect of outstanding options and restricted share units is reflected in diluted net income per share, but not loss per share, by application of the treasury stock method, which includes consideration of share-based compensation required by accounting principles generally accepted in the U.S.
The following table presents those options to purchase ordinary shares, restricted share units outstanding and convertible senior notes which were not included in the computation of diluted net (loss) income per share because the effect of their inclusion was anti-dilutive:
| Year Ended October 31, | ||||||
| 2009 | 2008 | 2007 | ||||
| (in thousands) | ||||||
| Non-qualified Share Options: |
||||||
| Number of options to purchase ordinary shares |
4,331 | 990 | 436 | |||
| Restricted share units: |
||||||
| Number of restricted share units |
1,356 | 17 | 1 | |||
| Convertible Senior Notes: |
||||||
| Number of potential ordinary shares to be converted |
10,526 | — | — | |||
7. PROVISION FOR INCOME TAXES
We recorded an income tax provision of approximately $4 million, $12 million and $17 million for fiscal years ended October 31, 2009, 2008 and 2007, respectively.
We are incorporated in Singapore and have negotiated tax incentives with the Singapore Economic Development Board, an agency of the Government of Singapore, which have been approved by Singapore’s Ministry of Finance and Ministry of Trade and Industry. Under the incentives, a portion of the income we earn in Singapore during these ten to fifteen year incentive periods is subject to reduced rates of Singapore income tax. The incentive tax rates will expire in various fiscal years beginning in fiscal 2011. The Singapore corporate income tax rate that would apply, absent the incentives, is 18% for fiscal years 2009 and 2008. Without these incentives, our income taxes would have been lower by $22 million or an increase of $0.37 per share (diluted) for fiscal year 2009 and higher by $4 million or a decrease of $0.07 per share (diluted) for fiscal year 2008. In order to receive the benefit of the incentives, we must develop and maintain in Singapore certain functions such as procurement, financial services, order management, credit and collections, spare parts depot and distribution center, a refurbishment center and regional activities like an application development center. In addition to these qualifying activities, we must hire a specified number of employees and maintain minimum levels of investment in Singapore. We have from two to nine years to phase-in the qualifying activities and to hire the specified numbers of employees. If we do not fulfill these conditions for any reason, our incentive could lapse, our income in Singapore would be subject to taxation at higher rates, and our overall effective tax rate could be between fifteen to twenty percentage points higher than would have been the case had we maintained the benefit of the incentives.
81
Table of Contents
Our provision for income taxes for fiscal years 2009, 2008, and 2007 are as follows:
| Year Ended October 31, | ||||||||||||
| 2009 | 2008 | 2007 | ||||||||||
| (in millions) | ||||||||||||
| Current: |
||||||||||||
| Domestic (U.S.) |
$ | 1 | $ | 6 | $ | 4 | ||||||
| Domestic (Singapore) |
1 | 6 | 4 | |||||||||
| Foreign |
3 | 8 | 8 | |||||||||
| Deferred: |
||||||||||||
| Domestic (U.S.) |
— | (4 | ) | (3 | ) | |||||||
| Domestic (Singapore) |
(1 | ) | (3 | ) | 2 | |||||||
| Foreign |
— | (1 | ) | 2 | ||||||||
| Total tax provision |
$ | 4 | $ | 12 | $ | 17 | ||||||
The table below shows the geographical mix of our pre-tax profit and loss positions for fiscal years 2009 and 2008, and 2007.
| Year Ended October 31, | |||||||||||
| 2009 | 2008 | 2007 | |||||||||
| (in millions) | |||||||||||
| Domestic (U.S.) |
$ | (3 | ) | $ | 3 | $ | (7 | ) | |||
| Domestic (Singapore) |
(134 | ) | 15 | 107 | |||||||
| Foreign |
14 | 22 | 14 | ||||||||
| Total net (loss) income before taxes |
$ | (123 | ) | $ | 40 | $ | 114 | ||||
The table below reconciles the differences between our domestic statutory income tax rates and our effective tax rate:
| Year Ended October 31, | |||||||||
| 2009 | 2008 | 2007 | |||||||
| Notional U.S. federal statutory tax rate |
35.0 | % | 35.0 | % | 35.0 | % | |||
| State income taxes, net of U.S. federal benefit |
(0.3 | ) | (1.4 | ) | (0.8 | ) | |||
| Foreign losses (income) taxed at lower rates |
(32.3 | ) | (18.3 | ) | (14.6 | ) | |||
| Investment income and losses |
(4.4 | ) | 10.5 | (4.0 | ) | ||||
| R&D credits |
0.5 | (1.9 | ) | (1.2 | ) | ||||
| Other, net |
(0.5 | ) | 4.0 | 0.5 | |||||
| Increase in valuation allowance |
(1.4 | ) | 2.1 | — | |||||
| (3.4 | )% | 30.0 | % | 14.9 | % | ||||
Our income taxes payable were approximately $13 million, $13 million and $11 million, at October 31, 2009, 2008 and 2007 respectively. These amounts are included within income taxes and other taxes payable and long-term income taxes payable.
82
Table of Contents
Deferred income taxes reflect the net effect of temporary differences between the carrying amounts of assets and liabilities used for financial reporting and tax purposes. We had no net deferred tax liabilities as of fiscal years ended October 31, 2009 and 2008. The significant components of deferred tax assets included in the consolidated balance sheets as of October 31, 2009 and 2008 are:
| October 31, | ||||||||
| 2009 | 2008 | |||||||
| (in millions) | ||||||||
| Deferred income tax assets: |
||||||||
| Inventory |
$ | 14 | $ | 14 | ||||
| Property, plant and equipment |
— | 1 | ||||||
| Intangibles |
11 | 10 | ||||||
| Stock based compensation expense |
6 | 3 | ||||||
| Pension liabilities |
3 | 4 | ||||||
| Employee benefits, other than retirement |
10 | 12 | ||||||
| Net operating losses and credit carryforwards |
11 | 9 | ||||||
| Other comprehensive income |
1 | 7 | ||||||
| Other |
2 | 3 | ||||||
| Total deferred income tax assets |
58 | 63 | ||||||
| Deferred income tax liabilities: |
||||||||
| Fixed assets |
(1 | ) | — | |||||
| Total deferred tax liabilities |
(1 | ) | — | |||||
| Valuation allowance |
(3 | ) | (1 | ) | ||||
| Net deferred income tax assets |
$ | 54 | $ | 62 | ||||
As of October 31, 2009 and 2008, we had $54 million and $62 million of net deferred tax assets due to temporary differences between the book and tax basis of the net assets. Management periodically evaluates the realizability of its net deferred tax assets and the need for any valuation allowance based on all available evidence, both positive and negative in accordance with the accounting guidance for income taxes. In performing this analysis, management considered the impact of Veirgy’s current year consolidated loss before income taxes of $123 million and the factors giving rise to such losses, as well as the lack of any carryback potential for the net operating losses included in the deferred tax assets. Management further considered various factors for each jurisdiction including historical evidence of profitability, expectations of future taxable income, indefinite loss carryovers in Singapore and the historical profitability of most jurisdictions due to Verigy’s tax structure. After evaluating both negative and positive factors, we determined that no valuation allowance is needed for the net deferred tax assets of $54 million as of October 31, 2009, and based on the available evidence, we concluded that its more likely than not that these assets will be realized. We have, however, established a valuation allowance of $2.7 million for the portion of our deferred tax assets related to capital losses for which we do not expect to be able to realize. This is a $1.7 million increase from the balance of $1.0 million as of October 31, 2008.
In addition, as of October 31, 2009, we have $20 million of available U.S. net operating loss carryforwards for income tax purposes, which begin to expire in 2012 through 2029. We also have $160 million of Singapore net operating loss carryforward generated in the current year available for income tax purposes that carryforward indefinitely with no expiration date. We also have a Federal Research and Development tax credit carryforward of $1 million available for income tax purposes, which expire in 2026, and $3.8 million of California Research and Development tax credit available for income tax purposes that carryforward indefinitely with no expiration date.
Our effective tax rate varies based on a variety of factors, including overall profitability, the geographical mix of income before taxes and the related tax rates in the jurisdictions where we operate, completion of separation, restructuring and other one-time charges, as well as discrete events, such as settlements of future audits. We are subject to audits and examinations of our tax returns by tax authorities in various jurisdictions,
83
Table of Contents
including the Internal Revenue Service. We regularly assess the likelihood of adverse outcomes resulting from these examinations to determine the adequacy of our provision for income taxes. Undistributed earnings of our subsidiaries are indefinitely reinvested in the respective operations. No provision has been made for taxes that might be payable upon remittance of such earnings, nor is it practicable to determine the amount of this liability.
We adopted accounting guidance for the uncertainty in income taxes. This guidance clarifies the criteria for recognizing income tax benefits, and requires additional disclosures about uncertain tax positions. Under this accounting guidance the financial statement recognition of the benefit for a tax position is dependent upon the benefit being more likely than not to be sustainable upon audit by the applicable taxing authority. If this threshold is met, the tax benefit is then measured and recognized at the largest amount that is greater than 50 percent likely of being realized upon ultimate settlement. A reconciliation of the beginning and ending amount of the consolidated liability for unrecognized income tax benefits is as follows:
| October 31, 2009 |
October 31, 2008 | |||||
| (in millions) | ||||||
| Balance at October 31, |
$ | 13 | $ | 10 | ||
| Additions for tax positions of prior fiscal years |
1 | — | ||||
| Additions for tax positions related to current fiscal year |
1 | 3 | ||||
| Balance at October 31, |
$ | 15 | $ | 13 | ||
At October 31, 2009, the total unrecognized tax benefits of $15.6 million included approximately $0.5 million of unrecognized tax benefits that have been netted against the related deferred tax assets and $15.1 million of unrecognized tax benefits which are reflected in other long term liabilities. Unrecognized tax benefits of $15.1 million would reduce our income tax provision if recognized, with a remaining $0.5 million affecting goodwill if recognized.
Our continuing practice is to recognize interest and penalties related to income tax matters as a component of income tax expense. We have approximately $1.8 million of accrued interest and penalties as of October 31, 2009 and approximately $1.2 million of accrued interest and penalties as of October 31, 2008.
Although we file Singapore, U.S. federal, U.S. state and foreign income tax returns, our three major tax jurisdictions are Singapore, the U.S. and Germany. Our 2006, 2007 and 2008 tax years remain subject to examination by the tax authorities in our major tax jurisdictions. Our U.S. federal income tax returns are currently under audit by the Internal Revenue Service for fiscal years ending October 31, 2006 and 2007.
8. SHARE-BASED COMPENSATION
2006 Equity Incentive Plan
On June 7, 2006, our board of directors adopted the Verigy Ltd. 2006 Equity Incentive Plan (the “2006 EIP”). A total of 10,300,000 ordinary shares were authorized for issuance under the plan. The 2006 EIP provides for grants of incentive stock options, nonqualified stock options, stock appreciation rights, restricted stock and restricted share units. As of October 31, 2009, there were approximately 2,600,000 ordinary shares available for new awards under the 2006 EIP and approximately 6,100,000 ordinary shares reserved for issuance for outstanding stock option and restricted share unit awards.
Except for replacement options granted in connection with Verigy’s separation from Agilent Technologies, Inc. (“Agilent”), employee nonqualified stock options have an exercise price of no less than 100% of the fair market value of an ordinary share on the date of grant and, generally, vest at a rate of 25% per year over 4 years. The maximum allowable term is 10 years. Restricted share units awarded to employees pay out in an equal number of ordinary shares and, generally, vest quarterly over 4 years. Options and restricted share units
84
Table of Contents
cease to vest upon termination of employment. If an employee terminates employment due to death, disability or retirement, the vested portion of the employee’s option and restricted share unit awards is determined by adding 12 months to the length of his or her actual service or full acceleration for Agilent replacement options. These vested awards are exercisable for one year after the date of termination or three years from the date of termination for Agilent replacement options, or, if earlier, the expiration of the term of the option.
Stock options granted to outside directors have a maximum term of 5 years. Options and restricted share units granted to outside directors prior to the second quarter of fiscal year 2008 vested on the first anniversary of the grant date, and options and restricted share units granted to outside directors beginning in the second quarter of fiscal year 2008 vest in four equal quarterly installments from the grant date. Restricted share units granted to outside directors are paid out on the third anniversary of the grant date. All awards granted to an outside director become fully vested upon the director’s termination of services if due to death, disability, retirement at or after age 65, or if in connection with a change in control.
Restricted share units are paid out in an equal number of ordinary shares upon vesting for employee awards and three years from the grant date for non-employee director awards. With respect to a majority of the awards, shares are withheld to cover the tax withholding obligation. As a result, the actual number of shares issued will be less than the number of restricted share units granted. Prior to vesting, restricted share units do not have dividend, voting or other rights associated with ordinary shares.
2006 Employee Shares Purchase Plan
On June 7, 2006, our board of directors adopted the 2006 Employee Shares Purchase Plan (the “Purchase Plan”). The Purchase Plan is intended to qualify for favorable tax treatment under section 423 of the U.S. Internal Revenue Code. The total number of shares that were authorized for purchase under the plan is 1,700,000.
Under the Purchase Plan, eligible employees may elect to purchase shares from payroll deductions up to 10% of eligible compensation during 6-month offering periods. The purchase price is (i) 85% of the fair market value per ordinary share on the trading day before the beginning of an offering period or (ii) 85% of the fair market value per ordinary share on the last trading day of an offering period, whichever is lower. The maximum number of shares that an employee can purchase is 2,500 shares each offering period and $25,000 in fair market value of ordinary shares each calendar year.
As of October 31, 2009, a cumulative plan total of 1,413,677 ordinary shares had been issued since inception as a result of purchases made by participants in our Purchase Plan, including 369,376 shares issued in the third quarter of fiscal year 2009.
Share-Based Compensation for Verigy Options and Purchase Plan
We adopted accounting guidance for share-based compensation, which requires the measurement and recognition of compensation expense for all share-based payment awards made to our employees and directors, including employee stock option awards, restricted share units and employee share purchases made under the Purchase Plan.
We have recognized compensation expense based on the estimated grant date fair value method required under the accounting guidance using a straight-line amortization method. As the accounting guidance requires that share-based compensation expense be based on awards that are ultimately expected to vest, estimated share-based compensation is reduced for estimated forfeitures. We expense restricted share units based on fair market value of the shares at the date of grant over the period during which the restrictions lapse.
Share-Based Compensation for Agilent Options Held by Verigy Employees
Prior to our separation from Agilent, some of our employees participated in Agilent’s stock-based compensation plans. Until November 1, 2005, we accounted for stock-based awards, based on Agilent’s stock,
85
Table of Contents
using the intrinsic value method of accounting in accordance with accounting principles generally accepted in the U.S. Under the intrinsic value method, we recorded compensation expense related to stock options in our consolidated statements of operations when the exercise price of our employee stock-based award was less than the market price of the underlying Agilent stock on the date of the grant. We had no stock option expenses resulting from an exercise price that was less than the market price on the date of the grant in any of the periods presented.
Share-Based Award Activity
The following table summarizes stock option activity for fiscal years 2009 and 2008:
| Options | ||||||
| Shares | Weighted Average Exercise Price | |||||
| (in thousands) | ||||||
| Outstanding as of October 31, 2007 |
3,280 | $ | 15.38 | |||
| Granted |
495 | $ | 22.28 | |||
| Exercised(1) |
(240 | ) | $ | 13.57 | ||
| Cancelled / Expired |
(84 | ) | $ | 15.39 | ||
| Outstanding as of October 31, 2008 |
3,451 | $ | 16.50 | |||
| Granted |
1,044 | $ | 9.51 | |||
| Exercised(1) |
(44 | ) | $ | 9.62 | ||
| Cancelled / Expired |
(120 | ) | $ | 15.85 | ||
| Outstanding as of October 31, 2009 |
4,331 | $ | 14.90 | |||
| (1) | The total pretax intrinsic value of stock options exercised during fiscal year 2009 was immaterial, and was $2.5 million during fiscal year 2008. |
The following table summarizes restricted share unit activity for fiscal years 2009 and 2008:
| Restricted Share Units (RSU) | ||||||
| Shares | Weighted Average Grant Date Share Price | |||||
| (in thousands) | ||||||
| Outstanding as of October 31, 2007 |
870 | $ | 18.49 | |||
| Granted |
742 | $ | 21.99 | |||
| Vested and paid out |
(292 | ) | $ | 19.46 | ||
| Forfeited |
(56 | ) | $ | 19.72 | ||
| Outstanding as of October 31, 2008 |
1,264 | $ | 20.27 | |||
| Granted |
1,225 | $ | 9.08 | |||
| Vested and paid out |
(615 | ) | $ | 16.97 | ||
| Forfeited |
(97 | ) | $ | 17.39 | ||
| Outstanding as of October 31, 2009(2)(3)(4) |
1,777 | $ | 13.85 | |||
For the majority of restricted stock units granted, the number of shares issued on the date the restricted stock units vest is net of the statutory withholding requirements that we pay on behalf of our employees. During fiscal year 2009, we withheld approximately 188,000 ordinary shares to satisfy $2.0 million of employees’ tax obligations. During fiscal year 2008 we withheld 102,000 ordinary shares to satisfy $2.2 million of employees’ tax obligations.
86
Table of Contents
The following table summarizes information about all outstanding stock options to purchase ordinary shares of Verigy at October 31, 2009:
| Options Outstanding | ||||||||||
| Range of Exercise Prices |
Number Outstanding |
Weighted Average Remaining Contractual Life |
Weighted Average Exercise Price |
Aggregate Intrinsic Value | ||||||
| (in thousands) | (in thousands) | |||||||||
| $ 6.49 - 15.00 |
2,476 | 4.81 years | $ | 11.68 | $ | 1,079 | ||||
| $15.01 - 20.00 |
1,350 | 5.07 years | $ | 16.69 | — | |||||
| $20.01 - 25.00 |
112 | 4.37 years | $ | 23.88 | — | |||||
| $25.01 - 30.00 |
393 | 4.16 years | $ | 26.44 | — | |||||
| 4,331 | 4.82 years | $ | 14.90 | $ | 1,079 | |||||
The aggregate intrinsic value in the table above represents the total pretax intrinsic value, based on Verigy’s closing stock price of $9.84 on October 30, 2009, which would have been received by award holders had all award holders exercised their awards (both vested and unvested) that were in-the-money as of that date. As of October 31, 2009, approximately 2,489,000 outstanding options were vested and exercisable and the weighted average exercise price was $15.40. The total number of exercisable stock options that were in-the-money was approximately 188,000, and the weighted average exercise price per share of the in-the-money options was $8.11.
The following table summarizes information about all outstanding restricted share unit awards of Verigy ordinary shares at October 31, 2009:
| Restricted Share Units Outstanding | |||||
| Range of Grant Date Share Prices |
Number Outstanding |
Weighted Average Grant Date Share Price | |||
| (in thousands) | |||||
| $ 6.46 - 15.00(2) |
1,078 | $ | 9.27 | ||
| $15.01 - 20.00(3) |
276 | $ | 18.46 | ||
| $20.01 - 25.00 |
295 | $ | 20.85 | ||
| $25.01 - 30.00(4) |
128 | $ | 26.42 | ||
| 1,777 | $ | 13.85 | |||
| (2) | The outstanding restricted share units as of October 31, 2009 include 24,500 fully vested units held by outside directors. |
| (3) | The outstanding restricted share units as of October 31, 2009 include 36,000 fully vested units held by outside directors. |
| (4) | The outstanding restricted share units as of October 31, 2009 include 18,500 fully vested units held by outside directors. |
As of October 31, 2009, the total grant date fair value of our outstanding restricted share units was approximately $24.6 million and the aggregate market value of the ordinary shares underlying the outstanding restricted share units was $17.5 million.
87
Table of Contents
Share-based Compensation
The impact on our results for share-based compensation for Verigy options, restricted share units and employee share purchases made under the Purchase Plan during fiscal years 2009 and 2008, respectively, were as follows:
| Year Ended October 31, | ||||||
| 2009 | 2008 | |||||
| (in millions) | ||||||
| Cost of products and services |
$ | 3.4 | $ | 3.1 | ||
| Research and development |
2.1 | 2.0 | ||||
| Selling, general and administrative |
13.5 | 11.7 | ||||
| Total share-based compensation expense |
$ | 19.0 | $ | 16.8 | ||
For fiscal years 2009 and 2008, share-based compensation capitalized within inventory was insignificant.
The weighted average grant date fair value of Verigy options granted during fiscal years 2009 and 2008 was $4.32 and $9.48 per share, respectively, and was determined using the Black-Scholes option pricing model. The tax benefit realized from equity compensation for fiscal year 2009 was $1.6 million, compared to $2.3 million for fiscal year 2008.
As of October 31, 2009 and 2008, the total compensation cost related to share-based awards not yet recognized, net of expected forfeitures, was approximately $27.8 million and $30.7 million, respectively. We expect to recognize the compensation cost related to these share-based awards over a weighted average of 2.45 years.
Valuation Assumptions for Verigy Options
The fair value of Verigy options granted during fiscal years 2009 and 2008 was estimated at grant date using a Black-Scholes options-pricing model with the following weighted average assumptions:
| Year Ended October 31, | ||||||
| 2009 | 2008 | |||||
| Risk-free interest rate for options |
1.78 | % | 3.11 | % | ||
| Dividend yield |
0.0 | % | 0.0 | % | ||
| Volatility for option |
54.3 | % | 47.2 | % | ||
| Expected option life |
4.45 years | 4.44 years | ||||
Valuation Assumptions for the Purchase Plan
| Year Ended October 31, | ||||||
| 2009 | 2008 | |||||
| Risk-free interest rate for ESPP |
0.35 | % | 2.05 | % | ||
| Dividend yield |
0.0 | % | 0.0 | % | ||
| Volatility for ESPP |
51.9 | % | 44.1 | % | ||
| Expected ESPP life |
6 months | 6 months | ||||
The Black-Scholes model requires the use of highly subjective and complex assumptions, including the option’s expected life and the price volatility of the underlying ordinary shares. The price volatility of our share price was determined on the date of grant using a combination of the average daily historical volatility and the average implied volatility of publicly traded options for our ordinary shares. Management believes that using a
88
Table of Contents
combination of historical and implied volatility is the most appropriate measure of the expected volatility of our share price. Because we have limited historical data, we used data from peer companies to determine our assumptions for the expected option life. For the risk-free interest rate, we used the rate of return on U.S. Treasury Strips as of the grant dates.
9. ORDINARY SHARE REPURCHASES
2008 Repurchase Plan
On April 15, 2008, at our 2008 annual general meeting of shareholders, our shareholders approved our repurchase of up to 10 percent of Verigy’s outstanding ordinary shares, or approximately 6 million ordinary shares. This program was effective through the 2009 annual general meeting of shareholders.
2009 Repurchase Plan
On April 14, 2009, at our 2009 annual general meeting of shareholders, our shareholders approved a resolution to renew the share repurchase program to extend through the 2010 annual general meeting of shareholders. This approval allows the repurchase of up to 10 percent of Verigy’s outstanding ordinary shares, or approximately 6 million ordinary shares, incremental to the ordinary shares repurchased through the 2008 Repurchase Plan. The 2009 Repurchase Plan will expire at our 2010 annual general meeting of shareholders.
The following repurchases under the 2008 repurchase program and the 2009 repurchase program were completed in the periods presented below:
| Number of Ordinary Shares Repurchased |
Weighted Average Price Per Share |
Amount of Ordinary Shares Repurchased | ||||||
| (in thousands) | (in thousands) | |||||||
| 2008 Repurchase Program to date as of October 31, 2008 |
2,637 | $ | 20.06 | $ | 52,901 | |||
| Three months ended January 31, 2009 |
197 | $ | 8.48 | 1,669 | ||||
| Three months ended April 30, 2009 |
— | $ | — | — | ||||
| Three months ended July 31, 2009 |
— | $ | — | — | ||||
| Three months ended October 31, 2009 |
— | $ | — | — | ||||
| 2008 and 2009 Repurchase Programs to date as of October 31, 2009 |
2,834 | $ | 19.25 | $ | 54,570 | |||
All repurchased shares are immediately retired and will not be available for future resale.
10. ACQUISITION OF TOUCHDOWN TECHNOLOGIES
On June 15, 2009, we completed the acquisition of substantially all of the assets and assumption of certain liabilities of Touchdown Technologies, Inc. The consideration payable in the acquisition consists of contingent consideration payable based on revenue from probe card sales during a five year period beginning November 1, 2009. There is no minimum or maximum amount of contingent consideration payable pursuant to the acquisition agreement.
We accounted for the acquisition using the purchase method of accounting in accordance with accounting principles generally accepted in the U.S. Under the purchase method of accounting, the estimated purchase price was allocated to the tangible assets and identifiable intangible assets acquired and liabilities assumed based on their fair values. As we did not pay any purchase consideration at the time of the acquisition, the fair value of acquired net assets over purchase consideration of zero is recorded as deferred acquisition credit included within other liabilities in the balance sheet. When the contingencies are resolved, any contingent consideration paid will
89
Table of Contents
reduce this liability. Any excess of the contingent payments over this liability will be recognized as an additional cost of the acquisition. Any excess of this liability over the contingent payments will reduce the recognized value of the acquired net assets on a pro rata basis. Any amount that remains after reducing those assets to zero will be recognized as an extraordinary gain.
The preliminary purchase price allocation is as follows (in millions):
| (in millions) | ||||
| Gross tangible assets acquired |
$ | 5 | ||
| Gross tangible liabilities assumed |
(5 | ) | ||
| Net tangible assets (liabilities) |
— | |||
| Intangible assets |
2 | |||
| In-process research and development |
4 | |||
| Deferred acquisition credit |
(6 | ) | ||
| Total |
$ | — | ||
Intangible assets of $2 million relates to developed technology of $1 million and patents of $1 million that will be amortized over the weighted average useful life of 4 years. In-process research and development of approximately $4 million relates to projects that had not reached technological feasibility and had no alternative future use, and therefore, did not qualify for capitalization and was recorded as an operating expense during fiscal year 2009.
The fair value of the existing technology was determined based on an income approach using the relief from royalty method and was determined by calculating the present value of the royalty savings related to the intangible assets using a royalty rate of 1.5% and a discount rate of 45%. The discount rate was estimated using an implied rate of return of the transaction, adjusted for the specific risk profile of the asset. The remaining useful life of existing technology was estimated based on historical product development cycles, the projected rate of technology attrition, and the future economic benefit expected to be received from the asset.
The fair value of patents was determined using the cost approach. The estimated useful life was determined based on the future economic benefit expected to be received from the patents.
The fair value of the in-process technology was determined based on the income approach using the multi-period excess earnings method. In-process technology is a result of acquired in-process technology projects that have not yet reached technological feasibility and have no alternative future uses. The cash flows derived from the in-process technology were discounted at a rate of 55% and was estimated using an implied rate of return of the transaction, adjusted for the specific risk profile of the project.
90
Table of Contents
Unaudited Pro Forma Financial Information
The unaudited financial information in the table below summarizes the combined results of operations for Verigy and Touchdown Technologies on a pro forma basis, as though the companies had been combined as of the beginning of fiscal year 2008. The pro forma financial information is presented for informational purposes only and may not be indicative of the results of operations that would have been achieved if the acquisition had taken place at the beginning of fiscal year 2008. The pro forma financial information for fiscal years 2009 and 2008 include the business combination accounting effect on historical Touchdown Technologies revenue, amortization and in-process research and development charges from acquired intangible assets and related tax effects.
| Year Ended October 31, | |||||||
| (in millions, except per share data) | |||||||
| 2009 | 2008 | ||||||
| Total net revenue |
$ | 323 | $ | 696 | |||
| Net (loss) income |
$ | (140 | ) | $ | 6 | ||
| Net (loss) income per share—basic |
$ | (2.40 | ) | $ | 0.10 | ||
| Net (loss) income per share—diluted |
$ | (2.40 | ) | $ | 0.10 | ||
11. CONVERTIBLE SENIOR NOTES
On July 15, 2009, we issued $138 million of convertible senior notes (the “notes”). The notes will mature on July 15, 2014, and bear interest at a fixed rate of 5.25% per annum. The interest is payable semi-annually on January 15th and July 15th of each year and payments commence on January 15, 2010. We incurred issuance costs of $5 million in connection with the senior notes. These costs were capitalized in other assets on the consolidated balance sheet, and the costs are being amortized to interest expense over the term of the senior notes using the effective interest method. The initial conversion rate for the notes is 76.2631 ordinary shares per $1,000 principal amount, equal to a conversion price of approximately $13.11 per ordinary share. This conversion rate is subject to adjustment in some events, but will not be adjusted for accrued interest. Holders may convert their notes at any time prior to the maturity date.
We may not redeem the notes prior to July 20, 2012, except upon the occurrence of certain tax-related events. On or after July 20, 2012, we may redeem for cash all or part of the notes if the last reported sale price per ordinary share has been at least 130% of the conversion price then in effect for at least 20 trading days during any 30 consecutive trading day period ending within five trading days prior to the date on which we provide notice of redemption. The redemption price will equal 100% of the principal amount of the notes being redeemed, plus accrued and unpaid interest, up to the date of redemption.
If we undergo a fundamental change, subject to certain conditions, holders may require us to purchase their notes in whole or in part for cash at a purchase price equal to 100% of the principal amount being purchased, plus accrued and unpaid interest, up to the date of purchase. In addition, upon the occurrence of a fundamental change, for holders who elect to convert their notes in certain circumstances, we will increase the conversion rate not to exceed 95.3288 per $1,000 principal amount, equal to a conversion price of $10.49 per ordinary share. Upon default, holders of at least 25% of the convertible notes can declare 100% of the principal and accrued and unpaid interest to become due and payable. In the event of insolvency or bankruptcy, the aggregate principal and accrued and unpaid interest automatically become due and payable.
12. MARKETABLE SECURITIES
We account for our short-term marketable securities in accordance with accounting principles generally accepted in the U.S. In April 2009, the FASB issued accounting guidance for recognition and presentation of other-than-temporary impairments. This accounting guidance is intended to bring greater consistency to the
91
Table of Contents
timing of impairment recognition, and provide greater clarity to investors about the credit and noncredit components of impaired debt securities that are not expected to be sold. The accounting guidance also requires increased and more timely disclosures regarding expected cash flows, credit losses, and an aging of securities with unrealized losses. This accounting guidance is effective for interim and annual periods ending after June 15, 2009. We adopted the accounting guidance during the third quarter of fiscal year 2009, and the adoption did not have a material impact on our results of operations or financial position.
We classify our marketable securities as available for sale at the time of purchase and re-evaluate such designation as of each consolidated balance sheet date. We amortize premiums and discounts against interest income over the life of the investment. Our marketable securities are classified as cash equivalents if the original maturity, from the date of purchase, is ninety days or less. For those investments that we intend to sell or more likely than not would be required to sell before recovery of the amortized cost basis, we recognized other-than-temporary impairment charges in earnings representing both credit and non-credit loss.
Our marketable securities include commercial paper, corporate bonds, government securities, money market funds and auction rate securities. Auction rate securities are securities that are structured with interest rate reset periods of generally less than ninety days but with contractual maturities that can be well in excess of 10 years. At the end of each interest rate reset period, investors can buy, sell or continue to hold the securities at par. As of October 31, 2009, all of our auction rate securities experienced failed auctions. The funds associated with these auctions will not be accessible to us until a successful auction occurs, a buyer is found outside of the auction process or the underlying securities have matured or are called by the issuer. Given the ongoing disruptions in the credit markets and the fact that the liquidity for these types of securities remains uncertain, we have classified all of our auction rate securities as long-term assets in our consolidated balance sheet as of October 31, 2009, as our ability to liquidate such securities in the next 12 months is uncertain.
Our auction rate securities primarily consist of investments that are backed by pools of student loans guaranteed by the U.S. Department of Education and other asset-backed securities. Our marketable securities portfolio as of October 31, 2009 had a carrying value of $398 million, of which approximately $56 million consisted of illiquid auction rate securities. Given the ongoing disruption in the market for auction rate securities, there is no longer an actively quoted market price for these securities. Accordingly, we utilized a model to estimate the fair value of these auction rate securities based on, among other items: (i) the underlying structure of each security and the underlying collateral quality; (ii) the present value of future principal and interest payments discounted at rates considered to reflect current market conditions; (iii) consideration of the probabilities of default, auction failure or repurchase at par for each period; and (iv) estimates of the recovery rates in the event of default for each security. These estimated fair values could change significantly based on future market conditions.
We evaluate our investments periodically for possible other-than-temporary impairment by reviewing factors such as the length of time and extent to which fair value has been below cost basis, the financial condition of the issuer and insurance guarantor, and our ability and intent to hold the investment for a period of time sufficient for anticipated recovery of market value. Based on an analysis of other-than-temporary impairment factors, we recorded an other-than-temporary impairment in the statement of operations of $11.5 million for the fiscal year ended October 31, 2009 related to our auction rate securities, of which $2 million was recorded as an impairment during the three months ended October 31, 2009. We have also recorded an unrealized gain within accumulated other comprehensive loss of approximately $2.1 million (net of tax of $0.5 million), primarily for our auction rate securities that are backed by pools of student loans as of October 31, 2009.
Investments in money market funds include investments in the Reserve Primary Fund and the Reserve International Liquidity Fund (collectively referred to as the “Reserve Funds”). The net asset value for the Reserve Funds fell below $1 because the funds had holdings of commercial paper and other notes with a major investment bank which filed for bankruptcy on September 15, 2008. As a result of these events, these funds are no longer classified as cash and cash equivalents. We have classified these investments as short-term marketable
92
Table of Contents
securities because, based on the maximum maturity date of the underlying securities as well as the proposed liquidation plan and distribution updates received for the funds, we believe that within one year, these investments will be redeemable. We received approximately $20.0 million from the distribution of these funds during fiscal year 2009, reducing the value of our remaining holdings of these funds to $3.1 million as of October 31, 2009.
The following table summarizes our marketable security investments as of October 31, 2009:
| Cost | Gross Unrealized Gains (Losses) |
Estimated Fair Market Value | |||||||
| (in millions) | |||||||||
| Cash equivalents and short-term marketable securities: |
|||||||||
| Money market funds |
$ | 158 | $ | — | $ | 158 | |||
| U.S. government agency securities and certificate of deposits |
41 | — | 41 | ||||||
| Corporate debt securities |
124 | — | 124 | ||||||
| Total cash equivalents and short-term marketable securities |
$ | 323 | $ | — | $ | 323 | |||
| Long-term marketable securities: |
|||||||||
| Certificate of deposits |
$ | 12 | — | $ | 12 | ||||
| Corporate debt securities |
6 | 1 | 7 | ||||||
| Auction rate securities |
$ | 56 | $ | — | $ | 56 | |||
| Total long-term available for sale investments |
$ | 74 | $ | 1 | $ | 75 | |||
| As Reported: |
|||||||||
| Cash equivalents |
$ | 156 | |||||||
| Short-term marketable securities |
167 | ||||||||
| Long-term marketable securities |
75 | ||||||||
| Total as of October 31, 2009 |
$ | 398 | |||||||
The following table summarizes our marketable security investments as of October 31, 2008:
| Cost | Gross Unrealized Gains (Losses) |
Estimated Fair Market Value | ||||||||
| (in millions) | ||||||||||
| Cash equivalents and short-term marketable securities: |
||||||||||
| Money market funds |
$ | 124 | $ | — | $ | 124 | ||||
| U.S. government agency securities and U.S. treasury securities |
63 | — | 63 | |||||||
| Corporate debt securities |
111 | (1 | ) | 110 | ||||||
| Total cash equivalents and short-term marketable securities |
$ | 298 | $ | (1 | ) | $ | 297 | |||
| Long-term marketable securities: |
||||||||||
| Auction rate securities |
$ | 73 | $ | (2 | ) | $ | 71 | |||
| Total long-term available for sale investments |
$ | 73 | $ | (2 | ) | $ | 71 | |||
| As Reported: |
||||||||||
| Cash equivalents |
$ | 101 | ||||||||
| Short-term marketable securities |
196 | |||||||||
| Long-term marketable securities |
71 | |||||||||
| Total as of October 31, 2008 |
$ | 368 | ||||||||
93
Table of Contents
The amortized cost, which is net of other-than-temporary impairment losses, and estimated fair value of cash equivalents and marketable securities classified as available for sale as of October 31, 2009 are shown in the table below by their contractual maturity dates:
| Cost | Gross Unrealized Gains (Losses) |
Estimated Fair Market Value | |||||||
| (in millions) | |||||||||
| Less than 1 year |
$ | 232 | $ | — | $ | 232 | |||
| Due in 1 to 2 years |
103 | — | 103 | ||||||
| Due after 2 years |
62 | 1 | 63 | ||||||
| Total as of October 31, 2009 |
$ | 397 | $ | 1 | $ | 398 | |||
13. INVENTORY
Inventory, net of related reserves, consists of the following:
| October 31, 2009 |
October 31, 2008 | |||||
| (in millions) | ||||||
| Raw materials |
$ | 26 | $ | 42 | ||
| Finished goods |
29 | 36 | ||||
| Total inventory |
$ | 55 | $ | 78 | ||
There were approximately $15 million of demonstration products included in finished goods inventory as of October 31, 2009, and $22 million as of October 31, 2008.
The total cost of products in the consolidated statements of operations for fiscal years 2009, 2008 and 2007 included gross inventory-related provisions of $25 million, $30 million and $12 million, respectively, for excess and obsolete inventory at our sites, as well as inventory at our contract manufacturers and suppliers where we have non-cancelable purchase commitments. In addition, our gross margins were favorably impacted by the sale of previously written-down inventory of $18 million, $3 million, and $4 million, respectively, for the same periods.
14. OTHER CURRENT ASSETS
| October 31, 2009 |
October 31, 2008 | |||||
| (in millions) | ||||||
| Current deferred tax assets |
$ | 20 | $ | 27 | ||
| Value added tax receivable |
7 | 10 | ||||
| Prepaid taxes |
3 | — | ||||
| Other prepayments |
3 | 4 | ||||
| Other receivables |
3 | 2 | ||||
| Other |
4 | 3 | ||||
| Total other current assets |
$ | 40 | $ | 46 | ||
94
Table of Contents
15. PROPERTY, PLANT AND EQUIPMENT, NET
| October 31, 2009 |
October 31, 2008 |
|||||||
| (in millions) | ||||||||
| Leasehold improvements |
$ | 13 | $ | 17 | ||||
| Software |
21 | 21 | ||||||
| Machinery and equipment |
60 | 48 | ||||||
| Total property, plant and equipment |
94 | 86 | ||||||
| Accumulated depreciation and amortization |
(53 | ) | (44 | ) | ||||
| Total property, plant and equipment, net |
$ | 41 | $ | 42 | ||||
We recorded $16 million, $15 million and $13 million of depreciation and amortization expense for fiscal years 2009, 2008, and 2007, respectively.
16. OTHER LONG TERM ASSETS
| October 31, 2009 |
October 31, 2008 | |||||
| (in millions) | ||||||
| Deferred tax assets, non-current |
$ | 35 | $ | 36 | ||
| Flexible time off assets |
14 | 11 | ||||
| Investments |
— | 6 | ||||
| Defined benefit contribution assets |
2 | 2 | ||||
| Lease deposits |
5 | 6 | ||||
| Origination fees on convertible senior notes |
4 | — | ||||
| Other |
2 | 4 | ||||
| Total other long term assets |
$ | 62 | $ | 65 | ||
Our investments consisted of investments in private companies accounted for using the cost method as we have no significant influence over the investee. All of our investments are subject to periodic impairment review, which requires significant judgment to identify events or circumstances that would likely have a significant adverse effect on the future value of the investment. In fiscal years 2009 and 2008, we recognized a $6 million and an $11 million other-than-temporary impairment charge related to the write down of a cost method investment because we determined that the carrying value of the investment was not recoverable. These impairment charges were included as impairment of investments in the consolidated statements of operations.
The flexible time off assets relate to amounts set aside to fund vacation, holiday and flexible time-off benefits for our employees in Germany.
Information about our pension plans and associated assets are presented in Note 20, “Retirement Plans and Post-Retirement Benefits.”
17. GOODWILL AND OTHER LONG-LIVED ASSETS
Our goodwill balance as of both October 31, 2009 and 2008 was $18 million and represents an allocation of goodwill recorded during the 2006 separation from Agilent. We review our goodwill for impairment annually in the fourth quarter of our fiscal year, or more frequently if impairment indicators arise. Impairment of goodwill is tested at the reporting unit level by comparing the reporting unit’s carrying amount, including goodwill, to the fair value of the reporting unit. The fair values of the reporting units are estimated using a combination of the income approach that uses discounted cash flows and the market approach that utilizes comparable companies’ data. If the carrying amount of the reporting unit exceeds its fair value, goodwill is considered impaired and a second step is performed to measure the amount of impairment loss. We have two reporting units for which we assess goodwill for impairment.
95
Table of Contents
During fiscal year 2009, we recorded $2 million of intangible assets related to our acquisition of Touchdown Technologies with a weighted-average amortization period of 4 years. These assets will be amortized on a straight-line basis with an estimated future amortization expense of approximately $0.5 million a year. We continually monitor events and changes in circumstances that could indicate carrying amounts of long-lived assets may not be recoverable. When such events or changes in circumstances occur, we assess the recoverability of long-lived assets by determining whether the carrying value of such assets will be recovered through undiscounted expected future cash flows. If the total of the undiscounted future cash flows is less than the carrying amount of those assets, we recognize an impairment loss based on the excess of the carrying amount over the fair value of the assets.
We performed an interim goodwill and long-lived asset impairment analysis during the three months ended January 31, 2009 because of the sharp deterioration in our operating results. Based on this interim assessment, we concluded that we did not have any impairment as of January 31, 2009. We completed our annual impairment assessment in the fourth quarter of fiscal year 2009 and we concluded that we did not have any impairment as of October 31, 2009.
18. GUARANTEES
Standard Warranty
A summary of our standard warranty accrual activity for fiscal years 2009 and 2008 is shown in the table below:
| October 31, 2009 |
October 31, 2008 |
|||||||
| (in millions) | ||||||||
| Beginning balance as of November 1, |
$ | 5 | $ | 9 | ||||
| Accruals for warranties issued during the period |
4 | 10 | ||||||
| Accruals related to pre-existing warranties (including changes in estimates) |
— | (2 | ) | |||||
| Settlements made during the period |
(6 | ) | (12 | ) | ||||
| Ending balance as of October 31, |
$ | 3 | $ | 5 | ||||
In our consolidated balance sheets, standard warranty accrual is presented within other current liabilities.
Also see Note 21, “Other Current Liabilities and Other Long-Term Liabilities.”
Extended Warranty
A summary of our extended warranty deferred revenue activity for fiscal years 2009 and 2008 is shown in the table below:
| October 31, 2009 |
October 31, 2008 |
|||||||
| (in millions) | ||||||||
| Beginning balance as of November 1, |
$ | 16 | $ | 21 | ||||
| Revenue recognized during the period |
(11 | ) | (11 | ) | ||||
| Deferral of revenue for new contracts |
3 | 6 | ||||||
| Ending balance as of October 31, |
$ | 8 | $ | 16 | ||||
In our consolidated balance sheets, current deferred revenue is presented separately and long-term deferred revenue is included in other long-term liabilities. See Note 21, “Other Current Liabilities and Other Long-Term Liabilities.”
96
Table of Contents
Indemnifications
As is customary in our industry and provided for in local law in the U.S. and other jurisdictions, many of our standard contracts provide remedies to our customers and others with whom we enter into contracts, such as defense, settlement or payment of judgment for intellectual property claims related to the use of our products. From time to time, we indemnify customers, as well as our suppliers, contractors, lessors, lessees and others with whom we enter into contracts, against combinations of loss, expense or liability arising from various triggering events related to the sale or the use of our products, the use of their goods and services, the use of facilities and state of our owned facilities and other matters covered by such contracts, usually up to a specified maximum amount. In addition, from time to time, we also provide protection to these parties against claims related to undiscovered liabilities, additional product liability or environmental obligations.
Under the agreements we entered into with Agilent at the time of the separation, we will indemnify Agilent in connection with our activities conducted prior to and following our separation from Agilent in connection with our businesses and the liabilities that we specifically assumed under the agreements we entered into in connection with the separation. These indemnification obligations cover a variety of aspects of our business, including, but not limited to, employee, tax, intellectual property and environmental matters.
19. RESTRUCTURING
In order to address the cyclical downturn and the negative impact on our results driven by the deteriorating global economy, in fiscal year 2009 we implemented restructuring actions to streamline our organizations and further reduce our operating costs. As market conditions continued to deteriorate, in the second quarter of fiscal year 2009, we announced a plan to expand our restructuring actions to further lower our quarterly operating costs in fiscal year 2009. As part of these restructuring actions, we reduced our global workforce through a combination of attrition, voluntary and involuntary terminations and other workforce reduction programs consistent with local legal requirements.
The total charges incurred in fiscal year 2009 for these restructuring actions were approximately $13.7 million, $5.5 million was recorded within cost of sales and the remainder of which was recorded within operating expenses.
In fiscal year 2008, we offered an early retirement plan to a number of eligible employees. The total net charges incurred in fiscal year 2008 for this early retirement plan were approximately $2 million, which was recorded within operating expenses.
As of October 31, 2009, we had approximately $4.9 million of accrued restructuring liability included within other current liabilities on the consolidated balance sheet. The accrual relates to severance and benefit payments and are expected to be paid out by the end of fiscal year 2010.
The table below summarizes the impact to the statement of operations resulting from all restructuring actions for fiscal years ended October 31, 2009, 2008 and 2007 is shown below:
| Year Ended October 31, | |||||||||
| 2009 | 2008 | 2007 | |||||||
| (in millions) | |||||||||
| Restructuring charges (included in cost of sales) |
$ | 6 | $ | — | $ | 3 | |||
| Restructuring charges (included in operating expenses) |
8 | 2 | 1 | ||||||
| Total restructuring charges |
$ | 14 | $ | 2 | $ | 4 | |||
97
Table of Contents
A summary of restructuring activity for all restructuring actions through October 31, 2009 is shown in the table below:
| Workforce Reduction |
||||
| (in millions) | ||||
| Beginning balance at October 31, 2008 |
$ | 0.7 | ||
| Total charges |
13.7 | |||
| Cash payments |
(8.6 | ) | ||
| Other |
(0.9 | ) | ||
| Ending balance as of October 31, 2009 |
$ | 4.9 | ||
20. RETIREMENT PLANS AND POST-RETIREMENT BENEFITS
We recognize the funded status of our defined benefit postretirement plans on our consolidated balance sheets, and our changes in the funded status are reflected in comprehensive income. As of the end of fiscal year 2009, we began to use a measurement date of October 31 to measure our plan assets and benefit obligations, the same date as our fiscal year end.
Accumulated other comprehensive income (loss). The following table summarizes the amounts recorded to accumulated other comprehensive income (loss) before taxes as of October 31, 2009:
| U.S. Plans | Non-U.S. Plans | Non-pension postretirement benefit plan | ||||||||
| (in millions) | ||||||||||
| Net transition obligation (asset) |
$ | — | $ | — | $ | — | ||||
| Net prior service cost (credit) |
— | — | 1.0 | |||||||
| Net actuarial loss (gain) |
— | (0.5 | ) | 0.4 | ||||||
| Total net plan |
$ | — | $ | (0.5 | ) | $ | 1.4 | |||
General. Substantially all of our employees are covered under various Verigy defined benefit and/or defined contribution plans. Additionally, we sponsor retiree medical accounts for certain eligible U.S. employees. Prior to the separation, Agilent had sponsored post-retirement health care benefits and a death benefit under the Retiree Survivor’s Benefit Plan for our eligible U.S. employees.
U.S. Retirement and Post-retirement Health Care Benefits for U.S. Employees
Effective June 1, 2006, we established a defined contribution benefit plan (“Verigy 401(k) plan”) for our U.S. employees. Our 401(k) plan provides matching contribution of up to 4% of eligible compensation. Eligible compensation consists of base and variable pay. In addition, we also offer a profit sharing plan for our U.S. employees, whereby we will make a maximum 2% contribution to the employee’s 401(k) plan if certain annual financial targets are achieved. A small number of our U.S. employees meeting certain age and service requirements will also receive an additional 2% profit sharing contribution to their 401(k) plan accounts if certain annual financial targets are achieved.
For fiscal year 2009, our matching expenses for our U.S. employees under the Verigy 401(k) plan was $2.1 million and $2.4 million for fiscal year 2008. We recorded approximately $0.6 million for the Verigy profit sharing plans in fiscal year 2008, however, we did not incur any expense in fiscal year 2009.
Effective June 1, 2006, Verigy made available certain retiree benefits to U.S. employees meeting certain age and service requirements upon termination of employment through Verigy’s Retiree Medical Account (RMA) Plan. At June 1, 2006, the present value of our responsibility for the retiree medical benefit obligation
98
Table of Contents
was approximately $2.3 million. We are ratably recognizing this obligation over a period of 6.4 years, the shorter of the estimated average working lifetime or retirement eligibility of these employees. For fiscal year 2009 and 2008, the amount of expenses recognized under the RMA plan was approximately $0.5 million and $0.7 million, respectively. There are no plan assets related to these obligations, and we currently do not have any plans to make any contributions.
Non-U.S. Retirement Benefit Plans. Eligible employees outside the U.S. generally receive retirement benefits under various retirement plans based upon factors such as years of service and employee compensation levels. Eligibility is generally determined in accordance with local statutory requirements.
Change in Plans. Upon our separation from Agilent, the defined benefit plans for our employees in Germany, Korea, Taiwan, France and Italy were transferred to us. With the exception of Italy and France, which involve relatively insignificant amounts, Agilent completed the funding of these transferred plans, based on 100% of the accumulated benefit obligation level as of the separation date, by contributing approximately $3.3 million into our pension trust accounts during fiscal year 2007.
Costs for All U.S. and Non-U.S. Plans. The following tables summarize the principal components of total costs associated with the retirement-related benefit plans of Verigy for fiscal years 2009, 2008 and 2007:
| U.S. Plans | Non-U.S. Plans | Total | |||||||||||||||||||||||||
| Year Ended October 31, | |||||||||||||||||||||||||||
| 2009 | 2008 | 2007 | 2009 | 2008 | 2007 | 2009 | 2008 | 2007 | |||||||||||||||||||
| (in millions) | |||||||||||||||||||||||||||
| Defined benefit pension plan costs |
$ | — | $ | — | $ | — | $ | 5 | $ | 7 | $ | 6 | $ | 5 | $ | 7 | $ | 6 | |||||||||
| Defined contribution pension plan costs |
2 | 3 | 3 | 1 | 1 | 1 | 3 | 4 | 4 | ||||||||||||||||||
| Non-pension post-retirement benefit costs |
1 | 1 | 1 | — | — | — | 1 | 1 | 1 | ||||||||||||||||||
| Total retirement-related plans costs |
$ | 3 | $ | 4 | $ | 4 | $ | 6 | $ | 8 | $ | 7 | $ | 9 | $ | 12 | $ | 11 | |||||||||
Non-U.S. Defined Benefit. For fiscal years 2009, 2008 and 2007, the net pension costs related to participation in our non-U.S. defined benefit plans were comprised of:
| Year Ended October 31, | ||||||||||||
| 2009 | 2008 | 2007 | ||||||||||
| (in millions) | ||||||||||||
| Service cost—benefits earned during the year |
$ | 3.6 | $ | 4.8 | $ | 4.1 | ||||||
| Interest cost on benefit obligation |
3.5 | 3.7 | 2.6 | |||||||||
| Expected return on plan assets |
(2.3 | ) | (2.7 | ) | (2.0 | ) | ||||||
| Amortization and deferrals: |
||||||||||||
| Actuarial loss |
0.6 | 1.3 | 1.2 | |||||||||
| Total net plan costs |
$ | 5.4 | $ | 7.1 | $ | 5.9 | ||||||
Measurement date. We use October 31 as the measurement date for all of our non-U.S. plans and U.S. retiree medical account.
99
Table of Contents
Funded status—For fiscal years 2009 and 2008, the funded status of our non-U.S. defined benefit plans were:
| Non-U.S. Defined Benefit Plans |
||||||||
| Year Ended October 31, |
||||||||
| 2009 | 2008 | |||||||
| (in millions) | ||||||||
| Change in fair value of plan assets: |
||||||||
| Fair value—beginning of period |
$ | 38.7 | $ | 43.0 | ||||
| Actual return on plan assets |
0.5 | (8.2 | ) | |||||
| Employer contributions |
2.1 | 2.5 | ||||||
| Participants’ contributions |
1.3 | 2.3 | ||||||
| Benefits paid |
(0.5 | ) | (0.6 | ) | ||||
| Currency impact |
1.9 | (0.3 | ) | |||||
| Fair value—end of period |
$ | 44.0 | $ | 38.7 | ||||
| Change in benefit obligation: |
||||||||
| Benefit obligation—beginning of period |
$ | 62.7 | $ | 70.0 | ||||
| Service cost |
3.6 | 4.8 | ||||||
| Interest cost |
3.5 | 3.7 | ||||||
| Participants’ contributions |
1.3 | 2.3 | ||||||
| Actuarial (gain) loss |
(10.9 | ) | (17.3 | ) | ||||
| Benefits paid |
(0.6 | ) | (0.6 | ) | ||||
| Adjustment due to change of measurement date |
0.7 | — | ||||||
| Currency impact |
1.8 | (0.2 | ) | |||||
| Benefit obligation—end of period |
$ | 62.1 | $ | 62.7 | ||||
| Funded status of the plans |
$ | (18.1 | ) | $ | (24.0 | ) | ||
| Unrecognized prior service cost |
— | — | ||||||
| Accrued benefit cost—end of year |
$ | (18.1 | ) | $ | (24.0 | ) | ||
| Liabilities recorded in the balance sheet: |
||||||||
| Liabilities |
$ | (18.1 | ) | $ | (24.0 | ) | ||
As of October 31, 2009 and 2008, the amounts of the obligations for our non-U.S. defined benefit plans were as follows:
| Year Ended October 31, | ||||||
| 2009 | 2008 | |||||
| (in millions) | ||||||
| Aggregate projected benefit obligation (“PBO”) |
$ | 62 | $ | 63 | ||
| Aggregate accumulated benefit obligation (“ABO”) |
$ | 51 | $ | 43 | ||
Assumptions. The assumptions used to determine the benefit obligations and expense for all of Verigy’s defined benefit and post-retirement benefit plans are presented in the tables below. The impacts of the assumptions listed for the fiscal years 2009, 2008 and 2007 have already been recognized in our consolidated statement of operations. The expected long-term return on assets below is based on the historical rate of return for our chosen asset mix of equities and fixed income investments adjusted for anticipated future movements.
100
Table of Contents
Assumptions used to calculate the net periodic cost in each year were as follows:
| Year Ended October 31, | |||||||||
| 2009 | 2008 | 2007 | |||||||
| Non-U.S. defined benefit plans: |
|||||||||
| Discount rate |
2.25 - 6.25 | % | 2.25 - 5.25 | % | 2.25 - 5.25 | % | |||
| Average increase in compensation levels |
2.50 - 4.50 | % | 3.00 - 4.50 | % | 3.00 - 4.50 | % | |||
| Expected long-term return on assets |
3.00 - 6.00 | % | 2.75 - 6.00 | % | 2.75 - 6.00 | % | |||
| U.S. post-retirement benefits plans: |
|||||||||
| Discount rate |
5.25 | % | 9.00 | % | 6.25 | % | |||
| Expected long-term return on assets |
— | % | — | % | — | % | |||
| Current medical cost trend rate |
9.00 | % | 8.00 | % | 8.00 | % | |||
| Ultimate medical cost trend rate |
5.00 | % | 5.00 | % | 5.00 | % | |||
| Medical cost trend rate decreases to ultimate rate in year |
2019 | 2011 | 2010 | ||||||
Assumptions used to calculate the benefit obligations and the resulting additional minimum pension liability were as follows:
| Year Ended October 31, 2009 |
Year Ended October 31, 2008 |
Year Ended October 31, 2007 |
|||||||
| Non-U.S. defined benefit plans: |
|||||||||
| Discount rate |
2.00 - 6.50 | % | 2.25 - 6.25 | % | 2.25 - 5.25 | % | |||
| Average increase in compensation levels |
2.50 - 4.00 | % | 2.50 - 4.50 | % | 3.75 - 4.50 | % |
21. OTHER CURRENT LIABILITIES AND OTHER LONG-TERM LIABILITIES
Other current accrued liabilities as of October 31, 2009 and 2008 were as follows:
| October 31, 2009 |
October 31, 2008 | |||||
| (in millions) | ||||||
| Supplier liabilities |
$ | 8 | $ | 12 | ||
| Derivatives |
— | 12 | ||||
| Restructuring accrual |
5 | 1 | ||||
| Accrued warranty costs |
3 | 5 | ||||
| Leases payable |
2 | — | ||||
| Interest payable |
2 | — | ||||
| Other |
2 | 4 | ||||
| Total other current liabilities |
$ | 22 | $ | 34 | ||
Supplier liabilities reflect the amount by which our firmly committed inventory purchases from our suppliers exceed our current forecasted production and service and support needs. Also see Note 18, “Guarantees” for additional information regarding warranty accruals and Note 19, “Restructuring” for additional information regarding our restructuring accrual.
101
Table of Contents
Other long-term liabilities as of October 31, 2009 and 2008 were as follows:
| October 31, 2009 |
October 31, 2008 | |||||
| (in millions) | ||||||
| Long-term extended warranty and deferred revenue |
$ | 3 | $ | 7 | ||
| Retirement plan accruals |
24 | 29 | ||||
| Deferred acquisition credit (see note 10) |
6 | — | ||||
| Total other long-term liabilities |
$ | 33 | $ | 36 | ||
Also see Note 20, “Retirement Plans and Post-Retirement Benefits” for additional information regarding retirement plan accruals and Note 10, “Acquisition of Touchdown Technologies” for additional information regarding the deferred acquisition credit.
22. COMMITMENTS AND CONTINGENCIES
Operating Lease Commitments. The following table reflects our non-cancelable operating lease commitments as of October 31, 2009:
| Fiscal Year |
Amount | ||
| (in millions) | |||
| 2010 |
$ | 11 | |
| 2011 |
9 | ||
| 2012 |
8 | ||
| 2013 |
7 | ||
| 2014 |
7 | ||
| Thereafter |
12 | ||
| Total |
$ | 54 | |
Rent expense was $6.7 million, $6.3 million, and $5.7 million for fiscal years 2009, 2008 and 2007, respectively. As part of our acquisition of Touchdown, we assumed approximately $2 million of capital lease obligations.
From time to time, we are involved in lawsuits, claims, investigations and proceedings, which arise in the ordinary course of business.
23. INTEREST INCOME AND OTHER
The following table presents the components of interest income and other for fiscal years 2009, 2008, and 2007:
| Year Ended October 31, | ||||||||||
| 2009 | 2008 | 2007 | ||||||||
| (in millions) | ||||||||||
| Interest and other income |
$ | 7 | $ | 17 | $ | 17 | ||||
| Interest expense |
(2 | ) | — | — | ||||||
| Net foreign currency remeasurement (loss) gain |
(1 | ) | 6 | — | ||||||
| Interest income and other |
$ | 4 | $ | 23 | $ | 17 | ||||
102
Table of Contents
Interest income and other consists primarily of interest on cash, cash equivalents and investments, interest expense primarily related to our convertible senior note, gains and losses from the remeasurement of assets and liabilities denominated in currencies other than the functional currency, as well as gains and losses on foreign exchange balance sheet hedge transactions. These transactions are intended to offset foreign exchange gains and losses from remeasurement, which are generally for a period of 30 days or less and settled by the end of the month.
The following table presents the components of impairment of investments for fiscal years 2009, 2008, and 2007:
| Year Ended October 31, |
||||||||||||
| 2009 | 2008 | 2007 | ||||||||||
| (in millions) | ||||||||||||
| Impairment of cost-based investment |
$ | (6 | ) | $ | (11 | ) | $ | (2 | ) | |||
| Impairment of auction rate securities |
(12 | ) | (20 | ) | — | |||||||
| Impairment of investments |
$ | (18 | ) | $ | (31 | ) | $ | (2 | ) | |||
During fiscal year 2009, we incurred a $6.2 million charge related to the write-off of a cost method investment that was determined to be impaired on an other-than-temporary basis. We recorded an $11.5 million other-than-temporary impairment charge for fiscal year 2009 for our auction rate securities.
During fiscal year 2008, we incurred an $11.1 million charge related to the write down of cost-based equity investment that was determined to be impaired on an other-than-temporary basis. Additionally, we have recorded other-than-temporary impairments within the statement of operations for the fiscal year 2008 of $17.4 million related to auction rate securities and $2.1 million related to our money market funds. See Note 12, “Marketable Securities” and Note 16, “Other Long Term Assets.”
24. SEGMENT & GEOGRAPHIC INFORMATION
The accounting principles generally accepted in the U.S. requires us to identify the segment or segments we operate in. We have two operating segments but aggregate the information into one reportable segment: we provide test system solutions that are used in the manufacture of semiconductor devices. Below is the revenue detail for the two product platforms within this segment:
| Year Ended October 31, | |||||||||
| 2009 | 2008 | 2007 | |||||||
| (in millions) | |||||||||
| Net revenue from products |
|||||||||
| SOC / SIP / High-Speed Memory |
$ | 179 | $ | 467 | $ | 333 | |||
| Memory |
22 | 64 | 282 | ||||||
| Total net revenue from products |
201 | 531 | 615 | ||||||
| Net revenue from services |
122 | 160 | 146 | ||||||
| Total net revenue |
$ | 323 | $ | 691 | $ | 761 | |||
Major customers
In fiscal year 2009, one of our customers accounted for 10.5% of our net revenue. In fiscal year 2008, one of our customers accounted for 11.9% of our net revenue. In fiscal year 2007, two of our customers accounted for 31.8% of our total net revenue, with one customer accounting for 21.7% and the other accounting for 10.1% of our net revenue.
103
Table of Contents
Geographic Net Revenue Information:
Historically, we have provided revenue by geography based on where the revenue is billed versus where the products are shipped. We are now reporting revenue by geography based on where the products are shipped. The amounts for fiscal years 2008 and 2007 were reclassified to conform to the presentation used for fiscal year 2009.
| Year Ended October 31, | |||||||||
| 2009 | 2008 | 2007 | |||||||
| (in millions) | |||||||||
| United States |
$ | 58 | $ | 95 | $ | 159 | |||
| Singapore |
39 | 51 | 59 | ||||||
| Taiwan |
111 | 272 | 326 | ||||||
| Japan |
32 | 61 | 52 | ||||||
| Korea |
33 | 103 | 45 | ||||||
| Rest of the World |
50 | 109 | 120 | ||||||
| Total net revenue |
$ | 323 | $ | 691 | $ | 761 | |||
Net revenue is attributed to geographic areas based on the country in which the customer takes title of our products.
Geographic Location of Property, Plant and Equipment Information:
| October 31, 2009 |
October 31, 2008 | |||||
| (in millions) | ||||||
| United States |
$ | 17 | $ | 15 | ||
| Singapore |
11 | 13 | ||||
| Germany |
4 | 8 | ||||
| Taiwan |
5 | 2 | ||||
| Rest of the World |
4 | 6 | ||||
| Total geographic location of property, plant and equipment |
$ | 41 | $ | 42 | ||
25. SUBSEQUENT EVENTS
In May 2009, the FASB issued the accounting guidance for subsequent events. The guidance establishes general standards of accounting for and disclosures of events that occur after the balance sheet date but before financial statements are issued or are available to be issued. It requires the disclosure of the date through which an entity has evaluated subsequent events, and the basis for the date. It was effective for us in the third quarter of 2009, and upon adoption, did not have any impact on our results of operations or financial position. We have evaluated subsequent events through December 21, 2009, the date of issuance of these consolidated financial statements, and do not have any events to disclose.
104
Table of Contents
(Unaudited)
The following table presents our unaudited quarterly results of operations, for each of our last eight quarters through the quarter ended October 31, 2009. This table should be read in conjunction with the consolidated audited annual financial statements and related notes contained elsewhere in this Form 10-K. We have prepared the unaudited information on the same basis as our audited consolidated financial statements. Results of operations for any quarter are not necessarily indicative of results for any future quarters or years.
| Quarter Ended | ||||||||||||||||||||||||||||||
| Oct. 31, 2009 |
Jul. 31, 2009 |
Apr. 30, 2009 |
Jan. 31, 2009 |
Oct. 31, 2008 |
Jul. 31, 2008 |
Apr. 30, 2008 |
Jan. 31, 2008 | |||||||||||||||||||||||
| (in millions except for per share amounts) | ||||||||||||||||||||||||||||||
| Net revenue: |
||||||||||||||||||||||||||||||
| Products |
$ | 68 | $ | 58 | $ | 42 | $ | 33 | $ | 108 | $ | 138 | $ | 122 | $ | 163 | ||||||||||||||
| Services |
29 | 29 | 29 | 35 | 42 | 41 | 40 | 37 | ||||||||||||||||||||||
| Total net revenue |
97 | 87 | 71 | 68 | 150 | 179 | 162 | 200 | ||||||||||||||||||||||
| Cost of sales: |
||||||||||||||||||||||||||||||
| Cost of products |
35 | 32 | 30 | 36 | 68 | 67 | 56 | 79 | ||||||||||||||||||||||
| Cost of services |
20 | 20 | 19 | 23 | 28 | 29 | 29 | 28 | ||||||||||||||||||||||
| Total cost of sales |
55 | 52 | 49 | 59 | 96 | 96 | 85 | 107 | ||||||||||||||||||||||
| Gross profit |
42 | 35 | 22 | 9 | 54 | 83 | 77 | 93 | ||||||||||||||||||||||
| Operating expenses: |
||||||||||||||||||||||||||||||
| Research and development |
22 | 25 | 20 | 25 | 25 | 27 | 26 | 25 | ||||||||||||||||||||||
| Selling, general and administrative |
29 | 29 | 28 | 31 | 38 | 40 | 37 | 39 | ||||||||||||||||||||||
| Restructuring charges |
1 | 1 | 2 | 4 | 1 | 1 | — | — | ||||||||||||||||||||||
| Total operating expenses |
52 | 55 | 50 | 60 | 64 | 68 | 63 | 64 | ||||||||||||||||||||||
| (Loss) income from operations |
(10 | ) | (20 | ) | (28 | ) | (51 | ) | (10 | ) | 15 | 14 | 29 | |||||||||||||||||
| Interest income and other |
— | 1 | 1 | 2 | 6 | 6 | 5 | 6 | ||||||||||||||||||||||
| Impairment of investments |
(2 | ) | (2 | ) | — | (14 | ) | (29 | ) | — | (2 | ) | — | |||||||||||||||||
| (Loss) income before income taxes |
(12 | ) | (21 | ) | (27 | ) | (63 | ) | (33 | ) | 21 | 17 | 35 | |||||||||||||||||
| Provision for income taxes |
— | — | 3 | 1 | 3 | 3 | 3 | 3 | ||||||||||||||||||||||
| Net (loss) income |
$ | (12 | ) | $ | (21 | ) | $ | (30 | ) | $ | (64 | ) | $ | (36 | ) | $ | 18 | $ | 14 | $ | 32 | |||||||||
| Net (loss) income per share—basic: |
$ | (0.20 | ) | $ | (0.36 | ) | $ | (0.52 | ) | $ | (1.09 | ) | $ | (0.60 | ) | $ | 0.30 | $ | 0.24 | $ | 0.53 | |||||||||
| Net (loss) income per share—diluted: |
$ | (0.20 | ) | $ | (0.36 | ) | $ | (0.52 | ) | $ | (1.09 | ) | $ | (0.60 | ) | $ | 0.29 | $ | 0.23 | $ | 0.52 | |||||||||
| Weighted average shares (in thousands) used in computing net (loss) income per share: |
||||||||||||||||||||||||||||||
| Basic: |
58,823 | 58,583 | 58,186 | 58,149 | 58,416 | 60,003 | 60,009 | 59,875 | ||||||||||||||||||||||
| Diluted: |
58,823 | 58,583 | 58,186 | 58,149 | 58,416 | 60,853 | 60,663 | 60,702 | ||||||||||||||||||||||
| Item 9. | Changes in and Disagreements with Accountants on Accounting and Financial Disclosure |
None.
| Item 9A. | Controls and Procedures |
Evaluation of Disclosure Controls and Procedures
Our management has evaluated, under the supervision and with the participation of our Chief Executive Officer and Chief Financial Officer, the effectiveness of our disclosure controls and procedures as of October 31, 2009, pursuant to and as required by Rule 13a-15(b) under the Securities Exchange Act of 1934 (the “Exchange
105
Table of Contents
Act”). Based on that evaluation, our Chief Executive Officer and Chief Financial Officer have concluded that, as of October 31, 2009, our disclosure controls and procedures, as defined by Rule 13a-15(b) under the Exchange Act, were effective and designed to ensure that (i) information required to be disclosed in the company’s reports filed under the Exchange Act is recorded, processed, summarized and reported within the time periods specified in the SEC’s rules and forms, and (ii) information is accumulated and communicated to management, including the Chief Executive Officer and Chief Financial Officer, as appropriate to allow timely decisions regarding required disclosures. Based on their evaluation, Verigy’s Chief Executive Officer and Chief Financial Officer have concluded that our disclosure controls and procedures are effective as of October 31, 2009.
Inherent Limitations on Effectiveness of Controls
Because of its inherent limitations, disclosure controls and procedures and internal control over financial reporting may not prevent or detect misstatements. In addition, projections of any evaluation of effectiveness to future periods are subject to the risk that controls may become inadequate because of changes in conditions or that the degree of compliance with the policies or procedures may deteriorate. Management necessarily applied its judgment in assessing the benefits of controls relative to their costs. Because of the inherent limitations in all control systems, no evaluation of controls can provide absolute assurance that all control issues and instances of fraud, if any, within the company have been detected. The design of any system of controls is based in part upon certain assumptions about the likelihood of future events, and there can be no assurance that any design will succeed in achieving its stated goals under all potential future conditions, regardless of how remote.
Management’s Annual Report on Internal Control Over Financial Reporting
Our management is responsible for establishing and maintaining adequate internal control over financial reporting, as such term is defined in Exchange Act Rule 13a-15(f). Under the supervision and with the participation of our management, including our Chief Executive Officer and Chief Financial Officer, we conducted an evaluation of the effectiveness of our internal control over financial reporting based on the framework in Internal Control—Integrated Framework issued by the Committee of Sponsoring Organizations of the Treadway Commission. Based on the results of this evaluation, our management concluded that our internal control over financial reporting was effective as of October 31, 2009.
The effectiveness of our internal control over financial reporting as of October 31, 2009 has been audited by PricewaterhouseCoopers LLP, our independent registered public accounting firm, as stated in their report which appears in Item 8 of this Annual Report on Form 10-K.
Changes in Internal Control over Financial Reporting
There were no changes in our internal control over financial reporting during the fiscal quarter ended October 31, 2009, that have materially affected, or are reasonably likely to materially affect, our internal control over financial reporting.
| Item 9B. | Other Information |
106
Table of Contents
PART III
| Item 10: | Directors and Executive Officers and Corporate Governance |
The information in our 2010 Proxy Statement regarding directors and executive officers appearing under the headings “Election of Directors” and “Other Matters—Section 16(a) Beneficial Ownership Reporting Compliance” is incorporated by reference in this section. In addition, the information under the heading “Corporate Governance” in our 2010 Proxy Statement is incorporated by reference in this section. We will file our 2010 Proxy Statement with the SEC no later than March 1, 2010.
Standards of Business Conduct
We have adopted Standards of Business Conduct that apply to all of our employees and our Directors. The Standards of Business Conduct are available on our website at http://www.investor.verigy.com/documents.cfm. Any amendment (other than technical, administrative or other non-substantive amendments) to or material waiver (as defined by the SEC) of a provision of the Standards of Business Conduct that applies to our principal executive officer, principal financial officer, principal accounting officer, controller or persons performing similar functions and relates to elements of the Standards of Business Conduct specified in the rules of the SEC will be posted on our website.
| Item 11: | Executive Compensation. |
The information appearing in our 2010 Proxy Statement under the headings “Director Compensation,” “Compensation Discussion and Analysis,” “Report of the Compensation Committee,” and “Executive Compensation” is incorporated by reference in this section. We will file our 2010 Proxy Statement with the SEC no later than March 1, 2010.
| Item 12: | Security Ownership of Certain Beneficial Owners and Management and Related Stockholder Matters. |
The information appearing in our 2010 Proxy Statement under the heading “Security Ownership of Certain Beneficial Owners and Management” is incorporated by reference in this section.
Information regarding shares authorized for issuance under equity compensation plans approved and not approved by stockholders in our 2010 Proxy Statement under the heading “Approval of Amendment of the 2006 Equity Incentive Plan” is incorporated by reference in this section. We will file our 2010 Proxy Statement with the SEC no later than March 1, 2010.
| Item 13: | Certain Relationships and Related Transactions, and Director Independence. |
The information appearing in our 2010 Proxy Statement under the headings “Corporate Governance” and “Certain Relationships and Related Transactions” is incorporated by reference in this section. We will file our 2010 Proxy Statement with the SEC no later than March 1, 2010.
| Item 14: | Principal Accountant Fees and Services. |
The information appearing in our 2010 Proxy Statement under the headings “Report of the Audit Committee” and “Approval of Re-Appointment of Independent Singapore Auditor for Fiscal Year 2010 and Authorization of Our Directors to Fix its Remuneration” is incorporated by reference in this section. We will file our 2010 Proxy Statement with the SEC no later than March 1, 2010.
107
Table of Contents
PART IV
| Item 15. | Exhibits and Financial Statement Schedules |
| (a) | The following documents are filed as part of this report: |
| 1. | Financial Statements. |
See Index to Consolidated Financial Statements under Item 8 of this report.
| 2. | Financial Statement Schedule. |
The following financial statement schedule should be considered in conjunction with our consolidated financial statements. All other schedules have been omitted because the required information is either not applicable or not sufficiently material to require submission of the schedule:
SCHEDULE II
VERIGY LTD.
Valuation and Qualifying Accounts
| Description |
Balance at Beginning of Period |
Additions Charged to Costs, Expenses or Other Accounts |
Balance at End of Period | ||||||
| (in millions) | |||||||||
| 2009 |
|||||||||
| Allowance for doubtful accounts |
$ | 0.1 | $ | 0.3 | $ | 0.4 | |||
| Deferred tax valuation allowance(*) |
$ | 1.0 | $ | 1.7 | $ | 2.7 | |||
| 2008 |
|||||||||
| Allowance for doubtful accounts |
$ | 0.1 | $ | — | $ | 0.1 | |||
| Deferred tax valuation allowance(*) |
$ | — | $ | 1.0 | $ | 1.0 | |||
| 2007 |
|||||||||
| Allowance for doubtful accounts |
$ | 0.1 | $ | — | $ | 0.1 | |||
| Deferred tax valuation allowance(*) |
$ | — | $ | — | $ | — | |||
| * | Pursuant to our separation, all deferred tax assets and associated valuation allowances as of the separation date remained with Agilent. |
108
Table of Contents
Pursuant to the requirements of Section 13 or 15(d) of the Securities Exchange Act of 1934, the registrant has duly caused this report to be signed on its behalf by the undersigned, thereunto duly authorized.
| VERIGY LTD. | ||
| By: | /S/ KEITH L. BARNES | |
| Keith L. Barnes | ||
| Chief Executive Officer | ||
Date: December 21, 2009
109
Table of Contents
POWER OF ATTORNEY
KNOW ALL PERSONS BY THESE PRESENTS, that each person whose signature appears below constitutes and appoints Keith L. Barnes and Robert J. Nikl, jointly and severally, his or her attorney-in-fact, each with the full power of substitution, for such person, in any and all capacities, to sign any and all amendments to this Annual Report on Form 10-K, and to file the same, with all exhibits thereto and other documents in connection therewith, with the Securities and Exchange Commission, granting unto said attorney-in-fact and agent full power and authority to do and perform each and every act and thing requisite and necessary to be done in connection therewith, as fully to all intents and purposes as he might do or could do in person hereby ratifying and confirming all that each of said attorneys-in-fact and agents, or his substitute, may do or cause to be done by virtue hereof.
Pursuant to the requirements of the Securities Exchange Act of 1934, this Report on Form 10-K has been signed below by the following persons on behalf of the registrant in the capacities and on the dates indicated.
| Signature |
Title |
Date | ||
| /s/ KEITH L. BARNES Keith L. Barnes |
Chairman, Chief Executive Officer and President (Principal Executive Officer) |
December 21, 2009 | ||
| /s/ ROBERT J. NIKL Robert J. Nikl |
Chief Financial Officer (Principal Financial and Accounting Officer) |
December 21, 2009 | ||
| /s/ STEVEN BERGLUND Steven Berglund |
Director |
December 21, 2009 | ||
| /s/ BOBBY CHENG HOO WAH Bobby Cheng Hoo Wah |
Director |
December 21, 2009 | ||
| /s/ C. SCOTT GIBSON C. Scott Gibson |
Lead Independent Director |
December 21, 2009 | ||
| /s/ ERNEST GODSHALK Ernest Godshalk |
Director |
December 21, 2009 | ||
| /s/ EDWARD C. GRADY Edward C. Grady |
Director |
December 21, 2009 | ||
| /s/ ERIC MEURICE Eric Meurice |
Director |
December 21, 2009 | ||
| /s/ CLAUDINE SIMSON Claudine Simson |
Director |
December 21, 2009 | ||
Table of Contents
| 3. | Exhibits. |
Exhibits are incorporated herein by reference or are filed with this report as indicated below (numbered in accordance with Item 601 of Regulation S-K):
EXHIBIT INDEX
| Exhibit |
Exhibit Description |
Incorporated By Reference | ||||||||||
| Form | File Number | Exhibit | Date | Filed Herewith | ||||||||
| 2.1 |
Master Separation and Distribution Agreement between Agilent and Verigy Ltd., effective May 31, 2006 | S-1/A | 333-132291 | 2.1 | 6/5/2006 | |||||||
| 3.1 |
Amended and Restated Memorandum and Articles of Association of Verigy Ltd. | S-1/A | 333-132291 | 3.2 | 6/5/2006 | |||||||
| 4.1 |
Form of Specimen Share Certificate for Verigy Ltd.’s Ordinary Shares | S-1/A | 333-132291 | 4.1 | 6/1/2006 | |||||||
| 10.1** |
Form of Indemnity Agreement entered into by Verigy Ltd. with each of its directors and executive officers | S-1/A | 333-132291 | 10.1 | 5/23/2006 | |||||||
| 10.2** |
2006 Equity Incentive Plan, as amended December 2, 2009 | x | ||||||||||
| 10.2.1** |
2006 Equity Incentive Plan—Non-U.S. Sub-Plans & Addenda | x | ||||||||||
| 10.2.2** |
Form of Employee Share Option Grant Agreement, as amended December 20, 2006 | 10-K | 333-132291 | 10.2.1 | 12/22/2006 | |||||||
| 10.2.3* |
Form of Non-Employee Director Share Option Grant Agreement, as amended December 20, 2006 | 10-K | 333-132291 | 10.2.2 | 12/22/2006 | |||||||
| 10.2.4** |
Form of Employee Share Unit Agreement, as amended December 20, 2006 | 10-K | 333-132291 | 10.2.3 | 12/22/2006 | |||||||
| 10.2.5** |
Form of Non-Employee Director Share Unit Agreement, as amended December 20, 2006 | 10-K | 333-132291 | 10.2.4 | 12/22/2006 | |||||||
| 10.2.6** |
Form of Verigy Ltd. 2006 Equity Incentive Plan Share Option Agreement for Employees Located Outside of the United States, as amended December 20, 2006 | 10-K | 333-132291 | 10.2.5 | 12/22/2006 | |||||||
| 10.2.7** |
Form of Verigy Ltd. 2006 Equity Incentive Plan Share Unit Agreement for Employees Located Outside of the United States, as amended December 20, 2006 | 10-K | 333-132291 | 10.2.6 | 12/22/2006 | |||||||
| 10.2.8** |
Form of Verigy Ltd. 2006 Equity Incentive Plan Share Option Agreement for Employees Located in France, as amended December 20, 2006 | 10-K | 333-132291 | 10.2.7 | 12/2/2006 | |||||||
| 10.2.9** |
Form of Verigy Ltd. 2006 Equity Incentive Plan Share Unit Agreement for Employees Located in France, as amended December 20, 2006 | 10-K | 333-132291 | 10.2.8 | 12/22/2006 | |||||||
| 10.2.10** |
Form of Replacement Option Award Agreement for U.S. Employees | 8-K | 000-52038 | 10.2.9 | 11/1/2006 | |||||||
| 10.2.11** |
Form of Replacement Option Award Agreement for Employees Outside the U.S. | 8-K | 000-52038 | 10.2.10 | 11/1/2006 | |||||||
| 10.2.12** |
Form of Replacement Share Unit Agreement for Employees Located in France | 8-K | 000-52038 | 10.2.11 | 11/1/2006 | |||||||
| 10.2.13** |
Form of Four-Tranche Officer Share Option Agreement | 10-K | 333-132291 | 10.2.12 | 12/22/2006 | |||||||
Table of Contents
| Exhibit |
Exhibit Description |
Incorporated By Reference | ||||||||||
| Form | File Number | Exhibit | Date | Filed Herewith | ||||||||
| 10.2.14** |
Form of Four-Tranche Officer Share Option Agreement for France-Based Officers | 10-K | 333-132291 | 10.2.13 | 12/22/2006 | |||||||
| 10.2.15** |
Form of Four-Tranche Officer Share Option Agreement for Non-U.S. and Non-France based Officers | 10-K | 000-52038 | 10.2.14 | 12/21/2007 | |||||||
| 10.2.16** |
Verigy Ltd. Amended and Restated 2006 Equity Incentive Plan Share Option Agreement for the Share Options Granted to Pascal Rondé, on June 12, 2006 | 10-Q | 000-52038 | 10.2.7 | 3/7/2008 | |||||||
| 10.2.17** |
Verigy Ltd. Amended and Restated 2006 Equity Incentive Plan Share Unit Agreement for the Restricted Share Units Granted to Pascal Rondé, on June 12, 2006 | 10-Q | 000-52038 | 10.2.8 | 3/7/2008 | |||||||
| 10.2.18** |
Verigy Ltd. Amended and Restated Replacement Share Unit Agreement for the Restricted Share Units Granted to Pascal Rondé, on October 31, 2006 | 10-Q | 000-52038 | 10.2.11 | 3/7/2008 | |||||||
| 10.2.19** |
Form of Amended and Restated Four-Tranche Officer Share Option Agreement for Pascal Rondé, effective March 6, 2008 | 10-Q | 000-52038 | 10.2.13 | 3/7/2008 | |||||||
| 10.2.20** |
Verigy Ltd. Amended and Restated 2006 Equity Incentive Plan Share Unit Agreement for the Restricted Share Units Granted to Pascal Rondé, on December 13, 2006 | 10-Q | 000-52038 | 10.2.15 | 3/7/2008 | |||||||
| 10.2.21** |
Form of Verigy Ltd. 2006 Equity Incentive Plan Share Unit Agreement for Pascal Rondé, as revised 2008 | 10-Q | 000-52038 | 10.2.16 | 3/7/2008 | |||||||
| 10.2.22** |
Form of Non-Contingent Three—Tranche Share Option Agreement for U.S. Officers | 8-K | 000-52038 | 10.1 | 12/7/2009 | |||||||
| 10.2.23** |
Form of Non-Contingent Three-Tranche Share Option Agreement for France-Based Officers | 8-K | 000-52038 | 10.2 | 12/7/2009 | |||||||
| 10.2.24** |
Form of Non-Contingent Three—Tranche Share Option Agreement for Non-U.S. and Non-France Based Officers | 8-K | 000-52038 | 10.3 | 12/7/2009 | |||||||
| 10.2.25** |
Form of Contingent Share Option Agreement for U.S. Officers | 8-K | 000-52038 | 10.4 | 12/7/2009 | |||||||
| 10.2.26** |
Form of Contingent Share Option Agreement for France-Based Officers | 8-K | 000-52038 | 10.5 | 12/7/2009 | |||||||
| 10.2.27** |
Form of Contingent Share Option Agreement for Non-U.S. and Non-France Based Officers | 8-K | 000-52038 | 10.6 | 12/7/2009 | |||||||
| 10.2.28** |
Form of U.S. Employee Share Unit Agreement adopted December 1, 2009 | X | ||||||||||
| 10.3** |
2006 Employee Shares Purchase Plan, as amended December 20, 2006 | 10-K | 333-132291 | 10.3 | 12/22/2006 | |||||||
| 10.4.1** |
Employment Offer Letter to Keith L. Barnes, dated April 4, 2006 | S-1/A | 333-132291 | 10.11 | 5/1/2006 | |||||||
| 10.4.2** |
Letter of Amendment to Employment Offer Letter to Keith L. Barnes, dated May 30, 2007 | 8-K | 000-52038 | 99.1 | 5/31/2007 | |||||||
| 10.4.3** |
Second Letter of Amendment to Employee Offer Letter to Keith Barnes, dated June 4, 2008 | 10-Q | 000-52038 | 10.5.3 | 6/6/2008 | |||||||
| 10.5.1** |
Employment Offer Letter to Robert Nikl, dated May 26, 2006 | S-1/A | 333-132291 | 10.14 | 6/1/2006 | |||||||
Table of Contents
| Exhibit |
Exhibit Description |
Incorporated By Reference | ||||||||||
| Form | File Number | Exhibit | Date | Filed Herewith | ||||||||
| 10.5.2** |
Letter of Amendment to Employment Offer Letter to Robert Nikl, dated October 1, 2007 | 8-K | 000-52038 | 99.1 | 10/2/2007 | |||||||
| 10.6** |
Relocation Agreement between Verigy US Inc. and Robert Nikl dated November 17, 2009 | 8-K | 000-52038 | 10.1 | 11/19/2009 | |||||||
| 10.7 |
Lease Agreement by and between Verigy US, Inc. and Pau Moulds CPP-A LLC, dated May 31, 2006 | 10-K | 333-132291 | 10.8 | 12/22/2006 | |||||||
| 10.8.1** |
Form of Second Amended and Restated Severance Agreement for U.S.-Based Officers | |||||||||||
| 10.8.2** |
Form of Equity Award Modification Agreement (Severance Agreement) for officers based in France | 10-K | 333-132291 | 10.9.2 | 12/21/2007 | |||||||
| 10.8.3** |
Form of Equity Award Modification Agreement (Severance Agreement) for officers based in Germany | 10-K | 333-132291 | 10.9.3 | 12/21/2007 | |||||||
| 10.9.1** |
Description of Verigy’s 2009 Pay-For-Results Program | X | ||||||||||
| 10.9.2** |
Description of Verigy’s 2010 Pay-For-Results Program | 8-K | 000-52038 | 10.7 | 12/7/2009 | |||||||
| 10.10** |
Form of Indemnification Agreement between Verigy US, Inc. and Verigy Ltd.’s Officers and Directors | 10-K | 333-132291 | 10.11 | 12/22/06 | |||||||
| 10.11** |
Employment Offer Letter to Jorge Titinger, dated April 30, 2008 | 8-K | 000-52038 | 99.2 | 6/5/2008 | |||||||
| 10.12 |
Amended and Restated Global Manufacturing Services Agreement between Verigy Ltd. and Jabil Circuit, Inc., dated April 6, 2009 | 8-K | 000-52038 | 10.1 | 4/7/2009 | |||||||
| 21.1 |
Verigy Ltd.’s Subsidiaries | X | ||||||||||
| 23.1 |
Consent of PricewaterhouseCoopers LLP, Independent Registered Public Accounting Firm | X | ||||||||||
| 24.1 |
Power of Attorney (see signature page to this Form 10-K) | X | ||||||||||
| 31.1 |
Certification of Principal Executive Officer Pursuant to Rule 13a-14 of the Securities Exchange Act of 1934, As Adopted Pursuant to Section 302 of the Sarbanes-Oxley Act of 2002 | X | ||||||||||
| 31.2 |
Certification of Principal Financial Officer Pursuant to Rule 13a-14 of the Securities Exchange Act of 1934, As Adopted Pursuant to Section 302 of the Sarbanes-Oxley Act of 2002 | X | ||||||||||
| 32.1 |
Certification of Principal Executive Officer Pursuant to 18 U.S.C. Section 1350, As Adopted Pursuant to Section 906 of the Sarbanes-Oxley Act of 2002 | X | ||||||||||
| 32.2 |
Certification of Principal Financial Officer Pursuant to 18 U.S.C. Section 1350, As Adopted Pursuant to Section 906 of the Sarbanes-Oxley Act of 2002 | X | ||||||||||
| ** | Management contracts or compensation plans or arrangements in which directors or executive officers are eligible to Participate |